UNITED STATES
SECURITIES AND EXCHANGE COMMISSION
Washington, D.C. 20549
FORM 10-K
(MARK ONE)
x ANNUAL REPORT PURSUANT TO
SECTION 13, 15(d), OR 37 OF THE SECURITIES EXCHANGE ACT OF 1934
For the fiscal year ended September 30, 20202023
OR
o TRANSITION REPORT PURSUANT TO SECTION 13 OR 15(d) OF THE SECURITIES EXCHANGE ACT OF 1934
For the transition period from _____ to _____
Commission file number 000-52313
TENNESSEE VALLEY AUTHORITY
(Exact name of registrant as specified in its charter)
| | | | | | | | | | | |
A corporate agency of the United States created by an act of Congress (State or other jurisdiction of incorporation or organization) | | 62-0474417 (IRS Employer Identification No.) |
| |
400 W. Summit Hill Drive Knoxville, Tennessee (Address of principal executive offices) | | 37902 (Zip Code) |
(865) 632-2101
(Registrant's telephone number, including area code)
Securities registered pursuant to Section 12(b) of the Act:
| | | | | | | | |
| Title of each class | Trading Symbol(s) | Name of each exchange on which registered |
| N/A | N/A | N/A |
Securities registered pursuant to Section 12(g) of the Act: None
Indicate by check mark if the registrant is a well-known seasoned issuer, as defined in Rule 405 of the Securities Act.
Yes o No x
Indicate by check mark if the registrant is not required to file reports pursuant to Section 13, Section 15(d), or Section 15(d)37 of the Act.
Yes o No x
Indicate by check mark whether the registrant (1) has filed all reports required to be filed by Section 13, 15(d), or 37 of the Securities Exchange Act of 1934 during the preceding 12 months (or for such shorter period that the registrant was required to file such reports), and (2) has been subject to such filing requirements for the past 90 days.
Yes x No o
Indicate by check mark whether the registrant has submitted electronically every Interactive Data File required to be submitted pursuant to Rule 405 of Regulation S-T (§ 232.405 of this chapter) during the preceding 12 months (or for such shorter period that the registrant was required to submit such files).
Yes x No o
Indicate by check mark whether the registrant is a large accelerated filer, an accelerated filer, a non-accelerated filer, a smaller reporting company, or an emerging growth company. See the definitions of "large accelerated filer," "accelerated filer," "smaller reporting company," and "emerging growth company" in Rule 12b-2 of the Exchange Act.
Large accelerated filer o Emerging growth company o Smaller reporting company o
Non-accelerated filer x Accelerated filer o
If an emerging growth company, indicate by check mark if the registrant has elected not to use the extended transition period for complying with any new or revised financial accounting standards provided pursuant to Section 13(a) of the Exchange Act. o
Indicate by check mark whether the registrant has filed a report on and attestation to its management's assessment of the effectiveness of its internal control over financial reporting under Section 404(b) of the Sarbanes-Oxley Act (15 U.S.C. 7262(b)) by the registered public accounting firm that prepared or issued its audit report. x
If securities are registered pursuant to Section 12(b) of the Act, indicate by check mark whether the financial statements of the registrant included in the filing reflect the correction of an error to previously issued financial statements. o
Indicate by check mark whether any of those error corrections are restatements that required a recovery analysis of incentive-based compensation received by any of the registrant's executive officers during the relevant recovery period pursuant to §240.10D-1(b). o
Indicate by check mark whether the registrant is a shell company (as defined in Rule 12b-2 of the Exchange Act).
Yes o No x
Estimated aggregate market value of the common equity held by non-affiliates of TVA at March 31, 2023: N/A
Number of shares of common stock outstanding at November 13, 2023: N/A
| | | | | |
| Table of Contents |
| GLOSSARY OF COMMON ACRONYMS....................................................................................................................................................................................................... | |
| FORWARD-LOOKING INFORMATION......................................................................................................................................................................................................... | |
| GENERAL INFORMATION............................................................................................................................................................................................................................ | |
| | |
| PART I | |
| | |
| ITEM 1. BUSINESS...................................................................................................................................................................................................................................... | |
| The Corporation................................................................................................................................................................................................................................. | |
| Service Area....................................................................................................................................................................................................................................... | |
COVID-19 Pandemic...................................................................................................................................................................................................................... | |
| Customers.......................................................................................................................................................................................................................................... | |
| Rates.................................................................................................................................................................................................................................................. | |
| Power Supply and Load Management Resources............................................................................................................................................................................. | |
| Fuel Supply......................................................................................................................................................................................................................................... | |
| Transmission...................................................................................................................................................................................................................................... | |
| Weather and Seasonality.................................................................................................................................................................................................................... | |
| Competition........................................................................................................................................................................................................................................ | |
| Research and Development............................................................................................................................................................................................................... | |
| Flood Control Activities....................................................................................................................................................................................................................... | |
| Environmental Stewardship Activities................................................................................................................................................................................................. | |
| Economic Development Activities...................................................................................................................................................................................................... | |
| Regulation.......................................................................................................................................................................................................................................... | |
| Taxation and Tax Equivalents............................................................................................................................................................................................................. | |
| Environmental Matters....................................................................................................................................................................................................................... | |
Human Capital Resources..................................................................................................................................................................................................................Management.............................................................................................................................................................................................................. | |
| | |
| ITEM 1A. RISK FACTORS............................................................................................................................................................................................................................ | |
| | |
| ITEM 1B. UNRESOLVED STAFF COMMENTS............................................................................................................................................................................................ | |
| | |
| ITEM 1C. CYBERSECURITY......................................................................................................................................................................................................................... | |
| |
| ITEM 2. PROPERTIES.................................................................................................................................................................................................................................. | |
| Generating Properties........................................................................................................................................................................................................................ | |
| Transmission Properties..................................................................................................................................................................................................................... | |
| Natural Resource Stewardship Properties......................................................................................................................................................................................... | |
| Buildings............................................................................................................................................................................................................................................. | |
| Disposal of Property........................................................................................................................................................................................................................... | |
| | |
| ITEM 3. LEGAL PROCEEDINGS.................................................................................................................................................................................................................. | |
| | |
| ITEM 4. MINE SAFETY DISCLOSURES...................................................................................................................................................................................................... | |
| | |
| PART II | |
| | |
| ITEM 5. MARKET FOR REGISTRANT'S COMMON EQUITY, RELATED STOCKHOLDER MATTERS AND ISSUER PURCHASES OF EQUITY SECURITIES............ | |
| | |
ITEM 6. SELECTED FINANCIAL DATA........................................................................................................................................................................................................RESERVED...................................................................................................................................................................................................................................... | |
| | |
| ITEM 7. MANAGEMENT'S DISCUSSION AND ANALYSIS OF FINANCIAL CONDITION AND RESULTS OF OPERATIONS................................................................... | |
| Business and Mission......................................................................................................................................................................................................................... | |
| Executive Overview............................................................................................................................................................................................................................ | |
| Results of Operations......................................................................................................................................................................................................................... | |
| |
Off-Balance Sheet Arrangements....................................................................................................................................................................................................... | |
| Key Initiatives and Challenges........................................................................................................................................................................................................... | |
Critical Accounting Policies and Estimates.........................................................................................................................................................................................Estimates.............................................................................................................................................................................................................. | |
Fair Value Measurements................................................................................................................................................................................................................... | |
| New Accounting Standards and Interpretations................................................................................................................................................................................. | |
| Legislative and Regulatory Matters.................................................................................................................................................................................................... | |
| Environmental Matters....................................................................................................................................................................................................................... | |
| Legal Proceedings.............................................................................................................................................................................................................................. | |
| Risk Management Activities............................................................................................................................................................................................................... | |
| | |
| ITEM 7A. QUANTITATIVE AND QUALITATIVE DISCLOSURES ABOUT MARKET RISK........................................................................................................................... | |
| | |
| ITEM 8. FINANCIAL STATEMENTS AND SUPPLEMENTARY DATA.......................................................................................................................................................... | |
| |
| Consolidated Statements of Operations............................................................................................................................................................................................. | |
| Consolidated Statements of Comprehensive Income (Loss)............................................................................................................................................................. | |
| Consolidated Statements of Cash Flows........................................................................................................................................................................................... | |
| Consolidated Statements of Changes in Proprietary Capital............................................................................................................................................................. | |
| |
| Report of Independent Registered Public Accounting Firm (PCAOB ID 42) ...................................................................................................................................... | |
| | | | | |
Report of Independent Registered Public Accounting Firm............................................................................................................................................................... | |
| ITEM 9. CHANGES IN AND DISAGREEMENTS WITH ACCOUNTANTS ON ACCOUNTING AND FINANCIAL DISCLOSURE............................................................... | |
| | |
| ITEM 9A. CONTROLS AND PROCEDURES............................................................................................................................................................................................... | |
| Disclosure Controls and Procedures.................................................................................................................................................................................................. | |
| Internal Control over Financial Reporting........................................................................................................................................................................................... | |
| Report of Independent Registered Public Accounting Firm................................................................................................................................................................ | |
| | |
| ITEM 9B. OTHER INFORMATION................................................................................................................................................................................................................ | |
| |
| |
| |
| PART III | |
| |
| ITEM 10. DIRECTORS, EXECUTIVE OFFICERS, AND CORPORATE GOVERNANCE............................................................................................................................. | |
| Directors.............................................................................................................................................................................................................................................. | |
| Executive Officers............................................................................................................................................................................................................................... | |
| Disclosure and Financial Code of Ethics............................................................................................................................................................................................ | |
| Insider Trading Policy......................................................................................................................................................................................................................... | |
| Committees of the TVA Board............................................................................................................................................................................................................ | |
| | |
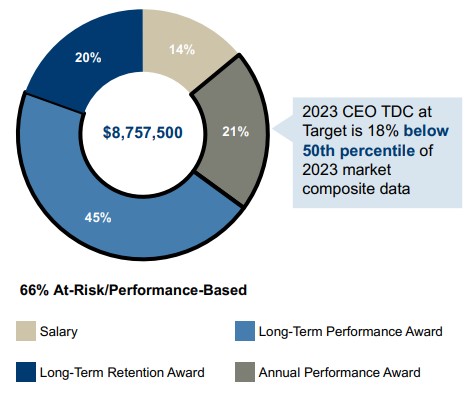
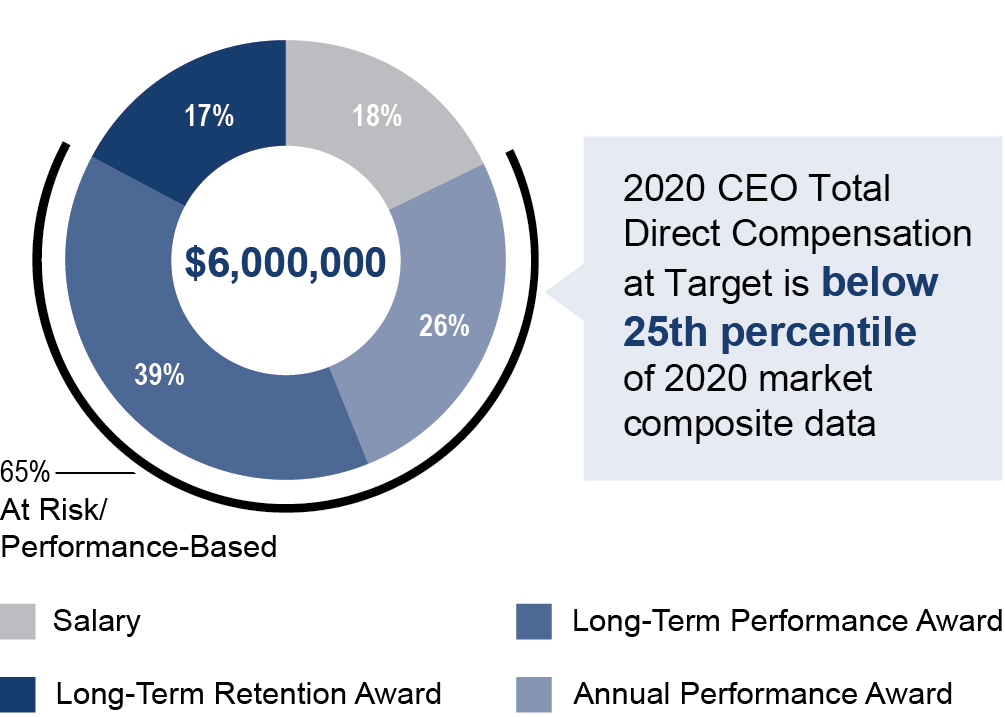
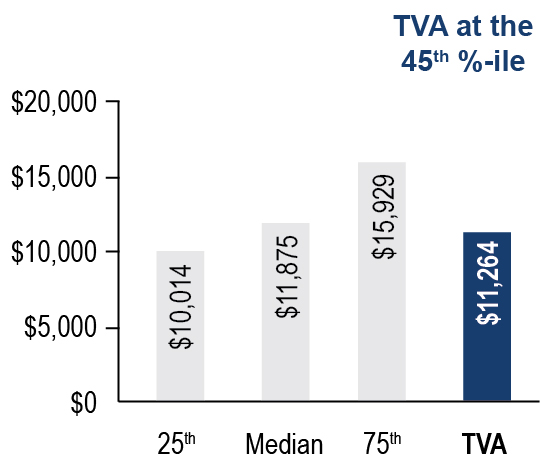
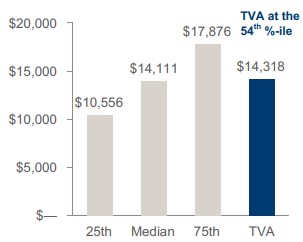
| ITEM 11. EXECUTIVE COMPENSATION..................................................................................................................................................................................................... | |
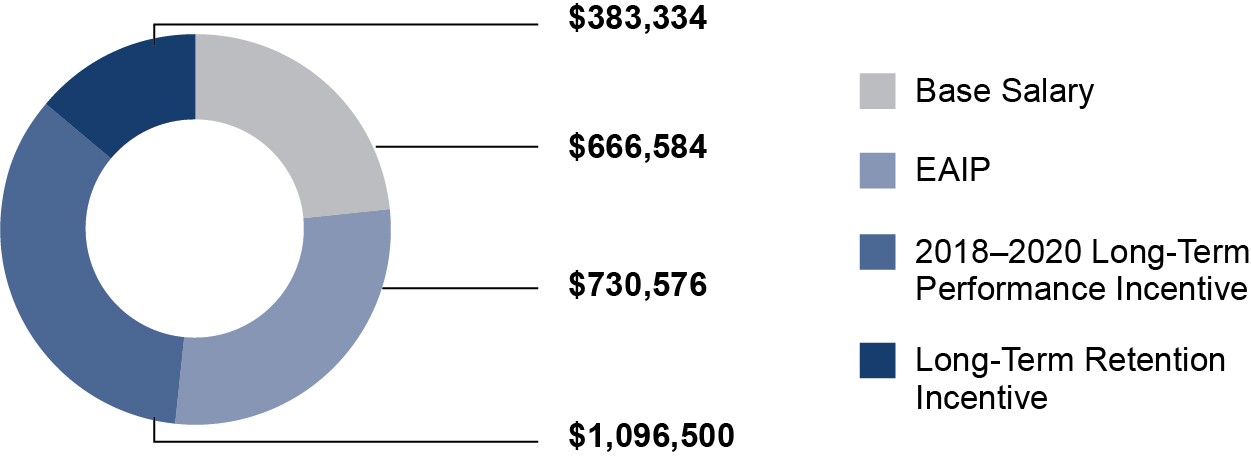
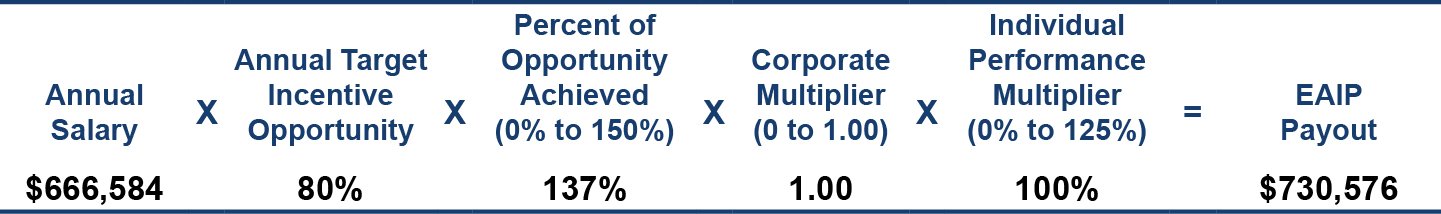
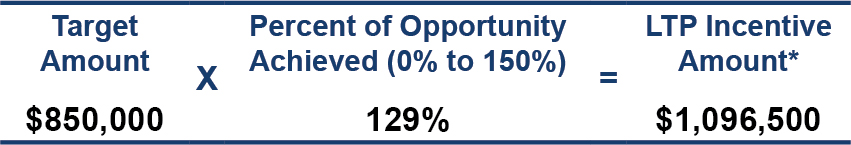
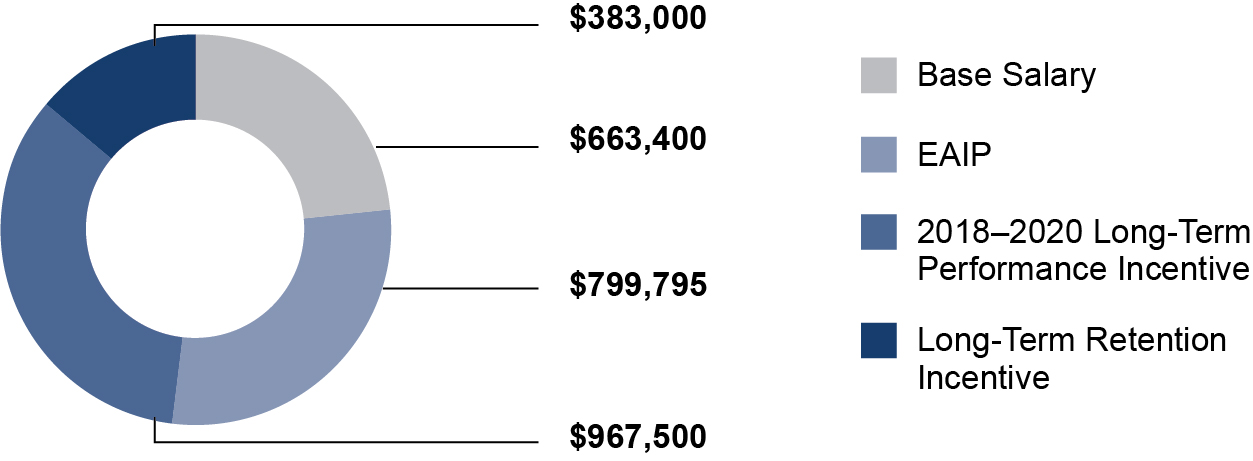
| Compensation Discussion and Analysis............................................................................................................................................................................................. | |
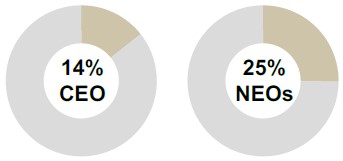
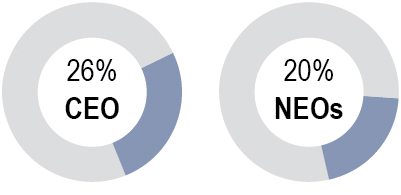
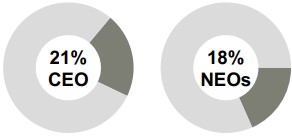
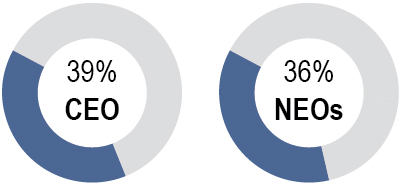
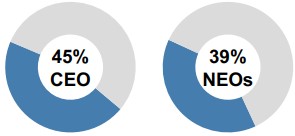
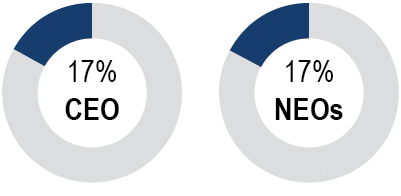
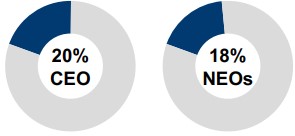
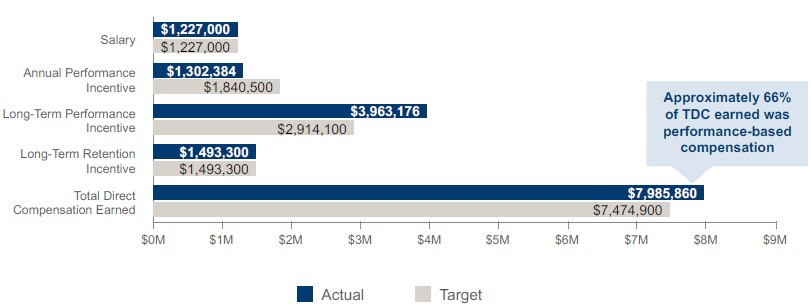
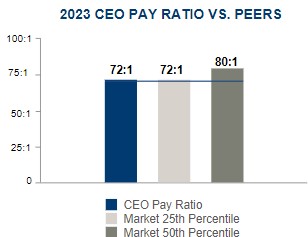
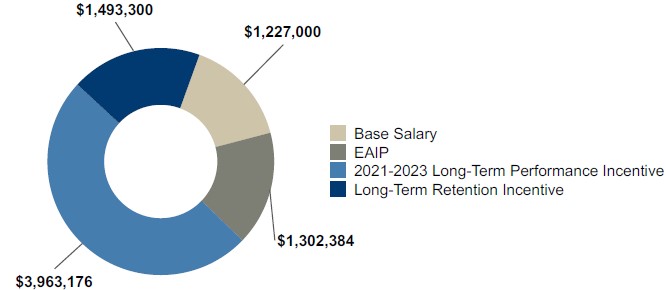
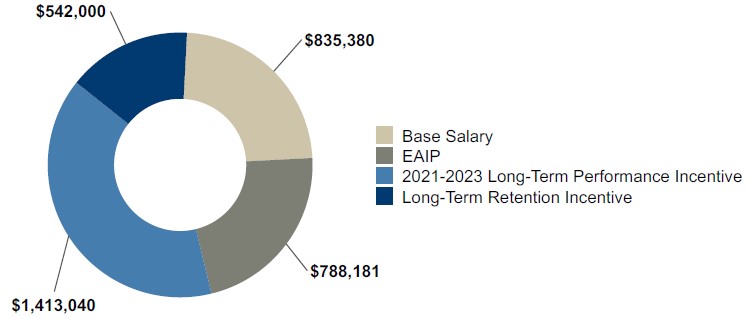
| CEO Pay Ratio Disclosure................................................................................................................................................................................................................. | |
| Executive Compensation Tables and Narrative Disclosures.............................................................................................................................................................. | |
Retirement and Pension Plans........................................................................................................................................................................................................... | |
Nonqualified Deferred Compensation................................................................................................................................................................................................ | |
Potential Payments on Account of Resignation, Retirement, Termination without Cause, Termination with Cause, Death, or Disability........................................... | |
Other Agreements.............................................................................................................................................................................................................................. | |
| Director Compensation....................................................................................................................................................................................................................... | |
| Compensation Committee Interlocks and Insider Participation.......................................................................................................................................................... | |
| Compensation Committee Report...................................................................................................................................................................................................... | |
| |
| ITEM 12. SECURITY OWNERSHIP OF CERTAIN BENEFICIAL OWNERS AND MANAGEMENT AND RELATED STOCKHOLDER MATTERS...................................... | |
| | |
| ITEM 13. CERTAIN RELATIONSHIPS AND RELATED TRANSACTIONS, AND DIRECTOR INDEPENDENCE......................................................................................... | |
| Director Independence....................................................................................................................................................................................................................... | |
| Related Party Transactions................................................................................................................................................................................................................ | |
| | |
| ITEM 14. PRINCIPAL ACCOUNTANT FEES AND SERVICES...................................................................................................................................................................... | |
| | |
| PART IV | |
| | |
| ITEM 15. EXHIBITS, FINANCIAL STATEMENT SCHEDULES..................................................................................................................................................................... | |
| | |
| ITEM 16. FORM 10-K SUMMARY................................................................................................................................................................................................................. | |
| |
| SIGNATURES................................................................................................................................................................................................................................................ | |
| | | | | | | | |
| GLOSSARY OF COMMON ACRONYMS |
Following are definitions of some of the terms or acronyms that may be used in this Annual Report on Form 10-K for the fiscal year ended September 30, 20202023 (the "Annual Report"): |
| |
| Term or Acronym | | Definition |
| ACE | | Affordable Clean Energy |
ANIACPA | | American Nuclear InsurersAnti-Cherrypicking Amendment |
| | |
| AOCI | | Accumulated other comprehensive income (loss) |
| ARO | | Asset retirement obligation |
| ART | | Asset Retirement Trust |
| Bonds | | Bonds, notes, or other evidences of indebtedness |
| CAA | | Clean Air Act |
| CCR | | Coal combustion residuals |
CERCLA | | Comprehensive Environmental Response, Compensation, and Liability Act |
CME | | Chicago Mercantile Exchange |
CO2 | | Carbon dioxide |
| COVID-19 | | Coronavirus Disease 2019 |
COLACOLA(s) | | Cost-of-living adjustmentadjustment(s) |
| CSAPR | | Cross-State Air Pollution Rule |
| CTs | | Combustion turbine unit(s) |
| CVA | | Credit valuation adjustment |
| CWA | | Clean Water Act |
| CY | | Calendar year |
| DBOT | | Down-blend offering for Tritiumtritium |
| DCP | | Deferred Compensation Plan |
| DEIA | | Diversity, Equity, Inclusion, and Accessibility |
| DER | | Distributed Energy Resources |
| DOE | | Department of Energy |
| EIS | | Environmental Impact Statement |
| ELGs | | Effluent Limitation Guidelines |
| | |
EMPsEO(s) | | Electromagnetic pulsesExecutive Order(s) |
| EPA | | Environmental Protection Agency |
| EPRI | | Electric Power Research Institute |
ESPA | | Early Site Permit Application |
| ERC | | Enterprise Risk Council |
| FASB | | Financial Accounting Standards Board |
| FERC | | Federal Energy Regulatory Commission |
| FHP | | Financial Hedging Program |
| FIP | | Federal Implementation Plan |
| FPA | | Federal Power Act |
FTP | | Financial Trading Program |
| GAAP | | Accounting principles generally accepted in the United States of America |
| GAC | | Grid Access Charge |
| GHG | | Greenhouse gas |
GMDs | | Geomagnetic disturbances |
HAP | | Hazardous Air Pollutants |
| IRP | | Integrated Resource Plan |
| IwD | | Inclusion with Diversity |
| JSCCG | | John Sevier Combined Cycle Generation LLC |
KOC | | Knoxville Office Complex |
kW | | Kilowatts |
kWh | | Kilowatt hours |
| LPCs | | Local power company customers |
LTA | | Long-Term Agreement |
LTDCP | | Long-Term Deferred Compensation Plan |
| | | | | |
| | |
MATS | | Mercury and Air Toxics Standards |
| MD&A | | Management's Discussion and Analysis of Financial Condition and Results of Operations |
| MLGW | | Memphis Light, Gas and Water Division |
| mmBtu | | Million British thermal unit(s) |
| MtM | | Mark-to-market |
| MW | | Megawatts |
| NAAQS | | National Ambient Air Quality Standards |
| | | | | | | | |
| NAV | | Net asset value |
| NDT | | Nuclear Decommissioning Trust |
| NEIL | | Nuclear Electric Insurance Limited |
| NEPA | | National Environmental Policy Act |
| NERC | | North American Electric Reliability Corporation |
| NES | | Nashville Electric Service |
NOx | | Nitrogen oxides |
| NPDES | | National Pollutant Discharge Elimination System |
| NRC | | Nuclear Regulatory Commission |
NSR | | New Source Review |
NWP | | Nationwide Permit |
| NYSE | | New York Stock Exchange |
OCI | | Other comprehensive income (loss) |
OMB | | Office of Management and Budget |
| PARRS | | Putable Automatic Rate Reset Securities |
PM | | Particulate matter |
| QTE | | Qualified technological equipment and software |
| RCRA | | Resource Conservation and Recovery Act |
| RECs | | Renewable Energy Certificates |
REITRFP | | Real Estate Investment TrustRequest For Proposal |
RSORP | | Renewable Standard OfferRestoration Plan |
| SCCG | | Southaven Combined Cycle Generation LLC |
| SCRs | | Selective catalytic reduction systems |
| SEC | | Securities and Exchange Commission |
SELC | | Southern Environmental Law Center |
| SERP | | Supplemental Executive Retirement Plan |
| SHLLC | | Southaven Holdco LLC |
| SIPs | | State implementation plans |
| SMR | | Small modular reactor(s) |
SO2 | | Sulfur dioxide |
SPC | | Summer Place Complex |
SOA | | Society of Actuaries |
SSSL | | Seven States Southaven, LLC |
TCWN | | Tennessee Clean Water Network |
| TDEC | | Tennessee Department of Environment & Conservation |
| TIPS | | Treasury Inflation-Protected Securities |
| TPBAR | | Tritium-producing burnable absorber rods |
| TVA Act | | The Tennessee Valley Authority Act of 1933, as amended |
| TVA Board | | TVA Board of Directors |
| TVARS | | Tennessee Valley Authority Retirement System |
| U.S. Treasury | | United States Department of the Treasury |
| USACE | | U.S. Army Corps of Engineers |
VIEVIE(s) | | Variable interest entityentity(ies) |
| XBRL | | eXtensible Business Reporting Language |
FORWARD-LOOKING INFORMATION
This Annual Report on Form 10-K ("Annual Report")for the fiscal year ended September 30, 2023 contains forward-looking statements relating to future events and future performance. All statements other than those that are purely historical may be forward-looking statements. In certain cases, forward-looking statements can be identified by the use of words such as "may," "will," "should," "expect," "anticipate," "believe," "intend," "project," "plan," "predict," "assume," "forecast," "estimate," "objective," "possible," "probably," "likely," "potential," "speculate," "aim," "aspiration," "goal," "seek," "strategy," "target," the negative of such words, or other similar expressions.
Although the Tennessee Valley Authority ("TVA") believes that the assumptions underlying any forward-looking statements are reasonable, TVA does not guarantee the accuracy of these statements. Numerous factors could cause actual results to differ materially from those in any forward-looking statements. These factors include, among other things:
•The impact of the Coronavirus Disease 2019 ("COVID-19") pandemic on TVA's operating results, financial condition, and cash flows, the demand for electricity, TVA's workforce and operations, the availability of fuel and critical parts, supplies, and services, the financial markets, and the business and financial condition of TVA's customers and counterparties;
•The duration and severity of the COVID-19 pandemic, actions taken to contain its spread and mitigate its effects, and broader impacts of the COVID-19 pandemic on economic and market conditions, including impacts on interest rates, commodity prices, investment performance, and foreign currency exchange rates;
•New, amended, or existing laws, regulations, executive orders ("EOs"), or administrative orders or interpretations, including those related to climate change and other environmental matters, and the costs of complying with these laws, regulations, executive orders,EOs, or administrative orders or interpretations;
•The cost of complying with known, anticipated, or new emissions reductionenvironmental requirements, some of which could render continued operation of many of TVA's aging coal-fired generation units not cost-effective or result in their removal from service, perhaps permanently;
•Significant reductions in demand for electricity produced through non-renewable or centrally located generation sourcesFederal legislation aimed specifically at curtailing TVA's activities, including legislation that may result from, among other things, economic downturns, increased energy efficiency and conservation, increased utilizationcause TVA to lose its protected service territory, its sole authority to set rates, or its authority to manage the Tennessee River system or the real property currently entrusted to TVA; subject TVA to additional environmental regulation or additional requirements of distributed generation and microgrids, and improvements in alternative generation and energy storage technologies;
•Changes in customer preferences for energy produced from cleaner generation sources;
•Changes in technology;
•Actions taken,the North American Electric Reliability Corporation ("NERC") or inaction, byFederal Energy Regulatory Commission ("FERC"); require the United States ("U.S.") government relating todivestiture of TVA or the national or TVAsale of certain of TVA's assets; lower the debt ceiling or automatic spending cuts in government programs;
•Costs or liabilities that are not anticipated in TVA's financial statements for third-party claims, natural resource damages, environmental cleanup activities, or fines or penalties associated with unexpected events such as failures of a facility or infrastructure;
•Addition or loss of customers by TVA or TVA's local power company customers ("LPCs");
•Significant delays, cost increases, or cost overruns associated with the construction and maintenance of generation, transmission, navigation, flood control, or related assets;
•Requirements or decisions changing the amount or timing of funding obligations associated with TVA's pension plans, other post-retirement benefit plans, or health care plans;
•Increases in TVA's financial liabilities for decommissioning its nuclear facilities or retiring other assets;
•Risks associated with the operation of nuclear facilitieson bonds, notes, or other generation and related facilities, including coal combustion residualsevidences of indebtedness (collectively, "Bonds") specified in the Tennessee Valley Authority Act of 1933, as amended, ("CCR"TVA Act") facilities;
•Physical attacks on; or restrict TVA's assets;access to its funds;
•Cyber attacks on TVA's assets or the assets of third parties upon which TVA relies;
•The outcomefailure of legal or administrative proceedings;TVA's information technology systems;
•The failure of TVA's generation, transmission, navigation, flood control,Significant delays and related assets and infrastructure, including CCR facilities and spent nuclear fuel storage facilities, to operate as anticipated, resulting in lost revenues, damages, additional costs, and/or other costs that are not reflected in TVA's financial statements or projections;
•Differences between estimates of revenues and expenses and actual revenues earned and expenses incurred;
•Weather conditions;
•Catastrophic events such as fires, earthquakes, explosions, solar events, electromagnetic pulses ("EMPs"), geomagnetic disturbances ("GMDs"), droughts, floods, hurricanes, tornadoes, or other casualty events or pandemics, wars, national emergencies, terrorist activities, or other similar events, especially if these events occur in or near TVA's service area;
•Events at a TVA facility, which, among other things, could result in loss of life, damage to the environment, damage to or loss of the facility, and damage to the property of others;
•Events or changes involving transmission lines, dams, and other facilities not operated by TVA, including those that affect the reliability of the interstate transmission grid of which TVA's transmission system is a part and those that increase flows across TVA's transmission grid;
•Disruption of fuel supplies, which may result from, among other things, economic conditions, weather conditions, production or transportation difficulties, labor challenges, or environmental laws or regulations affecting TVA's fuel suppliers or transporters;
•Purchased power price volatility and disruption of purchased power supplies;
•Events which affect the supply of water for TVA's generation facilities;
•Changes in TVA's determinations of the appropriate mix of generation assets;
•Ineffectiveness of TVA's efforts at adapting its organization to an evolving marketplace and remaining cost competitive;
•Inability to use regulatory accounting or loss of regulatory accounting approval for certain costs;
•Inabilityinability to obtain necessary regulatory approvals, licenses, or loss of, regulatory approvalpermits, for the construction or operation of assets;
•The requirement or decisionmajor projects, including for assets that TVA needs to make additional contributionsserve its existing and future load and to TVA's Nuclear Decommissioning Trust ("NDT") or Asset Retirement Trust ("ART");meet its carbon reduction aspirations;
•Limitations on TVA's ability to borrow money, which may result from, among other things, TVA's approaching or substantially reaching the limit on bonds, notes,debt ceiling or TVA's losing access to the debt markets, and other evidences of indebtedness (collectively, "Bonds") specified in the Tennessee Valley Authority Act of 1933, as amended ("TVA Act");
•An increase inwhich may impact TVA's cost ofability to make planned capital that may result from, among other things, changes in the market for TVA's debt securities, changes in the credit rating of TVA or the U.S. government, or, potentially, an increased reliance by TVA on alternative financing should TVA approach its debt limit;
•Changes in the economy and volatility in financial markets;
•Reliability or creditworthiness of counterparties;
•Changes in the market price of commodities such as coal, uranium, natural gas, fuel oil, crude oil, construction materials, reagents, electricity, or emission allowances;
•Changes in the market price of equity securities, debt securities, or other investments;
•Changes in interest rates, currency exchange rates, or inflation rates;
•Ineffectiveness of TVA's disclosure controls and procedures or its internal control over financial reporting;
•Inability to eliminate identified deficiencies in TVA's systems, standards, controls, or corporate culture;
•Inability to attract or retain a skilled workforce;
•Inability to respond quickly enough to current or potential customer demands or needs;
•Events at a nuclear facility, whether or not operated by or licensed to TVA, which, among other things, could lead to increased regulation or restriction on the construction, ownership, operation, or decommissioning of nuclear facilities or on the storage of spent fuel, obligate TVA to pay retrospective insurance premiums, reduce the availability and affordability of insurance, increase the costs of operating TVA's existing nuclear units, or cause TVA to forego future construction at these or other facilities;
•LossRisks associated with the operation of quorumnuclear facilities or other generation and related facilities, including coal combustion residuals ("CCR") facilities;
•Inability to continue to operate certain assets, especially nuclear facilities, including due to the inability to obtain, or loss of, regulatory approval for the operation of assets;
•Significant additional costs for TVA to manage and operate its CCR facilities;
•Physical attacks, threats, or other interference causing damage to TVA's facilities or interfering with TVA's operations;
•The failure of TVA's generation, transmission, navigation, flood control, and related assets and infrastructure, including CCR facilities and spent nuclear fuel storage facilities, to operate as anticipated, resulting in lost revenues, damages, or other costs that are not reflected in TVA's financial statements or projections, including due to aging or technological issues;
•Costs or liabilities that are not anticipated in TVA's financial statements for third-party claims, natural resource damages, environmental cleanup activities, or fines or penalties associated with unexpected events such as failures of a facility or infrastructure;
•Events at a TVA facility, which, among other things, could result in loss of life, damage to the environment, damage to or loss of the facility, or damage to the property of others;
•Events that negatively impact TVA's reliability, including problems at other utilities or at TVA facilities or the increase in intermittent sources of power;
•Events or changes involving transmission lines, dams, and other facilities not operated by TVA, including those that affect the reliability of the interstate transmission grid of which TVA's transmission system is a part and those that increase flows across TVA's transmission grid;
•Disruption of supplies of fuel, purchased power, or other critical items or services, which may result from, among other things, economic conditions, weather conditions, physical or cyber attacks, political developments, international trade restrictions or tariffs, legal actions, mine closures or reduced mine production, increases in fuel exports, environmental regulations affecting TVA's suppliers, transportation or delivery constraints, shortages of raw materials, supply chain difficulties, labor shortages, strikes, inflation, or similar events and which may, among other things, hinder TVA's ability to operate its assets and to complete projects on time and on budget;
•Circumstances that cause TVA to change its determinations regarding the appropriate mix of generation assets;
•Costs or other challenges resulting from a failure by TVA to meet its carbon reduction aspirations;
•Actions taken, or inaction, by the United States ("U.S.") government relating to the national debt ceiling or automatic spending cuts in government programs;
•Inability to respond quickly enough to current or potential customer demands or needs or to act solely in the interest of ratepayers;
•Negative outcomes of current or future legal or administrative proceedings;
•Other unforeseeable occurrences negatively impacting TVA assets or their supporting infrastructure;
•The need for significant future contributions associated with TVA's pension plans, other post-retirement benefit plans, or health care plans;
•Increases in TVA's financial liabilities for decommissioning its nuclear facilities and retiring other assets;
•The requirement or decision to make additional contributions to TVA's Nuclear Decommissioning Trust ("NDT") or Asset Retirement Trust ("ART");
•Differences between estimates of revenues and expenses and actual revenues earned and expenses incurred;
•An increase in TVA's cost of capital, which may result from, among other things, changes in the market for Bonds, disruptions in the banking system or financial markets, changes in the credit rating of TVA or the U.S. government, or, potentially, an increased reliance by TVA on alternative financing should TVA approach its debt limit;
•The inaccuracy of certain assumptions about the future, including economic forecasts, anticipated energy and commodity prices, cost estimates, construction schedules, power demand forecasts, the appropriate generation mix to meet demand, and assumptions about potential regulatory environments;
•Significant decline in the demand for electricity that TVA produces, which may result from, among other things, economic downturns or recessions, loss of customers, reductions in demand for electricity generated from non-renewable sources or centrally located generation sources, increased utilization of distributed energy resources, increased energy efficiency and conservation, or improvements in alternative generation and energy storage technologies;
•Changes in customer preferences for energy produced from cleaner generation sources;
•Addition or loss of customers by TVA or TVA's local power company customers ("LPCs");
•Potential for increased demand for energy resulting from, among other things, an increase in the population of TVA's service area;
•Changes in technology, which, among other things, may affect relationships with customers and require TVA to change how it conducts its operations;
•Changes in the economy and volatility in financial markets;
•Reliability or creditworthiness of counterparties including but not limited to customers, suppliers, renewable resource providers, and financial institutions;
•Changes in the market price of commodities such as purchased power, coal, uranium, natural gas, fuel oil, crude oil, construction materials, reagents, or emission allowances;
•Changes in the market price of equity securities, debt securities, or other investments;
���Changes in interest rates, currency exchange rates, or inflation rates;
•Failure to attract or retain an appropriately qualified, diverse, and inclusive workforce;
•Changes in the membership of the TVA Board of Directors ("TVA Board"); or TVA senior management, which may impact how TVA operates;
•ChangesWeather conditions, including changing weather patterns, extreme weather conditions, and other events such as flooding, droughts, wildfires, heat waves, and snow or ice storms that may result from climate change, which may hamper TVA's ability to supply power, cause customers' demand for power to exceed TVA's then-present power supply, or otherwise negatively impact net revenue;
•Events affecting the supply or quality of water from the Tennessee River system or Cumberland River system, or elsewhere, which could interfere with TVA's ability to generate power;
•Catastrophic events, such as fires, earthquakes, explosions, solar events, electromagnetic pulses, geomagnetic disturbances, droughts, floods, hurricanes, tornadoes, polar vortexes, icing events, pipeline explosions, or other casualty events, wars, national emergencies, terrorist activities, pandemics, widespread public health crises, geopolitical events, or other similar destructive or disruptive events;
•Inability to use regulatory accounting for certain costs;
•Ineffectiveness of TVA's financial control system to control issues and instances of fraud or to prevent or detect errors;
•Ineffectiveness of TVA's disclosure controls and procedures or its internal control over financial reporting;
•Adverse effects from regional health emergencies;
•Inability of TVA to implement its business strategy successfully, including due to the increased use in the prioritiespublic of distributed energy resources or energy-efficiency programs;
•Inability of TVA to adapt its business model to changes in the utility industry and customer preferences and to remain cost competitive;
•Inability of TVA to achieve or maintain its cost reduction goals, which may require TVA to increase rates and/or issue more debt than planned;
•The emergence of artificial intelligence and its potential application to various business practices, including TVA's operations and the operations of TVA's stakeholders;
•Loss of quorum of the TVA Board, or TVA senior management;which may limit TVA's ability to adapt to meet changing business conditions;
•Negative impacts on TVA's reputation; or
•Other unforeseeable events.
See also Part I, Item 1A, Risk Factors, and Part II, Item 7, Management's Discussion and Analysis of Financial Condition and Results of Operations.Operations for a discussion of factors that could cause actual results to differ materially from those in any forward-looking statement. New factors emerge from time to time, and it is not possible for TVA to predict all such factors or to assess the extent to which any factor or combination of factors may impact TVA's business or cause results to differ materially from those contained in any forward-looking statement. TVA undertakes no obligation to update any forward-looking statement to reflect developments that occur after the statement is made.made, except as required by law.
GENERAL INFORMATION
Fiscal Year
References to years (2020, 2019,(2023, 2022, etc.) in this Annual Report on Form 10-K for the fiscal year ended September 30, 2023are to TVA's fiscal years ending September 30 except for references to years in the biographical information about directors and executive officers in Part III, Item 10, Directors, Executive Officers, and Corporate Governance, as well as to years that are preceded by "CY," which references are to calendar years.
Notes
References to "Notes" are to the Notes to Consolidated Financial Statements contained in Part II, Item 8, Financial Statements and Supplementary Data in this Annual Report.
Property
TVA does not own real property and generally does not own real property interests (collectively, "real property"). TVA acquires real property in the name of the United States ("U.S."), and such legal title in real property is entrusted to TVA as the agent of the United StatesU.S. to accomplish the purposes of the TVA Act. TVA acquires personal property in the name of TVA. Accordingly, unless the context indicates the reference is to TVA's personal property, any statement in this Annual Report referring to TVA property shall be read as referring to the real property of the United StatesU.S. that has been entrusted to TVA as its agent.
Available Information
TVA files annual, quarterly, and current reports with the Securities and Exchange Commission ("SEC") under Section 37 of the Securities Exchange Act of 1934.1934 (the "Exchange Act"). TVA's SEC filings are available to the public onat www.tva.com, free of charge, as soon as reasonably practicable after such reports are electronically filed with or furnished to the SEC's website at www.sec.gov or on TVA's website at www.tva.gov.SEC. Information contained on or accessible through TVA's website shall not be deemed to be incorporated into, or to be a part of, this Annual Report.Report or any other report or document that TVA files with the SEC. All TVA SEC reports are available to the public without charge from the website maintained by the SEC at https://www.sec.gov.
PART I
ITEM 1. BUSINESS
The Corporation
General
The Tennessee Valley Authority ("TVA") is a corporate agency and instrumentality of the United States ("U.S.") that was created in 1933 by federal legislation in response to a proposal by President Franklin D. Roosevelt. TVA was created to, among other things, improve navigation on the Tennessee River, reduce the damage from destructive flood waters within the Tennessee River system and downstream on the lower Ohio and Mississippi Rivers, further the economic development of TVA's service area in the southeastern United States,U.S., and sell the electricity generated at the facilities TVA operates. Today, TVA operates the nation's largest public power system and supplies power to a population of approximately 10 million people.
TVA also manages the Tennessee River, its tributaries, and certain shorelines to provide, among other things, year-round navigation, flood damage reduction, and affordable and reliable electricity. Consistent with these primary purposes, TVA also manages the river system and public lands to provide recreational opportunities, adequate water supply, improved water quality, cultural and natural resource protection, and economic development. TVA performs these management duties in cooperation with other federal and state agencies that have jurisdiction and authority over certain aspects of the river system. In addition, the TVA Board of Directors ("TVA Board") has established two councils — the Regional Resource Stewardship Council and the Regional Energy Resource Council — to advise TVA on its stewardship activities in the Tennessee Valley and its energy resource activities.
Initially, all TVA operations were funded by federal appropriations. Direct appropriations for the TVA power program ended in 1959, and appropriations for TVA's stewardship, economic development, and multipurpose activities ended in 1999. Since 1999, TVA has funded all of its operations almost entirely from the sale of electricity and power system financings. TVA's power system financings consist primarily of the sale of bonds, notes, or other evidences of indebtedness (collectively, "Bonds") and secondarily of alternative forms of financing, such as lease arrangements. As a wholly-owned government corporation, TVA is not authorized to issue equity securities.
TVA's Mission of Service
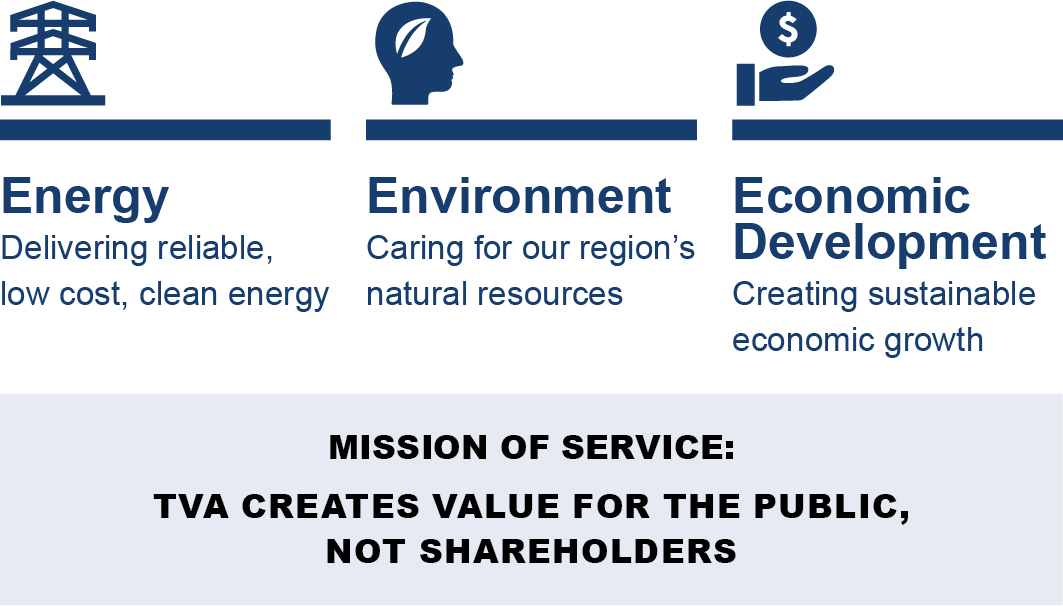
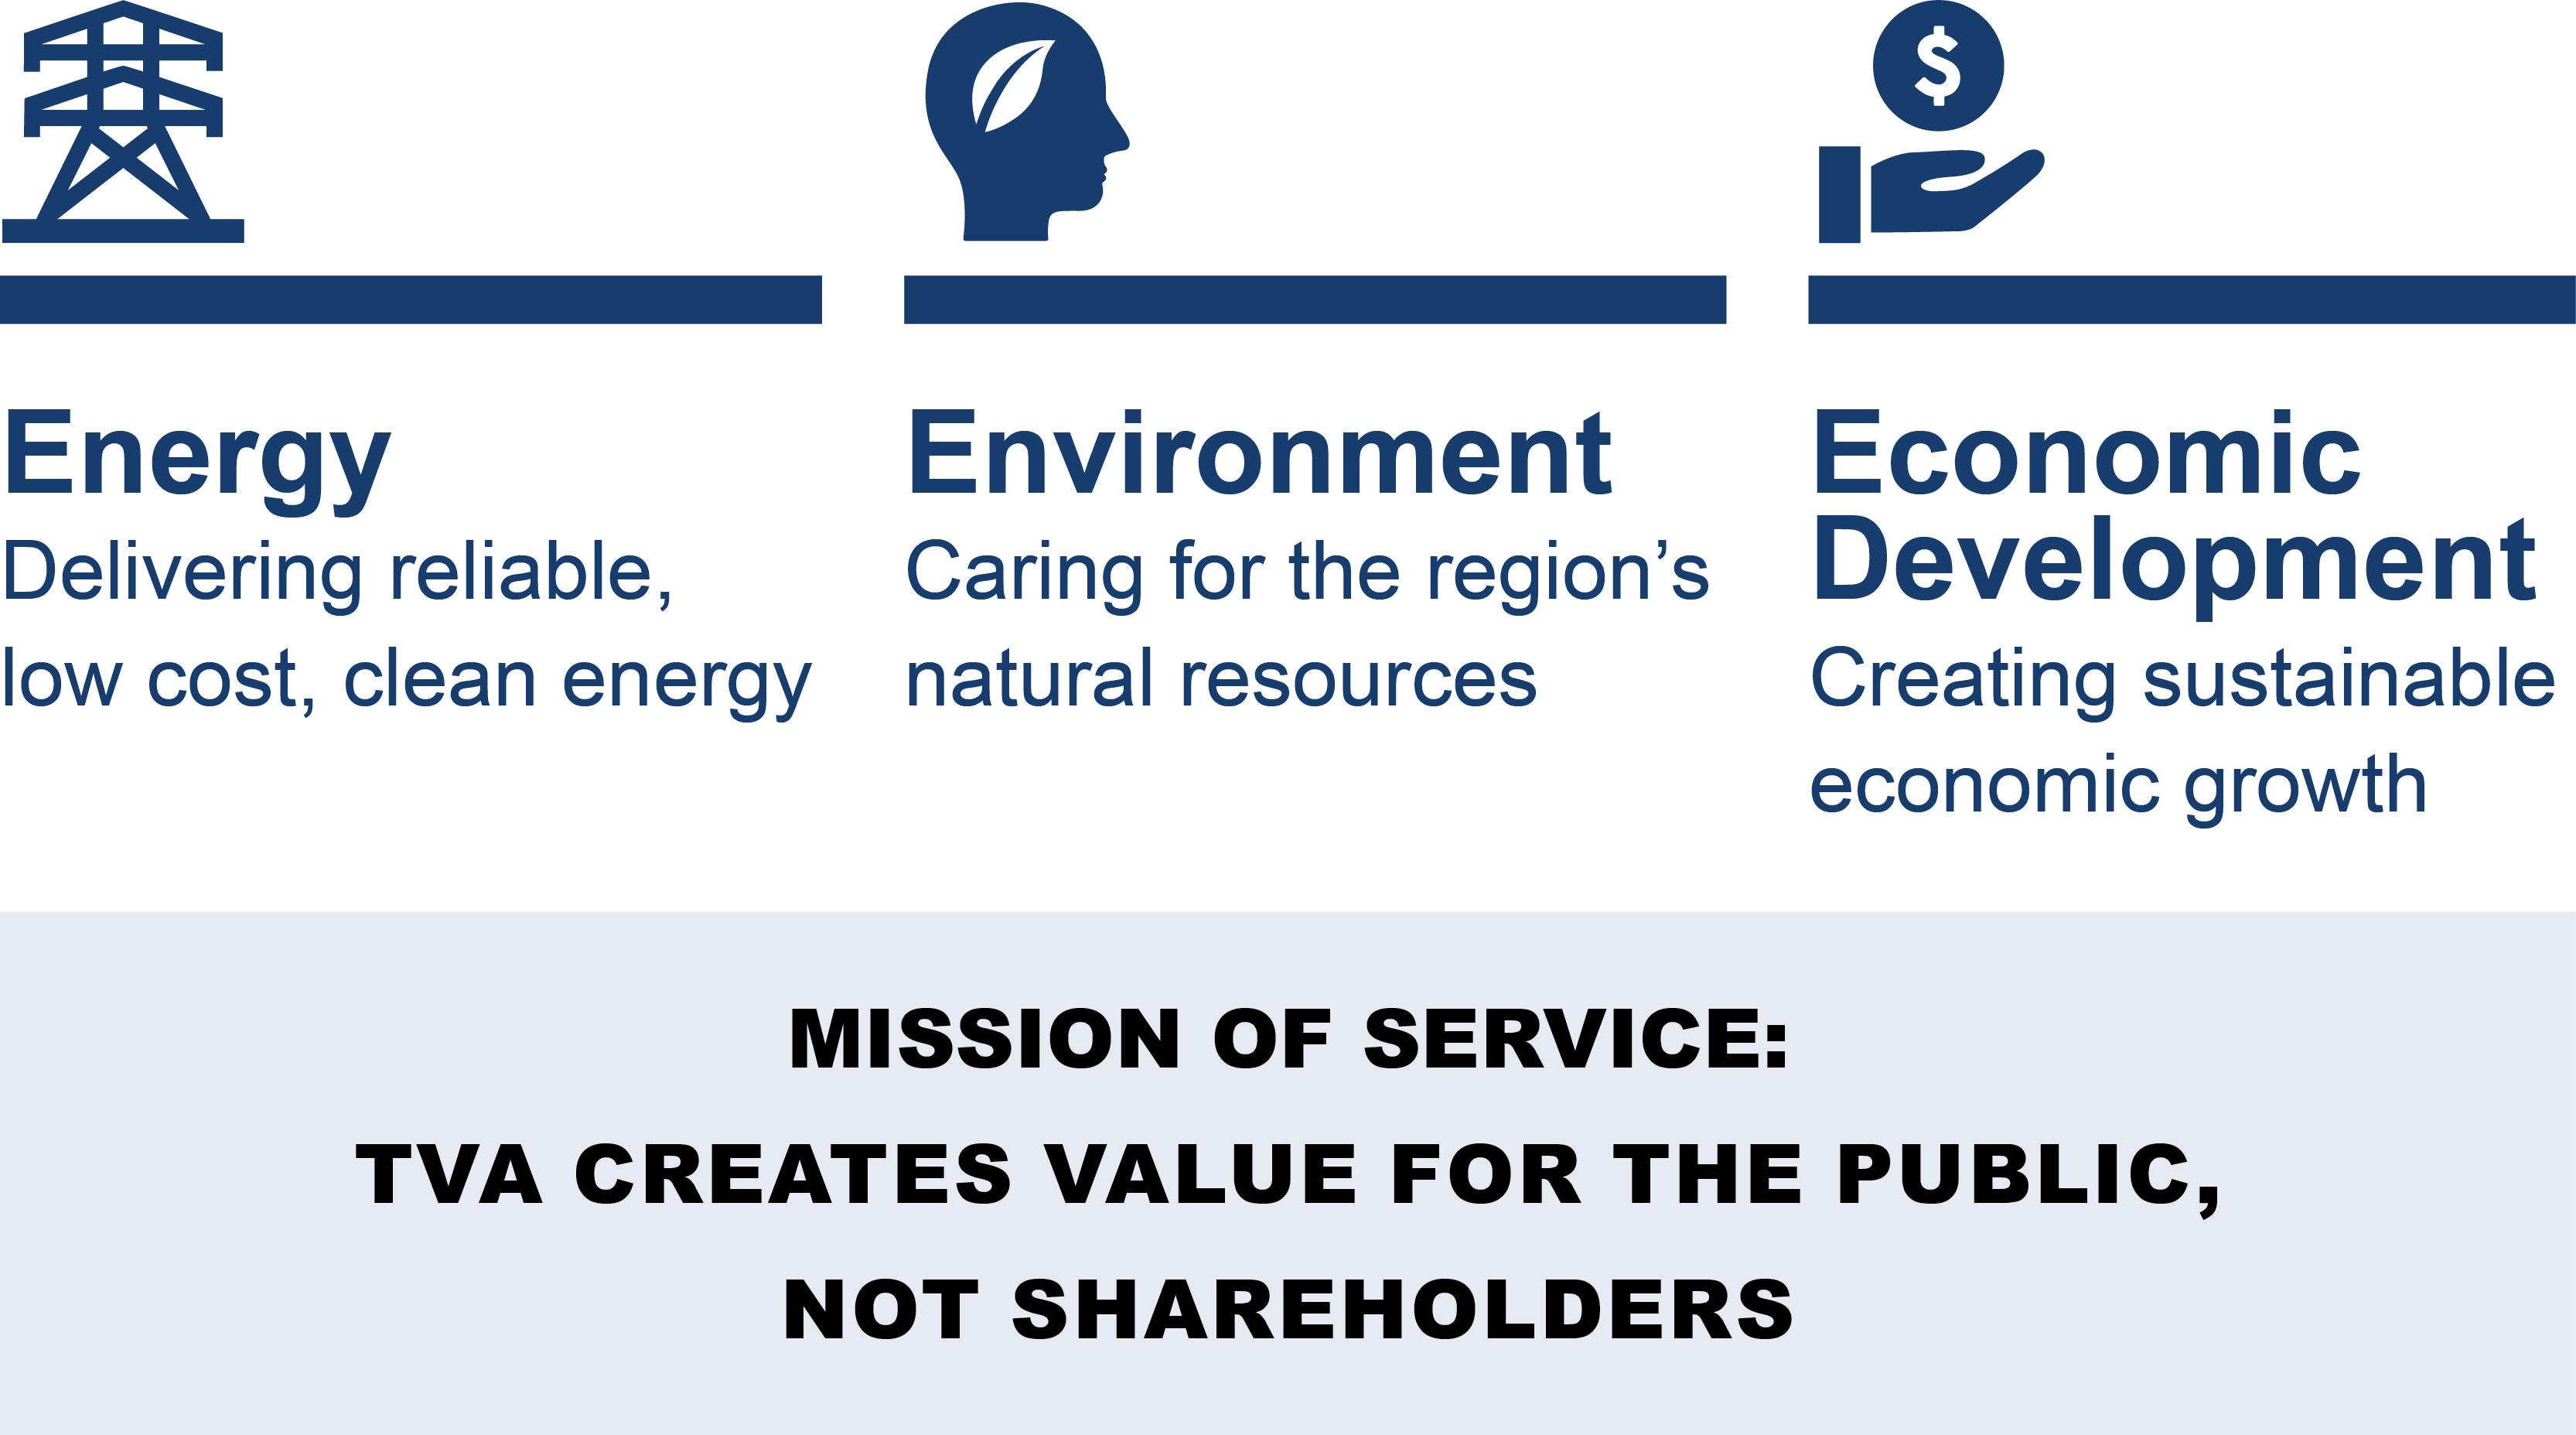
TVA was built for the people, created by federal legislation, and charged with a unique mission - to improve the quality of life in a seven-state region through the integrated management of the region's resources. TVA's mission focuses on three key areas:
•Energy — Delivering reliable, low cost, clean energy;
•Environment — Caring for the region's natural resources; and
•Economic Development — Creating sustainable economic growth.
TVA's Strategic Priorities
While TVA's mission has not changed since it was established in 1933, the climate in which TVA operates continues to evolve. To continue to deliver its mission of service while evolving for future success, TVA must realize five strategic priorities:
•People Advantage — Amplifying the energy, passion, and creativity within each TVA employee;
•Operational Excellence — Building on TVA's best-in-class reputation for reliable service and competitively priced power;
•Financial Strength — Investing in the future, while keeping energy costs as low as possible;
•Powerful Partnerships — Promoting progress through the shared success of TVA's customers and stakeholders; and
•Igniting Innovation — Pursuing innovative solutions for TVA and its customers and communities.
Service Area
TVA's service area, the area in which it sells power, is defined by the Tennessee Valley Authority Act of 1933, as amended ("TVA Act"). TVA supplies power in most of Tennessee, northern Alabama, northeastern Mississippi, and southwestern Kentucky, and in portions of northern Georgia, western North Carolina, and southwestern Virginia. Under the TVA Act, subject to certain minor exceptions, TVA may not, without the enactment of authorizing federal legislation, enter into contracts that would have the effect of making it, or the wholesale customers that distribute TVA power ("local power company customers" or "LPCs"), a source of power supply outside the area for which TVA or its LPCs were the primary source of power supply on July 1, 1957. This provision is referred to as the "fence" because it bounds TVA's sales activities, essentially limiting TVA to power sales within a defined service area.
Note
In addition to the locations above, TVA owns approximately one megawatt ("MW") of nameplate capacity among nine operating solar installations across the Tennessee Valley region with six installations in Tennessee, two in Alabama, and one in Mississippi. See Power Supply and Load Management Resources.Resources for a description of all of TVA's power supply resources.
In addition, the Federal Power Act ("FPA") includes a provision that helps protect TVA's ability to sell power within its service area. This provision, called the "anti-cherrypicking" provision, prevents the Federal Energy Regulatory Commission ("FERC") from ordering TVA to provide access to its transmission lines to others to deliver power to customers within TVA's defined service area. As a result, the anti-cherrypicking provision reduces TVA's exposure to loss of its customers. However, there have been some efforts to circumvent the anti-cherrypicking provision, and the protection of the provision could be limited and perhaps eliminated by federal legislation at some time in the future. See Competition and Item 1A, Risk Factors — Regulatory, Legislative, and Legal Risks — TVA maycould lose its protected service territory.territory.
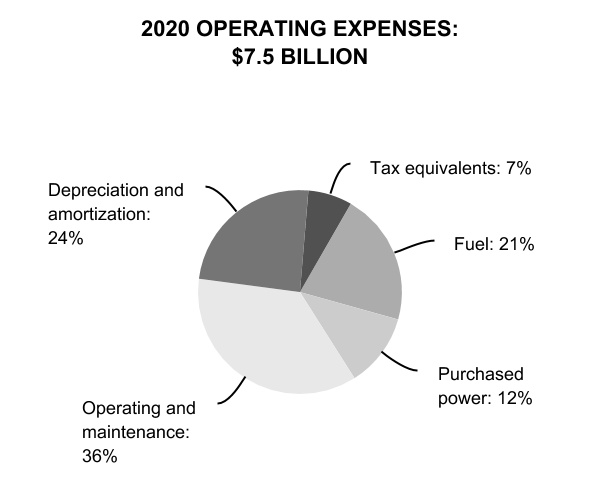
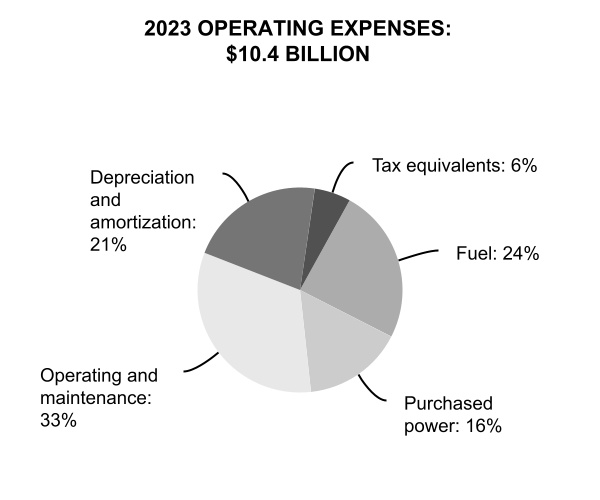
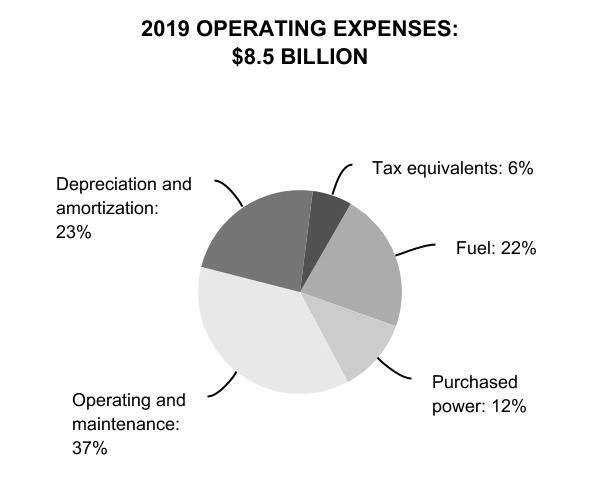
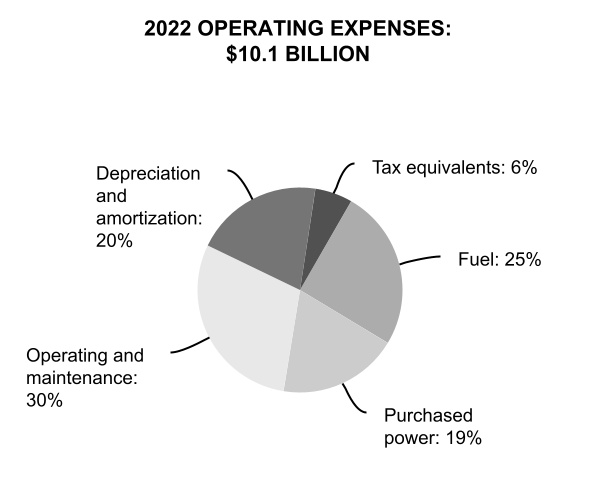
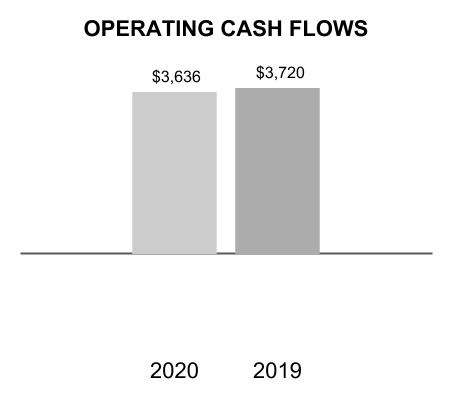
In 2020,2023, the revenues generated from TVA's electricity sales were $10.1$11.9 billion and accounted for virtually all of TVA's revenues. See Note 17 — Revenue for details regarding revenues by state for each of the last three years.
COVID-19 Pandemic
In March 2020, the World Health Organization declared the outbreak of the Coronavirus Disease 2019 ("COVID-19") to be a pandemic, which continues to be a serious challenge throughout the United States. TVA has implemented a company-wide
pandemic plan to address specific aspects of the COVID-19 pandemic. TVA's pandemic plan continues to evolve based on medical guidance and federal, regional, and local requirements and guidelines.
TVA has put in place measures to protect its workforce, stakeholders, and critical operations, such as extending the timeframe for workforce reintegration and continuing to implement strong physical and cybersecurity measures. Generation, transmission, and distribution functions are being actively monitored, and TVA's operations and delivery of energy to customers have not been materially impacted at this time. TVA has experienced a reduction in revenue through September 30, 2020 due to a decrease in energy demand, resulting from the COVID-19 pandemic, and therefore has implemented various cost savings initiatives such as deferring and prioritizing certain capital projects and decreasing discretionary spending. TVA continues to assess potential supplier risk and through September 30, 2020, has experienced minimal impacts in this regard.
The COVID-19 pandemic has also created economic uncertainty for TVA's LPCs and the communities they serve. To support LPCs and strengthen the public power response to the COVID-19 pandemic, TVA has created initiatives such as the Public Power Support and Stabilization Program, Back-to-Business Credit Program, Community Care Fund, and Pandemic Relief Credit. TVA has also provided regulatory flexibility for LPCs to halt disconnection of services. See Item 7, Management's Discussion and Analysis of Financial Condition and Results of Operations — Key Initiatives — Coronavirus Pandemic for an expanded discussion of the impact to TVA and related initiatives.
The COVID-19 pandemic is an evolving situation, and TVA will continue to monitor and adjust its response as necessary to ensure reliable service while protecting the safety and health of its workforce.
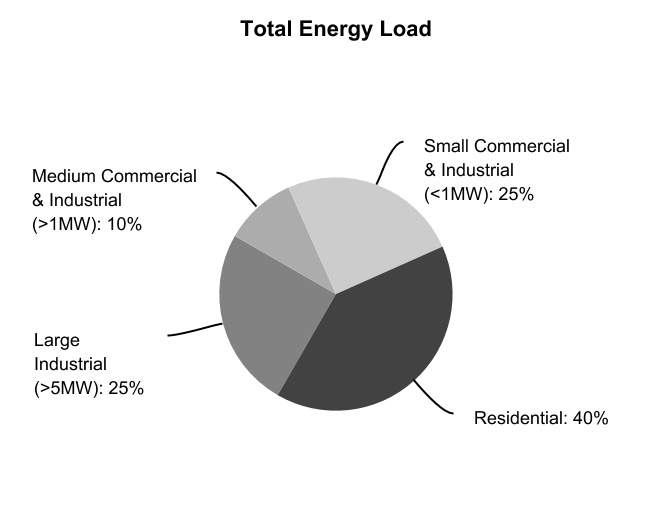
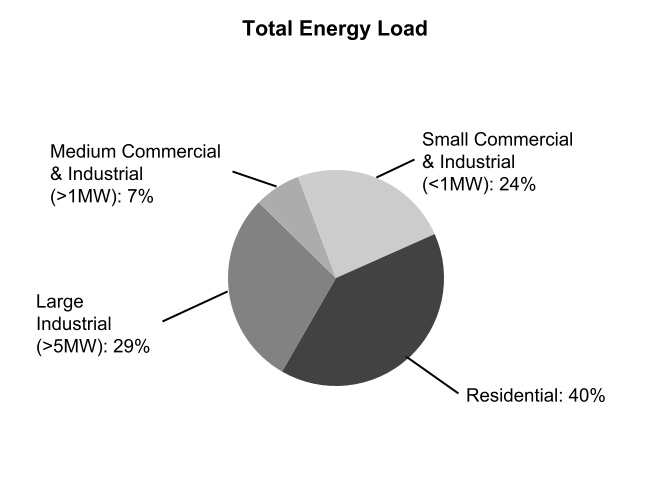
Customers
TVA is primarily a wholesaler of power, selling power to LPCs that then resell power to their customers at retail rates. TVA's LPCs consist of (1) municipalities and other local government entities ("municipalities") and (2) customer-owned entities ("cooperatives"). These municipalities and cooperatives operate public power electric systems whose primary purpose is not to make a profit but to supply electricity to the general public or the cooperatives' members. TVA also sells power directly to certain end-use customers, primarily large commercial and industrial loads and federal agencies with loads larger than 5,000 kilowatts ("kW").kilowatts. Whether TVA or an LPC serves a new power customer is determined by the applicable TVA-LPC wholesale power contract. Each contract contains a formula that balances the size of the LPC and the amount of any TVA infrastructure investment to determine which party is entitled to serve the new customer. In addition, power in excess of the needs of the TVA system may, where consistent with the provisions of the TVA Act, be sold under exchange power arrangements with other specific electric systems. See Part II, Item 7, Management's Discussion and Analysis of Financial Condition and Results of Operations — Results of Operations — Financial Results — Operating Revenues. Seeand Note 17 — Revenue for details regarding TVA's operating revenues for each of the last three years.revenues.
Local Power Company Customers
Revenues from LPCs accounted for approximately 9291 percent of TVA's total operating revenues in 2020. Following the merger in July 2020 of two LPCs,for 2023. TVA had wholesale power contracts with 153 LPCs at September 30, 2020.2023. Each of these contracts requires the LPC to purchase from TVA all of the electric power required for service to the LPC's customers; however, flexibility agreementsPower Supply Flexibility Agreements available to LPCs that have executed long-term contractsPartnership Agreements with TVA allow LPCs to locally generate or purchase up to approximately five percent of their average total hourly energy sales over the prior five yearsa certain time period in order to meet their individual customers' needs. Revised flexibility agreements were made available to LPCs in August 2023 which permit projects to be located anywhere in TVA's service area, either connected to the LPC distribution system or TVA's transmission system, and makes it easier for LPCs to partner in projects. As of September 30, 2023, 89 LPCs had signed a Power Supply Flexibility Agreement. LPCs purchase power under contracts with terms of five or 20 years to terminate.
TVA's two largest LPCs — Memphis Light, Gas and Water Division ("MLGW") and Nashville Electric Service ("NES") — have contracts with a five-year and a 20-year termination notice period, respectively. Sales to MLGW and NES accounted for nine percent and eight percent, respectively, of TVA's total operating revenues in 2020. In May 2020, MLGW published a draft Integrated Resource Plan ("IRP") to guide energy choices in the future, and in July 2020, TVA made a proposal to MLGW that highlights the benefits of remaining a TVA customer. In August 2020, MLGW published a final IRP and announced their plan to issue requests for proposal to validate the cost estimates included in the IRP. In addition, certain other LPCs are evaluating options for future energy choices.2023.
TVA and LPCs continue to work together to meet the changing needs of consumers around the Tennessee Valley. In 2019, the TVA Board approvedhas a 20-year Partnership Agreement option that better aligns the length of LPC power contracts with TVA's long-term commitments. These agreements areUnder the partnership arrangement, the LPC power contracts automatically extendedrenew each year after their initial effective date, contingent uponand have a 20-year termination notice. The partnership arrangements can be terminated under certain circumstances, including limitedTVA's failure to limit rate increases as provided for in the agreements going forward. Participating LPCs receive benefits including a 3.1 percent wholesale bill credit in exchange for their long-term commitment, which enables TVA to recover its long-term financial commitments over a commensurate period. In June 2020, TVA provided participating LPCs a flexibility option that allows them to locally generate up to approximately five percent of average total hourly energy sales over the prior five years in order to meet their individual customers' needs. As of November 16, 2020, 142September 30, 2023, 147 LPCs had signed the 20-year Partnership Agreement with TVA, and 64 LPCs had signed a Flexibility Agreement.TVA.
The power contracts between TVA and LPCs provide for the purchase of power by LPCs at the wholesale rates established by the TVA Board. Under the TVA Act, the TVA Board is authorized to regulate LPCs to carry out the purposes of the
TVA Act through contract terms and conditions as well as through rules and regulations. TVA regulates LPCs primarily through the provisions of TVA's wholesale power contracts. All of the power contracts between TVA and the LPCs require that power purchased from TVA be sold and distributed to the ultimate consumer without discrimination among consumers of the same class and prohibit direct or indirect discriminatory rates, rebates, or other special concessions. In addition, there are a number of wholesale power contract provisions through which TVA seeks to ensure that the electric system revenues of the LPCs are used only for electric system purposes. Furthermore, almost all of these contracts specify the resale rates and charges at which the LPC must resell TVA power to its customers. These rates are revised from time to time, subject to TVA approval, to reflect changes in costs, including changes in the wholesale cost of power.
TVA also regulates LPC policies for customer deposits, termination of service for non-payment, providing information to consumers, and billing through a service practice policy framework. TVA's regulatory framework provides for consistent regulatory policy for ratepayers across the Tennessee Valley, while recognizing local considerations. The regulatory provisions in TVA's wholesale power contracts are designed to carry out the objectives of the TVA Act, including the objective of providing for an adequate supply of power at the lowest feasible rates. See Rates — Rate Methodology below.
Other Customers
Revenues from directly served industrial customers accounted for approximately sixseven percent of TVA's total operating revenues in 2020.2023. Contracts with these customers are subject to termination by the customer or TVA upon a minimum notice period that varies according to a number of factors, including the customer's contract demand and the period of time service has been provided. TVA also serves seven federal customers, includingincluding U.S. Department of Energy ("DOE") facilities and military installations, which accounted for approximately one percent of TVA's total operating revenues in 2020.2023.
Other Revenue
Other revenue consists primarily of wheeling and network transmission charges, sales of excess steam that is a by-product of power production, delivery point charges for interconnection points between TVA and the customer, Renewable Energy Certificate ("REC") sales, and certain other minor items.ancillary goods or services. Other revenue accounted for approximately one percent of TVA's total operating revenues in 2020.2023.
Rates
Rate Authority
The TVA Act gives the TVA Board sole responsibility for establishing the rates TVA charges for power. These rates are not subject to judicial review or to review or approval by any state or other federal regulatory body. Under the TVA Act, TVA is required to charge rates for power that will produce gross revenues sufficient to provide funds for:
•Operation, maintenance, and administration of its power system;
•Payments to states and counties in lieu of taxes ("tax equivalents");
•Debt service on outstanding indebtedness;
•Payments to the United States Department of the Treasury ("U.S. TreasuryTreasury") in repayment of and as a return on the government's appropriation investment in TVA's power facilities (the "Power Program Appropriation Investment"); and
•Such additional margin as the TVA Board may consider desirable for investment in power system assets, retirement of outstanding Bonds in advance of their maturity, additional reduction of the Power Program Appropriation Investment, and other purposes connected with TVA's power business, having due regard for the primary objectives of the TVA Act, including the objective that power shall be sold at rates as low as are feasible. See Note 1823 — Proprietary CapitalRelated Parties.
TVA fulfilled its requirement to repay $1.0 billion of the Power Program Appropriation Investment in 2014; therefore, the repayment of this amount is no longer a component of rate setting.
Rate Methodology
TVA uses a seasonal time of use wholesale rate structure comprised of base demand and energy rates, a fuel rate, and a grid access charge ("GAC"). In setting the base rates, TVA uses a debt-service coverage ("DSC")methodology to derive annual revenue requirements in a manner similar to that used by other public power entities that also use the DSCdebt-service coverage rate methodology. Under the DSCdebt-service coverage methodology, rates are calculated so that an entity will be able to cover its operating costs and to satisfy its obligations to pay principal and interest on debt, plus an additional margin. This ratemaking approach is particularly suitable for use by entities financed primarily, if not entirely, by debt, such as TVA, and helps ensure that TVA produces gross revenues sufficient to fund requirements specified in the TVA Act listed under Rate Authority above.TVA's rate structure includes a focus on TVA's long-term pricing by aligning rates with underlying cost drivers.
TVA recovers fuel costs and tax equivalent payments associated with fuel cost adjustments through a monthly rate reflecting the forecasted costs of fuel. Beginning on October 1, 2018, fuelFuel costs are allocated to three groups of customers: (1) Standard Service (residential and small commercial customers), large manufacturing customers with contract demands greater than 5 megawatts ("MW"), and(2) large general service customers with contract demands greater than 5 MW, and (3) large manufacturing customers with contract demands greater than 5 MW. Fuel costs are
allocated to these three classes of customers in relation to their hourly loads and TVA's hourly incremental dispatch cost. Total monthly fuel costs include costs for natural gas, fuel oil, coal, purchased power, emission allowances, nuclear fuel, and other fuel-related commodities as well as realized gains and losses on derivatives purchased to hedge the costs of such commodities.
In recent years, TVA, LPCs, and directly served industries have worked collaboratively to develop changes to TVA's rate structures that focus on TVA's long-term pricing efforts. These changes are improving pricing by better aligning rates with underlying cost drivers and by sending improved pricing signals, while maintaining competitive industrial rates and keeping residential rates affordable. The rate structures are also designed to reduce wholesale energy rates for Standard Service and introduce a GAC at an offsetting rate to better recover fixed costs. This approach more accurately reflects the wholesale cost of energy and recognizes the value of the grid's reliability and associated fixed costs. TVA's modernized approach to pricing provides bill stability while maintaining reliability and fairness for all TVA's customers.
Power Supply and Load Management Resources
General
TVA seeks to balance production capabilities with power supply requirements by promoting the conservation and efficient use of electricity and, when necessary, buying, building, or leasing assets or entering into power purchase agreements.agreements ("PPAs"). TVA also seeks to employ a diverse mix of energy generating sources and works toward obtaining greater amounts of its power supply from clean (low or zero carbon-emitting) resources.
TVA is making investments in its generating portfolio and infrastructure to modernize the fleet and help meet growing demand for electricity while also allowing TVA to maintain competitive rates and high reliability and work toward an increasingly clean power system. As TVA continues to evaluate the impact of retiring its coal-fired fleet by 2035 and works to accelerate the growth of renewables, it also continues to evaluate adding flexible lower carbon-emitting gas plants as a strategy to maintain reliability. Commercial plant operations began on Colbert Combustion Turbine Units 9-11 in July 2023, and TVA has ongoing gas projects at TVA’s Paradise, Johnsonville, and Cumberland sites. In addition, TVA is committed to investing in the future of nuclear with the evaluation of emerging advanced nuclear technologies, such as small modular reactors ("SMRs"), while also
investing in its existing nuclear assets and working to renew its nuclear generation fleet licenses. TVA has been implementing the Hydro Life Extension Program with a focus on improving the availability and flexibility of the hydroelectric fleet and exploring new hydroelectric pumped-storage power to support the grid. It is also investing in research and development for technology around hydrogen fuel and carbon emitting) resources.capture, utilization, and storage. In 2022, the Inflation Reduction Act of 2022 ("Inflation Reduction Act") was signed into law, which makes certain tax-exempt entities, including TVA, eligible for a direct-pay option for certain tax credits that encourage investment in clean energy, in some circumstances. TVA is currently exploring funding opportunities of various types, including opportunities involving pumped-storage, solar, carbon capture, hydrogen, and transmission, among others; however, this exploration does not guarantee that TVA or its partners will receive any funds. See Research and Development below, Item 1A, Risk Factors — Operational Risks, and Part II, Item 7, Management's Discussion and Analysis of Financial Condition and Results of Operations — Key Initiatives and Challenges — Optimum Energy Portfolio.
Power generating facilities operated by TVA at September 30, 2020,2023, included three nuclear sites, 17 natural gas and/or oil-fired sites, fivefour coal-fired sites, 29 conventional hydroelectric sites, one pumped-storage hydroelectric site, one diesel generator site, and 14nine operating solar energy sites, although a certain number of these facilities were out of service as of September 30, 2020.installations. See Item 2, Properties — Generating Properties — Net Capability for a discussion of the units at these facilities. TVA also acquires power under power purchase agreements ("PPAs")PPAs of varying durations, including short-term contracts of less than 24-hours in duration. See Item 7, Management's DiscussionPower Purchase and Analysis of Financial Condition and Results of Operations — Results of Operations —Other Agreements Financial Results — Operating Expenses.below.
The following table shows TVA's generation and purchased power by generating source as a percentage of all
electric power generated and purchased (based on kilowatt hours ("kWh")) for the periods indicated:
| | | | | | | | | | | | | | | | | | | | |
Total Power Supply by Generating Source For the years ended September 30 |
Generation Resource(1) | | 2020 | | 2019 | | 2018 |
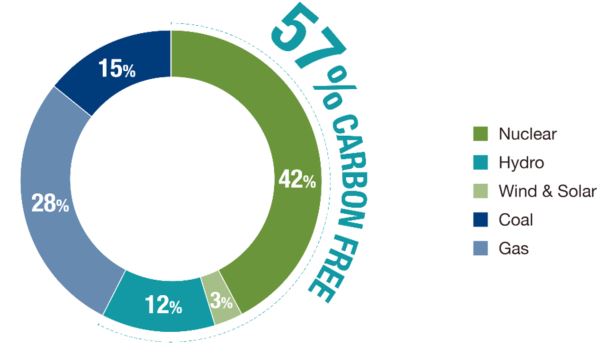
| Nuclear | | 42% | | 39% | | 39% |
| Natural gas and/or oil-fired | | 22% | | 20% | | 20% |
| Coal-fired | | 13% | | 17% | | 19% |
| Hydroelectric | | 10% | | 10% | | 9% |
| Purchased power (non-renewable) | | 8% | | 9% | | 9% |
| Purchased power (renewable) | | 5% | | 5% | | 4% |
| | | | | | | | | | | | | | | | | | | | |
Total Power Supply by Generating Source For the years ended September 30 |
Generation Resource(1) | | 2023 | | 2022 | | 2021 |
| Nuclear | | 42% | | 39% | | 41% |
| Natural gas and/or oil-fired | | 22% | | 22% | | 21% |
| Coal-fired | | 13% | | 13% | | 15% |
| Hydroelectric | | 8% | | 8% | | 10% |
| Purchased power | | 15% | | 18% | | 13% |
| | | | | | |
| | | | | | |
Note
(1) TVA's non-hydro renewable resources from TVA facilities are less than one percent for all periods shown, and therefore are not represented on the table above. Purchased power (renewable) contains the majority of non-hydro renewable energy supply. TVA sells the RECs resulting from some of its purchased power to certain customers. See Part II, Item 7, Management's Discussion and Analysis of Financial Condition and Results of Operations —Key Initiatives and Challenges — Optimum Energy Portfolio — Renewable Power Purchase Agreements.
12While TVA continues down the path of reducing power generation from carbon-emitting sources, there will be fluctuations in usage due to electricity demands. Also, TVA continues to make operational decisions to keep the system reliable and to deliver low-cost energy.
Nuclear
At September 30, 2020,2023, TVA had three nuclear sites consisting of seven units in operation. The units at Browns Ferry Nuclear Plant ("Browns Ferry") are boiling water reactor units, and the units at Sequoyah Nuclear Plant ("Sequoyah") and Watts Bar Nuclear Plant ("Watts Bar") are pressurized water reactor units. Operating information for each of these units is included in the table below.
| | | | | | | | | | | | | | | | | | | | |
TVA Nuclear Power At September 30, 2020 |
Nuclear Unit | | Summer Net Capability (MW) | | Net Capacity Factor for 2020 (%) | | Date of Expiration
of Operating
License |
Browns Ferry Unit 1(1) | | 1,101 | | 107.9 | | 2033 |
Browns Ferry Unit 2(1) | | 1,103 | | 100.7 | | 2034 |
Browns Ferry Unit 3(1) | | 1,105 | | 91.7 | | 2036 |
| Sequoyah Unit 1 | | 1,152 | | 82.3 | | 2040 |
| Sequoyah Unit 2 | | 1,140 | | 90.0 | | 2041 |
| Watts Bar Unit 1 | | 1,157 | | 81.6 | | 2035 |
| Watts Bar Unit 2 | | 1,164 | | 89.2 | | 2055 |
Note
(1)The summer net capability for Browns Ferry excludes the impact of the extended power uprate project. The generating capability is expected to increase by an estimated 465 MW after sufficient run time to validate the new capacity. | | | | | | | | | | | | | | | | | | | | |
TVA Nuclear Power At September 30, 2023 |
Nuclear Unit | | Summer Net Capability (MW) | | Net Capacity Factor for 2023 (%) | | Date of Expiration
of Operating
License |
| Browns Ferry Unit 1 | | 1,227 | | 90.0 | | 2033 |
| Browns Ferry Unit 2 | | 1,208 | | 89.2 | | 2034 |
| Browns Ferry Unit 3 | | 1,227 | | 90.3 | | 2036 |
| Sequoyah Unit 1 | | 1,152 | | 88.0 | | 2040 |
| Sequoyah Unit 2 | | 1,140 | | 89.4 | | 2041 |
| Watts Bar Unit 1 | | 1,157 | | 88.0 | | 2035 |
| Watts Bar Unit 2 | | 1,121 | | 100.0 | | 2055 |
Extended Power UprateNuclear Fleet License Extensions. On August 14, 2017,TVA is seeking to renew all nuclear generation units' licenses for an additional 20 years. The first license renewal application is expected to be submitted to the Nuclear Regulatory Commission ("NRC") approved TVA's requestin January 2024 for a 465 MW extended power uprate ("EPU") projectthe three units at Browns Ferry. Physical work on all units was completed in 2019. The generating capacity is expected to increase 465 MW after sufficient run time to validate the new capacity, which is expected to occur in 2021. See Part II, Item 7, Management's Discussion and Analysis of Financial
Condition and Results of Operations — Key Initiatives and Challenges— Generation Resources Optimum Energy Portfolio— Extended Power Uprate.Nuclear Fleet License Extensions.
Other Nuclear Initiatives. The NRC issuedTVA has an Early Site Permit to TVA in December 2019 to license small modular reactors ("SMRs")potentially construct and operate SMRs at TVA's Clinch River Nuclear Site in Oak Ridge, Tennessee.Tennessee, and in 2022, the TVA Board approved a programmatic approach to exploring advanced nuclear technology (the "New Nuclear Program"). See Part II, Item 7, Management's Discussion and Analysis of Financial Condition and Results of Operations — Key Initiatives and Challenges — Generation ResourcesOptimum Energy Portfolio — Small Modular Reactors.
Other Nuclear Matters. Operating nuclear facilities subjects TVA to waste disposal, decommissioning, and insurance requirements, as well as litigation risks. See Fuel Supply — Nuclear Fuel below for a discussion of spent nuclear fuel and low-level radioactive waste and Note 22 — Commitments and Contingencies — Contingencies for a discussion of TVA's nuclear decommissioning liabilities and the related trust and nuclear insurance, and Note 22 — Commitments and Contingencies — Legal Proceedings and Item 7, Management's Discussion and Analysis of Financial Condition and Results of Operations — Key Initiatives and Challenges — Apparent Violations of NRC Regulations for a discussion of legal and administrative proceedings related to TVA's nuclear program, which discussions are incorporated herein by reference.
Natural Gas and/or Oil-Fired
At September 30, 2020,2023, TVA's natural gas and oil-fired fleet consisted of 101104 combustion turbine power blocks (86(84 simple-cycle units, one cogeneration unit, and 14 combined-cycle power units),units, accounting for 12,50912,638 MW of summer net capability. Sixtycapability, and five idled units at Allen Combustion Turbine Facility: Units 2, 3, 11, 17, and 18). Sixty-five of the simple-cycle units are currently capable of quick-start response allowing full generation capability in approximately 10 minutes. The economic dispatch of natural gas-fired plants depends on both the day-to-day price of natural gas and the price of other available intermediate resources such as coal-fired plants. TVA uses simple-cycle units to meet peaking or backup power needs. TVA's 2019 IRP projects significant solar expansion overAs TVA evaluates the next decade.retirement of its coal-fired fleet and works to accelerate the growth of renewables, it also continues to evaluate adding flexible lower carbon-emitting gas plants as a strategy to maintain reliability. The natural gas-fired fleet supports thatrenewable expansion by providing reliability across all hours, as well as the flexibility to help manage ramping and intermittency. Commercial plant operations began on Colbert Combustion Turbine Units 9-11 on July 25, 2023. Pre-commercial plant operations began on Paradise Combustion Turbine Units 5-7 in the first quarter of 2024, and all three new units are anticipated to enter commercial operations by the end of calendar year ("CY") 2023. TVA has other ongoing projects at TVA's Johnsonville and Cumberland sites. TVA may decide to make further strategic investments in natural gas-fired facilities in the future by purchase, construction, or lease, to help support portfolio diversification and system reliability.
See Item 2, Properties — Generating Properties, Note 78 — Leases, Note 1011 — Variable Interest Entities, and Note 1314 — Debt and Other Obligations for a discussion of lease arrangements into which TVA has entered in connection with certain combustion turbine units. Becauseunits ("CTs"). See Part II, Item 7, Management's Discussion and Analysis of TVA's strategyFinancial Condition and Results of portfolio diversificationOperations — Key Initiatives and reductionChallenges — Optimum Energy Portfolio— Natural Gas-Fired Units for a discussion of air emissions, TVA may decide to make further strategic investments inongoing projects at certain natural gas-fired facilities in the future by purchase, construction, or lease..
Coal-Fired
At September 30, 2020,2023, TVA had fivefour coal-fired plants consisting of 2524 active units, accounting for 6,9155,815 MW of summer net capability. TVA considers units to be in an active state when the unit is generating, available for service, or temporarily unavailable due to equipment failures, inspections, or repairs. All other coal-fired units are considered retired. In 2018,2019, the TVA Board approved a plan to perform assessmentsthe retirement of Bull Run Fossil Plant ("Bull Run") and Paradise Fossil Plant
("Paradise"). Results of these assessments were presented to the TVA Board at its February 2019 meeting, and the Board approved the retirement of Paradise Unit 3 by December 20202023, and Bull Run by December 2023. Paradise Unit 3on September 30, 2023, the facility was taken offline on February 1, 2020, effectively retiring the plant.retired.
Coal-fired plants have been subject to increasingly stringent regulatory requirements over the last few decades, including those under the Clean Air Act ("CAA"), the Clean Water Act ("CWA"), and the Resource Conservation and Recovery Act ("RCRA"). TVA has committed to a programmatic approach for the evaluation of its sites where coal combustion residuals ("CCR") are stored to meet all applicable state and federal regulations. Increasing regulatory costs have caused TVA to consider whether to make the required capital investments to continue operating its coal-fired facilities. See Part II, Item 7, Management's Discussion and Analysis of Financial Condition and Results of Operations — Key Initiatives and Challenges — Generation ResourcesCoal Combustion Residuals — Coal Combustion Residuals Facilities.
TVA is movingcontinues to work toward a more balanced generation plan with greater reliance on lower-cost and cleaner energy generation technologies. Since September 30, 2010, TVA has reduced its summer net capability of coal-fired units by 7,6538,418 MW. TheFollowing the publication of the 2019 IRP indicated evaluation of additional coal unit retirements. MostIntegrated Resource Plan ("IRP"), TVA conducted end-of-life evaluations of the remaining coal-fired plants arecoal fleet to inform long-term planning. These evaluations confirmed that the aging coal fleet is among the oldest in the nation still in operation, and their fitis experiencing deterioration of material condition and performance challenges. The performance challenges are projected to increase due to the coal fleet’s advancing age and the difficulty of adapting the coal fleet’s generation within TVA's power supply portfolio will be further tested in the future with increasing amountschanging generation profile. TVA is evaluating the impact of solar generation utilizedretiring the balance of the coal-fired fleet by TVA. TVA's long-range plans will continue2035, and that evaluation includes environmental review, public input, and TVA Board approval. In January 2023, TVA issued its Record of Decision to considerretire the coststwo coal-fired units at Cumberland Fossil Plant ("Cumberland") by the end of CY 2026 and benefitsCY 2028. Environmental reviews and the public input process evaluating the potential retirement of significant environmental and other major capital investments at its remaining coal-fired plants.Kingston Fossil Plant ("Kingston") are underway. See Part II, Item 7,Management's Discussion and Analysis of Financial Condition and Results of Operations — — Key Initiatives and Challenges — Generation Resources — Optimum Energy Portfolio.Portfolio.
Diesel Generators
At September 30, 2023, TVA had one diesel generator plant consisting of five units, and this facility accounted for 9
MW of summer net capability. These units are not currently dispatched for generation to the transmission grid.
Hydroelectric Pumped-Storage
At September 30, 2023, TVA had four units at Raccoon Mountain Pumped-Storage Plant ("Raccoon Mountain") with a total net summer capability of 1,700 MW. These units are utilized to balance the transmission system as well as generate power. TVA uses electricity generated by its fleet during periods of low demand to operate pumps that fill the reservoir at Raccoon Mountain. Then, during periods of high or peak demand, the water is released and the pumps reverse to work as power generating turbines.
New hydroelectric pumped-storage is one of several technologies that TVA is exploring to ensure the reliability and resiliency of the grid, particularly as intermittent renewables like solar continue to be added to the generation mix. In 2023, TVA announced sites for a potential future pumped-storage facility. A programmatic environmental impact statement will rank these sites for overall favorability across a wide range of environmental, social, and technical factors. Early exploratory drilling has begun on the sites.
Renewable Energy Resources
As more consumers and businesses are seeking cleaner energy, the utility industry is evolving to meet those needs. As TVA also evolves, it will see impacts to the way it does business through the pricing of products, transmission of energy, and development of new products and services for its customers in support of changing customer preferences. Many companies are focusing on sustainability and requiring more energy efficiency and renewable energy options. In addition, TVA seeks to obtain greater amounts of its power supply from clean resources to work towards carbon emission reductions. As a result, TVA is working to increase its renewable energy portfolio, by investing in existing hydroelectric assets through the Hydro Life Extension Program, securing renewable PPAs, and exploring self-directed solar projects. TVA also encourages renewable power and offers renewable resources through various current programs and offerings, including the Green Invest Program which matches customer demand with renewable supply and is aimed to meet the needs of customers at scale. TVA issued a carbon-free request for proposal ("RFP") in 2022 for up to 5,000 MW of carbon-free and renewable energy projects, which included a broad range of potential generation sources. See Power Purchase and Other Agreements for information on TVA’s PPAs, including renewable agreements, and Part II, Item 7, Management's Discussion and Analysis of Financial Condition and Results of Operations — Key Initiatives and Challenges — Optimum Energy Portfolio — Renewable Power Purchase Agreements for a discussion of TVA's RFPs.
Conventional Hydroelectric DamsDams.. TVA maintains At September 30, 2023, TVA's hydroelectric fleet consisted of 29 conventional hydroelectric dams with 109 generating units throughout the Tennessee River system for the production of electricity. As of September 30, 2020, thesewith 106 active generating units that accounted for 3,7593,739 MW of summer net capability. Wilbur Hydroelectric Facility Units 1-3 were in long-term outage and unavailable for service at September 30, 2023. The amount of electricity that TVA is able to generate from its hydroelectric plants depends on a number of factors, including the amount of precipitation and runoff, initial water levels, generating unit availability, and the need for water for competing water management objectives. When these factors are unfavorable, TVA must increase its reliance on higher cost generation plants and purchased power. In addition, TVA receives a portion of energy generated by nineeight of the U.S. Army Corps of Engineers ("USACE") dams on the Cumberland River system, contributes toand electric generation from the TVA power system.USACE dams is dependent on the same factors that affect generation from the TVA-owned dams. SeeDam Safety Assurance Program and Weather and Seasonality below andItem 7,Management's Discussion and Analysis of Financial Condition and Results of Operations — Key Initiatives and Challenges — Dam Safety and Remediation Initiatives.below.
Raccoon Mountain Pumped-Storage Plant. At September 30, 2020, TVA had four units at Raccoon Mountain Pumped-Storage Plant ("Raccoon Mountain") with a total net summer capability of 1,635 MW. These units are utilized to balance the transmission system as well as generate power. TVA uses electricity generated by its fleet during periods of low demand to operate pumps that fill the reservoir at Raccoon Mountain. Then, during periods of high or peak demand, the water is released and the pumps reverse to work as power generating turbines.
Hiwassee Hydro Unit 2.Hiwassee Hydro Unit 2 has a unique reversible turbine/generator that acts as a pump and a turbine enhancing TVA's ability to balance baseload generation. At September 30, 2023, Hiwassee Hydro Unit 2 has aaccounted for 86 MW of the conventional hydroelectric summer net capability of 86 MW.capability.
Hydro Modernization Program. TVA's Hydro ModernizationLife Extension Program began in 1992 and focused on units2021 with potential to increase peaking capacity and improve reliability. With the completion of Pickwick Landing Dam ("Pickwick") Unit 2 in 2020, the initial Hydro Modernization Program has concluded with modernization completed on 62 conventional hydroelectric units under the program. The modernization projects resulted in 453 MW of increased capacity from the conventional hydroelectric units, with an average efficiency gain of approximately five percent. In 2019, TVA began its transition to a new program, the Hydro Major Maintenance Program, intended to focus on addressing reliability risks that will support the preservation ofrecovering and preserving TVA's extensive hydroelectric fleet, capacity.improving efficiency and flexibility, and ensuring long-term reliability of this vital clean energy asset. Hydroelectric generation will continue to be an important part of TVA's energy mix since itin the future. It plays a vital role in carbon reduction initiatives, the ability to integrate other renewables into the power portfolio, and ultimately, TVA's ability to meet changing customer preferences for cleaner energy sources. As such,
In January 2023, TVA signed a Memorandum of Understanding ("MOU") with the DOE to enhance collaboration on hydropower technology development. Joint efforts will focus on evaluating and demonstrating different approaches for operating hydropower plants to meet the electricity grid's changing needs.
Dam Safety Assurance Program. TVA has an established dam safety program, which includes procedures based on the Federal Guidelines for Dam Safety, with the objective of reducing the risk of a dam safety event. The program analyzes, evaluates, and manages risks through a systematic and thorough process that facilitates decision-making for the safety of a structure, identifying necessary actions to reduce risk, including remediation projects, and prioritization of actions for TVA's river
dams. Prioritization is currently evaluatingdriven by reducing risk to the needpublic and asset preservation. TVA also continues to revitalize the Hydro Modernization Program to increase the capability, flexibility, and availabilityprovide routine care of the hydroelectric fleetdams as part of the dam safety program through inspections, monitoring, and maintenance, among other activities.
Self-Directed Solar. During 2019, the TVA Board approved the opportunity for TVA to help meet these changing customer preferences.explore being directly involved in the development of a utility-scale solar project, contingent on the successful completion of environmental reviews under the National Environmental Policy Act ("NEPA") and other applicable laws. In 2021, TVA purchased land for this development, and in 2022, environmental reviews were complete. The challenges affecting the U.S. solar industry are also being seen in TVA's self-directed solar project. This has resulted in a delay in the estimated completion, with the project now expected to be complete by the end of CY 2027. The project has also experienced cost increases due to escalations from supply chain limitations.
In November 2022, the TVA Board approved the opportunity for TVA to explore the development of an additional utility-scale solar project, contingent on successfully completing environmental reviews under NEPA and other applicable laws and obtaining the necessary state permits. The project would utilize TVA-owned land, deploying a solar cap system on the closed CCR facility at the TVA Shawnee Fossil Plant in Paducah, Kentucky. See Part II, Item 7, Management's Discussion and Analysis of Financial Condition and Results of Operations — Key Initiatives and Challenges — Optimum Energy Portfolio — Self-Directed Solar.
Other Renewable Energy ResourcesResources.
TVA'sIn addition to the hydroelectric units above, TVA owns nine operating solar installations that account for approximately one MW of nameplate capacity. Other renewable energy portfolio includes both TVA-owned assets andresources also include renewable energy purchases.purchases, a majority associated with TVA owns 14 solar sites with a total net summer capability of approximately 1 MW. TVA currently plans to meet renewable goals through power purchases and arrangements with LPCs.programs. SeeDistributed Energy Resources and Power Purchase and Other Agreements below.for information on renewable PPAs. TVA's current renewable programs and offerings include:
Small-scale Solutions. The Green Connect Program connects residential customers who are interested in on-site solar photovoltaic ("PV") and/or battery storage systems with qualified solar and battery storage installers who agree to install to Green
Connect Program Standards. These qualified installers, who are members of TVA's Quality Contractor Network, are insured and
licensed and have also completed special training on TVA guidelines. Participants have access to objective information and the benefit of installation verifications with regard to whether their solar PV system has met the Green Connect Program Standards.
Utility-scale Solutions. The Green Invest Program matches customer demand with renewable supply through a Green Invest Agreement. The goal of the Green Invest Program is to meet the long-term sustainability needs of customers at scale. TVA procures the needed renewable supply through a diversified approach, which could include a competitive procurement process, strategic partnerships, or construction of renewable facilities to meet these needs. As of September 30, 2023, more than 2,000 MW of renewable PPAs have been matched to customers through the Green Invest Program. In addition, Generation Flexibility is a solution available to LPCs participating in TVA's Partnership Agreement and supports the deployment of up to 2,000 MW of distributed solar to provide clean, local generation. See Note 17 — Revenue.
Other Renewable Solutions. The Green Switch Program allows customers to support solar renewable resources through purchasing renewable solar energy generated in the Tennessee Valley. The product is sold in blocks of 200 kWh or matches 100 percent of a customer's electricity usage (available through select LPCs). During the year ended September 30, 2023, participants purchased 91,268 MWh through the Green Switch Program. The Green Flex Program gives commercial and industrial customers the ability to meet sustainability goals and to make renewable energy claims through RECs from wind generation located outside TVA's service area. During the year ended September 30, 2023, participants purchased approximately 650,000 RECs through the Green Flex Program.
TVA tracks its renewable energy commitments and claims through the management of Renewable Energy Certificates ("RECs").RECs. The RECs, which each represent 1one megawatt-hour ("MWh") of renewable energy generation, are principally associated with wind, solar, biomass, and low-impact hydroelectric. TVA continues to evaluate ways to adjust to customer preferences and requirements for cleaner and greener energy, including the acquisition of RECs from renewable purchased
power. These RECs power that can be sold to customers to meet their needs. Overall, TVA will procure needed renewable supply through a diversified approach, which could include a competitive procurement process, strategic partnerships, or construction of renewable facilities to meet these needs.
Total Renewable Energy Resources. As of September 30, 2023, TVA's total renewable energy resources amounted to 8,668 MW. Of this amount, 6,801 MW are operating while 1,867 MW are contracted but not yet online. In addition, TVA has 299 MW from self-directed solar projects currently under development.
Notes
(1) Contracted resources are executed PPAs expected to come online at a future date.
(2) Hydroelectric power consists of 3,739 MW from TVA-owned conventional hydroelectric facilities and 779 MW from renewable PPAs.
(3)TVA sells the RECs resulting from some of its purchased power to certain customers. See Part II, Item 7, Management's Discussion and Analysis of Financial Condition and Results of Operations —Key Initiatives and Challenges — Optimum Energy Portfolio — Renewable Power Purchase Agreements.
At September 30, 2020, TVA's operating renewables by location and by source are detailed below:
Notes
(1) In-Valley refers to the renewable energy that is sourced within TVA's service territory. Out-of-Valley refers to the renewable energy that is sourced outside of TVA's service territory and solely consists of wind power.
(2) See Power Purchase and Other Agreements below. PPAs also include capability from various historical renewable energy programs primarily with individuals and small businesses.
(3)TVA had one diesel generator plant consistingsells the RECs resulting from some of five units,its purchased power to certain customers. See Part II, Item 7, Management's Discussion and this facility accounted for 9
MWAnalysis of summer net capability. These units are not currently dispatched for generation.Financial Condition and Results of Operations —Key Initiatives and Challenges — Optimum Energy Portfolio — Renewable Power Purchase Agreements.
Distributed Energy Resources
Consumer desire for energy choice, among other things, is driving the expectation for flexible options in the electric industry. TVA and LPCs are working together to leverage the strengths of the Tennessee Valley public power model to provide distributed energy solutions that are economical, sustainable, and flexible. TVA will focus on the safety and reliability impacts of these resources as they are interconnected to the grid and will aim to ensure that the pricing of electricity remains as low as feasible. Additional regulatory considerations and analysis may be required as the distributed energy resources ("DER") market, technologies, and programs evolve. TVA is working to develop pricing and regulatory structures with a deliberate and thoughtful analysis
Contents
In 2019, the TVA Board approved new renewable power solutions, including a utility-scale option and a mid-scale option, that better equip TVA and LPCs with the flexibility to meet changing end-use customer needs. The utility-scale option, which aggregates demand through a competitive procurement process, is implemented by a renewable investment agreement through TVA's Green Invest Program. TVA may also construct its own renewable facilities to meet these needs. The mid-scale option, also known as the Flexibility Research Project, is a joint project with LPCs to enable solutions for situations where the end-use consumer needs onsite renewable or distributed generation and to enable TVA to gain market knowledge and operational insights from these research projects. See Item 7, Management's Discussion and Analysis of Financial Condition and Results of Operations — Key Initiatives and Challenges — Renewable Power Solutions.
Through the Home Uplift Program, TVA is partnering with LPCs, state and local governments, non-profit agencies, energy efficiency advocates, and the Tennessee Valley Public Power Association to complete home evaluations and make high-impact home energy upgrades for qualifying homeowners. In addition, TVA and LPCs conduct workshops to educate homeowners about low and no-cost energy efficiency upgrades that improve their quality of life.
TVA has encouraged the development of solar, wind, biomass, and low-impact hydroelectric generation systems through various current and former program offerings, with total operating capacity of 1,705 MW and nearly 1,178 MW of additional approved capacity as of September 30, 2020. Inside the Tennessee Valley, the combined participation for all such renewable solutions is 490 MW of installed operating capacity through both TVA-owned sites and PPAs. Outside the Tennessee Valley, TVA contracts for approximately 1,215 MW of operating wind capacity through PPAs.
In 2017, the TVA Board authorized up to $300$300 million to be spent over the next 10 years, subject to annual budget availability and necessary environmental reviews, to build an enhanced fiber optic network that will better connect TVA's operational assets. Fiber is a vital part of TVA's modern communication infrastructure.infrastructure and is needed to help manage DER as they enter the market. The new fiber optic lines will also improve the reliability and resiliency of the generation and transmission system while enabling the system to better accommodate DER as these resources enter the market.system. See Part II, Item 7, Management's Discussion and Analysis of Financial Condition and Results of Operations — Key Initiatives and Challenges — Optimum Energy Portfolio — Fiber Optic Network.
New energy management systems and energy storage technologies present opportunities for more sophisticated and integrated operation of the entire grid. The advent of electric vehicles and small-scale renewable generation has hastened the development of energy storage technologies that have the potential to mitigate the intermittent supply issues associated with many renewable generation options. Implementation of these technologies in conjunction with two-way communication to the site creates the potential for more efficient usage of other DER on the grid.
TVA's electric vehicle ("EV") strategyTVA is partnering with LPCs and others to support the electrification of transportation in the Tennessee Valley in a staged approach that will evolve as the localmulti-year EV initiative. The initiative focuses on reducing or eliminating EV market matures. TVA continues to focus on utilizing more EVsbarriers with EV policies, improving charging infrastructure availability, expanding EV availability and installing charging stations inside the Tennessee Valley. This approach has enabled TVA to gain insights on the valueofferings, and impact to utilitiesspreading EV consumer awareness. See Part II, Item 7, Management's Discussion and Analysis of large-scale electrification. TVA has also partnered with over 30 organizations across the StateFinancial Condition and Results of Tennessee (known as the "DriveOperations — Key Initiatives and Challenges — Electric Tennessee" collaborative) to create a roadmap to outline local market needs for widespread adoption. This foundational information is crucial as more affordable, longer range EVs come to the market in the next few years. In November 2020, the TVA Board approved changes that remove market barriers facing EV adoptions, including setting supportive utility level policies such as rate options and regulatory policies.Vehicles.
OnsiteOn-site energy management technologies and the proliferation of companies interested in providing services to support and aggregate the impacts of such systems provide another DER opportunity. Such systems can afford the consumer benefits through reduced consumption, increased comfort, detailed energy use data, and savings from time-sensitive rate structures. TVA and LPCs must consider the integration of the impacts from changes in energy usage patterns resulting from the operation of such systems.
Demand response systems that take advantage of the increasing sophistication in communication to homes, businesses, and distribution system assets also afford the opportunity for more granular control of system demand. Technologies can manage individual customer systems to shift usage from peak to off-peak periods and create significant reductions in the need for peak generation output or curtail usage for short periods to balance system demand. More sophisticated distribution control systems can also lower peak demand through control of excess voltage on the grid on either a dispatchable or continuous basis. Some large industrial customers also have the capacity to respond instantaneouslywithin a designated notice period and can augment operational flexibility by providing ancillary services. See Demand Management Portfolio below.
Demand Management Portfolio
TVA is leading an initiativecontinues to determine the valuemake investments in its demand management portfolio, consisting of DER forenergy efficiency and demand response programs, as part of its system. Initial efforts are focused on small-scale distributed (rooftop) solar, but the efforts are general enough to allow for other distributed options. These efforts are ongoing, led by a team that includes technical support from the Electric Power Research Institute ("EPRI"), to develop a methodology to identify site preferences on the distribution systems of the LPCs. This work, along with locational analysis already completed by TVA, will help in placing utility-scale solar in furtherance of the IRP recommendations as well as distributed solarcommitment to meet the Tennessee Valley’s growing energy needs and to support a decarbonized and more resilient grid. TVA is expanding its portfolio and plans to invest $1.5 billion in its demand management portfolio from 2024 – 2028. Over this five-year period, TVA anticipates approximately 2,200 gigawatt hours of LPCs.net incremental energy efficiency savings and over 2,200 MW of demand response portfolio capacity in 2028. These amounts are forward-looking and subject to various uncertainties. See Research Forward-Looking Information and Development below.Item 1A, Risk Factors.
Virtual Power Plant. TVA's Virtual Power Plant consists of energy efficiency and demand response programs aimed at balancing system needs by lowering costs, shaping energy usage, increasing capacity, and decarbonizing the grid. These programs support helping end-use consumers save on their bills and reduce some of the need for new generation in the future and are offered to both end-use residential customers and businesses and industries. TVA anticipates additional demand management programs to be developed over the coming years to help support the future direction of the Virtual Power Plant. See Distributed Energy Resources above for further discussion on demand response systems.
Community Energy Efficiency Programs. TVA also has energy programming focused on expanding partnerships, improving program access, and catalyzing investment in communities where all individuals can benefit from TVA's resources. TVA's Community Energy Efficiency Programs include (1) the Home Uplift Program which completes home evaluations and makes high-impact home energy upgrades for qualifying homeowners at no cost to the homeowners, (2) the School Uplift Program which assists schools with adopting strategic energy management practices, and (3) the Small Business Uplift Program which assists small businesses located within underserved communities with energy evaluations and energy improvement investments provided by TVA at no cost to the small business.
Power Purchase and Other Agreements
TVA acquires power from a variety of power producers generally through long-term and short-term PPAs as well as through spot market purchases. During 2020,2023, TVA acquired approximately 9392 percent of the power that it purchased through the long-term PPAs described below, including agreements for long-term renewable generation resources, approximately six percent through short-term PPAs, and approximately seventwo percenton the spot market. During 2022, TVA acquired approximately 94 percent of the power that it purchased through long-term PPAs, approximately three percent through short-term PPAs, and
approximately three percent on the spot market.
TVA's capability provided by PPAs is primarily provided under contracts that expire through 2043 and are described in the table below.
| | | | | | | | | | | | | | | | | | | | | | | | | | |
Power Purchase Agreements(1) At September 30, 2023 |
| Type of Facility | | Location | | Number of Contracts | | Contract Capacity (MW)(2) | | Contract Termination Date |
| Renewable PPAs | | | | | | |
| Operating | | | | | | | | |
| Solar | | Tennessee | | 6 | | 413 | | 2032 - 2043 |
| Solar | | Alabama | | 2 | | 302 | | 2037 - 2041 |
| Total Operating Solar | | | | 8 | | 715 | | |
| Wind | | Tennessee | | 1 | | 25 | | 2025 |
| Wind | | Iowa | | 2 | | 299 | | 2030 - 2031 |
| Wind | | Kansas | | 2 | | 366 | | 2032 - 2033 |
| Wind | | Illinois | | 3 | | 550 | | 2032 - 2033 |
| Total Operating Wind | | | | 8 | | 1,240 | | |
| Hydroelectric | | Tennessee, Kentucky, and North Carolina | | 2 | | 779 | | 2025 and upon three years' notice |
| Landfill Gas | | Tennessee | | 1 | | 5 | | 2031 |
| Subtotal Operating | | | | 19 | | 2,739 | | |
Contract Renewable Resources(3) | | | | 322 | | |
| Total Renewable Operating PPAs | | | | 3,061 | | |
| | | | | | | | |
| Contracted (not yet online) | | | | | | | | |
| | | | | | | | |
| | | | | | | | |
| | | | | | | | |
Solar(4) | | | | 16 | | 1,867 | | |
| Total Renewable Contracted PPAs | | 16 | | 1,867 | | |
| | | | | | |
| | | | | | | | |
| Nonrenewable PPAs | | | | | | |
| Operating | | | | | | | | |
| Diesel | | Tennessee | | 4 | | 59 | | 2028 - 2032 |
| Diesel | | Alabama | | 1 | | 10 | | 2035 |
| Diesel | | Mississippi | | 2 | | 46 | | 2028 |
| Total Operating Diesel | | | | 7 | | 115 | | |
| Natural Gas | | Alabama | | 3 | | 2,068 | | 2024 - 2033 |
Natural Gas(5) | | Georgia | | 3 | | 742 | | 2023 - 2025 |
| Natural Gas | | Illinois | | 1 | | 495 | | 2025 |
| Natural Gas | | Pennsylvania | | 1 | | 500 | | 2024 |
| Total Operating Natural Gas | | | | 8 | | 3,805 | | |
Delivered Energy(6) | | Various | | 3 | | 1,050 | | 2023 |
| Lignite | | Mississippi | | 1 | | 440 | | 2032 |
| Total Nonrenewable Operating PPAs | | 19 | | 5,410 | | |
| | | | | | | | |
| Contracted (not yet online) | | | | | | | | |
| | | | | | | | |
| | | | | | | | |
| | | | | | | | |
| | | | | | | | |
| | | | | | | | |
| | | | | | | | |
Battery Storage(4) | | | | 3 | | 150 | | |
Delivered Energy(4)(6) | | | | 1 | | 500 | | |
| Total Nonrenewable Contracted PPAs | | 4 | | 650 | | |
| | | | | | |
| | | | | | | | |
| | | | | | | | |
| | | | | | | | |
Notes
Renewable Power Purchase Agreements. In order(1) TVA sells the RECs resulting from some of its purchased power to meet customer preferences and requirements for cleaner and greener energy, TVA has entered into certain PPAs with renewable resource providers. As of September 30, 2020, TVA is contracted for 2,958 MW of summer net capability under renewable PPAs. These agreements are part of progressive partnerships that align the core values of TVA and the public power model with the desire of TVA's customers for renewable energy.customers. See Part II, Item 7, Management's Discussion and Analysis of Financial Condition and Results of Operations —Key Initiatives and Challenges — Changing Customer PreferencesOptimum Energy Portfolio — Renewable Power Purchase Agreements.
(2) Represents capability specified in TVA's PPA contracts. The measurement for nonrenewable resources is contracted capacity, adjusted for any contractual summer output constraints. The measurement for renewable resources is contracted capacity of the renewable resources' nameplate capacity. Nameplate
A portioncapacity does not account for real-time operating constraints, such as intermittency of TVA'srenewable resources associated with weather, delivery mechanisms, or other factors.
(3) Contract Renewable Resources is capability provided by power purchase agreements is provided under contractsfrom various historical renewable energy programs that expire between 2023consist of PPAs primarily with individuals and 2043, and the most significant of these contracts are described in the table below.
| | | | | | | | | | | | | | | | | | | | |
Power Purchase Contracts At September 30, 2020 |
| Type of Facility | | Location | | Summer Net Capability
(MW) | | Contract Termination Date |
| Lignite | | Mississippi | | 440 | | 2032 |
| Natural gas | | Alabama | | 790 | | 2033 |
| Natural gas | | Alabama | | 735 | | 2026 |
| Solar | | Alabama | | 75 | | 2037 |
Solar(1) | | Alabama | | 227 | | 2041 |
Solar(2) | | Alabama | | 150 | | 2042 |
| Solar | | Tennessee | | 53 | | 2039 |
| Solar | | Tennessee | | 5 | | 2032 |
Solar(2) | | Tennessee | | 147 | | 2042 |
Solar(3) | | Tennessee | | 69 | | 2038 |
Solar(3) | | Tennessee | | 100 | | 2038 |
Solar(3) | | Tennessee | | 70 | | 2038 |
Solar(3) | | Tennessee | | 35 | | 2038 |
Solar(3) | | Tennessee | | 177 | | 2043 |
Solar(3) | | Mississippi | | 200 | | 2043 |
| | | | | | |
| Landfill gas | | Tennessee | | 6 | | 2031 |
| Hydroelectric | | Tennessee and Kentucky | | 402 | | Upon three years' notice |
| Wind | | Iowa | | 198 | | 2031 |
| Wind | | Iowa | | 101 | | 2030 |
| Wind | | Kansas | | 201 | | 2032 |
| Wind | | Kansas | | 165 | | 2033 |
| Wind | | Illinois | | 150 | | 2032 |
| Wind | | Illinois | | 200 | | 2032 |
| Wind | | Illinois | | 200 | | 2033 |
| Wind | | Tennessee | | 27 | | 2025 |
| Diesel | | Tennessee | | 23 | | 2029 |
| Diesel | | Tennessee | | 20 | | 2032 |
| Diesel | | Tennessee | | 8 | | 2023 |
| Diesel | | Tennessee | | 8 | | 2028 |
| Diesel | | Mississippi | | 20 | | 2023 |
| Diesel | | Mississippi | | 26 | | 2028 |
| Diesel | | Alabama | | 10 | | 2028 |
Battery storage(3) | | Mississippi | | 50 | | 2043 |
| | | | | | |
| | | | | | |
| | | | | | |
Notessmall businesses.
(1)(4) Power delivery is expected to commence between 2024 - 2025. See challenges associated with contracted PPAs not yet online in 2021. Of the four solar PPAs TVA signed in 2019, one of the counterparties failed to comply with the terms of its PPA. TVA terminated this 150 MW PPA in 2020, and it is excluded from the table above. SeePart II, Item 7, Management's Discussion and Analysis of Financial Condition and Results of Operations — Key Initiatives and Challenges — Changing Customer PreferencesOptimum Energy Portfolio — Renewable Power Purchase Agreements.
(2) Power(5) Included in the table above is 200 MW of power delivery is expected to commence in 2022.
(3) Power delivery is expected to commence inGeorgia that expired on September 30, 2023.
(6) Delivered energy is sourced from multiple generating assets and originates from various states.
Under federal law, TVA is required to purchase energy from qualifying facilities (cogenerators and small power producers) at TVA's avoided cost of either generating this energy itself or purchasing this energy from another source. TVA fulfills this requirement through the Dispersed Power Production Program. As ofAt September 30, 2020,2023, there were 111955 generation sources, with a combined qualifying capacity of 268285 MW, whose power TVA purchases under this program.
Fuel Supply
General
TVA's consumption of various types of fuel depends largely on the demand for electricity by TVA's customers, the availability of various generating units, and the availability and cost of fuel. See Part II, Item 7, Management's Discussion and Analysis of Financial Condition and Results of Operations — Results of Operations — Financial Results — Operating Expenses.
Nuclear Fuel
Current Fuel Supply. Converting uranium to nuclear fuel generally involves four stages: the mining and milling of uranium ore to produce uranium concentrates; the conversion of uranium concentrates to uranium hexafluoride gas; the enrichment of uranium hexafluoride; and the fabrication of the enriched uranium hexafluoride into fuel assemblies. For its forward four-year (2021-2024) requirements, TVA currently has 100 percentplans to continue using contracts of various products, lengths, and terms as well as inventory to meet the projected nuclear fuel needs of its uranium mining and milling, conversion services, enrichment services, and fabrication services requirements either in inventory or under contract with various suppliers. TVA anticipates being able to fill its needs beyond this period by normal contracting processes as market forecasts indicate that the fuel cycle components will be readily available.nuclear fleet. The net book value of TVA's nuclear fuel was $1.3 billion and $1.5 billion at both September 30, 20202023 and 2019.2022, respectively. See Note 15 — Risk Management Activities and Derivative Transactions — Counterparty Risk.
TVA, the DOE, and certain nuclear fuel contractors have entered into agreements, referred to as the Down-blend Offering for Tritium ("DBOT"), that provide for the production, processing, and storage of low-enriched uranium that is to be made using surplus DOE highly enriched uranium and other uranium. Low-enriched uranium can be fabricated into fuel for use in a nuclear power plant. Production of the low-enriched uranium began in 2019 and is contracted to continue through September 2025. Beginning October 2025, contractContract activity after that date will consist of storage and flag management. Flag management ensures that the uranium is free from foreign obligations, and unencumbered by policy restrictions, so that it can be used in connection with the production of tritium. Under the terms of the interagency agreement between the DOE and TVA, the DOE will reimburse TVA for a portion of the costs of converting the highly enriched uranium to low-enriched uranium. See Note 1 — Summary of Significant Accounting Policies — Down-blend Offering for Tritium for a more detailed discussion of the DBOT project.
Low-Level Radioactive Waste. Certain materials and supplies used in the normal operation of nuclear electrical generating units are potentially exposed to low levels of radiation. TVA sends shipments of low-level radioactive waste to burial facilities in Clive, Utah and Andrews, Texas. TVA is capable of storing some low-level radioactive waste at its own facilities for an extended period of time, if necessary.
Spent Nuclear Fuel. All three nuclear sites have dry cask storage facilities. Sequoyah will need additional capacity by 2028.2029. Watts Bar and Browns Ferry will need additional capacity by 2041. Browns Ferry completed a project in early 2020 to build another independent spent fuel storage installation pad.2037. To recover the cost of providing long-term, onsiteon-site storage for spent nuclear fuel, TVA filed a breach of contract suit against the U.S. in the U.S. Court of Federal Claims in 2001. As a result of this lawsuit and related agreements, TVA has collected approximately $340$442 million through 2020.2023.
Tritium-Related Services. TVA and the DOE are engaged in a long-term interagency agreement under which TVA will, at the DOE's request, irradiate tritium-producing burnable absorber rods ("TPBARs") to assist the DOE in producing tritium for the Department of Defense ("DOD"). This agreement, which ends in 2035, requires the DOE to reimburse TVA for the costs that TVA incurs in connection with providing irradiation services and to pay TVA an irradiation services fee at a specified rate per TPBAR over the period when irradiation occurs.
In general, TPBARs are irradiated for one operating cycle, which lasts about 18 months. At the end of the cycle, TVA removes the irradiated rods and loads them into a shipping cask. The DOE then ships them to its tritium-extraction facility. TVA loads a fresh set of TPBARs into the reactor during each refueling outage. Irradiating the TPBARs does not affect TVA's ability to safely operate the reactors to produce electricity.
TVA has provided irradiation services using only Watts Bar Unit 1 since 2003. Although the interagency agreement provides2003 and Watts Bar Unit 2 since 2021. TVA has increased its production to within currently licensed limits for irradiation servicesWatts Bar Unit 1 and expects to be performed at licensed limits for Watts Bar and Sequoyah, TVA expects the Watts Bar site to provide sufficient capacity to fulfill this agreementUnit 2 in the near term.April 2025. The DOE notified TVA of future increased needs for tritium, requiring the use ofand TVA submitted a second reactor. In 2019, TVA received approval from the NRCLicense Amendment Request in 2023 to fulfill this request. The DOE's decision also allows for a license amendment to authorize the irradiation of TPBARs at Sequoyah in Watts Bar Unit 2.the future;
however, TVA is projectingdoes not have plans to beginemploy Sequoyah units for tritium production in Watts Bar Unit 2 in the fall of 2021.near term.
Natural Gas and Fuel Oil
During 2020,2023, TVA purchased a significant amount of its natural gas requirements from a variety of suppliers under contracts with terms of up to fourthree years and purchased substantially all of its fuel oil requirements on the spot market.market. The net book value of TVA's natural gas inventory was $19$25 million and $15$54 million at September 30, 20202023 and 2019,2022, respectively. The net book value of TVA's fuel oil inventory was $82$84 million at both September 30, 20202023 and 2019.2022. At September 30, 2020, 802023, 83 of the combustion turbines that TVA operatesturbine assets were dual-fuel capable, and TVA has fuel oil stored on each of these sites as a backup to natural gas.
TVA purchases natural gas from multiple suppliers on a daily, monthly, seasonal, and term basis. During 2020,2023, daily, monthly, seasonal, and term contracts accounted for 2620 percent, ninefour percent, 1624 percent, and 4952 percent of purchases, respectively. TVA plans to continue using contracts of various lengths and terms to meet the projected natural gas needs of its natural gas fleet. During 2020,2023, TVA arranged for the transportation of natural gas on eight separate pipelines, with approximately 6369 percent being transported on two pipelines. During 2020,2023, TVA maintained a total of approximately 1,485,0001,716,000 million British thermal unit(s) ("mmBtu") per day of firm transportation capacity on sixeight major pipelines, with approximately 5960 percent of total firm transportation capacity being maintained on two pipelines.
TVA utilizes natural gas storage services at seven facilities with a total capacity of 7.257.75 billion per cubic feet ("Bcf") of firm service and 4.406.275 Bcf of interruptible service to manage the daily balancing requirements of the eight pipelines used by TVA, with approximately 6255 percent of the total storage capacity being maintained at two facilities. During 2020,2023, storage levels were generally maintained at between 40 and 80 percent of the maximum contracted capacity at each facility. As TVA's natural gas requirements grow, it is anticipated that additional storage capacity may need to be acquired to meet the needs of the generating assets. In 2021,2024, TVA does not expectexpects to add a significant amount of firm capacity toincrease its storage portfolio.portfolio by approximately seven percent.
Coal
Coal consumption at TVA's coal-fired generating facilities during 2020both 2023 and 20192022 was approximately 1112 million tons and 15 million tons, respectively.tons. At September 30, 20202023 and 2019,2022, TVA had 3021 days and 3325 days of system-wide coal supply at full burn rate, respectively, with net book values of $152$204 million and $197$165 million, respectively.
TVA utilizes both short-term and long-term coal contracts. During 2020,2023, long-term contracts made up 7192 percent of coal purchases, and short-term contracts accounted for the remaining 29eight percent. TVA plans to continue using contracts of various lengths, terms, and coal quality to meet its expected consumption and inventory requirements. During 20202023 and 2019,2022, TVA purchased coal by basin as follows:
The following charts present the proportion of each delivery method TVA utilizes for its coal supply for the periods indicated:
Total systemCoal inventory increased at September 30, 2023 as compared to September 30, 2022. TVA experienced challenges in 2022 related to coal inventories fluctuated significantly throughoutsupply as a result of supply limitations and transportation challenges. Coal supply availability and transportation performance improved during the year. TVA began 2020 with average coalfirst quarter of 2023. Mild weather prior to late December 2022, which continued in the second through fourth quarters of 2023, required lower than forecasted coal-fired generation, enabling inventory levelsstockpiles to increase, and increased to high levelscurrent market conditions reflect an approximate balance between demand and available supply, due to the mild winter, demand reduction resulting from the COVID-19 pandemic,weaker export markets and lowlower natural gas prices. Inventory balances were significantly reduced during the summer peak months dueTVA also invested in additional multi-year coal supply contracts to higher than forecasted load, nuclear outages, and natural gas outages.help provide stability in coal supply availability. These investments are expected to support fuel resiliency with TVA's overall coal supply.
Transmission
The TVA transmission system is one of the largest high-voltage transmission systems in North America. TVA's transmission system has 69 interconnections with 13 neighboring electric systems and delivered approximately 151157 billion kWh of electricity to TVA customers in 2020.2023. In carrying out its responsibility for transmission grid reliability in the TVA service area, the TVA transmission grid has operated with 99.999 percent reliability since 2000 in delivering electricity to customers.2000. See Item 2, Properties — Transmission Properties.
Pursuant to its Transmission Service Guidelines, TVA offers transmission services to eligible customers to transmit wholesale power in a manner that is comparable to TVA's own use of the transmission system. TVA has also adopted and operates in accordance with its published Transmission Standards of Conduct and separates its transmission function from its power marketing function. As a Balancing Authority, Distribution Provider, Generator Owner, Generator Operator, Planning Coordinator, Reliability Coordinator, Resource Planner, Transmission Owner, Transmission Operator, Transmission Planner, and Transmission Service Provider, as those terms are defined for purposes of NERC regulations, TVA is also is subject to federal reliability standards that are set forth by the North American Electric Reliability Corporation ("NERC")NERC and approved by FERC. See Regulation.
Additional transmission upgrades may be required to maintain reliability. Upgrades may include enhancements to existing lines and substations or new installations as necessary to provide adequate power transmission capacity, maintain voltage support, and ensure generating plant and transmission system stability.
In 2017, the TVA Board authorized a strategic fiber opticaddition to upgrades to maintain reliability, TVA’s Grid of Tomorrow initiative aims to increase grid flexibility to enable greater use of up to $300 million to be spent over the next 10 years, subject to annual budget availabilityrenewable resources such as solar, wind, and necessary environmental reviews, that will expand TVA's fiber capacity and improve the reliability and resiliencyother forms of thedistributed generation and transmission system. The network expansion is designed to help meetincludes making data and communications upgrades as demonstrated by investments in the power system's growing need for bandwidth as well as accommodate the integration of new DER. As of September 30, 2020, TVA had spent $121 million on installation of the fiber optic lines and expects to spend an additional $179 million.
A new system operations center, has been approved for $255 million. The new secured facility is being built to accommodate a new energy management system, and to adapt to new regulatory requirements. The facility is expected to be constructed by 2022fiber optic network. See Part II, Item 7, Management's Discussion and fully operational by 2024.Analysis of Financial Condition and Results of Operations — As of September 30, 2020,Key Initiatives and Challenges TVA had spent approximately $37 million on the project and expects to spend an additional $218 million.— Optimum Energy Portfolio.
In recognition of the challenges of integrating intermittent and inverter-based resources to the power system, TVA established the Future Grid Performance initiative. The primary goal is to maintain a stable and reliable grid while fostering the evolution of the energy system of the future, one of TVA's strategic elements of Operational Excellence. Secondary goals include improving processes to facilitate an evolving resource mix with new technologies, optimizing approaches and tools to ensure system stability and performance in the future grid, and evaluating and adopting new grid technologies. This initiative seeks to address grid needs to keep the grid reliable and stable as TVA transitions to an energy system that has a greater share of intermittent and inverter-based resources, such as renewables and battery storage, connected to the transmission system.
In addition, TVA is working on various projects with universities, Electric Power Research Institute ("EPRI"), and others to help enable a dynamic and multi-directional grid. TVA is also working in partnership with LPCs to modernize their distribution
systems by developing a shared vision and roadmap for transforming the Tennessee Valley’s transmission and distribution systems into an integrated regional grid.
These initiatives support TVA’s decarbonization efforts while helping ensure TVA continues to achieve its mission to deliver reliable power at the lowest feasible rate. Investments in a modernized grid will help enable enhanced monitoring and control of TVA’s transmission and generation portfolio.
Weather and Seasonality
Weather affects both the demand for and the market prices of electricity. TVA's power system is generally a dual-peaking system in which the demand for electricity peaks during the summer and winter months to meet cooling and heating needs. TVA uses degree days to measure the impact of weather on its power operations. Degree days measure the extent to which the TVA system 23-station average temperatures vary from 65 degrees Fahrenheit. See Item 1, Business— Flood Control Activities, Item 1, Business — Environmental Matters — Climate Change — Physical Impacts of Climate Change, and
Part II, Item 7, Management's Discussion and Analysis of Financial Condition and Results of Operations — Results of Operations — Sales of Electricity.
Competition
TVA provides electricity in a service area that is largely free of competition from other electric power providers. This service area is defined primarily by provisions of law and long-term contracts. The region in which TVA or LPCs that distribute TVA power may provide power is limited and is often referred to as "the fence.the "fence." Under the Federal Power ActFPA, the Anti-Cherrypicking Amendment ("FPA"ACPA"), the anti-cherrypicking provision limits the ability of others to use the TVA transmission system for the purpose of serving customers within TVA's service area. State service territory laws limit unregulated third parties' ability to sell electricity to consumers. All TVA wholesale power contracts are all requirements contracts; however, Power Supply Flexibility Agreements available to LPCs that have executed long-term contractsPartnership Agreements with TVA allow LPCs to locally generate or purchase up to approximately five percent of their average total hourly energy sales over the prior five yearsa certain time period in order to meet their individual customers' needs. Revised flexibility agreements were made available to LPCs in August 2023 which permit projects to be located anywhere in TVA's service area, either connected to the LPC distribution system or TVA's transmission system, and makes it easier for LPCs to partner in projects. In addition, other utilities may use their own transmission lines to serve customers within TVA's service area, and third parties are able to avoid the restrictions on serving end-use customers by selling or leasing generating assets to a customer rather than selling electricity. These threats underscore the need for TVA to design rates and strategically price its products and services to be competitive. There have also been some efforts to erode the anti-cherrypicking provision,ACPA, and the protection of the provision could be limited and perhaps eliminated by federal legislation at some time in the future.
TVA also faces competition in the form of emerging technologies. Improvements in energy efficiency technologies, smart technologies, and energy storage technologies may reduce the demand for centrally provided power. The growing interest by customers in generating their own power through DER has the potential to lead to a reduction in the load served by TVA as well as cause TVA to re-evaluate how it operates the overall grid system to continue to provide highly reliable power at affordable rates. See Part II, Item 7, Management's Discussion and Analysis of Financial Condition and Results of Operations — Key Initiatives and Challenges — DistributedOptimum Energy Resources.Portfolio — Fiber Optic Network.
Finally, TVA and other utility companies are facing an evolving marketplace of increased competition driven by customer choice and behavior. As technology develops, consumers' demands for access to diverse products and services may increase, creating opportunities for growth with new products and services resulting from emerging technologies.customers could choose another utility to meet some or all of their power needs where available, pursue self-generation to meet some or all of their power needs, or move their operations outside of TVA's service territory.
Research and Development
Investments in TVA's research portfolio are supported through partnership and collaboration with LPCs, EPRI, the DOE, federal agencies, national labs, peer utilities, universities, and industry vendors and through participation in professional societies and other research consortiums.
Annual investments made in science and technological innovation help meet future business and operational
challenges. Each year, TVA's annual research portfolio is updated based on a broad range of operational and industry drivers to assess key technology gaps, performance issues, or other significant issues, addressed through research and development. Core research activities directly support optimization of TVA's generation and transmission assets, air and water quality, energy utilization, and distributed/clean energy integration. TVA also provides research and development services on behalf of LPCs by helping optimize their distribution systems and helping minimize technology gaps in energy utilization and consumer technologies.
TVA'sBeginning in 2020, TVA placed a high priority on providing innovation and research program is also focused on enabling transformational innovation. At the forefront is deploying grid-scale batterywhich aligns to and supports its transformative initiatives: advanced nuclear, decarbonization, energy storage, technologyregional grid transformation, electric vehicles, connected communities, and the newest - future grid performance. TVA has placed an emphasis on research leading to optimize the existing TVA generation assetsunderstanding and improve the resiliency of the transmission system. In 2020, TVA launched its first TVA-owned, grid scale, lithium-ion demonstration battery project. The system integration learnings from this project will guide future application of battery storageclean resources to support the reduction of carbon emissions from its power supply. This
research supports both TVA and national strategic interests to reduce carbon emissions and is designed to both catalyze and support TVA’s decarbonization initiative.
TVA is committed to investing in the future of nuclear and continues to evaluate the licensing and design of emerging nuclear technologies, such as advanced light water SMRs and advanced non-light water reactors, as part of technology innovation efforts aimed at developing the evolving bulk powerenergy system of the future, one of TVA's strategic elements of Operational Excellence. In December 2019, TVA became the first utility in the region. Additionally,nation to successfully obtain approval for an early site permit from the NRC to potentially construct and operate SMRs at its Clinch River Site. TVA has joinedentered into memorandums of understanding and agreements that allow for mutual collaboration to explore advanced reactor designs as a next-generation nuclear technology while leveraging the expertise of federally funded research and development centers, utilities, vendors, and academic institutions. These contractual relationships are important steps in the early stages of evaluation as TVA considers the economic feasibility of advanced nuclear reactors. These contractual relationships are also intended to leverage innovations to improve advanced nuclear designs, streamline licensing pathways, find efficiencies in construction methods, and optimize operating expenses. For example, TVA has entered into a multi-party collaborative arrangement to advance the global development of the GE Hitachi Nuclear Energy BWRX-300 SMR. See Note 21 — Collaborative Arrangement for additional information on the multi-party collaboration arrangement. TVA currently believes that this advanced nuclear reactor technology is most readily available for deployment with the fewest risks; as such, TVA is evaluating this technology in greater detail, while still considering other advanced reactor technologies. See Part II, Item 7, Management's Discussion and Analysis of Financial Condition and Results of Operations — Key Initiatives and Challenges — Optimum Energy Portfolio— Small Modular Reactors for additional discussion and total costs related to SMR work.
TVA is in the third year of a coalition of utilities and researchers, led by EPRI and the Gas Technology Institute, whose purpose is to engage, inform, and support global low-carbon resources initiatives to develop the pathways for the advancement of carbon reducing technologies for large scale utility deployment. This is a five-year program and includes research to optimize thesupport creating resource options, such as alternative fuels (hydrogen, ammonia, and methanized derivatives), carbon capture, electrification, and utilization of clean DER as part of the overall low-carbon resource mix. TVA has made progress understanding regional geology and carbon capture technologies and is evaluating both with an emphasis on the potential for carbon capture in TVA's future. To support this initiative, in August 2023 TVA entered into an MOU with TC Energy Development Holdings Inc. to study the development, construction, and operation of carbon capture, utilization, transportation, and sequestration infrastructure at or near TVA’s Ackerman and Paradise Combined Cycle Plants. TVA is also exploring the potential for hydrogen to serve as a resource in the decarbonization of the Tennessee Valley, both within the electrical sector and elsewhere. In November 2022, TVA and other major utility companies responded to a funding opportunity from the DOE with the intention of obtaining federal financial support for a Southeast Hydrogen Hub. The Southeast Hydrogen Hub was notified in October 2023 that their application was not among those funded.
At the forefront of the energy storage initiative is deploying grid-scale battery energy storage technology to optimize the existing TVA evaluates emerging energy efficiencygeneration assets and load management technologiesimprove the resiliency of the transmission system. In 2020, TVA launched its first TVA-owned, grid scale, lithium-ion demonstration battery project, and in 2023, TVA began construction near Vonore, Tennessee. The system integration lessons learned from this project will guide future application of battery storage as part of the evolving bulk power system in the region. TVA is studying the optimal siting and design for marketanother pumped-storage plant as described in Power Supply and program readiness. Efforts are directed towards demonstratingLoad Management Resources — Hydroelectric Pumped-Storage. TVA is also evaluating the potential of short duration battery alternatives to lithium-ion and validating the performance, reliability, and consumer acceptance of new efficiency technologies, as well as the value of energy efficiency and load management technologies for the consumer, LPCs, and TVA.long duration storage alternatives to pumped-storage.
TVA is assessingcontinues to develop potential electrification programs, in addition to the Fast Charge Network, that improve resource use and reduce environmental impacts (especially in the transportation sector). Assessments includesector. TVA programs are based on previous assessments, which included a multi-stakeholder vision and roadmap effort aimed at identifying the path forward for electric vehicles in Tennessee. The approach provides for broad engagement from industry, government, and utilities that could be applied in other states in the TVA service territory. In addition, TVA is continuing its evaluation of potential electric vehicle adoption strategies through coordination of activities with EPRI and state and industry stakeholders related to operational fleet requirements. Additional areasSee Part II, Item 7, Management's Discussion and Analysis of focus include LPC engagement on plug-in electric vehicle grid integrationFinancial Condition and readiness for various transportation electrification technologies. In addition, research continues in electrification applications on charging stations, impacts from charging stations to the power grid, refinementResults of power-system control processes,Operations — Key Initiatives and development of smart charging strategies to maximize the potential of electricity to replace petroleum as the transportation fuel of choice.Challenges — Electric Vehicles.
pilot projects. TVA has also established six community partnerships to provide consulting services to test a framework for engaging communities to help set goals, scope projects, and apply for funding. Research will continue to identify best practices, better understand challenges in the Tennessee Valley, and scale up learnings from the projects to broader applications throughout the Tennessee Valley. Finally,
TVA and LPCs engageare engaged in several initiatives related to regional grid modernization.transformation. Research includes technologies and applications advancement in intelligent transmission and distribution systems. Smart meter technology has the potential to shift usage patterns away from peak demand times which could change costs significantly. Additionally, intelligent transmission systems would give TVA the ability to nearly instantaneously diagnose problems, make corrections, and engage transmission and generation resources quickly so that power would keep flowing. This could promote reduced emissions, lower energy costs,
and add greater flexibility to accommodate the new consumer-generated sources under TVA's renewable energy programs. TVA also worked with LPC partners to execute a survey of LPC technology capabilities and plans, and the results are helping shape a realistic path toward TVA's long-term goals. See Power Supply and Load Management Resources — Distributed Energy Resources and Transmission.
Finally, TVA began a new initiative called Future Grid Performance. This initiative seeks to address grid needs to keep the grid reliable and stable as TVA transitions to an energy system that has a greater share of intermittent and inverter-based resources, such as renewables and battery storage, connected to the transmission system. See Transmission above for more information on this initiative.
Flood Control Activities
The Tennessee River watershed has one of the highest annual rainfall totals of any watershed in the U.S., averaging 51 inches per year. During 2020,2023, approximately 7653 inches of rain fell in the Tennessee Valley. TVA manages the Tennessee River system in an integrated manner, balancing hydroelectric generation withwhich includes managing minimum river flows and minimum depths for navigation, reducing flood damage, reduction,generating low-cost hydroelectric power, maintaining flows that support habitat for fish and other aquatic species, maintaining water quality and supply, and recreation.providing recreational opportunities for the Tennessee Valley. In addition, having cool water available helps TVA to meet thermal compliance and support normal operation of TVA's nuclear and fossil-fueled plants, while oxygenating water helps fish species remain healthy. TVA spills or releases excess water through its dams in order to reduce flood damage to the Tennessee Valley. TVA typically spills only when all available hydroelectric generating turbines are operating at full capacity and additional water still needs to be moved downstream.
The Tennessee Valley experienced just above normal rainfall at 104 percent of normal and runoff at 89 percent of normal during 2023. Although runoff for 2023 was below normal due to fewer significant rain events, the winter and spring timing of above normal rainfall during 2020, setting a new record for the wettest October through September period in TVA's history. Despite significant rainfall, runoff, and flooding during the period TVA continuedsupported TVA's objective to generate low-cost hydroelectric power while also meeting its river system commitments, including flood mitigation, which is estimated to have prevented approximately $1.0 billion in damages across the Tennessee Valley.Valley of approximately $7 million in 2023 and $9.7 billion over TVA's recorded history.
Environmental Stewardship Activities
TVA's mission includes managing the Tennessee River, its tributaries, and federal lands along the shoreline to provide, among other things, year-round navigation, flood damage reduction, affordable and reliable electricity, recreational opportunities, adequate water supply, improved water quality, and natural resource protection. There are 49 dams that comprise TVA's integrated reservoir system. Each dam may also have ancillary structures used to support or assist the main dam's function. The reservoir system provides approximately 800 miles of commercially navigable waterways and also provides significant flood reduction benefits both within the Tennessee River system and downstream on the lower Ohio and Mississippi Rivers. The reservoir system also provides a water supply for residential and industrial customers, as well as cooling water for TVA's coal-fired plants, combined cycle plants, and nuclear power plants. In May 2020, the TVA Board approved a newTVA's Environmental Policy. TVA's updated policyPolicy provides objectives for an integrated approach related to providing reliable, affordable, and increasingly clean energy; engaging in proactive stewardship of the Tennessee River system and public lands; and supporting sustainable economic growth. The Environmental Policy also provides additional direction in several environmental stewardship areas related to reducing environmental impacts on the Tennessee Valley's natural resources, including reducing carbon intensity and air emissions; minimizing waste; and protecting water resources biodiversity, and cultural resources. TVA's Biodiversity Policy further builds on the TVA record of environmental stewardship by acknowledging the critical role of natural systems in achieving its mission of improving the quality of life in the region. The policy commits to seeking conservation opportunities within capital projects and improving current operational practices to help minimize impacts, reduce costs, and enhance biodiversity.
TVA serves the people of the TVA region through the integrated management of the Tennessee River system and public lands, which include approximately 11,000 miles of shoreline; 650,000 surface acres of reservoir water; and 293,000 acres of reservoir lands. TVA accomplishes this mission and supports the objectives of the TVA Environmental Policy through implementation of its natural resources stewardship strategy. Within this strategy, TVA confirms a desire to remain agile, balance competing demands, and be a catalyst for collaboration in order to protect and enhance biological, cultural, and water resources as well as create and sustain destinations for recreation and opportunities for learning and research. As part of the strategy, TVA intends to assist water-based community development with issuingthe issuance of permits, technical support, and land agreements using planning, clear regulations, meaningful guidelines, and consistent enforcement. Additional guidance for carrying out many of TVA's essential stewardship responsibilities is provided in TVA's Natural Resource Plan ("NRP"). In May 2020, the TVA Board of Directors accepted changes to TVA's NRP to support a more strategic, flexible, and comprehensive management approach to TVA's natural resource stewardship work. TVA published its Record of Decision to complete its environmental review process in July 2020. The updated plan enhances alignment withaligns TVA's mission through economic development, energy, and environmental stewardship and guides business planning. In the newly published NRP, TVA expanded from six resource areas toIt includes ten focus areas, ensuring the NRP providesproviding a more comprehensive view of resource stewardship efforts.See Item 7, Management's Discussion and Analysis of Financial Condition and Results of Operations — Key Initiatives and Challenges — Natural Resource Plan.
Economic Development Activities
Economic development, along with energy production and environmental stewardship, is one of the primary statutory purposes of TVA. Economic development programs developed by TVA support all communities, including rural and economically distressed communities, across the Tennessee Valley. Through its economic development activities, TVA endeavors to recruit and retain companies in targeted business sectors, foster capital investment and job growth, and assist communities in the
Tennessee Valley with economic growth opportunities.
TVA seeks to achieve these goals through a combination of initiatives and partnerships with LPCs, regional, state, and local agencies, and communities by providing financial incentives, technical services, industry expertise, and site-selection
assistance to new and existing businesses in the Tennessee Valley. TVA's economic development incentive programs offer competitive incentives to new and existing power customers in certain business sectors that make multi-year commitments to invest in the Tennessee Valley. See Note 17 — In addition to providing financial support to businesses, TVA offers communities and economic developers site selection services, technical and project development assistance, and leadership training services.Revenue — Contract Balances — Economic Development Incentives for total incentives recorded.
In 2020,2023, TVA's economic development efforts, reliability, and competitive rates helped recruitattract or expand 188158 companies into the TVA service area. These companies announced the following economic performance measures:
| | | | | | | | |
| Economic Performance Measure | | At September 30, 2023(3) |
| Projected capital investments | | $9.2 billion |
Jobs expected to be created (#)(1) | | 12,276 |
Jobs expected to be retained (#)(2) | | 46,135 |
| | |
Notes
(1) "New jobs" in the TVA fiscal year are newly created, paid positions at a facility of over $8.6 billiona TVA customer. “Positions” are calculated by adding (1) the number of full-time, on-site employees and/or independent contractors at the facility, (2) the total number of full-time work-from-home employees and expectindependent contractors who reside in the TVA service territory and who spend 100% of their work time on facility-related matters, and (3) the total hours worked on facility-related matters by (a) full-time and part-time on-site employees at the facility and (b) full-time and part-time work-from-home employees who reside in the TVA service territory and who spend less than 100% of their work time on facility-related matters, divided by the number of work hours of such employees based on a 40 hour work week. A “TVA customer” means an entity that purchases power from TVA or a distributor of TVA power. New jobs reported by TVA may include positions created during the current TVA fiscal year and certified projections of anticipated positions to createbe created within a five-year time frame. New job numbers reported by TVA are certified and provided to TVA by TVA customers.
(2) "Retained jobs" are paid positions at a facility of a TVA customer that were created prior to the current TVA fiscal year and that continue to be filled in the current TVA fiscal year. “Positions” are calculated by adding (1) the number of full-time, on-site employees and/or retain approximately 67,000 jobs.independent contractors at the facility, (2) the total number of full-time work-from-home employees and independent contractors who reside in the TVA service territory and who spend 100% of their work time on facility-related matters, and (3) the total hours worked on facility-related matters by (a) full-time and part-time on-site employees at the facility and (b) full-time and part-time work-from-home employees who reside in the TVA service territory and who spend less than 100% of their work time on facility-related matters, divided by the number of work hours of such employees based on a 40 hour work week. A “TVA customer” means an entity that purchases power from TVA or a distributor of TVA power. Retained job numbers reported by TVA are certified and provided to TVA by TVA customers.
(3) These amounts are forward-looking and are subject to various uncertainties. Amounts may differ materially based upon a number of factors, including, but not limited to, economic downturns or recessions. See Forward-Looking Information and Item 1A, Risk Factors.
Regulation
TVA is required to comply with comprehensive and complex laws, regulations, and orders. The costs of complying with these laws, regulations, and orders are expected to be substantial, and costs could be significantly more than TVA anticipates.
Congress
TVA exists pursuant to the TVA Act as enacted by Congress and carries on its operations in accordance with this legislation. Congress can enact legislation expanding or reducing TVA's activities, change TVA's structure, and even eliminate TVA. Congress can also enact legislation requiring the sale of some or all of the assets TVA operates or reduce the U.S.'s ownership in TVA. To allow TVA to operate more flexibly than a traditional government agency, Congress exempted TVA from all or parts of certain general federal laws that govern other agencies, such as federal labor relations laws and the laws related to the hiring of federal employees, the procurement of supplies and services, and the acquisition of land. Other federal laws enacted since the creation of TVA that are applicable to other agencies have been made applicable to TVA, including those related to paying employees overtime and protecting the environment, cultural resources, and civil rights.
Securities and Exchange Commission
Section 37 of the Securities Exchange Act of 1934 (the "Exchange Act") requires TVA to file with the SECSecurities and Exchange Commission ("SEC") such periodic, current, and supplementary information, documents, and reports as would be required pursuant to Section 13 of the Exchange Act if TVA were an issuer of a security registered pursuant to Section 12 of the Exchange Act. Section 37 of the Exchange Act exempts TVA from complying with Section 10A(m)(3) of the Exchange Act, which requires each member of a listed issuer's audit committee to be an independent member of the board of directors of the issuer. Since TVA is an agency and instrumentality of the U.S., securities issued or guaranteed by TVA are "exempted securities" under the Securities Act of 1933, as amended (the "Securities Act"), and may be offered and sold without registration under the Securities Act. In addition, securities issued or guaranteed by TVA are "exempted securities" and "government securities" under the Exchange Act. TVA is also exempt from Sections 14(a)-(d) and 14(f)-(h) of the Exchange Act (which address proxy solicitations) insofar as those sections relate to securities issued by TVA, and transactions in TVA securities are exempt from rules governing tender offers under Regulation 14E of the Exchange Act. Also, since TVA securities are exempted securities under the Securities Act, TVA is exempt from the Trust Indenture Act of 1939 insofar as it relates to securities issued by TVA, and no independent trustee is required for these securities.
Federal Energy Regulatory Commission
Under the FPA, TVA is not a "public utility," a term which primarily refers to investor-owned utilities. Therefore, TVA is not subject to the full jurisdiction that FERC exercises over public utilities under the FPA. TVA is, however, an "electric utility" and a "transmitting utility" as defined in the FPA and, thus, is directly subject to certain aspects of FERC's jurisdiction. Under the FPA, for example, TVA (1) must comply with certain standards designed to maintain transmission system reliability; (2) can be ordered to interconnect its transmission facilities with the electrical facilities of independent generators and of other electric utilities that meet certain requirements; (3) can be ordered to transmit wholesale power provided that the order (a) does not impair the reliability of the TVA or surrounding systems, (b) meets the applicable requirements concerning terms, conditions, and rates for service, and (c) does not implicate the anti-cherrypicking provision;ACPA; (4) iscould be subject to FERC review of the transmission rates and the terms and conditions of service that TVA provides; and (5) is prohibited from (a) reporting false information on the price of electricity sold at wholesale or the availability of transmission capacity to a federal agency with intent to fraudulently affect the data being compiled by the agency and (b) using manipulative or deceptive devices or contrivances in connection with the purchase or sale of power or transmission services subject to FERC's jurisdiction.
In addition, the FPA provides FERC with authority (1) to order refunds of excessive prices on short-term sales (transactions lasting 31 days or less) by all market participants, including TVA, in price gouging situations if such sales are through an independent system operator or regional transmission organization under a FERC-approved tariff; (2) to issue regulations requiring the reporting, on a timely basis, of information about the availability and prices of wholesale power and transmission service by all market participants, including TVA; (3) to investigate electric industry practices, including TVA's operations that are subject to FERC's jurisdiction; and (4) to impose civil penalties of up to $1 million per day for each violation of the provisions of the FPA discussed in the prior paragraph that are applicable to TVA. Criminal penalties may also result from such violations.
Finally,Furthermore, while not required to do so, TVA has elected to implement various FERC orders and regulations pertaining to
public utilities on a voluntary basis to the extent that they are consistent with TVA's obligations under the TVA Act.
Finally, on July 28, 2023, FERC issued Order 2023. The order updates the procedures for interconnecting generating facilities and is intended to address interconnection queue backlogs, improve certainty in the interconnection process, and prevent undue discrimination for new technologies. TVA is in the process of evaluating the order and its potential impacts on TVA.
NERC Compliance
TVA is subject to federal reliability standards that are set forth by NERC and approved by FERC. These standards are designed to maintain the reliability of the bulk electric system, including TVA's generation and transmission system, and include areas such as maintenance, training, operations, planning, modeling, critical infrastructure, physical and cyber security, vegetation management, and facility ratings. TVA recognizes that reliability standards and expectations continue to become more complex and stringent for transmission systems.
Nuclear Regulatory Commission
TVA operates its nuclear facilities in a highly regulated environment and is subject to the oversight of the NRC, an independent federal agency that sets the rules that users of radioactive materials must follow. The NRC has broad authority to impose requirements relating to the licensing, operation, and decommissioning of nuclear generating facilities. In addition, if TVA fails to comply with requirements promulgated by the NRC, the NRC has the authority to impose fines, shut down units, or modify, suspend, or revoke TVA's operating licenses. See Part II, Item 7, Management's Discussion and Analysis of Financial Condition and Results of Operations — Key Initiatives and Challenges — Generation Resources.Operational Challenges.
Environmental Protection Agency
TVA is subject to regulation by the EPAEnvironmental Protection Agency ("EPA") in a variety of areas, including air quality control, water quality control, and management and disposal of solid and hazardous wastes.wastes, and greenhouse gas ("GHG") reductions to address climate change. See Environmental Matters below and Part II, Item 7, Management's Discussion and Analysis of Financial Condition and Results of Operations — Key Initiatives and Challenges.
States
The Supremacy Clause of the U.S. Constitution prohibits states, without federal legislative consent, from regulating the manner in which the federal government conducts its activities. As a federal agency, TVA is exempt from regulation, control, and taxation by states except in certain areas where Congress has clearly made TVA subject to state regulation. See Environmental Matters below.
Other Federal Entities
TVA's activities and records are also subject to review to varying degrees by other federal entities, including the Government Accountability Office and the Office of Management and Budget ("OMB"). There is also an Office of the Inspector General which reviews TVA's activities and records.
Taxation and Tax Equivalents
TVA is not subject to federal income taxation. In addition, neither TVA nor its property, franchises, or income is subject to taxation by states or their subdivisions. The TVA Act, however, does require TVA to make tax equivalent payments to states and counties in which TVA conducts power operations or in which TVA has acquired properties previously subject to state and local taxation. The total amount of these payments is five percent of gross revenues from the sale of power during the preceding year excluding sales or deliveries to other federal agencies and off-system sales with other utilities, with a provision for minimum payments under certain circumstances. Except for certain direct payments TVA is required to make to counties, distribution of tax equivalent payments within a state is determined by individual state legislation.
Environmental Matters
TVA's activities, particularly its power generation activities, are subject to comprehensive regulation under environmental laws and regulations relating to air pollution, water pollution, and management and disposal of solid and hazardous wastes, among other matters. Emissions from all TVA-ownedThe environmental laws and operated units (including small combustion turbine units of less than 25 MW)regulations that have been reduced from historic peaks. Emissions of nitrogen oxide ("NOx") have been reduced by 96 percent below peak 1995 levelsthe largest impact on TVA's operations and emissions of sulfur dioxide ("SO2") have been reduced by 99 percent below 1977 levels through CY 2019. For CY 2019, TVA's emission of carbon dioxide ("CO2") from its sources was 47 million tons, a 55 percent reduction from 2005 levels. This amount includes 2,383 tons from units rated at less than 25 MW. To remain consistent and to align with the EPA's reporting requirements, TVA intends to continue reporting CO2 emissions on a calendar year basis.financial condition are discussed below.
Clean Air Act Programs and Regulations
The Clean Air Act ("CAA") establishes a comprehensive program to protect and improve the nation's air quality and control sources of air pollution. The major CAA programs that affect TVA's power generation activities are described below.
National Ambient Air Quality Standards. The CAA requires the EPA to set National Ambient Air Quality Standards ("NAAQS") for certain air pollutants. The EPA has done thisset NAAQS for ozone, particulate matter, sulfur dioxide ("PM"), SO2"), nitrogen dioxide,oxides ("NOx"), carbon monoxide, and lead. Over the years, the EPA has made the NAAQS more stringent. Each state must develop a plan to be approved by the EPA for achieving and maintaining NAAQS within its borders. These plans impose limits on emissions from pollution sources, which are applicable to certain TVA generating units, including TVA fossil fuel-fired plants. Areas meeting a NAAQS are designated as attainment areas. Areas not meeting a NAAQS are designated as non-attainment areas, and more stringent requirements apply in those areas, including stricter controls on industrial facilities and more complicated and public permitting processes. TVA fossil fuel-fired plants can be impacted by these requirements. AllCurrently, all TVA generating units are located in areas designated as attainment areas. On January 6, 2023, however, the EPA proposed more stringent NAAQS for particulate matter that, if adopted, may increase the likelihood of certain areas in attainmentTVA’s service territory being designated as non-attainment areas. TVA could incur significant costs associated with NAAQS.upgrades to facilities if such facilities are in areas that are redesignated as being in non-attainment.
�� Revised Cross-State Air Pollution Rule. The EPA issuedTVA power plants are subject to the EPA's Cross-State Air Pollution Rule ("CSAPR") in July 2011 requiring several. CSAPR addresses air pollution from upwind states in the eastern U.S. to improvethat affect air quality by reducingin downwind states and is focused on NOx and SO2. To comply with CSAPR, TVA power plant emissions that contribute to pollution in other states. In 2016,plants must obtain one NOx allowance for every ton of NOx emitted during the EPA issued an update toozone season. Under a revised version of CSAPR to address cross-state air pollution (the "CSAPR Update Rule"), the Shawnee Fossil Plant ("Shawnee") facility is subject to reduced ozone-season NOx allowances and has been required to use most of its allowance inventory.In 2023, TVA monitored forecasted needs and utilized purchased allowances for the Shawnee facility. A longer-term compliance strategy for the facility is being developed that may include installing NOx control upgrades, incorporating operational changes, and continuing to purchase allowances. When completed, this strategy will help TVA comply with both the CSAPR Update Rule and the Federal Implementation Plan Addressing Regional Ozone Transport for the 2015 Ozone NAAQS. TVA has obtained approval from the State of Kentucky for construction of seven selective catalytic reduction systems ("SCRs") at the Shawnee facility. TVA plans to construct SCRs at four units by the end of 2025 and expects to spend $240 million. TVA is evaluating plans for the remaining three units.
Federal Implementation Plan Addressing Regional Ozone Transport for the 2015 Ozone NAAQS. On March 15, 2023, the EPA issued final regulations known as the "Good Neighbor Plan" to reduce NOx emissions from power plants and certain industrial facilities. With the Good Neighbor Plan, the EPA issued its Federal Implementation Plan ("FIP") that covers 23 states, including Alabama, Kentucky, and Mississippi, to reduce the interstate transport of NOx. Under the rule, beginning with the 2023 ozone season, power plants in 22 states, including Alabama, Kentucky, and Mississippi, are required to participate in a NOx trading program. Over time, the emission budgets will decline based on the level of reductions achievable through phased installation of emissions controls at power plants starting in 2024. The rule also establishes daily emission rates for coal steam electric generating units greater than or equal to 100 MW in the covered states beginning with the 2024 ozone season. To help comply with these regulations, TVA is developing a longer-term compliance strategy for its Shawnee facility that may include installing NOx control upgrades, incorporating operational changes, and continuing to purchase allowances. See Revised Cross-State Air Pollution Rule above. During 2023, the EPA subsequently issued an additional ruleinterim rules to resolve any remaining cross-state air pollutant issues ("CSAPR Close-Out Rule").stay the effectiveness of the 2023 FIP requirements for emission sources in several states, including Kentucky, Mississippi, and Alabama. The U.S. Court of Appeals forGood Neighbor Plan itself has been challenged in the District of Columbia Circuit ("D.C. Circuit") has remanded a portion , and applications have been filed with the U.S. Supreme Court to stay the plan while its merits are being litigated.
Mercury and Air Toxics Standards for Electric Utility Units. On April 16, 2020,In January 2022, the EPA issued a final rule which revokes the agency's earlier findingproposed reaffirming that regulation ofit is appropriate and necessary to regulate hazardous air pollutants ("HAP"), including mercury emitted from steam electric utilities is appropriateutilities. In addition, in April 2023 the EPA proposed to strengthen and necessary. The rule does not remove electric generating units from the source categories listed under Section 112 of the CAA nor does it rescindupdate the Mercury and Air Toxics Standards ("MATS"(“MATS”) requirements. Additionally,for electric utility units to reflect recent developments in control technologies and the EPA determined that further restrictions on HAP emissions are not warranted based on a residual risk and technology review for this source category. TVA does not anticipate that the final rule will change TVA's MATS compliance requirements or strategy. Certain states and environmental groups have filed petitionsperformance of these plants. If adopted in the D.C. Circuit challengingits current form, the EPA's finding that regulating HAPs from electric generatingproposed MATS could require TVA to install new equipment at some of its coal-fired units, is not appropriate and necessary. TVA cannot predict the outcomecost of these judicial petitions at this time.such equipment could be substantial.
Environmental Agreements. In 2011, TVA entered into two substantively similar agreements, one with the EPA and the other with Alabama, Kentucky, North Carolina, Tennessee, and three environmental advocacy groups (collectively, the "Environmental Agreements"). To resolve alleged New Source Review claims, TVA committed under the Environmental Agreements to, among other things, take now-completed actions regarding coal units and invest $290 million in certain TVA environmental projects. See Note 22 — Commitments and Contingencies — Legal Proceedings — Environmental Agreementsfor a discussion of the Environmental Agreements,, which discussion is incorporated herein by reference.
Acid Rain Program. The EPA's Acid Rain Program is intended to help reduce emissions of SO2 and NOx, which are the primary pollutants implicated in the formation of acid rain. The program includes a cap-and-trade emission reduction program for SO2 emissions from power plants. TVA continues to reduce SO2 and NOx emissions from its coal-fired plants, and the SO2 allowances allocated to TVA under the Acid Rain Program are sufficient to cover the operation of its coal-fired plants. In the TVA service area, the limitations imposed on SO2 and NOx emissions by the CSAPR program are more stringent than the Acid Rain Program. Therefore, TVA does not anticipate that the Acid Rain Program will impose any additional material requirements on TVA.
Regional Haze Program. The EPA issued the Clean Air Visibility Rule, which required certain older sources to install best available retrofit technology. No additional controls or lower operating limits are required for any TVA units to meet best available retrofit technology requirements. In January 2017, the EPA published the final rule that changed some of the requirements for Regional Haze State Implementation Plans ("SIPs"). Specific impacts on TVA cannot be determined until future Regional Haze SIPs are developed for the next decennial review under the visibility haze provisions of the CAA. States mustwere required to submit their Regional Haze SIPs to the EPA by July 31, 2021. In response to requests from state air pollution control agencies in Tennessee and Kentucky, TVA submitted regional haze analyses for its Cumberland and Shawnee facilities, respectively, to those state agencies. The reports evaluate SO2 emission reduction options for these facilities and will be considered by these state agencies in preparing their Regional Haze SIPs. On August 25, 2022, the EPA issued a final action stating that 15 states, including Kentucky, failed to submit a complete SIP, which triggered a two-year deadline for the EPA to promulgate a FIP for the state unless Kentucky submits, and the EPA approves, a SIP satisfying the visibility protection requirements of the CAA. TVA negotiated with Kentucky and agreed to accept a federal limit for SO2 emissions starting January 1, 2028. In August 2023, TVA submitted a Title V permit application to the Kentucky Division of Air Quality that incorporates this limit. TVA anticipates that it could meet this limit by installing control technologies for the seven uncontrolled Shawnee units. See Revised Cross-State Air Pollution Rule above for additional information regarding TVA’s plans to control the Shawnee units.
Opacity.Start Up, Shutdown, and Malfunctions. Opacity, or visible emissions, measures the denseness (or color)or color of power plant plumes and has traditionally been used by states as a means of monitoring good maintenance and operation of particulate control equipment. Under some conditions, retrofitting a unit with additional equipment to better control SO2 and NOx emissions can adversely affect opacity performance,emissions, and TVA and other utilities have addressed this issue. The evaluation of utilities' compliance with opacity requirements is coming under increased scrutiny, especially during periods of startup, shutdown, and malfunction. Historically, SIPs developed under the CAA typically excluded periods of startup, shutdowns, and malfunctions, but in June 2015, the EPA finalized a rule to eliminate such exclusions. The EPA rule required states to modify their implementation plans by November 2016. Kentucky, Tennessee, and Mississippi submitted implementation plans, but Alabama has not.exclusions ("2015 Rule"). Environmental petitioners and several states filed petitions for judicial review of the EPA final rule2015 Rule before the D.C. Circuit. In April 2017,U.S. Court of Appeals for the D.C. Circuit, atand oral arguments were heard on March 25, 2022. Separately, on September 8, 2021, environmental petitioners filed a lawsuit to enforce the requestSIP calls under the 2015 Rule, and on June 27, 2022, the EPA entered into a consent decree that would require the agency to take final action on SIP revisions submitted in response to the 2015 SIP call by dates ranging from 180 to 480 days from the date of the consent decree. On January 12, 2022, the EPA determined that Alabama and Shelby County (Tennessee) failed to submit a revised SIP as required by the 2015 Rule, and on February 15, 2023, the EPA proposed to issue a new finding of substantial inadequacy and SIP calls to Shelby County, Tennessee. On June 23, 2023, the EPA Administrator, ordered this litigation to be suspended pending the EPA's review to determine whether to reconsider all or partapproved a portion of the rule.SIP revisions submitted by the State of Tennessee. TVA does not expect significant impacts from these rule changes.cannot predict the outcome of future SIP evaluations.
New York Petition to Address Impacts from Upwind High Emitting Sources. In March 2018, the State of New York filed a petition with the EPA under Section 126(b) of the CAA to address ozone impacts on New York from the NOx emissions from sources emitting at least 400 tons of NOx in CY 2017 from nine states including Kentucky. The New York petition requests that the EPA require daily NOx limits for utility units with selective catalytic reduction systems ("SCRs") such as Shawnee Units 1 and 4 and emission reductions from utility units without SCRs such as Shawnee Units 2, 3, and 5-9.5 - 9. Kentucky utility unit NOx emissions are already limited by theunder CSAPR Update Rule and are declining, and current EPA modeling projects that no additional
requirements to reduce Kentucky NOx emissions are necessary. In September 2019, the EPA finalized its denial of New York's petition because the state did not demonstrate, and the EPA could not independently establish, that sources in the states listed in the petition contribute to exceedances of the 2008 and 2015 ozone NAAQS in New York.petition. The State of New York filed a petition in the D.C. Circuit for judicial review of the EPA's denial of the petition. Onpetition, and in July 14, 2020, the D.C. Circuit vacated the EPA's denial of the petition and remanded the petition to the EPA for reconsideration. Specific impacts to TVA cannot be determined until the EPA takes further action on the petition.
GHG Emissions from Existing Sources. In June 2019, the EPA finalized the final Affordable Clean Energy ("ACE") rule and repealed the EPA's previous regulation addressing greenhouse gas ("GHG")GHG emissions from existing fossil fuel-fired units. The ACE rule establishesestablished guidelines, under Section 111(d) of the CAA, for GHG emissions from existing coal-fired units based on efficiency improvements that can be achieved at those units at reasonable cost. States are requiredOn January 19, 2021, the D.C. Circuit vacated and remanded the ACE rule. On October 29, 2021, the U.S. Supreme Court accepted the request filed by a coalition of states and other parties to applyreview the emission guidelinesD.C. Circuit's decision to coal-fired units within their respective jurisdictions and take into accountvacate the remaining useful livesACE rule. On June 30, 2022, the U.S. Supreme Court issued its decision in West Virginia v. EPA, in which it restricted the EPA's authority to regulate GHG from existing power plants under Section 111(d). The U.S. Supreme Court concluded that Congress did not grant the EPA authority under the CAA to demand generation-shifting to achieve reduction of those units.GHG emissions, but the court did not hold that the EPA is limited in future rulemakings to just the heat-rate improvements that made up the ACE rule. The impactjudgment of the ACE rule on TVA's coal-fired units cannot be determined until TennesseeD.C. Circuit was thus reversed, and Kentucky submit tothe case remanded for further proceedings consistent with the U.S. Supreme Court's opinion. On May 23, 2023, the EPA their SIPs implementing guidelinespublished in the Federal Register a proposal that would repeal the ACE rule and the EPA approves these SIPs. The ACE rule allows states three yearsestablish new GHG emission guidelines for both existing fossil fuel-fired steam generating units and existing large, frequently operated stationary combustion turbine units. These proposed GHG emission guidelines, if finalized in their current form, could result in substantial costs to submit their SIPs and allows the EPA 18 months for approval. In addition, lawsuits challenging the ACE rule are pending in the D.C. Circuit, and the outcome of the litigation could change requirements under the ACE rule and modify the timeline for compliance.TVA.
GHG Emissions from New Source Performance StandardsSources. In December 2018,On May 23, 2023, the EPA published in the Federal Register proposed revisionsrevised new source performance standards ("NSPS") for GHG emissions from new fossil fuel-fired stationary combustion turbine units as well as proposed revised NSPS for GHG emissions from existing fossil fuel-fired steam generating units that undertake large modifications. These proposed NSPS, if finalized in their current form, could result in substantial costs to TVA. In the meantime, the 2015 GHG emission standards for new, modified, and reconstructed electric utility generating units that were finalizedremain in effect.
Climate Change
Emissions. Though many of TVA's facilities continue to emit air pollutants, emissions from all TVA-owned and operated units (including small CTs of less than 25 MW) have been reduced from historic peaks. Emissions of NOx and SO2 began being regulated in 1995 and 1977, respectively. Emissions of NOx and SO2 have been reduced by 97 percent and 99 percent, respectively, since their initial year of regulation.
| | | | | | | | | | | | | | | | | |
|
Emissions and Intensity Rates (1) | | CY 2022 | | CY 2021 | | | |
| | | | | | | |
| | | | | | | |
| | | | | | | |
Nitrogen Oxide (NOx)(2) | | | | | | | |
Total NOx Emissions (MT) | | 15,270 | | 15,210 | | | |
Total NOx Emissions Intensity (MT/Net MWh) | | 0.000113 | | 0.000109 | | | |
Sulfur Dioxide (SO2)(2) | | | | | | | |
Total SO2 Emissions (MT) | | 22,331 | | 25,226 | | | |
Total SO2 Emissions Intensity (MT/Net MWh) | | 0.000165 | | 0.000181 | | | |
| Mercury (Hg) | | | | | | | |
| Total Hg Emissions (kg) | | 39.2 | | 22.3 | | | |
| Total Hg Emissions Intensity (kg/Net MWh) | | 0.0000003 | | 0.0000002 | | | |
| | | | | | | |
| | | | | | | |
Notes
(1) Intensity rates are calculated based on generation from TVA's most recent fiscal year for years indicated and emissions data from the EPA in October 2015. For coal-fired units, the EPA proposes to revise the current new sourcemost recent CYs.
(2) Emissions data is consistent with Edison Electric Institute Environmental, Social, Governance, and Sustainability Report standards, such that carbon capturewhich are based on metric tons ("MTs"), whereas overall CO2 emission rates and sequestration technology is no longer necessary to meet the standards of performance that reflect the best system of emission reduction. The resulting limitsbaseline reductions from historical levels are less stringent than limits under the current rule and can be met by modern coal-fired units (e.g., supercritical steam generators) in combination with best operating practices, but without carbon capture and sequestration. The EPA is not proposing to revise the new source performance standard for GHG emission from gas-fired units. If finalized as proposed, the revisions are not expected to significantly impact TVA since TVA does not currently plan to construct, modify, or reconstruct any coal-fired units.based on short tons.
Maryland Petition to Address Impacts from Upwind Electric Generating Units. In September 2017, the State of Maryland filed a lawsuit against the EPA for failing to act within 60 days on Maryland's petition under Section 126 of the CAA to address ozone impacts on Maryland from the NOxFor CY 2022, TVA's emissions of 36 electric generatingcarbon dioxide ("CO2") from its owned and operated units, including purchased power and REC retirement adjustments which reduce the reportable CO2 emissions, were 54 million tons, resulting in a TVA system average, as delivered, CO2 emission rate of 658 lbs/MWh. This represents a 54 percent and 50 percent reduction in mass carbon emissions and TVA's Paradise coal-fired Unit 3. The EPA denied the petition for electric generating units with SCR units because existing regulations already address emissionscarbon emission rate, respectively, from such units. In addition, the EPA denied the petition with respect to electric generating units with non-catalytic controls because of cost. In October 2018, the State of Maryland filed a petition for judicial review with the D.C. Circuit, and on May 19, 2020, the D.C. Circuit remanded the EPA's denial of the petition back to the EPA with respect to the operation of four units with non-catalytic controls. With the retirement of Paradise Unit 3 on February 1, 2020, the partial remand of the petition to the EPA will not affect TVA.2005 levels.
While TVA continues down the path of lowering emissions, including GHG emissions, there will be fluctuations in TVA's emission numbers. Between CY 2021 and CY 2022, TVA's GHG emissions reflect higher electricity usage in the Tennessee Valley as the region experienced economic growth. Changes in the power supply mix between CY 2021 and CY 2022 also impacted the emissions fluctuation, as TVA continues to make operational decisions to keep the system reliable and deliver low-cost energy.
Report on Climate-Related Risks. On January 30, 2023, the Government Accountability Office ("GAO") publicly released a report entitled Tennessee Valley Authority: Additional Steps Are Needed to Better Manage Climate-Related Risks. This report examines climate-related risks to TVA's operations and steps TVA has taken to manage climate-related risks as well as additional steps needed. In the report, the GAO made three recommendations:
• TVA's CEO should direct TVA staff to conduct an inventory of assets and operations vulnerable to climate change that includes analyzing the likelihood and degree of damage or disruption from climate change and the likely consequences if specific climate effects were to occur.
• Once TVA staff identifies vulnerable assets and operations, TVA's CEO should direct TVA staff to develop a resilience plan that identifies and prioritizes measures to address climate change vulnerabilities and that includes a portfolio of resilience measures and an action plan that specifies which risks to address and how and when to do so.
• TVA's CEO should direct TVA staff to establish a plan to routinely reassess the TVA resilience plan and incorporate updated information about implemented resilience actions, as well as updated information about climate change, resilience technologies and planning tools, and connected infrastructure vulnerabilities.
TVA provided a response to the GAO in June 2023 outlining completed and planned TVA actions to address the recommendations. To strengthen TVA’s climate resiliency, TVA has established new priority actions in TVA’s Climate ChangeAction Adaptation and Resiliency Plan. These actions include continuing to implement and maintain seasonal readiness programs that incorporate climate threats, continuing to evaluate climate threats in enterprise risk management, researching methods for improving climate resilience and adaptation planning, incorporating relevant climate change information in each IRP, evaluating systems and components for potential resiliency hardening, integrating climate resiliency in the transmission grid resiliency program, and completing asset analysis and incorporating climate resiliency into business processes.
Executive Actions. In March 2017, President TrumpBiden has taken several executive actions relating to climate change.
•On January 20, 2021, President Biden issued Executive Order ("EO") 13783, "Promoting Energy IndependenceEO 13990, "Protecting Public Health and Economic Growth.the Environment and Restoring Science To Tackle the Climate Crisis." The EO reversed or altered many actions taken by the federal government in the last four years of the Obama Administration to address climate change and mandates that13990 directs federal agencies to review existingand revise regulations and actions that potentially burden energy development and use. Several EOs,consistent with broad policy statements, and reports that established climate change objectives were rescinded or revoked. EO 13783 did not mandate that the EPA reconsider its finding under the CAA that GHG emissions cause climate change and therefore endangergoals to improve public health and the environment. environment, reduce GHG emissions, and prioritize environmental justice.
Implementation of•On January 27, 2021, President Biden issued EO 13783 has resulted in14008, "Executive Order on Tackling the replacementClimate Crisis at Home and Abroad." EO 14008 seeks to promote safe global temperatures, increase climate resilience, and support low greenhouse gas emissions and climate-resilient development by, among other things, (1) using federal procurement authorities to achieve or facilitate (a) a carbon pollution-free electricity sector no later than 2035 and (b) clean and zero-emission vehicles for federal, state, local, and tribal government fleets, (2) putting the U.S. on a path to achieve net-zero emissions, economy-wide, by no later than 2050, and (3) establishing the Justice40 Initiative, instructing federal agencies to direct 40 percent of the Clean Power Plan rule for existing fossil generation units by the ACE rule and revisions to the GHG emission standards for new, modified, and reconstructed electric utility generating units. The impact of the ACE rule and the GHG emission standards are discussed above.benefit from eligible projects toward disadvantaged communities.
In•On May 2018,20, 2021, President Biden issued EO 13834, "Efficient Federal Operations," was signed. EO 13834 emphasizes meeting statutory requirements14030, “Climate-Related Financial Risk,” which calls for a governmental-wide strategy on the disclosure of climate-related financial risk that includes, among other things, the measurement, assessment, mitigation, and gives agencies greater flexibilitydisclosure of climate-related financial risk to federal government programs, assets, and discretion to decide how best to improve operationsliabilities in order to "optimizeincrease the long-term stability of federal operations.
•On December 8, 2021, President Biden issued EO 14057, "Executive Order on Catalyzing Clean Energy Industries and Jobs Through Federal Sustainability," which details the administration’s policy to take a whole-of-government approach to lead by example to achieve a carbon pollution-free electricity sector by 2035 and net-zero emissions economy-wide by no later than 2050. Implementing Instructions for EO 14057 issued in August 2022 provided instructions to federal agencies regarding agency planning, reporting requirements, and accountability. Agencies must issue or revise existing agency policies, directives, and guidance, as appropriate, including employee training, to ensure alignment with the goals and requirements of EO 14057.
•On September 12, 2022, President Biden issued EO 14082, “Implementation of the Energy and Infrastructure Provisions of the Inflation Reduction Act of 2022.” EO 14082 provides that in implementing the Inflation Reduction Act, federal agencies shall, as appropriate and to the extent consistent with law, prioritize, among other things, (1) driving progress to achieve the climate goals of the U.S. to reduce greenhouse gas emissions 50 to 52 percent below 2005 levels in 2030, achieve a carbon pollution-free electricity sector by 2035, and achieve net-zero emissions by no later than 2050, (2) advancing environmental and climate justice through an all-of-government approach, including through the Justice40 Initiative set forth in EO 14008, and (3) promoting construction of clean energy generation, storage, transmission, and enabling technologies through efficient, effective mechanisms that incorporate community engagement.
•On April 21, 2023, President Biden issued EO 14096, “Revitalizing Our Nation's Commitment to Environmental Justice for All.” EO 14096, among other things, details the administration’s policy to take a whole-of-government approach to environmental performance, reduce waste,justice and cut costs." It also callsto advance environmental justice by implementing and enforcing the nation’s environmental and civil rights laws, preventing pollution, addressing climate change and its effects, and working to clean up legacy pollution that is harming human health and the environment. In addition, EO 14096 directs each federal agency to make achieving environmental justice part of its mission and to submit an environmental justice strategic plan to the Chair of the Council on Environmental Quality within 18 months of the date of the order and every four years thereafter.
•On September 21, 2023, President Biden announced that he approved recommendations from the Interagency Working Group on the White House Council of Environmental Quality to streamline pre-existing environmental orders by "refocusing agencies on cost-effectively meeting mandates and goals" established by law. The order seeks to consolidate requirements related to energy and water efficiency, high performance buildings, renewable energy consumption, and federal vehicle fleet management. TVA consistently seeks to improve its operations in order to optimize energy and environmental performance and does not anticipate significant changes in its planning or operations as a resultexpanded use of the EO.social costs of GHG for budgeting, procurement, and other agency decisions, including reaffirming its use for environmental reviews where appropriate.
TVA is voluntarily pursuing multiple policies and programs in the Tennessee Valley that support the goals and policies of these executive actions. See Actions Taken by TVA to Reduce GHG Emissions below. TVA must consider executive actions within the context of statutory requirements imposed by Congress when carrying out its mission such as the TVA Act and the Energy Policy Act of 1992 that require power be sold at rates as low as feasible and the use of least-cost resource planning, respectively. TVA performs long-term least-cost resource planning through its Integrated Resource Plan process.
International AccordsParis Agreement. In September 2016, theThe U.S. formally acceptedis currently part of the Paris Agreement. The agreement met the threshold of at least 55 countriesParis Agreement tracks emissions targets through nationally determined contributions ("NDCs"). Each nation that account for at least 55 percent of global GHG emissions and formally entered into force in November 2016. On November 4, 2019, the U.S. formally notified the United Nations that it would withdraw from the agreement. Under the terms of the agreement, the effective date for the withdrawal was November 4, 2020. Specific impactsis a party to TVA cannot be determined at this time.
In response to President Trump's Paris withdrawal announcement, 25 states have formed the U.S. Climate Alliance, a bipartisan coalition of governors committed to reducing GHG emissions consistent with the goals of the Paris Agreement. North Carolina and Virginia are the only states in the TVA region that are U.S. Climate Alliance members. Among other commitments, each state commits to implement policies that advance the goals of the Paris Agreement aimingis asked to reduceprepare five-year, successive NDCs that it plans to achieve. On April 22, 2021, the Biden Administration announced its GHG emissions by at least 26-28 percent below CY 2005 levels by CY 2025 and to accelerate new and existing policies to reduce carbon pollution and promote clean energy deployment at the state and federal level. In June 2017, U.S. states, cities, and businesses representing more than half of the U.S. economy made a pledge to meet the GHG reduction targets ofNDCs for 2030 under the Paris Agreement, called "America's Pledge." In September 2020, America's Pledge released its secondand these NDCs establish a new target for the U.S. to achieve a 50 to 52 percent reduction from 2005 levels in economy-wide policy analysis with recommendationsnet GHG pollution in 2030. TVA's own operations have achieved GHG reductions from 2005 levels that are in excess of how states, cities, businesses, and other stakeholders can influence U.S. decarbonization. It is premature50 to determine potential impacts to TVA.52 percent.
Litigation. In addition to legislative activity, climateClimate change issues have been the subject of a number of lawsuits, including lawsuits against TVA.TVA, and TVA may be subject to additional lawsuits in the future. See Note 22 —Commitments and Contingencies — Legal Proceedings for additional information.
Indirect Consequences of Regulation or Business Trends. Legal, technological, political, and scientific developments regarding climate change may create new opportunities and risks. The potential indirect consequences could include an increase or decrease in electricity demand, increased demand for clean generation from alternative energy sources, and subsequent impacts to business reputation and public opinion. SeePower Supply and Load Management Resources above.
Physical Impacts of Climate Change. Physical impacts of climate change may include, but not be limited to, changing weather patterns, extreme weather conditions, and other events such as flooding, droughts, wildfires, heat waves, and snow or ice storms, and these events can impact TVA's system in terms of system operability, customer demand, and the health of regional economies. TVA has a 2021 Climate Change AdaptationAction Plan was lastwhich it updated in July 2020.2022. The goal of the adaptationaction planning process is to ensure TVA continues to achieve its mission and program goals and to operate in a secure, effective, and efficient manner in a changing climate by integrating climate change adaptation efforts in coordination with state and local partners, tribal governments, and private stakeholders. TVA manages the potential effects ofrisks proposed by climate change on its mission, programs, and operations within its environmental management processes.processes, though such risks cannot be completely eliminated.
Actions Taken by TVA to Reduce GHG Emissions. TVA has reduced GHG emissions from both its generation stationsfacilities and its other operations. Recent TVA Board actions have focused on TVA's plan to balancefurther reducing GHG emissions from its generation fleet by evaluating the potential retirement of its coal-fired generation byfleet, increasing its nuclear capacity, modernizing its hydroelectric generation system, increasing natural gas-fired generation installing emission control equipmentto enable greater integration of renewables on certain of its coal-fired units,the grid, increasing its purchases of renewable energy, building solar facilities, and investing in energy efficiency initiatives to reduce energy use in the Tennessee Valley. Additionally, TVA has investedcontinues to increaseinvest in energy efficiency in its operations. The combinationoperations and offers renewable energy programs. See Power Supply and Load Management Resources — Renewable Energy Resources. These changes support the broad electrification and carbon emission reduction efforts in other sectors of more stringentthe economy. There are inherent challenges each year in both operations and asset changes. TVA will not sacrifice reliability at any time, which means that TVA must make certain operational decisions at times to keep the system reliable, possibly impacting annual performance on carbon emissions. Therefore, while TVA continues to strive to lower GHG emissions, there will be fluctuations in TVA’s emission numbers resulting from changes in the power supply mix, weather impacts, economic conditions, and generating unit performance. As TVA evolves its generation portfolio, and after appropriate environmental regulations, lower natural gas prices,review under NEPA, the TVA Board could make decisions about the timing, retirement, and lower demand for energy across the Tennessee Valley has reduced the utilizationreplacement of coal-fired generation. These factors have resulted in loweraging fossil units or other expiring capacity, which may further TVA’s CO2 and other emissions reductions. The Environmental Policy also provides additional direction in several environmental stewardship areas related to reducing environmental impacts on the Tennessee Valley's natural resources, including reducing carbon intensity and air emissions. In addition, TVA's decarbonization initiative is aimed at understanding and applying clean resources to support the reduction of carbon emissions from theits power supply, and TVA system,is exploring several technologies as previously discussed in this section.part of these efforts. See Research and Development above.
Renewable/Clean Energy Standards
Twenty-nineThirty-six states and the District of Columbia have established enforceable or mandatory requirements for electric
utilities to generate a certain amount of electricity from renewable sources.sources or have established a renewable goal. In 12 of those
states and the District of Columbia, the requirement is for a 100% clean electricity standard or goal by 2050 or earlier. One state within the TVA service area, North Carolina, has a mandatory renewable standardand clean energy goal that, while not applying directly to TVA, does apply to TVA's LPCs serving retail customers in that state. TVA's policy is to provide compliance assistance to any distributor of TVA power, and TVA is providing assistance to the covered LPCs that sell TVA power in North Carolina. In 2020, Virginia signed into law the Clean Economy Act. The ActThis act establishes a mandatory requirement for utilities to generate a certain amount of electricity from renewable sources. At this time, TVA is not impacted by the legislation due to the relatively small amount of electricity that TVA provides in Virginia compared to other utilities. Likewise, the Mississippi Public Service Commission adopted an energy efficiency rule applying to electric and natural gas providers in the state, and TVA is supplying information on participation in TVA's energy efficiency programs to support the covered Mississippi LPCs.
Water Quality Control Developments
Waters of the United States. On May 25, 2023, the Supreme Court in Sackett v. EPA narrowed the interpretation of the scope of “waters of the United States” under the Clean Water Act (“CWA”). Specifically, the Court ruled that CWA jurisdiction extends only to wetlands that have continuous surface connection with relatively permanent bodies of water connected to traditional interstate navigable waters. In reaching its decision, the Court rejected the “significant nexus” standard for determining the jurisdiction of the CWA that was articulated by Justice Kennedy in the Court’s Rapanos decision. The result of this decision is that fewer waters will be subject to CWA permitting or other restrictions. In response to the Sackett v. EPA decision, the EPA and the Army Corps of Engineers (“ACE”) published a final rule in the Federal Register on September 8, 2023, that reestablishes, for the third time, the definition of Waters of the United States. The new definition encompasses fewer water bodies than the previous definition. As such, ACE permits will no longer be required for some streams and wetlands that would have been included based on the previous “significant nexus” standard.
Cooling Water Intake Structures. In May 2014, the EPA released a final rule under Section 316(b) of the Clean Water ActCWA relating to cooling water intake structures ("CWIS") for existing power generating facilities. The rule requires changes in CWIS used to cool the vast majority of coal, gas, and nuclear steam-electric generating plants and a wide range of manufacturing and industrial facilities in the U.S. The final rule requires CWIS to reflect the best technology available ("BTA") for minimizing adverse environmental impacts, primarily by reducing the amount of fish and shellfish that are impinged or entrained at a cooling water intake structure.CWIS. These new requirements will potentially affect a number of TVA's fossil- and nuclear-fueled facilities and will likely require capital upgrades to ensure compliance. Most TVA facilities are projected to require retrofit of CWIS with "fish-friendly" screens and fish return systems to achieve compliance with the new rule. The rule is being implemented through permits issued under the National Pollutant Discharge Elimination System ("NPDES") in Section 402 of the Clean Water Act.CWA. State agencies administer the NPDES permit program in most states including those in which TVA's facilities are located. In addition, the responsible state agencies must provide all permit applications to the U.S. Fish and Wildlife Service for a 60-day review prior to public notice and an opportunity to comment during the public notice. As a result, the permit may include requirements for additional studies of threatened and endangered species arising from U.S. Fish and Wildlife Service comments and may require additional measures be taken to protect threatened and endangered species and critical habitats directly or indirectly related to the plant cooling water intake. TVA's review of the final rule indicates that the rule offers adequate flexibility for cost-effective compliance. The required compliance timeframe is linked to plant-specific NPDES permit renewal
cycles (i.e., technology retrofits), and compliance isactivities have begun and are expected to be required incontinue through the CYs 2022-20242028 - 2030 timeframe.
The EPA has never previously applied the requirements under Section 316(b) to hydroelectric facilities. However, twoon September 30, 2021, EPA regionsRegion 10, which covers an area outside TVA’s service area, issued NPDES permits to four hydroelectric plants that do not cover TVA's activities are proposing to include Section 316(b) requirements in NPDES permits forrequirements. In determining the BTA to minimize adverse impacts on the environment using best professional judgment, Region 10 analyzed the existing controls that the hydroelectric facilities inwere already implementing and concluded that those regions that withdraw water used for cooling purposes.controls constitute BTA. It is not clear whether the requirementsthis approach will be adopted nationwide or given the unique features of hydroelectric facilities and the manner in which they withdraw water for cooling purposes, how the best technology availableBTA standard would be applied to TVA's hydroelectric facilities. Thefacilities; accordingly, the specific impacts to TVA from this potential policy changethe Region 10 permits cannot be determined at this time.
Hydrothermal Discharges. The EPA and many states continue to focus regulatory attention on potential effects of hydrothermal discharges. Many TVA plants have variances from thermal standards under Section 316(a) of the Clean Water ActCWA that are subject to review as NPDES permits are renewed. Specific data requirements in the future will be determined based on negotiations between TVA and state regulators. If plant thermal limits are made more stringent, TVA may have to install cooling towers at some of its plants and operate installed cooling towers more often. This could result in a substantial cost to TVA.
Steam-Electric Effluent Guidelines. In 2015, the EPA revised existing steam-electric effluent limitation guidelines ("ELGs"), which regulate water discharge pollutants and require the application of certain pollutant control technologies. The 2015 ELGs established more stringent performance standards for existing and new sources and required major upgrades to wastewater treatment options at all coal-fired plants. Compliance with new requirements was originally required in the CYs 2018-20232018 - 2023 timeframe, but the EPA delayed the compliance dates for flue gas desulfurization ("FGD") wastewater and bottom ash transport water until CYs 2020-20232020 - 2023 to allow the EPA time to review and potentially revise the ELGs with regard to these waste streams.
In August 2017,October 2020, the EPA Administrator announced his decision to conduct a rulemaking to potentially revise the new, more stringent effluent limitations that apply to bottom ash transport water and FGD wastewater in the 2015 ELG rule. In April 2019, the U.S. Court of Appeals for the Fifth Circuit ("Fifth Circuit") remanded portions of the 2015 ELG rule because it determined that some of the standards did not comply with statutory requirements. The EPA proposedissued final revised ELGs for bottom ash transport water and FGD wastewater on November 4, 2019, but did not address the portions of the ELG that were remanded by the Fifth Circuit.
The final ELGs were published on October 13, 2020.wastewater. The primary impact for TVA is on the operation of existing coal-fired generation facilities. The revised ELGs willcould impact long-term investment decisions being made relative to the long-term compliance and operability of these plants. The revisions may require TVA to install additional wastewater treatment systems for FGD wastewater and bottom ash transport water, and TVA could incur substantial costs to comply with the new rule. In addition, the revised ELGs could cause TVA to further reduce utilization of its coal-fired generation facilities or even to decommission such facilities. The revision also includes a subcategory for which the Cumberland Fossil Plant ("Cumberland") would qualify that provides TVA greater flexibility in meeting the ELGs. The revision includes two additional subcategories for low utilization units and units that cease coal combustion by the end of CY 2028. TVA will evaluateis evaluating the applicability of those subcategories to its plants as appropriate. LitigationIn October 2021, TVA filed Notices of Planned Participation preserving the option for TVA's Bull Run, Cumberland, and Kingston plants to participate in the subcategory for units that cease coal combustion by the end of CY 2028.
Petitions for judicial review of the October 2020 ELG rule were filed in the D.C. Circuit and the U.S. Court of Appeals for the Fourth Circuit (the "Fourth Circuit") and have been consolidated in the Fourth Circuit in the case Appalachian Voices, et al. v. EPA. On August 3, 2021, the EPA announced a supplemental rulemaking to revise the Steam Electric Power Generating Effluent Limitations Guidelines and Standards. As part of the rulemaking process, the EPA will determine whether more stringent limitations and standards are appropriate and consistent with the technology-forcing statutory scheme and the goals of the CWA. Because this rulemaking could result in more stringent ELGs, the EPA has requested that the Appalachian Voices, et al. v. EPA litigation in the Fourth Circuit be stayed pending the outcome of the supplemental rulemaking process.
Consistent with the 2020 rule, on January 8, 2021, TVA submitted requests to state regulatory authorities to modify NPDES permits for Kingston, Cumberland, Bull Run, Shawnee, and Gallatin Fossil Plant ("Gallatin") to incorporate into the permits limitations in the 2020 rule. The Kentucky Department for Environmental Protection issued a final revised permit for Shawnee in the fourth quarter of 2021 and an additional revision in the second quarter of 2022. The Tennessee Department of Environment and Conservation ("TDEC") issued a final revised permit for Kingston in the first quarter of 2022 and for Gallatin in May 2022. TDEC issued a draft permit for Bull Run in August 2022 and a draft permit for Cumberland in October 2023.
On March 7, 2023, the EPA proposed new ELGs for steam electric power generators. The proposed rule would impose more stringent effluent limits on discharges of flue gas desulfurization wastewater, bottom ash transport water, and combustion residual leachate from coal-fired power plants as well as establish new definitions for various legacy wastewaters, which affects when more stringent requirements will apply to such wastewaters. The EPA's proposed rule also includes flexible paths for certain types of power plants to come into compliance with the proposed ELGs. Since this is anticipated which introduces additional uncertaintya proposed rule, it is premature to evaluate the potential impacts of this rule on TVA operations; however, the EPA's adoption of such a rule could result in what will be required at each facility.material compliance costs to TVA.
Other Clean Water Act Requirements. As is the case in other industrial sectors, TVA and other utilities are also facing more stringent requirements related to the protection of wetlands, reductions in storm water impacts from construction activities, new water quality criteria for nutrients and other pollutants, new wastewater analytical methods, and changes in regulation of pesticide application.
Recent Clean Water Act Decisions
On April 23, 2020, in County of Maui v. Hawaii Wildlife Fund, the Supreme Court held that the Clean Water Act requires a permit when there is a direct discharge of pollutants from a point source to waters of the U.S. and when there is "the functional equivalent" of a direct discharge to such waters. The Court suggested seven factors for determining when such a discharge is the functional equivalent of a direct discharge and acknowledged that the new test would be somewhat difficult to apply, potentially requiring evaluation of multiple factors. The Court noted that "time and distance" of pollutant migration often will be the most important factor but that other relevant factors may include, for example, the nature of the material through which the pollutant travels and the extent to which the pollutant is diluted or chemically changed as it travels. TVA is evaluating what potential impact the decision and application of the test could have on its operations.
On April 15, 2020, in Northern Plains Resource Council v. U.S. Army Corps of Engineers, the U.S. District Court for the District of Montana ("District Court of Montana") vacated the Nationwide Permit ("NWP") 12, which authorizes discharges of dredged or fill material into waters of the U.S., and enjoined the U.S. Army Corps of Engineers from authorizing projects nationwide under the permit. The District Court of Montana subsequently amended its order on May 11, 2020, to allow NWP 12 to remain in place pending appeal for non-pipeline construction projects. The Supreme Court further granted a stay of the decision on July 6, 2020, allowing NWP 12 to remain in place for all pipeline construction projects except the Keystone XL pipeline. Consequently, the District Court of Montana's decision vacating NWP 12 does not have an immediate effect on TVA; however, unless the District Court of Montana's decision is reversed on appeal, there remains a risk that NWP 12 will not be available for TVA projects in the future. On September 15, 2020, the U.S. Army Corps of Engineers published a notice of proposed rulemaking in the Federal Register for the reissuance and modification of NWPs, including NWP 12. The notice also
included a proposal to limit the applicability of NWP 12 to oil and natural gas pipelines, modify certain pre-construction notification requirements, and create new NWPs for certain utility line activities. The proposed rule is unlikely to have a material impact on TVA, but the impact cannot be evaluated until the proposed rule is finalized and any related litigation is resolved.
Cleanup of Solid and Hazardous Wastes
Liability for releases and cleanup of hazardous substances is imposed under the federal Comprehensive Environmental Response, Compensation, and Liability Act ("CERCLA"), the Resource Conservation and Recovery Act ("RCRA"), and other federal and parallel state statutes. In a manner similar to many other industries and power systems, TVA has generated or used hazardous substances over the years.
TVA Sites. TVA historical operations at some of itscertain facilities have resulted in releases of contaminants that TVA is addressing, including at TVA's Environmental Research Center at Muscle Shoals, Alabama. TVA has completed several removal, remedial, and characterization actions at the site, as required by a RCRA permit issued by the Alabama Department of Environmental Management ("ADEM"). At September 30, 2020,2023, TVA's estimated liability for required cleanup and similar environmental work for those sites for which sufficient information was available to develop a cost estimate iswas approximately $14$16 million and was included in Accounts payable and accrued liabilities and Other long-term liabilities on the Consolidated Balance Sheets. ADEM issued a renewed permit to TVA on July 7, 2023, with a 10-year term. The new permit will not have any adverse impacts on TVA. In addition, the Environmental Research Center has an active groundwater monitoring program as part of a permitted corrective action plan.
Non-TVA Sites. TVA is aware of alleged hazardous-substance releases at certain non-TVA areas for which it may have some liability. See Note 22 — Commitments and Contingencies — Contingencies — Environmental Matters.
Coal Combustion Residuals. The EPA published its final rule governing CCR in 2015. The rule regulates CCR as nonhazardous waste under Subtitle D of the RCRA.RCRA and establishes standards for landfill and surface impoundment placement, design, operation, and closure; groundwater monitoring; corrective action; and post-closure care. While states may adopt the rule's requirements into their regulatory programs, the rule does not require states to adopt the requirements. The initial version of the rule provided for self-implementation by utilities and allowsallowed enforcement through citizen suits in federal court. The Water Infrastructure Improvements for the Nation Act ("WIIN Act") subsequently allowed state or federal-based permitting to implement the EPA's CCR rule as an alternative to("CCR Rule") instead of self-implementation and citizen suits. In 2020, the EPA issued the final Part A revision to its CCR Rule. Among other things, the final Part A rule requires unlined CCR surface impoundments to stop receiving CCR and non-CCR wastestreams and to initiate closure or retrofit by no later than April 11, 2021. TVA ceased sending CCR and non-CCR wastestreams to, and initiated closure of, unlined CCR surface impoundments by the specified deadline. See Part II, Item 7, Management's Discussion and Analysis of Financial Condition and Results of Operations — Key Initiatives and Challenges — Generation ResourcesCoal Combustion Residuals — Coal Combustion Residuals Facilities for a discussion of the impact on TVA's operations, including the cost and timing estimates of related projects.
In July 2018, the EPA issued a final CCR rule which provided additional flexibility and an extension of certain deadlines. In March 2019, the D.C. Circuit granted the EPA's request to remand the final rule to allow the EPA to reconsider the amendments. The remand also allowed the EPA time to complete a new rulemaking to establish revised timelines for unlined impoundments to initiate closure and to reexamine the October 2020 deadline for closing some unlined impoundments. In August 2019,On May 18, 2023, the EPA issued a proposed rule to amend portions ofexpanding the federal CCR Rule regarding beneficial use, temporary piles, and public access to information. On November 4, 2019, the EPA announced ainclude legacy CCR units. The proposed rule that will revise portionswould establish two new classes of units not currently regulated under the federal CCR Rule requiring closure of unlined surface impoundments. The final Part A rule was published in the Federal Register on August 28, 2020, and became effective September 28, 2020. Among other things, the final Part A rule requires all unlinedRule: (1) legacy CCR surface impoundments, to stop receivingwhich are surface impoundments that (a) contained both CCR and non-CCR wastestreamsliquids on or after October 19, 2015, and (b) are located at a power plant that ceased generating power prior to October 19, 2015, and (2) CCR management units, which are any area of land (a) on which any non-containerized accumulations of CCR are received, placed, or otherwise managed, and (b) which is not a CCR unit. The EPA proposes to subject both classes of legacy units to the requirements applicable to currently regulated units with a few exceptions and also proposes to mandate the requirement to initiate closure or retrofit by no later than April 11, 2021. Additionally,within 12 months of the finaleffective date of the rule. If finalized in its current form, this proposed rule providesmay significantly increase the
number of federally regulated units in TVA’s fleet that will be subject to substantial costs for closure, post-closure, and potential remediation, and could have a process for a utility to seek site-specific approval frommaterial adverse effect on TVA's results of operations and financial condition. In addition, the EPA has recently interpreted its CCR Rule in a way that could create significant additional costs with implementing closure.
In addition to the requirements of the EPA's CCR Rule, CCR landfills and surface impoundments will continue to use the unlined CCR surface impoundment until October 15, 2023, and possibly longer under certain circumstances. The final rule also includes requirements that enhance the public's access to groundwater monitoring and corrective action reports. TVA does not currently anticipate the final rule will have a significant impact because TVA is already planning to close its unlined CCR surface impoundmentsbe regulated by the regulatory deadline and already makes groundwater monitoring and corrective action reports publicly available. A prepublication copy of a separate final Part B rule was released on October 16, 2020. This rule provides an alternative liner demonstration procedure for utilities with clay lined units which are being forced to close under the Part A rule. However, TVA does not have any units which qualify for this demonstration.
states. In August 2015, the Tennessee Department of Environment and Conservation ("TDEC")TDEC issued an order that (1) established a process for TDEC to oversee TVA's implementation of the EPA's CCR ruleRule to ensure coordination and compliance with Tennessee laws and regulations that govern the management and disposal of CCR and (2) required TVA to investigate and assess CCR contamination risks at seven of TVA's eight coal-fired plants in Tennessee and to remediate any unacceptable risks. The TDEC order does not allege that TVA is violating any CCR regulatory requirements nor does it assess TVA penalties. The TDEC order sets out an iterative process through which TVA and TDEC will identify and evaluate any CCR contamination risks and, if necessary, respond to such risks. Currently,TVA has submitted to TDEC environmental assessment reports (“EARs”) for Allen, Cumberland, John Sevier, Bull Run, Kingston, Watts Bar Fossil, and Johnsonville. At TDEC's request, to address a potential data gap, TVA is conducting environmental investigationsadditional investigation work at Allen around the West Ash Disposal Area and will submit a revised EAR upon completion of that work. Upon TVA's submittal of each EAR, TDEC will review the seven sites in accordance with the TDEC-approved Environmental Investigation Plansdocument and provide comments, and TVA will make revisions until TDEC approves a final EAR for each site. UponAfter the completion of the investigations,EARs are approved, TVA will submit Corrective Action/Risk Assessment ("CARA") Plans that will identify the unacceptable risks and TVA's proposed remediation. TDEC approved the EARs for John Sevier and Cumberland in the first quarter of 2024, and the CARA Plans for those sites will be submitted to TDEC as required by the order. It is too early to accurately predict the scope of any remedial activities that may arise under the order, and as such cost estimates for any required remedies are not possible to predict at this time. See also Part II, Item 7, Management’s Discussion and Analysis of Financial Condition and Results of Operations – Key Initiatives and Challenges – Coal Combustion Residuals – Coal Combustion Residual Facilities for a discussion of an environmental assessment reportEAR for each site.Gallatin that was recently approved by TDEC pursuant to a consent order and agreement.
In October 2019, TDEC released amendments to its regulations which govern solid waste disposal facilities, including TVA's active CCR facilities covered by a solid waste disposal permit and those which closed pursuant to a TDEC-approved closure plan. Such facilities are generally subject to a 30-year post-closure care period during which the owner or operator must undertake certain activities, including monitoring and maintaining the facility. The amendments, among other things, add an additional 50-year period after the end of the post-closure care period, require TVA to submit recommendations as to what activities must be performed during this 50-year period to protect human health and the environment, and require TVA to submit revised closure plans every 10 years.
Groundwater Contamination. EnvironmentalThe EPA, environmental groups, and state regulatory agencies are increasing their attention on alleged groundwater contamination associated with CCR management activities. As a result, TVA may have to change how it manages CCR at some of its plants, potentially resulting in higher costs. See Part II, Item 7, Management's Discussion and Analysis of Financial Condition and Results of Operations — Key Initiatives and Challenges — Generation ResourcesCoal Combustion Residuals — Coal Combustion Residuals Facilities and — Regulatory Compliance — Allen Groundwater Investigation and Note 1213 — Asset Retirement Obligations.
Environmental Investments
From 1970 to 2020,2023, TVA spent approximately $6.8 billion on controls to reduce emissions from its coal-fired power plants. In addition, TVA has reduced emissions by idling or retiring coal-fired units and relying more on cleaner energy resources including natural gas and nuclear generation.generation and renewable sources.
TVA currently anticipates spending significant amounts on environmental projects in the future, including investments in new clean energy generation including renewables to reduce TVA's overall environmental footprint. TVA environmental project expenditures could also result from coal-fired plant decommissioning and from effective ash management modernization. Based on TVA's decisions regarding certain coal-fired units, the amount and timing of expenditures could change. See Power Supply and Load Management Resources — Coal-Fired above and Estimated Required Environmental Expenditures below.
SO2 Emissions and NOx Emissions. To reduce SO2 emissions, TVA operates scrubbers on 1917 of its coal-fired units and switched to lower-sulfur coal at 13certain coal-fired units. To reduce NOx emissions, TVA operates SCRs on 1917 coal-fired units, operates low-NOx burners or low-NOx combustion systems on 1920 units, operates over-fire air on one cyclone unit, optimized combustion on sixall 24 units, and operates NOx control equipment year round when units are operating (except during start-up, shutdown, and maintenance periods). TVA has also retired 3435 of 59 coal-fired units. Except for seven units at Shawnee, the remaining coal-fired units in the TVA fleet have scrubbers and SCRs. TVA plans to construct SCRs at four of the Shawnee units by the end of 2025 and is evaluating plans for the remaining three units. See Power Supply and Load Management Resources — Coal-Fired above.
Particulate Emissions. To reduce particulate emissions of air pollutants, TVA has equipped all of its coal-fired units with scrubbers, mechanical collectors, electrostatic precipitators, and/or bag houses.
Greenhouse Gas Emissions. Various federal agencies, including the EPA and the Department of Commerce, may issue regulations establishing more stringent air and waste requirements, as well as GHG accounting requirements, and these requirements could result in significant changes in the structure of the U.S. power industry, especially in the eastern half of the country. There could be additional material costs if further reductions of GHGs, including CO2, are mandated by legislative,
executive, regulatory, or judicial actions and if more stringent emission reduction requirements for conventional pollutants are established. These costs cannot reasonably be predicted at this time because of the uncertainty of these actions. The EPA may issue regulations establishing more stringent air, water, and waste requirements, and these requirements could result in significant changes in the structure of the U.S. power industry, especially in the eastern half of the country.
Estimated Required Environmental Expenditures
The following table contains information about TVA's current estimates on projects related to environmental laws and regulations.
| Estimated Potential Environmental Expenditures(1)(2) At September 30, 2020 (in millions) | |
Estimated Potential Environmental Expenditures(1)(2) As of September 30, 2023 (in millions) | | Estimated Potential Environmental Expenditures(1)(2) As of September 30, 2023 (in millions) |
| | | 2021 | | 2022 | | Thereafter(3)(4) | | Total | | 2024 | | 2025 | | 2026 - 2028(3)(4) | | Total |
Coal Combustion Residual Conversion Program(5) | $ | 313 | | | $ | 224 | | | $ | 412 | | | $ | 949 | | |
Coal Combustion Residual Program(5) | | Coal Combustion Residual Program(5) | $ | 323 | | | $ | 349 | | | $ | 936 | | | $ | 1,608 | |
Clean Air Act control projects(6) | Clean Air Act control projects(6) | 28 | | | 45 | | | 83 | | | 156 | | Clean Air Act control projects(6) | 109 | | | 85 | | | 58 | | | 252 | |
Clean Water Act requirements(7) | Clean Water Act requirements(7) | 41 | | | 78 | | | 71 | | | 190 | | Clean Water Act requirements(7) | 52 | | | 59 | | | 79 | | | 190 | |
Notes
(1) These estimates are subject to change as additional information becomes available and as regulations change.
(2) These estimates include $145$200 million, $134$171 million, and $121$122 million for 2021, 2022,2024, 2025, and thereafter,2026 - 2028, respectively, in capital environmental expenditures. See Part II, Item 7, Management's Discussion and Analysis of Financial Condition and Results of Operations — Liquidity and Capital Resources — Cash Requirements.
(3) See Note 22 — Commitments and Contingencies.
(4) These estimates do not include expenditures expected to be incurred during 2023, 2024, and 2025.after 2028.
(5) Includes costs associated with pond closures, conversionthe closure of wet to dry handling,facilities and landfill activities. TVA is continuing to evaluate the rules and their impact on its operations, including the cost and timing estimates of related projects. See Part II, Item 7, Management's Discussion and Analysis of Financial Condition and Results of Operations — Key Initiatives and Challenges — Generation ResourcesCoal Combustion Residuals — Coal Combustion Residuals Facilities and Note 1213 — Asset Retirement Obligations.
(6) Includes air quality projects that TVA is currently performing to comply with existing air quality regulations, but does not include any projects that may be required to comply with potential GHG regulations or transmission upgrades.
(7) Includes projects that TVA is currently planning to comply with revised rules under the CWAClean Water Act regarding CWIS and ELGs for steam electric power plants.
Human Capital ResourcesManagement
People Strategy and TVA's Values
On September 30,As the TVA region continued to grow throughout 2023, increasing not only its demand for electricity but also its demand for talent across the Tennessee Valley, the employees of TVA continue to advance the unique TVA mission and create a culture that lives up to its values - Safety, Integrity, Inclusion, and Service. TVA employees collectively align to address business needs together and enable strong performance while serving approximately 10 million people of the Tennessee Valley.
As part of its People Advantage strategic priority, TVA strives to create a work environment that supports and responds to the changing needs of the workforce. People Advantage is one of TVA's five strategic priorities and a multi-year commitment to evolve TVA's culture. TVA continues to strive to effectively demonstrate the value of its human capital and putting its people first by sustaining and evolving these programs.
The focus on People Advantage, along with the other four strategic priorities of Operational Excellence, Financial Strength, Powerful Partnerships, and Igniting Innovation, allows TVA to fulfill its daily mission of service to the people of the Tennessee Valley.
TVA's People Advantage priority is anchored on three specific pillars: (1) Inclusion with Diversity ("IwD"), (2) Talent, and (3) Engagement. To help shape an inclusive work environment that values all voices, TVA has intensified its efforts over the past few years to integrate IwD into its culture and make its efforts and progress sustainable and a part of TVA's daily operations. Similarly, TVA has promoted a people-focused organization that amplifies and harnesses the energy, power, and creativity of an experienced and talented workforce - one that continues to bring about the best from its people - manifesting itself as a "destination for difference makers" for highly-skilled candidates. TVA is working to cultivate a positive employee experience to heighten workforce engagement. This work is focused on equipping leaders to champion engagement across the enterprise through the understanding and leveraging of employee surveys, workplace flexibility opportunities, and health, safety, and well-being programs.
Management illustrates its commitment to human capital by including a safety metric in its incentive compensation metrics that tracks the serious injury incident rate and applies to all eligible participants in TVA’s annual program. Compensation derived from this program is based on TVA performance and individual achievements. As a result, success in measures like safety and similar principles grounded in human capital matters helps TVA maintain top quartile ranking in workforce engagement.
Ethics
Ethics and integrity are highly valued at TVA. Since its establishment in 1933, a commitment to ethics has been a part of TVA's DNA. TVA's Ethics & Compliance ("E&C") office aims to help employees make the right decisions when the right
decisions may not be clear. The office is focused on educating and creating awareness while also assisting employees with ethical decision-making inside and outside of the TVA workplace. Further, TVA requires all employees and certain contractors to take its annual ethics training and attest to its Code of Conduct, which sets forth standards for adhering to TVA's core values and conducting its affairs with openness, honesty, and integrity every day.
TVA contracted with Ethisphere® to take a deep dive review of TVA's corporate ethics and compliance program. After this review, TVA became the first federal agency to receive the Compliance Leader VerificationTM certification, applicable for 2022-2023.
TVA Board Governance and Oversight
The TVA Board’s People and Governance Committee ("Committee") assists the TVA Board in fulfilling its responsibilities under the TVA Act by overseeing policies and strategies that affect a wide array of people-related programs inclusive of leadership development, culture, engagement, labor relations, safety, communications, compensation, performance incentives, benefits, and well-being. Specifically, the Committee advises the TVA Board in areas of overall Board governance, CEO goals, performance, compensation, and succession planning. Emergent people issues are discussed by this Committee, or in TVA Board briefings, as appropriate. The TVA Board's Audit, Finance, Risk, and Cybersecurity Committee oversees TVA's compliance and ethics programs.
Inclusion with Diversity
In 2020, TVA had 9,989 employees,added Inclusion as one of whom 3,287 were tradesits core values and labor employees.adopted IwD as an enterprise-wide transformational strategic element. Since then, IwD has become increasingly integrated into TVA’s daily operations. To accelerate the impact of IwD within TVA and the communities it serves, TVA is working to shape an inclusive work environment that values all voices, recognizes and sustains diversity as an imperative, leverages the public power model to advance IwD in all TVA communities, and establishes foundational principles and objectives to further understanding of workplace equity.
Inclusion is a journey, not a destination, and TVA made strides in 2023 to continue the progress, including the following initiatives and accomplishments:
•Increased the visibility of the IwD Council internally and externally;
•Published TVA’s second Diversity, Equity, Inclusion, and Accessibility ("DEIA") Report that details the progress made over the past year and its uncompromising commitment to build a more inclusive and equitable future;
•Established representation goals aimed at increasing the number of women and people of color in leadership;
•Signed an agreement with the Trades and Labor Council for Annual Employees to strengthen the diversity of the hiring pool;
•Increased supplier diversity through Ready Now, a mentorship program designed to prepare diverse small business owners to work with TVA;
•Incorporated performance goals focused on IwD for every leader to build an accountability framework for progress;
•Cultivated support for nine Employee Resource Groups ("ERGs") to encourage employee development and foster community;
•Continued focus and work with business units to incorporate recommendations from the independent diversity, equity, and inclusion assessment to improve people policies, processes, programs, and behaviors to further drive inclusion and equity across TVA;
•Improved TVA’s inclusion score, which measures sense of belonging, to above median at 75;
•Trained and supported leaders to deliver IwD content through forums that cover a range of DEIA topics specific to their business units, demonstrating the importance of an inclusive workplace;
•Held IwD Leadership Forum for TVA's union partners to provide information, tools, and strategies to help achieve TVA's 10-year enterprise diversity goals, celebrate progress made thus far, and discuss TVA's journey moving forward; and
•Maintained CEO accountability for reinforcement of IwD as an enterprise priority through assessment of the
CEO’s individual performance in 2023.
TVA continues to advance IwD in the communities it serves and is enhancing its economic development program support for women-, minority-, and veteran-owned businesses. TVA has established a Supplier Diversity Stakeholder Advisory Council. One of the priorities of the council is the Supplier Diversity Mentoring Program, which is designed to support and position diverse suppliers seeking to do business with TVA. Specific skills enhancements include inventory management, technology integration, accounting practices, program implementation, and continuous improvement. In addition, TVA has strengthened and focused IwD in the communities TVA serves, as part of advancing the public power model at TVA. This was accomplished through support of TVA’s regional model, community engagement, and focused partnerships with deliberate outreach to LPCs and community-based organizations.
Employee Resource Groups. TVA is powered by its people and strengthened by its diversity. NeitherTVA supports nineERGs to help strengthen an inclusive culture and make life better for the federal labor relations laws covering most private sector employers nor those covering most federal agencies applypeople it serves:
•ABLED Events — allows TVA employees to bring unique perspectives and gifts together as a united team to celebrate commonalities and differences through "Awareness Benefiting Leaders & Employees about disAbilities" in the workplace.
•ACTion — celebrates and honors the many Asian cultures represented within TVA, from Japan to India, and to the Philippines and beyond. It regularly highlights social events and supports career-enriching workshops.
•African American Voices — provides an avenue for African Americans and others interested in fellowship and smart career connections within TVA. However,It promotes mentoring and development opportunities, as well as group workshop events on such topics as personal branding, personal finance, and networking and negotiation skills.
•Council for Native Americans (new for 2023) — provides educational opportunities for the TVA Boardworkforce to learn and interact more with a focus on the cultural diversity of Native Americans, to help facilitate the growth of the Native American employee population in numbers, and to provide an avenue for Native Americans to share their cultural diversity. Its goal is to be a growing part of TVA's commitment to a sustainable, diverse, and inclusive workforce by highlighting the Native American history, various ethnicities, and community endeavors.
•New Employee Network — makes life easier for new employees entering a large company. It provides organizational information and cross-functional connections not only on the front-end to new employees but throughout an employee’s tenure at the company.
•Spectrum — highlights the open, accepting, and safe work environment TVA provides for all employees and focuses increasing visibility on educational and social opportunities on LGBTQ+ issues by offering employees a variety of community and professional networking opportunities within the Tennessee Valley.
•TVA & Amigos — provides an avenue for TVA's Hispanic employees and those interested in Latin culture to be involved in professional, educational, and service-oriented events.
•TVA Veterans Association — allows employees unique camaraderie opportunities as they support a wide array of local and national ceremonies and events and is one of the oldest and most active ERGs at TVA, with all branches of the military represented.
•Women Empowered — supports women at all stages of their careers and advocates for the equal rights of all female employees across TVA. This extends externally as TVA supports inclusion, networking, and developmental opportunities for girls and young women in local communities.
Together, TVA and its employees collectively champion personal and professional growth through a network of professional, social, and volunteer opportunities made available by each ERG and TVA’s diverse mix of employees.
Talent
The strength of TVA lies in the collective power from the diverse knowledge, experiences, and perspectives that its employees bring. To inspire the best from its people, TVA utilizes a talent management framework to deliver enterprise workforce needs supporting talent attraction, selection, development, engagement, and performance.
Attracting and Retaining Talent. TVA is enriched by the diversity of a talented, highly skilled workforce made up of people from all backgrounds. As an employer of choice across the seven-state service region, TVA endeavors to ensure that all qualified candidates receive fair consideration for open jobs at TVA. TVA actively engages with key community and university partners to recruit talent of all races, colors, sexual orientations, ethnicities, gender identities, abilities, religions, and ages. TVA continues to improve employment opportunities for underrepresented populations within TVA’s workforce through early career apprenticeships and internships.
While TVA’s voluntary attrition rate reflected a slight year-over-year rise in 2022, voluntary attrition has returned to TVA’s historical rates prior to 2022. In addition, the TVA voluntary attrition rate continues to fall well below the national, utility, and government benchmarks. The majority of TVA's attrition is healthy attrition (e.g., retirements), and this is important because retention in early years of employment is key for maintaining healthy, inclusive pipelines at all levels in the organization. The stability that results from retaining talent is an area of strength that is critical to TVA’s success. TVA believes this is largely attributable to its People Advantage focus, which includes competitive compensation and comprehensive benefits programs, inclusion and well-being programs, flexible workplace practices, and an environment that promotes the retention of its complex and valuable workforce.
Competitive Total Rewards. TVA’s total rewards package is a significant factor in attracting and retaining top talent. TVA’s competitive benefits portfolio supports the values and needs of its employees. TVA provides market-based and competitive compensation which includes an annual incentive plan designed to reward accomplishments against established annual business and individual goals. All eligible employees participate in TVA's annual incentive plan, including TVA's represented employee population.
Additionally, in support of its cultural commitment to IwD, TVA periodically reviews compensation practices to promote fairness and equity. TVA has engaged third party vendors to conduct independent pay equity analyses and continues to monitor its pay practices and to provide its leaders with tools to assist in making equitable pay decisions.
To support and care for the well-being of employees and their families, TVA currently offers comprehensive and competitive benefits, including the following:
| | | | | | | | |
•medical, vision, dental, life, accident, and disability insurance | •flexible spending accounts
•tuition reimbursement | •well-being incentives
•employee assistance programs |
•behavioral and medical telemedicine | •401(k) retirement | •family caregiving benefits |
•leave donation | •dependent scholarship program | •family building benefits |
•maternity leave | •paid parental leave | •flexible work schedules |
•paid time-off | •health savings account | |
Development and Training. As TVA continues to adapt to the evolving demands of the industry, it is imperative that it cultivate a work environment that motivates people to do their best work by aligning employee development, skills, and capabilities with what TVA needs to succeed now and in the future. TVA provides multiple training and development opportunities at all employee levels. Those opportunities include:
| | | | | | | | |
•individual learning-ability | •team learning | •mentoring |
•career pathing, including rotational development | •professional, technical, and leadership career pathways | •33 craft apprenticeship programs |
•over 15,300 on-line learning courses | | |
TVA also invests in the development of its employees through tuition reimbursement for academic programs aligned with TVA’s business and workforce development needs. In addition, employees engaged in over 715,000 hours of training in 2023.
Leadership Development and Succession Planning. TVA encourages personal and professional development and has strategic leadership development programs designed to prepare employees to step into leadership positions and to accept the additional responsibilities, expectations, and challenges faced by each level of leadership. TVA also has advanced leadership programs designed to further prepare leaders for executive level positions, which require an extensive interview and assessment process for selection. Through TVA’s talent review and succession planning program, 98 percent of director and executive level roles have at least one succession candidate identified, with 93 percent having at least one ready-now succession candidate.
Continuous focus on and support of leadership development is maintained through means such as talent discussions at least annually at every level of the organization, which include attention to developing a diverse leadership pipeline. TVA has established goals for female and people of color representation in leadership and plans to update these goals to continuously improve this representation.
Engagement
Strong engagement levels impact all TVA strategic priorities. TVA's work in this key area is focused on ensuring TVA is providing the tools and education to support employee's well-being, leveraging flexibility to support and engage the workforce,
and strengthening relationships with TVA's union partners to ensure employees feel heard.
Employee Engagement Survey. TVA’s Employee Engagement Survey is a key tool for understanding and leveraging the employee voice. The survey is administered a minimum of annually to all employees and measures overall engagement and drivers of engagement. The survey results provide real-time insights and analytics and are compared to a normative database comprised of other relative external benchmarks to help identify strengths and opportunities for improvement. Results from the surveys are shared with employees and used by TVA leadership and business units to improve and monitor progress against People Advantage objectives. Two scores are used as key People Advantage metrics: Engagement, which measures the sense of commitment and involvement, and Inclusion, which measures the sense of belonging at work. See Key Metrics below for Engagement and Inclusion scores.
Workplace Flexibility. As part of its People Advantage strategic priority, TVA strives to create a work environment that is welcoming, supportive, and responsive to the changing needs of the workforce. As the world around TVA has considerably shifted over the past few years, TVA's employees continue to show a remarkable ability to adapt and persevere as they make a difference in communities across the Tennessee Valley. While recognizing hybrid environments means fewer individuals in office locations, TVA is exploring how to best enable its employees to work everywhere across the Tennessee Valley. TVA is evaluating its facilities and workspace options with the objective to transform its facilities into a resource that enables the future of work, while enhancing TVA's engagement and presence within the communities TVA serves. As always, TVA is committed to being a valued, trusted partner in the communities where TVA employees live and serve.
Safety, Employee Health, and Well-being. Safety is one of TVA’s core values. TVA's safety program is based on the fundamentals of a safety management system, which includes management commitment, employee engagement, hazard recognition and control, worksite analysis, contractor safety management, training, review, and continuous improvement. TVA’s safety training aims to educate employees on the elements of the safety program and foster a culture of awareness. Employee engagement is critical to the success of the program. TVA's vital safety behaviors are employee-driven and developed with the collaboration of represented employees, union leadership, and management. As a federal agency, TVA is also required to complete regulatory compliance inspections of its facilities on an annual basis.
In 2023, TVA Safety continued to expand efforts around contractor safety oversight and to improve field engagement. TVA also focused on engaging with industry leaders and developing internal safety talent through participation in the Middle Tennessee Occupational Safety and Health Administration Council, the American Society of Occupational Safety Professional Executive Forum Alliance, the Construction Safety Research board of advisors, and Edison Electric Institute, and sitting on the Department of Labor’s Federal Advisory Council on Occupational Safety and Health.
TVA has provided support for its employees to ensure the retention of valuable talent and to enhance well-being. This support includes emergency back-up care support for child and adult dependents, establishing a mental health advocacy program, providing unlimited Employee Assistance Program sessions, enhancing paid leave, and providing tutoring resources. TVA’s safety and well-being accomplishments in 2023 include an increased effort and focus on developing proactive and preventative leading indicators of the safety program, improving employee engagement, strengthening procedural and regulatory/compliance framework, and obtaining top decile serious injury performance based on the most recent data available.
Partnerships with Unions. TVA has a long-standing policy of acknowledging and working with recognized representatives of its employees, and that policy is reflected in long-term agreements to recognize the unions (or their successors) that represent TVA employees. Federal law prohibitsTVA’s labor construct is complex and unique and is primarily governed by the TVA Act. Neither the federal labor relations laws covering most private sector employers, nor those covering most federal agencies, apply to TVA.
TVA’s labor strategy is critical to the achievement of its strategic priorities as it prepares the workforce for the future. Its employees are represented by six collective bargaining agreements and nine labor unions. This reflects 58% of TVA's workforce, or approximately 6,000 employees. With the addition of collective bargaining agreements and labor unions for TVA's contractors, there are a total of nine collective bargaining agreements and 17 labor unions. TVA’s partnerships with these unions go back more than 80 years and form the backbone of TVA and its ability to serve the people of the Tennessee Valley.
Recent accomplishments to strengthen the relationship between TVA and its labor unions include integrating union partners in TVA’s comprehensive workforce optimization strategy, in alignment with operational and asset transition strategies that position TVA to meet strategic imperatives over the next decade; negotiating a three-year wage agreement between TVA and the Office and Professional Employees International Union through September 2026; and collaborating with IwD to hold the first ever IwD Forum with union leaders to align on how TVA and the union work together to reach goals for a skilled workforce representative of the Tennessee Valley.
Awards
Awards and other recognition help TVA understand its strengths, identify opportunities for improvement, bolster employee pride, and better attract and retain diverse talent. 2023 TVA recognition included:
| | | | | |
•2022-2023 – Ethisphere® Compliance Leader VerificationTM – first federal agency to receive certification | •2023 Military Friendly® Brand – Rank "Designated" |
•2023 National Organization on Disability – Leading Disability Employer | •2023 Military Friendly® Employers – Ranked No. 4 |
•2023 Fair360 – Top Companies for Utilities Award – Ranked No. 3; Top Regional Companies - No. 12 | •2023 Military Friendly® Military Spouse Friendly Employers - Ranked No. 7 |
•2023 VETS Indexes Employer Awards – VETS Indexes 5-Star Employer | •2023 Military Friendly® Supplier Diversity Program Award – Ranked No. 1; Top 10, four years in a row |
•2023 Forbes America's Best Employers By State - Ranked No. 8 in Tennessee | •One of the largest U.S. Contributors to Helmets to Hardhats Program |
| |
| |
Key Metrics
TVA actively monitors internal metrics to remain aware of human capital trends and to strive to ensure that it is making measurable progress on its People Advantage objectives. Through monitoring sources such as data and performance dashboards, one-on-one engagements between leaders and employees, and engagement surveys, TVA obtains information that helps it understand its performance and make adjustments, as needed.
Key measures of success in TVA’s People Advantage strategic priority are set forth below:
| | | | | | | | | | | | | | | | | | | | | | |
| | Goal | | | | Actual |
| Performance Measure | | 2024 | | | | 2023 | | 2022 |
People of color representation in leadership (%) (1) | | 12.0 | % | | | | 10.9 | % | | 10.4 | % |
Female representation in leadership (%) (1) | | 21.0 | % | | | | 19.7 | % | | 19.2 | % |
Diverse external hires (%) (2) | | 40.0 | % | | | | 41.4 | % | | 41.4 | % |
| | | | | | | | |
Voluntary attrition (%) (3) | | 2.4 | % | | | | 1.4 | % | | 2.4 | % |
Engagement (100-point scale) (4) | | Top Quartile (≥79) | | | | 81 | | 81 |
Inclusion (100-point scale) (5) | | Median (≥72) | | | | 75 | | 72 |
Recordable injuries (#) (6) | | 28 | | | | 32 | | 54 |
Serious injury incident rate (7) | | 0.00 | | | | 0.02 | | 0.02 |
Serious injury incidents (7) | | 0 | | | | 3 | | 2 |
Ethics violations(8) | | 0 | | | | 23 | | 28 |
Notes
(1) Defined as first line supervisors and above.
(2) Defined as external hires who are female, persons of color, or persons with disabilities.
(3) Voluntary attrition measures and accounts for all employees who leave the business voluntarily during a fiscal year. 2023 voluntary attrition rates have realigned to former pre-pandemic rates for TVA, significantly below those of the greater external market.
(4) Based on score from engaging in strikes againstEmployee Engagement Survey defined as degree to which employees invest their cognitive, emotional, and behavioral energies toward positive organizational outcomes. Benchmark data is provided by the third-party administrator of the survey, based on data collected from over 750 organizations. Benchmarks are updated at least annually using data from the previous 12-month period.
(5) Based on score from Employee Engagement Survey defined as the degree to which employees sense they belong at work. Benchmark data is provided by the third-party administrator of the survey, based on data collected from over 750 organizations. Benchmarks are updated at least annually using data from the previous 12-month period.
(6) Retroactive cases can affect annual recordable injury counts reported.
(7) Based on the Edison Electric Institute criteria developed by industry peers.
(8) Ethics violations are determined by performing a comprehensive assessment across TVA of substantiated ethics violations involving violation of ethical laws or TVA's Code of Conduct; refusal or failure to cooperate with investigations; violation of equal opportunity policies or remedial actions; mishandling of classified information, privacy information, or security incidents; misuse of government property or official time; theft or unauthorized possession of property; falsification of safety-related documents; falsification or failure to correct TVA documents; and associated disciplinary and/or corrective actions taken.
Workforce Demographics
| | | | | | | | | | | | | | |
| Employee Demographics | | 2023 | | 2022 |
| Number of employees on September 30 | | 10,901 | | 10,390 |
| Employees represented by collective bargaining unit | | 58% of employees represented, or approximately 6,000 employees | | 58% of employees represented, or approximately 6,000 employees |
| Trades and labor employees | | 3,293 | | 3,198 |
| Average tenure (years) | | 12 | | 13 |
| Average age | | 45.4 | | 45.7 |
| | | | |
| | | | |
| | | | |
| | | | |
| | | | | | | | | | | | | | | | | | | | | | | | | | | | | | | | | | | | | | | | | |
| | All Employees | | Leadership | | New Hires | |
| | 2023 | | 2022 | | 2023 | | 2022 | | 2023 | | 2022 | |
| Female | | 2,289 | | 2,159 | | 309 | | 288 | | 267 | | 276 | |
| | | | | | | | | | | | | |
| People of Color | | 1,363 | | 1,227 | | 171 | | 156 | | 206 | | 186 | |
| Military, Veteran | | 1,883 | | 1,822 | | 336 | | 315 | | 148 | | 122 | |
| Disabled | | 844 | | 773 | | 134 | | 114 | | 44 | | 38 | |
Note
All data is based upon self-reported information provided to TVA.
In addition to the employees above, TVA also had approximately 13,80015,600 and 16,200 contractors on September 30, 2023 and 2022, respectively, providing both intermittent or full-time services. The majority of these contractors are managed by TVA suppliers whothat are providing services to TVA.
Over the past year, TVA has worked to evolve its strategic direction to place an intentional focus on its people through a strategic priority identified as People Advantage. As part of this strategic priority, there are three key transformational elements: to accelerate the impact of inclusion with diversity within TVA and the communities it serves, to create a talent-focused
organization to amplify the energy, power, and creativity within each TVA employee, and to create a culture that lives up to its values. TVA employees share common core values and strategic objectives, and it is these values that are the fundamental beliefs that guide actions, behaviors, and decisions as a company. The TVA values include:
•Safety — Committing to the safety and well-being of each TVA employee and the communities TVA serves;
•Integrity — Conducting business in an honest and straightforward way;
•Inclusion — Treating everyone with dignity and respect, emphasizing inclusion by welcoming each person's individuality so that full potential is reached; and
•Service — Serving in the communities in which TVA employees live, work, and play.
Each and every day, TVA is responsible for making life better in the Tennessee Valley. TVA is dedicated to keeping its employees inspired and empowered toward achieving this primary mission of service and invests in people areas including employee health and safety, employee benefits and development, and diversity and inclusion efforts.
TVA continues to focus on safety, and as a result, TVA has seen a consistent decline in injuries for the last seven years and has achieved industry top decile performance in safety. TVA's safety program is based on the fundamentals of a safety management system, which includes management commitment, employee engagement, hazard recognition and control, worksite analysis, contractor safety management, training, review, and continuous improvement. Employee engagement is critical to the success of the program. TVA's vital safety behaviors are employee driven and developed with the collaboration of represented employees, union leadership, and management to improve safety behaviors. Audits and assessments are a key component of continuous improvement and in overseeing TVA's safety and health program and are performed regularly. As a federal agency, TVA is also required to complete regulatory compliance inspections of its facilities on an annual basis.
To care for the well-being of employees and their families, TVA offers quality healthcare, insurance, and retirement benefits. Other benefits also include flexible work schedules, wellness incentives, scholarships for dependents of employees, tuition reimbursement, training and education opportunities, and employee development. TVA offers career opportunities and training for military veterans, college students, and recent graduates. Employee development involves individual learning-ability, team learning, mentoring, and career pathing including rotational development. As TVA continues to adapt to the evolving demands of the industry, it is imperative that it cultivate a work environment that fosters the attributes and capabilities of an interconnected workforce.
TVA is enriched by the diversity of a talented, highly skilled workforce made up of people from all backgrounds. To achieve this, TVA endeavors to ensure that all qualified candidates receive fair consideration for open jobs at TVA and that all employees are encouraged, engaged, and empowered to contribute 100 percent of their talents, 100 percent of the time while bringing their authentic selves to work each day. Recruiting efforts also support the strategic element of inclusion with diversity and a culture that lives up to TVA's values, and TVA actively recruits employees of all races, colors, sexual orientations, ethnicities, gender identities, abilities, religions, and ages. TVA continues to work to improve the minority share and women share of the workforce and maintain its status as best in industry for the military veteran share of the workforce. In addition, TVA has Employee Resource Groups that support and empower employees based on their personal association to the diverse groups present at TVA.
Through the People Advantage strategic priority, TVA strives to become the destination for difference makers, where TVA and employees believe the best in each other, give the best to each other, and expect the best from each other. Key measures of success are engagement and inclusion scores, regrettable losses, recordable injuries, and people of color and female representation, both in leadership. The 2019 and 2020 results for these key measures are reflected in the chart below, in addition to the performance goals for 2021.
| | | | | | | | | | | | | | | | | |
| 2019 | | 2020 | | 2021 |
| Performance Measure | Actual | | Actual | | Plan |
| People of Color Representation in Leadership (%) | 9 | % | | 9 | % | | 10 | % |
| Female Representation in Leadership (%) | 17 | % | | 18 | % | | 19 | % |
| Regrettable Losses (%) | 1.1 | % | | 1.0 | % | | 0 | % |
Engagement (100 point scale) (1) | 75 | | 80 | | 81 |
Inclusion (100 point scale) (1) | 72 | | 72 | | 74 |
| Recordable Injuries (#) | 54 | | 38 | | 0 |
Note
(1) A new vendor was used to facilitate the Engagement and Inclusion Survey in 2020; therefore, weightings and results may vary when comparing 2020 to 2019.
See also Item 7, Management's Discussion and Analysis of Financial Condition and Results of Operations – Business and Mission – TVA's Mission of Service for a discussion of TVA's mission, strategic priorities, and linking the mission to performance through corporate measures.
ITEM 1A. RISK FACTORS
The risk factors described below, as well as the other information included in this Annual Report on Form 10-K for the fiscal year ended September 30, 2023 (the "Annual Report"), should be carefully considered. Risks and uncertainties described in these risk factors could cause future results of TVA operations to differ materially from historical results as well as from the results anticipated in forward-looking statements. Although the risk factors described below are the ones that TVA considers material, additional risk factors that are not presently known to TVA or that TVA presently does not consider material may also impact TVA's business operations. See Forward Looking Information above for a description of some matters that could affect the below risks or generate new risks. The occurrence of any of the following could have a material adverse effect on TVA's cash flows, results of operations, andor financial condition.
For ease of reference, the risk factors are presented in nineeight categories: (1) COVID-19 related risks; (2) regulatory, legislative, and legal risks; (2) cybersecurity and information technology risks; (3) operational risks; (4) financial, economic, and market risks; (5) human capital and management risks; (6) risks related to the environment and catastrophic events; (5) cybersecurity risks; (6) financial, economic, and market risks; (7) human capital and management risks; (8) accounting and financial reporting risks; and (9)(8) general business risks.risk factors.
COVID-19 RELATED RISKS
The COVID-19 pandemic has and may continue to adversely affect TVA's business, financial condition, and results of operations.
The COVID-19 pandemic has and may continue to adversely affect TVA's business, financial condition, and results of operations. To date, the COVID-19 pandemic has resulted in and may continue to result in reduced revenues due to customers curtailing operations to reduce the spread of the outbreak, including quarantines, closures, or reduced operations of businesses or other institutions and the deferral of revenues under programs offered by TVA to its local power company customers to offset the impact of customers' inability to pay during the outbreak. TVA estimates base revenues were reduced by approximately $185 million for the year ended September 30, 2020. TVA expects the COVID-19 pandemic to continue impacting revenue for 2021 and has planned for reduced operating revenues. It is uncertain at this time the extent to which TVA's revenues may be impacted beyond 2021. See Item 7, Management's Discussion and Analysis of Financial Condition and Results of Operations — Results of Operations — Financial Results — Operating Revenues.
TVA could be further adversely affected by the impact of the COVID-19 pandemic on the economy and financial markets, including a prolonged recession and continued volatility in interest rates, commodity prices, investment performance, and foreign currency exchange rates. TVA has experienced fluctuations related to its pension plan assets and other investment portfolios during the year ended September 30, 2020. The ultimate impact of the COVID-19 pandemic on the pension plan and other investments depends on factors beyond TVA's knowledge or control. A long-term recession could impact access to capital and have other long-term negative effects on operations.
In addition, TVA's operations could be impacted by, among other things, social distancing to prevent illness from spreading within the workforce; travel restrictions; the availability of the workforce to perform essential functions; and the unavailability of fuel or critical parts, supplies, or services due to transportation restrictions and the shutdown, slowdown, or inability to meet contractual requirements of suppliers or other vendors in TVA's supply chain. In addition, the continued spread of the COVID-19 pandemic could adversely impact TVA's ability to develop, construct, and operate facilities; could delay or prevent the completion of projects; and could lead to impairments of TVA's long-lived assets and accounts and loans receivable.
To address specific aspects of the COVID-19 pandemic, TVA has implemented a company-wide pandemic plan, including limiting non-essential travel and mandatory telework for those who do not have to be physically present at a TVA facility or office building; implementing strong physical and cyber-security measures; keeping certain developed recreation areas closed; actively monitoring generation, transmission, and distribution functions; and maintaining an increased cash reserve; however, it is possible that these measures will not be successful in mitigating the impact of the outbreak. At this time, operations and delivery of energy to customers have not been materially impacted.
The extent to which the COVID-19 pandemic will impact TVA's business, financial condition, and results of operations is uncertain and will depend on numerous evolving factors beyond TVA's knowledge or control including, among other things, the duration and severity of the outbreak, actions taken to contain its spread and mitigate its effects, and the broader impact of the COVID-19 pandemic on the country and region's economy. However, TVA reasonably anticipates that a prolonged outbreak could have a material adverse impact on its business, financial condition, and results of operations, and could require TVA to change how it conducts certain operations, takes power under certain agreements, or dispatches its own facilities.
See Item 7, Management's Discussion and Analysis of Financial Condition and Results of Operations — Key Initiatives and Challenges — Coronavirus Pandemic for an expanded discussion of the impact to TVA and related initiatives.
REGULATORY, LEGISLATIVE, AND LEGAL RISKS
New laws, regulations, or administrative or executive orders, or congressional actions or inactions, may negatively affect TVA's cash flows, results of operations, and financial condition, as well as the way TVA conducts its business.
Because TVA is a corporate agency and instrumentality established by federal law, it may be affected by a variety of laws, regulations, and administrative or executive orders that do not affect other electric utilities. For example, federal legislation may expand or reduce TVA's activities, change its governance structure, require TVA to sell some or all of the assets that it operates, require TVA to take certain other operational or regulatory actions, reduce or eliminate the U.S.'s ownership of TVA, or even liquidate TVA. Additionally, Congress could act, or fail to take action, on various issues that may result in impacts to TVA, including but not limited to action or inaction related to the national debt ceiling or automatic spending cuts in government programs. Furthermore, administrative or executive orders could cause TVA to change the way it conducts its business.
Although it is difficult to predict exactly how new laws, regulations, or administrative or executive orders or congressional action or inaction may impact TVA, some of the possible effects are described below.
TVA may become subject to additional environmental regulation.
New environmental laws, regulations, or orders may become applicable to TVA or the facilities it operates, and existing environmental laws or regulations may be revised or reinterpreted in a way that adversely affects TVA, including substantially increasing TVA's cost of operations or requiring significant capital expenditures. Possible areas of future laws or regulations include, but are not limited to, GHGs, CCR, ELGs, water quality, renewable energy portfolio standards, and natural gas production and transmission. See Item 1, Business – Environmental Matters – Water Quality Control Developments for a discussion of the EPA's new effluent limitation guidelines and Item 1, Business – Environmental Matters – Cleanup of Solid and Hazardous Wastes – Coal Combustion Residuals for a discussion of recent revisions to the EPA's CCR rule. Litigation may affect the timing and requirements of new regulatory proposals, and may indirectly affect TVA, even if TVA is not involved.
TVA's ability to control or allocate funds could be restricted.
Other federal entities may attempt to restrict TVA's ability to access or control its funds that are on deposit in TVA's account in the U.S. Treasury. For example, should the U.S. Treasury approach its debt ceiling, the U.S. Treasury might, as part of an effort to control cash disbursements, attempt to require TVA to receive approval before disbursement of funds from TVA's U.S. Treasury account. Additionally, the OMB might, in the event that automatic spending cuts go into effect, attempt to require TVA to reduce its budget by a specified percentage (although the legal applicability of such a situation to TVA would depend upon the wording of the legislation making the automatic spending cuts). Such attempts to restrict TVA's ability to control or allocate funds in those specific types of situations could adversely affect its cash flows, results of operations, and financial condition, its relationships with creditors, vendors, and counterparties, the way it conducts its business, and its reputation.
TVA may lose its protected service territory.
TVA's service area is defined primarily by provisions of law and long-term contracts. The fence limits the region in which TVA or LPCs which distribute TVA power may provide power. The anti-cherrypicking provision precludes FERC from ordering TVA to transmit power for others if that power would be consumed within the TVA service area. State service territory laws limit unregulated third parties' ability to sell electricity to consumers. All current wholesale power contracts between TVA and LPCs are all requirements contracts; however, Flexibility Agreements available to LPCs that have executed long-term contracts with TVA allow LPCs to locally generate up to approximately five percent of average total hourly energy sales over the prior five years to meet their individual customers' needs. In addition, other utilities may use their own transmission lines to serve customers within TVA's service area, and third parties are able to avoid the restrictions on serving end-use customers by selling or leasing generating assets to a customer rather than selling electricity.
From time to time, there have been efforts to circumvent the protection of the anti-cherrypicking provision. In addition, the protections afforded by the anti-cherrypicking provision could be limited or perhaps eliminated by federal legislation at some time in the future. If FERC were to limit the application of the anti-cherrypicking provision or if federal legislation were to eliminate or limit the application of the anti-cherrypicking provision, TVA could more easily lose customers that it could not replace within its specified service area due to the fence. The loss of these customers could adversely affect TVA's cash flows, results of operations, and financial condition.
The TVA Board may lose its sole authority to set rates for electricity.
Under the TVA Act, the TVA Board has the sole authority to set the rates that TVA charges for electricity, and these rates are not subject to further review. If the TVA Board loses this authority or if the rates or the ratemaking process become subject to external review, there could be material adverse effects on TVA including, but not limited to, being unable to set rates at a level sufficient to generate adequate revenues to service TVA's financial obligations, properly operate and maintain its assets, and provide for reinvestment in its power program and becoming subject to additional regulatory oversight that could impede its ability to adapt its business to changing circumstances.
TVA may lose responsibility for managing the Tennessee River system.
TVA's management of the Tennessee River system is important to effectively operate its power system. TVA's ability to integrate management of the Tennessee River system with power system operations increases power system reliability and reduces costs. Restrictions on how TVA manages the Tennessee River system could negatively affect its operations, change the way it conducts such operations, or increase costs.
TVA may lose responsibility for managing real property currently under its control.
TVA's management of real property containing power generation and transmission structures as well as certain reservoir shorelines is important for navigation, flood control, and the effective operation of the power system. Restrictions on or the loss of the authority to manage these properties could negatively affect TVA's operations, change the way it conducts such operations, or increase costs.
Existing laws, regulations, and orders may negatively affect TVA's cash flows, results of operations, and financial condition, as well as the way TVA conducts its business.
TVA is required to comply with comprehensive and complex laws, regulations, and orders. The costs of complying with these laws, regulations, and orders are expected to be substantial, and costs could be significantly more than TVA anticipates, especially in thewith respect to environmental and nuclear areas.compliance. In addition, TVA is required to obtain numerous permits and approvals from governmental agencies that regulate its business, and TVA may be unable to obtain or maintain all requireddesired regulatory approvals. If there iswere a delay in obtaining requireddesired regulatory approvals or if TVA failswere to fail to obtain or maintain any approvals or to comply with any law, regulation, or order, TVA may have to change how it operates certain assets, may be unable to operate certain assets, or may have to pay fines or penalties if it continuesfor continuing to operate the assets.
TVA is involved in various legal and administrative proceedings whose outcomes may affect TVA's finances and operations.
TVA is involved in various legal and administrative proceedings and is likely to become involved in additional proceedings Any resulting changes in the future in the ordinary course of business or as a result of, among other things, catastrophic events or environmental conditions at TVA property or areas where TVA has disposed of materials or property. The additional proceedings could involve, among other things, challenges to TVA's CCR facilities, nuisance suits involving TVA's coal-fired plants, and challenges to TVA's authority to set rates and enter into contracts. Although TVA cannot predict the outcome of the individual mattersmanner in which TVA is involved or will become involved, the resolution of these mattersconducts its business could require TVA to make substantial additional capital expenditures in excess of established reservesor abandon certain projects and in amounts that could have a material adverse effect on TVA's cash flows, results of operations, and financial condition. Similarly, resolution of any such proceedings may require TVA to change its business practices or procedures, change how it operates its coal-fired units, reduce emissions to a greater extent than TVA had planned, close existing CCR facilities sooner than planned, build new CCR facilities sooner than planned, build new CCR facilities that were not planned, cease operation of some coal-fired units, adjust its rates, or terminate or modify contracts. These events could also have a material adverse effect on TVA's cash flows, results of operations, and financial condition. For a discussion of certain current material legal proceedings, see Item 7, Management's Discussion and Analysis of Financial Condition and Results of Operations — Key Initiativesand Challenges and Note 22 — Contingencies and Legal Proceedings — Legal Proceedings.
TVA is largely restricted to a defined service area.
TVA's ability to expand its customer base is constrained by its inability to pursue new customers outside its service area. Accordingly, reductions in demand have to be offset by such actions as reducing TVA's internal costs or increasing rates. Any failure of such measures to fully offset the reduced demand for power may negatively affect TVA's cash flows, results of operations, and financial condition.
TVA may become subject to additional NERC requirements.
TVA is subject to federal reliability standards that are set forth by NERC and approved by FERC. TVA recognizes that reliability standards and expectations continue to become more complex and stringent for transmission systems. Currently there are approximately 90 mandatory standards subject to enforcement containing approximately 1,300 requirements and sub-requirements that must be met. Complying with these or additional requirements set forth by NERC may require significant capital expenditures and may negatively affect TVA's cash flows, results of operations, and financial condition.
TVA could be divested by the federal government or be required to sell some or all of its assets.
From time to time, presidential administrations have suggested that the federal government should either divest TVA or require TVA to sell some or all of its assets, including its transmission system. Either event could trigger change of control provisions in certain material contracts or covenants in TVA's bond documents that concern the sale or disposal of a substantial portion of TVA's power properties. TVA may, among other things, be required to pay off debt more quickly than anticipated and be unable to access credit facilities. Additionally, the loss of the transmission system could interfere with TVA's operations and require TVA to contract for the transmission of electricity to TVA customers. These factors could negatively affect TVA's operations, change the way it conducts such operations, and increase costs.
TVA's governmental status may interfere inwith its ability to quickly respond to the needs of its current or potential customers or to act solely in the interest of its ratepayers.
As a quasi-governmentalgovernmental entity, TVA has certain legal requirements that prevent it from responding as quickly to potential changes in the market or requests from current or potential customers as might be desired or in comparison to other utilities. For example, TVA is required to comply with the National Environmental Policy Act ("NEPA"), which requires environmental reviews to be performed in connection withcompleted before TVA decides to pursue certain projects. The delay in responding to requests could damage relationships with current customers, deter potential customers from moving into TVA's service territory, or damage TVA's reputation.
In addition, TVA's nature as a quasi-governmentalgovernmental entity imposes additional pressures that most companies do not face, such asincluding most significantly the requirementrequirements to support economic development, simultaneously manage a river system for commerce, recreation, flood control, and power generation, and promote recreational opportunities.opportunities within its service territory.
TVA funds these operations almost entirely from the sale of electricity. In addition, TVA must balance these obligations with the requirement to provide power at the lowest feasible rates. If TVA does not adequately communicate how it fulfills its various missions and the value it provides, its reputation may be harmed, which may result in political pressure to change its nature or operations as well as in the loss of public support.
TVA is involved in various legal and administrative proceedings, the outcomes of which may affect TVA's finances and operations.
TVA is involved in a wide range of legal and administrative proceedings and is likely to become involved in future additional proceedings in the ordinary course of business or as a result of, among other things, catastrophic events or environmental conditions arising from TVA property or areas where TVA has disposed of materials or property. The additional proceedings could involve, among other things, challenges to TVA’s CCR facilities, challenges to TVA's natural gas-fired plants and related pipelines, nuisance suits involving TVA’s coal-fired plants, challenges to the anti-cherrypicking provision, challenges under NEPA, challenges under the Freedom of Information Act, and challenges to TVA’s authority to set rates and enter into contracts. Although TVA cannot predict the outcome of the individual matters in which TVA is involved or will become involved, the resolution of these matters could require TVA to make expenditures in excess of established reserves and in substantial amounts. Similarly, resolution of any such proceedings may require TVA to change its business practices or procedures, incur additional capital or operational expense, change how it operates its fossil-fueled units, cease construction of new natural gas-fired plants, reduce
emissions to a greater extent than TVA had planned, close existing CCR facilities sooner than planned, close existing CCR facilities using a different methodology than planned, build new CCR facilities sooner than planned, build new CCR facilities that were not planned, cease operation of some coal-fired units, adjust its rates, or terminate or modify contracts. These events individually or in the aggregate could have a material adverse effect on TVA’s cash flows, results of operations, and financial condition. For a discussion of certain current material legal proceedings, see Part II, Item 7, Management's Discussion and Analysis of Financial Condition and Results of Operations — Key Initiativesand Challenges and Note 22 — Commitments and Contingencies — Legal Proceedings.
New laws, regulations, or administrative or executive orders, or congressional actions or inactions, may negatively affect TVA's cash flows, results of operations, and financial condition, as well as the way TVA conducts its business in ways that are different from most other utilities.
Because TVA is a corporate agency and instrumentality established by federal law, it may be affected by a variety of laws, regulations, and administrative or executive orders that do not directly apply to other electric utilities and may be subject to potential stakeholder activism. For example, federal legislation may expand or reduce TVA's activities, change its governance structure, require TVA to sell some or all of the assets that it operates, require TVA to take certain other operational or regulatory actions, reduce or eliminate the United States' ownership of TVA, or even liquidate TVA. Congress could act, or fail to take action, on various issues that may impact TVA, including but not limited to action or inaction related to the national debt ceiling or automatic spending cuts in government programs. Furthermore, federal administrative or executive orders could induce TVA to change the way it conducts its business. See Item 1, Business — Environmental Matters — Climate Change — Executive Actions for a discussion of recent executive actions regarding climate change.
Although it is difficult to predict new laws, regulations, or administrative or executive orders, or congressional action or inaction, or how such laws, regulation, orders, actions, or inactions may impact TVA, some of the possible effects are described below.
TVA could lose its protected service territory.
TVA’s service area is defined primarily by provisions of law and long-term contracts. The fence limits the region in which TVA or LPCs that distribute TVA power may provide power. The anti-cherrypicking provision precludes FERC from ordering TVA to transmit power for others if that power would be consumed within the TVA service area. State service territory laws limit unregulated third parties’ ability to sell electricity to consumers. From time to time, there have been efforts to circumvent the protection of the anti-cherrypicking provision. In addition, the protections afforded by the anti-cherrypicking provision conceivably could be affected by future federal legislation. If FERC were to limit the application of the anti-cherrypicking provision or if federal legislation were to eliminate or limit the application of the anti-cherrypicking provision without corresponding legislative modifications to the territorial limitations imposed by the fence, TVA's ability to respond to any resulting customer attrition would be constrained. Because TVA's ability to expand its customer base is constrained by the fence, reductions in demand have to be offset by such actions as reducing TVA’s internal costs or increasing rates. Any failure of such measures to fully offset the reduced demand for power may negatively affect TVA’s cash flows, results of operations, and financial condition.
TVA may become subject to additional environmental regulation.
New environmental laws, regulations, or orders may become applicable to TVA or the facilities it operates, and existing environmental laws or regulations may be revised or reinterpreted in a way that adversely affects TVA. For example, the EPA has recently interpreted its CCR Rule in a way that could create significant additional costs with implementing closure-in-place. This interpretation, as well as other interpretations, laws, regulations, or orders, could substantially increase TVA's cost of operations, prompt the early retirement of generation facilities, require significant capital expenditures, or cause TVA to change its methodology for closing CCR facilities. Possible areas of future laws or regulations include, but are not limited to, GHGs, CCR, ELGs, water quality, air quality, renewable energy portfolio standards, and natural gas production and transmission. See Item 1, Business — Environmental Matters — Clean Air Act Programs and Regulations for a discussion of the EPA's proposed greenhouse gas emission standards and guidelines, Item 1, Business — Environmental Matters — Water Quality Control Developments for a discussion of the EPA's proposed effluent limitation guidelines, Item 1, Business — Environmental Matters — Cleanup of Solid and Hazardous Wastes — Coal Combustion Residuals for a discussion of proposed revisions to the EPA's CCR Rule, and Item 1, Business — Environmental Matters — Climate Change — Executive Actions for a discussion of recent executive actions regarding climate change. Litigation may affect the timing and requirements of new regulatory proposals or may indirectly affect TVA, potentially even when TVA is not involved. Failure to comply with environmental requirements can result in enforcement actions and litigation, which can lead to the imposition of significant civil liability, including fines and penalties, criminal sanctions, and/or temporary or permanent closure of non-compliant facilities.
TVA may become subject to additional NERC requirements.
TVA is subject to federal reliability standards that are set forth by NERC and approved by FERC. TVA recognizes that reliability standards and expectations continue to become more complex and stringent for transmission systems. If TVA fails to comply with the mandatory reliability standards, TVA could be subject to increased compliance obligations. Complying with these or additional requirements set forth by NERC may require significant capital expenditures and may negatively affect TVA's cash flows, results of operations, and financial condition.
TVA could become subject to other federal legislation aimed specifically at curtailing TVA’s activities.
In addition to potential adverse impacts from changes to more general laws and regulations, because of TVA’s federal-entity status, TVA could become subject to laws or other restraints specifically aimed at TVA, including but not limited to the following examples.
Divestment or Forced Sale of TVA Assets. From time to time, federal officials have suggested that the federal government should either divest TVA or require TVA to sell some or all of its assets, including its transmission system. Either event could trigger change of control provisions in certain material contracts or covenants in TVA’s bond documents that concern the sale or disposal of a substantial portion of TVA’s power properties. See Item 2, Properties — Disposal of Property. TVA may then, among other things, be required to pay off debt more quickly than anticipated, be unable to access credit facilities, or both. Additionally, the loss of the transmission system could interfere with TVA’s operations and require TVA to contract for the transmission of electricity to customers, likely at a higher cost. These factors could negatively affect TVA’s operations, change the way it conducts such operations, and increase costs.
Restriction on TVA Accessing or Controlling Its Funds. Other federal entities may attempt to restrict TVA’s ability to access or control its funds that are on deposit in TVA’s account in the U.S. Treasury. For example, should the U.S. Treasury approach its debt ceiling, the U.S. Treasury might, as part of an effort to control cash disbursements, attempt to require TVA to receive approval before disbursement of funds from TVA’s U.S. Treasury account. Additionally, the OMB might, in the event that automatic spending cuts go into effect, attempt to require TVA to reduce its budget by a specified percentage (although the legal applicability of such a situation to TVA would depend upon the specific legislation making the automatic spending cuts). Such attempts to restrict TVA’s ability to control or allocate funds could adversely affect TVA’s cash flows, results of operations, financial condition, business relationships, the way it conducts its business, and its reputation.
Loss of TVA’s Sole Authority to Set Rates. Under the TVA Act, the TVA Board has the sole authority to set the rates that TVA charges for electricity, and these rates are not subject to further regulation. This authority provides the TVA Board the flexibility to set rates at a level sufficient to generate adequate revenues to service TVA’s financial obligations, properly operate and maintain its assets, and provide for reinvestment in its power program. If the TVA Board were to lose this authority, or if such authority were to be restricted, such as through becoming subject to an external review process or other regulatory oversight, such an occurrence could result in material adverse impacts on TVA’s ability to meet financial obligations, operate its system in a manner that it considers most efficient or appropriate, or adapt its business to changing circumstances, and could potentially result in stranded costs.
Loss of TVA’s Authority to Manage the Tennessee River System. TVA’s management of the Tennessee River system helps TVA effectively operate its power system. TVA’s ability to integrate management of the Tennessee River system with power system operations increases power system reliability and reduces costs. Restrictions on how TVA manages the Tennessee River system could negatively affect its operations or increase costs.
Lowering of TVA’s Debt Ceiling. The TVA Act provides that TVA may issue Bonds in an amount not to exceed $30.0 billion outstanding at any time. On September 30, 2023, TVA had $19.5 billion of Bonds outstanding (not including non-cash items of foreign currency exchange gain of $109 million, unamortized debt issue costs of $41 million, and net discount on sale of Bonds of $85 million). Future federal legislation could lower TVA’s debt ceiling or broaden the types of financial instruments that are covered by the ceiling, thus inhibiting TVA’s ability to raise capital necessary for essential business functions or for investing in carbon free technologies.
Loss or Limitation of TVA’s Authority to Manage Real Property Currently Entrusted to TVA. TVA’s management of real property containing power generation and transmission structures, as well as that consisting of reservoir shorelines, is important for the effective operation of the power system. Restrictions on or the loss of the authority to manage these properties could negatively affect TVA’s operations or increase costs.
CYBERSECURITY AND INFORMATION TECHNOLOGY RISKS
TVA’s facilities and information infrastructure may not operate as planned due to cyber threats to TVA’s assets and operations.
TVA’s operations are heavily computerized and include assets such as information technology and networking systems. As with all industries, the reliance on computerization and networking makes TVA a target for cyber attacks, and the risk of such attacks may increase as individual devices and equipment become accessible via the internet. TVA has been targeted by cyber attacks in the past and anticipates that it will be targeted in the future. These attacks may have been carried out, or in the future could be carried out, by individuals, groups, or nation states. TVA employs extensive cyber safeguards and works with industry specialists and relevant governmental authorities to deter, stop, or mitigate cyber attacks. Despite implementation of these security measures, TVA's facilities and information infrastructure may be subject to or vulnerable to disability, failures, or unauthorized access. Furthermore, as technology becomes more prevalent in energy infrastructure, TVA's infrastructure may be subject to increased cyber vulnerability in the future. Cyber attacks could come through one or more of a number of means, such as computer viruses, malicious or destructive code, phishing attacks, denial of service attacks, or ransomware. Cyber attacks may result in security breaches that may be detrimental to TVA's operations, including third parties' improperly accessing TVA's system and demanding ransom based on threats to expose sensitive data, including data from employees, customers, and financial parties, to gain operational control, or to expose security vulnerabilities specific to TVA’s facilities. In such a case, a cyber attack could compromise sensitive data, significantly disrupt operations, require additional expenditures for cybersecurity, negatively affect TVA’s cash flows, results of operations, financial condition, and reputation, and pose health and safety risks to TVA personnel and the customers and communities that TVA serves.
Because the investigation of any cybersecurity breach is inherently unpredictable and would require substantial time to complete, TVA may not be able to quickly remediate the consequences of any breach, which may increase the costs and enhance the negative consequences associated with a breach. Additionally, the theft, damage, or improper disclosure of sensitive data may subject TVA to penalties and claims from third parties or increased government oversight.
Cyber attacks on third parties or the failure of their technology infrastructure could interfere with or harm TVA.
Many third parties on which TVA relies for services, including for transferring funds to non-TVA entities or receiving delivery of products in the ordinary course of business, are heavily computerized and use assets such as information technology and networking systems. These providers' systems are susceptible to cybersecurity and data breaches and outages from fire, floods, power loss, telecommunications failures, physical attack, and similar events. If any of these third parties were to experience interferences from cyber attacks or significant system failures or outages, which events have occurred in the past and may occur again in the future, the services they provide TVA could be disrupted. This disruption could interfere with TVA’s ability to perform its obligations to others, transfer funds, obtain fuel or critical parts, supplies, or services, or make payments, which in turn could negatively affect TVA’s cash flows, results of operations, financial condition, and reputation. Additionally, the theft, damage, or improper disclosure of sensitive data held by these third parties may subject TVA to further harm. See Part II, Item 7, Management's Discussion and Analysis of Financial Condition and Results of Operations — Key Initiativesand Challenges — Safeguarding Assets — Cybersecurity for a discussion of recent cyber attacks on third parties.
The failure of TVA’s information technology systems could have adverse consequences to TVA.
TVA’s operations are dependent upon the proper functioning of its internal systems, including the information technology systems that support TVA’s underlying business processes. Any significant failure or malfunction of such information technology systems may result in disruptions of TVA’s operations. TVA relies on information technology systems, including the internet and cloud systems, to support a variety of business processes and activities and to store sensitive data. Some of TVA’s information technology systems may be dependent upon cloud service providers. These providers’ systems are susceptible to cybersecurity and data breaches and outages from fire, floods, power loss, telecommunications failures, security violations, and similar events. Failure to prevent or mitigate data loss from system failures or outages could materially affect the results of operations, financial condition, and cash flows of TVA.
The emergence of artificial intelligence technology could harm TVA.
TVA’s sensitive information may be subject to improper disclosure or fabrication by artificial intelligence (“AI”) and machine learning technologies on systems external to TVA, leading to compromises in cybersecurity. AI and machine learning technology may also be flawed, and data sets used in generative AI may be insufficient or contain biased, incorrect, or incomplete information. Additionally, the lack of governance and regulatory requirements for AI systems may make it difficult for TVA to create compliance standards for employee AI usage and may make the intellectual property ownership and license rights to certain information unclear. TVA could suffer reputational damage or face operational challenges as a result of any inconsistencies or flaws in the application of AI or machine learning technology.
OPERATIONAL RISKS
TVA may incur delays and additional costs in its major projects or may be unable to obtain necessary regulatory approval.approval for them.
Among other projects, TVA is improvingbuilding new natural gas-fired generation facilities, seeking to improve the reliability and resiliency of its transmission system, undertaking repairs at certain hydroelectric facilities and dams, and closing some coal-fired plants and their supporting infrastructure. These activities involve risks of overruns in the cost of labor and materials, as well as riskspotential delays, in beginning or completing these repairs, closures, or other projects. Further cancellation or delay of scheduleprojects related to these activities may adversely affect TVA's cash flows, financial condition, and results of operations. Such cancellation or delays which may result from, among other things, changes in market conditions, changes in laws or regulations, lack of productivity, human error, supply chain challenges, regional health emergencies, and the failure to schedule activities properly. In addition, if TVA does not or cannotproperly, TVA's inability to obtain the necessary regulatory approvals or licenses, is otherwise unable to complete the development or construction of a facility, decidesTVA's decision to cancel construction of a facility incursor cancel another type of project, including due to delays, or cost overruns, or changes in connection with constructing a facility,customer preferences, or is requiredchanges in requirements applicable to change how it will conductTVA conducts construction, repair, or closure activities, TVA's cash flows, financial condition, and results of operations could be negatively affected.activities. Further, if projects are not completed according to specifications, TVA may suffer, among other things, delays in receiving licenses, reduced plant efficiency, reduced transmission system integrity and reliability, and higher operating costs.
TVA's determination of the appropriate mix of generation assets is based on assumptions that may prove inaccurate.
TVA may not be able to operate one or morehas determined that its power generation assets should consist of a mix of nuclear, coal-fired, natural gas-fired, and renewable power sources, including hydroelectric. In making this determination, TVA took various factors into consideration, including the anticipated availability of its nuclear units, the availability of non-nuclear facilities, the forecasted cost of natural gas and coal, the forecasted demand for electricity, its carbon reduction aspirations, and environmental compliance including the expense of adding air pollution controls to its coal-fired units. If any of these assumptions materially change or are impacted by subsequent events, TVA's generation mix may not address its operational needs in the most efficient and cost-effective manner. Additionally, reallocating the mix of power units.
Should issues develop withgeneration assets from the planned mix may result in additional capital and operational expense. Furthermore, achieving TVA's nuclearcarbon reduction aspirations may require TVA to make significant capital investments, including investments in new technologies. TVA may retire coal-fired and natural-gas fired generation facilities sooner than planned in order to meet carbon reduction aspirations, which also may require significant capital expenditures or additional power units that TVA is unable to correct, TVA might voluntarily shut down one or more units or be ordered to do so by the NRC. Returning the unit(s) to operation could be a lengthy and expensive process, or might not be possible dependingpurchases, potentially causing an adverse effect on circumstances. In either case, TVA's cash flows, results of operations, financial condition, and reputationreputation.
TVA may not be negatively affected.able to meet its carbon reduction aspirations, which may result in additional capital expenditures or higher operating expense.
The achievement of TVA's carbon reduction aspirations, and its ability to maintain system reliability during the transition to cleaner forms of energy, is subject to numerous risks beyond TVA's control that are difficult to predict and may prevent TVA from timely achieving such aspirations. Occurrences that may prevent TVA from achieving its carbon reduction aspirations in a timely manner include, but are not limited to, the following:
•TVA may not receive timely approval from federal and state regulators for construction and operation of new natural gas assets and attendant infrastructure (e.g., pipelines).
•TVA may have difficulty obtaining resources or labor needed to complete projects on time and within budget.
•Legal challenges may slow or restrict TVA's ability to replace coal generation with cleaner forms of energy. These challenges may, for instance, come in the form of direct legal challenges to TVA projects or through challenges to TVA's environmental reviews or TVA's attempts to obtain necessary licenses and permits.
•Potential delays in projects, along with now-anticipated load growth, may force TVA to rely on coal-fired generation more heavily, or longer, than it had previously projected.
•As to TVA's longer term carbon reduction aspirations, the development of new technology necessary to meet these aspirations may not occur as quickly, feasibly, or cost-effectively as necessary.
•TVA's unique federal least-cost planning obligations may prevent TVA from moving forward with carbon-free generation as quickly as utilities that do not have the same requirements.
Operating nuclear units subjects TVA to nuclear risks and may result in significant costs that adversely affect its cash flows, results of operations, and financial condition.units.
TVA has seven operating nuclear units. RisksUnique risks associated with these units include the following:
NuclearHazard Risks. AHazards exist with the use of radioactive material in energy production, including management, handling, storage, and disposal. Further, a nuclear incident at one of TVA's facilities could have significant consequences including loss of life, damage to the environment, damage to or loss of the facility, and damage to non-TVA property. Although TVA carries certain types of nuclear insurance, the amount that TVA is required to pay in connection with a nuclear incident could significantly exceed the amount of coverage provided by insurance. The licensee of each nuclear reactor has a contingent obligation to pay a retrospective premium, equal to its proportionate share of the loss in excess of the primary level, regardless of proximity to the incident of fault, up to a maximum of approximately $138 million per reactor, per incident. With TVA's seven reactors, the maximum total contingent obligation per incident is $963 million. This retrospective premium is payable at a maximum rate
currently set at approximately $20 million per year, per incident, per reactor. Any such nuclearIn addition, following an incident could also negatively affect TVA by, among other things, obligating TVAmay have to pay retrospective insurance premiums, reducingand may experience a reduction in the availability and affordability of nuclear insurance, increasingan increase in the cost of nuclear insurance, an increase in the costs of operating nuclear units, or leading to increased regulation or restrictionrestrictions on the construction, operation, and decommissioning of nuclear facilities. Moreover, federal legislation could impose revenue-raising measures on the nuclear industry to pay claims exceeding the limit for a single incident under the Price-Anderson Act. Further, the availability or price of insurance may be impacted by TVA's acts or omissions, such as a failure to properly maintain a facility, or events outside of TVA's control, such as an equipment manufacturer's inability to meet a guideline, specification, or requirement.
Decommissioning Costs. TVA maintains a Nuclear Decommissioning Trust ("NDT") for the purpose of providing funds to decommission its nuclear facilities. The NDT is invested in securities generally designed to achieve a return in line with overall equity and debt market performance. See Note 16 — Fair Value Measurements — Investment Funds for the NDT balance at September 30, 20202023. TVA might have to make unplanned contributions to the NDT if, among other things:
•The value of the investments in the NDT declines significantly or the investments fail to achieve the assumed real rate of return;
•The decommissioning funding requirements are changed by law or regulation;
•The assumed real rate of return on plan assets, which is currently five percent, is lowered by the TVA Board or is overly optimistic;
•The actual costs of decommissioning are more than planned;
•Changes in technology and experience related to decommissioning cause decommissioning cost estimates to increase significantly;
•TVA is required to decommission a nuclear plant sooner than it anticipates; or
•The NRC guidelines for calculating the minimum amount of funds necessary for decommissioning activities are significantly changed.
If TVA makeswere to have to make additional contributions to the NDT, the contributions may negatively affect TVA's cash flows, results of operations, and financial condition.
Increased RegulationRegulatory Risks. The NRC has broad authority to adopt regulations related to the licensing, operating, and decommissioning of nuclear generation facilities and may adopt regulations as a result of events that occur at nuclear facilities in the U.S. or throughout the world, such as the events that occurred at Fukushima.Fukushima in 2011. These regulations can result in significant restrictions or requirements on TVA. For example, supplementary NRC rulemaking has been developed to mitigate beyond-design basis flooding and seismic events. To comply with existing, new, or modified regulations, TVA may be required to make substantial capital expenditures at its nuclear plants or make substantial contributions to the NDT. In addition, if TVA failswere to fail to comply with requirements promulgated by the NRC, the NRC has the authority to impose fines, shut down units, or modify, suspend, or revoke TVA's operating licenses. Moreover, the NRC may not approve future requests from TVA to extend the operating licenses for its nuclear units.
Waste Disposal. TVA's nuclear operations produce various types of nuclear waste materials, including spent fuel. TVA has been storing the spent fuel in accordance with NRC regulations in anticipation that a final storage site for all such waste will be developed and put in operation by the U.S. government. If no such site is forthcoming or if no alternative disposal or reuse plan iswere developed, then TVA might be required to arrange for the safe and permanent disposal of the spent fuel itself. Such a requirement would cause TVA to incur substantial expense, including substantial capital expenditures, and could cause TVA to change how it operates its nuclear plants.
Availability of Components. Nuclear facilities require specialized components and access to intellectual property for operation. As the number of reliable suppliers of such components decreases and access to intellectual property is reduced, the availability of the components and access to the intellectual property also will also likely decrease. If TVA iswere unable to secure either the original components, intellectual property, or replacements approved for use by the NRC, TVA might have to change how it conducts its operations.operations, which may result in substantial expense. Further, limitations on global trade resulting from the Coronavirus Disease 2019 ("COVID-19") or limitations on global shipping could materially decrease the availability or increase the cost of necessary or desired equipment.
TVA may not be able to operate one or more of its nuclear power units.
If operating issues were to develop with certain TVA nuclear power units that were not correctable, TVA may choose to shut down one or more units or be ordered to do so by the NRC. Returning the unit(s) to operation could be a lengthy and expensive process, or might not be feasible depending on circumstances. In either case, TVA's cash flows, results of operations, financial condition, and reputation may be negatively affected. Not being able to operate all of TVA's nuclear units may cause TVA to rely more on forms of generation that produce more carbon, thus making it more difficult for TVA to meet its carbon reduction aspirations or meet reliability goals.
TVA's management and operation of CCR facilities exposesexpose it to additional costs and risks.
TVA operates coal-fired units which produce CCR as byproducts of the power production process. TheTVA contains its CCR is contained withinin dedicated facilities operated by TVA. TVA has closed some of these facilities in compliance with state and federal laws and is in the process of closing others. Many of these facilities do not have liners, as they were constructed prior to the requirement that such facilities be built with liners and thus do not contain such liners. TVA has been ordered by TDEC to undertake investigations at all CCR facilities in Tennessee. TVA has also been involved in litigation related to certain CCR facilities, and to resolve one such lawsuit, TVA agreed to remove or beneficially reuse somesignificant amounts of CCR material at Gallatin Fossil Plant ("Gallatin"). TVA could be subject to similar litigation or orders in the future and could be required to restrict or stop the use of some or all CCR facilities that were not required to be closed by the CCR Rule or relocate CCR material to lined facilities. Further, TVA has decided to move all CCR material at Allen Combined CycleFossil Plant ("Allen CC") rather than closing the CCR facilities in place as originally planned, whichand moving the CCR material subjects TVA to additional costs and transportation-related risks. TVA may change its closure plans at other facilities depending on the particular facts of each situation andas well as new laws, regulations, orders, or interpretations, such as the EPA's recent interpretation of its CCR Rule that could create significant additional costs with implementing closure, subject to the completion of any required environmental investigations or studies.studies and any required approval of appropriate state regulators. The ultimate resolution of matters relating to CCR obligations could have a material adverse effect on TVA's cash flows, results of operation, and financial condition.
TVA's facilities and operations may be damaged or interfered with by physicalPhysical attacks, threats, or other interference.interference could damage or interfere with TVA's facilities and operations.
TVA has an extensive generation and transmission system and supporting infrastructure that includes, among other things, TVA's generation facilities and transmission infrastructure such as substations, towers, and control centers. Some of TVA's hydroelectric facilities include navigation locks which are necessary for commerce along the Tennessee River system. TVA also operates flood control dams and supporting infrastructure. Because of TVA's status as a governmentalgovernment corporation and TVA's role as predominantly the soleprimary power provider for its service territory, TVA may be targeted by individuals, groups, or nation states formay target TVA with physical attacks or threats of such attacks. Events such as war, armed conflicts, terrorist attacks, or similar disruptive events, may increase the risks of these attacks targeting critical infrastructure in the U.S.
Although TVA's operations are protected by automated monitoring systems, designated TVA business units (TVA Police and Emergency Management,Management), TVA employees, local law enforcement, or a combination thereof, it may not be possible to effectively deter or prevent such attacks. SuchThese attacks could pose health and safety risks, significantly disable or destroy TVA assets, interfere with TVA's operations, result in additional regulatory or security requirements, increase the costs of nuclear licensing or compliance, and otherwise negatively affect TVA's cash flows, results of operations, and financial condition. In addition, following a physical attack or threat, TVA may incur increased costs for additional security measures, including additional physical plant security and security personnel, increased capability, or other necessary measures.
TVA's assets or their supporting infrastructure may not operate as planned.
Many of TVA's assets, including generation, transmission, navigation, and flood control assets, have been operating for several decades and have been in nearly constant service since they were completed. As such, they require regular maintenance, repair, and replacement in order to continue uninterrupted operation. Additionally, certain of TVA's newer assets utilize advanced technology whichthat could experience technical or operating issues. The failure of TVA's assets or supporting infrastructure, including information technology systems, to perform as planned may cause health, safety, or environmental problems and may even result in events such as the failure of a dam, the inability to maintain a reservoir at the normal or expected level, or an incident at a coal-fired, gas-fired, or nuclear plant or a CCR facility. If these assets or their supporting infrastructure were to fail to operate as planned, if necessary repairs or upgrades arewere delayed or cannotcould not be completed as quickly as anticipated, or if necessary spare parts arewere unavailable, TVA, among other things:
•May have to invest a significant amount of resources to repair or replace the assets or the supporting infrastructure;
•May have to remediate collateral damage caused by a failure of the assets or the supporting infrastructure;
•May not be able to maintain the integrity or reliability of the transmission system at normal levels;
•May have to operate less economical sources of power;
•May have to purchase replacement power on the open market at prices greater than its generation costs;
•May be required to invest substantially to meet more stringent reliability standards;
•May be unable to maintain insurance on affected facilities, ormay be required to pay higher premiums for coverage, unless necessaryor may have to make certain repairs or upgrades are made;
•May be unable to operate the assets for a significant period of time; and/or
•May not be able to meet its contractual obligations to deliver power.
Any of these potential outcomes may negatively affect TVA's cash flows, results of operations, financial condition, and reputation.
TVA's operations present significant safety programs mayrisks that are not prevent accidents that could, among other things, impact TVA's operations or financial condition.able to be completely eliminated.
TVA's safety program, no matter how well designed and operated, may not completely prevent accidents. In addition to the potential human cost of accidents, which could include injury to employees or members of the public, significant accidents could impact TVA's ability to carry out operations, cause it to shut down facilities, subject it to additional regulatory scrutiny, expose it to litigation, damage its reputation, interfere with its ability to attract or retain a skilled workforce, or harm its financial condition.
TVA's service reliability could be affected by problems at other utilities or at TVA facilities, or by the increase in intermittent sources of power.
TVA's transmission facilities are directly interconnected with the transmission facilities of neighboring utilities and are thus part of the larger interstate power transmission grid. Certain of TVA's generation and transmission assets are critical to maintaining reliability of the transmission system. Additionally, TVA uses certain assets that belong to third parties to transmit power and maintain reliability. Accordingly, problems at other utilities as well as at TVA's facilities, including disruptions or black-outs caused by an event such as a severe storm, generator or transmission facility outage on a neighboring system, or the actions of a neighboring utility, may cause interruptions in TVA's service to TVA'sits customers, increase congestion on the transmission grid, or reduce service reliability. In addition, theThe increasing contribution of intermittent sources of power, such as wind and solar, as well as the retirement of coal-fired plants, may place additional strain on TVA's system, as well as on surrounding systems. If TVA suffers a service interruption, increased congestion, or reduced service reliability, TVA's cash flows, results of operations, financial condition, and reputationadditional transmission upgrades may be negatively affected.required to maintain reliability. Upgrades may include enhancements to existing lines and substations or new installations as necessary to provide adequate power transmission capacity, maintain voltage support, and ensure generating plant and transmission system stability.
TVA's supplies of fuel, purchased power, or other critical items may be disrupted or obtained at a higher cost than planned.
TVA purchases coal, uranium, natural gas, fuel oil, and electricity from a number of suppliers. Additionally, TVA contracts for conversion of uranium into nuclear fuel and purchases other items, such as anhydrous ammonia, liquid oxygen, or replacement parts that are critical to the operation of certain generation assets. TVA also purchases power from other power producers when the purchase of such power is appropriate due to economic opportunities or operational concerns. DisruptionTVA's reliance on purchased power may increase if the demand for power suddenly increases in TVA's service territory, and purchased power may become more costly, or price volatilityperhaps be unavailable, if the demand for power also increases in surrounding service territories. Examples of circumstances that may disrupt, or materially increase the acquisition orcost of, the future delivery of fuel, purchased power, contracted services, or other critical supplies may result from a variety ofinclude but are not limited to cyber attacks; war or physical attacks, including the wars in Ukraine and commercial events,Israel; political developments, international trade restrictions or tariffs, or legal actions,actions; mine closures or reduced mine production; increase in demand for power by other power systems which reduces the amount of power that is available for purchase by TVA; increases in fuel exports; environmental regulations affecting TVA's suppliers as well as fromsuppliers; or transportation or transmission constraints. delivery constraints, including the failure of suppliers to timely deliver the services or supplies to TVA at budgeted costs due to force majeure events, shortages of raw materials, supply chain difficulties, increased cost of components and labor, strikes or work stoppages, inflation, availability of personnel being impacted by regional health emergencies, or similar events.
If one of TVA's suppliers failswere to fail to perform under the terms of its contract with TVA, TVA might have to purchase replacement fuel, power, or other critical supplies, perhaps at a significantly higher price than TVA is entitled to pay under the contract. In some circumstances, TVA may not be able to recover this difference from the supplier. In addition, any disruption of TVA's supplies could require TVA to operate higher cost generation assets, thereby negatively affecting TVA's cash flows, results of operations, and financial condition. Moreover, if TVA iswere unable to acquire enough replacement fuel, power, or supplies, or does notwere to have sufficientinsufficient reserves to offset the loss, TVA may not be able to operate certain assets in the manner TVA determines is in its best interests or provide enough power to meet demand, resulting indemand. As a result, power curtailments, brownouts, or even blackouts.blackouts could occur.
FINANCIAL, ECONOMIC, AND MARKET RISKS
TVA could have to make significant future contributions to fund its qualified pension plan, and the increasing costs of the plan and employee benefits could adversely affect TVA's results of operations, financial condition, or cash flows.
On September 30, 2023, TVA's qualified pension plan had assets of approximately $8.1 billion compared to liabilities of approximately $10.1 billion. The plan is mature with approximately 22,000 retirees and beneficiaries receiving benefits of approximately $750 million per year. The costs of providing benefits depend upon a number of factors, including, but not limited to, provisions of the plan; changing experience and assumptions related to terminations, retirements, and mortality; rates of increase in compensation levels; rates of return on plan assets; discount rates used in determining future benefit obligations and required funding levels; optional forms of benefit payments selected; future government regulation; and levels of contributions made to the plan.
The pension plan covers substantially all of TVA's full-time annual employees hired prior to July 1, 2014. Although the
plan has been frozen to new participants since July 1, 2014, TVA's payment obligation under the pension plan is substantial, and changes in any one or more of these factors could cause TVA's benefit expenditures under the plan to increase and significantly exceed TVA's planned contributions. Unfavorable financial market conditions, including those arising from inflation and changes in interest rates, may cause lower-than expected rates of return on plan assets, loss in value of the investments, and lower discount rates used in determining future benefit obligations. These changes would negatively impact the funded status of the plan and may require TVA to make contributions in excess of the amounts planned. In addition to the costs of the plan, the costs of providing health care benefits to TVA's employees and retirees have increased in recent years. Additional contributions to the plan and absorption of additional costs for the pension plan, health care plans, and other employee benefits would negatively affect TVA's cash flows, results of operations, and financial condition.
TVA’s reliance on debt markets may make TVA more vulnerable to being unable to meet cash requirements than private utilities that can issue equity securities.
TVA uses cash provided by operations together with proceeds from power system financings to fund its current cash requirements. TVA's power system financings consist primarily of the sale of Bonds and secondarily of alternative forms of financing, such as lease arrangements. It is critical that TVA continue to have access to the debt markets in order to meet its cash requirements. The importance of having access to the debt markets is enhanced by the fact that TVA, unlike most utilities, relies almost entirely on debt capital, since as a governmental instrumentality, TVA cannot issue equity securities. TVA’s access to the debt markets could be negatively impacted by market disruptions, including disruptions that result from systemic risks to the banking system and the financial markets. Moreover, rapid increases in interest rates beyond planning levels, especially as financing needs are increasing, or disruptions in the market due to rapid changes in interest rates, could impact TVA's cost of funds or ability to raise funds to meet cash needs.
TVA's determinationdebt ceiling may limit TVA's ability to carry out its business in the event that TVA were to approach or reach it.
Approaching or reaching the debt ceiling may negatively affect TVA's business by limiting TVA's ability to access capital markets and by increasing the amount of debt TVA must service without new debt capital. This occurrence may restrict TVA's ability to raise debt capital to acquire new power program assets or maintain existing ones, to carry out upgrades or improvements to existing assets or build new ones, to purchase power under long-term PPAs, or to meet regulatory requirements. In addition, approaching or reaching the debt ceiling may lead to increased legislative or regulatory oversight of TVA's activities and could lead to negative rating actions by credit rating agencies. Operating at higher balances of Bonds subject to the $30.0 billion debt limit reduces TVA's financial flexibility for using financing to handle emergencies or other rapid cash funding needs, and increases operational risks in management of the appropriate mixportfolio of generation assets may change.Bonds subject to the debt limit.
TVA, has determinedtogether with owners of TVA securities, may be impacted by downgrades of TVA's credit ratings.
TVA’s current credit ratings are not based solely on its underlying business or financial condition but are based to a large extent on TVA's status as a wholly-owned government corporation and the legislation that its power generation assets should consistdefines TVA’s business structure. Key characteristics of TVA’s business defined by legislation include (1) the TVA Board's ratemaking authority; (2) the current competitive environment, which is defined by the fence and the anti-cherrypicking provision; and (3) TVA’s status as a mixcorporate agency and instrumentality of nuclear, coal-fired, natural gas-fired, and renewable power sources, including hydroelectric. In making this determination, TVA took various factors into consideration, including the anticipated availability of its nuclear units, the availability of non-nuclear facilities, the forecasted cost of natural gas and coal, the forecasted demand for electricity, and environmental compliance including the expense of adding air pollution controls to its coal-fired units.United States. If Congress takes any action that effectively alters any of these characteristics, TVA's credit ratings could be downgraded. Although TVA Bonds are not obligations of the United States, TVA, as a corporate agency and instrumentality of the United States, may be impacted by a downgrade of the United States’ sovereign credit ratings. Such a downgrade has and could again in the future, among other things, lead to a downgrade of TVA’s credit rating. Additionally, future events that may negatively impact TVA’s financial condition or reputation, including those discussed elsewhere in these Risk Factors, may lead to downgrades of TVA’s credit ratings, and the criteria used by the credit rating agencies to assign ratings could be changed at any time, which could result in changes to TVA’s ratings. See Part II, Item 7, Management's Discussion and Analysis of Financial Condition and Results of Operations — Liquidity and Capital Resources — Sources of Liquidity— Debt Securities for a discussion of a recent downgrade of TVA's credit rating by Fitch Ratings.
Downgrades of TVA’s credit ratings, particularly downgrades related to TVA-specific factors, may have material adverse effects on TVA’s cash flows, results of operations, and financial condition, as well as on investors in TVA securities. Among other things, a downgrade could increase TVA’s interest expense by increasing the interest rates that TVA pays on new debt securities that it issues. Such an increase may reduce the amount of cash available for other purposes, which may require TVA to borrow more, to reduce other expenses or capital investments, or to increase power rates. A downgrade may also result in TVA’s having to post collateral under certain physical and financial contracts that contain ratings triggers. A downgrade below a contractual threshold may specifically prevent TVA from borrowing under four credit facilities totaling $2.7 billion or posting letters of credit as collateral under these facilities. As of September 30, 2023, there were $535 million of letters of credit outstanding under these facilities. If TVA were no longer able to post letters of credit as collateral, TVA would likely have to post cash as collateral, which would negatively affect TVA’s liquidity.
Further, a downgrade may lower the price of TVA securities in the secondary market, thereby negatively impacting investors who sell TVA securities after the downgrade and diminishing the attractiveness and marketability of TVA securities in the secondary market as well as new TVA debt securities.
TVA relies on certain assumptions materially changeabout the future that may turn out to be inaccurate.
TVA uses certain assumptions that are presently justifiable in order to develop its plans for the future. Such assumptions include economic forecasts, anticipated energy and commodity prices, cost estimates, construction schedules, power demand forecasts, the appropriate generation mix to meet demand, and potential regulatory environments. Should these assumptions be inaccurate, or are impactedbe superseded by subsequent events, TVA's plans may not be effective in achieving the intended results. This situation could negatively affect cash flows, results of operations, and financial condition, as well as TVA's ability to meet electricity demand and the way TVA conducts its business.
Demand for electricity could significantly decline, change, or increase, and any of these scenarios could negatively affect TVA's cash flows, results of operations, and financial condition.
The fence limits the area in which TVA or LPCs that distribute TVA power may provide power. Accordingly, TVA is limited in its ability to replace or attract new customers to offset reduced demand for electricity among its existing customers. Some of the factors that could reduce, change, or increase the demand for electricity include, but are not limited to, the following:
Economic Downturns or Recessions. Uncertainty in the macroeconomic environment, including the effects of increased inflationary pressures and interest rates, potential economic downturns or recessions, geopolitical pressures, and pandemics and regional health emergencies, could have adverse effects on the U.S. and global economies that may indirectly impact TVA’s financial condition and results of operations due to the nature of TVA’s business.
•Renewed economic downturns or a recession in TVA’s service area or other parts of the United States could reduce overall demand for power and thus reduce TVA’s power sales and cash flows, especially if TVA’s industrial customers were to reduce their operations and thus their consumption of power.
•TVA could be further adversely affected by a downturn in the economy and financial markets, including differences in the recovery of specific economic sectors or regions of the Tennessee Valley and continued volatility in interest rates, commodity prices, investment performance, and foreign currency exchange rates.
•An extended slowdown in the recovery of the United States’ economic growth, changes in the demand for commodities, or material changes in governmental policy could result in lower economic growth and thus lower demand for electricity in TVA’s key markets.
•Contractual counterparties could be impaired in their ability to perform their obligations to TVA, or may choose to abandon contracts, which could result in more costly operation of TVA’s facilities.
Loss of Customers. TVA could lose customers if customers were to choose another utility to meet some or all of their power needs where available, pursue self-generation to meet some or all of their power needs, or move their operations outside of TVA's service territory. As of September 30, 2023, TVA had wholesale power contracts with 153 LPCs, and 89 LPCs had entered into Power Supply Flexibility Agreements with TVA that allow the LPCs to locally generate or purchase up to approximately five percent of their average total hourly energy sales over a certain time period in order to meet their individual customers' needs. Revised flexibility agreements were made available to LPCs in August 2023 which permit projects to be located anywhere in TVA's service area, either connected to the LPC distribution system or TVA's transmission system, and makes it easier for LPCs to partner in projects. A significant portion of TVA's total operating revenues is concentrated in a small number of these LPCs. The loss of customers could have a material adverse effect on TVA's cash flows, results of operations, or financial condition, and could result in higher rates, especially because of the difficulty in replacing customers because of the fence. A significant loss of customers could also impact investor confidence, resulting in TVA paying higher interest rates on its securities.
Change in Demand for Electricity Generated from Renewable Sources. TVA has been adapting its generation mix to account for the growing preference for electricity generated by renewable sources, such as solar or wind. Demand by customers for power that is largely or exclusively generated from renewable sources may not address its operational needscurrently or in the mostfuture exceed TVA's ability to produce such power or to maintain reliability consistent with customer expectations, and TVA might be compelled to change how it operates and may incur additional expense in meeting this demand.
Increased Utilization of DER. As the amount of DER grows on the TVA system, the need for TVA's traditional generation resources may be reduced, and the ability of the system to reliably and economically operate in conjunction with these DER may become more challenging. If TVA were unable to compensate for the resulting
decrease in demand for TVA electricity, TVA's cash flows, results of operations, and financial condition could be negatively impacted, likely resulting in higher rates and changes to TVA's operations.
Increased Energy Efficiency and Conservation. Increasingly efficient manner. Resolvinguse of energy as well as conservation efforts and DER may reduce the demand for power supplied by TVA. Reductions, if TVA is unable to compensate for them by reducing its cost of production of electricity or by increasing rates, could negatively affect TVA's cash flows, results of operations, and financial condition and could result in changes to TVA's operations, especially if the reductions occur during an economic downturn or a period of slow economic growth. In addition, higher rates may lead to further reduced demand through increased conservation efforts and DER.
Change in Demographic Conditions.Demographic conditions such a situationas population changes, job and income growth, housing starts, new business formation, inflation, and the overall level of economic activity or development may affect customer growth, customer usage, and the overall demand for power. Increases in the demand for power may require TVA to build additional generation facilities and/or rely more heavily on purchased power, either of which could negatively affect TVA's cash flows, results of operations, and financial condition. A lack of growth, or decline, in the number of customers or in customer demand for power may cause TVA to fail to fully realize the anticipated benefits from significant investments and expenditures and could negatively impact TVA’s growth, business, financial condition, results of operations, cash flows, and prospects.
Changes in technology could affect relationships with customers, require TVA to change how it conducts its operations, or impact TVA's financial condition.
TVA's primary business is to sell power it produces, for the most part, from large facilities such as nuclear power plants, hydroelectric facilities, natural gas-fired facilities, and coal-fired units. TVA sells power to LPCs and directly served customers. Research and development activities are ongoing to improve existing and alternative technologies to produce or store electricity, including large-scale energy storage, gas or wind turbines, fuel cells, microturbines, solar cells, and distributed energy or storage resources. Advances in these or other alternative technologies could reduce the costs of such production methods to a level that will enable these technologies to compete effectively with traditional power plants such as those used by TVA. These technologies could be more appealing to customers and could lead them to pressure TVA to modify power contracts to allow customers to generate some of their own power requirements or purchase power from other suppliers. Other customers might also cease purchasing power from TVA altogether. To the extent that sales to such customers are reduced or eliminated, TVA's cash flows, results of operations, and financial condition could be negatively affected. TVA could also be required to modify how it operates its traditional plants or further modify its generation mix to reduce reliance on these facilities. Additionally, demand could change in terms of amount or timing as more devices and equipment become connected to the internet, allowing for real-time adjustments in consumption of power. Such increased control over power consumption could, among other things, affect how TVA operates its facilities or dispatches power, or require TVA to change its pricing structure or rates.
TVA could lose its competitive edge if it fails to keep up with changes in technology.
TVA’s competitive position could be impacted if TVA is unable to deploy new technology in a cost effective and competitive manner. This process of enhancing or replacing TVA’s technology infrastructure involves significant development and implementation costs to keep pace with changing technologies and customer demand. If TVA fails to successfully implement critical technology infrastructure, or if it does not provide the anticipated benefits or meet customer demands, such failure could negatively affect TVA’s business strategy as well as impact its results of operations, financial position, and cash flows. Additionally, TVA may fail to fully capitalize on new technology due to cybersecurity risk aversion or unique regulations applicable to TVA, leading to a loss in competitive edge or inability to efficiently solve future problems.
TVA is subject to a variety of market risks that may negatively affect TVA's cash flows, results of operations, and financial condition.
TVA is subject to a variety of market risks, including but not limited to the following:
Commodity Price Risk. TVA's rates may increase if prices of commodities critical to operations, including coal, uranium, natural gas, fuel oil, crude oil, construction materials, or emission allowances, were to increase. An increase in rates may reduce demand and negatively impact TVA's cash flows, results of operations, and financial condition.
Investment Price Risk. TVA is exposed to investment price risk in its NDT, Asset Retirement Trust ("ART"), pension plan, Supplemental Executive Retirement Plan ("SERP"), Deferred Compensation Plan ("DCP"), and Restoration Plan ("RP"). If the value of the investments held in the NDT or the pension fund were to either decrease or fail to increase in accordance with assumed rates of return, TVA may be required to make substantial contributions to these funds. In addition, although TVA is not required to make contributions to the ART, it may choose to do so,
particularly if TVA's estimates of its non-nuclear asset retirement obligation liabilities were to increase. TVA may also choose to make contributions to the SERP, DCP, and RP from time to time.
Interest Rate Risk. Changes in interest rates may, variably, increase the amount of interest that TVA pays on new Bonds that it issues, decrease the return that TVA receives on short-term investments, decrease the value of the investments in the NDT, ART, pension fund, SERP, DCP, and RP, increase the amount of collateral that TVA is required to post in connection with certain of its derivative transactions, increase the losses on the mark-to-market valuation of certain derivative transactions into which TVA has entered, or some combination of these.
Counterparty Credit and Performance Risk. TVA is exposed to the risk that its counterparties will not be able to perform their contractual obligations. If TVA's counterparties were to fail to perform their obligations, TVA's cash flows, results of operations, and financial condition may be adversely affected. In addition, the failure of a counterparty to perform may make it difficult for TVA to perform its obligations, particularly if the counterparty were a supplier of electricity or fuel.
Currency Exchange Rate Risk. Over the next several years, TVA expects to spend a significant amount of capital on various projects. A portion of this amount may be spent on contracts that are denominated in one or more foreign currencies. TVA's two issues of Bonds denominated in British pounds sterling are hedged by currency swap agreements. The value of the U.S. dollar compared with other currencies has fluctuated widely in recent years, including as a result of changes in political and economic conditions. If not effectively managed, foreign currency exposure could negatively impact TVA's counterparty risk, cash flows, results of operations, and financial condition.
The market for TVA Bonds might be limited.
Although many TVA Bonds are listed on stock exchanges, there can be no assurances that any market will develop or continue to exist for any Bonds. Additionally, no assurances can be made as to the ability of the holders to sell their Bonds or as to the price at which holders will be able to sell their Bonds. Future trading prices of Bonds will depend on many factors, including prevailing interest rates, the then-current ratings assigned to the Bonds, the amount of Bonds outstanding, the time remaining until the maturity of the Bonds, the redemption features of the Bonds, the market for similar securities, and the level, direction, and volatility of interest rates generally, as well as the liquidity of the markets for those securities.
When a particular series of Bonds is offered through underwriters, those underwriters may attempt to make a market in the Bonds. Dealers other than underwriters may also make a market in TVA Bonds. However, the underwriters and dealers are not obligated to make a market in any TVA Bonds and may terminate any market-making activities at any time without notice.
Further, certain investors and underwriters use the environmental impact or sustainability of a company or industry as a criterion for deciding whether to invest in that company or industry. TVA's use of fossil fuels, among other things, could lead such investors or underwriters to not purchase TVA Bonds or reduce the attractiveness of TVA Bonds as compared to other investments, thereby limiting the market for TVA Bonds. Moreover, some investors may no longer be able to hold TVA securities after specified dates if TVA's performance on certain metrics fails to meet investor requirements on metrics such as the carbon intensity, carbon emissions, or operation of thermal coal-fired or natural gas-fired assets.
In addition, legal limitations may affect the ability of banks and others to invest in Bonds. For example, national banks may purchase TVA Bonds for their own accounts in an amount not to exceed 10 percent of unimpaired capital and surplus. Also, TVA Bonds are "obligations of a corporation which is an instrumentality of the United States" within the meaning of Section 7701(a)(19)(C)(ii) of the Internal Revenue Code for purposes of the 60 percent of assets limitation applicable to U.S. building and loan associations. These limitations on TVA Bond investors also may limit the market for TVA Bonds.
Payment of principal and interest on TVA securities is not guaranteed by the U.S government.
Although TVA is a corporate agency and instrumentality of the U.S. government, TVA securities are not backed by the full faith and credit of the U.S. Principal and interest on TVA securities are payable solely from TVA's net power proceeds. Net power proceeds are the remainder of TVA's gross power revenues after deducting the costs of operating, maintaining, and administering its power properties and payments to states and counties in lieu of taxes, but before deducting depreciation accruals or other charges representing the amortization of capital expenditures, plus the net proceeds from the sale or additionalother disposition of any power purchases,facility or interest therein. If TVA were to experience extreme financial difficulty and were unable to make payments of principal or interest on its Bonds, the federal government would not be legally obligated to prevent TVA from defaulting on its obligations. An inability to pay some or all of the principal or interest owed on a TVA security would likely have a negative impact on the market for TVA Bonds generally and TVA's financial condition, reputation, and relationship with the investment community, and could result in cross-defaults in other financial arrangements.
HUMAN CAPITAL AND MANAGEMENT RISKS
Failure to attract and retain an appropriately qualified, diverse, and inclusive workforce may negatively affect TVA's results of operations.
TVA's business depends on its ability to recruit and retain key executive officers as well as skilled professional and technical employees. Labor is subject to external factors that are beyond TVA's control, including the highly competitive market for skilled workers and leaders, inflation, regional health emergencies, and workforce participation rates. The inability to attract and retain an appropriately qualified, diverse, and inclusive workforce could adversely affect TVA's ability to, among other things, operate and maintain generation and transmission facilities, complete large construction projects, and successfully implement its continuous improvement initiatives. If Congress were to reduce the salary of TVA's CEO or otherwise amend TVA's compensation philosophy, TVA's ability to attract and retain key executives or other employees may be compromised.
Changes in the membership of the TVA Board and TVA senior management could impact how TVA operates.
The TVA Board is comprised of up to nine part-time members serving staggered, five-year terms. One to two Board members' terms typically expire each year. In addition, there is always the possibility that one or more members of TVA's senior management may retire or otherwise leave TVA. The individuals filling either the TVA Board or senior management positions may wish to change how TVA operates in whole or in part. If the changes were not successful or TVA were unable to adapt properly to such changes, TVA's financial condition, results of operations, reputation, and relationship with customers could be negatively affected.
Loss of a quorum of the TVA Board could limit TVA's ability to adapt to meet changing business conditions.
Under the TVA Act, a quorum of the TVA Board is five members. Becoming a member of the TVA Board requires confirmation by the U.S. Senate following appointment by the President. This process has been and could again in the future be subject to extended delays. The President may remove TVA Board members, and the TVA Board members may resign or otherwise leave office before a successor is commissioned. As a result, a delay in the appointment or confirmation of directors, or the removal of directors by the President, can threaten the TVA Board's quorum. The TVA Board is responsible for, among other things, establishing the rates TVA charges for power as well as TVA's long-term objectives, policies, and plans. Accordingly, the loss of a quorum for an extended period of time would impair TVA's ability to change rates and to modify these objectives, policies, and plans. Such an impairment would likely have a negative impact on TVA's ability to respond to significant changes in technology, the regulatory environment, or the industry overall and, in turn, negatively affect TVA's cash flows, results of operations, financial condition, and reputation may be negatively affected.reputation. The TVA Board currently has nine members.
RISKS RELATED TO THE ENVIRONMENTHUMAN CAPITAL AND CATASTROPHIC EVENTSMANAGEMENT RISKS
Weather conditions may influence TVA's abilityFailure to supply powerattract and its customers' demands for power.
Extreme temperatures may increase the demand for powerretain an appropriately qualified, diverse, and require TVA to purchase power at high prices to meet the demand from customers, while unusually mild weather may result in decreased demand for power and lead to reduced electricity sales. Also, in periods of below normal rainfall or drought, TVA's low-cost hydroelectric generation may be reduced, requiring TVA to purchase power or use more costly means of producing power. Additionally, periods of either high or low levels of rainfall may impede river traffic, impacting barge deliveries of critical items such as coal and equipment for power facilities. Furthermore, high river water temperatures in the summer may limit TVA's ability to
use water from the Tennessee or Cumberland River systems for cooling at certain of TVA's generating facilities, thereby limiting its ability to operate these generating facilities. This situation would be aggravated during periods of reduced rainfall or drought. If changes in the climate make such shifts in weather more common or extreme, TVA may be required to, among other things, change its generation mix or change how it conducts its operations, which could have a material adverse effect on TVA's cash flows, results of operations, and financial condition.
Events that affect the supply or quality of water in the Tennessee River system and Cumberland River system or elsewhere may interfere with TVA's ability to generate power.
An inadequate supply of water in the Tennessee River system and Cumberland River system could negatively impact TVA's cash flows, results of operations, and financial condition by reducing generation not only at TVA's hydroelectric plants but also at its coal-fired and nuclear plants, which depend on water from the river systems near which they are located for cooling and for use in boilers where water is converted into steam to drive turbines. Certain of TVA's gas-fired facilities not located near a river require alternative sources of water, such as from wells or local utility companies. Further, the water must be of a particular quality for use in TVA's equipment. If the available water is not of sufficient quality for TVA's use, then TVA must either treat the water or obtain alternate sources. An inadequate supply of quality water could result, among other things, from periods of low rainfall or drought, the withdrawal of water from the river systems by governmental entities or others, incidents affecting bodies of water not managed by TVA, supply issues which affect water providers, or intrusive aquatic plants and animals such as eel grass, algae, and mussels that block cooling water intake pipes or otherwise interfere with the operation of TVA's generation facilities. While TVA manages the Tennessee River and a large portion of its tributary system to provide much of the water necessary for the operation of its power plants, the USACE operates and manages other bodies of water upon which some of TVA's facilities rely. Events at these bodies of water or their associated hydroelectric facilities may interfere with the flow of water and may result in TVA's having insufficient water quality to meet the needs of its plants. If TVA has insufficient water supply of the quality necessary to meet the needs of its plants, TVA may be required to treat the water, reduce generation at its affected facilities to levels compatible with the available supply of water, or take additional steps that change how TVA conducts its operations or cause TVA to incur additional expense.
Catastrophic eventsinclusive workforce may negatively affect TVA's cash flows, results of operations, and financial condition.
TVA's cash flows, results of operations, and financial condition may be adversely affected, either directly or indirectly, by catastrophic events such as fires, earthquakes, explosions, solar events, electromagnetic pulses ("EMPs"), geomagnetic disturbances, droughts, floods, hurricanes, tornadoes, or other casualty events, wars, national emergencies, terrorist activities, pandemics, or other similar destructive or disruptive events. These events, the frequency and severity of which are unpredictable, may, among other things, lead to legislative or regulatory changes that affect the construction, operation, and decommissioning of nuclear units and the storage of spent fuel; limit or disrupt TVA's ability to generate and transmit power; limit or disrupt TVA's ability to provide flood control and river management; reduce the demand for power; disrupt fuel or other supplies; require TVA to produce additional tritium; lead to an economic downturn; require TVA to make substantial capital investments for repairs, improvements, or modifications; and create instability in the financial markets. If public opposition to nuclear power makes operating nuclear plants less feasible as a result of any of these events, TVA may be forced to shut down its nuclear plants. This would make it substantially more difficult for TVA to obtain greater amounts of its power supply from low or zero carbon emitting resources and to replace its generation capacity when faced with retiring or idling certain coal-fired units. Additionally, some studies have predicted that climate change may cause catastrophic events, such as droughts and floods, to occur more frequently in the Tennessee Valley region, which could adversely impact TVA.
CYBERSECURITY RISKS
TVA's facilities and information infrastructure may not operate as planned due to cyber threats to TVA's assets and operations.
TVA's business depends on its ability to recruit and retain key executive officers as well as skilled professional and technical employees. Labor is subject to external factors that are beyond TVA's control, including the highly competitive market for skilled workers and leaders, inflation, regional health emergencies, and workforce participation rates. The inability to attract and retain an appropriately qualified, diverse, and inclusive workforce could adversely affect TVA's ability to, among other things, operate and maintain generation and transmission facilities, complete large construction projects, and successfully implement its continuous improvement initiatives. If Congress were to reduce the salary of TVA's CEO or otherwise amend TVA's compensation philosophy, TVA's ability to attract and retain key executives or other employees may be compromised.
Changes in the membership of the TVA Board and TVA senior management could impact how TVA operates.
The TVA Board is comprised of up to nine part-time members serving staggered, five-year terms. One to two Board members' terms typically expire each year. In addition, there is always the possibility that one or more members of TVA's senior management may retire or otherwise leave TVA. The individuals filling either the TVA Board or senior management positions may wish to change how TVA operates in whole or in part. If the changes were not successful or TVA were unable to adapt properly to such changes, TVA's financial condition, results of operations, are heavily computerizedreputation, and include assets such as information technology and networking systems. Asrelationship with all industries,customers could be negatively affected.
Loss of a quorum of the reliance on computerization and networking makes TVA Board could limit TVA's ability to adapt to meet changing business conditions.
Under the TVA Act, a target for cyber attacks, andquorum of the riskTVA Board is five members. Becoming a member of such attacks may increase as individual devices and equipment become accessible via the internet. TVA Board requires confirmation by the U.S. Senate following appointment by the President. This process has been targeted by cyber attacks in the past and anticipates that it will be targeted in the future. These attacks may have been carried out, orcould again in the future could be carried out,subject to extended delays. The President may remove TVA Board members, and the TVA Board members may resign or otherwise leave office before a successor is commissioned. As a result, a delay in the appointment or confirmation of directors, or the removal of directors by individuals, groups,the President, can threaten the TVA Board's quorum. The TVA Board is responsible for, among other things, establishing the rates TVA charges for power as well as TVA's long-term objectives, policies, and plans. Accordingly, the loss of a quorum for an extended period of time would impair TVA's ability to change rates and to modify these objectives, policies, and plans. Such an impairment would likely have a negative impact on TVA's ability to respond to significant changes in technology, the regulatory environment, or nation states. Although TVA has extensive cyber safeguardsthe industry overall and, works with industry specialists and relevant governmental authorities to deter, stop, or mitigate cyber attacks, it is possible that these measures might not prevent all attacks. In such a case, a cyber attack could compromise sensitive data; significantly disrupt operations; require additional expenditures for cybersecurity;in turn, negatively affect TVA's cash flows, results of operations, financial condition, and reputation; and pose health and safety risks. Additionally, the theft, damage, or improper disclosure of sensitive data may subjectreputation. The TVA to penalties and claims from third parties.Board currently has nine members.
Cyber attacks on third parties could interfere with or harm TVA.
TVA relies on third parties for various services, including transferring funds to non-TVA entities in the ordinary course of business. As with TVA, these third parties are heavily computerized and use assets such as information technology and networking systems. If these third parties undergo cyber attacks, the services they provide TVA could be disrupted. This disruption could interfere with TVA's ability to perform its obligations to others, transfer funds, or make payments, which in turn could negatively affect TVA's financial condition and reputation. Additionally, the theft, damage, or improper disclosure of sensitive data held by these third parties may subject TVA to further harm.
FINANCIAL, ECONOMIC, AND MARKET RISKS
TVA may have to make significant contributions in the future to fund its qualified pension plan.
At September 30, 2020, TVA's qualified pension plan had assets of approximately $8.0 billion compared to liabilities of approximately $13.7 billion. The plan is mature with approximately 24,000 retirees and beneficiaries receiving benefits of over $700 million per year. The costs of providing benefits depend upon a number of factors, including, but not limited to, provisions of the plan; changing experience and assumptions related to terminations, retirements, and mortality; rates of increase in compensation levels; rates of return on plan assets; discount rates used in determining future benefit obligations and required funding levels; optional forms of benefit payments selected; future government regulation; and levels of contributions made to the plan.
Although the plan is frozen to new participants, any of these factors or any number of these factors could keep at high levels, or even increase, the costs of providing benefits and require TVA to make contributions to the plan in amounts that significantly exceed TVA's planned contributions. Unfavorable financial market conditions may result in lower expected rates of return on plan assets, loss in value of the investments, and lower discount rates used in determining future benefit obligations. These changes would negatively impact the funded status of the plan. Additional contributions to the plan and absorption of additional costs would negatively affect TVA's cash flows, results of operations, and financial condition.
TVA's debt ceiling could be made more restrictive. Additionally, approaching or reaching TVA's debt ceiling could limit TVA's ability to carry out its business.
The TVA Act provides that TVA can issue Bonds in an amount not to exceed $30.0 billion outstanding at any time. At September 30, 2020, TVA had $20.1 billion of Bonds outstanding (not including non-cash items of foreign currency exchange gain of $153 million, unamortized debt issue costs of $45 million, and net discount on sale of Bonds of $77 million).
Approaching or reaching the debt ceiling may negatively affect TVA's business by limiting TVA's ability to access capital markets and increasing the amount of debt TVA must service. Also, federal legislation may lower TVA's debt ceiling or broaden the types of financial instruments that are covered by the ceiling. Either of these scenarios may also restrict TVA's ability to raise capital to acquire new power program assets or maintain existing ones, to carry out upgrades or improvements to existing assets or build new ones, to purchase power under long-term power purchase agreements, or to meet regulatory requirements. In addition, approaching or reaching the debt ceiling may lead to increased legislative or regulatory oversight of TVA's activities and could lead to negative rating actions by credit rating agencies.
TVA may be unable to meet its current cash requirements if TVA's access to the debt markets is limited.
TVA uses cash provided by operations together with proceeds from power program financings and other financing arrangements to fund its current cash requirements. It is critical that TVA continues to have access to the debt markets in order to meet its cash requirements. The importance of having access to the debt markets is underscored by the fact that TVA, unlike most utilities, relies almost entirely on debt capital since, as a governmental instrumentality, TVA cannot issue equity securities.
TVA's credit ratings may be impacted by congressional actions or by a downgrade of the U.S.'s sovereign credit ratings.
TVA's current credit ratings are not based solely on its underlying business or financial condition but are based to a large extent on the legislation that defines TVA's business structure. Key characteristics of TVA's business defined by legislation include (1) the TVA Board's ratemaking authority; (2) the current competitive environment, which is defined by the fence and the anti-cherrypicking provision; and (3) TVA's status as a corporate agency and instrumentality of the U.S. If Congress takes any action that effectively alters any of these characteristics, TVA's credit ratings could be downgraded.
Although TVA Bonds are not obligations of the U.S., TVA, as a corporate agency and instrumentality of the U.S., may be impacted if the sovereign credit ratings of the U.S. are downgraded. Such a downgrade of the U.S.'s sovereign credit ratings could, among other things, result in a downgrade of TVA's credit rating. Additionally, the economy could be negatively impacted resulting in reduced demand for electricity, an increase in borrowing costs, and an increase in the cost of fuels, supplies, and other materials required for TVA's operations. Additionally, the criteria used by the credit rating agencies to assign ratings could be changed at any time, which could result in changes to TVA's ratings.
TVA, together with owners of TVA securities, may be impacted by downgrades of TVA's credit ratings.
Downgrades of TVA's credit ratings may have material adverse effects on TVA's cash flows, results of operations, and financial condition as well as on investors in TVA securities. Among other things, a downgrade could increase TVA's interest expense by increasing the interest rates that TVA pays on new securities that it issues. Such an increase may reduce the amount of cash available for other purposes, which may result in the need to increase borrowings, to reduce other expenses or capital investments, or to increase power rates. A downgrade may also result in TVA's having to post collateral under certain physical and financial contracts that contain ratings triggers. A downgrade below a contractual threshold may prevent TVA from borrowing under four credit facilities totaling $2.7 billion or posting letters of credit as collateral under these facilities. At September 30, 2020, there were $1.5 billion of letters of credit outstanding under these facilities. If TVA were no longer able to post letters of credit as collateral, TVA would likely have to post cash as collateral, which would negatively affect TVA's liquidity. Further, a downgrade may lower the price of TVA securities in the secondary market, thereby negatively impacting investors who sell TVA securities after the downgrade and diminishing the attractiveness and marketability of TVA securities. The criteria used by credit rating agencies to assign ratings could also be changed at any time, which could result in changes to TVA's ratings.
TVA's assumptions about the future may be inaccurate.
TVA uses certain assumptions in order to develop its plans for the future. Such assumptions include economic forecasts, anticipated energy and commodity prices, cost estimates, construction schedules, power demand forecasts, the appropriate generation mix to meet demand, and potential regulatory environments. Should these assumptions be inaccurate, or be superseded by subsequent events, TVA's plans may not be effective in achieving the intended results, which could negatively affect cash flows, results of operations, and financial condition, as well as TVA's ability to meet electricity demand and the way TVA conducts its business.
Demand for electricity may significantly decline or change, negatively affecting TVA's cash flows, results of operations, and financial condition.
Some of the factors that could reduce or change the demand for electricity include, but are not limited to, the following:
Economic Downturns or Recessions. Renewed economic downturns or a recession in TVA's service area or other parts of the U.S. could reduce overall demand for power and thus reduce TVA's power sales and cash flows, especially if TVA's industrial customers, which constitute a material portion of TVA's demand, reduce their operations and thus their consumption of power.
Loss of Customers. TVA could lose customers, particularly LPCs, if customers choose another utility to meet some or all of their power needs where available, pursue self-generation to meet some or all of their power needs, or move their operations outside of TVA's service territory. At September 30, 2020, TVA had wholesale power contracts with 153 LPCs, and 64 LPCs had entered into Flexibility Agreements with TVA that allow the LPCs to locally generate up to approximately five percent of average total hourly energy sales over the prior five years in order to meet their individual customers' needs. A significant portion of TVA's total operating revenues are concentrated in a small number of these LPCs. In May 2020, TVA's largest LPC which accounts for nine percent of total operating revenues, MLGW, published a draft Integrated Resource Plan to guide energy choices in the future, the outcome of which is uncertain. In addition, certain other LPCs are evaluating options for future energy choices. The loss of customers could have a material adverse effect on TVA's cash flows, results of operations, or financial condition, and could result in higher rates, especially because of the difficulty in replacing customers due to the fence. A significant loss of customers could also impact investor confidence, resulting in TVA paying higher rates on its securities.
Change in Demand for Electricity Generated from Renewable Sources. TVA has been adapting its generation mix to account for the growing preference for electricity generated by renewable sources, such as solar or wind. If demand by customers for power that is largely or exclusively generated from renewable sources exceeds TVA's ability to produce such power, TVA might have to change how it operates and may incur additional expense in meeting this demand.
Increased Utilization of DER. As the amount of DER grows on the TVA system, the need for TVA's traditional generation resources may be reduced, and the ability of the system to reliably and economically operate in conjunction with these DER may become more challenging. If TVA is unable to compensate for the resulting
decrease in demand for TVA electricity, TVA's cash flows, results of operations, and financial condition could be negatively impacted, resulting in higher rates and changes to TVA's operations.
Increased Energy Efficiency and Conservation. Increasingly efficient use of energy as well as conservation efforts have reduced the demand for power. Further reductions, if TVA is unable to compensate for them, could negatively affect TVA's cash flows, results of operations, and financial condition and could result in higher rates and changes to TVA's operations, especially if the reductions occur during an economic downturn or a period of slow economic growth.
Changes in technology could require TVA to change how it conducts its operations, affect relationships with customers, or impact its financial condition.
TVA's primary business is to sell power it produces, for the most part, from large facilities such as nuclear power plants, hydroelectric facilities, natural gas-fired facilities, and coal-fired units. TVA sells power to LPCs and directly served customers. Research and development activities are ongoing to improve existing and alternative technologies to produce or store electricity, including large-scale energy storage, gas or wind turbines, fuel cells, microturbines, solar cells, and distributed energy or storage resources. It is possible that advances in these or other alternative technologies could reduce the costs of such production methods to a level that will enable these technologies to compete effectively with traditional power plants such as TVA's. These technologies could be more appealing to customers and could lead them to bring pressure on TVA to modify the power contracts to allow customers to generate some of their own power requirements or purchase power from other suppliers. Other customers might also cease purchasing power from TVA altogether. To the extent that sales to such customers are reduced or eliminated, TVA's cash flows, results of operations, and financial condition could be negatively affected. TVA could also be required to modify how it operates its traditional plants or further modify its generation mix to reduce reliance on these facilities.
Additionally, demand could change in terms of amount or timing as devices and equipment become more connected to the internet and it becomes possible to adjust real-time consumption of power. Such increased control over power consumption could, among other things, affect how TVA operates its facilities or dispatches power, or require TVA to change its pricing structure or rates.
TVA is subject to a variety of market risks that may negatively affect TVA's cash flows, results of operations, and financial condition.
TVA is subject to a variety of market risks, including, but not limited to, commodity price risk, investment price risk, interest rate risk, counterparty credit and performance risk, and currency exchange rate risk.
Commodity Price Risk. TVA's rates may increase if prices of commodities critical to operations, including coal, uranium, natural gas, fuel oil, crude oil, construction materials, or emission allowances, increase.
Investment Price Risk. TVA is exposed to investment price risk in its NDT, Asset Retirement Trust ("ART"), Supplemental Executive Retirement Plan ("SERP"), Deferred Compensation Plan ("DCP"), and pension plan. If the value of the investments held in the NDT or the pension fund either decreases or fails to increase in accordance with assumed rates of return, TVA may be required to make substantial contributions to these funds. In addition, although TVA is not required to make contributions to the ART, it may choose to do so, particularly if TVA's estimates of its non-nuclear asset retirement obligation liabilities increase. TVA may also choose to make contributions to the SERP and DCP from time to time.
Interest Rate Risk. Changes in interest rates may increase the amount of interest that TVA pays on new Bonds that it issues, decrease the return that TVA receives on short-term investments, decrease the value of the investments in the NDT, ART, pension fund, SERP, and DCP, increase the amount of collateral that TVA is required to post in connection with certain of its derivative transactions, and increase the losses on the mark-to-market valuation of certain derivative transactions into which TVA has entered.
Counterparty Credit and Performance Risk. TVA is exposed to the risk that its counterparties will not be able to perform their contractual obligations. If TVA's counterparties fail to perform their obligations, TVA's cash flows, results of operations, and financial condition may be adversely affected. In addition, the failure of a counterparty to perform may make it difficult for TVA to perform its obligations, particularly if the counterparty is a supplier of electricity or fuel.
Currency Exchange Rate Risk. Over the next several years, TVA expects to spend a significant amount of capital on various projects. A portion of this amount may be spent on contracts that are denominated in one or more foreign currencies. Additionally, TVA's three issues of Bonds denominated in British pounds sterling are hedged by currency swap agreements. The value of the U.S. dollar compared with other currencies has fluctuated widely in recent years, including fluctuations in the U.S. dollar to British pound sterling exchange rate primarily driven by the "BREXIT" vote for the United Kingdom to leave the European Union. If not effectively managed, foreign currency
exposure could negatively impact TVA's counterparty risk, cash flows, results of operations, and financial condition.
Changes in an interest rate benchmark may impact certain TVA swaps and other financial arrangements.
TVA has four "fixed for floating" interest rate swaps related to outstanding Bonds and receives periodic payments under these swaps based on the floating London Interbank Offered Rate ("LIBOR") benchmark rate. TVA may also have additional contracts that could be impacted. LIBOR is expected to be discontinued after 2021. Various alternatives for LIBOR are being evaluated by market participants, with the Secured Overnight Financing Rate being the most widely-adopted alternative thus far. TVA may face risks related to the viability of an alternative benchmark over the remaining terms of its current contracts, or over the terms of any future contracts that rely on the benchmark rate.
TVA's ability to use derivatives to hedge certain risks may be limited.
Under the Dodd-Frank Wall Street Reform and Consumer Protection Act and its implementing regulations, TVA is subject to recordkeeping, reporting, and reconciliation requirements related to its derivative transactions. In addition, depending on how regulatory agencies interpret and implement the provisions of this act, TVA's hedging costs may increase, and TVA may have to post additional collateral and margin in connection with its derivative transactions. These occurrences may, among other things, negatively affect TVA's cash flows and cause TVA to reduce or modify its hedging activities, which could increase the risks to which TVA is exposed.
The market for TVA Bonds might be limited.
Although many TVA Bonds are listed on stock exchanges, there can be no assurances that any market will develop or continue to exist for any Bonds. Additionally, no assurances can be made as to the ability of the holders to sell their Bonds or as to the price at which holders will be able to sell their Bonds. Future trading prices of Bonds will depend on many factors, including prevailing interest rates, the then-current ratings assigned to the Bonds, the amount of Bonds outstanding, the time remaining until the maturity of the Bonds, the redemption features of the Bonds, the market for similar securities, and the level, direction, and volatility of interest rates generally, as well as the liquidity of the markets for those securities.
If a particular series of Bonds is offered through underwriters, those underwriters may attempt to make a market in the Bonds. Dealers other than underwriters may also make a market in TVA Bonds. However, the underwriters and dealers are not obligated to make a market in any TVA Bonds and may terminate any market-making activities at any time without notice.
Further, certain investors use the environmental impact or sustainability of an industry as a criteria for deciding whether to invest in that industry. TVA's use of fossil fuels or nuclear power could lead such investors to not purchase TVA Bonds.
In addition, legal limitations may affect the ability of banks and others to invest in Bonds. For example, national banks may purchase TVA Bonds for their own accounts in an amount not to exceed 10 percent of unimpaired capital and surplus. Also, TVA Bonds are "obligations of a corporation which is an instrumentality of the United States" within the meaning of Section 7701(a)(19)(C)(ii) of the Internal Revenue Code for purposes of the 60 percent of assets limitation applicable to U.S. building and loan associations.
Payment of principal and interest on TVA securities is not guaranteed by the U.S.
Although TVA is a corporate agency and instrumentality of the U.S. government, TVA securities are not backed by the full faith and credit of the U.S. Principal and interest on TVA securities are payable solely from TVA's net power proceeds. Net power proceeds are the remainder of TVA's gross power revenues after deducting the costs of operating, maintaining, and administering its power properties and payments to states and counties in lieu of taxes, but before deducting depreciation accruals or other charges representing the amortization of capital expenditures, plus the net proceeds from the sale or other disposition of any power facility or interest therein. If TVA were to experience extreme financial difficulty and were unable to make payments of principal or interest on its Bonds, the federal government would not be legally obligated to prevent TVA from defaulting on its obligations. An inability to pay some or all of the principal or interest owed on a TVA security would likely have a negative impact on TVA's financial condition, reputation, and relationship with the investment community, and could result in cross-defaults in other financial arrangements.
HUMAN CAPITAL AND MANAGEMENT RISKS
Failure to attract and retain an appropriately qualified, diverse, and inclusive workforce may negatively affect TVA's results of operations.
TVA's business depends on its ability to recruit and retain key executive officers as well as skilled professional and
technical employees. Labor is subject to external factors that are beyond TVA's control, including the highly competitive market for skilled workers and leaders, inflation, regional health emergencies, and workforce participation rates. The inability to attract and retain an appropriately qualified, diverse, and inclusive workforce could adversely affect TVA's ability to, among other things, operate and maintain generation and transmission facilities, complete large construction projects, and successfully implement its continuous improvement initiatives. If Congress reduceswere to reduce the salary of TVA's CEO or otherwise amendsamend TVA's compensation philosophy, TVA's ability to attract and retain key executives or other employees may be compromised.
Loss of a quorum of the TVA Board could limit TVA's ability to adapt to meet changing business conditions.
Under the TVA Act, a quorum of the TVA Board is five members. Becoming a member of the TVA Board requires confirmation by the U.S. Senate following appointment by the President. Further, the President may remove TVA Board members, and the TVA Board members may not continue in office indefinitely until a successor is appointed. As a result, a delay in the appointment or confirmation of directors, or the removal of directors by the President, can threaten the TVA Board's quorum. The TVA Board is responsible for, among other things, establishing the rates TVA charges for power as well as TVA's long-term objectives, policies, and plans. Accordingly, loss of a quorum for an extended period of time would impair TVA's ability to change rates and to modify these objectives, policies, and plans. Such an impairment would likely have a negative impact on TVA's ability to respond to significant changes in technology, the regulatory environment, or the industry overall and, in turn, negatively affect TVA's cash flows, results of operations, financial condition, and reputation.
Changes in the membership of the TVA Board and TVA senior management could impact how TVA operates.
The TVA Board is comprised of up to nine part-time members serving staggered, five-year terms. One to two Board members' terms typically expire each year. In addition, there is always the possibility that one or more members of TVA's senior management may retire or otherwise leave TVA. The individuals filling either the TVA Board or senior management positions may wish to change how TVA operates in whole or in part. If the changes arewere not successful or TVA is not ablewere unable to adapt properly to such changes, TVA's financial condition, results of operations, reputation, and relationship with customers could be negatively affected.
Loss of a quorum of the TVA Board could limit TVA's ability to adapt to meet changing business conditions.
Under the TVA Act, a quorum of the TVA Board is five members. Becoming a member of the TVA Board requires confirmation by the U.S. Senate following appointment by the President. This process has been and could again in the future be subject to extended delays. The President may remove TVA Board members, and the TVA Board members may resign or otherwise leave office before a successor is commissioned. As a result, a delay in the appointment or confirmation of directors, or the removal of directors by the President, can threaten the TVA Board's quorum. The TVA Board is responsible for, among other things, establishing the rates TVA charges for power as well as TVA's long-term objectives, policies, and plans. Accordingly, the loss of a quorum for an extended period of time would impair TVA's ability to change rates and to modify these objectives, policies, and plans. Such an impairment would likely have a negative impact on TVA's ability to respond to significant changes in technology, the regulatory environment, or the industry overall and, in turn, negatively affect TVA's cash flows, results of operations, financial condition, and reputation. The TVA Board currently has nine members.
RISKS RELATED TO THE ENVIRONMENT AND CATASTROPHIC EVENTS
Weather conditions may hamper TVA's ability to supply power or negatively impact net revenue, and weather conditions may cause customers' demand for power to exceed TVA's then-present power supply capabilities.
Weather may have a material adverse effect on TVA’s cash flows, results of operations, and financial condition, including through the following non-exclusive foreseeable scenarios:
•Extreme temperatures may increase the demand for power and require TVA to purchase power at high prices to meet customer demand, whereas unusually mild weather may result in decreased demand for power and lead to reduced electricity sales.
•In periods of below-normal rainfall or drought, TVA's low-cost hydroelectric generation may be reduced, requiring TVA to purchase power or use more costly means of producing power.
•Periods of either high or low levels of rainfall may impede river traffic, impacting barge deliveries of critical items such as coal and equipment for power facilities.
•High river water temperatures in the summer may limit TVA's ability to use water from the Tennessee or Cumberland River systems for cooling at certain of TVA's generating facilities, thereby limiting its ability to operate these generating facilities. This situation would be aggravated during periods of reduced rainfall or drought.
•Changes in the climate may make, or may be making, such shifts in weather more common or extreme. Climate change may cause catastrophic events like droughts, floods, wildfires, heat waves, and snow or ice storms to occur more frequently in the Tennessee Valley region. In response, TVA may be required to, among other things, change its generation mix or change how it conducts its operations.
•Extreme weather conditions or damage resulting from storms or other catastrophic events could stress TVA's transmission and distribution systems, communication systems, and technology, including information technology, resulting in increased restoration, maintenance, and capital costs and reduced reliability.
Events that affect the supply or quality of water from the Tennessee River system and Cumberland River system, or
elsewhere, may interfere with TVA's ability to generate power.
An inadequate supply of water in the Tennessee River system and Cumberland River system could negatively impact TVA's cash flows, results of operations, and financial condition, including potentially reducing generation at TVA's hydroelectric plants, which may require TVA to increase reliance on more expensive generation sources or purchase more energy in the market likely at higher costs; negatively affecting generation at coal-fired and nuclear plants, which depend on water from the river systems near which they are located for cooling and for use in boilers where water is converted into steam to drive turbines; or negatively affecting generation at TVA's gas-fired facilities not located near a river, which nonetheless require alternative sources of water, such as from wells or local utility companies.
Further, the water for these purposes must be of a particular quality for use in TVA's equipment. When the available water is not of sufficient quality for TVA's use, TVA must either treat the water or obtain alternate sources. An inadequate supply of quality water could result, among other things, from periods of low rainfall or drought, the withdrawal of water from the river systems by governmental entities or others, incidents affecting bodies of water not managed by TVA, supply issues that affect water providers, or intrusive aquatic plants and animals such as eel grass, algae, and mussels that block cooling water intake pipes or otherwise interfere with the operation of TVA's generation facilities. While TVA manages the Tennessee River and a large portion of its tributary system to provide much of the water necessary for the operation of its power plants, the USACE operates and manages other bodies of water upon which some of TVA's facilities rely. Events at these bodies of water or their associated hydroelectric facilities may interfere with the flow of water and may result in TVA's having insufficient water quality to meet the needs of some of its generating plants. If TVA were to have insufficient water supply of the quality necessary to meet the needs of its plants, TVA may be required to reduce generation at its affected facilities to levels compatible with the available supply of quality water, or take additional steps that change how TVA conducts its operations or that otherwise cause TVA to incur additional expense.
Catastrophic events may negatively affect TVA's cash flows, results of operations, and financial condition.
TVA's cash flows, results of operations, and financial condition may be adversely affected, either directly or indirectly, by catastrophic events such as fires, earthquakes, explosions, solar events, electromagnetic pulses, geomagnetic disturbances, droughts, floods, hurricanes, tornadoes, polar vortexes, icing events, pipeline explosions, or other casualty events, wars, national emergencies, terrorist activities, pandemics or epidemics, widespread public health crises, geopolitical conflicts, or other similar destructive or disruptive events. These events, the frequency and severity of which are unpredictable, may, among other things, limit or disrupt TVA's ability to generate and transmit power; lead to legislative or regulatory changes that affect the construction, operation, and decommissioning of nuclear units and the storage of spent fuel; limit or disrupt TVA's ability to provide flood control and river management; reduce the demand for power; disrupt fuel or other supplies; require TVA to produce additional tritium; cause or exacerbate an economic downturn; require TVA to make substantial capital investments for repairs, improvements, or modifications; negatively affect the cost or availability of insurance; or cause or exacerbate instability in the financial markets.
These destructive or disruptive events may present special risks to TVA’s nuclear plants. If public opposition to nuclear power were to make operating nuclear plants less feasible as a result of any of these events, TVA may be forced to shut down its nuclear plants. This would make it substantially more difficult for TVA to obtain greater amounts of its power supply from low or zero carbon emitting resources and to replace its generation capacity when faced with retiring or idling certain coal-fired units. Additionally, some studies have predicted that climate change may cause catastrophic events, such as heat waves, droughts, and floods, to occur more frequently or with greater intensity in the Tennessee Valley region, which could adversely impact TVA.
ACCOUNTING AND FINANCIAL REPORTING RISKS
TVA's financial control system cannot guarantee that all control issues and instances of fraud or errors will be prevented or detected.
No financial control system, no matter how well designed and operated, can provide absolute assurance that the objectives of the control system will be met, and no evaluation of financial controls can provide absolute assurance that all control issues and instances of fraud or errors can or will be prevented or detected. The design of any system of financial controls is based in part upon certain assumptions about the likelihood of future events, and there can be no assurance that any design will succeed in achieving its stated goals under all potential future conditions, regardless of how remote.
TVA may be unable to use regulatory accounting for some or all costs.
TVA uses regulatory accounting to defer certain costs. To qualify for regulatory accounting, costs must meet certain accounting criteria and be approved for regulatory accounting treatment by the TVA Board in its capacity as TVA's regulator. IfWhen costs do not meet, or cease to meet, these criteria, or if the TVA Board disallowswere to disallow the treatment or ceaseswere to cease to be TVA's sole regulator in such areas, TVA may not be able to defer those costs. Such an inability to defer costs would likely have a substantial impact on TVA's financial condition and results of operations and could impact the timing and amounts of TVA's rate recovery. For a discussion of regulatory accounting, see Part II, Item 7,
Management's Discussion and Analysis of Financial Condition and Results of Operations — Critical Accounting Policies and Estimates.
TVA's financial control system cannot guarantee that all control issues and instances of fraud or errors will be detected.
No financial control system, no matter how well designed and operated, can provide absolute assurance that the objectives of the control system are met, and no evaluation of financial controls can provide absolute assurance that all control issues and instances of fraud or errors can be detected. The design of any system of financial controls is based in part upon certain assumptions about the likelihood of future events, and there can be no assurance that any design will succeed in achieving its stated goals under all potential future conditions, regardless of how remote.
GENERAL BUSINESS RISKSRISK FACTORS
TVA may not be able to implement its business strategy successfully.
TVA's financial condition and results of operations are largely dependent on the extent to which it can implement its business strategy successfully. TVA's strategy includes maintaining low rates, aligning operations and maintenance spendingcosts with revenues, being responsible stewards, living within its means, meeting reliability expectations, and providing a balanced portfolio, in light of TVA's new strategic priorities: powerful partnerships, people advantage, operational excellence, igniting innovation,priorities. The strategic priorities are Powerful Partnerships, People Advantage, Operational Excellence, Igniting Innovation, and financial strength.Financial Strength. This strategy is subject to business, economic, and competitive uncertainties and contingencies, many of which are beyond TVA'sTVA’s control. Such uncertainties include customer energy-efficiency programs that are designed to reduce energy demand; energy-efficiency efforts by customers not related to TVA’s energy-efficiency programs; increased customer use of DER, such as solar panels and other technologies, as well as the use of energy storage technologies; and macroeconomic factors impacting economic growth or contraction within TVA’s service territory, which could affect energy demand. If TVA is unable to successfully implement its business strategy, TVA'sTVA’s financial condition and results of operations could be negatively affected. See Item 1, Business — Environmental Matters and Human Capital Management, Part II, Item 7, Management's Discussion and Analysis of Financial Condition and Results of Operations — Key Initiatives and Challenges, and Part III, Item 11, Executive Compensation — Compensation Discussion and Analysis for additional information regarding TVA's strategic objectives.
TVA's cost managementreduction efforts may not be successful.
TVA is continuingundertaking a cost optimization project to improve operating efficiencies topartially offset any potential future reductions in power demandcost increases expected for the years 2024 through 2026, and maintain itsachieving this may prove challenging, particularly if inflation rates reputation, cash flows, results of operations, and financial condition.remain high. The failure to achieve or
maintain cost reductionsreduction targets could adversely affect TVA's rates, reputation, cash flows, results of operations, and financial condition. Moreover, if TVA fails to limit rate increases as provided in the long-term Partnership Agreements, participating LPCs can terminate the Partnership Agreements.
TVA's organizational structure may not adequately support TVA's anticipated business needs or enable it to meet the needs of its current or potential customers.
TVA has been modifying its organizational structure to better adapt to the forecasted economic environment. If TVA's assumptions about either its forecasts or the proper internal structure of the company to meet the expected environment are inaccurate or if this structure does not adequately support TVA's needs, TVA could face operational or financial challenges that could adversely affect its cash flows, results of operations, and financial condition as well as TVA's ability to attract or retain a skilled workforce and to meet the needs of its current or potential customers.
TVA may have difficulty in adapting its business model to changes in the utility industry and customer preferences.
The traditional business model for power production, selling power from centrally located plants, is facing pressure from a variety of sources, including the potential for self-generation by current or potential customers, new technologies such as energy storage, and increased energy efficiency. These pressures may reduce the demand for TVA power. If TVA does not or cannot adapt to this pressure by adequately changing its business model, TVA's financial condition and results of operations could be negatively affected.
TVA's reputation may be negatively impacted.
As with any company, TVA's reputation is a vital element of its ability to effectively conduct its business. TVA's reputation could be harmed by a variety of factors, including the failure of a generating asset or supporting infrastructure,infrastructure; failure to effectively manage land and other natural resources entrusted to TVA,TVA; real or perceived violations of environmental regulations, including those related to climate change; real or perceived issues with TVA's safety culture or work environment,environment; inability to meet its human capital management goals; inability to meet its carbon reduction aspirations; inability to keep its electricity rates stable; involvement in a class-action or other high-profile lawsuit; significant delays in construction projects,projects; occurrence of or responses to cyber attacks or security vulnerabilities; acts or omissions of TVA management or acts or omissions of a contractor or other third-party working with or for TVA, the perception of such actswhich actually or omissions,perceivably reflect negatively on TVA; measures taken to offset reductions in demand or to supply rising demand; or a significant dispute with one of TVA's customers.
Any deterioration in TVA's reputation may harm TVA's relationships with its customers and stakeholders, may increase its cost of doing business, may interfere with its ability to attract and retain a skilledqualified, inclusive, and diverse workforce, may impact TVA's ability to raise debt capital, and may potentially lead to the enactment of new laws and regulations, or the modification of existing laws and regulations, that negatively affect the way TVA conducts its business.
ITEM 1B. UNRESOLVED STAFF COMMENTS
Not applicable.
ITEM 1C. CYBERSECURITY
Not applicable.
ITEM 2. PROPERTIES
TVA holds personal property in its own name but holds real property as agent for the U.S. TVA may acquire real property as an agent of the U.S. by negotiated purchase or by eminent domain.
Generating Properties
At September 30, 2020,2023, TVA-operated generating assets consisted of seven nuclear units, 2524 active coal-fired units, 8689 simple-cycle units (84 active units and five idled units), one cogeneration unit, 14 combined-cycle power blocks, 109 conventional hydroelectric units (106 active units and three units in long-term outage and unavailable for service), four pumped-storage hydroelectric units, five diesel generator units, and 14nine operating solar sites.installations. As of September 30, 2020, eight of the simple-cycle combustion turbine units and2023, four of the combined-cycle power blocks were leased to special purpose entities ("SPEs") and leased back to TVA under long-term leases. See Note 1011 — Variable Interest Entities and Note 1314 — Debt and Other Obligations — Lease/Leasebacks. In addition, TVA is leasing the three Caledonia combined-cycle power blocks under a long-term lease. For a discussion of these assets, see Item 1, Business — Power Supply and Load Management Resources.
Net Capability
The following table summarizes TVA's summer net capability in MW at September 30, 2020:
| | | | | | | | | | | | | | | | | | | | | | | | | | | | | |
SUMMER NET CAPABILITY(1) At September 30, 2020 |
Source of Capability | Location | | Number
of Units | | Summer Net Capability (MW) | | Date First Unit Placed in Service (CY) | | Date Last Unit Placed in Service (CY) |
| TVA-Operated Generating Facilities | | | | | | | | | |
| Nuclear | | | | | | | | | |
Browns Ferry(2) | Alabama | | 3 | | | 3,309 | | | 1974 | | 1977 |
| Sequoyah | Tennessee | | 2 | | | 2,292 | | | 1981 | | 1982 |
| Watts Bar | Tennessee | | 2 | | | 2,321 | | | 1996 | | 2016 |
| Total Nuclear | | | 7 | | | 7,922 | | | | | |
| Coal-Fired | | | | | | | | | |
| Bull Run | Tennessee | | 1 | | | 865 | | | 1967 | | 1967 |
| Cumberland | Tennessee | | 2 | | | 2,470 | | | 1973 | | 1973 |
| Gallatin | Tennessee | | 4 | | | 976 | | | 1956 | | 1959 |
| Kingston | Tennessee | | 9 | | | 1,398 | | | 1954 | | 1955 |
| | | | | | | | | |
| Shawnee | Kentucky | | 9 | | | 1,206 | | | 1953 | | 1955 |
| Total Coal-Fired | | | 25 | | 6,915 | | | | | |
Natural Gas and/or Oil-Fired(3)(4) | | | | | | | | | |
| Simple-Cycle Combustion Turbine | | | | | | | | | |
| Allen | Tennessee | | 20 | | | 456 | | | 1971 | | 1972 |
| Brownsville | Tennessee | | 4 | | | 468 | | | 1999 | | 1999 |
| Colbert | Alabama | | 8 | | | 392 | | | 1972 | | 1972 |
| Gallatin | Tennessee | | 8 | | | 642 | | | 1975 | | 2000 |
| Gleason | Tennessee | | 3 | | | 500 | | | 2000 | | 2000 |
| Johnsonville | Tennessee | | 19 | | | 1,189 | | | 1975 | | 2000 |
| Kemper | Mississippi | | 4 | | | 348 | | | 2002 | | 2002 |
| Lagoon Creek | Tennessee | | 12 | | | 1,048 | | | 2001 | | 2002 |
| Marshall County | Kentucky | | 8 | | | 608 | | | 2002 | | 2002 |
| Subtotal Simple-Cycle Combustion Turbine | | | 86 | | | 5,651 | | | | | |
| Combined-Cycle Combustion Turbine | | | | | | | | | |
Ackerman(5) | Mississippi | | 1 | | | 713 | | | 2007 | | 2007 |
Allen(6) | Tennessee | | 1 | | | 1,106 | | | 2018 | | 2018 |
Caledonia(7) | Mississippi | | 3 | | | 765 | | | 2003 | | 2003 |
John Sevier(8) | Tennessee | | 1 | | | 871 | | | 2012 | | | 2012 | |
Lagoon Creek(9) | Tennessee | | 1 | | | 525 | | | 2010 | | 2010 |
| Magnolia | Mississippi | | 3 | | | 918 | | | 2003 | | 2003 |
Paradise(10) | Kentucky | | 1 | | | 1,100 | | | 2017 | | 2017 |
| Southaven | Mississippi | | 3 | | | 780 | | | 2003 | | 2003 |
| Subtotal Combined-Cycle Combustion Turbine | | 14 | | | 6,778 | | | | | |
| Co-Generation | | | | | | | | | |
| Johnsonville | Tennessee | | 1 | | | 80 | | | 1975 | | 2000 |
| Total Natural Gas and/or Oil-Fired | | | 101 | | | 12,509 | | | | | |
| Hydroelectric | | | | | | | | | |
| Conventional Plants | Alabama | | 36 | | | 1,176 | | | 1925 | | 1962 |
| | Georgia | | 2 | | | 35 | | | 1931 | | 1956 |
| | Kentucky | | 5 | | | 223 | | | 1944 | | 1948 |
| | North Carolina | | 6 | | | 492 | | | 1940 | | 1956 |
| | Tennessee | | 60 | | | 1,833 | | | 1912 | | 1972 |
Pumped-Storage(11) | Tennessee | | 4 | | | 1,635 | | | 1978 | | 1979 |
| Total Hydroelectric | | | 113 | | | 5,394 | | | | | |
| Diesel Generator | | | | | | | | | |
| Meridian | Mississippi | | 5 | | | 9 | | | 1998 | | 1998 |
TVA Non-hydro Renewable Resources(12) | | | | | 1 | | | | |
| Total TVA-Operated Generating Facilities | | | | 32,750 | | | | | |
Contract Renewable Resources(13) | | | | | 324 | | | | | |
Power Purchase and Other Agreements(14) | | | | | 3,863 | | | | | |
| Total Summer Net Capability | | | | | 36,937 | | | | | |
Notes
(1) Net capability is defined as the ability of an electric system, generating unit, or other system component to carry or generate power for a specified time periodperiod. It does not include real-time bulk electrical system operating constraints such as transmission line loading limitations, fuel availability such as coal, gas, and seasonal river reservoir levels, fuel blend, severe weather events, environmental and/or other regulatory constraints, transmission system outages, generator outages, or generator derates. Summer net capability as presented in the table below reflects the expected output of individual resources at TVA’s anticipated summer demand peak. The summation of those individual resources does not include the real-time bulk electrical system operating constraints previously noted. See also Item 1A, Risk Factors— Operational Risks and Risks Related to the Environment and Catastrophic Events.
In addition to the TVA-operated generating facilities presented in the table below, TVA also has 8,471 MWs of operating capacity available through PPAs. At September 30, 2023, these contracts were comprised of 3,061 MWs of renewable PPAs and 5,410 MWs of nonrenewable PPAs. The summation of TVA's PPAs under contract does not include real-time operating constraints, such as intermittency of renewable resources associated with weather or other factors. See Item 1, Business — Power Supply and Load Management Resources — Power Purchase and Other Agreements for information on TVA's renewable and nonrenewable power purchase contracts by resource type and location.
and does not include operational limitations such as derates.
(2) The following table summarizes TVA's summer net capability for Browns Ferry excludes the impact of the EPU project. The generating capability is expected to increase by an estimatedin MW at September 30, 2023:
465 MW after sufficient run time to validate the new capacity upon issuance of the engineering memos. | | | | | | | | | | | | | | | | | | | | | | | | | | | | | |
SUMMER NET CAPABILITY At September 30, 2023 |
Source of Capability | Location | | Number
of Units | | Summer Net Capability (MW) | | Date First Unit Placed in Service (CY) | | Date Last Unit Placed in Service (CY) |
| TVA-Operated Generating Facilities | | | | | | | | | |
| Nuclear | | | | | | | | | |
| Browns Ferry | Alabama | | 3 | | | 3,662 | | | 1974 | | 1977 |
| Sequoyah | Tennessee | | 2 | | | 2,292 | | | 1981 | | 1982 |
| Watts Bar | Tennessee | | 2 | | | 2,278 | | | 1996 | | 2016 |
| Total Nuclear | | | 7 | | | 8,232 | | | | | |
| Coal-Fired | | | | | | | | | |
| | | | | | | | | |
| Cumberland | Tennessee | | 2 | | | 2,470 | | | 1973 | | 1973 |
| Gallatin | Tennessee | | 4 | | | 976 | | | 1956 | | 1959 |
| Kingston | Tennessee | | 9 | | | 1,298 | | | 1954 | | 1955 |
| | | | | | | | | |
| Shawnee | Kentucky | | 9 | | | 1,071 | | | 1953 | | 1955 |
| Total Coal-Fired | | | 24 | | 5,815 | | | | | |
Natural Gas and/or Oil-Fired(1)(2) | | | | | | | | | |
| Simple-Cycle Combustion Turbine | | | | | | | | | |
Allen(3) | Tennessee | | 20 | | | 287 | | | 1971 | | 1972 |
| Brownsville | Tennessee | | 4 | | | 438 | | | 1999 | | 1999 |
| Colbert | Alabama | | 11 | | | 1,041 | | | 1972 | | 2023 |
| Gallatin | Tennessee | | 8 | | | 580 | | | 1975 | | 2000 |
| Gleason | Tennessee | | 3 | | | 455 | | | 2000 | | 2000 |
| Johnsonville | Tennessee | | 19 | | | 1,028 | | | 1975 | | 2000 |
| Kemper | Mississippi | | 4 | | | 292 | | | 2002 | | 2002 |
| Lagoon Creek | Tennessee | | 12 | | | 884 | | | 2001 | | 2002 |
| Marshall County | Kentucky | | 8 | | | 592 | | | 2002 | | 2002 |
| Subtotal Simple-Cycle Combustion Turbine | | | 89 | | | 5,597 | | | | | |
| Combined-Cycle Combustion Turbine | | | | | | | | | |
Ackerman(4) | Mississippi | | 1 | | | 713 | | | 2007 | | 2007 |
Allen(5) | Tennessee | | 1 | | | 1,106 | | | 2018 | | 2018 |
Caledonia(6) | Mississippi | | 3 | | | 819 | | | 2003 | | 2003 |
John Sevier(7) | Tennessee | | 1 | | | 871 | | | 2012 | | | 2012 | |
Lagoon Creek(8) | Tennessee | | 1 | | | 596 | | | 2010 | | 2010 |
| Magnolia | Mississippi | | 3 | | | 951 | | | 2003 | | 2003 |
Paradise(9) | Kentucky | | 1 | | | 1,100 | | | 2017 | | 2017 |
| Southaven | Mississippi | | 3 | | | 802 | | | 2003 | | 2003 |
| Subtotal Combined-Cycle Combustion Turbine | | 14 | | | 6,958 | | | | | |
| Co-Generation | | | | | | | | | |
| Johnsonville | Tennessee | | 1 | | | 83 | | | 1975 | | 2000 |
| Total Natural Gas and/or Oil-Fired | | | 104 | | | 12,638 | | | | | |
| Hydroelectric | | | | | | | | | |
| Conventional Plants | Alabama | | 36 | | | 1,159 | | | 1925 | | 1962 |
| | Georgia | | 2 | | | 37 | | | 1931 | | 1956 |
| | Kentucky | | 5 | | | 225 | | | 1944 | | 1948 |
| | North Carolina | | 6 | | | 473 | | | 1940 | | 1956 |
| | Tennessee(3)(10) | | 60 | | | 1,845 | | | 1912 | | 1972 |
Pumped-Storage(11) | Tennessee | | 4 | | | 1,700 | | | 1978 | | 1979 |
| Total Hydroelectric | | | 113 | | | 5,439 | | | | | |
| Diesel Generator | | | | | | | | | |
| Meridian | Mississippi | | 5 | | | 9 | | | 1998 | | 1998 |
TVA Non-hydro Renewable Resources(12) | | | | | 1 | | | | | |
TVA Other Nonrenewable Resources(12) | | | | | 5 | | | | | |
| Total TVA-Operated Generating Facilities Summer Net Capability | | | | 32,139 | | | | | |
| | | | | | | | | |
| | | | | | | | |
| | | | | | | | |
| | | | | | | | | |
Notes
(3)(1) See Generating Properties above for a discussion of TVA-operated natural gas and/or oil-fired facilities subject to leaseback and long-term lease arrangements.
(4) Peak(2) As of September 30, 2023, 137 MW of peak firing short-term capability of simple-cycle combustion turbine units accountswas not operational and would require additional
investment for 326 MWdependable use; therefore, this short-term capability is not presented in the table above.
(3) As of short-term capability.September 30, 2023, TVA had five idled units at Allen Combustion Turbine Facility (Units 2, 3, 11, 17, and 18) and three units that were in long-term outage and unavailable for service at Wilbur Hydroelectric Facility (Units 1-3). These units are included in their respective locations in the table above; however, the capability from these units is excluded.
(5)(4) Ackerman Combined Cycle Facility is a single steam cycle unit driven by two gas turbines (2x1 configuration).
(5) Allen Combined Cycle Facility is a single steam cycle unit driven by two gas turbines (2x1 configuration).
(7)(6) Caledonia Combined Cycle Plant ("Caledonia CC") is currently a leased facility operated by TVA.
(8)(7) John Sevier Combined Cycle Facility ("John Sevier CCF") is a single steam cycle unit driven by three gas turbines (3x1 configuration).
(9)(8) Lagoon Creek Combined Cycle Facility is a single steam cycle unit driven by two gas turbines (2x1 configuration).
(10)(9) Paradise Combined Cycle Facility is a single steam cycle unit driven by three gas turbines (3x1 configuration).
(10) Includes 86 MW of summer net capability associated with Hiwassee Hydro Unit 2. See Item 1, Business — Power Supply and Load Management Resources — Renewable Energy Resources — Conventional Hydroelectric Dams.
(11) See Item 1, Business — Power Supply and Load Management Resources — Hiwassee Hydro Unit 2Hydroelectric Pumped-Storage for a discussion of Hiwassee Hydro Unit 2.Raccoon Mountain Pumped-Storage Plant.
(12) TVA owns approximately 1one MW of renewable solar capability among nine operating solar installations, at 14 solar sites.
(13) Contract Renewable Resources include capability from various renewable energy programs established by TVA to encourage the developmentand Allen Combined Cycle Facility has five MW of solar, wind,nonrenewable biomass and low-impact hydroelectric generation systems across the Tennessee Valley.
(14) Power Purchase and Other Agreements includes renewable resources. See Item 1, Business — Power Supply and Load Management Resources — Power Purchase and Other Agreements for information on renewable energy power purchase contracts.capability.
Transmission Properties
TVA's transmission system interconnects with systems of surrounding utilities and, at September 30, 2023, consisted primarily of the following assets at September 30, 2020:
•Approximatelyapproximately 2,500 circuit miles of 500 kilovolt, 11,80011,900 circuit miles of 161 kilovolt, 2,000and 1,900 circuit miles of other voltage transmission lines, and 3,900lines; 5,113 miles of fiber optic lines;
•517 573 transmission substations, power switchyards, and switching stations; and
•1,322 1,355 customer connection points (customer, generation, and interconnection).
At September 30, 2020, certain qualified technological equipment and other software related to TVA's transmission system were leased to private entities and leased back to TVA under long-term leases. See Note 13 — Debt and Other Obligations — Lease/Leasebacks and Note 22— Commitments and Contingencies — Commitments— Leasebacks.
Natural Resource Stewardship Properties
TVA operates and maintains 49 dams and manages the following natural resource stewardship properties:
•Approximatelyapproximately 11,000 miles of reservoir shoreline;
•Approximatelyshoreline, 293,000 acres of reservoir land;
•Approximatelyland, 650,000 surface acres of reservoir water;water, and
•Approximately approximately 100 public recreation areas throughout the Tennessee Valley, including campgrounds, day-use areas, and boat launching ramps.
Additionally, TVA manages over 170150 agreements for commercial recreation (such as campgrounds and marinas). As part of its stewardship responsibilities, TVA approval is required to be obtained before any obstruction affecting navigation, flood control, or public lands can be constructed inacross, along, or alongin the Tennessee River and its tributaries. These public lands and waters managed by TVA provide both conservation and responsible recreation, and serve as a driver for nearly $12.0 billion dollars of annual economic activity across the Tennessee Valley each year.sustainable recreation.
Buildings
TVA has a variety of buildings and structures located throughout its service area includingto support TVA's mission of service. These buildings and structures include generation and transmission facilities, corporate offices, customer service centers, power service centers, warehouses, visitor centers, and crew quarters. Two significant buildings are its Knoxville Office Complex ("KOC") and the Chattanooga Office Complex ("COC") in Tennessee. In 2013,
TVA initiated a studyengages in ongoing Tennessee Valley-wide real property portfolio evaluations of itsbuildings, structures, and land as part of the strategic real estate portfolio for the purpose ofprogram, which focuses on reducing cost, right-sizing the portfolio, and aligning its real estate holdings with TVA's strategic direction over the next 10direction. In addition, TVA continues to 20 years. As partoperate in a hybrid work environment for those who do not have to be physically present at a TVA facility. See Part II, Item 7, Management's Discussion and Analysis of this effort, TVA completed a comprehensive assessmentFinancial Condition and Results of its real estate holdings in the Knoxville region in 2016. For a discussion of these real estate holdings, see Disposal of PropertyOperations — Key Initiatives and Challenges— KnoxvilleReal Property Portfoliobelow..
Disposal of Property
TVA has broad authority to dispose of personal property but only limited authority to dispose of real property. TVA's primary, but not exclusive, authority to dispose of real property is briefly described below:
•as follows: TVA has authority to dispose of surplus real property at a public auction;
•TVA may dispose of real property for certain specified purposes, including providing replacement lands for certain entities whose lands were flooded or destroyed by dam or reservoir construction, providing real property for recreational use, and granting easements and rights-of-way upon which are located transmission or distribution lines;
•TVA can dispose of real property in connection with the construction of generating plants or other facilities under certain circumstances; and
•TVA has authority to grant easements for rights-of-way and other purposes.
The Basic Tennessee Valley Authority Power Bond Resolution adopted by the TVA Board on October 6, 1960, as amended on September 28, 1976, October 17, 1989, and March 25, 1992 (the "Basic Resolution") prohibits TVA (1) from mortgaging any part of its power properties and (2) from disposing of all or any substantial portion of these properties unless TVA provides for a continuance of the interest, principal, and sinking fund payments due and to become due on all outstanding Bonds, or for the retirement of such Bonds.
Tableof Contents Knoxville Property. In 2016, TVA completed a comprehensive assessment of its real estate holdings in the Knoxville, Tennessee region including the KOC and adjacent Summer Place Complex ("SPC"). As a result of this study and a subsequent Environmental Assessment in 2017, TVA has consolidated its Knoxville area employees into the West Tower of the KOC and the Greenway Drive Transmission Service Center, and is completing the centralized field offices in Norris, Tennessee. As part of this consolidation effort, TVA approved the conveyance of the SPC and the East Tower of the KOC and the transaction closed in August 2020.
ITEM 3. LEGAL PROCEEDINGS
From time to time, TVA is party to or otherwise involved in lawsuits, claims, proceedings, investigations, and other legal matters ("Legal Proceedings") that have arisen in the ordinary course of conducting TVA'sits activities, as a result of catastrophic events or otherwise. While the outcome of the Legal Proceedings to which TVA is a party cannot be predicted with certainty, any adverse outcome to a Legal Proceeding involving TVA may have a material adverse effect on TVA's cash flows,financial condition, results of operations, and financial condition. cash flows.
For a discussion of Legal Proceedings involving TVA, see Note 22 — Commitments and Contingencies — Legal Proceedings, which discussions arediscussion is incorporated by reference into this Item 3.
ITEM 4. MINE SAFETY DISCLOSURES
Not applicable.
PART II
ITEM 5. MARKET FOR REGISTRANT'S COMMON EQUITY, RELATED STOCKHOLDER MATTERS AND ISSUER PURCHASES OF EQUITY SECURITIES
Not applicable.
ITEM 6. SELECTED FINANCIAL DATARESERVED
Not applicable.
The following selected financial data for the years 2016 through 2020 should be read in conjunction with the audited financial statements and notes thereto (collectively, the "Consolidated Financial Statements") presented in Item 8, Financial Statements and Supplementary Data. Certain reclassifications have been made to the 2016, 2017, and 2018 financial statement presentations to conform to the 2019 and 2020 presentations.
| | | | | | | | | | | | | | | | | | | | | | | | | | | | | |
Selected Financial Data(1)(2) For the years ended, or at, September 30 (dollars in millions) |
| | 2020 | | 2019 | | 2018 | | 2017 | | 2016 |
| Sales (millions of kWh) | 151,251 | | | 158,443 | | | 160,338 | | | 152,362 | | | 155,855 | |
| | | | | | | | | |
Peak load (MW)(3) | 28,931 | | | 29,569 | | | 32,509 | | | 29,899 | | | 29,824 | |
| | | | | | | | | |
| Operating revenues | $ | 10,249 | | | $ | 11,318 | | | $ | 11,233 | | | $ | 10,739 | | | $ | 10,616 | |
| | | | | | | | | |
| Net income | $ | 1,352 | | | $ | 1,417 | | | $ | 1,119 | | | $ | 685 | | | $ | 1,233 | |
| | | | | | | | | |
| Total assets | $ | 52,825 | | | $ | 50,467 | | | $ | 48,667 | | | $ | 50,017 | | | $ | 50,494 | |
| | | | | | | | | |
| Financial obligations | | | | | | | | | |
Long-term debt, net(4) | | | | | | | | | |
| Long-term power bonds, net | $ | 17,956 | | | $ | 19,094 | | | $ | 20,157 | | | $ | 20,205 | | | $ | 20,901 | |
| Long-term debt of variable interest entities, net | 1,048 | | | 1,089 | | | 1,127 | | | 1,164 | | | 1,199 | |
| Long-term notes payable | — | | | — | | | 23 | | | 69 | | | 48 | |
| Total long-term debt, net | $ | 19,004 | | | $ | 20,183 | | | $ | 21,307 | | | $ | 21,438 | | | $ | 22,148 | |
| | | | | | | | | |
Current debt, net(4) | | | | | | | | | |
| Short-term debt, net | $ | 57 | | | $ | 922 | | | $ | 1,216 | | | $ | 1,998 | | | $ | 1,407 | |
| Current maturities of power bonds | 1,787 | | | 1,030 | | | 1,032 | | | 1,728 | | | 1,555 | |
| Current maturities of long-term debt of variable interest entities | 41 | | | 39 | | | 38 | | | 36 | | | 35 | |
| Current maturities of notes payable | — | | | 23 | | | 46 | | | 53 | | | 27 | |
| Total current debt, net | $ | 1,885 | | | $ | 2,014 | | | $ | 2,332 | | | $ | 3,815 | | | $ | 3,024 | |
| | | | | | | | | |
Total debt(4) | $ | 20,889 | | | $ | 22,197 | | | $ | 23,639 | | | $ | 25,253 | | | $ | 25,172 | |
| | | | | | | | | |
Finance leases(5) | $ | 566 | | | $ | 187 | | | $ | 182 | | | $ | 187 | | | $ | 181 | |
| | | | | | | | | |
| Leaseback obligations | $ | 223 | | | $ | 263 | | | $ | 301 | | | $ | 339 | | | $ | 467 | |
Notes
(1) See Item 7, Management's Discussion and Analysis of Financial Condition and Results of Operations for a description of certain items in 2020, 2019, and 2018 affecting results in those years.
(2) See Item 1A, Risk Factors and Note 22— Commitments and Contingencies for a discussion of risks and contingencies that could affect TVA's future financial results.
(3) TVA met an all-time summer peak demand of 33,482 megawatts ("MW") on August 16, 2007, at 102 degrees Fahrenheit and an all-time winter peak demand of 33,352 MW on January 24, 2014, at 7.3 degrees Fahrenheit.
(4) See Note 10 — Variable Interest Entities and Note 13— Debt and Other Obligations — Debt Outstanding.
(5) Included in Accounts payable and accrued liabilities and Finance lease liabilities on the Consolidated Balance Sheets.
ITEM 7. MANAGEMENT'S DISCUSSION AND ANALYSIS OF FINANCIAL CONDITION AND RESULTS OF OPERATIONS
(Dollars in millions except where noted)
The following Management's Discussion and Analysis of Financial Condition and Results of Operations ("MD&A") is intended to help the reader understand the Tennessee Valley Authority ("TVA"), its financial condition, results of operations, and cash flows, and its present business environment. The MD&A is provided as a supplement to, and should be read in conjunction with, TVA's consolidated financial statements and the accompanying notes thereto contained in Item 8, Financial Statements and Supplementary Data of this Annual Report on Form 10-K for the fiscal year ended September 30, 20202023 (the "Annual Report"). See Item 7, Management's Discussion and Analysis of Financial Condition and Results of Operations in TVA's Annual Report on Form 10-K/A10-K for the year ended September 30, 2019,2022, filed with the Securities and Exchange Commission ("SEC") on November 15, 2019,2022, for a discussion of variance drivers for the year ended September 30, 2019,2022, as compared to the year ended September 30, 2018.2021. The MD&A includes the following sections:
•Business and Mission — a general description of TVA's business, objectives, strategic priorities, and core capabilities;
•Executive Overview — a general overview of TVA's activities and results of operations for 2020;2023;
•Results of Operations — an analysis of TVA's consolidated results of operations for 20192022 and 2020;2023;
•Liquidity and Capital Resources — an analysis of cash flows, a description of aggregate contractual obligations, and an overview of financial position;
•Key Initiatives and Challenges — an overview of current and future initiatives and challenges facing TVA;
•Critical Accounting Policies and Estimates — a summary of accounting policies that require criticalsignificant estimates, judgments, and estimates;
•Fair Value Measurements — a description of TVA's investmentsassumptions that affect the amounts reported in the consolidated financial statements and derivative instruments and valuation considerations;accompanying notes;
•Legislative and Regulatory Matters — a summary of laws and regulations that may impact TVA; and
•Risk Management Activities — a description of TVA's risk governance and exposure to various market risks.
Business and Mission
Business
TVA operates the nation's largest public power system. At September 30, 2020,2023, TVA provided electricity to approximately 49 large industrialhad 60 directly served customers, which include seven federal agency customers, and 153 local power company customers ("LPCs") that serve approximately 10 million people in parts of seven southeastern states. TVA generates nearly all of its revenues from the sale of electricity, and in 20202023 revenues from the sale of electricity totaled $10.1$11.9 billion. As a wholly-owned agency and instrumentality of the United States ("U.S."), however, TVA differs from other electric utilities in a number of ways:
•TVA is a government corporation.
•The area in which TVA sells power is limited by the Tennessee Valley Authority Act of 1933, as amended, (the "TVA Act"), under a provision known as the "fence"; however, another provision of federal law known as the "anti-cherrypicking" provisionAnti-Cherrypicking Amendment ("ACPA") generally protects TVA from being forced to provide access to its transmission lines to others for the purpose of delivering power to customers within substantially all of TVA's defined service area.
•The rates TVA charges for power are set solely by the TVA Board of Directors ("TVA Board") and are not set or reviewed by another entity, such as a public utility commission. In setting rates, however, the TVA Board is charged by the TVA Act to have due regard for the primary objectives of the TVA Act, including the objective that power be sold at rates as low as feasible.
•TVA is not authorized to raise capital by issuing equity securities. TVA relies primarily on cash from operations and proceeds from power program borrowings to fund its operations and is authorized by the TVA Act to issue bonds, notes, or other evidences of indebtedness (collectively, "Bonds") in an amount not to exceed $30.0 billion outstanding at any given time. Although TVA's operations were originally funded primarily with appropriations from Congress, TVA has not received any appropriations from Congress for any activities since 1999 and, as directed by Congress, has funded essential stewardship activities primarily with power revenues.
TVA's Mission of Service
TVA was built for the people, created by federal legislation, and charged with a unique mission - to improve the quality of life in a seven-state region through the integrated management of the region's resources. TVA's mission focuses on three key areas:
| | | | | | | | |
| ENERGY | ENVIRONMENT | ECONOMIC DEVELOPMENT |
•Energy — Delivering affordable, reliable, power;low cost, clean energy;
•Environment — Caring for the region's natural resources; and
•Economic Development — Creating sustainable economic growth.
While TVA's mission has not changed since it was established in 1933, the climate in which TVA operates continues to evolve. The business and economic environment has become more challenging due to economic conditions; tougher environmental standards; and the need to diversify its power supply and adapt to changing customer usage behaviors, new technologies, and emerging, non-traditional competition. To continue to deliver its mission of service while evolving for future success, TVA must realize five strategic priorities:priorities, which are comprised of several strategic elements each:
•Powerful Partnerships — Promoting progress through the shared success of TVA's customers and stakeholders;
•People Advantage — Amplifying the energy, passion, and creativity within each TVA employee;
•Operational Excellence — Building on TVA's best-in-class reputation for reliable service and competitively priced power;
•Igniting Innovation — Pursuing innovative solutions for TVA and its customers and communities; and
•Financial Strength — Investing in the future, while keeping energy costs as low as possible. | | | | | | | | | | | | | | | | | | | | | | | | | | |
| | | | | | | | |
| | | | | | | | |
| Accelerate the impact of inclusion with diversity within TVA and the communities TVA serves | | Nation’s top nuclear fleet by 2025 | | Maintain financial health while funding TVA's energy transition | | Enhance TVA's role as a community leader and trusted partner | | Advance energy transformation in the Tennessee Valley through innovation |
| Deliver an enterprise talent strategy that will bring TVA's business priorities to life | | Evolve TVA's reliable and clean energy supply into the energy system of the future | | Balance commitments and obligations | | Engage and attract economic development opportunities and support the Tennessee Valley's energy transition | | Establish a focused innovation framework and mindset |
| Cultivate a positive employee experience to heighten workforce engagement and performance as TVA works everywhere to serve | | Lead the industry in reliable, resilient, cost-effective carbon reduction | | Develop long-term business model | | Champion the unique value of the Tennessee Valley public power model | | |
| | Advance TVA's grid capabilities to meet the reliability, resiliency, and flexibility needs of the future | | | | Meet resource and environmental stewardship commitments | | |
TVA's mission sets the stage for its strategic planning process that includes strategic objectives, initiatives, and scorecards for performance designed to provide clear direction for improving TVA's core business.
Linking the Mission to Performance
TVA has formulated key performance measures to support its strategic priorities. The intent of these measures is to align employees to TVA's mission by focusing its collective efforts on operational excellence, fiscal responsibility, economic
development, and environmental stewardship. The measures are designed to promote teamwork, encourage high performance behaviors, and motivate TVA employees to achieve goals aligned with TVA's mission and values. The 20202023 corporate results compared with targets for these key measures are reflected in the chart below, in addition to the 2021 corporatebelow. TVA has not yet established performance measures approved effective November 2020.for 2024. See Part III, Item 11, Executive Compensation — Compensation Discussion and Analysis for information regarding how the measures are calculated.
| | | | | | | | | | | | | | | | | |
| 2020 Corporate Measure | Weight | Actual | Threshold | Target | Stretch |
| TVA total spending ($ millions) | 40% | $ | 4,441 | | $ | 4,987 | | $ | 4,847 | | $ | 4,707 | |
| Load not served (system minutes) | 30% | 2.7 | | 4.8 | | 3.9 | | 3.5 | |
| Nuclear unit capability factor (UCF) (%) | 15% | 90.0 | % | 89.5 | % | 90.9 | % | 92.2 | % |
| Combined cycle equivalent availability factor (%) | 10% | 84.0 | % | 72.6 | % | 77.6 | % | 85.4 | % |
| Coal equivalent availability factor (%) | 5% | 79.4 | % | 56.8 | % | 61.8 | % | 80.8 | % |
| | 2021 Corporate Measure | Weight | | Threshold | Target | Stretch | |
| 2023 Corporate Measure | | 2023 Corporate Measure | Weight | Actual | Threshold | Target | Stretch |
| TVA total spending ($ millions) | TVA total spending ($ millions) | 40% | | Budget | | TVA total spending ($ millions) | 40% | $ | 6,168 | | $ | 6,757 | | $ | 6,560 | | $ | 6,362 | |
| Load not served (system minutes) | Load not served (system minutes) | 30% | | 4.6 | | 3.9 | | 3.4 | | Load not served (system minutes) | 30% | 3.1 | | 4.5 | | 3.9 | | 3.2 | |
| Nuclear unit capability factor (UCF) (%) | 15% | | 91.3 | % | 92.0 | % | 93.7 | % | |
| Annualized nuclear online reliability loss factor (%) | | Annualized nuclear online reliability loss factor (%) | 15% | 1.53 | % | 3.14 | % | 2.00 | % | 1.26 | % |
| Combined cycle equivalent availability factor (%) | Combined cycle equivalent availability factor (%) | 10% | | 75.9 | % | 80.9 | % | 85.8 | % | Combined cycle equivalent availability factor (%) | 10% | 83.9 | % | 78.6 | % | 83.6 | % | 89.0 | % |
| Coal equivalent availability factor (%) | Coal equivalent availability factor (%) | 5% | | 59.0 | % | 64.0 | % | 82.1 | % | Coal equivalent availability factor (%) | 5% | 74.8 | % | 58.8 | % | 63.8 | % | 73.3 | % |
Executive Overview
TVA's operating revenues were $10.2$12.1 billion and $11.3$12.5 billion for the years ended September 30, 20202023 and 2019,2022, respectively. The decrease in operating revenue was primarily due to lower sales volume as a result of milder weatherOperating revenues decreased for the TVA service area and impacts from the COVID-19 pandemic, as well as lower fuel cost recovery revenue from lower fuel rates. Despite record-setting heat experienced during October 2019 and record-setting cold during November 2019, TVA's service territory experienced overall milder weather during the year ended September 30, 2020, which decreased energy sales. TVA also experienced lower energy sales2023 as compared to the prior year, primarily as a result of the COVID-19 pandemic,lower sales volume and lower fuel rates. The decreased sales volume was driven by certain commercialoverall milder weather during 2023. Although TVA sustained several days of single-digit temperatures and industrial customers curtailing operationsexperienced record-setting demand as a result of Winter Storm Elliott in responselate December 2022, these impacts were more than offset by TVA experiencing milder weather during the remainder of 2023. The lower fuel rates were primarily due to COVID-19 pandemic social distancing standards and economic conditions. TVA estimates base revenues were reduced by approximately $185lower natural gas prices.
Total operating expenses increased $231 million for the year ended September 30, 2020, due to the impacts of COVID-19. Despite the reduction in revenue due to the COVID-19 pandemic, TVA was able to meet its financial targets, which would not have been possible without the financial discipline of TVA employees. TVA expects the COVID-19 pandemic to continue impacting revenue for 2021 and has planned for $10.0 billion in operating revenue. It is uncertain at this time the extent to which TVA's revenues may be impacted beyond 2021.
Fuel and purchased power expense decreased $439 million for the year ended September 30, 2020,2023 as compared to the prior year. This decrease was primarily due to lower effective fuel rates and lower purchased power and fuel volume driven by decreased demand, resulting from overall milder weather and the COVID-19 pandemic. Operating and maintenance expense decreased $370increased $386 million for the year ended September 30, 2020,2023, primarily due to increases in payroll and benefit costs, expenditures related to TVA's New Nuclear Program, outage and contract labor expense, and post-employment benefit expense. Depreciation and amortization expense increased $159 million as compared to the prior year. This wasyear primarily driven by prior year recoveryan increase in depreciation expense associated with the retirements of the regulatory asset for environmental cleanup costs related to the Kingston ash spill. DepreciationCumberland and Bull Run and an increase in amortization expense decreased $147of decommissioning costs. These increases were partially offset by a $288 million for the year ended September 30, 2020, as compared to the same period of the prior year. This decrease wasin purchased power expense primarily due to a decrease in depreciation expense as a resultlower demand for energy due to overall milder weather and higher availability of nuclear generation.
In the second quarter of 2023, TVA documented its final decision in 2019 to accelerateretire the retirements of Bull Runtwo coal-fired units at Cumberland Fossil Plant ("Bull Run"Cumberland"). TVA is working on the replacement generation for the first unit at Cumberland with a 1,450 megawatts ("MW") and Paradise Fossil Plant ("Paradise").
In March 2020, the World Health Organization declared the outbreak of COVID-19combined cycle plant that is expected to be a pandemic, which continuesoperational by the end of CY 2026. The second unit is scheduled to be a serious challenge throughout the U.S. In addition to impacts to TVA, the COVID-19 pandemic has also created economic uncertainty for TVA's LPCs and the communities they serve. To support LPCs and strengthen the public power response to the COVID-19 pandemic, in March 2020, the TVA Board approved the Public Power Support and Stabilization Program, offering up to $1.0 billion of credit support to provide temporary financial relief for its LPCs in the form of deferred payments of power bills under certain circumstances. In addition, in August 2020, the TVA Board approved a $200 million Pandemic Relief Credit that will apply to service provided to TVA's LPCs, their large commercial and industrial customers, and TVA's directly served customers as a 2.5 percent monthly base rate credit during 2021. TVA continues to coordinate with LPCs and partners to understand the impact of the COVID-19 pandemic to its service territory.
TVA's operations and delivery of energy to customers have not been materially impactedretired by the COVID-19 pandemic at this time.end of CY 2028, and in May 2023, TVA experienced fluctuations relatedpublished the notice of intent to its pension plan assets and other investment portfolios during the year ended September 30, 2020, which had substantially recovered as of September 30, 2020. In responseconduct an environmental impact statement ("EIS") to the reductions in revenue, TVA has implemented various cost savings initiatives, such as deferring and prioritizing certain capital projects and decreasing discretionary spending. Due to higher volatility in the financial marketsstudy potential environmental impacts associated with the COVID-19 pandemic,proposed construction and operation of facilities to replace part of that generation. Pre-commercial plant operations began on Colbert Combustion Turbine Units 9-10 in June 2023 and on Colbert Combustion Turbine Unit 11 in early July 2023, and all units became operational on July 25, 2023. In addition, pre-commercial plant operations began on Paradise Combustion Turbine Units 5-7 in the first quarter of 2024. See Key Initiatives and Challenges — Optimum Energy Portfolio — Coal-Fired Fleet and Natural Gas-Fired Units below.
Winter Storm Elliott brought historic winter storm conditions across the majority of the United States, including the TVA increasedservice area. Rain followed by extreme cold weather and wind also created operational challenges, including the failure of several generating facilities to operate as planned and challenges in purchasing and importing generation from neighboring markets. TVA implemented emergency operation plans previously established with its target balance of CashLPCs and cash equivalents beginningdirect serve customers, including load reduction directives to LPCs which resulted in March 2020 and continued to hold higher target cash balances at September 30, 2020. TVA continues to monitor the situation and will adjust its response as necessaryrolling outages, to ensure reliable service while protecting the safetyoverall stability of the power grid. TVA has conducted a review of the actions taken both before and health of its workforceduring the event to prepare for future needs and sustaining business operations.challenges. See Key Initiatives and Challenges — —Operational Challenges — Coronavirus Pandemic for an expanded discussion of the impact to TVA and related initiatives.Winter Storm Elliott.
During 2020, TVA continued to achieve 99.999 percent reliability in delivering energy to its customers. TVA's reliability and economic development efforts, reliability, and competitive rates continued to help attract and encourage the expansion of businessor expand businesses and industries in the Tennessee Valley, with over $8.6Valley. These companies announced projected capital investments of $9.2 billion in investments and approximately 67,000are expected to create 12,276 jobs createdand retain 46,135 jobs. These amounts are forward-looking and are subject to various uncertainties. Amounts may differ materially based upon a number of factors, including, but not limited to, economic downturns or retained during the year.recessions. See Forward-Looking Information and Part I, Item 1A, Risk Factors for a discussion of additional factors, and see Part I, Item 1, Business — Economic Development Activities for definitions of "new jobs" and "retained jobs."
Results of Operations
Sales of Electricity
Sales of electricity, which accounted for nearly all of TVA's operating revenues, were 151,251157,311 million and 158,443162,608 million kilowatt hours ("kWh") for 2023 and 2022, respectively. The total sales of electricity in 2020 and 2019, respectively.2023 includes 99 million kWh of pre-commercial generation at Colbert Combustion Turbine Units 9-11. TVA sells power at wholesale rates to LPCs whothat then resell the power to their customers at retail rates. TVA also sells power to directly served customers, consisting primarily of federal agencies and customers with large or nonstandard loads. In addition, power exceeding the TVA system'sTVA's system needs is sold under exchange power arrangements with certain other power systems.
The following chart compares TVA's sales of electricity by customer type for the years ended September 30, 20202023 and 2019:2022:
| | | | | | | | |
| Sales of Electricity | |
| For the years ended September 30 |
| (millions of kWh) | |
The following charts show a breakdown of TVA's energy load:
Note
Information included in the charts above was derived from energy usage of directly served customers and customers served by LPCs during calendar year 2019,("CY") 2022, and these graphs will continue to be updated on a calendar yearCY basis.
Weather affects both the demand for TVA power and the price for that power. TVA uses degree days to measure the impact of weather on its power operations. Degree days measure the extent to which the TVA system 23-station average temperatures vary from 65 degrees Fahrenheit. Although
| | | | | | | | | | | | | | | | | | | | | | | | | | | | | | | | | | | | | | | | | | | | | |
| Degree Days |
| Variation from Normal | | | | | | Change from Prior Period |
| | 2023 | | Normal | | Percent Variation | | 2022 | | Normal(1) | | Percent Variation | | | | | | Percent Change |
| Heating Degree Days | 2,774 | | | 3,132 | | | (11.4) | % | | 3,031 | | | 3,132 | | | (3.2) | % | | | | | | (8.5) | % |
| | | | | | | | | | | | | | | | | |
| Cooling Degree Days | 1,634 | | | 1,824 | | | (10.4) | % | | 1,974 | | | 1,824 | | | 8.2 | % | | | | | | (17.2) | % |
| | | | | | | | | | | | | | | | | |
| | | | | | | | | | | | | | | | | |
Note
(1) The prior period degree day information was adjusted in 2023 in order to incorporate a change in TVA's current calculation of normal weather. TVA now calculates based on a 20-year period of weather is generally a primary driver of changes in demand for TVA power, the COVID-19 pandemic has also had a significant impact on sales of electricity for the year ended September 30, 2020.
| | | | | | | | | | | | | | | | | | | | | | | | | | | | | | | | | | | | | | | | | | | | | | | | | | | | | |
| Degree Days |
| | 2020 | | Normal | | Percent Variation | | 2019 | | Normal | | Percent Variation | | 2020 | | 2019 | | Percent Change |
| Heating Degree Days | 3,056 | | | 3,369 | | | (9.3) | % | | 3,219 | | | 3,360 | | | (4.2) | % | | 3,056 | | | 3,219 | | | (5.1) | % |
| | | | | | | | | | | | | | | | | |
| Cooling Degree Days | 1,688 | | | 1,691 | | | (0.2) | % | | 2,020 | | | 1,686 | | | 19.8 | % | | 1,688 | | | 2,020 | | | (16.4) | % |
| | | | | | | | | | | | | | | | | |
| | | | | | | | | | | | | | | | | |
Sales of electricity decreased approximately fivethree percent for the year ended September 30, 2020,2023, as compared to the prior year, primarily due to overall milder weather and the COVID-19 pandemic. Despite record-setting heat experienced during October 2019 and record-setting cold during November 2019, overall milder weather across TVA's service territory accounted for approximately 60 percentsame period of the change in sales of electricity from the prior year. The remaining decreasedecreased sales volume was driven by overall milder weather during 2023 as compared to 2022, which resulted in a 17 percent decline in cooling degree days. Although Winter Storm Elliott brought cold temperatures and record-setting demand to the Tennessee Valley region in late December 2022, these impacts were more than offset by TVA experiencing milder weather during the remainder of 2023.
For LPCs, sales of electricity was predominantlydecreased primarily due to COVID-19, driven by certain commercialthe weather impacts. For industries directly served, sales of electricity decreased across the majority of sectors, primarily resulting from changes in the economy and industrial customers curtailing operations in response to social distancing standardsrespective industry sectors and economic conditions.business-specific factors.
Financial Results
The following table compares operating results for 20202023 and 2019:2022:
| Summary Consolidated Statements of Operations | |
Summary Consolidated Statements of Operations For the years ended September 30 (in millions) | | Summary Consolidated Statements of Operations For the years ended September 30 (in millions) |
| | | 2020 | | 2019 | | | 2023 | | 2022 | | Change | | Percent Change | |
| Operating revenues | Operating revenues | $ | 10,249 | | | $ | 11,318 | | | Operating revenues | $ | 12,054 | | | $ | 12,540 | | | $ | (486) | | | (3.9) | % | |
| Operating expenses | Operating expenses | 7,538 | | | 8,507 | | | Operating expenses | 10,360 | | | 10,129 | | | 231 | | | 2.3 | % | |
| Operating income | Operating income | 2,711 | | | 2,811 | | | Operating income | 1,694 | | | 2,411 | | | (717) | | | (29.7) | % | |
| Other income, net | Other income, net | 36 | | | 62 | | | Other income, net | 61 | | | 7 | | | 54 | | | 771.4 | % | |
| Other net periodic benefit cost | Other net periodic benefit cost | 253 | | | 258 | | | Other net periodic benefit cost | 199 | | | 258 | | | (59) | | | (22.9) | % | |
| Interest expense, net | 1,142 | | | 1,198 | | | |
| Interest expense | | Interest expense | 1,056 | | | 1,052 | | | 4 | | | 0.4 | % | |
| Net income | Net income | $ | 1,352 | | | $ | 1,417 | | | Net income | $ | 500 | | | $ | 1,108 | | | $ | (608) | | | (54.9) | % | |
Operating Revenues. Operating revenues for the years ended September 30, 20202023 and 2019, consisted of2022, were $12.1 billion and $12.5 billion, respectively. The following table compares TVA's operating revenues for the following:periods indicated:
| | | | | | | | |
| Operating Revenues | |
For the years ended September 30 |
| | | | | | | | | | | | | | | | | | | | | | | |
Operating Revenues by Customer Type For the years ended September 30 (in millions) |
| | 2023 | | 2022 | | Change | | Percent Change |
| Operating revenues | | | | | | | |
| Local power companies | $ | 10,903 | | | $ | 11,291 | | | $ | (388) | | | (3.4) | % |
| Industries directly served | 864 | | | 926 | | | (62) | | | (6.7) | % |
| Federal agencies and other | 135 | | | 154 | | | (19) | | | (12.3) | % |
Revenue capitalized during pre-commercial plant operations(1) | (3) | | | — | | | (3) | | | 100.0 | % |
| | | | | | | |
| Other revenue | 155 | | | 169 | | | (14) | | | (8.3) | % |
| Total operating revenues | $ | 12,054 | | | $ | 12,540 | | | $ | (486) | | | (3.9) | % |
Note
(1)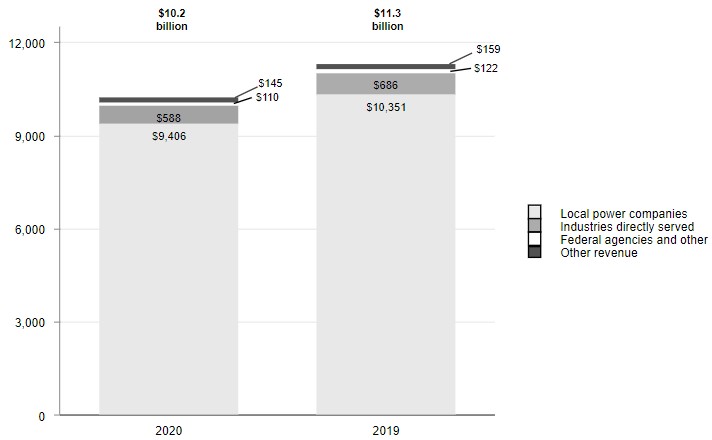
TVA's two largest LPCs — Memphis Light, Gas and Water Division ("MLGW") and Nashville Electric Service ("NES") — have contracts with a five-year and a 20-year termination notice period, respectively. Sales to MLGW and NES accounted for nine percent and eight percent, respectively, of TVA's total operating revenues during both the years ended September 30, 2020 2023
and 2019. In May 2020, MLGW published a draft Integrated Resource Plan ("IRP") to guide energy choices in the future, and in July 2020, TVA made a proposal to MLGW that highlights the benefits of remaining a TVA customer. In August 2020, MLGW published a final IRP and announced their plan to issue requests for proposal ("RFPs") to validate the cost estimates included in the IRP. In addition, certain other LPCs are evaluating options for future energy choices.2022.
TVA's rate structure uses pricing signals to indicate seasons and hours of higher cost to serve its customers and to capture a portion of TVA's fixed costs in fixed charges. The structure includes three base revenue components: time of use demand charges, time of use energy charges, and a grid access charge ("GAC"). The demand charges are based upon the customer's peak monthly usage and increase as the peak increases.usage. The energy charges are based on time differentiated kWh used by the customer. Both of these components can be significantly impacted by weather. The GAC captures a portion of fixed costs and is offset by a corresponding reduction to the energy rates. The GAC also reduces the impact of weather variability to the overall rate structure.
Additionally, in 2019, the TVA Board approvedhas a 20-year Partnership Agreement option that better aligns the length of LPC power contracts with TVA's long-term commitments. Under the partnership arrangement, the LPC power contracts automatically renew each year and have a 20-year termination notice. The partnership arrangements can be terminated under certain circumstances, including TVA's failure to limit rate increases as provided for in the agreements going forward. Participating LPCs receive benefits including a 3.1 percent wholesale bill credit in exchange for their long-term commitment, which enables TVA to recover its long-term financial commitments over a commensurate period. As of November 16, 2020, 142September 30, 2023, 147 LPCs had signed the 20-year Partnership Agreement with TVA.
In 2021, the TVA Board approved a 2.5 percent monthly base rate credit, the Pandemic Recovery Credit, which was effective for 2022. In 2022, the TVA Board approved a 2.5 percent monthly base rate credit, which is an extension of the Pandemic Recovery Credit and was effective for 2023. These pandemic credits applied to service provided to TVA's LPCs, their large commercial and industrial customers, and TVA directly served customers. The pandemic credits were able to be offered as a result of TVA's financial and operational performance and ended September 30, 2023.
In addition to base revenues, the rate structure also includes a separate fuel rate that recoversincludes the costs of natural gas, fuel oil, purchased power, coal, emission allowances, nuclear fuel, and other fuel-related commodities; realized gains and losses on derivatives purchased to hedge the costs of such commodities; and payments to states and counties in lieu of taxes ("tax equivalents") associated with the fuel cost adjustments. See Part I, Item 1, Business — Rates — Rate Methodology.
55In August 2023, the TVA Board approved a 4.5 percent wholesale rate increase (excluding fuel) effective October 1, 2023. This adjustment is estimated to produce an additional $405 million of revenue during 2024.
The changes in revenue components are summarized below:
| Changes in Revenue Components For the years ended September 30 (in millions) | | Changes in Revenue Components For the years ended September 30 (in millions) |
| | | 2020 | | 2019(2) | | Change | | | 2023 | | 2022(1) | | Change | | Percent Change | |
| Base revenue | Base revenue | | | | | | | Base revenue | | | | | | | | |
| Energy revenue | Energy revenue | $ | 4,546 | | | $ | 5,128 | | | $ | (582) | | | Energy revenue | $ | 4,687 | | | $ | 4,873 | | | $ | (186) | | | (3.8) | % | |
Demand revenue(1) | 3,426 | | | 3,609 | | | (183) | | | |
Grid access charge(4) | 597 | | | 257 | | | 340 | | | |
| Demand revenue | | Demand revenue | 3,654 | | | 3,610 | | | 44 | | | 1.2 | % | |
| Grid access charge | | Grid access charge | 589 | | | 590 | | | (1) | | | (0.2) | % | |
| Long-term partnership credits for LPCs | Long-term partnership credits for LPCs | (163) | | | (14) | | | (149) | | | Long-term partnership credits for LPCs | (199) | | | (199) | | | — | | | — | % | |
Other charges and credits(3) | (616) | | | (624) | | | 8 | | | |
| Pandemic relief credits | | Pandemic relief credits | (225) | | | (228) | | | 3 | | | (1.3) | % | |
Other charges and credits(2) | | Other charges and credits(2) | (643) | | | (673) | | | 30 | | | (4.5) | % | |
| Total base revenue | Total base revenue | 7,790 | | | 8,356 | | | (566) | | | Total base revenue | 7,863 | | | 7,973 | | | (110) | | | (1.4) | % | |
| Fuel cost recovery | Fuel cost recovery | 2,310 | | | 2,799 | | | (489) | | | Fuel cost recovery | 4,025 | | | 4,379 | | | (354) | | | (8.1) | % | |
| Off-system sales | Off-system sales | 4 | | | 4 | | | — | | | Off-system sales | 14 | | | 19 | | | (5) | | | (26.3) | % | |
Pre-commercial operations(3) | | Pre-commercial operations(3) | (3) | | | — | | | (3) | | | 100.0 | % | |
| Revenue from sales of electricity | Revenue from sales of electricity | 10,104 | | | 11,159 | | | (1,055) | | | Revenue from sales of electricity | 11,899 | | | 12,371 | | | (472) | | | (3.8) | % | |
| Other revenue | Other revenue | 145 | | | 159 | | | (14) | | | Other revenue | 155 | | | 169 | | | (14) | | | (8.3) | % | |
| Total operating revenues | Total operating revenues | $ | 10,249 | | | $ | 11,318 | | | $ | (1,069) | | | Total operating revenues | $ | 12,054 | | | $ | 12,540 | | | $ | (486) | | | (3.9) | % | |
Notes
(1) Includes approximately $10 million in Back-to-Business credits in 2020 to provide relief to certain large customers affected by the COVID-19 pandemic.
(2) For the year ended September 30, 2019, $142022, $12 million previously classified as Other charges and credits (a component of Base revenue), has beenEnergy revenue was reclassified to Long-term partnership credits for LPCs (a component of Base revenue)Off-system sales to conform with current year presentation.
(3)(2) Includes economic development credits to promote growth in the Tennessee Valley, hydro preference credits for residential customers of LPCs, and demand response credits allowing TVA to reduce industrial customer usage in periods of peak demand to balance system demand. See Note 17 — Revenue.
(4)All LPCs were presented with the option to implement the GAC in October 2018 or defer the implementation until October 2019. Seventy-nine LPCs elected to implement in October 2018, while the remaining LPCs implemented the wholesale changes in October 2019.(3) Represents revenue capitalized during pre-commercial operations at Colbert Combustion Turbine Units 9-11.
Operating revenues decreased $1.1 billion$486 million for the year ended September 30, 2020,2023, as compared to the prior year, primarily due to a $566 million decrease in base revenue and a $489$354 million decrease in fuel cost recovery revenue. The $566 million decrease in base revenue was driven by a decrease of $379 million attributable to lower sales volume and a decrease of $187 million attributable to lower effective rates. Lower sales volume resulted primarily from overall milder weather for the TVA service territory during year ended September 30, 2020 and from the COVID-19 pandemic. TVA estimates that the COVID-19 impact accounted for approximately $185 million of decreased base revenue. TVA expects the COVID-19 pandemic to continue impacting revenue for 2021 and has planned for $10.0 billion in operating revenue. It is uncertain at this time the extent to which TVA's revenues may be impacted beyond 2021. The $489$354 million decrease in fuel cost recovery revenue was driven by a $362$207 million decrease attributable to lower fuel rates and a $127$147 million decrease attributable to lower energy sales.sales volume in 2023. The lower fuel rates experienced were primarily due to lower natural gas prices. The lower sales volume was driven by
overall milder weather in the Tennessee Valley region for 2023 as compared to 2022. In addition, there was a $110 million decrease in base revenue which was driven by a $127 million decrease due to lower market prices for natural gas.sales volume partially offset by a $17 million increase attributable to higher effective rates. The increase in effective rates was primarily due to lower other charges and credits as compared to the prior year.
See Sales of Electricity above for further discussion of the change in the volume of sales of electricity and Operating Expenses below for further discussion of the change in fuel expense.
Operating Expenses. Operating expense components as a percentage of total operating expenses for 20202023 and 20192022 consisted of the following:
| Operating Expenses (in millions) | |
Operating Expenses For the years ended September 30 (in millions) | | Operating Expenses For the years ended September 30 (in millions) |
| | 2020 | | 2019 | | Change | | | 2023 | | 2022 | | Change | | Percent Change | |
| Operating expenses | Operating expenses | | | | | | | Operating expenses | | | | | | | | |
| Fuel | Fuel | $ | 1,584 | | | $ | 1,896 | | | $ | (312) | | | Fuel | $ | 2,549 | | | $ | 2,567 | | | $ | (18) | | | (0.7) | % | |
| Purchased power | Purchased power | 880 | | | 1,007 | | | (127) | | | Purchased power | 1,633 | | | 1,921 | | | (288) | | | (15.0) | % | |
| Operating and maintenance | Operating and maintenance | 2,720 | | | 3,090 | | | (370) | | | Operating and maintenance | 3,372 | | | 2,986 | | | 386 | | | 12.9 | % | |
| Depreciation and amortization | Depreciation and amortization | 1,826 | | | 1,973 | | | (147) | | | Depreciation and amortization | 2,213 | | | 2,054 | | | 159 | | | 7.7 | % | |
| Tax equivalents | Tax equivalents | 528 | | | 541 | | | (13) | | | Tax equivalents | 593 | | | 601 | | | (8) | | | (1.3) | % | |
| Total operating expenses | Total operating expenses | $ | 7,538 | | | $ | 8,507 | | | $ | (969) | | | Total operating expenses | $ | 10,360 | | | $ | 10,129 | | | $ | 231 | | | 2.3 | % | |
The following table summarizes TVA's expenses for various fuels for the years indicated:
| Fuel Expense for TVA-Owned Facilities(1) For the years ended September 30 | |
Fuel Expense for TVA-Operated Facilities(1) For the years ended September 30 (in millions) | | Fuel Expense for TVA-Operated Facilities(1) For the years ended September 30 (in millions) |
| | Fuel Expense By Source | | Cost per kWh(4) | | Fuel Expense By Source | | Cost per kWh(4) |
| | | 2020 | | 2019 | | | 2020 | | 2019 | | | 2023 | | 2022 | | | 2023 | | 2022 | |
Coal(2) | Coal(2) | $ | 533 | | | $ | 744 | | | | 2.69 | | | 2.66 | | | Coal(2) | $ | 877 | | | $ | 627 | | | | $ | 4.18 | | | $ | 2.97 | | |
Natural gas and/or oil-fired(3) | Natural gas and/or oil-fired(3) | 660 | | | 783 | | | | 1.96 | | | 2.47 | | | Natural gas and/or oil-fired(3) | 1,293 | | | 1,590 | | | | 3.74 | | | 4.37 | | |
| Nuclear fuel | Nuclear fuel | 378 | | | 369 | | | | 0.58 | | | 0.58 | | | Nuclear fuel | 337 | | | 329 | | | | 0.50 | | | 0.51 | | |
| Total fuel | Total fuel | $ | 1,571 | | | $ | 1,896 | | | | 1.33 | | | 1.54 | | | Total fuel | $ | 2,507 | | | $ | 2,546 | | | | $ | 2.04 | | | $ | 2.08 | | |
Notes
(1) Excludes effects of the fuel cost adjustment deferrals and amortization on fuel expense in the amountamounts of $13$42 million and $21 million for the yearyears ended September 30, 2020. The effect on fuel expense from the fuel cost adjustment deferrals2023 and amortization was less than $1 million for the year ended September 30, 2019, and therefore is not represented in the table above.2022, respectively.
(2) Fuel expense related to oil consumed for startup at coal-fired facilities was $17$33 million and $25$30 million for the years ended September 30, 20202023 and 2019,2022, respectively.
(3) Fuel expense related to oil consumed for generation at natural gas and/or oil-fired facilities was $14 million and $2 million for both the years ended September 30, 20202023 and 2019.2022, respectively.
(4) Total cost per kWh is based on a weighted average.
Fuel expense decreased $312$18 million for the year ended September 30, 2020,2023, as compared to the prior year. This decrease was primarily due to a decrease in effective fuel rates due to lower natural gas prices and nuclear fuel efficiency gains,
resulting in a $36 million decrease in fuel expenses. Additionally, fuel expense decreased $3 million due to lower demand for energy. Partially offsetting these decreases was an increase in fuel cost recovery of $21 million from the recognition of unplanned fuel costs that were deferred in the summer of 2022.
Purchased power expense decreased $288 million for the year ended September 30, 2023, as compared to the prior year. This decrease was primarily due to lower effective fuel rates of $260 million resulting from lower natural gas prices. Also, thedemand for energy due to overall milder weather and COVID-19 pandemic reduced demand,higher availability of nuclear generation resulting in a decrease in volume of $66$335 million. Partially offsetting these decreasesthis decrease was an increase of $14 million driven by variances in fuel rate recovery.cost recovery of $45 million from the recognition of unplanned purchased power costs that were deferred in the summer of 2022, as well as an increase of $2 million from higher purchased power market prices.
Purchased powerOperating and maintenance expense decreased $127increased $386 million for the year ended September 30, 2020,2023, as compared to the prior year. This increase was primarily due to a reduction in volume of $110 million driven by decreased demand, resulting from the milder weather and COVID-19 pandemic. Lower effective rates contributed an additional $18 million to the decrease resulting from lower market prices for natural gas.
Operating and maintenance expense decreased $370 million for the year ended September 30, 2020, as compared to the prior year. This was primarily driven by a decrease of $266 million of prior year recovery of the regulatory asset for environmental cleanup costs related to the Kingston ash spill. Additionally, project write-offs and materials and supplies inventory reserves and write-offs related to the retirement of Bull Run and Paradise decreased $157 million as compared to the prior year. Partially offsetting these decreases was $85 million of increased payroll and benefit costs primarily due to labor escalation for cost of living increases and $28additional headcount to support operational needs, $73 million of increased expenditures related to TVA's New Nuclear Program, $43 million of increased outage expense primarily driven by increased scope for natural gas outages, Winter Storm Elliot, and power operations performance improvement activities, and $40 million of increased contract labor costs primarily related to power operations performance improvement activities and natural gas project work. In addition, there was an increase of other post-employment benefit expense of $37 million primarily due to the timing of nuclear outages, emergent work, and contract model transition.changes in discount rates.
Depreciation and amortization expense decreased $147increased $159 million for the year ended September 30, 2020,2023, as compared to the prior year. This decrease wasyear, primarily driven by a net decreasean increase of $85 million in depreciation expense of $199 million related to the decision in 2019 to accelerateassociated with the retirements of Cumberland and Bull Run and Paradise. Paradise was fully depreciated in the second quarteran increase of 2020. Partially offsetting this decrease was a $25$51 million increase in amortization expense of non-nuclear decommissioning costs recovered in rates. The remaining variance wasremainder of the increase is primarily due to depreciation of additions to Completednet completed plant. See Note 1 — Summary of Significant Accounting Policies—Property, Plant, and Equipment, and Depreciation — Depreciation.
Tax equivalents expense decreased $13$8 million for the year ended September 30, 2020,2023, as compared to the prior year. This change is primarily driven by aan decrease in the tax equivalents collected in the fuel ratecost recovery.
The following table showstables show TVA's generation and purchased power by generating source as a percentage of all electrical power generated and purchased (based on kWh) for the periods indicated:
| Total Power Supply by Generating Source For the years ended September 30 (millions of kWh) | Total Power Supply by Generating Source For the years ended September 30 (millions of kWh) | Total Power Supply by Generating Source For the years ended September 30 (millions of kWh) |
| | | 2020 | | 2019 | | | 2023 | | 2022 | |
| | Nuclear | | Nuclear | 67,102 | | | 42 | % | | 64,475 | | | 39 | % | |
Natural gas and/or oil-fired(1) | | Natural gas and/or oil-fired(1) | 34,467 | | | 22 | % | | 36,259 | | | 22 | % | |
| Coal-fired | Coal-fired | 19,825 | | | 13 | % | | 27,934 | | | 17 | % | | Coal-fired | 20,896 | | | 13 | % | | 20,999 | | | 13 | % | |
| Nuclear | 64,832 | | | 42 | % | | 63,433 | | | 39 | % | | |
| | Hydroelectric | Hydroelectric | 16,003 | | | 10 | % | | 16,058 | | | 10 | % | | Hydroelectric | 13,063 | | | 8 | % | | 13,934 | | | 8 | % | |
| Natural gas and/or oil-fired | 33,635 | | | 22 | % | | 31,704 | | | 20 | % | | |
Total TVA-operated generation facilities(2)(3) | | Total TVA-operated generation facilities(2)(3) | 135,528 | | | 85 | % | | 135,667 | | | 82 | % | |
Purchased power (natural gas and/or oil-fired)(4) | | Purchased power (natural gas and/or oil-fired)(4) | 13,703 | | | 9 | % | | 18,352 | | | 11 | % | |
Purchased power (other renewables)(5) | | Purchased power (other renewables)(5) | 6,247 | | | 4 | % | | 6,141 | | | 4 | % | |
| Total TVA-operated generation facilities(1) | 134,295 | | | 87 | % | | 139,129 | | | 86 | % | | |
Purchased power (non-renewable)(2) | 11,592 | | | 8 | % | | 14,105 | | | 9 | % | | |
Purchased power (renewable)(3) | 7,934 | | | 5 | % | | 7,840 | | | 5 | % | | |
| Total purchased power | 19,526 | | | 13 | % | | 21,945 | | | 14 | % | | |
| Purchased power (coal-fired) | | Purchased power (coal-fired) | 2,722 | | | 1 | % | | 2,753 | | | 2 | % | |
| Purchased power (hydroelectric) | | Purchased power (hydroelectric) | 1,591 | | | 1 | % | | 2,543 | | | 1 | % | |
Total purchased power(3) | | Total purchased power(3) | 24,263 | | | 15 | % | | 29,789 | | | 18 | % | |
| Total power supply | Total power supply | 153,821 | | | 100 | % | | 161,074 | | | 100 | % | | Total power supply | 159,791 | | | 100 | % | | 165,456 | | | 100 | % | |
Notes
(1) The generation for 2023 includes 99 million kWh of pre-commercial generation at Colbert Combustion Turbine Units 9-11.
(2) Generation from TVA-owned non-hydroelectric renewable resources (non-hydroelectric) is less than one percent for all periods shown and therefore is not represented in the table above.
(2)(3) Raccoon Mountain Pumped-Storage Plant net generation is allocated against each TVA-operated generation facility and purchased power type for both the year ended September 30, 2023, and the year ended September 30, 2022. See Part I, Item 1, Business — Power Supply and Load Management Resources — Hydroelectric Pumped-Storage for a discussion of Raccoon Mountain Pumped-Storage Plant.
(4) Purchased power (non-renewable)(natural gas and/or oil-fired) includes generation from Caledonia Combined Cycle Plant ("Caledonia CC"),CC, which is currently a leased facility operated by TVA. Generation from Caledonia CC was 4,2294,030 million kWh and 4,1814,797 million kWh for the years ended September 30, 20202023 and 2019,2022, respectively.
(3)(5) Purchased power (renewable)(other renewables) includes purchased power purchased from the following renewable sources: hydroelectric, solar, wind, biomass, and renewable cogeneration. TVA sells the Renewable Energy Certificates ("RECs") resulting from some of this purchased power to certain customers.
In addition to power supply sources included here, TVA offers energy efficiency programs that effectively reduced 2023 energy needs by about 2,100 net cumulative gigawatt hours or 1.3%.
Interest Expense. Interest expense and interest rates for 20202023 and 2019,2022 were as follows:
| Interest Expense and Rates
For the years ended September 30 | Interest Expense and Rates
For the years ended September 30 | Interest Expense and Rates For the years ended September 30 |
| | | 2020 | | 2019 | | Percent Change | | | 2023 | | 2022 | | Percent Change | |
Interest expense(1) | Interest expense(1) | $ | 1,142 | | | $ | 1,198 | | | (4.7) | % | | Interest expense(1) | $ | 1,056 | | | $ | 1,052 | | | 0.4 | % | |
| | Average blended debt balance(2) | Average blended debt balance(2) | $ | 21,978 | | | $ | 23,266 | | | (5.5) | % | | Average blended debt balance(2) | $ | 20,613 | | | $ | 20,596 | | | 0.1 | % | |
| Average blended interest rate(3) | Average blended interest rate(3) | 5.05 | % | | 4.92 | % | | 2.6 | % | | Average blended interest rate(3) | 4.92 | % | | 4.96 | % | | (0.8) | % | |
Notes
(1) Includes amortization of debt discounts, issuance, and reacquisition costs, net.
(2) Includes average balances of long-term power bonds, debt of variable interest entities ("VIE"),VIEs, and discount notes.
(3) Includes interest on long-term power bonds, debt of VIE,VIEs, and discount notes.
Total interest expense decreased $56increased $4 million for the year ended September 30, 2020,2023, as compared to the prior year. This was primarily driven by a $9 million increase from higher other interest, partially offset by a $5 million decrease from interest associated with the rates and balances of $42debt. The $9 million increase from higher other interest is primarily due to short-term interest rates on vendor deposits and customer prepayments being nearly four percentage points higher on average in 2023 as compared to 2022, along with higher average monthly balances on these vendor deposits and customer prepayments. The $5 million decrease from interest associated with debt is due to a $45 million decrease from lower average rates on long-term debt and $1 million decrease from lower balances on short-term debt partially offset by a $32 million increase from higher average rates on short-term debt and $14a $9 million due primarily to lower average short-term rates.increase from higher balances on long-term debt.
Other Income, (Expense), Net
During 2020, Other income, (expense), net decreased $26increased $54 million for the year ended September 30, 2023, as compared to the prior year. This increase was primarily driven by $21 million of othermarket gains on TVA's Investment funds and increases in interest income in 2019 relateddue to a deposit liability received by TVAhigher interest rates as a down payment oncompared to the sale of Bellefonte. The purchaser, Nuclear Development, LLC, failed to fulfill the requirements of the sales contract with respect to obtaining Nuclear Regulatory Commission ("NRC") approval of the transfer of required nuclear licenses and payment of the remainder of the selling price before the November 30, 2018 closing date. Additionally, Interest income decreased $7 million primarily as a result of lower interest rates. See Note 22 — Commitments and Contingencies — Legal proceedings for a discussion of the lawsuit filed by Nuclear Development, LLC.prior year.
Other Net Periodic Benefit Cost
Other net periodic benefit cost decreased $5$59 million for the year ended September 30, 2020,2023, as compared to the prior year. Other net periodic benefit cost is subject to significant economic assumptions, such as changes in the discount rate used to measure the benefit plans, that can materially impact TVA. However, TVA uses regulatory accounting to recognize other net periodic benefit cost as a regulatory asset to the extent that the amount calculated under U.S. generally accepted accounting principles ("GAAP") as pension expense differs from the amount TVA contributes to the pension plan as pension plan contributions. See Note 2120 — Benefit Plans. In 2020, U.S. GAAP pension expense exceeded contributions resulting in additional amounts deferred as a regulatory asset as compared to the prior year.
Liquidity and Capital Resources
Sources of Liquidity
TVA depends on various sources of liquidity to meet cash needs and contingencies. TVA's primary sources of liquidity
are cash from operations and proceeds from the issuance of short-term debt in the form of discount notes, along with periodic
issuances of long-term debt. TVA's balance of short-term debt typically changes frequently as TVA issues discount notes to
meet short-term cash needs and pay scheduled maturities of discount notes and long-term debt. TVA's next significant power bond maturity is $1.0 billion in September 2024. The periodic amounts of short-term debt issued are determined by near-term expectations for cash receipts, cash expenditures, and funding needs, while
seeking to maintain a target range of cash and cash equivalents on hand.
In addition to cash from operations and proceeds from the issuance of short-term and long-term debt, TVA's sources of liquidity include four long-term revolving credit facilities totaling $2.7 billion, a $150 million credit facility with the United States Department of the Treasury ("U.S. Treasury"), four long-term revolving credit facilities totaling $2.7 billion, and proceeds from other financings. See Note 1314 — Debt and Other Obligations — Credit Facility Agreements. The TVA Board authorized TVA to issue power bonds and enter into other financing arrangements in an aggregate amount not to exceed $4.0 billion during 2024.In the second quarter of 2023, TVA issued $1.0 billion of power bonds maturing in March 2028. Other financing arrangements may include lease financings and sales of receivables, loans, or other assets.
The TVA Act authorizes TVA to issue Bonds in an amount not to exceed $30.0 billion outstanding at any time. Power bondsBonds outstanding, excluding unamortized discounts and premiums and net exchange gains from foreign currency transactions, at September 30, 20202023 and 2019,2022, were $20.1$19.5 billion (including current maturities) and $21.4$19.3 billion (including current maturities), respectively. The balance of Bonds outstanding directly affects TVA's capacity to meet operational liquidity needs and to strategically use Bonds to fund certain capital investments as management and the TVA Board may deem desirable. Other options for financing not subject to the limit on Bonds, including lease financings (see Lease Financings below and Note 1011 — Variable Interest Entities), could provide supplementary funding if needed. Currently, TVA expects to have adequate capabilityutilize a combination of Bonds and additional power revenues through power rate increases to fundmeet its ongoing operational liquidity needs and make while making
planned capital investments overthrough the next decade. TVA may also utilize available federal funding through the Inflation Reduction Act of 2022 ("Inflation Reduction Act") and the Bipartisan Infrastructure Law ("BIL"), third party funding resources, or other funding sources. See Lease FinancingsFinancings, Key Initiatives and Challenges — below,Optimum Energy Portfolio —Decarbonization, Note 1011 — Variable Interest Entities, and Note 1314 — Debt and Other Obligations for additional information.
TVA may from time to time seek to retire or purchase its outstanding debt through cash purchases and/or exchanges for securities, in open market purchases, privately negotiated transactions, or otherwise. Such repurchases or exchanges, if any, will depend on prevailing market conditions, TVA's liquidity requirements, contractual restrictions, and other factors. The amounts involved may be material.
Due to higher volatility in the financial markets associated with the COVID-19 pandemic, TVA increased its target balance of Cash and cash equivalents beginning in March 2020. TVA continued to hold higher target cash balances at September 30, 2020, and may hold higher cash balances from time to time in future periods dueresponse to potential market volatility. TVA has maintained continued debt market access since the outbreak of the pandemic. TVA successfully funded the maturity of $1.0 billion of power bonds in March 2020 withvolatility or other business conditions. In addition, cash balances may include collateral received from operations and proceeds from the issuance of discount notes. In May 2020, TVA issued $1.0 billion of power bonds to take advantage of the historically low interest rate environment and to meet its ongoing funding needs. TVA's next significant power bond maturity of $1.5 billion is in February 2021.counterparties.
Debt Securities. TVA's Bonds are not obligations of the U.S., and the U.S. does not guarantee the payments of principal or interest on Bonds. TVA's Bonds consist of power bonds and discount notes. Power bonds have maturities of between one and 50 years. At September 30, 2020,2023, the average maturity of long-term power bonds was 15.314.43 years, and the weighted average interest rate was 4.564.61 percent. Discount notes have maturities of less than one year. Power bonds and discount notes have a first priority and equal claim of payment out of net power proceeds. Net power proceeds are defined as the remainder of TVA's gross power revenues after deducting the costs of operating, maintaining, and administering its power properties and payments to states and counties in lieu of taxes,tax equivalents, but before deducting depreciation accruals or other charges representing the amortization of capital expenditures, plus the net proceeds from the sale or other disposition of any power facility or interest therein. In addition to power bonds and discount notes, TVA had long-term debt associated with certain VIEs outstanding at September 30, 2020.2023. See Lease Financing below, Note 1011 — Variable Interest Entities, and Note 1314 — Debt and Other Obligations for additional information.
Power bonds and discount notes are both issued pursuant to Section 15d of the TVA Act and pursuant to the Basic Tennessee Valley Authority Power Bond Resolution adopted by the TVA Board on October 6, 1960, as amended on September 28, 1976, October 17, 1989, and March 25, 1992 (the "Basic Resolution"). The TVA Act and the Basic Resolution each contain two bond tests: the rate test and the bondholder protection test.
Under the rate test, TVA must charge rates for power which will produce gross revenues sufficient to provide funds for:
•Operation,for operation, maintenance, and administration of its power system;
•Tax tax equivalents;
•Debt debt service on outstanding Bonds;
•Payments payments to the U.S. Treasury in repayment of and as a return on the Powergovernment's appropriation investment in TVA's power facilities (the "Power Program Appropriation Investment;Investment"); and
•Such such additional margin as the TVA Board may consider desirable for investment in power system assets, retirement of outstanding Bonds in advance of maturity, additional reduction of the Power Program Appropriation Investment, and other purposes connected withwith TVA's powerpower business, having due regard for the primary objectives of the TVA Act, including the objective that power shall be sold at rates as low as are feasible. See Note 1823 — Proprietary Capital —Appropriation InvestmentRelated Parties.
TVA fulfilled its requirement to repay $1.0 billion of the Power Program Appropriation Investment in 2014; therefore, the repayment of this amount is no longer a component of rate setting.
The rate test for the one-year period ended September 30, 2020,2023, was calculated after the end of 2020,2023, and TVA met the test's requirements.
Under the bondholder protection test, TVA must, in successive five-year periods, use an amount of net power proceeds at least equal to the sum of the depreciation accruals and other charges representing the amortization of capital expenditures and the net proceeds from any disposition of power facilities, for either the reduction of its capital obligations (including Bonds and the Power Program Appropriation Investment) or investment in power assets.
The bondholder protection test for the five-year period ended September 30, 2020, was calculated after the end of 2020, and TVA met the test's requirements. TVA must next meet the bondholder protection test for the five-year period ending September 30, 2025, and expects to meet the test.
TVA uses proceeds from the issuance of discount notes, in addition to other sources of liquidity, to fund short-term cash needs and scheduled maturities of long-term debt.
The following table provides additional information regarding TVA's short-term borrowings.
| | Short-Term Borrowing Table | |
Short-Term Borrowings (in millions) | | Short-Term Borrowings (in millions) |
| | | At September 30, 2020 | | For the year ended September 30, 2020 | | At September 30, 2019 | | For the year ended September 30, 2019 | | | At September 30, 2023 | | For the year ended September 30, 2023 | | At September 30, 2022 | | For the year ended September 30, 2022 | |
| Gross Amount Outstanding (at End of Period) or Average Gross Amount Outstanding (During Period) | Gross Amount Outstanding (at End of Period) or Average Gross Amount Outstanding (During Period) | | | | | | | | | Gross Amount Outstanding (at End of Period) or Average Gross Amount Outstanding (During Period) | | | | | | | | |
| Discount notes | Discount notes | $ | 57 | | | $ | 812 | | | $ | 922 | | | $ | 1,610 | | | Discount notes | $ | 432 | | | $ | 890 | | | $ | 1,173 | | | $ | 1,014 | | |
| Maximum Month-End Gross Amount Outstanding (During Period) | Maximum Month-End Gross Amount Outstanding (During Period) | | | Maximum Month-End Gross Amount Outstanding (During Period) | | |
| Discount notes | Discount notes | N/A | | $ | 1,875 | | | N/A | | $ | 2,390 | | | Discount notes | N/A | | $ | 1,864 | | | N/A | | $ | 2,062 | | |
| Weighted Average Interest Rate | Weighted Average Interest Rate | | | Weighted Average Interest Rate | | |
| Discount notes | Discount notes | 0.06 | % | | 0.77 | % | | 2.15 | % | | 2.32 | % | | Discount notes | 5.29 | % | | 4.34 | % | | 2.93 | % | | 0.83 | % | |
TVA ended the year at September 30, 2020,2023, with a lower balance for both short-term debt and average short-term debt as compared to 2019.September 30, 2022. The decrease wasresulted primarily due tofrom the decision to issue $1.0 billion of power bonds in 20202023 and the timing of cash flows.
TVA generally uses proceeds from the issuance of power bonds to refinance maturing power bonds or other financing obligations, as necessary, or for other power system purposes. The total balance of power bonds may decline in periods where redemptions of power bonds exceed issuance due to net positive cash flow from operating and investing activities. In 2020,At this time, TVA achievedanticipates the balance of Bonds and surpassed its strategic goal of reducing debtother financing obligations will increase in future years due to $21.8 billion by 2023.an expected increase in capital expenditures.
TVA issued $1.0 billion and $500 million of power bonds during 2020,2023 and no power bonds were issued in 2019.2022, respectively. TVA redeemed $1.5 billion$29 million and $1.1$1.0 billion of Bonds during 20202023 and 2019,2022, respectively. For additional information about TVA debt issuance activity and debt instruments issued and outstanding at September 30, 20202023 and 2019,2022, including rates, maturities, outstanding principal amounts, and redemption features, see Note 1314 — Debt and Other Obligations — Debt Securities Activity and Debt Outstanding.
TVA Bonds are traded in the public bond markets and are listed on the New York Stock Exchange ("NYSE") except for TVA's discount notes, the 2009 Series B power bonds, and the power bonds issued under TVA's electronotes® program. TVA's Putable Automatic Rate Reset Securities ("PARRS") are traded on the NYSE under the exchange symbols "TVC" and "TVE." Other bonds listed on the NYSE are assigned various symbols by the exchange, which are noted on the NYSE's website. TVA has also listed certain bonds on foreign exchanges from time to time, including the Luxembourg, Hong Kong, and Singapore Stock Exchanges. See Part I, Item 1A, Risk Factors — Financial, Economic, and Market Risksfor additional information regarding the market for TVA's Bonds.
Although TVA Bonds are not obligations of the U.S., TVA, as a corporate agency and instrumentality of the U.S. government, may be impacted if the sovereign credit ratings of the U.S. are downgraded. Additionally, TVA may be impacted by how the U.S. government addresses situations of approaching its statutory debt limit. According to statements made by
nationally recognized credit rating agencies, downward pressure on the ratings of the U.S. could eventually develop if there are no changes in current policies and budget deficits and the trajectory of debt continues to increase; additionally, current ratings factor in the prospect that debates over raising the debt ceilinglimit of the U.S. government could continue to be protracted and difficult. The outlook on the ratings ofIn August 2023, Fitch Ratings ("Fitch") downgraded the U.S. government is currently stable with two of the three agencies that provide ratings on TVA Bonds. In July 2020, Fitch Ratings downgraded the U.S.'sgovernment's credit rating outlook to negative from stableAA+, reflecting the ongoingits perception of a deterioration in the U.S. public finances and the absence of a credible fiscal consolidation plan, worsened by the economic challenges from the COVID-19 pandemic. In August 2020, the outlook on the credit rating of TVA was subsequently changed by Fitch to negative from stable, reflecting the actions onassociated with raising the U.S. debt limit. Fitch subsequently downgraded TVA's rating from AAA to AA+. TVA has not been required to post additional collateral due to the downgrade. The outlook on the ratings of TVA is currently stable with two of threeStandard & Poor's Financial Services, LLC ("S&P") and Fitch. However, on November 10, 2023, Moody's Investors Service, Inc. ("Moody's") revised the outlook on the U.S. government's credit rating agencies. ratings from stable to negative, and subsequently determined on November 13, 2023, to revise the outlook on TVA's ratings from stable to negative. See Note 15 — Risk Management Activities and Derivative Transactions — Other Derivative Instruments — Collateral. TVA's rated senior unsecured Bonds are currently rated Aaa, AAA,AA+, and AA+., by Moody's, Fitch, and S&P, respectively. TVA's short-term discount notes are not rated.
Lease Financings. TVA has entered into certain leasing transactions with special purpose entities ("SPEs") to obtain third-party financing for its facilities. These SPEs are sometimes identified as VIEs of which TVA is determined to be the primary beneficiary. TVA is required to account for these VIEs on a consolidated basis. In addition, TVA previously entered into leasing transactions to obtain third-party financing for 24 peaking combustion turbine units ("CTs") as well as certain qualified technological equipment and software ("QTE"). See Note 1011 — Variable Interest Entities and Note 1314 — Debt and Other Obligations for information about TVA's lease financing activities. During 2017 and 2016, TVA acquired 100 percent of the equity interests in certain SPEs created for the purpose of facilitating lease financing. TVA may seek to enter into similar arrangements in the future. In March 2019, TVA made final rent payments under lease/leaseback transactions involving eight combustion turbine units ("CTs"), and in July 2019, these transactions were terminated. In May 2020, TVA made final rent payments under lease/leaseback transactions involving eight additional CTs and anticipate these transactions will be terminated in 2021. TVA will continue making rent payments under the remaining lease/leaseback transactions through 2022.
Summary Cash Flows
A major source of TVA's liquidity is operating cash flows resulting from the generation and sale of electricity. Cash, cash equivalents, and restricted cash weretotaled $521 million and $322$520 million at September 30, 20202023 and 2019,2022, respectively. A summary of cash flow components for the years ended September 30 follows:
Cash provided by (used in):
Operating Activities. TVA's cash flows from operations are primarily driven by sales of electricity, fuel expense, and operating and maintenance expense. The timing and level of cash flows from operations can be affected by the weather, changes in working capital, commodity price fluctuations, outages, and other project expenses.
Net cash flows provided by operating activities decreased $84$76 million for 2020the year ended September 30, 2023, as compared to 2019,2022. The decrease was primarily due to lower revenue collections from decreased sales of electricity primarily driven predominantly by overall milder weather during 2023 and the COVID-19 pandemic, in additionhigher cash payments related to lower effective rates as a result of the long-term partnership credits for LPCs. Increases in post-employment claims, asset retirement obligation ("ARO") settlements,TVA's New Nuclear Program, increased payroll and other paymentsbenefits costs due to timing also contributed to the decrease inlabor escalation for cost of living increases, and higher cash flows from operations.paid for interest. These decreasesitems were partially offset by loweran increase in collections of fuel cost recovery revenue due to timing and less fuel and purchased power payments as a result ofdue to milder weather and lower natural gas prices and decreased electricity demand, lower interest payments, and decreased discretionary spend to mitigate COVID-19 financial impacts.prices.
Investing Activities. The majority of TVA's investing cash flows are due to investments to acquire, upgrade, or maintain generating and transmission assets, including environmental projects and the purchase of nuclear fuel. Nuclear fuel expenditures vary depending on the number of outages and the prices and timing of purchases of uranium and enrichment services.
Net cash flows used in investing activities decreased $228increased $331 million for 2020 compared to 2019, primarily driven by decreases in the number of nuclear fuel outagesyear ended September 30, 2023, as compared to the prior year deferralprimarily driven by the acquisition of leasehold interests in combustion turbine assets, construction of certain capital project spend to mitigate COVID-19 financial impacts,combustion turbines, transmission upgrades, and a reduction in capital expenditures for capacity expansion due primarily to the completion of the Browns Ferry Nuclear Plant ("Browns Ferry") extended power uprate in the prior year and the Pickwick South Embankment remediation project nearing completion.environmental projects. These decreasesincreases were partially offset by an increase in expenditures for the Boone Dam Embankment Remediation capacity expansion project.Watts Bar Unit 2 steam generator replacement project, which was completed in the prior year.
Financing Activities. TVA's cash flows provided by or used in financing activities are primarily driven by the timing and level of cash flows provided by operating activities, cash flows used in investing activities, and net issuance and redemption of debt instruments to maintain a strategic balance of cash on hand.
Net cash flows used inprovided by financing activities decreased $55 million for 2020 compared to 2019. TVA's financing activities continue to reflect an overall reduction in debt driven by strong financial performance and execution of long-range financial plans to reduce debt and keep TVA's electric rates competitive.
Impact of COVID-19 to Liquidity
As a result of certain commercial and industrial customers curtailing operations in response to the COVID-19 pandemic, TVA experienced decreases in base revenue. TVA estimates base revenues were reduced by approximately $185increased $406 million for the year ended September 30, 20202023, as compared to the prior year, primarily due to higher net debt issuances and lower payments on leaseback transactions. Lower net cash flows provided by operating activities and higher net cash used in investing activities in 2023 resulted in the impacts of COVID-19.need for net debt issuances to maintain targeted cash balance levels during the period. TVA expectsanticipates to have a need to increase debt in the COVID-19 pandemiccoming years as it continues to continue impacting revenue for 2021. It is uncertain at this time the extent toinvest in power system assets, which TVA's revenues may be impacted beyond 2021. See Item 7, Management's Discussion and Analysis of Financial Condition and Results of Operations — Results of Operations — Financial Results — Operating Revenues. Due to reductionsresult in TVA's revenue for the year ended September 30, 2020 and expected reductionspositive net cash flows provided by financing activities in revenue in 2021 associated with the COVID-19 pandemic, TVA has and will continue to implement various cost savings initiatives such as deferring and prioritizing certain capital projects and decreasing discretionary spending. TVA may also experience an increase in interest cost, fuel cost, and other additional operating costs. The ultimate impact of the COVID-19 pandemic on TVA's financial condition depends on factors beyond TVA's knowledge or control, including the duration and severity of this outbreak, actions taken to contain its spread and mitigate its effects, and broader impacts of the COVID-19 pandemic on the country and region's economy.future periods.
The COVID-19 pandemic has also created economic uncertainty for TVA's LPCs and the communities they serve. To support LPCs and strengthen the public power response to the COVID-19 pandemic, TVA has created initiatives such as the Public Power Support and Stabilization Program, Back-to-Business Credit Program, Community Care Fund, and Pandemic Relief Credit. TVA has also provided regulatory flexibility for LPCs to halt disconnection Tableof services. See Item 7, Management's Discussion and Analysis of Financial Condition and Results of Operations — Key Initiatives — Coronavirus PandemicContents for an expanded discussion of these initiatives.
Cash Requirements and Contractual Obligations
Actual capital expenditures and future planned capital expenditures for property, plant, and equipment additions, including clean airenvironmental projects and new generation, and nuclear fuel are as follows:
| Capital Expenditures For the year ended September 30 | |
Capital Expenditures For the years ended September 30 (in millions) | | Capital Expenditures For the years ended September 30 (in millions) |
| | Actual | | Estimated Capital Expenditures(1) | | Actual | | Estimated Capital Expenditures(1) |
| | | 2020 | | 2021 | | 2022 | | 2023 | | 2023 | | 2024 | | 2025 | | 2026 | | 2027 | | 2028 |
| Capacity expansion expenditures | Capacity expansion expenditures | $ | 224 | | | $ | 553 | | | $ | 922 | | | $ | 866 | | Capacity expansion expenditures | $ | 1,069 | | | $ | 1,747 | | | $ | 3,156 | | | $ | 2,377 | | | $ | 2,694 | | | $ | 1,179 | |
Environmental expenditures | Environmental expenditures | 310 | | | 145 | | | 134 | | | 74 | | Environmental expenditures | 196 | | | 200 | | | 171 | | | 79 | | | 34 | | | 9 | |
| Nuclear fuel | Nuclear fuel | 359 | | | 422 | | | 312 | | | 254 | | Nuclear fuel | 223 | | | 263 | | | 259 | | | 411 | | | 370 | | | 465 | |
| Transmission expenditures | Transmission expenditures | 404 | | | 525 | | | 510 | | | 400 | | Transmission expenditures | 715 | | | 677 | | | 1,114 | | | 869 | | | 595 | | | 449 | |
Other capital expenditures(2)(3) | Other capital expenditures(2)(3) | 761 | | | 949 | | | 903 | | | 916 | | Other capital expenditures(2)(3) | 793 | | | 1,211 | | | 1,199 | | | 986 | | | 988 | | | 839 | |
| Total capital expenditures | Total capital expenditures | $ | 2,058 | | (3) | $ | 2,594 | | | $ | 2,781 | | | $ | 2,510 | | Total capital expenditures | $ | 2,996 | | (4) | $ | 4,098 | | | $ | 5,899 | | | $ | 4,722 | | | $ | 4,681 | | | $ | 2,941 | |
Notes
(1) Currently, TVA plansexpects to fund these expenditures with cash from operationsutilize a combination of Bonds and proceeds fromadditional power program financings.revenues through power rate increases to meet its ongoing operational liquidity needs while making planned capital investments through the decade. TVA may also utilize available federal funding through the Inflation Reduction Act and the BIL, third party funding resources, or other funding sources. Estimated capital expenditures only include expenditures that are currently planned. Additional expenditures may be required, among other things, for TVA to meet growth in demand for power in its service area or to comply with new environmental laws, regulations, or orders.
(2) Table includes capital portion of Contentsestimated environmental expenditures. See Part I, Item 1, Business — Environmental Matters — Estimated Required Environmental Expenditures for total estimates on projects related to environmental laws and regulations. (2)(3) Other capital expenditures are primarily associated with short lead time construction projects aimed at the continued safe and reliable operation of generating assets.
(3)(4) The numbers above include the change in construction in progress and nuclear fuel expenditures included in Accounts payable and accrued liabilities of $73$42 million.
TVA continually reviews its capital expenditures and financing programs. The amounts shown in the table above are forward-looking amounts based on a number of assumptions and are subject to various uncertainties. Amounts may differ materially based upon a number of factors, including, but not limited to, changes in assumptions about system load growth, environmental regulation, rates of inflation, total cost of major projects, and availability and cost of external sources of capital. See Forward-Looking Information and Part I, Item 1A, Risk Factors.
TVA has certain obligations and commitments to make future payments, under contracts, including contracts executed in connection with certain of the planned construction expenditures. The following table sets forth TVA'sTVA estimates of future paymentstotal commitments and contingencies at September 30, 2020.2023, are approximately $5.6 billion for the year ended September 30, 2024, and $44.4 billion for the years thereafter, of which $3.5 billion and $19.5 billion, respectively, are set forth in the table below. See Note 78 — Leases, Note 1011 — Variable Interest Entities, Note 1114 — Other Long-Term Liabilities, Note 13 — Debt and Other Obligations, Note 2120 — Benefit Plans, and Note 22 — Commitments and Contingenciesfor the for a further description of these obligations and commitments.commitments attributable to leases, VIEs and membership interests of VIEs subject to mandatory redemption, debt and leaseback obligations, the retirement plan, and unconditional purchase obligations, respectively, for remaining amounts.
| | | | | | | | | | | | | | | | | | | | | | | | | | | | | | | | | | | | | | | | | |
Commitments and Contingencies Payments due in the year ending September 30 |
| | 2021 | | 2022 | | 2023 | | 2024 | | 2025 | | Thereafter | | Total |
Debt(1) | $ | 1,917 | | | $ | 1,028 | | | $ | 29 | | | $ | 1,022 | | | $ | 1,022 | | | $ | 15,057 | | | $ | 20,075 | |
Interest payments relating to debt(2) | 1,001 | | | 950 | | | 929 | | | 928 | | | 898 | | | 13,057 | | | 17,763 | |
Debt of VIEs(3) | 41 | | | 43 | | | 40 | | | 36 | | | 37 | | | 900 | | | 1,097 | |
| Interest payments relating to debt of VIEs | 50 | | | 49 | | | 47 | | | 45 | | | 47 | | | 403 | | | 641 | |
| | | | | | | | | | | | | |
| | | | | | | | | | | | | |
| Lease obligations | | | | | | | | | | | | | |
Finance(4) | 92 | | | 93 | | | 92 | | | 87 | | | 86 | | | 592 | | | 1,042 | |
Operating(5) | 66 | | | 51 | | | 39 | | | 37 | | | 34 | | | 16 | | | 243 | |
| Purchase obligations | | | | | | | | | | | | | |
Power(6) | 252 | | | 229 | | | 216 | | | 196 | | | 172 | | | 1,068 | | | 2,133 | |
Fuel(7) | 1,375 | | | 682 | | | 453 | | | 429 | | | 377 | | | 1,234 | | | 4,550 | |
Other(8) | 236 | | | 114 | | | 65 | | | 38 | | | 28 | | | 237 | | | 718 | |
| Environmental Agreements | 2 | | | 2 | | | 2 | | | 1 | | | 1 | | | 3 | | | 11 | |
| Membership interests of VIEs subject to mandatory redemption | 3 | | | 3 | | | 2 | | | 1 | | | 1 | | | 15 | | | 25 | |
| Interest payments related to membership interests of VIEs subject to mandatory redemption | 2 | | | 2 | | | 1 | | | 1 | | | 1 | | | 6 | | | 13 | |
| Flood response commitment to NRC | 1 | | | 26 | | | — | | | — | | | — | | | — | | | 27 | |
| Unfunded loan commitments | 1 | | | — | | | — | | | — | | | — | | | — | | | 1 | |
| Long-term monitoring costs - Kingston ash spill | 1 | | | 1 | | | — | | | 1 | | | — | | | 9 | | | 12 | |
Leaseback obligations(9) | 207 | | | 25 | | | — | | | — | | | — | | | — | | | 232 | |
Retirement Plan(10) | 300 | | | 300 | | | 300 | | | 300 | | | 300 | | | 3,300 | | | 4,800 | |
| Other contractual obligations | 2 | | | — | | | — | | | — | | | — | | | — | | | 2 | |
| Total | $ | 5,549 | | | $ | 3,598 | | | $ | 2,215 | | | $ | 3,122 | | | $ | 3,004 | | | $ | 35,897 | | | $ | 53,385 | |
| | | | | | | | | | | | | | | | | | | | | | | | | | | | | | | | | | | | | | | | | |
Other Commitments and Contingencies Payments due for the years ending September 30 (in millions) |
| | 2024 | | 2025 | | 2026 | | 2027 | | 2028 | | Thereafter | | Total |
| | | | | | | | | | | | | |
Interest payments relating to debt(1) | $ | 995 | | | $ | 966 | | | $ | 912 | | | $ | 851 | | | $ | 815 | | | $ | 11,195 | | | $ | 15,734 | |
| | | | | | | | | | | | | |
| Interest payments relating to debt of VIEs | 45 | | | 44 | | | 42 | | | 40 | | | 39 | | | 285 | | | 495 | |
| Interest payments relating to membership interests of VIEs subject to mandatory redemption | 1 | | | 1 | | | 1 | | | 1 | | | 1 | | | 3 | | | 8 | |
| | | | | | | | | | | | | |
| | | | | | | | | | | | | |
| | | | | | | | | | | | | |
| | | | | | | | | | | | | |
| | | | | | | | | | | | | |
| Purchase obligations | | | | | | | | | | | | | |
Power(2) | 354 | | | 174 | | | 123 | | | 56 | | | 36 | | | 392 | | | 1,135 | |
Fuel(3) | 1,621 | | | 972 | | | 497 | | | 305 | | | 256 | | | 886 | | | 4,537 | |
Other(4) | 461 | | | 308 | | | 78 | | | 26 | | | 35 | | | 127 | | | 1,035 | |
| | | | | | | | | | | | | |
| | | | | | | | | | | | | |
| Flood response commitment to NRC | 1 | | | 1 | | | 1 | | | — | | | — | | | 27 | | | 30 | |
| | | | | | | | | | | | | |
| | | | | | | | | | | | | |
| | | | | | | | | | | | | |
| | | | | | | | | | | | | |
| | | | | | | | | | | | | |
| | | | | | | | | | | | | |
| Total | $ | 3,478 | | | $ | 2,466 | | | $ | 1,654 | | | $ | 1,279 | | | $ | 1,182 | | | $ | 12,915 | | | $ | 22,974 | |
Notes
(1) Does not include non-cash items of foreign currency exchange gain of $153 million, unamortized debt issue costs of $45 million, and net discount on sale of Bonds of $77 million.
(2) Includes the effects of interest rate derivatives employed to manage interest rate risk.
(3) Debt of VIEs does not include the non-cash item of unamortized debt issue costs of $8 million.
(4) Includes the interest component of finance leases based on the interest rates stated in the lease agreements and excludes certain related non-lease costs.
(5) Excludes commitments related to non-lease costs, which are included in purchase obligations.
(6)(2) Includes commitments for energy and/or capacity under power purchase agreements ("PPAs") from coal-fired, hydroelectric, diesel, renewable, and gas-fired facilities, as well as transmission service agreements to support purchases of power from the market. Certain power purchase agreements ("PPAs")PPAs are accounted for as leases and have lease and non-lease components. For these contracts, the lease component is included in lease obligations (see Note 8 — Leases) and the non-lease component is included in power.power purchase obligations in the table above. For PPA contracts containing a lease component that have not commenced, the entire commitment amount is included in the table above.
(3) Includes commitments to purchase nuclear fuel, coal, and natural gas, as well as related transportation and storage services.
(8)(4) Primarily includes long-term service contracts, contracts that contain minimum purchase levels for the purchase of limestone along with related storage and transportation, and contractual obligations related to TVA's load control programs.
(9) In 2020, Paradise Pipeline Financing Obligation was derecognized due to a modification of a contract. See Note 11 – Other Long-Term Liabilities – Paradise Pipeline Financing Obligation.
(10) Pursuant to amendments to the TVA Retirement System ("TVARS") Rules and Regulations that became effective October 1, 2016, TVA will contribute to TVARS for a period of 20 years (2017-2036) or, if earlier, through the fiscal year in which it is determined by actuarial valuation that TVARS has reached and remained at a 100 percent funded status, which is an amount not less than the greater of (a) the minimum required TVARS actuarial valuation contribution or (b) $300 million.program.
EnergyRight® Program. TVA purchases certain loans receivable from its LPCs in association with the EnergyRight® program. Depending on the nature of the energy-efficiency project, loans may have a maximum term of five years or 10 years. The loans receivable are then transferred to a third-party bank with which TVA has agreed to repay in full any loan receivable that has been in default for 180 days or more or that TVA has determined is uncollectible. As ofAt September 30, 2020,2023, the total carrying amount of the loans receivable, net of discount, was approximately $87$59 million. Such amounts are not reflected in the Other Commitments and Contingencies table above. The total carrying amount of the financing obligation was approximately $97$69 million at September 30, 2020.2023. See Note 89 — Other Long-Term Assets and Note 1112 — Other Long-Term Liabilities for additional information.
Off-Balance Sheet Arrangements
At September 30, 2020, TVA had no off-balance sheet arrangements.
Key Initiatives and Challenges
COVID-19 PandemicOptimum Energy Portfolio
In December 2019, a novel strain of coronavirus was reported in China. As this strain continued to spread across the globe, the World Health Organization declared the outbreak of the 2019 novel coronavirus a pandemic on March 11, 2020. TVA has performed risk analyses across the company to determine potential impacts and monitor performance throughout the situation and has implemented a company-wide pandemic plan to address specific aspects of the COVID-19 pandemic. TVA's pandemic plan continues to evolve based on medical guidance and federal, regional, and local requirements and guidelines.
Based on ongoing monitoring, COVID-19 continues to pose a significant risk in the U.S. and in the Tennessee Valley region, and as a result TVA has extended the timeframe for workforce reintegration and continues to limit non-essential travel. Mandatory telework has been implemented for those employees who do not have to be physically present at a TVA facility or office building to provide mission-essential activities or produce safe, reliable power. TVA continues to implement strong physical and cybersecurity measuresmust continuously evaluate all generating assets to ensure an optimal energy portfolio that systems remain functionalprovides safe, clean, and reliable power while maintaining flexibility and fiscal responsibility to keep employees, customers, and communities safe and enable TVA to continue achieving its mission to serve the people of the Tennessee Valley. In addition to measures to protect its workforce, stakeholders, and critical operations, TVA is actively monitoring generation, transmission,making investments in its generating portfolio and distribution functions. Operationsinfrastructure to modernize the fleet and deliveryhelp meet growing demand for electricity while also allowing TVA to maintain competitive rates and high reliability and work toward an increasingly clean power system. As TVA continues to evaluate the impact of energyretiring its coal-fired fleet by 2035 and works to customers have not been materially impacted byaccelerate the COVID-19 pandemic at this time. Certaingrowth of renewables, it also continues to evaluate adding flexible lower carbon-emitting gas plants as a strategy to maintain reliability. TVA recreation areas including TVA campgrounds, day use areas, trails, and undeveloped lands have reopened since TVA had initially closed them to slow the spread of the virus. However, for public and staff safety, restrooms and pavilions remain closed. These changes will continue until it is safe to resume full operations.
For the year ended September 30, 2020, TVA estimates base revenues were reduced by approximately $185 million due to the impacts of COVID-19. Certain commercial and industrial customers curtailed operations in response to COVID-19 pandemic social distancing standards and economic conditions. As a result, TVA experienced decreased energy demand from those customers in 2020. TVA expects the COVID-19 pandemic to continue impacting revenue for 2021. It is uncertain at this time the extent to which TVA's revenues may be impacted beyond 2021. See Item 7, Management's Discussion and Analysis of Financial Condition and Results of Operations — Results of Operations — Financial Results — Operating Revenues.
Due to reductions in TVA's revenue for the year ended September 30, 2020 and expected reductions in revenue in 2021 associated with the COVID-19 pandemic, TVA has and will continue to implement various cost savings initiatives, such as deferring and prioritizing certain capital projects and decreasing discretionary spending.also evaluating other capacity expansion projects. In addition, TVA mayis committed to investing in the future of nuclear with the evaluation of emerging advanced nuclear technologies, such as small modular reactors ("SMRs"), and is increasing its renewable energy portfolio by securing PPAs and developing projects such as TVA's Self-Directed Solar. It is also experience increasesinvesting in interest cost, fuel cost,research and other additional operating costs. The ultimate impact of the COVID-19 pandemic on TVA's financial condition depends on factors beyond TVA's knowledge or control,development for decarbonization technologies including the durationbattery storage, carbon capture, carbon sequestration and severity of this outbreak, actions taken to contain its spreadutilization, new hydroelectric pumped-storage, energy efficiency, demand response, electrification, commercial resiliency, and mitigate its effects, and broader impacts of the COVID-19 pandemic on the country and region's economy.hydrogen.
TVA also continuesis developing its next Integrated Resource Plan ("IRP"), which will provide TVA direction on how to assessbest meet future electricity demands from now to 2050. As part of the IRP process, and in alignment with the National Environmental Policy Act ("NEPA"), TVA will analyze potential supplier performance risks, including procurementenvironmental impacts associated with the IRP by preparing an EIS. In May 2023, TVA published the notice of fuel, parts,intent, which is the first step in the NEPA process. The IRP process includes extensive engagement from the public and services. If suppliers are unablestakeholders and is expected to perform under TVA's existing contracts or if be complete in CY 2024.
TVA is unable to obtain similar services from other vendors, TVA could experience delays, disruptions, additional costs, or other operational outcomes that may impact generation, maintenance, and capital programs. At this time, TVA has experienced minimal impacts due to force majeure events,also partnering with the exceptionUniversity of Tennessee Baker School for Public Policy and Public Affairs and with diverse stakeholders from across the Tennessee Valley to conduct a manufacturing delayValley Pathways Study, focused on building a competitive and clean economy for the Tennessee Valley. This study will examine potential scenarios for all economic sectors across the Tennessee Valley that will support sustainable growth and a major turbine component. A mitigation strategy was developed byviable and preferred decarbonization pathway.
In addition, in August 2023, the TVA andBoard rescinded its previous declaration of surplus property for the vendor to reduce projected delays and impacts to TVA's outage schedule. TVA will continue to monitorBellefonte Nuclear Plant site as it evaluates the supply base and remain in contact with suppliers to identifysite for potential risks.future generation needs.
Customer Pandemic InitiativesCoal-Fired Fleet. . The COVID-19 pandemic has created economic uncertainty for TVA's customersTVA is evaluating the impact of retiring the balance of the coal-fired fleet by 2035. TVA will prepare environmental reviews pursuant to NEPA prior to making a decision on retiring or building any plant. In 2022, TVA made available and received public input on a draft EIS to assess the impacts associated with the potential retirement of Cumberland and the communities they serve. To supportconstruction and strengthenoperation of facilities to replace part of that generation. The final EIS was published in December 2022, and TVA documented its final decision with the public power responseRecord of Decision on January 10, 2023. TVA plans to retire the COVID-19 pandemic,two coal-fired units at Cumberland, which at September 30, 2023, accounted for 2,470 MW of TVA's summer net capability. TVA announcedplans to replace generation for one unit with a 1,450 MW combined cycle plant that is expected to be operational by the following initiatives in 2020:end of CY 2026 when the first unit is scheduled to be retired. See Natural Gas-Fired Units below.
Regulatory Flexibility.The second unit is scheduled to be retired by the end of CY 2028, and in May 2023, TVA provided regulatory flexibilitypublished the notice of intent to conduct an EIS to study potential environmental impacts associated with the proposed construction and operation of facilities to replace part of that generation. TVA could spend up to $1.2 billion on the construction of facilities to replace part of the generation for LPCs to halt disconnection of services and respond to the local needs of their customers and communities.second unit.
On May 12, 2023, TVA made available to the public a draft EIS to assess the impacts associated with the potential retirement of Kingston Fossil Plant ("Kingston") and the construction and operation of facilities to replace part of that generation. TVA asked for public input on the draft EIS during the 45-day public comment period of May 19, 2023 through July 3, 2023. TVA is currently reviewing comments submitted on the draft EIS, and a final EIS is expected to be published by the second quarter of 2024. TVA could spend up to $2.8 billion on the construction of facilities to replace part of that generation.
Natural Gas-Fired Units.As TVA continues to evaluate the impact of retiring its coal-fired fleet by 2035 and works to accelerate the growth of renewables, it also continues to evaluate adding flexible lower carbon-emitting gas plants as a strategy to maintain reliability. During 2019, the TVA Board approved an expansion of peaking gas replacement capacity at two
Program Flexibilitycombustion turbine gas facilities, contingent on the successful completion of environmental reviews under NEPA and other applicable laws. In 2020, detailed design and engineering work began at TVA’s Paradise and Colbert sites to further scope out the projects and supply information needed for the NEPA review. In 2021, environmental reviews under NEPA and other applicable laws were complete, and TVA received the air permits for the Paradise and Colbert facilities. Commercial plant operations began on Colbert Combustion Turbine Units 9-11 on July 25, 2023, with a total summer net capability of 681 MW. As of . In April 2020,September 30, 2023, TVA established flexibility provisions for certain economic development programs for participating customers impactedhad spent $329 million on this expansion, and TVA expects to spend an additional $56 million. Pre-commercial plant operations began on Paradise Combustion Turbine Units 5-7 in the first quarter of 2024, and all three new units are anticipated to enter commercial operations by the COVID-19 pandemic, as well as deferral options for EnergyRightend of CY 2023, with an expected summer net capability of 681 MW. As of ® program loan payments, through October 31, 2020, for customers experiencing financial hardship. See Note 8 — Other Long-Term Assets, Note 12 — Other Long-Term LiabilitiesSeptember 30, 2023, TVA had spent $372 million on this expansion, and Note 18 — Revenue.TVA expects to spend an additional $44 million.
Financial SupportA 500 MW aeroderivative CT project at TVA’s Johnsonville site has been approved for $599 million, contingent on the successful completion of environmental reviews under NEPA and other applicable laws. In 2020, detailed design and engineering work began to further scope out the project and supply information needed for the NEPA review. In 2022, environmental reviews under NEPA and other applicable laws were completed, and TVA received the air permits for the Johnsonville facility. As of September 30, 2023, TVA had spent $486 million on this project. TVA expects to spend an additional $113 million on this project and anticipates the project to enter commercial operations by the end of CY 2024. See Note 22 — Commitments and Contingencies — Legal Proceedings — Case Involving Johnsonville Aeroderivative Combustion Turbine Project for a discussion of a lawsuit involving this project.
As discussed in Coal-Fired Fleet above, TVA is replacing generation for one unit at Cumberland with a 1,450 MW combined cycle plant that is expected to be operational by the end of CY 2026 when this first unit is scheduled to be retired. As of September 30, 2023, TVA had spent $229 million on this project, and expects to spend an additional $1.9 billion through CY 2026. See Note 22 — Commitments and Contingencies — Legal Proceedings — Case Involving Cumberland Combined Cycle Plant for a discussion of a lawsuit involving this project.
TVA is also exploring a 200 MW aeroderivative CT project at TVA's Allen site and a 500 MW simple cycle CT project at TVA's Caledonia site contingent on the successful completion of environmental reviews under NEPA and other applicable laws. As of September 30, 2023, TVA had spent $108 million on long lead time equipment that could be used at any site, and could spend up to an additional $738 million on these projects.
Decarbonization. TVA's decarbonization initiative is aimed at understanding and applying clean resources to support the reduction of carbon emissions from its power supply. Related to its carbon reduction efforts, TVA has established six guiding principles which are as follows:
•Prioritize the needs of Tennessee Valley stakeholders as TVA works to achieve its goals by maintaining low rates and high reliability, and attracting new jobs in the Tennessee Valley.
•Use best-available science and support research and policies that further carbon-free dispatchable technologies.
•Partner with LPCs and other customers and communities to support economy-wide decarbonization efforts and the strategic electrification of other sectors, such as transportation.
•Maintain nuclear generation, hydro generation, and a strong transmission grid as key enabling assets.
•Be transparent with stakeholders in measuring and sharing TVA's progress, and listen and work effectively with all its stakeholders to understand their priorities and needs.
•Adapt to new technologies and changing policies, and be willing and open to changing TVA's plans and projects to achieve deep carbon reduction.
Exploration. As part of the decarbonization efforts, in 2022, the TVA Board approved a programmatic approach to exploring advanced nuclear technology, which is one of several technologies TVA is exploring. Other decarbonization technologies TVA is exploring in addition to advanced nuclear include battery storage, carbon capture, carbon sequestration and utilization, new hydroelectric pumped-storage, energy efficiency, demand response, electrification, commercial resiliency, and hydrogen. TVA also is increasing its renewable energy portfolio to work towards carbon emission reductions and meet customer preferences by investing in existing assets, encouraging renewable power through various current programs and offerings, and securing renewable PPAs through RFPs, among others. See below, Part I, Item 1, Business — Power Supply and Load Management Resources — Renewable Energy Resources and Demand Management Portfolio, andPart I, Item 1, Business — Research and Development for further discussion of TVA's decarbonization efforts. See also Part I, Item 1, Business — Environmental Matters — Climate Change for a discussion of the impact of executive actions and climate-related regulations on TVA.
Federal Funding Legislation. TVA is currently evaluating and seeking potential funding opportunities under the Inflation Reduction Act and the BIL to support its decarbonization efforts. In 2022, President Biden signed into law the Inflation Reduction Act. Among other things, the Inflation Reduction Act makes certain tax-exempt entities, including TVA, eligible for a direct-pay
option for certain tax credits that encourage investment in clean energy. In addition, in 2022, President Biden signed into law the BIL, a spending bill that, among other things, created new federal grants, direct pay, and incentive programs for a wide variety of eligible entities and activities. In many cases, TVA is directly or indirectly eligible to seek BIL funded opportunities through agency-sponsored and implemented funding opportunities. While TVA intends to seek to take advantage of these funding opportunities to the extent practically and legally feasible, any net financial value of these incentives for TVA is yet to be determined and is heavily dependent on numerous factors, including TVA’s need to comply with environmental and least-cost-planning laws as a condition of planning and completing qualifying projects, market conditions (including interest rates, resources availability, and project cost inflation, which is predictably impacted by the availability of the tax credits), costs of compliance with the funding requirements, TVA’s ability to leverage flow-through of tax credit value in power purchase agreement pricing and other financial terms, the continued availability of such funding across several federal political cycles, TVA’s debt financing capabilities, and future Internal Revenue Service ("IRS") guidance on key provisions of the Inflation Reduction Act. TVA continues to evaluate the Inflation Reduction Act, the BIL, IRS guidance, and other related matters. In November 2022, TVA and other major utility companies responded to a funding opportunity from the DOE with the intention of obtaining federal financial support for a Southeast Hydrogen Hub. The Southeast Hydrogen Hub was notified in October 2023 that their application was not among those funded.
Renewable Power Purchase Agreements. In March 2020,recent years, TVA has issued requests for proposals ("RFPs") in order to meet customer preferences and requirements for cleaner energy. TVA will procure the renewable energy and sell the resulting
RECs to specific customers, allowing TVA to increase its renewable energy portfolio without additional costs to other TVA customers. These agreements help to align the core values of TVA and the public power model with the desire of TVA's customers for renewable energy. TVA issued an RFP during 2021 for up to 200 MW of new renewable energy. In December 2022, TVA signed four PPAs for a total of 160 MW of solar generation expected to come online in 2025. TVA also issued a carbon-free RFP in July 2022 for up to 5,000 MW of carbon-free and renewable energy projects. This RFP includes a broad range of potential generation sources, including nuclear, green gas, solar, storage, and wind, among others. TVA anticipates making selections for the carbon-free RFP by the end of CY 2023.
In addition, TVA’s existing solar PPA portfolio is not immune from the challenges affecting the U.S. solar industry. Similar to the experience of the rest of the industry, the majority of TVA’s contracted PPAs from previous RFPs that are not yet online have been impacted by project delays and price increases. In the second quarter of 2023, one of the counterparties failed to comply with the terms of its PPA. TVA terminated the agreement, which includes 66 MW of solar and 66 MW of battery storage, due to the counterparty's default.
Self-Directed Solar. During 2019, the TVA Board approved the Public Power Support and Stabilization Program. Through this program,opportunity for TVA is offering up to $1.0 billion of credit support to LPCs that demonstrateexplore being directly involved in the need for temporary financial relief, through the deferraldevelopment of a portionutility-scale solar project, contingent on the successful completion of LPCs' wholesale power payments owed to TVA.environmental reviews under the NEPA and other applicable laws. In 2021, TVA purchased land for this development and in 2022, environmental reviews were complete. The program requires LPCs to apply forchallenges affecting TVA’s RFPs are also being seen in TVA’s Self-Directed Solar project. This has resulted in a delay in the deferral, which is subject to approval by TVA. If approved, TVA will establish and approve a repayment scheduleestimated completion, with the LPCproject now expected to be complete by December 31, 2020, with a repayment term notthe end of CY 2027. The project has also experienced cost increases due to exceed two years. The program is available through CY 2020,escalations from supply chain limitations. As of September 30, 2023, TVA had spent $49 million on the 200 MW project and asexpects to spend an additional $416 million.
In November 2022, the TVA Board approved the opportunity for TVA to explore the development of November 16, 2020, $1 million of credit support has been approvedan additional utility-scale solar project, contingent on successfully completing environmental reviews under the program.NEPA and other applicable laws and obtaining the necessary state permits. The project would utilize TVA-owned land, deploying a solar cap system on the closed CCR facility at the TVA Shawnee Fossil Plant in Paducah, Kentucky. As of September 30, 2023, TVA had spent $49 million on the 99 MW project and expects to spend an additional $167 million.
Small Modular Reactors. In December 2019, TVA became the first utility in the nation to successfully obtain approval for an early site permit from the Nuclear Regulatory Commission ("NRC") to potentially construct and operate SMRs at TVA’s Clinch River Nuclear Site. The permit is valid through 2039 and therefore provides TVA a great deal of flexibility to make new nuclear decisions based on energy needs and economic factors. In 2021, TVA initiated a Programmatic EIS ("PEIS") that evaluates a variety of alternatives for a proposed advanced nuclear technology park at the Clinch River Nuclear Site and will provide additional flexibility for future decision making. The PEIS was issued for public comment in March 2022, and the Record of Decision was signed in September 2022.
Back-to-Business CreditIn 2022, the TVA Board approved the New Nuclear Program and approved up to $200 million to explore advanced reactor technology options. Of this amount, TVA had spent $100 million as of September 30, 2023. The New Nuclear Program provides a systematic roadmap for TVA’s exploration of advanced nuclear technology. Collaboration with other interested parties will be an important aspect of this program, and TVA has entered into several agreements with technology progressive organizations that allow for mutual collaboration to explore advanced reactor designs as a next-generation nuclear technology. In December 2022, TVA entered into a multi-party collaborative arrangement to advance the global deployment of the GE Hitachi Nuclear Energy ("GEH") BWRX-300 SMR. GEH is responsible for standard design development. See Note 21 — .Collaborative Arrangement for additional information. One of the first tasks the New Nuclear Program is pursuing is a project to develop an NRC construction permit application at the Clinch River Nuclear Site. In addition, while evaluating alternatives for potential advanced nuclear at the Clinch River Nuclear Site, TVA createdis exploring the Back-to-Business Credit Programfeasibility of applying a similar approach that could deploy additional SMRs at Clinch River and other TVA-owned properties.
The decision to enable TVApotentially build SMRs continues to be part of the ongoing discussion as part of the asset strategy for TVA’s future generation portfolio, and LPCs the abilityany future decision to provide relief to certain large customers affectedconstruct any reactor, advanced or otherwise, would require approval by the COVID-19 pandemic by providing certain credits when returning to operations.TVA Board and the NRC. As of September 30, 2020,2023, TVA had provided approximately $10spent $191 million to date on work regarding SMRs, including work to complete the early site permit application for the Clinch River Nuclear Site and work associated with the New Nuclear Program above. Of these amounts, the U.S. Department of Energy ("DOE") had reimbursed TVA $29 million. Additional expenditures will be determined based on future project development.
Nuclear Fleet License Extensions. Subject to the completion of all appropriate environmental reviews, TVA is seeking to renew all nuclear generation units' licenses for an additional 20 years. The first license renewal application is expected to be submitted to the Nuclear Regulatory Commission ("NRC") in Back-to-Business credits under this program.January 2024 for the three units at Browns Ferry. As of September 30, 2023, TVA had spent $25 million to support the subsequent license renewal ("SLR") of the three units at Browns Ferry and expects to spend an additional $16 million to complete the Browns Ferry SLR.
Community Care FundFiber Optic Network. TVA is also partnering with LPCs through the Community Care Fund by making available over $4 million in matching funds to support local initiatives that address hardships created by the COVID-19 pandemic. Over $2 million in matching funds had been provided as of September 30, 2020.
Pandemic Relief Credit. In August 2020, the TVA Board approved a $200 million Pandemic Relief Credit. The 2.5 percent base rate credit will be applied beginning in October 2020 and will remain in effect through the end of 2021. The credit will apply to service provided to TVA's LPCs, their large commercial and industrial customers, and TVA directly served customers.
These actions continue to show TVA's commitment to support the financial integrity of LPCs along with communities and customers across the Tennessee Valley during these challenging economic conditions caused by the COVID-19 pandemic. The COVID-19 pandemic is an evolving situation that may lead to extended disruption of economic activity and an adverse impact on TVA's results of operations. TVA is closely monitoring developments and will continue adjusting its response as necessary to ensure reliable service while protecting the safety and health of its workforce.
Distributed Energy Resources
Consumer desire for energy choice, among other things, is driving the expectation for flexible options in the electric industry. TVA and LPCs are working together to leverage the strengths of the Tennessee Valley public power model to provide distributed energy solutions that are economical, sustainable, and flexible. TVA will focus on the safety and reliability impacts of these resources as they are interconnected to the grid and will ensure that the pricing of electricity remains as low as feasible. Additional regulatory considerations and analysis may be required as the distributed energy resources ("DER") market, technologies, and programs evolve. TVA is working to develop pricing and regulatory structures with a deliberate and thoughtful analysis of each current and future program offering. This requires strong partnerships with LPCs to give customers choices and provide end-use consumers the flexibility they desire.
In 2017, the TVA Board authorized up to $300 million to be spent over the next 10 years, subject to annual budget availability and necessary environmental reviews, to build an enhanced fiber optic network that will better connect TVA's operational assets. Fiber is a vital part of TVA's modern communication infrastructure. The new fiber optic lines will improve the reliability and resiliency of the generation and transmission system while enabling the system to better accommodate DER as they enter the market. As of September 30, 20202023, TVA had spent $121$245 million on installation of the fiber optic lines and expects to spend an additional $179 million.
Changing Customer Preferences
As more consumers and businesses are demanding cleaner energy, the utility industry is evolving to meet those needs. As TVA also evolves, it will see impacts to the way it does business$55 million through the pricing of products, transmission of energy, and development of new products and services for its customers in support of changing customer preferences and its economic development efforts. End-use customers are becoming more technologically sophisticated and want greater control over their energy usage. Many companies are focusing on sustainability and requiring more energy efficiency and renewable energy options. The continuing challenge for TVA and others is finding ways to meet the needs and preferences of customers while successfully developing flexible pricing models to accommodate the evolving markets.2027.
Low-Income System Operations Center. A new system operations center was approved by the TVA Board. The new secured facility is being built to accommodate a new energy management system and adapt to new regulatory requirements, and will improve reliability, have improved physical security from the previous center, and be flexible to help accommodate operational growth requirements, including future renewables. Construction of the facility is expected to be complete in CY 2024, and the facility is expected to be fully operational in CY 2026. As of September 30, 2023, TVA had spent $263 million on the project and expects to spend an additional $69 million.
Energy Efficiency Program.Management System. A new energy management system was approved by the TVA Board. As the current energy management system is nearing the end of its life cycle, this project will replace the existing analog system with a digital system. The new digital system will have higher capacity and speed for communications with the TVA grid and for inputs from monitoring equipment, will network the new control center with existing locations, and will enable better remote visibility and control to help mitigate reliability implications of climate change. The system is expected to be complete in CY 2027. As of September 30, 2023, TVA had spent $59 million on the project and expects to spend an additional $49 million.
Automated Energy Exchange Platform. In October 2021, an automated energy exchange, the Southeast Energy Exchange Market ("SEEM"), took effect. The exchange was created to facilitate more short-term power exchanges and will be an enhancement to the existing market. TVA completed the appropriate environmental reviews, and during the third quarter of 2022, the TVA Board approved the creation of a zero-cost, non-firm transmission service to allow TVA to participate in SEEM. In November 2022, the SEEM market began transacting.
On July 14, 2023, the United States Court of Appeals for the District of Columbia Circuit ("D.C. Circuit") remanded the Federal Energy Regulatory Commission's ("FERC") approval of SEEM, sending the matter back to FERC for additional proceedings. Among other things, the D.C. Circuit found that FERC failed to provide adequate explanations for its acceptance of SEEM’s market design and for whether SEEM’s zero-cost transmission rates transformed SEEM into a loose power pool, which would require a joint tariff to be filed with FERC allowing open membership and access to pool transmission for non-members. TVA is evaluating the impact of the D.C. Circuit opinion and cannot predict the outcome of the D.C. Circuit’s remand at FERC or any future or related proceeding.
Federal Funding Project Management Office. ThroughIn 2023, TVA established a new Federal Funding Project Management Office (“FFPMO”). The FFPMO will govern and support TVA’s federal funding strategy to help position TVA and Tennessee Valley partners to leverage funding from the Home Uplift Program, Inflation Reduction Act and the BIL. The FFPMO is responsible for overseeing opportunities, assessing TVA's BIL and Inflation Reduction Act eligibility, prioritizing and coordinating proposal development, and seeking to capture funding opportunities for TVA. The FFPMO also acts as a conduit for LPCs and business partners to potentially access the Inflation Reduction Act and BIL funds. TVA is currently exploring funding opportunities of various types, including opportunities involving pumped-storage, solar, carbon capture, hydrogen, and transmission, among others. This exploration does not guarantee that TVA or its partners will receive any funds. See Decarbonization above for a discussion of potential financial impacts and related challenges of the Inflation Reduction Act and BIL.
Electric Vehicles
TVA is partnering with LPCs state and local governments, non-profit agencies, energy efficiency advocates, andothers to support the electrification of transportation in the Tennessee Valley Public Power Association to complete home evaluationsin a multi-year electric vehicle ("EV") initiative. The initiative focuses on reducing or eliminating EV market barriers by setting EV policies, improving charging infrastructure availability, expanding EV availability and make high-impact home energy upgrades for qualifying homeowners.offerings, and spreading EV consumer awareness. In addition,2021, the TVA Board approved new policies and LPCs conduct workshops to educate homeowners about low and no-cost energy efficiency upgrades that improve their qualityan optional wholesale EV rate aimed at encouraging the development of life.charging infrastructure in the Tennessee Valley. The updated policies enable LPC investment in public charging infrastructure
and allow for the conditional resale of electricity, for transportation purposes only, by any charging developer on a $/kWh basis. The optional wholesale rate was developed with high power EV charging in mind and provides a stable option for those developing charging infrastructure.
Renewable Power Purchase Agreements
TVA is also working with LPCs, state agencies, and third-party charging developers to create the Fast Charge Network. This will be a foundational network of public fast charging stations at least every 50 miles along interstates and major highways across its seven-state service area. In 2021, TVA began a partnership with the State of Tennessee for the development and funding of Fast Charge Tennessee, the portion of the Fast Charge Network that covers Tennessee, . In orderand in 2022 TVA launched the Fast Charge Network. As of September 30, 2023, 15 sites were complete and operational with 55 additional sites under contract for development. TVA had spent $2 million on fast charging network charging stations as of September 30, 2023. TVA also plans to meet customer preferenceselectrify 100 percent of its light-duty and requirements for cleaner energy,50 percent of its medium-duty vehicles in the TVA has entered into certain power purchase agreements ("PPAs") with renewable resource providers. In 2019, as a resultfleet. The adoption of TVA's 2017 request for proposals for renewable energy,EVs in the Tennessee Valley continues to grow, and TVA signed four solar PPAs for 674 megawatts ("MW")is working to ensure that the benefits of solar generation at sitesthis rapid growth are secured, while also helping LPCs proactively avoid issues in Tennessee and Alabama. One of these four solar projects is expected to come onlinetheir distribution systems. Also in 2021, TVA and twofive other major utilities formed the Electric Highway Coalition to develop a network of fast charging stations along all major highway routes within their service area. Since formation, the projects are expected to come online in 2022.Electric Highway Coalition has gained significant interest from additional utilities and other EV collaboratives. In 2020, one of2022, the counterparties failed to complyElectric Highway Coalition merged with the termsMidwest Electric Vehicle Charging Infrastructure Collaboration to create the National Electric Highway Coalition with members committed to coordinate the development of its PPA. TVA terminatedEV charging infrastructure across the 150 MW agreement due to the counterparty's default and is evaluating its rights under the PPA and next steps. During 2020, as a result of TVA's 2019 request for proposals for renewable energy, TVA signed six additional PPAs for a total of 661 MW of solar generation with 50 MW of battery storage expected to come online in 2023. Due to transmission issues for one of the projects, the 661 MW will be decreased to 651 MW. TVA will procure the renewable energy and sell the resulting Renewable Energy Certificates ("RECs") to specific customers, allowing TVA to increase its renewable energy portfolio without additional costs to other Tennessee Valley customers. These agreements help to align the core values of TVA and the public power model with the desire of TVA's customers for renewable energy.central U.S.
Further,Sustainability and Social Responsibility
Sustainability has been and continues to be a focus in support of TVA's mission to deliver affordable and reliable energy, steward the environment, and create sustainable economic growth. TVA issued another requesthas a Chief Sustainability Officer (“CSO”) who oversees an Enterprise Wide Environmental Executive Council, a Sustainability Steering Committee, and a Sustainability Working Group, which together are responsible for proposal during the second quartergovernance of 2020 for up to 200 MWsustainability at TVA. The CSO is also a member of new renewable energy. The ultimate volume contracted will align to TVA customers' demand for renewable energy, allowing TVA to increase its renewable energy portfolio without additional costs to other Tennessee Valley customers. TVA anticipates making selections in CY 2020.TVA’s Risk Management Steering Committee.
TVA’s sustainability work is categorized into four areas:
Renewable Power Solutions. •TVA encourages renewable power through various current offerings. Offerings includeEconomic Impact — Partnering to build the Green Switch Program that allows customers to support wind, solar, and biomass renewable resources through purchasing renewableregion’s clean energy generated in the Tennessee Valley, sold in 200 kWh blocks. TVA also offers the Green Flex Program, which gives commercial and industrial customers the ability to meet sustainability goals and to make renewable energy claims through RECs from wind generation located outside TVA's service area. In 2019, the TVA Board approved new renewable power solutions, including a utility-scale program and a mid-scale flexibility option, that better equip TVA and LPCs with the flexibility to meet changing end-use customer needs. The utility-scale program, Green Invest, aggregates demand through a competitive procurement process and is implemented through a renewable investment agreement. The goal of the Green Invest program is to meet the long-term sustainability needs of customers at scale. TVA may also construct its own renewable facilities to meet these needs. The mid-scale option, also known as the Flexibility Research Project, is a joint project with LPCs to enable solutions for situations where the end-use consumer needs onsite renewable or distributed generation. This project will allow TVA to gain market knowledge and operational insights.economy
Energy Exchange Market•Environment — Stewarding the region’s resources
•Social — Serving people and communities across the region
•Governance — Driving progress through accountability and transparency
| | | | | | | | | | | | | | | | | | | | |
| Economic Impact | | Environment | | Social | | Governance |
| | | | | | |
| Energy affordability | | Climate change and resilience | | Health and safety | | Transparency |
| Reliability and resiliency | | Air quality | | Environmental justice | | Board and executive diversity |
| Jobs created and retained | | Water quality and availability | | Community vitality and engagement | | Systemic risk management |
| Flood and drought management | | Waste management | | Reservoir and stewardship benefits | | Ethics |
| Energy innovations | | Habitat and biodiversity protection | | Local power company partnerships | | Cyber and physical security |
| Renewable energy | | Cultural resource management | | Diversity and inclusion | | Sustainable financing framework |
| Investor relations | | | | Labor relations | | |
| Supplier partners | | | | Recruitment, development, and retention | | |
| | | | Skilled workforce availability | | |
TVA issued its 2022 Sustainability Report on May 10, 2023. This comprehensive Sustainability Report aligns with global reporting standards and will serve as a baseline for annual corporate sustainability reporting. TVA also publishes two other utilities across the southeastern United States are exploring the creation ofsustainability-related documents: a new automated energy exchange across the region, to facilitate more immediateFederal Sustainability Report and short-term power exchanges. The energy exchange would be an enhancement to TVA's existing trading program, and the creation of this energy exchange platform would require approval of the Federal Energy Regulatory Commission, which regulates transmission service and power transfers by jurisdictional public utilities. These discussions demonstrate TVA's commitment to maintaining and improving reliability in the Tennessee Valley in the least-cost manner.
Natural Resource Plan
�� In May 2020, the TVA Board of Directors accepted changes to TVA's Natural Resource Plan ("NRP") to support a more strategic, flexible, and comprehensive management approach to TVA's natural resource stewardship work. TVA published its Record of Decision to complete its environmental review process in July 2020. The updated plan enhances alignment with TVA's mission through economic development, energy, and environmental stewardship, and guides business planning. In the newly published NRP, TVA expanded from six resource areas to ten focus areas, ensuring the NRP provides a more comprehensive view of resource stewardship efforts.
Strategic Financial Plan
In 2019, the TVA Board approved an annual budget that reflects the first year of a new Strategic Financial Plan. The Strategic FinancialImplementation Plan, which extends from 2020 through 2030, is flexible in aligning customer preferencesaddresses TVA's responsibilities related to federal sustainability performance, and TVA's mission while atan Environmental, Social, and Governance Sustainability Report, which uses a utility-focused and investor-driven reporting template developed by the same time establishing a long-term forecast of financial results. Key focus areas of the Strategic Financial Plan include maintaining rates as low as feasible, establishing better alignment between the length of LPC contracts and TVA's long-term commitments, stabilizing debt, assuming 100 percent long-term partner participation, maintaining a cash balance of $300 million, and pursuing operational efficiencies. AsEdison Electric Institute. TVA executes the plan, key assumptions and performance may change estimated debt and cash balances. For example, TVA is continuing to evaluate its long-term asset needs. In addition, due to higher volatility in the financial markets associated with the COVID-19 pandemic, TVA increased its target balance of Cash and cash equivalents beginning in March 2020. TVA continued to hold higher target cash balances at September 30, 2020, and may hold higher balances in future periods due to potential market volatility.
Generation Resourcesissues other reports related to sustainability and social responsibility, including a Diversity, Equity, Inclusion and Accessibility ("DEIA") Report, which highlights the actions TVA has taken in the DEIA area, the results achieved, and the plans to continue to focus and improve, among other reports.
Operational Challenges
Extreme Flooding Preparedness. Updates to the TVA analytical hydrology model completed in 2009 indicated that under "probable maximum flood" conditions, some of TVA's dams might not have been capable of regulating the higher flood waters. A "probable maximum flood" is an extremely unlikely event; however, TVA has a responsibility to provide protection for its nuclear plants against such events. As a result, TVA installed a series of modifications at four dams.
Since 2009, TVA has performed further hydrology modeling of portions of the TVA watershed using updated modeling tools. TheHydrology models were submitted for Sequoyah Nuclear Plant ("Sequoyah") Units 1 and 2 in 2012. However, concerns regarding TVA dam stability and revised hydrology models were reviewedanalyses led to the submittal of a new hydrologic analysis for Sequoyah Units 1 and approved by2 in 2020. To resolve additional dam stability issues identified later in 2020, TVA submitted a revision to the NRCSequoyah model in April 2023. TVA plans to submit models for Watts Bar Nuclear Plant ("Watts Bar") Units 1 and 2. However, TVA identified an error2 in CY 2023 to incorporate a methodology approved by the modeling that will require the modelsNRC subsequent to their review of a previous hydrology submittal for Watts Bar Units 1 and 2 to be resubmitted. TVA plans to resubmit models for Watts Bar Units 1 and 2 by the end of the first quarter of CY 2021. In addition, TVA submitted models for Sequoyah Nuclear Plant ("Sequoyah") Units 1 and 2 on January 14, 2020.Bar. TVA will subsequently address conditions at Browns Ferry as needed.
As of September 30, 2020,2023, TVA had spent $154$158 million on the modifications and improvements related to extreme flooding preparedness. TVA is deferring the decision on the need for additional modifications until after the modeling work is complete.
Winter Storm Elliott.NRC Seismic Assessments. In 2014,late December 2022, Winter Storm Elliott brought historic winter storm conditions across the NRC notified licensees of nuclear power reactors in the central and eastern U.S.majority of the resultsU.S. The TVA service area sustained several days of seismic hazard screeningsingle-digit temperatures and prioritization evaluations performedhigh winds and experienced record-setting power demand. On December 23, 2022, TVA broke its all-time record for single-day energy demand of more than 740 million kWh, as well as its highest winter peak power demand of 33,427 MW. Rain followed by unit ownersextreme cold weather and reviewed by the NRC staff. Because the seismic hazards for Browns Ferry, Sequoyah,wind caused operational challenges at several coal and Watts Bar had increasesnatural gas-fired facilities, including freezing instrumentation, which resulted in seismic parameters beyond the technical information available when the plantsa maximum unavailability of generation capacity of approximately 7,300 MW. TVA also encountered challenges in purchasing and importing generation from neighboring markets that were designed and licensed, TVA must conduct seismic risk evaluations for these plants. TVA completed the risk evaluation for Watts Bar and submitted it to the NRCalso experiencing high demand, which resulted in 2017; the evaluation concluded that no additional actions were required. The NRC completed its review of the Watts Bar evaluation in 2018 and concluded that no further response or regulatory actions were required. The evaluation for Sequoyah was submitted on October 18, 2019, and the evaluation for Browns Ferry was submitted on December 17, 2019. The NRC completed its review of the Sequoyah and Browns Ferry evaluations in the fourth quarter of 2020 and concluded that no further response or regulatory actions were required.
Mitigation of Beyond-Design-Basis Events. NRC rulemaking has been developed to codify the requirements promulgated by orders related to beyond-design-basis flooding and seismic events discussed above. The NRC Commissioners approved the final rule in 2019. TVA plans to implement requirements for Sequoyah and Watts Bar by 2022 and for Browns Ferry by 2023. A gap review of the revised rule has been performed, and no new gaps to compliance were identified. Actions to complete flood and seismic assessments are still ongoing. See Extreme Flooding Preparedness and NRC Seismic Assessments above.
Work Environment at Nuclear Plants. In March 2016, the NRC issued a Chilling Effect Letter ("CEL") to TVA regarding work environment concerns identified at Watts Bar. In the mid-cycle assessment letter issued in June 2018, the NRC issued a Cross Cutting Issue in safety conscious work environment ("CCI") and outlined the closure criteria for both the CEL and CCI. In October 2019, TVA informed the NRC of its CEL and CCI closure criteria readiness, and the NRC completed its inspection, resulting in no additional findings with progress noted as documented in its December 2019 inspection report. In March 2020, the NRC issued its Annual Assessment Letter for Watts Bar notingcurtailments during TVA's progress in addressing the CEL and CCI while stating that the NRC continues to monitor TVA's activities as they deliberate on the appropriate time to close the CEL and CCI.peak demand periods.
Apparent Violations of NRC Regulations. On March 2, 2020, the NRC issued a letter to TVA identifying four apparent violations of NRC regulations that prohibit licensees from retaliating against employees for their having raised protected nuclear safety concerns. In June 2020, TVA participated in a pre-decisional enforcement conference before the NRC, and on August 24, 2020, the NRC issued violations to TVA and a notice of proposed imposition of civil penalties in an amount less than $1 million. TVA submitted a written response to the NRC that denies the violations and opposes the imposition of civil penalties. On October 29, 2020, the NRC issued an order imposing civil penalties in an amount less than $1 million. TVA has until November 28, 2020, to request an evidentiary hearing before the NRC's Atomic Safety and Licensing Board.
On March 9, 2020, the NRC issued a letter to TVA identifying twelve apparent violations of NRC regulations: six relating to operational activities and six relating to NRC regulations governing the completeness and accuracy of information. TVA participated in a pre-decisional enforcement conference before the NRC in July 2020, and on November 6, 2020, the NRC issued five violations to TVA and a notice of proposed imposition of civil penalties in an amount less than $1 million. TVA is evaluating its options and must respond to the NRC by December 5, 2020.
Tritium-Producing Burnable Absorber Rods. TVA was a cooperating agency in the 2016 Department of Energy ("DOE") Final Supplemental Environmental Impact Statement for the Production of Tritium in a Commercial Light Water Reactor. In 2017, due to an anticipated need for more tritium-producing burnable absorber rods ("TPBARs"), the DOE announced its preferred alternative for irradiation services, which included use of an additional reactor. As a result of these challenges, TVA implemented emergency operation plans previously established with its LPC and direct serve customers, which included public requests for broad conservation of power, curtailment of power to all customers on interruptible rates through TVA's assessmentdemand response programs along with further requests to large customers to voluntarily reduce power consumption, and concurrence withload reduction directives to LPCs to ensure the DOE's alternative, TVA submitted a license amendment request tooverall stability of the NRC to authorize the irradiation of TPBARspower grid. The load reduction directives were issued on two occasions, on December 23, 2022 for approximately two hours and on December 24, 2022 for approximately six hours, which resulted in Watts Bar Unit 2. The NRC approved the request in 2019. TVA is projecting to begin tritium production in Watts Bar Unit 2 in the fall of 2021. The DOE's decision also allows for irradiation of TPBARs at Sequoyah in the future; however, TVA does not have plans to employ Sequoyah units for tritium production in the near term.
Extended Power Uprate. TVA has undertaken an extended power uprate ("EPU") project at Browns Ferry to increase the amount of electrical generation capacity of its reactors. The license for each reactor was amended to allow reactor operation at the higher power level. The Browns Ferry EPU license amendments were approved by the NRC in 2017, following a nearly two-year review.rolling outages.
Although TVA faced challenges in acquiring power, TVA purchased a significant volume of power to help meet energy needs and experienced high prices during the winter storm event. TVA deferred $149 million of fuel and purchased power costs in December 2022 through its fuel cost adjustment primarily as a result of unplanned power purchases during the event. TVA began recognizing these deferred costs in expense in February 2023.
TVA has conducted a review of the actions taken both before and during the event to prepare for future needs and challenges. The project involved extensive engineering analysesreview recommended actions to improve the reliability and resiliency of TVA's system, including developing design modification plans for each generating facility for both winter and replacement of certain existing plant components to enable the units to produce the additional power requested by the license amendments. The project's total cost will be approximately $475 million. Physical work on all units was completed in 2019. The generating capacity is expectedsummer peaks, improving cross-organizational coordination and communication, strengthening fuel resiliency strategy, updating load forecasting operations, enhancing emergency protocols, and updating processes for communicating with customers and key stakeholders, among others. In addition, TVA has already implemented numerous actions to increase by an estimated 465 MWoperational resilience. These actions included placing more robust enclosures at generating facilities and enhancing insulation around instrumentation.
In addition, FERC, North American Electric Reliability Corporation ("NERC"), and NERC’s regional entities have opened a joint inquiry into the operations of the bulk power system during the winter weather conditions that must be validated through operationoccurred with Winter Storm Elliott. FERC has stated that the purpose of all unitsthe joint inquiry is to further protect the reliability of the grid for four seasonsfuture weather-related events. In November 2023, FERC, NERC, and NERC’s regional entities issued the final report regarding the inquiry. Among other things, the report recommends completion of additional testing. TVA is currently operatingcold weather reliability standard revisions for the electric industry and testing the unitsimprovements to reliability for U.S. natural gas infrastructure through the required period to complete the validation of the increased generating capacityfederal and/or state legislation and will update the official capacity upon issuance of the engineering memos.regulation.
Plant Closures. Results of assessments performed at Paradise and Bull Run were presented to the TVA Board at its February 2019 meeting. The TVA Board approved the retirement of Paradise Unit 3 by December 2020 and Bull Run by December 2023. Subsequent to the TVA Board approval, TVA determined that Paradise would not be restarted after January 2020 due to the plant's material condition. Paradise Fossil Plant Unit 3 was taken offline on February 1, 2020, effectively retiring the plant. See Note 6 — Plant Closures.
Optimum Energy Portfolio. TVA must continuously evaluate all generating assets to ensure an optimal energy portfolio that provides safe, clean, and reliable power while maintaining flexibility and fiscal responsibility to the people of the Tennessee Valley. During 2019, the TVA Board approved the Integrated Resource Plan, which recommended an action to evaluate the engineering end-of-life of aging fossil units. These assessments consider material condition, plant performance, system flexibility needs, environmental impacts, grid support, and other factors. TVA is also considering plans for additional generating facilities to replace retiring or expiring capacity and to support a low cost, reliable, flexible, and increasingly clean power system. In addition, TVA will prepare Environmental Assessments ("EAs") pursuant to the National Environmental Policy Act ("NEPA") prior to retiring or building a plant.Coal Combustion Residuals
Coal Combustion Residuals Facilities. TVA has committed to a programmatic approach for the elimination of wet storage of coal combustion residuals ("CCR") within the TVA service area. Under this program ("CCR Conversion Program"), TVA is convertingperformed stability remediation, completed the conversion of all operational coal-fired plants to dry CCR storage, and is now closing all remaining wet storage facilities.
Dry generation and dewatering projects. Conversion of coal plant CCRTVA has accomplished the conversion from wet processes to dry handling of CCR materials at all operating coal plants with the completion of dry generation and/or dewatering is completeprojects at Bull Run, Shawnee, and Kingston Fossil Plant ("Kingston"). Construction atCumberland, Gallatin Fossil Plant ("Gallatin") was completed during 2020. Construction of dewatering, Kingston, and dry generation facilities is underway at CumberlandShawnee Fossil Plant ("Cumberland"Shawnee") and is scheduled for completion in the first quarter of 2021. .
Landfills. TVA has made strategic decisions to build and maintain lined and permitted dry storage facilities on TVA-owned property at some TVA locations, allowing these facilities to operate beyond existing dry storage capacity. Lined and permitted landfills are completed and operational at Bull Run, Gallatin, Kingston, and Gallatin; a lined and permitted landfill at Shawnee is currently under construction with completion scheduledShawnee. TVA received the permit for January 2021;the construction of a new lined and permitted landfill at Cumberland is expected to startGallatin, and construction started in 2021; and2022. TVA is designing and permitting a lateral expansion ofreceived the existing landfill at Gallatin. TVA has withdrawn its permit applications for a new lined landfill at Bull RunCumberland in 2023, and has stopped construction of a permitted lined landfill expansion at Kingston until TVA can determine itsis evaluating the need for these landfills with certainty.construction. Construction of additional lined and dry permitted storage facilities may occur to support future business requirements.requirements.
Wet CCR impoundmentfacilities closures. TVA is working to close wet CCR impoundmentsfacilities in accordance with federal and state requirements. Closure project schedules and costs are driven by the selected closure methodology (such as closure-in-place or closure-by-removal). Closure initiation dates are driven by environmental regulations. TVA's predominant closure methodology is currently closure-in-place, with exceptions at certain facilities.facilities, although the EPA has recently interpreted its CCR Rule in a way that could create significant additional costs with implementing closure. TVA issued an environmental impact statement ("EIS")EIS in June 2016 that addresses the closure of CCR impoundments at TVA's coal-fired plants. TVA issued its associated Record of Decision in July 2016. Although the EIS was designed to be programmatic in order to address the mode of impoundment closures, it specifically addressed closure methods at 10 impoundments. TVA subsequently decided to close those impoundments. The method of final closure for each of these facilities will depend on various factors, including approval by appropriate state regulators.regulators and applicable closure requirements of state and federal regulations. Additional site-specific NEPA studies will be conducted as other facilities are designated for closure. See Note 1213 — Asset Retirement Obligations.
Groundwater monitoring. Compliance with the Environmental Protection Agency's ("EPA's") CCR rule ("CCR Rule") as well as other requirements will require additional engineering and analysis as well asrequired implementation of a comprehensive groundwater monitoring program. As further analyses are performed, including evaluation of monitoring results, there is the potential for additional costs for investigation and/or remediation. TVA expects to continue to evaluateprogram and update these cost estimates.
ongoing analysis. In compliance with the CCR Rule, TVA published the results of additional groundwater testing at TVA's CCR facilities on March 1, 2019. The results included values above groundwater protection standards for some constituents at several CCR units. Accordingly, TVA will have to cease sending CCR and non-CCR wastestreams to any impacted unlined CCR surface impoundments as soon as possible but no later than the applicable CCR Rule date. The EPA has published a final rule that
changes the deadline to cease sending CCR and non-CCR wastestreams to unlined CCR impoundments and to initiate closure or retrofit the units from October 31, 2020 to April 11, 2021. The final rule establishes a process for a utility to seek site-specific approval from the EPA to continue to use the unlined CCR impoundment based on meeting certain criteria. TVA evaluated and published Assessment of Corrective Measures reports to its CCR website in August 2019. TVA is continuing to publish periodic reports on additional2022 groundwater testing at its CCR facilities;facilities during the latestsecond quarter of 2023. Similar to prior years, the tests identified several CCR units with constituents at statistically significant levels above site-specific groundwater protection standards. TVA has completed an assessment of corrective measures ("ACM"), which analyzes the effectiveness of potential corrective actions, and has published ACM reports were published on February 28, 2020 and August 28, 2020. Under theto its CCR Rule basedCompliance Data and Information website. Based on the results of the assessment of corrective measures,ACM, TVA is required to select a remedy as soon as feasible. TVA has selected remedies for two of its plants: a groundwater pump and treat system at the East Ash Disposal Area at Allen and monitored natural attenuation at Shawnee. TVA continues to investigate and evaluate remedies for its other plants and will continue posting semi-annual progress reports on the status of remedy selection.selection until the final remedy is selected. The cost of these final remedies cannot reasonably be predicted until investigations and evaluations are complete and remedial methods are selected.
The final Part A revision to the CCR Rule became effective September 28, 2020. Among other things, the final Part A rule requires unlined CCR surface impoundments to stop receiving CCR and non-CCR waste streams and to initiate closure or retrofit by no later than April 11, 2021. TVA ceased sending CCR and non-CCR waste streams to, and initiated closure of, unlined CCR surface impoundments by the specified deadline.
As of September 30, 2020,2023, TVA had spent approximately $2.1$2.9 billion on its CCR Conversion Program. Through 2028, TVA expects to spend an additional $949 million$1.6 billion on the CCR Conversion Program through 2025. These estimatesProgram. Estimates for these amounts and costs after 2028 may change depending on the final closure method selected for each facility. OnceWhile the conversion portion of the CCR Conversion Program is completed, TVA will continue to undertake certain CCR closure and storage projects, including building new landfill cells under existing permits and closing existing cells once they reach capacity.
TVA was involved in two lawsuits concerning the CCR facilities at Gallatin. One of these cases was decided in TVA's favor by the U.S. Court of Appeals for the Sixth Circuit, and the other case was resolved by the entry of a consent order and agreement in Davidson County Chancery Court that became effective July 24, 2019. Under the consent order, TVA agreed to close the existing wet ash impoundmentsfacility by removal, either to an onsiteon-site landfill or to an offsite facility. TVA may also consider options for beneficial reuse of the CCR. TVA has submitted the removal plan for approval to the Tennessee Department of Environment and Conservation ("TDEC") and other applicable parties pursuant to the consent order.order, which was approved on November 7, 2023. In addition, TVA submitted an Environmental Assessment Report ("EAR") to TDEC, and TDEC approved the EAR on June 6, 2023. As required by the consent order, TVA will submit to TDEC and other applicable parties a Corrective Action/Risk Assessment Plan addressing groundwater at the site. See Note 1213 — Asset Retirement Obligationsfor additional information..
In October 2019, TDEC released amendments to its regulations which govern solid waste disposal facilities, including TVA's active CCR facilities covered by a solid waste disposal permit and those which closed pursuant to a TDEC approved closure plan. Such facilities are generally subject to a 30-year post-closure care period during which the owner or operator must undertake certain activities, including monitoring and maintaining the facility. The amendments, among other things, add an additional 50-year period after the end of the post-closure care period, require TVA to submit recommendations as to what activities must be performed during this 50-year period to protect human health and the environment, and require TVA to submit revised closure plans every 10 years.
Potential Liability Associated with Workers' ExposureOn May 18, 2023, the EPA issued a proposed rule expanding the federal CCR Rule to include legacy CCR Materials. In response to the 2008 ash spill at Kingston, TVA hired Jacobs Engineering Group, Inc. ("Jacobs") to oversee certain aspects of the cleanup. After the cleanup was completed, Jacobs was sued in the U.S. District Court for the Eastern District of Tennessee ("Eastern District") by employees of a contractor involved in the cleanup and family members of some of the employees. The plaintiffs alleged that Jacobs had failed to take or provide proper health precautions and misled workers about the health risks associated with exposure to coal fly ash, which is a CCR material. The plaintiffs alleged that exposure to the fly ash caused a variety of significant health issues and illnesses, including in some cases death. The case was split into two phases, with the first phase considering, among other issues, general causation and the second determining specific causation and damages. On November 7, 2018, a jury hearing the first phase returned a verdict in favor of the plaintiffs, including determinations that Jacobs failed to adhere to its contract with TVA or the Site Wide Safety and Health Plan; Jacobs failed to provide reasonable care to the plaintiffs; and Jacobs's failures were capable of causing a list of medical conditions, ranging from hypertension to cancer. On January 11, 2019, the Eastern District referred the parties to mediation. Mediation has concluded, but the parties did not resolve the matter. The litigation will now proceed to the second phase on the question of whether Jacobs's breaches were the specific medical cause of the plaintiffs' alleged injuries and damages.
Further in 2019, an additional group of contractor employees and family members filed suit against Jacobs in the Circuit Court for Roane County, Tennessee. These plaintiffs have raised similar claims to those being litigated in the case referenced above.
While TVA is not a party to either of these lawsuits, TVA may potentially have an indemnity obligation to reimburse Jacobs for some amounts that Jacobs is required to pay. TVA will continue monitoring the litigation to determine whether these or similar cases could have broader implications for the utility industry. TVA does not expect any potential liability to have a material adverse impact on its results of operations or financial condition. See Note 22 —Commitments and Contingencies —Legal Proceedings.
River Management. Rainfall and runoff in the Tennessee Valley in 2020 were 150 percent and 156 percent of normal, respectively. Above normal rainfall and runoff have continued to help TVA meet its river system commitments, including managing minimum river flows for navigation, generating low-cost hydroelectric power, maintaining water quality and water supply, and providing recreational opportunities for the Tennessee Valley. In addition, having cool water available helps TVA to meet thermal compliance and support normal operation of TVA's nuclear and fossil-fueled plants, while oxygenating water helps fish species remain healthy.
Small Modular Reactors. In 2015, DOE entered into an Interagency Agreement with TVA to support site characterization activities and the development of an Early Site Permit Application ("ESPA") for a generic small modular reactor ("SMR"). The ESPA is based on the potential construction and operation of two or more SMR units at TVA's Clinch River Site inunits. If
Oak Ridge, Tennessee. TVA submittedfinalized in its current form, this proposed rule may significantly increase the ESPAnumber of federally regulated units in TVA’s fleet that will be subject to substantial costs for review by the NRC in 2016. NRC staff concluded their environmental review and issued a final EIS in April 2019, followed by the conclusion of the safety review and issuance of a final safety evaluation report in June 2019. The Commission held the statutorily required mandatory hearing for the ESPA in August 2019, and the permit was issued by the NRC in December 2019. The permit is valid through 2039 and therefore provides TVA a great deal of flexibility to make new nuclear decisions based on energy needs and economic factors.
TVA is in the process of evaluating new nuclear technology optionsclosure, post-closure, and potential deployment scenarios. To assistremediation, and could have a material adverse effect on TVA's results of operations and financial condition. In addition, the EPA has recently interpreted its CCR Rule in the evaluationa way that could create significant additional costs with implementing closure. See Part I, Item 1, Business — Environmental Matters — Cleanup of SMRs, TVA has entered into memorandums of understanding with Oak Ridge National LaboratorySolid and the University of Tennessee. These partnerships allow for collaboration, exploring advanced reactor designs as a next-generation nuclear technology while leveraging advanced modeling and simulation tools to assist in determining the feasibility of SMRs. Any decision to construct an SMR would require approval by the TVA Board and the NRC. As of September 30, 2020, TVA had spent $81 million on work regarding SMRs, including work to complete the ESPA for the Clinch River Site, of which the DOE reimbursed TVA $28 million. Additional expenditures will be determined based on future project development.
System Operations Center. A new system operations center has been approved for $255 million. The new secured facility is being built to accommodate a new energy management system and to adapt to new regulatory requirements. The facility is expected to be constructed by 2022 and fully operational by 2024. As of September 30, 2020, TVA had spent approximately $37 million on the project and expects to spend an additional $218 million.Hazardous Wastes — Coal Combustion Residuals.
Dam Safety and Remediation Initiatives
Assurance Initiatives. TVA has an established dam safety program, which includes procedures based on the Federal Guidelines for Dam Safety, with the objective of reducing the risk of a dam safety event. The program is comprised of various engineering activities for all of TVA's dams including safety reassessments using modern industry criteria and the new probable maximum flood and site-specific seismic load cases. One aspect of the guidelines is that dam structures will be periodically assessed to assure that TVA's dams meet current design criteria. These assessments include material sampling of the dam and foundational structures and detailed engineering analysis. TVA will continue preventative and ongoing maintenance as a part of this safety program.
Boone Dam Remediation. In 2015, a sinkhole was discovered near the base of the earthen embankment at Boone Dam, and a small amount of water and sediment was found seeping from the river bank below the dam. TVA identified underground pathways contributing to the seepage and prepared a plan to repair the dam, which consists of the construction of a composite seepage barrier wall in the dam's earthen embankment. TVA has completed grouting and construction of an upstream and downstream buttress. Installation of the concrete cut-off wall elements is in process.
As construction of the embankment repair project continues, the estimated cost and duration continue to be refined. As of September 30, 2020, TVA had spent $251 million related to this project and expects to spend an additional $184 million through 2023. TVA expects the reservoir to return to normal operations in 2022 and is continuing to work with the community to help mitigate local impacts of the extended drawdown.
Pickwick South Embankment Remediation. Reassessments of Pickwick Landing Dam ("Pickwick") found low safety factors for post-earthquake stability indicating that the dam is at significant risk for slope stability failure following a seismic event in portions of the south embankment. Slope stability failure could lead to a breach of the south embankment and loss of the reservoir, resulting in loss of life and damage to property downstream, disruption to navigation, and loss of generation and recreation.
TVA is upgrading the south embankment by constructing berms on the upstream and downstream slopes. The design phase of the project began in 2017 and is now completed. Construction began in the spring of 2019, and the project is currently estimated to be completed in two years, but could take longer depending on successful construction sequencing. As of September 30, 2020, TVA had spent $118 million related to this project and expects to spend an additional $14 million through 2022.
Real Estate Portfolio
TVA continues to study its real estate portfolio and align its real estate holdings with TVA's strategic direction. A comprehensive assessment of its real estate portfolio has been completed. TVA will continue to develop and implement a strategy aimed at reducing cost and right-sizing its portfolio as part of the effort.
Knoxville Property. In 2016, TVA completed a comprehensive assessment of its real estate holdings in the Knoxville, Tennessee region including the Knoxville Office Complex ("KOC") and adjacent Summer Place Complex ("SPC"). As a result of this study and a subsequent Environmental Assessment in 2017, TVA has consolidated its Knoxville area employees into the West Tower of the KOC and the Greenway Drive Transmission Service Center, and is completing the centralized field offices in Norris, Tennessee. As part of this consolidation effort, TVA approved the conveyance of the SPC and the East Tower of the KOC and the transaction closed in August 2020.
Regulatory Compliance
Steam-Electric Effluent Guidelines. In 2015, the EPA published a final rule revising the existing steam-electric effluent limitation guidelines ("ELGs"). The ELGs update the existing technology-based water discharge limitations for power plants. Compliance with new requirements is required in the 2018-2023 timeframe and will necessitate major upgrades to wastewater treatment systems at all coal-fired plants. Dry fly ash handling is mandated by the rule. The rule also requires either dry bottom ash handling systems or "no discharge" recycle of bottom ash transport waters, and new technology-based limits on flue gas desulfurization ("FGD") (scrubber) wastewater require primary physical/chemical treatment and secondary biological treatment to meet extremely low limits for arsenic, mercury, and selenium.
The EPA published a rule in 2017, postponing certain compliance/applicability dates to provide the EPA time to review and revise, as necessary, the 2015 ELGs for FGD wastewater and bottom ash transport water. The EPA delayed the compliance dates for these two waste streams from the 2018-2023 timeframe to 2020-2023. However, the 2018-2023 applicability dates and the accompanying requirements for fly ash transport water, flue gas mercury control wastewater, and gasification wastewater remain unchanged. While the EPA reconsiders the limits for FGD wastewater and bottom ash transport water, states have issued National Pollutant Discharge Elimination System ("NPDES") permits for all of TVA's active coal facilities based on the 2015 ELGs, recognizing that the permits may need to be reopened to incorporate modifications to those ELGs. The EPA proposed revised ELGs for bottom ash transport water and FGD wastewater on November 4, 2019. The final ELGs were published on October 13, 2020.
The primary impact of these regulations for TVA is on the operation of existing coal-fired generation facilities. The revised ELGs could impact long-term investment decisions being made relative to the long-term compliance and operability of these plants. The revisions may require TVA to install additional wastewater treatment systems for FGD wastewater and bottom ash transport water, and TVA could incur substantial costs to comply with the new rule. TVA currently has three plants with wet scrubbers that may be subject to new scrubber-related limits, the largest being Cumberland. Bull Run is exempt from the imposition of new scrubber-related limits due to the pending retirement of the plant prior to the regulatory deadline. The revision also includes a subcategory for which Cumberland would qualify that provides TVA greater flexibility in meeting the ELGs. Litigation of the final rule is anticipated which introduces additional uncertainty in what will be required at each facility.
Allen Groundwater Investigation. The CCR Rule required TVA to implement a comprehensive groundwater monitoring program at units subject to the rule. As a result of this groundwater monitoring program, TVA reported to TDEC in 2017 elevated levels of arsenic, lead, and fluoride in groundwater samples collected from two shallow-aquifer groundwater monitoring wells around the Allen East Ash Disposal Area. TVA, under the oversight of TDEC, conducted a remedial investigation into the nature and extent of the contamination. In 2018, TVA submitted a draft Remedial Investigation Report to TDEC which was revised after discussions with TDEC and additional investigation. TVA submitted the Final Updated Remedial Investigation Report to TDEC in 2019.
The remedial investigation confirmed that the high arsenic, fluoride, and lead concentrations are limited to the shallow alluvial aquifer in the north and south areas of the Allen East Ash Disposal Area. These areas are not adversely impacting the Memphis aquifer, which is the source of the public drinking water supply. All samples taken from the Memphis aquifer through TVA production wells were belowwithin the EPA drinking water standards. As the result of a pumping test conducted on TVA production wells at the nearby Allen Combined Cycle Plant ("Allen CC") by the United States Geological Survey and the University of Memphis, TVA ishas committed to not operatingusing these production wells until additional data is generated that supports safe use. TVA constructed water tanks on site and is purchasing cooling water from Memphis Light, Gas and Water. TheMLGW in lieu of utilizing the production wells. Purchasing cooling water in combination with the use of water tanks, rather than the wells, maycould impose some operational restrictionslimitations, such as limitations on capacity, on the Allen CC due to the lower availability of cooling water.
TVA's Remedial Investigation/Interim Response Action Groundwater Monitoring Plan is reviewed and modified annually. The 2020 Remedial Investigation/Interim Response Action Groundwater Monitoring Plan wasPursuant to a remedial action plan that has been approved by TDEC, on May 5, 2020. TVA has sampled the monitoring wellsinstalled a groundwater pump and treat system at the site as described by the plan quarterly.East Ash Disposal Area. In addition, TVA prepares a memorandum after each quarterly event and prepares an annual reportis taking steps to evaluate the sampling results. The 2019 Remedial Investigation/Interim Response Action Groundwater Monitoring report was submitted to TDEC on July 2, 2020.
The Interim Response Action Plan to remediate the groundwater will include a groundwater extraction system and a groundwater treatment system. TVA will also continue to dewaterclose both the East Ash Disposal Area and treat the water before it is dischargednearby West Ash Disposal Area. On November 29, 2021, after obtaining the necessary approvals from TDEC, TVA began removing CCR materials to an offsite, lined landfill, and removal activities are expected to continue through 2030.
Potential Liability Associated with Workers' Exposure to CCR Materials. In response to the NPDES outfall. A feasibility study2008 ash spill at Kingston, TVA hired Jacobs Engineering Group, Inc. ("Jacobs") to evaluate remedial actionsoversee aspects of the cleanup. After the cleanup was completed, Jacobs was sued in the U.S. District Court for the siteEastern District of Tennessee ("Eastern District") by employees of a contractor involved in the cleanup and family members of some of the employees. Other contractor employees and family members also filed lawsuits against Jacobs in the Eastern District. In the third quarter of 2023, Jacobs announced that it reached a global settlement that resolved all of these lawsuits. While TVA was submittednot a party to TDECany of these lawsuits, TVA may potentially have an indemnity obligation to reimburse Jacobs in some circumstances. TVA does not expect any potential liability to have a material adverse impact on September 4, 2020.its results of operations or financial condition. See Note 22 —Commitments and Contingencies — Contingencies.
Real Property Portfolio
TVA engages in ongoing Tennessee Valley-wide real property portfolio evaluations of buildings, structures, and land as part of the strategic real estate program, which focuses on reducing cost, right-sizing the portfolio, and aligning real estate holdings with TVA's strategic direction. In addition, TVA continues to operate in a hybrid work environment for those who do not have to be physically present at a TVA facility. In order to align the strategic real estate program with the current hybrid environment, TVA entered into new lease locations in Washington, D.C. and Nashville, Tennessee in 2023. TVA is evaluating its use of the Chattanooga Office Complex and issued an RFP in August 2023 to determine availability for a new Chattanooga, Tennessee facility based on TVA's workplace needs.
Supply Chain and Inflation Pressures
TVA continues to experience impacts due to inflation, supply chain material challenges, and labor availability. This has evaluated closure optionsled to project delays, limited availability, and/or price increases for supplies and labor. TVA actively manages supply chain volatility with contracting, inventory strategies, and supplier engagement and support. Inflationary pressures are expected to persist in 2024 due in part to continued price volatility in some sectors. TVA is undertaking a cost optimization project to address these pressures. Business unit leaders will work to identify ways to partially offset cost increases expected for the Allen East Ash Disposal Area, as well asyears 2024 – 2026, with the nearby West Ash Impoundment, through an EIS pursuantgoal to NEPA. In March 2019, TVA released its public scoping report, which eliminated closure-in-place as an alternative. TVA publishedreduce planned cost increases over the final EIS on March 13, 2020 and its Record of Decision on April 14, 2020, which documents the final decision regarding the closure method for the CCR units at the Allen Fossil Plant.three-year period. TVA has decidedbeen able to remove CCR from the above identified areasmanage these challenges with limited business disruptions at this time; however, should pressures continue long term, TVA could experience more significant disruptions and pressure to an existing permitted offsite landfill.increase power rates.
Board Quorum
Federal Contracting
The terms of A.D. Frazier and Hiring Practices.Jeff W. Smith as members of the TVA Board ended January 3, 2023, with the
adjournment of the most recent session of Congress. Although their terms of office expired May 18, 2022, the TVA Act permitted them to continue to serve as Directors until the end of this session of Congress. On August 3, 2020, President Trump issued an "Executive Order ("EO") on Aligning Federal ContractingJanuary 4, 2023, Beth P. Geer, L. Michelle Moore, Robert P. Klein, William J. Renick, Joe H. Ritch, and Hiring PracticesA. Wade White took their oath of office and began their service as members of the TVA Board. With the Intereststhese new Board members, TVA has a full nine-member Board. The term of American Workers". Among other things, the EO directsDirector Kilbride
federal agencies to review contracts awarded in 2018 and 2019 to assess (i) whether temporary foreign labor was used and impacts from such use, and (ii) whether any offshoring occurred and its impacts. The EO also directs agencies to review employment policies for compliance with specific laws. TVAexpired on May 18, 2023, although he is conducting a review and will report a summary of its findings to the Office of Management and Budget ("OMB") by December 1, 2020.
Ratemaking
TVA, LPCs, and directly served industries have worked collaboratively in recent years to develop changes to rates that focus on TVA's long-term pricing efforts and the changing needs of customers in the Tennessee Valley. These changes have improved pricing by better aligning rates with underlying cost drivers and by sending improved pricing signals, while maintaining competitive industrial rates and keeping residential rates affordable.
In 2019,permitted under the TVA Board approvedAct to remain in office until the earlier of the end of the current session of Congress or the date a 20-year Partnership Agreement option that better aligns the length of LPC contracts with TVA's long-term commitments. These agreements are automatically extended each year after their initial effective date, contingent upon certain circumstances, including limited rate increases going forward. Participating LPCs will receive benefits including a 3.1 percent wholesale bill credit in exchange for their long-term commitment, which enables TVA to recover its long-term financial commitments over a commensurate period. In June 2020, TVA provided participating LPCs a flexibility option that allows them to locally generate up to approximately five percent of average total hourly energy sales over the prior five years in order to meet their individual customers' needs. As of November 16, 2020, 142 LPCs had signed the 20-year Partnership Agreement with TVA, and 64 LPCs had signed a Flexibility Agreement.successor takes office.
Safeguarding Assets
Physical Security — Non-Nuclear Asset Protection. TVA utilizes a variety of security technologies, security awareness activities, and security personnel to prevent sabotage, vandalism, and thefts. Any of these activities could negatively impact the ability of TVA to generate, transmit, and deliver power to its customers. TVA's Police and Emergency Management personnel are active participants with numerous professional and peer physical security organizations in both the electric industry and law enforcement communities.
Physical attacks on transmission facilities across the country have heightened awareness of the need to physically protect facilities. TVA continues to workworks with the North American Electric Reliability Corporation ("NERC"),NERC, the SERC Reliability Corporation, the North American Transmission Forum, and other utilities to implement industry approved recommendations and standards.
Nuclear Security. Nuclear security is carried out in accordance with federal regulations as set forth by the NRC. These regulations are designed for the protection of TVA's nuclear power plants, the public, and employees from the threat of radiological sabotage and other nuclear-related terrorist threats. TVA has security forces to guard against such threats.
Cybersecurity. TVA operates in a highly regulated environment with respect to cybersecurity. TVA's cybersecurity program aligns or complies with the Federal Information Security ManagementModernization Act, the NERC Critical Infrastructure Protection requirements, and the NRC requirements for cybersecurity, as well as industry best practices. As part of the U.S. government, TVA coordinates with and works closely with the U.S. Department of Homeland Security's Cybersecurity and Infrastructure Security Agency ("CISA") and the U.S. Computer Emergency Readiness Team ("US-CERT"). CISA serves as the agency assisting other federal entities in defending against threats and securing critical infrastructure. US-CERT functions as a liaison between the U.S. Department of Homeland Security and the public and private sectors to coordinate responses to security threats from the internet.threats.
The risk of cybersecurity events such as malicious code attacks, unauthorized access attempts, and social engineering
attempts is intensifying across all industries, including the energy sector. TVA continues to intensify.see increases in malicious activity including phishing campaigns, malicious websites, distributed denial of service attacks, and activity related to business partner compromise, among others. These types of malicious activity have also been observed by TVA's external vendors, stakeholders, and partners, which has caused the need for heightened awareness and preparedness.
On May 12, 2021, President Biden signed EO 14028, "Improving the Nation's Cybersecurity." This EO is intended to improve the nation's cybersecurity posture and protect federal government networks by improving information-sharing between the U.S. government and the private sector on cyber issues and strengthening the United States' ability to respond to incidents when they occur. This EO is focused on specific goals and requirements including actions for zero trust architectures; cloud services; FedRAMP programs; supply chain and contracts; secure software development; endpoint detection and response, standardized vulnerability, and incident response operational plans; threat and vulnerability analysis; assessment and threat-hunting; event logging, monitoring, and retention; and information sharing. TVA continues to respond to the EO, associated Office of Management and Budget memorandums, and other emerging requirements in alignment with the order. TVA has submitted all reports as required, established response teams and an oversight structure, and initiated projects as necessary to address the required actions.
TVA is leveraging federal and other partners to better identify, detect, protect, and respond to these potential attacks.
TVA's risk-based cybersecurity program is utilized to identify and prioritize remediation and mitigation activities to reduce the risk to TVA. While TVA and its third-party vendors and service providers have been, and will likely continue to be, subjected to such attacks and attempts to disrupt operations, to date the attacks have not had a significant or material impact on business or operations and have not impacted TVA's ability to operate as planned. See Part I, Item 1A, Risk Factors — Cybersecurity and Information Technology Risks — TVA's facilities and information infrastructure may not operate as planned due to cyber threats to TVA's assets and operations.
Over the last few years, there has been an increase of malicious cyber activity across all industries, including the energy sector. TVA has observed a significant increase in malicious activity related to the COVID-19 pandemic including phishing campaigns and malicious websites. These types of malicious activity are occurring across the industry and have also been observed by TVA's external vendors, stakeholders, and partners. This activity has caused the need for heightened awareness and preparedness. TVA is leveraging federal and other partners to better identify, detect, protect, and respond to these potential attacks. While there have been incidents of phishing and attempted fraud against TVA and its vendors and service providers, these events have not had a significant or material impact on business or operations.
Transmission Assets. In addition to physical and cybersecurity attacks, TVA's transmission assets are vulnerable to various types of electrically charged energy disruptions such as those from geomagnetic disturbances ("GMDs") and electromagnetic pulses ("EMPs"). Because the effects of GMD and EMP are similar, they are often considered together. In September 2016, the Federal Energy Regulatory Commission ("FERC") approved a new standard to address GMD events, and in March 2020, FERC approved a revision to the standard. TVA has met the requirements of the original standard and subsequent revisions, and has evaluated the effects of solar storms ranging from NERC's reference case to possible extreme
levels. TVA continues as an active participant with NERC in this field. The most serious threats from EMP are those caused by high-altitude nuclear explosions. Like others in the industry, TVA is coordinating with federal and state authorities, NERC, Electric Power Research Institute, and other grid owners and operators to address this concern.
Bulk-Power System Assets. On May 1, 2020, President Trump issued EO 13920, Securing the United States Bulk-Power System. Among other things, the EO prohibits the acquisition or installation of any bulk-power system electric equipment where the transaction (1) involves any property in which any foreign country or a national thereof has any interest and (2) poses an undue risk to the bulk-power system in, or national security of, the United States. Whether a bulk-power system electric equipment acquisition or installation is prohibited will depend on determinations by the Secretary of DOE that have not yet been made. At this time, it is uncertain to what extent this EO may impact TVA's operations.
Critical Accounting Policies and Estimates
TVA's consolidated financial statements are prepared in accordance with accounting principles generally accepted in the United States of America ("GAAP"), which require management to make estimates, judgments, and assumptions that affect the amounts reported in the consolidated financial statements and accompanying notes. Each of these estimates varies in regard to the level of judgment involved and its potential impact on TVA's financial results. Estimates are deemed critical either when a different estimate could have reasonably been used, or where changes in the estimate are reasonably likely to occur from period to period, and such use or change also would materially impact TVA's financial condition, results of operations, or cash flows. TVA's critical accounting policies are also discussed in Note 1 — Summary of Significant Accounting Policies of the Notes to Consolidated Financial Statements.
TVA believes that its most critical accounting policies and estimates relate to the following:AROs, fair value measurements, and pension and other post-retirement benefits.
•Regulatory Accounting;
•AROs; and
•Pension and Other Post-Retirement Benefits.
Management has discussed the development, selection, and disclosure of critical accounting policies and estimates with the Audit, Finance, Risk, and RegulationCybersecurity Committee of the TVA Board. While TVA's estimates and assumptions are based on its knowledge of current events and actions it may undertake in the future, actual results may ultimately differ from these estimates and assumptions.
Regulatory Accounting
The TVA Board is authorized by the TVA Act to set rates for power sold to customers; thus, TVA is "self-regulated." Additionally, TVA's regulated rates are designed to recover its costs of providing electricity. In view of demand for electricity and the level of competition, TVA has assumed that rates, set at levels that will recover TVA's costs, can be charged and collected. As a result of these factors, TVA records certain assets and liabilities that result from the regulated ratemaking process that would not be recorded under GAAP for non-regulated entities. Regulatory assets generally represent incurred costs that have been deferred because such costs are probable of future recovery in customer rates. Regulatory liabilities generally represent obligations to make refunds to customers for previous collections of costs that are not likely to be incurred or deferral of gains that will be credited to customers in future periods. The timeframe over which the regulatory assets are recovered from customers or regulatory liabilities are credited to customers is subject to annual TVA Board approval. At September 30, 2020, TVA had $10.4 billion of Regulatory assets and $164 million of Regulatory liabilities.
TVA assesses whether the regulatory assets are probable of future recovery by considering factors such as applicable regulatory changes, potential legislation, and changes in technology. Based on these assessments, TVA believes the existing regulatory assets are probable of recovery. This determination reflects the current regulatory and political environment and is subject to change in the future.
In 2017, the TVA Board authorized management to accelerate amortization of certain regulatory assets to the extent actual net income in 2018 exceeded the budgeted amount, up to the aggregate amount of those certain regulatory assets. Assets included in this Board action include: deferred nuclear generating units, environmental cleanup costs related to the Kingston ash spill, and nuclear training costs related to the refurbishing and restarting of Browns Ferry Unit 1 and the construction of Watts Bar Unit 2. TVA recorded $857 million of accelerated amortization of the Deferred nuclear generating units and Nuclear training costs regulatory assets in 2018. The TVA Board authorized TVA to use the amount included in the 2019 rate action for these two regulatory assets, to the extent needed, to accelerate amortization of the Environmental cleanup costs - Kingston ash spill regulatory asset in 2019. TVA recorded $266 million of accelerated recovery for the Kingston ash spill regulatory asset in 2019. No accelerated amortization was recorded in 2020.
TVA does not believe there is a reasonable likelihood that there will be a material change in the estimates or assumptions used to record regulatory assets and liabilities. If future recovery of regulatory assets ceases to be probable, or any of the other factors described herein cease to be applicable, TVA would be required to write off these costs and recognize them in net income or other comprehensive income.
Asset Retirement Obligations
TVA recognizes legal obligations associated with the future retirement of certain tangible long-lived assets. These obligations relate to TVA's generating facilities, including coal-fired, nuclear, hydroelectric, and natural gas and/or oil-fired. They also pertain to coal ash impoundments, transmission facilities, and other property-related assets. Activities involved with the retirement of these assets could include decontamination and demolition of structures, removal and disposal of wastes, and site restoration. TVA periodically reviews its estimated asset retirement obligation ("ARO")ARO liabilities. Revisions to the ARO estimates are made whenever factors indicate that the timing or amounts of estimated cash flows have changed. Any change to an ARO liability is recognized prospectively as an equivalent increase or decrease in the carrying value of the capitalized asset. Any accretion or depreciation expense related to these liabilities and assets is charged to a regulatory asset. See Note 910 — Regulatory Assets and Liabilities — Nuclear Decommissioning Costs and Non-Nuclear Decommissioning Costs and Note 1213 — Asset Retirement Obligations.for explanations of changes in estimates.
Nuclear Decommissioning. Utilities that own and operate nuclear plants are required to recognize a liability for legal obligations related to nuclear decommissioning. An equivalent amount is recorded as an increase in the carrying value of the capitalized asset and allocated to a regulatory asset over the useful life of the capitalized asset. The initial obligation is measured at its estimated fair value using various judgments and assumptions. Fair value is developed using an expected present value technique that is based on assumptions of market participants and that considers estimated retirement costs in current period dollars that are inflated to the anticipated decommissioning date and then discounted back to the date the ARO was incurred. Decommissioning cost studies are updated for each of TVA's nuclear units at least every five years. Changes in assumptions and estimates included within the calculations of the value of the AROs could result in significantly different results than those identified and recorded in the financial statements.statements, including amortization of the regulatory assets.
Nuclear Decommissioning. Decommissioning cost studies are updated for each of TVA's nuclear unit's long-lived assets at least every five years. At September 30, 2020,2023, the estimated future nuclear decommissioning cost recognized in the financial statements was $3.3$3.8 billion and was included in AROs, and the unamortized regulatory asset related to nuclear decommissioning ARO costs of $896$728 million was included in Regulatory assets.
The following key assumptions can have a significant effect on estimates related to the nuclear decommissioning costs reported in TVA's nuclear ARO liability:
Timing and Method – In projecting decommissioning costs, two assumptions must be made to estimate the timing of plant decommissioning. First, the date of the plant's retirement must be estimated. At Browns Ferry and Sequoyah, the estimated retirement date is based on the unit with the longest license period remaining. At Watts Bar, the estimated retirement date is based on each unit's license period. Second, an assumption must be made on the timing of the decommissioning. TVA has ascribed probabilities to two different decommissioning methods related to its nuclear decommissioning obligation estimate: the DECON method and the SAFSTOR method. The DECON method requires that radioactive contamination be removed from a site and safely disposed of or decontaminated to a level that permits the site to be released for unrestricted use shortly after it ceases operation. The SAFSTOR method allows nuclear facilities to be placed and maintained in a condition that allows the
facilities to be safely stored and subsequently decontaminated to levels that permit release for unrestricted use. TVA bases its nuclear decommissioning estimates on site-specific cost studies, which are updated for each of TVA's nuclear units at least every five years, with the last study performed in 2017.years. Changes in probabilities ascribed to the assumptions or the timing of decommissioning can significantly change the present value of TVA's obligations.
Cost Estimates – There is limited experience with actual decommissioning of large nuclear facilities. Changes in technology and experience as well as changes in regulations regarding nuclear decommissioning could cause cost estimates to change significantly. TVA's cost studies assume current technology and regulations.
Cost Escalation Rate – TVA uses expected inflation rates over the remaining timeframe until the costs are expected to be incurred to estimate the amount of future cash flows required to satisfy TVA's decommissioning obligations.
Discount Rate – TVA uses its incremental borrowing rate over a period consistent with the remaining timeframe until the costs are expected to be incurred to calculate the present value of the weighted estimated cash flows required to satisfy TVA's decommissioning obligations.
The actual decommissioning costs may vary from the derived estimates because of changes in current assumptions, such as the assumed dates of decommissioning, changes in regulatory requirements, changes in technology, and changes in the cost of labor, materials, and equipment. A 10 percent change in TVA's AROforecasted costs for nuclear decommissioning costactivities at September 30, 2020,2023, would have affected the liability by approximately $328$381 million.
Non-Nuclear Decommissioning. At September 30, 2020,2023, the estimated future non-nuclear decommissioning cost recognized in the financial statements was $3.5$3.7 billion and was included in AROs, and the unamortized regulatory asset related
to non-nuclear decommissioning ARO costs of $2.5$2.9 billion was included in Regulatory assets.
This decommissioning cost estimate involves estimating the amount and timing of future expenditures and making judgments concerning whether or not such costs are considered a legal obligation. Estimating the amount and timing of future expenditures includes, among other things, making projections of the timing and duration of the asset retirement process and predicting how costs will escalate with
inflation. These costs are predominantly CCR closure, CCR post-closure care and monitoring, and plant powerhouse asbestos removal. CCR closure estimates are primarily closure-in-place except for specific ponds located at Allen and Gallatin, which are closure-by-removal. CCR post-closure care and monitoring primarily includes costs for grounds maintenance, cover system and mechanical maintenance, inspections, and groundwater monitoring costs. Asbestos removal is based on cost per square foot to remove and dispose of asbestos-containing materials. TVA revises estimates of CCR closure on a project by project basis when updated cost information becomes available that causes management's expectation of cost to change materially. CCR post-closure care and monitoring costs and asbestos removal are studied for revision at least every five years, but revised more frequently if updated cost information becomes available that causes management's expectation of cost to change materially.
The following key assumptions can have a significant effect on estimates related to the non-nuclear decommissioning costs:
Timing and Method – In projecting non-nuclear decommissioning costs, the date of the asset's retirement must be estimated. In instances where the retirement of a specific asset will precede the retirement of the generating plant, the anticipated retirement date of the specific asset is used. Additionally, TVA expects to incur certain ongoing costs subsequent to the initial asset retirement. TVA develops its cost estimates based on likelihood of decommissioning method where options exist in fulfilling legal obligations (e.g., closure-in-place or closure-by-removal for coal ash impoundments). The decommissioning method is determined based on several factors including available technologies, environmental studies, cost factors, resource availability, and timing requirements. As these factors are considered and decommissioning methods are determined, the detailed project schedules and estimates are adjusted. Non-nuclear decommissioning cost estimates, including CCR post-closure care and monitoring costs and asbestos removal, are studied for revision at least every five years, but revised more frequently if updated cost information becomes available that causes management's expectation of cost to change materially. See Note 810 — Regulatory Assets and Liabilities — Non-Nuclear Decommissioning Costs.
Technology and Regulation – Changes in technology and experience as well as changes in regulations regarding non-nuclear decommissioning could cause cost estimates to change significantly. TVA's cost estimates generally assume current technology and regulations. In April 2015, the EPA published its final rule governing CCR, which regulates landfill and impoundment location, design, and operations; dictates certain pond-closure conditions; and establishes groundwater monitoring and closure and post-closure standards. As a result of this ruling, in 2015 TVA made revisions to the assumptions and estimates used to calculate its CCR AROs. TVA continues to evaluate the impact of the rule on its operations, including cost and timing estimates of related projects. As a result, further adjustments to its ARO liabilities may be required as estimates are refined.
Cost Escalation Rate – TVA uses expected inflation rates over the remaining timeframe until the costs are expected to be incurred to estimate the amount of future cash flows required to satisfy TVA's decommissioning obligations.
Discount Rate – TVA uses its incremental borrowing rate over a period consistent with the remaining timeframe until the costs are expected to be incurred to calculate the present value of the weighted estimated cash flows required to satisfy TVA's decommissioning obligations.
The actual decommissioning costs may vary from the derived estimates because of changes in current assumptions, such as the assumed dates of decommissioning, changes in the discount or escalation rates, changes in regulatory requirements, changes in technology, and changes in the cost of labor, materials, and equipment. A 10 percent change in TVA's AROforecasted costs for non-nuclear decommissioning costsactivities at September 30, 2020,2023, would have affected the liability by approximately $351$368 million.
Fair Value Measurements
Investments. Investment funds are comprised of equity securities and debt securities and are classified as trading. These securities are held in the Nuclear Decommissioning Trust ("NDT"), Asset Retirement Trust ("ART"), Supplemental Executive Retirement Plan ("SERP"), Deferred Compensation Plan ("DCP"), Restoration Plan ("RP"), and qualified benefit pension plan.
Investment Funds. The assets in the NDT, ART, SERP, DCP, and RP are generally measured at fair value based on quoted market prices or other observable market data such as interest rate indices. These investments are primarily U.S. and international equities, real estate investment trusts, fixed income investments, high-yield fixed income investments, U.S. Treasury Inflation-Protected Securities ("TIPS"), treasuries, currencies, derivative instruments, and other investments. TVA has classified all of these trading securities as either Level 1, Level 2, or Investments measured at net asset value ("NAV"). Private equity limited partnerships, private real asset investments, and private credit investments may include holdings of investments in private real estate, venture capital, buyout, mezzanine or subordinated debt, restructuring or distressed debt, and special situations through funds managed by third-party investment managers. These investments are valued at NAV as a practical expedient for fair value. There are no readily available quoted exchange prices for these investments. The fair value of these investments is
based on information provided by the investment managers. These investments are valued on a quarterly basis. See Note 16 — Fair Value Measurements —Valuation Techniques for a discussion of valuation levels of the investments.
Plan Investments. TVA's qualified benefit pension plan is funded with qualified plan assets. These investments are primarily global public equities, private equities, fixed income securities, public real assets, and private real assets. See Note 20 — Benefit Plans —Fair Value Measurements for disclosure of fair value measurements for investments held by the TVA Retirement System ("TVARS") that support TVA's qualified defined benefit pension plan.
Pricing. Prices provided by third parties for the assets in investment funds and plan investments are subjected to automated tolerance checks by the investment portfolio trustee to identify and avoid, where possible, the use of inaccurate prices. Any such prices identified as outside the tolerance thresholds are reported to the vendor that provided the price. If the prices are validated, the primary pricing source is used. If not, a secondary source price that has passed the applicable tolerance check is used (or queried with the vendor if it is out of tolerance), resulting in either the use of a secondary price, where validated, or the last reported default price, as in the case of a missing price. For monthly valued accounts, where secondary price sources are available, an automated inter-source tolerance report identifies prices with an inter-vendor pricing variance of over two percent at an asset class level. For daily valued accounts, each security is assigned, where possible, an indicative major market index, against which daily price movements are automatically compared. Tolerance thresholds are established by asset class. Prices found to be outside of the applicable tolerance threshold are reported and queried with vendors as described above.
For investment funds, TVA additionally performs its own analytical testing on the change in fair value measurements each period to ensure the valuations are reasonable based on changes in general market assumptions. TVA also performs pricing tests on various portfolios comprised of securities classified in Levels 1 and 2 on a quarterly basis to confirm accuracy of the values received from the investment portfolio trustee. For plan investments, TVARS reviews the trustee's Service Organization Controls report and the pricing policies of the trustee's largest pricing vendor.
Derivatives. TVA has historically entered into various derivative transactions, including commodity option contracts, forward contracts, swaps, swaptions, futures, and options on futures, to manage various market risks. Other than certain derivative instruments included in investment funds, it is TVA's policy to enter into these derivative transactions solely for hedging purposes and not for speculative purposes. See Note 10 — Regulatory Assets and Liabilities andNote 15— Risk Management Activities and Derivative Transactions for explanations of changes in estimates.
Currency and Interest Rate Derivatives.TVA has two currency swaps and two "fixed for floating" interest rate swaps. The currency swaps protect against changes in cash flows caused by volatility in exchange rates related to outstanding Bonds denominated in British pounds sterling. TVA uses interest rate swaps to fix variable short-term debt to a fixed rate. The currency and interest rate swaps are classified as Level 2 valuations as the rate curves and interest rates affecting the fair value of the contracts are based on observable data.
Commodity Derivatives. TVA enters into commodity contracts for natural gas that require physical delivery of the contracted quantity of the commodity. The natural gas derivative contracts are classified as Level 2 valuations based on market approaches which utilize short-term and mid-term market-quoted prices from an external industry brokerage firm.
TVA maintains policies and procedures to value commodity contracts using what is believed to be the best and most relevant data available. In addition, TVA's risk management group reviews valuations and pricing data.
Commodity Derivatives under the Financial Hedging Program ("FHP"). In 2022, the FHP was reinstated and the TVA Board approved the elimination of the Value at Risk aggregate transaction limit for the FHP and authorized the use of tolerances and measures that will be reviewed annually by the TVA Board. Hedging activity began under the program in the second quarter of 2022. The commodity derivatives under the FHP are classified as Level 2 valuations based on market approaches which utilize short-term and mid-term market-quoted prices from an external industry brokerage firm.
Fair Value Considerations. In determining the fair value of its financial instruments, TVA considers the source of observable market data inputs, liquidity of the instrument, credit risk, and risk of nonperformance of itself or the counterparty to the contract. The conditions and criteria used to assess these factors are described below.
Sources of Market Assumptions.TVA derives its financial instrument market assumptions from market data sources (e.g., Chicago Mercantile Exchange and Moody's Investors Service, Inc. ("Moody's")). In some cases, where market data is not readily available, TVA uses comparable market sources and empirical evidence to derive market assumptions and determine a financial instrument's fair value.
Market Liquidity.Market liquidity is assessed by TVA based on criteria as to whether the financial instrument trades in an active or inactive market. A financial instrument is considered to be in an active market if the prices are fully transparent to the market participants, the prices can be measured by market bid and ask quotes, the market has a relatively high trading volume, and the market has a significant number of market participants that will allow the market to rapidly absorb the quantity of the assets traded without significantly affecting the market price. Other factors TVA considers when determining whether a
market is active or inactive include the presence of government or regulatory control over pricing that could make it difficult to establish a market-based price upon entering into a transaction.
Nonperformance Risk. In determining the potential impact of nonperformance risk, which includes credit risk, TVA considers changes in current market conditions, readily available information on nonperformance risk, letters of credit, collateral, other arrangements available, and the nature of master netting arrangements. TVA is a counterparty to derivative instruments that subject TVA to nonperformance risk. Nonperformance risk on the majority of investments and certain exchange-traded instruments held by TVA is incorporated into the exit price that is derived from quoted market data that is used to value the investment.
Nonperformance risk for most of TVA's derivative instruments is an adjustment to the initial asset/liability fair value. TVA adjusts for nonperformance risk, both of TVA (for liabilities) and the counterparty (for assets), by applying a credit valuation
adjustment ("CVA"). TVA determines an appropriate CVA for each applicable financial instrument based on the term of the instrument and TVA's or the counterparty's credit rating as obtained from Moody's. For companies that do not have an observable credit rating, TVA uses internal analysis to assign a comparable rating to the company. TVA discounts each financial instrument using the historical default rate (as reported by Moody's for CY 1983 to CY 2022) for companies with a similar credit rating over a time period consistent with the remaining term of the contract.
All derivative instruments are analyzed individually and are subject to unique risk exposures. The application of CVAs resulted in a $1 million decrease in the fair value of assets and a $1 million decrease in the fair value of liabilities at September 30, 2023.
Collateral.TVA's interest rate swaps, currency swaps, and commodity derivatives under the FHP contain contract provisions that require a party to post collateral (in a form such as cash or a letter of credit) when the party's liability balance under the agreement exceeds a certain threshold. See Note 15 — Risk Management Activities and Derivative Transactions—Other Derivative Instruments — Collateral for a discussion of collateral related to TVA's derivative liabilities.
Pension and Other Post-Retirement Benefits
TVA sponsors a defined benefit pension plan that is qualified under section 401(a) of the Internal Revenue Code and covers substantially all of its full-time annual employees hired prior to July 1, 2014. TVARS, a separate legal entity governed by its own board of directors (the "TVARS Board"), administers the qualified defined benefit pension plan. TVA also provides a Supplemental Executive Retirement Plan ("SERP")SERP to certain executives in critical positions, which provides supplemental pension benefits tied to compensation levels that exceed limits imposed by IRS rules applicable to the qualified defined benefit pension plan. Additionally, TVA provides post-retirement health care benefits for most of its full-time employees who reach retirement age while still working for TVA.
TVA's pension and other post-retirement benefits contain uncertainties because they require management to make certain assumptions related to TVA's cost to provide these benefits. Numerous factors are considered including the provisions of the plans, changing employee demographics, various actuarial calculations, assumptions, and accounting mechanisms. EffectsLingering effects of the COVID-19 pandemic, supply-chain disruptions, inflation, and geopolitical tensions on the financial markets, regulations, and experience are uncertain and still evolving, creating an additional degree andof complexity associated with the future occurrence or outcome of events and conditions underlying the significant accounting assumptions discussed below.
KeyCertain key actuarial assumptions utilizedcritical to the pension and postretirement accounting estimates include expected long-term rate of return on plan assets, discount rates, projected health care cost trend rates, expected long-term ratecost of return on plan assets, rate of increase in future compensation levels, retirement rates, expected timing and form of payments,living adjustments ("COLA"), and mortality rates. Every five years, a formal actuarial experience study that compares assumptions to the actual experience is conducted. Additional ad-hoc experience studies are performed as needed to review recent experience and validate recommended changes to the actuarial assumptions used based upon TVA's lastlatest experience study in 2018. 2023. See Note 20 — Benefit Plans for explanations of changes in assumptions and estimates.
Expected Return on Plan Assets. The qualified defined benefit pension plan is the only plan that is funded with qualified plan assets. In determining the expected long-term rate of return on pension plan assets, TVA uses a process that incorporates actual historical asset class returns and an assessment of expected future performance and takes into consideration external actuarial advice, the current outlook on capital markets, the asset allocation policy, and the anticipated impact of active management. Based upon review ofIn September 2023, the current plan'sTVARS Board approved a new asset target allocation mix, capital market outlooks, andpolicy, but had no changes to the most recent studies, TVA management maintained its 6.756.50 percent expected long-term rate of return on plan assets assumption which will be used to calculate the 2021 net periodic pension cost.adopted in 2022.
TVA recognizes the impact of asset performance on pension expense over a three-year phase-in period through a market-related value of assets ("MRVA") calculation. The market-related value of assetsMRVA recognizes investment gains and losses over a three-year period and is used in calculating the expected return on assets and the recognized net actuarial loss components of pension net periodic benefit cost.
A higher expected rate of return assumption decreases the net periodic pension benefit costs, whereas a lower expected rate of return assumption increases the net periodic pension benefit cost. The plan's actual rate of return for 20202023 was 5.116.13 percent compared to the assumption of 6.756.50 percent. The difference between the expected and actual return on plan
assets resulted in an actuarial loss of $91$9 million that is recognized as an increase in the related regulatory asset and an increase in the pension benefit obligation at September 30, 2020.2023.
Discount Rate. TVA's discount rates are derived by identifying a theoretical settlement portfolio of high quality corporate bonds of Aa quality or higher sufficient to provide for the projected benefit payments. The model matches the present value of the projected benefit payments to the market value of the theoretical settlement bond portfolio with any resulting excess funds presumed to be reinvested and used to meet successive year benefit payments. A single equivalent discount rate is determined to align the present value of the required cash flow with the value of the bond portfolio. The resulting discount rates are reflective of both the current interest rate and the distinct liability of the pension and post-retirement benefit plans.
The discount rate is somewhat volatile because it is determined based upon the prevailing rate of long-term corporate bonds as of the measurement date. A higher discount rate decreases the plan obligations and correspondingly decreases the net periodic pension and net post-retirement benefit costs for those plans where actuarial losses are being amortized. Alternatively, a lower discount rate increases net periodic pension and net periodic post-retirement benefit costs. The discount rates used to determine the pension and post-retirement benefit obligations were 2.755.95 percent and 3.056.05 percent, respectively, at September 30, 2020.2023.
Health Care Cost Trends. In establishing health care cost trend rates for the post-retirement obligation, TVA reviews actual recent cost trends and projected future trends considering health care inflation, changes in health care utilization, and changes in plan benefits and premium experience. The pre-Medicare current health care costeligible per capita claims costs trend rate is 6.507.50 percent, declining 0.25 percent per year until it reaches the ultimate trend rate isof 5.00 percent in 2034. The pre-Medicare eligible per capita contributions trend rate and the year to reach the ultimate rate is 2027.5.00 percent. The post-Medicare current health care cost trend rate is zero percent for years 2023 through 2025, reaching the ultimate rate of 4.00 percent in 2026. During 2023, TVA recognized a $27 million actuarial loss to reflect observed and ultimate health careanticipated plan experience for contribution costs and pre-Medicare per capita claims costs and a $17 million actuarial loss due to changes in the pre-Medicare per capita claims cost trend rate remained constant at zero percent and 4.00 percent, respectively, whereas the year to reach the ultimate rate was extended to 2024 from 2023 attributable to lower than expected premium increases on the private exchange. This change in the post-Medicare health care cost trend rate assumption resulted in a $15 million decrease in the post-retirement obligation at September 30, 2020.assumptions.
Cost of Living Adjustments. Cost of living adjustments ("COLAs") are an increase in the benefits for eligible retirees to help maintain the purchasing power of benefits as consumer prices increase. This assumption is based on the long-term expected future rate of inflation, which is based on the capital market outlooks, economic forecasts, and the Federal Reserve policy. See Note 2120 — Benefit Plans — Plan Assumptions — Cost of Living Adjustment for further discussion on the calculation of the COLA. The actual COLA for CY 20202023 was 1.546.00 percent. The CY 20212024 COLA is assumed to be 1.004.05 percent, and for years thereafter the COLA is assumed to be 2.00 percent. A higher COLA increases the pension benefit obligation whereas a lower COLA assumption decreases the obligation. The actual calendar year COLA and the long-term COLA assumption are used to determine the benefit obligation at September 30 and the net periodic benefit costs for the following fiscal year.
Mortality. TVA's mortality assumptions are based upon actuarial projections in combination with actuarial studies of the actual mortality experience of TVARS's pension and post-retirement benefit plan participants taking into consideration the Society of Actuaries ("SOA") mortality table and projection scales as of September 30, 2020.2023. TVA continues to monitor the availability of updates to mortality tables, longevity improvement scales, and mortality reviews and experience studies to consider whether these updates should be reflected in the current year mortality assumption. In determining the benefit obligations at September 30, 2020, TVA adopted a modified version of the SOA PRI-2012 mortality table and a modified version of the MP-2019 projection scale based upon an updated mortality experience study. The change in TVA's mortality assumptions resulted in a $137 million decrease in the pension obligation and a $2 million increase in the post-retirement obligation at September 30, 2020.
Sensitivity to Changes in Key Assumptions
The following tables illustrate the estimated effects of changing certain of the critical actuarial assumptions discussed above, while holding all other assumptions constant and excluding any impact for unamortized actuarial gains and losses:
| Sensitivity to Certain Changes in Pension Assumptions At September 30, 2020 | |
| Sensitivity to Certain Changes in Pension Assumptions | | Sensitivity to Certain Changes in Pension Assumptions |
Actuarial Assumption |
Actuarial Assumption | | Current Assumption | | Change in Assumption | | Impact |
Actuarial Assumption | | Actual Assumption | | Change in Assumption | | Impact |
| Effect on 2020 pension expense: | | | | | | | |
| Effect on 2023 pension expense: | | Effect on 2023 pension expense: | | | | | | |
| Discount rate | Discount rate | | 3.20 | % | | (0.25) | % | | $ | 17 | | Discount rate | | 5.60 | % | | (0.25) | % | | $ | 12 | |
| Expected return on assets | Expected return on assets | | 6.75 | % | | (0.25) | % | | 18 | | Expected return on assets | | 6.50 | % | | (0.25) | % | | 19 | |
| COLA | COLA | | 2.00 | % | | 0.25 | % | | 30 | | COLA | | 2.00 | % | | 0.25 | % | | 24 | |
| | Effect on benefit obligation | | |
| Effect on benefit obligation at September 30, 2023: | | Effect on benefit obligation at September 30, 2023: | |
| Discount rate | Discount rate | | 2.75 | % | | (0.25) | % | | 418 | | Discount rate | | 5.95 | % | | (0.25) | % | | $ | 236 | |
| COLA | COLA | | 2.00 | % | | 0.25 | % | | 270 | | COLA | | 2.00 | % | | 0.25 | % | | 165 | |
| | | | | | | | | | | |
Sensitivity to Changes in Assumed Health Care Cost Trend Rates At September 30, 2020 |
| | 1% Increase | | 1% Decrease |
| Effect on total of service and interest cost components for the year | $ | 4 | | | $ | (4) | |
| Effect on end-of-year accumulated post-retirement benefit obligation | 70 | | | (68) | |
| | | | | | | | | | | |
| Sensitivity to Changes in Assumed Health Care Cost Trend Rates |
| | 1% Increase | | 1% Decrease |
| Effect on total of service and interest cost components for 2023 | $ | 5 | | | $ | (3) | |
| Effect on end-of-year accumulated post-retirement benefit obligation at September 30, 2023 | 52 | | | (48) | |
Contributions. The minimum pension contribution for 2020 was $300 million and was paid in twelve monthly installments. TVA made contributions of $5 million to the SERP and $25 million, net of rebates and subsidies received, to the unfunded other post-retirement benefit plans. TVA expects to contribute $300 million to TVARS, $5 million to the SERP, and $28 million to the other post-retirement benefit plans in 2021.
Accounting Mechanisms. In accordance with current accounting guidance, TVA utilizes a number of accounting mechanisms that reduce the volatility of reported pension expense. Differences between actuarial assumptions and actual plan results are deferred and amortized into period expense only when the accumulated differences exceed 10 percent of the greater of the projected benefit obligation or the market-related value of plan assets. If necessary, the excess is amortized over the
average future expected working lifetime of participants expected to receive benefits, which is approximately 11 years for the pension plan and 12 years for the post-retirement plan. Additionally, TVA recognizes pension costs as regulatory assets to the extent that the amount calculated under U.S. GAAP as pension expense differs from the amount TVA contributes to the pension plan as pension plan contributions. As a result of recent plan design changes, future contributions are expected to exceed the expense calculated under U.S. GAAP. Accordingly, TVA will discontinue this regulatory accounting practice once all such deferred costs have been recovered, at which time it will recognize pension costs in accordance with U.S. GAAP. Furthermore, amortization of net prior service cost/(credit) resulting from a plan change is included as a component of period expense in the year first recognized and every year thereafter until it is fully amortized. The increase or decrease in the benefit obligation due to a plan change is amortized over the average remaining service period of participating employees expected to receive benefits under the plans. The pension and post-retirement plans currently have prior service costs/(credits) from plan changes made in 2009, 2010, 2016, 2018, 2019, and 2020 with remaining amortization periods of one to nine years.
Fair Value Measurements
Investments
Investment Funds. Investments classified as trading consist of amounts held in the Nuclear Decommissioning Trust ("NDT"), Asset Retirement Trust ("ART"), SERP, and Deferred Compensation Plan ("DCP"). These assets are generally measured at fair value based on quoted market prices or other observable market data such as interest rate indices. These investments are primarily U.S. and international equities, real estate investment trusts, fixed income investments, high-yield fixed income investments, U.S. Treasury Inflation-Protected Securities, treasuries, currencies, derivative instruments, and other investments. TVA has classified all of these trading securities as either Level 1, Level 2, or Investments measured at net asset value. See Note 16 — Fair Value Measurements —Valuation Techniques for a discussion of valuation levels of the investments.
Plan Investments. TVA's qualified benefit pension plan is funded with qualified plan assets. These investments are primarily global public equities, private equities, fixed income securities, public real assets, and private real assets. See Note 21 — Benefit Plans —Fair Value Measurements for disclosure of fair value measurements for investments held by TVARS that support TVA's qualified defined benefit pension plan.
Pricing. Prices provided by third-parties for the assets in investment funds and plan investments are subjected to automated tolerance checks by the investment portfolio trustee to identify and avoid, where possible, the use of inaccurate prices. Any such prices identified as outside the tolerance thresholds are reported to the vendor that provided the price. If the prices are validated, the primary pricing source is used. If not, a secondary source price that has passed the applicable tolerance check is used (or queried with the vendor if it is out of tolerance), resulting in either the use of a secondary price, where validated, or the last reported default price, as in the case of a missing price. For monthly valued accounts, where secondary price sources are available, an automated inter-source tolerance report identifies prices with an inter-vendor pricing variance of over two percent at an asset class level. For daily valued accounts, each security is assigned, where possible, an indicative major market index, against which daily price movements are automatically compared. Tolerance thresholds are established by asset class. Prices found to be outside of the applicable tolerance threshold are reported and queried with vendors as described above.
For investment funds, TVA additionally performs its own analytical testing on the change in fair value measurements each period to ensure the valuations are reasonable based on changes in general market assumptions. TVA also performs pricing tests on various portfolios comprised of securities classified in Levels 1 and 2 on a quarterly basis to confirm accuracy of the values received from the investment portfolio trustee. For plan investments, TVARS reviews the trustee's Service Organization Controls report and the pricing policies of the trustee's largest pricing vendor.
Derivatives
TVA has historically entered into various derivative transactions, including commodity option contracts, forward contracts, swaps, swaptions, futures, and options on futures, to manage various market risks. Other than certain derivative instruments included in investment funds, it is TVA's policy to enter into these derivative transactions solely for hedging purposes and not for speculative purposes.
Currency and Interest Rate Derivatives. TVA has three currency swaps and four "fixed for floating" interest rate swaps. The currency swaps protect against changes in cash flows caused by volatility in exchange rates related to outstanding Bonds denominated in British pounds sterling. TVA uses interest rate swaps to fix variable short-term debt to a fixed rate. The currency and interest rate swaps are classified as Level 2 valuations as the rate curves and interest rates affecting the fair value of the contracts are based on observable data. The application of credit valuation adjustments ("CVAs") did not materially affect the fair value of these assets and liabilities at September 30, 2020.
Commodity Contracts. TVA enters into commodity contracts for coal and natural gas that require physical delivery of the contracted quantity of the commodity. During the fourth quarter of 2020, TVA discontinued derivative accounting for forward coal contracts because these contracts no longer meet the criteria of net settlement. As a result, the associated net derivative liabilities and regulatory assets have been derecognized. The natural gas derivative contracts are classified as Level 2 valuations based on market approaches which utilize short-term and mid-term market-quoted prices from an external industry brokerage firm. The application of CVAs did not materially affect the fair value of these assets and liabilities at September 30, 2020.
TVA maintains policies and procedures to value commodity contracts using what is believed to be the best and most relevant data available. In addition, TVA's risk management group reviews valuations and pricing data.
Fair Value Considerations
In determining the fair value of its financial instruments, TVA considers the source of observable market data inputs, liquidity of the instrument, credit risk, and risk of nonperformance of itself or the counterparty to the contract. The conditions and criteria used to assess these factors are described below.
Sources of Market Assumptions. TVA derives its financial instrument market assumptions from market data sources (e.g., CME and Moody's Investors Service, Inc. ("Moody's")). In some cases, where market data is not readily available, TVA uses comparable market sources and empirical evidence to derive market assumptions and determine a financial instrument's fair value.
Market Liquidity. Market liquidity is assessed by TVA based on criteria as to whether the financial instrument trades in an active or inactive market. A financial instrument is considered to be in an active market if the prices are fully transparent to the market participants, the prices can be measured by market bid and ask quotes, the market has a relatively high trading volume, and the market has a significant number of market participants that will allow the market to rapidly absorb the quantity of the assets traded without significantly affecting the market price. Other factors TVA considers when determining whether a market is active or inactive include the presence of government or regulatory control over pricing that could make it difficult to establish a market-based price upon entering into a transaction.
Nonperformance Risk. In determining the potential impact of nonperformance risk, which includes credit risk, TVA considers changes in current market conditions, readily available information on nonperformance risk, letters of credit, collateral, other arrangements available, and the nature of master netting arrangements. TVA is a counterparty to derivative instruments
that subject TVA to nonperformance risk. Nonperformance risk on the majority of investments and certain exchange-traded instruments held by TVA is incorporated into the exit price that is derived from quoted market data that is used to value the investment.
Nonperformance risk for most of TVA's derivative instruments is an adjustment to the initial asset/liability fair value. TVA adjusts for nonperformance risk, both of TVA (for liabilities) and the counterparty (for assets), by applying a CVA. TVA determines an appropriate CVA for each applicable financial instrument based on the term of the instrument and TVA's or the counterparty's credit rating as obtained from Moody's. For companies that do not have an observable credit rating, TVA uses internal analysis to assign a comparable rating to the company. TVA discounts each financial instrument using the historical default rate (as reported by Moody's for CY 1983 to CY 2019) for companies with a similar credit rating over a time period consistent with the remaining term of the contract.
All derivative instruments are analyzed individually and are subject to unique risk exposures. The application of CVAs resulted in a less than $1 million decrease in the fair value of assets and a $1 million decrease in the fair value of liabilities at September 30, 2020.
Collateral. TVA's interest rate swaps and currency swaps contain contract provisions that require a party to post collateral (in a form such as cash or a letter of credit) when the party's liability balance under the agreement exceeds a certain threshold. See Note 15 — Risk Management Activities and Derivative Transactions—Other Derivative Instruments — Collateral for a discussion of collateral related to TVA's derivative liabilities.
New Accounting Standards and Interpretations
See Note 2 — Impact of New Accounting Standards and Interpretations for a discussion of recent accounting standards and pronouncements whichthat were issued by the Financial Accounting Standards Board ("FASB"), became effective for TVA, or were adopted by TVA during the presented periods.
Legislative and Regulatory Matters
TVA continues to monitor how regulatory agencies are interpreting and implementing the provisions of the Dodd-Frank Wall Street Reform and Consumer Protection Act, which was enacted in July 2010. As a result, TVA has become subject to recordkeeping, reporting, and reconciliation requirements related to its derivative transactions. In addition, depending on how regulatory agencies interpret and implement the provisions, TVA's hedging costs may increase, and TVA may have to post additional collateral and margin in connection with its derivative transactions.
For additional discussion on legislative and regulatory matters, including a discussion of environmental legislation and regulation, see Part I, Item 1, Business — Environmental Matters, Part I, Item 1, Business — Regulation, and Item 7, Management's Discussion and Analysis of Financial Condition and Results of Operations — Key Initiatives and Challenges — Regulatory Compliance.Challenges.
TVA does not engage, and does not control any entity that is engaged, in any activity listed under Section 13(r) of the Securities Exchange Act of 1934 (the "Exchange Act"), which requires certain issuers to disclose certain activities relating to Iran involving the issuer and its affiliates. Based on information supplied by each such person, none of TVA's directors and executive officers are involved in any such activities. While TVA is an agency and instrumentality of the U.S., TVA does not believe its disclosure obligations, if any, under Section 13(r) extend to the activities of any other departments, divisions, or agencies of the U.S.
Environmental Matters
See Part I, Item 1, Business — Environmental Matters, which discussion is incorporated by reference into this Item 7, Management's Discussion and Analysis of Financial Condition and Results of Operations.
Legal Proceedings
From time to time, TVA is a party to or otherwise involved in lawsuits, claims, proceedings, investigations, and other legal matters ("Legal ProceedingsProceedings") that have arisen in the ordinary course of conducting its activities, as a result of catastrophic events or otherwise. As of September 30, 2020,2023, TVA had accrued approximately $14$28 million with respect to Legal Proceedings. No assurance can be given that TVA will not be subject to significant additional claims and liabilities. If actual liabilities significantly exceed the estimates made, TVA's results of operations, liquidity, and financial condition could be materially adversely affected.
For a discussion of certain current material Legal Proceedings, see Note 22 — Commitments and Contingencies — Legal Proceedings, which discussions are incorporated into this Item 7, Management's Discussion and Analysis of Financial Condition and Results of Operations.
Risk Management Activities
TVA is exposed to various market risks. These market risks include risks related to commodity prices, investment prices, interest rates, currency exchange rates, inflation, and counterparty credit and performance risk. To help manage certain of these risks, TVA has entered into various derivative transactions, including commodity option contracts, forward contracts, swaps, swaptions, futures, and options on futures. Other than certain derivative instruments in its trust investment funds, it is TVA's policy to enter into these derivative transactions solely for hedging purposes and not for speculative purposes. See Note 15 — Risk Management Activities and Derivative Transactions.
Risk Governance
The Enterprise Risk Council ("ERC") is responsible for the highest level of risk oversight at TVA and is also responsible for communicating enterprise-wide risks with policy implications to the TVA Board or a designated TVA Board committee. The Enterprise Risk CouncilERC is comprised of the Enterprise Leadership Team ("ELT") and the Chief Risk Officer ("CRO") who acts as Chair. ERC members may invite additional attendees to meetings as non-voting participants. The ERC has also established subordinate committees, consisting of business unit leaders, to assist in the oversight of fuel and power procurement, DER programs and products, and general risk management.
TVA has a designated Enterprise Risk Management ("ERM") organization within its Financial Services organization responsible for (1) establishing enterprise risk management policies and guidelines, (2) developing an enterprise risk profile aligned with TVA's strategic objectives, (3) performing annual risk assessments across all TVA business units, (4) monitoring and reporting on identified enterprise risks and emerging risks, (5) facilitating enterprise risk discussions with the risk subject matter experts across the organization and at the ERC and TVA Board levels, and (6) developing and improving TVA's risk awareness culture. TVA has cataloged major short-term and long-term enterprise level risks across the organization. A discussion of significant risks is presented in Part I, Item 1A, Risk Factors.
Commodity Price Risk
TVA is exposed to effects of market fluctuations in the price of commodities that are critical to its operations, including electricity, coal, and natural gas. The magnitude of exposure to these risks is influenced by many factors including contract terms and market liquidity. TVA's commodity price risk is substantially mitigated by its cost-based rates, including its total fuel cost adjustment, and long-term fixed price commodity contracts.
Commodity Derivatives. TVA manages risk with commodity contracts for both coal and natural gas that require physical delivery of the contracted quantity. A hypothetical 10 percent decline in the market price of coal on September 30, 2019, would have resulted in a decrease of approximately $34 million in the fair value of TVA's coal derivative instruments at this date. TVA discontinued derivative accounting for forward coal contracts during the fourth quarter of 2020; therefore, a hypothetical 10 percent decline in the market price of coal on September 30, 2020, is not presented. A hypotheticalAn immediate 10 percent decline in the market price of natural gas on September 30, 20202023 and 2019,2022, would have resulted in decreases of approximately $84$1 million and $79$18 million, respectively, in the fair value of TVA's natural gas derivative instruments at these dates.
Commodity Derivatives under the FHP. TVA manages risk with commodity derivatives under the FHP by hedging exposure to the price of natural gas. An immediate 10 percent decline in the market price of natural gas on September 30, 2023 and 2022, would have resulted in a decrease of approximately $127 million and $133 million, respectively, in the fair value of TVA's natural gas derivative instruments under the FHP.
Investment Price Risk
TVA's investment price risk relates primarily to investments in TVA's NDT, ART, pension fund, SERP, DCP, and DCP.RP.
Nuclear Decommissioning Trust. The NDT is generally designed to achieve a return in line with overall equity and debt market performance. The assets of the trust are invested in debt and equity securities, private partnerships, and certain derivative instruments including forwards, futures, options, and swaps, and through these investments the trust has exposure to U.S. equities, international equities, real estate investment trusts, natural resource equities, high-yield debt, domestic debt, U.S. Treasury Inflation-Protected Securities ("TIPS"),TIPS, treasuries, private real assets, private equity, and private credit strategies. At September 30, 20202023 and 2019,2022, an immediate 10 percent decrease in the price of the investments in the trust would have reduced the value of the trust by $223$279 million and $211$252 million, respectively.
Asset Retirement Trust. The ART is presently invested to achieve a return in line with overall equity and debt market performance. The assets of the trust are invested in debt and equity securities, private partnerships, and certain derivative instruments including options, and through these investments the trust has exposure to U.S. equities, real estate investment trusts, natural resource equities, high-yield debt, domestic debt, TIPS, treasuries, private real assets, private equity, and private credit strategies. At September 30, 20202023 and 2019,2022, an immediate 10 percent decrease in the price of the investments in the trust would have reduced the value of the trust by $87$124 million and $77$106 million, respectively.
Due to higher volatility in the financial markets associated with the COVID-19 pandemic, TVA has experienced fluctuations related to its ART and NDT investment portfolio during 2020. The losses experienced during the three months ended March 31, 2020, have been recovered. For the year ended September 30, 2020, the NDT increased in value $123 million compared to the year ending September 30, 2019. Despite this volatility, TVA's NDT funding as of September 30, 2020, continues to be fully funded per the NRC funding requirements.
Qualified Pension Plan. In 2021, a new asset allocation policy was put in place to reduce risk and volatility in the TVARS investment portfolio. Furthermore, in September 2023, based on current market conditions and updated capital market assumptions, the asset allocation policy was modified to further progress towards these goals. TVARS investments will be reallocated in a prudent manner over time to move toward the new asset allocation targets. The TVARS asset allocation policy for qualified pension plan assets has targets of 4017 percent equity including global public and private equity investments, 40growth assets, 30 percent fixed income securities,defensive growth assets, 33 percent defensive assets, and 20 percent real assets, including public and private real asset investments. TVARS has a long-term investment plan that contains a dynamic de-risking strategy which will allocate investments to assets that better match the liability, such as long duration fixed income securities, over time as improved funding status targets are met.inflation-sensitive assets. Pursuant to the TVARS Rules and Regulations, any proposed changes in asset allocation that would change the system'sTVARS's assumed rate of investment return are subject to TVA'sthe review and veto.veto of the TVA Board.
As set forth above, the qualified pension plan assets are invested across global public equity, private equity, safety oriented fixed income, opportunistic fixed income, public realgrowth assets, defensive growth assets, defensive assets, and private realinflation-sensitive assets. The TVARS asset allocation policy includes permissible deviations from these target allocations, and action can be taken, as appropriate, to rebalance the plan's assets consistent with the asset allocation policy. At September 30, 20202023 and 2019,2022, an immediate 10 percent decrease in the value of the net assets of the fund would have reduced the value of the fund by approximately $796$813 million and $798$809 million, respectively.
Supplemental Executive Retirement Plan. The SERP is a non-qualified defined benefit pension plan similar to those typically found in other companies in TVA's peer group and is provided to selected employees of TVA. TVA's SERP was created to recruit and retain key executives. The plan is designed to provide a competitive level of retirement benefits in excess of the limitations on contributions and benefits imposed by TVA's qualified defined benefit plan and Internal Revenue Code Section 415 limits on qualified retirement plans. The SERP currently targets an asset allocation policy for its plan assets of 64 percent equity securities, which includes U.S. and non-U.S. equities, and 36 percent fixed income securities. The SERP plan assets are presently invested to achieve a return in line with overall equity and debt market performance. At September 30, 20202023 and 2019,2022, an immediate 10 percent decrease in the value of the SERP investments would have reduced the value of the investments by $7$8 million and $6$7 million, respectively.
Deferred Compensation Plan. The DCP is designed to provide participants with the ability to defer compensation to future periods. The plan assists in the recruitment of top executive talent for TVA. As in other corporations, deferred compensation can be an integral part of a total compensation package. Assets currently include deferral balances. The default return on investment of the accounts is interest calculated based on the composite rate of all marketable U.S. Treasury issues.
Executives may alternatively choose to have their balances adjusted based on the return of certain mutual funds. At both September 30, 20202023 and 2019,2022, an immediate 10 percent decrease in the value of the deferred compensation accounts would have reduced the value of the accounts by $3$2 million.
Restoration Plan. The RP is a non-qualified excess 401(k) plan designed to allow certain eligible employees whose contributions to the 401(k) plan are limited by IRS rules to save additional amounts for retirement and receive non-elective and matching employer contributions. The plan is designed to provide a competitive level of retirement benefits and assist in the recruitment of executive talent for TVA. The default return on investment of the accounts is interest calculated based on the composite rate of all marketable U.S. Treasury issues. Executives may alternatively choose to have their balances adjusted based on the return of certain mutual funds. At September 30, 2023, an immediate 10 percent decrease in the value of the RP accounts would have reduced the value of the accounts by less than $1 million.
Interest Rate Risk
TVA's interest rate risk is related primarily to its short-term investments, short-term debt, long-term debt, and interest rate derivatives.
Investments. At September 30, 2020,2023, TVA had $501 million of cash and cash equivalents, and the average balance of cash and cash equivalents for 2023 was $544 million. The average interest rate that TVA received on its short-term investments during 2023 was 4.65 percent. If the rates of interest that TVA received on its short-term investments during 2023 were 3.65 percent, TVA would have received $5 million less in interest from its short-term investments. At September 30, 2022, TVA had $500 million of cash and cash equivalents, and the average balance of cash and cash equivalents for 20202022 was $637$675 million. The average interest rate that TVA received on its short-term investments during 20202022 was slightly less than one percent. If the rates of interest that TVA received on its short-term investments during 2020 were zero percent, TVA would have received approximately $4 million less in interest from its short-term investments. At September 30, 2019, TVA had $299 million of cash and cash equivalents, and the average balance of cash and cash equivalents for 2019 was $336 million. The average interest rate that TVA received on its short-term investments during 2019 was 2.40 percent. If the rates that TVA received on its short-term investments during 20192022 were 1.40exactly zero percent, TVA would have received approximately $3$4 million less in interest from its short-term investments. In addition to affecting the amount of interest that TVA receives from its short-term investments, changes in interest rates could affect the value of the investments in its NDT, ART, pension plan, ART, NDT, SERP, DCP, and DCP.RP. See Risk Management Activities — Investment Price Risk above.
Short-Term Debt. At September 30, 2020,2023, TVA's short-term borrowings were $57$432 million, and the current maturities of long-termpower bonds and debt of variable interest entities were $1.8$1.1 billion. Based on TVA's interest rate exposure at September 30, 2020,2023, an immediate one percentage point increase in interest rates would have resulted in an increase of $19$15 million in TVA's short-term interest expense. At September 30, 2019,2022, TVA's short-term borrowings were $922 million,$1.2 billion, and the current maturities of long-term debt were $1.1 billion.$68 million. Based on TVA's interest rate exposure at September 30, 2019,2022, an immediate one percentage point increase in interest rates would have resulted in an increase of $20$12 million in TVA's short-term interest expense.
Long-Term Debt. At September 30, 20202023 and 2019,2022, the interest rates on all of TVA's outstanding long-term debt were fixed (or subject only to downward adjustment under certain conditions). Accordingly, an immediate one percentage point increase in interest rates would not have affected TVA's interest expense associated with its long-term debt. When TVA's long-term debt matures or is redeemed, however, TVA typically refinances debt in whole or in part by issuing additional debt. Accordingly, if interest rates are high when TVA issues this additional debt, TVA's cash flows, results of operations, and financial condition may be adversely affected. This risk is somewhat mitigated by the fact that TVA's debt portfolio is diversified in terms of maturities and has a long average life. At September 30, 20202023 and 2019,2022, the average life of TVA's debt portfolio was 15.314.43 years and 16.115.96 years, respectively. At September 30, 20202023 and 2019,2022, the average interest rate of TVA's debt portfolio was 4.564.61 percent and 4.65 percent, respectively. See Note 1314 — Debt and Other Obligations — Debt Outstanding for a schedule of TVA's debt maturities.
Interest Rate Derivatives. Changes in interest rates also affect the mark-to-market ("MtM") valuation of TVA's interest rate derivatives. See Note 15 — Risk Management Activities and Derivative Transactions — Derivatives Not Receiving Hedge Accounting Treatment — Interest Rate Derivatives. TVA had fourtwo interest rate swaps outstanding at both September 30, 20202023 and September 30, 2019.2022. Net unrealized gains and losses on thesethe remaining instruments are reflected on TVA's Consolidated Balance Sheets in a regulatory liability or asset account, and realized gains and losses are reflected in earnings. Based on TVA's interest rate exposure at September 30, 2020 and 2019,2023, an immediate one percentage point decrease in interest rates would have increased the interest rate swap liabilities by $272 million. Based on TVA's interest rate exposure at September 30, 2022, an immediate one-half percentage point decrease in interest rates would have increased the interest rate swap liabilities by $270 million and $253 million, respectively.
London Interbank Offered Rate. TVA has four "fixed for floating" interest rate swaps related to outstanding Bonds, and receives periodic payments under these swaps based on the floating London Interbank Offered Rate ("LIBOR") benchmark rate. TVA may also have additional contracts that could be impacted. LIBOR is expected to be discontinued after 2021. Various alternatives for LIBOR are being evaluated by market participants, with the Secured Overnight Financing Rate being the most widely-adopted alternative thus far. TVA may face risks related to the viability of an alternative benchmark over the remaining terms of its current contracts, or over the terms of any future contracts that rely on the benchmark rate.$122 million.
Currency Exchange Rate Risk
Over the next several years, TVA plans to spend a significant amount of capital on clean air projects, capacity expansion, and other projects. A portion of this amount may be spent on contracts that are denominated in one or more foreign currencies. Additionally, TVA's threetwo issues of Bonds denominated in British pounds sterling are hedged by currency swap agreements. The value of the U.S. dollar compared with other currencies has fluctuated widely in recent years, including fluctuations in the U.S. dollar to British pound sterling exchange rate primarily driven by the "BREXIT" vote for the United Kingdom to leave the European Union. If not effectively managed, foreign currency exposure could negatively impact TVA's counterparty risk, cash flows, results of operations, and financial condition.
ITEM 7A. QUANTITATIVE AND QUALITATIVE DISCLOSURES ABOUT MARKET RISK
Quantitative and qualitative disclosures about market risk are reported in Item 7, Management's Discussion and Analysis of Financial Condition and Results of Operations — Risk Management Activities, which discussion is incorporated by reference into this Item 7A, Quantitative and Qualitative Disclosures About Market Risk.
ITEM 8. FINANCIAL STATEMENTS AND SUPPLEMENTARY DATA
TENNESSEE VALLEY AUTHORITY
CONSOLIDATED STATEMENTS OF OPERATIONSBALANCE SHEETS
For the years endedAt September 30
(in millions)
| | | | | | | | | | | | | | | | | |
| | 2020 | | 2019 | | 2018 |
| Operating revenues | | | | | |
| Revenue from sales of electricity | $ | 10,104 | | | $ | 11,159 | | | $ | 11,075 | |
| Other revenue | 145 | | | 159 | | | 158 | |
| Total operating revenues | 10,249 | | | 11,318 | | | 11,233 | |
| Operating expenses | | | | | |
| Fuel | 1,584 | | | 1,896 | | | 2,049 | |
| Purchased power | 880 | | | 1,007 | | | 973 | |
| Operating and maintenance | 2,720 | | | 3,090 | | | 2,598 | |
| Depreciation and amortization | 1,826 | | | 1,973 | | | 2,527 | |
| Tax equivalents | 528 | | | 541 | | | 518 | |
| Total operating expenses | 7,538 | | | 8,507 | | | 8,665 | |
| Operating income | 2,711 | | | 2,811 | | | 2,568 | |
| Other income (expense), net | 36 | | | 62 | | | 50 | |
| Other net periodic benefit cost | 253 | | | 258 | | | 256 | |
| Interest expense | | | | | |
| Interest expense | 1,142 | | | 1,198 | | | 1,243 | |
| | | | | |
| | | | | |
| Net income (loss) | $ | 1,352 | | | $ | 1,417 | | | $ | 1,119 | |
| The accompanying notes are an integral part of these consolidated financial statements. |
| | | | | | | | | | | | |
| ASSETS |
| | 2023 | | 2022 |
| Current assets | | | |
| Cash and cash equivalents | $ | 501 | | | $ | 500 | |
| | | | |
| Accounts receivable, net | 1,745 | | | 2,007 | |
| Inventories, net | 1,108 | | | 1,072 | |
| Regulatory assets | 178 | | | 138 | |
| Other current assets | 134 | | | 257 | |
| Total current assets | 3,666 | | | 3,974 | |
| | | | |
| Property, plant, and equipment | | | |
| Completed plant | 68,199 | | | 66,442 | |
| Less accumulated depreciation | (35,871) | | | (34,239) | |
| Net completed plant | 32,328 | | | 32,203 | |
| Construction in progress | 3,238 | | | 2,535 | |
| Nuclear fuel | 1,344 | | | 1,492 | |
| Finance leases | 572 | | | 630 | |
| Total property, plant, and equipment, net | 37,482 | | | 36,860 | |
| | | | |
| Investment funds | 4,123 | | | 3,671 | |
| | | | |
| Regulatory and other long-term assets | | | |
| Regulatory assets | 5,566 | | | 6,134 | |
| Operating lease assets, net of amortization | 177 | | | 155 | |
| Other long-term assets | 330 | | | 394 | |
| Total regulatory and other long-term assets | 6,073 | | | 6,683 | |
| | | | |
| Total assets | $ | 51,344 | | | $ | 51,188 | |
| The accompanying notes are an integral part of these consolidated financial statements. |
TENNESSEE VALLEY AUTHORITY
CONSOLIDATED BALANCE SHEETS
At September 30
(in millions)
| | | | | | | | | | | |
| ASSETS |
| | 2020 | | 2019 |
| Current assets | | | |
| Cash and cash equivalents | $ | 500 | | | $ | 299 | |
| | | |
| Accounts receivable, net | 1,529 | | | 1,739 | |
| Inventories, net | 1,003 | | | 999 | |
| Regulatory assets | 130 | | | 156 | |
| Other current assets | 84 | | | 85 | |
| Total current assets | 3,246 | | | 3,278 | |
| | | |
| Property, plant, and equipment | | | |
| Completed plant | 64,970 | | | 62,944 | |
| Less accumulated depreciation | (33,550) | | | (31,384) | |
| Net completed plant | 31,420 | | | 31,560 | |
| Construction in progress | 2,139 | | | 1,893 | |
| Nuclear fuel | 1,504 | | | 1,534 | |
| Finance leases | 516 | | | 146 | |
| Total property, plant, and equipment, net | 35,579 | | | 35,133 | |
| | | |
| Investment funds | 3,198 | | | 2,968 | |
| | | |
| Regulatory and other long-term assets | | | |
| Regulatory assets | 10,245 | | | 8,763 | |
| Operating lease assets, net of amortization | 232 | | | 0 | |
| Other long-term assets | 325 | | | 325 | |
| Total regulatory and other long-term assets | 10,802 | | | 9,088 | |
| | | |
| Total assets | $ | 52,825 | | | $ | 50,467 | |
| The accompanying notes are an integral part of these consolidated financial statements. |
| | | | | | | | | | | |
| LIABILITIES AND PROPRIETARY CAPITAL |
| 2023 | | 2022 |
| Current liabilities | | | |
| Accounts payable and accrued liabilities | $ | 2,618 | | | $ | 2,466 | |
| | | |
| Accrued interest | 272 | | | 273 | |
| Asset retirement obligations | 272 | | | 275 | |
| | | |
| | | |
| Regulatory liabilities | 222 | | | 391 | |
| Short-term debt, net | 432 | | | 1,172 | |
| Current maturities of power bonds | 1,022 | | | 29 | |
| Current maturities of long-term debt of variable interest entities | 35 | | | 39 | |
| | | |
| Total current liabilities | 4,873 | | | 4,645 | |
| | | |
| Other liabilities | | | |
| Post-retirement and post-employment benefit obligations | 2,527 | | | 3,072 | |
| Asset retirement obligations | 7,217 | | | 6,887 | |
| Finance lease liabilities | 576 | | | 628 | |
| Other long-term liabilities | 1,211 | | | 1,485 | |
| | | |
| Regulatory liabilities | 107 | | | 172 | |
| Total other liabilities | 11,638 | | | 12,244 | |
| | | |
| Long-term debt, net | | | |
| Long-term power bonds, net | 17,844 | | | 17,826 | |
| Long-term debt of variable interest entities, net | 933 | | | 968 | |
| | | |
| Total long-term debt, net | 18,777 | | | 18,794 | |
| | | |
| Total liabilities | 35,288 | | | 35,683 | |
| | | |
| Commitments and contingencies (Note 22) | | | |
| | | |
| Proprietary capital | | | |
| Power program appropriation investment | 258 | | | 258 | |
| Power program retained earnings | 15,302 | | | 14,800 | |
| Total power program proprietary capital | 15,560 | | | 15,058 | |
| Nonpower programs appropriation investment, net | 525 | | | 533 | |
| Accumulated other comprehensive loss | (29) | | | (86) | |
| Total proprietary capital | 16,056 | | | 15,505 | |
| | | |
| Total liabilities and proprietary capital | $ | 51,344 | | | $ | 51,188 | |
| The accompanying notes are an integral part of these consolidated financial statements. |
TENNESSEE VALLEY AUTHORITY
CONSOLIDATED BALANCE SHEETSSTATEMENTS OF OPERATIONS
AtFor the years ended September 30
(in millions)
| | | | | | | | | | | |
| LIABILITIES AND PROPRIETARY CAPITAL |
| 2020 | | 2019 |
| Current liabilities | | | |
| Accounts payable and accrued liabilities | $ | 1,844 | | | $ | 1,649 | |
| | | |
| Accrued interest | 298 | | | 296 | |
| Asset retirement obligations | 345 | | | 163 | |
| Current portion of leaseback obligations | 198 | | | 40 | |
| | | |
| Regulatory liabilities | 141 | | | 150 | |
| Short-term debt, net | 57 | | | 922 | |
| Current maturities of power bonds | 1,787 | | | 1,030 | |
| Current maturities of long-term debt of variable interest entities | 41 | | | 39 | |
| Current maturities of notes payable | 0 | | | 23 | |
| Total current liabilities | 4,711 | | | 4,312 | |
| | | |
| Other liabilities | | | |
| Post-retirement and post-employment benefit obligations | 6,617 | | | 6,181 | |
| Asset retirement obligations | 6,440 | | | 5,453 | |
| Finance lease liabilities | 525 | | | 182 | |
| Other long-term liabilities | 2,548 | | | 2,308 | |
| Leaseback obligations | 25 | | | 223 | |
| | | |
| | | |
| Regulatory liabilities | 23 | | | 0 | |
| Total other liabilities | 16,178 | | | 14,347 | |
| | | |
| Long-term debt, net | | | |
| Long-term power bonds, net | 17,956 | | | 19,094 | |
| Long-term debt of variable interest entities, net | 1,048 | | | 1,089 | |
| | | |
| Total long-term debt, net | 19,004 | | | 20,183 | |
| | | |
| Total liabilities | 39,893 | | | 38,842 | |
| | | |
| Commitments and contingencies (Note 22) | | | |
| | | |
| Proprietary capital | | | |
| Power program appropriation investment | 258 | | | 258 | |
| Power program retained earnings | 12,177 | | | 10,823 | |
| Total power program proprietary capital | 12,435 | | | 11,081 | |
| Nonpower programs appropriation investment, net | 548 | | | 556 | |
| Accumulated other comprehensive income (loss) | (51) | | | (12) | |
| Total proprietary capital | 12,932 | | | 11,625 | |
| | | |
| Total liabilities and proprietary capital | $ | 52,825 | | | $ | 50,467 | |
| The accompanying notes are an integral part of these consolidated financial statements. |
| | | | | | | | | | | | | | | | | |
| | 2023 | | 2022 | | 2021 |
| Operating revenues | | | | | |
| Revenue from sales of electricity | $ | 11,899 | | | $ | 12,371 | | | $ | 10,357 | |
| Other revenue | 155 | | | 169 | | | 146 | |
| Total operating revenues | 12,054 | | | 12,540 | | | 10,503 | |
| Operating expenses | | | | | |
| Fuel | 2,549 | | | 2,567 | | | 1,737 | |
| Purchased power | 1,633 | | | 1,921 | | | 984 | |
| Operating and maintenance | 3,372 | | | 2,986 | | | 2,890 | |
| Depreciation and amortization | 2,213 | | | 2,054 | | | 1,533 | |
| Tax equivalents | 593 | | | 601 | | | 514 | |
| Total operating expenses | 10,360 | | | 10,129 | | | 7,658 | |
| Operating income | 1,694 | | | 2,411 | | | 2,845 | |
| Other income, net | 61 | | | 7 | | | 13 | |
| Other net periodic benefit cost | 199 | | | 258 | | | 258 | |
| Interest expense | | | | | |
| Interest expense | 1,056 | | | 1,052 | | | 1,088 | |
| | | | | |
| | | | | |
| Net income | $ | 500 | | | $ | 1,108 | | | $ | 1,512 | |
| The accompanying notes are an integral part of these consolidated financial statements. |
TENNESSEE VALLEY AUTHORITY
CONSOLIDATED STATEMENTS OF COMPREHENSIVE INCOME (LOSS)
For the years ended September 30
(in millions)
| | | | 2020 | | 2019 | | 2018 | | 2023 | | 2022 | | 2021 |
| Net income (loss) | $ | 1,352 | | | $ | 1,417 | | | $ | 1,119 | | |
| Net income | | Net income | $ | 500 | | | $ | 1,108 | | | $ | 1,512 | |
| Other comprehensive income (loss) | Other comprehensive income (loss) | | Other comprehensive income (loss) | |
| Net unrealized gain (loss) on cash flow hedges | Net unrealized gain (loss) on cash flow hedges | (1) | | | (114) | | | 10 | | Net unrealized gain (loss) on cash flow hedges | 99 | | | (157) | | | 126 | |
| Net unrealized (gain) loss reclassified to earnings from cash flow hedges | Net unrealized (gain) loss reclassified to earnings from cash flow hedges | (38) | | | 45 | | | 26 | | Net unrealized (gain) loss reclassified to earnings from cash flow hedges | (42) | | | 93 | | | (97) | |
| Total other comprehensive income (loss) | Total other comprehensive income (loss) | $ | (39) | | | $ | (69) | | | $ | 36 | | Total other comprehensive income (loss) | 57 | | | (64) | | | 29 | |
| Total comprehensive income (loss) | $ | 1,313 | | | $ | 1,348 | | | $ | 1,155 | | |
| Total comprehensive income | | Total comprehensive income | $ | 557 | | | $ | 1,044 | | | $ | 1,541 | |
| The accompanying notes are an integral part of these consolidated financial statements. | The accompanying notes are an integral part of these consolidated financial statements. | The accompanying notes are an integral part of these consolidated financial statements. |
TENNESSEE VALLEY AUTHORITY
CONSOLIDATED STATEMENTS OF CASH FLOWS
For the years ended September 30
(in millions)
| | | | 2020 | | 2019 | | 2018 | | 2023 | | 2022 | | 2021 |
| Cash flows from operating activities | Cash flows from operating activities | | | | | | Cash flows from operating activities | | | | | |
| Net income (loss) | $ | 1,352 | | | $ | 1,417 | | | $ | 1,119 | | |
| Adjustments to reconcile net income (loss) to net cash provided by operating activities | | | | | | |
| Net income | | Net income | $ | 500 | | | $ | 1,108 | | | $ | 1,512 | |
| Adjustments to reconcile net income to net cash provided by operating activities | | Adjustments to reconcile net income to net cash provided by operating activities | | | | | |
Depreciation and amortization(1) | Depreciation and amortization(1) | 1,848 | | | 1,993 | | | 2,554 | | Depreciation and amortization(1) | 2,235 | | | 2,076 | | | 1,555 | |
| | Amortization of nuclear fuel cost | Amortization of nuclear fuel cost | 388 | | | 379 | | | 382 | | Amortization of nuclear fuel cost | 371 | | | 347 | | | 383 | |
| Non-cash retirement benefit expense | Non-cash retirement benefit expense | 324 | | | 314 | | | 324 | | Non-cash retirement benefit expense | 241 | | | 328 | | | 333 | |
| Prepayment credits applied to revenue | 0 | | | (10) | | | (100) | | |
| | Other regulatory amortization and deferrals | Other regulatory amortization and deferrals | (23) | | | 261 | | | 2 | | Other regulatory amortization and deferrals | 31 | | | 70 | | | (72) | |
| Changes in current assets and liabilities | Changes in current assets and liabilities | | | | | Changes in current assets and liabilities | | | | |
| Accounts receivable, net | Accounts receivable, net | 259 | | | (40) | | | (68) | | Accounts receivable, net | 301 | | | (412) | | | (18) | |
| Inventories and other current assets, net | Inventories and other current assets, net | (12) | | | (87) | | | 65 | | Inventories and other current assets, net | (83) | | | (163) | | | 42 | |
| Accounts payable and accrued liabilities | Accounts payable and accrued liabilities | (38) | | | (155) | | | 143 | | Accounts payable and accrued liabilities | (1) | | | 282 | | | 178 | |
| Accrued interest | Accrued interest | 1 | | | (8) | | | (36) | | Accrued interest | (1) | | | (7) | | | (18) | |
| | Pension contributions | Pension contributions | (305) | | | (307) | | | (304) | | Pension contributions | (306) | | | (308) | | | (306) | |
| | Settlements of asset retirement obligations | Settlements of asset retirement obligations | (114) | | | (89) | | | (106) | | Settlements of asset retirement obligations | (327) | | | (291) | | | (242) | |
| Other, net | Other, net | (44) | | | 52 | | | (37) | | Other, net | (89) | | | (82) | | | (91) | |
| Net cash provided by operating activities | Net cash provided by operating activities | 3,636 | | | 3,720 | | | 3,938 | | Net cash provided by operating activities | 2,872 | | | 2,948 | | | 3,256 | |
| | Cash flows from investing activities | Cash flows from investing activities | | | | | | Cash flows from investing activities | | | | | |
| Construction expenditures | Construction expenditures | (1,643) | | | (1,700) | | | (1,759) | | Construction expenditures | (2,526) | | | (2,361) | | | (1,963) | |
| | Nuclear fuel expenditures | Nuclear fuel expenditures | (342) | | | (474) | | | (457) | | Nuclear fuel expenditures | (273) | | | (283) | | | (354) | |
| | Acquisition of leasehold interests in combustion turbine assets | | Acquisition of leasehold interests in combustion turbine assets | (155) | | | — | | | — | |
| Purchases of investments | Purchases of investments | (49) | | | (48) | | | (49) | | Purchases of investments | (51) | | | (51) | | | (50) | |
| Loans and other receivables | Loans and other receivables | | | | | Loans and other receivables | | | | |
| Advances | Advances | (8) | | | (10) | | | (12) | | Advances | (7) | | | (9) | | | (7) | |
| Repayments | Repayments | 7 | | | 11 | | | 4 | | Repayments | 8 | | | 15 | | | 9 | |
| Other, net | Other, net | 20 | | | (22) | | | 4 | | Other, net | 10 | | | 26 | | | 27 | |
| Net cash used in investing activities | Net cash used in investing activities | (2,015) | | | (2,243) | | | (2,269) | | Net cash used in investing activities | (2,994) | | | (2,663) | | | (2,338) | |
| | Cash flows from financing activities | Cash flows from financing activities | | | | | | Cash flows from financing activities | | | | | |
| Long-term debt | Long-term debt | | | | | | Long-term debt | | | | | |
| Issues of power bonds | Issues of power bonds | 997 | | | 0 | | | 998 | | Issues of power bonds | 992 | | | 484 | | | 500 | |
| | Redemptions and repurchases of power bonds | Redemptions and repurchases of power bonds | (1,427) | | | (1,035) | | | (1,731) | | Redemptions and repurchases of power bonds | (29) | | | (1,028) | | | (1,860) | |
| Payments on debt of variable interest entities | Payments on debt of variable interest entities | (39) | | | (38) | | | (36) | | Payments on debt of variable interest entities | (39) | | | (43) | | | (41) | |
| Redemptions of notes payable | (23) | | | (46) | | | (53) | | |
| | Short-term debt issues (redemptions), net | Short-term debt issues (redemptions), net | (865) | | | (294) | | | (782) | | Short-term debt issues (redemptions), net | (740) | | | 392 | | | 723 | |
| | Payments on leases and leasebacks | Payments on leases and leasebacks | (55) | | | (43) | | | (42) | | Payments on leases and leasebacks | (56) | | | (85) | | | (250) | |
| | Financing costs, net | Financing costs, net | (4) | | | 0 | | | (3) | | Financing costs, net | (4) | | | (3) | | | (2) | |
| | Other, net | Other, net | (6) | | | (21) | | | (9) | | Other, net | (1) | | | — | | | 9 | |
| Net cash (used in) provided by financing activities | (1,422) | | | (1,477) | | | (1,658) | | |
| Net cash provided by (used in) financing activities | | Net cash provided by (used in) financing activities | 123 | | | (283) | | | (921) | |
| Net change in cash, cash equivalents, and restricted cash | Net change in cash, cash equivalents, and restricted cash | 199 | | | 0 | | | 11 | | Net change in cash, cash equivalents, and restricted cash | 1 | | | 2 | | | (3) | |
| Cash, cash equivalents, and restricted cash at beginning of year | Cash, cash equivalents, and restricted cash at beginning of year | 322 | | | 322 | | | 311 | | Cash, cash equivalents, and restricted cash at beginning of year | 520 | | | 518 | | | 521 | |
| Cash, cash equivalents, and restricted cash at end of year | Cash, cash equivalents, and restricted cash at end of year | $ | 521 | | | $ | 322 | | | $ | 322 | | Cash, cash equivalents, and restricted cash at end of year | $ | 521 | | | $ | 520 | | | $ | 518 | |
Note (1) Including amortization of debt issuance costs and premiums/discounts. | Note (1) Including amortization of debt issuance costs and premiums/discounts. | Note (1) Including amortization of debt issuance costs and premiums/discounts. |
| The accompanying notes are an integral part of these consolidated financial statements. | The accompanying notes are an integral part of these consolidated financial statements. | The accompanying notes are an integral part of these consolidated financial statements. |
TENNESSEE VALLEY AUTHORITY
CONSOLIDATED STATEMENTS OF CHANGES IN PROPRIETARY CAPITAL
For the years ended September 30
(in millions)
| | | | Power Program Appropriation Investment | |
Power Program Retained Earnings | | Nonpower Programs Appropriation Investment, Net | | Accumulated Other Comprehensive Income (Loss) | |
Total | | Power Program Appropriation Investment | |
Power Program Retained Earnings | | Nonpower Programs Appropriation Investment, Net | | Accumulated Other Comprehensive Loss | |
Total |
| Balance at September 30, 2017 | $ | 258 | | | $ | 8,282 | | | $ | 572 | | | $ | 21 | | | $ | 9,133 | | |
| Balance at September 30, 2020 | | Balance at September 30, 2020 | $ | 258 | | | $ | 12,177 | | | $ | 548 | | | $ | (51) | | | $ | 12,932 | |
| Net income (loss) | | Net income (loss) | — | | | 1,520 | | | (8) | | | — | | | 1,512 | |
| Total other comprehensive income (loss) | | Total other comprehensive income (loss) | — | | | — | | | — | | | 29 | | | 29 | |
| Return on power program appropriation investment | | Return on power program appropriation investment | — | | | (4) | | | — | | | — | | | (4) | |
| Implementation of Financial Instruments - Credit Losses Standard | | Implementation of Financial Instruments - Credit Losses Standard | — | | | (4) | | | — | | | — | | | (4) | |
| Balance at September 30, 2021 | | Balance at September 30, 2021 | $ | 258 | | | $ | 13,689 | | | $ | 540 | | | $ | (22) | | | $ | 14,465 | |
| Net income (loss) | | Net income (loss) | — | | | 1,115 | | | (7) | | | — | | | 1,108 | |
| Total other comprehensive income (loss) | | Total other comprehensive income (loss) | — | | | — | | | — | | | (64) | | | (64) | |
| Return on power program appropriation investment | | Return on power program appropriation investment | — | | | (4) | | | — | | | — | | | (4) | |
| Balance at September 30, 2022 | | Balance at September 30, 2022 | $ | 258 | | | $ | 14,800 | | | $ | 533 | | | $ | (86) | | | $ | 15,505 | |
| Net income (loss) | Net income (loss) | 0 | | | 1,127 | | | (8) | | | 0 | | | 1,119 | | Net income (loss) | — | | | 508 | | | (8) | | | — | | | 500 | |
| Total other comprehensive income (loss) | Total other comprehensive income (loss) | 0 | | | 0 | | | 0 | | | 36 | | | 36 | | Total other comprehensive income (loss) | — | | | — | | | — | | | 57 | | | 57 | |
| Return on power program appropriation investment | Return on power program appropriation investment | 0 | | | (5) | | | 0 | | | 0 | | | (5) | | Return on power program appropriation investment | — | | | (6) | | | — | | | — | | | (6) | |
| | Balance at September 30, 2018 | $ | 258 | | | $ | 9,404 | | | $ | 564 | | | $ | 57 | | | $ | 10,283 | | |
| Net income (loss) | 0 | | | 1,425 | | | (8) | | | 0 | | | 1,417 | | |
| Total other comprehensive income (loss) | 0 | | | 0 | | | 0 | | | (69) | | | (69) | | |
| Return on power program appropriation investment | 0 | | | (6) | | | 0 | | | 0 | | | (6) | | |
| Balance at September 30, 2019 | $ | 258 | | | $ | 10,823 | | | $ | 556 | | | $ | (12) | | | $ | 11,625 | | |
| Net income (loss) | 0 | | | 1,360 | | | (8) | | | 0 | | | 1,352 | | |
| Total other comprehensive income (loss) | 0 | | | 0 | | | 0 | | | (39) | | | (39) | | |
| Return on power program appropriation investment | 0 | | | (6) | | | 0 | | | 0 | | | (6) | | |
| Balance at September 30, 2020 | $ | 258 | | | $ | 12,177 | | | $ | 548 | | | $ | (51) | | | $ | 12,932 | | |
| Balance at September 30, 2023 | | Balance at September 30, 2023 | $ | 258 | | | $ | 15,302 | | | $ | 525 | | | $ | (29) | | | $ | 16,056 | |
| The accompanying notes are an integral part of these consolidated financial statements. | The accompanying notes are an integral part of these consolidated financial statements. | The accompanying notes are an integral part of these consolidated financial statements. |
NOTES TO CONSOLIDATED FINANCIAL STATEMENTS
(Dollars in millions except where noted)
| | Note | Note | Page No. | Note | Page No. |
| 1 | 1 | | Summary of Significant Accounting Policies | | 1 | | Summary of Significant Accounting Policies | |
| 2 | 2 | | Impact of New Accounting Standards and Interpretations | | 2 | | Impact of New Accounting Standards and Interpretations | |
| 3 | 3 | | Accounts Receivable, Net | | 3 | | Accounts Receivable, Net | |
| 4 | 4 | | Inventories, Net | | 4 | | Inventories, Net | |
| 5 | 5 | | Net Completed Plant | | 5 | | Other Current Assets | |
| 6 | 6 | | Plant Closures | | 6 | | Net Completed Plant | |
| 7 | 7 | | Leases | | 7 | | Plant Closures | |
| 8 | 8 | | Other Long-Term Assets | | 8 | | Leases | |
| 9 | 9 | | Regulatory Assets and Liabilities | | 9 | | Other Long-Term Assets | |
| 10 | 10 | | Variable Interest Entities | | 10 | | Regulatory Assets and Liabilities | |
| 11 | 11 | | Other Long-Term Liabilities | | 11 | | Variable Interest Entities | |
| 12 | 12 | | Asset Retirement Obligations | | 12 | | Other Long-Term Liabilities | |
| 13 | 13 | | Debt and Other Obligations | | 13 | | Asset Retirement Obligations | |
| 14 | 14 | | Accumulated Other Comprehensive Income (Loss) | | 14 | | Debt and Other Obligations | |
| 15 | 15 | | Risk Management Activities and Derivative Transactions | | 15 | | Risk Management Activities and Derivative Transactions | |
| 16 | 16 | | Fair Value Measurements | | 16 | | Fair Value Measurements | |
| 17 | 17 | | Revenue | | 17 | | Revenue | |
| 18 | 18 | | Proprietary Capital | | 18 | | Other Income, Net | |
| 19 | 19 | | Other Income (Expense), Net | | 19 | | Supplemental Cash Flow Information | |
| 20 | 20 | | Supplemental Cash Flow Information | | 20 | | Benefit Plans | |
| 21 | 21 | | Benefit Plans | | 21 | | Collaborative Arrangement | |
| 22 | 22 | | Commitments and Contingencies | | 22 | | Commitments and Contingencies | |
| 23 | 23 | | Related Parties | | 23 | | Related Parties | |
| 24 | | Unaudited Quarterly Financial Information | | |
| |
1. Summary of Significant Accounting Policies
General
The Tennessee Valley Authority ("TVA") is a corporate agency and instrumentality of the United States ("U.S.") that was created in 1933 by federal legislation in response to a proposal by President Franklin D. Roosevelt. TVA was created to, among other things, improve navigation on the Tennessee River, reduce the damage from destructive flood waters within the Tennessee River system and downstream on the lower Ohio and Mississippi Rivers, further the economic development of TVA's service area in the southeastern U.S., and sell the electricity generated at the facilities TVA operates.
Today, TVA operates the nation's largest public power system and supplies power in most of Tennessee, northern Alabama, northeastern Mississippi, and southwestern Kentucky and in portions of northern Georgia, western North Carolina, and southwestern Virginia to a population of approximately 10 million people.
TVA also manages the Tennessee River, its tributaries, and certain shorelines to provide, among other things, year-round navigation, flood damage reduction, and affordable and reliable electricity. Consistent with these primary purposes, TVA also manages the river system and public lands to provide recreational opportunities, adequate water supply, improved water quality, cultural and natural resource protection, and economic development. TVA performs these management duties in cooperation with other federal and state agencies that have jurisdiction and authority over certain aspects of the river system. In addition, the TVA Board of Directors ("TVA Board") has established two councils — the Regional Resource Stewardship Council and the Regional Energy Resource Council — to advise TVA on its stewardship activities in the Tennessee Valley and its energy resource activities.
The power program has historically been separate and distinct from the stewardship programs. It is required to be self-supporting from power revenues and proceeds from power financings, such as proceeds from the issuance of bonds, notes, or other evidences of indebtedness (collectively, "Bonds"). Although TVA does not currently receive congressionalCongressional appropriations, it is required to make annual payments to the United States Department of the Treasury ("U.S. Treasury") as a return on the government's appropriation investment in TVA's power facilities (the "Power Program Appropriation Investment"). In the 1998 Energy and Water Development Appropriations Act, Congress directed TVA to fund essential stewardship activities related to its management of the Tennessee River system and nonpower or stewardship properties with power revenues in the event that there were insufficient appropriations or other available funds to pay for such activities in any fiscal year. Congress has not
provided any appropriations to TVA to fund such activities since 1999. Consequently, during 2000, TVA began paying for essential stewardship activities primarily with power revenues, with the remainder funded with user fees and other forms of revenues derived in connection with those activities. The activities related to stewardship properties do not meet the criteria of an operating segment under accounting principles generally accepted in the United States of America ("GAAP"). Accordingly, these assets and properties are included as part of the power program, TVA's only operating segment.
Power rates are established by the TVA Board of Directors (the "TVA Board") as authorized by the Tennessee Valley Authority Act of 1933, as amended (the "TVA("TVA Act"). The TVA Act requires TVA to charge rates for power that will produce gross revenues sufficient to provide funds for operation, maintenance, and administration of its power system; payments to states and counties in lieu of taxes ("tax equivalents"); debt service on outstanding indebtedness; payments to the U.S. Treasury in repayment of and as a return on the Power Program Appropriation Investment; and such additional margin as the TVA Board may consider desirable for investment in power system assets, retirement of outstanding Bonds in advance of maturity, additional reduction of the Power Program Appropriation Investment, and other purposes connected with TVA's power business. TVA fulfilled its requirement to repay $1.0 billion of the Power Program Appropriation Investment with the 2014 payment; therefore, this itemrepayment obligation is no longer a component of rate setting. In setting TVA's rates, the TVA Board is charged by the TVA Act to have due regard for the primary objectives of the TVA Act, including the objective that power shall be sold at rates as low as are feasible. Rates set by the TVA Board are not subject to review or approval by any state or other federal regulatory body.
Fiscal Year
TVA's fiscal year ends September 30. Years (2020, 2019,(2023, 2022, etc.) refer to TVA's fiscal years unless they are preceded by "CY," in which case the references are to calendar years.
Cost-Based Regulation
Since the TVA Board is authorized by the TVA Act to set rates for power sold to its customers, TVA is self-regulated. Additionally, TVA's regulated rates are designed to recover its costs. Based on current projections, TVA believes that rates, set at levels that will recover TVA's costs, can be charged and collected. As a result of these factors, TVA records certain assets and liabilities that result from the regulated ratemaking process that would not be recorded under GAAP for non-regulated entities. Regulatory assets generally represent incurred costs that have been deferred because such costs are probable of future recovery in customer rates. Regulatory liabilities generally represent obligations to make refunds to customers for previous collections for costs that are not likely to be incurred or deferral of gains that will be credited to customers in future periods. TVA assesses whether the regulatory assets are probable of future recovery by considering factors such as applicable regulatory changes, potential legislation, and changes in technology. Based on these assessments, TVA believes the existing regulatory assets are probable of recovery. This determination reflects the current regulatory and political environment and is subject to change in the future. If future recovery of regulatory assets ceases to be probable, or any of the other factors described above cease to be applicable, TVA wouldis no longer be considered to be a regulated entity, andthen costs would be required to write off these costs.be written off. All regulatory asset write offs would be required to be recognized in earnings in the period in which future recovery ceases to be probable.
Basis of Presentation
The accompanying consolidated financial statements, which have been prepared in accordance with GAAP, include the accounts of TVA wholly-owned direct subsidiaries, and variable interest entities ("VIE"VIEs") of which TVA is the primary beneficiary. See Note 1011 — Variable Interest Entities. Intercompany balances and transactions have been eliminated in consolidation.
Use of Estimates
The preparation of financial statements requires TVA to estimate the effects of various matters that are inherently uncertain as of the date of the consolidated financial statements. Although the consolidated financial statements are prepared in conformity with GAAP, TVA is required to make estimates and assumptions that affect the reported amounts of assets and liabilities, the disclosure of contingent assets and liabilities, and the amounts of revenues and expenses, including impacts from the COVID-19 pandemic, reported during the reporting period. Each of these estimates varies in regard to the level of judgment involved and its potential impact on TVA's financial results. Estimates are considered critical either when a different estimate could have reasonably been used, or where changes in the estimate are reasonably likely to occur from period to period, and such use or change would materially impact TVA's financial condition, results of operations, or cash flows.
Reclassifications
Certain historical amounts have been reclassified in the accompanying consolidated financial statements to the current presentation. In the Consolidated Balance Sheet at September 30, 2019, TVA reclassified $163 million from Accounts payable and accrued liabilities to Asset retirement obligations in Current liabilities. In addition, as a result of the adoption of the new lease accounting standard effective for TVA October 1, 2019, TVA reclassified $182 million from Other long-term liabilities to Finance lease liabilities in the Consolidated Balance Sheet at September 30, 2019.
Cash, Cash Equivalents, and Restricted Cash
Cash includes cash on hand, non-interest bearing cash, and deposit accounts. All highly liquid investments with original maturities of three months or less are considered cash equivalents. Cash and cash equivalents that are restricted, as to withdrawal or use under the terms of certain contractual agreements, are recorded in Other long-term assets on the Consolidated Balance Sheets. Restricted cash and cash equivalents includesinclude cash held in trusts that are currently restricted for TVA economic development loans and for certain TVA environmental programs in accordance with agreements related to compliance with certain environmental regulations. See Note 22 — Commitments and Contingencies — Legal Proceedings — Environmental Agreements.
The following table provides a reconciliation of cash, cash equivalents, and restricted cash reported inon the Consolidated Balance Sheets and Consolidated Statements of Cash Flows:
| | | | | | | | | | | |
Cash, Cash Equivalents, and Restricted Cash
At September 30 |
| | 2020 | | 2019 |
| Cash and cash equivalents | $ | 500 | | | $ | 299 | |
| | | |
| Restricted cash and cash equivalents, included in Other long-term assets | 21 | | | 23 | |
| Total Cash, cash equivalents, and restricted cash | $ | 521 | | | $ | 322 | |
Due to higher volatility in the financial markets associated with the COVID-19 pandemic, TVA increased its target balance of Cash and cash equivalents beginning in March 2020. TVA continued to hold higher target cash balances at September 30, 2020, and may hold higher balances in future periods due to potential market volatility. | | | | | | | | | | | |
Cash, Cash Equivalents, and Restricted Cash At September 30 (in millions) |
| | 2023 | | 2022 |
| Cash and cash equivalents | $ | 501 | | | $ | 500 | |
| Restricted cash and cash equivalents included in Other long-term assets | 20 | | | 20 | |
| Total cash, cash equivalents, and restricted cash | $ | 521 | | | $ | 520 | |
Allowance for Uncollectible Accounts
TVA recognizes an allowance that reflects the current estimate for credit losses expected to be incurred over the life of the financial assets based on historical experience, current conditions, and reasonable and supportable forecasts that affect the collectability of the reported amounts. The appropriateness of the allowance is evaluated at the end of each reporting period.
The
To determine the allowance for uncollectible accounts reflects TVA's estimate of probable losses inherent in its accounts and loans receivable balances excluding the EnergyRight® loans receivable.trade receivables, TVA determines the allowance based on known accounts,considers historical experience and other currently available information, including events such as customer bankruptcy and/or a customer failing to fulfill payment arrangements after 90 days. It also reflectsby the due date. TVA's corporate credit department'sdepartment also performs an assessment of the financial condition of customers and the credit quality of the receivables. In addition, TVA continuesreviews other reasonable and supportable forecasts to monitor the impact of the COVID-19 pandemic on accounts and loans receivable balances to evaluatedetermine if the allowance for uncollectible accounts.amounts should be further adjusted in accordance with the accounting guidance for Current Expected Credit Losses.
To determine the allowance for loans receivables, TVA aggregates loans into the appropriate pools based on the existence of similar risk characteristics such as collateral types and internal assessed credit risks. In situations where a loan exhibits unique risk characteristics and is no longer expected to experience similar risks to the rest of its pool, the loan will be evaluated separately. TVA derives an annual loss rate based on historical loss and then adjusts the rate to reflect TVA's consideration of available information on current conditions and reasonable and supportable future forecasts. This information may include economic and business conditions, default trends, and other internal and external factors. For periods beyond the reasonable and supportable forecast period, TVA uses the current calculated long-term average historical loss rate for the remaining life of the loan portfolio.
The allowance for uncollectible accounts was less than $1 million at both September 30, 20202023 and 2019,2022, for trade accounts receivable. Additionally, loans receivable of $105$104 million and $131$105 million at September 30, 20202023 and 2019,2022, respectively, are included in Accounts receivable, net and Other long-term assets, for the current and long-term portions, respectively, andrespectively. Loans receivables are reported net of allowances for uncollectible accounts of less than $1$3 million at both September 30, 20202023 and 2019, respectively.2022.
Revenues
TVA recognizes revenue from contracts with customers to depict the transfer of goods or services to customers in an amount to which the entity expects to be entitled in exchange for those goods or services. For the generation and transmission of electricity, this is generally at the time the power is delivered to a metered customer delivery point for the customer's consumption or distribution. As a result, revenues from power sales are recorded as electricity is delivered to customers. In addition to power sales invoiced and recorded during the month, TVA accrues estimated unbilled revenues for power sales provided to five customers whose billing date occurs prior to the end of the month. Exchange power sales are presented in the accompanying Consolidated Statements of Operations as a component of sales of electricity. Exchange power sales are sales of excess power after meeting TVA native load and directly served requirements. Native load refers to the customers on whose behalf a company, by statute, franchise, regulatory requirement, or contract, has undertaken an obligation to serve. TVA engages in other arrangements in addition to power sales. Certain other revenue from activities related to TVA's overall mission areis recorded in Other revenue. Revenues that are not related to the overall mission are recorded in Other income, (expense), net.
Inventories
CertainFuel, Materials, and Supplies. Materials and supplies inventories are valued using an average unit cost method. A new average cost is computed after each inventory purchase transaction, and inventory issuances are priced at the latest moving weighted average unit cost. Coal, fuel oil, and natural gas inventories are valued using an average cost method. A new weighted average cost is computed monthly, and monthly issues are priced accordingly.
Renewable Energy Certificates. TVA accounts for Renewable Energy Certificates ("RECs") using the specific identification cost method. RECs that are acquired through power purchases are recorded as inventory and charged to purchased power expense when the RECs are subsequently used or sold. TVA assigns a value to the RECs at the inception of
the power purchase arrangement using a relative standalone selling price approach. RECs created through TVA-owned asset generation are recorded at zero cost.
Emission Allowances. TVA accounts for emission allowances using the specific identification cost method. Allowances that are acquired through third party purchases are recorded as inventory at cost and charged to operating expense based on tons emitted during the respective compliance periods.
Allowance for Inventory Obsolescence. TVA reviews materials and supplies inventories by category and usage on a periodic basis. Each category is assigned a probability of becoming obsolete based on the type of material and historical usage data. TVA has a fleet-wide inventory management policy for each generation type. Based on the estimated value of the inventory, TVA adjusts its allowance for inventory obsolescence.
Pre-Commercial Plant Operations
As part of the process of completing the construction of a generating unit, the electricity produced is used to serve the
demands of the electric system. TVA estimates revenue from suchrevenues earned during pre-commercial generationoperations at the fair value of the energy delivered based on the guidance provided by Federal Energy Regulatory Commission ("FERC") regulations. The Allen Combined Cycle Plant ("Allen CC") began pre-commercialTVA's hourly incremental dispatch cost. Pre-commercial plant operations began on Colbert Combustion Turbine Units 9-10 in September 2017,June 2023 and began commercial operations in April 2018. Cogeneration capability at Johnsonvilleon Colbert Combustion Turbine Unit 20 commenced pre-commercial plant operations11 in September 2017, and was placed in service during December 2017.early July 2023. All three units became operational on July 25, 2023. Estimated revenue of $11$3 million related to Allen CCthis project was capitalized to offset project costs for the year ended September 30, 2018.2023. TVA also capitalized related fuel costs for these construction projectsthis project of approximately $19$3 million duringfor the year ended September 30, 2018. No such amounts were capitalized during 2019 or 2020.
Inventories
CertainFuel, Materials, and Supplies. Materials and supplies inventories are valued using an average unit cost method. A new average cost is computed after each inventory purchase transaction, and inventory issuances are priced at the latest moving weighted average unit cost. Coal, fuel oil, and natural gas inventories are valued using an average cost method. A new weighted average cost is computed monthly, and monthly issues are priced accordingly.
Renewable Energy Credits. TVA accounts for Renewable Energy Certificates ("RECs") using the specific identification cost method. RECs that are acquired through power purchases are recorded as inventory and charged to purchased power expense when the RECs are subsequently used or sold. TVA assigns a value to the RECs at the inception of the power purchase arrangement using a relative fair value approach. RECs created through TVA-owned asset generation are recorded at zero cost.
Emission Allowances. TVA has emission allowances for sulfur dioxide ("SO2")and nitrogen oxide ("NOx") which are accounted for as inventory. The cost of specific allowances used each month is charged to operating expense based on tons of SO2 and NOx emitted during the respective compliance periods. Allowances granted to TVA by the Environmental Protection Agency ("EPA") are recorded at 0 cost.
Allowance for Inventory Obsolescence. TVA reviews materials and supplies inventories by category and usage on a periodic basis. Each category is assigned a probability of becoming obsolete based on the type of material and historical usage data. In 2018, TVA started moving from a site-specific inventory management policy to a fleet-wide strategy for each generation type. Based on the estimated value of the inventory, TVA adjusts its allowance for inventory obsolescence.2023.
Property, Plant, and Equipment, and Depreciation
Property, Plant, and Equipment. Additions to plant are recorded at cost, which includes direct and indirect costs. The cost of current repairs and minor replacements is charged to operating expense. When property, plant, and equipment is retired, accumulated depreciation is charged for the original cost of the assets. Gains or losses are only recognized upon the sale of land or an entire operating unit. TVA capitalizes certain costs incurred in connection with developing or obtaining internal-use software. Capitalized software costs are included in Property, plant, and equipment on the Consolidated Balance Sheets and are generally amortized over seven years.
Nuclear Fuel. Nuclear fuel, which is included in Property, plant, and equipment, is valued using the average cost method for raw materials and the specific identification method for nuclear fuel in a reactor. Amortization of nuclear fuel in a reactor is calculated on a units-of-production basis and is included in fuel expense. When property, plant,
TVA, the U.S. Department of Energy ("DOE"), and equipment is retired, accumulated depreciation is chargedcertain nuclear fuel contractors have entered into agreements, referred to as the Down-blend Offering for Tritium ("DBOT"), that provide for the original costproduction, processing, and storage of low-enriched uranium that is to be made using surplus DOE highly enriched uranium and other uranium. Low-enriched uranium can be fabricated into fuel for use in a nuclear power plant. Production of the assets. Gains or losses are only recognized uponlow-enriched uranium began in 2019 and is contracted to continue through September 2025. Contract activity will consist of storage and flag management. Flag management ensures that the saleuranium is of land or an entire operating unit.U.S. origin, free from foreign obligations, and unencumbered by policy restrictions, so that it can be used in connection with the production of tritium. Under the terms of the interagency agreement between the DOE and TVA, the DOE will reimburse TVA for a portion of the costs of converting the highly enriched uranium to low-enriched uranium. Since 2019, TVA has received $219 million in reimbursements from the DOE, which is recorded as a reduction in nuclear fuel inventory costs. At September 30, 2023, TVA recorded $11 million in Accounts receivable, net related to this agreement.
Depreciation. TVA accounts for depreciation of its properties using the composite depreciation convention of accounting. Under the composite method, assets with similar economic characteristics are grouped and depreciated as one asset. Depreciation is generally computed on a straight-line basis over the estimated service lives of the various classes of assets. The estimation of asset useful lives requires management judgment, supported by external depreciation studies of historical asset retirement experience. Depreciation rates are determined based on the external depreciation studies. These studies will bethat are updated approximately every five years. years, with the latest study implemented during the first quarter of 2022.
Depreciation expense for the years ended September 30, 2020, 2019,2023, 2022, and 20182021 was $1.6$1.9 billion, $1.8 billion, and $1.3$1.4 billion, respectively. Depreciation expense expressed as a percentage of the average annual depreciable completed plant was 2.743.14 percent for 2020, 3.092023, 2.98 percent for 2019,2022, and 2.452.28 percent for 2018.2021. Average depreciation rates by asset class are as follows:
| Property, Plant, and Equipment Depreciation Rates
At September 30
(percent) | Property, Plant, and Equipment Depreciation Rates
At September 30
(percent) | Property, Plant, and Equipment Depreciation Rates
At September 30
(percent) |
| | 2020 | | 2019 | | 2018 | | 2023 | | 2022 | | 2021 |
| Asset Class | Asset Class | | | | | | Asset Class | | | | | |
| Nuclear | Nuclear | 2.38 | | | 2.38 | | | 2.64 | | Nuclear | 2.73 | | | 2.72 | | | 2.38 | |
Coal-fired(1) | Coal-fired(1) | 3.62 | | | 4.96 | | | 2.32 | | Coal-fired(1) | 4.98 | | | 4.27 | | | 1.95 | |
| Hydroelectric | Hydroelectric | 1.60 | | | 1.61 | | | 1.57 | | Hydroelectric | 1.82 | | | 1.85 | | | 1.60 | |
| Gas and oil-fired | Gas and oil-fired | 3.04 | | | 3.00 | | | 2.93 | | Gas and oil-fired | 3.17 | | | 3.38 | | | 2.98 | |
| Transmission | Transmission | 1.34 | | | 1.34 | | | 1.32 | | Transmission | 1.52 | | | 1.51 | | | 1.34 | |
| Other | Other | 7.26 | | | 7.16 | | | 5.90 | | Other | 4.43 | | | 3.64 | | | 7.12 | |
Note
(1) The rates include the acceleration of depreciation related to retiring certain coal-fired units.
Coal-Fired. As a result of TVA's decision to idle or retire certain units sinceand potentially retiring the previous depreciation study, TVA recognized $387 million, $566 million, and $48 million in accelerated depreciation expense related to the units during the years ended September 30, 2020, 2019, and 2018, respectively. Accelerated depreciation is based on the remaining useful liferemainder of the asset at the time the decision is made to idle or retire a unit.coal-fired fleet by 2035. See Note 7 — Plant Closures.
Reacquired Rights. Property, plant, and equipment includes intangible reacquired rights, net of amortization, of $192$324 million and $200$178 million as of September 30, 20202023 and 2019,2022, respectively, related to the purchase of residual interests from
lease/leaseback agreements of certain combustion turbine units ("CTs"). Reacquired rights are amortized over the estimated useful lifelives of the underlying CTs.CTs which range from 30 to 35 years. Amortization expense was $10 million, $6 million, and $8 million for allthe years 2020, 2019,ended September 30, 2023, 2022, and 2018.2021, respectively, and accumulated amortization at September 30, 2023 and 2022 totaled $52 million and $42 million, respectively. At September 30, 2023, the estimated aggregate amortization expense for each of the next five years and thereafter is shown below:
Software Costs. TVA capitalizes certain costs incurred in connection with developing or obtaining internal-use software. Capitalized software costs are included in Property, plant, and equipment on the Consolidated Balance Sheets and are generally amortized over seven years. At September 30, 2020 and 2019, unamortized computer software costs totaled $54 million and $63 million, respectively. Amortization expense related to capitalized computer software costs was $42 million, $38 million, and $32 million for 2020, 2019, and 2018, respectively. Software costs that do not meet capitalization criteria are expensed as incurred. | | | | | | | | | | | | | | | | | | | | | | | | | | | | | | | | | | | | | | |
| | | 2024 | | 2025 | | 2026 | | 2027 | | 2028 | | Thereafter |
| Reacquired Rights | | $ | 11 | | | $ | 12 | | | $ | 11 | | | $ | 12 | | | $ | 11 | | | $ | 267 | |
| | | | | | | | | | | | |
Impairment of Assets. TVA evaluates long-lived assets for impairment when events or changes in circumstances indicate that the carrying value of such assets may not be recoverable. For long-lived assets, TVA bases its evaluation on impairment indicators such as the nature of the assets, the future economic benefit of the assets, any historical or future profitability measurements, regulatory approval and ability to set rates at levels that allow for recoverability of the assets, and other external market conditions or factors that may be present. If such impairment indicators are present or other factors exist that indicate that the carrying amount of an asset may not be recoverable, TVA determines whether an impairment has occurred based on an estimate of undiscounted cash flows attributable to the asset as compared with the carrying value of the asset. If an impairment has occurred, the amount of the impairment recognized is measured as the excess of the asset's carrying value over its fair value. Additionally, TVA regularly evaluates construction projects. If the project is canceled or deemed to have no future economic benefit, the project is written off as an asset impairment or, upon TVA Board approval, reclassified as a regulatory asset.asset and amortized over the Board-approved period. See Note 67 — Plant Closures.
Leases
TVA recognizes a lease asset and lease liability for leases with terms of greater than 12 months. Lease assets represent TVA's right to use an underlying asset for the lease term, and lease liabilities represent TVA's obligation to make lease payments arising from the lease, both of which are recognized based on the present value of the future minimum lease payments over the lease term at the commencement date. TVA has certain lease agreements that include variable lease payments that are based on energy production levels. These variable lease payments are not included in the measurement of the lease assets or lease liabilities but are recognized in the period in which the expenses are incurred.
While not specifically structured as leases, certain power purchase agreements ("PPAs") are deemed to contain a lease of the underlying generating units when the terms convey the right to control the use of the assets. Amounts recorded for these leases are generally based on the amount of the scheduled capacity payments due over the remaining terms of the power purchase agreements,PPAs, the terms of which vary. The total lease obligationobligations included in Accounts payable and accrued liabilities, Other long-term liabilities, and Finance lease liabilities related to these agreements were $500$390 million and $174$135 million for finance and operating leases, respectively, at September 30, 2020.2023. The total lease obligations included in Accounts payable and accrued liabilities, Other long-term liabilities, and Finance lease liabilities related to these agreements were $425 million and $133 million for finance and operating leases, respectively, at September 30, 2022.
TVA has agreements with lease and non-lease components and has elected to account for the components separately. Consideration is allocated to lease and non-lease components generally based on relative standalone selling prices.
TVA has lease agreements which include options for renewal and early termination. The intent to renew a lease varies depending on the lease type and asset. Renewal options that are reasonably certain to be exercised are included in the lease measurements. The decision to terminate a lease early is dependent on various economic factors. No termination options have been included in TVA's lease measurements.
Leases with an initial term of 12 months or less, which do not include an option to extend the initial term of the lease to greater than 12 months that TVA is reasonably certain to exercise, are not recorded on the Consolidated Balance Sheets at September 30, 2020.2023.
Operating leases are recognized on a straight-line basis over the term of the lease agreement. Rent expense associated with short-term leases and variable leases is recorded in Operating and maintenance expense, Fuel expense, or Purchased power expense on the Consolidated Statements of Operations. Expenses associated with finance leases result in the separate presentation of interest expense on the lease liability and amortization expense of the related lease asset on the Consolidated Statements of Operations.
Decommissioning Costs
TVA recognizes legal obligations associated with the future retirement of certain tangible long-lived assets. These obligations relate to fossil fuel-fired generating plants, nuclear generating plants, hydroelectric generating plants/dams, transmission structures, and other property-related assets. These other property-related assets include, but are not limited to, easements and coal rights. Activities involved with retiring these assets could include decontamination and demolition of structures, removal and disposal of wastes, and site restoration. Revisions to the estimatesforecasted costs of asset retirement obligations ("AROs")decommissioning activities are made whenever factors indicate that the timing or amounts of estimated cash flows have changed materially. Studies are updated for both nuclear and non-nuclear decommissioning costs at least every five years. Any accretion or depreciation expense related to these liabilities and assets is charged to a regulatory asset. See Note 910 —
Regulatory Assets and Liabilities — Nuclear Decommissioning Costs and Non-Nuclear Decommissioning Costs and Note 1213 — Asset Retirement Obligations.
Down-blend Offering for Tritium
TVA, the Department of Energy ("DOE"), and certain nuclear fuel contractors have entered into agreements, referred to as the Down-blend Offering for Tritium, that provide for the production, processing, and storage of low-enriched uranium that is to be made using surplus DOE highly enriched uranium and other uranium. Low-enriched uranium can be fabricated into fuel for use in a nuclear power plant. Production of the low-enriched uranium began in 2019 and is contracted to continue through October 2027. Beginning October 2027, contract activity will consist of storage and flag management. Flag management ensures that the uranium is of U.S. origin, free from foreign obligations, and unencumbered by policy restrictions, so that it can be used in connection with the production of tritium. Under the terms of the interagency agreement between the DOE and TVA, the DOE will reimburse TVA for a portion of the costs of converting the highly enriched uranium to low-enriched uranium. Since 2019, TVA has received $89 million in reimbursements from the DOE. At September 30, 2020, TVA recorded $6 million in Accounts receivable, net related to this agreement.
Investment Funds
Investment funds consist primarily of trust funds designated to fund decommissioning requirements (see Note 22 — Commitments and Contingencies — Contingencies — Decommissioning Costs), the Supplemental Executive Retirement Plan ("SERP") (see Note 2120 — Benefit Plans — Overview of Plans and Benefits — Supplemental Executive Retirement Plan), and the Deferred Compensation Plan ("DCP"), and the Restoration Plan ("RP"). The Nuclear Decommissioning Trust ("NDT") holds funds primarily for the ultimate decommissioning of TVA's nuclear power plants. The Asset Retirement Trust ("ART") holds funds primarily for the costs related to the future closure and retirement of TVA's other long-lived assets. The NDT, ART, SERP, DCP, and DCPRP funds are invested in portfolios of securities generally designed to achieve a return in line with overall equity and debt market performance. The NDT, ART, SERP, DCP, and DCPRP funds are all classified as trading.
Energy Prepayment Obligations
In 2004, TVA and its largest customer, Memphis Light, Gas and Water Division ("MLGW"), entered into an energy prepayment agreement under which MLGW prepaid TVA $1.5 billion for the future costs of electricity to be delivered by TVA to MLGW over a period of 180 months. TVA accounted for the prepayment as unearned revenue and reported the obligation to deliver power under this arrangement as Energy prepayment obligations. The arrangement ceased in 2019. Revenue was recognized in each year of the arrangement as electricity was delivered to MLGW based on the ratio of units of kilowatt hours delivered to total units of kilowatt hours under contract. As of September 30, 2019, $1.5 billion had been recognized as non-cash revenue on a cumulative basis during the life of the agreement, $10 million and $100 million of which was recognized as non-cash revenue during 2019 and 2018, respectively.
Discounts to account for the time value of money, which are recorded as a reduction to electricity sales, amounted to $4 million and $46 million for the years ended September 30, 2019 and 2018, respectively.
Insurance
Although TVA uses private companies to administer its healthcare plans for eligible active and retired employees not covered by Medicare, TVA does not purchase health insurance. Third-party actuarial specialists assist TVA in determining certain liabilities for self-insured claims. TVA recovers the costs of claims through power rates and through adjustments to the participants' contributions to their benefit plans. These liabilities are included in Other liabilities on the Consolidated Balance Sheets.
TVA sponsors an Owner Controlled Insurance Program which provides workers' compensation and liability insurance for a select group of contractors performing maintenance, modifications, outage, and new construction activities at TVA facilities.
The Federal Employees' Compensation Act ("FECA") governs liability to employees for service-connected injuries. TVA purchases excess workers' compensation insurance above a self-insured retention.
In addition to excess workers' compensation insurance, TVA purchases the following types of insurance:
•Nuclear liability insurance; nuclear property, decommissioning, and decontamination insurance; and nuclear accidental outage insurance. See Note 22 — Commitments andContingencies — Nuclear Insurance.
•Excess liability insurance for aviation, auto, marine, and general liability exposures.
•Property insurance for certain conventional (non-nuclear) assets.
The insurance policies are subject to the terms and conditions of the specific policy, including deductibles or self-insured retentions. To the extent insurance would not provide either a partial or total recovery of the costs associated with a loss, TVA would have to recover any such costs through other means, including through power rates.
Research and Development Costs
Research and development costs are expensed when incurred. TVA's research programs include those related to power delivery technologies, emerging technologies (clean energy, renewables, distributed resources, and energy efficiency), technologies related to generation (fossil fuel, nuclear, and hydroelectric), and environmental technologies.
Tax Equivalents
TVA is not subject to federal income taxation. In addition, neither TVA nor its property, franchises, or income is subject to taxation by states or their subdivisions. The TVA Act requires TVA to make payments to states and counties in which TVA conducts its power operations and in which TVA has acquired power properties previously subject to state and local taxation. The total amount of these payments is five percent of gross revenues from sales of power during the preceding year, excluding sales or deliveries to other federal agencies and off-system sales with other utilities, with a provision for minimum payments under certain circumstances. TVA calculates tax equivalent expense by subtracting the prior year fuel cost-related tax equivalent regulatory asset or liability from the payments made to the states and counties during the current year and adding back the current year fuel cost-related tax equivalent regulatory asset or liability. Fuel cost-related tax equivalent expense is recognized in the same accounting period in which the fuel cost-related revenue is recognized.
Maintenance Costs
TVA records maintenance costs and repairs related to its property, plant, and equipment inon the Consolidated Statements of Operations as they are incurred except for the recording of certain regulatory assets for retirement and removal costs.
2. Impact of New Accounting Standards and Interpretations
The following are accounting standard updates issued by the Financial Accounting Standards Board ("FASB") that TVA adopted during 2020:
| | | | | | | | | | | | | | |
Lease Accounting |
Description | This guidance changes the provisions of recognition in both the lessee and lessor accounting models. The standard requires entities that lease assets ("lessees") to recognize on the balance sheet the assets and liabilities for the rights and obligations created by leases with terms of more than 12 months, while also refining the definition of a lease. In addition, lessees are required to disclose key information about the amount, timing, and uncertainty of cash flows arising from leasing arrangements. The recognition, measurement, and presentation of expenses and cash flows arising from a lease by a lessee primarily depend on its classification as a finance lease (formerly referred to as capital lease) or operating lease. The standard requires both types of leases to be recognized on the balance sheet. Operating leases will result in straight-line expense, while finance leases will result in recognition of interest on the lease liability separate from amortization expense. The accounting rules for the owner of assets leased by the lessee ("lessor accounting") remain relatively unchanged.
The standard allows for certain practical expedients to be elected related to lease term determination, separation of lease and non-lease elements, reassessment of existing leases, and short-term leases. The standard is to be applied using a modified retrospective transition. |
Effective Date for TVA | October 1, 2019 |
Effect on the Financial Statements or Other Significant Matters | TVA elected the modified retrospective method of adoption effective October 1, 2019. Under the modified retrospective method of adoption, prior year reported results are not restated.
TVA recorded $205 million and $210 million of lease assets and lease liabilities, respectively, for operating leases in effect at the adoption date. The accounting for finance leases remained substantially unchanged. Adoption of the standard did not materially impact results of operations or cash flows.
TVA has elected to apply the following practical expedients:
|
| Practical Expedient | Description | |
| Package of transition practical expedients (for leases commenced prior to adoption date; expedients must be adopted as a package) | Do not need to (1) reassess whether any expired or existing contracts are leases or contain leases, (2) reassess the lease classification for any expired or existing leases, or (3) reassess initial direct costs for any existing leases. | |
| Short-term lease expedient (elect by class of underlying asset) | Elect as an accounting policy to not apply the recognition requirements to short-term leases by asset class. | |
| Existing and expired land easements not previously accounted for as leases | Elect to not evaluate existing or expired easements under the new guidance and carry forward current accounting treatment. | |
| Comparative reporting requirements for initial adoption | Elect to (1) apply transition requirements at adoption date, (2) recognize cumulative effect adjustment to retained earnings in period of adoption, and (3) not apply the new requirements to comparative periods, including disclosures. | |
| | | |
|
Derivatives and Hedging - Improvements to Accounting for Hedging Activities |
Description | This guidance better aligns an entity's risk management activities and financial reporting for hedging relationships through changes to both the designation and measurement guidance for qualifying hedging relationships and the presentation of hedge results. To meet that objective, the amendments expand and refine hedge accounting for both nonfinancial and financial risk components and align the recognition and presentation of the effects of the hedging instrument and the hedged item in the financial statements. |
Effective Date for TVA | October 1, 2019 |
Effect on the Financial Statements or Other Significant Matters | TVA has adopted the standard on a prospective basis. The adoption of this standard did not have a material impact on TVA's financial condition, results of operations, or cash flows. TVA only uses hedge accounting under its foreign currency swap arrangements, and the adoption of this standard had no impact on those arrangements. |
|
Customer's Accounting for Implementation Costs in a Cloud Arrangement That Is a Service Contract |
Description | This guidance relates to the accounting for a customer's implementation costs in a hosting arrangement that is a service contract. The amendments align the requirements for capitalizing those implementation costs with the requirements for capitalizing implementation costs incurred to develop or obtain internal-use software and hosting arrangements that include an internal-use software license. The amendments also provide requirements for the classification of the capitalized costs and related expense and cash flows in the financial statements, the application of impairment guidance to the capitalized costs, and the application of abandonment guidance to the capitalized costs. Entities are required to apply the amendments either retrospectively or prospectively to all implementation costs incurred after the adoption date. |
Effective Date for TVA | October 1, 2019 |
Effect on the Financial Statements or Other Significant Matters | TVA has adopted the standard on a prospective basis. Adoption of this standard did not have a material impact on TVA's financial condition, results of operations, or cash flows. TVA records qualified implementation costs in a cloud arrangement that is a service contract as a prepaid asset and amortizes the prepaid asset to Operating and maintenance expense based on the term of the contract. |
The following accounting standards have been issued but as of September 30, 2020,2023, were not effective and had not been adopted by TVA:
| | | | | |
Financial Instruments - Credit LossesAccounting for Contract Assets and Contract Liabilities from Contracts with Customers |
| Description | This guidance eliminates the probable initial recognition threshold in current GAAP and, instead, requires an allowanceentity (acquirer) to be recorded for all recognize and measure contract assets and contract
liabilities acquired in a business combination in accordance with revenue with customers. It is
expected credit losses for certainthat an acquirer will generally recognize and measure acquired contract assets and contract
liabilities in a manner consistent with how the acquiree recognized and measured contract assets and
contract liabilities in the acquiree’s financial assets that are not measured at fair value.statement. The allowance for credit losses is basedentity should apply the standard prospectively to business combinations occurring on historical information, current conditions, and reasonable and supportable forecasts. The new standard also makes revisions toor after the other than temporary impairment model for available-for-sale debt securities. Disclosureseffective date of credit quality indicators in relation to the amortized cost of financing receivables are further disaggregated by year of origination.standard. |
| Effective Date for TVA | TheThis new standard is effective for TVA'sTVA’s interim and annual reporting periods beginning October 1, 2020.
2023. TVA adopted the standard on October 1, 2023, on a prospective basis. While early adoption was permitted, TVA did not adopt the standard early. |
| Effect on the Financial Statements or Other Significant Matters | TVA adopted this standard using the modified retrospective method through a cumulative-effect adjustment to retained earnings on October 1, 2020. TVA will recognize an allowance that reflects the current estimate of credit losses expected to be incurred over the life of the financial assets based on historical experience, current conditions, and reasonable and supportable forecasts. This standard will primarily impact TVA's long-term loans receivable. Adoption of this standard isdid not expected to have a material impact on TVA's financial condition, results of operations, or cash flows. |
|
|
| |
| |
| |
|
|
| |
| |
| |
|
|
| |
| |
| |
| | | | | |
Fair Value Measurement DisclosureTroubled Debt Restructurings and Vintage Disclosures |
| Description | This guidance eliminates the recognition and measurement guidance on troubled debt restructuring for
creditors that have adopted Financial Instruments-Credit Losses and requires enhanced disclosures
about loan modifications for borrowers experiencing financial difficulty. Additionally, the guidance
requires public business entities to present current-period gross write-offs by year of origination in their
vintage disclosures. The guidance changes certain disclosure requirementsentity should apply the standard prospectively except for fair value measurements. It removes certain disclosure requirements, such as the amounttransition method related to the recognition and measurement of and reasons for transfers between Level 1 and Level 2troubled debt restructuring. For the transition method, an entity has the option to apply a modified retrospective transition method, resulting in a cumulative-effect adjustment to retained earnings in the period of the fair value hierarchy; the policy for timing of the transfers between levels; and the valuation processes for Level 3 fair value measurements. Some disclosure requirements are added, such as the change in unrealized gains and losses included in other comprehensive income for recurring Level 3 fair value measurements and the range and weighted average of significant unobservable inputs used to develop Level 3 fair value measurements.adoption. |
| Effective Date for TVA | TheThis new standard is effective for TVA'sTVA’s interim and annual reporting periods beginning October 1, 2020.
2023. TVA adopted the standard on October 1, 2023, on a prospective basis. While early adoption was permitted, TVA did not adopt the standard early. |
| Effect on the Financial Statements or Other Significant Matters | TVA does not expect the adoptionAdoption of this standard todid not have a material impact on TVA's financial condition, results of operations, or cash flows. |
|
Reference Rate Reform |
Description | The guidance provides temporary optional expedients and exceptions to the guidance in GAAP on contract modifications and hedge accounting to ease the financial reporting burdens related to the expected market transition from the London Interbank Offered Rate ("LIBOR") and other interbank offered rates to alternative reference rates, such as the Secured Overnight Financing Rates. |
Effective Date for TVA | The new standard is effective for adoption at any time between March 12, 2020, and December 31, 2022. TVA currently plans to adopt the standard by December 31, 2022. |
Effect on the Financial Statements or Other Significant Matters | TVA continues to review this standard and evaluate the impact of using an alternative reference rate instead of LIBOR in its interest rate swap contracts. TVA expects the adoption of the standard will simplify the accounting for any modifications to its interest rate swap contracts. |
|
|
| |
| |
| |
|
|
| |
| |
| |
3. Accounts Receivable, Net
Accounts receivable primarily consist of amounts due from customers for power sales. The table below summarizes the types and amounts of TVA's accounts receivable:
| Accounts Receivable, Net At September 30 | |
Accounts Receivable, Net At September 30 (in millions) | | Accounts Receivable, Net At September 30 (in millions) |
| | | 2020 | | 2019 | | 2023 | | 2022 |
| Power receivables | Power receivables | $ | 1,401 | | | $ | 1,624 | | Power receivables | $ | 1,627 | | | $ | 1,899 | |
| Other receivables | Other receivables | 128 | | | 115 | | Other receivables | 118 | | | 108 | |
| Accounts receivable, net(1) | Accounts receivable, net(1) | $ | 1,529 | | | $ | 1,739 | | Accounts receivable, net(1) | $ | 1,745 | | | $ | 2,007 | |
Note
(1) Allowance for uncollectible accounts was less than $1 million at both September 30, 20202023 and 2019,2022, and therefore is not represented in the table above.
In response to the COVID-19 pandemic, the TVA Board approved the Public Power Support and Stabilization program in March 2020, which includes alternative wholesale payment arrangements for LPCs. Through this program, TVA is offering up to $1.0 billion of credit support to LPCs that demonstrate the need for temporary financial relief, through the deferral of a portion of LPCs' wholesale power payments owed to TVA. The program requires LPCs to apply for the deferral, which is subject to approval by TVA. If approved, TVA will establish and approve a repayment schedule with the LPC by December 31, 2020, with a repayment term not to exceed two years. The program is available through CY 2020, and as of November 16, 2020, $1 million of credit support has been approved under the program.
4. Inventories, Net
The table below summarizes the types and amounts of TVA's inventories:
| Inventories, Net At September 30 | |
Inventories, Net At September 30 (in millions) | | Inventories, Net At September 30 (in millions) |
| | | 2020 | | 2019 | | 2023 | | 2022 |
| Materials and supplies inventory | Materials and supplies inventory | $ | 770 | | | $ | 742 | | Materials and supplies inventory | $ | 849 | | | $ | 808 | |
| Fuel inventory | Fuel inventory | 253 | | | 294 | | Fuel inventory | 313 | | | 303 | |
| RECs inventory, net | 15 | | | 16 | | |
| Renewable energy certificates/emissions allowance inventory, net | | Renewable energy certificates/emissions allowance inventory, net | 15 | | | 18 | |
| Allowance for inventory obsolescence | Allowance for inventory obsolescence | (35) | | | (53) | | Allowance for inventory obsolescence | (69) | | | (57) | |
| Inventories, net | Inventories, net | $ | 1,003 | | | $ | 999 | | Inventories, net | $ | 1,108 | | | $ | 1,072 | |
5. Other Current Assets
Other current assets consisted of the following:
| | | | | | | | | | | | | |
Other Current Assets At September 30 (in millions) | | |
| | 2023 | | 2022(1) | | |
| Inventory work-in-progress | $ | 28 | | | $ | 18 | | | |
| Current portion of prepaid long-term service agreements | 25 | | | 12 | | | |
| Commodity contract derivative assets | 21 | | | 172 | | | |
| Prepaid software maintenance | 18 | | | 14 | | | |
| Prepaid insurance | 16 | | | 16 | | | |
| | | | | |
| Other | 26 | | | 25 | | | |
| Other current assets | $ | 134 | | | $ | 257 | | | |
Note
(1) At September 30, 2022, $18 million, $14 million, $16 million, and $12 million previously classified as Other (a component of Other current assets) have been reclassified to Inventory work-in-progress (a component of Other current assets), Prepaid software maintenance (a component of Other current assets), Prepaid insurance (a component of Other current assets), and Current portion of prepaid long-term service agreements (a component of Other current assets), respectively, to conform with current year presentation.
Commodity Contract Derivative Assets. TVA enters into certain derivative contracts for natural gas that require physical
delivery of the contracted quantity of the commodity as well as certain financial derivative contracts to hedge exposure to the price of natural gas. Commodity contract derivative assets classified as current include deliveries or settlements that will occur within 12 months or less. SeeNote 15 — Risk Management Activities and Derivative Transactions — Derivatives Not Receiving Hedge Accounting Treatment — Commodity Derivatives and — Commodity Derivatives under the FHP for adiscussion of TVA's commodity contract derivatives.
5.6. Net Completed Plant
Net completed plant consisted of the following:
| Net Completed Plant At September 30 | |
Net Completed Plant At September 30 (in millions) | | Net Completed Plant At September 30 (in millions) |
| | | 2020 | | 2019 | | 2023 | | 2022 |
| | | Cost | | Accumulated Depreciation | |
Net | | Cost | | Accumulated Depreciation | | Net | | Cost | | Accumulated Depreciation | |
Net | | Cost | | Accumulated Depreciation | | Net |
Coal-fired(2)(1) | Coal-fired(2)(1) | $ | 18,613 | | | $ | 13,944 | | | $ | 4,669 | | | $ | 17,400 | | | $ | 12,538 | | | $ | 4,862 | | Coal-fired(2)(1) | $ | 18,525 | | | $ | 14,464 | | | $ | 4,061 | | | $ | 18,145 | | | $ | 13,649 | | | $ | 4,496 | |
| Gas and oil-fired | Gas and oil-fired | 6,010 | | | 1,696 | | | 4,314 | | | 6,054 | | | 1,562 | | | 4,492 | | Gas and oil-fired | 6,663 | | | 2,057 | | | 4,606 | | | 6,112 | | | 1,957 | | | 4,155 | |
| Nuclear | Nuclear | 25,741 | | | 12,141 | | | 13,600 | | | 25,543 | | | 11,656 | | | 13,887 | | Nuclear | 26,803 | | | 13,557 | | | 13,246 | | | 26,629 | | | 12,928 | | | 13,701 | |
| Transmission | Transmission | 8,283 | | | 3,140 | | | 5,143 | | | 7,932 | | | 3,083 | | | 4,849 | | Transmission | 9,375 | | | 3,359 | | | 6,016 | | | 8,919 | | | 3,301 | | | 5,618 | |
| Hydroelectric | Hydroelectric | 3,410 | | | 1,090 | | | 2,320 | | | 3,163 | | | 1,051 | | | 2,112 | | Hydroelectric | 4,109 | | | 1,241 | | | 2,868 | | | 3,987 | | | 1,192 | | | 2,795 | |
| Other electrical plant | Other electrical plant | 1,981 | | | 1,146 | | | 835 | | | 1,920 | | | 1,110 | | | 810 | | Other electrical plant | 1,798 | | | 780 | | | 1,018 | | | 1,724 | | | 807 | | | 917 | |
| Intangible software | 3 | | | 2 | | | 1 | | | 3 | | | 1 | | | 2 | | |
| Multipurpose dams | Multipurpose dams | 900 | | | 381 | | | 519 | | | 900 | | | 373 | | | 527 | | Multipurpose dams | 900 | | | 404 | | | 496 | | | 900 | | | 396 | | | 504 | |
| Other stewardship | Other stewardship | 29 | | | 10 | | | 19 | | | 29 | | | 10 | | | 19 | | Other stewardship | 26 | | | 9 | | | 17 | | | 26 | | | 9 | | | 17 | |
| | Total | Total | $ | 64,970 | | | $ | 33,550 | | | $ | 31,420 | | | $ | 62,944 | | | $ | 31,384 | | | $ | 31,560 | | Total | $ | 68,199 | | | $ | 35,871 | | | $ | 32,328 | | | $ | 66,442 | | | $ | 34,239 | | | $ | 32,203 | |
NotesNote
(1) TVA recognized accelerated depreciation as a result of the decision to idle or retire certain units.units and the potential retirement of the remainder of the coal-fired fleet by 2035. See Note 67 — Plant Closures.
(2) In 2020, TVA recorded approximately $1.1 billion in upward revisions to asset retirement costs for coal-fired assets. See Note 12 —Asset Retirement Obligations.
6.
7. Plant Closures
Background
TVA must continuously evaluate all generating assets to ensure an optimal energy portfolio that provides safe, clean, and reliable power while maintaining flexibility and fiscal responsibility to the people of the Tennessee Valley. Based on results of assessments presented to the TVA Board in 2019, the retirement of Paradise Fossil Plant ("Paradise") Unit 3 by December 2020 and Bull Run Fossil Plant ("Bull Run") by December 2023 was approved. Subsequent toapproved, and as of September 30, 2023, the facility was retired. In addition, TVA is evaluating the impact of retiring the balance of the coal-fired fleet by 2035, and that evaluation includes environmental reviews, public input, and TVA Board approval, TVA determined that Paradise would not be restarted after January 2020 dueapproval. Due to the plant's material condition. Paradise Unit 3 was taken offline on February 1, 2020, effectively retiring the plant.these evaluations, certain planning assumptions were updated, and their financial impacts are discussed below.
In January 2023, TVA issued its Record of Decision to retire the two coal-fired units at Cumberland Fossil Plant ("Cumberland") by the end of CY 2026 and CY 2028.
Financial Impact
As a result of TVA's decision to accelerate the retirements of Paradise and Bull Run, certain construction projects at these locations were identified as probable of abandonment or were no longer expected to be in service for greater than one year prior to the plants' retirement dates. The write-off of these projects resulted in $11 million and $151 million of Operating and maintenance expense during the years ended September 30, 2020 and 2019, respectively. TVA also recognized losses of $2 million and $19 million in Operating and maintenance expense related to additional materials and supplies inventory reserves and write-offs identified at Paradise during the years ended September 30, 2020 and 2019, respectively.
TVA's policy is to adjust depreciation rates to reflect the most current assumptions, ensuring units will be fully depreciated by the applicable retirement dates. As a result of TVA's decision to accelerate the retirement of Paradise and Bull Run, TVA has recognized an additional $387 million and $566a cumulative $659 million of accelerated depreciation since the second quarter of 2019. Of this amount, $177 million, $140 million, and $136 million were recognized for the years ended September 30, 20202023, 2022, and 2019,2021, respectively. TVA's decision to retire the two units at Cumberland is estimated to result in approximately $16 million of additional depreciation quarterly, which does not include any potential impact from additions or retirements to net completed plant. TVA estimates it has recognized a cumulative $48 million of additional depreciation since January 2023, related to this decision.
TVA also recognized $14 million, $22 million, and $4 million in Operating and maintenance expense related to additional inventory reserves and project write-offs for the coal-fired fleet, including Bull Run and Cumberland, for the years ended September 30, 2023, 2022, and 2021, respectively.
78. Leases
As described in Note 2 — Impact of New Accounting Standards and Interpretations, TVA elected the modified retrospective method of adoption for the new lease accounting standard effective October 1, 2019. Under the modified retrospective method of adoption, prior year reported results are not restated.
TVA recorded $205 million and $210 million of lease assets and lease liabilities, respectively, for operating leases in effect at the adoption date. The accounting for finance leases remained substantially unchanged. Adoption of the standard did not materially impact results of operations or cash flows.
The following table provides additional information regarding the presentation of leases on the Consolidated Balance Sheets at September 30, 2020:Sheets:
| | | | | | | | |
Amounts Recognized on TVA's Consolidated Balance Sheets
At September 30, 2020
|
Assets | | |
Operating | Operating lease assets, net of amortization | $ | 232 | |
Finance | Finance leases | 516 | |
Total lease assets | | $ | 748 | |
| | |
Liabilities | | |
Current | | |
Operating | Accounts payable and accrued liabilities | $ | 63 | |
Finance | Accounts payable and accrued liabilities | 41 | |
Non-current | | |
Operating | Other long-term liabilities | 171 | |
Finance | Finance lease liabilities | 525 | |
Total lease liabilities | | $ | 800 | |
| | | | | | | | | | | | | | |
Amounts Recognized on TVA's Consolidated Balance Sheets At September 30 (in millions) |
| | 2023 | | 2022 |
| Assets | | | | |
| Operating | Operating lease assets, net of amortization | $ | 177 | | | $ | 155 | |
| Finance | Finance leases | 572 | | | 630 | |
| Total lease assets | | $ | 749 | | | $ | 785 | |
| | | | |
| Liabilities | | | | |
| Current | | | | |
| Operating | Accounts payable and accrued liabilities | $ | 71 | | | $ | 59 | |
| Finance | Accounts payable and accrued liabilities | 56 | | | 59 | |
| Non-current | | | | |
| Operating | Other long-term liabilities | 93 | | | 93 | |
| Finance | Finance lease liabilities | 576 | | | 628 | |
| Total lease liabilities | | $ | 796 | | | $ | 839 | |
TVA's leases consist primarily of railcars, equipment, real estate/land, power generating facilities, and gas pipelines. TVA's leases have various terms and expiration dates remaining from less than one year to 2623 years. The components of lease costs for the year September 30, 2020, were as follows:
| | | | | | | |
Lease Costs |
| For the year ended September 30, 2020 |
Operating lease costs(1)
| $ | 84 | | | |
Variable lease costs(1)
| 75 | | | |
Short-term lease costs(1)
| 7 | | | |
Finance lease costs | | | |
Amortization of lease assets(2)
| 15 | | | |
Interest on lease liabilities(3)(4)
| 33 | | | |
Total finance lease costs | 48 | | | |
Total lease costs | $ | 214 | | | |
| | | | | | | | | | | | | | | | | | | |
Lease Costs For the years ended September 30 (in millions) |
| 2023 | | 2022 | | 2021 | | |
Operating lease costs(1) | $ | 69 | | | $ | 56 | | | $ | 52 | | | |
Variable lease costs(1) | 134 | | | 78 | | | 75 | | | |
Short-term lease costs(1) | 18 | | | 26 | | | 12 | | | |
| Finance lease costs | | | | | | | |
Amortization of lease assets(2) | 57 | | | 58 | | | 51 | | | |
Interest on lease liabilities(3)(4) | 43 | | | 42 | | | 39 | | | |
| Total finance lease costs | 100 | | | 100 | | | 90 | | | |
| Total lease costs | $ | 321 | | | $ | 260 | | | $ | 229 | | | |
Notes
(1) Costs are included in Operating and maintenance expense, Fuel expense, Purchased power expense, and Tax equivalents expense on the Consolidated Statements of Operations. TVA's rental expense for operating leases was approximately $97 million and $92 million for the years ended September 30, 2019 and 2018, respectively.
(2) Expense is included in Depreciation and amortization expense on the Consolidated Statements of Operations.
(3) Expense is included in Interest expense on the Consolidated Statements of Operations.
(4) Certain finance leases receive regulatory accounting treatment and are reclassified to Fuel expense and Purchased power expense.
TVA's variable lease costs are primarily related to renewable energy purchase agreements that require TVA to purchase all output from the underlying facility. Payments under those agreements are solely based on the actual output over the lease term. Certain TVA lease agreements contain renewal options. Those renewal options that are reasonably certain to be exercised are included in the lease measurements.
The following table contains additional information with respect to cash and non-cash activities related to leases:
| | | | | |
Amounts Recognized on TVA's Consolidated Statements of Cash Flows
For the Year Ended September 30, 2020
|
Operating cash flows for operating leases | $ | 85 | |
Operating cash flows for finance leases | 33 | |
Financing cash flows for finance leases | 15 | |
| |
Lease assets obtained in exchange for lease obligations (non-cash) | |
Operating leases(1)
| $ | 110 | |
Finance leases | 394 | |
| | | | | | | | | | | | | | | | | |
Amounts Recognized on TVA's Consolidated Statements of Cash Flows For the years ended September 30 (in millions) |
| 2023 | | 2022 | | 2021 |
| Operating cash flows for operating leases | $ | 77 | | | $ | 57 | | | $ | 53 | |
| Operating cash flows for finance leases | 43 | | | 42 | | | 39 | |
| Financing cash flows for finance leases | 56 | | | 60 | | | 52 | |
| | | | | |
| Lease assets obtained in exchange for lease obligations (non-cash) | | | | | |
Operating leases(1) | $ | 84 | | | $ | 43 | | | $ | (22) | |
| Finance leases | 3 | | | — | | | 233 | |
Note
(1) Amount excludesfor 2021 represents a non-cash reduction due to a lease that was amended during the fiscal year resulting in derecognition of the operating lease assets recorded as a result of the adoption of the new lease standard.
asset and obligation upon remeasurement.
TVA has certain finance leases under PPAs under which the present value of the minimum lease payments exceeds the fair value of the related lease asset at the date of measurement. This resulted in an interest rate that was higher than TVA's incremental borrowing rate. At September 30, 2020, theThe weighted average remaining lease termterms in years and the weighted average discount rate for TVA's operating and financing leases were as follows:
| | | | | |
Weighted Averages
At September 30, 2020
|
Weighted average remaining lease terms | |
Operating leases | 5 years |
Finance leases | 12 years |
| |
Weighted average discount rate(1)
| |
Operating leases | 1.6% |
Finance leases | 21.8% |
| | | | | | | | | | | |
Weighted Averages At September 30 |
| 2023 | | 2022 |
| Weighted average remaining lease terms | | | |
| Operating leases | 3 years | | 3 years |
| Finance leases | 10 years | | 11 years |
| | | |
Weighted average discount rate(1) | | | |
| Operating leases | 4.1% | | 1.5% |
| Finance leases | 21.6% | | 17.8% |
Note
(1) The discount rate is calculated using the rate implicit in a lease if it is readily determinable. If the rate used by the lessor is not readily determinable, TVA uses its incremental borrowing rate as permitted by accounting guidance. The incremental borrowing rate is influenced by TVA's credit rating and lease term and as such may differ for individual leases, embedded leases, or portfolios of leased assets.
The following table presents maturities of lease liabilities and a reconciliation of the undiscounted cash flows to lease liabilities at September 30, 20202023:
| | | | | |
Future Minimum Lease Payments Minimum Payments Due at September 30, 2020 |
| Operating leases | |
| 2021 | $ | 66 | |
| 2022 | 51 | |
| 2023 | 39 | |
| 2024 | 37 | |
| 2025 | 34 | |
| Thereafter | 16 | |
| Minimum annual payments | 243 | |
| Less: present value discount | (9) | |
| Operating present value of net minimum lease payments | $ | 234 | |
| |
| Finance leases | |
| 2021 | $ | 92 | |
| 2022 | 93 | |
| 2023 | 92 | |
| 2024 | 87 | |
| 2025 | 86 | |
| Thereafter | 592 | |
| Minimum annual payments | 1,042 | |
| Less: amount representing interest | (476) | |
| Finance present value of net minimum lease payments | $ | 566 | |
The following table presents the future minimum lease payments under operating leases and the finance lease maturities as reported under the previous lease standard at September 30, 2019:
| Future Minimum Lease Payments Minimum Payments Due at September 30, 2019 | |
Future Minimum Lease Payments Minimum payments outstanding at September 30, 2023 (in millions) | | Future Minimum Lease Payments Minimum payments outstanding at September 30, 2023 (in millions) |
| Operating leases | Operating leases | | Operating leases | |
| 2020 | $ | 76 | | |
| 2021 | 75 | | |
| 2022 | 60 | | |
| 2023 | 12 | | |
| 2024 | 2024 | 3 | | 2024 | $ | 76 | |
| 2025 | | 2025 | 51 | |
| 2026 | | 2026 | 24 | |
| 2027 | | 2027 | 9 | |
| 2028 | | 2028 | 3 | |
| Thereafter | Thereafter | 2 | | Thereafter | 11 | |
| Minimum annual payments | Minimum annual payments | 228 | | Minimum annual payments | 174 | |
| Less: present value discount | Less: present value discount | 0 | | Less: present value discount | (10) | |
| Operating present value of net minimum lease payments | Operating present value of net minimum lease payments | $ | 228 | | Operating present value of net minimum lease payments | $ | 164 | |
| | Finance leases | Finance leases | | Finance leases | |
| 2020 | $ | 53 | | |
| 2021 | 53 | | |
| 2022 | 53 | | |
| 2023 | 55 | | |
| 2024 | 2024 | 51 | | 2024 | $ | 109 | |
| 2025 | | 2025 | 107 | |
| 2026 | | 2026 | 106 | |
| 2027 | | 2027 | 104 | |
| 2028 | | 2028 | 102 | |
| Thereafter | Thereafter | 418 | | Thereafter | 450 | |
| Minimum annual payments | Minimum annual payments | 683 | | Minimum annual payments | 978 | |
| Less: amount representing interest | Less: amount representing interest | (495) | | Less: amount representing interest | (346) | |
| Finance present value of net minimum lease payments | Finance present value of net minimum lease payments | $ | 188 | | Finance present value of net minimum lease payments | $ | 632 | |
During the fourth quarter of 2023, TVA entered into a PPA with a term of 2 years that commenced in October 2023. Lease payments made over the term are expected to total approximately $43 million.
TVA has entered into three PPAs with renewable resource providerproviders for solar generation and rights to charge and discharge a battery energy storage system.systems. The system issystems are considered a lease component in this agreement. This lease has a termthese agreements. These PPAs have terms of 20 years, and isare expected to commence on October 1, 2022. Payments madebetween April 2024 and April 2025. Total capacity payments related to these batteries over the term of this leasethese PPAs are expected to total approximately $89$394 million.
9. Other Long-Term Assets
The table below summarizes the types and amounts of TVA's other long-term assets:
| | | | | | | | | | | |
Other Long-Term Assets At September 30 |
| | 2020 | | 2019(1) |
| Loans and other long-term receivables, net | $ | 100 | | | $ | 125 | |
EnergyRight® receivables | 69 | | | 81 | |
| Prepaid long-term service agreements | 42 | | | 22 | |
| Commodity contract derivative assets | 23 | | | 0 | |
| Restricted cash and cash equivalents | 21 | | | 23 | |
| Prepaid capacity payments | 11 | | | 19 | |
| | | |
| | | |
| Other | 59 | | | 55 | |
| Total other long-term assets | $ | 325 | | | $ | 325 | |
Note
(1) At September 30, 2019, $22 million previously classified as Other (a component of Other long-term assets) has been reclassified to Prepaid long-term service agreements (a component of Other long-term assets) to conform with current year presentation. | | | | | | | | | | | |
Other Long-Term Assets At September 30 (in millions) |
| | 2023 | | 2022 |
| Loans and other long-term receivables, net | $ | 97 | | | $ | 99 | |
| Prepaid long-term service agreements | 64 | | | 74 | |
EnergyRight® receivables, net | 47 | | | 49 | |
| Prepaid capital assets | 28 | | | — | |
| Commodity contract derivative assets | 12 | | | 102 | |
| | | |
| | | |
| Other | 82 | | | 70 | |
| Total other long-term assets | $ | 330 | | | $ | 394 | |
Loans and Other Long-Term Receivables. TVA's loans and other long-term receivables primarily consist of economic development loans for qualifying organizations and a receivable for reimbursements to recover the cost of providing long-term, on-site storage for spent nuclear fuel. The current and long-term portions of the loans receivable are reported in Accounts receivable, net and Other long-term assets, respectively, on TVA's Consolidated Balance Sheets. At September 30, 2023 and 2022, the carrying amount of the loans receivable, net of discount, reported in Accounts receivable, net was $7 million and $6 million, respectively.
EnergyRight® Receivables. In association with the EnergyRight® program, TVA's local power company customers ("LPCs") offer financing to end-use customers for the purchase of energy-efficient equipment. Depending on the nature of the energy-efficiency project, loans may have a maximum term of five years or 10 years. TVA purchases the resulting loans receivable from its LPCs. The loans receivable are then transferred to a third-party bank with which TVA has agreed to repay in
full any loans receivable that have been in default for 180 days or more or that TVA has determined are uncollectible. Given this continuing involvement, TVA accounts for the transfer of the loans receivable as secured borrowings. The current and long-term portions of the loans receivable are reported in Accounts receivable, net and Other long-term assets, respectively, on TVA's Consolidated Balance Sheets. At September 30, 20202023 and 2019,2022, the carrying amount of the loans receivable, net of discount, reported in Accounts receivable, net was approximately $18$12 million and $20$13 million, respectively. See Note 1112 — Other Long-Term Liabilities for information regarding the associated financing obligation.
In responseAllowance for Loan Losses. The allowance for loan loss is an estimate of expected credit losses, measured over the estimated life of the loan receivables, that considers reasonable and supportable forecasts of future economic conditions in addition to the COVID-19 pandemic, customers experiencing financial hardship can request a deferralinformation about historical experience and current conditions. See Note 1 — Summary of EnergyRightSignificant Accounting Policies ®— loan paymentsAllowance for Uncollectible Accounts.
The allowance components, which consist of a periodcollective allowance and specific loans allowance, are based on the risk characteristics of up to six months. This deferral option began April 20, 2020, and is available through October 31, 2020. DeferredTVA's loans. Loans that share similar risk characteristics are evaluated on a collective basis in measuring credit losses, while loans willthat do not accrue interest during the deferral months. These deferredshare similar risk characteristics with other loans have resulted in a less than $1 million impact to TVA.are evaluated on an individual basis.
| | | | | | | | | | | |
Allowance Components At September 30 (in millions) |
| 2023 | | 2022 |
EnergyRight® loan reserve | $ | 1 | | | $ | 1 | |
| Economic development loan collective reserve | 1 | | | 1 | |
| Economic development loan specific loan reserve | 1 | | | 1 | |
| | | |
| Total allowance for loan losses | $ | 3 | | | $ | 3 | |
Prepaid Long-Term Service Agreements. TVA has entered into various long-term service agreements for major
maintenance activities at certain of its combined cycle plants. TVA uses the direct expense method of accounting for these
arrangements. TVA accrues for parts when it takes ownership and for contractor services when they are rendered. Under
certain of these agreements, payments made exceed the value of parts received and services rendered. The current and long-term portions of the resulting prepayments are reported in Other current assets and Other long-term assets, respectively, on
TVA's Consolidated Balance Sheets. At September 30, 20202023 and 2019,2022, prepayments of $3$25 million and $5$12 million,
respectively, were recorded in Other current assets.
9.Commodity Contract Derivative Assets. TVA enters into certain derivative contracts for natural gas that require physical delivery of the contracted quantity of the commodity as well as certain financial derivative contracts to hedge exposure to the price of natural gas. SeeNote 15 — Risk Management Activities and Derivative Transactions — Derivatives Not Receiving Hedge Accounting Treatment — Commodity Derivatives and — Commodity Derivatives under the FHP for adiscussion of TVA's commodity contract derivatives.
10. Regulatory Assets and Liabilities
TVA records certain assets and liabilities that result from the regulated ratemaking process that would not be recorded under GAAP for non-regulated entities. As such, certain items that would generally be reported in earnings or that would impact the Consolidated Statements of Operations are recorded as regulatory assets or regulatory liabilities. Regulatory assets generally represent incurred costs that have been deferred because such costs are probable of future recovery in customer rates. Regulatory liabilities generally represent obligations to make refunds to customers for previous collections for costs that are not likely to be incurred or deferral of gains that will be credited to customers in future periods. Components of regulatory assets and regulatory liabilities are summarized in the table below.
| | | | | | | | | | | |
Regulatory Assets and Liabilities At September 30 |
| | 2020 | | 2019(1) |
| Current regulatory assets | | | |
| Unrealized losses on interest rate derivatives | $ | 114 | | | $ | 89 | |
| Unrealized losses on commodity derivatives | 4 | | | 39 | |
| | | |
| | | |
| | | |
| | | |
| Fuel cost adjustment receivable | 12 | | | 28 | |
| | | |
| Total current regulatory assets | 130 | | | 156 | |
| | | |
| Non-current regulatory assets | | | |
| Deferred pension costs and other post-retirement benefits costs | 5,193 | | | 4,756 | |
| | | |
| Non-nuclear decommissioning costs | 2,512 | | | 1,741 | |
| Unrealized losses on interest rate derivatives | 1,506 | | | 1,241 | |
| Nuclear decommissioning costs | 896 | | | 868 | |
| Unrealized losses on commodity derivatives | 0 | | | 15 | |
| | | |
| | | |
| | | |
| | | |
| Other non-current regulatory assets | 138 | | | 142 | |
| Total non-current regulatory assets | 10,245 | | | 8,763 | |
| Total regulatory assets | $ | 10,375 | | | $ | 8,919 | |
| | | |
| Current regulatory liabilities | | | |
| Fuel cost adjustment tax equivalents | $ | 115 | | | $ | 138 | |
| | | |
| Unrealized gains on commodity derivatives | 26 | | | 12 | |
| Total current regulatory liabilities | 141 | | | 150 | |
| | | |
| Non-current regulatory liabilities | | | |
| | | |
| Unrealized gains on commodity derivatives | 23 | | | 0 | |
| Total non-current regulatory liabilities | 23 | | | 0 | |
| Total regulatory liabilities | $ | 164 | | | $ | 150 | |
Note
(1) At September 30, 2019, $12 million previously classified as Environmental agreements (a component of Regulatory assets) has been reclassified to Other non-current regulatory assets (a component of Regulatory assets) to conform with current year presentation.
In 2017, the TVA Board authorized management to accelerate amortization of certain regulatory assets to the extent actual net income in 2018 exceeded the budgeted amount, up to the aggregate amount of those certain regulatory assets. Assets included in this TVA Board action include: deferred nuclear generating units, environmental cleanup costs related to the Kingston ash spill, and nuclear training costs related to the refurbishing and restarting of Browns Ferry Nuclear Plant ("Browns Ferry") Unit 1 and the construction of Watts Bar Nuclear Plant ("Watts Bar") Unit 2. TVA recorded $857 million of accelerated amortization of the Deferred nuclear generating units and Nuclear training costs regulatory assets in 2018. The TVA Board authorized TVA to use the amount included in the 2019 rate action for these two regulatory assets, to the extent needed, to accelerate amortization of the Environmental cleanup costs - Kingston ash spill regulatory asset in 2019. TVA recorded $266 million of accelerated recovery for the Kingston ash spill regulatory asset in 2019. No accelerated amortization was recorded in 2020. | | | | | | | | | | | |
Regulatory Assets and Liabilities At September 30 (in millions) |
| | 2023 | | 2022 |
| Current regulatory assets | | | |
| Unrealized losses on interest rate derivatives | $ | 31 | | | $ | 47 | |
| Unrealized losses on commodity derivatives | 136 | | | 14 | |
| | | |
| | | |
| | | |
| | | |
| Fuel cost adjustment receivable | 11 | | | 77 | |
| | | |
| Total current regulatory assets | 178 | | | 138 | |
| | | |
| Non-current regulatory assets | | | |
| Retirement benefit plans deferred costs | 1,440 | | | 1,839 | |
| Non-nuclear decommissioning costs | 2,922 | | | 2,856 | |
| Unrealized losses on interest rate derivatives | 272 | | | 479 | |
| Nuclear decommissioning costs | 728 | | | 821 | |
| Unrealized losses on commodity derivatives | 52 | | | 1 | |
| | | |
| | | |
| | | |
| | | |
| Other non-current regulatory assets | 152 | | | 138 | |
| Total non-current regulatory assets | 5,566 | | | 6,134 | |
| Total regulatory assets | $ | 5,744 | | | $ | 6,272 | |
| | | |
| Current regulatory liabilities | | | |
| Fuel cost adjustment tax equivalents | $ | 201 | | | $ | 218 | |
| | | |
| Unrealized gains on commodity derivatives | 21 | | | 173 | |
| Total current regulatory liabilities | 222 | | | 391 | |
| | | |
| Non-current regulatory liabilities | | | |
| Retirement benefit plans deferred credits | 95 | | | 70 | |
| Unrealized gains on commodity derivatives | 12 | | | 102 | |
| Total non-current regulatory liabilities | 107 | | | 172 | |
| Total regulatory liabilities | $ | 329 | | | $ | 563 | |
Retirement Benefit Plans Deferred Pension Costsand Other Post-retirement Benefit Costs (Credits). TVA measures the funded status of its pension and post-retirement ("OPEB") benefit plans at each year-end balance sheet date. The funded status is measured as the difference between the fair value of plan assets and the benefit obligations at the measurement date for each plan. The changes in funded status are actuarial gains and losses that are recognized on TVA's Consolidated Balance Sheets by adjusting the recognized pension and OPEB liabilities, with the offset deferred as a regulatory asset or a regulatory liability. In an unregulated
environment, these deferred costs (credits) would be recognized as an increase or decrease to accumulated other comprehensive income (loss) ("AOCI").
"Incurred cost" is a cost arising from cash paid out or an obligation to pay for an acquired asset or service, and a loss from any cause that has been sustained and for which payment has been or must be made. In the cases of pension and OPEB costs, the unfunded obligation represents a projected liability to the employee for services rendered, and thus it meets the definition of an incurred cost. Therefore, amounts that otherwise would be charged to AOCI for these costs are recorded as a regulatory asset or liability since TVA has historically recovered pension and OPEB expense in rates. Through historical and current year expense included in ratemaking, the TVA Board has demonstrated the ability and intent to include pension and OPEB costs in allowable costs and in rates for ratemaking purposes. As a result, it is probable that future revenue will result from inclusion of the pension and OPEB regulatory assets or regulatory liability in allowable costs for ratemaking purposes.
The regulatory asset and liability are classified as long-term, which is consistent with the pension and OPEB liabilities, and are not amortized to the consolidated statementsConsolidated Statements of operationsOperations over a specified recovery period. They are adjusted either upward or downward each year in conjunction with the adjustments to the unfunded pension liability and OPEB liability, as calculated by the actuaries. Ultimately the regulatory asset and liability will be recognized in the consolidated statementsConsolidated Statements of operationsOperations in the form of pension and OPEB expense as the actuarial liabilities are eliminated in future periods. See Note 2120 — Benefit Plans — Obligations and Funded Status.
Additionally on October 1, 2014, TVA began recognizing pension costs as a regulatory asset to the extent that the amount calculated under GAAP as pension expense differs from the amount TVA contributes to the pension plan. As a result of recentprevious plan design changes, future contributions are expected to exceed the expense calculated under U.S. GAAP. Accordingly, TVA will discontinuediscontinued this regulatory accounting practice onceas all such deferred costs have beenwere recovered at which time it will recognize pension costs in accordance with U.S. GAAP.as of September 30, 2023.
Non-Nuclear Decommissioning Costs. Non-nuclear decommissioning costs include:include (1) certain deferred charges related to the future closure and decommissioning of TVA's non-nuclear long-lived assets, (2) recognition of changes in the liability, (3) recognition of changes in the value of TVA's ART, and (4) certain other deferred charges under the accounting rules for AROs.asset retirement obligations ("AROs"). TVA has established the ART to more effectively segregate, manage, and invest funds to help meet future non-nuclear AROs. The funds from the ART may be used, among other things, to pay the costs related to the future closure and retirement of non-nuclear long-lived assets under various legal requirements. These future costs can be funded through a combination of investment funds already set aside in the ART, future earnings on those investment funds, and future cash contributions to the ARTART. In 2023 and future earnings thereon. For 2020,2022, TVA recovered in rates a portionan amount determined by the average life of its estimated current yeardebt financed for non-nuclear decommissioning costsexpenditures, assuming a 20-year debt service period, and contributions to the ART. Deferred charges will be recovered in rates based on an analysis of the expected expenditures, contributions, and investment earnings required to recover the decommissioning costs. ThereRecovery of future decommissioning costs is not a specified recovery period; therefore,dependent upon the future earnings of the ART, timing of decommissioning activities, and changes in decommissioning estimates. The regulatory asset is classified as long-term consistent withas amounts recovered are used to service debt or to contribute to the ART, investments and ARO liability.which is restricted for future decommissioning costs.
Unrealized Losses on Interest Rate Derivatives. TVA uses regulatory accounting treatment to defer the unrealized gains and losses on certain interest rate derivative contracts. When amounts in these contracts are realized, the resulting gains or losses are included in the ratemaking formula. The unrealized losses on these interest rate derivatives are recorded on TVA's Consolidated Balance Sheets as current and non-current regulatory assets, and the related realized gains or losses, if any, are recorded on TVA's Consolidated Statements of Operations when the contracts settle. A portion of certain unrealized gains and losses will be amortized into earnings over the remaining lives of the contracts. Gains and losses on interest rate derivatives that are expected to be realized within the next year are included as a current regulatory asset or liability on TVA's Consolidated Balance Sheet.Sheets.
Due to changingrising interest rates in the financial markets associated with the COVID-19 pandemic,and net settlement payments made during 2023, TVA has experienced a reduction in unrealized losses related to its derivative instruments for the year ended September 30, 2020.2023. TVA does not recognize unrealized gains and losses from the investment portfolios and derivative instruments within earnings but rather defers all such gains and losses within a regulatory liability or asset in accordance with its accounting policy. See Note 15 — Risk Management Activities and Derivative Transactions and Note 16 — Fair Value Measurements.
Nuclear Decommissioning Costs. Nuclear decommissioning costs include:include (1) certain deferred charges related to the future closure and decommissioning of TVA's nuclear generating units under the Nuclear Regulatory Commission ("NRC") requirements, (2) recognition of changes in the liability, (3) recognition of changes in the value of TVA's NDT, and (4) certain other deferred charges under the accounting rules for AROs. These future costs can be funded through a combination of investment funds set aside in the NDT and ART and future earnings on thethose investment funds, and future earnings thereon.funds. Deferred charges will be recovered in rates based on the analysis of expected expenditures, contributions, and investment earnings required to recover the decommissioning costs. See Note 1 — Summary of Significant Accounting Policies — Investment Funds. ThereRecovery of future decommissioning costs is not a specified recovery period; therefore,dependent upon the future earnings of the NDT and ART, timing of decommissioning activities, and changes in decommissioning estimates. The regulatory asset is classified as long-term consistent withas amounts recovered are contributed to the NDT investmentsor the ART, which are restricted for future decommissioning costs.
Nuclear decommissioning costs decreased $93 million for the year ended September 30, 2023 as compared to the same period of the prior year, primarily due to investment gains in the NDT and ARO liability.amortization of regulatory assets into expenses
during 2023 as amounts were collected in rates, and these increases were partially offset by accretion of the related AROs. See Note 13 — Asset Retirement Obligations and Note 16 — Fair Value Measurements.
Unrealized Gains (Losses) on Commodity Derivatives. TVA enters into certain derivative contracts for natural gas that require the physical delivery of the contracted quantity of the commodity. Unrealized gains (losses) on natural gas purchase contracts, included as part of unrealized gains (losses) on commodity derivatives, relate to the mark-to-market ("MtM") valuation of natural
gas purchase contracts. During the fourth quarter of 2020, TVA discontinued derivative accounting for forward coal contracts because these contracts no longer meet the criteria of net settlement. As a result, the associated net regulatory assets have been derecognized. The natural gas purchase contracts qualify as derivative contracts but do not qualify for cash flow hedge accounting treatment. As a result, TVA recognizes the changes in the market value of these derivative contracts as a regulatory liability or asset. This treatment reflects TVA's ability and intent to recover the cost of these commodity contracts on a settlement basis for ratemaking purposes through the fuel cost adjustment. TVA recognizes the actual cost of fuel received under these contracts in fuel expense at the time the fuel is used to generate electricity. These contracts expire at various times through 2024.March 2026. Unrealized gains and losses on contracts with a maturity of less than one year are included as a current regulatory asset or liability on TVA's Consolidated Balance Sheets. See Note 15 — Risk Management Activities and Derivative Transactions.
TVA reinstated the FHP in December 2021, and hedging activity began under the program in the second quarter of 2022. Currently, TVA is hedging exposure to the price of natural gas under the FHP. Deferred gains and losses relating to TVA's FHP are included as part of unrealized gains and losses on commodity derivatives. TVA defers all MtM unrealized gains or losses as regulatory liabilities or assets, respectively, and records the realized gains or losses in fuel and purchased power expense as the contracts settle to match the delivery period of the underlying commodity. This accounting treatment reflects TVA's ability and intent to include the realized gains or losses of these commodity contracts in future periods through the fuel cost adjustment. Net unrealized gains and losses for any settlements that occur within 12 months or less are classified as a current regulatory liability or asset. See Note 15 — Risk Management Activities and Derivative Transactions.
Fuel Cost Adjustment Receivable. The fuel cost adjustment provides a mechanism to alter rates monthly to reflect changing fuel and purchased power costs. There is typically a lag between the occurrence of a change in fuel and purchased power costs and the reflection of the change in fuel rates. Balances in the fuel cost adjustment regulatory accounts represent over-collected or under-collected revenues that offset fuel and purchased power costs, and the fuel rate is designed to recover or refund the balance in less than one year.
Other Non-Current Regulatory Assets. Other non-current regulatory assets consist of the following:
Deferred Capital LeasesLease Asset and Other Financing Obligations. For certain leases, that were determined prior to TVA's adoption of the new lease accounting standard effective October 1, 2019, TVA recognized the initial capitalfinance lease and other financing asset and liability and asset at inception.inception of the lease or other obligation. However, the annual expense recognized in rates is equal to the annual lease payments, which differs from GAAP treatment.treatment for non-regulated entities. This practice results in TVA's asset balances being higher than they otherwise would have been under GAAP, with the difference representing a regulatory asset related to each capital lease.the lease or other financing obligation. These costs will be amortized over the respective lease or other financing obligation terms as lease payments are made. As the costs associated with this regulatory asset are not currently being considered in rates and the asset is expected to increase over the next year, the regulatory asset has been classified as long-term.
Debt Reacquisition Costs. Reacquisition expenses, call premiums, and other related costs, such as unamortized debt issue costs associated with redeemed Bond issues, are deferred and amortized (accreted) on a straight-line basis over the weighted average life of TVA's debt portfolio. Because timing of additional reacquisition expenses and changes to the weighted average life of the debt are uncertain, the regulatory asset is classified as long-term.
Retirement Removal Costs. Retirement removal costs, net of salvage, that are not legally required are recognized as a regulatory asset. Net removal costs are amortized over a one-year period subsequent to completion of the removal activities. TVA treats this regulatory asset as long-term in its entirety primarily because it relates to assets that are long-term in nature.
Fuel Cost Adjustment Tax Equivalents. The fuel cost adjustment includes a provision related to the current funding of the future payments TVA will make. As TVA records the fuel cost adjustment, five percent of the calculation that relates to a future asset or liability for tax equivalent payments is recorded as a current regulatory liability and paid or refunded in the following year.
10.11. Variable Interest Entities
A VIE is an entity that either (i) has insufficient equity to permit the entity to finance its activities without additional subordinated financial support or (ii) has equity investors who lack the characteristics of owning a controlling financial interest. When TVA determines that it has a variable interest in a VIE, a qualitative evaluation is performed to assess which interest holders have the power to direct the activities that most significantly impact the economic performance of the entity and have the obligation to absorb losses or receive benefits that could be significant to the entity. The evaluation considers the purpose and design of the business, the risks that the business was designed to create and pass along to other entities, the activities of the business that can be directed and which party can direct them, and the expected relative impact of those activities on the economic performance of the business through its life. TVA has the power to direct the activities of an entity when it has the
ability to make key operating and financing decisions, including, but not limited to, capital investment and the issuance of debt. Based on the evaluation of these criteria, TVA has determined it is the primary beneficiary of certain entities and as such is required to account for the VIEs on a consolidated basis.
John Sevier VIEs
In 2012, TVA entered into a $1.0 billion construction management agreement and lease financing arrangement with John Sevier Combined Cycle Generation LLC ("JSCCG") for the completion and lease by TVA of the John Sevier Combined Cycle Facility ("John Sevier CCF"). JSCCG is a special single-purpose limited liability company formed in January 2012 to finance the John Sevier CCF through a $900 million secured note issuance (the "JSCCG notes") and the issuance of $100 million of membership interests subject to mandatory redemption. The membership interests were purchased by John Sevier Holdco LLC ("Holdco"). Holdco is a special single-purpose entity, also formed in January 2012, established to acquire and hold the membership interests in JSCCG. A non-controlling interest in Holdco is held by a third-party through nominal membership interests, to which none of the income, expenses, and cash flows are allocated.
The membership interests held by Holdco in JSCCG were purchased with proceeds from the issuance of $100 million of secured notes (the "Holdco notes") and are subject to mandatory redemption pursuant to a schedule of amortizing, semi-annual payments due each January 15 and July 15, with a final payment due in January 2042. The payment dates for the mandatorily redeemable membership interests are the same as those of the Holdco notes. The sale of the JSCCG notes, the membership interests in JSCCG, and the Holdco notes closed in January 2012. The JSCCG notes are secured by TVA's lease payments, and the Holdco notes are secured by Holdco's investment in, and amounts receivable from, JSCCG. TVA's lease payments to JSCCG are equal to and payable on the same dates as JSCCG's and Holdco's semi-annual debt service payments. In addition to the lease payments, TVA pays administrative and miscellaneous expenses incurred by JSCCG and Holdco. Certain agreements related to this transaction contain default and acceleration provisions.
Due to its participation in the design, business conduct,activity, and credit and financial support of JSCCG and Holdco, TVA
has determined that it has a variable interest in each of these entities. Based on its analysis, TVA has concluded that it is the
primary beneficiary of JSCCG and Holdco and, as such, is required to account for the VIEs on a consolidated basis. Holdco's
membership interests in JSCCG are eliminated in consolidation.
Southaven VIE
In 2013, TVA entered into a $400 million lease financing arrangement with Southaven Combined Cycle Generation LLC ("SCCG") for the lease by TVA of the Southaven Combined Cycle Facility ("Southaven CCF"). SCCG is a special single-purpose limited liability company formed in June 2013 to finance the Southaven CCF through a $360 million secured notes issuance (the "SCCG notes") and the issuance of $40 million of membership interests subject to mandatory redemption. The membership interests were purchased by Southaven Holdco LLC ("SHLLC"). SHLLC is a special single-purpose entity, also formed in June 2013, established to acquire and hold the membership interests in SCCG. A non-controlling interest in SHLLC is held by a third-party through nominal membership interests, to which none of the income, expenses, and cash flows of SHLLC are allocated.
The membership interests held by SHLLC were purchased with proceeds from the issuance of $40 million of secured notes (the "SHLLC notes") and are subject to mandatory redemption pursuant to a schedule of amortizing, semi-annual payments due each February 15 and August 15, with a final payment due on August 15, 2033. The payment dates for the mandatorily redeemable membership interests are the same as those of the SHLLC notes, and the payment amounts are sufficient to provide returns on, as well as returns of, capital until the investment has been repaid to SHLLC in full. The rate of return on investment to SHLLC is 7.0seven percent, which is reflected as interest expense in the consolidated statementsConsolidated Statements of operations.Operations. SHLLC is required to pay a pre-determined portion of the return on investment to Seven States Southaven, LLC ("SSSL") on each lease payment date as agreed in SHLLC's formation documents (the "Seven States Return"). The current and long-term portions of the Membership interests of VIE subject to mandatory redemption are included in Accounts payable and accrued liabilities and Other long-term liabilities, respectively.
The payment dates for the mandatorily redeemable membership interests are the same as those of the SHLLC notes. The SCCG notes are secured by TVA's lease payments, and the SHLLC notes are secured by SHLLC's investment in, and amounts receivable from, SCCG. TVA's lease payments to SCCG are payable on the same dates as SCCG's and SHLLC's semi-annual debt service payments and are equal to the sum of (i) the amount of SCCG's semi-annual debt service payments, (ii) the amount of SHLLC's semi-annual debt service payments, and (iii) the amount of the Seven States Return. In addition to the lease payments, TVA pays administrative and miscellaneous expenses incurred by SCCG and SHLLC. Certain agreements related to this transaction contain default and acceleration provisions.
In the event that TVA were to choose to exercise an early buy out feature of the Southaven facility lease, in part or in whole, TVA must pay to SCCG amounts sufficient for SCCG to repay or partially repay on a pro rata basis the membership interests held by SHLLC, including any outstanding investment amount plus accrued but unpaid return. TVA also has the right, at any time and without any early redemption of the other portions of the Southaven facility lease payments due to SCCG, to fully repay SHLLC's investment, upon which repayment SHLLC will transfer the membership interests to a designee of TVA.
TVA participated in the design, business conduct,activity, and financial support of SCCG and has determined that it has a direct variable interest in SCCG resulting from risk associated with the value of the Southaven CCF at the end of the lease term. Based on its analysis, TVA has determined that it is the primary beneficiary of SCCG and, as such, is required to account for the VIE on a consolidated basis.
Impact on Consolidated Financial Statements
The financial statement items attributable to carrying amounts and classifications of JSCCG, Holdco, and SCCG as of September 30, 20202023 and 2019,2022, as reflected on the Consolidated Balance Sheets, are as follows:
| Summary of Impact of VIEs on Consolidated Balance Sheets At September 30 | |
Summary of Impact of VIEs on Consolidated Balance Sheets At September 30 (in millions) | | Summary of Impact of VIEs on Consolidated Balance Sheets At September 30 (in millions) |
| | | 2020 | | 2019 | | 2023 | | 2022 |
| | Current liabilities | Current liabilities | | | | Current liabilities | | | |
| Accrued interest | Accrued interest | $ | 10 | | | $ | 11 | | Accrued interest | $ | 9 | | | $ | 10 | |
| Accounts payable and accrued liabilities | Accounts payable and accrued liabilities | 3 | | | 3 | | Accounts payable and accrued liabilities | 1 | | | 2 | |
| Current maturities of long-term debt of variable interest entities | Current maturities of long-term debt of variable interest entities | 41 | | | 39 | | Current maturities of long-term debt of variable interest entities | 35 | | | 39 | |
| Total current liabilities | Total current liabilities | 54 | | | 53 | | Total current liabilities | 45 | | | 51 | |
| Other liabilities | Other liabilities | | Other liabilities | |
| Other long-term liabilities | Other long-term liabilities | 23 | | | 25 | | Other long-term liabilities | 17 | | | 18 | |
| Long-term debt, net | Long-term debt, net | | | | Long-term debt, net | | | |
| Long-term debt of variable interest entities, net | Long-term debt of variable interest entities, net | 1,048 | | | 1,089 | | Long-term debt of variable interest entities, net | 933 | | | 968 | |
| Total liabilities | Total liabilities | $ | 1,125 | | | $ | 1,167 | | Total liabilities | $ | 995 | | | $ | 1,037 | |
Interest expense of $54$48 million, $56$50 million, and $58$52 million related to debt of VIEs and membership interests of variable interest entity subject to mandatory redemption is included inon the Consolidated Statements of Operations for the years ended September 30, 2020, 2019,2023, 2022, and 2018,2021, respectively.
At September 30, 2023, TVA had outstanding debt of VIEs of $968 million and outstanding membership interests subject to mandatory redemption (including current portion) of $18 million issued by one of its VIEs of which it is the primary beneficiary. The following table sets forth TVA's future payments at September 30, 2023:
| | | | | | | | | | | | | | | | | | | | | | | | | | | | | | | | | | | | | | |
Maturities Due in the Year Ending September 30 (in millions) |
| | 2024 | | 2025 | | 2026 | | 2027 | | 2028 | | Thereafter |
Long-term debt of VIEs including current maturities(1) | | $ | 35 | | | $ | 37 | | | $ | 39 | | | $ | 40 | | | $ | 42 | | | $ | 781 | |
| Membership interests of variable interest entity subject to mandatory redemption | | 1 | | | 1 | | | 1 | | | 1 | | | 1 | | | 13 | |
| | | | | | | | | | | | |
Note
(1) Long-term debt of VIEs does not include non-cash item of unamortized debt issue costs of $6 million.
Creditors of the VIEs do not have any recourse to the general credit of TVA. TVA does not have any obligations to provide financial support to the VIEs other than as prescribed in the terms of the agreements related to these transactions.
11.
12. Other Long-Term Liabilities
Other long-term liabilities consist primarily of liabilities related to certain derivative agreements as well as for environmental remediation liabilities and liabilities under agreements related to compliance with certain environmental regulations. See Note 12— Asset Retirement Obligations, Note 15 — Risk Management Activities and Derivative Transactions — Derivatives Not Receiving Hedge Accounting Treatment — Interest Rate Derivatives, and Note 22 — Commitments and Contingencies — Legal Proceedings — Environmental Agreements.operating leases. The table below summarizes the types and amounts of Other long-term liabilities:
| Other Long-Term Liabilities(1) At September 30 | |
Other Long-Term Liabilities At September 30 (in millions) | | Other Long-Term Liabilities At September 30 (in millions) |
| | | 2020 | | 2019 | | 2023 | | 2022(1) |
| Interest rate swap liabilities | Interest rate swap liabilities | $ | 1,927 | | | $ | 1,676 | | Interest rate swap liabilities | $ | 627 | | | $ | 851 | |
| | Operating lease liabilities | Operating lease liabilities | 171 | | | 0 | | Operating lease liabilities | 93 | | | 93 | |
| Currency swap liabilities | Currency swap liabilities | 123 | | | 193 | | Currency swap liabilities | 131 | | | 228 | |
| EnergyRight® financing obligation | 78 | | | 90 | | |
| Paradise pipeline financing obligation | 0 | | | 80 | | |
| Accrued long-term service agreements | 56 | | | 66 | | |
| | Commodity contract derivative liabilities | | Commodity contract derivative liabilities | 52 | | | 1 | |
EnergyRight® financing obligation | | EnergyRight® financing obligation | 55 | | | 58 | |
| Long-term deferred compensation | | Long-term deferred compensation | 41 | | | 39 | |
| Advances for construction | | Advances for construction | 56 | | | 53 | |
| Long-term deferred revenue | | Long-term deferred revenue | 45 | | | 39 | |
| | Other | Other | 193 | | | 203 | | Other | 111 | | | 123 | |
| Total other long-term liabilities | Total other long-term liabilities | $ | 2,548 | | | $ | 2,308 | | Total other long-term liabilities | $ | 1,211 | | | $ | 1,485 | |
(1) Due to the implementationAt September 30, 2022, $1 million previously classified as Other (a component of the new lease accounting standard effective October 1, 2019, TVA reclassified $182 million of finance leases from Other long-term liabilities) has been reclassified to Commodity contract derivative liabilities (a component of Other long-term liabilities) to Finance lease liabilities in the Consolidated Balance Sheet for theconform with current year ending September 30, 2019.presentation.
Interest Rate Swap Liabilities. TVA uses interest rate swaps to fix variable short-term debt to a fixed rate. The values of these derivatives are included in Other current assets, Accounts payable and accrued liabilities, Accrued interest, and Other long-term liabilities on the Consolidated Balance Sheets. As of September 30, 2020 and 2019, the carrying amount of the interest rate swap liabilities reported in Accounts payable and accrued liabilities and Accrued interest was approximately $114 million and $88 million, respectively. See Note 15 — Risk Management Activities and Derivative Transactions —Overview of Accounting Treatment and Derivatives Not Receiving Hedge Accounting Treatment — Interest Rate Derivatives for information regarding the interest rate swap liabilities. As
Operating Lease Liabilities. TVA's operating leases consist primarily of railcars, equipment, real estate/land, and power generating facilities. At September 30, 2020, Interest2023 and 2022, the current portion of TVA's operating leases reported in Accounts payable and accrued liabilities was $71 million and $59 million, respectively. See Note 8 — Leases for more information regarding leases.
Currency Swap Liabilities. To protect against exchange rate risk related to British pound sterling denominated Bond transactions, TVA entered into foreign currency hedges. The values of these derivatives are included in Accounts payable and accrued liabilities and Other long-term liabilities on the Consolidated Balance Sheets. See Note 15 — Risk Management Activities and Derivative Transactions — Overview of Accounting Treatment and Cash Flow Hedging Strategy for Currency Swaps for more information regarding the currency swap liabilities increased $277 million as compared to September 30, 2019, primarily due to a decrease in interest rates resulting in higher mark-to-market values on future expected net cash flows.liabilities.
TableCommodity Contract Derivative Liabilities. TVA enters into certain derivative contracts for natural gas that require physical delivery of Contentsthe contracted quantity of the commodity as well as certain financial derivative contracts to hedge exposure to the price of natural gas. See Note 15 — Risk Management Activities and Derivative Transactions — Derivatives Not Receiving Hedge Accounting Treatment — Commodity Derivatives and — Commodity Derivatives under the FHP for a discussion of TVA's commodity contract derivatives.
EnergyRight® Financing Obligation. TVA purchases certain loans receivable from its LPCs in association with the EnergyRight® program. The current and long-term portions of the resulting financing obligation are reported in Accounts payable and accrued liabilities and Other long-term liabilities, respectively, on TVA's Consolidated Balance Sheets. As ofAt both September 30, 20202023 and 2019,2022, the carrying amount of the financing obligation reported in Accounts payable and accrued liabilities was approximately $19 million and $23 million, respectively.$14 million. See Note 89 — Other Long-Term Assets for information regarding the associated loans receivable.
In responseLong-Term Deferred Compensation. TVA provides compensation arrangements to engage and retain certain employees, both executive and non-executive, which are designed to provide participants with the COVID-19 pandemic, customers experiencing financial hardship can request a deferral of EnergyRight® loan payments for a period of upability to six months. This deferral option began April 20, 2020, and is available through October 31, 2020. Deferred loans will not accrue interest during the deferral months. These deferred loans have resulted in a less than $1 million impactdefer compensation to TVA.
Paradise Pipeline Financing Obligation. TVA reserves firm pipeline capacity on an approximately 19-mile pipeline
owned by Texas Gas, which serves TVA's Paradise Combined Cycle Facility. TVA had been accounting for the contract covering this arrangement as a financing transaction due to failed sale-leaseback treatment. The contract was revised during the fourth quarter of 2020 and is no longer deemed to contain a lease component. Accordingly, amounts related to the pipeline asset and financing obligation recorded in connection with this transaction were derecognized as of September 30, 2020.future periods. The current and long-term portions of less than $1 million and $80 million, respectively, of the financing obligation are reportedrecorded in Accounts payable and accrued liabilities and Other long-term liabilities, respectively, on TVA'sTVA’s Consolidated Balance Sheet atSheets. At September 30, 2019.2023 and 2022, the current amount of deferred compensation recorded in Accounts payable and accrued liabilities was $65 million and $53 million, respectively.
Accrued Long-Term Service Agreement. Advances for Construction.TVA has entered into variousreceives refundable and non-refundable advances for construction that are generally intended to defray all or a portion of the costs of building or extending TVA’s existing power assets. Amounts received are deferred as a liability with the long-term service agreements for majorportion representing amounts that will not be recognized within the next 12 months. As projects meet milestones or other contractual obligations, the refundable portion is refunded to the customer and the non-
maintenance activities at certain
refundable portion is recognized as contributions in aid of construction and offsets the direct expense methodcost of accountingplant assets. At September 30, 2023 and 2022, the current amount of advances for theseconstruction recorded in Accounts payable and accrued liabilities was $39 million and $33 million, respectively.
arrangements. TVA accrues for parts when it takes ownership and for contractor services when they are rendered. Under
certain of these agreements, partsLong-Term Deferred Revenue. Long-term deferred revenue represents payments received andthat exceed services rendered exceed payments made.resulting in the deferral of revenue. This long-term portion represents amounts that will not be recognized within the next 12 months primarily related to fiber and transmission agreements. The current and long-term portions
of the resulting obligationdeferral are reportedrecorded in Accounts payable and accrued liabilities and Other long-term liabilities, respectively, on
TVA's TVA’s Consolidated Balance Sheets. As ofAt September 30, 20202023 and 2019, related liabilities2022, the current amount of $15 million and $12 million, respectively, weredeferred revenue recorded in Accounts payable and accrued liabilities.liabilities was $21 million and $16 million, respectively.
12.13. Asset Retirement Obligations
During the year ended September 30, 2020,2023, TVA's total ARO liability increased $1.2 billion.$327 million.
To estimate its decommissioning obligation related to its nuclear generating stations, TVA uses a probability-weighted, discounted cash flow model which, on a unit-by-unit basis, considers multiple outcome scenarios that include significant estimations and assumptions. Those assumptions include (1) estimates of the cost of decommissioning; (2) the method of decommissioning and the timing of the related cash flows; (3) the license period of the nuclear plant, considering the probability of license extensions; (4) cost escalation factors; and (5) the credit adjusted risk free rate to measure the obligation at the present value of the future estimated costs. TVA has ascribed probabilities to two different decommissioning methods related to its nuclear decommissioning obligation estimate: the DECON method and the SAFSTOR method. The DECON method requires radioactive contamination to be removed from a site and safely disposed of or decontaminated to a level that permits the site to be released for unrestricted use shortly after it ceases operation. The SAFSTOR method allows nuclear facilities to be placed and maintained in a condition that allows the facilities to be safely stored and subsequently decontaminated to levels that permit release for unrestricted use.
TVA bases its nuclear decommissioning estimates on site-specific cost studies. The most recent study was approved and implemented in September 2017. An increase of $250 million was recorded to the nuclear AROs as a result of the updates. Site-specific cost studies are updated for each of TVA's nuclear units at least every five years.
TVA also has decommissioning obligations related to its non-nuclear generating sites, ash impoundments, transmission substation and distribution assets, and certain general facilities. To estimate its decommissioning obligation related to these assets, TVA uses estimations and assumptions for the amounts and timing of future expenditures and makes judgments concerning whether or not such costs are considered a legal obligation. Those assumptions include (1) estimates of the costs of decommissioning, (2) the method of decommissioning and the timing of the related cash flows, (3) the expected retirement date of each asset, (4) cost escalation factors, and (5) the credit adjusted risk free rate to measure the obligation at the present value of the future estimated costs. TVA bases its decommissioning estimates for each asset on its identified preferred closure method.
During 2020, theThe revisions in non-nuclear estimatesestimates increased $1.1 billionthe liability balance by $362 million for the year ended September 30, 2020. In November 2019,2023. During the Tennessee Department of Environmentyear coal combustion residuals ("CCR") closure liabilities at Bull Run, Johnsonville, and Conservation ("TDEC") released amendmentsCumberland increased $458 million due to its regulations which govern solid waste disposal facilities, includingrevised cost estimates for final closure activities based on TVA's active CCR facilities covered by a solid waste disposal permit and those which closed pursuant to a TDECcurrent approved closure plan. Such facilities are generally subject to a 30-yearstrategies at these sites. Partially offsetting these increases, expected reductions in CCR post-closure care period during which the owner or operator must undertake certain activities, includingcosts for long-term monitoring and maintaining the facility. The amendments, among other things, add an additional 50-year period after the end of the post-closure care period, require TVA to submit recommendations as to what activities must be performed during this 50-year period to protect human health and
the environment, and require TVA to submit revised closure plans every 10 years. This regulatory revisionat Gallatin resulted in an increasea decrease of $129$60 million. In addition, CCR closure liabilities at Cumberland decreased $15 million due to identified changes in the projected timing of which $38certain asset retirement activities, and CCR closure liabilities at Paradise decreased $9 million was related to operating CCR facilities and $91 million was related to inactive or closed CCR facilities. In June 2020, based on recentrefined project cost data andestimates.
The revisions in non-nuclear estimates TVA revised its AROsincreased $186 million for closure-by-removal of certain CCR facilities at Allen Fossil Plant, resulting in an increase to AROs of $273 million. Inthe year ended September 2020,30, 2022. During the year, TVA completed an engineering review of its cost estimates to close the ash pond complexfor closure of certain areas containing coal fines at GallatinParadise Fossil Plant resulting("Paradise"), which resulted in an increase of $173$119 million due to expected cost increases for excavation, disposal,necessary changes in activities associated with proper completion of the closure. CCR closure liabilities at Paradise and other activities requiredCumberland increased $82 million due to new vendor bids, modified closure designs, and revised estimates for construction costs. Refined project cost assumptions and scope changes related to TVA's AROs for the closure of certain coal yards at its fossil plants resulted in an increase of $57 million. In addition, effective October 1, 2022, TVA implemented revised depreciation rates applicable to its completed plant due to the results of a new depreciation study. The study included a decline in the service life estimates of TVA's coal-fired plants based on current planning assumptions to potentially retire the remainder of the coal-fired fleet by 2035. As a result of the change in service life estimates reflected in the depreciation study, TVA performed an assessment of the assumptions used in the timing of cash flows related to its non-nuclear AROs. Based on the assessment, TVA increased AROs by $47 million due to identified changes in the projections of timing of certain asset retirement activities. Partially offsetting these increases, expected reductions in CCR post-closure costs for maintenance and monitoring at Paradise, Shawnee, and Colbert Fossil Plant ("Colbert") resulted in a closure-by-removal project. Also in September 2020, TVA completed a studydecrease of its plant decommissioning obligations and$53 million. CCR post-closure care and monitoring obligations. TVA increased its plant decommissioning obligations by $19closure liabilities at Gallatin decreased $30 million primarily due to asbestosselection of a new vendor bid and hazardous material abatement costs. TVA increased itschanges to anticipated timing of certain asset retirement activities. In addition, CCR post-closure care and monitoring AROs primarilyclosure liabilities at Allen Fossil Plant decreased $15 million as a result of expectedchanges in cost increases to monitor groundwaterestimates and maintain CCR areas after closure as well as increases in expected acreage to maintain after closure, totaling $460 million.anticipated timing of various retirement activities.
During 2019, theThe revisions in non-nuclearnuclear estimates increased $50the liability balance by $61 million for the year ended September 30, 2019. As a result2022. This was primarily due to approval and implementation of the most recent experiencesite-specific cost study in completing settlements at certain facilities, costs for asbestos abatement activities across TVA's fossil fleet increased $114 million. TVA changed the preferred closure method for Allen West Impoundment from closure-in-place to closure-by-removal, which resultedSeptember 2022 resulting in a costan increase of $33$58 million. Partially offsetting these increases was a $57 million decrease in costs for Paradise closure projects, and a $44 million decrease in costs for the Allen East Impoundment closure project. Additionally, as a result
Additionally, during the years ended September 30, 20202023 and 2019,2022, both the nuclear and non-nuclear liabilities were increased by periodic accretion, partially offset by settlement projects that were conducted during these periods. The nuclear and non-nuclear accretion amounts were deferred as regulatory assets. During 2020, 2019,2023, 2022, and 2018, $1692021, $188 million, $144$137 million, and $144$72 million, respectively, of the related regulatory assets were amortized into expense as these amounts were collected in rates. See Note 910 — Regulatory Assets and Liabilities. TVA maintains investment trusts to help fund its decommissioning obligations. See Note 16 — Fair Value Measurements — Investment Funds and Note 22 — Commitments and Contingencies — Contingencies — Decommissioning Costs for a discussion of the trusts' objectives and the current balances of the trusts.
| | Asset Retirement Obligation Activity | |
Asset Retirement Obligation Activity (in millions) | | Asset Retirement Obligation Activity (in millions) |
| | | Nuclear | | Non-Nuclear | | Total | | | Nuclear | | Non-Nuclear | | Total | |
| Balance at September 30, 2018 | $ | 2,989 | | | $ | 1,790 | | | $ | 4,779 | | | |
| | Balance at September 30, 2021 | | Balance at September 30, 2021 | $ | 3,428 | | | $ | 3,574 | | | $ | 7,002 | | |
| Settlements | Settlements | (7) | | | (82) | | | (89) | | | Settlements | (2) | | | (309) | | | (311) | | |
| Revisions in estimate | Revisions in estimate | 0 | | | 50 | | | 50 | | | Revisions in estimate | 61 | | | 186 | | | 247 | | |
| | Additional obligations | 18 | | | 0 | | | 18 | | | |
| Gallatin CCR | 0 | | | 672 | | | 672 | | | |
| Accretion (recorded as regulatory asset) | Accretion (recorded as regulatory asset) | 136 | | | 50 | | | 186 | | | Accretion (recorded as regulatory asset) | 156 | | | 68 | | | 224 | | |
| | Balance at September 30, 2019 | 3,136 | | | 2,480 | | | 5,616 | | (1) | |
| Balance at September 30, 2022 | | Balance at September 30, 2022 | 3,643 | | | 3,519 | | | 7,162 | | (1) |
| | Settlements | Settlements | (1) | | | (113) | | | (114) | | | Settlements | (8) | | | (271) | | | (279) | | |
| Revisions in estimate | Revisions in estimate | 0 | | | 1,077 | | | 1,077 | | | Revisions in estimate | 7 | | | 362 | | | 369 | | |
| | Accretion (recorded as regulatory asset) | Accretion (recorded as regulatory asset) | 143 | | | 63 | | | 206 | | | Accretion (recorded as regulatory asset) | 166 | | | 71 | | | 237 | | |
| | Balance at September 30, 2020 | $ | 3,278 | | | $ | 3,507 | | | $ | 6,785 | | (1) | |
| Balance at September 30, 2023 | | Balance at September 30, 2023 | $ | 3,808 | | | $ | 3,681 | | | $ | 7,489 | | (1) |
Note
(1) Includes $345$272 million and $163and $275 million at September 30, 20202023 and 2019,2022, respectively, in Current liabilities.
13.14. Debt and Other Obligations
General
The TVA Act authorizes TVA to issue Bonds in an amount not to exceed $30.0 billion at any time. At September 30, 2020,2023, TVA had only two types of Bonds outstanding: power bonds and discount notes. Power bonds have maturities between one year and 50 years, and discount notes have maturities of less than one year. Power bonds and discount notes are both issued pursuant to Section 15d of the TVA Act and pursuant to the Basic Tennessee Valley Authority Power Bond Resolution adopted by the TVA Board on October 6, 1960, as amended on September 28, 1976, October 17, 1989, and March 25, 1992 (the "Basic Resolution"). Bonds are not obligations of the U.S., and the U.S. does not guarantee the payments of principal or interest on Bonds.
Power bonds and discount notes rank on parity and have first priority of payment from net power proceeds, which are defined as the remainder of TVA's gross power revenues after deducting the costs of operating, maintaining, and administering its power properties and tax equivalent payments, but before deducting depreciation accruals or other charges representing the amortization of capital expenditures, plus the net proceeds from the sale or other disposition of any power facility or interest therein.
TVA considers its scheduled rent payments under its leaseback transactions, as well as its scheduled payments under its lease financing arrangements involving John Sevier CCF and Southaven CCF as costs of operating, maintaining, and administering its power properties. Costs of operating, maintaining, and administering TVA's power properties have priority over TVA's payments on the Bonds. Once net power proceeds have been applied to payments on power bonds and discount notes as well as any other Bonds that TVA may issue in the future that rank on parity with or subordinate to power bonds and discount notes, Section 2.3 of the Basic Resolution provides that the remaining net power proceeds shall be used only for (1) minimum payments into the U.S. Treasury required by the TVA Act as repayment of, and as a return on, the Power Program Appropriation Investment; (2) investment in power system assets; (3) additional reductions of TVA's capital obligations; and (4) other lawful purposes related to TVA's power business.
The TVA Act and the Basic Resolution each contain two bond tests: the rate test and the bondholder protection test. Under the rate test, TVA must charge rates for power which will produce gross revenues sufficient to provide funds for, among other things, debt service on outstanding Bonds. As of September 30, 2020,2023, TVA was in compliance with the rate test. See Note 1 — Summary of Significant Accounting Policies — General. Under the bondholder protection test, TVA must, in successive five-year periods, use an amount of net power proceeds at least equal to the sum of (1) the depreciation accruals and other charges representing the amortization of capital expenditures and (2) the net proceeds from any disposition of power facilities for either the reduction of its capital obligations (including Bonds and the Power Program Appropriation Investment) or investment in power assets. TVA met the bondholder protection test for the five-year period ended September 30, 2020, and must next meet the bondholder protection test for the five-year period ending September 30, 2025.
Secured Debt of VIEs
On August 9, 2013, SCCG issued secured notes totaling $360 million that bear interest at a rate of 3.846 percent. The SCCG notes require amortizing semi-annual payments on each February 15 and August 15, and mature on August 15, 2033. Also on August 9, 2013, SCCG issued $40 million of membership interests subject to mandatory redemption. The proceeds from the secured notes issuance and the issuance of the membership interests were paid to TVA in accordance with the terms of the Southaven head lease. See Note 1011 — Variable Interest Entities — Southaven VIE. TVA used the proceeds from the transaction primarily to fund the acquisition of the Southaven CCF from SSSL.
On January 17, 2012, JSCCG issued secured notes totaling $900 million in aggregate principal amount that bear interest at a rate of 4.626 percent. Also on January 17, 2012, Holdco issued secured notes totaling $100 million that bear interest at a rate of 7.1 percent. The JSCCG notes and the Holdco notes require amortizing semi-annual payments on each January 15 and July 15, and mature on January 15, 2042. The Holdco notes require a $10 million balloon payment upon maturity. See Note 1011 — Variable Interest Entities — John Sevier VIEs. TVA used the proceeds from the transaction to meet its requirements under the TVA Act.
Secured debt of VIEs, including current maturities, outstanding at both September 30, 20202023 and 20192022 totaled $1.1 billion.$968 million and $1.0 billion, respectively.
Secured Notes
On July 20, 2016, TVA acquired two entities, in a business combination, designed to administer rent payments TVA makes under certain of its lease/leaseback arrangements. On September 27, 2000, the entities issued secured notes totaling $255 million that had an interest rate of 7.299 percent and required amortizing semi-annual payments on each March 15 and September 15 with a maturity date of March 15, 2019. In 2016, TVA assumed these secured notes in the acquisition at a fair value of $78 million. The secured notes of the entities were paid in full in 2019.
On September 20, 2017, TVA acquired two entities, in an asset acquisition, designed to administer rent payments TVA makes under certain of its lease/leaseback arrangements. On November 14, 2001, the entities issued secured notes totaling $272 million that had an interest rate of 5.572 percent and required amortizing semi-annual payments on each May 1 and November 1 with a maturity date of May 1, 2020. In 2017, TVA assumed these secured notes in the acquisition at a fair value of $74 million. The secured notes of the entities, including current maturities, outstanding at September 30, 2019, totaled approximately $23 million, and are included in Notes payable on TVA's Consolidated Balance Sheet. The secured notes of the entities were paid in full in 2020.
Short-Term Debt
The following table provides information regarding TVA's short-term borrowings:
| | | | | | | | | | | | | | | | | |
Short-term Borrowings At September 30 |
| | 2020 | | 2019 | | 2018 |
| Gross amount outstanding - discount notes | $ | 57 | | | $ | 922 | | | $ | 1,217 | |
| | | | | |
| Weighted average interest rate - discount notes | 0.06 | % | | 2.15 | % | | 2.05 | % |
| | | | | | | | | | | |
Short-Term Borrowings At September 30 |
| | 2023 | | 2022 |
| Gross amount outstanding - discount notes (in millions) | $ | 432 | | | $ | 1,173 | |
| | | |
| Weighted average interest rate - discount notes | 5.29 | % | | 2.93 | % |
Put and Call Options
At September 30, 2019, bond issues of $357 million held by the public were redeemable in whole or in part, at TVA's option, on call dates through 2020 and at call prices of 100 percent of the principal amount. Nine of these bond issues totaling $217 million, with maturity dates ranging from 2025 to 2043, included a "survivor's option," which allowed for right of redemption upon the death of a beneficial owner in certain specified circumstances. These bonds were classified as long-term at September 30, 2019. TVA subsequently announced in October 2019 that $217 million of callable bonds were redeemed at par on November 15, 2019.
Additionally, TVA has two issues of Putable Automatic Rate Reset Securities ("PARRS") outstanding. After a fixed-rate period of five years, the coupon rate on the PARRS may automatically be reset downward under certain market conditions on an annual basis. The coupon rate reset on the PARRS is based on a calculation. For both series of PARRS, the coupon rate will reset downward on the reset date if the rate calculated is below the then-current coupon rate on the Bond. The calculation dates, potential reset dates, and terms of the calculation are different for each series. The coupon rate on the 1998 Series D PARRS may be reset on June 1 (annually) if the sum of the five-day average of the 30-Year Constant Maturity Treasury ("CMT") rate for the week ending the last Friday in April, plus 94 basis points, is below the then-current coupon rate. The coupon rate on the 1999 Series A PARRS may be reset on May 1 (annually) if the sum of the five-day average of the 30-Year CMT rate for the week ending the last Friday in March, plus 84 basis points, is below the then-current coupon rate. The coupon rates may only be reset downward, but investors may request to redeem their Bonds at par value in conjunction with a coupon rate reset for a limited period of time prior to the reset dates under certain circumstances.
The coupon rate for the 1998 Series D PARRS, which mature in June 2028, has been reset eight times, from an initial rate of 6.750 percent to the current rate of 2.134 percent. In connection with these resets, $318 million of the Bonds have been redeemed; therefore, $256 million of the Bonds were outstanding at September 30, 2020.2023. The coupon rate for the 1999 Series A PARRS, which mature in May 2029, has been reset seven times, from an initial rate of 6.50 percent to the current rate of 2.216 percent. In connection with these resets, $316 million of the Bonds have been redeemed; therefore, $208 million of the Bonds were outstanding at September 30, 2020.2023.
Due to the contingent nature of the put option on the PARRS, TVA determines whether the PARRS should be classified as long-term debt or current maturities of long-term debt by calculating the expected reset rate for the Bonds on the calculation dates, described above. If the determination date for reset is before the balance sheet date of the reporting period and the expected reset rate is less than the then-current coupon rate on the PARRS, the PARRS are included in current maturities. Otherwise, the PARRS are included in long-term debt.
Debt Securities Activity
The table below summarizes the long-term debt securities activity for the years ended September 30, 20202023 and 2019.2022.
| | | | | | | | | | | | | | |
Debt Securities Activity For the years ended September 30 |
| | | 2020 | | 2019 |
| Issues | | | | |
| | | | |
| | | | |
| | | | |
| | | | |
| | | | |
| | | | |
| | | | |
2020 Series A(1) | | $ | 1,000 | | | $ | 0 | |
| Discount on debt issues | | (3) | | | 0 | |
| Total | | $ | 997 | | | $ | 0 | |
| | | | |
| | | | |
| | | | |
| | | | |
| | | | |
Redemptions/Maturities(2) | | | | |
electronotes® | | $ | 219 | | | $ | 5 | |
| 2013 Series A | | | | 1,000 | |
| 2009 Series B | | 28 | | | 30 | |
| 2018 Series A | | 1,000 | | | 0 | |
| 1999 Series A PARRS (TVE) | | 23 | | | 0 | |
| 1998 Series D PARRS (TVC) | | 17 | | | 0 | |
| 1995 Series B | | 140 | | | 0 | |
| Total redemptions/maturities of power bonds | | 1,427 | | | 1,035 | |
| Notes payable | | 23 | | | 46 | |
| Variable interest entities | | 39 | | | 38 | |
| Total | | $ | 1,489 | | | $ | 1,119 | |
| | | | | | | | | | | | | | |
Debt Securities Activity For the years ended September 30 (in millions) |
| | | 2023 | | 2022 |
| Issues | | | | |
| | | | |
| | | | |
| | | | |
| | | | |
| | | | |
| | | | |
| | | | |
2022 Series A(1) | | $ | — | | | $ | 500 | |
2023 Series A(2) | | 1,000 | | | — | |
| Discount on debt issues | | (8) | | | (16) | |
| Total | | $ | 992 | | | $ | 484 | |
| | | | |
| | | | |
| | | | |
| | | | |
| | | | |
Redemptions/Maturities(3) | | | | |
| | | | |
| | | | |
| | | | |
| | | | |
| | | | |
| | | | |
| 2009 Series B | | $ | 29 | | | $ | 28 | |
| 2012 Series A | | — | | | 1,000 | |
| | | | |
| Total redemptions/maturities of power bonds | | 29 | | | 1,028 | |
| | | | |
| Debt of variable interest entities | | 39 | | | 43 | |
| Total redemptions/maturities of debt | | $ | 68 | | | $ | 1,071 | |
Notes
(1) The 20202022 Series A Bonds were issued at 99.796.786 percent of par.
(2) The 2023 Series A Bonds were issued at 99.187 percent of par.
(3) All redemptions were at 100 percent of par.
Debt Outstanding
Total debt outstanding at September 30, 20202023 and 2019,2022, consisted of the following:
| Short-Term Debt
At September 30 | |
Short-Term Debt At September 30 (in millions) | | Short-Term Debt At September 30 (in millions) |
CUSIP or Other Identifier | CUSIP or Other Identifier | | Maturity | | Call/(Put) Date | |
Coupon Rate | | 2020 | | 2019 | CUSIP or Other Identifier | | Maturity | | |
Coupon Rate | | 2023 | | 2022 |
| Short-term debt, net of discounts | Short-term debt, net of discounts | | | | | | | | $ | 57 | | | $ | 922 | | Short-term debt, net of discounts | | | | | | | $ | 432 | | | $ | 1,172 | |
| Current maturities of long-term debt of VIEs issued at par | Current maturities of long-term debt of VIEs issued at par | | 41 | | | 39 | | Current maturities of long-term debt of VIEs issued at par | | | | 35 | | | 39 | |
| Current maturities of notes payable | | 0 | | | 23 | | |
| | Current maturities of power bonds issued at par | Current maturities of power bonds issued at par | | Current maturities of power bonds issued at par | | | |
| | | 880591EF5 | 880591EF5 | | 12/15/2019 | | 3.770% | | 0 | | | 1 | | 880591EF5 | | 12/15/2023 | | | 3.770% | | 1 | | | 1 | |
| 880591EF5 | 880591EF5 | | 6/15/2020 | | 3.770% | | 0 | | | 27 | | 880591EF5 | | 6/15/2024 | | | 3.770% | | 21 | | | 28 | |
| 880591EF5 | | 12/15/2020 | | 3.770% | | 1 | | | 0 | | |
| 880591EF5 | | 6/15/2021 | | 3.770% | | 28 | | | 0 | | |
| 88059TEL1 | | 11/15/2019 | | 2.650% | | 0 | | | 1 | | |
| 88059TEL1 | | 5/15/2020 | | 2.650% | | 0 | | | 1 | | |
| 880591ER9 | | 880591ER9 | | 9/15/2024 | | | 2.875% | | 1,000 | | | — | |
| | 880591EV0 | | 3/15/2020 | | 2.250% | | 0 | | | 1,000 | | |
| 880591EL2 | | 2/15/2021 | | 3.875% | | 1,500 | | | 0 | | |
| 880591DC3 | | 6/7/2021 | | 5.805% | | 258 | | (1) | 0 | | |
| | Total current maturities of power bonds issued at par | Total current maturities of power bonds issued at par | | | | | | | | 1,787 | | | 1,030 | | Total current maturities of power bonds issued at par | | | | | | | 1,022 | | | 29 | |
| Total current debt outstanding, net | Total current debt outstanding, net | | | | | | | | $ | 1,885 | | | $ | 2,014 | | Total current debt outstanding, net | | | | | | | $ | 1,489 | | | $ | 1,240 | |
Note
| | | | | | | | | | | | | | | | | | | | | | | | | | | | | | | | | | |
Long-Term Debt At September 30 (in millions) |
CUSIP or Other Identifier | | Maturity | | Coupon
Rate | | | | 2023 Par | | 2022 Par | | Stock Exchange Listings |
| | | | | | | | | | | | |
| | | | | | | | | | | | |
| | | | | | | | | | | | |
| | | | | | | | | | | | |
| | | | | | | | | | | | |
| | | | | | | | | | | | |
| 880591ER9 | | 9/15/2024 | | 2.875% | | | | $ | — | | | $ | 1,000 | | | New York |
| 880591EW8 | | 5/15/2025 | | 0.750% | | | | 1,000 | | | 1,000 | | | New York |
| 880591CJ9 | | 11/1/2025 | | 6.750% | | | | 1,350 | | | 1,350 | | | New York, Hong Kong, Luxembourg, Singapore |
| 880591EU2 | | 2/1/2027 | | 2.875% | | | | 1,000 | | | 1,000 | | | New York |
880591300(3) | | 6/1/2028 | | 2.134% | | | | 256 | | | 256 | | | New York |
880591409(3) | | 5/1/2029 | | 2.216% | | | | 208 | | | 208 | | | New York |
| 880591DM1 | | 5/1/2030 | | 7.125% | | | | 1,000 | | | 1,000 | | | New York, Luxembourg |
| 880591EX6 | | 9/15/2031 | | 1.500% | | | | 500 | | | 500 | | | New York |
| 880591DP4 | | 6/7/2032 | | 6.587% | (2) | | | 305 | | (1) | 279 | | (1) | New York, Luxembourg |
| 880591DV1 | | 7/15/2033 | | 4.700% | | | | 472 | | | 472 | | | New York, Luxembourg |
| 880591EF5 | | 6/15/2034 | | 3.770% | | | | 139 | | | 160 | | | None |
| 880591DX7 | | 6/15/2035 | | 4.650% | | | | 436 | | | 436 | | | New York |
| 880591CK6 | | 4/1/2036 | | 5.980% | | | | 121 | | | 121 | | | New York |
| 880591CS9 | | 4/1/2036 | | 5.880% | | | | 1,500 | | | 1,500 | | | New York |
| 880591CP5 | | 1/15/2038 | | 6.150% | | | | 1,000 | | | 1,000 | | | New York |
| 880591ED0 | | 6/15/2038 | | 5.500% | | | | 500 | | | 500 | | | New York |
| 880591EH1 | | 9/15/2039 | | 5.250% | | | | 2,000 | | | 2,000 | | | New York |
| 880591EP3 | | 12/15/2042 | | 3.500% | | | | 1,000 | | | 1,000 | | | New York |
| 880591DU3 | | 6/7/2043 | | 4.962% | (2) | | | 183 | | (1) | 168 | | (1) | New York, Luxembourg |
| | | | | | | | | | | | |
| 880591EB4 | | 1/15/2048 | | 4.875% | | | | 500 | | | 500 | | | New York, Luxembourg |
| 880591DZ2 | | 4/1/2056 | | 5.375% | | | | 1,000 | | | 1,000 | | | New York |
| 880591EJ7 | | 9/15/2060 | | 4.625% | | | | 1,000 | | | 1,000 | | | New York |
| 880591ES7 | | 9/15/2065 | | 4.250% | | | | 1,000 | | | 1,000 | | | New York |
| 880591EY4 | | 9/15/2052 | | 4.250% | | | | 500 | | | 500 | | | New York |
| 880591EZ1 | | 3/15/2028 | | 3.875% | | | | 1,000 | | | — | | | New York |
| | | | | | | | | | | | |
| | | | | | | | | | | | |
| Subtotal | | | | | | | | 17,970 | | | 17,950 | | | |
| Unamortized discounts, premiums, issue costs, and other | | | | | | | | (126) | | | (124) | | | |
| Total long-term outstanding power bonds, net | | | | | | | | 17,844 | | | 17,826 | | | |
| Long-term debt of VIEs, net | | | | | | | | 933 | | | 968 | | | |
| | | | | | | | | | | | |
| Total long-term debt, net | | | | | | | | $ | 18,777 | | | $ | 18,794 | | | |
Notes
(1) Includes total net exchange gain from currency transactions of $73$109 million and $150 million at September 30, 2020.
| | | | | | | | | | | | | | | | | | | | | | | | | | | | | | | | | | | | | | |
Long-Term Debt At September 30 |
CUSIP or Other Identifier | | Maturity | | Coupon
Rate | | Effective Call Date | | 2020 Par | | 2019 Par | | Stock Exchange Listings |
electronotes®(2) | | 5/15/2020 - 2/15/2043 | | 2.375% - 3.625% | | 2/15/2015 - 2/15/2018 (5) | | $ | 0 | | | $ | 217 | | | None |
| | | | | | | | | | | | |
| | | | | | | | | | | | |
| 880591EL2 | | 2/15/2021 | | 3.875% | | | | 0 | | | 1,500 | | | New York |
| 880591DC3 | | 6/7/2021 | | 5.805% | (3) | | | 0 | |
| 246 | | (1) | New York, Luxembourg |
| 880591EN8 | | 8/15/2022 | | 1.875% | | | | 1,000 | | | 1,000 | | | New York |
| 880591ER9 | | 9/15/2024 | | 2.875% | | | | 1,000 | | | 1,000 | | | New York |
| 880591EW8 | | 5/15/2025 | | 0.750% | | | | 1,000 | | | 0 | | | New York |
| 880591CJ9 | | 11/1/2025 | | 6.750% | | | | 1,350 | | | 1,350 | | | New York, Hong Kong, Luxembourg, Singapore |
| 880591EU2 | | 2/1/2027 | | 2.875% | | | | 1,000 | | | 1,000 | | | New York |
880591300(4) | | 6/1/2028 | | 2.134% | | | | 256 | | | 273 | | | New York |
880591409(4) | | 5/1/2029 | | 2.216% | | | | 208 | | | 232 | | | New York |
| 880591DM1 | | 5/1/2030 | | 7.125% | | | | 1,000 | | | 1,000 | | | New York, Luxembourg |
| 880591DP4 | | 6/7/2032 | | 6.587% | (3) | | | 323 | | (1) | 307 | | (1) | New York, Luxembourg |
| 880591DV1 | | 7/15/2033 | | 4.700% | | | | 472 | | | 472 | | | New York, Luxembourg |
| 880591EF5 | | 6/15/2034 | | 3.770% | | | | 218 | | | 246 | | | None |
| 880591DX7 | | 6/15/2035 | | 4.650% | | | | 436 | | | 436 | | | New York |
| 880591CK6 | | 4/1/2036 | | 5.980% | | | | 121 | | | 121 | | | New York |
| 880591CS9 | | 4/1/2036 | | 5.880% | | | | 1,500 | | | 1,500 | | | New York |
| 880591CP5 | | 1/15/2038 | | 6.150% | | | | 1,000 | | | 1,000 | | | New York |
| 880591ED0 | | 6/15/2038 | | 5.500% | | | | 500 | | | 500 | | | New York |
| 880591EH1 | | 9/15/2039 | | 5.250% | | | | 2,000 | | | 2,000 | | | New York |
| 880591EP3 | | 12/15/2042 | | 3.500% | | | | 1,000 | | | 1,000 | | | New York |
| 880591DU3 | | 6/7/2043 | | 4.962% | (3) | | | 194 | | (1) | 185 | | (1) | New York, Luxembourg |
| 880591CF7 | | 7/15/2045 | | 6.235% | | 7/15/2020 | | 0 | | | 140 | | | New York |
| 880591EB4 | | 1/15/2048 | | 4.875% | | | | 500 | | | 500 | | | New York, Luxembourg |
| 880591DZ2 | | 4/1/2056 | | 5.375% | | | | 1,000 | | | 1,000 | | | New York |
| 880591EJ7 | | 9/15/2060 | | 4.625% | | | | 1,000 | | | 1,000 | | | New York |
| 880591ES7 | | 9/15/2065 | | 4.250% | | | | 1,000 | | | 1,000 | | | New York |
| | | | | | | | | | | | |
| | | | | | | | | | | | |
| | | | | | | | | | | | |
| Subtotal | | | | | | | | 18,078 | | | 19,225 | | | |
| Unamortized discounts, premiums, issue costs, and other | | | | | | | | (122) | | | (131) | | | |
| Total long-term outstanding power bonds, net | | | | | | | | 17,956 | | | 19,094 | | | |
| Long-term debt of VIEs, net | | | | | | | | 1,048 | | | 1,089 | | | |
| | | | | | | | | | | | |
| Total long-term debt, net | | | | | | | | $ | 19,004 | | | $ | 20,183 | | | |
Notes
(1) Includes net exchange gain from currency transactions of $80 million2023 and $191 million at September 30, 2020 and 2019,2022, respectively.
(2) Includes one electronotes® issue with partial maturities of principal for each required annual payment.
(3) The coupon rate represents TVA's effective interest rate.
(4)(3) TVA PARRS, CUSIP numbers 880591300 and 880591409, may be redeemed under certain conditions. See Put and Call Options above.
(5) The bonds were callable on or after the dates shown.
| | | | | | | | | | | | | | | | | | | | | | | | | | | | | | | | | | | | | | | | | |
Maturities Due in the Year Ending September 30 (in millions) |
| 2024 | | 2025 | | 2026 | | 2027 | | 2028 | | Thereafter | | Total |
Long-term power bonds including current maturities(1) | $ | 1,022 | | | $ | 1,022 | | | $ | 1,370 | | | $ | 1,020 | | | $ | 1,272 | | | $ | 13,395 | | | $ | 19,101 | |
| | | | | | | | | | | | | |
Short-term debt(2) | 432 | | | — | | | — | | | — | | | — | | | — | | | 432 | |
| | | | | | | | | | | | | | | | | | | | | | | | | | | | | | | | | | | | | | | | | |
| Maturities Due in the Year Ending September 30 |
| | 2021 | | 2022 | | 2023 | | 2024 | | 2025 | | Thereafter | | Total |
Long-term power bonds, long-term debt of VIEs, and notes payable including current maturities(1) | $ | 1,901 | | | $ | 1,071 | | | $ | 69 | | | $ | 1,058 | | | $ | 1,059 | | | $ | 15,957 | | | $ | 21,115 | |
| Short-term debt, net of discounts | 57 | | | 0 | | | 0 | | | 0 | | | 0 | | | 0 | | | 57 | |
NoteNotes
(1) Long-term power bonds doesdo not include non-cash items of foreign currency exchange gain of $153$109 million, unamortized debt issue costs of $45$41 million, andor net
discount on sale of Bonds of $77$85 million. Long-term
(2) Short-term debt of VIE does not include the non-cash item of unamortized debt issue costsdiscount on issuance of $8discount notes of less than $1 million.
Credit Facility Agreements
TVA has funding available under 4four long-term revolving credit facilities totaling $2.7 billion: a $150 millionbillion. See the table below for additional information on the four long-term revolving credit facility that matures on December 11, 2021, a $1.0 billion credit facility that matures on June 13, 2023, a $1.0 billion credit facility that matures on September 28, 2023, and a $500 million credit facility that matures on February 1, 2025.facilities. The interest rate on any borrowing under these facilities varies based on market factors and the rating of TVA's senior unsecured, long-term, non-credit-enhanced debt. TVA is required to pay an unused facility fee on the portion of the total $2.7 billion that TVA has not borrowed or committed under letters of credit. This fee, along with letter of credit fees, may fluctuate depending on the rating of TVA's senior unsecured, long-term, non-credit-enhanced debt. At September 30, 20202023 and 2019,2022, there were $1.5 billion$535 million and $1.3 billion,$704 million, respectively, of letters of credit outstanding under these facilities, and there were 0no borrowings outstanding. TVA's letters of credit are primarily posted as collateral under TVA's interest rate swaps. See Note 15 — Risk Management Activities and Derivative Transactions — Other Derivative Instruments — Collateral. TVA may also post collateral for TVA's currency swaps, for commodity derivatives under the Financial Hedging program ("FHP"), or for certain transactions with third parties that require TVA to post letters of credit.
The following table provides additional information regarding TVA's funding available under the 4four long-term revolving credit facilities:
| | | | | | | | | | | | | | | | | | | | | | | | | | |
Summary of Long-Term Credit Facilities At September 30, 2020 |
| Maturity Date | | Facility Limit | | Letters of Credit Outstanding | | Cash Borrowings | | Availability |
| December 2021 | | $ | 150 | | | $ | 38 | | | $ | 0 | | | $ | 112 | |
| June 2023 | | 1,000 | | | 432 | | | 0 | | | 568 | |
| September 2023 | | 1,000 | | | 487 | | | 0 | | | 513 | |
| February 2025 | | 500 | | | 500 | | | 0 | | | 0 | |
| Total | | $ | 2,650 | | | $ | 1,457 | | | $ | 0 | | | $ | 1,193 | |
| | | | | | | | | | | | | | | | | | | | | | | | | | |
Summary of Long-Term Credit Facilities At September 30, 2023 (in millions) |
| Maturity Date | | Facility Limit | | Letters of Credit Outstanding | | Cash Borrowings | | Availability |
| | | | | | | | |
| February 2025 | | $ | 500 | | | $ | 302 | | | $ | — | | | $ | 198 | |
| March 2026 | | 150 | | | 38 | | | — | | | 112 | |
| September 2026 | | 1,000 | | | 99 | | | — | | | 901 | |
| March 2027 | | 1,000 | | | 96 | | | — | | | 904 | |
| Total | | $ | 2,650 | | | $ | 535 | | | $ | — | | | $ | 2,115 | |
TVA and the U.S. Treasury, pursuant to the TVA Act, have entered into a memorandum of understanding under which the U.S. Treasury provides TVA with a $150 million credit facility. This credit facility was renewed for 20212024 with a maturity date of September 30, 2021.2024. Access to this credit facility or other similar financing arrangements with the U.S. Treasury has been available to TVA since the 1960s. TVA can borrow under the U.S. Treasury credit facility only if it cannot issue Bonds in the market on reasonable terms, and TVA considers the U.S. Treasury credit facility a secondary source of liquidity. The interest rate on any borrowing under this facility is based on the average rate on outstanding marketable obligations of the U.S. with maturities from date of issue of one year12 months or less. There were no outstanding borrowings under the facility at September 30, 2020.2023. The availability of this credit facility may be impacted by how the U.S. government addresses the possibility of approaching its debt limit.
Lease/Leasebacks
TVA previously entered into leasing transactions to obtain third-party financing for 24 peaking CTs as well as certain qualified technological equipment and software ("QTE"). Due to TVA's continuing involvement with the combustion turbine facilities and the QTE during the leaseback term, TVA accounted for the lease proceeds as financing obligations. On September 30, 2020 and 2019, theThere were no outstanding leasebackleaseback obligations related to the remaining CTs and QTE were $223 millionat September 30, 2023 and $263 million, respectively. In March 2019,2022. Prior to 2021, TVA made final rent payments under lease/leaseback transactions involving eight16 CTs and TVA had previously acquired the equity interests related to these transactions. These transactions were terminated in July 2019. In May 2020, TVA made final rent payments under lease/leaseback transactions involving eight additional CTs, and TVA had previously acquired the equity interest related to these transactions. Rent payments under the remaining CT lease/leaseback transactions are scheduled to bewere made through January 2022. In December 2021, TVA does have the optiongave notice of its election to acquire the equityleasehold interests related to transactions involving the remaining eight CTs for additional amounts. In addition,a total of $155 million. One associated acquisition closed in December 2022 for $78 million, and the other acquisition closed in May 2023 for $77 million. As a result, TVA recorded the cash consideration as reacquired rights, which is an intangible asset included in Completed plant on October 30, 2019, TVA provided notice of its intent to purchase the ownership interest in certain QTE. Repurchase payments are expected to be paid through a series of installments in 2021 and 2022, after which the associated leasesConsolidated Balance Sheet. The amount will be terminated.
14. Accumulated Other Comprehensive Income (Loss)
AOCI represents market valuation adjustmentsthe underlying CTs. TVA recognized $3 million of amortization expense related to TVA's currency swaps. The currency swaps are cash flow hedges and are the only derivatives in TVA's portfolio that have been designated and qualifyreacquired rights within the Consolidated Statements of Operations for hedge accounting treatment. TVA records exchange rate gains and losses on its foreign currency-denominated debt and any related accrued interest in net income and marks its currency swap assets and liabilities to market through other comprehensive income (loss) ("OCI"). TVA then reclassifies an amount out of AOCI into net income, offsetting the exchange gain/loss recorded on the debt. For the yearsyear ended September 30, 2020 and 2019, TVA reclassified $382023. Transaction costs were not material. The estimated amortization expense will be $5 million of gains and $45annually from 2024 through 2052. The estimated amortization expense will be $2 million of losses, respectively, related to its cash flow hedges from AOCI to Interest expense. See Note 15 — Risk Management Activities and Derivative Transactions.
TVA records certain assets and liabilities that result from the regulated ratemaking process that would not be recorded under GAAP for non-regulated entities. As such, certain items that would generally be reported in AOCI or that would impact the statements of operations are recorded as regulatory assets or regulatory liabilities. See Note 9— Regulatory Assets and Liabilities for a schedule of regulatory assets and liabilities. See Note 15 — Risk Management Activities and Derivative Transactions for a discussion of the recognition in AOCI of gains and losses associated with certain derivative contracts. See Note 16 — Fair Value Measurements for a discussion of the recognition of certain investment fund gains and losses as regulatory assets and liabilities. See Note 21 — Benefit Plans for a discussion of the regulatory accounting related to components of TVA's benefit plans.2053.
15. Risk Management Activities and Derivative Transactions
TVA is exposed to various risks related to commodity prices, investment prices, interest rates, currency exchange rates, and inflation as well as counterparty credit and performance risks. To help manage certain of these risks, TVA has historically entered into various derivative transactions, principally commodity option contracts, forward contracts, swaps, swaptions, futures, and options on futures. Other than certain derivative instruments in its trust investment funds, it is TVA's policy to enter into these derivative transactions solely for hedging purposes and not for speculative purposes. During the fourth quarter of 2020, TVA discontinued derivative accounting for forward coal contracts because these contracts no longer meet the criteria of net settlement. As a result, the associated $10 million net derivative liabilities have been derecognized. TVA suspended its FTP in 2014 and no longer uses financial instruments to hedge risks related to commodity prices; however, TVA plans to continue to manage fuel price volatility through other methods and is currently reevaluating its suspended FTP program for future use of financial instruments.
Overview of Accounting Treatment
TVA recognizes certain of its derivative instruments as either assets or liabilities on its Consolidated Balance Sheets at fair value. The accounting for changes in the fair value of these instruments depends on (1) whether TVA uses regulatory accounting to defer the derivative gains and losses, (2) whether the derivative instrument has been designated and qualifies for hedge accounting treatment, and (3) if so, the type of hedge relationship (for example, cash flow hedge).
The following tables summarize the accounting treatment that certain of TVA's financial derivative transactions receive:
| Summary of Derivative Instruments That Receive Hedge Accounting Treatment (part 1) Amount of Mark-to-Market Gain (Loss) Recognized in Accumulated Other Comprehensive Income (Loss) For the years ended September 30 | |
Summary of Derivative Instruments That Receive Hedge Accounting Treatment (part 1) Amount of Mark-to-Market Gain (Loss) Recognized in Accumulated Other Comprehensive Income (Loss) For the years ended September 30 (in millions) | | Summary of Derivative Instruments That Receive Hedge Accounting Treatment (part 1) Amount of Mark-to-Market Gain (Loss) Recognized in Accumulated Other Comprehensive Income (Loss) For the years ended September 30 (in millions) |
| Derivatives in Cash Flow Hedging Relationship | Derivatives in Cash Flow Hedging Relationship | | Objective of Hedge Transaction | | Accounting for Derivative
Hedging Instrument | | 2020 | | 2019 | Derivatives in Cash Flow Hedging Relationship | | Objective of Hedge Transaction | | Accounting for Derivative
Hedging Instrument | | 2023 | | 2022 |
| Currency swaps | Currency swaps | | To protect against changes in cash flows caused by changes in foreign currency exchange rates (exchange rate risk) | | Unrealized gains and losses are recorded in AOCI and reclassified to Interest expense to the extent they are offset by gains and losses on the hedged transaction | | $ | (1) | | | $ | (114) | | Currency swaps | | To protect against changes in cash flows caused by changes in foreign currency exchange rates (exchange rate risk) | | Unrealized gains and losses are recorded in AOCI and reclassified to Interest expense to the extent they are offset by gains and losses on the hedged transaction | | $ | 99 | | | $ | (157) | |
| Summary of Derivative Instruments That Receive Hedge Accounting Treatment (part 2)(1) Amount of Gain (Loss) Reclassified from Accumulated Other Comprehensive Income to Interest Expense For the years ended September 30 | |
Summary of Derivative Instruments That Receive Hedge Accounting Treatment (part 2)(1) Amount of Gain (Loss) Reclassified from Accumulated Other Comprehensive Income (Loss) to Interest Expense For the years ended September 30 | | Summary of Derivative Instruments That Receive Hedge Accounting Treatment (part 2)(1) Amount of Gain (Loss) Reclassified from Accumulated Other Comprehensive Income (Loss) to Interest Expense For the years ended September 30 |
| Derivatives in Cash Flow Hedging Relationship | Derivatives in Cash Flow Hedging Relationship | | 2020 | | 2019 | Derivatives in Cash Flow Hedging Relationship | | 2023 | | 2022 |
| Currency swaps | Currency swaps | | $ | 38 | | | $ | (45) | | Currency swaps | | $ | 42 | | | $ | (93) | |
Note
(1) There were 0no amounts excluded from effectiveness testing for any of the periods presented. Based on forecasted foreign currency exchange rates, TVA expects to reclassify approximately $27$20 million of gains from AOCI to Interest expense within the next 12 months to offset amounts anticipated to be recorded in Interest expense related to the forecasted exchange gainloss on the debt.
| Summary of Derivative Instruments That Do Not Receive Hedge Accounting Treatment Amount of Gain (Loss) Recognized in Income on Derivatives(1) For the years ended September 30 | |
Summary of Derivative Instruments That Do Not Receive Hedge Accounting Treatment Amount of Gain (Loss) Recognized in Income on Derivatives(1) For the years ended September 30 (in millions) | | Summary of Derivative Instruments That Do Not Receive Hedge Accounting Treatment Amount of Gain (Loss) Recognized in Income on Derivatives(1) For the years ended September 30 (in millions) |
| | | | |
| Derivative Type | Derivative Type | | Objective of Derivative(2) | | Accounting for Derivative Instrument | | 2020 | | 2019 | Derivative Type | | Objective of Derivative | | Accounting for Derivative Instrument | | 2023 | | 2022 |
| Interest rate swaps | Interest rate swaps | | To fix short-term debt variable rate to a fixed rate (interest rate risk) | | Mark-to-market gains and losses are recorded as regulatory assets or liabilities
Realized gains and losses are recognized in Interest expense when incurred during the settlement period and are presented in operating cash flow | | $ | (97) | | | $ | (79) | | Interest rate swaps | | To fix short-term debt variable rate to a fixed rate (interest rate risk) | | Mark-to-market gains and losses are recorded as regulatory liabilities and assets, respectively
Realized gains and losses are recognized in Interest expense when incurred during the settlement period and are presented in operating cash flow | | $ | (45) | | | $ | (103) | |
| | Commodity contract derivatives | | To protect against fluctuations in market prices of purchased coal or natural gas (price risk) | | Mark-to-market gains and losses are recorded as regulatory assets or liabilities
Realized gains and losses due to contract settlements are recognized in Fuel expense as incurred | | (1) | | | 0 | | |
| Commodity derivatives
under the FHP | | Commodity derivatives
under the FHP | | To protect against fluctuations in market prices of purchased commodities (price risk) | | Mark-to-market gains and losses are recorded as regulatory liabilities and assets, respectively
Realized gains and losses are recognized in Fuel expense or Purchased power expense as the contracts settle to match the delivery period of the underlying commodity(2) | | (348) | | | 47 | |
Notes
(1) All of TVA's derivative instruments that do not receive hedge accounting treatment have unrealized gains (losses) that would otherwise be recognized in income but instead are deferred as regulatory assetsliabilities and liabilities.assets. As such, there were 0no related gains (losses) recognized in income for these unrealized gains (losses) for the years ended September 30, 20202023 and 2019.2022.
(2) DuringOf the fourth quarter of 2020, TVA discontinued derivative accounting for forward coal contracts.
| | | | | | | | | | | | | | | | | | | | | | | |
Fair Values of TVA Derivatives At September 30 |
| | 2020 | | 2019 |
| Derivatives That Receive Hedge Accounting Treatment: |
| | Balance | | Balance Sheet Presentation | | Balance | | Balance Sheet Presentation |
| Currency swaps | | | | | | | |
| £200 million Sterling | $ | (78) | | | Accounts payable and accrued liabilities $(78) | | $ | (90) | | | Accounts payable and accrued liabilities $(6); Other long-term liabilities $(84) |
| £250 million Sterling | (63) | | | Accounts payable and accrued liabilities $(5); Other long-term liabilities $(58) | | (61) | | | Accounts payable and accrued liabilities $(5); Other long-term liabilities $(56) |
| £150 million Sterling | (68) | | | Accounts payable and accrued liabilities $(3); Other long-term liabilities $(65) | | (57) | | | Accounts payable and accrued liabilities $(4); Other long-term liabilities $(53) |
| | | | | | | |
| Derivatives That Do Not Receive Hedge Accounting Treatment: |
| | Balance | | Balance Sheet Presentation | | Balance | | Balance Sheet Presentation |
| Interest rate swaps | | | | | | | |
| $1.0 billion notional | $ | (1,449) | | | Accounts payable and accrued liabilities $(43); Accrued interest $(37); Other long-term liabilities $(1,369) | | $ | (1,261) | | | Accounts payable and
accrued liabilities $(29); Accrued interest $(33);
Other long-term liabilities
$(1,199) |
| $476 million notional | (588) | | | Accounts payable and accrued liabilities $(22); Accrued interest $(10); Other long-term liabilities $(556) | | (498) | | | Accounts payable and
accrued liabilities $(15); Accrued interest $(9);
Other long-term liabilities
$(474) |
| $42 million notional | (4) | | | Accounts payable and accrued liabilities $(2); Other long-term liabilities $(2) | | (5) | | | Accounts payable and
accrued liabilities $(1); Accrued interest $(1); Other long-term liabilities $(3) |
| Commodity contract derivatives | 46 | | | Other current assets $26; Other long-term assets $23; Accounts payable and accrued liabilities $(3) | | (41) | | | Other current assets $12; Other long-term liabilities $(16); Accounts payable and accrued liabilities $(37) |
| | | | | | | | | | | | | | | | | | | | | | | |
Fair Values of TVA Derivatives At September 30 (in millions) |
| | 2023 | | 2022 |
| Derivatives That Receive Hedge Accounting Treatment: |
| | Balance | | Balance Sheet Presentation | | Balance | | Balance Sheet Presentation |
| Currency swaps | | | | | | | |
| | | | | | | |
| £250 million Sterling | $ | (72) | | | Accounts payable and accrued liabilities $(6); Other long-term liabilities $(66) | | $ | (130) | | | Accounts payable and accrued liabilities $(7); Other long-term liabilities $(123) |
| £150 million Sterling | (69) | | | Accounts payable and accrued liabilities $(4); Other long-term liabilities $(65) | | (110) | | | Accounts payable and accrued liabilities $(5); Other long-term liabilities $(105) |
| | | | | | | |
| Derivatives That Do Not Receive Hedge Accounting Treatment: |
| | Balance | | Balance Sheet Presentation | | Balance | | Balance Sheet Presentation |
| Interest rate swaps | | | | | | | |
| $1.0 billion notional | $ | (499) | | | Other current assets $1; Accrued interest $(27); Other long-term liabilities $(473) | | $ | (672) | | | Accounts payable and accrued liabilities $(9); Accrued interest $(33); Other long-term liabilities $(630) |
| $476 million notional | (159) | | | Other current assets $3; Accrued interest $(8); Other long-term liabilities $(154) | | (233) | | | Accounts payable and accrued liabilities $(3); Accrued interest $(9); Other long-term liabilities $(221) |
| | | | | | | |
| Commodity contract derivatives | 31 | | | Other current assets $21; Other long-term assets $12; Accounts payable and accrued liabilities $(1); Other long-term liabilities $(1) | | 145 | | | Other current assets $118; Other long-term assets $34; Accounts payable and accrued liabilities $(6); Other long-term liabilities $(1) |
| Commodity derivatives under the FHP | (186) | | | Accounts payable and accrued liabilities $(135); Other long-term liabilities $(51) | | 115 | | | Accounts receivable, net $1; Other current assets $54; Other long-term assets $68; Accounts payable and accrued liabilities $(8) |
Cash Flow Hedging Strategy for Currency Swaps
To protect against exchange rate risk related to 3 British pound sterling denominated Bond transactions, TVA entered into foreign currency hedges at the time the Bond transactions occurred. TVA had the following currency swaps outstanding at September 30, 2020:2023:
| Currency Swaps Outstanding September 30, 2020 | |
| Currency Swaps Outstanding | | Currency Swaps Outstanding |
| Effective Date of Currency Swap Contract | Effective Date of Currency Swap Contract | | Associated TVA Bond Issues Currency Exposure | | Expiration Date of Swap | | Overall Effective
Cost to TVA | Effective Date of Currency Swap Contract | | Associated TVA Bond Issues Currency Exposure | | Expiration Date of Swap | | Overall Effective
Cost to TVA |
| 1999 | | £200 million | | 2021 | | 5.81% | |
| 2001 | 2001 | | £250 million | | 2032 | | 6.59% | 2001 | | £250 million | | 2032 | | 6.587% |
| 2003 | 2003 | | £150 million | | 2043 | | 4.96% | 2003 | | £150 million | | 2043 | | 4.962% |
When the dollar strengthens against the British pound sterling, the exchange gain on the Bond liability and related accrued interest is offset by an equal amount of loss on the swap contract that is reclassified out of AOCI. Conversely, the exchange loss on the Bond liability and related accrued interest is offset by an equal amount of gain on the swap contract that is reclassified out of AOCI. All such exchange gains or losses on the Bond liability and related accrued interest are included in Long-term debt, net and Accounts payable and accrued liabilities,Accrued interest, respectively. The offsetting exchange losses or gains on the swap contracts are recognized in AOCI. If any gain (loss) were to be incurred as a result of the early termination of the foreign currency swap contract, the resulting income (expense) would be amortized over the remaining life of the associated Bond as a component of Interest expense. The values of the currency swap liabilities are included in Accounts payable and accrued liabilities and Other long-term liabilities on the Consolidated Balance Sheets.
Derivatives Not Receiving Hedge Accounting Treatment
Interest Rate Derivatives. Generally TVA uses interest rate swaps to fix variable short-term debt to a fixed rate, and TVA uses regulatory accounting treatment to defer the MtM gains and losses on its interest rate swaps. The net deferred unrealized gains and losses are classified as regulatory assetsliabilities or liabilitiesassets on TVA's Consolidated Balance Sheets and are included in the ratemaking formula when gains or losses are realized. The values of these derivatives are included in Other current assets, Accounts payable and accrued liabilities, Accrued interest, and Other long-term liabilities on the Consolidated Balance Sheets, and realized gains and losses, if any, are included inon TVA's Consolidated Statements of Operations. For the years ended September 30, 20202023 and 2019,2022, the changes in fair market value of the interest rate swaps resulted in the deferral ofreduction in unrealized losses of $272$240 million and $565$728 million, respectively. TVA may hold short-term debt balances lower than the notional amount of the interest rate swaps from time to time due to changes in business conditions and other factors. While actual balances vary, TVA generally plans to maintain average balances of short-term debt equal to or in excess of the combined notional amount of the interest rate swaps.
Commodity Derivatives. TVA enters into certain commodityderivative contracts for coal and natural gas that require physical delivery of the contracted quantity of the commodity. DuringTVA may also enter into short-term PPAs with a term of less than one year that provide an option to financially settle contracted power deliveries. This option creates an embedded derivative in the fourth quarter of 2020, TVA discontinued derivative accounting for forward coal contracts.hosting power purchase agreement. TVA marks to market natural gasthese contracts and defers the fair market valuesunrealized gains (losses) as regulatory assets or liabilities on a gross basis.(assets). At September 30, 2020,2023, TVA's natural gas contract derivatives had terms of up to fourthree years.
| Commodity Contract Derivatives At September 30 | Commodity Contract Derivatives At September 30 | Commodity Contract Derivatives At September 30 |
| | | 2020 | | 2019 | | 2023 | | 2022 |
| | | Number of Contracts | | Notional Amount | | Fair Value (MtM) | | Number of Contracts | | Notional Amount | | Fair Value (MtM) | | Number of Contracts | | Notional Amount | | Fair Value (MtM)
(in millions) | | Number of Contracts | | Notional Amount | | Fair Value (MtM) (in millions) |
| Coal contract derivatives | 0 | | 0 million tons | | $ | 0 | | | 8 | | 9 million tons | | $ | (4) | | |
| | Natural gas contract derivatives | Natural gas contract derivatives | 42 | | 302 million mmBtu | | $ | 46 | | | 65 | | 330 million mmBtu | | $ | (37) | | Natural gas contract derivatives | 54 | | 318 million mmBtu | | $ | 31 | | | 44 | | 296 million mmBtu | | $ | 145 | |
|
| | | | | | | | | | | | | | | | | | | | | | | | | | | | | | | | | | | |
Commodity Derivatives under Financial Hedging Program(1) At September 30 |
| 2023 | | 2022 |
| Number of Contracts | | Notional Amount | | Fair Value (MtM) (in millions) | | Number of Contracts | | Notional Amount | | Fair Value (MtM) (in millions) |
| Natural gas | | | | | | | | | | | |
| | | | | | | | | | | |
| Swap contracts | 221 | | 388 | million mmBtu | | $ | (186) | | | 225 | | 256 | million mmBtu | | $ | 115 | |
| | | | | | | | | | | |
| | | | | | | | | | | |
| | | | | | | | | | | |
| | | | | | | | | | | |
| | | | | | | | | | | |
| | | | | | | | | | | |
| | | | | | | | | | | |
| | | | | | | | | | | |
Note
(1) Fair value amounts presented are based on the net commodity position with the counterparty. Notional amounts disclosed represent the net value of contractual amounts.
Offsetting of Derivative Assets and Liabilities
The amounts of TVA's derivative instruments as reported on the Consolidated Balance Sheets at September 30, 2020 and 2019, are shown in the table below.below:
| | | | | | | | | | | | | |
Derivative Assets and Liabilities(1) (in millions) |
| |
| At September 30, 2020 | | | | At September 30, 2019 |
| Assets | | | | | |
| | | | | |
| Commodity derivatives not subject to master netting or similar arrangement | $ | 49 | | | | | $ | 12 | |
| | | | | |
| | | | | |
| | | | | |
| | | | | |
| | | | | |
| Liabilities | | | | | |
Currency swaps(2) | $ | 209 | | | | | $ | 208 | |
Interest rate swaps(2) | 2,041 | | | | | 1,764 | |
| Total derivatives subject to master netting or similar arrangement | 2,250 | | | | | 1,972 | |
| Commodity derivatives not subject to master netting or similar arrangement | 3 | | | | | 53 | |
| Total liabilities | $ | 2,253 | | | | | $ | 2,025 | |
| | | | | |
| |
| | | | | |
| | | | | |
| | | | | |
| | | | | |
| | | | | |
| | | | | |
| | | | | |
| | | | | |
| | | | | |
| | | | | |
| | | | | | | | | | | | | |
Derivative Assets and Liabilities(1) At September 30 (in millions) |
| |
| 2023 | | | | 2022 |
| Assets | | | | | |
| Interest rate swaps | $ | 4 | | | | | $ | — | |
| Commodity contract derivatives | 33 | | | | | 152 | |
Commodity derivatives under the FHP(2) | — | | | | | 123 | |
| Total derivatives subject to master netting or similar arrangement | $ | 37 | | | | | $ | 275 | |
| | | | | |
| | | | | |
| | | | | |
| | | | | |
| Liabilities | | | | | |
| Currency swaps | $ | 141 | | | | | $ | 240 | |
Interest rate swaps(3) | 662 | | | | | 905 | |
| Commodity contract derivatives | 2 | | | | | 7 | |
Commodity derivatives under the FHP(2) | 186 | | | | | 8 | |
| Total derivatives subject to master netting or similar arrangement | $ | 991 | | | | | $ | 1,160 | |
| | | | | |
| | | | | |
| | | | | |
| |
| | | | | |
| | | | | |
| | | | | |
| | | | | |
| | | | | |
| | | | | |
| | | | | |
| | | | | |
| | | | | |
| | | | | |
Notes
(1) Offsetting amounts primarily include counterparty netting of derivative contracts, margin account deposits for futures commission merchants transactions, and cash collateral received or paid in accordance with the accounting guidance for derivatives and hedging transactions. Therecontracts. Except as discussed below, there were no other material offsetting amounts on TVA's Consolidated Balance Sheets at either September 30, 20202023 or 2019.2022.
(2) At September 30, 2023, the gross derivative asset and gross derivative liability was $26 million and $212 million, respectively, with offsetting amounts for each totaling $26 million.
(3) Letters of credit of approximately $1.5 billion$509 million and $1.3 billion$704 million were posted as collateral at September 30, 20202023 and 2019,2022, respectively, to partially secure the liability positions of one of the currency swaps and one of the interest rate swaps in accordance with the collateral requirements for these derivatives.this derivative.
Other Derivative Instruments
Investment Fund Derivatives. Investment funds consist primarily of funds held in the NDT, ART, SERP, DCP, and DCP.RP. See Note 16 — Fair Value Measurements — Investment Funds for a discussion of the trusts, plans, and types of investments. The NDT and ART may invest in derivative instruments which may include swaps, futures, options, forwards, and other instruments. At September 30, 20202023 and 2019,2022, the NDT held investments in forward contracts to purchase debt securities. The fair values of these derivatives were in net asset positions totaling $13$11 million and $22$4 million at September 30, 20202023 and 2019,2022, respectively.
Collateral. TVA's interest rate swaps, and currency swaps, and commodity derivatives under the FHP contain contract provisions that require a party to post collateral (in a form such as cash or a letter of credit) when the party's liability balance under the agreement exceeds a certain threshold. At September 30, 2020,2023, the aggregate fair value of all derivative instruments with credit-risk related contingent features that were in a liability position was $2.2 billion.$987 million. TVA's collateral obligations at September 30, 2020,2023, under these arrangements were approximately $1.5 billion,$429 million, for which TVA had posted approximately $1.5 billion$509 million in letters of credit. These letters of credit reduce the available balance under the related credit facilities. TVA's assessment of the risk of its nonperformance includes a reduction in its exposure under the contractinterest rate swap contracts as a result of this posted collateral.
For all of its derivative instruments with credit-risk related contingent features:
•If TVA remains a majority-owned U.S. government entity but Standard & Poor's Financial Services, LLC ("S&P") or Moody's Investors Service, Inc. ("Moody's") downgrades TVA's credit rating to AA or Aa2, respectively, TVA's collateral obligations would likely increase by $22 million, and
•If TVA ceases to be majority-owned by the U.S. government, TVA's credit rating would likely be downgraded and TVA would be required to post additional collateral.
Counterparty Risk
TVA may be exposed to certain risks when a counterparty has the potential to fail to meet its obligations in accordance with agreed terms. These risks may be related to credit, operational, or nonperformance matters. To mitigate certain counterparty risk, TVA analyzes the counterparty's financial condition prior to entering into an agreement, establishes credit limits, monitors the appropriateness of those limits, as well as any changes in the creditworthiness of the counterparty, on an ongoing basis, and when required, employs credit mitigation measures, such as collateral or prepayment arrangements and master purchase and sale agreements.Investment Funds
Customers Investment funds consist primarily of trust funds designated to fund decommissioning requirements (see Note 22 — Commitments and Contingencies — Contingencies — Decommissioning Costs), the Supplemental Executive Retirement Plan ("SERP") (see Note 20 — Benefit Plans— Overview of Plans and Benefits — Supplemental Executive Retirement Plan), the Deferred Compensation Plan ("DCP"), and the Restoration Plan ("RP"). The Nuclear Decommissioning Trust ("NDT") holds funds primarily for the ultimate decommissioning of TVA's nuclear power plants. The Asset Retirement Trust ("ART") holds funds primarily for the costs related to the future closure and retirement of TVA's other long-lived assets. The NDT, ART, SERP, DCP, and RP funds are invested in portfolios of securities generally designed to achieve a return in line with overall equity and debt market performance. The NDT, ART, SERP, DCP, and RP funds are all classified as trading.
Research and Development Costs
Research and development costs are expensed when incurred. TVA's research programs include those related to power delivery technologies, emerging technologies (clean energy, renewables, distributed resources, and energy efficiency), technologies related to generation (fossil fuel, nuclear, and hydroelectric), and environmental technologies.
Tax Equivalents
TVA is exposednot subject to counterparty credit risk associated with trade accounts receivablefederal income taxation. In addition, neither TVA nor its property, franchises, or income is subject to taxation by states or their subdivisions. The TVA Act requires TVA to make payments to states and counties in which TVA conducts its power operations and in which TVA has acquired power properties previously subject to state and local taxation. The total amount of these payments is five percent of gross revenues from deliveredsales of power during the preceding year, excluding sales or deliveries to LPCs, and from industries andother federal agencies directly served, all locatedand off-system sales with other utilities, with a provision for minimum payments under certain circumstances. TVA calculates tax equivalent expense by subtracting the prior year fuel cost-related tax equivalent regulatory asset or liability from the payments made to the states and counties during the current year and adding back the current year fuel cost-related tax equivalent regulatory asset or liability. Fuel cost-related tax equivalent expense is recognized in the Tennessee Valley region. Ofsame accounting period in which the $1.4 billionfuel cost-related revenue is recognized.
Maintenance Costs
TVA records maintenance costs and $1.6 billionrepairs related to its property, plant, and equipment on the Consolidated Statements of receivables from power sales outstanding at September 30, 2020Operations as they are incurred except for the recording of certain regulatory assets for retirement and 2019, respectively, nearly all counterparties were rated investment grade. The obligations of customers that are not investment grade are secured by collateral. TVA is also exposed to risk from exchange power arrangements with a small number of investor-owned regionalremoval costs.
2. Impact of New Accounting Standards and Interpretations
utilities
The following accounting standards have been issued but as of September 30, 2023, were not effective and had not been adopted by TVA:
| | | | | |
| Accounting for Contract Assets and Contract Liabilities from Contracts with Customers |
| Description | This guidance requires an entity (acquirer) to recognize and measure contract assets and contract
liabilities acquired in a business combination in accordance with revenue with customers. It is
expected that an acquirer will generally recognize and measure acquired contract assets and contract
liabilities in a manner consistent with how the acquiree recognized and measured contract assets and
contract liabilities in the acquiree’s financial statement. The entity should apply the standard prospectively to business combinations occurring on or after the effective date of the standard. |
| Effective Date for TVA | This new standard is effective for TVA’s interim and annual reporting periods beginning October 1,
2023. TVA adopted the standard on October 1, 2023, on a prospective basis. While early adoption was permitted, TVA did not adopt the standard early. |
| Effect on the Financial Statements or Other Significant Matters | Adoption of this standard did not have a material impact on TVA's financial condition, results of operations, or cash flows. |
|
|
| |
| |
| |
|
|
| |
| |
| |
|
|
| |
| |
| |
| | | | | |
| Troubled Debt Restructurings and Vintage Disclosures |
| Description | This guidance eliminates the recognition and measurement guidance on troubled debt restructuring for
creditors that have adopted Financial Instruments-Credit Losses and requires enhanced disclosures
about loan modifications for borrowers experiencing financial difficulty. Additionally, the guidance
requires public business entities to present current-period gross write-offs by year of origination in their
vintage disclosures. The entity should apply the standard prospectively except for the transition method related to the recognition and measurement of troubled debt restructuring. For the transition method, an entity has the option to apply a modified retrospective transition method, resulting in a cumulative-effect adjustment to retained earnings in the period of adoption. |
| Effective Date for TVA | This new standard is effective for TVA’s interim and annual reporting periods beginning October 1,
2023. TVA adopted the standard on October 1, 2023, on a prospective basis. While early adoption was permitted, TVA did not adopt the standard early. |
| Effect on the Financial Statements or Other Significant Matters | Adoption of this standard did not have a material impact on TVA's financial condition, results of operations, or cash flows. |
|
|
| |
| |
| |
|
|
| |
| |
| |
|
|
| |
| |
| |
3. Accounts Receivable, Net
Accounts receivable primarily consist of amounts due from customers for power sales. The table below summarizes the types and amounts of TVA's accounts receivable:
| | | | | | | | | | | |
Accounts Receivable, Net At September 30 (in millions) |
| | 2023 | | 2022 |
| Power receivables | $ | 1,627 | | | $ | 1,899 | |
| Other receivables | 118 | | | 108 | |
| | | |
Accounts receivable, net(1) | $ | 1,745 | | | $ | 2,007 | |
Note
(1) Allowance for uncollectible accounts was less than $1 million at both September 30, 2023 and 2022, and therefore is not represented in the table above.
4. Inventories, Net
The table below summarizes the types and amounts of TVA's inventories:
| | | | | | | | | | | |
Inventories, Net At September 30 (in millions) |
| | 2023 | | 2022 |
| Materials and supplies inventory | $ | 849 | | | $ | 808 | |
| Fuel inventory | 313 | | | 303 | |
| Renewable energy certificates/emissions allowance inventory, net | 15 | | | 18 | |
| Allowance for inventory obsolescence | (69) | | | (57) | |
| Inventories, net | $ | 1,108 | | | $ | 1,072 | |
5. Other Current Assets
Other current assets consisted of the following:
| | | | | | | | | | | | | |
Other Current Assets At September 30 (in millions) | | |
| | 2023 | | 2022(1) | | |
| Inventory work-in-progress | $ | 28 | | | $ | 18 | | | |
| Current portion of prepaid long-term service agreements | 25 | | | 12 | | | |
| Commodity contract derivative assets | 21 | | | 172 | | | |
| Prepaid software maintenance | 18 | | | 14 | | | |
| Prepaid insurance | 16 | | | 16 | | | |
| | | | | |
| Other | 26 | | | 25 | | | |
| Other current assets | $ | 134 | | | $ | 257 | | | |
Note
(1) At September 30, 2022, $18 million, $14 million, $16 million, and $12 million previously classified as Other (a component of Other current assets) have been reclassified to Inventory work-in-progress (a component of Other current assets), Prepaid software maintenance (a component of Other current assets), Prepaid insurance (a component of Other current assets), and Current portion of prepaid long-term service agreements (a component of Other current assets), respectively, to conform with current year presentation.
Commodity Contract Derivative Assets. TVA enters into certain derivative contracts for natural gas that require physical
delivery of the contracted quantity of the commodity as well as certain financial derivative contracts to hedge exposure to the price of natural gas. Commodity contract derivative assets classified as current include deliveries or settlements that will occur within 12 months or less. SeeNote 15 — Risk Management Activities and Derivative Transactions — Derivatives Not Receiving Hedge Accounting Treatment — Commodity Derivatives and — Commodity Derivatives under the FHP for adiscussion of TVA's commodity contract derivatives.
6. Net Completed Plant
Net completed plant consisted of the following:
| | | | | | | | | | | | | | | | | | | | | | | | | | | | | | | | | | | |
Net Completed Plant At September 30 (in millions) |
| | 2023 | | 2022 |
| | Cost | | Accumulated Depreciation | |
Net | | Cost | | Accumulated Depreciation | | Net |
Coal-fired(1) | $ | 18,525 | | | $ | 14,464 | | | $ | 4,061 | | | $ | 18,145 | | | $ | 13,649 | | | $ | 4,496 | |
| Gas and oil-fired | 6,663 | | | 2,057 | | | 4,606 | | | 6,112 | | | 1,957 | | | 4,155 | |
| Nuclear | 26,803 | | | 13,557 | | | 13,246 | | | 26,629 | | | 12,928 | | | 13,701 | |
| Transmission | 9,375 | | | 3,359 | | | 6,016 | | | 8,919 | | | 3,301 | | | 5,618 | |
| Hydroelectric | 4,109 | | | 1,241 | | | 2,868 | | | 3,987 | | | 1,192 | | | 2,795 | |
| Other electrical plant | 1,798 | | | 780 | | | 1,018 | | | 1,724 | | | 807 | | | 917 | |
| Multipurpose dams | 900 | | | 404 | | | 496 | | | 900 | | | 396 | | | 504 | |
| Other stewardship | 26 | | | 9 | | | 17 | | | 26 | | | 9 | | | 17 | |
| | | | | | | | | | | |
| Total | $ | 68,199 | | | $ | 35,871 | | | $ | 32,328 | | | $ | 66,442 | | | $ | 34,239 | | | $ | 32,203 | |
Note
(1) TVA recognized accelerated depreciation as a result of the decision to idle or retire certain units and the potential retirement of the remainder of the coal-fired fleet by 2035. See Note 7 — Plant Closures.
7. Plant Closures
Background
TVA must continuously evaluate all generating assets to ensure an optimal energy portfolio that provides safe, clean, and reliable power while maintaining flexibility and fiscal responsibility to the people of the Tennessee Valley. Based on results of assessments presented to the TVA Board in 2019, the retirement of Bull Run Fossil Plant ("Bull Run") by December 2023 was approved, and as of September 30, 2023, the facility was retired. In addition, TVA is evaluating the impact of retiring the balance of the coal-fired fleet by 2035, and that evaluation includes environmental reviews, public input, and TVA Board approval. Due to these evaluations, certain planning assumptions were updated, and their financial impacts are discussed below.
In January 2023, TVA issued its Record of Decision to retire the two coal-fired units at Cumberland Fossil Plant ("Cumberland") by the end of CY 2026 and CY 2028.
Financial Impact
TVA's policy is to adjust depreciation rates to reflect the most current assumptions, ensuring units will be fully depreciated by the applicable retirement dates. As a result of TVA's decision to accelerate the retirement of Bull Run, TVA has recognized a cumulative $659 million of accelerated depreciation since the second quarter of 2019. Of this amount, $177 million, $140 million, and $136 million were recognized for the years ended September 30, 2023, 2022, and 2021, respectively. TVA's decision to retire the two units at Cumberland is estimated to result in approximately $16 million of additional depreciation quarterly, which does not include any potential impact from additions or retirements to net completed plant. TVA estimates it has recognized a cumulative $48 million of additional depreciation since January 2023, related to either delivered power or the replacement of open positions of longer-term purchased power or fuel agreements. this decision.
TVA believes its policiesalso recognized $14 million, $22 million, and procedures for counterparty performance risk reviews have generally protected TVA against significant exposure$4 million in Operating and maintenance expense related to marketadditional inventory reserves and project write-offs for the coal-fired fleet, including Bull Run and Cumberland, for the years ended September 30, 2023, 2022, and 2021, respectively.
8. Leases
The following table provides information regarding the presentation of leases on the Consolidated Balance Sheets:
| | | | | | | | | | | | | | |
Amounts Recognized on TVA's Consolidated Balance Sheets At September 30 (in millions) |
| | 2023 | | 2022 |
| Assets | | | | |
| Operating | Operating lease assets, net of amortization | $ | 177 | | | $ | 155 | |
| Finance | Finance leases | 572 | | | 630 | |
| Total lease assets | | $ | 749 | | | $ | 785 | |
| | | | |
| Liabilities | | | | |
| Current | | | | |
| Operating | Accounts payable and accrued liabilities | $ | 71 | | | $ | 59 | |
| Finance | Accounts payable and accrued liabilities | 56 | | | 59 | |
| Non-current | | | | |
| Operating | Other long-term liabilities | 93 | | | 93 | |
| Finance | Finance lease liabilities | 576 | | | 628 | |
| Total lease liabilities | | $ | 796 | | | $ | 839 | |
TVA's leases consist primarily of railcars, equipment, real estate/land, power generating facilities, and gas pipelines. TVA's leases have various terms and expiration dates remaining from less than one year to 23 years. The components of lease costs were as follows:
| | | | | | | | | | | | | | | | | | | |
Lease Costs For the years ended September 30 (in millions) |
| 2023 | | 2022 | | 2021 | | |
Operating lease costs(1) | $ | 69 | | | $ | 56 | | | $ | 52 | | | |
Variable lease costs(1) | 134 | | | 78 | | | 75 | | | |
Short-term lease costs(1) | 18 | | | 26 | | | 12 | | | |
| Finance lease costs | | | | | | | |
Amortization of lease assets(2) | 57 | | | 58 | | | 51 | | | |
Interest on lease liabilities(3)(4) | 43 | | | 42 | | | 39 | | | |
| Total finance lease costs | 100 | | | 100 | | | 90 | | | |
| Total lease costs | $ | 321 | | | $ | 260 | | | $ | 229 | | | |
Notes
(1) Costs are included in Operating and maintenance expense, Fuel expense, Purchased power expense, and Tax equivalents expense on the Consolidated Statements of Operations.
(2) Expense is included in Depreciation and amortization expense on the Consolidated Statements of Operations.
(3) Expense is included in Interest expense on the Consolidated Statements of Operations.
(4) Certain finance leases receive regulatory accounting treatment and are reclassified to Fuel expense and Purchased power expense.
TVA's variable lease costs are primarily related to renewable energy purchase agreements that require TVA to purchase all output from the underlying facility. Payments under those agreements are solely based on the actual output over the lease term. Certain TVA lease agreements contain renewal options. Those renewal options that are reasonably certain to be exercised are included in the lease measurements.
The following table contains additional information with respect to cash and non-cash activities related to leases:
| | | | | | | | | | | | | | | | | |
Amounts Recognized on TVA's Consolidated Statements of Cash Flows For the years ended September 30 (in millions) |
| 2023 | | 2022 | | 2021 |
| Operating cash flows for operating leases | $ | 77 | | | $ | 57 | | | $ | 53 | |
| Operating cash flows for finance leases | 43 | | | 42 | | | 39 | |
| Financing cash flows for finance leases | 56 | | | 60 | | | 52 | |
| | | | | |
| Lease assets obtained in exchange for lease obligations (non-cash) | | | | | |
Operating leases(1) | $ | 84 | | | $ | 43 | | | $ | (22) | |
| Finance leases | 3 | | | — | | | 233 | |
Note
(1) Amount for 2021 represents a non-cash reduction due to a lease that was amended during the fiscal year resulting in derecognition of the operating lease asset and obligation upon remeasurement.
TVA has certain finance leases under PPAs under which the present value of the minimum lease payments exceeds the fair value of the related lease asset at the date of measurement. This resulted in an interest rate that was higher than TVA's incremental borrowing rate. The weighted average remaining lease terms in years and the weighted average discount rate for TVA's operating and financing leases were as follows:
| | | | | | | | | | | |
Weighted Averages At September 30 |
| 2023 | | 2022 |
| Weighted average remaining lease terms | | | |
| Operating leases | 3 years | | 3 years |
| Finance leases | 10 years | | 11 years |
| | | |
Weighted average discount rate(1) | | | |
| Operating leases | 4.1% | | 1.5% |
| Finance leases | 21.6% | | 17.8% |
Note
(1) The discount rate is calculated using the rate implicit in a lease if it is readily determinable. If the rate used by the lessor is not readily determinable, TVA uses its incremental borrowing rate as permitted by accounting guidance. The incremental borrowing rate is influenced by TVA's credit rating and lease term and as such may differ for individual leases, embedded leases, or portfolios of leased assets.
The following table presents maturities of lease liabilities and a reconciliation of the undiscounted cash flows to lease liabilities at September 30, 2023:
| | | | | |
Future Minimum Lease Payments Minimum payments outstanding at September 30, 2023 (in millions) |
| Operating leases | |
| 2024 | $ | 76 | |
| 2025 | 51 | |
| 2026 | 24 | |
| 2027 | 9 | |
| 2028 | 3 | |
| Thereafter | 11 | |
| Minimum annual payments | 174 | |
| Less: present value discount | (10) | |
| Operating present value of net minimum lease payments | $ | 164 | |
| |
| Finance leases | |
| 2024 | $ | 109 | |
| 2025 | 107 | |
| 2026 | 106 | |
| 2027 | 104 | |
| 2028 | 102 | |
| Thereafter | 450 | |
| Minimum annual payments | 978 | |
| Less: amount representing interest | (346) | |
| Finance present value of net minimum lease payments | $ | 632 | |
During the fourth quarter of 2023, TVA entered into a PPA with a term of 2 years that commenced in October 2023. Lease payments made over the term are expected to total approximately $43 million.
TVA has entered into three PPAs with renewable resource providers for solar generation and rights to charge and discharge battery energy storage systems. The systems are considered a lease component in these agreements. These PPAs have terms of 20 years, and are expected to commence between April 2024 and April 2025. Total capacity payments related to these batteries over the term of these PPAs are expected to total $394 million.
9. Other Long-Term Assets
The table below summarizes the types and amounts of TVA's other long-term assets:
| | | | | | | | | | | |
Other Long-Term Assets At September 30 (in millions) |
| | 2023 | | 2022 |
| Loans and other long-term receivables, net | $ | 97 | | | $ | 99 | |
| Prepaid long-term service agreements | 64 | | | 74 | |
EnergyRight® receivables, net | 47 | | | 49 | |
| Prepaid capital assets | 28 | | | — | |
| Commodity contract derivative assets | 12 | | | 102 | |
| | | |
| | | |
| Other | 82 | | | 70 | |
| Total other long-term assets | $ | 330 | | | $ | 394 | |
Loans and Other Long-Term Receivables. TVA's loans and other long-term receivables primarily consist of economic development loans for qualifying organizations and a receivable for reimbursements to recover the cost of providing long-term, on-site storage for spent nuclear fuel. The current and long-term portions of the loans receivable are reported in Accounts receivable, net and Other long-term assets, respectively, on TVA's Consolidated Balance Sheets. At September 30, 2023 and 2022, the carrying amount of the loans receivable, net of discount, reported in Accounts receivable, net was $7 million and $6 million, respectively.
EnergyRight® Receivables. In association with the EnergyRight® program, TVA's local power company customers ("LPCs") offer financing to end-use customers for the purchase of energy-efficient equipment. Depending on the nature of the energy-efficiency project, loans may have a maximum term of five years or 10 years. TVA purchases the resulting loans receivable from its LPCs. The loans receivable are then transferred to a third-party bank with which TVA has agreed to repay in full any loans receivable that have been in default for 180 days or more or that TVA has determined are uncollectible. Given this continuing involvement, TVA accounts for the transfer of the loans receivable as secured borrowings. The current and long-term portions of the loans receivable are reported in Accounts receivable, net and Other long-term assets, respectively, on TVA's Consolidated Balance Sheets. At September 30, 2023 and 2022, the carrying amount of the loans receivable, net of discount, reported in Accounts receivable, net was $12 million and $13 million, respectively. See Note 12 — Other Long-Term Liabilities for information regarding the associated financing obligation.
Allowance for Loan Losses. The allowance for loan loss is an estimate of expected credit losses, measured over the estimated life of the loan receivables, that considers reasonable and supportable forecasts of future economic conditions in addition to information about historical experience and current conditions. See Note 1— Summary of Significant Accounting Policies— — Allowance for Uncollectible Accounts and Note 3 — Accounts Receivable, Net.
TVA had revenue from 2 LPCsThe allowance components, which consist of a collective allowance and specific loans allowance, are based on the risk characteristics of TVA's loans. Loans that collectively accounted for 17 percent of total operating revenue for the years ended both September 30, 2020 and September 30, 2019.share similar risk characteristics are evaluated on a collective basis in measuring credit losses, while loans that do not share similar risk characteristics with other loans are evaluated on an individual basis.
| | | | | | | | | | | |
Allowance Components At September 30 (in millions) |
| 2023 | | 2022 |
EnergyRight® loan reserve | $ | 1 | | | $ | 1 | |
| Economic development loan collective reserve | 1 | | | 1 | |
| Economic development loan specific loan reserve | 1 | | | 1 | |
| | | |
| Total allowance for loan losses | $ | 3 | | | $ | 3 | |
Suppliers.Prepaid Long-Term Service Agreements. TVA assesses potential supplier performance risks, including procurementhas entered into various long-term service agreements for major
maintenance activities at certain of fuel,its combined cycle plants. TVA uses the direct expense method of accounting for these
arrangements. TVA accrues for parts when it takes ownership and services. If suppliersfor contractor services when they are unablerendered. Under
certain of these agreements, payments made exceed the value of parts received and services rendered. The current and long-term portions of the resulting prepayments are reported in Other current assets and Other long-term assets, respectively, on
TVA's Consolidated Balance Sheets. At September 30, 2023 and 2022, prepayments of $25 million and $12 million, respectively, were recorded in Other current assets.
Commodity Contract Derivative Assets. TVA enters into certain derivative contracts for natural gas that require physical delivery of the contracted quantity of the commodity as well as certain financial derivative contracts to performhedge exposure to the price of natural gas. SeeNote 15 — Risk Management Activities and Derivative Transactions — Derivatives Not Receiving Hedge Accounting Treatment — Commodity Derivatives and — Commodity Derivatives under TVA's existing contracts or if TVA is unable to obtain similar services from other vendors, TVA could experience delays, disruptions, additional costs, or other operational outcomes that may impact generation, maintenance, and capital programs. If onethe FHP for adiscussion of TVA's fuelcommodity contract derivatives.
10. Regulatory Assets and Liabilities
TVA records certain assets and liabilities that result from the regulated ratemaking process that would not be recorded under GAAP for non-regulated entities. As such, certain items that would generally be reported in earnings or purchased power suppliers failsthat would impact the Consolidated Statements of Operations are recorded as regulatory assets or regulatory liabilities. Regulatory assets generally represent incurred costs that have been deferred because such costs are probable of future recovery in customer rates. Regulatory liabilities generally represent obligations to performmake refunds to customers for previous collections for costs that are not likely to be incurred or deferral of gains that will be credited to customers in future periods. Components of regulatory assets and regulatory liabilities are summarized in the table below.
| | | | | | | | | | | |
Regulatory Assets and Liabilities At September 30 (in millions) |
| | 2023 | | 2022 |
| Current regulatory assets | | | |
| Unrealized losses on interest rate derivatives | $ | 31 | | | $ | 47 | |
| Unrealized losses on commodity derivatives | 136 | | | 14 | |
| | | |
| | | |
| | | |
| | | |
| Fuel cost adjustment receivable | 11 | | | 77 | |
| | | |
| Total current regulatory assets | 178 | | | 138 | |
| | | |
| Non-current regulatory assets | | | |
| Retirement benefit plans deferred costs | 1,440 | | | 1,839 | |
| Non-nuclear decommissioning costs | 2,922 | | | 2,856 | |
| Unrealized losses on interest rate derivatives | 272 | | | 479 | |
| Nuclear decommissioning costs | 728 | | | 821 | |
| Unrealized losses on commodity derivatives | 52 | | | 1 | |
| | | |
| | | |
| | | |
| | | |
| Other non-current regulatory assets | 152 | | | 138 | |
| Total non-current regulatory assets | 5,566 | | | 6,134 | |
| Total regulatory assets | $ | 5,744 | | | $ | 6,272 | |
| | | |
| Current regulatory liabilities | | | |
| Fuel cost adjustment tax equivalents | $ | 201 | | | $ | 218 | |
| | | |
| Unrealized gains on commodity derivatives | 21 | | | 173 | |
| Total current regulatory liabilities | 222 | | | 391 | |
| | | |
| Non-current regulatory liabilities | | | |
| Retirement benefit plans deferred credits | 95 | | | 70 | |
| Unrealized gains on commodity derivatives | 12 | | | 102 | |
| Total non-current regulatory liabilities | 107 | | | 172 | |
| Total regulatory liabilities | $ | 329 | | | $ | 563 | |
Retirement Benefit Plans Deferred Costs (Credits). TVA measures the funded status of its pension and post-retirement ("OPEB") benefit plans at each year-end balance sheet date. The funded status is measured as the difference between the fair value of plan assets and the benefit obligations at the measurement date for each plan. The changes in funded status are actuarial gains and losses that are recognized on TVA's Consolidated Balance Sheets by adjusting the recognized pension and OPEB liabilities, with the offset deferred as a regulatory asset or a regulatory liability. In an unregulated environment, these deferred costs (credits) would be recognized as an increase or decrease to accumulated other comprehensive income (loss) ("AOCI").
"Incurred cost" is a cost arising from cash paid out or an obligation to pay for an acquired asset or service, and a loss from any cause that has been sustained and for which payment has been or must be made. In the cases of pension and OPEB costs, the unfunded obligation represents a projected liability to the employee for services rendered, and thus it meets the definition of an incurred cost. Therefore, amounts that otherwise would be charged to AOCI for these costs are recorded as a regulatory asset or liability since TVA has historically recovered pension and OPEB expense in rates. Through historical and current year expense included in ratemaking, the TVA Board has demonstrated the ability and intent to include pension and OPEB costs in allowable costs and in rates for ratemaking purposes. As a result, it is probable that future revenue will result from inclusion of the pension and OPEB regulatory assets or regulatory liability in allowable costs for ratemaking purposes.
The regulatory asset and liability are classified as long-term, which is consistent with the pension and OPEB liabilities, and are not amortized to the Consolidated Statements of Operations over a specified recovery period. They are adjusted either upward or downward each year in conjunction with the adjustments to the unfunded pension liability and OPEB liability, as calculated by the actuaries. Ultimately the regulatory asset and liability will be recognized in the Consolidated Statements of Operations in the form of pension and OPEB expense as the actuarial liabilities are eliminated in future periods. See Note 20 — Benefit Plans — Obligations and Funded Status.
Additionally on October 1, 2014, TVA began recognizing pension costs as a regulatory asset to the extent that the amount calculated under GAAP as pension expense differs from the amount TVA contributes to the pension plan. As a result of previous plan design changes, future contributions are expected to exceed the expense calculated under U.S. GAAP. Accordingly, TVA discontinued this regulatory accounting practice as all such deferred costs were recovered as of September 30, 2023.
Non-Nuclear Decommissioning Costs. Non-nuclear decommissioning costs include (1) certain deferred charges related to the future closure and decommissioning of TVA's non-nuclear long-lived assets, (2) recognition of changes in the liability, (3) recognition of changes in the value of TVA's ART, and (4) certain other deferred charges under the terms of its contract withaccounting rules for asset retirement obligations ("AROs"). TVA TVA might losehas established the money that it paidART to more effectively segregate, manage, and invest funds to help meet future non-nuclear AROs. The funds from the ART may be used, among other things, to pay the costs related to the supplierfuture closure and retirement of non-nuclear long-lived assets under various legal requirements. These future costs can be funded through a combination of investment funds set aside in the contractART, future earnings on those investment funds, and havefuture cash contributions to purchase replacement fuelthe ART. In 2023 and 2022, TVA recovered in rates an amount determined by the average life of debt financed for non-nuclear decommissioning expenditures, assuming a 20-year debt service period, and contributions to the ART. Deferred charges will be recovered in rates based on an analysis of the expected expenditures, contributions, and investment earnings required to recover the decommissioning costs. Recovery of future decommissioning costs is dependent upon the future earnings of the ART, timing of decommissioning activities, and changes in decommissioning estimates. The regulatory asset is classified as long-term as amounts recovered are used to service debt or power onto contribute to the spot market, perhaps at a significantly higher price than TVA was entitled to pay under the contract. In addition, TVA might not be able to acquire replacement fuel or power in a timely manner and thus might be unable to satisfy its own obligations to deliver power.ART, which is restricted for future decommissioning costs.
Natural GasUnrealized Losses on Interest Rate Derivatives. TVA purchasesuses regulatory accounting treatment to defer the majorityunrealized gains and losses on certain interest rate derivative contracts. When amounts in these contracts are realized, the resulting gains or losses are included in the ratemaking formula. The unrealized losses on these interest rate derivatives are recorded on TVA's Consolidated Balance Sheets as current and non-current regulatory assets, and the related realized gains or losses, if any, are recorded on TVA's Consolidated Statements of Operations when the contracts settle. A portion of certain unrealized gains and losses will be amortized into earnings over the remaining lives of the contracts. Gains and losses on interest rate derivatives that are expected to be realized within the next year are included as a current regulatory asset or liability on TVA's Consolidated Balance Sheets.
Due to rising interest rates in the financial markets and net settlement payments made during 2023, TVA experienced a reduction in unrealized losses related to its derivative instruments for the year ended September 30, 2023. TVA does not recognize unrealized gains and losses from the investment portfolios and derivative instruments within earnings but rather defers all such gains and losses within a regulatory liability or asset in accordance with its accounting policy. See Note 15 — Risk Management Activities and Derivative Transactions and Note 16 — Fair Value Measurements.
Nuclear Decommissioning Costs. Nuclear decommissioning costs include (1) certain deferred charges related to the future closure and decommissioning of TVA's nuclear generating units under the Nuclear Regulatory Commission ("NRC") requirements, (2) recognition of changes in the liability, (3) recognition of changes in the value of TVA's NDT, and (4) certain other deferred charges under the accounting rules for AROs. These future costs can be funded through a combination of investment funds set aside in the NDT and ART and future earnings on those investment funds. Deferred charges will be recovered in rates based on the analysis of expected expenditures, contributions, and investment earnings required to recover the decommissioning costs. See Note 1 — Summary of Significant Accounting Policies — Investment Funds. Recovery of future decommissioning costs is dependent upon the future earnings of the NDT and ART, timing of decommissioning activities, and changes in decommissioning estimates. The regulatory asset is classified as long-term as amounts recovered are contributed to the NDT or the ART, which are restricted for future decommissioning costs.
Nuclear decommissioning costs decreased $93 million for the year ended September 30, 2023 as compared to the same period of the prior year, primarily due to investment gains in the NDT and amortization of regulatory assets into expenses
during 2023 as amounts were collected in rates, and these increases were partially offset by accretion of the related AROs. See Note 13 — Asset Retirement Obligations and Note 16 — Fair Value Measurements.
Unrealized Gains (Losses) on Commodity Derivatives. TVA enters into certain derivative contracts for natural gas requirements fromthat require the physical delivery of the contracted quantity of the commodity. Unrealized gains (losses) on natural gas purchase contracts, included as part of unrealized gains (losses) on commodity derivatives, relate to the mark-to-market ("MtM") valuation of natural gas purchase contracts. The natural gas purchase contracts qualify as derivative contracts but do not qualify for cash flow hedge accounting treatment. As a varietyresult, TVA recognizes the changes in the market value of suppliersthese derivative contracts as a regulatory liability or asset. This treatment reflects TVA's ability and intent to recover the cost of these commodity contracts on a settlement basis for ratemaking purposes through the fuel cost adjustment. TVA recognizes the actual cost of fuel received under primarily short-term contracts. Inthese contracts in fuel expense at the eventtime the fuel is used to generate electricity. These contracts expire at various times through March 2026. Unrealized gains and losses on contracts with a maturity of nonperformance byless than one year are included as a current regulatory asset or liability on TVA's Consolidated Balance Sheets. See Note 15 — Risk Management Activities and Derivative Transactions.
TVA reinstated the FHP in December 2021, and hedging activity began under the program in the second quarter of 2022. Currently, TVA is hedging exposure to the price of natural gas under the FHP. Deferred gains and losses relating to TVA's FHP are included as part of unrealized gains and losses on commodity derivatives. TVA defers all MtM unrealized gains or losses as regulatory liabilities or assets, respectively, and records the realized gains or losses in fuel and purchased power expense as the contracts settle to match the delivery period of the underlying commodity. This accounting treatment reflects TVA's ability and intent to include the realized gains or losses of these suppliers, TVA believescommodity contracts in future periods through the fuel cost adjustment. Net unrealized gains and losses for any settlements that it can obtain replacement natural gas.occur within 12 months or less are classified as a current regulatory liability or asset. See Note 15 — Risk Management Activities and Derivative Transactions.
Fuel Cost Adjustment Receivable. The fuel cost adjustment provides a mechanism to alter rates monthly to reflect changing fuel and purchased power costs. There is typically a lag between the occurrence of a change in fuel and purchased power costs and the reflection of the change in fuel rates. Balances in the fuel cost adjustment regulatory accounts represent over-collected or under-collected revenues that offset fuel and purchased power costs, and the fuel rate is designed to recover or refund the balance in less than one year.
Other Non-Current Regulatory Assets. Other non-current regulatory assets consist of the following:
CoalDeferred Lease Asset and Other Financing Obligations. To help ensure a reliable supply of coal,For certain leases, TVA had coal contracts with multiple suppliersrecognized the initial finance lease and other financing asset and liability at September 30, 2020. The contracted supply of coal is sourced from multiple geographic regionsinception of the United States and is to be delivered via various transportation methods (e.g., barge, rail, and truck). Emerging technologies, environmental regulations, and low natural gas prices have contributed to weak demand for coal. As a result, coal suppliers are facing increased financial pressure, which has led to relatively poor credit ratings and bankruptcies. Continued difficulties by coal suppliers, including impacts from the COVID-19 pandemic, could result in consolidations, additional bankruptcies, restructuring, contract renegotiations,lease or other scenarios.obligation. However, the annual expense recognized in rates is equal to the annual payments, which differs from GAAP treatment for non-regulated entities. This practice results in TVA's asset balances being higher than they otherwise would have been under GAAP, with the difference representing a regulatory asset related to the lease or other financing obligation. These costs will be amortized over the respective lease or other financing obligation terms as payments are made. As the costs associated with this regulatory asset are not currently being considered in rates and the asset is expected to increase over the next year, the regulatory asset has been classified as long-term.
Nuclear FuelDebt Reacquisition Costs. Nuclear fuel is obtained predominantly through long-term uranium concentrate supply contracts, contracted conversion services, contracted enrichment services, orReacquisition expenses, call premiums, and other related costs, such as unamortized debt issue costs associated with redeemed Bond issues, are deferred and amortized (accreted) on a combination thereof,straight-line basis over the weighted average life of TVA's debt portfolio. Because timing of additional reacquisition expenses and contracted fuel fabrication services. The supply markets for uranium concentrates and certain nuclear fuel services are subject to price fluctuations and availability restrictions. Supply market conditions may make procurement contracts subject to credit risk relatedchanges to the potential nonperformanceweighted average life of counterparties. In the event of nonperformance by these or other suppliers, TVA believes that replacement uranium concentrate and nuclear fuel services can be obtained, although at prices that may be unfavorable when compared todebt are uncertain, the prices under the current supply agreements.regulatory asset is classified as long-term.
Purchased PowerRetirement Removal Costs. Retirement removal costs, net of salvage, that are not legally required are recognized as a regulatory asset. Net removal costs are amortized over a one-year period subsequent to completion of the removal activities. TVA treats this regulatory asset as long-term in its entirety primarily because it relates to assets that are long-term in nature.
Fuel Cost Adjustment Tax Equivalents. The fuel cost adjustment includes a provision related to the current funding of the future payments TVA will make. As TVA records the fuel cost adjustment, five percent of the calculation that relates to a future asset or liability for tax equivalent payments is recorded as a current regulatory liability and paid or refunded in the following year.
11. Variable Interest Entities
A VIE is an entity that either (i) has insufficient equity to permit the entity to finance its activities without additional subordinated financial support or (ii) has equity investors who lack the characteristics of owning a controlling financial interest. When TVA determines that it has a variable interest in a VIE, a qualitative evaluation is performed to assess which interest holders have the power to direct the activities that most significantly impact the economic performance of the entity and have the obligation to absorb losses or receive benefits that could be significant to the entity. The evaluation considers the purpose and design of the business, the risks that the business was designed to create and pass along to other entities, the activities of the business that can be directed and which party can direct them, and the expected relative impact of those activities on the economic performance of the business through its life. TVA has the power to direct the activities of an entity when it has the
ability to make key operating and financing decisions, including, but not limited to, capital investment and the issuance of debt. Based on the evaluation of these criteria, TVA has determined it is the primary beneficiary of certain entities and as such is required to account for the VIEs on a power purchaseconsolidated basis.
John Sevier VIEs
In 2012, TVA entered into a $1.0 billion construction management agreement that expires on March 31, 2032,and lease financing arrangement with John Sevier Combined Cycle Generation LLC ("JSCCG") for the completion and lease by TVA of the John Sevier Combined Cycle Facility ("John Sevier CCF"). JSCCG is a special single-purpose limited liability company formed in January 2012 to finance the John Sevier CCF through a $900 million secured note issuance (the "JSCCG notes") and the issuance of $100 million of membership interests subject to mandatory redemption. The membership interests were purchased by John Sevier Holdco LLC ("Holdco"). Holdco is a special single-purpose entity, also formed in January 2012, established to acquire and hold the membership interests in JSCCG. A non-controlling interest in Holdco is held by a third-party through nominal membership interests, to which none of the income, expenses, and cash flows are allocated.
The membership interests held by Holdco in JSCCG were purchased with proceeds from the issuance of $100 million of secured notes (the "Holdco notes") and are subject to mandatory redemption pursuant to a schedule of amortizing, semi-annual payments due each January 15 and July 15, with a supplierfinal payment due in January 2042. The payment dates for the mandatorily redeemable membership interests are the same as those of electricity for 440 megawatts ("MW")the Holdco notes. The sale of summer net capabilitythe JSCCG notes, the membership interests in JSCCG, and the Holdco notes closed in January 2012. The JSCCG notes are secured by TVA's lease payments, and the Holdco notes are secured by Holdco's investment in, and amounts receivable from, a lignite-fired generating plant.JSCCG. TVA's lease payments to JSCCG are equal to and payable on the same dates as JSCCG's and Holdco's semi-annual debt service payments. In addition to the lease payments, TVA pays administrative and miscellaneous expenses incurred by JSCCG and Holdco. Certain agreements related to this transaction contain default and acceleration provisions.
Due to its participation in the design, business activity, and credit and financial support of JSCCG and Holdco, TVA has determined that it has a variable interest in each of these entities. Based on its analysis, TVA has concluded that it is the supplierprimary beneficiary of JSCCG and Holdco and, as such, is required to account for the VIEs on a consolidated basis. Holdco's membership interests in JSCCG are eliminated in consolidation.
Southaven VIE
In 2013, TVA entered into a $400 million lease financing arrangement with Southaven Combined Cycle Generation LLC ("SCCG") for the lease by TVA of the Southaven Combined Cycle Facility ("Southaven CCF"). SCCG is a special single-purpose limited liability company formed in June 2013 to finance the Southaven CCF through a $360 million secured notes issuance (the "SCCG notes") and the issuance of $40 million of membership interests subject to mandatory redemption. The membership interests were purchased by Southaven Holdco LLC ("SHLLC"). SHLLC is a special single-purpose entity, also formed in June 2013, established to acquire and hold the membership interests in SCCG. A non-controlling interest in SHLLC is held by a third-party through nominal membership interests, to which none of the income, expenses, and cash flows of SHLLC are allocated.
The membership interests held by SHLLC were purchased with proceeds from the issuance of $40 million of secured notes (the "SHLLC notes") and are subject to mandatory redemption pursuant to a schedule of amortizing, semi-annual payments due each February 15 and August 15, with a final payment due on August 15, 2033. The payment dates for the mandatorily redeemable membership interests are the same as those of the SHLLC notes, and the payment amounts are sufficient to provide returns on, as well as returns of, capital until the investment has been repaid to SHLLC in full. The rate of return on investment to SHLLC is seven percent, which is reflected as interest expense in the Consolidated Statements of Operations. SHLLC is required to pay a pre-determined portion of the return on investment to Seven States Southaven, LLC ("SSSL") on each lease payment date as agreed in SHLLC's formation documents (the "Seven States Return"). The current and long-term portions of the Membership interests of VIE subject to mandatory redemption are included in Accounts payable and accrued liabilities and Other long-term liabilities, respectively.
The payment dates for the mandatorily redeemable membership interests are the same as those of the SHLLC notes. The SCCG notes are secured by TVA's lease payments, and the SHLLC notes are secured by SHLLC's investment in, and amounts receivable from, SCCG. TVA's lease payments to SCCG are payable on the same dates as SCCG's and SHLLC's semi-annual debt service payments and are equal to the sum of (i) the amount of SCCG's semi-annual debt service payments, (ii) the amount of SHLLC's semi-annual debt service payments, and (iii) the amount of the Seven States Return. In addition to the lease payments, TVA pays administrative and miscellaneous expenses incurred by SCCG and SHLLC. Certain agreements related to this transaction contain default and acceleration provisions.
In the event that TVA were to choose to exercise an early buy out feature of the Southaven facility lease, in part or in whole, TVA must pay to SCCG amounts sufficient for SCCG to repay or partially repay on a pro rata basis the membership interests held by SHLLC, including any outstanding investment amount plus accrued but unpaid return. TVA also has the equivalentright, at any time and without any early redemption of the other portions of the Southaven facility lease payments due to SCCG, to fully repay SHLLC's investment, upon which repayment SHLLC will transfer the membership interests to a non-investment gradedesignee of TVA.
TVA participated in the design, business activity, and financial support of SCCG and has determined that it has a direct variable interest in SCCG resulting from risk associated with the value of the Southaven CCF at the end of the lease term. Based on its analysis, TVA has determined that it is the primary beneficiary of SCCG and, as such, is required to account for the VIE on a consolidated basis.
Impact on Consolidated Financial Statements
The financial statement items attributable to carrying amounts and classifications of JSCCG, Holdco, and SCCG as of September 30, 2023 and 2022, as reflected on the Consolidated Balance Sheets, are as follows:
| | | | | | | | | | | |
Summary of Impact of VIEs on Consolidated Balance Sheets At September 30 (in millions) |
| | 2023 | | 2022 |
| | | |
| | | |
| | | |
| | | |
| Current liabilities | | | |
| Accrued interest | $ | 9 | | | $ | 10 | |
| Accounts payable and accrued liabilities | 1 | | | 2 | |
| Current maturities of long-term debt of variable interest entities | 35 | | | 39 | |
| Total current liabilities | 45 | | | 51 | |
| Other liabilities | | | |
| Other long-term liabilities | 17 | | | 18 | |
| Long-term debt, net | | | |
| Long-term debt of variable interest entities, net | 933 | | | 968 | |
| Total liabilities | $ | 995 | | | $ | 1,037 | |
Interest expense of $48 million, $50 million, and $52 million related to debt of VIEs and membership interests of variable interest entity subject to mandatory redemption is included on the Consolidated Statements of Operations for the years ended September 30, 2023, 2022, and 2021, respectively.
At September 30, 2023, TVA had outstanding debt of VIEs of $968 million and outstanding membership interests subject to mandatory redemption (including current portion) of $18 million issued by one of its VIEs of which it is the primary beneficiary. The following table sets forth TVA's future payments at September 30, 2023:
| | | | | | | | | | | | | | | | | | | | | | | | | | | | | | | | | | | | | | |
Maturities Due in the Year Ending September 30 (in millions) |
| | 2024 | | 2025 | | 2026 | | 2027 | | 2028 | | Thereafter |
Long-term debt of VIEs including current maturities(1) | | $ | 35 | | | $ | 37 | | | $ | 39 | | | $ | 40 | | | $ | 42 | | | $ | 781 | |
| Membership interests of variable interest entity subject to mandatory redemption | | 1 | | | 1 | | | 1 | | | 1 | | | 1 | | | 13 | |
| | | | | | | | | | | | |
Note
(1) Long-term debt of VIEs does not include non-cash item of unamortized debt issue costs of $6 million.
Creditors of the VIEs do not have any recourse to the general credit rating; therefore,of TVA. TVA does not have any obligations to provide financial support to the supplier has provided credit assurance to TVA underVIEs other than as prescribed in the terms of the agreement.agreements related to these transactions.
12. Other Suppliers. At this time, TVA has experienced minimal impacts due to force majeure events, with the exception of a manufacturing delay for a major turbine component. A mitigation strategy was developed by TVA and the vendor to reduce projected delays and impacts to TVA's outage schedule. TVA will continue to monitor the supply base and remain in contact with suppliers to identify potential risks.Long-Term Liabilities
Other long-term liabilities consist primarily of liabilities related to certain derivative agreements as well as liabilities related to operating leases. The table below summarizes the types and amounts of Other long-term liabilities:
| | | | | | | | | | | |
Other Long-Term Liabilities At September 30 (in millions) |
| | 2023 | | 2022(1) |
| Interest rate swap liabilities | $ | 627 | | | $ | 851 | |
| Operating lease liabilities | 93 | | | 93 | |
| Currency swap liabilities | 131 | | | 228 | |
| Commodity contract derivative liabilities | 52 | | | 1 | |
EnergyRight® financing obligation | 55 | | | 58 | |
| Long-term deferred compensation | 41 | | | 39 | |
| Advances for construction | 56 | | | 53 | |
| Long-term deferred revenue | 45 | | | 39 | |
| | | |
| Other | 111 | | | 123 | |
| Total other long-term liabilities | $ | 1,211 | | | $ | 1,485 | |
Derivative CounterpartiesNote(1) At September 30, 2022, $1 million previously classified as Other (a component of Other long-term liabilities) has been reclassified to Commodity contract derivative liabilities (a component of Other long-term liabilities) to conform with current year presentation.
Interest Rate Swap Liabilities. TVA has entered into physical and financial contracts that qualify as derivatives for hedging purposes, and TVA's NDT, ART, and qualified defined benefit pension plan have entered into derivative contracts for investment purposes. If a counterparty to one of the physical or financial derivative transactions defaults, TVA might incur substantial costs in connection with entering into a replacement transaction. If a counterparty to the derivative contracts into which the NDT, the ART, and the qualified pension plan have entered for investment purposes defaults, the value of the investment could decline significantly or perhaps become worthless. TVA has concentrations of credit risk from the banking, coal, and gas industries because multiple companies in these industries serve as counterparties to TVA in various derivative transactions. At September 30, 2020, all of TVA's currency swaps anduses interest rate swaps as well as allto fix variable short-term debt to a fixed rate. The values of these derivatives are included in Other current assets, Accounts payable and accrued liabilities, Accrued interest, and Other long-term liabilities on the derivatives in the NDTConsolidated Balance Sheets. See Note 15 — Risk Management Activities and ART were with banking counterparties whose Moody's credit ratings were A3 or higher.Derivative Transactions
TVA classifies qualified forward natural gas contracts as derivatives. See— Overview of Accounting Treatment and Derivatives Not Receiving Hedge Accounting Treatment above.— Interest Rate Derivatives for information regarding the interest rate swap liabilities.
Operating Lease Liabilities. TVA's operating leases consist primarily of railcars, equipment, real estate/land, and power generating facilities. At September 30, 2020,2023 and 2022, the current portion of TVA's operating leases reported in Accounts payable and accrued liabilities was $71 million and $59 million, respectively. See Note 8 — Leases for more information regarding leases.
Currency Swap Liabilities. To protect against exchange rate risk related to British pound sterling denominated Bond transactions, TVA entered into foreign currency hedges. The values of these derivatives are included in Accounts payable and accrued liabilities and Other long-term liabilities on the Consolidated Balance Sheets. See Note 15 — Risk Management Activities and Derivative Transactions — Overview of Accounting Treatment and Cash Flow Hedging Strategy for Currency Swaps for more information regarding the currency swap liabilities.
Commodity Contract Derivative Liabilities. TVA enters into certain derivative contracts for natural gas that require physical delivery of the contracted quantity of the commodity as well as certain financial derivative contracts to hedge exposure to the price of natural gas. See Note 15 — Risk Management Activities and Derivative Transactions — Derivatives Not Receiving Hedge Accounting Treatment — Commodity Derivatives and — Commodity Derivatives under the FHP for adiscussion of TVA's commodity contract derivatives.
EnergyRight® Financing Obligation. TVA purchases certain loans receivable from its LPCs in association with the EnergyRight® program. The current and long-term portions of the resulting financing obligation are reported in Accounts payable and accrued liabilities and Other long-term liabilities, respectively, on TVA's Consolidated Balance Sheets. At both September 30, 2023 and 2022, the carrying amount of the financing obligation reported in Accounts payable and accrued liabilities was $14 million. See Note 9 — Other Long-Term Assets for information regarding the associated loans receivable.
Long-Term Deferred Compensation. TVA provides compensation arrangements to engage and retain certain employees, both executive and non-executive, which are designed to provide participants with the ability to defer compensation to future periods. The current and long-term portions are recorded in Accounts payable and accrued liabilities and Other long-term liabilities, respectively, on TVA’s Consolidated Balance Sheets. At September 30, 2023 and 2022, the current amount of deferred compensation recorded in Accounts payable and accrued liabilities was $65 million and $53 million, respectively.
Advances for Construction. TVA receives refundable and non-refundable advances for construction that are generally intended to defray all or a portion of the costs of building or extending TVA’s existing power assets. Amounts received are deferred as a liability with the long-term portion representing amounts that will not be recognized within the next 12 months. As projects meet milestones or other contractual obligations, the refundable portion is refunded to the customer and the non-
refundable portion is recognized as contributions in aid of construction and offsets the cost of plant assets. At September 30, 2023 and 2022, the current amount of advances for construction recorded in Accounts payable and accrued liabilities was $39 million and $33 million, respectively.
Long-Term Deferred Revenue. Long-term deferred revenue represents payments received that exceed services rendered resulting in the deferral of revenue. This long-term portion represents amounts that will not be recognized within the next 12 months primarily related to fiber and transmission agreements. The current and long-term portions of the deferral are recorded in Accounts payable and accrued liabilities and Other long-term liabilities, respectively, on TVA’s Consolidated Balance Sheets. At September 30, 2023 and 2022, the current amount of deferred revenue recorded in Accounts payable and accrued liabilities was $21 million and $16 million, respectively.
13. Asset Retirement Obligations
During the year ended September 30, 2023, TVA's total ARO liability increased $327 million.
To estimate its decommissioning obligation related to its nuclear generating stations, TVA uses a probability-weighted, discounted cash flow model which, on a unit-by-unit basis, considers multiple outcome scenarios that include significant estimations and assumptions. Those assumptions include (1) estimates of the cost of decommissioning; (2) the method of decommissioning and the timing of the related cash flows; (3) the license period of the nuclear plant, considering the probability of license extensions; (4) cost escalation factors; and (5) the credit adjusted risk free rate to measure the obligation at the present value of the future estimated costs. TVA has ascribed probabilities to two different decommissioning methods related to its nuclear decommissioning obligation estimate: the DECON method and the SAFSTOR method. The DECON method requires radioactive contamination to be removed from a site and safely disposed of or decontaminated to a level that permits the site to be released for unrestricted use shortly after it ceases operation. The SAFSTOR method allows nuclear facilities to be placed and maintained in a condition that allows the facilities to be safely stored and subsequently decontaminated to levels that permit release for unrestricted use.
TVA also has decommissioning obligations related to its non-nuclear generating sites, ash impoundments, transmission substation and distribution assets, and certain general facilities. To estimate its decommissioning obligation related to these assets, TVA uses estimations and assumptions for the amounts and timing of future expenditures and makes judgments concerning whether or not such costs are considered a legal obligation. Those assumptions include (1) estimates of the costs of decommissioning, (2) the method of decommissioning and the timing of the related cash flows, (3) the expected retirement date of each asset, (4) cost escalation factors, and (5) the credit adjusted risk free rate to measure the obligation at the present value of the future estimated costs. TVA bases its decommissioning estimates for each asset on its identified preferred closure method.
The revisions in non-nuclear estimates increased the liability balance by $362 million for the year ended September 30, 2023. During the year coal combustion residuals ("CCR") closure liabilities at Bull Run, Johnsonville, and Cumberland increased $458 million due to revised cost estimates for final closure activities based on TVA's current approved closure strategies at these sites. Partially offsetting these increases, expected reductions in CCR post-closure costs for long-term monitoring at Gallatin resulted in a decrease of $60 million. In addition, CCR closure liabilities at Cumberland decreased $15 million due to identified changes in the projected timing of certain asset retirement activities, and CCR closure liabilities at Paradise decreased $9 million based on refined project cost estimates.
The revisions in non-nuclear estimates increased $186 million for the year ended September 30, 2022. During the year, TVA completed an engineering review of its cost estimates for closure of certain areas containing coal fines at Paradise Fossil Plant ("Paradise"), which resulted in an increase of $119 million due to expected cost increases for necessary changes in activities associated with proper completion of the closure. CCR closure liabilities at Paradise and Cumberland increased $82 million due to new vendor bids, modified closure designs, and revised estimates for construction costs. Refined project cost assumptions and scope changes related to TVA's AROs for the closure of certain coal yards at its fossil plants resulted in an increase of $57 million. In addition, effective October 1, 2022, TVA implemented revised depreciation rates applicable to its completed plant due to the results of a new depreciation study. The study included a decline in the service life estimates of TVA's coal-fired plants based on current planning assumptions to potentially retire the remainder of the coal-fired fleet by 2035. As a result of the change in service life estimates reflected in the depreciation study, TVA performed an assessment of the assumptions used in the timing of cash flows related to its non-nuclear AROs. Based on the assessment, TVA increased AROs by $47 million due to identified changes in the projections of timing of certain asset retirement activities. Partially offsetting these increases, expected reductions in CCR post-closure costs for maintenance and monitoring at Paradise, Shawnee, and Colbert Fossil Plant ("Colbert") resulted in a decrease of $53 million. CCR closure liabilities at Gallatin decreased $30 million due to selection of a new vendor bid and changes to anticipated timing of certain asset retirement activities. In addition, CCR closure liabilities at Allen Fossil Plant decreased $15 million as a result of changes in cost estimates and anticipated timing of various retirement activities.
The revisions in nuclear estimates increased the liability balance by $61 million for the year ended September 30, 2022. This was primarily due to approval and implementation of the most recent site-specific cost study in September 2022 resulting in an increase of $58 million.
Additionally, during the years ended September 30, 2023 and 2022, both the nuclear and non-nuclear liabilities were increased by periodic accretion, partially offset by settlement projects that were conducted during these periods. The nuclear and non-nuclear accretion amounts were deferred as regulatory assets. During 2023, 2022, and 2021, $188 million, $137 million, and $72 million, respectively, of the related regulatory assets were amortized into expense as these amounts were collected in rates. See Note 10 — Regulatory Assets and Liabilities. TVA maintains investment trusts to help fund its decommissioning obligations. See Note 16 — Fair Value Measurements — Investment Funds and Note 22 — Commitments and Contingencies — Contingencies — Decommissioning Costs for a discussion of the trusts' objectives and the current balances of the trusts.
| | | | | | | | | | | | | | | | | | | | |
Asset Retirement Obligation Activity (in millions) |
| | Nuclear | | Non-Nuclear | | Total | |
| Balance at September 30, 2021 | $ | 3,428 | | | $ | 3,574 | | | $ | 7,002 | | |
| Settlements | (2) | | | (309) | | | (311) | | |
| Revisions in estimate | 61 | | | 186 | | | 247 | | |
| | | | | | |
| | | | | | |
| Accretion (recorded as regulatory asset) | 156 | | | 68 | | | 224 | | |
| | | | | | |
| Balance at September 30, 2022 | 3,643 | | | 3,519 | | | 7,162 | | (1) |
| | | | | | |
| Settlements | (8) | | | (271) | | | (279) | | |
| Revisions in estimate | 7 | | | 362 | | | 369 | | |
| | | | | | |
| | | | | | |
| Accretion (recorded as regulatory asset) | 166 | | | 71 | | | 237 | | |
| | | | | | |
| Balance at September 30, 2023 | $ | 3,808 | | | $ | 3,681 | | | $ | 7,489 | | (1) |
Note
(1) Includes $272 million and $275 million at September 30, 2023 and 2022, respectively, in Current liabilities.
14. Debt and Other Obligations
General
The TVA Act authorizes TVA to issue Bonds in an amount not to exceed $30.0 billion at any time. At September 30, 2023, TVA had only two types of Bonds outstanding: power bonds and discount notes. Power bonds have maturities between one year and 50 years, and discount notes have maturities of less than one year. Power bonds and discount notes are both issued pursuant to Section 15d of the TVA Act and pursuant to the Basic Tennessee Valley Authority Power Bond Resolution adopted by the TVA Board on October 6, 1960, as amended on September 28, 1976, October 17, 1989, and March 25, 1992 (the "Basic Resolution"). Bonds are not obligations of the U.S., and the U.S. does not guarantee the payments of principal or interest on Bonds.
Power bonds and discount notes rank on parity and have first priority of payment from net power proceeds, which are defined as the remainder of TVA's gross power revenues after deducting the costs of operating, maintaining, and administering its power properties and tax equivalent payments, but before deducting depreciation accruals or other charges representing the amortization of capital expenditures, plus the net proceeds from the sale or other disposition of any power facility or interest therein.
TVA considers its scheduled payments under its lease financing arrangements involving John Sevier CCF and Southaven CCF as costs of operating, maintaining, and administering its power properties. Costs of operating, maintaining, and administering TVA's power properties have priority over TVA's payments on the Bonds. Once net power proceeds have been applied to payments on power bonds and discount notes as well as any other Bonds that TVA may issue in the future that rank on parity with counterparties whose ratings rangedor subordinate to power bonds and discount notes, Section 2.3 of the Basic Resolution provides that the remaining net power proceeds shall be used only for (1) minimum payments into the U.S. Treasury required by the TVA Act as repayment of, and as a return on, the Power Program Appropriation Investment; (2) investment in power system assets; (3) additional reductions of TVA's capital obligations; and (4) other lawful purposes related to TVA's power business.
The TVA Act and the Basic Resolution each contain two bond tests: the rate testand the bondholder protection test. Under the rate test, TVA must charge rates for power which will produce gross revenues sufficient to provide funds for, among other things, debt service on outstanding Bonds. As of September 30, 2023, TVA was in compliance with the rate test. See Note 1 — Summary of Significant Accounting Policies — General. Under the bondholder protection test, TVA must, in successive five-year periods, use an amount of net power proceeds at least equal to the sum of (1) the depreciation accruals and other charges representing the amortization of capital expenditures and (2) the net proceeds from Caa2any disposition of power facilities for either the reduction of its capital obligations (including Bonds and the Power Program Appropriation Investment) or investment in power assets. TVA met the bondholder protection test for the five-year period ended September 30, 2020, and must next meet the bondholder protection test for the five-year period ending September 30, 2025.
Secured Debt of VIEs
On August 9, 2013, SCCG issued secured notes totaling $360 million that bear interest at a rate of 3.846 percent. The SCCG notes require amortizing semi-annual payments on each February 15 and August 15, and mature on August 15, 2033. Also on August 9, 2013, SCCG issued $40 million of membership interests subject to A2. mandatory redemption. The proceeds from the secured notes issuance and the issuance of the membership interests were paid to TVA in accordance with the terms of the Southaven head lease. See Note 11 — Variable Interest Entities — Southaven VIE. TVA used the proceeds from the transaction primarily to fund the acquisition of the Southaven CCF from SSSL.
On January 17, 2012, JSCCG issued secured notes totaling $900 million in aggregate principal amount that bear interest at a rate of 4.626 percent. Also on January 17, 2012, Holdco issued secured notes totaling $100 million that bear interest at a rate of 7.1 percent. The JSCCG notes and the Holdco notes require amortizing semi-annual payments on each January 15 and July 15, and mature on January 15, 2042. The Holdco notes require a $10 million balloon payment upon maturity. See Note 11 — Variable Interest Entities — John Sevier VIEs. TVA used the proceeds from the transaction to meet its requirements under the TVA Act.
Secured debt of VIEs, including current maturities, outstanding at September 30, 2023 and 2022 totaled $968 million and $1.0 billion, respectively.
Short-Term Debt
The following table provides information regarding TVA's short-term borrowings:
| | | | | | | | | | | |
Short-Term Borrowings At September 30 |
| | 2023 | | 2022 |
| Gross amount outstanding - discount notes (in millions) | $ | 432 | | | $ | 1,173 | |
| | | |
| Weighted average interest rate - discount notes | 5.29 | % | | 2.93 | % |
Put Options
TVA has two issues of Putable Automatic Rate Reset Securities ("PARRS") outstanding. After a fixed-rate period of five years, the coupon rate on the PARRS may automatically be reset downward under certain market conditions on an annual basis. The coupon rate reset on the PARRS is based on a calculation. For both series of PARRS, the coupon rate will reset downward on the reset date if the rate calculated is below the then-current coupon rate on the Bond. The calculation dates, potential reset dates, and terms of the calculation are different for each series. The coupon rate on the 1998 Series D PARRS may be reset on June 1 (annually) if the sum of the five-day average of the 30-Year Constant Maturity Treasury ("CMT") rate for the week ending the last Friday in April, plus 94 basis points, is below the then-current coupon rate. The coupon rate on the 1999 Series A PARRS may be reset on May 1 (annually) if the sum of the five-day average of the 30-Year CMT rate for the week ending the last Friday in March, plus 84 basis points, is below the then-current coupon rate. The coupon rates may only be reset downward, but investors may request to redeem their Bonds at par value in conjunction with a coupon rate reset for a limited period of time prior to the reset dates under certain circumstances.
The coupon rate for the 1998 Series D PARRS, which mature in June 2028, has been reset eight times, from an initial rate of 6.750 percent to the current rate of 2.134 percent. In connection with these resets, $318 million of the Bonds have been redeemed; therefore, $256 million of the Bonds were outstanding at September 30, 2023. The coupon rate for the 1999 Series A PARRS, which mature in May 2029, has been reset seven times, from an initial rate of 6.50 percent to the current rate of 2.216 percent. In connection with these resets, $316 million of the Bonds have been redeemed; therefore, $208 million of the Bonds were outstanding at September 30, 2023.
Due to the contingent nature of the put option on the PARRS, TVA determines whether the PARRS should be classified as long-term debt or current maturities of long-term debt by calculating the expected reset rate for the Bonds on the calculation dates, described above. If the determination date for reset is before the balance sheet date of the reporting period and the expected reset rate is less than the then-current coupon rate on the PARRS, the PARRS are included in current maturities. Otherwise, the PARRS are included in long-term debt.
Debt Securities Activity
The table below summarizes the long-term debt securities activity for the years ended September 30, 2023 and 2022.
| | | | | | | | | | | | | | |
Debt Securities Activity For the years ended September 30 (in millions) |
| | | 2023 | | 2022 |
| Issues | | | | |
| | | | |
| | | | |
| | | | |
| | | | |
| | | | |
| | | | |
| | | | |
2022 Series A(1) | | $ | — | | | $ | 500 | |
2023 Series A(2) | | 1,000 | | | — | |
| Discount on debt issues | | (8) | | | (16) | |
| Total | | $ | 992 | | | $ | 484 | |
| | | | |
| | | | |
| | | | |
| | | | |
| | | | |
Redemptions/Maturities(3) | | | | |
| | | | |
| | | | |
| | | | |
| | | | |
| | | | |
| | | | |
| 2009 Series B | | $ | 29 | | | $ | 28 | |
| 2012 Series A | | — | | | 1,000 | |
| | | | |
| Total redemptions/maturities of power bonds | | 29 | | | 1,028 | |
| | | | |
| Debt of variable interest entities | | 39 | | | 43 | |
| Total redemptions/maturities of debt | | $ | 68 | | | $ | 1,071 | |
Notes
(1) The 2022 Series A Bonds were issued at 96.786 percent of par.
(2) The 2023 Series A Bonds were issued at 99.187 percent of par.
(3) All redemptions were at 100 percent of par.
Debt Outstanding
Total debt outstanding at September 30, 2023 and 2022, consisted of the following:
| | | | | | | | | | | | | | | | | | | | | | | | | | | | |
Short-Term Debt At September 30 (in millions) |
CUSIP or Other Identifier | | Maturity | | | |
Coupon Rate | | 2023 | | 2022 |
| Short-term debt, net of discounts | | | | | | | | $ | 432 | | | $ | 1,172 | |
| Current maturities of long-term debt of VIEs issued at par | | | | | | | | 35 | | | 39 | |
| | | | | | | | | | |
| Current maturities of power bonds issued at par | | | | | | | | | | |
| | | | | | | | | | |
| | | | | | | | | | |
| | | | | | | | | | |
| 880591EF5 | | 12/15/2023 | | | | 3.770% | | 1 | | | 1 | |
| 880591EF5 | | 6/15/2024 | | | | 3.770% | | 21 | | | 28 | |
| 880591ER9 | | 9/15/2024 | | | | 2.875% | | 1,000 | | | — | |
| | | | | | | | | | |
| | | | | | | | | | |
| | | | | | | | | | |
| | | | | | | | | | |
| | | | | | | | | | |
| Total current maturities of power bonds issued at par | | | | | | | | 1,022 | | | 29 | |
| Total current debt outstanding, net | | | | | | | | $ | 1,489 | | | $ | 1,240 | |
| | | | | | | | | | | | | | | | | | | | | | | | | | | | | | | | | | |
Long-Term Debt At September 30 (in millions) |
CUSIP or Other Identifier | | Maturity | | Coupon
Rate | | | | 2023 Par | | 2022 Par | | Stock Exchange Listings |
| | | | | | | | | | | | |
| | | | | | | | | | | | |
| | | | | | | | | | | | |
| | | | | | | | | | | | |
| | | | | | | | | | | | |
| | | | | | | | | | | | |
| 880591ER9 | | 9/15/2024 | | 2.875% | | | | $ | — | | | $ | 1,000 | | | New York |
| 880591EW8 | | 5/15/2025 | | 0.750% | | | | 1,000 | | | 1,000 | | | New York |
| 880591CJ9 | | 11/1/2025 | | 6.750% | | | | 1,350 | | | 1,350 | | | New York, Hong Kong, Luxembourg, Singapore |
| 880591EU2 | | 2/1/2027 | | 2.875% | | | | 1,000 | | | 1,000 | | | New York |
880591300(3) | | 6/1/2028 | | 2.134% | | | | 256 | | | 256 | | | New York |
880591409(3) | | 5/1/2029 | | 2.216% | | | | 208 | | | 208 | | | New York |
| 880591DM1 | | 5/1/2030 | | 7.125% | | | | 1,000 | | | 1,000 | | | New York, Luxembourg |
| 880591EX6 | | 9/15/2031 | | 1.500% | | | | 500 | | | 500 | | | New York |
| 880591DP4 | | 6/7/2032 | | 6.587% | (2) | | | 305 | | (1) | 279 | | (1) | New York, Luxembourg |
| 880591DV1 | | 7/15/2033 | | 4.700% | | | | 472 | | | 472 | | | New York, Luxembourg |
| 880591EF5 | | 6/15/2034 | | 3.770% | | | | 139 | | | 160 | | | None |
| 880591DX7 | | 6/15/2035 | | 4.650% | | | | 436 | | | 436 | | | New York |
| 880591CK6 | | 4/1/2036 | | 5.980% | | | | 121 | | | 121 | | | New York |
| 880591CS9 | | 4/1/2036 | | 5.880% | | | | 1,500 | | | 1,500 | | | New York |
| 880591CP5 | | 1/15/2038 | | 6.150% | | | | 1,000 | | | 1,000 | | | New York |
| 880591ED0 | | 6/15/2038 | | 5.500% | | | | 500 | | | 500 | | | New York |
| 880591EH1 | | 9/15/2039 | | 5.250% | | | | 2,000 | | | 2,000 | | | New York |
| 880591EP3 | | 12/15/2042 | | 3.500% | | | | 1,000 | | | 1,000 | | | New York |
| 880591DU3 | | 6/7/2043 | | 4.962% | (2) | | | 183 | | (1) | 168 | | (1) | New York, Luxembourg |
| | | | | | | | | | | | |
| 880591EB4 | | 1/15/2048 | | 4.875% | | | | 500 | | | 500 | | | New York, Luxembourg |
| 880591DZ2 | | 4/1/2056 | | 5.375% | | | | 1,000 | | | 1,000 | | | New York |
| 880591EJ7 | | 9/15/2060 | | 4.625% | | | | 1,000 | | | 1,000 | | | New York |
| 880591ES7 | | 9/15/2065 | | 4.250% | | | | 1,000 | | | 1,000 | | | New York |
| 880591EY4 | | 9/15/2052 | | 4.250% | | | | 500 | | | 500 | | | New York |
| 880591EZ1 | | 3/15/2028 | | 3.875% | | | | 1,000 | | | — | | | New York |
| | | | | | | | | | | | |
| | | | | | | | | | | | |
| Subtotal | | | | | | | | 17,970 | | | 17,950 | | | |
| Unamortized discounts, premiums, issue costs, and other | | | | | | | | (126) | | | (124) | | | |
| Total long-term outstanding power bonds, net | | | | | | | | 17,844 | | | 17,826 | | | |
| Long-term debt of VIEs, net | | | | | | | | 933 | | | 968 | | | |
| | | | | | | | | | | | |
| Total long-term debt, net | | | | | | | | $ | 18,777 | | | $ | 18,794 | | | |
Notes
(1) Includes total net exchange gain from currency transactions of $109 million and $150 million at September 30, 2023 and 2022, respectively.
(2) The coupon rate represents TVA's effective interest rate.
(3) TVA PARRS, CUSIP numbers 880591300 and 880591409, may be redeemed under certain conditions. See Put Options above.
| | | | | | | | | | | | | | | | | | | | | | | | | | | | | | | | | | | | | | | | | |
Maturities Due in the Year Ending September 30 (in millions) |
| 2024 | | 2025 | | 2026 | | 2027 | | 2028 | | Thereafter | | Total |
Long-term power bonds including current maturities(1) | $ | 1,022 | | | $ | 1,022 | | | $ | 1,370 | | | $ | 1,020 | | | $ | 1,272 | | | $ | 13,395 | | | $ | 19,101 | |
| | | | | | | | | | | | | |
Short-term debt(2) | 432 | | | — | | | — | | | — | | | — | | | — | | | 432 | |
Notes
(1) Long-term power bonds do not include non-cash items of foreign currency exchange gain of $109 million, unamortized debt issue costs of $41 million, or net
discount on sale of Bonds of $85 million.
(2) Short-term debt does not include the non-cash item of discount on issuance of discount notes of less than $1 million.
Credit Facility Agreements
TVA has funding available under four long-term revolving credit facilities totaling $2.7 billion. See the table below for additional information on the four long-term revolving credit facilities. The interest rate on any borrowing under these facilities varies based on market factors and the rating of TVA's senior unsecured, long-term, non-credit-enhanced debt. TVA is required to pay an unused facility fee on the portion of the total $2.7 billion that TVA has not borrowed or committed under letters of credit. This fee, along with letter of credit fees, may fluctuate depending on the rating of TVA's senior unsecured, long-term, non-credit-enhanced debt. At September 30, 2023 and 2022, there were $535 million and $704 million, respectively, of letters of credit outstanding under these facilities, and there were no borrowings outstanding. TVA's letters of credit are primarily posted as collateral under TVA's interest rate swaps. See Note 15 — Risk Management Activities and Derivative Transactions — Other Derivative Instruments — Collateral. TVA may also post collateral for TVA's currency swaps, for commodity derivatives under the Financial Hedging program ("FHP"), or for certain transactions with third parties that require TVA to post letters of credit.
The following table provides additional information regarding TVA's funding available under the four long-term revolving credit facilities:
| | | | | | | | | | | | | | | | | | | | | | | | | | |
Summary of Long-Term Credit Facilities At September 30, 2023 (in millions) |
| Maturity Date | | Facility Limit | | Letters of Credit Outstanding | | Cash Borrowings | | Availability |
| | | | | | | | |
| February 2025 | | $ | 500 | | | $ | 302 | | | $ | — | | | $ | 198 | |
| March 2026 | | 150 | | | 38 | | | — | | | 112 | |
| September 2026 | | 1,000 | | | 99 | | | — | | | 901 | |
| March 2027 | | 1,000 | | | 96 | | | — | | | 904 | |
| Total | | $ | 2,650 | | | $ | 535 | | | $ | — | | | $ | 2,115 | |
TVA and the U.S. Treasury, pursuant to the TVA Act, have entered into a memorandum of understanding under which the U.S. Treasury provides TVA with a $150 million credit facility. This credit facility was renewed for 2024 with a maturity date of September 30, 2024. Access to this credit facility or other similar financing arrangements with the U.S. Treasury has been available to TVA since the 1960s. TVA can borrow under the U.S. Treasury credit facility only if it cannot issue Bonds in the market on reasonable terms, and TVA considers the U.S. Treasury credit facility a secondary source of liquidity. The interest rate on any borrowing under this facility is based on the average rate on outstanding marketable obligations of the U.S. with maturities from date of issue of 12 months or less. There were no outstanding borrowings under the facility at September 30, 2023. The availability of this credit facility may be impacted by how the U.S. government addresses the possibility of approaching its debt limit.
Lease/Leasebacks
TVA previously entered into leasing transactions to obtain third-party financing for 24 peaking CTs as well as certain qualified technological equipment and software ("QTE"). Due to TVA's continuing involvement with the combustion turbine facilities and the QTE during the leaseback term, TVA accounted for the lease proceeds as financing obligations. There were no outstanding leaseback obligations related to the remaining CTs and QTE at September 30, 2023 and 2022. Prior to 2021, TVA made final rent payments involving 16 CTs and acquired the equity interest related to these transactions. Rent payments under the remaining CT lease/leaseback transactions were made through January 2022. In December 2021, TVA gave notice of its election to acquire the leasehold interests related to the remaining eight CTs for a total of $155 million. One associated acquisition closed in December 2022 for $78 million, and the other acquisition closed in May 2023 for $77 million. As a result, TVA recorded the cash consideration as reacquired rights, which is an intangible asset included in Completed plant on the Consolidated Balance Sheet. The amount will be amortized over the remaining estimated useful life of the underlying CTs. TVA recognized $3 million of amortization expense related to the reacquired rights within the Consolidated Statements of Operations for the year ended September 30, 2023. Transaction costs were not material. The estimated amortization expense will be $5 million annually from 2024 through 2052. The estimated amortization expense will be $2 million in 2053.
15. Risk Management Activities and Derivative Transactions
TVA is exposed to various risks related to commodity prices, investment prices, interest rates, currency exchange rates, and inflation as well as counterparty credit and performance risks. To help manage certain of these risks, TVA has historically entered into various derivative transactions, principally commodity option contracts, forward contracts, swaps, swaptions, futures, and options on futures. Other than certain derivative instruments in its trust investment funds, it is TVA's policy to enter into these derivative transactions solely for hedging purposes and not for speculative purposes.
Overview of Accounting Treatment
TVA recognizes certain of its derivative instruments as either assets or liabilities on its Consolidated Balance Sheets at fair value. The accounting for changes in the slowdownfair value of these instruments depends on (1) whether TVA uses regulatory accounting to defer the derivative gains and losses, (2) whether the derivative instrument has been designated and qualifies for hedge accounting treatment, and (3) if so, the type of hedge relationship (for example, cash flow hedge).
The following tables summarize the accounting treatment that certain of TVA's financial derivative transactions receive:
| | | | | | | | | | | | | | | | | | | | | | | | | | |
Summary of Derivative Instruments That Receive Hedge Accounting Treatment (part 1) Amount of Mark-to-Market Gain (Loss) Recognized in Accumulated Other Comprehensive Income (Loss) For the years ended September 30 (in millions) |
| Derivatives in Cash Flow Hedging Relationship | | Objective of Hedge Transaction | | Accounting for Derivative
Hedging Instrument | | 2023 | | 2022 |
| Currency swaps | | To protect against changes in cash flows caused by changes in foreign currency exchange rates (exchange rate risk) | | Unrealized gains and losses are recorded in AOCI and reclassified to Interest expense to the extent they are offset by gains and losses on the hedged transaction | | $ | 99 | | | $ | (157) | |
| | | | | | | | | | | | | | |
Summary of Derivative Instruments That Receive Hedge Accounting Treatment (part 2)(1) Amount of Gain (Loss) Reclassified from Accumulated Other Comprehensive Income (Loss) to Interest Expense For the years ended September 30 |
| Derivatives in Cash Flow Hedging Relationship | | 2023 | | 2022 |
| Currency swaps | | $ | 42 | | | $ | (93) | |
Note
(1) There were no amounts excluded from effectiveness testing for any of the periods presented. Based on forecasted foreign currency exchange rates, TVA expects to reclassify approximately $20 million of gains from AOCI to Interest expense within the next 12 months to offset amounts anticipated to be recorded in demand andInterest expense related to the impactsforecasted exchange loss on the oildebt.
| | | | | | | | | | | | | | | | | | | | | | | | | | |
Summary of Derivative Instruments That Do Not Receive Hedge Accounting Treatment Amount of Gain (Loss) Recognized in Income on Derivatives(1) For the years ended September 30 (in millions) |
| | | | | | |
| Derivative Type | | Objective of Derivative | | Accounting for Derivative Instrument | | 2023 | | 2022 |
| Interest rate swaps | | To fix short-term debt variable rate to a fixed rate (interest rate risk) | | Mark-to-market gains and losses are recorded as regulatory liabilities and assets, respectively
Realized gains and losses are recognized in Interest expense when incurred during the settlement period and are presented in operating cash flow | | $ | (45) | | | $ | (103) | |
| | | | | | | | |
| | | | | | | | |
| | | | | | | | |
Commodity derivatives
under the FHP | | To protect against fluctuations in market prices of purchased commodities (price risk) | | Mark-to-market gains and losses are recorded as regulatory liabilities and assets, respectively
Realized gains and losses are recognized in Fuel expense or Purchased power expense as the contracts settle to match the delivery period of the underlying commodity(2) | | (348) | | | 47 | |
Notes
(1) All of TVA's derivative instruments that do not receive hedge accounting treatment have unrealized gains (losses) that would otherwise be recognized in income but instead are deferred as regulatory liabilities and gas industryassets. As such, there were no related gains (losses) recognized in income for these unrealized gains (losses) for the years ended September 30, 2023 and 2022.
(2) Of the amount recognized in 2023, $301 million and $47 million were reported in Fuel expense and Purchased power expense, respectively. Of the amount recognized in 2022, $38 million and $9 million were reported in Fuel expense and Purchased power expense, respectively.
| | | | | | | | | | | | | | | | | | | | | | | |
Fair Values of TVA Derivatives At September 30 (in millions) |
| | 2023 | | 2022 |
| Derivatives That Receive Hedge Accounting Treatment: |
| | Balance | | Balance Sheet Presentation | | Balance | | Balance Sheet Presentation |
| Currency swaps | | | | | | | |
| | | | | | | |
| £250 million Sterling | $ | (72) | | | Accounts payable and accrued liabilities $(6); Other long-term liabilities $(66) | | $ | (130) | | | Accounts payable and accrued liabilities $(7); Other long-term liabilities $(123) |
| £150 million Sterling | (69) | | | Accounts payable and accrued liabilities $(4); Other long-term liabilities $(65) | | (110) | | | Accounts payable and accrued liabilities $(5); Other long-term liabilities $(105) |
| | | | | | | |
| Derivatives That Do Not Receive Hedge Accounting Treatment: |
| | Balance | | Balance Sheet Presentation | | Balance | | Balance Sheet Presentation |
| Interest rate swaps | | | | | | | |
| $1.0 billion notional | $ | (499) | | | Other current assets $1; Accrued interest $(27); Other long-term liabilities $(473) | | $ | (672) | | | Accounts payable and accrued liabilities $(9); Accrued interest $(33); Other long-term liabilities $(630) |
| $476 million notional | (159) | | | Other current assets $3; Accrued interest $(8); Other long-term liabilities $(154) | | (233) | | | Accounts payable and accrued liabilities $(3); Accrued interest $(9); Other long-term liabilities $(221) |
| | | | | | | |
| Commodity contract derivatives | 31 | | | Other current assets $21; Other long-term assets $12; Accounts payable and accrued liabilities $(1); Other long-term liabilities $(1) | | 145 | | | Other current assets $118; Other long-term assets $34; Accounts payable and accrued liabilities $(6); Other long-term liabilities $(1) |
| Commodity derivatives under the FHP | (186) | | | Accounts payable and accrued liabilities $(135); Other long-term liabilities $(51) | | 115 | | | Accounts receivable, net $1; Other current assets $54; Other long-term assets $68; Accounts payable and accrued liabilities $(8) |
Cash Flow Hedging Strategy for Currency Swaps
To protect against exchange rate risk related to British pound sterling denominated Bond transactions, TVA entered into foreign currency hedges at the time the Bond transactions occurred. TVA had the following currency swaps outstanding at September 30, 2023:
| | | | | | | | | | | | | | | | | | | | |
| Currency Swaps Outstanding |
| Effective Date of Currency Swap Contract | | Associated TVA Bond Issues Currency Exposure | | Expiration Date of Swap | | Overall Effective
Cost to TVA |
| 2001 | | £250 million | | 2032 | | 6.587% |
| 2003 | | £150 million | | 2043 | | 4.962% |
When the dollar strengthens against the British pound sterling, the exchange gain on the Bond liability and related accrued interest is offset by an equal amount of loss on the swap contract that is reclassified out of AOCI. Conversely, the exchange loss on the Bond liability and related accrued interest is offset by an equal amount of gain on the swap contract that is reclassified out of AOCI. All such exchange gains or losses on the Bond liability and related accrued interest are included in Long-term debt, net and Accrued interest, respectively. The offsetting exchange losses or gains on the swap contracts are recognized in AOCI. If any gain (loss) were to be incurred as a result of the COVID-19 pandemic. TVA will continue to monitorearly termination of the impactsforeign currency swap contract, the resulting income (expense) would be amortized over the remaining life of the associated Bond as a component of Interest expense. The values of the currency swap liabilities are included in Accounts payable and affected credit ratingsaccrued liabilities and enforce contract performance assurance provisions when applicable.Other long-term liabilities on the Consolidated Balance Sheets.
16. Fair Value MeasurementsDerivatives Not Receiving Hedge Accounting Treatment
Fair value is determined based on the exchange price that would be received for an asset or paid to transfer a liability (an exit price) in the asset or liability's principal market, or in the absence of a principal market, the most advantageous market for the asset or liability in an orderly transaction between market participants.Interest Rate Derivatives. Generally TVA uses market or observable inputs as the preferred source of values, followed by assumptions based on hypothetical transactions in the absence of market inputs.
Valuation Techniques
The measurement of fair value results in classification intointerest rate swaps to fix variable short-term debt to a hierarchy by the inputs used to determine the fair value as follows:
| | | | | | | | | | | |
Level 1 | —
| | Unadjusted quoted prices in active markets accessible by the reporting entity for identical assets or liabilities. Active markets are those in which transactions for the asset or liability occur with sufficient frequency and volume to provide pricing.
|
Level 2
| —
| | Pricing inputs other than quoted market prices included in Level 1 that are based on observable market data and that are directly or indirectly observable for substantially the full term of the asset or liability. These include quoted market prices for similar assets or liabilities, quoted market prices for identical or similar assets in markets that are not active, adjusted quoted market prices, inputs from observable data such as interestfixed rate, and yield curves, volatilities and default rates observable at commonly quoted intervals, and inputs derived from observable market data by correlation or other means. |
Level 3 | —
| | Pricing inputs that are unobservable, or less observable, from objective sources. Unobservable inputs are only to be used to the extent observable inputs are not available. These inputs maintain the concept of an exit price from the perspective of a market participant and should reflect assumptions of other market participants. An entity should consider all market participant assumptions that are available without unreasonable cost and effort. These are given the lowest priority and are generally used in internally developed methodologies to generate management's best estimate of the fair value when no observable market data is available. |
A financial instrument's level within the fair value hierarchy (where Level 1 is the highest and Level 3 is the lowest) is based on the lowest level of input significant to the fair value measurement.
The following sections describe the valuation methodologies TVA uses regulatory accounting treatment to measure different financial instruments at fair value. Except fordefer the MtM gains and losses on SERPits interest rate swaps. The net deferred unrealized gains and DCP assets, all changes in fair value of these assets and liabilities have been recordedlosses are classified as changes in regulatory assets, regulatory liabilities or AOCIassets on TVA's Consolidated Balance Sheets and are included in the ratemaking formula when gains or losses are realized. The values of these derivatives are included in Other current assets, Accounts payable and accrued liabilities, Accrued interest, and Other long-term liabilities on the Consolidated Balance Sheets, and realized gains and losses, if any, are included on TVA's Consolidated Statements of Comprehensive Income (Loss). Except for gainsOperations. For the years ended September 30, 2023 and 2022, the changes in fair market value of the interest rate swaps resulted in the reduction in unrealized losses on SERPof $240 million and DCP assets, there has been no impact$728 million, respectively. TVA may hold short-term debt balances lower than the notional amount of the interest rate swaps from time to time due to changes in business conditions and other factors. While actual balances vary, TVA generally plans to maintain average balances of short-term debt equal to or in excess of the Consolidated Statementscombined notional amount of Operations or the Consolidated Statements of Cash Flows related to these fair value measurements.interest rate swaps.
Commodity Derivatives. TVA enters into certain derivative contracts for natural gas that require physical delivery of the contracted quantity of the commodity. TVA may also enter into short-term PPAs with a term of less than one year that provide an option to financially settle contracted power deliveries. This option creates an embedded derivative in the hosting power purchase agreement. TVA marks to market these contracts and defers the unrealized gains (losses) as regulatory liabilities (assets). At September 30, 2023, TVA's natural gas contract derivatives had terms of up to three years.
| | | | | | | | | | | | | | | | | | | | | | | | | | | | | | | | | | | |
Commodity Contract Derivatives At September 30 |
| | 2023 | | 2022 |
| | Number of Contracts | | Notional Amount | | Fair Value (MtM)
(in millions) | | Number of Contracts | | Notional Amount | | Fair Value (MtM) (in millions) |
| | | | | | | | | | | |
| Natural gas contract derivatives | 54 | | 318 million mmBtu | | $ | 31 | | | 44 | | 296 million mmBtu | | $ | 145 | |
| | | | | | | | | | | |
Commodity Derivatives under the FHP. In 2022, the FHP was reinstated, and hedging activity began under the program in the second quarter of 2022. Currently, TVA is hedging exposure to the price of natural gas under the FHP. There is no Value at Risk aggregate transaction limit under the current FHP structure, but the TVA Board reviews and authorizes the use of tolerances and measures annually. TVA's FHP policy prohibits trading financial instruments under the FHP for speculative purposes. At September 30, 2023, TVA's natural gas swap contracts under the FHP had remaining terms of up to five years.
| | | | | | | | | | | | | | | | | | | | | | | | | | | | | | | | | | | |
Commodity Derivatives under Financial Hedging Program(1) At September 30 |
| 2023 | | 2022 |
| Number of Contracts | | Notional Amount | | Fair Value (MtM) (in millions) | | Number of Contracts | | Notional Amount | | Fair Value (MtM) (in millions) |
| Natural gas | | | | | | | | | | | |
| | | | | | | | | | | |
| Swap contracts | 221 | | 388 | million mmBtu | | $ | (186) | | | 225 | | 256 | million mmBtu | | $ | 115 | |
| | | | | | | | | | | |
| | | | | | | | | | | |
| | | | | | | | | | | |
| | | | | | | | | | | |
| | | | | | | | | | | |
| | | | | | | | | | | |
| | | | | | | | | | | |
| | | | | | | | | | | |
Note
(1) Fair value amounts presented are based on the net commodity position with the counterparty. Notional amounts disclosed represent the net value of contractual amounts.
TVA defers all FHP unrealized gains (losses) as regulatory liabilities (assets) and records the realized gains or losses in Fuel expense and Purchased power expense to match the delivery period of the underlying commodity. The fair value of commodity derivatives under the FHP decreased $301 million primarily due to a decrease in forward natural gas prices at September 30, 2023 as compared to September 30, 2022.
Offsetting of Derivative Assets and Liabilities
The amounts of TVA's derivative instruments as reported on the Consolidated Balance Sheets are shown in the table below:
| | | | | | | | | | | | | |
Derivative Assets and Liabilities(1) At September 30 (in millions) |
| |
| 2023 | | | | 2022 |
| Assets | | | | | |
| Interest rate swaps | $ | 4 | | | | | $ | — | |
| Commodity contract derivatives | 33 | | | | | 152 | |
Commodity derivatives under the FHP(2) | — | | | | | 123 | |
| Total derivatives subject to master netting or similar arrangement | $ | 37 | | | | | $ | 275 | |
| | | | | |
| | | | | |
| | | | | |
| | | | | |
| Liabilities | | | | | |
| Currency swaps | $ | 141 | | | | | $ | 240 | |
Interest rate swaps(3) | 662 | | | | | 905 | |
| Commodity contract derivatives | 2 | | | | | 7 | |
Commodity derivatives under the FHP(2) | 186 | | | | | 8 | |
| Total derivatives subject to master netting or similar arrangement | $ | 991 | | | | | $ | 1,160 | |
| | | | | |
| | | | | |
| | | | | |
| |
| | | | | |
| | | | | |
| | | | | |
| | | | | |
| | | | | |
| | | | | |
| | | | | |
| | | | | |
| | | | | |
| | | | | |
Notes
(1) Offsetting amounts include counterparty netting of derivative contracts. Except as discussed below, there were no other material offsetting amounts on TVA's Consolidated Balance Sheets at either September 30, 2023 or 2022.
(2) At September 30, 2023, the gross derivative asset and gross derivative liability was $26 million and $212 million, respectively, with offsetting amounts for each totaling $26 million.
(3) Letters of credit of approximately $509 million and $704 million were posted as collateral at September 30, 2023 and 2022, respectively, to partially secure the liability positions of one of the interest rate swaps in accordance with the collateral requirements for this derivative.
Other Derivative Instruments
Investment Fund Derivatives. Investment funds consist primarily of funds held in the NDT, ART, SERP, DCP, and RP. See Note 16 — Fair Value Measurements — Investment Funds for a discussion of the trusts, plans, and types of investments. The NDT and ART may invest in derivative instruments which may include swaps, futures, options, forwards, and other instruments. At September 30, 2023 and 2022, the NDT held investments in forward contracts to purchase debt securities. The fair values of these derivatives were in net asset positions totaling $11 million and $4 million at September 30, 2023 and 2022, respectively.
Collateral. TVA's interest rate swaps, currency swaps, and commodity derivatives under the FHP contain contract provisions that require a party to post collateral (in a form such as cash or a letter of credit) when the party's liability balance under the agreement exceeds a certain threshold. At September 30, 2023, the aggregate fair value of all derivative instruments with credit-risk related contingent features that were in a liability position was $987 million. TVA's collateral obligations at September 30, 2023, under these arrangements were $429 million, for which TVA had posted $509 million in letters of credit. These letters of credit reduce the available balance under the related credit facilities. TVA's assessment of the risk of its nonperformance includes a reduction in its exposure under the interest rate swap contracts as a result of this posted collateral.
For all of its derivative instruments with credit-risk related contingent features:
•If TVA remains a majority-owned U.S. government entity but Standard & Poor's Financial Services, LLC ("S&P") or Moody's Investors Service, Inc. ("Moody's") downgrades TVA's credit rating to AA or Aa2, respectively, TVA's collateral obligations would likely increase by $22 million, and
•If TVA ceases to be majority-owned by the U.S. government, TVA's credit rating would likely be downgraded and TVA would be required to post additional collateral.
Investment Funds
Investment funds consist primarily of trust funds designated to fund decommissioning requirements (see Note 22 — Commitments and Contingencies — Contingencies — Decommissioning Costs), the Supplemental Executive Retirement Plan ("SERP") (see Note 20 — Benefit Plans— Overview of Plans and Benefits — Supplemental Executive Retirement Plan), the Deferred Compensation Plan ("DCP"), and the Restoration Plan ("RP"). The Nuclear Decommissioning Trust ("NDT") holds funds primarily for the ultimate decommissioning of TVA's nuclear power plants. The Asset Retirement Trust ("ART") holds funds primarily for the costs related to the future closure and retirement of TVA's other long-lived assets. The NDT, ART, SERP, DCP, and RP funds are invested in portfolios of securities generally designed to achieve a return in line with overall equity and debt market performance. The NDT, ART, SERP, DCP, and RP funds are all classified as trading.
Research and Development Costs
Research and development costs are expensed when incurred. TVA's research programs include those related to power delivery technologies, emerging technologies (clean energy, renewables, distributed resources, and energy efficiency), technologies related to generation (fossil fuel, nuclear, and hydroelectric), and environmental technologies.
Tax Equivalents
TVA is not subject to federal income taxation. In addition, neither TVA nor its property, franchises, or income is subject to taxation by states or their subdivisions. The TVA Act requires TVA to make payments to states and counties in which TVA conducts its power operations and in which TVA has acquired power properties previously subject to state and local taxation. The total amount of these payments is five percent of gross revenues from sales of power during the preceding year, excluding sales or deliveries to other federal agencies and off-system sales with other utilities, with a provision for minimum payments under certain circumstances. TVA calculates tax equivalent expense by subtracting the prior year fuel cost-related tax equivalent regulatory asset or liability from the payments made to the states and counties during the current year and adding back the current year fuel cost-related tax equivalent regulatory asset or liability. Fuel cost-related tax equivalent expense is recognized in the same accounting period in which the fuel cost-related revenue is recognized.
Maintenance Costs
TVA records maintenance costs and repairs related to its property, plant, and equipment on the Consolidated Statements of Operations as they are incurred except for the recording of certain regulatory assets for retirement and removal costs.
2. Impact of New Accounting Standards and Interpretations
The following accounting standards have been issued but as of September 30, 2023, were not effective and had not been adopted by TVA:
| | | | | |
| Accounting for Contract Assets and Contract Liabilities from Contracts with Customers |
| Description | This guidance requires an entity (acquirer) to recognize and measure contract assets and contract
liabilities acquired in a business combination in accordance with revenue with customers. It is
expected that an acquirer will generally recognize and measure acquired contract assets and contract
liabilities in a manner consistent with how the acquiree recognized and measured contract assets and
contract liabilities in the acquiree’s financial statement. The entity should apply the standard prospectively to business combinations occurring on or after the effective date of the standard. |
| Effective Date for TVA | This new standard is effective for TVA’s interim and annual reporting periods beginning October 1,
2023. TVA adopted the standard on October 1, 2023, on a prospective basis. While early adoption was permitted, TVA did not adopt the standard early. |
| Effect on the Financial Statements or Other Significant Matters | Adoption of this standard did not have a material impact on TVA's financial condition, results of operations, or cash flows. |
|
|
| |
| |
| |
|
|
| |
| |
| |
|
|
| |
| |
| |
| | | | | |
| Troubled Debt Restructurings and Vintage Disclosures |
| Description | This guidance eliminates the recognition and measurement guidance on troubled debt restructuring for
creditors that have adopted Financial Instruments-Credit Losses and requires enhanced disclosures
about loan modifications for borrowers experiencing financial difficulty. Additionally, the guidance
requires public business entities to present current-period gross write-offs by year of origination in their
vintage disclosures. The entity should apply the standard prospectively except for the transition method related to the recognition and measurement of troubled debt restructuring. For the transition method, an entity has the option to apply a modified retrospective transition method, resulting in a cumulative-effect adjustment to retained earnings in the period of adoption. |
| Effective Date for TVA | This new standard is effective for TVA’s interim and annual reporting periods beginning October 1,
2023. TVA adopted the standard on October 1, 2023, on a prospective basis. While early adoption was permitted, TVA did not adopt the standard early. |
| Effect on the Financial Statements or Other Significant Matters | Adoption of this standard did not have a material impact on TVA's financial condition, results of operations, or cash flows. |
|
|
| |
| |
| |
|
|
| |
| |
| |
|
|
| |
| |
| |
3. Accounts Receivable, Net
Accounts receivable primarily consist of amounts due from customers for power sales. The table below summarizes the types and amounts of TVA's accounts receivable:
| | | | | | | | | | | |
Accounts Receivable, Net At September 30 (in millions) |
| | 2023 | | 2022 |
| Power receivables | $ | 1,627 | | | $ | 1,899 | |
| Other receivables | 118 | | | 108 | |
| | | |
Accounts receivable, net(1) | $ | 1,745 | | | $ | 2,007 | |
Note
(1) Allowance for uncollectible accounts was less than $1 million at both September 30, 2023 and 2022, and therefore is not represented in the table above.
4. Inventories, Net
The table below summarizes the types and amounts of TVA's inventories:
| | | | | | | | | | | |
Inventories, Net At September 30 (in millions) |
| | 2023 | | 2022 |
| Materials and supplies inventory | $ | 849 | | | $ | 808 | |
| Fuel inventory | 313 | | | 303 | |
| Renewable energy certificates/emissions allowance inventory, net | 15 | | | 18 | |
| Allowance for inventory obsolescence | (69) | | | (57) | |
| Inventories, net | $ | 1,108 | | | $ | 1,072 | |
5. Other Current Assets
Other current assets consisted of the following:
| | | | | | | | | | | | | |
Other Current Assets At September 30 (in millions) | | |
| | 2023 | | 2022(1) | | |
| Inventory work-in-progress | $ | 28 | | | $ | 18 | | | |
| Current portion of prepaid long-term service agreements | 25 | | | 12 | | | |
| Commodity contract derivative assets | 21 | | | 172 | | | |
| Prepaid software maintenance | 18 | | | 14 | | | |
| Prepaid insurance | 16 | | | 16 | | | |
| | | | | |
| Other | 26 | | | 25 | | | |
| Other current assets | $ | 134 | | | $ | 257 | | | |
Note
(1) At September 30, 2022, $18 million, $14 million, $16 million, and $12 million previously classified as Other (a component of Other current assets) have been reclassified to Inventory work-in-progress (a component of Other current assets), Prepaid software maintenance (a component of Other current assets), Prepaid insurance (a component of Other current assets), and Current portion of prepaid long-term service agreements (a component of Other current assets), respectively, to conform with current year presentation.
Commodity Contract Derivative Assets. TVA enters into certain derivative contracts for natural gas that require physical
delivery of the contracted quantity of the commodity as well as certain financial derivative contracts to hedge exposure to the price of natural gas. Commodity contract derivative assets classified as current include deliveries or settlements that will occur within 12 months or less. SeeNote 15 — Risk Management Activities and Derivative Transactions — Derivatives Not Receiving Hedge Accounting Treatment — Commodity Derivatives and — Commodity Derivatives under the FHP for adiscussion of TVA's commodity contract derivatives.
6. Net Completed Plant
Net completed plant consisted of the following:
| | | | | | | | | | | | | | | | | | | | | | | | | | | | | | | | | | | |
Net Completed Plant At September 30 (in millions) |
| | 2023 | | 2022 |
| | Cost | | Accumulated Depreciation | |
Net | | Cost | | Accumulated Depreciation | | Net |
Coal-fired(1) | $ | 18,525 | | | $ | 14,464 | | | $ | 4,061 | | | $ | 18,145 | | | $ | 13,649 | | | $ | 4,496 | |
| Gas and oil-fired | 6,663 | | | 2,057 | | | 4,606 | | | 6,112 | | | 1,957 | | | 4,155 | |
| Nuclear | 26,803 | | | 13,557 | | | 13,246 | | | 26,629 | | | 12,928 | | | 13,701 | |
| Transmission | 9,375 | | | 3,359 | | | 6,016 | | | 8,919 | | | 3,301 | | | 5,618 | |
| Hydroelectric | 4,109 | | | 1,241 | | | 2,868 | | | 3,987 | | | 1,192 | | | 2,795 | |
| Other electrical plant | 1,798 | | | 780 | | | 1,018 | | | 1,724 | | | 807 | | | 917 | |
| Multipurpose dams | 900 | | | 404 | | | 496 | | | 900 | | | 396 | | | 504 | |
| Other stewardship | 26 | | | 9 | | | 17 | | | 26 | | | 9 | | | 17 | |
| | | | | | | | | | | |
| Total | $ | 68,199 | | | $ | 35,871 | | | $ | 32,328 | | | $ | 66,442 | | | $ | 34,239 | | | $ | 32,203 | |
Note
(1) TVA recognized accelerated depreciation as a result of the decision to idle or retire certain units and the potential retirement of the remainder of the coal-fired fleet by 2035. See Note 7 — Plant Closures.
7. Plant Closures
Background
TVA must continuously evaluate all generating assets to ensure an optimal energy portfolio that provides safe, clean, and reliable power while maintaining flexibility and fiscal responsibility to the people of the Tennessee Valley. Based on results of assessments presented to the TVA Board in 2019, the retirement of Bull Run Fossil Plant ("Bull Run") by December 2023 was approved, and as of September 30, 2023, the facility was retired. In addition, TVA is evaluating the impact of retiring the balance of the coal-fired fleet by 2035, and that evaluation includes environmental reviews, public input, and TVA Board approval. Due to these evaluations, certain planning assumptions were updated, and their financial impacts are discussed below.
In January 2023, TVA issued its Record of Decision to retire the two coal-fired units at Cumberland Fossil Plant ("Cumberland") by the end of CY 2026 and CY 2028.
Financial Impact
TVA's policy is to adjust depreciation rates to reflect the most current assumptions, ensuring units will be fully depreciated by the applicable retirement dates. As a result of TVA's decision to accelerate the retirement of Bull Run, TVA has recognized a cumulative $659 million of accelerated depreciation since the second quarter of 2019. Of this amount, $177 million, $140 million, and $136 million were recognized for the years ended September 30, 2023, 2022, and 2021, respectively. TVA's decision to retire the two units at Cumberland is estimated to result in approximately $16 million of additional depreciation quarterly, which does not include any potential impact from additions or retirements to net completed plant. TVA estimates it has recognized a cumulative $48 million of additional depreciation since January 2023, related to this decision.
TVA also recognized $14 million, $22 million, and $4 million in Operating and maintenance expense related to additional inventory reserves and project write-offs for the coal-fired fleet, including Bull Run and Cumberland, for the years ended September 30, 2023, 2022, and 2021, respectively.
8. Leases
The following table provides information regarding the presentation of leases on the Consolidated Balance Sheets:
| | | | | | | | | | | | | | |
Amounts Recognized on TVA's Consolidated Balance Sheets At September 30 (in millions) |
| | 2023 | | 2022 |
| Assets | | | | |
| Operating | Operating lease assets, net of amortization | $ | 177 | | | $ | 155 | |
| Finance | Finance leases | 572 | | | 630 | |
| Total lease assets | | $ | 749 | | | $ | 785 | |
| | | | |
| Liabilities | | | | |
| Current | | | | |
| Operating | Accounts payable and accrued liabilities | $ | 71 | | | $ | 59 | |
| Finance | Accounts payable and accrued liabilities | 56 | | | 59 | |
| Non-current | | | | |
| Operating | Other long-term liabilities | 93 | | | 93 | |
| Finance | Finance lease liabilities | 576 | | | 628 | |
| Total lease liabilities | | $ | 796 | | | $ | 839 | |
TVA's leases consist primarily of railcars, equipment, real estate/land, power generating facilities, and gas pipelines. TVA's leases have various terms and expiration dates remaining from less than one year to 23 years. The components of lease costs were as follows:
| | | | | | | | | | | | | | | | | | | |
Lease Costs For the years ended September 30 (in millions) |
| 2023 | | 2022 | | 2021 | | |
Operating lease costs(1) | $ | 69 | | | $ | 56 | | | $ | 52 | | | |
Variable lease costs(1) | 134 | | | 78 | | | 75 | | | |
Short-term lease costs(1) | 18 | | | 26 | | | 12 | | | |
| Finance lease costs | | | | | | | |
Amortization of lease assets(2) | 57 | | | 58 | | | 51 | | | |
Interest on lease liabilities(3)(4) | 43 | | | 42 | | | 39 | | | |
| Total finance lease costs | 100 | | | 100 | | | 90 | | | |
| Total lease costs | $ | 321 | | | $ | 260 | | | $ | 229 | | | |
Notes
(1) Costs are included in Operating and maintenance expense, Fuel expense, Purchased power expense, and Tax equivalents expense on the Consolidated Statements of Operations.
(2) Expense is included in Depreciation and amortization expense on the Consolidated Statements of Operations.
(3) Expense is included in Interest expense on the Consolidated Statements of Operations.
(4) Certain finance leases receive regulatory accounting treatment and are reclassified to Fuel expense and Purchased power expense.
TVA's variable lease costs are primarily related to renewable energy purchase agreements that require TVA to purchase all output from the underlying facility. Payments under those agreements are solely based on the actual output over the lease term. Certain TVA lease agreements contain renewal options. Those renewal options that are reasonably certain to be exercised are included in the lease measurements.
The following table contains additional information with respect to cash and non-cash activities related to leases:
| | | | | | | | | | | | | | | | | |
Amounts Recognized on TVA's Consolidated Statements of Cash Flows For the years ended September 30 (in millions) |
| 2023 | | 2022 | | 2021 |
| Operating cash flows for operating leases | $ | 77 | | | $ | 57 | | | $ | 53 | |
| Operating cash flows for finance leases | 43 | | | 42 | | | 39 | |
| Financing cash flows for finance leases | 56 | | | 60 | | | 52 | |
| | | | | |
| Lease assets obtained in exchange for lease obligations (non-cash) | | | | | |
Operating leases(1) | $ | 84 | | | $ | 43 | | | $ | (22) | |
| Finance leases | 3 | | | — | | | 233 | |
Note
(1) Amount for 2021 represents a non-cash reduction due to a lease that was amended during the fiscal year resulting in derecognition of the operating lease asset and obligation upon remeasurement.
TVA has certain finance leases under PPAs under which the present value of the minimum lease payments exceeds the fair value of the related lease asset at the date of measurement. This resulted in an interest rate that was higher than TVA's incremental borrowing rate. The weighted average remaining lease terms in years and the weighted average discount rate for TVA's operating and financing leases were as follows:
| | | | | | | | | | | |
Weighted Averages At September 30 |
| 2023 | | 2022 |
| Weighted average remaining lease terms | | | |
| Operating leases | 3 years | | 3 years |
| Finance leases | 10 years | | 11 years |
| | | |
Weighted average discount rate(1) | | | |
| Operating leases | 4.1% | | 1.5% |
| Finance leases | 21.6% | | 17.8% |
Note
(1) The discount rate is calculated using the rate implicit in a lease if it is readily determinable. If the rate used by the lessor is not readily determinable, TVA uses its incremental borrowing rate as permitted by accounting guidance. The incremental borrowing rate is influenced by TVA's credit rating and lease term and as such may differ for individual leases, embedded leases, or portfolios of leased assets.
The following table presents maturities of lease liabilities and a reconciliation of the undiscounted cash flows to lease liabilities at September 30, 2023:
| | | | | |
Future Minimum Lease Payments Minimum payments outstanding at September 30, 2023 (in millions) |
| Operating leases | |
| 2024 | $ | 76 | |
| 2025 | 51 | |
| 2026 | 24 | |
| 2027 | 9 | |
| 2028 | 3 | |
| Thereafter | 11 | |
| Minimum annual payments | 174 | |
| Less: present value discount | (10) | |
| Operating present value of net minimum lease payments | $ | 164 | |
| |
| Finance leases | |
| 2024 | $ | 109 | |
| 2025 | 107 | |
| 2026 | 106 | |
| 2027 | 104 | |
| 2028 | 102 | |
| Thereafter | 450 | |
| Minimum annual payments | 978 | |
| Less: amount representing interest | (346) | |
| Finance present value of net minimum lease payments | $ | 632 | |
During the fourth quarter of 2023, TVA entered into a PPA with a term of 2 years that commenced in October 2023. Lease payments made over the term are expected to total approximately $43 million.
TVA has entered into three PPAs with renewable resource providers for solar generation and rights to charge and discharge battery energy storage systems. The systems are considered a lease component in these agreements. These PPAs have terms of 20 years, and are expected to commence between April 2024 and April 2025. Total capacity payments related to these batteries over the term of these PPAs are expected to total $394 million.
9. Other Long-Term Assets
The table below summarizes the types and amounts of TVA's other long-term assets:
| | | | | | | | | | | |
Other Long-Term Assets At September 30 (in millions) |
| | 2023 | | 2022 |
| Loans and other long-term receivables, net | $ | 97 | | | $ | 99 | |
| Prepaid long-term service agreements | 64 | | | 74 | |
EnergyRight® receivables, net | 47 | | | 49 | |
| Prepaid capital assets | 28 | | | — | |
| Commodity contract derivative assets | 12 | | | 102 | |
| | | |
| | | |
| Other | 82 | | | 70 | |
| Total other long-term assets | $ | 330 | | | $ | 394 | |
Loans and Other Long-Term Receivables. TVA's loans and other long-term receivables primarily consist of economic development loans for qualifying organizations and a receivable for reimbursements to recover the cost of providing long-term, on-site storage for spent nuclear fuel. The current and long-term portions of the loans receivable are reported in Accounts receivable, net and Other long-term assets, respectively, on TVA's Consolidated Balance Sheets. At September 30, 2023 and 2022, the carrying amount of the loans receivable, net of discount, reported in Accounts receivable, net was $7 million and $6 million, respectively.
EnergyRight® Receivables. In association with the EnergyRight® program, TVA's local power company customers ("LPCs") offer financing to end-use customers for the purchase of energy-efficient equipment. Depending on the nature of the energy-efficiency project, loans may have a maximum term of five years or 10 years. TVA purchases the resulting loans receivable from its LPCs. The loans receivable are then transferred to a third-party bank with which TVA has agreed to repay in full any loans receivable that have been in default for 180 days or more or that TVA has determined are uncollectible. Given this continuing involvement, TVA accounts for the transfer of the loans receivable as secured borrowings. The current and long-term portions of the loans receivable are reported in Accounts receivable, net and Other long-term assets, respectively, on TVA's Consolidated Balance Sheets. At September 30, 2023 and 2022, the carrying amount of the loans receivable, net of discount, reported in Accounts receivable, net was $12 million and $13 million, respectively. See Note 12 — Other Long-Term Liabilities for information regarding the associated financing obligation.
Allowance for Loan Losses. The allowance for loan loss is an estimate of expected credit losses, measured over the estimated life of the loan receivables, that considers reasonable and supportable forecasts of future economic conditions in addition to information about historical experience and current conditions. See Note 1 — Summary of Significant Accounting Policies — Allowance for Uncollectible Accounts.
The allowance components, which consist of a collective allowance and specific loans allowance, are based on the risk characteristics of TVA's loans. Loans that share similar risk characteristics are evaluated on a collective basis in measuring credit losses, while loans that do not share similar risk characteristics with other loans are evaluated on an individual basis.
| | | | | | | | | | | |
Allowance Components At September 30 (in millions) |
| 2023 | | 2022 |
EnergyRight® loan reserve | $ | 1 | | | $ | 1 | |
| Economic development loan collective reserve | 1 | | | 1 | |
| Economic development loan specific loan reserve | 1 | | | 1 | |
| | | |
| Total allowance for loan losses | $ | 3 | | | $ | 3 | |
Prepaid Long-Term Service Agreements. TVA has entered into various long-term service agreements for major
maintenance activities at certain of its combined cycle plants. TVA uses the direct expense method of accounting for these
arrangements. TVA accrues for parts when it takes ownership and for contractor services when they are rendered. Under
certain of these agreements, payments made exceed the value of parts received and services rendered. The current and long-term portions of the resulting prepayments are reported in Other current assets and Other long-term assets, respectively, on
TVA's Consolidated Balance Sheets. At September 30, 2023 and 2022, prepayments of $25 million and $12 million, respectively, were recorded in Other current assets.
Commodity Contract Derivative Assets. TVA enters into certain derivative contracts for natural gas that require physical delivery of the contracted quantity of the commodity as well as certain financial derivative contracts to hedge exposure to the price of natural gas. SeeNote 15 — Risk Management Activities and Derivative Transactions — Derivatives Not Receiving Hedge Accounting Treatment — Commodity Derivatives and — Commodity Derivatives under the FHP for adiscussion of TVA's commodity contract derivatives.
10. Regulatory Assets and Liabilities
TVA records certain assets and liabilities that result from the regulated ratemaking process that would not be recorded under GAAP for non-regulated entities. As such, certain items that would generally be reported in earnings or that would impact the Consolidated Statements of Operations are recorded as regulatory assets or regulatory liabilities. Regulatory assets generally represent incurred costs that have been deferred because such costs are probable of future recovery in customer rates. Regulatory liabilities generally represent obligations to make refunds to customers for previous collections for costs that are not likely to be incurred or deferral of gains that will be credited to customers in future periods. Components of regulatory assets and regulatory liabilities are summarized in the table below.
| | | | | | | | | | | |
Regulatory Assets and Liabilities At September 30 (in millions) |
| | 2023 | | 2022 |
| Current regulatory assets | | | |
| Unrealized losses on interest rate derivatives | $ | 31 | | | $ | 47 | |
| Unrealized losses on commodity derivatives | 136 | | | 14 | |
| | | |
| | | |
| | | |
| | | |
| Fuel cost adjustment receivable | 11 | | | 77 | |
| | | |
| Total current regulatory assets | 178 | | | 138 | |
| | | |
| Non-current regulatory assets | | | |
| Retirement benefit plans deferred costs | 1,440 | | | 1,839 | |
| Non-nuclear decommissioning costs | 2,922 | | | 2,856 | |
| Unrealized losses on interest rate derivatives | 272 | | | 479 | |
| Nuclear decommissioning costs | 728 | | | 821 | |
| Unrealized losses on commodity derivatives | 52 | | | 1 | |
| | | |
| | | |
| | | |
| | | |
| Other non-current regulatory assets | 152 | | | 138 | |
| Total non-current regulatory assets | 5,566 | | | 6,134 | |
| Total regulatory assets | $ | 5,744 | | | $ | 6,272 | |
| | | |
| Current regulatory liabilities | | | |
| Fuel cost adjustment tax equivalents | $ | 201 | | | $ | 218 | |
| | | |
| Unrealized gains on commodity derivatives | 21 | | | 173 | |
| Total current regulatory liabilities | 222 | | | 391 | |
| | | |
| Non-current regulatory liabilities | | | |
| Retirement benefit plans deferred credits | 95 | | | 70 | |
| Unrealized gains on commodity derivatives | 12 | | | 102 | |
| Total non-current regulatory liabilities | 107 | | | 172 | |
| Total regulatory liabilities | $ | 329 | | | $ | 563 | |
Retirement Benefit Plans Deferred Costs (Credits). TVA measures the funded status of its pension and post-retirement ("OPEB") benefit plans at each year-end balance sheet date. The funded status is measured as the difference between the fair value of plan assets and the benefit obligations at the measurement date for each plan. The changes in funded status are actuarial gains and losses that are recognized on TVA's Consolidated Balance Sheets by adjusting the recognized pension and OPEB liabilities, with the offset deferred as a regulatory asset or a regulatory liability. In an unregulated environment, these deferred costs (credits) would be recognized as an increase or decrease to accumulated other comprehensive income (loss) ("AOCI").
"Incurred cost" is a cost arising from cash paid out or an obligation to pay for an acquired asset or service, and a loss from any cause that has been sustained and for which payment has been or must be made. In the cases of pension and OPEB costs, the unfunded obligation represents a projected liability to the employee for services rendered, and thus it meets the definition of an incurred cost. Therefore, amounts that otherwise would be charged to AOCI for these costs are recorded as a regulatory asset or liability since TVA has historically recovered pension and OPEB expense in rates. Through historical and current year expense included in ratemaking, the TVA Board has demonstrated the ability and intent to include pension and OPEB costs in allowable costs and in rates for ratemaking purposes. As a result, it is probable that future revenue will result from inclusion of the pension and OPEB regulatory assets or regulatory liability in allowable costs for ratemaking purposes.
The regulatory asset and liability are classified as long-term, which is consistent with the pension and OPEB liabilities, and are not amortized to the Consolidated Statements of Operations over a specified recovery period. They are adjusted either upward or downward each year in conjunction with the adjustments to the unfunded pension liability and OPEB liability, as calculated by the actuaries. Ultimately the regulatory asset and liability will be recognized in the Consolidated Statements of Operations in the form of pension and OPEB expense as the actuarial liabilities are eliminated in future periods. See Note 20 — Benefit Plans — Obligations and Funded Status.
Additionally on October 1, 2014, TVA began recognizing pension costs as a regulatory asset to the extent that the amount calculated under GAAP as pension expense differs from the amount TVA contributes to the pension plan. As a result of previous plan design changes, future contributions are expected to exceed the expense calculated under U.S. GAAP. Accordingly, TVA discontinued this regulatory accounting practice as all such deferred costs were recovered as of September 30, 2023.
Non-Nuclear Decommissioning Costs. Non-nuclear decommissioning costs include (1) certain deferred charges related to the future closure and decommissioning of TVA's non-nuclear long-lived assets, (2) recognition of changes in the liability, (3) recognition of changes in the value of TVA's ART, and (4) certain other deferred charges under the accounting rules for asset retirement obligations ("AROs"). TVA has established the ART to more effectively segregate, manage, and invest funds to help meet future non-nuclear AROs. The funds from the ART may be used, among other things, to pay the costs related to the future closure and retirement of non-nuclear long-lived assets under various legal requirements. These future costs can be funded through a combination of investment funds set aside in the ART, future earnings on those investment funds, and future cash contributions to the ART. In 2023 and 2022, TVA recovered in rates an amount determined by the average life of debt financed for non-nuclear decommissioning expenditures, assuming a 20-year debt service period, and contributions to the ART. Deferred charges will be recovered in rates based on an analysis of the expected expenditures, contributions, and investment earnings required to recover the decommissioning costs. Recovery of future decommissioning costs is dependent upon the future earnings of the ART, timing of decommissioning activities, and changes in decommissioning estimates. The regulatory asset is classified as long-term as amounts recovered are used to service debt or to contribute to the ART, which is restricted for future decommissioning costs.
Unrealized Losses on Interest Rate Derivatives. TVA uses regulatory accounting treatment to defer the unrealized gains and losses on certain interest rate derivative contracts. When amounts in these contracts are realized, the resulting gains or losses are included in the ratemaking formula. The unrealized losses on these interest rate derivatives are recorded on TVA's Consolidated Balance Sheets as current and non-current regulatory assets, and the related realized gains or losses, if any, are recorded on TVA's Consolidated Statements of Operations when the contracts settle. A portion of certain unrealized gains and losses will be amortized into earnings over the remaining lives of the contracts. Gains and losses on interest rate derivatives that are expected to be realized within the next year are included as a current regulatory asset or liability on TVA's Consolidated Balance Sheets.
Due to rising interest rates in the financial markets and net settlement payments made during 2023, TVA experienced a reduction in unrealized losses related to its derivative instruments for the year ended September 30, 2023. TVA does not recognize unrealized gains and losses from the investment portfolios and derivative instruments within earnings but rather defers all such gains and losses within a regulatory liability or asset in accordance with its accounting policy. See Note 15 — Risk Management Activities and Derivative Transactions and Note 16 — Fair Value Measurements.
Nuclear Decommissioning Costs. Nuclear decommissioning costs include (1) certain deferred charges related to the future closure and decommissioning of TVA's nuclear generating units under the Nuclear Regulatory Commission ("NRC") requirements, (2) recognition of changes in the liability, (3) recognition of changes in the value of TVA's NDT, and (4) certain other deferred charges under the accounting rules for AROs. These future costs can be funded through a combination of investment funds set aside in the NDT and ART and future earnings on those investment funds. Deferred charges will be recovered in rates based on the analysis of expected expenditures, contributions, and investment earnings required to recover the decommissioning costs. See Note 1 — Summary of Significant Accounting Policies — Investment Funds. Recovery of future decommissioning costs is dependent upon the future earnings of the NDT and ART, timing of decommissioning activities, and changes in decommissioning estimates. The regulatory asset is classified as long-term as amounts recovered are contributed to the NDT or the ART, which are restricted for future decommissioning costs.
Nuclear decommissioning costs decreased $93 million for the year ended September 30, 2023 as compared to the same period of the prior year, primarily due to investment gains in the NDT and amortization of regulatory assets into expenses
during 2023 as amounts were collected in rates, and these increases were partially offset by accretion of the related AROs. See Note 13 — Asset Retirement Obligations and Note 16 — Fair Value Measurements.
Unrealized Gains (Losses) on Commodity Derivatives. TVA enters into certain derivative contracts for natural gas that require the physical delivery of the contracted quantity of the commodity. Unrealized gains (losses) on natural gas purchase contracts, included as part of unrealized gains (losses) on commodity derivatives, relate to the mark-to-market ("MtM") valuation of natural gas purchase contracts. The natural gas purchase contracts qualify as derivative contracts but do not qualify for cash flow hedge accounting treatment. As a result, TVA recognizes the changes in the market value of these derivative contracts as a regulatory liability or asset. This treatment reflects TVA's ability and intent to recover the cost of these commodity contracts on a settlement basis for ratemaking purposes through the fuel cost adjustment. TVA recognizes the actual cost of fuel received under these contracts in fuel expense at the time the fuel is used to generate electricity. These contracts expire at various times through March 2026. Unrealized gains and losses on contracts with a maturity of less than one year are included as a current regulatory asset or liability on TVA's Consolidated Balance Sheets. See Note 15 — Risk Management Activities and Derivative Transactions.
TVA reinstated the FHP in December 2021, and hedging activity began under the program in the second quarter of 2022. Currently, TVA is hedging exposure to the price of natural gas under the FHP. Deferred gains and losses relating to TVA's FHP are included as part of unrealized gains and losses on commodity derivatives. TVA defers all MtM unrealized gains or losses as regulatory liabilities or assets, respectively, and records the realized gains or losses in fuel and purchased power expense as the contracts settle to match the delivery period of the underlying commodity. This accounting treatment reflects TVA's ability and intent to include the realized gains or losses of these commodity contracts in future periods through the fuel cost adjustment. Net unrealized gains and losses for any settlements that occur within 12 months or less are classified as a current regulatory liability or asset. See Note 15 — Risk Management Activities and Derivative Transactions.
Fuel Cost Adjustment Receivable. The fuel cost adjustment provides a mechanism to alter rates monthly to reflect changing fuel and purchased power costs. There is typically a lag between the occurrence of a change in fuel and purchased power costs and the reflection of the change in fuel rates. Balances in the fuel cost adjustment regulatory accounts represent over-collected or under-collected revenues that offset fuel and purchased power costs, and the fuel rate is designed to recover or refund the balance in less than one year.
Other Non-Current Regulatory Assets. Other non-current regulatory assets consist of the following:
Deferred Lease Asset and Other Financing Obligations. For certain leases, TVA recognized the initial finance lease and other financing asset and liability at inception of the lease or other obligation. However, the annual expense recognized in rates is equal to the annual payments, which differs from GAAP treatment for non-regulated entities. This practice results in TVA's asset balances being higher than they otherwise would have been under GAAP, with the difference representing a regulatory asset related to the lease or other financing obligation. These costs will be amortized over the respective lease or other financing obligation terms as payments are made. As the costs associated with this regulatory asset are not currently being considered in rates and the asset is expected to increase over the next year, the regulatory asset has been classified as long-term.
Debt Reacquisition Costs. Reacquisition expenses, call premiums, and other related costs, such as unamortized debt issue costs associated with redeemed Bond issues, are deferred and amortized (accreted) on a straight-line basis over the weighted average life of TVA's debt portfolio. Because timing of additional reacquisition expenses and changes to the weighted average life of the debt are uncertain, the regulatory asset is classified as long-term.
Retirement Removal Costs. Retirement removal costs, net of salvage, that are not legally required are recognized as a regulatory asset. Net removal costs are amortized over a one-year period subsequent to completion of the removal activities. TVA treats this regulatory asset as long-term in its entirety primarily because it relates to assets that are long-term in nature.
Fuel Cost Adjustment Tax Equivalents. The fuel cost adjustment includes a provision related to the current funding of the future payments TVA will make. As TVA records the fuel cost adjustment, five percent of the calculation that relates to a future asset or liability for tax equivalent payments is recorded as a current regulatory liability and paid or refunded in the following year.
11. Variable Interest Entities
A VIE is an entity that either (i) has insufficient equity to permit the entity to finance its activities without additional subordinated financial support or (ii) has equity investors who lack the characteristics of owning a controlling financial interest. When TVA determines that it has a variable interest in a VIE, a qualitative evaluation is performed to assess which interest holders have the power to direct the activities that most significantly impact the economic performance of the entity and have the obligation to absorb losses or receive benefits that could be significant to the entity. The evaluation considers the purpose and design of the business, the risks that the business was designed to create and pass along to other entities, the activities of the business that can be directed and which party can direct them, and the expected relative impact of those activities on the economic performance of the business through its life. TVA has the power to direct the activities of an entity when it has the
ability to make key operating and financing decisions, including, but not limited to, capital investment and the issuance of debt. Based on the evaluation of these criteria, TVA has determined it is the primary beneficiary of certain entities and as such is required to account for the VIEs on a consolidated basis.
John Sevier VIEs
In 2012, TVA entered into a $1.0 billion construction management agreement and lease financing arrangement with John Sevier Combined Cycle Generation LLC ("JSCCG") for the completion and lease by TVA of the John Sevier Combined Cycle Facility ("John Sevier CCF"). JSCCG is a special single-purpose limited liability company formed in January 2012 to finance the John Sevier CCF through a $900 million secured note issuance (the "JSCCG notes") and the issuance of $100 million of membership interests subject to mandatory redemption. The membership interests were purchased by John Sevier Holdco LLC ("Holdco"). Holdco is a special single-purpose entity, also formed in January 2012, established to acquire and hold the membership interests in JSCCG. A non-controlling interest in Holdco is held by a third-party through nominal membership interests, to which none of the income, expenses, and cash flows are allocated.
The membership interests held by Holdco in JSCCG were purchased with proceeds from the issuance of $100 million of secured notes (the "Holdco notes") and are subject to mandatory redemption pursuant to a schedule of amortizing, semi-annual payments due each January 15 and July 15, with a final payment due in January 2042. The payment dates for the mandatorily redeemable membership interests are the same as those of the Holdco notes. The sale of the JSCCG notes, the membership interests in JSCCG, and the Holdco notes closed in January 2012. The JSCCG notes are secured by TVA's lease payments, and the Holdco notes are secured by Holdco's investment in, and amounts receivable from, JSCCG. TVA's lease payments to JSCCG are equal to and payable on the same dates as JSCCG's and Holdco's semi-annual debt service payments. In addition to the lease payments, TVA pays administrative and miscellaneous expenses incurred by JSCCG and Holdco. Certain agreements related to this transaction contain default and acceleration provisions.
Due to its participation in the design, business activity, and credit and financial support of JSCCG and Holdco, TVA has determined that it has a variable interest in each of these entities. Based on its analysis, TVA has concluded that it is the primary beneficiary of JSCCG and Holdco and, as such, is required to account for the VIEs on a consolidated basis. Holdco's membership interests in JSCCG are eliminated in consolidation.
Southaven VIE
In 2013, TVA entered into a $400 million lease financing arrangement with Southaven Combined Cycle Generation LLC ("SCCG") for the lease by TVA of the Southaven Combined Cycle Facility ("Southaven CCF"). SCCG is a special single-purpose limited liability company formed in June 2013 to finance the Southaven CCF through a $360 million secured notes issuance (the "SCCG notes") and the issuance of $40 million of membership interests subject to mandatory redemption. The membership interests were purchased by Southaven Holdco LLC ("SHLLC"). SHLLC is a special single-purpose entity, also formed in June 2013, established to acquire and hold the membership interests in SCCG. A non-controlling interest in SHLLC is held by a third-party through nominal membership interests, to which none of the income, expenses, and cash flows of SHLLC are allocated.
The membership interests held by SHLLC were purchased with proceeds from the issuance of $40 million of secured notes (the "SHLLC notes") and are subject to mandatory redemption pursuant to a schedule of amortizing, semi-annual payments due each February 15 and August 15, with a final payment due on August 15, 2033. The payment dates for the mandatorily redeemable membership interests are the same as those of the SHLLC notes, and the payment amounts are sufficient to provide returns on, as well as returns of, capital until the investment has been repaid to SHLLC in full. The rate of return on investment to SHLLC is seven percent, which is reflected as interest expense in the Consolidated Statements of Operations. SHLLC is required to pay a pre-determined portion of the return on investment to Seven States Southaven, LLC ("SSSL") on each lease payment date as agreed in SHLLC's formation documents (the "Seven States Return"). The current and long-term portions of the Membership interests of VIE subject to mandatory redemption are included in Accounts payable and accrued liabilities and Other long-term liabilities, respectively.
The payment dates for the mandatorily redeemable membership interests are the same as those of the SHLLC notes. The SCCG notes are secured by TVA's lease payments, and the SHLLC notes are secured by SHLLC's investment in, and amounts receivable from, SCCG. TVA's lease payments to SCCG are payable on the same dates as SCCG's and SHLLC's semi-annual debt service payments and are equal to the sum of (i) the amount of SCCG's semi-annual debt service payments, (ii) the amount of SHLLC's semi-annual debt service payments, and (iii) the amount of the Seven States Return. In addition to the lease payments, TVA pays administrative and miscellaneous expenses incurred by SCCG and SHLLC. Certain agreements related to this transaction contain default and acceleration provisions.
In the event that TVA were to choose to exercise an early buy out feature of the Southaven facility lease, in part or in whole, TVA must pay to SCCG amounts sufficient for SCCG to repay or partially repay on a pro rata basis the membership interests held by SHLLC, including any outstanding investment amount plus accrued but unpaid return. TVA also has the right, at any time and without any early redemption of the other portions of the Southaven facility lease payments due to SCCG, to fully repay SHLLC's investment, upon which repayment SHLLC will transfer the membership interests to a designee of TVA.
TVA participated in the design, business activity, and financial support of SCCG and has determined that it has a direct variable interest in SCCG resulting from risk associated with the value of the Southaven CCF at the end of the lease term. Based on its analysis, TVA has determined that it is the primary beneficiary of SCCG and, as such, is required to account for the VIE on a consolidated basis.
Impact on Consolidated Financial Statements
The financial statement items attributable to carrying amounts and classifications of JSCCG, Holdco, and SCCG as of September 30, 2023 and 2022, as reflected on the Consolidated Balance Sheets, are as follows:
| | | | | | | | | | | |
Summary of Impact of VIEs on Consolidated Balance Sheets At September 30 (in millions) |
| | 2023 | | 2022 |
| | | |
| | | |
| | | |
| | | |
| Current liabilities | | | |
| Accrued interest | $ | 9 | | | $ | 10 | |
| Accounts payable and accrued liabilities | 1 | | | 2 | |
| Current maturities of long-term debt of variable interest entities | 35 | | | 39 | |
| Total current liabilities | 45 | | | 51 | |
| Other liabilities | | | |
| Other long-term liabilities | 17 | | | 18 | |
| Long-term debt, net | | | |
| Long-term debt of variable interest entities, net | 933 | | | 968 | |
| Total liabilities | $ | 995 | | | $ | 1,037 | |
Interest expense of $48 million, $50 million, and $52 million related to debt of VIEs and membership interests of variable interest entity subject to mandatory redemption is included on the Consolidated Statements of Operations for the years ended September 30, 2023, 2022, and 2021, respectively.
At September 30, 2023, TVA had outstanding debt of VIEs of $968 million and outstanding membership interests subject to mandatory redemption (including current portion) of $18 million issued by one of its VIEs of which it is the primary beneficiary. The following table sets forth TVA's future payments at September 30, 2023:
| | | | | | | | | | | | | | | | | | | | | | | | | | | | | | | | | | | | | | |
Maturities Due in the Year Ending September 30 (in millions) |
| | 2024 | | 2025 | | 2026 | | 2027 | | 2028 | | Thereafter |
Long-term debt of VIEs including current maturities(1) | | $ | 35 | | | $ | 37 | | | $ | 39 | | | $ | 40 | | | $ | 42 | | | $ | 781 | |
| Membership interests of variable interest entity subject to mandatory redemption | | 1 | | | 1 | | | 1 | | | 1 | | | 1 | | | 13 | |
| | | | | | | | | | | | |
Note
(1) Long-term debt of VIEs does not include non-cash item of unamortized debt issue costs of $6 million.
Creditors of the VIEs do not have any recourse to the general credit of TVA. TVA does not have any obligations to provide financial support to the VIEs other than as prescribed in the terms of the agreements related to these transactions.
12. Other Long-Term Liabilities
Other long-term liabilities consist primarily of liabilities related to certain derivative agreements as well as liabilities related to operating leases. The table below summarizes the types and amounts of Other long-term liabilities:
| | | | | | | | | | | |
Other Long-Term Liabilities At September 30 (in millions) |
| | 2023 | | 2022(1) |
| Interest rate swap liabilities | $ | 627 | | | $ | 851 | |
| Operating lease liabilities | 93 | | | 93 | |
| Currency swap liabilities | 131 | | | 228 | |
| Commodity contract derivative liabilities | 52 | | | 1 | |
EnergyRight® financing obligation | 55 | | | 58 | |
| Long-term deferred compensation | 41 | | | 39 | |
| Advances for construction | 56 | | | 53 | |
| Long-term deferred revenue | 45 | | | 39 | |
| | | |
| Other | 111 | | | 123 | |
| Total other long-term liabilities | $ | 1,211 | | | $ | 1,485 | |
Note(1) At September 30, 2022, $1 million previously classified as Other (a component of Other long-term liabilities) has been reclassified to Commodity contract derivative liabilities (a component of Other long-term liabilities) to conform with current year presentation.
Interest Rate Swap Liabilities. TVA uses interest rate swaps to fix variable short-term debt to a fixed rate. The values of these derivatives are included in Other current assets, Accounts payable and accrued liabilities, Accrued interest, and Other long-term liabilities on the Consolidated Balance Sheets. See Note 15 — Risk Management Activities and Derivative Transactions — Overview of Accounting Treatment and Derivatives Not Receiving Hedge Accounting Treatment — Interest Rate Derivatives for information regarding the interest rate swap liabilities.
Operating Lease Liabilities. TVA's operating leases consist primarily of railcars, equipment, real estate/land, and power generating facilities. At September 30, 2023 and 2022, the current portion of TVA's operating leases reported in Accounts payable and accrued liabilities was $71 million and $59 million, respectively. See Note 8 — Leases for more information regarding leases.
Currency Swap Liabilities. To protect against exchange rate risk related to British pound sterling denominated Bond transactions, TVA entered into foreign currency hedges. The values of these derivatives are included in Accounts payable and accrued liabilities and Other long-term liabilities on the Consolidated Balance Sheets. See Note 15 — Risk Management Activities and Derivative Transactions — Overview of Accounting Treatment and Cash Flow Hedging Strategy for Currency Swaps for more information regarding the currency swap liabilities.
Commodity Contract Derivative Liabilities. TVA enters into certain derivative contracts for natural gas that require physical delivery of the contracted quantity of the commodity as well as certain financial derivative contracts to hedge exposure to the price of natural gas. See Note 15 — Risk Management Activities and Derivative Transactions — Derivatives Not Receiving Hedge Accounting Treatment — Commodity Derivatives and — Commodity Derivatives under the FHP for adiscussion of TVA's commodity contract derivatives.
EnergyRight® Financing Obligation. TVA purchases certain loans receivable from its LPCs in association with the EnergyRight® program. The current and long-term portions of the resulting financing obligation are reported in Accounts payable and accrued liabilities and Other long-term liabilities, respectively, on TVA's Consolidated Balance Sheets. At both September 30, 2023 and 2022, the carrying amount of the financing obligation reported in Accounts payable and accrued liabilities was $14 million. See Note 9 — Other Long-Term Assets for information regarding the associated loans receivable.
Long-Term Deferred Compensation. TVA provides compensation arrangements to engage and retain certain employees, both executive and non-executive, which are designed to provide participants with the ability to defer compensation to future periods. The current and long-term portions are recorded in Accounts payable and accrued liabilities and Other long-term liabilities, respectively, on TVA’s Consolidated Balance Sheets. At September 30, 2023 and 2022, the current amount of deferred compensation recorded in Accounts payable and accrued liabilities was $65 million and $53 million, respectively.
Advances for Construction. TVA receives refundable and non-refundable advances for construction that are generally intended to defray all or a portion of the costs of building or extending TVA’s existing power assets. Amounts received are deferred as a liability with the long-term portion representing amounts that will not be recognized within the next 12 months. As projects meet milestones or other contractual obligations, the refundable portion is refunded to the customer and the non-
refundable portion is recognized as contributions in aid of construction and offsets the cost of plant assets. At September 30, 2023 and 2022, the current amount of advances for construction recorded in Accounts payable and accrued liabilities was $39 million and $33 million, respectively.
Long-Term Deferred Revenue. Long-term deferred revenue represents payments received that exceed services rendered resulting in the deferral of revenue. This long-term portion represents amounts that will not be recognized within the next 12 months primarily related to fiber and transmission agreements. The current and long-term portions of the deferral are recorded in Accounts payable and accrued liabilities and Other long-term liabilities, respectively, on TVA’s Consolidated Balance Sheets. At September 30, 2023 and 2022, the current amount of deferred revenue recorded in Accounts payable and accrued liabilities was $21 million and $16 million, respectively.
13. Asset Retirement Obligations
During the year ended September 30, 2023, TVA's total ARO liability increased $327 million.
To estimate its decommissioning obligation related to its nuclear generating stations, TVA uses a probability-weighted, discounted cash flow model which, on a unit-by-unit basis, considers multiple outcome scenarios that include significant estimations and assumptions. Those assumptions include (1) estimates of the cost of decommissioning; (2) the method of decommissioning and the timing of the related cash flows; (3) the license period of the nuclear plant, considering the probability of license extensions; (4) cost escalation factors; and (5) the credit adjusted risk free rate to measure the obligation at the present value of the future estimated costs. TVA has ascribed probabilities to two different decommissioning methods related to its nuclear decommissioning obligation estimate: the DECON method and the SAFSTOR method. The DECON method requires radioactive contamination to be removed from a site and safely disposed of or decontaminated to a level that permits the site to be released for unrestricted use shortly after it ceases operation. The SAFSTOR method allows nuclear facilities to be placed and maintained in a condition that allows the facilities to be safely stored and subsequently decontaminated to levels that permit release for unrestricted use.
TVA also has decommissioning obligations related to its non-nuclear generating sites, ash impoundments, transmission substation and distribution assets, and certain general facilities. To estimate its decommissioning obligation related to these assets, TVA uses estimations and assumptions for the amounts and timing of future expenditures and makes judgments concerning whether or not such costs are considered a legal obligation. Those assumptions include (1) estimates of the costs of decommissioning, (2) the method of decommissioning and the timing of the related cash flows, (3) the expected retirement date of each asset, (4) cost escalation factors, and (5) the credit adjusted risk free rate to measure the obligation at the present value of the future estimated costs. TVA bases its decommissioning estimates for each asset on its identified preferred closure method.
The revisions in non-nuclear estimates increased the liability balance by $362 million for the year ended September 30, 2023. During the year coal combustion residuals ("CCR") closure liabilities at Bull Run, Johnsonville, and Cumberland increased $458 million due to revised cost estimates for final closure activities based on TVA's current approved closure strategies at these sites. Partially offsetting these increases, expected reductions in CCR post-closure costs for long-term monitoring at Gallatin resulted in a decrease of $60 million. In addition, CCR closure liabilities at Cumberland decreased $15 million due to identified changes in the projected timing of certain asset retirement activities, and CCR closure liabilities at Paradise decreased $9 million based on refined project cost estimates.
The revisions in non-nuclear estimates increased $186 million for the year ended September 30, 2022. During the year, TVA completed an engineering review of its cost estimates for closure of certain areas containing coal fines at Paradise Fossil Plant ("Paradise"), which resulted in an increase of $119 million due to expected cost increases for necessary changes in activities associated with proper completion of the closure. CCR closure liabilities at Paradise and Cumberland increased $82 million due to new vendor bids, modified closure designs, and revised estimates for construction costs. Refined project cost assumptions and scope changes related to TVA's AROs for the closure of certain coal yards at its fossil plants resulted in an increase of $57 million. In addition, effective October 1, 2022, TVA implemented revised depreciation rates applicable to its completed plant due to the results of a new depreciation study. The study included a decline in the service life estimates of TVA's coal-fired plants based on current planning assumptions to potentially retire the remainder of the coal-fired fleet by 2035. As a result of the change in service life estimates reflected in the depreciation study, TVA performed an assessment of the assumptions used in the timing of cash flows related to its non-nuclear AROs. Based on the assessment, TVA increased AROs by $47 million due to identified changes in the projections of timing of certain asset retirement activities. Partially offsetting these increases, expected reductions in CCR post-closure costs for maintenance and monitoring at Paradise, Shawnee, and Colbert Fossil Plant ("Colbert") resulted in a decrease of $53 million. CCR closure liabilities at Gallatin decreased $30 million due to selection of a new vendor bid and changes to anticipated timing of certain asset retirement activities. In addition, CCR closure liabilities at Allen Fossil Plant decreased $15 million as a result of changes in cost estimates and anticipated timing of various retirement activities.
The revisions in nuclear estimates increased the liability balance by $61 million for the year ended September 30, 2022. This was primarily due to approval and implementation of the most recent site-specific cost study in September 2022 resulting in an increase of $58 million.
Additionally, during the years ended September 30, 2023 and 2022, both the nuclear and non-nuclear liabilities were increased by periodic accretion, partially offset by settlement projects that were conducted during these periods. The nuclear and non-nuclear accretion amounts were deferred as regulatory assets. During 2023, 2022, and 2021, $188 million, $137 million, and $72 million, respectively, of the related regulatory assets were amortized into expense as these amounts were collected in rates. See Note 10 — Regulatory Assets and Liabilities. TVA maintains investment trusts to help fund its decommissioning obligations. See Note 16 — Fair Value Measurements — Investment Funds and Note 22 — Commitments and Contingencies — Contingencies — Decommissioning Costs for a discussion of the trusts' objectives and the current balances of the trusts.
| | | | | | | | | | | | | | | | | | | | |
Asset Retirement Obligation Activity (in millions) |
| | Nuclear | | Non-Nuclear | | Total | |
| Balance at September 30, 2021 | $ | 3,428 | | | $ | 3,574 | | | $ | 7,002 | | |
| Settlements | (2) | | | (309) | | | (311) | | |
| Revisions in estimate | 61 | | | 186 | | | 247 | | |
| | | | | | |
| | | | | | |
| Accretion (recorded as regulatory asset) | 156 | | | 68 | | | 224 | | |
| | | | | | |
| Balance at September 30, 2022 | 3,643 | | | 3,519 | | | 7,162 | | (1) |
| | | | | | |
| Settlements | (8) | | | (271) | | | (279) | | |
| Revisions in estimate | 7 | | | 362 | | | 369 | | |
| | | | | | |
| | | | | | |
| Accretion (recorded as regulatory asset) | 166 | | | 71 | | | 237 | | |
| | | | | | |
| Balance at September 30, 2023 | $ | 3,808 | | | $ | 3,681 | | | $ | 7,489 | | (1) |
Note
(1) Includes $272 million and $275 million at September 30, 2023 and 2022, respectively, in Current liabilities.
14. Debt and Other Obligations
General
The TVA Act authorizes TVA to issue Bonds in an amount not to exceed $30.0 billion at any time. At September 30, 2023, TVA had only two types of Bonds outstanding: power bonds and discount notes. Power bonds have maturities between one year and 50 years, and discount notes have maturities of less than one year. Power bonds and discount notes are both issued pursuant to Section 15d of the TVA Act and pursuant to the Basic Tennessee Valley Authority Power Bond Resolution adopted by the TVA Board on October 6, 1960, as amended on September 28, 1976, October 17, 1989, and March 25, 1992 (the "Basic Resolution"). Bonds are not obligations of the U.S., and the U.S. does not guarantee the payments of principal or interest on Bonds.
Power bonds and discount notes rank on parity and have first priority of payment from net power proceeds, which are defined as the remainder of TVA's gross power revenues after deducting the costs of operating, maintaining, and administering its power properties and tax equivalent payments, but before deducting depreciation accruals or other charges representing the amortization of capital expenditures, plus the net proceeds from the sale or other disposition of any power facility or interest therein.
TVA considers its scheduled payments under its lease financing arrangements involving John Sevier CCF and Southaven CCF as costs of operating, maintaining, and administering its power properties. Costs of operating, maintaining, and administering TVA's power properties have priority over TVA's payments on the Bonds. Once net power proceeds have been applied to payments on power bonds and discount notes as well as any other Bonds that TVA may issue in the future that rank on parity with or subordinate to power bonds and discount notes, Section 2.3 of the Basic Resolution provides that the remaining net power proceeds shall be used only for (1) minimum payments into the U.S. Treasury required by the TVA Act as repayment of, and as a return on, the Power Program Appropriation Investment; (2) investment in power system assets; (3) additional reductions of TVA's capital obligations; and (4) other lawful purposes related to TVA's power business.
The TVA Act and the Basic Resolution each contain two bond tests: the rate testand the bondholder protection test. Under the rate test, TVA must charge rates for power which will produce gross revenues sufficient to provide funds for, among other things, debt service on outstanding Bonds. As of September 30, 2023, TVA was in compliance with the rate test. See Note 1 — Summary of Significant Accounting Policies — General. Under the bondholder protection test, TVA must, in successive five-year periods, use an amount of net power proceeds at least equal to the sum of (1) the depreciation accruals and other charges representing the amortization of capital expenditures and (2) the net proceeds from any disposition of power facilities for either the reduction of its capital obligations (including Bonds and the Power Program Appropriation Investment) or investment in power assets. TVA met the bondholder protection test for the five-year period ended September 30, 2020, and must next meet the bondholder protection test for the five-year period ending September 30, 2025.
Secured Debt of VIEs
On August 9, 2013, SCCG issued secured notes totaling $360 million that bear interest at a rate of 3.846 percent. The SCCG notes require amortizing semi-annual payments on each February 15 and August 15, and mature on August 15, 2033. Also on August 9, 2013, SCCG issued $40 million of membership interests subject to mandatory redemption. The proceeds from the secured notes issuance and the issuance of the membership interests were paid to TVA in accordance with the terms of the Southaven head lease. See Note 11 — Variable Interest Entities — Southaven VIE. TVA used the proceeds from the transaction primarily to fund the acquisition of the Southaven CCF from SSSL.
On January 17, 2012, JSCCG issued secured notes totaling $900 million in aggregate principal amount that bear interest at a rate of 4.626 percent. Also on January 17, 2012, Holdco issued secured notes totaling $100 million that bear interest at a rate of 7.1 percent. The JSCCG notes and the Holdco notes require amortizing semi-annual payments on each January 15 and July 15, and mature on January 15, 2042. The Holdco notes require a $10 million balloon payment upon maturity. See Note 11 — Variable Interest Entities — John Sevier VIEs. TVA used the proceeds from the transaction to meet its requirements under the TVA Act.
Secured debt of VIEs, including current maturities, outstanding at September 30, 2023 and 2022 totaled $968 million and $1.0 billion, respectively.
Short-Term Debt
The following table provides information regarding TVA's short-term borrowings:
| | | | | | | | | | | |
Short-Term Borrowings At September 30 |
| | 2023 | | 2022 |
| Gross amount outstanding - discount notes (in millions) | $ | 432 | | | $ | 1,173 | |
| | | |
| Weighted average interest rate - discount notes | 5.29 | % | | 2.93 | % |
Put Options
TVA has two issues of Putable Automatic Rate Reset Securities ("PARRS") outstanding. After a fixed-rate period of five years, the coupon rate on the PARRS may automatically be reset downward under certain market conditions on an annual basis. The coupon rate reset on the PARRS is based on a calculation. For both series of PARRS, the coupon rate will reset downward on the reset date if the rate calculated is below the then-current coupon rate on the Bond. The calculation dates, potential reset dates, and terms of the calculation are different for each series. The coupon rate on the 1998 Series D PARRS may be reset on June 1 (annually) if the sum of the five-day average of the 30-Year Constant Maturity Treasury ("CMT") rate for the week ending the last Friday in April, plus 94 basis points, is below the then-current coupon rate. The coupon rate on the 1999 Series A PARRS may be reset on May 1 (annually) if the sum of the five-day average of the 30-Year CMT rate for the week ending the last Friday in March, plus 84 basis points, is below the then-current coupon rate. The coupon rates may only be reset downward, but investors may request to redeem their Bonds at par value in conjunction with a coupon rate reset for a limited period of time prior to the reset dates under certain circumstances.
The coupon rate for the 1998 Series D PARRS, which mature in June 2028, has been reset eight times, from an initial rate of 6.750 percent to the current rate of 2.134 percent. In connection with these resets, $318 million of the Bonds have been redeemed; therefore, $256 million of the Bonds were outstanding at September 30, 2023. The coupon rate for the 1999 Series A PARRS, which mature in May 2029, has been reset seven times, from an initial rate of 6.50 percent to the current rate of 2.216 percent. In connection with these resets, $316 million of the Bonds have been redeemed; therefore, $208 million of the Bonds were outstanding at September 30, 2023.
Due to the contingent nature of the put option on the PARRS, TVA determines whether the PARRS should be classified as long-term debt or current maturities of long-term debt by calculating the expected reset rate for the Bonds on the calculation dates, described above. If the determination date for reset is before the balance sheet date of the reporting period and the expected reset rate is less than the then-current coupon rate on the PARRS, the PARRS are included in current maturities. Otherwise, the PARRS are included in long-term debt.
Debt Securities Activity
The table below summarizes the long-term debt securities activity for the years ended September 30, 2023 and 2022.
| | | | | | | | | | | | | | |
Debt Securities Activity For the years ended September 30 (in millions) |
| | | 2023 | | 2022 |
| Issues | | | | |
| | | | |
| | | | |
| | | | |
| | | | |
| | | | |
| | | | |
| | | | |
2022 Series A(1) | | $ | — | | | $ | 500 | |
2023 Series A(2) | | 1,000 | | | — | |
| Discount on debt issues | | (8) | | | (16) | |
| Total | | $ | 992 | | | $ | 484 | |
| | | | |
| | | | |
| | | | |
| | | | |
| | | | |
Redemptions/Maturities(3) | | | | |
| | | | |
| | | | |
| | | | |
| | | | |
| | | | |
| | | | |
| 2009 Series B | | $ | 29 | | | $ | 28 | |
| 2012 Series A | | — | | | 1,000 | |
| | | | |
| Total redemptions/maturities of power bonds | | 29 | | | 1,028 | |
| | | | |
| Debt of variable interest entities | | 39 | | | 43 | |
| Total redemptions/maturities of debt | | $ | 68 | | | $ | 1,071 | |
Notes
(1) The 2022 Series A Bonds were issued at 96.786 percent of par.
(2) The 2023 Series A Bonds were issued at 99.187 percent of par.
(3) All redemptions were at 100 percent of par.
Debt Outstanding
Total debt outstanding at September 30, 2023 and 2022, consisted of the following:
| | | | | | | | | | | | | | | | | | | | | | | | | | | | |
Short-Term Debt At September 30 (in millions) |
CUSIP or Other Identifier | | Maturity | | | |
Coupon Rate | | 2023 | | 2022 |
| Short-term debt, net of discounts | | | | | | | | $ | 432 | | | $ | 1,172 | |
| Current maturities of long-term debt of VIEs issued at par | | | | | | | | 35 | | | 39 | |
| | | | | | | | | | |
| Current maturities of power bonds issued at par | | | | | | | | | | |
| | | | | | | | | | |
| | | | | | | | | | |
| | | | | | | | | | |
| 880591EF5 | | 12/15/2023 | | | | 3.770% | | 1 | | | 1 | |
| 880591EF5 | | 6/15/2024 | | | | 3.770% | | 21 | | | 28 | |
| 880591ER9 | | 9/15/2024 | | | | 2.875% | | 1,000 | | | — | |
| | | | | | | | | | |
| | | | | | | | | | |
| | | | | | | | | | |
| | | | | | | | | | |
| | | | | | | | | | |
| Total current maturities of power bonds issued at par | | | | | | | | 1,022 | | | 29 | |
| Total current debt outstanding, net | | | | | | | | $ | 1,489 | | | $ | 1,240 | |
| | | | | | | | | | | | | | | | | | | | | | | | | | | | | | | | | | |
Long-Term Debt At September 30 (in millions) |
CUSIP or Other Identifier | | Maturity | | Coupon
Rate | | | | 2023 Par | | 2022 Par | | Stock Exchange Listings |
| | | | | | | | | | | | |
| | | | | | | | | | | | |
| | | | | | | | | | | | |
| | | | | | | | | | | | |
| | | | | | | | | | | | |
| | | | | | | | | | | | |
| 880591ER9 | | 9/15/2024 | | 2.875% | | | | $ | — | | | $ | 1,000 | | | New York |
| 880591EW8 | | 5/15/2025 | | 0.750% | | | | 1,000 | | | 1,000 | | | New York |
| 880591CJ9 | | 11/1/2025 | | 6.750% | | | | 1,350 | | | 1,350 | | | New York, Hong Kong, Luxembourg, Singapore |
| 880591EU2 | | 2/1/2027 | | 2.875% | | | | 1,000 | | | 1,000 | | | New York |
880591300(3) | | 6/1/2028 | | 2.134% | | | | 256 | | | 256 | | | New York |
880591409(3) | | 5/1/2029 | | 2.216% | | | | 208 | | | 208 | | | New York |
| 880591DM1 | | 5/1/2030 | | 7.125% | | | | 1,000 | | | 1,000 | | | New York, Luxembourg |
| 880591EX6 | | 9/15/2031 | | 1.500% | | | | 500 | | | 500 | | | New York |
| 880591DP4 | | 6/7/2032 | | 6.587% | (2) | | | 305 | | (1) | 279 | | (1) | New York, Luxembourg |
| 880591DV1 | | 7/15/2033 | | 4.700% | | | | 472 | | | 472 | | | New York, Luxembourg |
| 880591EF5 | | 6/15/2034 | | 3.770% | | | | 139 | | | 160 | | | None |
| 880591DX7 | | 6/15/2035 | | 4.650% | | | | 436 | | | 436 | | | New York |
| 880591CK6 | | 4/1/2036 | | 5.980% | | | | 121 | | | 121 | | | New York |
| 880591CS9 | | 4/1/2036 | | 5.880% | | | | 1,500 | | | 1,500 | | | New York |
| 880591CP5 | | 1/15/2038 | | 6.150% | | | | 1,000 | | | 1,000 | | | New York |
| 880591ED0 | | 6/15/2038 | | 5.500% | | | | 500 | | | 500 | | | New York |
| 880591EH1 | | 9/15/2039 | | 5.250% | | | | 2,000 | | | 2,000 | | | New York |
| 880591EP3 | | 12/15/2042 | | 3.500% | | | | 1,000 | | | 1,000 | | | New York |
| 880591DU3 | | 6/7/2043 | | 4.962% | (2) | | | 183 | | (1) | 168 | | (1) | New York, Luxembourg |
| | | | | | | | | | | | |
| 880591EB4 | | 1/15/2048 | | 4.875% | | | | 500 | | | 500 | | | New York, Luxembourg |
| 880591DZ2 | | 4/1/2056 | | 5.375% | | | | 1,000 | | | 1,000 | | | New York |
| 880591EJ7 | | 9/15/2060 | | 4.625% | | | | 1,000 | | | 1,000 | | | New York |
| 880591ES7 | | 9/15/2065 | | 4.250% | | | | 1,000 | | | 1,000 | | | New York |
| 880591EY4 | | 9/15/2052 | | 4.250% | | | | 500 | | | 500 | | | New York |
| 880591EZ1 | | 3/15/2028 | | 3.875% | | | | 1,000 | | | — | | | New York |
| | | | | | | | | | | | |
| | | | | | | | | | | | |
| Subtotal | | | | | | | | 17,970 | | | 17,950 | | | |
| Unamortized discounts, premiums, issue costs, and other | | | | | | | | (126) | | | (124) | | | |
| Total long-term outstanding power bonds, net | | | | | | | | 17,844 | | | 17,826 | | | |
| Long-term debt of VIEs, net | | | | | | | | 933 | | | 968 | | | |
| | | | | | | | | | | | |
| Total long-term debt, net | | | | | | | | $ | 18,777 | | | $ | 18,794 | | | |
Notes
(1) Includes total net exchange gain from currency transactions of $109 million and $150 million at September 30, 2023 and 2022, respectively.
(2) The coupon rate represents TVA's effective interest rate.
(3) TVA PARRS, CUSIP numbers 880591300 and 880591409, may be redeemed under certain conditions. See Put Options above.
| | | | | | | | | | | | | | | | | | | | | | | | | | | | | | | | | | | | | | | | | |
Maturities Due in the Year Ending September 30 (in millions) |
| 2024 | | 2025 | | 2026 | | 2027 | | 2028 | | Thereafter | | Total |
Long-term power bonds including current maturities(1) | $ | 1,022 | | | $ | 1,022 | | | $ | 1,370 | | | $ | 1,020 | | | $ | 1,272 | | | $ | 13,395 | | | $ | 19,101 | |
| | | | | | | | | | | | | |
Short-term debt(2) | 432 | | | — | | | — | | | — | | | — | | | — | | | 432 | |
Notes
(1) Long-term power bonds do not include non-cash items of foreign currency exchange gain of $109 million, unamortized debt issue costs of $41 million, or net
discount on sale of Bonds of $85 million.
(2) Short-term debt does not include the non-cash item of discount on issuance of discount notes of less than $1 million.
Credit Facility Agreements
TVA has funding available under four long-term revolving credit facilities totaling $2.7 billion. See the table below for additional information on the four long-term revolving credit facilities. The interest rate on any borrowing under these facilities varies based on market factors and the rating of TVA's senior unsecured, long-term, non-credit-enhanced debt. TVA is required to pay an unused facility fee on the portion of the total $2.7 billion that TVA has not borrowed or committed under letters of credit. This fee, along with letter of credit fees, may fluctuate depending on the rating of TVA's senior unsecured, long-term, non-credit-enhanced debt. At September 30, 2023 and 2022, there were $535 million and $704 million, respectively, of letters of credit outstanding under these facilities, and there were no borrowings outstanding. TVA's letters of credit are primarily posted as collateral under TVA's interest rate swaps. See Note 15 — Risk Management Activities and Derivative Transactions — Other Derivative Instruments — Collateral. TVA may also post collateral for TVA's currency swaps, for commodity derivatives under the Financial Hedging program ("FHP"), or for certain transactions with third parties that require TVA to post letters of credit.
The following table provides additional information regarding TVA's funding available under the four long-term revolving credit facilities:
| | | | | | | | | | | | | | | | | | | | | | | | | | |
Summary of Long-Term Credit Facilities At September 30, 2023 (in millions) |
| Maturity Date | | Facility Limit | | Letters of Credit Outstanding | | Cash Borrowings | | Availability |
| | | | | | | | |
| February 2025 | | $ | 500 | | | $ | 302 | | | $ | — | | | $ | 198 | |
| March 2026 | | 150 | | | 38 | | | — | | | 112 | |
| September 2026 | | 1,000 | | | 99 | | | — | | | 901 | |
| March 2027 | | 1,000 | | | 96 | | | — | | | 904 | |
| Total | | $ | 2,650 | | | $ | 535 | | | $ | — | | | $ | 2,115 | |
TVA and the U.S. Treasury, pursuant to the TVA Act, have entered into a memorandum of understanding under which the U.S. Treasury provides TVA with a $150 million credit facility. This credit facility was renewed for 2024 with a maturity date of September 30, 2024. Access to this credit facility or other similar financing arrangements with the U.S. Treasury has been available to TVA since the 1960s. TVA can borrow under the U.S. Treasury credit facility only if it cannot issue Bonds in the market on reasonable terms, and TVA considers the U.S. Treasury credit facility a secondary source of liquidity. The interest rate on any borrowing under this facility is based on the average rate on outstanding marketable obligations of the U.S. with maturities from date of issue of 12 months or less. There were no outstanding borrowings under the facility at September 30, 2023. The availability of this credit facility may be impacted by how the U.S. government addresses the possibility of approaching its debt limit.
Lease/Leasebacks
TVA previously entered into leasing transactions to obtain third-party financing for 24 peaking CTs as well as certain qualified technological equipment and software ("QTE"). Due to TVA's continuing involvement with the combustion turbine facilities and the QTE during the leaseback term, TVA accounted for the lease proceeds as financing obligations. There were no outstanding leaseback obligations related to the remaining CTs and QTE at September 30, 2023 and 2022. Prior to 2021, TVA made final rent payments involving 16 CTs and acquired the equity interest related to these transactions. Rent payments under the remaining CT lease/leaseback transactions were made through January 2022. In December 2021, TVA gave notice of its election to acquire the leasehold interests related to the remaining eight CTs for a total of $155 million. One associated acquisition closed in December 2022 for $78 million, and the other acquisition closed in May 2023 for $77 million. As a result, TVA recorded the cash consideration as reacquired rights, which is an intangible asset included in Completed plant on the Consolidated Balance Sheet. The amount will be amortized over the remaining estimated useful life of the underlying CTs. TVA recognized $3 million of amortization expense related to the reacquired rights within the Consolidated Statements of Operations for the year ended September 30, 2023. Transaction costs were not material. The estimated amortization expense will be $5 million annually from 2024 through 2052. The estimated amortization expense will be $2 million in 2053.
15. Risk Management Activities and Derivative Transactions
TVA is exposed to various risks related to commodity prices, investment prices, interest rates, currency exchange rates, and inflation as well as counterparty credit and performance risks. To help manage certain of these risks, TVA has historically entered into various derivative transactions, principally commodity option contracts, forward contracts, swaps, swaptions, futures, and options on futures. Other than certain derivative instruments in its trust investment funds, it is TVA's policy to enter into these derivative transactions solely for hedging purposes and not for speculative purposes.
Overview of Accounting Treatment
TVA recognizes certain of its derivative instruments as either assets or liabilities on its Consolidated Balance Sheets at fair value. The accounting for changes in the fair value of these instruments depends on (1) whether TVA uses regulatory accounting to defer the derivative gains and losses, (2) whether the derivative instrument has been designated and qualifies for hedge accounting treatment, and (3) if so, the type of hedge relationship (for example, cash flow hedge).
The following tables summarize the accounting treatment that certain of TVA's financial derivative transactions receive:
| | | | | | | | | | | | | | | | | | | | | | | | | | |
Summary of Derivative Instruments That Receive Hedge Accounting Treatment (part 1) Amount of Mark-to-Market Gain (Loss) Recognized in Accumulated Other Comprehensive Income (Loss) For the years ended September 30 (in millions) |
| Derivatives in Cash Flow Hedging Relationship | | Objective of Hedge Transaction | | Accounting for Derivative
Hedging Instrument | | 2023 | | 2022 |
| Currency swaps | | To protect against changes in cash flows caused by changes in foreign currency exchange rates (exchange rate risk) | | Unrealized gains and losses are recorded in AOCI and reclassified to Interest expense to the extent they are offset by gains and losses on the hedged transaction | | $ | 99 | | | $ | (157) | |
| | | | | | | | | | | | | | |
Summary of Derivative Instruments That Receive Hedge Accounting Treatment (part 2)(1) Amount of Gain (Loss) Reclassified from Accumulated Other Comprehensive Income (Loss) to Interest Expense For the years ended September 30 |
| Derivatives in Cash Flow Hedging Relationship | | 2023 | | 2022 |
| Currency swaps | | $ | 42 | | | $ | (93) | |
Note
(1) There were no amounts excluded from effectiveness testing for any of the periods presented. Based on forecasted foreign currency exchange rates, TVA expects to reclassify approximately $20 million of gains from AOCI to Interest expense within the next 12 months to offset amounts anticipated to be recorded in Interest expense related to the forecasted exchange loss on the debt.
| | | | | | | | | | | | | | | | | | | | | | | | | | |
Summary of Derivative Instruments That Do Not Receive Hedge Accounting Treatment Amount of Gain (Loss) Recognized in Income on Derivatives(1) For the years ended September 30 (in millions) |
| | | | | | |
| Derivative Type | | Objective of Derivative | | Accounting for Derivative Instrument | | 2023 | | 2022 |
| Interest rate swaps | | To fix short-term debt variable rate to a fixed rate (interest rate risk) | | Mark-to-market gains and losses are recorded as regulatory liabilities and assets, respectively
Realized gains and losses are recognized in Interest expense when incurred during the settlement period and are presented in operating cash flow | | $ | (45) | | | $ | (103) | |
| | | | | | | | |
| | | | | | | | |
| | | | | | | | |
Commodity derivatives
under the FHP | | To protect against fluctuations in market prices of purchased commodities (price risk) | | Mark-to-market gains and losses are recorded as regulatory liabilities and assets, respectively
Realized gains and losses are recognized in Fuel expense or Purchased power expense as the contracts settle to match the delivery period of the underlying commodity(2) | | (348) | | | 47 | |
Notes
(1) All of TVA's derivative instruments that do not receive hedge accounting treatment have unrealized gains (losses) that would otherwise be recognized in income but instead are deferred as regulatory liabilities and assets. As such, there were no related gains (losses) recognized in income for these unrealized gains (losses) for the years ended September 30, 2023 and 2022.
(2) Of the amount recognized in 2023, $301 million and $47 million were reported in Fuel expense and Purchased power expense, respectively. Of the amount recognized in 2022, $38 million and $9 million were reported in Fuel expense and Purchased power expense, respectively.
| | | | | | | | | | | | | | | | | | | | | | | |
Fair Values of TVA Derivatives At September 30 (in millions) |
| | 2023 | | 2022 |
| Derivatives That Receive Hedge Accounting Treatment: |
| | Balance | | Balance Sheet Presentation | | Balance | | Balance Sheet Presentation |
| Currency swaps | | | | | | | |
| | | | | | | |
| £250 million Sterling | $ | (72) | | | Accounts payable and accrued liabilities $(6); Other long-term liabilities $(66) | | $ | (130) | | | Accounts payable and accrued liabilities $(7); Other long-term liabilities $(123) |
| £150 million Sterling | (69) | | | Accounts payable and accrued liabilities $(4); Other long-term liabilities $(65) | | (110) | | | Accounts payable and accrued liabilities $(5); Other long-term liabilities $(105) |
| | | | | | | |
| Derivatives That Do Not Receive Hedge Accounting Treatment: |
| | Balance | | Balance Sheet Presentation | | Balance | | Balance Sheet Presentation |
| Interest rate swaps | | | | | | | |
| $1.0 billion notional | $ | (499) | | | Other current assets $1; Accrued interest $(27); Other long-term liabilities $(473) | | $ | (672) | | | Accounts payable and accrued liabilities $(9); Accrued interest $(33); Other long-term liabilities $(630) |
| $476 million notional | (159) | | | Other current assets $3; Accrued interest $(8); Other long-term liabilities $(154) | | (233) | | | Accounts payable and accrued liabilities $(3); Accrued interest $(9); Other long-term liabilities $(221) |
| | | | | | | |
| Commodity contract derivatives | 31 | | | Other current assets $21; Other long-term assets $12; Accounts payable and accrued liabilities $(1); Other long-term liabilities $(1) | | 145 | | | Other current assets $118; Other long-term assets $34; Accounts payable and accrued liabilities $(6); Other long-term liabilities $(1) |
| Commodity derivatives under the FHP | (186) | | | Accounts payable and accrued liabilities $(135); Other long-term liabilities $(51) | | 115 | | | Accounts receivable, net $1; Other current assets $54; Other long-term assets $68; Accounts payable and accrued liabilities $(8) |
Cash Flow Hedging Strategy for Currency Swaps
To protect against exchange rate risk related to British pound sterling denominated Bond transactions, TVA entered into foreign currency hedges at the time the Bond transactions occurred. TVA had the following currency swaps outstanding at September 30, 2023:
| | | | | | | | | | | | | | | | | | | | |
| Currency Swaps Outstanding |
| Effective Date of Currency Swap Contract | | Associated TVA Bond Issues Currency Exposure | | Expiration Date of Swap | | Overall Effective
Cost to TVA |
| 2001 | | £250 million | | 2032 | | 6.587% |
| 2003 | | £150 million | | 2043 | | 4.962% |
When the dollar strengthens against the British pound sterling, the exchange gain on the Bond liability and related accrued interest is offset by an equal amount of loss on the swap contract that is reclassified out of AOCI. Conversely, the exchange loss on the Bond liability and related accrued interest is offset by an equal amount of gain on the swap contract that is reclassified out of AOCI. All such exchange gains or losses on the Bond liability and related accrued interest are included in Long-term debt, net and Accrued interest, respectively. The offsetting exchange losses or gains on the swap contracts are recognized in AOCI. If any gain (loss) were to be incurred as a result of the early termination of the foreign currency swap contract, the resulting income (expense) would be amortized over the remaining life of the associated Bond as a component of Interest expense. The values of the currency swap liabilities are included in Accounts payable and accrued liabilities and Other long-term liabilities on the Consolidated Balance Sheets.
Derivatives Not Receiving Hedge Accounting Treatment
Interest Rate Derivatives. Generally TVA uses interest rate swaps to fix variable short-term debt to a fixed rate, and TVA uses regulatory accounting treatment to defer the MtM gains and losses on its interest rate swaps. The net deferred unrealized gains and losses are classified as regulatory liabilities or assets on TVA's Consolidated Balance Sheets and are included in the ratemaking formula when gains or losses are realized. The values of these derivatives are included in Other current assets, Accounts payable and accrued liabilities, Accrued interest, and Other long-term liabilities on the Consolidated Balance Sheets, and realized gains and losses, if any, are included on TVA's Consolidated Statements of Operations. For the years ended September 30, 2023 and 2022, the changes in fair market value of the interest rate swaps resulted in the reduction in unrealized losses of $240 million and $728 million, respectively. TVA may hold short-term debt balances lower than the notional amount of the interest rate swaps from time to time due to changes in business conditions and other factors. While actual balances vary, TVA generally plans to maintain average balances of short-term debt equal to or in excess of the combined notional amount of the interest rate swaps.
Commodity Derivatives. TVA enters into certain derivative contracts for natural gas that require physical delivery of the contracted quantity of the commodity. TVA may also enter into short-term PPAs with a term of less than one year that provide an option to financially settle contracted power deliveries. This option creates an embedded derivative in the hosting power purchase agreement. TVA marks to market these contracts and defers the unrealized gains (losses) as regulatory liabilities (assets). At September 30, 2023, TVA's natural gas contract derivatives had terms of up to three years.
| | | | | | | | | | | | | | | | | | | | | | | | | | | | | | | | | | | |
Commodity Contract Derivatives At September 30 |
| | 2023 | | 2022 |
| | Number of Contracts | | Notional Amount | | Fair Value (MtM)
(in millions) | | Number of Contracts | | Notional Amount | | Fair Value (MtM) (in millions) |
| | | | | | | | | | | |
| Natural gas contract derivatives | 54 | | 318 million mmBtu | | $ | 31 | | | 44 | | 296 million mmBtu | | $ | 145 | |
| | | | | | | | | | | |
Commodity Derivatives under the FHP. In 2022, the FHP was reinstated, and hedging activity began under the program in the second quarter of 2022. Currently, TVA is hedging exposure to the price of natural gas under the FHP. There is no Value at Risk aggregate transaction limit under the current FHP structure, but the TVA Board reviews and authorizes the use of tolerances and measures annually. TVA's FHP policy prohibits trading financial instruments under the FHP for speculative purposes. At September 30, 2023, TVA's natural gas swap contracts under the FHP had remaining terms of up to five years.
| | | | | | | | | | | | | | | | | | | | | | | | | | | | | | | | | | | |
Commodity Derivatives under Financial Hedging Program(1) At September 30 |
| 2023 | | 2022 |
| Number of Contracts | | Notional Amount | | Fair Value (MtM) (in millions) | | Number of Contracts | | Notional Amount | | Fair Value (MtM) (in millions) |
| Natural gas | | | | | | | | | | | |
| | | | | | | | | | | |
| Swap contracts | 221 | | 388 | million mmBtu | | $ | (186) | | | 225 | | 256 | million mmBtu | | $ | 115 | |
| | | | | | | | | | | |
| | | | | | | | | | | |
| | | | | | | | | | | |
| | | | | | | | | | | |
| | | | | | | | | | | |
| | | | | | | | | | | |
| | | | | | | | | | | |
| | | | | | | | | | | |
Note
(1) Fair value amounts presented are based on the net commodity position with the counterparty. Notional amounts disclosed represent the net value of contractual amounts.
TVA defers all FHP unrealized gains (losses) as regulatory liabilities (assets) and records the realized gains or losses in Fuel expense and Purchased power expense to match the delivery period of the underlying commodity. The fair value of commodity derivatives under the FHP decreased $301 million primarily due to a decrease in forward natural gas prices at September 30, 2023 as compared to September 30, 2022.
Offsetting of Derivative Assets and Liabilities
The amounts of TVA's derivative instruments as reported on the Consolidated Balance Sheets are shown in the table below:
| | | | | | | | | | | | | |
Derivative Assets and Liabilities(1) At September 30 (in millions) |
| |
| 2023 | | | | 2022 |
| Assets | | | | | |
| Interest rate swaps | $ | 4 | | | | | $ | — | |
| Commodity contract derivatives | 33 | | | | | 152 | |
Commodity derivatives under the FHP(2) | — | | | | | 123 | |
| Total derivatives subject to master netting or similar arrangement | $ | 37 | | | | | $ | 275 | |
| | | | | |
| | | | | |
| | | | | |
| | | | | |
| Liabilities | | | | | |
| Currency swaps | $ | 141 | | | | | $ | 240 | |
Interest rate swaps(3) | 662 | | | | | 905 | |
| Commodity contract derivatives | 2 | | | | | 7 | |
Commodity derivatives under the FHP(2) | 186 | | | | | 8 | |
| Total derivatives subject to master netting or similar arrangement | $ | 991 | | | | | $ | 1,160 | |
| | | | | |
| | | | | |
| | | | | |
| |
| | | | | |
| | | | | |
| | | | | |
| | | | | |
| | | | | |
| | | | | |
| | | | | |
| | | | | |
| | | | | |
| | | | | |
Notes
(1) Offsetting amounts include counterparty netting of derivative contracts. Except as discussed below, there were no other material offsetting amounts on TVA's Consolidated Balance Sheets at either September 30, 2023 or 2022.
(2) At September 30, 2023, the gross derivative asset and gross derivative liability was $26 million and $212 million, respectively, with offsetting amounts for each totaling $26 million.
(3) Letters of credit of approximately $509 million and $704 million were posted as collateral at September 30, 2023 and 2022, respectively, to partially secure the liability positions of one of the interest rate swaps in accordance with the collateral requirements for this derivative.
Other Derivative Instruments
Investment Fund Derivatives. Investment funds consist primarily of funds held in the NDT, ART, SERP, DCP, and RP. See Note 16 — Fair Value Measurements — Investment Funds for a discussion of the trusts, plans, and types of investments. The NDT and ART may invest in derivative instruments which may include swaps, futures, options, forwards, and other instruments. At September 30, 2023 and 2022, the NDT held investments in forward contracts to purchase debt securities. The fair values of these derivatives were in net asset positions totaling $11 million and $4 million at September 30, 2023 and 2022, respectively.
Collateral. TVA's interest rate swaps, currency swaps, and commodity derivatives under the FHP contain contract provisions that require a party to post collateral (in a form such as cash or a letter of credit) when the party's liability balance under the agreement exceeds a certain threshold. At September 30, 2023, the aggregate fair value of all derivative instruments with credit-risk related contingent features that were in a liability position was $987 million. TVA's collateral obligations at September 30, 2023, under these arrangements were $429 million, for which TVA had posted $509 million in letters of credit. These letters of credit reduce the available balance under the related credit facilities. TVA's assessment of the risk of its nonperformance includes a reduction in its exposure under the interest rate swap contracts as a result of this posted collateral.
For all of its derivative instruments with credit-risk related contingent features:
•If TVA remains a majority-owned U.S. government entity but Standard & Poor's Financial Services, LLC ("S&P") or Moody's Investors Service, Inc. ("Moody's") downgrades TVA's credit rating to AA or Aa2, respectively, TVA's collateral obligations would likely increase by $22 million, and
•If TVA ceases to be majority-owned by the U.S. government, TVA's credit rating would likely be downgraded and TVA would be required to post additional collateral.
Counterparty Risk
TVA may be exposed to certain risks when a counterparty has the potential to fail to meet its obligations in accordance with agreed terms. These risks may be related to credit, operational, or nonperformance matters. To mitigate certain counterparty risk, TVA analyzes the counterparty's financial condition prior to entering into an agreement, establishes credit limits, monitors the appropriateness of those limits, as well as any changes in the creditworthiness of the counterparty, on an ongoing basis, and when required, employs credit mitigation measures, such as collateral or prepayment arrangements and master purchase and sale agreements.
Customers. TVA is exposed to counterparty credit risk associated with trade accounts receivable from delivered power sales to LPCs, and from industries and federal agencies directly served, all located in the Tennessee Valley region. Of the $1.6 billion and $1.9 billion of receivables from power sales outstanding at September 30, 2023 and 2022, respectively, nearly all counterparties were rated investment grade. The obligations of customers that are not investment grade are secured by collateral. TVA is also exposed to risk from exchange power arrangements with a small number of investor-owned regional utilities related to either delivered power or the replacement of open positions of longer-term purchased power or fuel agreements. TVA believes its policies and procedures for counterparty performance risk reviews have generally protected TVA against significant exposure related to market and economic conditions. See Note 1— Summary of Significant Accounting Policies — Allowance for Uncollectible Accounts, Note 3 — Accounts Receivable, Net, andNote 9 — Other Long-Term Assets.
TVA had revenue from two LPCs that collectively accounted for 17 percent of total operating revenues for both the years ended September 30, 2023 and 2022.
Suppliers. TVA assesses potential supplier performance risks, including procurement of fuel, parts, and services. If suppliers are unable to perform under TVA's existing contracts or if TVA is unable to obtain similar services or supplies from other vendors, TVA could experience delays, disruptions, additional costs, or other operational outcomes that may impact generation, maintenance, and capital programs. If certain fuel or purchased power suppliers fail to perform under the terms of their contract with TVA, TVA might lose the money that it paid to the supplier under the contract and have to purchase replacement fuel or power on the spot market, perhaps at a significantly higher price than TVA was entitled to pay under the contract. In addition, TVA might not be able to acquire replacement fuel or power in a timely manner and thus might be unable to satisfy its own obligations to deliver power. TVA continues evaluating potential supplier performance risks and supplier impact but cannot determine or predict the duration of such risks/impacts or the extent to which such risks/impacts could affect TVA's business, operations, and financial results or cause potential business disruptions.
TVA continues to experience impacts due to inflation, supply chain material challenges, and labor availability. This has led to project delays, limited availability, and/or price increases for supplies and labor. TVA has been able to manage these challenges with limited business disruptions at this time; however, should pressures continue long term, TVA could experience more significant disruptions and pressure to increase power rates.
Natural Gas and Fuel Oil. TVA purchases a significant amount of its natural gas requirements through contracts with a variety of suppliers and purchases substantially all of its fuel oil requirements on the spot market. TVA delivers to its gas fleet under firm and non-firm transportation contracts on multiple interstate natural gas pipelines. TVA contracts for storage capacity that allows for operational flexibility and increased supply during peak gas demand scenarios or supply disruptions. TVA plans to continue using contracts of various lengths and terms to meet the projected natural gas needs of its natural gas fleet. TVA also maintains on-site, fuel oil backup to operate at the majority of the combustion turbine sites in the event of major supply disruptions. In the event suppliers are unable to perform under existing contracts, TVA can utilize its storage portfolio or other suppliers to help secure replacement natural gas volumes.
Coal. To help ensure a reliable supply of coal, TVA had coal contracts with multiple suppliers at September 30, 2023. The contracted supply of coal is sourced from several geographic regions of the U.S. and is delivered via barge and rail. As a result of emerging technologies, environmental regulations, industry trends, and natural gas market volatility over the past few years, coal suppliers are facing increased financial pressure, which has led to relatively poor credit ratings and bankruptcies, restructuring, mine closures, or other scenarios. A long-term continued decline in demand for coal could result in more consolidations, additional bankruptcies, restructuring, mine closures, or other scenarios.
Nuclear Fuel. Nuclear fuel is obtained predominantly through long-term uranium concentrate supply contracts, contracted conversion services, contracted enrichment services, or a combination thereof, and contracted fuel fabrication services. The supply markets for uranium concentrates and certain nuclear fuel services are subject to price fluctuations and availability restrictions. Supply market conditions may make procurement contracts subject to credit risk related to the potential nonperformance of counterparties. In the event of nonperformance by these or other suppliers, TVA believes that replacement uranium concentrate and nuclear fuel services can be obtained, although at prices that may be unfavorable when compared to the prices under the current supply agreements.
As a result of Russia’s invasion of Ukraine, new contracts for Russian origin nuclear fuel have been limited by Executive Order 14066, and further restrictions on the purchase or use of Russian origin fuel may be forthcoming. TVA should have no direct impact from existing or future restrictions since TVA has no Russian origin nuclear fuel in inventory for use in its reactors and it is not contracted to purchase any Russian origin nuclear fuel. TVA could be impacted by higher market prices as a result of general market impacts associated with supply restrictions; however, at this time TVA's nuclear fuel is obtained predominantly through long-term contracts.
Purchased Power. TVA acquires power from a variety of power producers through long-term and short-term PPAs as well as through spot market purchases. Because of the long-term nature and reliability of purchased power, TVA requires that the PPAs contain certain counterparty performance assurance requirements to help insure counterparty performance during the term of the agreements.
Other Suppliers. Mounting solar supply chain constraints, commodity price increases, and the recent trade policy investigation into solar panel imports have created challenges for the U.S. solar industry. Both TVA's Self-Directed Solar project and TVA's existing solar PPA portfolio are not immune from these challenges. Similar to the experience of the rest of the industry, the majority of TVA's contracted PPAs from previous requests for proposals ("RFPs") that are not yet online have been impacted by project delays and price increases, and TVA terminated one PPA because of counterparty default.
Derivative Counterparties. TVA has entered into physical and financial contracts that are classified as derivatives for hedging purposes, and TVA's NDT, ART, and qualified defined benefit plan ("pension plan") have entered into derivative contracts for investment purposes. If a counterparty to one of the physical or financial derivative transactions defaults, TVA might incur costs in connection with entering into a replacement transaction. If a counterparty to the derivative contracts into which the NDT, the ART, or the pension plan have entered for investment purposes defaults, the value of the investment could decline significantly or perhaps become worthless. TVA has concentrations of credit risk from the banking, coal, and gas industries because multiple companies in these industries serve as counterparties to TVA in various derivative transactions. At September 30, 2023, all of TVA's commodity derivatives under the FHP, currency swaps, interest rate swaps, and PPAs with option to settle were with counterparties whose Moody's credit ratings were A2 or higher. TVA classifies forward natural gas contracts as derivatives. At September 30, 2023, the forward natural gas contracts were with counterparties whose ratings ranged from B1 to A1.
16. Fair Value Measurements
Fair value is determined based on the exchange price that would be received for an asset or paid to transfer a liability (an exit price) in the asset or liability's principal market, or in the absence of a principal market, the most advantageous market for the asset or liability in an orderly transaction between market participants. TVA uses market or observable inputs as the preferred source of values, followed by assumptions based on hypothetical transactions in the absence of market inputs.
Valuation Techniques
The measurement of fair value results in classification into a hierarchy by the inputs used to determine the fair value as follows:
| | | | | | | | | | | |
| Level 1 | —
| | Unadjusted quoted prices in active markets accessible by the reporting entity for identical assets or liabilities. Active markets are those in which transactions for the asset or liability occur with sufficient frequency and volume to provide pricing. |
Level 2
| —
| | Pricing inputs other than quoted market prices included in Level 1 that are based on observable market data and that are directly or indirectly observable for substantially the full term of the asset or liability. These include quoted market prices for similar assets or liabilities, quoted market prices for identical or similar assets in markets that are not active, adjusted quoted market prices, inputs from observable data such as interest rate and yield curves, volatilities and default rates observable at commonly quoted intervals, and inputs derived from observable market data by correlation or other means. |
| Level 3 | —
| | Pricing inputs that are unobservable, or less observable, from objective sources. Unobservable inputs are only to be used to the extent observable inputs are not available. These inputs maintain the concept of an exit price from the perspective of a market participant and should reflect assumptions of other market participants. An entity should consider all market participant assumptions that are available without unreasonable cost and effort. These are given the lowest priority and are generally used in internally developed methodologies to generate management's best estimate of the fair value when no observable market data is available. |
A financial instrument's level within the fair value hierarchy (where Level 1 is the highest and Level 3 is the lowest) is based on the lowest level of input significant to the fair value measurement.
The following sections describe the valuation methodologies TVA uses to measure different financial instruments at fair value. Except for gains and losses on SERP, DCP, and RP assets, all changes in fair value of these assets and liabilities have been recorded as changes in regulatory assets, regulatory liabilities, or AOCI on TVA's Consolidated Balance Sheets and Consolidated Statements of Comprehensive Income (Loss). Except for gains and losses on SERP and DCP assets, there has been no impact to the Consolidated Statements of Operations or the Consolidated Statements of Cash Flows related to these fair value measurements.
Investment Funds
At September 30, 2020,2023, Investment funds were comprised of $3.2$4.1 billion of equity securities and debt securities classified as trading measured at fair value. Equity and trading debt securities are held in the NDT, ART, SERP, DCP, and DCP.RP. The NDT holds funds for the ultimate decommissioning of TVA's nuclear power plants. The ART holds funds primarily for the costs related to the future closure and retirement of TVA's other long-lived assets. The balances in the NDT and ART were $2.2$2.8 billion and $866 million,$1.2 billion, respectively, at September 30, 2020.2023.
TVA established a SERP to provide benefits to selected employees of TVA which are comparable to those provided by competing organizations. The DCP is designed to provide participants with the ability to defer compensation to future periods. The RP is a non-qualified excess 401(K) plan designed to allow certain eligible employees whose contributions to the 401(k) plan are limited by Internal Revenue Service ("IRS") rules to save additional amounts for retirement and receive non-elective and matching employer contributions. The NDT, ART, SERP, DCP, and DCPRP funds are invested in portfolios of securities generally designed to achieve a return in line with overall equity and debt market performance.
The NDT, ART, SERP, DCP, and DCPRP are composed of multiple types of investments and are managed by external institutional investment managers. Most U.S. and international equities, U.S. Treasury inflation-protected securities ("TIPS"), real estate investment trust securities, and cash securities and certain derivative instruments are measured based on quoted exchange prices in active markets and are classified as Level 1 valuations. Fixed-income investments, high-yield fixed-income investments, currencies, and most derivative instruments are non-exchange traded and are classified as Level 2 valuations. These measurements are based on market and income approaches with observable market inputs.
Private equity limited partnerships, private real asset investments, and private credit investments may include holdings of investments in private real estate, venture capital, buyout, mezzanine or subordinated debt, restructuring or distressed debt, and special situations through funds managed by third-party investment managers. These investments generally involve a three-to-four-year period where the investor contributes capital, followed by a period of distribution, typically over several years. The investment period is generally, at a minimum, 10 years or longer. The NDT had unfunded commitments related to private equity limited partnerships in private equity of $218$237 million, private real assets of $67$123 million, and private credit of $33$81 million at September 30,
2020. 2023. The ART had unfunded commitments related to limited partnerships in private equity of $133$124 million, private real assets of $54$60 million, and private credit of $16$43 million at September 30, 2020.2023. These investments have no redemption or limited redemption options and may also impose restrictions on the NDT's and ART's ability to liquidate their investments. There are 0no readily available quoted exchange prices for these investments. The fair value of these investments is based on information provided by the investment managers. These investments are valued on a quarterly basis. TVA's private equity limited partnerships, private real asset investments, and private credit investments are valued at net asset values ("NAV") as a practical expedient for fair value. TVA classifies its interest in these types of investments as investments measured at NAV in the fair value hierarchy.
Commingled funds represent investment funds comprising multiple individual financial instruments. The commingled funds held by the NDT, ART, SERP, DCP, and DCPRP consist of either a single class of securities, such as equity, debt, or foreign currency securities, or multiple classes of securities. All underlying positions in these commingled funds are either exchange traded or measured using observable inputs for similar instruments. The fair value of commingled funds is based on NAV per fund share (the unit of account), derived from the prices of the underlying securities in the funds. These commingled funds can be redeemed at the measurement date NAV and are classified as Commingled funds measured at net asset valueNAV in the fair value hierarchy.
Realized and unrealized gains and losses on equity and trading debt securities are recognized in current earnings and are based on average cost. The gains and losses of the NDT and ART are subsequently reclassified to a regulatory asset or liability account in accordance with TVA's regulatory accounting policy. See Note 1 — Summary of Significant Accounting Policies — Cost-Based RegulationandNote 10— Regulatory Assets and Liabilities. TVA recorded unrealized gains and losses related to its equity and trading debt securities held during each period as follows:
| | Unrealized Investment Gains (Losses)
At or for the years ended September 30 | |
Unrealized Investment Gains (Losses)(1)
For the years ended September 30 (in millions) | | Unrealized Investment Gains (Losses)(1)
For the years ended September 30 (in millions) |
| Fund | Fund | Financial Statement Presentation | | 2020 | | 2019 | Fund | Financial Statement Presentation | | 2023 | | 2022 |
| NDT | NDT | Regulatory asset | | $ | 37 | | | $ | (112) | | NDT | Regulatory assets(2) | | $ | 162 | | | $ | (396) | |
| ART | ART | Regulatory asset | | 32 | | | (70) | | ART | Regulatory assets(3) | | 96 | | | (190) | |
| SERP | SERP | Other income (expense) | | 3 | | | 0 | | SERP | Other income (expense) | | 6 | | | (19) | |
| DCP | DCP | Other income (expense) | | 2 | | | (2) | | DCP | Other income (expense) | | 1 | | | (5) | |
|
Due(1) Employee contributions to higher volatilitythe RP began in the financial markets associated withsecond quarter of 2023. As of September 30, 2023, the COVID-19 pandemic, TVA has experienced fluctuationsunrealized losses for the RP were less than $1 million, and therefore were not represented in the table above.
(2) Includes $27 million of unrealized gains and $138 million of unrealized losses related to its ART and NDT investment portfolio during 2020. The losses experienced duringequity securities (excluding commingled funds) for the three months ended March 31, 2020, have been recovered. For the yearyears ended September 30, 2020,2023 and 2022, respectively.
(3) Includes $13 million of unrealized gains and $44 million of unrealized losses related to ART equity securities (excluding commingled funds) for the NDT increased in value $123 million compared to the yearyears ended September 30, 2019. Despite this volatility, TVA's NDT funding as of September 30, 2020, continues to be fully funded per the NRC funding requirements.2023 and 2022, respectively.
Currency and Interest Rate Swap Derivatives
See Note 15 — Risk Management Activities and Derivative Transactions — Cash Flow Hedging Strategy for Currency Swaps and Derivatives Not Receiving Hedge Accounting Treatment for a discussion of the nature, purpose, and contingent features of TVA's currency swaps and interest rate swaps. These swaps are classified as Level 2 valuations and are valued based on income approaches using observable market inputs for similar instruments.
Commodity Contract Derivatives and Commodity Derivatives under the FHP
Commodity Contract Derivatives. Most of these derivative contracts are valued based on market approaches, which utilize short-term and mid-term market-quoted prices from an external industry brokerage service. These contracts are classified as Level 2 valuations.
Commodity Derivatives under the FHP. Swap contracts are valued using a pricing model based on New York Mercantile Exchange inputs and are subject to nonperformance risk outside of the exit price. These contracts are classified as Level 2 valuations.
See Note 15 — Risk Management Activities and Derivative Transactions — Derivatives Not Receiving Hedge Accounting Treatment.Treatment — Commodity Derivatives Most of these contracts are valued based on market approaches which utilize short-term and mid-term market-quoted prices from an external industry brokerage service.— Commodity Derivatives under the FHP.
Nonperformance Risk
The assessment of nonperformance risk, which includes credit risk, considers changes in current market conditions, readily available information on nonperformance risk, letters of credit, collateral, other arrangements available, and the nature of master netting arrangements. TVA is a counterparty to currency swaps, interest rate swaps, commodity contracts, and other derivatives which subject TVA to nonperformance risk. Nonperformance risk on the majority of investments and certain exchange-traded instruments held by TVA is incorporated into the exit price that is derived from quoted market data that is used to mark the investment to market.
Nonperformance risk for most of TVA's derivative instruments is an adjustment to the initial asset/liability fair value. TVA adjusts for nonperformance risk, both of TVA (for liabilities) and the counterparty (for assets), by applying credit valuation adjustments ("CVAs"). TVA determines an appropriate CVA for each applicable financial instrument based on the term of the instrument and TVA's or the counterparty's credit rating as obtained from Moody's. For companies that do not have an observable credit rating, TVA uses internal analysis to assign a comparable rating to the counterparty. TVA discounts each
financial instrument using the historical default rate (as reported by Moody's for CY 1983 to CY 2019)2022) for companies with a similar credit rating over a time period consistent with the remaining term of the contract. The application of CVAs resulted in a less than $1 million decrease in the fair value of assets and a $1 million decrease in the fair value of liabilities at September 30, 2020.2023.
Fair Value Measurements
The following tables set forth by level, within the fair value hierarchy, TVA's financial assets and liabilities that were measured at fair value on a recurring basis at September 30, 20202023 and 2019.2022. Financial assets and liabilities have been classified in their entirety based on the lowest level of input that is significant to the fair value measurement. TVA's assessment of the significance of a particular input to the fair value measurement requires judgment and may affect the determination of the fair value of the assets and liabilities and their classification in the fair value hierarchy levels.
| | | | | | | | | | | | | | | | | | | | | | | |
Fair Value Measurements At September 30, 2020 |
| Quoted Prices in Active
Markets for
Identical Assets
(Level 1) | | Significant Other
Observable Inputs
(Level 2) | | Significant
Unobservable
Inputs
(Level 3) | | Total |
| Assets | | | | | | | |
| Investments | | | | | | | |
| Equity securities | $ | 500 | | | $ | 0 | | | $ | 0 | | | $ | 500 | |
Government debt securities(1) | 485 | | | 40 | | | 0 | | | 525 | |
Corporate debt securities(2) | 0 | | | 356 | | | 0 | | | 356 | |
| Mortgage and asset-backed securities | 0 | | | 27 | | | 0 | | | 27 | |
| Institutional mutual funds | 188 | | | 0 | | | 0 | | | 188 | |
| Forward debt securities contracts | 0 | | | 13 | | | 0 | | | 13 | |
Private equity funds measured at net asset value(3) | 0 | | | 0 | | | 0 | | | 194 | |
Private real asset funds measured at net asset value(3) | 0 | | | 0 | | | 0 | | | 168 | |
Private credit measured at net asset value(3) | 0 | | | 0 | | | 0 | | | 53 | |
Commingled funds measured at net asset value(3) | 0 | | | 0 | | | 0 | | | 1,174 | |
| Total investments | 1,173 | | | 436 | | | 0 | | | 3,198 | |
| | | | | | | |
| Commodity contract derivatives | 0 | | | 49 | | | 0 | | | 49 | |
| | | | | | | |
| | | | | | | |
| | | | | | | |
| Total | $ | 1,173 | | | $ | 485 | | | $ | 0 | | | $ | 3,247 | |
| | | | | | | |
| Quoted Prices in Active Markets for Identical Liabilities
(Level 1) | | Significant Other
Observable Inputs
(Level 2) | | Significant
Unobservable
Inputs
(Level 3) | | Total |
| Liabilities | | | | | | | |
Currency swaps(4) | $ | 0 | | | $ | 209 | | | $ | 0 | | | $ | 209 | |
| Interest rate swaps | 0 | | | 2,041 | | | 0 | | | 2,041 | |
| Commodity contract derivatives | 0 | | | 3 | | | 0 | | | 3 | |
| | | | | | | |
| Total | $ | 0 | | | $ | 2,253 | | | $ | 0 | | | $ | 2,253 | |
| | | | | | | | | | | | | | | | | | | | | | | |
Fair Value Measurements At September 30, 2023 (in millions) |
| Quoted Prices in Active
Markets for
Identical Assets
(Level 1) | | Significant Other
Observable Inputs
(Level 2) | | Significant
Unobservable
Inputs
(Level 3) | | Total |
| Assets | | | | | | | |
| Investments | | | | | | | |
| Equity securities | $ | 608 | | | $ | — | | | $ | — | | | $ | 608 | |
Government debt securities(1)(2) | 287 | | | 60 | | | — | | | 347 | |
Corporate debt securities(3) | — | | | 300 | | | — | | | 300 | |
| Mortgage and asset-backed securities | — | | | 36 | | | — | | | 36 | |
| Institutional mutual funds | 288 | | | — | | | — | | | 288 | |
| Forward debt securities contracts | — | | | 11 | | | — | | | 11 | |
Cash equivalents and other short-term investments(2) | 104 | | | 166 | | | — | | | 270 | |
Private equity funds measured at net asset value(4) | — | | | — | | | — | | | 583 | |
Private real asset funds measured at net asset value(4) | — | | | — | | | — | | | 387 | |
Private credit funds measured at net asset value(4) | — | | | — | | | — | | | 158 | |
Commingled funds measured at net asset value(4) | — | | | — | | | — | | | 1,135 | |
| Total investments | 1,287 | | | 573 | | | — | | | 4,123 | |
| Interest rate swaps | — | | | 4 | | | — | | | 4 | |
| Commodity contract derivatives | — | | | 33 | | | — | | | 33 | |
| | | | | | | |
| | | | | | | |
| | | | | | | |
| Total | $ | 1,287 | | | $ | 610 | | | $ | — | | | $ | 4,160 | |
| | | | | | | |
| Quoted Prices in Active Markets for Identical Liabilities
(Level 1) | | Significant Other
Observable Inputs
(Level 2) | | Significant
Unobservable
Inputs
(Level 3) | | Total |
| Liabilities | | | | | | | |
Currency swaps(5) | $ | — | | | $ | 141 | | | $ | — | | | $ | 141 | |
| Interest rate swaps | — | | | 662 | | | — | | | 662 | |
| Commodity contract derivatives | — | | | 2 | | | — | | | 2 | |
| Commodity derivatives under the FHP | — | | | 186 | | | — | | | 186 | |
| | | | | | | |
| Total | $ | — | | | $ | 991 | | | $ | — | | | $ | 991 | |
Notes
(1) Includes securities of government-sponsored entities.
(2) There are $287 million of U.S. Treasury Securities in Level 1 Government debt securities and $104 million of U.S. Treasury Securities in Level 1 Cash equivalents and other short-term investments for a total of $391 million of U.S. Treasury securities within Level 1 of the fair value hierarchy.
(3) Includes both U.S. and foreign debt.
(3)(4) Certain investments that are measured at fair value using the net asset value per share (orNAV or its equivalent) practical expedientequivalent ("alternative investments") have not been categorized in the fair value hierarchy. The inputs to these fair value measurements include underlying NAVs, discounted cash flow valuations, comparable market valuations, and adjustments for currency, credit, liquidity, and other risks. The fair value amounts presented in this table are intended to permit reconciliation of the fair value hierarchy to the amounts presented on the Consolidated Balance Sheets.
(4)(5) TVA records currency swaps net of cash collateral received from or paid to the counterparty, to the extent such amount is not recorded in Accounts payable and accrued liabilities. See Note 15 — Risk Management Activities and Derivative Transactions — Offsetting of Derivative Assets and Liabilities.
| Fair Value Measurements
At September 30, 2019 | |
Fair Value Measurements
At September 30, 2022 (in millions) | | Fair Value Measurements
At September 30, 2022 (in millions) |
| | Quoted Prices in Active
Markets for
Identical Assets
(Level 1) | | Significant Other
Observable Inputs
(Level 2) | | Significant
Unobservable
Inputs
(Level 3) | | Total | | Quoted Prices in Active
Markets for
Identical Assets
(Level 1) | | Significant Other
Observable Inputs
(Level 2) | | Significant
Unobservable
Inputs
(Level 3) | | Total |
| Assets | Assets | | | | | | | | Assets | | | | | | | |
| Investments | Investments | | | | | | | | Investments | | | | | | | |
| Equity securities | Equity securities | $ | 464 | | | $ | 0 | | | $ | 0 | | | $ | 464 | | Equity securities | $ | 534 | | | $ | — | | | $ | — | | | $ | 534 | |
Government debt securities | Government debt securities | 279 | | | 65 | | | 0 | | | 344 | | Government debt securities | 297 | | | 35 | | | — | | | 332 | |
Corporate debt securities | Corporate debt securities | 0 | | | 417 | | | 0 | | | 417 | | Corporate debt securities | — | | | 282 | | | — | | | 282 | |
| Mortgage and asset-backed securities | Mortgage and asset-backed securities | 0 | | | 32 | | | 0 | | | 32 | | Mortgage and asset-backed securities | — | | | 52 | | | — | | | 52 | |
| Institutional mutual funds | Institutional mutual funds | 250 | | | 0 | | | 0 | | | 250 | | Institutional mutual funds | 242 | | | — | | | — | | | 242 | |
| Forward debt securities contracts | Forward debt securities contracts | 0 | | | 22 | | | 0 | | | 22 | | Forward debt securities contracts | — | | | 4 | | | — | | | 4 | |
Private equity funds measured at net asset value(1) | 0 | | | 0 | | | 0 | | | 140 | | |
Private real asset funds measured at net asset value(1) | 0 | | | 0 | | | 0 | | | 135 | | |
Private credit measured at net asset value(1) | 0 | | | 0 | | | 0 | | | 33 | | |
Commingled funds measured at net asset value(1) | 0 | | | 0 | | | 0 | | | 1,131 | | |
Cash equivalents and other short-term investments(2)(3) | | Cash equivalents and other short-term investments(2)(3) | 61 | | | 118 | | | — | | | 179 | |
Private equity funds measured at net asset value(5) | | Private equity funds measured at net asset value(5) | — | | | — | | | — | | | 487 | |
Private real asset funds measured at net asset value(5) | | Private real asset funds measured at net asset value(5) | — | | | — | | | — | | | 369 | |
Private credit funds measured at net asset value(5) | | Private credit funds measured at net asset value(5) | — | | | — | | | — | | | 103 | |
Commingled funds measured at net asset value(3)(5) | | Commingled funds measured at net asset value(3)(5) | — | | | — | | | — | | | 1,087 | |
| | Total investments | Total investments | 993 | | | 536 | | | 0 | | | 2,968 | | Total investments | 1,134 | | | 491 | | | — | | | 3,671 | |
| | Commodity contract derivatives | Commodity contract derivatives | 0 | | | 7 | | | 5 | | | 12 | | Commodity contract derivatives | — | | | 152 | | | — | | | 152 | |
| | Commodity derivatives under the FHP | | Commodity derivatives under the FHP | — | | | 123 | | | — | | | 123 | |
| | Total | Total | $ | 993 | | | $ | 543 | | | $ | 5 | | | $ | 2,980 | | Total | $ | 1,134 | | | $ | 766 | | | $ | — | | | $ | 3,946 | |
| | | Quoted Prices in Active Markets for Identical Liabilities
(Level 1) | | Significant Other
Observable Inputs
(Level 2) | | Significant
Unobservable
Inputs
(Level 3) | | Total | | Quoted Prices in Active Markets for Identical Liabilities
(Level 1) | | Significant Other
Observable Inputs
(Level 2) | | Significant
Unobservable
Inputs
(Level 3) | | Total |
| Liabilities | Liabilities | | | | | | | | Liabilities | | | | | | | |
Currency swaps(2) | $ | 0 | | | $ | 208 | | | $ | 0 | | | $ | 208 | | |
Currency swaps(6) | | Currency swaps(6) | $ | — | | | $ | 240 | | | $ | — | | | $ | 240 | |
| Interest rate swaps | Interest rate swaps | 0 | | | 1,764 | | | 0 | | | 1,764 | | Interest rate swaps | — | | | 905 | | | — | | | 905 | |
| Commodity contract derivatives | Commodity contract derivatives | 0 | | | 44 | | | 9 | | | 53 | | Commodity contract derivatives | — | | | 7 | | | — | | | 7 | |
| Commodity derivatives under the FHP | | Commodity derivatives under the FHP | — | | | 8 | | | — | | | 8 | |
| Total | Total | $ | 0 | | | $ | 2,016 | | | $ | 9 | | | $ | 2,025 | | Total | $ | — | | | $ | 1,160 | | | $ | — | | | $ | 1,160 | |
Notes
(1) Includes securities of government-sponsored entities.
(2) There are $297 million of U.S. Treasury Securities in Level 1 Government debt securities and $61 million of U.S. Treasury Securities in Level 1 Cash equivalents and other short-term investments for a total of $358 million of U.S. Treasury securities within Level 1 of the fair value hierarchy.
(3) At September 30, 2022, $61 million of the Level 1 Government debt securities have been reclassified to Level 1 Cash equivalents and other short-term investments. At September 30, 2022, $1 million of the Level 2 Government debt securities, $1 million of the Level 2 Corporate debt securities, and $116 million of the Commingled funds measured at net asset value have been reclassified to Level 2 Cash equivalents and other short-term investments.
(4) Includes both U.S. and foreign debt.
(5) Certain investments that are measured at fair value using the net asset value per share (orNAV or its equivalent) practical expedientequivalent ("alternative investments") have not been categorized in the fair value hierarchy. The inputs to these fair value measurements include underlying NAVs, discounted cash flow valuations, comparable market valuations, and adjustments for currency, credit, liquidity, and other risks. The fair value amounts presented in this table are intended to permit reconciliation of the fair value hierarchy to the amounts presented on the Consolidated Balance Sheets.
(2)(6) TVA records currency swaps net of cash collateral received from or paid to the counterparty, to the extent such amount is not recorded in Accounts payable and accrued liabilities. See Note 15 — Risk Management Activities and Derivative Transactions — Offsetting of Derivative Assets and Liabilities.
During the fourth quarter of 2020, TVA discontinued derivative accounting for forward coal contracts. TVA previously used internal valuation specialists for the calculation of its commodity contract derivatives fair value measurements classified as Level 3. Analytical testing was performed on the change in fair value measurements each period to ensure the valuation is reasonable based on changes in general market assumptions. Significant changes to the estimated data used for unobservable inputs, in isolation or combination, may result in significant variations to the fair value measurement reported.
The following table presents a reconciliation of all commodity contract derivatives measured at fair value on a recurring basis using significant unobservable inputs (Level 3):
| | | | | |
Fair Value Measurements Using Significant Unobservable Inputs
|
| Commodity Contract Derivatives |
Balance at October 1, 2018 | $ | 58 | |
| |
| |
| |
| |
Change in net unrealized gains (losses) deferred as regulatory assets and liabilities | (62) | |
Balance at September 30, 2019 | (4) | |
| |
| |
| |
Settlements | (1) | |
Change in net unrealized gains (losses) deferred as regulatory assets and liabilities | 5 | |
Balance at September 30, 2020 | $ | 0 | |
The following table presents quantitative information related to the significant unobservable inputs used in the measurement of fair value of TVA's assets and liabilities classified as Level 3 in the fair value hierarchy:
| | | | | | | | | | | | | | | | | | | | | | | |
Quantitative Information about Level 3 Fair Value Measurements
|
| Fair Value at September 30, 2019 | | Valuation Technique(s) | | Unobservable Inputs | | Range |
Assets | | | | | | | |
Commodity contract derivatives | $ | 5 | | | Pricing model | | Coal supply and demand | | 0.4 - 0.8 billion tons/year |
| | | | | Long-term market prices | | $12.10 - $94.51/ton |
| | | | | | | |
Liabilities | | | | | | | |
Commodity contract derivatives | $ | 9 | | | Pricing model | | Coal supply and demand | | 0.4 - 0.8 billion tons/year |
| | | | | Long-term market prices | | $12.10 - $94.51/ton |
Other Financial Instruments Not Recorded at Fair Value
TVA uses the methods and assumptions described below to estimate the fair value of each significant class of financial instruments. The fair value of the financial instruments held at September 30, 20202023 and 2019,2022, may not be representative of the actual gains or losses that will be recorded when these instruments mature or are called or presented for early redemption. The estimated values of TVA's financial instruments not recorded at fair value at September 30, 20202023 and 2019,2022, were as follows:
| | | | | | | | | | | | | | | | | | | | | | | | | | | | | |
| Estimated Values of Financial Instruments Not Recorded at Fair Value |
| | | | At September 30, 2020 | | At September 30, 2019 |
| | Valuation Classification | | Carrying
Amount | | Fair
Value | | Carrying
Amount | | Fair
Value |
EnergyRight® receivables (including current portion) | Level 2 | | $ | 87 | | | $ | 86 | | | $ | 101 | | | $ | 100 | |
| | | | | | | | | |
| Loans and other long-term receivables, net (including current portion) | Level 2 | | $ | 105 | | | $ | 93 | | | $ | 131 | | | $ | 120 | |
| | | | | | | | | |
EnergyRight® financing obligations (including current portion) | Level 2 | | $ | 97 | | | $ | 108 | | | $ | 113 | | | $ | 126 | |
| | | | | | | | | |
| Unfunded loan commitments | Level 2 | | $ | 0 | | | $ | 2 | | | $ | 0 | | | $ | 10 | |
| | | | | | | | | |
| Membership interests of VIEs subject to mandatory redemption (including current portion) | Level 2 | | $ | 26 | | | $ | 35 | | | $ | 28 | | | $ | 37 | |
| | | | | | | | | |
| Long-term outstanding power bonds (including current maturities), net | Level 2 | | $ | 19,743 | | | $ | 26,630 | | | $ | 20,124 | | | $ | 26,059 | |
| | | | | | | | | |
| Long-term debt of VIEs (including current maturities), net | Level 2 | | $ | 1,089 | | | $ | 1,419 | | | $ | 1,128 | | | $ | 1,371 | |
| | | | | | | | | |
| Long-term notes payable (including current maturities) | Level 2 | | $ | 0 | | | $ | 0 | | | $ | 23 | | | $ | 23 | |
| | | | | | | | | | | | | | | | | | | | | | | | | | | | | |
Estimated Values of Financial Instruments Not Recorded at Fair Value (in millions) |
| | | | At September 30, 2023 | | At September 30, 2022 |
| | Valuation Classification | | Carrying
Amount | | Fair
Value | | Carrying
Amount | | Fair
Value |
EnergyRight® receivables, net (including current portion) | Level 2 | | $ | 59 | | | $ | 55 | | | $ | 62 | | | $ | 62 | |
| | | | | | | | | |
| Loans and other long-term receivables, net (including current portion) | Level 2 | | 104 | | | 96 | | | 105 | | | 96 | |
| | | | | | | | | |
EnergyRight® financing obligations (including current portion) | Level 2 | | 69 | | | 81 | | | 72 | | | 81 | |
| | | | | | | | | |
| Unfunded loan commitments | Level 2 | | — | | | 1 | | | — | | | — | |
| | | | | | | | | |
| Membership interests of VIEs subject to mandatory redemption (including current portion) | Level 2 | | 18 | | | 19 | | | 20 | | | 22 | |
| | | | | | | | | |
| Long-term outstanding power bonds, net (including current maturities) | Level 2 | | 18,866 | | | 17,963 | | | 17,856 | | | 18,070 | |
| | | | | | | | | |
| Long-term debt of VIEs, net (including current maturities) | Level 2 | | 968 | | | 927 | | | 1,007 | | | 989 | |
| | | | | | | | | |
| | | | | | | | | |
The carrying value of Cash and cash equivalents, Restricted cash and cash equivalents, Accounts receivable, net, and Short-term debt, net approximate their fair values.
The fair value for loans and other long-term receivables is estimated by determining the present value of future cash flows using a discount rate equal to lending rates for similar loans made to borrowers with similar credit ratings and for similar remaining maturities, where applicable. The fair value of long-term debt and membership interests of VIEs subject to mandatory redemption is estimated by determining the present value of future cash flows using current market rates for similar obligations, giving effect to credit ratings and remaining maturities.
17. Revenue
TVA adopted Revenue from Contracts with Customers effective October 1, 2018, using the modified retrospective method of adoption, which does not require restatement of prior year reported results. As a result of the adoption of this standard, no cumulative effect adjustment was recorded. Additionally, comparative disclosures for 2018 operating results with
the previous revenue recognition rules are not applicable as TVA's revenue recognition has not materially changed as a result of the new standard.
Revenue from Sales of Electricity
TVA's revenue from contracts with customers is primarily derived from the generation and sale of electricity to its customers and is included in Revenue from sales of electricity on the Consolidated Statements of Operations. Electricity is sold primarily to LPCs for distribution to their end-use customers. In addition, TVA sells electricity to directly served industrial companies, federal agencies, and others.
| | | | | |
| LPC sales | Approximately 9392 percent of TVA's revenueRevenue from sales of electricity is tofor both the years ended September 30, 2023 and 2022, was from LPCs, which then distribute the power to their customers using their own distribution systems. Power is delivered to each LPC at delivery points within the LPC's service territory. TVA recognizes revenue when the customer takes possession of the power at the delivery point. For power sales, the performance obligation to deliver power is satisfied in a series over time because the sales of electricity over the term of the customer contract are a series of distinct goods that are substantially the same and have the same pattern of transfer to the customer. TVA has no continuing performance obligations subsequent to delivery. Using the output method for revenue recognition provides a faithful depiction of the transfer of electricity as customers obtain control of the power and benefit from its use at delivery. Additionally, TVA has an enforceable right to consideration for energy delivered at any discrete point in time and will recognize revenue at an amount that reflects the consideration to which TVA is entitled for the energy delivered.
The amount of revenue is based on contractual prices approved by the TVA Board. Customers are invoiced monthly for power delivered as measured by meters located at the delivery points. The net transaction price is offset by certain credits available to customers that are known at the time of billing. Credits are designed to achieve objectives of the TVA Act and include items such as hydro preference credits for residential customers of LPCs, economic development credits to promote growth in the Tennessee Valley, wholesale bill credits to maintain long-term partnerships with LPCs, pandemic credits created to support LPCs and strengthen the public power response to the COVID-19 pandemic, and demand response credits allowing TVA to reduce industrial customer usage in periods of peak demand to balance system demand. Payments are typically due within approximately one month of invoice issuance. |
| |
| Directly served customers | Directly served customers, including industrial customers, federal agencies, and other customers, take power for their own consumption. Similar to LPCs, power is delivered to a delivery point, at which time the customer takes possession and TVA recognizes revenue. For all power sales, the performance obligation to deliver power is satisfied in a series over time since the sales of electricity over the term of the customer contract are a series of distinct goods that are substantially the same and have the same pattern of transfer to the customer. TVA has no continuing performance obligations subsequent to delivery. Using the output method for revenue recognition provides a faithful depiction of the transfer of electricity as customers obtain control of the power and benefit from its use at delivery. Additionally, TVA has an enforceable right to consideration for energy delivered at any discrete point in time and will recognize revenue at an amount that reflects the consideration to which TVA is entitled for the energy delivered.
The amount of revenue is based on contractual prices approved by the TVA Board. Customers are invoiced monthly for power delivered as measured by meters located at the delivery points. The net transaction price is offset by certain credits available to customers that are known at the time of billing. Examples of credits include items such as economic development credits to promote growth in the Tennessee Valley, pandemic credits created to support directly served customers in response to the COVID-19 pandemic, and demand response credits allowing TVA to reduce industrial customer usage in periods of peak demand to balance system demand. Payments are typically due within approximately one month of invoice issuance. |
Other Revenue
Other revenue consists primarily of wheeling and network transmission charges, sales of excess steam that is a by-product of power production, delivery point charges for interconnection points between TVA and the customer, REC sales, and certain other ancillary goods or services.
Disaggregated RevenueRevenues
In 2020, theDuring 2023, revenues generated from TVA's electricity sales were $10.1$11.9 billion and accounted for virtually all of TVA's revenues. TVA's operating revenues by state for each of the last three years are detailed in the table below:
| Operating Revenues By State For the years ended September 30 (in millions) | Operating Revenues By State For the years ended September 30 (in millions) | Operating Revenues By State For the years ended September 30 (in millions) |
| | | 2020 | | 2019 | | 2018 | | 2023 | | 2022 | | 2021 |
| Alabama | Alabama | $ | 1,439 | | | $ | 1,593 | | | $ | 1,600 | | Alabama | $ | 1,731 | | | $ | 1,778 | | | $ | 1,508 | |
| Georgia | Georgia | 249 | | | 270 | | | 267 | | Georgia | 284 | | | 299 | | | 254 | |
| Kentucky | Kentucky | 624 | | | 691 | | | 696 | | Kentucky | 773 | | | 821 | | | 655 | |
| Mississippi | Mississippi | 941 | | | 1,063 | | | 1,052 | | Mississippi | 1,146 | | | 1,182 | | | 984 | |
| North Carolina | North Carolina | 65 | | | 74 | | | 66 | | North Carolina | 89 | | | 87 | | | 66 | |
| Tennessee | Tennessee | 6,740 | | | 7,419 | | | 7,350 | | Tennessee | 7,819 | | | 8,137 | | | 6,841 | |
| Virginia | Virginia | 42 | | | 45 | | | 48 | | Virginia | 46 | | | 48 | | | 42 | |
| Subtotal | Subtotal | 10,100 | | | 11,155 | | | 11,079 | | Subtotal | 11,888 | | | 12,352 | | | 10,350 | |
| Off-system sales | Off-system sales | 4 | | | 4 | | | 7 | | Off-system sales | 14 | | | 19 | | | 7 | |
Revenue capitalized during pre-commercial plant operations(1) | Revenue capitalized during pre-commercial plant operations(1) | 0 | | | 0 | | | (11) | | Revenue capitalized during pre-commercial plant operations(1) | (3) | | | — | | | — | |
| Revenue from sales of electricity | Revenue from sales of electricity | 10,104 | | | 11,159 | | | 11,075 | | Revenue from sales of electricity | 11,899 | | | 12,371 | | | 10,357 | |
| Other revenue | Other revenue | 145 | | | 159 | | | 158 | | Other revenue | 155 | | | 169 | | | 146 | |
| Total operating revenues | Total operating revenues | $ | 10,249 | | | $ | 11,318 | | | $ | 11,233 | | Total operating revenues | $ | 12,054 | | | $ | 12,540 | | | $ | 10,503 | |
Note
(1) Represents revenue capitalized during pre-commercial operations of $11 million at Allen CC in 2018. See Note 1 — Summary of Significant Accounting Policies — Pre-Commercial Plant Operations.Colbert Combustion Turbine Units 9-11.
TVA's operating revenues by customer type for each of the last three years are detailed in the table below:
| Operating Revenues by Customer Type For the years ended September 30 (in millions) | Operating Revenues by Customer Type For the years ended September 30 (in millions) | Operating Revenues by Customer Type For the years ended September 30 (in millions) |
| | | 2020 | | 2019 | | 2018 | | 2023 | | 2022 | | 2021 |
| Revenue from sales of electricity | Revenue from sales of electricity | | | | | | Revenue from sales of electricity | | | | | |
Local power companies(1) | Local power companies(1) | $ | 9,406 | | | $ | 10,351 | | | $ | 10,262 | | Local power companies(1) | $ | 10,903 | | | $ | 11,291 | | | $ | 9,534 | |
| Industries directly served | Industries directly served | 588 | | | 686 | | | 695 | | Industries directly served | 864 | | | 926 | | | 707 | |
| Federal agencies and other | Federal agencies and other | 110 | | | 122 | | | 129 | | Federal agencies and other | 135 | | | 154 | | | 116 | |
Revenue capitalized during pre-commercial plant operations(2)(1) | Revenue capitalized during pre-commercial plant operations(2)(1) | 0 | | | 0 | | | (11) | | Revenue capitalized during pre-commercial plant operations(2)(1) | (3) | | | — | | | — | |
| Revenue from sales of electricity | Revenue from sales of electricity | 10,104 | | | 11,159 | | | 11,075 | | Revenue from sales of electricity | 11,899 | | | 12,371 | | | 10,357 | |
| Other revenue | Other revenue | 145 | | | 159 | | | 158 | | Other revenue | 155 | | | 169 | | | 146 | |
| Total operating revenues | Total operating revenues | $ | 10,249 | | | $ | 11,318 | | | $ | 11,233 | | Total operating revenues | $ | 12,054 | | | $ | 12,540 | | | $ | 10,503 | |
NotesNote
(1) The amount for the years ended September 30, 2020 and 2019, is net of $163 million and $14 million, respectively, of wholesale bill credits to LPCs participating in the long-term Partnership Agreement. There were 0 such credits in 2018.
(2) Represents revenue capitalized during pre-commercial operations of $11 million at Allen CC in 2018. See Note 1 — Summary of Significant Accounting Policies — Pre-Commercial Plant Operations.Colbert Combustion Turbine Units 9-11.
TVA and LPCs continue to work together to meet the changing needs of consumers around the Tennessee Valley. In 2019, the TVA Board approved a 20-year Partnership Agreement option that better aligns the length of LPC power contracts with TVA's long-term commitments. These agreements areUnder the partnership arrangement, the LPC power contracts automatically extendedrenew each year after their initial effective date, contingent uponand have a 20-year termination notice. The partnership arrangements can be terminated under certain circumstances, including limitedTVA's failure to limit rate increases as provided for in the agreements going forward. Participating LPCs will receive benefits including a 3.1 percent wholesale bill credit in exchange for their long-term commitment, which enables TVA to recover its long-term financial commitments over a commensurate period. The total wholesale bill credits to LPCs participating in the Partnership Agreement were $199 million, $199 million, and $189 million, respectively, for the years ended September 30, 2023, 2022, and 2021. In June 2020, TVA provided participating LPCs a flexibility option, named Generation Flexibility, that allows them to locally generate or purchase up to approximately five percent of their average total hourly energy sales over the prior five yearsa certain time period in order to meet their individual customers' needs. Revised flexibility agreements were made available to LPCs in August 2023 which permit projects to be located anywhere in TVA's service area, either connected to the LPC distribution system or TVA's transmission system, and make it easier for LPCs to partner in projects. As of November 16, 2020, 142September 30, 2023, 147 LPCs had signed the 20-year Partnership Agreement with TVA, and 6489 LPCs had signed a Power Supply Flexibility Agreement.
In August 2020,previous years, the TVA Board approved a $200 million Pandemic Relief Credit. Thepandemic credits, which were effective for 2021, 2022, and 2023. These
credits provided an annual 2.5 percent monthly base rate credit will beand applied beginning in October 2020 and will remain in effect through the end of 2021. The credit will apply to service provided to TVA's local power company customers,LPCs, their large commercial and industrial customers, and TVA directly served customers. For the years ended September 30, 2023, 2022, and 2021, pandemic credits totaled $225 million and $228 million, and $221 million, respectively.
The number of LPCs with theby contract arrangements described below,arrangement, the revenues derived from such arrangements during 2020,for 2023, and the percentage those revenues comprised of TVA's total operating revenues during 2020 represented by these revenuesfor 2023, are summarized in the tablestable below:
| TVA Local Power Company Contracts
At or for the year ended September 30, 2020 | |
TVA Local Power Company Contracts
At or for the year ended September 30, 2023 | | TVA Local Power Company Contracts
At or for the year ended September 30, 2023 |
Contract Arrangements(1) | Contract Arrangements(1) | Number of LPCs | | Revenue from Sales of Electricity to LPCs
(in millions) | | Percentage of Total Operating Revenues | Contract Arrangements(1) | Number of LPCs | | Revenue from Sales of Electricity to LPCs
(in millions) | | Percentage of Total Operating Revenues |
| 20-year termination notice | 20-year termination notice | 142 | | | $ | 7,666 | | | 74.8 | % | 20-year termination notice | 147 | | | $ | 9,367 | | | 77.7 | % |
| | 5-year termination notice | 5-year termination notice | 11 | | | 1,740 | | | 17.0 | % | 5-year termination notice | 6 | | | 1,536 | | | 12.7 | % |
Total(2) | 153 | | | $ | 9,406 | | | 91.8 | % | |
| Total | | Total | 153 | | | $ | 10,903 | | | 90.4 | % |
NotesNote
(1) Ordinarily, the LPCs and TVA have the same termination notice period; however, in contractsa contract with twoone of the LPCs with a five-year termination notices,notice, TVA has a 10-year termination notice (which becomes a five-year termination notice if TVA loses its discretionary wholesale rate-setting authority). Certain LPCs have five-year termination notices or a shorter period if any act of Congress, court decision, or regulatory change requires or permits that election.
(2) TVA wholesale power contracts decreased to 153 in 2020 due to a merger between two LPCs in July 2020.
TVA's two largest LPCs — MLGWMemphis Light, Gas and NESWater Division ("MLGW") and Nashville Electric Service ("NES") — have contracts with a five-year and a 20-year termination notice period, respectively. Sales to MLGW and NES accounted for 9nine percent and 8eight percent, respectively, of TVA's total operating revenues in 2020. In May 2020, MLGW published a draft IRP to guide energy choices in the future,2023, 2022, and in July 2020, TVA made a proposal to MLGW that highlights the benefits of remaining a TVA customer. In August 2020, MLGW published a final IRP and announced its plan to issue requests for proposal to validate the cost estimates included in the IRP. In addition, certain other LPCs are evaluating options for future energy choices.2021.
Contract Balances
Contract assets represent an entity's right to consideration in exchange for goods and services that the entity has transferred to customers. TVA doesdid not have any material contract assets as ofat September 30, 2020.2023.
Contract liabilities represent an entity's obligations to transfer goods or services to customers for which the entity has received consideration (or an amount of consideration is due) from the customers. These contract liabilities are primarily related to upfront consideration received prior to the satisfaction of the performance obligation.
See
Energy Prepayment Obligations.below and Note 12 — In 2004, TVA and its largest customer, MLGW, entered into an energy prepayment agreement under which MLGW prepaid TVA $1.5 billion for the future costs of electricity to be delivered by TVA to MLGW over a period of 15 years. TVA accounted for the prepayment as unearned revenue and reported the obligation to deliver power under this arrangement as Energy prepayment obligations. The arrangement ceased in 2019. TVA recognized approximately $100 million of noncash revenue in each year of the arrangement as electricity was delivered to MLGW based on the ratio of units of kilowatt hours delivered to total units of kilowatt hours under contract. As of September 30, 2019, $1.5 billion had been recognized as noncash revenue on a cumulative basis during the life of the agreement, $100 million of which was recognized as noncash revenue and a corresponding reduction in the balance of Energy prepayment obligations during 2018. During 2019, $10 million was recognized as noncash revenue and a corresponding reduction in the balance of Energy prepayment obligations. Discounts to account for the time value of money, which were recorded as a reduction to electricity sales, amounted to $4 million and $46 million during 2019 and 2018, respectively.Other Long-Term Liabilities — Long-Term Deferred Revenue.
Economic Development Incentives. Under certain economic development programs TVA offers incentives to existing and potential power customers in targeted business sectors that make multi-year commitments to invest in the Tennessee Valley. TVA records those incentives as reductions of revenue. In 2020 and 2019, TVAIncentives recorded a total of $318 million and $310 million, respectively, in incentives as a reduction of revenue.to revenue were $330 million, $328 million, and $315 million for 2023, 2022, and 2021, respectively. Incentives that have been approved but have not been paid are recorded in Accounts payable and accrued liabilities and Other long-term liabilities on the Consolidated Balance Sheets. At September 30, 20202023 and 2019,2022, the outstanding unpaid incentives were $172$188 million and $157$187 million, respectively. Incentives that have been paid out may be subject to claw back if the customer fails to meet certain program requirements. Additionally, in May 2020, TVA established flexibility provisions to support the continued operations and recovery of participating customers experiencing financial and operational hardships as a result of the COVID-19 pandemic and corresponding economic downturn. These provisions have not had a material impact to TVA.
18. Proprietary Capital
Appropriation Investment
TVA's power program and stewardship (nonpower) programs were originally funded primarily by appropriations from Congress. In 1959, Congress passed an amendment to the TVA Act that required TVA's power program to be self-financing from power revenues and proceeds from power program financings. While TVA's power program did not directly receive appropriated funds after it became self-financing, TVA continued to receive appropriations for certain multipurpose and other nonpower mission-related activities as well as for its stewardship activities. TVA has not received any appropriations from Congress for any activities since 1999, and since that time, TVA has funded stewardship program activities primarily with power revenues.
The 1959 amendment to the TVA Act also required TVA, beginning in 1961, to make annual payments to the U.S. Treasury from net power proceeds as a repayment of and as a return on the Power Program Appropriation Investment until a total of $1.0 billion of the Power Program Appropriation Investment has been repaid in accordance with the 1959 amendment. TVA fulfilled its requirement to repay $1.0 billion of the Power Program Appropriation Investment in 2014. The TVA Act requires TVA to continue making payments to the U.S. Treasury as a return on the remaining $258 million of the Power Program Appropriation Investment.
The table below summarizes TVA's activities related to appropriated funds and retained earnings.
| | | | | | | | | | | | | | | | | | | | | | | |
Summary of Proprietary Capital Activity At or for the years ended September 30 |
| | 2020 | | 2019 |
| Power Program | | Nonpower
Programs | | Power Program | | Nonpower
Programs |
| Appropriation Investment | $ | 258 | | | $ | 4,351 | | | $ | 258 | | | $ | 4,351 | |
| Proprietary Capital | | | | | | | |
| Balance at beginning of year | 10,823 | | | (3,795) | | | 9,404 | | | (3,787) | |
| Net income (loss) for year | 1,360 | | | (8) | | | 1,425 | | | (8) | |
| Return on power program appropriation investment | (6) | | | 0 | | | (6) | | | 0 | |
| Balance at end of year | 12,177 | | | (3,803) | | | 10,823 | | | (3,795) | |
| Net proprietary capital at September 30 | $ | 12,435 | | | $ | 548 | | | $ | 11,081 | | | $ | 556 | |
Payments to the U.S. Treasury
TVA paid the U.S. Treasury $6 million, $6 million, and $5 million in 2020, 2019, and 2018, respectively, as a return on the Power Program Appropriation Investment. The amount of the return on the Power Program Appropriation Investment is based on the Power Program Appropriation Investment balance at the beginning of that year and the computed average interest rate payable by the U.S. Treasury on its total marketable public obligations at the same date. The interest rates payable by TVA on the Power Program Appropriation Investment were 2.44 percent, 2.37 percent, and 2.09 percent for 2020, 2019, and 2018, respectively.
Accumulated Other Comprehensive Income (Loss)
The items included in AOCI consist of market valuation adjustments for certain derivative instruments. See Note 15 — Risk Management Activities and Derivative Transactions.
TVA records exchange rate gains and losses on debt and related accrued interest in net income and marks its currency swap assets and liabilities to market through OCI. TVA recognized unrealized gains (losses) of $(1) million and $(114) million in 2020 and 2019, respectively, into AOCI on the mark-to-market of currency swaps. TVA then reclassified an amount out of AOCI into net income, offsetting the gain/loss from recording the exchange gain/loss on the debt and related accrued interest. The amounts reclassified from OCI into net income resulted in increases (decreases) to net income of $38 million, $(45) million, and $(26) million in 2020, 2019, and 2018, respectively. These reclassifications, coupled with the recording of the exchange gain/loss on the debt and related accrued interest, did not have an impact on net income in 2020, 2019, and 2018. Based on forecasted foreign currency exchange rates, TVA expects to reclassify approximately $27 million of gains from AOCI to interest expense within the next 12 months to offset amounts anticipated to be recorded in interest expense related to exchange gain on the debt and related accrued interest.
19. Other Income, (Expense), Net
Income and expenses not related to TVA's operating activities are summarized in the following table:
| | | | | | | | | | | | | | | | | |
Other Income (Expense), Net For the years ended September 30 |
| | 2020 | | 2019 | | 2018 |
| Bellefonte deposit | $ | 0 | | | $ | 21 | | | $ | 0 | |
| Interest income | 18 | | | 25 | | | 23 | |
| External services | 12 | | | 13 | | | 14 | |
| Gains (losses) on investments | 9 | | | 3 | | | 6 | |
| Miscellaneous | (3) | | | 0 | | | 7 | |
| Total other income (expense), net | $ | 36 | | | $ | 62 | | | $ | 50 | |
During 2020, Other income (expense), net decreased $26 million, primarily driven by $21 million of other income in 2019 related to a deposit liability received by TVA as a down payment on the sale of Bellefonte. The purchaser, Nuclear Development, LLC, failed to fulfill the requirements of the sales contract with respect to obtaining NRC approval of the transfer of required nuclear licenses and payment of the remainder of the selling price before the November 30, 2018 closing date. Additionally, Interest income decreased $7 million primarily as a result of lower interest rates. See Note 22 — Commitments and Contingencies — Legal Proceedings for a discussion of the lawsuit filed by Nuclear Development, LLC. | | | | | | | | | | | | | | | | | |
Other Income, Net For the years ended September 30 (in millions) |
| | 2023 | | 2022 | | 2021 |
| Bellefonte | $ | — | | | $ | — | | | $ | (28) | |
| Interest income | 34 | | | 15 | | | 12 | |
| External services | 15 | | | 16 | | | 13 | |
| Gains (losses) on investments | 13 | | | (17) | | | 16 | |
| Miscellaneous | (1) | | | (7) | | | — | |
| Total other income, net | $ | 61 | | | $ | 7 | | | $ | 13 | |
20.19. Supplemental Cash Flow Information
Interest paid was $1.1 billion for 2020each of 2023, 2022, and $1.2 billion for both 2019 and 2018.2021. These amounts differ from interest expense in certain years due to the timing of payments. There was no interest capitalized in 2020, 2019,2023, 2022, or 2018.2021.
Construction in progress and Nuclearnuclear fuel expenditures included in Accounts payable and accrued liabilities at September 30, 2020, 2019,2023, 2022, and 20182021 were $398$559 million, $324$510 million, and $372$539 million, respectively, and are excluded from the Consolidated Statements of Consolidated Cash Flows for the years ended September 30, 2020, 2019,2023, 2022, and 20182021 as non-cash investing activities.
ExcludedARO project accruals included in Accounts payable and accrued liabilities at September 30, 2023, 2022, and 2021 were $71 million, $119 million, and $98 million, respectively, and are excluded from the Consolidated Statements of Consolidated Cash Flows for the years ended September 30, 20202023, 2022, and 2019,2021 as non-cash operating activities.
There are no material finance leases that were entered into during the years ended September 30, 2023 and 2022. Excluded from the Consolidated Statements of Cash Flows for the year ended September 30, 2021, were non-cash investing and financing activities were $394of $233 million related primarily to an increase in lease obligations incurred primarily in connection with a PPAassets and $10 million related to lease obligationsliabilities incurred for leased equipment, respectively. There were no capital leases incurred during 2018.a finance lease that was amended in March 2021. See Note 78 — Leases for further information regarding TVA's finance leases. Also excluded from the Statement of Consolidated Cash Flows for the year ended September 30, 2020, were $80 million and $73 million as non-cash financing and investing activities, respectively, due to derecognition of the Paradise pipeline financing obligation and asset.
Cash flows from swap contracts that are accounted for as hedges are classified in the same category as the item being hedged or on a basis consistent with the nature of the instrument.
21.20. Benefit Plans
TVA sponsors a qualified defined benefitpension plan ("pension plan") that covers most of its full-time employees hired prior to July 1, 2014, a qualified defined contribution plan ("401(k) plan") that covers most of its full-time employees, two unfunded post-retirement health care plans that provide for non-vested contributions toward the cost of eligible retirees' medical coverage, other post-employment benefits such as workers' compensation, the Restoration Plan, and the SERP. The pension plan and the 401(k) plan are administered by a separate legal entity, the TVA Retirement System ("TVARS"), which is governed by its own board of directors (the "TVARS Board").
Overview of Plans and Benefits
Retirement Plans. The participants in the pension plan receive either a traditional final average pay pension or a cash balance pension. The traditional pension benefit is based on the participant's creditable service, average monthly salary for theirthe participant's highest three consecutive years of eligible compensation, and a pension factor based on the participant's age and years of service, less a Social Security offset. The cash balance pension benefit is based on pay and interest credits accumulated in the participant's account and the participant's age.
Participants in the pension plan are also eligible to receive 401(k) plan matching contributions, may be eligible to receive 401(k) plan non-elective contributions, and may be eligible to make after-tax contributions of up to $10,000 per year to the pension plan, which at the election of the participant are invested in either the fixed fund, which receives a fixed interest rate set forth in the plan, or the variable fund, which receives a rate of return based on an S&P 500 index fund. Participants in the
pension plan may also become eligible for a supplemental pension benefit based on age and years of service at retirement, which is provided to help offset the cost of retiree medical insurance. Employees first hired on or after July 1, 2014, are participants in the 401(k) plan only and receive both non-elective and matching contributions to their accounts in the 401(k) plan.
401(k) Plan. Under the 401(k) plan, the non-elective and matching contributions TVA makes to participant accounts depends on the employee's hire date, years of service, and individual elections. Non-elective employer contributions for eligible participants range from three percent to six percent and matching employer contributions range from 1.5 percent to six percent. TVA recognized 401(k) contribution costs of $88$105 million, $84$97 million, and $80$92 million during 2020, 2019,2023, 2022, and 2018,2021, respectively. The 2021
Restoration Plan. TVA established the Restoration Plan, a nonqualified excess 401(k) plan, contribution coststo allow certain eligible employees whose contributions to the 401(k) plan are estimatedlimited by IRS rules to be approximately $92 million.save additional amounts for retirement and receive non-elective and matching employer contributions. During 2023, TVA recognized less than $1 million in Restoration Plan benefit costs.
Supplemental Executive Retirement Plan. TVA has established a SERP for certain executives in critical positions to provide supplemental pension benefits tied to compensation that exceeds limits imposed by IRS rules applicable to the qualified defined benefit pension plan.
Other Post-Retirement Benefits. TVA sponsors two unfunded post-retirement benefit plans that provide for non-vested contributions toward the cost of certain eligible retirees' medical coverage. The first plan covers only certain retirees and surviving dependents who do not qualify for TVARS benefits, including the supplemental pension benefit. The second plan is designed to place a limit on the out-of-pocket amount certain eligible retirees pay for medical coverage and provides a credit based on years of TVA service and monthly base pension amount, reduced by any TVARS supplemental pension benefits or any TVA contribution from the first plan, described above. EffectiveIn January 2017, TVA began providing all Medicare-eligible retirees and spouses were provided Medicare supplement coverage through a private exchange. Transition to the exchange doesdid not affect any TVARS supplemental benefits for eligible retirees, and the credit will continuecontinues to be calculated in the same manner as before.
Other Post-Employment Benefits. TVA employees injured in work-related incidents are covered by the workers' compensation program for federal employees administered through the Department of Labor by the Office of Workers'
Compensation Programs in accordance with the provisions of the Federal Employees' Compensation Act ("FECA").FECA. FECA provides compensation and medical benefits to federal employees for permanent and temporary disability due to employment-related injury or disease.
Accounting Mechanisms
Regulatory Accounting. TVA has classified all amounts related to unrecognized prior service costs/(credits), net actuarial gains or losses, and the funded status as regulatory assets or liabilities as such amounts are probable of collection in future rates. Additionally, TVA recognizes pension costs as regulatory assets or regulatory liabilities to the extent that the amount calculated under U.S. GAAP as pension expense differs from the amount TVA contributes to the pension plan as pension plan contributions. As a result of recent plan design changes, future contributions are expected to exceed the expense calculated under U.S. GAAP. Accordingly, TVA will discontinuediscontinued this regulatory accounting practice onceas all such deferred costs have beenwere recovered at which time it will recognize pension costs in accordance with U.S. GAAP.as of September 30, 2023.
Cost Method. TVA uses the projected unit credit cost method to determine the service cost and the projected benefit obligation for retirement, termination, and ancillary benefits. Under this method, a "projected accrued benefit" is calculated at the beginning of the year and at the end of the year for each benefit that may be payable in the future. The "projected accrued benefit" is based on the plan's accrual formula and upon service at the beginning or end of the year, but it uses final average compensation, social security benefits, and other relevant factors projected to the age at which the employee is assumed to leave active service. The projected benefit obligation is the actuarial present value of the "projected accrued benefits" at the beginning of the year for employed participants and is the actuarial present value of all benefits for other participants. The service cost is the actuarial present value of the difference between the "projected accrued benefits" at the beginning and end of the year.
Amortization of Net Gain or Loss. TVA utilizes the corridor approach for gain/loss amortization. Differences between actuarial assumptions and actual plan results are deferred and amortized into periodic cost only when the accumulated differences exceed 10 percent of the greater of the projected benefit obligation or the market-related value of plan assets. If necessary, the excess is amortized over the average remaining service periodfuture expected working lifetime of participating employeesparticipants expected to receive benefits. The current projected amortization periods of unrecognized net gain or lossbenefits, which is approximately 11 years for the pension plan and 1214 years for the post-retirement plan.plans.
Amortization of Prior Service Cost/(Credit). Amortization of net prior service cost/(credit) resulting from a plan change is included as a component of period expense in the year first recognized and every year thereafter until it is fully amortized. The increase or decrease in the benefit obligation due to the plan change is amortized over the average remaining service period of participating employees expected to receive benefits under the plan. The pension and post-retirement plans currently have prior service costs/(credits) related tofrom plan changes made in 2009, 2010, 2016, 2018, 2019,2020, and 20202021 with remaining amortization periods ranging from one to ninesix years. However, when a plan change reduces the benefit obligation, existing positive prior service costs are reduced or eliminated starting with the earliest established before a new prior service credit base is established.
Asset Method. TVA's asset method calculates a market-related value of assets ("MRVA") that recognizes realized and unrealized investment gains and losses over a three-year smoothing period to decrease the volatility of annual net periodic pension benefit costs. The MRVA is used to determine the expected return on plan assets, a component of net periodic pension benefit cost. The difference in the expected return on the MRVA and the actual return on the fair value on plan assets is recognized as an actuarial (gain)/loss in the pension benefit obligation at September 30. However, the MRVA has no impact on the fair value of plan assets measured at September 30.
Obligations and Funded Status
The actuarial results provided reflect data and assumptions appropriate for the purpose of the measurement of plan obligations and funded status for the year ended. EffectsLingering effects of the COVID-19 pandemic, supply-chain disruptions, inflation, and geopolitical tensions on the financial markets, regulations, and experience are uncertain and still evolving. The ultimate impactevolving, creating an additional degree of complexity associated with the COVID-19 pandemic onfuture occurrence or outcome of events and conditions underlying the pensionsignificant accounting assumptions used to measure the plan and other post-retirement plans depends on factors beyond TVA's knowledge or control, including the duration and severity obligations.
The changes in plan obligations, assets, and funded status for the years ended September 30, 20202023 and 2019,2022, were as follows:
| Obligations and Funded Status
For the years ended September 30 | |
| 795,900,000 | | Pension Benefits | | Other Post-Retirement Benefits | |
| | 2020 | | 2019 | | 2020 | | 2019 | |
Obligations and Funded Status
For the years ended September 30 (in millions) | | Obligations and Funded Status
For the years ended September 30 (in millions) |
| 812,900,000 | | 812,900,000 | | Pension Benefits | | Other Post-Retirement Benefits |
| 809,400,000 | | 809,400,000 | | 2023 | | 2022 | | 2023 | | 2022 |
| Change in benefit obligation | Change in benefit obligation | | | | | | | | Change in benefit obligation | | | | | | | |
| Benefit obligation at beginning of year | Benefit obligation at beginning of year | $ | 13,312 | | | $ | 11,725 | | | $ | 499 | | | $ | 428 | | Benefit obligation at beginning of year | $ | 10,536 | | | $ | 13,348 | | | $ | 388 | | | $ | 498 | |
| Service cost | Service cost | 55 | | | 44 | | | 16 | | | 11 | | Service cost | 32 | | | 53 | | | 10 | | | 17 | |
| Interest cost | Interest cost | 415 | | | 499 | | | 16 | | | 18 | | Interest cost | 568 | | | 378 | | | 18 | | | 15 | |
| Plan participants' contributions | Plan participants' contributions | 6 | | | 7 | | | 0 | | | 0 | | Plan participants' contributions | 4 | | | 5 | | | — | | | — | |
Collections(1) | Collections(1) | — | | | — | | | 20 | | | 22 | | Collections(1) | — | | | — | | | 13 | | | 15 | |
| | Actuarial (gain) loss | Actuarial (gain) loss | 614 | | | 1,756 | | | 39 | | | 78 | | Actuarial (gain) loss | (284) | | | (2,509) | | | (44) | | | (114) | |
| Plan change | 2 | | | 7 | | | 0 | | | 0 | | |
| | Net transfers (to) from variable fund/401(k) plan | Net transfers (to) from variable fund/401(k) plan | 2 | | | 1 | | | 0 | | | 0 | | Net transfers (to) from variable fund/401(k) plan | 4 | | | 11 | | | — | | | — | |
| Expenses paid | Expenses paid | (5) | | | (6) | | | 0 | | | 0 | | Expenses paid | (7) | | | (6) | | | — | | | — | |
| Benefits paid | Benefits paid | (726) | | | (721) | | | (46) | | | (58) | | Benefits paid | (754) | | | (744) | | | (38) | | | (43) | |
| Benefit obligation at end of year | Benefit obligation at end of year | 13,675 | | | 13,312 | | | 544 | | | 499 | | Benefit obligation at end of year | 10,099 | | | 10,536 | | | 347 | | | 388 | |
| | Change in plan assets | Change in plan assets | | | | | | | | Change in plan assets | | | | | | | |
| Fair value of net plan assets at beginning of year | Fair value of net plan assets at beginning of year | 7,980 | | | 8,003 | | | 0 | | | 0 | | Fair value of net plan assets at beginning of year | 8,094 | | | 9,110 | | | — | | | — | |
| Actual return on plan assets | Actual return on plan assets | 397 | | | 389 | | | 0 | | | 0 | | Actual return on plan assets | 482 | | | (590) | | | — | | | — | |
| Plan participants' contributions | Plan participants' contributions | 6 | | | 7 | | | 0 | | | 0 | | Plan participants' contributions | 4 | | | 5 | | | — | | | — | |
Collections(1) | Collections(1) | 0 | | | 0 | | | 20 | | | 22 | | Collections(1) | — | | | — | | | 13 | | | 15 | |
| Net transfers (to) from variable fund/401(k) plan | Net transfers (to) from variable fund/401(k) plan | 2 | | | 1 | | | 0 | | | 0 | | Net transfers (to) from variable fund/401(k) plan | 4 | | | 11 | | | — | | | — | |
| Employer contributions | Employer contributions | 305 | | | 307 | | | 26 | | | 36 | | Employer contributions | 306 | | | 308 | | | 25 | | | 28 | |
| Expenses paid | Expenses paid | (5) | | | (6) | | | 0 | | | 0 | | Expenses paid | (7) | | | (6) | | | — | | | — | |
| Benefits paid | Benefits paid | (726) | | | (721) | | | (46) | | | (58) | | Benefits paid | (754) | | | (744) | | | (38) | | | (43) | |
| Fair value of net plan assets at end of year | Fair value of net plan assets at end of year | 7,959 | | | 7,980 | | | 0 | | | 0 | | Fair value of net plan assets at end of year | 8,129 | | | 8,094 | | | — | | | — | |
| | Funded status | Funded status | $ | (5,716) | | | $ | (5,332) | | | $ | (544) | | | $ | (499) | | Funded status | $ | (1,970) | | | $ | (2,442) | | | $ | (347) | | | $ | (388) | |
Note
(1) Collections include retiree contributions as well as provider discounts and rebates.
For 2020,2023, the $614$284 million pension benefit obligation actuarial loss isgain was primarily due to the decreaseincrease in the discount rate from 3.205.60 percent to 2.755.95 percent, which increaseddecreased the liability by $714$334 million. In addition, based on the results obtained from the most recent experience study performed in 2023, TVA recognized $74actuarial gains of $23 million ofdue to the revision in demographic and other experience related assumptions to reflect anticipated future plan experience. These gains were partially offset by a $61 million actuarial lossesloss due to higher COLA and higher interest crediting rates than previously assumed for CY 2024, and a $12 million actuarial loss due to observed plan experience.
For 2022, the $2.5 billion pension benefit obligation actuarial gain was primarily due to the increase in the discount rate from 2.90 percent to 5.60 percent, which decreased the liability by $3.5 billion. This gain was partially offset by a $527 million actuarial loss due to mortality assumption changes, a $411 million actuarial loss due to the higher COLA and higher interest crediting rates than previously assumed for CY 2023 and CY 2024, and a $78 million actuarial loss due to demographic and plan experience, and an actuarial loss of $32 million due to the assumption change of elections for lump sum payments based upon an updated actuarial study. These actuarial losses were partially offset by a $137 million gain due to mortality assumption changes and $69 million gain due to a lower COLA than previously assumed. The
2020 plan change of $2 million was due to the plan change in the interest rate and mortality basis used to determine SERP retirement payments.
For 2019, the $1.8 billion pension benefit obligation actuarial loss is primarily due to the decrease in the discount rate from 4.35 percent to 3.20 percent, which increased the liability by $1.6 billion. In addition, TVA recognized actuarial losses of $147 million due to demographic and plan experience. These actuarial losses were partially offset by a $14 million gain due to mortality assumption changes. The 2019 pension plan change of $7 million was a result of two new participants entering the SERP plan during 2019.
The other post-retirement actuarial lossgain for 2020 increased2023 decreased the benefit obligation by $39$44 million. TVA recognized a $30$61 million lossactuarial gain primarily due to lower retirement rate assumptions than previously assumed and actuarial gains of $10 million due to the updatedrevision of demographic and other experience related assumptions to reflect anticipated future plan assumptions relatedexperience based on the results obtained from the 2023 experience study. In addition, TVA recognized a $17 million actuarial gain from the increase in the discount rate from 5.65 percent to the election rate for pre-Medicare retirees, assumed per capita claims costs, and expected retiree contributions6.05 percent. These gains were partially offset by a $27 million actuarial loss to reflect observed and anticipated plan experience. In addition, TVA recognizedexperience for contribution costs and pre-Medicare per capita claims costs and a $20$17 million actuarial loss due to changes in the decreasepre-Medicare per capita claims cost trend rate assumptions.
The $114 million other post-retirement actuarial gain for 2022 was primarily due to the increase in the discount rate from 3.303.05 percent to 3.055.65 percent, andwhich decreased the liability by $168 million. The liability decreased an additional $31 million as a $4 million loss
result of an actuarial gain from delaying the ultimate post-Medicare trend rate assumption two years due to actual experience different from assumed.favorable premium rates. These lossesgains were partially offset by a gain of $15$67 million actuarial loss due to the updated post-Medicarechanges in pre-Medicare trend rate assumption attributableassumptions related to higher claim costs and lower than expected premium increases on the private exchange.
The other post-retirementfuture retiree contributions. In addition, TVA recognized an $18 million actuarial loss for 2019 was primarily due to the decrease in the discount rate from 4.40 percent to 3.30 percent, which increased the liability by $71 million. TVA recognized losses of $24 million primarily due to the updated per capita claim costsmortality assumption and an additional loss of $7 million related to actual experience different from assumed. These losses were partially offset by a net gain of $24 million due to the change in health care trend rate assumptions.changes.
Amounts related to these benefit plans recognized on TVA's Consolidated Balance Sheets consist of regulatory assets and liabilities that have not been recognized as components of net periodic benefit cost at September 30, 20202023 and 2019,2022, and the funded status of TVA's benefit plans, which are included in Accounts payable and accrued liabilities and Post-retirement and post-employment benefit obligations:
| Amounts Recognized on TVA's Consolidated Balance Sheets At September 30 | |
Amounts Recognized on TVA's Consolidated Balance Sheets At September 30 (in millions) | | Amounts Recognized on TVA's Consolidated Balance Sheets At September 30 (in millions) |
| | | Pension Benefits | | Other Post-Retirement Benefits | | Pension Benefits | | Other Post-Retirement Benefits |
| | | 2020 | | 2019 | | 2020 | | 2019 | | 2023 | | 2022 | | 2023 | | 2022 |
| Regulatory assets (liabilities) | Regulatory assets (liabilities) | $ | 5,115 | | | $ | 4,731 | | | $ | 78 | | | $ | 25 | | Regulatory assets (liabilities) | $ | 1,440 | | | $ | 1,839 | | | $ | (95) | | | $ | (70) | |
| Accounts payable and accrued liabilities | Accounts payable and accrued liabilities | (5) | | | (5) | | | (28) | | | (28) | | Accounts payable and accrued liabilities | (6) | | | (6) | | | (21) | | | (22) | |
Pension and post-retirement benefit obligations(1) | Pension and post-retirement benefit obligations(1) | (5,711) | | | (5,327) | | | (516) | | | (471) | | Pension and post-retirement benefit obligations(1) | (1,964) | | | (2,436) | | | (326) | | | (366) | |
Note
(1) The table above excludes $390$237 million and $383$270 million of post-employment benefit costs that are recorded in Post-retirement and post-employment benefit obligations on the Consolidated Balance Sheets at September 30, 20202023 and 2019,2022, respectively.
Unrecognized amounts included in regulatory assets or liabilities yet to be recognized as components of accrued benefit cost at September 30, 20202023 and 2019,2022, consisted of the following:
| Post-Retirement Benefit Costs Deferred as Regulatory Assets (Liabilities) At September 30 | |
Post-Retirement Benefit Costs Deferred as Regulatory Assets (Liabilities) At September 30 (in millions) | | Post-Retirement Benefit Costs Deferred as Regulatory Assets (Liabilities) At September 30 (in millions) |
| | | Pension Benefits | | Other Post-Retirement Benefits | | Pension Benefits | | Other Post-Retirement Benefits |
| | | 2020 | | 2019 | | 2020 | | 2019 | | 2023 | | 2022 | | 2023 | | 2022 |
| Unrecognized prior service credit | Unrecognized prior service credit | $ | (615) | | | $ | (714) | | | $ | (112) | | | $ | (135) | | Unrecognized prior service credit | $ | (336) | | | $ | (424) | | | $ | (59) | | | $ | (76) | |
| Unrecognized net loss | 5,620 | | | 5,350 | | | 190 | | | 160 | | |
| Unrecognized net loss (gain) | | Unrecognized net loss (gain) | 1,776 | | | 2,186 | | | (36) | | | 6 | |
| Amount capitalized due to actions of regulator | Amount capitalized due to actions of regulator | 110 | | | 95 | | | 0 | | | 0 | | Amount capitalized due to actions of regulator | — | | | 77 | | | — | | | — | |
| Total regulatory assets (liabilities) | Total regulatory assets (liabilities) | $ | 5,115 | | | $ | 4,731 | | | $ | 78 | | | $ | 25 | | Total regulatory assets (liabilities) | $ | 1,440 | | | $ | 1,839 | | | $ | (95) | | | $ | (70) | |
TheInformation for the pension projected benefit obligation ("PBO") in excess of plan assets and other post-retirement accumulated postretirement benefit obligation ("APBO") has been disclosed in the Obligations and Funded Status table above. The following table provides the pension plan accumulated benefit obligation and fair value("ABO") in excess of plan assets for the pensionassets. The other post-retirement plans are unfunded or have no plan at September 30, 2020 and 2019, were as follows:assets.
| Projected Benefit Obligations and Accumulated Benefit Obligations in Excess of Plan Assets At September 30 | |
Accumulated Benefit Obligations in Excess of Plan Assets At September 30 (in millions) | | Accumulated Benefit Obligations in Excess of Plan Assets At September 30 (in millions) |
| | | 2020 | | 2019 | | 2023 | | 2022 |
| Projected benefit obligation | $ | 13,675 | | | $ | 13,312 | | |
| | Accumulated benefit obligation | Accumulated benefit obligation | 13,613 | | | 13,246 | | Accumulated benefit obligation | $ | 10,069 | | | $ | 10,508 | |
| Fair value of net plan assets | Fair value of net plan assets | 7,959 | | | 7,980 | | Fair value of net plan assets | 8,129 | | | 8,094 | |
The components of net periodic benefit cost and other amounts recognized as changes in regulatory assets for the years ended September 30, 2020, 2019,2023, 2022, and 20182021 were as follows:
| | | | | | | | | | | | | | | | | | | | | | | | | | | | | | | | | | | |
Components of Net Periodic Benefit Cost For the years ended September 30 |
| | Pension Benefits | | Other Post-Retirement Benefits |
| | 2020 | | 2019 | | 2018 | | 2020 | | 2019 | | 2018 |
| Service cost | $ | 55 | | | $ | 44 | | | $ | 53 | | | $ | 16 | | | $ | 11 | | | $ | 14 | |
| Interest cost | 415 | | | 499 | | | 473 | | | 16 | | | 18 | | | 19 | |
| Expected return on plan assets | (488) | | | (477) | | | (478) | | | 0 | | | 0 | | | 0 | |
| Amortization of prior service credit | (97) | | | (99) | | | (99) | | | (24) | | | (24) | | | (22) | |
| Recognized net actuarial loss | 436 | | | 336 | | | 409 | | | 10 | | | 4 | | | 8 | |
| Total net periodic benefit cost as actuarially determined | 321 | | | 303 | | | 358 | | | 18 | | | 9 | | | 19 | |
| Amount expensed (capitalized) due to actions of regulator | (15) | | | 1 | | | (54) | | | 0 | | | 0 | | | 0 | |
| Net periodic benefit cost | $ | 306 | | | $ | 304 | | | $ | 304 | | | $ | 18 | | | $ | 9 | | | $ | 19 | |
The amounts in the regulatory asset that are expected to be recognized as components of net periodic benefit cost during the next fiscal year are as follows:
| | | | | | | | | | | | | | | | | |
Expected Amortization of Regulatory Assets in 2021 At September 30, 2020 |
| | Pension Benefits | | Other Post-Retirement
Benefits | | Total |
| Prior service credit | $ | (97) | | | $ | (18) | | | $ | (115) | |
| Net actuarial loss | 447 | | | 12 | | | 459 | |
| Amounts expensed due to actions of regulator | 28 | | | 0 | | | 28 | |
| | | | | | | | | | | | | | | | | | | | | | | | | | | | | | | | | | | |
Components of Net Periodic Benefit Cost For the years ended September 30 (in millions) |
| | Pension Benefits | | Other Post-Retirement Benefits |
| | 2023 | | 2022 | | 2021 | | 2023 | | 2022 | | 2021 |
| Service cost | $ | 32 | | | $ | 53 | | | $ | 57 | | | $ | 10 | | | $ | 17 | | | $ | 18 | |
| Interest cost | 568 | | | 378 | | | 368 | | | 18 | | | 15 | | | 16 | |
| Expected return on plan assets | (492) | | | (435) | | | (493) | | | — | | | — | | | — | |
| Amortization of prior service credit | (88) | | | (93) | | | (97) | | | (17) | | | (17) | | | (18) | |
| Recognized net actuarial loss (gain) | 135 | | | 392 | | | 452 | | | (2) | | | 5 | | | 11 | |
| Total net periodic benefit cost as actuarially determined | 155 | | | 295 | | | 287 | | | 9 | | | 20 | | | 27 | |
| Amount expensed due to actions of regulator | 77 | | | 13 | | | 19 | | | — | | | — | | | — | |
| Net periodic benefit cost | $ | 232 | | | $ | 308 | | | $ | 306 | | | $ | 9 | | | $ | 20 | | | $ | 27 | |
| | | | | | | | | | | |
Plan Assumptions
Plan assumptions utilized to determine benefit obligations and net periodic benefit costs include discount rates, projected health care cost trend rates, COLAs, expected long-term rate of return on plan assets, rate of increase in future compensation levels, retirement rates, expected timing and form of payments, and mortality rates, the most significant of which certain key assumptions are noted below. Every five years, a formal actuarial experience study that compares assumptions to the actual experience is conducted. Additional ad-hoc experience studies are performed as needed to review recent experience and validate recommended changes to the actuarial assumptions used based upon TVA's lastlatest experience study in 2018.2023.
| | Actuarial Assumptions Utilized to Determine Benefit Obligations at September 30 | Actuarial Assumptions Utilized to Determine Benefit Obligations at September 30 | Actuarial Assumptions Utilized to Determine Benefit Obligations at September 30 |
| | | Pension Benefits | | Other Post-Retirement Benefits | | Pension Benefits | | Other Post-Retirement Benefits |
| | | 2020 | | 2019 | | 2020 | | 2019 | | 2023 | | 2022 | | 2023 | | 2022 |
| Discount rate | Discount rate | 2.75% | | 3.20% | | 3.05% | | 3.30% | Discount rate | 5.95% | | 5.60% | | 6.05% | | 5.65% |
| Rate of compensation increase | 3.43% | | 3.50% | | N/A | | N/A | |
| Average rate of compensation increase | | Average rate of compensation increase | 4.05% | | 3.32% | | N/A | | N/A |
| Weighted average interest crediting rate | | Weighted average interest crediting rate | 5.13% | | 5.14% | | N/A | | N/A |
Cost of living adjustment (COLA)(1) | Cost of living adjustment (COLA)(1) | 2.00% | | 2.00% | | 2.00% | | 2.00% | Cost of living adjustment (COLA)(1) | 2.00% | | 2.00% | | 2.00% | | 2.00% |
| Pre-Medicare eligible | | |
Current health care cost trend rate(2) | N/A | | N/A | | 6.50% | | 6.75% | |
| Pre-Medicare eligible per capita claim costs | | Pre-Medicare eligible per capita claim costs | |
| Current health care cost trend rate | | Current health care cost trend rate | N/A | | N/A | | 7.50% | | 7.00% |
| Ultimate health care cost trend rate | | Ultimate health care cost trend rate | N/A | | N/A | | 5.00% | | 5.00% |
| Year ultimate trend rate is reached | | Year ultimate trend rate is reached | N/A | | N/A | | 2034 | | 2031 |
| Pre-Medicare eligible per capita contributions | | Pre-Medicare eligible per capita contributions | |
| Current health care cost trend rate | | Current health care cost trend rate | N/A | | N/A | | 5.00% | | 5.00% |
| Ultimate health care cost trend rate | Ultimate health care cost trend rate | N/A | | N/A | | 5.00% | | 5.00% | Ultimate health care cost trend rate | N/A | | N/A | | 5.00% | | 5.00% |
| Year ultimate trend rate is reached | Year ultimate trend rate is reached | N/A | | N/A | | 2027 | | 2027 | Year ultimate trend rate is reached | N/A | | N/A | | 2022 | | 2022 |
| Post-Medicare eligible | Post-Medicare eligible | | Post-Medicare eligible | |
| Current health care cost trend rate | Current health care cost trend rate | N/A | | N/A | | 0% | | 0% | Current health care cost trend rate | N/A | | N/A | | —% | | —% |
| Ultimate health care cost trend rate | Ultimate health care cost trend rate | N/A | | N/A | | 4.00% | | 4.00% | Ultimate health care cost trend rate | N/A | | N/A | | 4.00% | | 4.00% |
| Year ultimate trend rate is reached | Year ultimate trend rate is reached | N/A | | N/A | | 2024 | | 2023 | Year ultimate trend rate is reached | N/A | | N/A | | 2026 | | 2026 |
NotesNote
(1) The COLA assumption rate is the ultimate long-term rate. The calendar year rate for 20212024 is assumed to be one4.05 percent, and for years thereafter the ultimate is used.
(2) In 2019, TVA reset the pre-Medicare health care cost trend rates assumption with an initial rate of 6.75 percent, declining 0.25 percent per year until it reaches the ultimate rate of 5.00 percent in 2027. For 2020, TVA maintained this trend assumption for pre-Medicare per capita claims cost with a current health care cost rate of 6.50 percent. However, to account for cumulative delayed medical care due to the COVID-19 pandemic and the expected spending as the demand for care returns, the pre-Medicare per capita retiree contributions current health care cost trend rate is 11.93 percent, and in 2022 assumed to return to 6.25 percent in line with the health care cost trend rates assumption.used.
| Actuarial Assumptions Utilized to Determine Net Periodic Benefit Cost for the Years Ended September 30(1) | Actuarial Assumptions Utilized to Determine Net Periodic Benefit Cost for the Years Ended September 30(1) | Actuarial Assumptions Utilized to Determine Net Periodic Benefit Cost for the Years Ended September 30(1) |
| | | Pension Benefits | | Other Post-Retirement Benefits | | Pension Benefits | | Other Post-Retirement Benefits |
| | | 2020 | | 2019 | | 2018 | | 2020 | | 2019 | | 2018 | | 2023 | | 2022 | | 2021 | | 2023 | | 2022 | | 2021 |
| Discount rate | Discount rate | 3.20 | % | | 4.35 | % | | 3.85 | % | | 3.30 | % | | 4.40 | % | | 3.95 | % | Discount rate | 5.60% | | 2.90% | | 2.75% | | 5.65% | | 3.05% | | 3.05% |
Expected return on plan assets(2) | Expected return on plan assets(2) | 6.75 | % | | 6.75 | % | | 6.75 | % | | N/A | | N/A | | N/A | Expected return on plan assets(2) | 6.50% | | 5.75% | | 6.75% | | N/A | | N/A | | N/A |
| Weighted average interest crediting rate | | Weighted average interest crediting rate | 5.14% | | 5.14% | | 5.15% | | N/A | | N/A | | N/A |
Cost of living adjustment (COLA)(3) | Cost of living adjustment (COLA)(3) | 2.00 | % | | 2.00 | % | | 2.00 | % | | 2.00 | % | | 2.00 | % | | 2.00 | % | Cost of living adjustment (COLA)(3) | 2.00% | | 2.00% | | 2.00% | | 2.00% | | 2.00% | | 2.00% |
| Rate of compensation increase | 3.43 | % | | 3.50 | % | | 5.34 | % | | N/A | | N/A | | N/A | |
| Pre-Medicare eligible | | |
| Average rate of compensation increase | | Average rate of compensation increase | 3.28% | | 3.32% | | 3.37% | | N/A | | N/A | | N/A |
| Pre-Medicare eligible per capita claims costs | | Pre-Medicare eligible per capita claims costs | |
| Current health care cost trend rate | | Current health care cost trend rate | N/A | | N/A | | N/A | | 7.00% | | 6.25% | | 6.50% |
| Ultimate health care cost trend rate | | Ultimate health care cost trend rate | N/A | | N/A | | N/A | | 5.00% | | 5.00% | | 5.00% |
| Year ultimate trend rate is reached | | Year ultimate trend rate is reached | N/A | | N/A | | N/A | | 2031 | | 2027 | | 2027 |
| Pre-Medicare eligible per capita contributions | | Pre-Medicare eligible per capita contributions | |
| Current health care cost trend rate | Current health care cost trend rate | N/A | | N/A | | N/A | | 6.75 | % | | 6.25 | % | | 6.50 | % | Current health care cost trend rate | N/A | | N/A | | N/A | | 5.00% | | 8.51% | | 11.93% |
| Ultimate health care cost trend rate | Ultimate health care cost trend rate | N/A | | N/A | | N/A | | 5.00 | % | | 5.00 | % | | 5.00 | % | Ultimate health care cost trend rate | N/A | | N/A | | N/A | | 5.00% | | 5.00% | | 5.00% |
| Year ultimate trend rate is reached | Year ultimate trend rate is reached | N/A | | N/A | | N/A | | 2027 | | 2024 | | 2024 | Year ultimate trend rate is reached | N/A | | N/A | | N/A | | 2022 | | 2027 | | 2027 |
| Post-Medicare eligible | Post-Medicare eligible | | Post-Medicare eligible | |
| Current health care cost trend rate | Current health care cost trend rate | N/A | | N/A | | N/A | | 0 | % | | 0 | % | | 0 | % | Current health care cost trend rate | N/A | | N/A | | N/A | | —% | | —% | | —% |
| Ultimate health care cost trend rate | Ultimate health care cost trend rate | N/A | | N/A | | N/A | | 4.00 | % | | 4.00 | % | | 4.00 | % | Ultimate health care cost trend rate | N/A | | N/A | | N/A | | 4.00% | | 4.00% | | 4.00% |
| Year ultimate trend rate is reached | Year ultimate trend rate is reached | N/A | | N/A | | N/A | | 2023 | | 2021 | | 2021 | Year ultimate trend rate is reached | N/A | | N/A | | N/A | | 2026 | | 2024 | | 2024 |
Notes
(1) The actuarial assumptions used to determine the benefit obligations at September 30 of each year are subsequently used to determine net periodic benefit cost
for the following year except the rate of compensation increase assumption.
(2) The actual return on assets for 2020, 2019,2023, 2022, and 20182021 were 5.11%, 4.99%,6.13 percent, (6.64) percent, and 5.84%,20.30 percent, respectively.
(3) The COLA assumption rate is the ultimate rate. The actual calendar year rate is used in determining the expense, and for years thereafter the ultimate rate is used.
Discount Rate. In selecting the assumed discount rate, TVA reviews market yields on high-quality corporate debt and endeavors to match, through the use of a hypothetical bond portfolio, instrument maturities with the maturities of its pension obligations in accordance with the prevailing accounting standards. The selected bond portfolio is derived from a universe of high quality corporate bonds of Aa-rated quality or higher. After the bond portfolio is selected, a single interest rate is determined that equates the present value of the plan's projected benefit payments discounted at this rate with the market value of the bonds selected.
Rate ofExpected Return on Plan Assets. The qualified defined benefit pension plan is the only plan that is funded with qualified plan assets. The expected rate of return is based on annual studies performed by third-party professional investment consultants. In determining the expected long-term rate of return on pension plan assets, TVA uses a process that incorporates actual historical asset class returns and an assessment of expected future performance and takes into consideration external actuarial advice, the current outlook on capital markets, the asset allocation policy, and the anticipated investment expenses and impact of active management. Asset allocations are periodically updated using the pension plan asset/liability studies and are part of the determination of the estimates of long-term rates of return. The TVARS asset allocation policy diversifies plan assets across multiple asset classes so as to minimize the risk of large losses. The asset allocation policy is designed to be responsive to changes in the funded status of TVARS. In September 2023, the TVARS Board approved a new asset allocation policy, but had no changes to the 6.50 percent expected return on assets assumption adopted in 2022.
Compensation Increases. Assumptions related to compensation increases are based upon the latest TVA compensation experience study performed in 2018.2023. Future compensation is assumed to likely increase at rates between 2.503.00 percent and 14.005.50 percent per year, depending upon the employee's age. The average assumed compensation increasedage, and is used to determine the benefit obligations and net periodic benefit costcost. The average assumed compensation increase is based upon the current active participants.
Mortality. The mortality assumption is comprised of a base table that represents the current future life expectancy adjusted by an improvement scale to project future improvements in life expectancy. TVA's mortality assumptions are based upon actuarial projections in combination with studies of the actual mortality experience of TVA's pension and post-retirement benefit plan participants while taking into consideration the published Society of Actuaries ("SOA") mortality table and projection scale at September 30. In 2020, based upon the most recent mortality experience study, TVA adopted a modified version of the SOA PRI-2012 table and a modified version of the SOA MP-2019 improvement scale.30, 2023.
The following mortality assumptions were used to determine the benefit obligations for the pension and other post-retirement benefit plans at September 30, 2020, 2019,2023, 2022, and 2018.2021. Assumptions used to determine year-end benefit obligations are the assumptions used to determine the subsequent year's net periodic benefit costs.
| | | | | | | | | | | | | | | | | |
Mortality Assumptions At September 30 |
| | 2020 | | 2019 | | 2018 |
| Mortality table | PRI-2012 table (adjusted) | | RP-2014 table (adjusted) | | RP-2014 table (adjusted) |
| Improvement scale | MP-2019 (modified) | | MP-2018 (modified) | | RP-2017 (modified) |
| | | | | | | | | | | | | | | | | |
Mortality Assumptions At September 30 |
| | 2023 | | 2022 | | 2021 |
| Mortality table | PRI-2012 Upper Quartile table (adjusted) | | PRI-2012 Upper Quartile table (adjusted) | | PRI-2012 table (adjusted) |
| Improvement scale | MP-2021 (modified) | | MP-2021 (modified) | | MP-2020 (modified) |
Health Care Cost Trends. The health care cost trend rates are assumptions about the annual rate of changes in the cost of health care benefits currently provided by the post-retirement benefit plan. In establishing health care cost trend rates, TVA reviews actual recent cost trends and projected future trends considering health care inflation, changes in health care utilization, and changes in plan benefits and premium experience.
Cost of Living Adjustment. COLAs are an increase in the benefits for eligible retirees to help maintain the purchasing power of benefits as consumer prices increase. Eligible retirees receive a COLACOLAs on pension and supplemental benefits equalin January based on a formula linked to the percentage change in the Consumer Price Index for All Urban Consumers ("CPI-U") in January following any year in which the 12-monthcalculation is at least one percent. Increases in COLA will be the percentage change in average CPI-U exceeded by as much as one percent the 12-month average of the CPI-U for the preceding year incurrent 12-month period (November - October) compared to the average CPI-U for the previous 12-month period (November - October) for which a COLA was given. Increases in the COLA will be the percent increase in CPI-U over the preceding yeargiven, less 0.25 percent, with a 6.00 percent cap for any one year.
TVA's COLA assumption is derived from long-term expectations of the expected future rate of inflation, based upon capital market assumptions, economic forecasts, and the Federal Reserve policy. The actual calendar year COLA and the long- term COLA assumption are used to determine the benefit obligation at September 30 and the net periodic benefit costs for the following fiscal year. The actual calendar year COLAs for 2020, 2019,2023, 2022, and 20182021 were 1.546.00 percent, 2.213.50 percent, and 1.841.13 percent, respectively.
Sensitivity of Costs to Changes in Assumptions. The following chart reflects the sensitivity of pension cost to changes in certain actuarial assumptions:
| | | | | | | | | | | | | | | | | | | | |
Sensitivity to Certain Changes in Pension Assumptions At September 30, 2020 |
Actuarial Assumption | | Change in Assumption | | Impact on 2020 Pension Cost | | Impact on 2020 Projected Benefit Obligation |
| Discount rate | | (0.25) | % | | $ | 17 | | | $ | 418 | |
| Rate of return on plan assets | | (0.25) | % | | 18 | | | N/A |
| Cost of living adjustments | | 0.25 | % | | 30 | | | 270 | |
Each fluctuation above assumes that the other components of the calculation are held constant and excludes any impact for unamortized actuarial gains or losses.
The following chart reflects the sensitivity of post-retirement benefit cost to changes in the health care trend rate:
| | | | | | | | | | | |
Sensitivity to Changes in Assumed Health Care Cost Trend Rates At September 30, 2020 |
| | 1% Increase | | 1% Decrease |
| Effect on total of service and interest cost components for the year | $ | 4 | | | $ | (4) | |
| Effect on end-of-year accumulated post-retirement benefit obligation | 70 | | | (68) | |
| | | | | | | | | | | | | | | | | | | | |
| Sensitivity to Certain Changes in Pension Assumptions |
Actuarial Assumption | | Change in Assumption | | Impact on 2023 Pension Cost (in millions) | | Impact on 2023 Projected Benefit Obligation (in millions) |
| Discount rate | | (0.25) | % | | $ | 12 | | | $ | 236 | |
| Rate of return on plan assets | | (0.25) | % | | 19 | | | N/A |
| Cost of living adjustments | | 0.25 | % | | 24 | | | 165 | |
Each fluctuation above assumes that the other components of the calculation are held constant and excludes any impact for unamortized actuarial gains or losses.
Plan Investments
The TVARSIn 2021, a new asset allocation policy for qualified pension plan assets has targets of 40 percent equity including global publicwas put in place to reduce risk and private equityvolatility in the TVARS investment portfolio. Furthermore, in September 2023, based on current market conditions and updated capital market assumptions, the asset allocation policy was modified to further progress towards these goals. TVARS investments 40 percent fixed income securities, and 20 percent real assets including public and private real assets. TVARS haswill be reallocated in a long-term investment plan that contains a dynamic de-risking strategy which will allocate investments to assets that better match the liability, such as long duration fixed income securities,prudent manner over time as improved funding status targets are met.to move toward the new asset allocation targets. Pursuant to the TVARS Rules and Regulations, any proposed changes in asset allocation that would change TVARS's assumed rate of investment return are subject to TVA'sthe review and veto.
As set forth above, the TVA Board. The qualified pension plan assets are invested across global public equity, private equity, safety oriented fixed income, opportunistic fixed income, public real assets,growth, defensive-growth, defensive, and private realinflation-sensitive assets. The TVARS asset allocation policy includes permissible deviations from target allocations, and action can be taken, as appropriate, to rebalance the plan's assets consistent with the asset allocation policy. At September 30, 20202023 and 2019,2022, the asset holdings of TVARS included the following:
| | | | | | | | | | | | | | | | | | | | |
Asset Holdings of TVARS At September 30 |
| | | | | Plan Assets at September 30 |
| Asset Category | | Target Allocation | | 2020 | | 2019 |
| Global public equity | | 32 | % | | 36 | % | | 37 | % |
| Private equity | | 8 | % | | 13 | % | | 10 | % |
| Safety oriented fixed income | | 20 | % | | 18 | % | | 18 | % |
| Opportunistic fixed income | | 20 | % | | 15 | % | | 12 | % |
| Public real assets | | 10 | % | | 10 | % | | 15 | % |
| Private real assets | | 10 | % | | 8 | % | | 8 | % |
| | | | | | |
| Total | | 100 | % | | 100 | % | | 100 | % |
| | | | | | | | | | | | | | | | | | | | |
| Asset Holdings of TVARS |
| | | | | Plan Assets at September 30 |
| Asset Category | | Target Allocation | | 2023 | | 2022 |
| Growth assets | | 17 | % | | 22 | % | | 20 | % |
| Defensive growth assets | | 30 | % | | 33 | % | | 34 | % |
| Defensive assets | | 33 | % | | 17 | % | | 18 | % |
| Inflation-sensitive assets | | 20 | % | | 28 | % | | 28 | % |
| Total | | 100 | % | | 100 | % | | 100 | % |
Fair Value Measurements
The following table provides the fair value measurement amounts for assets held by TVARS at September 30, 2020:2023:
| TVA Retirement System At September 30, 2020 | |
TVA Retirement System At September 30, 2023 (in millions) | | TVA Retirement System At September 30, 2023 (in millions) |
| | | Total(1)(2) | | Quoted Prices in Active Markets for Identical
Assets/Liabilities
(Level 1) | | Significant Other
Observable Inputs
(Level 2) | | Significant
Unobservable
Inputs
(Level 3) | | Total(1)(2) | | Quoted Prices in Active Markets for Identical
Assets/Liabilities
(Level 1) | | Significant Other
Observable Inputs
(Level 2) | | Significant
Unobservable
Inputs
(Level 3) |
| Assets | Assets | | | | | | | | Assets | | | | | | | |
| Equity securities | Equity securities | $ | 1,624 | | | $ | 1,621 | | | $ | 0 | | | $ | 3 | | Equity securities | $ | 732 | | | $ | 731 | | | $ | — | | | $ | 1 | |
| | Preferred securities | Preferred securities | 11 | | | 0 | | | 11 | | | 0 | | Preferred securities | 4 | | | — | | | 4 | | | — | |
| | Debt securities | Debt securities | | | | | | | Debt securities | | | | | | |
| Corporate debt securities | Corporate debt securities | 1,421 | | | 0 | | | 1,418 | | | 3 | | Corporate debt securities | 1,109 | | | — | | | 1,107 | | | 2 | |
| Residential mortgage-backed securities | Residential mortgage-backed securities | 317 | | | 0 | | | 314 | | | 3 | | Residential mortgage-backed securities | 330 | | | — | | | 323 | | | 7 | |
| Debt securities issued by U.S. Treasury | Debt securities issued by U.S. Treasury | 701 | | | 701 | | | 0 | | | 0 | | Debt securities issued by U.S. Treasury | 602 | | | 602 | | | — | | | — | |
| Debt securities issued by foreign governments | Debt securities issued by foreign governments | 231 | | | 0 | | | 179 | | | 52 | | Debt securities issued by foreign governments | 12 | | | — | | | 10 | | | 2 | |
| Asset-backed securities | Asset-backed securities | 116 | | | 0 | | | 88 | | | 28 | | Asset-backed securities | 173 | | | — | | | 130 | | | 43 | |
| Debt securities issued by state/local governments | Debt securities issued by state/local governments | 23 | | | 0 | | | 23 | | | 0 | | Debt securities issued by state/local governments | 21 | | | — | | | 21 | | | — | |
| Commercial mortgage-backed securities | Commercial mortgage-backed securities | 91 | | | 0 | | | 86 | | | 5 | | Commercial mortgage-backed securities | 113 | | | — | | | 108 | | | 5 | |
| Commingled funds measured at net asset value(3) | Commingled funds measured at net asset value(3) | | Commingled funds measured at net asset value(3) | |
| Equity | Equity | 931 | | | 0 | | | 0 | | | 0 | | Equity | 360 | | | — | | | — | | | — | |
| Debt | Debt | 203 | | | 0 | | | 0 | | | 0 | | Debt | 544 | | | — | | | — | | | — | |
| | Blended | Blended | 102 | | | 0 | | | 0 | | | 0 | | Blended | 101 | | | — | | | — | | | — | |
| | Institutional mutual funds | Institutional mutual funds | 277 | | | 277 | | | 0 | | | 0 | | Institutional mutual funds | 363 | | | 363 | | | — | | | — | |
| Cash equivalents and other short-term investments | Cash equivalents and other short-term investments | 338 | | | 77 | | | 261 | | | 0 | | Cash equivalents and other short-term investments | 315 | | | 51 | | | 264 | | | — | |
| Private credit measured at net asset value(3) | 166 | | | 0 | | | 0 | | | 0 | | |
Private equity measured at net asset value(3) | 1,003 | | | 0 | | | 0 | | | 0 | | |
Private real assets measured at net asset value(3) | 629 | | | 0 | | | 0 | | | 0 | | |
Private credit funds measured at net asset value(3) | | Private credit funds measured at net asset value(3) | 694 | | | — | | | — | | | — | |
Private equity funds measured at net asset value(3) | | Private equity funds measured at net asset value(3) | 1,769 | | | — | | | — | | | — | |
Private real asset funds measured at net asset value(3) | | Private real asset funds measured at net asset value(3) | 1,162 | | | — | | | — | | | — | |
| | | Securities lending collateral | Securities lending collateral | 167 | | | 0 | | | 167 | | | 0 | | Securities lending collateral | 181 | | | — | | | 181 | | | — | |
| | Derivatives | Derivatives | | | | | | | | Derivatives | | | | | | | |
| Futures | Futures | 3 | | | 3 | | | 0 | | | 0 | | Futures | 1 | | | 1 | | | — | | | — | |
| Swaps | Swaps | 10 | | | 0 | | | 10 | | | 0 | | Swaps | 17 | | | — | | | 17 | | | — | |
| Options | 2 | | | 0 | | | 2 | | | 0 | | |
| | Foreign currency forward receivable | Foreign currency forward receivable | 2 | | | 0 | | | 2 | | | 0 | | Foreign currency forward receivable | 2 | | | — | | | 2 | | | — | |
| | Total assets | Total assets | $ | 8,368 | | | $ | 2,679 | | | $ | 2,561 | | | $ | 94 | | Total assets | $ | 8,605 | | | $ | 1,748 | | | $ | 2,167 | | | $ | 60 | |
| | Liabilities | Liabilities | | | | | | | | Liabilities | | | | | | | |
| Derivatives | Derivatives | | Derivatives | |
| Futures | Futures | $ | 1 | | | $ | 1 | | | $ | 0 | | | $ | 0 | | Futures | $ | 5 | | | $ | 5 | | | $ | — | | | $ | — | |
| Foreign currency forward payable | 3 | | | 0 | | | 3 | | | 0 | | |
| | | Swaps | Swaps | 6 | | | 0 | | | 6 | | | 0 | | Swaps | 26 | | | — | | | 26 | | | — | |
| Options | Options | 2 | | | 0 | | | 2 | | | 0 | | Options | 1 | | | 1 | | | — | | | — | |
| | Securities sold under agreements to repurchase | Securities sold under agreements to repurchase | 123 | | | 0 | | | 123 | | | 0 | | Securities sold under agreements to repurchase | 96 | | | — | | | 96 | | | — | |
| | Total liabilities | Total liabilities | $ | 135 | | | $ | 1 | | | $ | 134 | | | $ | 0 | | Total liabilities | $ | 128 | | | $ | 6 | | | $ | 122 | | | $ | — | |
Notes
(1) Excludes approximately $107$167 million in net payables associated with security purchases and sales and various other payables.
(2) Excludes a $167$181 million payable for collateral on loaned securities in connection with TVARS's participation in securities lending programs.
(3) In accordance with Subtopic 820-10, certain investments that are measured at fair value using the net asset value per share (orNAV or its equivalent) practical expedientequivalent ("alternative investments") have not been classified in the fair value hierarchy. The inputs to these fair value measurements include underlying NAVs, discounted cash flow valuations, comparable market valuations, and adjustments for currency, credit, liquidity, and other risks.
The following table provides the fair value measurement amounts for assets held by TVARS at September 30, 2019:2022:
| TVA Retirement System At September 30, 2019 | |
TVA Retirement System At September 30, 2022 (in millions) | | TVA Retirement System At September 30, 2022 (in millions) |
| | | Total(1)(2) | | Quoted Prices in Active Markets for Identical
Assets/Liabilities
(Level 1) | | Significant Other
Observable Inputs
(Level 2) | | Significant
Unobservable
Inputs
(Level 3) | | Total(1)(2) | | Quoted Prices in Active Markets for Identical
Assets/Liabilities
(Level 1) | | Significant Other
Observable Inputs
(Level 2) | | Significant
Unobservable
Inputs
(Level 3) |
| Assets | Assets | | | | | | | | Assets | | | | | | | |
| Equity securities | Equity securities | $ | 1,766 | | | $ | 1,762 | | | $ | 0 | | | $ | 4 | | Equity securities | $ | 709 | | | $ | 707 | | | $ | — | | | $ | 2 | |
| | Preferred securities | Preferred securities | 10 | | | 1 | | | 9 | | | 0 | | Preferred securities | 6 | | | 1 | | | 5 | | | — | |
| | Debt securities | Debt securities | | | | | | | Debt securities | | | | | | |
| Corporate debt securities | Corporate debt securities | 1,387 | | | 0 | | | 1,382 | | | 5 | | Corporate debt securities | 1,087 | | | — | | | 1,087 | | | — | |
| Residential mortgage-backed securities | Residential mortgage-backed securities | 427 | | | 0 | | | 424 | | | 3 | | Residential mortgage-backed securities | 293 | | | — | | | 289 | | | 4 | |
| Debt securities issued by U.S. Treasury | Debt securities issued by U.S. Treasury | 807 | | | 807 | | | 0 | | | 0 | | Debt securities issued by U.S. Treasury | 616 | | | 616 | | | — | | | — | |
| Debt securities issued by foreign governments | Debt securities issued by foreign governments | 210 | | | 0 | | | 209 | | | 1 | | Debt securities issued by foreign governments | 130 | | | — | | | 130 | | | — | |
| Asset-backed securities | Asset-backed securities | 144 | | | 0 | | | 116 | | | 28 | | Asset-backed securities | 176 | | | — | | | 136 | | | 40 | |
| Debt securities issued by state/local governments | Debt securities issued by state/local governments | 18 | | | 0 | | | 18 | | | 0 | | Debt securities issued by state/local governments | 23 | | | — | | | 23 | | | — | |
| Commercial mortgage-backed securities | Commercial mortgage-backed securities | 81 | | | 0 | | | 80 | | | 1 | | Commercial mortgage-backed securities | 161 | | | — | | | 145 | | | 16 | |
| Commingled funds measured at net asset value(3) | Commingled funds measured at net asset value(3) | | Commingled funds measured at net asset value(3) | |
| Equity | Equity | 795 | | | 0 | | | 0 | | | 0 | | Equity | 436 | | | — | | | — | | | — | |
| Debt | Debt | 308 | | | 0 | | | 0 | | | 0 | | Debt | 657 | | | — | | | — | | | — | |
| Commodities | 217 | | | 0 | | | 0 | | | 0 | | |
| | Blended | Blended | 125 | | | 0 | | | 0 | | | 0 | | Blended | 111 | | | — | | | — | | | — | |
| | Institutional mutual funds | Institutional mutual funds | 97 | | | 97 | | | 0 | | | 0 | | Institutional mutual funds | 454 | | | 454 | | | — | | | — | |
| Cash equivalents and other short-term investments | Cash equivalents and other short-term investments | 329 | | | 1 | | | 328 | | | 0 | | Cash equivalents and other short-term investments | 431 | | | 133 | | | 298 | | | — | |
| Certificates of deposit | 3 | | | 0 | | | 3 | | | 0 | | |
Private credit measured at net asset value(3) | 78 | | | 0 | | | 0 | | | 0 | | |
Private equity measured at net asset value(3) | 778 | | | 0 | | | 0 | | | 0 | | |
Private real assets measured at net asset value(3) | 659 | | | 0 | | | 0 | | | 0 | | |
| Private credit funds measured at net asset value(3) | | Private credit funds measured at net asset value(3) | 522 | | | — | | | — | | | — | |
Private equity funds measured at net asset value(3) | | Private equity funds measured at net asset value(3) | 1,454 | | | — | | | — | | | — | |
Private real asset funds measured at net asset value(3) | | Private real asset funds measured at net asset value(3) | 1,080 | | | — | | | — | | | — | |
| | | Securities lending collateral | Securities lending collateral | 224 | | | 0 | | | 224 | | | 0 | | Securities lending collateral | 196 | | | — | | | 196 | | | — | |
| | Derivatives | Derivatives | | Derivatives | |
| Futures | Futures | 2 | | | 2 | | | 0 | | | 0 | | Futures | 5 | | | 5 | | | — | | | — | |
| Swaps | Swaps | 5 | | | 0 | | | 5 | | | 0 | | Swaps | 17 | | | — | | | 17 | | | — | |
| Options | 1 | | | — | | | 1 | | | — | | |
| | Foreign currency forward receivable | Foreign currency forward receivable | 1 | | | 0 | | | 1 | | | 0 | | Foreign currency forward receivable | 2 | | | — | | | 2 | | | — | |
| | Total assets | Total assets | $ | 8,472 | | | $ | 2,670 | | | $ | 2,800 | | | $ | 42 | | Total assets | $ | 8,566 | | | $ | 1,916 | | | $ | 2,328 | | | $ | 62 | |
| | Liabilities | Liabilities | | | | | | | | Liabilities | | | | | | | |
| Derivatives | Derivatives | | Derivatives | |
| Futures | Futures | $ | 4 | | | $ | 4 | | | $ | 0 | | | $ | 0 | | Futures | $ | 10 | | | $ | 10 | | | $ | — | | | $ | — | |
| Foreign currency forward payable | Foreign currency forward payable | 1 | | | 0 | | | 1 | | | 0 | | Foreign currency forward payable | 1 | | | — | | | 1 | | | — | |
| | Swaps | Swaps | 12 | | | 0 | | | 12 | | | 0 | | Swaps | 54 | | | — | | | 54 | | | — | |
| Options | 1 | | | 0 | | | 1 | | | 0 | | |
| | | Securities sold under agreements to repurchase | Securities sold under agreements to repurchase | 118 | | | 0 | | | 118 | | | 0 | | Securities sold under agreements to repurchase | 111 | | | — | | | 111 | | | — | |
| | Total liabilities | Total liabilities | $ | 136 | | | $ | 4 | | | $ | 132 | | | $ | 0 | | Total liabilities | $ | 176 | | | $ | 10 | | | $ | 166 | | | $ | — | |
cNotesNotes
(1) Excludes approximately $132$100 million in net payables associated with security purchases and sales and various other payables.
(2) Excludes a $224$196 million payable for collateral on loaned securities in connection with TVARS's participation in securities lending programs.
(3) In accordance with Subtopic 820-10, certain investments that are measured at fair value using the net asset value per share (orNAV or its equivalent) practical expedientequivalent ("alternative investments") have not been classified in the fair value hierarchy. The inputs to these fair value measurements include underlying NAVs, discounted cash flow valuations, comparable market valuations, and adjustments for currency, credit, liquidity, and other risks.
The following table provides a reconciliation of beginning and ending balances of pension plan assets measured at fair value on a recurring basis where the determination of fair value includes significant unobservable inputs (Level 3):
| | | | | |
Fair Value Measurements Using Significant Unobservable Inputs (in millions) |
| | Fair Value Measurements Using Significant Unobservable Inputs (Level 3) |
Balance at October 1, 2018September 30, 2021 | $ | 5874 | |
| Net realized/unrealized gains (losses) | 4 (4) | |
| Purchases, sales, issuances, and settlements (net) | (12)2 | |
| Transfers in and/or out of Level 3 | (8)(10) | |
| |
Balance at September 30, 20192022 | 4262 | |
| Net realized/unrealized gains (losses) | 461 | |
| Purchases, sales, issuances, and settlements (net) | 112 | |
| Transfers in and/or out of Level 3 | (5) | |
| |
Balance at September 30, 20202023 | $ | 9460 | |
The following descriptions of the valuation methods and assumptions used by the pension plan to estimate the fair value of investments apply to investments held directly by the pension plan. Third-party pricing vendors provide valuations for investments held by the pension plan in most instances, except for commingled, private credit, private equity, and private real asset funds which are priced at net asset valuesNAVs established by the investment managers. In instances where pricing is determined to be based on unobservable inputs, a Level 3 classification has been assigned. Certain securities priced by the investment manager using a proprietary fair value model with unobservable inputs have been classified as Level 3.
Equity and Preferred Securities. Investments listed on either a national or foreign securities exchange or traded in the over-the-counter National Market System are generally valued each business day at the official closing price (typically the last reported sale price) on the exchange on which the security is primarily traded and are classified as Level 1. Equity securities, including common stocks and preferred securities, classified as Level 2 may have been priced by dealer quote or using assumptions based on observable market data, such as yields on bonds from the same issuer or industry. Certain securities priced by the investment manager using unobservable inputs have been classified as Level 3.
Corporate Debt Securities. Corporate bonds are valued based upon recent bid prices or the average of recent bid and asked prices when available (Level 2 inputs) and, if not available, they are valued through matrix pricing models. Matrix pricing, which is a mathematical technique commonly used to price debt securities that are not actively traded, values debt securities without relying exclusively on quoted prices for the specific securities but rather by relying on the securities' relationship to other benchmark quoted securities (Level 2 inputs). Certain securities priced by the investment manager using broker pricing or unobservable inputs have been classified as Level 3.
Mortgage and Asset-Backed Securities. Residential mortgage-backed securities consist of collateralized mortgage obligations ("CMOs") and U.S. pass-through security pools related to government-sponsored enterprises. CMO pricing is typically based on either a volatility-driven, multidimensional, single-cash-flow stream model or an option-adjusted spread model. These models incorporate available market data such as trade information, dealer quotes, market color, spreads, bids, and offers. Pricing for government-sponsored enterprise securities, including the Federal Home Loan Mortgage Corporation, the Federal National Mortgage Association, and the Government National Mortgage Association, is typically based on quotes from the To Be Announced ("TBA") market, which is highly liquid with multiple electronic platforms that facilitate the execution of trading between investors and broker/dealers. Prices from the TBA market are then compared against other live data feeds as well as input obtained directly from the dealer community. Most residential mortgage-backed securities are considered to be priced using Level 2 inputs because of the nature of their market-data-based pricing models. Certain securities priced by vendors using a single broker quote or unobservable inputs have been classified as Level 3.
Debt Securities Issued by U.S. Treasury. For U.S. Treasury securities, fair values reflect the closing price reported in the active market in which the security is traded (Level 1 inputs).
Debt Securities Issued by Foreign Governments. Foreign government bonds and foreign government inflation-linked securities are typically priced based on proprietary discounted cash flow models, incorporating option-adjusted spread features as appropriate. Debt securities issued by foreign governments are classified as Level 2 because of the nature of their market-data-based pricing models. Certain securities priced by the investment manager using broker quotes or unobservable input have been classified as Level 3.
Debt Securities Issued by State and Local Governments. Debt securities issued by state and local governments are
typically priced using market-data-based pricing models, and are therefore classified as Level 2. These pricing models incorporate market data such as quotes, trading levels, spread relationships, and yield curves, as applicable. Certain securities priced using an unobservable input have been classified as Level 3.
Commercial Mortgage-Backed and Asset-Backed Securities. Commercial mortgage-backed and asset-backed securities are typically priced based on a single-cash-flow stream model, which incorporates available market data such as trade information, dealer quotes, market color, spreads, bids, and offers. Because of the market-data-based nature of such pricing models, these securities are typically classified as Level 2. Certain securities priced by investment managers using broker pricing or unobservable inputs have been classified as Level 3.
Commingled Funds. The pension plan invests in commingled funds, which include collective trusts, unit investment trusts, and similar investment funds that predominantly hold debt and/or equity securities as underlying assets. The pension plan's ownership consists of a pro rata share and not a direct ownership of an underlying investment. These commingled funds are valued at their closing net asset valuesNAVs (or unit value) per share as reported by the managers of the commingled funds and as supported by the unit prices of actual purchases and sale transactions occurring as of or close to the financial statement date. These funds have not been classified in the fair value hierarchy in accordance with FASB guidance issued in May 2015.
The pension plan is invested in equity commingled funds, which can be categorized as either passively managed index funds or actively managed funds. The equity index funds seek to track the performance of a particular index by replicating its capitalization and characteristics. Passive fund benchmark indices include the Russell 1000 index and MSCI ACWI ex-U.S. index. The actively managed equity funds seek to outperform certain equity benchmarks through a combination of fundamental and technical analysis. Active funds select portfolio positions based upon their research.
The pension plan is invested in debt commingled funds, which can be categorized as either passively managed index funds or actively managed funds. The pension plan's debt index fund invests in a diversified portfolio of fixed-income securities and derivatives of varying maturities to replicate the characteristics of the Bloomberg Barclays Capital U.S. Treasury Inflation-Protected Securities ("TIPS") index.TIPS. The fund seeks to track the total return of the Bloomberg Barclays Capital U.S. TIPS index. The actively managed debt funds seek to outperform certain fixed-income benchmarks through fundamental research and analysis. The funds invest in a diversified portfolio of fixed income securities and derivatives of varying maturities. Varying by strategy, fund objectives include achieving a positive relative total return through active credit selection and providing risk management through desired strategic exposures.
The pension plan is invested in commodity commingled funds, which can be categorized as actively managed funds. The funds seek to outperform certain commodity benchmarks through fundamental research and analysis. The funds invest in a diversified portfolio of commodity securities and derivatives of varying maturities. The objective is to achieve a positive relative return through active security selection.
The pension plan is invested in commingled funds, which invest across multiple asset classes that can be categorized as blended. These funds seek to outperform a passive benchmark through active security selection. The funds invest in securities across equity, fixed income, currency, and commodities. The portfolios employ fundamental, quantitative, and technical analysis.
The pension plan's investments in equity, debt, blended, and commodity commingled funds can generally be redeemed upon notification of the investment managers, with required notice periods varying from same-day to monthly. These investments do not have unfunded commitments.
Institutional Mutual Funds. Investments in institutional mutual funds are valued at prices based on their net asset value.NAV. Institutional mutual funds have daily published market prices that represent their net asset valueNAV (or unit value) per share and are classified as Level 1.
Cash Equivalents and Other Short-Term Investments and Certificates of Deposit. Cash equivalents and other short-term investments are highly liquid securities with maturities of less than three months and 12 months, respectively. These consist primarily of discount securities such as commercial paper, repurchase agreements, U.S. Treasury bills, and certain agency securities. These securities, as well as certificates of deposit, may be priced at cost, which approximates fair value due to the short-term nature of the instruments. Model based pricing which incorporates observable inputs may also be utilized. These securities are classified as Level 2. Active market pricing may be utilized for U.S. Treasury bills, which are classified as Level 1.
Private Credit Funds. Private credit limited partnerships are reported at net asset valuesNAVs provided by the fund managers. These funds have not been classified in the fair value hierarchy in accordance with FASB guidance issued in May 2015.
The private credit limited partnerships invest across direct lending, opportunistic credit, and distressed debt strategies. The limited partnerships generally make investments of senior secured first-lien loans, second-lien secured loans, asset-based
loans, risk transfer loans, specialty finance loans, unitranche loans, and distressed debt opportunities to middle market private companies. The limited partnerships generally seek to obtain financial returns through high income potential and occasional equity upside. The limited partnerships generally have a term life of five to eight years and are diversified by sector and industry.
Private Equity Funds. Private equity limited partnerships are reported at net asset valuesNAVs provided by the fund managers. These funds have not been classified in the fair value hierarchy in accordance with FASB guidance issued in May 2015.
The private equity limited partnerships typically make longer-term investments in private companies and seek to obtain financial returns through long-term appreciation based on corporate stewardship, improved operating processes, and financial
restructuring which may involve a merger or acquisition. Significant investment strategies include venture capital, buyout, mezzanine or subordinated debt, restructuring or distressed debt, energy infrastructure, and special situations. Venture capital partnerships consist of two main groupings. Early-stage venture capital partnerships invest in businesses still in the conceptual stage where products may not be fully developed and where revenues and/or profits may be several years away. Later-stage venture capital partnerships invest in more mature companies in need of growth or expansion capital. Buyout partnerships provide the equity capital for acquisition transactions either from a private seller or the public, which may represent the purchase of the entire company or a refinancing or recapitalization transaction where equity is invested. Mezzanine or subordinated debt partnerships provide the intermediate capital between equity and senior debt in a buyout or refinancing transaction and typically own a security in the company that carries current interest payments as well as a potential equity interest in the company. Restructuring or distressed debt partnerships purchase opportunities generated by overleveraged or poorly managed companies. Special situation partnerships include organizations with a specific industry focus not covered by the other private equity subclasses or unique opportunities that fall outside the regular subclasses.
The private equity funds have no investment withdrawal provisions prior to the termination of the partnership. Partnerships generally continue 10 to 14 years after the inception of the fund. The partnerships are generally subject to 2two to 3three one-year extensions at the discretion of the General Partner. Partnerships can generally be dissolved by an 80 percent vote in interest by all limited partners, with some funds requiring the occurrence of a specific event.
Private Real Asset Investments. The pension plan's ownership in private real asset investments consists of a pro rata share and not a direct ownership of the underlying investments. The fair values of the pension plan's private real asset investments are estimated utilizing net asset valuesNAVs provided by the investment managers. These investments have not been classified in the fair value hierarchy in accordance with FASB guidance issued in May 2015. The investment strategies and methodologies utilized by the investment managers to calculate their net asset valuesNAVs are summarized as follows:
The pension plan is invested in limited partnerships that invest in real estate securities, real estate partnerships, and direct real estate properties. This includes investments in office, multifamily, industrial, and retail investment properties in the U.S. and international markets. The investment strategy focuses on distressed, opportunistic, and value-added opportunities. Partnership investments also include mortgage and/or real estate-related fixed-income instruments and related securities. Investments are diversified by property type and geographic location.
The pension plan is invested in a commingled fund that develops, renovates, and re-leases real estate properties to create value. Investments are predominantly in top tier real estate markets that offer deep liquidity. Property types include residential, office, industrial, hotel, retail, and land. Properties are diversified by geographic region within the U.S. domestic market. The plan is invested in a second commingled fund that invests primarily in core, well-leased, operating real estate properties with a focus on income generation. Investments are diversified by property type with a focus on office, industrial, apartment, and retail. Properties are diversified within the U.S. with an overweight to major market and coastal regions.
Fair value estimates of the underlying investments in these limited partnerships and commingled fund investments are primarily based upon property appraisal reports prepared by independent real estate appraisers within a reasonable amount of time following acquisition of the real estate and no less frequently than annually thereafter. The appraisals are based on one or a combination of three methodologies: cost of reproduction analysis, discounted cash flow analysis, and sales comparison analysis. Pricing for certain investments in mortgage-backed and asset-backed securities is typically based on models that incorporate observable inputs.
The pension plan is invested in energy infrastructure partnerships which acquire essential, long-lived real assets in three main groupings. Upstream assets include oil and gas exploration, drilling, and acquisition. Midstream assets include storage, pipelines, gathering, processing, and transportation of energy commodities. Downstream assets include generation, distribution, and transmission facilities. Additionally, the pension plan is invested in infrastructure partnerships that target mid-sized operating infrastructure companies and/or assets with limited development and construction risk primarily in the energy, transportation and logistics, environmental, telecommunications, and social industries. The partnerships use one or more valuation techniques (e.g., the market approach, the income approach, or the cost approach) for which sufficient and reliable data is available. The use of the market approach generally consists of using comparable market transactions, while the use of the income approach generally consists of the net present value of estimated future cash flows, adjusted as appropriate for liquidity, credit, market, and/or other risk factors.
The pension plan is invested in a private real asset investment trust formed to make direct or indirect investments in commercial timberland properties. Pricing for these types of investments is based on comprehensive appraisals that are conducted shortly after initial purchase of properties and at three-year intervals thereafter. All appraisals are conducted by third-party timberland appraisal firms. Appraisals are based on either a sales comparison analysis or a discounted cash flow analysis.
Securities Lending Collateral. Collateral held under securities lending arrangements areis invested in highly liquid short-term securities, primarily repurchase agreements. The securities are often priced at cost, which approximates fair value due to the short-term nature of the instruments. These securities are classified as Level 2.
Derivatives. The pension plan invests in a variety of derivative instruments. The valuation methodologies for these instruments are as follows:
Futures. The pension plan enters into futures. The futures contracts are listed on either a national or foreign securities exchange and are generally valued each business day at the official closing price (typically the last reported sales price) on the exchange on which the security is primarily traded. The pricing is performed by third-party vendors. Since futures are priced by an exchange in an active market, they are classified as Level 1.
Options. The pension plan enters into purchased and written options. Options that are listed on either a national or foreign securities exchange are generally valued each business day at the official closing price (typically the last reported sales price) on the exchange on which the security is primarily traded. These options are classified as Level 1. Options traded over the counter and not on exchanges are priced by third-party vendors and are classified as Level 2.
Swaps. The pension plan enters into various types of swaps. Credit default swaps are priced at market using models that consider cash flows, credit curves, recovery rates, and other factors. The pricing is performed by third-party vendors, and in some cases by clearing exchanges. Interest rate swap contracts are priced at market using forward rates derived from the swap curve, and the pricing is also performed by third-party vendors, and in some cases by clearing exchanges. Other swaps such as equity index swaps and variance swaps are priced by third-party vendors using market inputs such as spot rates, yield curves, and volatility. The pension plan's swaps are generally classified as Level 2 based on the observable nature of their pricing inputs.
Foreign currency forwards. The pension plan enters into foreign currency forwards. All commitments are marked to market daily at the applicable translation rates, and any resulting unrealized gains or losses are recorded. Foreign currency forwards are priced by third-party vendors and are classified as Level 2.
Securities Sold Under Agreements to Repurchase. The pension plan enters into contracts to sell securities to a counterparty at a specified price with an agreement to purchase the same or substantially the same security from the same counterparty at a fixed or determinable price at a future date. Securities sold under agreements to repurchase are presented at their contract price which approximates fair value due to their short-term nature. These securities are classified as Level 2. In connection with sales of securities under agreements to repurchase, the counterparties require the pension plan to maintain collateral securities with a fair value that approximates or exceeds the contract amount of the repurchase agreement. These securities are held in government inflation-linked bonds and classified as government debt securities.
The valuation methods described above may produce a fair value calculation that may not be indicative of net realizable value or reflective of future fair values. Furthermore, while the pension plan believes its valuation methods are appropriate and consistent with other market participants, the use of different methodologies or assumptions to determine the fair value of certain financial instruments could result in a different fair value measurement at the reporting date.
Reclassification. In the September 30, 2019 fair value measurements table, $113 million and $546 million of private equity and private real estate have been reclassified to private real assets to conform with current year presentation.
Cash Flows
Estimated Future Benefit Payments. The following table sets forth the estimated future benefit payments under the benefit plans.
| | | | | | | | | | | |
Estimated Future Benefits Payments At September 30, 2020 |
| | Pension Benefits(1) | | Other Post-Retirement Benefits |
| 2021 | $ | 777 | | | $ | 28 | |
| 2022 | 776 | | | 26 | |
| 2023 | 773 | | | 24 | |
| 2024 | 768 | | | 23 | |
| 2025 | 767 | | | 22 | |
| 2026 - 2030 | 3,741 | | | 117 | |
| | | | | | | | | | | |
Estimated Future Benefits Payments At September 30, 2023 (in millions) |
| | Pension Benefits(1) | | Other Post-Retirement Benefits |
| 2024 | $ | 809 | | | $ | 22 | |
| 2025 | 814 | | | 21 | |
| 2026 | 812 | | | 21 | |
| 2027 | 812 | | | 21 | |
| 2028 | 809 | | | 21 | |
| 2029 - 2033 | 3,918 | | | 119 | |
Note
(1) Participants are assumed to receive the Fixed Fund in a lump sum in lieu of available annuity options allowed for certain grandfathered participants resulting in higher estimated pension benefits payments.
Contributions. TVA made contributions to the pension plan of $300 million for 20202023 and 2019.2022. TVA has committed to make a minimum contribution of $300 million per year through 2036 or until the plan has reached and remained at 100 percent funded status under the actuarial rules applicable to TVARS. TVA made SERP contributions of $5$6 million and $7$8 million for 20202023 and 2019,2022, respectively. TVA made cash contributions to the other post-retirement benefit plans of $25 million (net of $5$4 million in rebates) and $36 $28 million (net of $4 million in rebates) for 20202023 and 2019,2022, respectively. TVA expects to contribute $300 million to TVARS, $5$6 millionto the SERP, and $28$22 million to the other post-retirement benefit plans in 2021.2024.
Other Post-Employment Benefits
Post-employment benefit cost estimates are revised to properly reflect changes in actuarial assumptions made at the end of each year. TVA utilizes a discount rate determined by reference to the U.S. Treasury Constant Maturities corresponding to the calculated average durations of TVA's future estimated post-employment claims payments. The use of a 0.694.59 percent discount rate resulted in the recognition of $45$(3) million in expenses in 20202023 and an unpaid benefit obligation of $390$266 million at September 30, 2020.2023. The use of a 1.683.83 percent discount rate resulted in the recognition of approximately $59$(40) million in expenses in 20192022 and an unpaid benefit obligation of $419$299 million at September 30, 2019.2022. The use of a 3.051.52 percent discount rate resulted in the recognition of approximately $(6)$(20) million in expenses in 20182021 and an unpaid benefit obligation of $339$340 million at September 30, 2018.2021. The U.S. Department of Labor ("DOL") administers TVA's worker compensation program and invoices TVA annually for claims processed.
The decrease in the unpaid obligation at September 30, 20202023, compared to the prior year iswas due primarily to the timing ofincrease in the payment of workers compensationdiscount rate from 3.83 percent in 2022 to 4.59 percent in 2023 and a decrease in claims. These decreases were partially offset by inflationary impacts on wage and medical costs and an increase in medical utilization previously delayed by the pandemic. The DOL billed TVA $29 million for 2023 claims todue in October 2023. TVA estimated claims for 2024 are $28 million.
The decrease in the U.S, Department of Labor ("DOL") inunpaid obligation at September 202030, 2022, compared to the prior year claims paid in October 2019. TVA paid $74 million in claims during 2020 comparedwas due primarily to $39 million in 2019. TVA estimated losses for 2021 are $32 million and due in October 2021.
Overall, the decreaseincrease in the discount rate from 1.681.52 percent in 20192021 to 0.693.83 percent in 2020 increased the long-term portion of the unpaid benefit obligation. This increase was offset by a decrease2022, decreases in loss experience, and fewer claims partially attributable to delayed medical treatments as a result of the COVID-19 pandemic. TVA paid $29 million for 2022 claims to the DOL in October 2022.
The ultimate impact of inflation and interest rates on the COVID-19 pandemic on post-employment benefit costs and claims experienceobligation depends on factors beyond TVA's knowledge or control, including the duration and severity of this outbreak, actions taken to contain its spread and mitigate itslingering effects and broader impacts of the COVID-19 pandemic, on the countrysupply chain disruptions, and region's economy.
The increase in the unpaid benefit obligation when comparing 2019 to 2018 was due primarily to the decrease of the discount rate from 3.05 percent in 2018 to 1.68 percent in 2019.geographical tensions.
The current portion which represents unpaid losses and administrative fees due are in Accounts payable and accrued liabilities. The long-term portion is recognized in Post-retirement and post-employment benefit obligations.
| Amounts Recognized on TVA's Consolidated Balance Sheets At September 30 | |
Amounts Recognized on TVA's Consolidated Balance Sheets At September 30 (in millions) | | Amounts Recognized on TVA's Consolidated Balance Sheets At September 30 (in millions) |
| | | 2020 | | 2019 | | 2023 | | 2022 |
| Accounts payable and accrued liabilities | Accounts payable and accrued liabilities | $ | 0 | | | $ | 36 | | Accounts payable and accrued liabilities | $ | 29 | | | $ | 29 | |
| Post-retirement and post-employment benefit obligations | Post-retirement and post-employment benefit obligations | 390 | | | 383 | | Post-retirement and post-employment benefit obligations | 237 | | | 270 | |
21. Collaborative Arrangement
144
In December 2022, TVA, Ontario Power Generation, BWRX TCA sp. z.o.o., and GE Hitachi Nuclear Energy ("GEH") entered into a multi-party collaborative arrangement to advance the global deployment of the GEH BWRX-300 small modular reactor ("SMR"). GEH is responsible for standard design development. Under the agreement, TVA will contribute up to $88 million for design costs incurred by GEH through 2026. At the time feasibility is determined, TVA will have the right to use the design and may receive additional economic benefits.
Payments pursuant to the agreement are recorded as research and development expense, which is reflected as Operating and maintenance expense on TVA's Consolidated Statements of Operations in the period incurred. TVA recorded $31 million of expenses related to this agreement for the year ended September 30, 2023. TVA also had a $6 million letter of credit posted under this arrangement at September 30, 2023.
22. Commitments and Contingencies
Commitments
Power Purchase Obligations. TVA has contracted with various independent power producers and LPCs for additional capacity to be made available to TVA. Several of these agreements have contractual minimum payments and are accounted for as either finance or operating leases. In total, these agreements provide 2,384 MW4,487 megawatts ("MW") of summer net capability. The remaining terms of the agreements range up to 12 years. Additionally, TVA has contracted with regional transmission organizations to reserve 1,4502,792 MW of transmission service to support purchases from the market and wind power purchase agreements.PPAs. The remaining terms of these agreements range up to four years. Excluding lease-related costs, TVA incurred $202$301 million, $195$318 million, and $188$202 million of expense under these power purchase and transmission service agreements during 2020, 2019,2023, 2022, and 2018,2021, respectively.
TVA has one power purchase agreement that meets the definition of an unconditional purchase obligation. At September 30, 2023, the non-lease portion of the commitment for each of the next five years and thereafter is shown below:
| | | | | | | | | | | | | | | | | | | | | | | | | | | | | | | | | | | | | | |
| | | 2024 | | 2025 | | 2026 | | 2027 | | 2028 | | Thereafter |
| Unconditional purchase obligation | | $ | 155 | | | $ | 155 | | | $ | 155 | | | $ | 155 | | | $ | 154 | | | $ | 541 | |
| | | | | | | | | | | | |
Under federal law, TVA is obligated to purchase power from qualifying facilities (cogenerators and small power producers). As of September 30, 2020,2023, there was a combined qualifying facility capacity of 268285 MW from 111955 different generation sources, from which TVA purchased power under this law.
Membership Interests of VIE Subject to Mandatory Redemption. At September 30, 2020, TVA had outstanding membership interests subject to mandatory redemption (including current portion) of $26 million issued by one of its VIEs of which it is the primary beneficiary. See Note 10 — Variable Interest Entities for additional information. At September 30, 2020, the mandatory redemptions for each of the next five years are shown below:
| | | | | | | | | | | | | | | | | | | | | | | | | | | | | | | | |
| | | | | | | | | | |
| | | 2021 | | 2022 | | 2023 | | 2024 | | 2025 |
| Membership interests of variable interest entity subject to mandatory redemption | | $ | 3 | | | $ | 3 | | | $ | 2 | | | $ | 1 | | | $ | 1 | |
Leasebacks. At September 30, 2020 and 2019, the outstanding leaseback obligations related to CTs and QTE were $223 million and $263 million, respectively. See Note 13 — Debt and Other Obligations — Lease/Leasebacks. At September 30, 2020, the future minimum payments under leaseback obligations are shown below.
| | | | | | | | |
Lease/Leasebacks Minimum payments due in years ending September 30 |
| 2021 | | $ | 207 | |
| 2022 | | 25 | |
| 2023 | | 0 | |
| 2024 | | 0 | |
| 2025 | | 0 | |
| Thereafter | | 0 | |
| Total | | $ | 232 | |
Leases. TVA also has obligations to make lease payments related to finance and operating leases. See Note 7 — Leases for additional information.
Unfunded Loan Commitments. At September 30, 2020,2023, TVA's commitments under unfunded loan commitments were $1 million for 2021.2024. TVA has no commitments under unfunded loan commitments for 20222025 through 2025.2028.
In addition to the commitments above, TVA had contractual obligations in the form of revenue discounts related to energy prepayments. TVA recognized $10 million of prepayment obligations and related interest payments of $4 million in revenue during 2019. The arrangement ceased in 2019.Other Commitments. See Note 1 8 — LeasesSummary of Significant Accounting Policies — Energy Prepayment Obligations and Note 17, Note 11 — Variable Interest Entities, Note 14 — Debt and Other Obligations, and Note 20 — Benefit Plans Revenuefor the.obligations and commitments attributable to leases, VIEs and membership interests of VIEs subject to mandatory redemption, leaseback obligations, and the retirement plan, respectively.
Contingencies
Nuclear Insurance. Section 170 of the Atomic Energy Act, commonly known as the Price-Anderson Act, provides a layered framework of financial protection to compensate for liability claims of members of the public for personal injury and property damages arising from a nuclear incident in the U.S. This financial protection consists of 2two layers of coverage:
•coverage. The primary level is private insurance underwritten by American Nuclear Insurers ("ANI") and provides public liability insurance coverage of $450 million for each nuclear power plant licensed to operate. If this amount is not sufficient to cover claims arising from a nuclear incident, the second level, Secondary Financial Protection, applies.
•Within the Secondary Financial Protection level, the licensee of each nuclear reactor has a contingent obligation to pay a retrospective premium, equal to its proportionate share of the loss in excess of the primary level, regardless
of proximity to the incident of fault, up to a maximum of approximately $138 million per reactor per incident. With TVA's 7seven reactors, the maximum total contingent obligation per incident is $963 million. This retrospective premium is payable at a maximum rate currently set at approximately $20 million per year per nuclear incident per reactor. Currently, 97 reactors are participating in the Secondary Financial Protection program.
In the event that a nuclear incident results in public liability claims, the primary level provided by ANIAmerican Nuclear Insurers combined with the Secondary Financial Protection should provide up to approximately $13.8 billion in coverage.
Federal law requires that each NRC power reactor licensee obtain property insurance from private sources to cover the cost of stabilizing and decontaminating a reactor and its station site after an accident. TVA carries property, decommissioning liability, and decontamination liability insurance from Nuclear Electric Insurance Limited ("NEIL"). and European Mutual Association for Nuclear Insurance. The limits available for each site vary depending on the site and range froma loss are up to $2.1 billion for two of TVA's nuclear sites and up to $2.8 billion available for a loss at TVA's three sites.the remaining site. Some of this insurance may require the payment of retrospective premiums up to a maximum of approximately $145$114 million.
TVA purchases accidental outage (business interruption) insurance for TVA's nuclear sites from NEIL. In the event that an accident covered by this policy takes a nuclear unit offline or keeps a nuclear unit offline, NEIL will pay TVA, after a waiting period, an indemnity (a set dollar amount per week) with a maximum indemnity of $490 million per unit. This insurance policy may require the payment of retrospective premiums up to a maximum of approximately $43$44 million, but only to the extent the retrospective premium is deemed necessary by the NEIL Board of Directors to pay losses unable to be covered by NEIL's surplus.
Decommissioning Costs. TVA recognizes legal obligations associated with the future retirement of certain tangible long-lived assets related primarily to nuclear generating plants, coal-fired generating plants, hydroelectric generating plants/dams, transmission structures, and other property-related assets. See Note 1213 — Asset Retirement Obligations.
Nuclear Decommissioning. Provision for decommissioning costs of nuclear generating units is based on options prescribed by the NRC procedures to dismantle and decontaminate the facilities to meet the NRC criteria for license termination. At September 30, 2020, $3.32023, $3.8 billion, representing the discounted value of future estimated nuclear decommissioning costs, was included in nuclear AROs. The actual decommissioning costs may vary from the derived estimates because of, among other things, changes in current assumptions, such as the assumed dates of decommissioning, changes in regulatory requirements, changes in technology, and changes in the cost of labor, materials, and equipment. Utilities that own and operate nuclear plants are required to use different procedures in calculating nuclear decommissioning costs under GAAP than those that are used in calculating nuclear decommissioning costs when reporting to the NRC. The 2two sets of procedures produce different estimates for the costs of decommissioning primarily because of differences in the underlying assumptions. Decommissioning costsTVA bases its nuclear decommissioning estimates on site-specific cost studies. The most recent study was approved and implemented in September 2022. Site-specific cost studies are updated for each of TVA's nuclear units at least every five years.
TVA maintains aan NDT to provide funding for the ultimate decommissioning of its nuclear power plants. See Note 16 — Fair Value Measurements — Investment Funds. TVA monitors the value of its NDT and believes that, over the long term and before cessation of nuclear plant operations and commencement of decommissioning activities, adequate funds from investments and additional contributions, if necessary, will be available to support decommissioning. TVA's operating nuclear power units are licensed through various dates between 2033 - 2055, depending on the unit. It may be possible to extend the operating life of some of the units with approval from the NRC. See Note 910 — Regulatory Assets and Liabilities — Nuclear Decommissioning Costs and Note 1213 — Asset Retirement Obligations.
Non-Nuclear Decommissioning. At September 30, 20202023, $3.53.7 billion, representing the discounted value of future estimated non-nuclear decommissioning costs, was included in non-nuclear AROs. This decommissioning cost estimate involves estimating the amount and timing of future expenditures and making judgments concerning whether or not such costs are considered a legal obligation. Estimating the amount and timing of future expenditures includes, among other things, making projections of the timing and duration of the asset retirement process and how costs will escalate with inflation. The actual decommissioning costs may vary from the derived estimates because of changes in current assumptions, such as the assumed dates of decommissioning, changes in regulatory requirements, changes in technology, and changes in the cost of labor, materials, and equipment. TVA updates its underlying assumptions for non-nuclear decommissioning AROs at least every five years. However, material changes in underlying assumptions that impact the amount and timing of undiscounted cash flows are continuously monitored and incorporated into ARO balances in the period identified.
TVA maintains an ART to help fund the ultimate decommissioning of its non-nuclear power assets. See Note 16 — Fair Value Measurements — Investment Funds. Estimates involved in determining if additional funding will be made to the ART include inflation rate, rate of return projections on the fund investments, and the planned use of other sources to fund decommissioning costs. See Note 910 — Regulatory Assets and Liabilities — Non-Nuclear Decommissioning Costs and Note 1213 — Asset Retirement Obligations.
Environmental Matters. TVA's power generation activities, like those across the utility industry and in other industrial sectors, are subject to federal, state, and local environmental laws and regulations. Major areas of regulation affecting TVA's activities include air quality control, GHGgreenhouse gas ("GHG") emissions, water quality control, and management and disposal of solid and hazardous wastes. In the future, regulationsRegulations in all of these major areas are expectedcontinue to become more stringent. Regulations are also expectedstringent and have, and will continue to have, a particular emphasis on climate change, renewable generation, and energy efficiency.
TVA has incurred, and expects to continue to incur, substantial capital and operating and maintenance costs to comply with evolving environmental requirements primarily associated with, but not limited to, the operation of TVA's coal-fired and natural gas-fired generating units in general.general and emissions of pollutants from those units. Environmental requirements placed on the operation of TVA's coal-fired and other generating units using fossil fuels such as oil and natural gas will likely continue to become more restrictive over time. Litigation over the regulation of emissions or discharges from coal-fired generating units is also occurring. Failure to comply with environmental and safety lawsrequirements can result in TVA being subject to enforcement actions and litigation, which can lead to the imposition of significant civil liability, including fines and penalties, criminal sanctions, and/or the shutting downtemporary or permanent closure of non-compliant facilities. Historical non-compliance can also lead to difficulty in renewing existing permits, as well as difficulty in obtaining permits to bring new generation facilities online. Other obstacles to renewal or permitting of new facilities include a proliferation of non-government organizations seeking to use litigation tools to delay or stop altogether permitting of new fossil fuel facilities in favor of renewable energy projects.
From 1970 to 2020,2023, TVA spent approximately $6.8 billion to reduce emissions from its power plants, including $19$25 million, $16 million, and $17 million in 2023, 2022, and $62 million in 2020, 2019, and 2018,2021, respectively, on clean air controls. TVA estimates that compliance with existing and future Clean Air Act ("CAA") requirements (excluding greenhouse gas ("GHG") requirements)GHG requirements and new or proposed regulations) could lead to costs of $156$252 million from 20212024 to 2025,2028, which include existing controls capital projects and air operations and maintenance projects. TVA also estimates additional expenditures of approximately $949 million$1.6 billion from 20212024 to 20252028 relating to TVA's CCR Conversion Program, as well as expenditures of approximately $190 million from 20212024 to 20252028 relating to compliance with Clean Water Act ("CWA") requirements. Future costs could differ from these estimates if new environmental laws or regulations become applicable to TVA or the facilities it operates, or if existing environmental laws or regulations are revised or reinterpreted. There could also be costs that cannot reasonably be predicted at this time, due to uncertainty of actions, that could increase these estimates.estimates, and these estimates do not include expenditures expected to be incurred after 2028.
Compliance with the EPA's CCR Rule required implementation of a groundwater monitoring program, additional engineering, and ongoing analysis. As further analyses are performed, including evaluation of monitoring results, there is the potential for additional costs for investigation and/or remediation. These costs cannot reasonably be predicted until a final remedy is selected where required.
Liability for releases, natural resource damages, and required cleanup of hazardous substances is primarily regulated by the federal Comprehensive Environmental Response, Compensation, and Liability Act ("CERCLA"), the Resource Conservation and Recovery Act ("RCRA"), and other federal and parallel state statutes. In a manner similar to many other governmental entities, industries, and power systems, TVA has generated or used hazardous substances over the years. TVA operations at some facilities have resulted in releases of contaminants that TVA has addressed or is addressing consistent with state and federal requirements. At September 30, 20202023 and 2019,2022, TVA's estimated liability for required cleanup and similar environmental work for those sites for which sufficient information is available to develop a cost estimate was approximately $14$16 million and $15 $17
million, respectively, on a non-discounted basis, and was included in Accounts payable and accrued liabilities and Other long-term liabilities on the Consolidated Balance Sheets. Additionally, the potential inclusion of new hazardous substances under CERCLA and RCRA jurisdiction could significantly affect TVA's future liability for remediating historical releases.
Potential Liability Associated with Workers' Exposure to CCR Materials. In response to the 2008 ash spill at Kingston, TVA hired Jacobs Engineering Group, Inc. ("Jacobs") to oversee certain aspects of the cleanup. After the cleanup was completed, Jacobs was sued in the U.S. District Court for the Eastern District of Tennessee ("Eastern District") by employees of a contractor involved in the cleanup and family members of some of the employees. The plaintiffs alleged that Jacobs had failed to take or provide proper health precautions and misled workers about the health risks associated with exposure to coal fly ash, which is a CCR material. The plaintiffs also alleged that exposure to the fly ash caused a variety of significant health issues and illnesses, including in some cases death. The case was split into two phases, with the first phase considering, among other issues, general causation and the second determining specific causation and damages. On November 7, 2018, a jury hearing the first phase returned a verdict in favor of the plaintiffs, including determinations that Jacobs failed to adhere to its contract with TVA or the Site Wide Safety and Health Plan; Jacobs failed to provide reasonable care to the plaintiffs; and Jacobs's failures were capable of causing a list of medical conditions, ranging from hypertension to cancer. On January 11, 2019, the Eastern District referred the parties to mediation. Mediation has concluded, but the parties did not resolve the matter. The litigation will now proceed to the second phase on the question of whether Jacobs's breaches were the specific medical cause of the plaintiffs' alleged injuries and damages.
On May 13, 2019, an additional group ofOther contractor employees and family members also filed suitlawsuits against Jacobs in the Circuit Court for Roane County, Tennessee. These plaintiffs have raised similar claims to those being litigated inEastern District. In the case referenced above.
third quarter of 2023, Jacobs announced that it reached a global settlement that resolved all of these lawsuits. While TVA iswas not a party to eitherany of these lawsuits, TVA may potentially have an indemnity obligation to reimburse Jacobs forin some amounts that Jacobs is required to pay. TVA will continue monitoring the litigation to determine whether these or similar cases could have broader implications for the utility industry.circumstances. TVA does not expect any potential liability to have a material adverse impact on its results of operations or financial condition.
Legal Proceedings
From time to time, TVA is party to or otherwise involved in lawsuits, claims, proceedings, investigations, and other legal matters ("Legal Proceedings") that have arisen in the ordinary course of conducting TVA's activities, as a result of a catastrophic event or otherwise.
General. At September 30, 2020,2023, TVA had accrued $14$28 million of probable losses with respect to Legal Proceedings. Of the accrued amount, $12$10 million is included in Other long-term liabilities and $2$18 million is included in Accounts payable and accrued liabilities. No assurance can be given that TVA will not be subject to significant additional claims and liabilities. If actual liabilities significantly exceed the estimates made, TVA's results of operations, liquidity, and financial condition could be materially adversely affected.
Environmental Agreements. InOn April 14, 2011, TVA entered into 2two substantively similar agreements, 1one with the EPA and the other with Alabama, Kentucky, North Carolina, Tennessee, and three environmental advocacy groups: the Sierra Club, the National Parks Conservation Association, and Our Children's Earth Foundationgroups (collectively, the "Environmental Agreements"). UnderTo resolve alleged New Source Review claims, TVA committed under the Environmental Agreements TVA committed to, among other things, take now-completed actions regarding coal units that have been completed. TVA also agreed toand invest $290 million in certain TVA environmental projects of whichprojects. Of this amount, TVA had spent approximately $280$283 million as of September 30, 2020.2023. Additionally, TVA holds restricted cash in an interest earning trust to fund the remaining project commitments. Under the Environmental Agreements, anyAny interest earned through the trust must also be re-invested tospent on agreed upon environmental projects. The total remaining committed spend,costs, including interest earned onthrough the trust, iswere approximately $11$8 million as of September 30, 2020. In exchange for these commitments, most past claims against TVA based on alleged New Source Review ("NSR") and associated violations were waived and cannot be brought against TVA. Future claims, including those for sulfuric acid mist and GHG emissions, can still be brought against TVA.2023.
The liabilities related to the Environmental Agreements are included in Accounts payable and accrued liabilities and Other long-term liabilities on the September 30, 2020,2023, Consolidated Balance Sheets. In conjunction with the approval of the Environmental Agreements, the TVA Board determined that it was appropriate to record TVA's obligations under the Environmental Agreements as regulatory assets, and they are included as such on the September 30, 2020,2023, Consolidated Balance Sheets and will be recovered in rates in future periods.
Case Involving Kingston Fossil PlantJohnsonville Aeroderivative Combustion Turbine Project.. In May 2019, Roane County and On December 22, 2022, the Cities of Kingston and Harriman ("local governments")Southern Environmental Law Center filed a lawsuit in the Circuit Court for Roane County, Tennessee, against TVA and Jacobs for monetary damages and unspecified injunctive relief relating to TVA's cleanup response to the 2008 ash spill at Kingston. The local governments allege that TVA and Jacobs failed to take proper measures to mitigate environmental and health risks during the cleanup response and misled the local governments and their citizens about health and environmental risks associated with exposure to coal fly ash. The local governments seek to recover monetary damages on behalf of their citizens for personal injury and property loss claims, damages for lost tax revenue, damages for increased emergency and medical response costs, punitive damages, and unspecified injunctive relief. In June 2019, TVA removed the lawsuit to the Eastern District, and TVA and Jacobs filed separate motions to dismiss. Plaintiffs, in response, filed a response opposing both motions and a separate motion seeking leave to file a proposed amended class action complaint in which Roane County would serve as class representative for the municipalities and their citizens.
In December 2019, the Eastern District court ruled that the local governments did not have standing to assert representative claims on behalf of their citizens and rejected their motion to proceed as a class action on behalf of their citizens because of the dissimilarity of the injuries allegedly suffered by the local governments (lost tax revenue) and the personal injuries and personal medical expenses allegedly suffered by the individuals. The court indicated, however, that the local governments may have legal standing to assert claims for their direct injuries (claims relating to municipally owned property) and directed the local governments to file an amended pleading in conformance with the court's order by January 16, 2020. The plaintiffs filed their amended complaint on January 15, 2020. On February 26, 2020, TVA and Jacobs moved to dismiss the amended complaint, and on September 30, 2020, the court dismissed the lawsuit without prejudice.
Class Action Lawsuit Involving Kingston Fossil Plant. On November 7, 2019, a resident of Roane County, Tennessee, filed a proposed class action lawsuit against Jacobs and TVA in the Eastern District. The complaint alleges that the class representative and all other members of the proposed class were damaged as a result of the 2008 ash spill at Kingston and the resulting cleanup activities. The complaint alleges, among other things, that (1) TVA was negligent in its construction and operation of the Kingston CCR facility, (2) TVA and Jacobs failed to take proper measures to mitigate environmental and health risks during the cleanup response, and (3) TVA and Jacobs misled the community about health and environmental risks associated with exposure to coal fly ash. The complaint seeks monetary damages and injunctive relief in the form of an order requiring the defendants to establish a blood testing program and medical monitoring protocol and to remediate damage to the properties of the proposed class. On April 22, 2020, TVA and Jacobs moved to dismiss the complaint, and the court has not yet ruled on this motion.
Case Involving Bull Run Fossil Plant. On February 5, 2020, two plaintiffs who reside near Bull Run filed suit against TVA in the Circuit Court for Anderson County, Tennessee, on behalf of themselves and their two minor children. The plaintiffs allege that they and their children were injured from direct exposures to CCR material originating from Bull Run and from second-hand exposures to coal ash through contact with a family member who worked at an undisclosed TVA facility. TVA removed the case to the Eastern District on March 5, 2020, and the plaintiffs filed an amended complaint in federal court on March 12, 2020. On June 19, 2020, TVA moved to dismiss the amended complaint, and on August 5, 2020, the court dismissed the amended complaint without prejudice on procedural grounds.
Case Involving Tennessee River Boat Accident. In July 2015, plaintiffs filed suit in the U.S. District Court for the NorthernMiddle District of AlabamaTennessee on behalf of the Sierra Club, alleging that TVA violated the National Environmental Policy Act ("Northern District"NEPA"), seeking recovery for personal injuries sustained when the plaintiffs' boat struck a TVA transmission line which was being raised from the Tennessee River during a repair operation. The Northern District dismissed the case, finding that TVA's exercise of its discretion as a governmental entity in deciding how to carry out the operation barred any liability for negligence. In August 2017, the U.S. Court of Appeals for the Eleventh Circuit ("Eleventh Circuit") affirmed the decision. The plaintiffs petitioned the Supreme Court for review of the decision, arguing that the provision of the TVA Act which allows suit to be brought against TVA does not allow TVA to claim immunity for discretionary actions. In April
2019, the Supreme Court issuedbuild a new aeroderivative combustion turbine project at its opinion reversing the judgment of the Eleventh Circuit and remanding the case to the Eleventh Circuit. In July 2019, the Eleventh Circuit remanded the case to the district court for further proceedings consistent with the Supreme Court's opinion. Trial is currently scheduled for February 16, 2021.Johnsonville facility.
Case Involving Bellefonte Nuclear Plant. In November 2018, Nuclear Development, LLC, filed suit against TVA in the Northern District. The plaintiff allegesSierra Club claims that TVA breached its agreementviolated NEPA by failing to sell Bellefonteadequately analyze the climate consequences of the project, adequately address GHG mitigation in light of EOs to decarbonize the power sector, consider a reasonable range of alternatives to the plaintiff. project, and prepare an environmental impact statement ("EIS").
The plaintiff seeks, among other things, (1) an injunction requiring TVASierra Club requests the federal court to maintain Bellefonteenter a declaratory judgment that TVA's environmental assessment ("EA") violates NEPA and that TVA's decision to issue a finding of no significant impact ("FONSI") was arbitrary, vacate the associated NRC permits until the case is concluded, (2) an order compelling TVA to complete the sale of Bellefonte to the plaintiff,EA and (3) if the court does notFONSI, order TVA to completeprepare an EIS, and prohibit further construction and operation of the sale, monetary damages in excess of $30 million. In December 2018, Nuclear Development, LLC, andcombustion turbines until TVA filed a joint stipulationhas complied with the court. Under the stipulation, Nuclear Development, LLC, withdrew its request for an expedited hearing on its injunction in exchange for TVA's agreement to continue to maintain Bellefonte in accordance with the NRC permits and to give Nuclear Development, LLC, and the court five days prior notice of any filing byNEPA. On March 20, 2023, TVA to terminate the permits or sell the site. TVA filed a motionmoved to dismiss the case, in February 2019.and that motion remains pending before the court. In May 2019,addition, on October 23, 2023, TVA and the court denied TVA's motion. Discovery is ongoing. On September 23, 2020, the partiesplaintiffs filed competing motionscross-motions for summary judgment, but a decision onjudgment. TVA cannot predict the motions is not expected for several months. The case is scheduled to be trial ready by December 1, 2020.outcome of this litigation.
Case Involving Rate ChangesCumberland Combined Cycle Plant.. On June 9, 2020, a proposed class action lawsuit was filed in federal court in Abingdon, Virginia, by a LPC customer, asserting claims14, 2023, Appalachian Voices, the Center for breach of contractBiological Diversity, and violation of the Administrative Procedure Act. The lawsuit alleges that the customers of TVA's LPCs are third-party beneficiaries under TVA's wholesale power contracts with its LPCs and that TVA's rate changes dating back to 2010 violate Section 11 of the TVA Act. Section 11 of the TVA Act establishes the broad policy that TVA power projects shall be considered primarily for the benefit of the people of the Tennessee Valley and that service to industry is a secondary purpose to be used principally to secure a sufficiently high load factor and revenue returns to permit domestic and rural use at the lowest possible rates. The remedies requested include an injunction prohibiting TVA rate changes that violate Section 11, monetary damages, and repayment of rates charged in violation of Section 11. TVA filed a motion to dismiss the case on November 9, 2020.
Case Involving Long-Term Agreements. On August 17, 2020, the Southern Environmental Law Center ("SELC")Sierra Club filed a lawsuit in the United States District Court for the WesternMiddle District of Tennessee on behalf of three environmental groups alleging that, beginning in August 2019, TVA violated the National Environmental Policy Act ("NEPA") and Section 10 of the TVA Act by offering a Long-Term Agreement ("LTA") to its LPCs. The environmental groups represented by SELC are Protect Our Aquifer, Energy Alabama, and Appalachian Voices.
The environmental groups claim that TVA violated NEPA because (1) TVA failedin deciding to perform an environmental review ofbuild a 1,450 MW combined cycle plant at its Cumberland facility. The plaintiffs request the LTAs, which harmed the groups' advocacy efforts and their abilitycourt, among other things, to participate in and to inform TVA's decision, and (2) the LTAs will haveenter a negative effect on the environment by increasing TVA's reliance on coal and gas and impeding TVA's customers' efforts to institute renewable energy options. The groups also claimdeclaratory judgment that the LTAs violate Section 10 of the TVA Act, which authorizes TVA to enter into power contracts "for a term not exceeding twenty years," because, the groups allege, the twenty-year rolling contract with a twenty-year notice of termination requirement makes the LTAs effectively "never ending."
The environmental groups request the federal court to (1) declare that TVA's entry into long-term power agreements without preparing an environmental reviewCumberland EIS violated NEPA and TVA's decision to issue the TVA Act, (2)Cumberland Record of Decision was arbitrary, capricious, and/or not in accordance with law; enter a declaratory judgment that TVA’s failure to supplement the Cumberland EIS violated NEPA and was arbitrary, capricious, and/or not in accordance with law; vacate the long-term contracts,Cumberland EIS and (3)the Cumberland Record of Decision; order TVA to prepare a revised draft EIS or
supplemental EIS subject to public comment that corrects the NEPA violations identified by the plaintiffs; and enjoin further construction and operation of the Cumberland combined cycle plant until TVA from implementing "system-wide energy contract programs that significantly affect the environment."has complied with NEPA. TVA filed a motion to dismissan amended answer on September 14, 2023. TVA cannot predict the case on October 20, 2020.outcome of this litigation.
23. Related Parties
TVA is a wholly-owned corporate agency of the federal government, and because of this relationship, TVA's revenues and expenses are included as part of the federal budget as a revolving fund. TVA's purpose and responsibilities as an agency are described under the "Other Agencies" section of the federal budget.
TVA's power program and stewardship (nonpower) programs were originally funded primarily by appropriations from Congress. In 1959, Congress passed an amendment to the TVA currently receives noAct that required TVA's power program to be self-financing from power revenues and proceeds from power program financings. While TVA's power program did not directly receive appropriated funds after it became self-financing, TVA continued to receive appropriations for certain multipurpose and other nonpower mission-related activities as well as for its stewardship activities. TVA has not received any appropriations from Congress for any activities since 1999, and funds its business usingsince that time, TVA has funded stewardship program activities primarily with power system revenues, power financings, and other revenues. TVA is a source of cash
The 1959 amendment to the federal government. TVA will indefinitely continueAct also required TVA, beginning in 1961, to paymake annual payments to the U.S. Treasury from net power proceeds as a repayment of and as a return on the outstandingPower Program Appropriation Investment until a total of $1.0 billion of the Power Program Appropriation Investment has been repaid in accordance with the 1959 amendment. TVA fulfilled its requirement to repay $1.0 billion of the Power Program Appropriation Investment in 2014. The TVA Act requires TVA to continue making payments to the U.S. Treasury as a return on the remaining $258 million of the government's appropriation investment in TVA's power facilities (the "PowerPower Program Appropriation Investment"). See Note 18Investment.
—Proprietary Capital —
TVA paid the U.S. Treasury $6 million, $4 million, and $4 million in 2023, 2022, and 2021, respectively, as a return on the Power Program Appropriation Investment. The amount of the return on the Power Program Appropriation Investment is based on the Power Program Appropriation Investment balance at the beginning of that year and the computed average interest rate payable by the U.S. Treasury on its total marketable public obligations at the same date. The interest rates payable by TVA on the Power Program Appropriation Investment were 1.99 percent, 1.47 percent, and 1.64 percent for 2023, 2022, and 2021, respectively.
TVA also has access to a financing arrangement with the U.S. Treasury pursuant to the TVA Act. TVA and the U.S. Treasury entered into a memorandum of understanding under which the U.S. Treasury provides TVA with a $150 million credit facility. This credit facility has a maturity date of September 30, 2021,2024, and is typically renewed annually. Access to this credit facility or other similar financing arrangements has been available to TVA since the 1960s. See Note 1314 — Debt and Other Obligations — Credit Facility Agreements.
In the normal course of business, TVA contracts with other federal agencies for sales of electricity and other services. Transactions with agencies of the federal government were as follows:
| Related Party Transactions For the years ended, or at, September 30 | |
Related Party Transactions At or for the years ended September 30 (in millions) | | Related Party Transactions At or for the years ended September 30 (in millions) |
| | | 2020 | | 2019 | | 2018 | | 2023 | | 2022 | | 2021 |
| Revenue from sales of electricity | Revenue from sales of electricity | $ | 105 | | | $ | 118 | | | $ | 122 | | Revenue from sales of electricity | $ | 120 | | | $ | 134 | | | $ | 109 | |
| Other income | Other income | 260 | | | 258 | | | 240 | | Other income | 282 | | | 296 | | | 280 | |
| | Expenditures | Expenditures | | Expenditures | |
| Operating expenses | Operating expenses | 224 | | | 222 | | | 220 | | Operating expenses | 234 | | | 228 | | | 214 | |
| Additions to property, plant, and equipment | Additions to property, plant, and equipment | 9 | | | 10 | | | 8 | | Additions to property, plant, and equipment | 8 | | | 11 | | | 10 | |
| Cash and cash equivalents | Cash and cash equivalents | 31 | | | 45 | | | 46 | | Cash and cash equivalents | 31 | | | 30 | | | 30 | |
| Accounts receivable, net | Accounts receivable, net | 94 | | | 76 | | | 60 | | Accounts receivable, net | 87 | | | 78 | | | 65 | |
| Investment funds | Investment funds | 485 | | | 279 | | | 199 | | Investment funds | 391 | | | 358 | | | 573 | |
| Long-term accounts receivable | Long-term accounts receivable | 27 | | | 53 | | | 46 | | Long-term accounts receivable | 38 | | | 43 | | | 31 | |
| Accounts payable and accrued liabilities | Accounts payable and accrued liabilities | 39 | | | 69 | | | 69 | | Accounts payable and accrued liabilities | 42 | | | 42 | | | 15 | |
| Long-term power bonds, net | Long-term power bonds, net | 1 | | | 0 | | | 0 | | Long-term power bonds, net | 1 | | | 1 | | | 1 | |
| Return on power program appropriation investment | Return on power program appropriation investment | 6 | | | 6 | | | 5 | | Return on power program appropriation investment | 6 | | | 4 | | | 4 | |
|
24. Unaudited Quarterly Financial Information
A summary of the unaudited quarterly results of operations for the years 2020 and 2019 follows. This summary should be read in conjunction with the audited consolidated financial statements appearing herein. Results for interim periods may fluctuate as a result of seasonal weather conditions, changes in rates, and other factors.
| | | | | | | | | | | | | | | | | | | | | | | | | | | | | |
| Unaudited Quarterly Financial Information |
| 2020 |
| | First | | Second | | Third | | Fourth | | Total |
| Operating revenues | $ | 2,578 | | | $ | 2,521 | | | $ | 2,251 | | | $ | 2,899 | | | $ | 10,249 | |
| Operating expenses | 2,046 | | | 1,914 | | | 1,716 | | | 1,862 | | | 7,538 | |
| Operating income | 532 | | | 607 | | | 535 | | | 1,037 | | | 2,711 | |
| Net income (loss) | 192 | | | 255 | | | 205 | | | 700 | | | 1,352 | |
| | | | | | | | | | | | | | | | | | | | | | | | | | | | | |
| Unaudited Quarterly Financial Information |
| 2019 |
| | First | | Second | | Third | | Fourth | | Total |
| Operating revenues | $ | 2,725 | | | $ | 2,750 | | | $ | 2,604 | | | $ | 3,239 | | | $ | 11,318 | |
| Operating expenses | 1,960 | | | 2,158 | | | 2,088 | | | 2,301 | | | 8,507 | |
| Operating income | 765 | | | 592 | | | 516 | | | 938 | | | 2,811 | |
| Net income (loss) | 423 | | | 241 | | | 165 | | | 588 | | | 1,417 | |
Report of Independent Registered Public Accounting Firm
To the Board of Directors of Tennessee Valley Authority
Opinion on the Financial Statements
We have audited the accompanying consolidated balance sheets of Tennessee Valley Authority (the Company) as of September 30, 20202023 and 2019,2022, the related consolidatedstatements of operations, comprehensive income (loss), changes in proprietary capital and cash flows for each of the three years in the period ended September 30, 2020,2023, and the related notes (collectively referred to as the consolidated financial statements). In our opinion, the consolidated financial statements present fairly, in all material respects, the financial position of the Company at September 30, 20202023 and 2019,2022, and the results of its operations and its cash flows for each of the three years in the period ended September 30, 2020,2023, in conformity with U.S. generally accepted accounting principles.
We also have audited, in accordance with the standards of the Public Company Accounting Oversight Board (United States) (PCAOB), the Company's internal control over financial reporting as of September 30, 2020,2023, based on criteria established in Internal Control-Integrated Framework issued by the Committee of Sponsoring Organizations of the Treadway Commission (2013 framework), and our report dated November 16, 202013, 2023 expressed an unqualified opinion thereon.
Basis for Opinion
These financial statements are the responsibility of the Company's management. Our responsibility is to express an opinion on the Company'sCompany’s financial statements based on our audits. We are a public accounting firm registered with the PCAOB and are required to be independent with respect to the Company in accordance with the U.S. federal securities laws and the applicable rules and regulations of the Securities and Exchange Commission and the PCAOB.
We conducted our audits in accordance with the standards of the PCAOB. Those standards require that we plan and perform the audit to obtain reasonable assurance about whether the financial statements are free of material misstatement, whether due to error or fraud. Our audits included performing procedures to assess the risks of material misstatement of the financial statements, whether due to error or fraud, and performing procedures that respond to those risks. Such procedures included examining, on a test basis, evidence regarding the amounts and disclosures in the financial statements. Our audits also included evaluating the accounting principles used and significant estimates made by management, as well as evaluating the overall presentation of the financial statements. We believe that our audits provide a reasonable basis for our opinion.
| | | | | | | | |
Critical Audit Matters
The critical audit matters communicated below are matters arising from the current period audit of the financial statements that were communicated or required to be communicated to the Audit, Finance, Risk, and Cybersecurity Committee and that: (1) relate to accounts or disclosures that are material to the financial statements and (2) involved our especially challenging, subjective or complex judgments. The communication of critical audit matters does not alter in any way our opinion on the consolidated financial statements, taken as a whole, and we are not, by communicating the critical audit matters below, providing separate opinions on the critical audit matters or on the accounts or disclosures to which they relate. |
| | Valuation of Pension Benefit and Other Post-Retirement Benefit Obligations |
| Description of the Matter | | At September 30, 2023, the Company’s pension benefit obligation was $10.1 billion and the Company’s other post-retirement benefit obligation was $347 million. The Company utilizes certain actuarial assumptions to measure the pension benefit and other post-retirement benefit obligations at September 30, as more fully described in Note 20 to the consolidated financial statements.
Auditing the pension benefit and other post-retirement benefit obligations was complex due to the judgmental nature of the assumptions used in the Company’s measurement process, including the discount rates, mortality rates, projected health care cost trend rates, and cost of living adjustments. These assumptions have a significant effect on the projected pension benefit and other post-retirement benefit obligations.
|
| | | | | | | | |
| | |
| How We Addressed the Matter in Our Audit | | We obtained an understanding, evaluated the design and tested the operating effectiveness of controls over the pension benefit and other post-retirement benefit obligations valuation process. For example, we tested controls over management’s review of the pension benefit and other post-retirement benefit obligations calculations, the relevant data inputs, and the significant actuarial assumptions described above.
To test the valuation of the pension benefit and other post-retirement benefit obligations, our audit procedures included, with the assistance of actuarial specialists, evaluating the methodologies used, the significant actuarial assumptions described above, and the underlying data used by the Company, among other procedures. We compared the actuarial assumptions used by the Company to historical trends. We evaluated the Company’s methodology for determining the discount rates that reflect the maturity and duration of the benefit payments and that are used to estimate the pension benefit and other post-retirement benefit obligations. To evaluate the projected health care cost trend rates, the cost of living adjustments, and the mortality rates, we assessed whether the information was consistent with publicly available information, and whether any market data adjusted for entity-specific adjustments was applied. We also tested the completeness and accuracy of the underlying data, including the participant data, used in the determination of the projected pension benefit and other post-retirement benefit obligations. |
| | | | | | | | |
| | Valuation of Alternative Investments |
| Description of the Matter | | At September 30, 2023, the Company had $4.1 billion in investment funds and $8.1 billion in plan investments related to the defined benefit pension plan. Approximately 55% and 57% of investment funds and plan investments, respectively, are invested in private equity funds, private real asset funds, private credit funds, and commingled funds. These types of investments are referred to as “alternative investments.” These alternative investments are measured at fair value using the net asset value (“NAV”) (or its equivalent) as more fully described in Note 16, for investment funds, and Note 20, for plan investments, to the consolidated financial statements.
Auditing the valuation of alternative investments was challenging because of the higher estimation uncertainty of the inputs to the fair value measurements, including the underlying NAVs, discounted cash flow valuations, comparable market valuations, and adjustments for currency, credit, liquidity, and other risks. Additionally, certain information regarding the fair value of these alternative investments was based on unaudited information available to management at the time of valuation.
|
| How We Addressed the Matter in Our Audit | | We obtained an understanding, evaluated the design and tested the operating effectiveness of controls over the Company’s alternative investments’ valuation process. For example, we tested controls over management's review of the alternative investment valuation, which included a comparison of returns to benchmarks and monitoring of investment managers’ valuation policies and procedures, as well as portfolio performance.
To test the valuation of the alternative investments, our audit procedures included, among others, comparing fund returns to selected relevant benchmarks and understanding variations as well as comparing fair values from the most recent audited financial statements to the Company's estimated fair values. We obtained an understanding of the changes to the investment portfolio and changes in investment strategies. We assessed the historical accuracy of management's estimates by comparing actual fair values to previous estimates. We evaluated for contrary evidence by confirming the fair values of the investments and ownership interest directly with the trustee and with a sample of investment managers. |
/s/ Ernst & Young LLP
We have served as the Company'sCompany’s auditor since 2007
Chattanooga, Tennessee
November 16, 202013, 2023
ITEM 9. CHANGES IN AND DISAGREEMENTS WITH ACCOUNTANTS ON ACCOUNTING AND FINANCIAL DISCLOSURE
Not applicable.
ITEM 9A. CONTROLS AND PROCEDURES
Disclosure Controls and Procedures
TVA maintains disclosure controls and procedures designed to ensure that information required to be disclosed by TVA in reports that it files or submits under the Securities Exchange Act of 1934 (the "Exchange Act") is recorded, processed, summarized, and reported, within the time periods specified in the Securities and Exchange Commission's rules and forms, and is accumulated and communicated to TVA's management, as appropriate, to allow timely decisions regarding required disclosure. TVA's management, including the President and Chief Executive Officer, the Executive Vice President and Chief Financial and Strategy Officer, and members of the Disclosure Control Committee, including the Vice President and Controller (Principal Accounting Officer) ("management"(collectively "management"), evaluated the effectiveness of TVA's disclosure controls and procedures (as defined in Rule 13a-15(e) under the Exchange Act) as of September 30, 2020.2023. Based on this evaluation, TVA's management concluded that TVA's disclosure controls and procedures were effective as of September 30, 2020, to ensure that information required to be disclosed by TVA in reports that it files or submits under the Exchange Act, is recorded, processed, summarized, and reported, within the time periods specified in the Securities and Exchange Commission's rules and forms, and include controls and procedures designed to ensure that information required to be disclosed by TVA in such reports is accumulated and communicated to TVA's management, as appropriate, to allow timely decisions regarding required disclosure.2023.
Internal Control over Financial Reporting
(a)Management's Annual Report on Internal Control over Financial Reporting
TVA's management is responsible for establishing and maintaining adequate internal control over financial reporting as defined in Exchange Act Rule 13a-15(f) and required by Section 404 of the Sarbanes-Oxley Act. TVA's internal control over financial reporting is designed to provide reasonable, but not absolute, assurance regarding the reliability of financial reporting and the preparation of financial statements in accordance with generally accepted accounting principles.principles generally accepted in the United States of America ("GAAP"). Because of the inherent limitations in all control systems, internal control over financial reporting and systems may not prevent or detect misstatements.
TVA's management, including the President and Chief Executive Officer, the Executive Vice President and Chief Financial and Strategy Officer, and members of the Disclosure Control Committee, including the Vice President and Controller (Principal Accounting Officer), evaluated the design and effectiveness of TVA's internal control over financial reporting as of September 30, 2020,2023, based on the framework in Internal Control — Integrated Framework (2013) issued by the Committee of Sponsoring Organizations of the Treadway Commission. Based on this evaluation, TVA's management concluded that TVA's internal control over financial reporting was effective as of September 30, 2020.2023.
Although the effectiveness of internal control over financial reporting was not required to be subject to attestation by TVA's independent registered public accounting firm, TVA has chosen to obtain such a report. Ernst & Young LLP, the independent registered public accounting firm that audited the financial statements included in this Annual Report, has issued an attestation report on TVA's internal control over financial reporting.
(b)Changes in Internal Control over Financial Reporting
During the quarter ended September 30, 2020,2023, there were no changes in TVA's internal control over financial reporting that materially affected, or are reasonably likely to materially affect, TVA's internal control over financial reporting.
Report of Independent Registered Public Accounting Firm
To the Board of Directors of Tennessee Valley Authority
Opinion on Internal Control over Financial Reporting
We have audited Tennessee Valley Authority'sAuthority’s internal control over financial reporting as of September 30, 2020,2023, based on criteria established in Internal Control —Control—Integrated Framework issued by the Committee of Sponsoring Organizations of the Treadway Commission (2013 framework) (the COSO Criteria)criteria). In our opinion, Tennessee Valley Authority (the Company) maintained, in all material respects, effective internal control over financial reporting as of September 30, 2020,2023, based on the COSO criteria.
We also have audited, in accordance with the standards of the Public Company Accounting Oversight Board (United States) (PCAOB), the consolidated balance sheets of the Company as of September 30, 20202023, and 2019,2022, the related consolidated statements of operations, comprehensive income (loss), changes in proprietary capital and cash flows for each of the three years in the period ended September 30, 2020,2023, and the related notes and our report dated November 16, 202013, 2023 expressed an unqualified opinion thereon.
Basis for Opinion
The Company'sCompany’s management is responsible for maintaining effective internal control over financial reporting and for its assessment of the effectiveness of internal control over financial reporting included in the accompanying Management'sManagement’s Annual Report on Internal Control over Financial Reporting. Our responsibility is to express an opinion on the Company'sCompany’s internal control over financial reporting based on our audit. We are a public accounting firm registered with the PCAOB and are required to be independent with respect to the Company in accordance with the U.S. federal securities laws and the applicable rules and regulations of the Securities and Exchange Commission and the PCAOB.
We conducted our audit in accordance with the standards of the PCAOB. Those standards require that we plan and perform the audit to obtain reasonable assurance about whether effective internal control over financial reporting was maintained in all material respects.
Our audit included obtaining an understanding of internal control over financial reporting, assessing the risk that a material weakness exists, testing and evaluating the design and operating effectiveness of internal control based on the assessed risk, and performing such other procedures as we considered necessary in the circumstances. We believe that our audit provides a reasonable basis for our opinion.
Definition and Limitations of Internal Control Over Financial Reporting
A company'scompany’s internal control over financial reporting is a process designed to provide reasonable assurance regarding the reliability of financial reporting and the preparation of financial statements for external purposes in accordance with generally accepted accounting principles. A company'scompany’s internal control over financial reporting includes those policies and procedures that (1) pertain to the maintenance of records that, in reasonable detail, accurately and fairly reflect the transactions and dispositions of the assets of the company; (2) provide reasonable assurance that transactions are recorded as necessary to permit preparation of financial statements in accordance with generally accepted accounting principles, and that receipts and expenditures of the company are being made only in accordance with authorizations of management and directors of the company; and (3) provide reasonable assurance regarding prevention or timely detection of unauthorized acquisition, use, or disposition of the company'scompany’s assets that could have a material effect on the financial statements.
Because of its inherent limitations, internal control over financial reporting may not prevent or detect misstatements. Also, projections of any evaluation of effectiveness to future periods are subject to the risk that controls may become inadequate because of changes in conditions, or that the degree of compliance with the policies or procedures may deteriorate.
/s/ Ernst & Young LLP
Chattanooga, Tennessee
November 16, 202013, 2023
ITEM 9B. OTHER INFORMATION
No Adjustments toInsider Trading Arrangements and Policies
During the three months ended September 30, 2023, no director or officer of TVA notified TVA of the adoption or termination of a "Rule 10b5-1 trading arrangement" or "non-Rule 10b5-1 trading arrangement," as each term is defined in Item 408(a) of Regulation S-K.
2024 CEO Compensation
On October 22, 2020,November 9, 2023, the People and Performance Committee (the "Committee"TVA Board approved no adjustment to the salary of Chief Executive Officer ("CEO") commissioned FW Cook to conduct an independent studyJeffrey J. Lyash for 2024.
The following sets forth the components of CEO compensation that provides increased direct focus on pay levels among government agencies. TVA's CEO benchmarking approach has historically considered TVA's federal agency status in both a direct and indirect manner: the direct manner has been to incorporate government agencies from Willis Towers Watson's ("WTW") Energy Services Survey into the survey sample used to develop benchmarks (four of the 31 companies in the 2019 sample were government agencies). The indirect manner has been to position CEOMr. Lyash's 2024 target total direct compensation below the 25th percentile of the market composite data even though TVA's compensation plan provides for a general target at the 50th percentile.("TDC"), effective October 1, 2023:
The independent study for 2021 seeks to further incorporate government agency pay into•Salary remained the market composite data via the following actions: (1) the Committee has authorized a custom surveysame at $1,227,000.
•Long-term performance ("LTP") grant of CEO/Principal Executive compensation at non-utility government agencies to be conducted by Willis Towers Watson$3,983,000, which will vest on September 30, 2026.
•Long-term retention ("LTR") grant of $1,707,000, which will vest in three equal increments on September 30, 2024, September 30, 2025, and (2) the Committee will consider compensation practices from an expanded pool of government agencies and non-profit entities that participate in the WTW Energy Services Survey. The results of the independent study will be presented to the Committee in January 2021 and will be used by the Committee and TVA Board in determining Mr. Lyash's target total direct compensation for 2021.September 30, 2026.
No adjustments were made to any other existing elements of compensation for Mr. Lyash for 2024.
Compensation Adjustments for Other NEOs
On November 13, 2020, Chief Executive Officer ("CEO")9, 2023, CEO Jeffrey J. Lyash approved compensation adjustments for the following Named Executive Officers ("NEOs") for 2021.2024. (Biographical information for each is set out in Item 10, Directors, Executive Officers, and Corporate Governance.) The following sets forth salary increases and incentive awards granted for 2021,2024, effective October 1, 2020:2023:
John M. Thomas, III
•Salary increased from $666,584$835,380 to $686,582.$860,411.
•Long-term performance ("LTP")LTP grant of $1,000,000,$1,425,000, which will vest on September 30, 2023.2026.
•Long-term retention ("LTR")LTR grant of $432,000,$700,000, which will vest in three equal increments on September 30, 2021,2024, September 30, 2022,2025, and September 30, 2023.2026.
Michael D. SkaggsDonald A. Moul
•Salary increased from $663,400$795,600 to $689,936.$819,468.
•LTP grant of $1,175,000,$1,425,000, which will vest on September 30, 2023.2026.
•LTR grant of $504,000,$852,000, which will vest in three equal increments on September 30, 2021,2024, September 30, 2022,2025, and September 30, 2023.
Sherry A. Quirk
•Salary increased from $557,291 to $574,010.
•LTP grant of $695,000, which will vest on September 30, 2023.
•LTR grant of $295,000, which will vest in three equal increments on September 30, 2021, September 30, 2022, and September 30, 2023.2026.
Timothy S. Rausch
•Salary increased from $535,600$637,640 to $551,668.$663,146.
•LTP grant of $500,000,$725,000, which will vest on September 30, 2023.2026.
•LTR grant of $330,000,$375,000, which will vest in three equal increments on September 30, 2021,2024, September 30, 2022,2025, and September 30, 2023.2026.
David B. Fountain
•Salary increased from $629,802 to $648,696.
•LTP grant of $1,000,000, which will vest on September 30, 2026.
•LTR grant of $414,000, which will vest in three equal increments on September 30, 2024, September 30, 2025, and September 30, 2026.
No adjustments were made to any other existing elements of compensation for these NEOs for 2021.2024.
Supplemental Compensation Plan Change to Better Align to Market
ITEM 9C. DISCLOSURE REGARDING FOREIGN JURISDICTIONS THAT PREVENT INSPECTIONS
Long-Term Incentive Plan
On November 12, 2020, the CEO approved an amended and restated Long-Term Incentive Plan ("LTIP") that allows TVA to make off-cycle performance-based grants and retention grants on a pro-rated basis. A copy of the amended and restated LTIP is attached as an exhibit to this Annual Report and is incorporated herein by reference. The foregoing description is qualified in its entirety by reference to such document.
Corporate Multiplier
On November 13, 2020, the TVA Board approved the following performance measures for the Corporate Multiplier for 2021: (1) Safety, (2) Total Financing Obligations, (3) Cash Flow from Operations, (4) Net Income, (5) Jobs Created and Retained, and (6) Board Level Significant Events. These measures are described in more detail in the table below:
| | | | | | | | |
Performance Measure | Description | Target |
Safety (Serious Injury Incident Rate) | (Number of cases X 200,000) / (Number of hours worked by TVA employees and staff augmentation contractors) | 0 |
Total Financing Obligations | The total amount of net long-term debt (including unamortized premiums and discounts), net short-term debt, leaseback obligations, energy prepayment obligations, and variable interest entities less unbudgeted contributions to unfunded liabilities | $21,249 |
Cash Flow from Operating Activities | Net cash provided by operating activities as shown on TVA's Consolidated Statements of Cash Flows | $2,707 |
Net Income | Net income as shown on TVA's Consolidated Statements of Operations | $1,010 |
Jobs Created and Retained | The number of new or retained jobs in the Tennessee Valley for which TVA has played a role in the recruitment or retention of the economic development project | 42,000-70,000 |
Board Level Significant Events | Items (both favorable and unfavorable) that the Board deems significant and that affect TVA's reputation, organizational health, or the public at large | 0 |
The TVA Board and the CEO will jointly qualitatively assess TVA's performance and determine the final Corporate Multiplier, which will range between 0 and 1.0, after the end of 2021.
The award for certain participants in the Winning Performance Team Incentive Plan ("WPTIP") and the Executive Annual Incentive Plan ("EAIP") may be adjusted by the participant's supervisor based on an evaluation of the participant's individual achievements and performance during the year. In addition, awards may be further adjusted by the TVA Board or the CEO (1) as a result of any unusual or nonrecurring event affecting TVA or the financial statements of TVA or (2) as a result of changes in business conditions or the business strategy of TVA.
Establishment of LTIP Performance Measures and Goals for the 2021 - 2023 Performance Cycle
On November 13, 2020, the TVA Board approved LTIP performance measures for the 2021 - 2023 performance cycle. These performance measures, along with their associated weights and goals, are as follows:
2021 - 2023 LTIP Performance Cycle
| | | | | | | | | | | | | | |
| Performance Measure | Weight | Threshold
(50%) | Target
(100%) | Maximum
(150%) |
Non-Fuel Delivered Cost of Power(1) | 45% | 3.62 | 3.48 | 3.34 |
Load Not Served(2) | 30% | 4.6 | 3.9 | 3.4 |
External Performance Indicators for TVA Nuclear Fleet(3) | 15% | 95.3 | 96.8 | 98.3
|
Customer Survey(4) | 5% | 67.3 | 71.3 | 75.3 |
Stakeholder Survey(5) | 5% | 75.2 | 77.7 | 80.2 |
Notes
(1)Non-Fuel Delivered Cost of Power = (Operating and Maintenance Expense + Base Capital Expense + Interest Expense + Other Expense) / Budgeted Electric Power Sales. For the 2021 - 2023 LTIP performance cycle, the Non-Fuel Delivered Cost of Power measure will be calculated using an average of the 2021, 2022, and 2023 results.
(2)Load Not Served = (Percentage of Total Load Not Served) x (Number of Minutes in the Period). The Load Not Served measure excludes events during declared major events, variances, gunfire, vandalism, and verified tornadoes and includes distributor provided load not served estimates for distributor connection point interruptions caused by TVA. For the 2021 - 2023 LTIP performance cycle, the Load Not Served measure will be calculated using an average of the 2021, 2022, and 2023 results.
(3)The External Performance Indicators for TVA Nuclear Fleet measure is calculated using a weighted combination of key performance indicators based on standard nuclear industry definitions for station performance, with the maximum obtainable being 100 points. For the 2021 – 2023 LTIP performance cycle, this measure will be based on 2023 results.
(4)For the 2021 - 2023 LTIP performance cycle, the Customer Survey metric will be a composite score of customer survey results based on responses to key survey questions related to the impact of customer experience on loyalty to TVA. This measure will be calculated using an average of the 2021, 2022, and 2023 results.
(5)For the 2021 - 2023 LTIP performance cycle, the Stakeholder Survey metric will be the average score of a survey conducted among the general public, public officials, economic development leaders, and business and community leaders in the TVA service area to assess public opinion of TVA. This measure will be calculated using an average of the 2021, 2022, and 2023 results.
PART III
ITEM 10. DIRECTORS, EXECUTIVE OFFICERS, AND CORPORATE GOVERNANCE
Directors
The Tennessee Valley Authority Act of 1933, as amended (the "TVA Act") provides that the Tennessee Valley Authority ("TVA") will be administered by a board of nine part-time members appointed by the President of the United States ("U.S.") with the advice and consent of the U.S. Senate. The Chair of the TVA Board of Directors ("TVA Board") is selected by the members of the TVA Board. Under the TVA Act, to be eligible to be appointed as a member of the TVA Board, an individual (i) must be a U.S. citizen; (ii) must have management expertise relative to a large for-profit or nonprofit corporate, government, or academic structure; (iii) cannot be a TVA employee; (iv) must make a full disclosure to Congress of any investment or other financial interest that the individual holds in the energy industry; and (v) must affirm support for the objectives and missions of TVA, including being a national leader in technological innovation, low-cost power, and environmental stewardship. In addition, the President of the U.S., in appointing members of the TVA Board, must (i) consider recommendations from other public officials such as the Governors of the states in TVA's service area; individual citizens; business, industrial, labor, electric power distribution, environmental, civic, and service organizations; and the congressional delegations of the states in TVA's service area; and (ii) seek qualified members from among persons who reflect the diversity, including geographical diversity, and needs of TVA's service area. At least seven of the nine TVA Board members must be legal residents of the TVA service area. Currently, TVA has fivenine active TVA Board members.
TVA Board members serve five-year terms, and at least one member's term ends each year. After a member's term ends, the member is permitted under the TVA Act to remain in office until the earlier of the end of the then-current session of Congress or the date a successor takes office. The TVA Board, among other things, establishes broad goals, objectives, and policies for TVA; develops long-range plans to guide TVA in achieving these goals, objectives, and policies; approves annual budgets; and establishes a compensation plan for employees.
The terms of A.D. Frazier and Jeff W. Smith as members of the TVA Board ended January 3, 2023, with the
adjournment of the most recent session of Congress. Although their terms of office expired May 18, 2022, the TVA Act permitted them to continue to serve as Directors until the end of this session of Congress. On January 4, 2023, Beth P. Geer, L. Michelle Moore, Robert P. Klein, William J. Renick, Joe H. Ritch, and A. Wade White took their oath of office and began their service as members of the TVA Board. With these new Board members, TVA has a full nine-member Board. The term of Director Kilbride expired on May 18, 2023, although he is permitted under the TVA Act to remain in office until the earlier of the end of the current session of Congress or the date a successor takes office.
The TVA Board as of November 16, 2020,13, 2023, consisted of the following fivenine individuals with their ages and terms of office provided:
| | | | | | | | | | | | |
| Directors | Age | Year Current Term Began | Year Term Expires | |
John L. Ryder, Chair(1) | 71 | 2019 | 2021 | |
| Kenneth E. Allen | 74 | 2018 | 2021 | |
| A.D. Frazier | 76 | 2018 | 2022 | |
| William B. Kilbride | 69 | 2019 | 2023 | |
| Jeff W. Smith | 61 | 2018 | 2022 | |
| | | | |
| | | | | | | | | | | | |
| Directors | Age | Year Current Term Began | Year Term Expires | |
Joe H. Ritch(1) | 73 | 2023 | 2025 | |
| Beth P. Geer | 58 | 2023 | 2026 | |
| Beth H. Harwell | 66 | 2021 | 2024 | |
| William B. Kilbride | 72 | 2019 | 2023 | |
| Robert P. Klein | 72 | 2023 | 2026 | |
| L. Michelle Moore | 51 | 2023 | 2026 | |
| Brian E. Noland | 55 | 2020 | 2024 | |
| William J. Renick | 70 | 2023 | 2027 | |
| A. Wade White | 55 | 2023 | 2027 | |
| | | | |
| | | | |
NoteNotes
(1) Mr. RyderRitch assumed the Board Chair role on August 13, 2020.November 7, 2023.
Mr. RyderRitch of Memphis,Huntsville, Alabama, joined the TVA Board in January 2023 and assumed the role of Board Chair in November 2023. He previously served on the TVA Board from January 2013 to January 2017 and as Board Chair from May 2014 to January 2017. He has been an attorney at Dentons Sirote, PC, a law firm in Huntsville, Alabama, and its predecessor firm, since June 1982. He has served as chair of the Redstone Regional Alliance since 1994, as a director of Axometrics, which provides polarization measurement solutions, since 2002, and as a member of the Alabama School of Cyber Technology and Engineering Foundation since 2018. He formerly served on various corporate boards primarily in the technology, aerospace, and defense industries, including Perkins Technical Services, Inc. and CAS Inc., as well as many non-profit boards, including
the Board of Trustees of the University of Alabama System, of which he is now a Trustee Emeritus, and the Huntsville/Madison County Chamber of Commerce. He has received numerous business and community awards and was inducted into the Alabama Business Hall of Fame in 2021.
Ms. Geer of Brentwood, Tennessee, joined the TVA Board in March 2019. HeJanuary 2023. She has served as a bankruptcythe chief of staff to former Vice President Al Gore since May 2012 and election law attorney with Harris Shelton Hanover Walsh, PLLC,has served on the Nashville Sustainability Advisory Committee since 2000. In addition, heFebruary 2020. She has extensive policy experience in climate change and environmental justice, having previously served as General Counsel toin roles in the Republican National Committee from 2013 to 2017Clinton-Gore White House, U.S. Department of Labor, and as Chairman of the Republican National Lawyers Association from 2017 to 2018.U.S. Senate.
Mr. AllenDr. Harwell of White Plains, Kentucky,Nashville, Tennessee, joined the TVA Board in January 2018. He spent more than 50 years in the coal industry and held a number of executive management positions prior to his retirement in June 2017. Most recently, he2021. She has served as Executive Vice President and Chief Operating Officer ("COO")a distinguished visiting professor at Middle Tennessee State University since the fall of Armstrong Energy, Inc. from July 2014 to June 2017,2019. She previously served as Executive Vice Presidentthe speaker of Operations for Armstrong Energy, Inc.the Tennessee House of Representatives, from 2011 to July 2014, anduntil 2019, while serving as COO of Armstrong Coal Company, Inc. from December 2013 until June 2017. He is currently a member of the Board of Directorsstate representative for the First United Bank56th District of Tennessee for nearly 30 years. She has also chaired the Tennessee Republican Party and served as an assistant professor of political science at Belmont University, as well as in Madisonville, Kentucky.a variety of additional roles in both education and public service.
Mr. Frazier of Mineral Bluff, Georgia, joined the TVA Board in January 2018. Since July 2012, he has served as President Emeritus of Georgia Oak Partners, LLC, a private equity company. Mr. Frazier previously held a number of other executive management positions, including chair and Chief Financial Officer ("CFO") of the Chicago Stock Exchange, chair and Chief Executive Officer ("CEO") of Danka Business Systems, a reseller of high-end photocopying equipment, president of Caremark, a pharmacy benefit management company, and COO of the Atlanta Committee for the 1996 Olympic Games.
Mr. Kilbride of Chattanooga, Tennessee, joined the TVA Board in August 2019.2019 and served as Board Chair from August 2021 to November 2023. He served as the president and CEO of the Chattanooga Area Chamber of Commerce from July 2014 until his retirement in January 2017, where he led multiple initiatives to attract and retain business to southeast Tennessee. He previously served as the president of the Mohawk Home, Divisiona division of Mohawk Industries, Inc. from 1992 to 2014 after earlier holding positions with bothChemical Bank, Dean Witter Reynolds Financial Services, and the New York Stock Exchange.
Mr. Smith of Knoxville,Chattanooga, Tennessee, joined the TVA Board in January 2018.2023. He retired in November 2015 as former vice president of the International Brotherhood of Electrical Workers, a role he assumed after a decades-long career as a lineman and foreman for the Electric Power Board of Chattanooga. He also served as president of the Tennessee Valley Trades and Labor Council for 14 years, as well as on the TVA Labor-Management Committee, and served honorably in the Tennessee Army National Guard.
Ms. Moore of Midlothian, Virginia, joined the TVA Board in January 2023. Since April 2000, Mr. SmithJune 2015, she has served as CEO of Groundswell, a nonprofit that builds community power to reduce energy burdens and expand economic opportunity. She is the author of Rural Renaissance, and from her roots in rural Georgia, she has worked to connect clean energy with affordability and quality of life for more than 25 years, including leading federal sustainability and infrastructure project delivery for the Obama White House.
Dr. Noland of Johnson City, Tennessee, joined the TVA Board in December 2020. Since January 2012, he has served as the deputy for operations at Oak Ridge National Laboratory ("ORNL"). Since April 2001, he has alsoninth president of East Tennessee State University. He previously served as the President of UT-Battelle Development Corporation, an entity established to develop privately constructed facilities at ORNL. During a six-month special assignment in 2002, he assisted with the creationChancellor of the U.S. DepartmentWest Virginia Higher Education System for six years. In addition, he serves on the NCAA Division I Board of Homeland Security.Directors as well as the boards of Ballad Health and the Bank of Tennessee.
Mr. Renick of Ashland, Mississippi, joined the TVA Board in January 2023. He served as senior advisor for the Mississippi Office of Workforce Development from July 2021 to June 2022 and served as Workforce Division Director at Three Rivers Planning and Development District in Pontotoc, Mississippi, from June 2008 to June 2021. In April 2023, he became a member of the Board of Directors of the CREATE Foundation in Tupelo, Mississippi, and he also serves as the chair of the CREATE Foundation's Commission on the Future of Northeast Mississippi. A longtime public servant, Mr. Renick has served in multiple local and state elected and appointed positions, as well as in the private sector.
Mr. White of Eddyville, Kentucky, joined the TVA Board in January 2023. He has served with Farmers Bank and Trust Company in Princeton, Kentucky, in business development and public relations, since January 2023. He previously served as a senior claims specialist with Progressive Insurance Company in Louisville, Kentucky, from January 2022 to December 2022, and as Lyon County Judge Executive from January 2011 to December 2022.
Executive Officers
TVA's executive officers as of November 16, 2020,13, 2023, their titles, their ages, and the date their employment with TVA commenced are as follows:
| | | | | | | | | | | |
| Executive Officers | Title | Age | Employment Commenced |
| Jeffrey J. Lyash | President and Chief Executive Officer | 59 | 2019 |
| John M. Thomas, III | Executive Vice President and Chief Financial Officer | 57 | 2005 |
| Michael D. Skaggs | Executive Vice President and Chief Operating Officer | 60 | 1994 |
| Sherry A. Quirk | Executive Vice President and General Counsel | 66 | 2015 |
| Timothy S. Rausch | Executive Vice President and Chief Nuclear Officer | 56 | 2018 |
| Susan E. Collins | Executive Vice President and Chief People and Communications Officer | 54 | 2014 |
| Jeannette Mills | Executive Vice President and Chief External Relations Officer | 53 | 2020(1) |
| Diane T. Wear | Vice President and Controller (Principal Accounting Officer) | 52 | 2008 |
Note
(1) Ms. Mills commenced employment with TVA on February 3, 2020. | | | | | | | | | | | |
| Executive Officers | Title | Age | Employment Commenced |
| Jeffrey J. Lyash | President and Chief Executive Officer | 62 | 2019 |
| John M. Thomas, III | Executive Vice President and Chief Financial and Strategy Officer | 59 | 2005 |
| Donald A. Moul | Executive Vice President and Chief Operating Officer | 58 | 2021 |
| Timothy S. Rausch | Executive Vice President and Chief Nuclear Officer | 59 | 2018 |
| David B. Fountain | Executive Vice President and General Counsel | 56 | 2020 |
| Susan E. Collins | Executive Vice President and Chief Human Resources and Administrative Officer | 57 | 2014 |
| Jeannette Mills | Executive Vice President and Chief External Relations Officer | 56 | 2020 |
| Diane T. Wear | Vice President and Controller | 55 | 2008 |
| | | |
| | | |
Mr. Lyash has served as TVA's President and CEO since April 2019. He previously served as the President and Chief Executive Officer of Ontario Power Generation Inc. ("OPG"), an electric utility, from August 2015 until April 2019. Prior to joining OPG, Mr. Lyash served as the President of the Power Business Unit of Chicago Bridge & Iron Company N.V., an engineering, procurement, and construction company, from July 2013 to August 2015, as Executive Vice President of Energy Supply for Duke Energy Corporation, an electric utility, from July 2012 to December 2012, and as Executive Vice President of Energy Supply for Progress Energy, Inc. ("Progress Energy"), an electric utility, from June 2010 to July 2012. Mr. Lyash joined Progress Energy (formerly Carolina Power & Light Company) in 1993 and held a number of other positions before assuming the role of Executive Vice President of Energy Supply, including Executive Vice President of Corporate Development from July 2009 to June 2010, President and Chief Executive Officer of Progress Energy Florida, Inc., from June 2006 to July 2009, Senior Vice President of Energy Delivery for Progress Energy Florida, Inc., from November 2003 to June 2006, and Vice President of Transmission for Progress Energy Carolinas, Inc., from January 2002 to October 2003. He also held a wide range of management and executive roles in Progress Energy's nuclear program, including Operations Manager, Engineering Manager, Plant Manager, and Director of Site Operations. Mr. Lyash began his career in the utility industry in 1981 and worked for Pennsylvania Power & Light before joining the U.S. Nuclear Regulatory Commission ("NRC"), where he worked from 1984 to 1993. While at the NRC, Mr. Lyash held a number of senior technical and management positions and also worked from June 1984 to May 1985 as an engineer at Browns Ferry Nuclear Plant while on loan to TVA. Mr. Lyash has served as a director for the Electric Power Research Institute ("EPRI") since 2015 and is currently Chair of the EPRI Board, and he has served as a director for Granite Construction Inc. since June 2018.
Mr. Thomas has served as TVA's CFO since June 2010 and was also named Executive Vice President and Chief Financial and Strategy Officer ("CFSO") in June 2021. Mr. Thomas served as Executive Vice President and CFO from February 2012. He served2012 to June 2021, as CFO from June 2010 to February 2012, as Executive Vice President of People and Performance from January 2010 to June 2010, as Senior Vice President, Corporate Governance and Compliance from July 2009 to January 2010, as Controller and Chief Accounting Officer from January 2008 to September 2009, and as the General Manager, Operations Business Services from November 2005 to January 2008. Prior to joining TVA, Mr. Thomas was CFO during 2005 for Benson Security Systems. He was also the Controller of Progress Fuels Corporation from 2003 to 2005 and Controller of Progress Ventures, Inc. from 2001 to 2002, both subsidiaries of Progress Energy.
Mr. SkaggsRausch was named TVA's Executive Vice President and COO effective October 2018. Since joining TVAChief Nuclear Officer in 1994 as Manager of Projects at Watts Bar Nuclear Plant ("Watts Bar"), Mr. Skaggs has held several management positions, including Executive Vice President, Operations from October 2016 to September 2018, Senior Vice President, Watts Bar Operations and Construction from September 2013 to October 2016, Senior Vice President, Nuclear Construction from February 2012 to September 2013, Senior Vice President of Nuclear Generation Development and Construction from October 2011 to February 2012, Site Vice President of Sequoyah Nuclear Plant from November 2010 to October 2011, Vice President of Nuclear Operations Support from December 2009 to November 2010, Site Vice President at Watts Bar from July 2005 to December 2009, and Site Vice President at Browns Ferry Nuclear Plant from July 2004 to July 2005.
Ms. Quirk has served as TVA's Executive Vice President and General Counsel since February 2015. From October 2010 to February 2015, Ms. Quirk was an equity partner in the law firm of Schiff Hardin LLP, which specializes in federal energy regulation, legislation, and power supply transactions. Prior to joining Schiff Hardin, Ms. Quirk was a partner in the Energy
Group of Sullivan & Worcester LLP, and a partner in the Energy Group of Verner, Liipfert, Bernhard, McPherson and Hand, specializing in federal energy regulation, legislation, power supply transactions, and state proceedings.
2020. Mr. Rausch joined TVA in October 2018 as Senior Vice President and Chief Nuclear Officer. Before joining TVA, Mr. Rausch served as the Senior Vice President and Chief Nuclear Officer of Talen Energy Corporation from June 2015 until September 2018 and as the Senior Vice President and Chief Nuclear Officer of PPL Generation, LLC from July 2009 to June 2015. Mr. Rausch has 25 years of experience in virtually all the disciplines of the nuclear power industry, including roles as Site Vice President, Plant General Manager, and Director of Engineering. In
Mr. Fountain was named Executive Vice President and General Counsel in March 2021. Mr. Fountain joined TVA in June 2020 as the Senior Vice President and Vice General Counsel. Prior to joining TVA, Mr. Fountain served in various leadership roles for more than 20 years with Duke Energy and predecessor companies Progress Energy and Carolina Power & Light. Most recently, Mr. Fountain served as Senior Vice President, Legal, Corporate Secretary, and Chief Ethics and Compliance Officer at Duke Energy from November 2018 to May 2020 heand as President of Duke Energy North Carolina from August 2015 to November 2018.
Mr. Moul was named Executive Vice President and Chief Operating Officer in June 2021. Before joining TVA, Mr. Moul served as the Executive Vice President, Nuclear Officer.Division and Chief Nuclear Officer at NextEra Energy Inc. from January 2020 to May 2021 and as the Vice President and Chief Nuclear Officer of NextEra Energy Inc. from May 2019 to December 2019. He previously held various roles at several subsidiaries of FirstEnergy Corp. Mr. Moul served as Executive on Special Assignment of FirstEnergy Solutions Corp. from March 2019 to May 2019, President and Chief Nuclear Officer of FirstEnergy Generation Companies from March 2018 to March 2019, President of FirstEnergy Generation LLC from April 2017 to March 2018, and Senior Vice President, Fossil Operations and Environmental of FirstEnergy Solutions from August 2015 to April 2017.
Ms. Collins was named Executive Vice President and Chief Human Resources and Administrative Officer in July 2023. Ms. Collins joined TVA in May 2014 as Vice President of Human Resources, she was named Senior Vice President and Chief Human Resources Officer in February 2016, and she was named Senior Vice President, Chief Human Resources and Communications Officer in June 2019.2019, and was named Executive Vice President and Chief People and Communications Officer in November 2020. Before joining TVA, Ms. Collins served as Senior Vice President of Human Resources for Constellation Energy Nuclear Group, LLC from 2009 to 2014 and as Vice President of Human Resources for Constellation Energy from 2008 to 2009. In November 2020, she was named Executive Vice President, Chief People and Communications Officer to reflect the broader scope of her role.
Ms. Mills was named TVA's Executive Vice President and Chief External Relations Officer in February 2020. Most recently, from 2017 until arriving at TVA, Ms. Mills served as the Senior Vice President of Safety, Health, Environmental and Assurance for the U.S. region at National Grid Group, the United Kingdom's largest investor-owned utility. Beginning in June 2015, she served as a Commissioner on the Maryland Public Service Commission, providing regulatory oversight of gas, electric, telephone, water, sewage disposal, and transportation companies. Ms. Mills spent 25 years of her career at Baltimore Gas and Electric, starting as an associate engineer and steadily progressing through positions of increasing responsibility to ultimately serve as Vice President, Customer Operations and Chief Customer Officer from 2008 to 2013.
Ms. Wear has served as TVA's Vice President and Controller since March 2012. Ms. Wear was the Assistant Controller from February 2010 to March 2012. Between April 2008, when she joined TVA, and February 2010, Ms. Wear was the General
Manager, External Reporting/Accounting Policy and Research. Prior to joining TVA, Ms. Wear was a Managing Director at PricewaterhouseCoopers LLP. Ms. Wear joined a predecessor firm to PricewaterhouseCoopers LLP in January 1992.
Disclosure and Financial Code of Ethics
TVA has a Disclosure and Financial Ethics Code ("Financial Ethics Code") that applies to all executive officers (including the CEO, CFO, and Controller) and directors of TVA as well as to all employees who certify information contained in quarterly reports or annual reports or who have responsibility for internal control self-assessments. The Financial Ethics Code includes provisions covering conflicts of interest, ethical conduct, compliance with applicable laws, rules, and regulations, responsibility for full, fair, accurate, timely, and understandable disclosures, and accountability for adherence to the Financial Ethics Code. TVA will provide a current copy of the Financial Ethics Code to any person, without charge, upon request. Requests may be made by calling 888-882-4975 or by sending an e-mail to: investor@tva.com. Any waivers of or changes to provisions of the Financial Ethics Code that require disclosure pursuant to applicable Securities and Exchange Commission requirements will be promptly disclosed to the public, subject to limitations imposed by law, on TVA's website at: www.tva.gov.www.tva.com. Information contained on TVA's website shall not be deemed to be incorporated into, or to be a part of, this Annual Report.
Insider Trading Policy
TVA has an Insider Trading Policy that provides guidelines with respect to transactions in TVA securities and the handling of confidential information about TVA and the companies with which TVA engages in transactions or does business. The policy promotes compliance with U.S. federal, state, and foreign securities laws that prohibit certain persons who are aware of material nonpublic information about TVA from (1) purchasing, selling, or otherwise engaging in transactions in TVA securities, or (2) providing material nonpublic information to other persons who may trade on the basis of that information. The prohibitions against insider trading apply to trading or otherwise transacting in TVA securities, tipping, and making recommendations to engage in transactions in TVA securities by virtually any person, including all persons associated with TVA, if the information involved is material and nonpublic. In addition, the prohibitions against insider trading extend to transactions in the securities of other companies if the transactions are based on material nonpublic information gained while working for TVA.
Committees of the TVA Board
The TVA Board has an Audit, Finance, Risk, and RegulationCybersecurity Committee established in accordance with the TVA Act. This committee oversees TVA's Audit, Risk,financial health and Regulation Committee consists of John L. Ryderreporting, risk management, cybersecurity, compliance, ethics, electricity rates, annual budget, major contracts, and portfolio planning. It also reviews and considers input from the TVA Inspector General to ensure TVA investigates and reports transparently about its financial and legal obligations. Members include Joe H. Ritch (Chair), Beth P. Geer, William B. Kilbride, and William B. Kilbride.J. Renick. Director Kilbride is an "audit committee financial expert" as defined in Item 407(d)(5) of Regulation S-K under the Securities Exchange Act of 1934 (the "Exchange Act").
TVA is exempted by Section 37 of the Exchange Act from complying with Section 10A(m)(3) of the Exchange Act, which requires each member of a listed issuer's audit committee to be an independent member of the board of directors of the issuer. The TVA Act contains certain provisions that are similar to the considerations for independence under Section 10A(m)(3) of the Exchange Act, including that to be eligible for appointment to the TVA Board, an individual shall not be an employee of TVA and shall make full disclosure to Congress of any investment or other financial interest that the individual holds in the energy industry.
Under Section 10A(m)(2) of the Exchange Act, which applies to TVA, the audit committee is directly responsible for the appointment, compensation, and oversight of the external auditor; however, the TVA Act assigns the responsibility for engaging the services of the external auditor to the TVA Board.
The TVA Board has also established the followingthree committees in addition to the Audit, Finance, Risk, and Cybersecurity Committee, as explained below:
The External Stakeholders and Regulation Committee:Committee oversees relationships with customers, members of the public, and key stakeholders. Involvement includes TVA's regulatory policy, natural resource management, economic development, government relations, federal advisory councils, and emerging social issues. Current members include Beth H. Harwell (Chair), Beth P. Greer, L. Michelle Moore, and William J. Renick.
•The Operations and Nuclear Oversight Committee helps ensure the Finance, Rates,safety and Portfolio Committee,effectiveness of TVA's power system generation and transmission assets by overseeing operational performance and planning. Additional oversight includes significant projects, major inspections and evaluations, long-term asset planning, and operational and regulatory compliance. Current members include Robert P. Klein (Chair), L. Michelle Moore, Brian E. Noland, and A. Wade White.
•External Relations Committee,
•The People and PerformanceGovernance Committee has a primary focus on people and
•Nuclear Oversight Committee. the creation of a culture that lives up to TVA's values and seeks to ensure optimal performance and sustainability of the enterprise. The committee reviews key components of the people framework such as inclusion with diversity, talent, engagement, total rewards, and labor relations. Another key function of this committee is Board governance. Current members include Brian E. Noland (Chair), Beth H. Harwell, Robert P. Klein, and A. Wade White.
ITEM 11. EXECUTIVE COMPENSATION
Compensation Discussion and Analysis
This Compensation Discussion and Analysis ("CD&A") provides information on the objectives, goals, and structure of TVA's executive compensation program and the 20202023 compensation awarded to TVA's CEO, CFO,CFSO, and the three other most highly compensated executive officers serving at the end of 2020.2023. Collectively, these officers are TVA's 20202023 Named Executive Officers ("NEOs"):
| | | | | | | | |
Name | Title | Employed with TVA since |
Jeffrey J. Lyash | President and CEO | 2019 |
John M. Thomas, III | Executive Vice President and Chief Financial Officer | 2005 |
Michael D. Skaggs | Executive Vice President and Chief Operating Officer | 1994 |
Sherry A. Quirk | Executive Vice President and General Counsel | 2015 |
Timothy S. Rausch | Executive Vice President and Chief Nuclear Officer(1)
| 2018 |
| | | | | | | | | | | |
| Name | Title | Employment
Date | Position
Date |
| Jeffrey J. Lyash | President and Chief Executive Officer | 2019 | 2019 |
| John M. Thomas, III | Executive Vice President and Chief Financial and Strategy Officer | 2005 | 2010 |
| Donald A. Moul | Executive Vice President and Chief Operating Officer | 2021 | 2021 |
| Timothy S. Rausch | Executive Vice President and Chief Nuclear Officer | 2018 | 2020 |
| David B. Fountain | Executive Vice President and General Counsel | 2020 | 2021 |
| | | |
Note
(1)Effective November 13, 2020; formerly SeniorMr. Thomas was named Executive Vice President and Chief NuclearFinancial and Strategy Officer
TVA's Unique Public Power Mission of Service
TVA is a corporate agency and instrumentality of the U.S. that was created in 1933 by federal legislation to provide integrated resource management of the Tennessee Valley while improving the lives of the people in the region. This congressional statute mandatesdirects TVA with the mission of being a primary objective of providing reliable energy at rates that are as low as feasible; managing natural resources responsibly;national leader in technological innovation, low-cost power, and promoting economic development. The Consolidated Appropriations Act of 2005 altered theenvironmental stewardship. Under federal law, TVA Act in several key areas designed to more closely align TVAis aligned with other corporate entities including changing its Board structure, providing for a CEO, requiring TVAas it is required to follow Securities and Exchange Commission reporting requirements, and requiring that compensation must be based on prevailing compensation for similar positions in investor-owned companies as well as governmental entities. TVA's operational and financial performance have considerably improved since the transition to its current governance structure.
| | | | | |
TVA PUBLIC POWER MISSION - TO SERVE THE PEOPLE OF THE TENNESSEE VALLEY TO MAKE LIFE BETTER | Today, TVA operates the nation's largest public power system and is one of the largest U.S. utility companieselectric utilities in terms of generating capacity.
However, TVA's "Public Power"public power mission sets it apart from its investor-owned peers: aspeers. As an instrumentality of the federal government, itsTVA’s mission is to serve the people of the Tennessee Valley. Profits do not go to shareholders, but rather are reinvested back into the Tennessee Valley community and the energy infrastructure that powers it. In doing so, TVA uses no Americanappropriated tax dollars are used:dollars. TVA is self-funded, with virtually all its operations funded through revenue and power system financings.
|
Complexity and Scale Comparable to Investor-Owned Utilities
TVA supplies reliable power over more than 16,000 miles of transmission lines to a population of approximately 10 million people over nearly 80,000 square miles in seven southeastern states, employs nearly 10,000approximately 10,900 people, and helps recruit and retain billions of dollars in economic development and environmental stewardship projects annually. The complexity, scale, and scope of its utility operations rival those of the largest U.S. utility companies. Unlike most of its peers, TVA is also responsible for managing and caring for many of the natural resources, including public lands and waters, in the Tennessee Valley region.
| | | | | | | | | |
Energy Delivering reliable, low cost, clean energy | |
| | | |
Transmission Grid Reliability - 99.999% Residential rates - lower than 75% of top 100 U.S. Utilities* Industrial rates - lower than more than 95% of top 100 U.S. Utilities* * based on June 2023 12-month rolling average from U.S. Energy Information Administration ("EIA") | |
| | | |
Largest Public Power ProviderSystem In the United States | 36,93732,139 MW
Summer Net CapacityCapability of TVA-Operated Generating Facilities | |
2ndOne of the Largest Transmission SystemSystems
In high voltage lines among United States utilities
More than 16,000 miles of high voltagetransmission lines and and 69 interconnections with neighboring electric systems | 3rd4th Largest Electricity Generator
In the United States, based on 2019 Total2022 Total Electric Generation | |
3rd Largest Nuclear Fleet In the United States, providing over 4042 percent of the energy producedpower supplied by TVA in 2023 | |
| |
29 Power-Generating Dams with 109 Units
| |
| |
3rd Largest Pumped-Storage Hydro Plant In the United States, capable of producing 1,6351,700 megawatts of net summer capability on demand | |
| | |
| | | |
Generating Assets –Three nuclear sites –FiveFour coal-fired sites –29 conventional hydroelectric sites –One pumped-storage hydroelectric site –Nine combustion turbine gas sites –Eight combined cycle gas sites –14Nine operating solar energy sitesinstallations –One diesel generator site
| Partnering with 153 Local Power Companies, Every Day We ServeTVA Serves | |
Approximately 10 Million People Served | Over 750,000Nearly 800,000 Businesses
Including 56 large corporations and60 directly served customers - which includes seven federal installationsagencies | |
Across Seven Southeastern States | |
|
Managing Large, Complex Operations Safely 2020 Was One ofContinued Strong Safety Performance
| |
| | | | | | | | | | | |
|
| Carbon Reduction Leadership |
|
54% reduction in mass carbon emissions and 50% reduction in TVA's Safest Years on Recordcarbon emission rate fromgeneration from CY 2005 to CY2022 |
| | | | | |
Environment Caring for ourthe region's natural resources |
| |
| |
| Managing |
49 Dams Hydroelectric and non-power providing 5,394 MW summer net capability
| Approximately 100 Public Recreation Areas |
| |
The Tennessee River to provide year-round navigation, flood damage reduction, and affordable and reliable electricity |
| |
Caring for
| | | | | |
Over 40,000 Miles of Rivers, Streams, and Tributaries
| 11,000 Miles of reservoir shoreline 293,000 Acres of reservoir land 650,000Surface Acres of reservoir water |
Water Source for more than
Five Million People
Using 10 Billion Gallons in the Valley every day
Approximately 800 Miles of Commercially Navigable Waterways |
| | | | | |
Economic Development Creating sustainable economic growth |
| |
| |
AttractingHelping attract
Over $45.4$9.2 Billion Capital InvestmentProjected
Investments in Tennessee Valley over the last five years, creatingexpected to create/retain 58,411 jobs
(12,276 jobs created and retaining approximately 341,00046,135 jobs retained) | Nearly 10,000Approximately
10,900 Employees 13,800
15,600 Contractors |
| |
TVA Programs
| | | | | |
Rural Development Rural Leadership Institute / Rural Certified Communities
Technical Services Site evaluations and master planning, 3D renderings, video, photography, and virtual reality
Workforce Analytics Company Research Support communities in fulfillment of information for company prospects | Telework Technology Grant Assistance for rural or economically distressed communities to enhance technology capabilities that support remote work opportunities
Product Development Financial support for communities to make sites and buildings more marketable for companies to locate and grow
CommunityTraining and Development
Training &and development, facilitation services, leadership training, workforce training, and young talent development |
| |
A Top Utility in Economic Development 18 Consecutive Years According toSite Selection Magazine |
Attracting and Retaining Experienced Talent Requires Competitive Pay
Talent matters, because of its high value and scarcity. Attraction and retention of talent is paramount to TVA given its complex, specialized operations and performancehigh-performance expectations. This important component of TVA's strategy was incorporated in the TVA Act through the requirement of competitive compensation in the Consolidated Appropriations Act of 2005. In order toTo effectively fulfill its public power mission, in the most effective way possible, TVA must provide market-based, competitive compensation levels to deliverdrive superior performance and executeexecution of ambitious multi-year objectives aligned with TVA's public power mission.
TVA is one of the largest and most complex organizations in the energy services industry, with generating capacity assets, and a local power company ("LPC") customer countscount that surpasssurpasses most of its peers. While TVA's revenue is below the median of its peer group, this is reflective of TVA's success with regard to its public service mission as one of its primary objectives is to maintain the lowest feasible rates. As noted in "Delivering Value Through Superior Performance" below, TVA's rates are below the vast majority of the top U.S. utilities. Unique to TVA, the company is also responsible for managing the Tennessee River system to provide flood control, navigation, hydroelectric generation, recreation, water quality and supply, and other benefits. Further, TVA plays the critical role of attracting and allocating a significant amount of capital back into the economic development of the Tennessee Valley. TVA's revenue, "normalized" as defined in Note 1 below, is only marginally above the median of its proxy peer group, which demonstrates TVA's success with regard to its public service mission, as one of its primary objectives is to maintain the lowest feasible rates. As noted in Delivering Value Through Superior Performance below, TVA's rates are below the rates of the vast majority of the top U.S. utilities. TVA successfully manages all of thisthese responsibilities with an employee count below the median employee count of itsthese peers, demonstrating a comparatively greater efficiency.
TVA WELL-POSITIONED AGAINST PEERS*
*For information on peer group see "Compensation Setting Process Demonstrates Strong Governance - TVA Competes with Peers for Talent" below
(1)Based on data from the consecutive four quarters ending June 30, 2019 (data source S&P's Capital IQ)
(2)Based on data from the consecutive four quarters ending June 30, 2019 (data source S&P's Capital IQ)
(3)Based on preceding fiscal year end as of October 2019 (data source S&P's Capital IQ)
(4)Estimated as of October 2019 (data source SNL Energy)
(5)As of October 2019 (data source SNL Energy) | | | | | | | | |
| TVA POSITIONING AGAINST PROXY PEERS* | |
| | |
| *TVA's positioning and summary statistics are based on the latest available data at the time the executive compensation review was presented to the People and Governance Committee, October 2022. Data from TVA's 24-company proxy peer group are sourced from S&P Capital IQ. For information on peer group, see Compensation Setting Process – TVA Competes with Peers for Talent below. Notes on TVA Data: (1)Revenue reflects 2021 revenue, normalized (1) for estimated partnership and pandemic credits provided to customers and (2) to reflect TVA's role as a wholesale power provider and its offering of significant services beyond a traditional wholesale utility. This updated methodology best reflects TVA's revenue in comparison to the revenue of its proxy peers. (2)Assets are as of June 30, 2022. (3)Employee count is as of September 30, 2021. (4)Generating capacity is as of March 31, 2022. (5)Customer count is as of March 31, 2022 and represents metered households of LPCs that deliver power to approximately 10 million people of the Tennessee Valley.
| |
Given the nature and scale of its operations, TVA competes with large investor-owned utilities ("IOUs") to attract and retain talent. In fact, over 70 percentAll of TVA's NEOs were formerly employed by IOUs. Additionally, 68 percent of TVA executives thatwho were externally recruited over the last five years are former employees of investor-owned utilities. Three of TVA's five NEOs, including its CEO, were formerly employed by investor-owned utilities.IOUs. TVA's ability to compete with these organizations for talent has yielded success for TVA and its stakeholders.stakeholders, and TVA's competitive pay philosophy is one of the key drivers of success in this area.
Delivering Value Through Superior Performance
TVA's success is measured in terms of value delivered to the businesses, customers, and residents of the Tennessee Valley by providing low-cost energy, maintaining reliable, safe, and efficient infrastructure, investing in the community's economy, and managing and protecting its environmental assets. As shown below,Executing on its strategic priorities, TVA has executed on this objective year after year, makingcontinues to make a positive impact on all of its stakeholders.stakeholders, as shown below. Under the leadership of TVA's NEOs, TVA's employees delivered another year of strong performance improvements – and and achieved or exceeded original 2020 plan objectives – despite the significant challenges arising from the COVID-19 pandemic. nearly all 2023 key performance objectives.
| | | | | |
Value Delivered to Partners and Customers | Low Rates •Residential rates lower than 70 percent of the top 100 U.S. utilities (based on U.S. Energy Information Administration ("EIA") data for CY 2019)
•Industrial rates lower than 90 percent of the top 100 U.S. utilities (based on EIA data for CY 2019)
•Effective wholesale rates held flat, stable, and low for past seven years and through next decade
Reliable Energy
•99.999 percent transmission reliability since 2000
Strong Partnerships
•COVID-19 Pandemic Support
–Made $1.0 billion of credit support available to local power companies ("LPCs")
–Provided regulatory relief and flexibility to LPCs
–Approved a $200 million Pandemic Relief Credit that will apply to service provided to TVA's LPCs, their large commercial and industrial customers, and TVA's directly served customers as a 2.5 percent monthly base rate credit during 2021
–Created Back-to-Business Credit Program with approximately $10 million in incentives to help large customers return to work at pre-pandemic levels
•Returned $163 million in bill credits to local power companies participating in Long-Term Partnership Agreements in 2020
TVA Strength and Stability
•Reduced total financing obligations ("TFO") to $21.4 billion, the lowest level in 30 years
•Organization and operations entirely self-funded since 1999
|
Value Delivered to the Community | Economic Development
•Named Top Utility in Economic Development by Site Selection Magazine for 15th year in a row
•Attracted or allocated more than $45.4 billion in investment into the Tennessee Valley in the last five years, with more than $8.6 billion of that in 2020 alone
•Responsible for approximately 341,000 jobs attracted or retained in the Tennessee Valley in the last five years, with approximately 67,000 of those added in 2020 despite the COVID-19 pandemic headwinds
•Supported rural communities with nearly half of TVA economic development projects tailored to meet the needs of these areas
•Contributed nearly $552 million in tax equivalent payments to states and local governments in 2020 (excluding impacts from tax equivalents related to fuel cost adjustments)
Community Organization Support
•Supported community organizations and education in the Tennessee Valley with more than $3 million in corporate giving and grants
•Distributed more than one million meals to families in need in 2020 through TVA's partnership with Feeding America
COVID-19 Pandemic Support
•Created Community Care Fund that has already provided over $2 million to charitable and community organizations, with an additional $2 million available
National Defense
•Proudly supports national defense efforts and partners with Oak Ridge National Laboratory on cutting-edge research
|
| | | | | |
Value Delivered to Employees | Safety-Focused Operations •Top decile performance in 2020 for both TVA's SeriousRecordable Injury Rate and RecordableSerious Injury Incident Rate based on the most recent data available –One of TVA's best safety performance years on record
•Invested in innovative trend tracking technology and employee engagement and oversight to continuously improve safety performance
|
Pay for Performance •Above target at-risk incentive payouts awarded to employees for achievingmeeting or exceeding nearly all company performance goals in 20202023
|
Inclusive Culture & Recognition •Issued 2022 Diversity, Equity, Inclusion and Accessibility Report |
•2022-2023 Ethisphere® Compliance Leader VerificationTM - recognizing TVA’s best-in-class ethics and compliance program and TVA as first federal agency to receive this designation |
•Supports nine Employee Resource Groups ("ERGs") - launched new ERG, Council for Native Americans, in 2023 |
•2023 Forbes America's Best Employers by State - Ranked asNo. 8 in Tennessee |
•2023 VETS Indexes 5-Star Employer - recognizing organizations doing the most to recruit, hire, retain, develop, and support veterans and the military-connected community |
•2023 Fair360 - Top Companies for Utilities Award - Ranked No. 3; Top Regional Companies - Ranked No. 12 |
•2023 National Organization on Disability – Leading Disability Employer |
•2023 Military Friendly® Supplier Diversity Program - Ranked No. 1; Top 10 Employer for U.S. military veteran supportdesignation four years in the workforce - military veterans comprise nearly 20 percent of the TVA workforcea row •TVA Employee Resource Groups received a 2020 Diversity Impact Award from the Association of ERGs and Councils2023 Military Friendly® Brand - Rank "Designated" •Recognized as a 2020 Leading Disability Employer2023 Military Friendly® Military Spouse Friendly Employers - Ranked No. 7 •2023 Military Friendly® Employers - Ranked on Forbes listNo. 4; veterans represent approximately 17% of America's Best Employers for 2020 and ranked No. 2 employer in TennesseeTVA workforce |
Training and Education •InvestedContinued investing in TVA's employees through training and performance improvement programs COVID-19 Pandemic Support
|
Employee Benefits, Well-being, and Virtual Care •Established TVA Employee Relief Fund to support employees adversely impacted by the COVID-19 pandemicExpanded preventive mental health services and natural disasterstravel benefit •Implemented a Healthy Maternity Program •Enhanced therapy and counseling services |
Strong Labor Partnerships •Employees and contractors are represented by 17 different labor union groups |
•Extended agreements withOne of the Trades and Labor Council for Annual Employees and North America's Building Trades Unions for 10 year periodslargest U.S. contributors to the Helmets to Hardhats program |
Value Delivered to the Public | |
| | | | | |
| Reliable and the Environment | SustainabilityClean Energy
•The TVA transmission grid has operated with 99.999 percent reliability since 2000 |
•Exceeded stretch goal for availability of TVA's coal generation fleet, and exceeded target goals for availability of TVA's nuclear and combined cycle generation fleets |
•$1519.7 billion invested in a cleaner and more diverse energy generation mix since 2013 |
•Contracted additional solar that increased total operatingTop quartile performance among regional industry peers in clean energy (Based on Edison Electric Institute's June 2023 Electric Company Carbon Emissions and contracted capacity approximately 70 percent in 2020Electricity Mix Reporting Database for Corporate Customers) |
•Nearly 50 percent more renewable energy generation than TVA's closest regional peerAchieved commercial operation of three new units at Colbert Combustion Turbine site |
•Increased carbon-free power supply mix to 57 percentTVA Nuclear fleet demonstrated consistent, exemplary, top performance
|
–Browns Ferry Unit 2 exceeded its continuous run record (562 days) and achieved its first breaker-to-breaker continuous run record - 665 consecutive days (February 2023) |
–Sequoyah maintained station performance in top quartile for the entire fiscal year ended September 30, 2020 (nearly 59 percent including the impact of TVA's energy efficiency programs)(based on standard nuclear industry definitions for station performance) •For CY2019, TVA's emissions of carbon dioxide were at a 55 percent reduction from 2005 levels
Power Supply Mix by Source*
*Chart depicts both generated and purchased power within respective resource types. In addition to power supply sources
included here, TVA offers energy efficiency programs that effectively reduced 2020 energy needs by about 2,300 GWh or 1.5%.
•Programs and Partnerships
|
–Exploring grid-scale, battery energy-storage systems, the first of which TVA expectsBrowns Ferry, Sequoyah, and Watts Bar nuclear sites had exemplary performance levels compared to install in eastern Tennessee and expects to store 40 megawatt hours of energy with enough power to run more than 11,000 homes for three hoursindustry peers |
–Established annual carbon reduction awards for top performing and most-improved companies acrossWatts Bar Unit 1 achieved its second breaker-to-breaker continuous run – 496 consecutive days (April 2023). This duration is second to the Tennessee Valleybreaker-to-breaker continuous run record of 512 days (September 2000) –TVA offers green programs in partnership with LPCs which allow businesses and individuals to purchase renewable energy certificates to meet their renewable energy and sustainability goals
•Published first TVA Sustainability Report in 2020
|
Effective Resource Management •Prevented over $9.5An estimated $9.7 billion in potential flood damage averted in the Tennessee Valley and along the Ohio and Mississippi Rivers over TVA's recorded history, with approximately $1.0 billionan estimated $7 million in potential flood damage averted in 2020 despite it being the wettest year on record •Provides both conservation and responsible recreation, and serves as a driver for nearly $12.0 billion of annual economic activity across the Tennessee Valley each yearin 2023
|
•Operates River Forecast Center around the clock, monitoring weather conditions and forecasts, and constantly watching and adjusting the Tennessee River system
|
•Manages the Tennessee River system in an integrated manner, which includes balancing hydroelectric generation, navigation, flood-damage reduction, water quality and supply, and recreation |
•Implementing the Hydro Life Extension Program with a focus on improving the availability and flexibility of the hydroelectric fleet |
|
Public Power Mission Means Exceptional Performance with Conservative | | | | | |
| TVA Strength and Stability •Organization and operations entirely self-funded since 1999
|
•Total Financing Obligations ("TFOs") at September 30, 2023 were among the lowest in over 30 years |
Rates •Residential rates lower than 75 percent of the top 100 U.S. utilities (based on June 2023 12-month rolling average from EIA) •Industrial rates lower than more than 95 percent of the top 100 U.S. utilities (based on June 2023 12-month rolling average from EIA)
|
| |
| Strong Partnerships •COVID-19 Pandemic Support –Continued regulatory relief and flexibility to LPCs through June 30, 2023 |
–In previous years, the TVA Board approved pandemic credits, which were effective for 2021, 2022, and 2023. These credits provided an annual 2.5 percent monthly base rate credit and applied to service provided to TVA's LPCs, their large commercial and industrial customers, and TVA's directly served customers and totaled $225 million and $228 million for 2023 and 2022, respectively |
–Continued support through the Community Care Fund established in 2020 that has already provided over $11 million, with over $2 million provided in 2023, to support local initiatives that address hardships created by the COVID-19 pandemic |
•Returned $199 million in bill credits to LPCs participating in Long-Term Partnership Agreements in 2023 |
Economic Development •Named a Top Utility in Economic Development by Site Selection Magazine for 18th year in a row |
•Efforts continued to help attract and encourage the expansion of business and industries in the Tennessee Valley in 2023 contributing to: –$9.2 billion in projected investments, and –Expect creation/retention of 58,411 jobs (12,276 jobs created; 46,135 jobs retained) |
•Supported rural communities withTVA economic development programs tailored to meet the needs of these areas |
•Provided $611 million in tax equivalent payments in 2023 to state and local governments served by TVA’s energy generation or in areas supporting TVA properties (excluding impacts from tax equivalents related to fuel cost adjustments) |
Community Support •Nearly $11 million donated to organizations across the Tennessee Valley in addition to the Community Care Fund |
•Distributed 1 million meals to families in need in 2023 through TVA's partnership with Feeding America |
•Continued support through the Home Uplift, School Uplift, and Community Centered Growth programs across the Tennessee Valley |
•Through the Connected Communities initiative, TVA established 15 connected communities pilot projects aimed at addressing today's challenges with community-driven information and technology solutions for a modernized energy system. Six community partnerships have also been added to provide consulting services |
| |
| | | | | |
| Sustainability Solutions
|
•Sustainability helps TVA to live its values – those of Safety, Integrity, Inclusion, and Service – and encompasses the following: –Economic Impact – partnering to build the region’s clean energy economy, –Environment – stewarding the region’s resources, –Social – serving people and communities across the region, and –Governance – driving progress through accountability and transparency |
•Issued 2022 Sustainability Report highlighting innovative work and partnerships •Issued 2022 EEI Environmental, Social, and Governance ("ESG")/Sustainability Report •TVA projects and community partnerships supported through biodiversity investments consistent with TVA Board’s Biodiversity Policy |
Energy •Carbon-free power supply mix was 55% percent of TVA's overall power supply for the year ended September 30, 2023 |
•For CY 2022, TVA's mass emissions of carbon dioxide were at a 54 percent reduction and TVA's carbon emission rate was at a 50 percent reduction from 2005 levels
|
|
–Chart depicts both generated and purchased power within respective resource types. In addition to power supply sources included here, TVA offers energy efficiency programs that effectively reduced 2023 energy needs by about 2,100 net cumulative gigawatt hours or 1.3%. TVA sells the renewable energy certificates ("RECs") resulting from some of its purchased power to certain customers |
| •First utility in the nation to successfully obtain approval for an early site permit from the Nuclear Regulatory Commission to potentially construct and operate Small Modular Reactors ("SMRs") at TVA’s Clinch River Nuclear Site •In December 2022, TVA entered into a multi-party collaborative arrangement to further advance the global deployment of SMRs |
| •New Nuclear Program approved by TVA Board in 2022 – up to $200 million to explore advanced reactor technology options – New Nuclear Program provides a systematic roadmap for TVA’s exploration of advanced nuclear technology |
| •Top quartile utility in renewable energy delivered in the Southeast |
| Programs and Partnerships •Pioneering partnerships to develop advanced nuclear technology •TVA offers renewable energy programs, in partnership with LPCs, which allow businesses and individuals to purchase RECs to meet their renewable energy and sustainability goals |
| •TVA has been working with LPCs, state agencies, and third-party charging developers on the creation of the Fast Charge Network for electric vehicles, and in 2022, TVA launched the Fast Charge Network. As of September 30, 2023, 15 sites were complete and operational with 55 additional sites under contract for development |
| •In 2023, TVA began construction on its first TVA-owned, grid scale, lithium-ion demonstration battery project near Vonore, Tennessee |
| National Defense •Supports national defense efforts and partners with Oak Ridge National Laboratory on innovative research |
| |
| | |
|
Strong Performance Furthers TVA's Public Power Mission TVA's workforce performed at a high level in 2023 in managing TVA's extensive, complex operations and delivering on its public power mission. As a result of its high level of performance, TVA achieved nearly all of its performance objectives at target or above for both its annual and long-term incentives for 2023. TVA is a utility company that competes with other utilities - including IOUs - for talent, but since TVA is a mission-based organization, TVA compensates its CEO conservatively relative to its compensation peers. TVA’s benchmarking and compensation-setting process is described below under Compensation Setting Process – TVA Competes with Peers for Talent. TVA generally determines target total direct compensation ("TDC") based on TVA’s relevant labor market. Currently, TVA’s CEO target TDC is below the 50th percentile (median) of 2023 compensation peers. TVA's performance along with its compensation structure results in differentiated value delivered directly to the residents of the Tennessee Valley and reflects a keen focus on TVA's mission of serving those residents. |
|
Notable 2023 Actions
The following are notable plan design changes for 2023:
Plan Changes to Better Align to Market (approved by TVA in 2022 and applicable to performance cycles ending in 2023 and beyond)
Short-Term Incentive ("STI") Plans
As noted above,On May 10, 2022, the CEO approved plan design changes to TVA's workforce has consistently performed atSTI plans, including the Executive Annual Incentive Plan ("EAIP"). The maximum scorecard opportunity increased to 200 percent to remain competitive through better alignment with market practices of TVA’s pay comparator peer group and to reward achievement of stretch performance goals. This change continues to reinforce corporate performance that contributes to TVA’s overall commitment to its stakeholders while maintaining the current plan design maximum payout based on a high levelcombination of scorecard results, a Corporate Multiplier, and an Individual Performance Multiplier. Approved changes now allow positive discretion on the Corporate Multiplier (increased to 1.1), which provides additional consideration for the quality of annual performance results as well as the flexibility to recognize corporate achievements not directly captured in managing TVA's extensive, complex operationsthe scorecard results, and delivering on its public power mission. 2020 was no exceptioncomplements the existing negative discretion currently provided under the EAIP. STI plans despiteinclude the headwinds createdWinning Performance Team Incentive Plan ("WPTIP") for eligible non-executives and the EAIP for eligible executives, including the NEOs. Final awards for the CEO are approved by the COVID-19 pandemic. As a result of its high level of performance, TVA was able to fund annualBoard Chair after obtaining input from Board members and long-term incentives above target for 2020 - at 137 percentconsulting with the People and 129 percent, respectively, of target payout. TVA is a utility company that competes with other utilities - including investor-owned utilities - for talent, but since TVA is a mission-based organization, TVA compensates its executives conservatively relative to its compensation peers. In particular, TVA's CEO is currently compensated below the 25th percentile of 2020 compensation peers. TVA's performance along with its compensation structure results in differentiated value delivered directly to the residents of the Tennessee Valley and reflects a keen focus on TVA's mission of serving those residents.Governance Committee.
Long-Term Incentive Plan ("LTIP")
On May 10, 2022, the CEO approved changes to the LTIP. The maximum scorecard opportunity increased to 200 percent to remain competitive through better alignment with market practices of TVA’s pay comparator peer group and to reward achievement of stretch performance goals.
CEO participation in TVA incentive plans is approved and administered by the Board or its designee.
TVA's Executive Compensation Philosophy
TVA's mission is to serve the people of the Tennessee Valley to make life better. TVA aims to achieve its mission by attracting, retaining, and motivating highly qualified and committed executives to guide the organization's strategy, performance, and public power mission. TVA follows a Compensation Plan as adopted by the TVA Board in accordance with the guidance of the TVA Act.
The Compensation Plan is designed to:
| | | | | | | | |
| | |
| •Provide market-based, competitive compensation levelsso TVA can attract, retain, and motivate highly competent employees. Target total direct compensationTDC generally is determined by considering several factors, including reference to the 50th percentilemedian (50th percentile) of the relevant labor market. Executives may be positioned above or below the median based on labor market scarcityconditions and other factors such as tenure in the role. •Set performance goals that are aligned with TVA's strategic priorities. •Incentivize and reward short-term and long-term performanceby providing a mix of salary and performance-based short-term and long-term incentives.incentives, typically targeting a majority portion of long-term compensation in the form of at-risk, performance-based compensation. •Align performance and productivity improvement at all levels by setting consistent performance goals and objectivesfor all levels of the organization. | |
| | |
The TVA Board follows these requirements of the TVA Act in designing and implementing its Compensation Plan:
•Compensation will be based on an annual survey of benchmark compensation for similar positions in private industry, including engineering and electric energy companies, publicly-owned electric companies, and federal, state, and local governments; and
•Compensation will take into account education, experience, level of responsibility, geographic differences, and retention and recruitment needs.
TVA's Executive Compensation Program Aligns Pay with Performance
Nearly two-thirdsTwo-thirds of the CEO's target direct compensationTDC is performance-based and/orand at risk, based on achievement of performance goals that further advance TVA's mission and strategic objectives. More than half of the other NEOs' target direct compensationTDC opportunity is performance-based and at risk. This alignment of compensation with performance also results in compensation being aligned with value delivered to TVA's stakeholders, including LPCs, businesses, and communities, and to the economy of the Tennessee Valley.
| | | | | | | | |
CEO (LYASH) TARGET DIRECTTDC
COMPENSATION MIX | | OTHER NEO TARGET DIRECTTDC
COMPENSATION MIX |
| |
|
20202023 CEO Target Total Direct Compensation Is Well Below the Peer Median
The TVA Act requiresencourages competitive, market-based executive compensation. Many of TVA's peers, with similarly complex and large-scale operations, are large, investor-owned utilities.IOUs. The TVA Board considers TVA's federal agency status in setting compensation components and pay levels, in both a direct and indirect manner. This is done directly – by incorporating governmentgovernment/non-profit agencies into the executive compensation survey sample used to develop benchmarks, as required by the TVA Act.Act – and indirectly by approving target TDC that was below the 50th percentile (median) of the market composite data. The compensation consultant for the People and Governance Committee (the "Committee") performed a market study in January 2021, which evaluated multiple methodologies and validated TVA’s current methodology for benchmarking CEO compensation.
| | | | | |
CEO 2020
Total Direct Compensation at Target is
below
25The use of benchmarking data is described in detail under Compensation Setting Process – TVA Competes with Peers for Talentth
percentile
of 2020 market composite data
| Although the TVA Board moved Mr. Lyash's pay closer to the median in 2020, its compensation decisions resulted in positioning his pay below the 25th percentile of the 2020 market composite.
The use of benchmarking data is described in detail under "Compensation Setting Process Demonstrates Strong Governance – TVA Competes With Peers For Talent" below.
|
The graphicgraphics below illustrates the variance between 2020illustrate 2023 target total direct compensationTDC for the CEO and the average 20202023 target total direct compensationTDC for the other NEOs andas compared to the 20202023 market composite 25th and 50th (median) and 25th percentiles.
Note
Target market assessment was effective October 2022 and included a market composite of Willis Towers Watson (“WTW”) survey sample and proxy peer group. See Compensation Setting Process — TVA Competes with Peers for Talent — List of Compensation Peer Companies below for a list of companies in the survey sample and proxy peers.
CEO Compensation at a Glance
ACTUAL 2023 TOTAL DIRECT COMPENSATION ("TDC") EARNED - $7,985,860
| | | | | | | | | | | | | | |
ACTUAL 2020 TOTAL DIRECT COMPENSATION EARNED | | | | | |
| | | | | | |
$1,058,000 1,227,000
BASE SALARY | | $2,391,609 1,302,384
ANNUAL PERFORMANCE INCENTIVEAWARD underAt risk, performance-based
Under the Executive Annual Incentive Plan 137 percent of target enterprise ("EAIP"), performance achieved against target was 185 percent, followed by the application of a 0.85 Corporate Multiplier. An Individual Performance Multiplier was then applied at 45 percent.
| | $3,963,176
LONG-TERM PERFORMANCE ("LTP") AWARD(1) 1.10x Individual Multiplier appliedAt risk, performance-based
Under the Long-Term Incentive Plan ("LTIP"), the LTP payout percentage achieved for the three-year performance cycle ended September 30, 2023, was adjusted by TVA's Board from 146 percent to 136 percent. | | $338,000 1,493,300
LONG-TERM RETENTION INCENTIVE
("LTR") AWARD(1)(2) 2020 tranche
Under LTIP, award amount consists of 2020 Long-Term Retention Awardthree 2023 tranches – 2021 LTR award, 2022 LTR award, and 2023 LTR award. |
NoteNotes
(1)Mr. Lyash's long-termLyash was granted an LTP award with a target amount of $2,914,100 effective October 1, 2020, for the 2021-2023 performance cycle.
(2)Mr. Lyash’s LTR incentives earned in 20202023 reflect a partial long-term incentive award. Since Mr. Lyash joined TVA in 2019, he did not vest in any long-term performance award in 2020, and while executives typically have three overlapping retention awards (granted(typically granted annually with ratable vesting over three years subject to continued employment), Mr. Lyash only had one such award outstanding in 2020..
Total Direct CompensationTDC earned reflects theincentive outcomes tied to short- and long-term company performance, along with decisions made by the Committee at the end of 20202023, to reward NEOs for pastthe CEO's individual performance. Under Mr. Lyash'sLyash’s leadership in his first full year as CEO, TVA has made meaningful progress on improving its Public Powerpublic power mission. The company's outperformancecompany’s performance under key operational metrics strengthened TVA'sTVA’s ability to deliver low-cost and reliable energy to the Tennessee Valley. 2020 objectives were established in 2019 and despite challenges presented by the COVID-19 pandemic,
TVA achieved or exceeded nearly all targeted objectives, delivering high operational, safety, and financial strength performance for 2020.
As a result of TVA's 2020 achievements, eligible TVA employees were rewarded with payouts under TVA's annual incentive plans.
| | | | | | | | | | | | | | |
| KEY COMPANY PERFORMANCE METRICS |
| Metric(1) | Target
Performance | Actual
Performance | | Performance Against Target |
TVA Total Spend ($M)(2) | $4,847 | $4,441 | | Exceeded stretch goal |
| Load Not Served (System Minutes) | 3.9 | 2.7 | | Exceeded stretch goal |
| Annualized Nuclear Unit Capability Factor | 90.9 | % | 90.0 | % | | Exceeded threshold goal despite challenges |
| Combined Cycle Equivalent Availability Factor | 77.6 | % | 84.0 | % | | Exceeded target goal |
| Coal Equivalent Availability Factor | 61.8 | % | 79.4 | % | | Exceeded target goal; ahead of 5-year plan for coal fleet |
Notes (1) See "2020 Performance Goals and Performance Achievement" below for further information on each performance metric. (2) Total Non-Fuel Operating and Maintenance, Capital, Non-Fuel Inventory, and Cloud Implementation expenses for corporate and operational Strategic Business Unit organizations (excludes Board of Directors). |
| | | | | | | | | | | |
2020 TARGET TOTAL DIRECT COMPENSATION OPPORTUNITY GRANTED BELOW MARKET |
| |
| | Target Total Direct CompensationTDC opportunity is forward-looking – it represents potential compensation set by the Committee, effective at the beginning of 20202023, to incentivize superior performance. Some of the $6 million$8,757,500 opportunity was earned in 20202023 (salary, annual performance award, and 1/3 of the long-term retentionLTR award) while most will not be earned until future satisfaction of preset performance goals or employment conditions: Mr. Lyash will earn the long-term performanceLTP award component only upon achievement of certain performance targets at the end of the three-year performance period (September 30, 2022)2025), and he will receive the second and third tranches of the long-term retentionLTR award opportunity only upon his continued employment on each of September 30, 20212024 and September 30, 2022.2025. See "20202023 Performance Goals and Performance Achievement"Achievement below for more information on annual and long-term incentives.incentive plans.
There is no minimum payment guaranteed under the annual and long-term performance awards. The amount that he will receive upon the vesting of those awards will be determined at the end of the performance periods and depends on the level of performance against preset performance goals. |
OTHER COMPENSATION
Mr. Lyash was paid $1,092,000 in 2020 as the second tranche of a deferred cash recruitment and relocation incentive award under his employment offer letter. This deferred cash incentive award was intended to compensate him for amounts he forfeited from his previous employer in order to join TVA, as well as to provide some measure of substitute compensation in light of his not being eligible to receive any long-term performance incentive payments until September 2021.
Compensation Setting Process Demonstrates Strong GovernanceKEY COMPANY PERFORMANCE METRICS
The 2023 annual key performance metrics objectives were established in 2022 and, despite challenges presented by long-term U.S. skilled labor shortages, market conditions, and economic development and demand management, TVA exceeded nearly all targeted objectives, delivering strongoperational, overall safety, and financial strength performance for 2023. The LTP performance metrics below were for the 2021-2023 performance cycle. Organizational performance under the 2021-2023 LTP program was strong in achieving several key operational measures, as noted below.
Who Is Involved In | | | | | | | | | | | | | | | | | |
Annual Metric(1) | Target
Performance | Actual
Performance | | Weight | Performance Against Target |
| TVA Total Spend ($M) | $6,560 | $6,168 | | 40% | Exceeded stretch goal |
| Load Not Served (System Minutes) | 3.9 | 3.1 | | 30% | Exceeded stretch goal |
| Annualized Nuclear Online Reliability Loss Factor | 2.00 | % | 1.53 | % | | 15% | Exceeded target goal |
| Combined Cycle Equivalent Availability Factor | 83.6 | % | 83.9 | % | | 10% | Exceeded target goal |
| Coal Equivalent Availability Factor | 63.8 | % | 74.8 | % | | 5% | Exceeded stretch goal |
| | | | | | | | | | | | | | | | | |
LTP Metric(1) | Target
Performance | Actual
Performance | | Weight | Performance Against Target |
| Non-Fuel Delivered Cost of Power | 3.48 | 3.40 | | 45% | Exceeded target goal |
| Load Not Served (System Minutes) | 3.9 | 3.6 | | 30% | Exceeded target goal |
| External Performance Indicators for TVA Nuclear Fleet | 94.9 | 94.1 | | 15% | Above threshold goal |
| Stakeholder Survey | 77.7 | | 81.0 | | | 5% | Exceeded stretch goal |
| Customer Survey | 71.3 | | 70.3 | | | 5% | Above threshold goal |
Note
(1)See 2023 Performance Goals and Performance Achievement below for further information on each performance metric and 2023 results.
Compensation Setting CompensationProcess
The TVA Board, under the authority of the TVA Act, has responsibility for establishing compensation for TVA employees, including the NEOs. The TVA Board is directed under Section 2 of the TVA Act to establish a plan that specifies all compensation (such as salary and any other pay, benefits, incentives, or other form of remuneration) for the CEO and TVA employees.
The TVA Act also provides that:
•Thethat the TVA Board will annually approve all compensation (such as salary and any other pay, benefits, incentives, or other formforms of remuneration) for all managers and technical personnel who report directly to the CEO (including any adjustment(s)adjustments to compensation);
•On the recommendation of the CEO, the TVA Board will approve the salaries of employees whose salaries would be in excess of Level IV of the Executive Schedule of the U.S. Government ($170,800 in 2020); and
•The CEO will determine the salary and benefits of employees whose annual salary is not greater than Level IV of the Executive Schedule ($170,800 in 2020).
Under the authority of the TVA Act, the TVA Board, its People and Performance Committee, (the "Committee"), and individual TVA Board members are involved in compensation matters. The TVA Board has taken the following actions to delegate authority with respect to compensation:
Delegation to Committee
•Responsibility for oversight of executive compensation:compensation pursuant to the Compensation Plan and review of this CD&A.
•TheAuthority to review and make critical recommendations to the Board, as reflected in the chart on the following page.
Delegation to TVA Board has delegated to the TVA Board Chair in consultation with the Committee and with input from individual members of the TVA Board, the authority
•Authority to evaluate and rate the CEO'sCEO’s performance during the year, and the authorityyear.
•Authority to approve any payout to the CEO under the EAIP, based on, among other things, the CEO'sCEO’s evaluated performance during the year.year, in consultation with the Committee and with input from individual members of the TVA Board.
Delegation to CEO
•The TVA Board has authorized the CEOAuthority to set or adjust total target compensation for present or future direct reports within a compensation range of 80 percent to 110 percent of the target total direct compensation, as well asTDC. Additionally, has authority to approve the parameters under which such executives may participate in certainof supplemental compensation and benefit plans, such as TVA's Supplemental Executive Retirement Plan ("SERP"), provided that the CEO may not finally set or adjusttake such compensationactions until the TVA Board members have been notified of the proposed compensationactions and given the opportunity to ask the Committee, or the full TVA Board, to review the proposed compensationactions before it becomesthey become effective.
•The TVA Board has delegated to the CEO, in consultation with the Committee and with input from individual members of the TVA Board, the authorityAuthority to approve the individual performance goals for the CEO's direct reports and the authority to evaluate and rate the performance of the CEO's direct reports during the year against such performance goals.goals, in consultation with the Committee and with input from individual members of the TVA Board.
•The TVA Board has delegatedAuthority to approve, or delegate to others the authority to approve, the salaries and all other compensation of employees whose annual salaries would be in excess of Level IV of the Executive Schedule of the U.S. Government ($183,500 in 2023) for anyone except the CEO and the authorityInspector General.
•Authority to approve, or delegate to others the authority to approve, all personnel and compensation actions for whichthat the TVA Board is responsible but has not reserved for itself.
•The Committee is responsible for oversight of executive compensation pursuant to the Compensation Plan and review of this Compensation Discussion and Analysis.
Role of Compensation Consultant
The Committee engaged the independent consulting firm Frederic W. Cook & Co., Inc. ("FW Cook") in 20202023 to determine the peer group and the benchmarking process and to help evaluate competitive compensation. The Committee assessed certain independence factors and determined the firm's work raised no potential conflict of interest.
Compensation Setting – Annual Roles and Responsibilities
The following chart sets forth the roles of the TVA Board, Board Chair, Committee, and CEO, and typical timeframe, in setting compensation for the NEOs.
| | | | | | | | |
| What | When | How |
| Compensation Governance | Typically AprilJanuary | –•Committee reviews and evaluates independent compensation consultant.
|
| April - May | –•CEO reviews and approves any changes to supplemental compensation plans (i.e., short-term incentive ("STI") and long-term incentive ("LTI") plans).
•Committee reviews TVA Compensation Plan, peer group, and benchmarking process and recommends any changes to the TVA Board. |
Typically August | –•TVA Board reviews and approves any changes.changes to compensation governance.
|
Corporate
Multiplier
(WPTIP/EAIP)Incentive Plan Measures and Goals | TypicallyJanuary - October | –•CEO evaluates and assessesCommittee monitors performance results compared to target goals.
–CEO recommends corporate multiplier (reviewed by the Committee) for TVA Board approval.quarterly.
|
Typically October -
NovemberApril | –•Committee reviews proposed performance measures for next fiscal year ("FY").
|
| July - August | •Committee reviews and recommends to the TVA Board the STI corporate multiplier measures and goals and LTIP measures and goals for upcoming cycles. •CEO sets and approves STI enterprise performance measures and goals for upcoming cycle. •TVA Board.Board approves STI corporate multiplier measures and goals and LTIP performance measures and goals for upcoming cycles. |
Corporate Multiplier ("WPTIP"/"EAIP") | TypicallyOctober - November | –•CEO qualitatively assesses performance compared to target and recommends final payout and corporate multiplier between 0 and 1.1 for the past FY to the Committee and TVA Board.
•Committee reviews and recommends to the TVA Board the corporate multiplier for past FY. •TVA Board reviewsqualitatively assesses performance compared to target to determine final corporate multiplier between 0 and approves.1.1 for past FY. |
Long-Term
Incentive Plan
LTIP"LTP") | Typically October - November | –•CEO evaluatesqualitatively assesses performance compared to target and recommends final LTIP payout percentage (reviewed by Committee) for cycle ending in past FY to the Committee and TVA Board approval.Board.
|
Typically October -
November | –•Committee reviews and recommends LTIP payout percentage.
|
Typically November | –to TVA Board reviews and approves the LTIP payout percentage.percentage for cycle ending in past FY.
–•TVA Board qualitatively assesses performance compared to target to determine final LTIP payout percentage for cycle ending in past FY.
•The TVA Board has the discretionary authority to review the results of performance measures and goals and to approve any adjustments to payouts in appropriate circumstances. |
| Executive Schedule ("ES") Level IV | Typically October -
| –•The listBoard has delegated to the CEO the authority to approve, or delegate to others the authority to approve, the salaries and all other compensation of employees (excluding CEO and Inspector General ("IG")) whose annual salaries would be above ES Level IV is made available to the Committee and other TVA Board members.
–Proposed delegation for the CEO to approve the list is reviewed prior to presentation for TVA Board approval.
|
Typically November | –TVA Board approves, on recommendationin excess of CEO, the salaries of employees (excluding CEO and IG) whose annual salary would be above ES Level IV ($170,800183,500 for 2020).
–Approval of employee list has been delegated annually to CEO (2008 – 2020).
|
CEO
Compensation
Adjustment | Typically October | –Committee reviews the compensation consultant's benchmarking and market analysis report.
–Committee decides whether to recommend compensation adjustments2023) for anyone except the CEO (recommends toand the full TVA Board, if applicable).
|
Typically November | –TVA Board reviews and approves at the November Board meeting, if applicable.
|
CEO Annual
Performance
Goals | Mid-July to
September 30 | –Board Chair reviews and discusses with CEO performance goals for the next fiscal year.
–Board Chair consults with appropriate TVA Board committee.
–Board Chair solicits input from individual TVA Board members.Inspector General.
|
CEO
Performance
Evaluation | September – October- November | –•Individual TVA Board members complete CEO performance assessment and return to Compensation.TVA's Compensation organization.
–•TVA's Compensation organization summarizes comments and information and presents to the Board Chair.
–•Board Chair consults with Committee.
–•Board Chair informs EVP, Chief PeopleHuman Resources and CommunicationsAdministrative Officer, he/she has:
•–Evaluated the CEO's performance, and
•–Determined the EAIP awardaward.
–•Board Chair and Committee Chair jointly inform CEO of his/her performance evaluation.
|
CEO
Compensation
Adjustment | October - November | •Committee reviews the compensation consultant's benchmarking and market analysis report. •Committee decides whether to recommend compensation adjustments for the CEO (recommends to the full TVA Board). •TVA Board reviews and approves at the November TVA Board meeting, if applicable, for the next FY. |
| CEO Executive Annual Incentive Plan ("EAIP") Award | Typically October - November | –•Board Chair obtains input from TVA Board members, consults with Committee, and approves any payout, or adjustments to payout, to the CEO under the EAIP.
–•InformsBoard Chair informs EVP, Chief PeopleHuman Resources and CommunicationsAdministrative Officer, via memo.
|
Compensation Discussion and Analysis ("CD&A")CEO Annual
Performance
Goals | August –October - November | –•CommitteeBoard Chair reviews and recommends inclusion in TVA's Annual Report on Form 10-K.discusses with CEO performance goals for the next FY.
|
•Board Chair consults with appropriate TVA Board committee. •Board Chair solicits input from individual TVA Board members. •Board Chair informs CEO Direct Reports | Typically October | –Committee receives and discusses CEO direct reports' performance report and compensation.of approved goals.
|
CEO Direct Report ("DR")
Compensation | October/October - November | –•CEO determines compensation adjustments for CEO direct reports. The TVA Board has delegated this responsibility to the CEO for the CEO direct reports within an approved range (80-110 percent of market total direct compensation)targeted TDC).
–•CEO reviews CEO direct reportsreports' performance with Committee and informs TVA Board members of compensation adjustments under consideration prior to approving the compensation adjustments.
–•CEO notifies EVP, Chief PeopleHuman Resources and CommunicationsAdministrative Officer, of approved compensation adjustments via memo.
|
Compensation Discussion
and Analysis ("CD&A") | October - November | •Committee reviews and recommends inclusion in TVA's Annual Report on Form 10-K. |
TVA Competes with Peers for Talent
A fundamental goal of TVA's executive compensation program is to attract, retain, and motivate the highly competent talent necessary to manage TVA's complex operations and achieve superior performance. TVA competes for this talent with large investor-owned energy companies,IOUs, and thus TVA needs to offer compensation programs that are competitive with those peers.
Use of Market Data and Benchmarking
TVA generally determines target total direct compensationTDC for executives based on the relevant labor market. After compiling market compensation for the positions at the beginning of 2020,2023, the Committee, with assistance from FW Cook, used the information to:
•Assess target compensation level and incentive opportunity competitiveness; and
•Determine appropriate target compensation levels and incentive opportunities to maintain the desired degree of market competitiveness, taking into considerationwhile also considering other factors, such as executive experience, skill set, performance, and internal parity.
The relevant labor market for most of TVA's executives, including the NEOs, consists of both private and publicly-owned companies in the energy services industry that have similar revenue and scope as TVA. Each year, the TVA Board'sCommittee's compensation consultant recommends a peer group for approval by the Committee. For 20202023 compensation opportunities, TVA's market data was determined based on a review of executive compensation survey data and proxy peer group data.data from public filings. For the survey-based analysis, TVA referenced a sample from the 20192022 Willis Towers Watson Energy Services Executive Compensation Database consisting of (i) 27 investor-owned utilities32 IOUs with revenuesrevenue greater than or equal to $3.0 billion plus (ii) four11 additional government entities.government/non-profit entities with revenue greater or equal to $1.0 billion. Data from this sample were further regressed to TVA's size based on revenue. For NEO roles, the survey analysis was supplemented with public compensation data from a separate proxy peer group of investor-owned utilities.IOUs. The Committee reviews the proxy peers annually to ensure continued appropriateness, including comparable business content and model, company size measured primarily by revenue and assets, and other refining factors such as generating capacity, number of employees, and number of customers. When making compensation decisions for 2020,2023, the Committee reviewed proxy peer group size data, which is shown below. At that time, TVA was centrally-positionedcentrally positioned within the current proxy peer group:group; the primary financial metrics, revenue and assets, arewere positioned near theclose to median while secondary metrics arewere balanced, with generating capacity above the 75th percentile, customersemployee count between the 25th percentile and median, and customer count near the 75th percentile, and employee count near the 25th percentile.
| | | | | | | | | | | | | | |
TVA REVENUE VS
PEERS(1) ($MMs)(in millions)
| TVA ASSETS VS
PEERS(2) ($MMs)(in millions)
| GENGENERATION CAPACITY VS
PEERS(3)
(000sin thousand MW) | TVA EMPLOYEE
COUNT VS PEERS(4) | TVALPC CUSTOMER COUNT VS PEERS(5)
(000s)(in thousands)
|
| | | | |
| | | | |
TVA's positioning and summary statistics are based on the latest available data at the time the executive compensation review was presented to the People and Governance Committee, October 2022. Data from TVA's 24-company proxy peer group are sourced from S&P Capital IQ. For information on peer group, see List of Compensation Peer Companies below.
Notes on TVA Data:
(1)Based on data fromRevenue reflects 2021 revenue, normalized (1) for estimated partnership and pandemic credits provided to customers and (2) to reflect TVA's role as a wholesale power provider and its offering of significant services beyond a traditional wholesale utility. This updated methodology best reflects TVA's revenue in comparison to the consecutive four quarters ending June 30, 2019 (data source S&P's Capital IQ)revenue of its proxy peers.
(2)Based on data from the consecutive four quarters endingAssets are as of June 30, 2019 (data source S&P's Capital IQ)2022.
(3)Based on preceding fiscal year endGenerating capacity is as of October 2019 (data source S&P's Capital IQ)March 31, 2022.
(4)EstimatedEmployee count is as of October 2019 (data source SNL Energy)September 30, 2021.
(5)AsCustomer count is as of October 2019 (data source SNL Energy)March 31, 2022 and represents metered households of LPCs that deliver power to approximately 10 million people of the Tennessee Valley.
For executives with both proxy and survey benchmarks, competitive comparisons were made relative to a "market composite", or an average of the survey and proxy data.
List of Compensation Peer Companies
The following chart outlines the companies that constituted the survey sample and proxy peer group used to benchmark NEO compensation for 2020:
| | | | | | | | | | | | |
| Company | Investor Owned Utilities
with Revenue Greater
thanThan or Equal to $3.0 Billion
Which Participated in
20192022 Willis Towers
Watson Energy Services
Survey | GovernmentGovernment/Non-Profit Entities with Revenue Greater Than or Equal to $1.0 Billion
Which Participated in
20192022 Willis Towers
Watson Energy Services
Survey | Proxy Peer Group
of Investor Owned
Utilities | |
AES Corp.Corporation | n | | n | |
| Alliant Energy Corporation | n | | | |
| Ameren Corporation | n | | n | |
American Electric Power Co.,Company, Inc. | n | | n | |
| CenterPoint Energy, Inc. | n | | n | |
CMS Energy Corp.Corporation | n | | n | |
| Consolidated Edison, Inc. | n | | n | |
| Constellation Energy Corporation | n | | | |
| CPS Energy | | n | | |
| Dominion Energy, Inc. | n | | n | |
DTE Energy Co.Company | n | | n | |
Duke Energy Corp.Corporation | n | | n | |
| Edison International | n | | n | |
Energy NorthwestEntergy Corporation | n | | n | |
Entergy Corp.Evergy, Inc. | n | | n |
Evergy | n | | |
| Eversource Energy | n | | n | |
Exelon Corp.Corporation | n | | n | |
| FirstEnergy Corp. | n | | n | |
| Great River Energy | | n | | |
| JEA | | n | | |
| LG&E and KU Energy LLC | n | | | |
| Lower Colorado River Authority | | n | | |
| Nebraska Public Power District | | n | | |
| New York Power Authority | | n | | |
| NextEra Energy, Inc. | n | | n | |
| NiSource, Inc. | n | | n | |
| NRG Energy, Inc. | n | | n | |
| Oak Ridge National Laboratory | | n | | |
| Oncor Electric Delivery Company LLC | n | | | n |
| Omaha Public Power | | n | | |
Pacific Gas and Electric Co.Company | n | | n | |
| Pinnacle West Capital Corporation | n | | | |
PPL Corp.Corporation | n | | n | |
| Public Service Enterprise Group Inc. | n | | n | |
| Puget Sound Energy, Inc. | n | | | |
| Salt River Project | | n | | |
| Santee Cooper | | n | | |
| Sempra Energy | n | | n | |
| Southern Company | n | | n | |
Southern CompanyTri-State Generation and Transmission | | n | | |
| Vistra Corp. | n | | n | |
VistraWEC Energy Group, Inc. | n | | | |
| Xcel Energy, Inc. | n | | n |
WEC Energy | n | | |
Xcel Energy | n | | n |
Assessment of Risk
TVA's Enterprise Risk Management Organization,organization, in coordination with other members of TVA's management, including Human ResourcesTotal Rewards, Digital Solutions and Total Rewards,Data, conducts an annual assessment of enterprise levelenterprise-level risks which includes consideringincluding risks arising from TVA's compensation policies and practices, in order to identify any risks that are reasonably likely to have a material adverse effect on the organization and its achievement of its strategic goals and objectives.
Based on the results of this assessment, no risks were identified with the compensation policies and practices that are reasonably likely to have a material adverse effect on TVA'sthe organization and its achievement of its strategic goals and objectives.
20202023 Executive Compensation Program Components
Total Direct Compensation
In setting executive compensation each year, the Committee focuses on Total Direct Compensation ("TDC"),TDC, which includes those compensation elements that incentivize future performance or reward past performance. TDC is comprised of annual salary, annual incentive award under the Executive Annual Incentive Plan ("EAIP"), Long-Term Performance ("LTP")EAIP, LTP award under the LTIP, and Long-Term Retention ("LTR") award.
Each year, two key compensation decisions are made with respect to NEO compensation: (1) the amount of the TDC opportunity to grant, which is forward-looking, incentivizes the NEO to perform, and is determined towardstoward the beginning of the fiscal year, and (2) the amount of TDC earned, which rewards the NEO for prior performance and (other than salary)salary or LTR award) is determined at the end of the year. The TDC components and weightings for TDC opportunities granted to the NEOs in 20202023 are summarized below and described in the sections that follow. Since TVA is a governmental entity that issues no equity, all direct compensation is denominated and paid out in cash.
| | | | | | | | |
Compensation Component
And % of Target Total
Direct CompensationTDC | Objective | Key Features |
Annual Salary | Provides fixed base level of compensation to executives to encourage hiring and retention of qualified individuals | •Annual salary is typically determined by reference toconsidering, among other things, the median (50th percentile) for similar positions at other companies in TVA's peer group orgroup; above the median (50th to 75th percentile) for positions affected by market scarcity, recruitment and retention issues, and other business reasons; or below median due to incumbent experience, position scope, or other business reasons. •Typically reviewed annually to consider changes in benchmark salaries and/or exceptional individual merit performances. |
Executive Annual Incentive Plan (EAIP) | Incentivizes performance by providing at-risk compensation tied to attainment of pre-established performance goals for the fiscal year | •Annual incentive payouts are based on the results of enterprise goals as determined from year to year by the TVA Board or the CEO, as applicable. Annual incentive payouts may be impacted by a corporate multiplier or adjusted by the TVA Board or CEO, as applicable, based on the evaluation of performance during the year. •Target annual incentive opportunities increase with position and responsibility and are based in part on the opportunities other companies in TVA's peer group provide to those in similar positions. •Typically reviewed annually to consider changes in benchmark annual incentives. |
| Long-Term Incentive Plan (LTIP) | | •Participation is limited to key positions that have the ability to significantly impact the long-term financial and/or operational objectives critical to TVA's overall success. •LTP awards are granted annually with a three-year vestingperformance cycle. Awards are variable at-risk opportunities based on achievement against performance goals established at the beginning of the three-year performance period. •The Committee's policy is for approximately 70 to 80 percenta majority of each executive's total long-term incentive opportunity to be in the form of performance-based awards, with the remaining percent to be retention oriented. •LTR awards may be granted annually and will vest and pay out in three equal increments annually over three years, subject to the participant being employed through such dates, but are payable upon death, disability, or disabilityretirement if earlier on a pro-rated basis. •Since TVA issues no equity, TVA offers retention awards to be competitive with the industry marketplace for talent, providing a retention incentive similar to restricted stock or restricted stock units. These grants are intended to encourage executives to remain with TVA and to provide, in combination with salary, EAIP, and LTP grants, a competitive level of total direct compensation. •The Committee's policy is for approximately 20 to 30 percent of each executive's total long-term incentive opportunity be retention-oriented.TDC.
|
Long-Term Performance Award (LTP) | Incentivizes performance by providing at-risk compensation tied to attainment of pre-established performance goals over a three-year performance period |
Long-Term Retention Award (LTR) | Incentivizes retention by providing retention-based grants that are tied to a three-year vesting schedule |
Setting Competitive Compensation Amounts and Opportunities Relevant to Labor Market
Salary
Annual salary is determined by reference to median (50th percentile) for similar positions at other companies in TVA's peer group. Reference above the median (50th to 75th percentile) may be used for positions affected by market scarcity, recruitment and retention issues, and other business reasons.considered a "fixed" compensation component. Salary levels are typically reviewed annually to consider changes in benchmark salaries and/or exceptional individual merit performances.
Incentive Opportunities
The annual and long-term incentive opportunities for the NEOs are set at levels that (i) are competitive with the relevant labor market, with target total direct compensationTDC generally determined by reference toconsidering the 50th percentile of the relevant labor market, and (ii) result in approximately 70 to 80 percenta majority of each executive's total long-term incentive opportunity in the form of performance-based awards and approximately 20 to 30the remaining percent of each executive's total long-term incentive opportunity in the form of retention awards. More than half of TVA's NEO's target TDC opportunity is performance-based and at-risk as described above in TVA's Executive Compensation Program Aligns Pay with Performance.
Long-term incentive awards are intended to provide a similar pay component as equity-based compensation at peer investor-owned utilities.IOUs. Since TVA does not issue equity, the compensation program cannot provide a component similar to equity awards that capture long-term value, reflect the continuing efforts of executives, and have the potential for significant appreciation.gains or losses, based on market fluctuations. As a result, TVA's long-term incentives are not necessarily intended to match market pay levels.
Target annual incentive opportunities increase with position scope and responsibility to hold management accountable for delivery of results and are based in part on the opportunities other companies in TVA's peer group provide to those in similar positions. Incentive opportunities are typically reviewed annually to consider changes in benchmark annual and long-term incentives. The Committee reviews peer benchmark information by position for each component of pay as well as for overall total direct compensation.
Non-Direct Compensation Elements
Other Compensation
To recruit high-quality talent, TVA may offer recruitment awards as well as relocation assistance and reimbursement. These types of deferred cash incentive awards are intended to compensate the individuals for amounts they may have forfeited from their previous employer in order to join TVA and/or provide substitute compensation when the individual is not eligible to receive certain incentive payments until a future date.
In July 2023, Mr. Moul received the third and final installment of a deferred cash recruitment and relocation incentive in the amount of $100,000 that was part of his 2021 employment offer. In 2023, Mr. Moul received an additional $110,182 in relocation benefits as reported in the Executive Compensation Tables and Narrative Disclosures – Summary Compensation Table under "All Other Compensation".
Executive Severance Plan
TVA has established an Executive Severance Plan to provide additional benefits to certain executives if TVA terminates the employment of covered executives other than for Gross Misconduct or such executives terminate for Good Reason. See Executive Compensation Tables and Narrative Disclosures - Executive Severance Plan below for additional information regarding the benefits available to covered executives under the Executive Severance Plan as well as definitions of Gross Misconduct and Good Reason.
Retirement Benefits
TVA provides its NEOs with retirement benefits through its qualified plans as well as through a non-qualified supplemental executive retirement plan ("SERP") in order to provide compensation beginning with retirement or termination of employment (if vesting requirements are satisfied), with enhanced compensation for certain executives to provide an additional incentive for hiring and retention of qualified individuals.
TVA sponsors a qualified defined benefit plan ("pension plan") and a qualified defined contribution plan ("401(k) plan"), which are administered by the TVA Retirement System ("TVARS"). The availability of, and level of benefits provided by, these qualified plans are comparable to similar qualified plans provided by companies in TVA's peer group.
In addition to its qualified retirement plans, TVA has a SERP for selected executives who are critical to the ongoing success of the enterprise. TVA's SERP is a non-qualified plan that provides supplemental pensionretirement benefits at compensation levels that are higher than the limits specified by IRSInternal Revenue Service ("IRS") regulations for qualified pensionretirement plans. The provision of such non-qualified plans to executives is a common practice among companies in TVA's peer group. The purpose of the SERP is to:
•Provide a competitive retirement benefit level that cannot be delivered solely through TVA's qualified retirement plans due to Internal Revenue Service ("IRS")IRS limitations, and
•Provide a benefit level (as a percentage replacement of pre-retirement pay) that is more comparable to that of employees who are not subject to the IRS limitations.
More information regarding these retirement benefits is found following the Pension Benefits Table.
Health and Other Benefits
TVA offers a group of health and other benefits (medical, dental, vision, life and accidental death and disability insurance, and long-term disability insurance) that are available to a broad group of employees. The NEOs are eligible to participate in TVA's health benefit plans and other non-retirement benefit plans on the same terms and at the same contribution rates as other TVA employees.
In order to recruit high-quality talent, TVA may offer recruitment and sign-on bonuses as well as relocation assistance and reimbursement. In 2020, Mr. Lyash received the second of three annual installments of a recruitment and relocation incentive that was part of his employment offer. This incentive, which was intended in part to compensate Mr. Lyash for forfeited
compensation from his prior employer, vests and is payable as long as Mr. Lyash remains employed by TVA on the applicable vesting dates. The second and largest installment was paid to Mr. Lyash on September 30, 2020, in the amount of $1,092,000.
Mr. Rausch earned $350,000 in 2020 pursuant to the Performance Incentive Arrangement award opportunity that was granted to him in connection with his employment agreement in 2018. The award opportunity was granted in order to compensate Mr. Rausch for incentive awards forfeited upon joining TVA but were payable subject to the CEO's evaluation of Mr. Rausch's performance. In 2020, Mr. Rausch also earned the second and final $100,000 payment of a recruitment and relocation incentive that was a part of his employment offer. More details regarding these payments are set forth in Mr. Rausch's compensation scorecard under "2020 Pay Decisions – 2020 NEO Pay Decisions and Compensation Scorecards" below.
20202023 Performance Goals and Performance Achievement
A significant portion of each NEO's compensation is based on company performance and influenced by individual performance achievements. As a result, a majority of NEO compensation is at-risk, providing incentive for the executive to achieve superior performance for TVA and for the businesses, communities, and residents it serves, both in the short term and in the years to come.
Incentive compensation is provided to NEOs under the Executive Annual Incentive Plan ("EAIP") and the Long-Term Incentive Plan ("LTIP"). | | | | | | | | | | | | | | |
| | Strategic Priorities | | Incentive Compensation Metrics* |
A significant portion of each NEO's compensation is based on company performance and influenced by individual performance achievements. As a result, a majority of NEO compensation is at-risk, providing incentive for the executive to achieve superior performance for TVA and for the businesses, communities, and residents it serves, both in the short term and in the years to come. Incentive compensation is provided to NEOs under the EAIP and LTIP. Each incentive award is described below. | | People
Advantage Amplifying the energy, passion, and creativity within each TVA employee | | Safety - Serious Injury Incident Rate ("SIIR") |
| Operational Excellence Building on TVA's best-in-class reputation for reliable service and competitively priced power | | Load Not Served Annualized Nuclear Online Reliability Loss Factor Combined Cycle Equivalent Availability Factor Coal Equivalent Availability Factor External Performance Indicators for the TVA Nuclear Fleet |
| Financial Strength Investing in the future, while keeping energy costs as low as possible | | Total Financing Obligations Operating Cash Flow Net Income Total Spend Non-Fuel Delivered Cost of Power |
| Powerful Partnerships Promoting progress through the shared success of TVA's customers and stakeholders | | Jobs Created and Retained Stakeholder Survey Customer Survey
|
| Igniting Innovation Pursuing innovative solutions for TVA and its customers and communities | | |
*Incentive compensation metrics are further described below in 2023 Incentive Plan Performance Metrics and Long-Term Performance Awards.
Executive Annual Incentive Plan
All TVA employees participate in an annual incentive program (subject to eligibility requirements), since every employee contributes to the success of TVA and the execution of its Public Powerpublic power mission. While the metrics used for annual incentives are the same for all employees, they are provided under two plans: the Winning Performance Team Incentive Plan ("WPTIP")WPTIP provides for annual incentive awards for eligible non-executives, and the EAIP provides for annual incentive awards for eligible executives, including the NEOs.
The EAIP is designed to encourage and reward executives for successfully achieving annual financial and operational goals. For 2020,2023, each NEO's annual incentive payment was calculated as follows:
| | | | | | | | | | | | | | | | | | | | | | | | | | | | | | | | |
EAIP
Amount | = | Annual
Salary | × | Annual Target
Incentive
Opportunity | × | Percent of
Scorecard
Opportunity
Achieved
(0% to 150%200%) | × | Corporate
Multiplier
(0 to 1.00)1.1) | × | Individual
Performance
Multiplier
(0% to 150%) |
Each component of this calculation is discussed below (except for annual salary, which is discussed above). The award for certain participants in the WPTIP and the EAIP may be adjusted by the participant's supervisor based on an evaluation of the participant's individual achievements and performance during the year. In addition, pursuant to discretion granted under the TVA Compensation Plan, awards may be further adjusted by the TVA Board or the CEO (1) as a result of any unusual or nonrecurring event affecting TVA or the financial statements of TVA, or (2) as a result of changes in business conditions or the business strategy of TVA. There is no guaranteed minimum payout under the EAIP or WPTIP, and the maximum payout for either plan cannot exceed 225 percent of the target award.
Annual Target Incentive Opportunity
TheFollowing a review of benchmarking and individual performance, the TVA Board evaluated the appropriateness of the EAIP award opportunity for the CEO based on market data and Mr. Lyashother individual factors and made no changes for 2023. Similarly, the CEO evaluated the appropriateness of the EAIP award opportunities for the CEOother NEOs based on market data and other NEOs, respectively,individual factors, including internal parity, and made no changes for 2020.2023. Accordingly, target EAIP award opportunities of the NEOs for 20202023 were as follows:
| | | | | |
| Named Executive Officers | 20202023 Target
Annual Incentive Opportunity(1) |
| Mr. Lyash | 150 | % |
| Mr. Thomas | 80 | % |
Mr. SkaggsMoul | 80 | % |
Ms. QuirkMr. Rausch | 70 | % |
Mr. RauschFountain | 70 | % |
| |
Note
(1)Represents a percent of each NEO's annual salary.
20202023 Incentive Plan Performance Metrics
The metrics used to measure performance under the WPTIP and EAIP are the same for all TVA employees. These metrics tie directly to key enterprise metrics used by senior management in its annual budget and strategic planning process, which in turn tie directly to the achievement of TVA's strategic objectives and mission. The 20202023 WPTIP and EAIP metrics and goals were set out in an organizational scorecard ("TVA Enterprise Scorecard") applicable to all employees. The 20202023 performance measures, along with the weighting ascribed to each, are shown below as a percentage of the total WPTIP/EAIP award opportunity at target-level performance.
| | | | | | | | | | | | | | | | | |
| | | | | |
20202023 WPTIP/EAIP METRICS
| | | The 20202023 WPTIP/EAIP metrics are described in detail below. |
| | | TVA Total SpendingSpend What this measures: TVA's ability to keep costs low Total Non-Fuel Operating and Maintenance, Capital, Non-Fuel Inventory, and cloudCloud Implementation expenses for corporate and operational Strategic Business Unit organizations (excludes Board of Directors). | Why Is This Metric Used? Supports the overall TVA goal of maintaining costs and managing rates based on spending levels approved by TVA management and the TVA Board. |
| | | | |
| | | | |
| | | Load Not Served What this measures: Transmission system outages that affect TVA customers Load Not Served ("LNS") is a measure of the magnitude and duration of transmission system outages that affect TVA customers expressed in System Minutes.system minutes. An automatic customer interruption with a duration of one minute or greater is tracked as an LNS event. LNS events caused by TVA on a distributor system will also count as a TVA event even if the TVA system remains energized. LNS excludesevents exclude interruptions due to declared Major Events, Variances, Gunfire, Vandalism,major events, variances, gunfire, vandalism, and verified Tornadoes.tornadoes. | Why Is This Metric Used? An automatic customer interruption with a duration of one minute or greater is tracked as a LNS event. We manageTVA manages this critical indicator to reduce the impact of customer outages.
|
| | | | |
| | | | |
| | | | |
| | | Annualized Nuclear Unit CapabilityOnline Reliability Loss Factor What this measures: Nuclear plant availability Annualized Nuclear Unit CapabilityOnline Reliability Loss Factor is the 12-month ratio of available energyall generation which excludes events outside of management control, over a given period of timelosses (minus refueling outage (“RFO”) and exempt losses) to the reference energy generation over the same time period.(minus RFO and exempt losses) in a normal fuel cycle period, per external standard nuclear industry guidelines.
| Why Is This Metric Used? Monitors progress in attainingperformance between refueling outages to obtain high unit and energy production reliability. |
| | | | | |
| | | | |
| | | Combined Cycle Equivalent Availability Factor What this measures: Combined cycle plant reliability Combined Cycle Equivalent Availability Factor ("EAF") reflects the percentage of time over a given period that a generating unit was available to generate powerelectricity for TVATVA-operated combined cycle generating assets, based on Generating Availability Data System ("GADS") event reporting guidelines for megawatt hour losses. Combined Cycle EAF excludes events classified as outside management control and variances. | Why Is This Metric Used? Combined Cycle EAF focuses on ensuring TVA combined cycle generating assets are available and reliable to meet system demand. |
| | | | | |
| | | | | |
| | | | Coal Equivalent Availability Factor What this measures: Coal plant reliability Coal EAF reflects the percentage of time over a given period that a generating unit was available to generate powerelectricity for TVA coal-firedcoal generating assets, based on GADS event reporting guidelines for megawatt hour losses. Coal EAF excludes events classified as outside management control and variances. | Why Is This Metric Used? Coal EAF focuses on ensuring TVA coal generating assets are available and reliable to meet system demand. |
| | | | | |
| | | | | |
In setting the goal for each metric, consideration is given to TVA's historic performance, its strategic business plan priorities and strategic benchmarking goals, customer and stakeholder feedback, environmental and regulatory concerns and goals, and the competitive environment. Achievement of the target goal would result in a 100 percent payout with respect to that goal. A threshold goal is also set for each metric, so that no payout would occur with respect to metrics that fail to achieve that threshold. Additionally, a stretch goal for each metric is set to incentivize and reward exceptional performance. Linear interpolation is used for results between threshold and stretch goals.
20202023 Executive Annual Incentive Plan Results
The performance results on the 20202023 TVA Enterprise Scorecard are set forth below. Performance resulted inreflects a 137185 percent payout (onopportunity achieved against target (on a scale from 0 percent – 150 percent payout).
- 200 percent),
TVA'S 2020followed by the application of the EAIP PERFORMANCE
Corporate Multiplier, 0.85
Note
(1) The TVA Enterprise Scorecard sets forth the performance goals applicable to the WPTIP and the EAIP.
Corporate Multiplier Allows TVA Board to Adjust for Overall Performance
| | | | | | | | | | | | | | |
As in previous years, the TVA Board approved the use of a corporate multiplier for the 2020 Winning Performance/EAIP program.2023 EAIP. The corporate multiplier ranges between 0 and 1.0x and can be used only for purposes of reducing the amount of the award. For 2020, the TVA Board determined that the corporate1.1. The multiplier should be 1.0xwas based on the following: •Industry-leading safety performance in 2023 against goals set in May 2022 for six organizational metrics, and following are key highlights for this performance period:
•Continued overall strong fiscal responsibility, including reducing debt to the lowest level in three decadessafety performance, while also acknowledging an employee fatality – 2023 SIIR remains top decile, based on most recent data available •Financial health and achieving long-rangeperformance – continued strong financial performance with TFO goal three years ahead of planexceeding stretch; Net income exceeding target; and Operating Cash Flow exceeding threshold and below target •Restored service safelyJobs created and efficiently after two major tornadoesjobs retained – 2023 efforts continued to help attract and averted major flooding during third straight yearencourage the expansion of historic rainfall totalsbusiness and industries –$9.2 billion in projected investments, and –Expected creation/retention of 58,411 jobs (12,276 jobs created and 46,135 jobs retained) •Strengthened customer relationships, including 93 percentOverall performance – strong performance with record–setting results across a broad range of LPCs signing 20-year Partnership Agreements with TVAmetrics while also acknowledging the events of Winter Storm Elliott and $163 million in savings returned to local power company partners through a wholesale bill credit •an employee fatalityAchieved outstanding results despite unprecedented challenges associated with the COVID-19 pandemic
| | | | |
| | Why does the TVA Board
use a multiplier? |
|
| | | |
| | The multiplier allows the TVA Board to qualitatively assess the organization's performance, emphasizing the importance of safety, financial health, reputation, and economic development. | |
|
|
|
Corporate Multiplier Factors
| | | | | | | | | | | |
| Metric | Definition | Why Is This Metric Used? |
Safety – Serious
Injury Incident Rate (SIIR)
("SIIR") | A mathematical calculation used by Edison Electric Institute that quantifies the extent of injury for serious injuries and fatalities from events within the control of the employee and/or the employer. | TVA shares a professional and personal commitment to protect the safety of its employees, its contractors, its customers, and those in communities that TVA serves. |
| Total Financing Obligations (TFO)("TFO") | All statutoryTFO is calculated by subtracting unbudgeted contributions to unfunded liabilities from the sum of (1) long-term debt (including unamortized premiums/discounts), (2) short-term debt, (3) leaseback obligations, (4) energy prepayment obligations, and other financing obligations.(5) variable interest entities. | TVA's TFOs are driven by its business plan and reflectsreflect the application of sound financial guiding principles. Focusing on this measure will improve TVA's fiscal performance and strengthen TVA's balance sheet. |
Operating Cash Flow from Operating Activities | Amount of cash generated from power production and other mission-related activities and generally defined as Operating Revenuesoperating revenues received less cash payments made for Operating Expenses.operating expenses. See Part II, Item 8, Financial Statements and Supplementary Data – Consolidated Statements of Cash Flows for additional information. | Operating Cash Flow from Operating Activities is considered a key indicator of overall financial health as it measures TVA's ability to use cash received from customers to sufficiently fund outgoing cash expenditures. |
| Net Income | NetConsists of the entity’s net earnings derived by adjusting revenues for the cost of doing business.business, including the cost of sales, depreciation, interest, taxes, and other expenses. See Part II, Item 8, Financial Statements and Supplementary Data – Consolidated Statements of Operations for additional information.
| StandardNet income is a standard accounting measure that provides a view of TVA's financial performance and position. |
Jobs Created and Jobs Retained(1) | Measures the number of new or retained jobs in the Tennessee Valley for which TVA has played a role in the recruitment or retention of the economic development project. | Tracks its progress using an industry standard measure. Jobs Created and Retained is aan industry standard measure that economic developers can speak to and easily understand, and provides an established tracking mechanism is in place to measure TVA's economic development efforts. |
| Board Level Significant Events | Includes items deemed significant by the TVA Board of Directors. These items may affect TVA's reputation with its customers and its stakeholders, the organizational health of the workforce, or its impact on the public at large. Both favorable and unfavorable events will be considered. | An incentive pay program, by design, cannot cover the entire scope of activities that could occur during a given cycle. This measure allows the TVA Board to deem certain reputational, environmental, or other items as significant impacts to TVA's business. Items that may be considered significant (either favorably or unfavorably) include customer survey results, stakeholder survey results, key indicators of organizational health, environmental events, or other major events not covered in other performance measures. |
Note
(1) "Jobs created" in the TVA fiscal year are newly created, paid positions at a facility of a TVA customer, meaning any entity that purchases power from TVA or its distributor. "Jobs retained" are paid positions at a facility of a TVA customer that were created prior to the current TVA fiscal year and that continue to be filled in the current TVA fiscal year. See Part I, Item I, Business — Economic Development Activities for additional information.
Based on the performance of the 2020 corporate multiplier measures, the TVA Board determined to apply a 1.0x multiplier, or no reduction to the calculated Winning Performance/EAIP payout.
2023 CORPORATE MULTIPLIER MEASURES (0.0 – 1.0x1.1 MULTIPLIER)
Note
(1)Includes impact of partnership credits. Partnership credits are wholesale bill credits provided to local power companyLPC customers who are party to 20-yearhave signed long-term Partnership Agreements with TVA. For more information, see Part I, Item 1, Business — RatesCustomers.
Individual Performance Multiplier Reinforces Pay for Performance
Annually, individual goals for the NEOs are established at the beginning of each performance cycle. These goals tie to the achievement of TVA's mission and strategic objectives. A 50 percent weighting is assigned to business goals, and a 50 percent weighting is assigned to leadership competencies. No numerical measures are assigned to the goals. Rather, at the end of the performance period, the CEO assesses the performance of the other NEOs and informs the Committee of his decision on a multiplier for each NEO. For the CEO Individual Performance Multiplier, each TVA Board member assesses the CEO's performance at the end of a performance period on a scale of 1–5, with "5" representing superior performance. Results of the assessment are provided to the TVA Board Chair who, after consultation with the Committee, and with input from individual Board members, determines the multiplier to be applied to the CEO.
For 2020,2023, the NEOs were evaluated on individual performance goals and the following leadership competencies:
| | | | | | | | | | | |
Leadership Competencies | | |
Inspiring Trust and
| Continuous Improvement | Vision, Innovation, & Strategic Execution | Leadership Courage | Building Organizational Talent |
Accountability and Driving
| Adaptability | Business Acumen | Effective Communication |
| Building Organizational Talent | Leveraging Diversity | |
The 20202023 individual multipliers and award payouts to the NEOs under the 20202023 EAIP are described under each executive's compensation scorecard under "20202023 Pay Decisions - 2020— 2023 NEO Pay Decisions and Compensation Scorecards" below andScorecards below. Award
payouts are also reported in the "Non-Equity Incentive Plan Compensation" column in the Executive Compensation Tables and Narrative Disclosures —Summary Compensation Table.
Long-Term Incentive Plan ("LTIP") Compensation
CertainTVA executives, in critical positions, including the NEOs, participate in the company's long-term compensation plans.LTIP. These individuals make decisions that significantly influence the development and execution of TVA's long-term strategic objectives. As such, awards under TVA's Long-Term Incentive PlanLTIP are designed to reward executives for sustainable success. Since long-term success is supported by a commitment to continued employment, the NEOs are incentivized to remain with the company through the cliff vesting feature of the long-term performanceLTP awards and through long-term retention awards.
| | | | | | | | | | | |
| | | |
| LONG-TERM AWARDS REWARD LONG-TERM SUCCESS | | | LONG-TERM INCENTIVE AWARDS |
| | | |
•Enterprise-wide performance criteria that are directly aligned with TVA's mission •"Cumulative" performance approach to measure performance achieved over a three-year period with a new three-year performance cycle beginning each year •Potential payment range of 0 percent to 150200 percent of target incentive opportunity to enable awards that are commensurate with performance achievements •Award opportunities established for each performance cycle atbelow or belownear median levels of competitiveness with TVA's peer group •Long-term performanceLTP awards vest upon the completion of the three-year performance period, contingent upon continued employment through vesting date and subject to achievement of performance goals •Long-term retentionLTR awards vest in one-third increments over three years, contingent upon continued employment on each vesting date | | | |
| | | |
The TVA Board and Mr. Lyash evaluated the appropriateness of the long-term incentive award opportunities for the CEO and other NEOs, respectively. For 2020,2023, the valuevalues of both the long-term performance awardTotal LTI awards (LTP awards at target and the long-term retention awardsLTR awards) were increased from 20192022 levels, for each NEO so that Total Direct Compensation moved closer tonear market median, following a review of benchmarking and individual performance and reflective of increased tenure.tenure and experience. Accordingly, target long-term incentive award opportunities of the NEOs for 20202023 were as follows:
| | | | | | | | | | | | | | | | | | | | | | | |
| Named Executive Officers | 2020–2022 LTP(1) | Value at target | % Increase from 2019–2021 LTP target value | | 2020 LTR(1) | Value at target | % Increase from 2019 LTR award value |
| Mr. Lyash | 221.3 % | $ | 2,341,000 | | 15.7 | % | (2) | 95.8 % | $ | 1,014,000 | | N/A(3) |
| Mr. Thomas | 147.0 % | $ | 980,000 | | 11.4 | % | | 63.0 % | $ | 420,000 | | 10.5 | % |
| Mr. Skaggs | 149.2 % | $ | 990,000 | | 1.0 | % | | 64.7 % | $ | 429,000 | | 2.1 | % |
| Ms. Quirk | 124.7 % | $ | 695,000 | | 1.5 | % | | 53.3 % | $ | 297,000 | | 2.4 | % |
| Mr. Rausch | 93.4 % | $ | 500,000 | | 23.7 | % | | 61.6 % | $ | 330,000 | | 90.5 | % |
Notes
(1)Represents a percent of each NEO's salary.
(2)Since Mr. Lyash joined TVA in 2019, the second performance year under the 2019–2021 LTP, his payout under that award will be prorated to reflect his service for two-thirds of the performance period.
(3)Mr. Lyash did not receive a LTR award in 2019.
| | | | | | | | | | | | | | | | | | | | | | | | | |
| NEO | 2023-2025 Granted LTI Values ($) | | 2023-2025 LTI - Increase vs 2022-2024 (%) |
| LTP Target | LTR Award | TOTAL LTI | | | | LTP Target | LTR Award | TOTAL LTI |
| Mr. Lyash | $ | 3,983,000 | | $ | 1,707,000 | | $ | 5,690,000 | | | | | 12% | 12% | 12% |
| Mr. Thomas | 1,425,000 | | 600,000 | | 2,025,000 | | | | | 2% | 3% | 2% |
| Mr. Moul | 1,425,000 | | 785,000 | | 2,210,000 | | | | | 21% | 0% | 13% |
| Mr. Rausch | 725,000 | | 330,000 | | 1,055,000 | | | | | 22% | 0% | 14% |
| Mr. Fountain | 970,000 | | 390,000 | | 1,360,000 | | | | | 26% | 18% | 24% |
Long-Term Performance Awards
TVA's executive compensation program provides for an annual grant of a long-term performancean LTP award with a three-year performance period. During 2020,2023, there were three overlapping LTP awards:
| | | | | | | | |
2018–20202021–2023 LTP Award | Granted October 1, 2017 | Vested September 30, 20202023 |
2019–20212022–2024 LTP Award | Granted October 1, 2018 | Vesting September 30, 20212024 |
2020–20222023–2025 LTP Award | Granted October 1, 2019 | Vesting September 30, 20222025 |
The performance metrics and threshold, target, and stretch goals for each metric are determined annually by the TVA Board. Following the TVA Board's approval of performance achievement at the end of each three-year performance period, awards are paid out in cash early in the subsequent fiscal year. Targetyear, or upon death, disability, or retirement, as described in TVA's Long-Term Incentive Plan. For the 2021-2023 LTP award cycle, target performance provides for a 100 percent payout opportunity, performance below threshold provides for no payout, performance at threshold provides for a 50 percent payout opportunity, and performance at stretch provides for a 150200 percent payout opportunity. Linear interpolation is used for results between threshold and stretch goals. The TVA Board can use itsmay apply discretion to adjust the final payout for each NEO's LTP award based on the evaluation of the NEO's individual achievements, peer group comparisons,awards, if necessary, to ensure a fair and performance over the performance cycle.
| | | | | | | | | | | | | | |
LTP
Incentive
Amount | = | Target
Value | × | Percent of Opportunity Achieved
(0% to 150%200%) |
For the three-year performance period ended September 30, 2020,2023, the TVA Board previously approved threefive overall long-term incentive measures of TVA performance to be applied to all participants in the LTIP.LTP. The 2018–20202021–2023 performance measures, along with the weighting ascribed to each, are shown below as a percentage of the total LTP award opportunity at target-level performance.
| | | | | | | | | | | | | | | | | |
| | | | | |
2018-20202021-2023 LTP
PERFORMANCE METRICS | | | The 2018–20202021–2023 LTP metrics are described in detail below. |
| | | Non-Fuel Delivered Cost of Power What this measures: Non-fuelnon-fuel expenses (cents/kWh)
The Non-Fuel Delivered Cost of Power performance measure is a financial measure. The Non-Fuel Delivered Cost of Power measure is equal to the sum of (i) non-fuel operating and maintenance ("O&M") expense, (ii) base capital expense,cost, (iii) interest expense, and (iv) other expense divided by budgeted electric power sales. | Why Is This Metric Used? This measure drives performance through activities that management can control. It aligns with TVA's strategic objective of maintaining low rates and focuses on aligning O&MTVA’s non-fuel costs associated with generation, transmission, statutory mission services, and additional customer services with revenue. Non-Fuel Delivered Cost of Power supports retail rate objectives and aligns to the Business Planbusiness plan commitment. |
| | | | |
| | | | |
| | | | Load Not Served What this measures: Transmissiontransmission system outages that affect TVA customers
Load Not Served ("LNS") is a measure of the magnitude and duration of transmission system outages that affect TVA customers expressed in System Minutes.system minutes. An automatic customer interruption with a duration of one minute or greater is tracked as an LNS event. LNS events caused by TVA on a distributor system will also count as a TVA event even if the TVA system remains energized. LNS excludes interruptions due to declared Major Events, Variances, Gunfire, Vandalism,major events, variances, gunfire, vandalism, and verified Tornadoes.tornadoes. | Why Is This Metric Used? An automatic customer interruption with a duration of one minute or greater is tracked as a Load Not Served ("LNS") event. TVA manages this critical indicator to reduce the impact of customer outages.
|
| | | | | |
| | | | | |
| | | | External MeasuresPerformance Indicators for the TVA Nuclear Fleet What this measures: External perception and reputational eventsnuclear operations performance
•External Nuclear Performance Indicators Index – Weightedfor the TVA Nuclear Fleet is calculated using a weighted combination of key nuclear performance indicators based on standard nuclear industry definitions for station performance.performance, with the maximum obtainable being 100 points.
| Why Is This Metric Used? •This measure is a recognized industry standard for nuclear operations performance based on safety and reliability.
|
| | | | | |
| | | | | |
| | | | Stakeholder Survey What this measures: external perception and reputational events Stakeholder Survey – Conductedis conducted among the general public, public officials, economic development leaders, and business/community leaders in the TVA service area to assess public opinion of TVA. •
| Why Is This Metric Used? This measure is conducted to assess the external reputation and perception of TVA and TVA's effectiveness in carrying out its mission and strategic objectives. |
| | | | | |
| | | | | |
| | | | Customer Survey – Annual What this measures: TVA's focus on meeting and exceeding customer expectations Customer Survey is an annual survey of LPCs and Direct-Serve Customers ("DSC") focused on better understanding customer loyalty and related performance drivers. •Media Tone – Measures the percent of positive and balanced media coverage out of total TVA news coverage.
| Why Is This Metric Used? Targets for these measures represent incremental improvement in external perceptionsThis measure is to help TVA better understand the strength of TVA's performancethe bond with its customers and brand.identify how TVA can positively affect this relationship.
|
| | | | | |
| | | | | |
Consistent with its public power mission, TVA's long-term performance metrics include the results of surveys that assess the external reputation and perception of TVA and TVA's effectiveness in carrying out its mission and strategic objectives. These metrics reflect TVA's focus on meeting or exceeding customer expectations and identifying areas for continuous improvement.
In setting the goal for each metric, the TVA Board considers budgeted amounts in the company's approved business plans, actual performance in recent years, and level of achievability.attainment. The TVA Board also considers TVA's strategic business
plan priorities and strategic benchmarking goals, customer and stakeholder feedback, environmental and regulatory concerns and goals, and the competitive environment. Achievement of the target goal would result in a 100 percent payout opportunity with respect to that goal. A threshold goal is also set for each metric, so that no payout would occur with respect to metrics that fail to achieve that threshold. Additionally, a stretch goal for each metric is set to incentivize and reward exceptional performance. Linear interpolation is used for results between threshold and stretch goals.
2018–20202021–2023 LTP Award Performance Results
The performance results on the 20202023 TVA EnterpriseLong-Term Performance Scorecard are set forth below. Performance resulted in aan adjusted payout of 129136 percent of target opportunity.
2018–20202021–2023 Long-Term Performance Scorecard
Notes
(1)On August 22, 2018, the TVA Board approved replacing the Wholesale Rate Excluding Fuel measure with Non-Fuel Delivered Cost of Power for the 2018–2020 performance cycle because the Wholesale Rate Excluding Fuel measure has not historically reflected TVA's financial performance.= (Non-Fuel Operating and Maintenance Expense + Base Capital Cost + Interest Expense + Other Expense) / Budgeted Electric Power Sales. For the 2018–2020 LTIP2021–2023 performance cycle, the Non-Fuel Delivered Cost of Power measure was calculated using thean average of 2019the 2021, 2022, and 20202023 results.
(2)Load Not Served = (Percentage of Total Load Not Served) x (Number of Minutes in the Period). For the 2018–2020 LTIP2021–2023 performance cycle, the Load Not Served measure was calculated using an average of the 2018, 2019,2021, 2022, and 20202023 results. The target Load Not Served measure is the average of the rates for 2018, 2019 and 2020 that were set forth in the approved business plans for 2016, 2017, and 2018, respectively.
(3)The External Performance Indicators for TVA Nuclear Fleet measure is calculated using a weighted combination of key performance indicators based on standard nuclear industry definitions for station performance, with the maximum obtainable being 100 points. For the 2018–2020 LTIP2021–2023 performance cycle, the External Measures metrics werePerformance Indicators for the TVA Nuclear Fleet measure was calculated using the 2023 results.
(4)For the 2021–2023 performance cycle, the Stakeholder Survey was calculated using an average of the 2018, 2019,2021, 2022, and 2020 results (except for the External Nuclear Performance Indicators measure, which was based on 2020 results).2023 results.
For the 2021–2023 performance cycle, the Customer Survey was calculated using an average of the 2021, 2022, and 2023 results.
In reviewing the 2018–20202021–2023 performance period, the TVA Board considered strong performance in several areas including key areas wherealong with below target performance exceeded target expectations:
P TVA's debt is at the lowest level in three decades; TVA paid down $1.4 billion in debt in 2020
P Achieved and surpassed strategic goal of reducing debt to $21.8 billion by 2023
P Sustained $800 million in annual operating costs savings
P TVA's financial position is the strongest it has been in decades and is setting a path to keep base rates stablefor External Performance Indicators for the next decadeTVA Nuclear Fleet and Customer Survey in 2023. Below are key highlights for this performance period:
P üStrong transmission grid system reliability performance
However,•TFOs at September 30, 2023 are among the lowest in lightover 30 years
•Delivered three years of several external measures that failedcustomer credits
ü Nuclear performance
•Browns Ferry, Sequoyah, and Watts Bar nuclear sites performed at exemplary levels compared to meet threshold targets,industry peers
•Browns Ferry Unit 2 exceeded its continuous run record (562 days) and achieved its first breaker-to-breaker continuous run record - 665 consecutive days (February 2023)
•Sequoyah maintained station performance in top quartile for the entire fiscal year
•Watts Bar Unit 1 achieved its second breaker-to-breaker continuous run – 496 consecutive days (April 2023). This duration is second to the breaker-to-breaker continuous run record of 512 days (September 2000)
•External Performance Indicators for the TVA Nuclear Fleet - fell just below target for 2023 due to an outage at Watts Bar Unit 2 that occurred late in 2023
ü Customer relationships
•96% of 153 LPCs have signed 20-year Partnership Agreements with TVA
•TVA offered regulatory relief and flexibility so LPCs could help their communities
•Stakeholder Survey - three-year survey results exceeded TVA's stretch goal, driven by consistent above target performance for each year in the period
•Customer Survey - despite improving commitment levels in 2021 and the highest ever commitment score in 2022, 2023 resulted in an average score below target for the three-year performance period
ü Continued economic development efforts have been successful (2021-2023)
•Companies have announced $28.2 billion in projected investments, and
•Approximately 205,800 jobs (61,300 jobs created and 144,500 jobs retained) are expected to be created/retained
The TVA Board, determined that on balance the calculated payout appropriately reflected executive performance in executing on TVA's long-term priorities, and did not exerciseusing its discretion to adjustreview results and approve adjustments in payouts, adjusted the calculated payout.2023 LTP payout percentage from 146 to 136. This adjustment recognizes TVA's strong performance over the three-year performance period while also acknowledging the events of Winter Storm Elliott. Payouts to the NEOs for the 2018–20202021–2023 LTP Award are described under each executive's compensation scorecard under "20202023 Pay Decisions – 20202023 NEO Pay Decisions and Compensation Scorecards"Scorecards below and reported in the Executive Compensation Tables and Narrative Disclosures – Summary Compensation Table under "Non-Equity Incentive Plan Compensation."
2019–20212022–2024 Outstanding LTP Performance Cycle
The TVA Board previously approved the following overall LTP measures of TVA performance for all participants for the three-year cycle ending September 30, 20212024 (awards to be paid in November 2021)2024):
| | | | | | | | | | | | | | | | | | | | | | | | | | |
| Performance Metric and Weighting | Threshold Target Stretch (50% Payout) (100% Payout) (200% Payout) |
| | | | | | | | |
Non-Fuel Delivered Cost of Power(1) | 45% | | | | | | | |
| 3.67 | 3.53 | 3.39 | |
| | | | | | | | |
| | | | | | | | |
Load Not Served(2) | 30% | | | | | | | |
| 4.5 | 3.9 | 3.2 | |
| | | | | | | | |
| | | | | | | | |
External Performance Indicators for the TVA Nuclear Fleet(3) | 15% | | | | | | | |
| 93.5 | 96.0 | 98.5 | |
| | | | | | | | |
| | | | | | | | |
Powerful Partnerships Survey(4) | 10% | | | | | | | |
| 74.0 | 78.0 | 82.0 | |
| | | | | | | | |
| | | | | | | | |
Notes
(1)The metrics have theMetric has same definition as for the 2018–20202021-2023 LTP awards.
(2)For the 2019–2021 LTIP2022-2024 performance cycle, the Non-Fuel Delivered Cost of Power measure will be calculated using an average of the 2019, 2020,2022, 2023, and 20212024 results.
(3)(2)Metric has same definition as for the 2021-2023 LTP awards. For the 2019 – 2021 LTIP2022-2024 performance cycle, the Load Not Served measure will be calculated using an average of the 2019, 2020,2022, 2023, and 20212024 results.
(3)Metric has same definition as for the 2021-2023 LTP awards. For the 2022-2024 performance cycle, the External Performance Indicators for the TVA Nuclear Fleet measure will be calculated based on 2024 results.
(4)The Powerful Partnerships Survey measure is conducted among customers, elected officials, business and economic development leaders, and the general public in the TVA service area to assess the strength of various stakeholder relationships with TVA. For the 2019 – 2021 LTIP2022-2024 performance cycle, the External Measures metricsPowerful Partnerships Survey measure will be calculated using an average of the 2019, 2020,2022, 2023, and 2021 results (except for2024 results.
Beginning with the External Nuclear Performance Indicators2022-2024 performance cycle, the Powerful Partnerships Survey has been added as a new measure, which will be based on 2021 results).with a weighting of 10%, and replaces the former Stakeholder Survey and Customer Survey measures, as illustrated in the above chart.
2023–2025 Outstanding LTP Performance Cycle
In October 2019,May 2022, the TVA Board approved the following overall LTP measures of TVA performance for all participants for the three-year cycle ending September 30, 20222025 (awards to be paid in November 2022)2025):
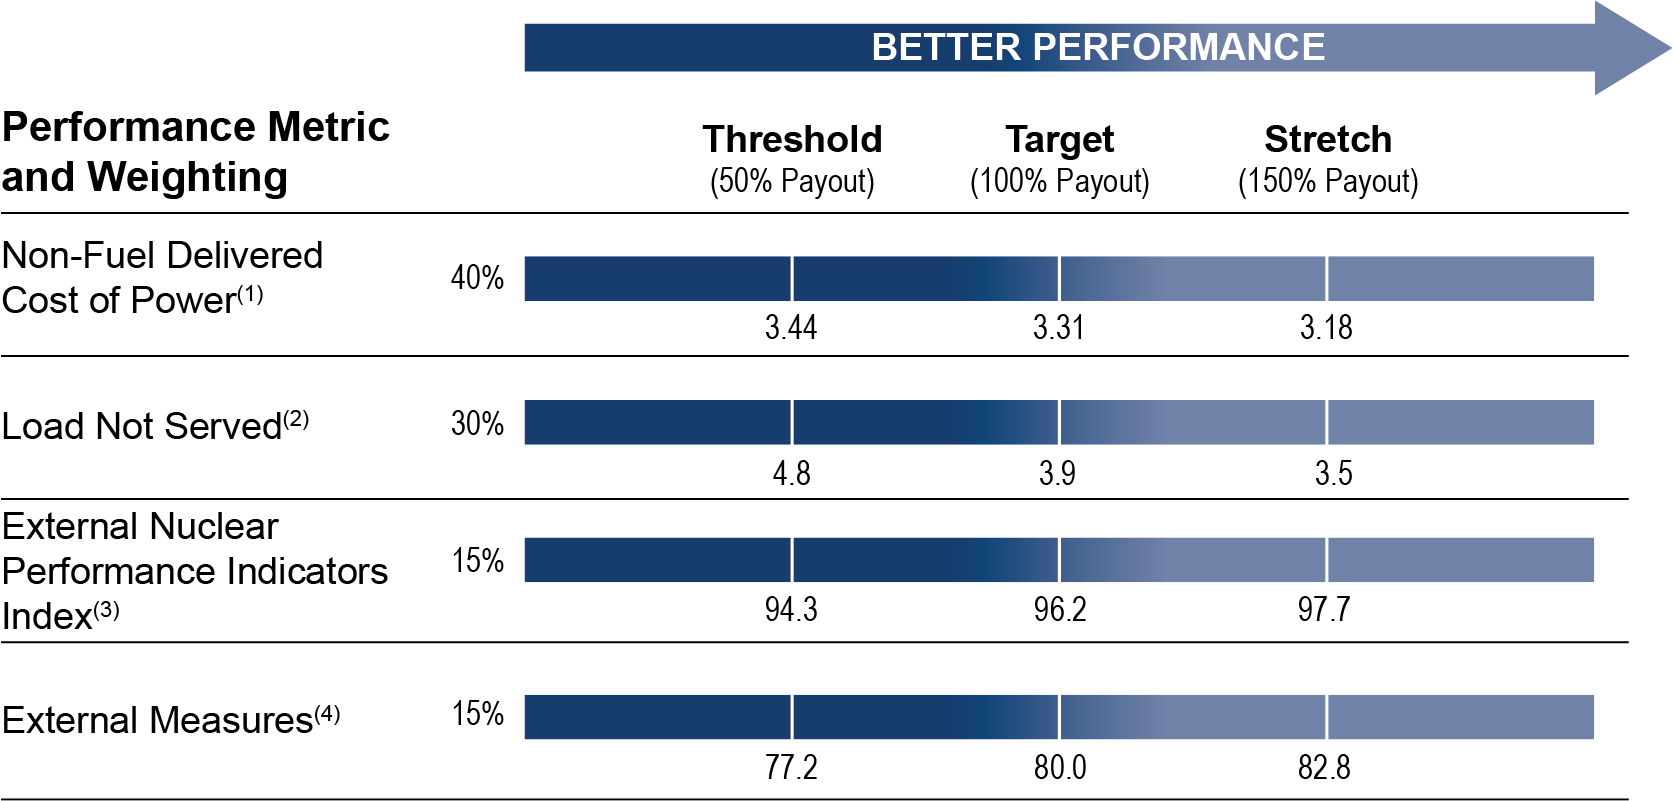
| | | | | | | | | | | | | | | | | | | | | | | | | | |
| Performance Metric and Weighting | Threshold Target Stretch (50% Payout) (100% Payout) (200% Payout) |
| | | | | | | | |
Non-Fuel Delivered Cost of Power(1) | 45% | | | | | | | |
| 3.44 | 3.31 | 3.18 | |
| | | | | | | | |
| | | | | | | | |
Load Not Served(2) | 30% | | | | | | | |
| 4.5 | 3.9 | 3.2 | |
| | | | | | | | |
| | | | | | | | |
External Performance Indicators for the TVA Nuclear Fleet(3) | 15% | | | | | | | |
| Industry Median | Top Quartile | Top Fleet | |
| | | | | | | | |
| | | | | | | | |
Powerful Partnerships Survey(4) | 10% | | | | | | | |
| 75.0 | 79.0 | 83.0 | |
| | | | | | | | |
Notes
(1)Metric has same definition as for the 2021-2023 LTP awards. For the 2020 - 2022 LTIP2023-2025 performance cycle, the Non-Fuel Delivered Cost of Power measure will be calculated using an average of the results for each of 2020, 2021,2023, 2024, and 2022.2025 results.
(2)Metric has same definition as for the 2021-2023 LTP awards. For the 2020 - 2022 LTIP2023-2025 performance cycle, the Load Not Served measure will be calculated using an average of the results for each of 2020, 2021,2023, 2024, and 2022.2025 results.
(3)Metric has same definition as for the 2021-2023 LTP awards. For the 2020 - 2022 LTIP2023-2025 performance cycle, the External Nuclear Performance Indicators for the Nuclear Fleet measure will be calculated based on 2022using 2025 results.
(4)Metric has same definition as for the 2022-2024 LTP awards. For the 2020 - 2022 LTIP2023-2025 performance cycle, the External Measures metricsPowerful Partnerships Survey measure will be calculated using an average of results for each of 2020, 2021,the 2023, 2024, and 2022.2025 results.
Non-Fuel Delivered Cost of Power and Load Not Served have the same definition as for the 2018–2020 LTP awards. External Nuclear Performance Indicator Index was kept a measure but is no longer a component of External Measures. Additionally, Board Level Significant Events has been removed as a metric under External Measures since the Long-Term Incentive Plan program design gives the TVA Board discretion in its review of the results and determination of payout. The remaining External Measures for the 2020–2022 LTP awards are the same as those for the 2018–2020 LTP awards. The External Measures for the 2020–2022 LTP awards, together with their weighting and targets, are as follows:
2020–2022 LTP Award External Measures
Long-Term Retention AwardsOther Compensation
AsTo recruit high-quality talent, TVA may offer recruitment awards as well as relocation assistance and reimbursement. These types of deferred cash incentive awards are intended to compensate the individuals for amounts they may have forfeited from their previous employer in order to join TVA and/or provide substitute compensation when the individual is not eligible to receive certain incentive payments until a corporate agencyfuture date.
In July 2023, Mr. Moul received the third and final installment of a deferred cash recruitment and relocation incentive in the amount of $100,000 that was part of his 2021 employment offer. In 2023, Mr. Moul received an additional $110,182 in relocation benefits as reported in the Executive Compensation Tables and Narrative Disclosures – Summary Compensation Table under "All Other Compensation".
Executive Severance Plan
TVA has established an Executive Severance Plan to provide additional benefits to certain executives if TVA terminates the employment of covered executives other than for Gross Misconduct or such executives terminate for Good Reason. See Executive Compensation Tables and Narrative Disclosures - Executive Severance Plan below for additional information regarding the benefits available to covered executives under the Executive Severance Plan as well as definitions of Gross Misconduct and Good Reason.
Retirement Benefits
TVA provides its NEOs with retirement benefits through its qualified plans as well as through a non-qualified supplemental executive retirement plan ("SERP") in order to provide compensation beginning with retirement or termination of employment (if vesting requirements are satisfied), with enhanced compensation for certain executives to provide an additional incentive for hiring and retention of qualified individuals.
TVA sponsors a qualified defined benefit plan ("pension plan") and a qualified defined contribution plan ("401(k) plan"), which are administered by the TVA Retirement System ("TVARS"). The availability of, and level of benefits provided by, these qualified plans are comparable to similar qualified plans provided by companies in TVA's peer group.
In addition to its qualified retirement plans, TVA has a SERP for selected executives who are critical to the ongoing success of the U.S., TVA does not have equity securitiesenterprise. TVA's SERP is a non-qualified plan that it can useprovides supplemental retirement benefits at compensation levels that are higher than the limits specified by Internal Revenue Service ("IRS") regulations for qualified retirement plans. The provision of such non-qualified plans to provide stock awards, options, or other equity-based awards as compensation for its employees.executives is a common practice among companies in TVA's peer group. The purpose of the retention awards under the LTIPSERP is to provide a retention incentive similar to restricted stock or restricted stock units. These grants are intended to encourage executives to remain with TVA and to provide, in combination with salary, EAIP, and LTP grants,to:
•Provide a competitive retirement benefit level of total direct compensation. Grants are generally effective as of October 1that cannot be delivered solely through TVA's qualified retirement plans due to IRS limitations, and will become one-third vested on each subsequent September 30 or upon death, disability, or retirement if earlier on a pro-rated basis. Each award will be paid in a lump sum within two months of vesting.
More information regarding these retirement benefits is found following the Pension Benefits Table.
Health and Other Benefits
TVA offers a group of health and other benefits (medical, dental, vision, life and accidental death and disability insurance, and long-term disability insurance) that are available to a broad group of employees. The NEOs are eligible to participate in TVA's health benefit plans and other non-retirement benefit plans on the same terms and at the same contribution rates as other TVA employees.
2020 Long-Term Retention Award Grant2023 Performance Goals and Performance Achievement
| | | | | | | | | | | | | | |
| | Strategic Priorities | | Incentive Compensation Metrics* |
A significant portion of each NEO's compensation is based on company performance and influenced by individual performance achievements. As a result, a majority of NEO compensation is at-risk, providing incentive for the executive to achieve superior performance for TVA and for the businesses, communities, and residents it serves, both in the short term and in the years to come. Incentive compensation is provided to NEOs under the EAIP and LTIP. Each incentive award is described below. | | People
Advantage Amplifying the energy, passion, and creativity within each TVA employee | | Safety - Serious Injury Incident Rate ("SIIR") |
| Operational Excellence Building on TVA's best-in-class reputation for reliable service and competitively priced power | | Load Not Served Annualized Nuclear Online Reliability Loss Factor Combined Cycle Equivalent Availability Factor Coal Equivalent Availability Factor External Performance Indicators for the TVA Nuclear Fleet |
| Financial Strength Investing in the future, while keeping energy costs as low as possible | | Total Financing Obligations Operating Cash Flow Net Income Total Spend Non-Fuel Delivered Cost of Power |
| Powerful Partnerships Promoting progress through the shared success of TVA's customers and stakeholders | | Jobs Created and Retained Stakeholder Survey Customer Survey
|
| Igniting Innovation Pursuing innovative solutions for TVA and its customers and communities | | |
Following the market assessment conducted by FW Cook, effective October 1, 2019, TVA granted LTR awards to the NEOs. These awards vest*Incentive compensation metrics are further described below in three equal tranches on September 30, 2020, September 30, 2021, and September 30, 2022. The amounts of these awards are set forth under "Long-Term Incentive Compensation" above.
2020 Vesting of Outstanding Retention Awards
In 2020, three LTR awards were outstanding for each NEO, other than the CEO for whom only the 2020 LTR was outstanding. Each of these awards vested one-third on September 30, 2020. The vesting schedule for the three LTR awards outstanding in 2020 is set forth below. LTR awards that vested in 2020 are described under "2020 NEO Pay Decisions and Compensation Scorecards" below and are also reported in the Summary Compensation Table under "Non-Equity2023 Incentive Plan Compensation."
Note
(1)Performance Metrics Mr. Lyash did not receive a 2018 LTR grant or 2019 LTR grant.and Long-Term Performance Awards.
2020 Pay DecisionsExecutive Annual Incentive Plan
All TVA employees participate in an annual incentive program (subject to eligibility requirements), since every employee contributes to the success of TVA and the execution of its public power mission. While the metrics used for annual incentives are the same for all employees, they are provided under two plans: the WPTIP provides for annual incentive awards for eligible non-executives, and the EAIP provides for annual incentive awards for eligible executives, including the NEOs.
2020 CEO Pay Decisions Overview
CEO PAY EARNED IN 2020, each NEO's annual incentive payment was calculated as follows:
| | | | | | | | | | | |
Base Salary | $ | 1,058,000 | | | | | | | | | | | | | | | | | | |
Annual Performance Incentive underEAIP
Executive Annual Incentive PlanAmount | $= | 2,391,609 | | | 137 percent of target enterprise performance achieved
Reflects Individual Performance Multiplier of 1.10x
|
Long-Term Retention IncentiveAnnual
Salary | $× | 338,000 Annual Target
Incentive
Opportunity | × | Percent of
Scorecard
Opportunity
Achieved
(0% to 200%) | 2020 tranche of 2020 LTR award× | Corporate
Multiplier
(0 to 1.1) | × | Individual
Performance
Multiplier
(0% to 150%) |
Each year,component of this calculation is discussed below (except for annual salary, which is discussed above). The award for certain participants in the Committee makes two key compensation decisions with respectWPTIP and the EAIP may be adjusted by the participant's supervisor based on an evaluation of the participant's individual achievements and performance during the year. In addition, pursuant to CEO compensation:discretion granted under the amount of TDC opportunity (which is forward-looking and incentivizesTVA Compensation Plan, awards may be further adjusted by the TVA Board or the CEO to perform),(1) as a result of any unusual or nonrecurring event affecting TVA or the financial statements of TVA, or (2) as a result of changes in business conditions or the business strategy of TVA. There is no guaranteed minimum payout under the EAIP or WPTIP, and the amountmaximum payout for either plan cannot exceed 225 percent of TDC earned (which rewards the CEO for his prior performance).
2020 CEO Total Direct Compensation Opportunity
The Total Direct Compensation opportunity granted to Mr. Lyash in 2020 is illustrated below. Based on a review of 2020 compensation peer data, Mr. Lyash's increasing tenure with TVA, and his performance, the Committee increased each component of Mr. Lyash's TDC over 2019 levels.
CEO 2020 TARGET TOTAL DIRECT COMPENSATION OPPORTUNITYAnnual Target Incentive Opportunity
Notes
(1)Mr. Lyash did not receiveFollowing a LTP grant in 2019 since he joined TVA in April 2019review of benchmarking and LTP awards at that time were only granted effective October 1. Amount shown for 2019 represents a 2019 – 2021 LTP award that he was granted effective October 1, 2019, under which his payout will be prorated two-thirds to reflect his service during two of the threeindividual performance, years.
(2)Mr. Lyash did not receive a LTR grant in 2019.
Although the TVA Board moved Mr. Lyash's pay closer toevaluated the median in 2020, its compensation decisions resulted in positioning his total direct compensation at target below the 25th percentileappropriateness of the 2020EAIP award opportunity for the CEO based on market composite data.data and other individual factors and made no changes for 2023. Similarly, the CEO evaluated the appropriateness of the EAIP award opportunities for the other NEOs based on market data and other individual factors, including internal parity, and made no changes for 2023. Accordingly, target EAIP award opportunities of the NEOs for 2023 were as follows:
2020 CEO TARGET TOTAL DIRECT COMPENSATION OPPORTUNITY BELOW MARKET(1)
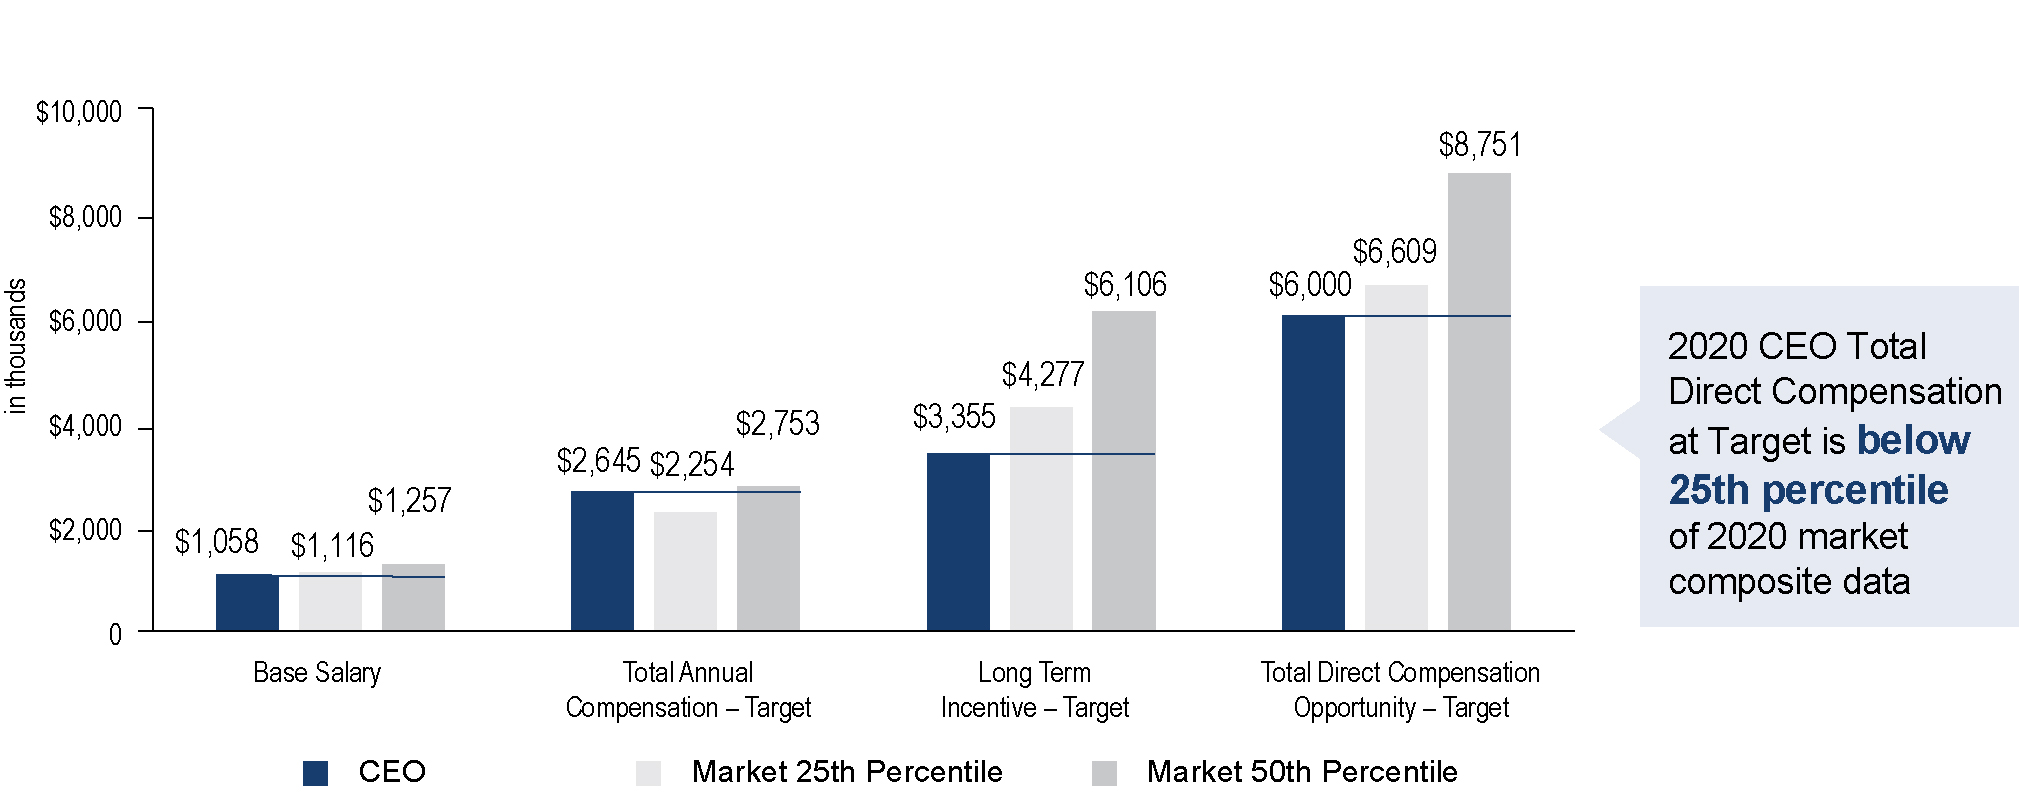
| | | | | |
| Named Executive Officers | 2023 Target Annual Incentive Opportunity(1) |
| Mr. Lyash | 150 | % |
| Mr. Thomas | 80 | % |
| Mr. Moul | 80 | % |
| Mr. Rausch | 70 | % |
| Mr. Fountain | 70 | % |
| |
Note
(1)Target market assessment effective October 2019 and included market compositeRepresents a percent of WTW database and proxy peer group.
2020 CEO Total Direct Compensation Earned
The Total Direct Compensation that Mr. Lyash received for 2020 reflected company and individual performance that exceeded targets. Mr. Lyash was not eligible to receive any payments under any LTP award in 2020; his first LTP award, the 2019–2021 LTP award, vests September 30, 2021; payout under this award will be prorated two-thirds to reflect his service during two of the three performance years.
CEO 2020 TOTAL DIRECT COMPENSATION EARNED2023 Incentive Plan Performance Metrics
The award that Mr. Lyash received reflected an Individual Performance Multipliermetrics used to measure performance under the WPTIP and EAIP are the same for all TVA employees. These metrics tie directly to key enterprise metrics used by senior management in its annual budget and strategic planning process, which in turn tie directly to the achievement of 1.10x.TVA's strategic objectives and mission. The Committee and TVA Board were extremely pleased with Mr. Lyash's performance, which they believe would typically warrant a maximum Individual Performance Multiplier of 1.50x. However, given the factors described in more detail in Mr. Lyash's scorecard under "2020 NEO Pay Decisions and Compensation Scorecards," the Committee and TVA Board exercised their discretion to reduce the multiplier to 1.10x.
In addition to Total Direct Compensation Earned (as shown in the table above), Mr. Lyash was paid $1,092,000 in2023 2020WPTIP and EAIP metrics and goals were set out in an organizational scorecard ("TVA Enterprise Scorecard") applicable to all employees. The 2023 performance measures, along with the weighting ascribed to each, are shown below as the second tranche of a recruitment and relocation incentive under his employment offer letter. This incentive was intended to compensate him for amounts he forfeited from his previous employer in order to join TVA, as well as to provide some measure of substitute compensation in light of his not being eligible to receive any LTP incentive payments until September 2021.
Why Total Compensation Earned Differs From Compensation Reported
2020 CEO TOTAL COMPENSATION COMPONENTS
•Amounts are estimates of the pension/SERP benefits earned for service during the prior year, determined using assumptions consistent with those used in the financial statements in this Annual Report, set forth in Note 21 - Benefit Plans.
Unlike the amounts reported in the Summary Compensation Table, Mr. Lyash's Total Direct Compensation Earned represents the annual pay decisions by the Committee that specifically reflect its assessment of the company's performance and individual performance and reward the employee for satisfaction of incentive award conditions (enterprise performance and continued employment). Other elements included in the Summary Compensation Table, such as changes in pension values and vesting of recruitment and relocation incentives, are excluded from Total Direct Compensation Earned because they do not relate to performance and are outside the scope of the Committee's annual pay decisions. The Committee therefore believes that Total Direct Compensation Earned renders a more accurate and up-to-date reflection of its assessment of performance.
2020 CEO Pay Ratio Lowest Among Peers
As reflected above, TVA's CEO target Total Direct Compensation is low compared to its 2020 compensation peer group on an absolute basis but is also low compared to its peers in the context of organizational pay ratios. As discussed fully under "CEO Pay Ratio Disclosure", the pay ratiopercentage of the total compensation for Mr. Lyash to the median TVA employee was approximately 53 to 1 for 2020. Based on TVA's 2020 pay ratio and the pay ratio disclosed in its peers' most recent public
disclosures, TVA has the lowest margin between CEO and median employee compensation. Peers used are those shown under Proxy Peer Group of Investor Owned Utilities in the "List of Compensation Peer Companies."
2020 CEO PAY RATIO VS. PEERS
2020 NEO Pay Decisions and Compensation Scorecards
The following pages show each NEO's 2020 Total Direct Compensation earned, 2020 TDC opportunities granted, and the Committee's (or the CEO's in the case of NEOs other than the CEO) rationale for those pay decisions.
| | | | | | | | | | | | | | | | | |
| | | | | |
JEFFREY J. LYASH2023 WPTIP/EAIP METRICS
President and CEO
Joined TVA April 2019 | | | The 2023 WPTIP/EAIP metrics are described in detail below. |
| | 2020 TOTAL DIRECT COMPENSATION EARNED | TVA Total Spend $3,787,609What this measures: TVA's ability to keep costs low
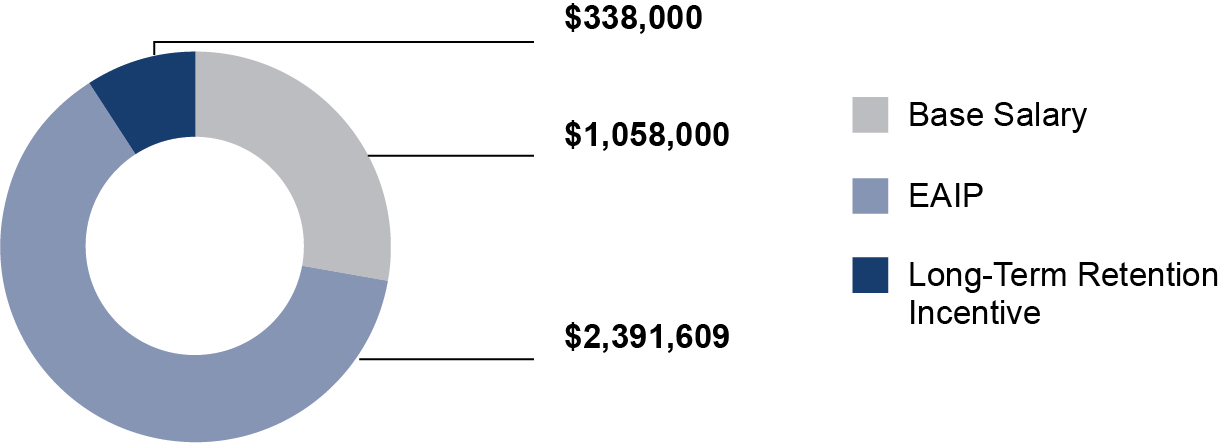 | Why Is This Metric Used? Base Salary. Mr. Lyash's salary was increased 15 percent to $1,058,000 for 2020, reflecting outstanding performanceSupports the overall TVA goal of maintaining costs and positioning tomanaging rates based on spending levels approved by TVA management and the TVA Board.
|
| | | | |
| | | | |
| | | Load Not Served What this measures: Transmission system outages that affect TVA customers Load Not Served ("LNS") is a more competitive base salary. This amount is below the 25th percentilemeasure of the 2020 compensation peer group median.magnitude and duration of transmission system outages that affect TVA customers expressed in system minutes. An automatic customer interruption with a duration of one minute or greater is tracked as an LNS event. LNS events caused by TVA on a distributor system will also count as a TVA event even if the TVA system remains energized. LNS events exclude interruptions due to declared major events, variances, gunfire, vandalism, and verified tornadoes. | Why Is This Metric Used? TVA manages this critical indicator to reduce the impact of customer outages. |
| | | | |
| | | | |
| | | | |
| | | Annualized Nuclear Online Reliability Loss Factor What this measures: Nuclear plant availability Annualized Nuclear Online Reliability Loss Factor is the 12-month ratio of all generation losses (minus refueling outage (“RFO”) and exempt losses) to reference energy generation (minus RFO and exempt losses) in a normal fuel cycle period, per external standard nuclear industry guidelines. EAIP Payment Earned.
Based
| Why Is This Metric Used? Monitors performance between refueling outages to obtain high unit and energy production reliability. |
| | | | | |
| | | | Combined Cycle Equivalent Availability Factor What this measures: Combined cycle plant reliability Combined Cycle Equivalent Availability Factor ("EAF") reflects the percentage of time over a given period that a generating unit was available to generate electricity for TVA-operated combined cycle generating assets, based on Mr. Lyash's superior performance and overall rating of 5 out of 5, TVA'sGenerating Availability Data System ("GADS") event reporting guidelines for applying an individual performance multipliermegawatt hour losses. Combined Cycle EAF excludes events classified as outside management control and variances. | Why Is This Metric Used? Combined Cycle EAF focuses on ensuring TVA combined cycle generating assets are available and reliable to annual incentive awards would have providedmeet system demand. |
| | | | | |
| | | | | |
| | | | Coal Equivalent Availability Factor What this measures: Coal plant reliability Coal EAF reflects the highest individual performance multiplierpercentage of 1.50xtime over a given period that a generating unit was available to his 2020 EAIP award. Consideration of three issues were includedgenerate electricity for TVA coal generating assets, based on GADS event reporting guidelines for megawatt hour losses. Coal EAF excludes events classified as outside management control and variances. | Why Is This Metric Used? Coal EAF focuses on ensuring TVA coal generating assets are available and reliable to meet system demand. |
| | | | | |
| | | | | |
In setting the goal for each metric, consideration is given to TVA's historic performance, its strategic business plan priorities and strategic benchmarking goals, customer and stakeholder feedback, environmental and regulatory concerns and goals, and the competitive environment. Achievement of the target goal would result in a 100 percent payout with respect to that goal. A threshold goal is also set for each metric, so that no payout would occur with respect to metrics that fail to achieve that threshold. Additionally, a stretch goal for each metric is set to incentivize and reward exceptional performance. Linear interpolation is used for results between threshold and stretch goals.
2023 Executive Annual Incentive Plan Results
The performance results on the 2023 TVA Enterprise Scorecard are set forth below. Performance reflects a 185 percent opportunity achieved against target (on a scale from 0 percent - 200 percent), followed by the application of the EAIP Corporate Multiplier, 0.85.
TVA'S 2023 ENTERPRISE SCORECARD PERFORMANCE(1)
Note
(1) The TVA Enterprise Scorecard sets forth the performance goals applicable to the WPTIP and the EAIP.
Corporate Multiplier Allows TVA Board to Adjust for Overall Performance
| | | | | | | | | | | | | | |
As in makingprevious years, the final decision. These are the execution of the ongoing Information Technology transition initiative andTVA Board approved the use of H1-B Visa workers in that process, progress in resolving TVA's supplier relationship with Memphis Light, Gas & Water,a corporate multiplier for the 2023 EAIP. The corporate multiplier ranges between 0 and nuclear fleet progress in improving performance. Also, considered was Mr. Lyash's strength of demonstrated recovery in all three areas of concern. After taking these into consideration, and applying discretion, Mr. Lyash's individual performance1.1. The multiplier was reducedbased on performance in 2023 against goals set in May 2022 for six organizational metrics, and following are key highlights for this performance period: •Continued overall strong safety performance, while also acknowledging an employee fatality – 2023 SIIR remains top decile, based on most recent data available •Financial health and performance – continued strong financial performance with TFO exceeding stretch; Net income exceeding target; and Operating Cash Flow exceeding threshold and below target •Jobs created and jobs retained – 2023 efforts continued to help attract and encourage the expansion of business and industries –$9.2 billion in projected investments, and –Expected creation/retention of 58,411 jobs (12,276 jobs created and 46,135 jobs retained) •Overall performance – strong performance with record–setting results across a broad range of metrics while also acknowledging the events of Winter Storm Elliott and an employee fatality | | | | |
| | Why does the TVA Board
use a multiplier? | |
| | | |
| | The multiplier allows the TVA Board to qualitatively assess the organization's performance, emphasizing the importance of safety, financial health, reputation, and economic development. | |
|
|
|
The TVA Board and the CEO qualitatively assessed TVA’s performance at the end of the 2023 performance period. Based on TVA's performance with respect to the 2023 corporate multiplier measures and the overall performance described above, and considering the additional accountabilities of the leadership team in regards to the events of Winter Storm Elliott and an employee fatality, the TVA Board determined to apply a 0.85 multiplier to the calculated EAIP payout.
Corporate Multiplier Factors
| | | | | | | | | | | |
| Metric | Definition | Why Is This Metric Used? |
Safety – Serious
Injury Incident Rate
("SIIR") | A mathematical calculation used by Edison Electric Institute that quantifies the extent of injury for serious injuries and fatalities from 1.50x to 1.10x. Based on TVA's guidelines, a 1.10x is atevents within the bottomcontrol of the rangeemployee and/or the employer. | TVA shares a professional and personal commitment to protect the safety of its employees, its contractors, its customers, and those in communities that TVA serves. |
| Total Financing Obligations ("TFO") | TFO is calculated by subtracting unbudgeted contributions to unfunded liabilities from the sum of (1) long-term debt (including unamortized premiums/discounts), (2) short-term debt, (3) leaseback obligations, (4) energy prepayment obligations, and (5) variable interest entities. | TVA's TFOs are driven by its business plan and reflect the application of sound financial guiding principles. Focusing on this measure will improve TVA's fiscal performance and strengthen TVA's balance sheet. |
| Operating Cash Flow | Amount of cash generated from power production and other mission-related activities and generally defined as operating revenues received less cash payments made for operating expenses. See Part II, Item 8, Financial Statements and Supplementary Data – Consolidated Statements of Cash Flows for additional information. | Operating Cash Flow is considered a 5key indicator of overall financial health as it measures TVA's ability to use cash received from customers to sufficiently fund outgoing cash expenditures. |
| Net Income | Consists of the entity’s net earnings derived by adjusting revenues for the cost of doing business, including the cost of sales, depreciation, interest, taxes, and other expenses. See Part II, Item 8, Financial Statements and Supplementary Data – Consolidated Statements of Operations for additional information. | Net income is a standard accounting measure that provides a view of TVA's financial performance rating and position. |
Jobs Created and Jobs Retained(1) | Measures the number of new or retained jobs in the middleTennessee Valley for which TVA has played a role in the recruitment or retention of the economic development project. | Jobs Created and Retained is an industry standard measure that economic developers can speak to and easily understand, and provides an established tracking mechanism to measure TVA's economic development efforts. |
| Board Level Significant Events | Includes items deemed significant by the TVA Board of Directors. These items may affect TVA's reputation with its customers and its stakeholders, the organizational health of the workforce, or its impact on the public at large. Both favorable and unfavorable events will be considered. | An incentive pay program, by design, cannot cover the entire scope of activities that could occur during a given cycle. This measure allows the TVA Board to deem certain reputational, environmental, or other items as significant impacts to TVA's business. Items that may be considered significant (either favorably or unfavorably) include customer survey results, stakeholder survey results, key indicators of organizational health, environmental events, or other major events not covered in other performance measures. |
Note
(1) "Jobs created" in the TVA fiscal year are newly created, paid positions at a facility of a TVA customer, meaning any entity that purchases power from TVA or its distributor. "Jobs retained" are paid positions at a facility of a TVA customer that were created prior to the current TVA fiscal year and that continue to be filled in the current TVA fiscal year. See Part I, Item I, Business — Economic Development Activities for additional information.
2023 CORPORATE MULTIPLIER MEASURES (0.0 – 1.1 MULTIPLIER)
Note
(1)Includes impact of partnership credits. Partnership credits are wholesale bill credits provided to LPC customers who have signed long-term Partnership Agreements with TVA. For more information, see Part I, Item 1, Business — Customers.
Individual Performance Multiplier Reinforces Pay for Performance
Annually, individual goals for the NEOs are established at the beginning of each performance cycle. These goals tie to the achievement of TVA's mission and strategic objectives. A 50 percent weighting is assigned to business goals, and a 50 percent weighting is assigned to leadership competencies. No numerical measures are assigned to the goals. Rather, at the end of the performance period, the CEO assesses the performance of the other NEOs and informs the Committee of his decision on a multiplier for each NEO. For the CEO Individual Performance Multiplier, each TVA Board member assesses the CEO's performance at the end of a performance period on a scale of 1–5, with "5" representing superior performance. Results of the assessment are provided to the TVA Board Chair who, after consultation with the Committee, and with input from individual Board members, determines the multiplier to be applied to the CEO. For each NEO, the individual performance multiplier can range between 0% to 150% of the calculated payout and can be used to reduce (multiplier below 100%) or increase (multiplier above 100%) the amount of the award.
For 2023, the NEOs were evaluated on individual performance goals and the following leadership competencies:
Leadership Competencies
| | | | | | | | | | | | | | |
| Inspiring Trust and Engagement | Continuous Improvement | Vision, Innovation, & Strategic Execution | Leadership Courage | Building Organizational Talent |
Accountability and Driving for a 4 rating.Results | Adaptability | Business Acumen | Effective Communication | Leveraging Diversity |
The 2023 individual multipliers and award payouts to the NEOs under the 2023 EAIP are described under each executive's compensation scorecard under 2023 Pay Decisions — 2023 NEO Pay Decisions and Compensation Scorecards below. Award
payouts are also reported in the "Non-Equity Incentive Plan Compensation" column in the Executive Compensation Tables and Narrative Disclosures — Summary Compensation Table.
Long-Term Incentive Plan ("LTIP") Compensation
TVA executives, including the NEOs, participate in the company's LTIP. These individuals make decisions that significantly influence the development and execution of TVA's long-term strategic objectives. As such, awards under TVA's LTIP are designed to reward executives for sustainable success. Since long-term success is supported by a commitment to continued employment, the NEOs are incentivized to remain with the company through the vesting of the LTP awards and LTR awards, as discussed below.
Long-Term Incentives Earned
| | | | | | | | | | | |
| | | |
| LONG-TERM AWARDS REWARD LONG-TERM SUCCESS | | | LONG-TERM INCENTIVE AWARDS |
| | | |
Long-Term Performance Award Earned.• Mr. Lyash did not participate in the 2018–2020 LTP program, and thus did not receive any LTP payout in 2020.Enterprise-wide performance criteria that are directly aligned with TVA's mission
Long-Term Retention Award Earned.• Mr. Lyash earned $338,000 in 2020 as the first tranche of his 2020 LTR program award of $1,014,000. The 2020 LTR award vests ratably"Cumulative" performance approach to measure performance achieved over a three-year period with a new three-year performance cycle beginning each year
•Potential payment range of 0 percent to 200 percent of target incentive opportunity to enable awards that are commensurate with performance achievements •Award opportunities established for each performance cycle below or near median levels of competitiveness with TVA's peer group •LTP awards vest upon the completion of the three-year performance period, contingent upon continued employment through vesting date and subject to achievement of performance goals •LTR awards vest in one-third increments over three years, contingent upon continued employment on each vesting date.date | | | Long-Term Incentive Opportunities Granted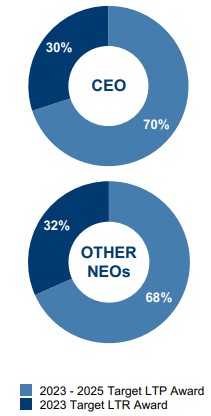 |
The TVA Board and Mr. Lyash evaluated the appropriateness of the long-term incentive award opportunities for the CEO and other NEOs, respectively. For 2023, the values of the Total LTI awards (LTP awards at target and the LTR awards) were increased from 2022 levels, near market median, following a review of benchmarking and individual performance and reflective of increased tenure and experience. Accordingly, target long-term incentive award opportunities of the NEOs for 2023 were as follows:
| | | | | | | | | | | | | | | | | | | | | | | | | |
| NEO | 2023-2025 Granted LTI Values ($) | | 2023-2025 LTI - Increase vs 2022-2024 (%) |
| LTP Target | LTR Award | TOTAL LTI | | | | LTP Target | LTR Award | TOTAL LTI |
| Mr. Lyash | $ | 3,983,000 | | $ | 1,707,000 | | $ | 5,690,000 | | | | | 12% | 12% | 12% |
| Mr. Thomas | 1,425,000 | | 600,000 | | 2,025,000 | | | | | 2% | 3% | 2% |
| Mr. Moul | 1,425,000 | | 785,000 | | 2,210,000 | | | | | 21% | 0% | 13% |
| Mr. Rausch | 725,000 | | 330,000 | | 1,055,000 | | | | | 22% | 0% | 14% |
| Mr. Fountain | 970,000 | | 390,000 | | 1,360,000 | | | | | 26% | 18% | 24% |
Long-Term Performance Awards
TVA's executive compensation program provides for an annual grant of an LTP award with a three-year performance period. During 2023, there were three overlapping LTP awards:
| | | | | | | | |
2020–2022 Long-Term Performance2021–2023 LTP Award Opportunity. | Effective October 1, 2019, Mr. Lyash was grantedVested September 30, 2023 |
| 2022–2024 LTP Award | Vesting September 30, 2024 |
| 2023–2025 LTP Award | Vesting September 30, 2025 |
The performance metrics and threshold, target, and stretch goals for each metric are determined annually by the TVA Board. Following the TVA Board's approval of performance achievement at the end of each three-year performance period, awards are paid out in cash early in the subsequent fiscal year, or upon death, disability, or retirement, as described in TVA's Long-Term Incentive Plan. For the 2021-2023 LTP award cycle, target performance provides for a 100 percent payout opportunity, performance below threshold provides for no payout, performance at threshold provides for a 50 percent payout opportunity, and performance at stretch provides for a 200 percent payout opportunity. Linear interpolation is used for results between threshold and stretch goals. The TVA Board may apply discretion to adjust the final payout for LTP awards, if necessary, to ensure a fair and balanced outcome.
| | | | | | | | | | | | | | |
LTP
Incentive
Amount | = | Target
Value | × | Percent of Opportunity Achieved
(0% to 200%) |
For the three-year performance period ended September 30, 2023, the TVA Board previously approved five overall long-term incentive measures of TVA performance to be applied to all participants in the LTP. The 2021–2023 performance measures, along with the weighting ascribed to each, are shown below as a percentage of the total LTP award opportunity at target-level performance.
| | | | | | | | | | | | | | | | | |
| | | | | |
2021-2023 LTP PERFORMANCE METRICS | | | The 2021–2023 LTP metrics are described in detail below. |
| | | Non-Fuel Delivered Cost of Power What this measures: non-fuel expenses (cents/kWh) The Non-Fuel Delivered Cost of Power is a 2020–2022 LTP program awardfinancial measure equal to the sum of (i) non-fuel operating and maintenance ("O&M") expense, (ii) base capital cost, (iii) interest expense, and (iv) other expense divided by budgeted electric power sales. | Why Is This Metric Used? This measure drives performance through activities that management can control. It aligns with TVA's strategic objective of maintaining low rates and focuses on aligning TVA’s non-fuel costs associated with generation, transmission, statutory mission services, and additional customer services with revenue. Non-Fuel Delivered Cost of Power supports retail rate objectives and aligns to the business plan commitment. |
| | | | |
| | | | |
| | | | Load Not Served What this measures: transmission system outages that affect TVA customers Load Not Served ("LNS") is a measure of the magnitude and duration of transmission system outages that affect TVA customers expressed in system minutes. An automatic customer interruption with a target opportunityduration of $2,341,000, whichone minute or greater is tracked as an LNS event. LNS events caused by TVA on a distributor system will vestalso count as a TVA event even if the TVA system remains energized. LNS excludes interruptions due to declared major events, variances, gunfire, vandalism, and verified tornadoes. | Why Is This Metric Used? TVA manages this critical indicator to reduce the impact of customer outages. |
| | | | | |
| | | | | |
| | | | External Performance Indicators for the TVA Nuclear Fleet What this measures: nuclear operations performance External Performance Indicators for the TVA Nuclear Fleet is calculated using a weighted combination of key performance indicators based on September 30, 2022. Actual payout will dependstandard nuclear industry definitions for station performance, with the maximum obtainable being 100 points. | Why Is This Metric Used? This measure is a recognized industry standard for nuclear operations performance based on safety and reliability. |
| | | | | |
| | | | | |
| | | | Stakeholder Survey What this measures: external perception and reputational events Stakeholder Survey is conducted among the general public, public officials, economic development leaders, and business/community leaders in the TVA service area to assess public opinion of TVA.
| Why Is This Metric Used? This measure is conducted to assess the external reputation and perception of TVA and TVA's effectiveness in carrying out its mission and strategic objectives. |
| | | | | |
| | | | | |
| | | | Customer Survey What this measures: TVA's focus on meeting and exceeding customer expectations Customer Survey is an annual survey of LPCs and Direct-Serve Customers focused on better understanding customer loyalty and related performance against targets atdrivers. | Why Is This Metric Used? This measure is to help TVA better understand the endstrength of the three-year performance period.bond with its customers and identify how TVA can positively affect this relationship. |
| | | | | |
| | | | | |
Consistent with its public power mission, TVA's long-term performance metrics include the results of surveys that assess the external reputation and perception of TVA and TVA's effectiveness in carrying out its mission and strategic objectives. These metrics reflect TVA's focus on meeting or exceeding customer expectations and identifying areas for continuous improvement.
In setting the goal for each metric, the TVA Board considers budgeted amounts in the company's approved business plans, actual performance in recent years, and level of attainment. The TVA Board also considers TVA's strategic business plan priorities and strategic benchmarking goals, customer and stakeholder feedback, environmental and regulatory concerns and goals, and the competitive environment. Achievement of the target goal would result in a 100 percent payout opportunity with respect to that goal. A threshold goal is also set for each metric, so that no payout would occur with respect to metrics that fail to achieve that threshold. Additionally, a stretch goal for each metric is set to incentivize and reward exceptional performance. Linear interpolation is used for results between threshold and stretch goals.
2021–2023 LTP Award Performance Results
The performance results on the 2023 TVA Long-Term Performance Scorecard are set forth below. Performance resulted in an adjusted payout of 136 percent of target opportunity.
2021–2023 Long-Term Performance Scorecard
Notes
(1)Non-Fuel Delivered Cost of Power = (Non-Fuel Operating and Maintenance Expense + Base Capital Cost + Interest Expense + Other Expense) / Budgeted Electric Power Sales. For the 2021–2023 performance cycle, the Non-Fuel Delivered Cost of Power measure was calculated using an average of the 2021, 2022, and 2023 results.
(2)Load Not Served = (Percentage of Total Load Not Served) x (Number of Minutes in the Period). For the 2021–2023 performance cycle, the Load Not Served measure was calculated using an average of the 2021, 2022, and 2023 results.
(3)The External Performance Indicators for TVA Nuclear Fleet measure is calculated using a weighted combination of key performance indicators based on standard nuclear industry definitions for station performance, with the maximum obtainable being 100 points. For the 2021–2023 performance cycle, the External Performance Indicators for the TVA Nuclear Fleet measure was calculated using the 2023 results.
(4)For the 2021–2023 performance cycle, the Stakeholder Survey was calculated using an average of the 2021, 2022, and 2023 results.
(5)For the 2021–2023 performance cycle, the Customer Survey was calculated using an average of the 2021, 2022, and 2023 results.
In reviewing the 2021–2023 performance period, the TVA Board considered strong performance in several areas along with below target performance for External Performance Indicators for the TVA Nuclear Fleet and Customer Survey in 2023. Below are key highlights for this performance period:
ü Strong transmission grid system reliability performance
ü Financial performance
•TFOs at September 30, 2023 are among the lowest in over 30 years
•Delivered three years of customer credits
ü Nuclear performance
•Browns Ferry, Sequoyah, and Watts Bar nuclear sites performed at exemplary levels compared to industry peers
•Browns Ferry Unit 2 exceeded its continuous run record (562 days) and achieved its first breaker-to-breaker continuous run record - 665 consecutive days (February 2023)
•Sequoyah maintained station performance in top quartile for the entire fiscal year
•Watts Bar Unit 1 achieved its second breaker-to-breaker continuous run – 496 consecutive days (April 2023). This duration is second to the breaker-to-breaker continuous run record of 512 days (September 2000)
•External Performance Indicators for the TVA Nuclear Fleet - fell just below target for 2023 due to an outage at Watts Bar Unit 2 that occurred late in 2023
ü Customer relationships
•96% of 153 LPCs have signed 20-year Partnership Agreements with TVA
•TVA offered regulatory relief and flexibility so LPCs could help their communities
•Stakeholder Survey - three-year survey results exceeded TVA's stretch goal, driven by consistent above target performance for each year in the period
•Customer Survey - despite improving commitment levels in 2021 and the highest ever commitment score in 2022, 2023 resulted in an average score below target for the three-year performance period
ü Continued economic development efforts have been successful (2021-2023)
•Companies have announced $28.2 billion in projected investments, and
•Approximately 205,800 jobs (61,300 jobs created and 144,500 jobs retained) are expected to be created/retained
The TVA Board, using its discretion to review results and approve adjustments in payouts, adjusted the calculated 2023 LTP payout percentage from 146 to 136. This adjustment recognizes TVA's strong performance over the three-year performance period while also acknowledging the events of Winter Storm Elliott. Payouts to the NEOs for the 2021–2023 LTP Award are described under each executive's compensation scorecard under 2023 Pay Decisions – 2023 NEO Pay Decisions and Compensation Scorecards below and reported in the Executive Compensation Tables and Narrative Disclosures – Summary Compensation Table under "Non-Equity Incentive Plan Compensation."
2022–2024 Outstanding LTP Performance Cycle
The TVA Board previously approved the following overall LTP measures of TVA performance for all participants for the three-year cycle ending September 30, 2024 (awards to be paid in November 2024):
| | | | | | | | | | | | | | | | | | | | | | | | | | |
| Performance Metric and Weighting | Threshold Target Stretch (50% Payout) (100% Payout) (200% Payout) |
| | | | | | | | |
Non-Fuel Delivered Cost of Power(1) | 45% | | | | | | | |
| 3.67 | 3.53 | 3.39 | |
| | | | | | | | |
| | | | | | | | |
Load Not Served(2) | 30% | | | | | | | |
| 4.5 | 3.9 | 3.2 | |
| | | | | | | | |
| | | | | | | | |
External Performance Indicators for the TVA Nuclear Fleet(3) | 15% | | | | | | | |
| 93.5 | 96.0 | 98.5 | |
| | | | | | | | |
| | | | | | | | |
Powerful Partnerships Survey(4) | 10% | | | | | | | |
| 74.0 | 78.0 | 82.0 | |
| | | | | | | | |
| | | | | | | | |
Notes
(1)Metric has same definition as for the 2021-2023 LTP awards. For the 2022-2024 performance cycle, the Non-Fuel Delivered Cost of Power measure will be calculated using an average of the 2022, 2023, and 2024 results.
(2)Metric has same definition as for the 2021-2023 LTP awards. For the 2022-2024 performance cycle, the Load Not Served measure will be calculated using an average of the 2022, 2023, and 2024 results.
(3)Metric has same definition as for the 2021-2023 LTP awards. For the 2022-2024 performance cycle, the External Performance Indicators for the TVA Nuclear Fleet measure will be calculated based on 2024 results.
(4)The Powerful Partnerships Survey measure is conducted among customers, elected officials, business and economic development leaders, and the general public in the TVA service area to assess the strength of various stakeholder relationships with TVA. For the 2022-2024 performance cycle, the Powerful Partnerships Survey measure will be calculated using an average of the 2022, 2023, and 2024 results.
Beginning with the 2022-2024 performance cycle, the Powerful Partnerships Survey has been added as a new measure, with a weighting of 10%, and replaces the former Stakeholder Survey and Customer Survey measures, as illustrated in the above chart.
2023–2025 Outstanding LTP Performance Cycle
In May 2022, the TVA Board approved the following overall LTP measures of TVA performance for all participants for the three-year cycle ending September 30, 2025 (awards to be paid in November 2025):
| | | | | | | | | | | | | | | | | | | | | | | | | | |
| Performance Metric and Weighting | Threshold Target Stretch (50% Payout) (100% Payout) (200% Payout) |
| | | | | | | | |
Non-Fuel Delivered Cost of Power(1) | 45% | | | | | | | |
| 3.44 | 3.31 | 3.18 | |
| | | | | | | | |
| | | | | | | | |
Load Not Served(2) | 30% | | | | | | | |
| 4.5 | 3.9 | 3.2 | |
| | | | | | | | |
| | | | | | | | |
External Performance Indicators for the TVA Nuclear Fleet(3) | 15% | | | | | | | |
| Industry Median | Top Quartile | Top Fleet | |
| | | | | | | | |
| | | | | | | | |
Powerful Partnerships Survey(4) | 10% | | | | | | | |
| 75.0 | 79.0 | 83.0 | |
| | | | | | | | |
Notes
(1)Metric has same definition as for the 2021-2023 LTP awards. For the 2023-2025 performance cycle, the Non-Fuel Delivered Cost of Power measure will be calculated using an average of the 2023, 2024, and 2025 results.
(2)Metric has same definition as for the 2021-2023 LTP awards. For the 2023-2025 performance cycle, the Load Not Served measure will be calculated using an average of the 2023, 2024, and 2025 results.
(3)Metric has same definition as for the 2021-2023 LTP awards. For the 2023-2025 performance cycle, the External Performance Indicators for the Nuclear Fleet measure will be calculated using 2025 results.
(4)Metric has same definition as for the 2022-2024 LTP awards. For the 2023-2025 performance cycle, the Powerful Partnerships Survey measure will be calculated using an average of the 2023, 2024, and 2025 results.
2020 Long-Term Retention Award Opportunity. Effective October 1, 2019, Mr. Lyash was granted a 2020 LTR program award of $1,014,000 that vests ratably over a three-year period, subject to continued employment on each vesting date. The first tranche was earned in 2020 as described above.
Other Compensation
Recruitment and Relocation Incentive. Mr. Lyash was paid $1,092,000 in 2020 as the second tranche of a recruitment and relocation incentive under his employment offer letter. This incentive was intended to compensate him for amounts he forfeited from his previous employer in order to join TVA, as well as to provide some measure of substitute compensation in light of his not being eligible to earn any long-term performance incentive payments until September 2021.
| | |
2020 INDIVIDUAL PERFORMANCE HIGHLIGHTS
•TVA debt was reduced to the lowest level in 30 years and to the level committed to OMB three years ahead of plan significantly lowering interest expenditures.
•The reliability of the transmission system and of the nuclear, gas, coal, and hydroelectric generation fleets all improved. This strong fleet performance reduced fuel and purchased power costs while continuing to reduce TVA's environmental footprint.
•Operating and Maintenance costs were also lowered, helping to offset the revenue reduction caused by the global pandemic.
•The aggregate impact of these achievements was that TVA not only held rates flat but returned $163 million to LPCs participating in the long-term Partnership Agreement during 2020.
•These achievements also enabled TVA to deliver a wide range of pandemic support programs to LPCs, businesses, and communities that lessened their burden and helped businesses across the Tennessee Valley recover.
•The performance achieved in 2020 is expected to help keep rates flat again next year and allow an additional Pandemic Relief Credit of $200 million in 2021.
•This performance places TVA base rates plus fuel at their lowest level in over a decade. In the public power model, the benefits of this performance do not accrue to shareholders; rather, they flow directly to the people TVA serves and now more than ever at the time they need it most.
•Mr. Lyash's highest rated competencies were adaptability, effective communication, business acumen, accountability and driving for results, and leveraging diversity.
| | |
| | | | | | | | | | | |
| | | |
JOHN M. THOMAS, III
Executive Vice President and Chief Financial Officer
Joined TVA November 2005
| | | 2020 TOTAL DIRECT COMPENSATION EARNED
$2,876,994
Base Salary. Mr. Thomas' salary was increased three percent to $666,584 for 2020, reflecting outstanding performance and positioning to maintain a competitive base salary.
EAIP Payment Earned. Organizational performance under the TVA EAIP Scorecard exceeded target for all but one measure, resulting in a 137 percent payout percentage. Company performance under the TVA Corporate Multiplier measures was strong for nearly all measures despite the challenges presented by COVID-19. As a result, the TVA Board approved a 1.0x Corporate Multiplier.
The CEO approved an Individual Performance Multiplier of 1.0x for Mr. Thomas for 2020. Based on Mr. Thomas' strong performance and overall rating of 4 out of 5, TVA's guidelines for applying an individual performance multiplier to annual incentive awards would have provided for an individual performance multiplier of up to 1.2x to his 2020 EAIP award. Consideration of the execution of the ongoing Information Technology transition initiative and the use of H1-B Visa workers in that process led the CEO to approve a 1.0x multiplier for Mr. Thomas. Based on TVA's guidelines, a 1.0x is at the bottom of the range for a 4 performance rating.
Long-Term Incentives Earned
Long-Term Performance Awards Earned. Organizational performance under the 2018–2020 LTP program was stronger than expected in key operational measures, resulting in significantly lower than expected Non-Fuel Delivered Cost of Power and Load Not Served. However, several external measures failed to meet threshold targets. In light of improvements in other key performance areas, such as financial health, the TVA Board determined that the 129 percent calculated payout appropriately reflected executive performance in executing on TVA's long-term priorities and did not exercise its discretion to adjust the payout.
Long-Term Retention Awards Earned. Mr. Thomas earned $383,334 in 2020 upon the vesting of the 2020 tranches of his 2018, 2019, and 2020 LTR program awards. The LTR awards vest ratably over a three-year period, subject to continued employment on each vesting date.
Long-Term Incentive Opportunities Granted
2020–2022 Long-Term Performance Award Opportunity. Effective October 1, 2019, Mr. Thomas was granted a 2020–2022 LTP program award with a target opportunity of $980,000, which will vest on September 30, 2022. The actual payout of the award will depend on performance against targets at the end of the three-year performance period.
2020 Long-Term Retention Award Opportunity. Effective October 1, 2019, Mr. Thomas was granted a 2020 LTR program award of $420,000 that vests ratably over a three-year period, subject to continued employment on each vesting date. The first tranche was earned in 2020 as described above.
|
| | |
2020 INDIVIDUAL PERFORMANCE HIGHLIGHTS
•Executed CFO function at exceptionally high level and assumed leadership responsibility for technology and innovation units in 2020
•Responded swiftly to significant revenue loss presented by the COVID-19 pandemic by working across the organization to reduce O&M expense and adjust capital spending
•Effectively managed TVA liquidity, access to debt markets and liability management activities to maintain TVA's strong financial position and lower interest expense
•Executed major bond issuance with TVA attaining the lowest interest rate in its history
•Led efforts whereby TVA reduced debt to lowest level in 30 years – target debt level reduction achieved three years ahead of plan
•Successfully implemented the Long-Term Partnership Agreements, which returned $163 million to participating LPCs in 2020
•Developed and championed additional COVID-19 pandemic-related financial support response in the form of $1.0 billion in LPC credit support, direct fund matching to communities through the Community Care Fund, and business support through the Back-to-Business Credit program
•Established innovation agenda through which TVA has implemented an aggressive and innovative solar program that has resulted in substantial expansion of TVA's solar portfolio without adversely impacting rates
| | |
| | | | | | | | | | | |
| | | |
MICHAEL D. SKAGGS
Executive Vice President and Chief Operating Officer
Joined TVA February 1994
| | | 2020 TOTAL DIRECT COMPENSATION EARNED
$2,813,695
Base Salary. Mr. Skaggs's salary was increased seven percent to $663,400 for 2020, reflecting outstanding performance and positioning to maintain a competitive base salary.
EAIP Payment Earned. Organizational performance under the TVA EAIP Scorecard exceeded target for all but one measure, resulting in a 137 percent payout percentage. Company performance under the TVA Corporate Multiplier measures was strong for nearly all measures despite the challenges presented by COVID-19. As a result, the TVABoard approved a 1.0x Corporate Multiplier.
The CEO approved an Individual Performance Multiplier of 1.10x for Mr. Skaggs for 2020 given his exemplary performance, including those considerations noted under 2020 Individual Performance Highlights.
Long-Term Incentives Earned
Long-Term Performance Awards Earned. Organizational performance under the 2018–2020 LTP program was stronger than expected in key operational measures, resulting in significantly lower than expected Non-Fuel Delivered Cost of Power and Load Not Served. However, several external measures failed to meet threshold targets. In light of improvements in other key performance areas, such as safety, the TVA Board determined that the 129 percent calculated payout appropriately reflected executive performance in executing on TVA's long-term priorities and did not exercise its discretion to adjust the payout.
Long-Term Retention Awards Earned. Mr. Skaggs earned $383,000 in 2020 upon the vesting of the 2020 tranches of his 2018, 2019, and 2020 LTR program awards, respectively. The LTR program awards vest ratably over a three-year period, subject to continued employment on each vesting date.
Long-Term Incentive Opportunities Granted
2020–2022 Long-Term Performance Award Opportunity. Effective October 1, 2019, Mr. Skaggs was granted a 2020–2022 LTP program award with a target opportunity of $990,000 which will vest on September 30, 2022. Actual payout will depend on performance against targets at the end of the three-year performance period.
2020 Long-Term Retention Award Opportunity. Effective October 1, 2019, Mr. Skaggs was granted a 2020 LTR program award of $429,000 that vests ratably over a three-year period, subject to continued employment on each vesting date. The first tranche was earned in 2020 as described above.
|
| | |
2020 INDIVIDUAL PERFORMANCE HIGHLIGHTS
•First and foremost, led the operational teams to the best industrial safety performance in TVA history, with Serious Injury Rate improving to industry top decile and OSHA Injury Rate improving to industry top decile
•Led improvement efforts for critical support functions of supply chain, environmental programs, and security in 2020
•Led significant improvement of non-nuclear generation fleet performance in 2020, exceeding aggressive goals and contributing to lower fuel costs and considerable savings to customers
•Continuously improved transmission reliability in 2020, setting industry performance standards, and resulting in more reliable and higher-quality power delivery to industrial customers, LPCs, and communities
•Executed the Grid 2023 program, which is focused on building the integrated energy system of the future, on schedule and on budget
| | |
| | | | | | | | | | | |
| | | |
SHERRY A. QUIRK
Executive Vice President and General Counsel
Joined TVA February 2015
| | | 2020 TOTAL DIRECT COMPENSATION EARNED
$2,253,150
Base Salary. Ms. Quirk's salary was increased three percent to $557,291 for 2020, reflecting strong performance and positioning to maintain a competitive base salary.
EAIP Payment Earned. Organizational performance under the TVA EAIP Scorecard exceeded target for all but one measure, resulting in a 137 percent payout percentage. Company performance under the TVA Corporate Multiplier measures was strong for nearly all measures despite the challenges presented by COVID-19. As a result, the TVA Board approved a 1.0x Corporate Multiplier.
The CEO approved an Individual Performance Multiplier of 1.0x for Ms. Quirk for 2020 given her strong performance, including those considerations noted under 2020 Individual Performance Highlights.
Long-Term Incentives Earned
Long-Term Performance Award Payments Earned. Organizational performance under the 2018–2020 LTP program was stronger than expected in key operational measures, resulting in significantly lower than expected Non-Fuel Delivered Cost of Power and Load Not Served. However, several external measures failed to meet threshold targets. In light of improvements in other key performance areas, such as safety, the TVA Board determined that the 129 percent calculated payout appropriately reflected executive performance in executing on TVA's long-term priorities and did not exercise its discretion to adjust the payout.
Long-Term Retention Award Payments Earned. Ms. Quirk earned $290,667 in 2020 upon the vesting of the 2020 tranches of her 2018, 2019, and 2020 LTR program awards, respectively. The LTR program awards vest ratably over a three-year period, subject to continued employment on each vesting date.
Long-Term Incentive Opportunities Granted
2020–2022 Long-Term Performance Award Opportunity. Effective October 1, 2019, Ms. Quirk was granted a 2020–2022 LTP program award with a target opportunity of $695,000, which will vest on September 30, 2022. Actual payout will depend on performance against targets at the end of the three-year performance period.
2020 Long-Term Retention Award Opportunity. Effective October 1, 2019, Ms. Quirk was granted a 2020 LTR program award of $297,000 that vests ratably over a three-year period, subject to continued employment on each vesting date. The first tranche was earned in 2020 as described above.
|
| | |
2020 INDIVIDUAL PERFORMANCE HIGHLIGHTS
•Effectively led the activities of the Office of the General Counsel ("OGC") across multiple areas of law, including nuclear, regulatory, commercial, environmental, litigation, employment, natural resources, and others
•Served a critical role as an insightful and prudent advisor to the Enterprise Leadership Team and to the TVA Board
•Supported the TVA Board in developing and implementing a number of changes intended to strengthen the company's governance and improve transparency
•Led OGC's critical role in the development of the Long-Term Partnership Proposal and Flexibility Program that was overwhelmingly adopted by local power companies
•Collaboratively restructured the legal department to align with the enterprise's focus of allocation of resources to risks
•Counseled enterprise through a variety of novel legal challenges
•Played key role in developing the basis and structure of the portfolio of COVID-19 pandemic-related programs delivered across the TVA service area
•Made a positive impact on the TVA workforce with actions to strengthen the TVA Ethics Program and TVA Diversity and Inclusion Program
•Led the OGC creation and execution of the OGC pro-bono legal support initiative which launched in Memphis, Tennessee and is already positively impacting lives
| | |
| | | | | | | | | | | |
| | | |
TIMOTHY S. RAUSCH
Executive Vice President and
Chief Nuclear Officer (effective November 13, 2020; formerly Senior Vice President and Chief Nuclear Officer)
Joined TVA October 2018
| | | 2020 TOTAL DIRECT COMPENSATION EARNED
$1,216,990
Base Salary. Mr. Rausch's salary was increased three percent to $535,600 for 2020, reflecting strong performance and positioning to maintain a competitive base salary.
EAIP Payment Earned. Organizational performance under the TVA EAIP Scorecard exceeded target for all but one measure, resulting in a 137 percent payout percentage. Company performance under the TVA Corporate Multiplier measures was strong for nearly all measures despite the challenges presented by COVID-19. As a result, the TVA Board approved a 1.0x Corporate Multiplier.
The CEO approved an Individual Performance Multiplier of 1.0x for Mr. Rausch for 2020 given his strong performance, including those considerations noted under 2020 Individual Performance Highlights.
Long-Term Incentives Earned
Long-Term Retention Award Payments Earned. Mr. Rausch earned $167,750 in 2020 upon the vesting of the 2020 tranches of his 2019 and 2020 LTR program award. The LTR program award vests ratably over a three-year period, subject to continued employment on each vesting date.
Long-Term Incentive Opportunities Granted
2020–2022 Long-Term Performance Award Opportunity. Effective October 1, 2019, Mr. Rausch was granted a 2020–2022 LTP program award with a target opportunity of $500,000, which will vest on September 30, 2022. Actual payout will depend on performance against targets at the end of the three-year performance period.
2020 Long-Term Retention Award Opportunity. Effective October 1, 2019, Mr. Rausch was granted a 2020 LTR program award of $330,000 that vests ratably over a three-year period, subject to continued employment on each vesting date. The first tranche was earned in 2020 as described above.
Other Compensation Performance Incentive Arrangement.Mr. Rausch earned $350,000 in 2020 pursuantTo recruit high-quality talent, TVA may offer recruitment awards as well as relocation assistance and reimbursement. These types of deferred cash incentive awards are intended to compensate the Performance Incentive Arrangement ("PIA") award opportunity that was granted to him in connection with his employment agreement in 2018. The award opportunity was grantedindividuals for amounts they may have forfeited from their previous employer in order to compensatejoin TVA and/or provide substitute compensation when the individual is not eligible to receive certain incentive payments until a future date.
In July 2023, Mr. Rausch for incentive awards forfeited upon joining TVA but were payable subject toMoul received the CEO's evaluation of Mr. Rausch's performance. Given his strong performance, including those considerations noted under 2020 Individual Performance Highlights, Mr. Rausch received his maximum opportunity under the PIA award. Recruitment and Relocation Incentive. Mr. Rausch was paid $100,000 in 2020 as the secondthird and final trancheinstallment of a deferred cash recruitment and relocation incentive in the amount of $100,000 that was part of his 2021 employment offer. In 2023, Mr. Moul received an additional $110,182 in relocation benefits as reported in the Executive Compensation Tables and Narrative Disclosures – Summary Compensation Table under his"All Other Compensation".
Executive Severance Plan TVA has established an Executive Severance Plan to provide additional benefits to certain executives if TVA terminates the employment offer letter.of covered executives other than for Gross Misconduct or such executives terminate for Good Reason. See Executive Compensation Tables and Narrative Disclosures - Executive Severance Plan below for additional information regarding the benefits available to covered executives under the Executive Severance Plan as well as definitions of Gross Misconduct and Good Reason. |
| | |
2020 INDIVIDUAL PERFORMANCE HIGHLIGHTS
Retirement Benefits TVA provides its NEOs with retirement benefits through its qualified plans as well as through a non-qualified supplemental executive retirement plan ("SERP") in order to provide compensation beginning with retirement or termination of employment (if vesting requirements are satisfied), with enhanced compensation for certain executives to provide an additional incentive for hiring and retention of qualified individuals. TVA sponsors a qualified defined benefit plan ("pension plan") and a qualified defined contribution plan ("401(k) plan"), which are administered by the TVA Retirement System ("TVARS"). The availability of, and level of benefits provided by, these qualified plans are comparable to similar qualified plans provided by companies in TVA's peer group. In addition to its qualified retirement plans, TVA has a SERP for selected executives who are critical to the ongoing success of the enterprise. TVA's SERP is a non-qualified plan that provides supplemental retirement benefits at compensation levels that are higher than the limits specified by Internal Revenue Service ("IRS") regulations for qualified retirement plans. The provision of such non-qualified plans to executives is a common practice among companies in TVA's peer group. The purpose of the SERP is to: •Led strong TVA nuclear fleet progress towards best-in-class operationProvide a competitive retirement benefit level that cannot be delivered solely through TVA's qualified retirement plans due to IRS limitations, and •DevelopedProvide a benefit level (as a percentage replacement of pre-retirement pay) that is more comparable to that of employees who are not subject to the IRS limitations. More information regarding these retirement benefits is found following the Pension Benefits Table. Health and implemented Nuclear Excellence Plan, resultingOther Benefits TVA offers a group of health and other benefits (medical, dental, vision, life and accidental death and disability insurance, and long-term disability insurance) that are available to a broad group of employees. The NEOs are eligible to participate in stronger nuclear fleet performanceTVA's health benefit plans and other non-retirement benefit plans on the same terms and at the same contribution rates as other TVA employees.
•Led Extended Power Uprate program at Browns Ferry Nuclear plant that increased cost effective power output by 14 percent2023 Performance Goals and received nuclear industry recognition for project excellencePerformance Achievement
–Browns Ferry Nuclear Unit 1 completed the longest continuous operating run in its history
•Led four major nuclear plant refueling outages involving thousands of workers, with three completed under budget and two completed on schedule despite challenges presented by the COVID-19 pandemic
–Sequoyah Nuclear Plant, Unit 2, completed its outage in 23 days, which is top quartile performance and contributed to lower fuel costs
•Led the organization in achieving the industry's first Early Site Permit for Small Modular Reactors, which is a critical milestone in the development of this future zero carbon generating resource
CEO Pay Ratio Disclosure
As required by Section 953(b) of the Dodd-Frank Wall Street Reform and Consumer Protection Act of 2010 and Item 402(u) of Regulation S-K, TVA is providing the following information regarding the annual total compensation of TVA's CEO position and the annual total compensation of the median employee of the company:
•The total compensation for the CEO position for 2020 was $7,297,233.
•For 2020, the median employee's annual total compensation was $136,920. | | Strategic Priorities | | Incentive Compensation Metrics* | A significant portion of each NEO's compensation is based on company performance and influenced by individual performance achievements. As a result, a majority of NEO compensation is at-risk, providing incentive for the executive to achieve superior performance for TVA and for the businesses, communities, and residents it serves, both in the short term and in the years to come. Incentive compensation is provided to NEOs under the EAIP and LTIP. Each incentive award is described below. | | People
Advantage Amplifying the energy, passion, and creativity within each TVA employee | | Safety - Serious Injury Incident Rate ("SIIR") | | Operational Excellence Building on TVA's best-in-class reputation for reliable service and competitively priced power | | Load Not Served Annualized Nuclear Online Reliability Loss Factor Combined Cycle Equivalent Availability Factor Coal Equivalent Availability Factor External Performance Indicators for the TVA Nuclear Fleet | | Financial Strength Investing in the future, while keeping energy costs as low as possible | | Total Financing Obligations Operating Cash Flow Net Income Total Spend Non-Fuel Delivered Cost of Power | | Powerful Partnerships Promoting progress through the shared success of TVA's customers and stakeholders | | Jobs Created and Retained Stakeholder Survey Customer Survey
| | Igniting Innovation Pursuing innovative solutions for TVA and its customers and communities | | | |
*Incentive compensation metrics are further described below in 2023 Incentive Plan Performance Metrics and Long-Term Performance Awards.
Executive Annual Incentive Plan
All TVA employees participate in an annual incentive program (subject to eligibility requirements), since every employee contributes to the success of TVA and the execution of its public power mission. While the metrics used for annual incentives are the same for all employees, they are provided under two plans: the WPTIP provides for annual incentive awards for eligible non-executives, and the EAIP provides for annual incentive awards for eligible executives, including the NEOs.
The EAIP is designed to encourage and reward executives for successfully achieving annual financial and operational goals. For 2023, each NEO's annual incentive payment was calculated as follows:
Based on this information, the pay ratio of the total compensation for the CEO position to the median employee was approximately 53 to 1.
To identify the median employee and to determine the annual total compensation of the median employee, TVA took the following steps:
•TVA selected September 30, 2020, as the date on which to identify its median employee. On September 30, 2020, TVA's employee population (including full-time, part-time, and temporary employees) consisted of 9,942 individuals located in the U.S.
•In order to identify the median employee from its employee population, TVA compared the compensation that would be included in Box 5 (Medicare Wages and Tips) of Form W-2, which includes salary, overtime, and incentive compensation, for the period from October 1, 2019 to September 30, 2020. Box 5 compensation was used as it is representative of the compensation received by all employees and is readily available and objective.
•After identifying its median employee, TVA calculated that employee's compensation for 2020 as though that compensation were being calculated for purposes of the Summary Compensation Table, resulting in annual total compensation of $136,920.
The above pay ratio is a reasonable estimate calculated in a manner consistent with Item 402(u) of Regulation S-K. Because Item 402(u) provides companies with flexibility to select the methodology and assumptions used to identify the median employee and to calculate the pay ratio, the pay ratio reported by TVA may not be comparable to the pay ratios reported by other companies.
Executive Compensation Tables and Narrative Disclosures
Summary Compensation and Grants of Plan-Based Awards
The following table provides information on compensation earned by each of the NEOs in 2020 (and 2019 and 2018, as applicable).
SUMMARY COMPENSATION TABLE
| | | | | | | | | | | | | | | | | | | | | | | | | | | | | | | | | | | | | | | | | | | | | |
| Name and Principal Position | Year | Salary | | Bonus(1) | | | | Non-Equity Incentive Plan Compensation(2) | | Change in Pension Value and
Nonqualified Deferred Compensation Earnings(3) | | All Other Compensation(4) | | Total | |
| Jeffrey J. Lyash | 2020 | $ | 1,058,000 | | | $ | — | | | | | $ | 2,729,609 | | | | $ | 2,271,647 | | | | $ | 1,237,977 | | | $ | 7,297,233 | | |
| President and Chief | 2019 | 445,846 | | | 380,000 | | | | 861,969 | | (5) | | 5,970,873 | | (6) | | 504,835 | | | 8,163,523 | | |
| Executive Officer | | | | | | | | | | | | | | | | | |
| | | | | | | | | | | | | | | | | |
| | | | | | | | | | | | | | | | | |
| | | | | | | | | | | | | | | | | |
| | | | | | | | | | | | | | | | | |
| John M. Thomas, III | 2020 | $ | 666,584 | | | $ | — | | | | | $ | 2,210,410 | | | | $ | 980,220 | | | | $ | 21,000 | | | $ | 3,878,214 | | |
| Executive Vice President | 2019 | 648,208 | | | 52,500 | | | | | 1,804,797 | | (7) | | 1,076,752 | | (8) | | 20,625 | | | 3,602,882 | | |
| and Chief Financial Officer | 2018 | 629,023 | | | — | | | | | 1,692,318 | | (9) | | 173,723 | | (10) | | 20,250 | | | 2,515,314 | | |
| Michael D. Skaggs | 2020 | $ | 663,400 | | | $ | — | | | | | $ | 2,150,295 | | | | $ | 1,609,999 | | | | $ | 12,600 | | | $ | 4,436,294 | | |
| Executive Vice President | 2019 | 614,692 | | | 52,500 | | | | | 1,716,194 | | (11) | | 2,017,130 | | (12) | | 12,375 | | | 4,412,891 | | |
| and Chief Operating Officer | 2018 | 520,951 | | | — | | | | | 1,422,133 | | (13) | | 320,678 | | (14) | | 12,150 | | | 2,275,912 | | |
| Sherry A. Quirk | 2020 | $ | 557,291 | | | $ | — | | | | | $ | 1,695,859 | | | | $ | 360,648 | | | | $ | 25,200 | | | $ | 2,638,998 | | |
| Executive Vice President | 2019 | 540,751 | | | 47,250 | | | | | 1,441,756 | | (15) | | 401,540 | | (16) | | 24,750 | | | 2,456,047 | | |
| and General Counsel | 2018 | 511,254 | | | — | | | | | 1,288,900 | | (17) | | 207,166 | | (18) | | 24,300 | | | 2,031,620 | | |
| Timothy S. Rausch | 2020 | $ | 535,600 | | | $ | — | | | | | $ | 1,031,390 | | | | $ | 106,428 | | | | $ | 159,794 | | | $ | 1,833,212 | | |
| Executive Vice President | 2019 | 502,000 | | | — | | | | | 713,750 | | (19) | | 72,784 | | (20) | | 255,735 | | | 1,544,269 | | |
| and Chief Nuclear Officer | | | | | | | | | | | | | | | | | |
(1) The 2020 data is outlined in the table below.
BONUS
| | | | | | | | | | | | | | | | | | | | | | | | | | | | | | | | |
EAIP
Amount | = | Annual
Salary | × | Annual Target
Incentive
Opportunity | × | Percent of
Scorecard
Opportunity
Achieved
(0% to 200%) | × | Corporate
Multiplier
(0 to 1.1) | × | Individual
Performance
Multiplier
(0% to 150%) |
Each component of this calculation is discussed below (except for annual salary, which is discussed above). The award for certain participants in the WPTIP and the EAIP may be adjusted by the participant's supervisor based on an evaluation of the participant's individual achievements and performance during the year. In addition, pursuant to discretion granted under the TVA Compensation Plan, awards may be further adjusted by the TVA Board or the CEO (1) as a result of any unusual or nonrecurring event affecting TVA or the financial statements of TVA, or (2) as a result of changes in business conditions or the business strategy of TVA. There is no guaranteed minimum payout under the EAIP or WPTIP, and the maximum payout for either plan cannot exceed 225 percent of the target award.
Annual Target Incentive Opportunity
Following a review of benchmarking and individual performance, the TVA Board evaluated the appropriateness of the EAIP award opportunity for the CEO based on market data and other individual factors and made no changes for 2023. Similarly, the CEO evaluated the appropriateness of the EAIP award opportunities for the other NEOs based on market data and other individual factors, including internal parity, and made no changes for 2023. Accordingly, target EAIP award opportunities of the NEOs for 2023 were as follows:
| | | | | |
| Named Executive Officers | 2023 Target Annual Incentive Opportunity(1) |
| Mr. Lyash | 150 | % |
| Mr. Thomas | 80 | % |
| Mr. Moul | 80 | % |
| Mr. Rausch | 70 | % |
| Mr. Fountain | 70 | % |
| |
Note
(1)Represents a percent of each NEO's annual salary.
2023 Incentive Plan Performance Metrics
The metrics used to measure performance under the WPTIP and EAIP are the same for all TVA employees. These metrics tie directly to key enterprise metrics used by senior management in its annual budget and strategic planning process, which in turn tie directly to the achievement of TVA's strategic objectives and mission. The 2023 WPTIP and EAIP metrics and goals were set out in an organizational scorecard ("TVA Enterprise Scorecard") applicable to all employees. The 2023 performance measures, along with the weighting ascribed to each, are shown below as a percentage of the total WPTIP/EAIP award opportunity at target-level performance.
| | | | | | | | | | | | | | | | | |
| | | | | |
2023 WPTIP/EAIP METRICS | | | The 2023 WPTIP/EAIP metrics are described in detail below. |
| | | TVA Total Spend What this measures: TVA's ability to keep costs low Total Non-Fuel Operating and Maintenance, Capital, Non-Fuel Inventory, and Cloud Implementation expenses for corporate and operational Strategic Business Unit organizations (excludes Board of Directors). | Why Is This Metric Used? Supports the overall TVA goal of maintaining costs and managing rates based on spending levels approved by TVA management and the TVA Board. |
| | | | |
| | | | |
| | | Load Not Served What this measures: Transmission system outages that affect TVA customers Load Not Served ("LNS") is a measure of the magnitude and duration of transmission system outages that affect TVA customers expressed in system minutes. An automatic customer interruption with a duration of one minute or greater is tracked as an LNS event. LNS events caused by TVA on a distributor system will also count as a TVA event even if the TVA system remains energized. LNS events exclude interruptions due to declared major events, variances, gunfire, vandalism, and verified tornadoes. | Why Is This Metric Used? TVA manages this critical indicator to reduce the impact of customer outages. |
| | | | |
| | | | |
| | | | |
| | | Annualized Nuclear Online Reliability Loss Factor What this measures: Nuclear plant availability Annualized Nuclear Online Reliability Loss Factor is the 12-month ratio of all generation losses (minus refueling outage (“RFO”) and exempt losses) to reference energy generation (minus RFO and exempt losses) in a normal fuel cycle period, per external standard nuclear industry guidelines.
| Why Is This Metric Used? Monitors performance between refueling outages to obtain high unit and energy production reliability. |
| | | | | |
| | | | Combined Cycle Equivalent Availability Factor What this measures: Combined cycle plant reliability Combined Cycle Equivalent Availability Factor ("EAF") reflects the percentage of time over a given period that a generating unit was available to generate electricity for TVA-operated combined cycle generating assets, based on Generating Availability Data System ("GADS") event reporting guidelines for megawatt hour losses. Combined Cycle EAF excludes events classified as outside management control and variances. | Why Is This Metric Used? Combined Cycle EAF focuses on ensuring TVA combined cycle generating assets are available and reliable to meet system demand. |
| | | | | |
| | | | | |
| | | | Coal Equivalent Availability Factor What this measures: Coal plant reliability Coal EAF reflects the percentage of time over a given period that a generating unit was available to generate electricity for TVA coal generating assets, based on GADS event reporting guidelines for megawatt hour losses. Coal EAF excludes events classified as outside management control and variances. | Why Is This Metric Used? Coal EAF focuses on ensuring TVA coal generating assets are available and reliable to meet system demand. |
| | | | | |
| | | | | |
In setting the goal for each metric, consideration is given to TVA's historic performance, its strategic business plan priorities and strategic benchmarking goals, customer and stakeholder feedback, environmental and regulatory concerns and goals, and the competitive environment. Achievement of the target goal would result in a 100 percent payout with respect to that goal. A threshold goal is also set for each metric, so that no payout would occur with respect to metrics that fail to achieve that threshold. Additionally, a stretch goal for each metric is set to incentivize and reward exceptional performance. Linear interpolation is used for results between threshold and stretch goals.
2023 Executive Annual Incentive Plan Results
The performance results on the 2023 TVA Enterprise Scorecard are set forth below. Performance reflects a 185 percent opportunity achieved against target (on a scale from 0 percent - 200 percent), followed by the application of the EAIP Corporate Multiplier, 0.85.
TVA'S 2023 ENTERPRISE SCORECARD PERFORMANCE(1)
Note
(1) The TVA Enterprise Scorecard sets forth the performance goals applicable to the WPTIP and the EAIP.
Corporate Multiplier Allows TVA Board to Adjust for Overall Performance
| Jeffrey J.
Lyash | | | | John M.
Thomas, III | | Michael D.
Skaggs | | Sherry A.
Quirk | | Timothy S.
Rausch |
LTP Scorecard Adjustment | $ | — | | | | | $ | — | | | $ | — | | | $ | — | | | $ | — | |
Sign-on Bonus | — | | | | | | | | | | | | | | |
As in previous years, the TVA Board approved the use of a corporate multiplier for the 2023 EAIP. The corporate multiplier ranges between 0 and 1.1. The multiplier was based on performance in 2023 against goals set in May 2022 for six organizational metrics, and following are key highlights for this performance period: •Continued overall strong safety performance, while also acknowledging an employee fatality – 2023 SIIR remains top decile, based on most recent data available •Financial health and performance – continued strong financial performance with TFO exceeding stretch; Net income exceeding target; and Operating Cash Flow exceeding threshold and below target •Jobs created and jobs retained – 2023 efforts continued to help attract and encourage the expansion of business and industries –$9.2 billion in projected investments, and –Expected creation/retention of 58,411 jobs (12,276 jobs created and 46,135 jobs retained) •Overall performance – strong performance with record–setting results across a broad range of metrics while also acknowledging the events of Winter Storm Elliott and an employee fatality | | | | |
| | Why does the TVA Board
use a multiplier? | |
| | | |
| | The multiplier allows the TVA Board to qualitatively assess the organization's performance, emphasizing the importance of safety, financial health, reputation, and economic development. | |
|
|
|
The TVA Board and the CEO qualitatively assessed TVA’s performance at the end of the 2023 performance period. Based on TVA's performance with respect to the 2023 corporate multiplier measures and the overall performance described above, and considering the additional accountabilities of the leadership team in regards to the events of Winter Storm Elliott and an employee fatality, the TVA Board determined to apply a 0.85 multiplier to the calculated EAIP payout.
Corporate Multiplier Factors
| | | | | | | | | | | |
| Metric | Definition | Why Is This Metric Used? |
Safety – Serious
Injury Incident Rate
("SIIR") | A mathematical calculation used by Edison Electric Institute that quantifies the extent of injury for serious injuries and fatalities from events within the control of the employee and/or the employer. | TVA shares a professional and personal commitment to protect the safety of its employees, its contractors, its customers, and those in communities that TVA serves. |
| Total Financing Obligations ("TFO") | TFO is calculated by subtracting unbudgeted contributions to unfunded liabilities from the sum of (1) long-term debt (including unamortized premiums/discounts), (2) short-term debt, (3) leaseback obligations, (4) energy prepayment obligations, and (5) variable interest entities. | TVA's TFOs are driven by its business plan and reflect the application of sound financial guiding principles. Focusing on this measure will improve TVA's fiscal performance and strengthen TVA's balance sheet. |
| Operating Cash Flow | Amount of cash generated from power production and other mission-related activities and generally defined as operating revenues received less cash payments made for operating expenses. See Part II, Item 8, Financial Statements and Supplementary Data – Consolidated Statements of Cash Flows for additional information. | Operating Cash Flow is considered a key indicator of overall financial health as it measures TVA's ability to use cash received from customers to sufficiently fund outgoing cash expenditures. |
| Net Income | Consists of the entity’s net earnings derived by adjusting revenues for the cost of doing business, including the cost of sales, depreciation, interest, taxes, and other expenses. See Part II, Item 8, Financial Statements and Supplementary Data – Consolidated Statements of Operations for additional information. | Net income is a standard accounting measure that provides a view of TVA's financial performance and position. |
Jobs Created and Jobs Retained(1) | Measures the number of new or retained jobs in the Tennessee Valley for which TVA has played a role in the recruitment or retention of the economic development project. | Jobs Created and Retained is an industry standard measure that economic developers can speak to and easily understand, and provides an established tracking mechanism to measure TVA's economic development efforts. |
| Board Level Significant Events | Includes items deemed significant by the TVA Board of Directors. These items may affect TVA's reputation with its customers and its stakeholders, the organizational health of the workforce, or its impact on the public at large. Both favorable and unfavorable events will be considered. | An incentive pay program, by design, cannot cover the entire scope of activities that could occur during a given cycle. This measure allows the TVA Board to deem certain reputational, environmental, or other items as significant impacts to TVA's business. Items that may be considered significant (either favorably or unfavorably) include customer survey results, stakeholder survey results, key indicators of organizational health, environmental events, or other major events not covered in other performance measures. |
Note
(1) "Jobs created" in the TVA fiscal year are newly created, paid positions at a facility of a TVA customer, meaning any entity that purchases power from TVA or its distributor. "Jobs retained" are paid positions at a facility of a TVA customer that were created prior to the current TVA fiscal year and that continue to be filled in the current TVA fiscal year. See Part I, Item I, Business — Economic Development Activities for additional information.
— | |
|
2023 CORPORATE MULTIPLIER MEASURES (0.0 – 1.1 MULTIPLIER) Note (1)Includes impact of partnership credits. Partnership credits are wholesale bill credits provided to LPC customers who have signed long-term Partnership Agreements with TVA. For more information, see Part I, Item 1, Business — Customers. Individual Performance Multiplier Reinforces Pay for Performance Annually, individual goals for the NEOs are established at the beginning of each performance cycle. These goals tie to the achievement of TVA's mission and strategic objectives. A 50 percent weighting is assigned to business goals, and a 50 percent weighting is assigned to leadership competencies. No numerical measures are assigned to the goals. Rather, at the end of the performance period, the CEO assesses the performance of the other NEOs and informs the Committee of his decision on a multiplier for each NEO. For the CEO Individual Performance Multiplier, each TVA Board member assesses the CEO's performance at the end of a performance period on a scale of 1–5, with "5" representing superior performance. Results of the assessment are provided to the TVA Board Chair who, after consultation with the Committee, and with input from individual Board members, determines the multiplier to be applied to the CEO. For each NEO, the individual performance multiplier can range between 0% to 150% of the calculated payout and can be used to reduce (multiplier below 100%) or increase (multiplier above 100%) the amount of the award. For 2023, the NEOs were evaluated on individual performance goals and the following leadership competencies: Leadership Competencies | | | | | | | | | | | | | | | | Inspiring Trust and Engagement | Continuous Improvement | Vision, Innovation, & Strategic Execution | Leadership Courage | Building Organizational Talent | | Accountability and Driving for Results | Adaptability | Business Acumen | Effective Communication | Leveraging Diversity |
The 2023 individual multipliers and award payouts to the NEOs under the 2023 EAIP are described under each executive's compensation scorecard under 2023 Pay Decisions — 2023 NEO Pay Decisions and Compensation Scorecards below. Award
payouts are also reported in the "Non-Equity Incentive Plan Compensation" column in the Executive Compensation Tables and Narrative Disclosures — Summary Compensation Table.
| — | |
Long-Term Incentive Plan ("LTIP") Compensation TVA executives, including the NEOs, participate in the company's LTIP. These individuals make decisions that significantly influence the development and execution of TVA's long-term strategic objectives. As such, awards under TVA's LTIP are designed to reward executives for sustainable success. Since long-term success is supported by a commitment to continued employment, the NEOs are incentivized to remain with the company through the vesting of the LTP awards and LTR awards, as discussed below. | | | | | — | | Total | $ | — | | | | | $ | — | | | $ | — | | | $ | — | | | $ | — | | | | | | | LONG-TERM AWARDS REWARD LONG-TERM SUCCESS | | | LONG-TERM INCENTIVE AWARDS | | | | | •Enterprise-wide performance criteria that are directly aligned with TVA's mission •"Cumulative" performance approach to measure performance achieved over a three-year period with a new three-year performance cycle beginning each year •Potential payment range of 0 percent to 200 percent of target incentive opportunity to enable awards that are commensurate with performance achievements •Award opportunities established for each performance cycle below or near median levels of competitiveness with TVA's peer group •LTP awards vest upon the completion of the three-year performance period, contingent upon continued employment through vesting date and subject to achievement of performance goals •LTR awards vest in one-third increments over three years, contingent upon continued employment on each vesting date | | | |
The TVA Board and Mr. Lyash evaluated the appropriateness of the long-term incentive award opportunities for the CEO and other NEOs, respectively. For 2023, the values of the Total LTI awards (LTP awards at target and the LTR awards) were increased from 2022 levels, near market median, following a review of benchmarking and individual performance and reflective of increased tenure and experience. Accordingly, target long-term incentive award opportunities of the NEOs for 2023 were as follows: | | | | | | | | | | | | | | | | | | | | | | | | | | | NEO | 2023-2025 Granted LTI Values ($) | | 2023-2025 LTI - Increase vs 2022-2024 (%) | | LTP Target | LTR Award | TOTAL LTI | | | | LTP Target | LTR Award | TOTAL LTI | | Mr. Lyash | $ | 3,983,000 | | $ | 1,707,000 | | $ | 5,690,000 | | | | | 12% | 12% | 12% | | Mr. Thomas | 1,425,000 | | 600,000 | | 2,025,000 | | | | | 2% | 3% | 2% | | Mr. Moul | 1,425,000 | | 785,000 | | 2,210,000 | | | | | 21% | 0% | 13% | | Mr. Rausch | 725,000 | | 330,000 | | 1,055,000 | | | | | 22% | 0% | 14% | | Mr. Fountain | 970,000 | | 390,000 | | 1,360,000 | | | | | 26% | 18% | 24% |
Long-Term Performance Awards TVA's executive compensation program provides for an annual grant of an LTP award with a three-year performance period. During 2023, there were three overlapping LTP awards:
| | | | | | | | | | 2021–2023 LTP Award | Vested September 30, 2023 | | 2022–2024 LTP Award | Vesting September 30, 2024 | | 2023–2025 LTP Award | Vesting September 30, 2025 |
The performance metrics and threshold, target, and stretch goals for each metric are determined annually by the TVA Board. Following the TVA Board's approval of performance achievement at the end of each three-year performance period, awards are paid out in cash early in the subsequent fiscal year, or upon death, disability, or retirement, as described in TVA's Long-Term Incentive Plan. For the 2021-2023 LTP award cycle, target performance provides for a 100 percent payout opportunity, performance below threshold provides for no payout, performance at threshold provides for a 50 percent payout opportunity, and performance at stretch provides for a 200 percent payout opportunity. Linear interpolation is used for results between threshold and stretch goals. The TVA Board may apply discretion to adjust the final payout for LTP awards, if necessary, to ensure a fair and balanced outcome. (2) The 2020 data is outlined in the table below.
NON-EQUITY INCENTIVE PLAN COMPENSATION
| | | | | | | | | | | | | | | | | | | | | | | | | | | | | | | | | Jeffrey J.
Lyash | | | | John M.
Thomas, III | | Michael D.
Skaggs | | Sherry A.
Quirk | | Timothy S.
Rausch | | EAIP | $ | 2,391,609 | | | | | $ | 730,576 | | | $ | 799,795 | | | $ | 534,442 | | | $ | 513,640 | | | LTP | — | | | | | 1,096,500 | | | 967,500 | | | 870,750 | | | — | | LTR 2018-03(A) | — | | | | | 116,667 | | | 100,000 | | | 95,000 | | | — | | LTR 2019-02(B) | — | | | | | 126,667 | | | 140,000 | | | 96,667 | | | 57,750 | | LTR 2020-01(C) | 338,000 | | | | | 140,000 | | | 143,000 | | | 99,000 | | | 110,000 | | Performance Incentive Arrangement ("PIA")(D) | — | | | | | — | | | — | | | — | | | 350,000 | | | Total | $ | 2,729,609 | | | | | $ | 2,210,410 | | | $ | 2,150,295 | | | $ | 1,695,859 | | | $ | 1,031,390 | |
Notes
(A) LTR grant representing the third tranche of the LTR award effective October 1, 2017.
(B) LTR grant representing the second tranche of the LTR award effective October 1, 2018.
(C) LTR grant representing the first tranche of the LTR award effective October 1, 2019.
(D) Represents the maximum amount payable for the second payment of the PIA.
196 | | | | | | | | | | | | | | | LTP
Incentive
Amount | = | Target
Value | × | Percent of Opportunity Achieved
(0% to 200%) |
For the three-year performance period ended September 30, 2023, the TVA Board previously approved five overall long-term incentive measures of TVA performance to be applied to all participants in the LTP. The 2021–2023 performance measures, along with the weighting ascribed to each, are shown below as a percentage of the total LTP award opportunity at target-level performance.
(3) The 2020 data is outlined in the table below.
CHANGE IN PENSION VALUE AND NONQUALIFIED DEFERRED COMPENSATION EARNINGS
| | | | | | | | | | | | | | | | | | | | | | | | | | | | | | | | | Jeffrey J.
Lyash | | | | John M.
Thomas, III | | Michael D.
Skaggs | | Sherry A.
Quirk | | Timothy S.
Rausch | | Increase under TVARS Plans | $ | — | | | | | $ | 34,401 | | | $ | 55,129 | | | $ | — | | | $ | — | | | Increase under SERP | 2,271,647 | | | | | 945,819 | | | 1,554,870 | | | 360,648 | | | 106,428 | | | Total | $ | 2,271,647 | | | | | $ | 980,220 | | | $ | 1,609,999 | | | $ | 360,648 | | | $ | 106,428 | |
(4) The 2020 data is outlined in the table below.
ALL OTHER COMPENSATION
| | | | | | | | | | | | | | | | | | | | | | | | | | | | | | | | | Jeffrey J.
Lyash | | | | John M.
Thomas, III | | Michael D.
Skaggs | | Sherry A.
Quirk | | Timothy S.
Rausch | | 401(k) Matching Contribution | $ | 12,600 | | | | | $ | 12,600 | | | $ | 12,600 | | | $ | 12,600 | | | $ | 12,600 | | | Non-Elective 401(k) Contribution | 12,600 | | | | | 8,400 | | | — | | | 12,600 | | | 12,600 | | | Recruitment/Relocation Incentive | 1,092,000 | | | | | — | | | — | | | — | | | 100,000 | | | Relocation Benefits | 120,777 | | | | | — | | | — | | | — | | | 34,594 | | | Total | $ | 1,237,977 | | | | | $ | 21,000 | | | $ | 12,600 | | | $ | 25,200 | | | $ | 159,794 | |
(5) Represents $861,969 awarded under the EAIP.
(6) Reflects increase of $5,970,873 under the SERP.
(7) Represents $660,630 awarded under the EAIP, $817,500 awarded under the LTIP, and 326,667 awarded under the LTR.
(8) Reflects increases of $60,304 under the Cash Balance Pension and $1,016,448 under the SERP.
(9) Represents $653,452 awarded under the EAIP, $772,200 awarded under the LTIP, and $266,666 awarded under the LTR.
(10) Reflects increases of $27,604 under the Cash Balance Pension and $146,119 under the SERP.
(11) Represents $575,360 awarded under the EAIP, $817,500 awarded under the LTP, and $323,334 awarded under the LTR.
(12) Reflects increases of $91,600 under the Cash Balance Pension and $1,925,530 under the SERP.
(13) Represents $540,800 awarded under the EAIP, $648,000 awarded under the LTIP, and $233,333 awarded under the LTR.
(14) Represents increases of $49,607 under the Cash Balance Pension and $271,071 under the SERP.
(15) Represents $439,340 awarded under the EAIP, $735,750 awarded under the LTP, and $266,666 awarded under the LTR.
(16) Reflects increases of $401,540 under the SERP.
(17) Represents $464,100 awarded under the EAIP, $604,800 awarded under the LTIP, and $220,000 awarded under the LTR.
(18) Reflects an increase of $207,166 under the SERP.
(19) Represents $406,000 awarded under the EAIP, $57,750 awarded under the LTR, and $250,000 awarded under a Performance Incentive Arrangement.
(20) Reflects an increase of $72,784 under the SERP.
The following table provides information on non-equity incentive plan opportunities and grants provided to NEOs and the possible range of payouts associated with the opportunities and grants. Awards under the EAIP, LTP, LTR, and PIA that vested as of September 30, 2020, will be paid in cash during the first quarter of 2021.
197 | | | | | | | | | | | | | | | | | | | | | | | | 2021-2023 LTP PERFORMANCE METRICS | | | The 2021–2023 LTP metrics are described in detail below. | | | | Non-Fuel Delivered Cost of Power What this measures: non-fuel expenses (cents/kWh) The Non-Fuel Delivered Cost of Power is a financial measure equal to the sum of (i) non-fuel operating and maintenance ("O&M") expense, (ii) base capital cost, (iii) interest expense, and (iv) other expense divided by budgeted electric power sales. | Why Is This Metric Used? This measure drives performance through activities that management can control. It aligns with TVA's strategic objective of maintaining low rates and focuses on aligning TVA’s non-fuel costs associated with generation, transmission, statutory mission services, and additional customer services with revenue. Non-Fuel Delivered Cost of Power supports retail rate objectives and aligns to the business plan commitment. | | | | | | | | | | | | | | | Load Not Served What this measures: transmission system outages that affect TVA customers Load Not Served ("LNS") is a measure of the magnitude and duration of transmission system outages that affect TVA customers expressed in system minutes. An automatic customer interruption with a duration of one minute or greater is tracked as an LNS event. LNS events caused by TVA on a distributor system will also count as a TVA event even if the TVA system remains energized. LNS excludes interruptions due to declared major events, variances, gunfire, vandalism, and verified tornadoes. | Why Is This Metric Used? TVA manages this critical indicator to reduce the impact of customer outages. | | | | | | | | | | | | | | | | | External Performance Indicators for the TVA Nuclear Fleet What this measures: nuclear operations performance External Performance Indicators for the TVA Nuclear Fleet is calculated using a weighted combination of key performance indicators based on standard nuclear industry definitions for station performance, with the maximum obtainable being 100 points. | Why Is This Metric Used? This measure is a recognized industry standard for nuclear operations performance based on safety and reliability. | | | | | | | | | | | | | | | | | Stakeholder Survey What this measures: external perception and reputational events Stakeholder Survey is conducted among the general public, public officials, economic development leaders, and business/community leaders in the TVA service area to assess public opinion of TVA.
| Why Is This Metric Used? This measure is conducted to assess the external reputation and perception of TVA and TVA's effectiveness in carrying out its mission and strategic objectives. | | | | | | | | | | | | | | | | | Customer Survey What this measures: TVA's focus on meeting and exceeding customer expectations Customer Survey is an annual survey of LPCs and Direct-Serve Customers focused on better understanding customer loyalty and related performance drivers. | Why Is This Metric Used? This measure is to help TVA better understand the strength of the bond with its customers and identify how TVA can positively affect this relationship. | | | | | | | | | | | | |
Consistent with its public power mission, TVA's long-term performance metrics include the results of surveys that assess the external reputation and perception of TVA and TVA's effectiveness in carrying out its mission and strategic objectives. These metrics reflect TVA's focus on meeting or exceeding customer expectations and identifying areas for continuous improvement. In setting the goal for each metric, the TVA Board considers budgeted amounts in the company's approved business plans, actual performance in recent years, and level of attainment. The TVA Board also considers TVA's strategic business plan priorities and strategic benchmarking goals, customer and stakeholder feedback, environmental and regulatory concerns and goals, and the competitive environment. Achievement of the target goal would result in a 100 percent payout opportunity with respect to that goal. A threshold goal is also set for each metric, so that no payout would occur with respect to metrics that fail to achieve that threshold. Additionally, a stretch goal for each metric is set to incentivize and reward exceptional performance. Linear interpolation is used for results between threshold and stretch goals. 2021–2023 LTP Award Performance Results The performance results on the 2023 TVA Long-Term Performance Scorecard are set forth below. Performance resulted in an adjusted payout of 136 percent of target opportunity. 2021–2023 Long-Term Performance Scorecard
Notes (1)Non-Fuel Delivered Cost of Power = (Non-Fuel Operating and Maintenance Expense + Base Capital Cost + Interest Expense + Other Expense) / Budgeted Electric Power Sales. For the 2021–2023 performance cycle, the Non-Fuel Delivered Cost of Power measure was calculated using an average of the 2021, 2022, and 2023 results. (2)Load Not Served = (Percentage of Total Load Not Served) x (Number of Minutes in the Period). For the 2021–2023 performance cycle, the Load Not Served measure was calculated using an average of the 2021, 2022, and 2023 results. (3)The External Performance Indicators for TVA Nuclear Fleet measure is calculated using a weighted combination of key performance indicators based on standard nuclear industry definitions for station performance, with the maximum obtainable being 100 points. For the 2021–2023 performance cycle, the External Performance Indicators for the TVA Nuclear Fleet measure was calculated using the 2023 results. (4)For the 2021–2023 performance cycle, the Stakeholder Survey was calculated using an average of the 2021, 2022, and 2023 results. (5)For the 2021–2023 performance cycle, the Customer Survey was calculated using an average of the 2021, 2022, and 2023 results.
In reviewing the 2021–2023 performance period, the TVA Board considered strong performance in several areas along with below target performance for External Performance Indicators for the TVA Nuclear Fleet and Customer Survey in 2023. Below are key highlights for this performance period: ü Strong transmission grid system reliability performance ü Financial performance •TFOs at September 30, 2023 are among the lowest in over 30 years •Delivered three years of customer credits ü Nuclear performance •Browns Ferry, Sequoyah, and Watts Bar nuclear sites performed at exemplary levels compared to industry peers
•Browns Ferry Unit 2 exceeded its continuous run record (562 days) and achieved its first breaker-to-breaker continuous run record - 665 consecutive days (February 2023) •Sequoyah maintained station performance in top quartile for the entire fiscal year •Watts Bar Unit 1 achieved its second breaker-to-breaker continuous run – 496 consecutive days (April 2023). This duration is second to the breaker-to-breaker continuous run record of 512 days (September 2000) •External Performance Indicators for the TVA Nuclear Fleet - fell just below target for 2023 due to an outage at Watts Bar Unit 2 that occurred late in 2023 ü Customer relationships •96% of 153 LPCs have signed 20-year Partnership Agreements with TVA •TVA offered regulatory relief and flexibility so LPCs could help their communities •Stakeholder Survey - three-year survey results exceeded TVA's stretch goal, driven by consistent above target performance for each year in the period •Customer Survey - despite improving commitment levels in 2021 and the highest ever commitment score in 2022, 2023 resulted in an average score below target for the three-year performance period ü Continued economic development efforts have been successful (2021-2023) •Companies have announced $28.2 billion in projected investments, and •Approximately 205,800 jobs (61,300 jobs created and 144,500 jobs retained) are expected to be created/retained The TVA Board, using its discretion to review results and approve adjustments in payouts, adjusted the calculated 2023 LTP payout percentage from 146 to 136. This adjustment recognizes TVA's strong performance over the three-year performance period while also acknowledging the events of Winter Storm Elliott. Payouts to the NEOs for the 2021–2023 LTP Award are described under each executive's compensation scorecard under 2023 Pay Decisions – 2023 NEO Pay Decisions and Compensation Scorecards below and reported in the Executive Compensation Tables and Narrative Disclosures – Summary Compensation Table under "Non-Equity Incentive Plan Compensation." 2022–2024 Outstanding LTP Performance Cycle The TVA Board previously approved the following overall LTP measures of TVA performance for all participants for the three-year cycle ending September 30, 2024 (awards to be paid in November 2024): | | | | | | | | | | | | | | | | | | | | | | | | | | | | Performance Metric and Weighting | Threshold Target Stretch (50% Payout) (100% Payout) (200% Payout) | | | | | | | | | | Non-Fuel Delivered Cost of Power(1) | 45% | | | | | | | | | 3.67 | 3.53 | 3.39 | | | | | | | | | | | | | | | | | | | | Load Not Served(2) | 30% | | | | | | | | | 4.5 | 3.9 | 3.2 | | | | | | | | | | | | | | | | | | | | External Performance Indicators for the TVA Nuclear Fleet(3) | 15% | | | | | | | | | 93.5 | 96.0 | 98.5 | | | | | | | | | | | | | | | | | | | | Powerful Partnerships Survey(4) | 10% | | | | | | | | | 74.0 | 78.0 | 82.0 | | | | | | | | | | | | | | | | | | | |
Notes (1)Metric has same definition as for the 2021-2023 LTP awards. For the 2022-2024 performance cycle, the Non-Fuel Delivered Cost of Power measure will be calculated using an average of the 2022, 2023, and 2024 results. (2)Metric has same definition as for the 2021-2023 LTP awards. For the 2022-2024 performance cycle, the Load Not Served measure will be calculated using an average of the 2022, 2023, and 2024 results. (3)Metric has same definition as for the 2021-2023 LTP awards. For the 2022-2024 performance cycle, the External Performance Indicators for the TVA Nuclear Fleet measure will be calculated based on 2024 results. (4)The Powerful Partnerships Survey measure is conducted among customers, elected officials, business and economic development leaders, and the general public in the TVA service area to assess the strength of various stakeholder relationships with TVA. For the 2022-2024 performance cycle, the Powerful Partnerships Survey measure will be calculated using an average of the 2022, 2023, and 2024 results. Beginning with the 2022-2024 performance cycle, the Powerful Partnerships Survey has been added as a new measure, with a weighting of 10%, and replaces the former Stakeholder Survey and Customer Survey measures, as illustrated in the above chart.
2023–2025 Outstanding LTP Performance Cycle In May 2022, the TVA Board approved the following overall LTP measures of TVA performance for all participants for the three-year cycle ending September 30, 2025 (awards to be paid in November 2025): | | | | | | | | | | | | | | | | | | | | | | | | | | | | Performance Metric and Weighting | Threshold Target Stretch (50% Payout) (100% Payout) (200% Payout) | | | | | | | | | | Non-Fuel Delivered Cost of Power(1) | 45% | | | | | | | | | 3.44 | 3.31 | 3.18 | | | | | | | | | | | | | | | | | | | | Load Not Served(2) | 30% | | | | | | | | | 4.5 | 3.9 | 3.2 | | | | | | | | | | | | | | | | | | | | External Performance Indicators for the TVA Nuclear Fleet(3) | 15% | | | | | | | | | Industry Median | Top Quartile | Top Fleet | | | | | | | | | | | | | | | | | | | | Powerful Partnerships Survey(4) | 10% | | | | | | | | | 75.0 | 79.0 | 83.0 | | | | | | | | | | |
Notes (1)Metric has same definition as for the 2021-2023 LTP awards. For the 2023-2025 performance cycle, the Non-Fuel Delivered Cost of Power measure will be calculated using an average of the 2023, 2024, and 2025 results. (2)Metric has same definition as for the 2021-2023 LTP awards. For the 2023-2025 performance cycle, the Load Not Served measure will be calculated using an average of the 2023, 2024, and 2025 results. (3)Metric has same definition as for the 2021-2023 LTP awards. For the 2023-2025 performance cycle, the External Performance Indicators for the Nuclear Fleet measure will be calculated using 2025 results. (4)Metric has same definition as for the 2022-2024 LTP awards. For the 2023-2025 performance cycle, the Powerful Partnerships Survey measure will be calculated using an average of the 2023, 2024, and 2025 results.
Long-Term Retention Awards As a corporate agency of the U.S., TVA does not have equity securities that it can use to provide stock awards, options, or other equity-based awards as compensation for its employees. The purpose of the retention awards under the LTIP is to provide a retention incentive similar to restricted stock or restricted stock units. These grants are intended to encourage executives to remain with TVA and to provide, in combination with salary, EAIP, and LTP grants, a competitive level of TDC. Grants are generally effective as of October 1 and will become one-third vested on each subsequent September 30 or upon death, disability, or retirement if earlier on a pro-rated basis. Each award will be paid in a lump sum within two months of vesting. 2023 Long-Term Retention Award Grant Following the market assessment conducted by FW Cook, effective October 1, 2022, TVA granted LTR awards to the NEOs. These awards vest in three equal tranches on September 30, 2023, September 30, 2024, and September 30, 2025, contingent upon continued employment on each vesting date. The amounts of these awards are set forth under Long-Term Incentive Plan ("LTIP") Compensation above. 2023 Vesting of Outstanding Retention Awards LTR awards that vested in 2023 are described under 2023 Pay Decisions — 2023 NEO Pay Decisions and Compensation Scorecards below and are reported in the Executive Compensation Tables and Narrative Disclosures —Summary Compensation Table under "Non-Equity Incentive Plan Compensation." The vesting schedule for the three LTR awards outstanding in 2023 is set forth below.
2023 VESTING OF OUTSTANDING RETENTION AWARDS
2023 Pay Decisions 2023 CEO Pay Decisions Overview CEO TDC EARNED IN 2023 - $7,985,860 | | | | | | | | | | | | | | | | Base Salary | $ | 1,227,000 | | | 2023 salary | Annual Performance Incentive under
Executive Annual Incentive Plan | $ | 1,302,384 | | | 185 percent of target EAIP award, followed by 0.85 Corporate Multiplier; 45 percent Individual Performance Multiplier then applied | | Long-Term Performance Incentive | $ | 3,963,176 | | | 136 percent of target LTP earned for the three-year performance cycle ended September 30, 2023 | | Long-Term Retention Incentive | $ | 1,493,300 | | | 2023 tranche of 2021, 2022, and 2023 LTR awards |
Each year, the Committee makes two key compensation decisions with respect to CEO compensation: the amount of TDC opportunity (which is forward-looking and incentivizes the CEO to perform), and the amount of TDC earned (which rewards the CEO for his prior performance).
2023 CEO Total Direct Compensation Opportunity On November 10, 2022, the TVA Board approved compensation adjustments for Mr. Lyash for 2023, increasing each component of Mr. Lyash's TDC over 2022 levels. The adjustments were made following the annual review of FW Cook’s market analysis and benchmarking of CEO compensation, and in consideration of Mr. Lyash's increased tenure with TVA and his 2022 performance. The target TDC opportunity granted to Mr. Lyash in 2023 is illustrated below.
CEO 2023 TARGET TOTAL DIRECT COMPENSATION OPPORTUNITY(1)(2) Note (1) Target market assessment effective October 2022 and included market composite of WTW survey sample and proxy peer group. This composite group includes 43 investor-owned utilities and government/non-profit entities further described in Item 11, Executive Compensation —Compensation Discussion and Analysis —Compensation Setting Process — TVA Competes with Peers for Talent — List of Compensation Peer Companies. (2) Market 50th Percentile amounts are benchmarks for each compensation component which are determined independently and do not sum together.
2023 CEO TARGET TOTAL DIRECT COMPENSATION OPPORTUNITY BELOW MARKET(1)(2) Note (1)Target market assessment effective October 2022 and included market composite of WTW survey sample and proxy peer group. This composite group includes 43 investor-owned utilities and government/non-profit entities further described in Item 11, Executive Compensation —Compensation Discussion and Analysis —Compensation Setting Process — TVA Competes with Peers for Talent — List of Compensation Peer Companies. (2)Market 25th and 50th Percentile amounts are benchmarks for each compensation component which are determined independently and do not sum together.
2023 CEO Total Direct Compensation Earned The TDC that Mr. Lyash earned for 2023 reflected individual and company performance that met and exceeded most targets and was approximately 66% performance-based compensation. CEO 2023 TOTAL DIRECT COMPENSATION EARNED Note (1)2021-2023 Long-Term Performance Incentive award reflects a three-year performance cycle. (2)Long-Term Retention Incentive amount reflects the 2023 tranches of the 2021, 2022, and 2023 LTR awards. The annual incentive award that Mr. Lyash received reflected an Individual Performance Multiplier of 45%. The Committee and TVA Board reviewed Mr. Lyash's 2023 performance and considered his higher level of accountability related to Winter Storm Elliott and the employee fatality in compensation decisions. See 2023 Pay Decisions - 2023 NEO Pay Decisions and Compensation Scorecards below for more information.
Why Total Compensation Earned Differs From Compensation Reported 2023 CEO TOTAL COMPENSATION COMPONENTS | | | | | | | | | | | | | | | | | | | | | | Summary Compensation Table Total Compensation = | $ | 10,544,082 | | | | | | | | | | | | | | | | | | | | | $27,450 | | | | | | Other | | | | | | | | | | | $7,985,860 | | | | $2,530,772 | | Total Direct Compensation Earned | | | Increase in Value of Supplemental Executive Retirement Plan | | | | | | | | | Amount does not represent payments actually received by CEO(1) | | | | |
Note (1) Amount reflects change in present value of the accumulated pension/SERP benefits during the prior year, determined using assumptions consistent with those used in the financial statements in this Annual Report, set forth in Note 20 —Benefit Plans. Unlike the amounts reported in the Summary Compensation Table, Mr. Lyash's TDC Earned represents the annual pay decisions by the Committee that specifically reflect its assessment of the company's performance and individual performance and reward the employee for satisfaction of incentive award conditions (enterprise performance and continued employment). Other elements included in the Summary Compensation Table, such as changes in pension values and vesting of recruitment and relocation incentives, are excluded from TDC Earned because they do not relate to performance and are outside the scope of the Committee's annual pay decisions. The Committee therefore believes that TDC Earned renders a more accurate and up-to-date reflection of its assessment of performance.
CEO Pay Ratio Disclosure As required by Section 953(b) of the Dodd-Frank Wall Street Reform and Consumer Protection Act of 2010 and Item 402(u) of Regulation S-K, TVA is providing the following information regarding the annual total compensation of TVA's CEO position and the annual total compensation of the median employee of the company: •The total compensation for the CEO position for 2023 was $10,544,082. •For 2023, the median employee's annual total compensation was $146,466. Based on this information, the pay ratio of the total compensation for the CEO position to the median employee was approximately 72 to 1. To identify the median employee and to determine the annual total compensation of the median employee, TVA took the following steps: •TVA selected September 30, 2023, as the date on which to identify its median employee. On September 30, 2023, TVA's employee population that had earnings in 2023 (including full-time, part-time, and temporary employees) consisted of 10,795 individuals located in the U.S. •In order to identify the median employee from its employee population, TVA compared the compensation that would be included in Box 5 (Medicare Wages and Tips) of Form W-2, which includes salary, overtime, and incentive compensation, for the period from October 1, 2022 to September 30, 2023. Box 5 compensation was used as it is representative of the compensation received by all employees and is readily available and objective. •After identifying its median employee, TVA calculated that employee's compensation for 2023 as though that compensation was being calculated for purposes of the Summary Compensation Table, resulting in annual total compensation of $146,466. The above pay ratio is a reasonable estimate calculated in a manner consistent with Item 402(u) of Regulation S-K. Because Item 402(u) provides companies with flexibility to select the methodology and assumptions used to identify the median employee and to calculate the pay ratio, the pay ratio reported by TVA may not be comparable to the pay ratios reported by other companies.
2023 CEO Pay Ratio Below Median Among Peers As reflected above, TVA's CEO target TDC is low compared to its 2023 compensation peer group on an absolute basis and is also low compared to its peers in the context of organizational pay ratios. Based on TVA's 2023 pay ratio noted above and the pay ratio disclosed in its peers' most recent public disclosures, TVA's current pay ratio is below the 50th percentile, and approximates the 25th percentile of its peers. Peers used are those shown under Proxy Peer Group of Investor-Owned Utilities in the Compensation Setting Process — TVA Competes with Peers for Talent — List of Compensation Peer Companies.
2023 NEO Pay Decisions and Compensation Scorecards The following pages show each NEO's 2023 Total Direct Compensation earned, 2023 TDC opportunities granted, and the Committee's (or the CEO's in the case of NEOs other than the CEO) rationale for those pay decisions.
| | | | | | | | | | | | | | | | | | | | | | | | | | | | | | | | | | | | | | | | | | | | | | | | | | | | | | | | | JEFFREY J. LYASH | | | 2023 TOTAL DIRECT COMPENSATION EARNED | | President and CEO | | | $ | 7,985,860 | | | | | | | | | | | Hire Date: April 2019 | | | | | | | 2023 INDIVIDUAL PERFORMANCE HIGHLIGHTS •Strong organizational performance - record-setting achievements across broad range of metrics. •Guided TVA fleet through historic weather and power demand event - Winter Storm Elliott; all-time record single-day energy demand (more than 740 million kWh hours) and highest winter peak power demand (33,427 MW). •Strong financial performance - debt among the lowest in over 30 years; 2023 was the fourth year of base flat wholesale rates; significant revenues returned to the customers via pandemic and long-term partnership credits. •TVA Nuclear Fleet demonstrated consistent, exemplary, top performance. •Strengthened public power model - by leveraging partnerships designed to advance electric vehicles and charging stations throughout the Tennessee Valley. •TVA's repatriation of Native American remains was a culmination of many years of work with the tribes, surpassing other federal agencies in creating this outcome. •Asset construction program initiated (to add energy and capacity) - hydro plant life extension, nuclear uprate, renewables development, energy storage development, and gas generation construction programs. •Maintained strong focus on IwD across all organizational levels to help sustain momentum towards a more diverse TVA. •Strengthened customer relationships: 96% of LPCs have signed TVA 20-year Partnership Agreement. •Continued strong economic development focus, recruiting industries and adding significant capital and jobs to the Valley. •TVA received numerous recognitions/awards: for military friendly, veterans, and diversity; 2023 Forbes America's Best Employers by State; 2023 Nuclear Energy Institute ("NEI") Top Innovative Practice Award; Smart Energy Consumer Collaborative ("SECC") 2023 Best Practices Award, SMB Engagement Award for the Community Centered Growth Program. •Overall safety performance - industry top decile.
. 2023 COMMUNITY/INDUSTRY ENGAGEMENT ▪Nuclear Energy Institute - Board Chair ▪Institute of Nuclear Power Operations - Vice Chair of Board ▪World Association of Nuclear Operators - Governor, Global Board and Chairman, Atlanta Centre ▪Drexel University - Board of Trustees ▪Boys and Girls Clubs of the Tennessee Valley and the United Way - actively engaged supporter Dre
| | | | | Base Salary. Mr. Lyash's salary was increased 6.49 percent to $1,227,000 at the beginning of 2023, reflecting performance and positioning to a more competitive base salary. This amount is below the 2023 compensation peer group median. EAIP Payment Earned. Organizational performance, including strong fiscal responsibility and operational/reliability performance, under the TVA EAIP Enterprise Scorecard exceeded targets for all measures reflecting a 185 percent opportunity achieved against target. Company performance under the TVA Corporate Multiplier measures was strong for several key measures. However, the TVA Board considered the events of Winter Storm Elliott and an employee fatality and approved a 0.85 EAIP Corporate Multiplier. The TVA Board approved an Individual Performance Multiplier of 45 percent for Mr. Lyash for 2023 given his performance and the events of Winter Storm Elliott and an employee fatality. | | | | | | | Annual Salary | X | Annual Target Incentive Opportunity | X | Percent of Opportunity Achieved (0% to 200%) | X | Corporate Multiplier
(0 to 1.1) | X | Individual Performance Multiplier (0% to 150%) | = | EAIP Payout | | | $1,227,000 | | 150% | | 185% | | 0.85 | | 45% | | $1,302,384 | | | Long-Term Incentives Earned Long-Term Performance Awards Earned. Organizational performance under the 2021–2023 LTP program was strong in several areas, including key areas where performance exceeded target expectations. In light of performance results, including strong reliability performance and stakeholder relationships, and considering the events of Winter Storm Elliott, the TVA Board exercised its discretion to adjust the calculated 2023 LTP payout percentage from 146 percent to 136 percent. | | | Target Amount | X | Percent of Opportunity Achieved (0% to 200%) | = | LTP Incentive Amount | | | | | $2,914,100 | | 136% | | $3,963,176 | | | | | Long-Term Retention Award Earned. Mr. Lyash earned $1,493,300 in 2023 upon the vesting of the 2023 tranches of his 2021, 2022, and 2023 LTR program awards. The LTR awards vest ratably over a three-year period, subject to continued employment on each vesting date. Long-Term Incentive Opportunities Granted 2023–2025 Long-Term Performance Award Opportunity. Effective October 1, 2022, Mr. Lyash was granted a 2023–2025 LTP program award with a target opportunity of $3,983,000, which will vest on September 30, 2025. Actual payout will depend on performance against targets at the end of the three-year performance period. 2023 Long-Term Retention Award Opportunity. Effective October 1, 2022, Mr. Lyash was granted a 2023 LTR program award of $1,707,000 that vests ratably over a three-year period, subject to continued employment on each vesting date. The first tranche was earned in 2023 as described above.
|
| | | | | | | | | | | | | | | | | | | | | | | | | | | | | | | | | | | | | | | | | | | | | | | | | | | | | | | | | JOHN M. THOMAS, III | | | 2023 TOTAL DIRECT COMPENSATION EARNED | | Executive Vice President and Chief Financial and Strategy Officer | | | $3,578,601 | | | | | | | | | | | | | Hire Date: November 2005 | | | | | | 2023 INDIVIDUAL PERFORMANCE HIGHLIGHTS •Maintained flat wholesale base rates during 2023 amid rising inflation and interest rate environments. •Developed programmatic approach to identify and leverage federal funding opportunities. •Partnerships with auto industry, Tennessee Valley states, LPCs, and customers to help advance 15 electric vehicle Fast Charge Network sites to completion, with 55 additional sites under developmental contract. •Southeast Hydrogen Hub partnership to establish the region's hydrogen infrastructure. •Replenished Interruptible Power ("IP") economic call rights depleted during Winter Storm Elliott by recruiting new participants and issuing a summer 2023 IP Special Offer. •Executed CFO, strategic planning, and business planning functions that exceeded enterprise goals in total spend, debt levels, and net income. •Signed multi-year interagency agreement with DOE for the implementation of energy efficiency initiatives at DOE's Y-12 facility in Oak Ridge. •Continued community support through extended pandemic credits. •Maintaining investor relations and financial integrity through timely SEC reporting with unqualified opinion and no significant issues. •TVA residential rates are in the top quartile of lowest rates among the top 100 U.S. Utilities and TVA industrial rates are in the top decile of lowest rates among the top 100 U.S. Utilities based on June 2023 12-month rolling average from EIA. •Launched three new Digital Centers of Excellence (Enterprise Productivity, Internet of Things, and Innovation). •TVA was honored with the SECC 2023 Best Practices Award, SMB Engagement Award for the Community Centered Growth program. •TVA earned the 2023 Energy Efficiency - Program Delivery award from the U.S. Environmental Protection Agency and the U.S. DOE for TVA's Home Uplift Program.
. 2023 COMMUNITY/INDUSTRY ENGAGEMENT •Siskin Children's Institute - Executive Committee; chair, Finance Committee •Electric Power Research Institute - Audit Committee •Chattanooga Chamber of Commerce - CEO Round Table | | | | | Base Salary. Mr. Thomas' salary was increased 5.00 percent to $835,380 at the beginning of 2023, reflecting performance and positioning to maintain a competitive base salary. EAIP Payment Earned. Organizational performance, including strong fiscal responsibility and operational/reliability performance, under the TVA EAIP Enterprise Scorecard exceeded targets for all measures reflecting a 185 percent opportunity achieved against target. Company performance under the TVA Corporate Multiplier measures was strong for several key measures. However, the TVA Board considered the events of Winter Storm Elliott and an employee fatality and approved a 0.85 EAIP Corporate Multiplier. The CEO approved an Individual Performance Multiplier of 75 percent for Mr. Thomas for 2023 given his performance and the events of Winter Storm Elliott and an employee fatality. | | | Annual Salary | X | Annual Target Incentive Opportunity | X | Percent of Opportunity Achieved (0% to 200%) | X | Corporate Multiplier
(0 to 1.1) | X | Individual Performance Multiplier (0% to 150%) | = | EAIP Payout | | | $835,380 | | 80% | | 185% | | 0.85 | | 75% | | $788,181 | | | Long-Term Incentives Earned Long-Term Performance Awards Earned. Organizational performance under the 2021–2023 LTP program was strong in several areas, including key areas where performance exceeded target expectations. In light of performance results, including strong reliability performance and stakeholder relationships, and considering the events of Winter Storm Elliott, the TVA Board exercised its discretion to adjust the calculated 2023 LTP payout percentage from 146 percent to 136 percent. | | | Target Amount | X | Percent of Opportunity Achieved (0% to 200%) | = | LTP Incentive Amount | | | | | $1,039,000 | | 136% | | $1,413,040 | | | | | Long-Term Retention Award Earned. Mr. Thomas earned $542,000 in 2023 upon the vesting of the 2023 tranches of his 2021, 2022, and 2023 LTR program awards. The LTR awards vest ratably over a three-year period, subject to continued employment on each vesting date. Long-Term Incentive Opportunities Granted 2023–2025 Long-Term Performance Award Opportunity. Effective October 1, 2022, Mr. Thomas was granted a 2023–2025 LTP program award with a target opportunity of $1,425,000, which will vest on September 30, 2025. Actual payout of the award will depend on performance against targets at the end of the three-year performance period. 2023 Long-Term Retention Award Opportunity. Effective October 1, 2022, Mr. Thomas was granted a 2023 LTR program award of $600,000 that vests ratably over a three-year period, subject to continued employment on each vesting date. The first tranche was earned in 2023 as described above. |
| | | | | | | | | | | | | | | | | | | | | | | | | | | | | | | | | | | | | | | | | | | | | | | | | | | | | | | | | DONALD A. MOUL | | | 2023 TOTAL DIRECT COMPENSATION EARNED | Executive Vice President and
Chief Operating Officer | | | $3,066,865 | | | | | | | | | | | | | Hire Date: June 2021 | | | | | | 2023 INDIVIDUAL PERFORMANCE HIGHLIGHTS •Effectively maintained bulk grid stability during Winter Storm Elliott, as well as employee performance with no safety events; supported post-event meetings with external stakeholders and LPCs to examine pre-event actions and plans for after-action review work. •Maintained stable and secure system during August 2023 three-day consecutive demand above 31,000 MW. •Repatriation of Native American remains - culmination of many years of work with tribes and commitment from TVA, surpassing other federal agencies in creating this outcome. •Achieved supply chain cost savings of $5.3 million. •Successful launch of Colbert Combustion Turbine site (three new units) in Alabama, adding approximately 681 MWs of natural gas generation - enough dispatchable electricity to power over 400,000 homes. •Successful launch of Skyhawk solar facility in northwest Tennessee and utility scale battery projects at Bull Run and Kingston sites. •Championed unique Labor Forecast Center - to strengthen union partnerships and help TVA project, plan, and meet evolving future skilled labor and energy needs. •Leveraged collaborations for investing in TVA's nuclear future. •Maintained TVA's SIIR at top decile and improved OSHA Recordable Rate to top decile. •Operational challenges of Winter Storm Elliott (December 2022) and employee fatality (September 2023). •Led, supported, and participated in activities leading to the completion of the signing of the BWRX-300 Technology Collaboration Agreement. •Championed, led, and supported the realization of an estimated $179 million in continuous improvement annual benefits across the enterprise. •Partnered with Ford to facilitate Blue Oval City's anticipated energy draw, including installation of one of the largest TVA direct-serve substations and making significant transmission investments to support anticipated further growth in the Blue Oval City region. 2023 COMMUNITY/INDUSTRY ENGAGEMENT •Zoo Knoxville - Board of Directors and Circle of Friends •University of Tennessee Nuclear Engineering - Board of Advisors •Penn State University - Founder, Moul Family Fund for Reactor Operator Internship •Leadership Knoxville - Class of 2023 •Nuclear Electric Insurance Limited - Board of Directors
.
| | | | | Base Salary. Mr. Moul's salary was increased 4.00 percent to $795,600 at the beginning of 2023, reflecting performance and positioning to maintain a competitive base salary. EAIP Payment Earned. Organizational performance, including strong fiscal responsibility and operational/reliability performance, under the TVA EAIP Enterprise Scorecard exceeded targets for all measures reflecting a 185 percent opportunity achieved against target. Company performance under the TVA Corporate Multiplier measures was strong for several key measures. However, the TVA Board considered the events of Winter Storm Elliott and an employee fatality and approved a 0.85 EAIP Corporate Multiplier. The CEO approved an Individual Performance Multiplier of 75 percent for Mr. Moul for 2023 given his performance and the events of Winter Storm Elliott and an employee fatality. | | | Annual Salary | X | Annual Target Incentive Opportunity | X | Percent of Opportunity Achieved (0% to 200%) | X | Corporate Multiplier
(0 to 1.1) | X | Individual Performance Multiplier (0% to 150%) | = | EAIP Payout | | | $795,600 | | 80% | | 185% | | 0.85 | | 75% | | $750,649 | | | Long-Term Incentives Earned Long-Term Performance Awards Earned. Organizational performance under the 2021–2023 LTP program was strong in several areas, including key areas where performance exceeded target expectations. In light of performance results, including strong reliability performance and stakeholder relationships, and considering the events of Winter Storm Elliott, the TVA Board exercised its discretion to adjust the calculated 2023 LTP payout percentage from 146 percent to 136 percent. | | | Target Amount | X | Percent of Opportunity Achieved (0% to 200%) | = | LTP Incentive Amount | | | | | $588,750 | | 136% | | $800,700 | | | | | Long-Term Retention Award Earned. Mr. Moul earned $719,916 in 2023 upon the vesting of the 2023 tranches of his 2021, 2022, and 2023 LTR program awards. The LTR program awards vest ratably over a three-year period, subject to continued employment on each vesting date. Long-Term Incentive Opportunities Granted 2023–2025 Long-Term Performance Award Opportunity. Effective October 1, 2022, Mr. Moul was granted a 2023–2025 LTP program award with a target opportunity of $1,425,000 which will vest on September 30, 2025. The actual payout will depend on performance against targets at the end of the three-year performance period. 2023 Long-Term Retention Award Opportunity. Effective October 1, 2022, Mr. Moul was granted a 2023 LTR program award of $785,000 that vests ratably over a three-year period, subject to continued employment on each vesting date. The first tranche was earned in 2023 as described above. Other Compensation Recruitment and Relocation Incentive. Mr. Moul was paid $100,000 in 2023 as the third and final installment of a deferred cash relocation incentive under his employment offer letter. Mr. Moul received an additional $110,182 in relocation benefits as reported in the Executive Compensation Tables and Narrative Disclosures – Summary Compensation Table under "All Other Compensation". |
| | | | | | | | | | | | | | | | | | | | | | | | | | | | | | | | | | | | | | | | | | | | | | | | | | | | | | | | | TIMOTHY S. RAUSCH | | | 2023 TOTAL DIRECT COMPENSATION EARNED | Executive Vice President and Chief Nuclear Officer | | | $2,454,805 | | | | | | | | | | | | | Hire Date: October 2018 | | | | | | 2023 INDIVIDUAL PERFORMANCE HIGHLIGHTS •Through leadership, talent development, and the continued investment in assets and people, TVA continues to make progress toward its goal of being the Nation’s Top Nuclear Fleet by 2025 as part of its Operational Excellence priority. •TVA's Nuclear fleet has demonstrated consistent, exemplary, top performance: –Browns Ferry, Sequoyah, and Watts Bar nuclear sites - exemplary performance levels compared to industry peers. –Browns Ferry Unit 2 - exceeded its continuous run record (562 day run) and achieved its first breaker-to-breaker continuous run record - 665 consecutive days. –Sequoyah - top quartile station performance for the entire fiscal year (based on standard nuclear industry definition). –Watts Bar Unit 1 - achieved second breaker-to-breaker continuous run – 496 consecutive days (April 2023). Current record - 512 days (September 2000). •Achieved 100% pass rate on recent licensing class (in support of a sustainable operations pipeline). •Results for Annualized Nuclear Online Reliability Loss Factor is a strong indicator of operating as a top performing organization. •Zero industrial, radiological, environmental, or nuclear significant events. •TVA Nuclear recognitions/awards: NEI Top Innovative Practice Award for the Virtual Reality Polar Crane Operator Simulation; TVA Women in Nuclear Chapter - Excellence in Networking Award.
| | | | | Base Salary. Mr. Rausch's salary was increased 12.00 percent to $637,640 at the beginning of 2023, reflecting performance and positioning to maintain a competitive base salary. EAIP Payment Earned. Organizational performance, including strong fiscal responsibility and operational/reliability performance, under the TVA EAIP Enterprise Scorecard exceeded targets for all measures reflecting a 185 percent opportunity achieved against target. Company performance under the TVA Corporate Multiplier measures was strong for several key measures. However, the TVA Board considered the events of Winter Storm Elliott and an employee fatality and approved a 0.85 EAIP Corporate Multiplier. The CEO approved an Individual Performance Multiplier of 115 percent for Mr. Rausch for his performance. | | | Annual Salary | X | Annual Target Incentive Opportunity | X | Percent of Opportunity Achieved (0% to 200%) | X | Corporate Multiplier
(0 to 1.1) | X | Individual Performance Multiplier (0% to 150%) | = | EAIP Payout | | | $637,640 | | 70% | | 185% | | 0.85 | | 115% | | $807,165 | | | Long-Term Incentives Earned Long-Term Performance Awards Earned. Organizational performance under the 2021–2023 LTP program was strong in several areas, including key areas where performance exceeded target expectations. In light of performance results, including strong reliability performance and stakeholder relationships, and considering the events of Winter Storm Elliott, the TVA Board exercised its discretion to adjust the calculated 2023 LTP payout percentage from 146 percent to 136 percent. | 2023 COMMUNITY/INDUSTRY ENGAGEMENT •University of Tennessee at Chattanooga - Engineering & Computer Science Advisory Board •American Association of Blacks in Energy - active member •Chambliss Center for Children - fundraiser platinum sponsor •Nuclear Energy Institute - Nuclear Strategy Industry Advisory Committee •INPO Senior Nuclear Plant Manager - quarterly course instructor •INPO Executive Advisory Group newly appointed Chair •U.S. Women in Nuclear Executive Advisory Committee member
| | | Target Amount | X | Percent of Opportunity Achieved (0% to 200%) | = | LTP Incentive Amount | | | | | $500,000 | | 136% | | $680,000 | | | | | Long-Term Retention Award Earned. Mr. Rausch earned $330,000 in 2023 upon the vesting of the 2023 tranches of his 2021, 2022, and 2023 LTR program awards. The LTR program awards vest ratably over a three-year period, subject to continued employment on each vesting date. Long-Term Incentive Opportunities Granted 2023–2025 Long-Term Performance Award Opportunity. Effective October 1, 2022, Mr. Rausch was granted a 2023–2025 LTP program award with a target opportunity of $725,000, which will vest on September 30, 2025. Actual payout will depend on performance against targets at the end of the three-year performance period. 2023 Long-Term Retention Award Opportunity. Effective October 1, 2022, Mr. Rausch was granted a 2023 LTR program award of $330,000 that vests ratably over a three-year period, subject to continued employment on each vesting date. The first tranche was earned in 2023 as described above. |
| | | | | | | | | | | | | | | | | | | | | | | | | | | | | | | | | | | | | | | | | | | | | | | | | | | | | | | | | DAVID B. FOUNTAIN | | | 2023 TOTAL DIRECT COMPENSATION EARNED | | Executive Vice President and General Counsel | | | $2,260,243 | | | | | | | | | | | | | Hire Date: June 2020 | | | | | | 2023 INDIVIDUAL PERFORMANCE HIGHLIGHTS •Provided critical legal and regulatory support of TVA's current asset plan, including the Clean Energy RFP for up to 5,000 MW and assistance with the Cumberland and Kingston site transitions. •Provided legal and regulatory support for TVA's New Nuclear Program and Clinch River Project, including negotiations associated with a multi-party collaborative arrangement to advance the global deployment of SMR reactor technology. •Counseled TVA for favorable outcomes throughout a variety of unique legal challenges; maintained and strengthened key relationships in Congress and the Administration as well as with TVA leadership and union partners. •Successfully defended TVA and the public power model in multiple litigated cases. •Managed the response to the review conducted by NERC, FERC, and the SERC Reliability Corporation of TVA's actions during Winter Storm Elliott (December 2022). •Served as corporate secretary for the TVA Board and provided counsel on effective corporate governance. •Supported the timely filing of documents with the Securities and Exchange Commission on Forms 10-K, 10-Q, and 8-K and TVA financing transactions. •Executive sponsor - TVA’s ESG framework team which coordinates various ESG initiatives across the enterprise. •Maintained best-in-class ethics program as TVA's Designated Agency Ethics Official.
2023 COMMUNITY/INDUSTRY ENGAGEMENT •University of North Carolina, Kenan-Flagler Business School Energy Center - Advisory Board •Edison Electric Institute Legal Committee •Presentations at the annual conferences of the National Association of Regulatory Utility Commissioners, Southern States Energy Board, Tennessee Valley Public Power Association Legal Conference, and Tennessee Valley Industrial Committee •United Way of Greater Knoxville - Board of Directors •Shepherd's Table Soup Kitchen - Board of Directors
| | | | | Base Salary. Mr. Fountain's salary was increased 9.00 percent to $629,802 at the beginning of 2023, reflecting his performance and positioning to maintain a competitive base salary. EAIP Payment Earned. Organizational performance, including strong fiscal responsibility and operational/reliability performance, under the TVA EAIP Enterprise Scorecard exceeded targets for all measures reflecting a 185 percent opportunity achieved against target. Company performance under the TVA Corporate Multiplier measures was strong for several key measures. However, the TVA Board considered the events of Winter Storm Elliott and an employee fatality and approved a 0.85 EAIP Corporate Multiplier. The CEO approved an Individual Performance Multiplier of 75 percent for Mr. Fountain for 2023 given his performance and the events of Winter Storm Elliott and an employee fatality. | | | Annual Salary | X | Annual Target Incentive Opportunity | X | Percent of Opportunity Achieved (0% to 200%) | X | Corporate Multiplier
(0 to 1.1) | X | Individual Performance Multiplier (0% to 150%) | = | EAIP Payout | | | $629,802 | | 70% | | 185% | | 0.85 | | 75% | | $519,941 | | | Long-Term Incentives Earned Long-Term Performance Awards Earned. Organizational performance under the 2021–2023 LTP program was strong in several areas, including key areas where performance exceeded target expectations. In light of performance results, including strong reliability performance and stakeholder relationships, and considering the events of Winter Storm Elliott, the TVA Board exercised its discretion to adjust the calculated 2023 LTP payout percentage from 146 percent to 136 percent. | | | Target Amount | X | Percent of Opportunity Achieved (0% to 200%) | = | LTP Incentive Amount | | | | | $562,500 | | 136% | | $765,000 | | | | | Long-Term Retention Award Earned. Mr. Fountain earned $345,500 in 2023 upon the vesting of the 2023 tranches of his 2021, 2022, and 2023 LTR program awards. The LTR awards vest ratably over a three-year period, subject to continued employment on each vesting date. Long-Term Incentive Opportunities Granted 2023–2025 Long-Term Performance Award Opportunity. Effective October 1, 2022, Mr. Fountain was granted a 2023–2025 LTP program award with a target opportunity of $970,000 which will vest on September 30, 2025. The actual payout will depend on performance against targets at the end of the three-year performance period. 2023 Long-Term Retention Award Opportunity. Effective October 1, 2022, Mr. Fountain was granted a 2023 LTR program award of $390,000 that vests ratably over a three-year period, subject to continued employment on each vesting date. The first tranche was earned in 2023 as described above.
|
Executive Compensation Tables and Narrative Disclosures
Summary Compensation and Grants of Plan-Based Awards
The following table provides information on compensation earned by each of the NEOs in 2023 (and 2022 and 2021, as applicable).
SUMMARY COMPENSATION TABLE | | | | | | | | | | | | | | | | | | | | | | | | | | | | | | | | | | | | | | | | | | | | | | | | | | | Name and Principal Position | | Year | | Salary | | Bonus(1) | | | | Non-Equity Incentive Plan Compensation(2) | | Change in Pension Value and
Nonqualified Deferred Compensation Earnings(3) | | All Other Compensation(4) | | Total | | | Jeffrey J. Lyash | | 2023 | | $ | 1,227,000 | | | $ | — | | | | | $ | 6,758,860 | | | | $ | 2,530,772 | | | | $ | 27,450 | | | $ | 10,544,082 | | | | President and Chief | | 2022 | | 1,152,250 | | | — | | | | | 7,040,428 | | | | 1,541,448 | | | | 26,100 | | | 9,760,226 | | | | Executive Officer | | 2021 | | 1,100,000 | | | — | | | | | 6,354,730 | | | | 2,110,300 | | | | 317,650 | | | 9,882,680 | | | | John M. Thomas, III | | 2023 | | $ | 835,380 | | | $ | — | | | | | $ | 2,743,221 | | | | $ | 950,898 | | | | $ | 22,875 | | | $ | 4,552,374 | | | | Executive Vice President and | | 2022 | | 795,600 | | | — | | | | | 2,627,456 | | | | 57,928 | | | | 21,750 | | | 3,502,734 | | | | Chief Financial and Strategy Officer | | 2021 | | 710,711 | | | — | | | | | 2,423,003 | | | | 767,504 | | | | 21,375 | | | 3,922,593 | | | | Donald A. Moul | | 2023 | | $ | 795,600 | | | $ | — | | | | | $ | 2,271,265 | | | | $ | 332,840 | | | | $ | 237,632 | | | $ | 3,637,337 | | | | Executive Vice President | | 2022 | | 765,000 | | | — | | | | | 1,742,662 | | | | 139,756 | | | | 945,452 | | | 3,592,870 | | | | and Chief Operating Officer | | 2021 | | 205,962 | | | — | | | | | 648,869 | | | | — | | | | 678,098 | | | 1,532,929 | | | | Timothy S. Rausch | | 2023 | | $ | 637,640 | | | $ | — | | | | | $ | 1,817,165 | | | | $ | 322,682 | | | | $ | 27,450 | | | $ | 2,804,937 | | | | Executive Vice President | | 2022 | | 569,321 | | | — | | | | | 1,607,805 | | | | 219,325 | | | | 26,100 | | | 2,422,551 | | | | and Chief Nuclear Officer | | 2021 | | 551,668 | | | — | | | | | 1,387,136 | | | | 237,895 | | | | 25,650 | | | 2,202,349 | | | | David B. Fountain | | 2023 | | $ | 629,802 | | | $ | — | | | | | $ | 1,630,441 | | | | $ | 221,672 | | | | $ | 27,450 | | | $ | 2,509,365 | | | | Executive Vice President | | 2022 | | 577,800 | | | — | | | | | 1,239,436 | | | | 185,739 | | | | 76,100 | | | 2,079,075 | | | | and General Counsel | | 2021 | | 507,444 | | | — | | | | | 567,163 | | | | 4,167 | | | | 479,295 | | | 1,558,069 | | | | | | | | | | | | | | | | | | | | | | | | | | | | | | | | | | | | | | | | | | | | | | | | | | | | | | | | | | | | | | |
Notes (1) There were no bonus awards in 2023. (2) The 2023 data is outlined in the Non-Equity Incentive Plan Compensation table below. (3) The 2023 data is outlined in the Change in Pension Value and Nonqualified Deferred Compensation Earnings table below. (4) The 2023 data is outlined in the All Other Compensation table below.
NON-EQUITY INCENTIVE PLAN COMPENSATION | | | | | | | | | | | | | | | | | | | | | | | | | | | | | | | | | | | Jeffrey J. Lyash | | | | John M. Thomas, III | | Donald A. Moul | | Timothy S. Rausch | | David B. Fountain | | | | EAIP | $ | 1,302,384 | | | | | $ | 788,181 | | | $ | 750,649 | | | $ | 807,165 | | | $ | 519,941 | | | | | LTP | 3,963,176 | | | | | 1,413,040 | | | 800,700 | | | 680,000 | | | 765,000 | | | | LTR 2021-03(A) | 416,300 | | | | | 147,000 | | | 196,250 | | | 110,000 | | | 105,500 | | | | LTR 2022-02(B) | 508,000 | | | | | 195,000 | | | 262,000 | | | 110,000 | | | 110,000 | | | | LTR 2023-01(C) | 569,000 | | | | | 200,000 | | | 261,666 | | | 110,000 | | | 130,000 | | | | | | | | | | | | | | | | | | | Total | $ | 6,758,860 | | | | | $ | 2,743,221 | | | $ | 2,271,265 | | | $ | 1,817,165 | | | $ | 1,630,441 | | | |
Notes (A) LTR grant representing the third tranche of the LTR award effective October 1, 2020. (B) LTR grant representing the second tranche of the LTR award effective October 1, 2021. (C) LTR grant representing the first tranche of the LTR award effective October 1, 2022.
CHANGE IN PENSION VALUE AND NONQUALIFIED DEFERRED COMPENSATION EARNINGS | | | | | | | | | | | | | | | | | | | | | | | | | | | | | | | | | | | Jeffrey J. Lyash | | | | John M. Thomas, III | | Donald A. Moul | | Timothy S. Rausch | | David B. Fountain | | | Increase under TVARS Plans(A) | $ | — | | | | | $ | 18,114 | | | $ | — | | | $ | — | | | $ | — | | | | | Increase under SERP | 2,530,772 | | | | | 932,784 | | | 332,840 | | | 322,682 | | | 221,672 | | | | | Total | $ | 2,530,772 | | | | | $ | 950,898 | | | $ | 332,840 | | | $ | 322,682 | | | $ | 221,672 | | | |
Notes (A) The present value of the TVARS Plans and SERP are impacted by plan assumption changes and actual plan experience which may be different than previously assumed.
ALL OTHER COMPENSATION | | | | | | | | | | | | | | | | | | | | | | | | | | | | | | | | | | | | | Jeffrey J. Lyash | | | | John M. Thomas, III | | Donald A. Moul | | Timothy S. Rausch | | David B. Fountain | | | | 401(k) Matching Contribution | $ | 13,725 | | | | | $ | 13,725 | | | $ | 13,725 | | | $ | 13,725 | | | $ | 13,725 | | | | | Non-Elective 401(k) Contribution | 13,725 | | | | | 9,150 | | | 13,725 | | | 13,725 | | | 13,725 | | | | | Deferred Cash Recruitment/Relocation Incentive | — | | | | | — | | | 100,000 | | (A) | — | | | — | | | | | Relocation Benefits | — | | | | | — | | | 110,182 | | | — | | | — | | | | | Total | $ | 27,450 | | | | | $ | 22,875 | | | $ | 237,632 | | | $ | 27,450 | | | $ | 27,450 | | | |
Notes (A) Mr. Moul is required to repay to TVA deferred cash recruitment and relocation incentive payment in the amount of $450,000 if, prior to June 21, 2024, he (1) voluntarily terminates employment unless the separation is for reasons beyond his control and acceptable to TVA, or (2) is terminated for cause. Mr. Moul is required to repay to TVA deferred cash recruitment and relocation incentive payment in the amount of $100,000 if, prior to June 21, 2025, he (1) voluntarily terminates employment unless the separation is for reasons beyond his control and acceptable to TVA, or (2) is terminated for cause.
The following table provides information on non-equity incentive plan opportunities and grants provided to NEOs and the possible range of payouts associated with the opportunities and grants. Awards under the EAIP, LTP, and LTR that vested as of September 30, 2023, will be paid in cash during the first quarter of 2024.
GRANTS OF PLAN-BASED AWARDS TABLE as of September 30, 20202023 | | | | | | | | | | | | | | | | | | | | | | | | | | | | | | | | | | | | | | | | | | Estimated Possible Payouts Under Non-Equity Incentive Plan Awards(1) | | Estimated Future Payouts Under
Non-Equity Incentive Plan Awards(1) | | | | | | | Current Year | | Future Years | | | | Name | Plan | | | Threshold(2) | Target(2) | Maximum(2) | | Threshold(2) | Target(2) | Maximum(2) | | Performance Period Ending/Vesting Date | | Jeffrey J. Lyash | EAIP | | (3) | $ | 793,500 | | $ | 1,587,000 | | $ | 2,380,500 | | | | | | | 9/30/2020 | | LTR 2020-01 | | (5) | | 338,000 | | 338,000 | | | | | | | 9/30/2020 | | LTP 2019 | | (6) | | | — | | | $ | 1,012,000 | | $ | 2,024,000 | | $ | 3,036,000 | | | 9/30/2021 | | LTR 2020-02 | | (5) | | | — | | | | 338,000 | | 338,000 | | | 9/30/2021 | | LTP 2020 | | (7) | | | | | 1,170,500 | | 2,341,000 | | 3,511,500 | | | 9/30/2022 | | LTR 2020-03 | | (5) | | | | | | 338,000 | | 338,000 | | | 9/30/2022 | | | | | | | | | | | | | | | | John M. Thomas, III | EAIP | | (3) | $ | 266,634 | | $ | 533,267 | | $ | 799,901 | | | | | | | 9/30/2020 | | LTP 2018 | | (4) | 425,000 | 850,000 | 1,275,000 | | | | | | 9/30/2020 | | LTR 2018-03 | | (5) | | 116,667 | 116,667 | | | | | | 9/30/2020 | | LTR 2019-02 | | (5) | | 126,667 | 126,667 | | | | | | 9/30/2020 | | LTR 2020-01 | | (5) | | 140,000 | 140,000 | | | | | | 9/30/2020 | | LTP 2019 | | (6) | | | | | $ | 440,000 | | $ | 880,000 | | $ | 1,320,000 | | | 9/30/2021 | | LTR 2019-03 | | (5) | | | | | | 126,667 | 126,667 | | 9/30/2021 | | LTR 2020-02 | | (5) | | | | | | 140,000 | 140,000 | | 9/30/2021 | | LTP 2020 | | (7) | | | | | 490,000 | 980,000 | 1,470,000 | | 9/30/2022 | | LTR 2020-03 | | (5) | | | | | | 140,000 | 140,000 | | 9/30/2022 | | | | | | | | | | | | | | | | | | | | | | | | | | | | Michael D. Skaggs | EAIP | | (3) | $ | 265,360 | | $ | 530,720 | | $ | 796,080 | | | | | | | 9/30/2020 | | LTP 2018 | | (4) | 375,000 | 750,000 | 1,125,000 | | | | | | 9/30/2020 | | LTR 2018-03 | | (5) | | 100,000 | 100,000 | | | | | | 9/30/2020 | | LTR 2019-02 | | (5) | | 140,000 | 140,000 | | | | | | 9/30/2020 | | LTR 2020-01 | | (5) | | 143,000 | 143,000 | | | | | | 9/30/2020 | | LTP 2019 | | (6) | | | | | $ | 490,000 | | $ | 980,000 | | $ | 1,470,000 | | | 9/30/2021 | | LTR 2019-03 | | (5) | | | | | | 140,000 | 140,000 | | 9/30/2021 | | LTR 2020-02 | | (5) | | | | | | 143,000 | 143,000 | | 9/30/2021 | | LTP 2020 | | (7) | | | | | 495,000 | 990,000 | 1,485,000 | | 9/30/2022 | | LTR 2020-03 | | (5) | | | | | | 143,000 | 143,000 | | 9/30/2022 | | | | | | | | | | | | | | | | | | | | | | | | | | | | Sherry A. Quirk | EAIP | | (3) | $ | 195,052 | | $ | 390,104 | | $ | 585,156 | | | | | | | 9/30/2020 | | LTP 2018 | | (4) | 337,500 | 675,000 | 1,012,500 | | | | | | 9/30/2020 | | LTR 2018-03 | | (5) | | 95,000 | 95,000 | | | | | | 9/30/2020 | | LTR 2019-02 | | (5) | | 96,667 | 96,667 | | | | | | 9/30/2020 | | LTR 2020-01 | | (5) | | 99,000 | 99,000 | | | | | | 9/30/2020 | | LTP 2019 | | (6) | | | | | $ | 342,500 | | $ | 685,000 | | $ | 1,027,500 | | | 9/30/2021 | | LTR 2019-03 | | (5) | | | | | | 96,667 | 96,667 | | 9/30/2021 | | LTR 2020-02 | | (5) | | | | | | 99,000 | 99,000 | | 9/30/2021 | | LTP 2020 | | (7) | | | | | 347,500 | 695,000 | 1,042,500 | | 9/30/2022 | | LTR 2020-03 | | (5) | | | | | | 99,000 | 99,000 | | 9/30/2022 | | | | | | | | | | | | | | | | | | | | | | | | | | | | Timothy S. Rausch | EAIP | | (3) | $ | 187,460 | | $ | 374,920 | | $ | 562,380 | | | | | | | 9/30/2020 | | PIA 2020 | | (8) | | | 350,000 |
| | | | | 9/30/2020 | | LTR 2019-02 | | (5) | | 57,750 | 57,750 | | | | | | 9/30/2020 | | LTR 2020-01 | | (5) | | 110,000 | 110,000 | | | | | | 9/30/2020 | | LTP 2019 | | (6) | | | | | $ | 202,125 | | $ | 404,250 | | $ | 606,375 | | | 9/30/2021 | | LTR 2019-03 | | (5) | | | | | | 57,750 | 57,750 | | 9/30/2021 | | LTR 2020-02 | | (5) | | | | | | 110,000 | 110,000 | | 9/30/2021 | | LTP 2020 | | (7) | | | | | 250,000 | 500,000 | 750,000 | | 9/30/2022 | | LTR 2020-03 | | (5) | | | | | | 110,000 | 110,000 | | 9/30/2022 |
| | | | | | | | | | | | | | | | | | | | | | | | | | | | | | | | | | | | | | | | | | | | Estimated Possible Payouts Under Non-Equity Incentive Plan Awards(1) | | Estimated Possible Future Payouts Under Non-Equity Incentive Plan Awards(1) | | | | | | | | | Current Year | | Future Years | | Performance | | | | Name | Plan | | | Threshold(2) | Target(2) | Maximum(2) | | Threshold(2) | Target(2) | Maximum(2) | | Period End /
Vesting Date | | | | Jeffrey J. Lyash | EAIP | | (3) | $ | 920,250 | | $ | 1,840,500 | | $ | 3,681,000 | | | | | | | 9/30/2023 | | | | LTP 2021 | | (4) | 1,457,050 | | 2,914,100 | | 5,828,200 | | | | | | | 9/30/2023 | | | | LTR 2021-03 | | (5) | | 416,300 | | 416,300 | | | | | | | 9/30/2023 | | | | LTR 2022-02 | | (5) | | 508,000 | | 508,000 | | | | | | | 9/30/2023 | | | | LTR 2023-01 | | (5) | | 569,000 | | 569,000 | | | | | | | 9/30/2023 | | | | LTP 2022 | | (6) | | | | | $ | 1,778,000 | | $ | 3,556,000 | | $ | 7,112,000 | | | 9/30/2024 | | | | LTR 2022-03 | | (5) | | | | | | 508,000 | | 508,000 | | | 9/30/2024 | | | | LTR 2023-02 | | (5) | | | | | | 569,000 | | 569,000 | | | 9/30/2024 | | | | LTP 2023 | | (6) | | | | | 1,991,500 | | 3,983,000 | | 7,966,000 | | | 9/30/2025 | | | | LTR 2023-03 | | (5) | | | | | | 569,000 | | 569,000 | | | 9/30/2025 | | | | | | | | | | | | | | | | | | | | John M. Thomas, III | EAIP | | (3) | $ | 334,152 | | $ | 668,304 | | $ | 1,336,608 | | | | | | | 9/30/2023 | | | | LTP 2021 | | (4) | 519,500 | 1,039,000 | 2,078,000 | | | | | | 9/30/2023 | | | | LTR 2021-03 | | (5) | | 147,000 | 147,000 | | | | | | 9/30/2023 | | | | LTR 2022-02 | | (5) | | 195,000 | 195,000 | | | | | | 9/30/2023 | | | | LTR 2023-01 | | (5) | | 200,000 | 200,000 | | | | | | 9/30/2023 | | | | LTP 2022 | | (6) | | | | | $ | 697,500 | | $ | 1,395,000 | | $ | 2,790,000 | | | 9/30/2024 | | | | LTR 2022-03 | | (5) | | | | | | 195,000 | 195,000 | | 9/30/2024 | | | | LTR 2023-02 | | (5) | | | | | | 200,000 | 200,000 | | 9/30/2024 | | | | LTP 2023 | | (6) | | | | | 712,500 | 1,425,000 | 2,850,000 | | 9/30/2025 | | | | LTR 2023-03 | | (5) | | | | | | 200,000 | 200,000 | | 9/30/2025 | | | | | | | | | | | | | | | | | | | | | | | | | | | | | | | | | | Donald A. Moul | EAIP | | (3) | $ | 318,240 | | $ | 636,480 | | $ | 1,272,960 | | | | | | | 9/30/2023 | | | | LTP 2021 | | (4)(7) | 294,375 | 588,750 | 1,177,500 | | | | | | 9/30/2023 | | | | LTR 2021-03 | | (5)(8) | | 196,250 | 196,250 | | | | | | 9/30/2023 | | | | LTR 2022-02 | | (5) | | 262,000 | 262,000 | | | | | | 9/30/2023 | | | | LTR 2023-01 | | (5) | | 261,666 | 261,666 | | | | | | 9/30/2023 | | | | LTP 2022 | | (6) | | | | | $ | 587,500 | | $ | 1,175,000 | | $ | 2,350,000 | | | 9/30/2024 | | | | LTR 2022-03 | | (5) | | | | | | 262,000 | 262,000 | | 9/30/2024 | | | | LTR 2023-02 | | (5) | | | | | | 261,667 | 261,667 | | 9/30/2024 | | | | LTP 2023 | | (6) | | | | | 712,500 | 1,425,000 | 2,850,000 | | 9/30/2025 | | | | LTR 2023-03 | | (5) | | | | | | 261,667 | 261,667 | | 9/30/2025 | | | | | | | | | | | | | | | | | | | | | | | | | | | | | | | | | | Timothy S. Rausch | EAIP | | (3) | $ | 223,174 | | $ | 446,348 | | $ | 892,696 | | | | | | | 9/30/2023 | | | | LTP 2021 | | (4) | 250,000 | 500,000 | 1,000,000 | | | | | | 9/30/2023 | | | | LTR 2021-03 | | (5) | | 110,000 | 110,000 | | | | | | 9/30/2023 | | | | LTR 2022-02 | | (5) | | 110,000 | 110,000 | | | | | | 9/30/2023 | | | | LTR 2023-01 | | (5) | | 110,000 | 110,000 | | | | | | 9/30/2023 | | | | LTP 2022 | | (6) | | | | | $ | 298,000 | | $ | 596,000 | | $ | 1,192,000 | | | 9/30/2024 | | | | LTR 2022-03 | | (5) | | | | | | 110,000 | 110,000 | | 9/30/2024 | | | | LTR 2023-02 | | (5) | | | | | | 110,000 | 110,000 | | 9/30/2024 | | | | LTP 2023 | | (6) | | | | | 362,500 | 725,000 | 1,450,000 | | 9/30/2025 | | | | LTR 2023-03 | | (5) | | | | | | 110,000 | 110,000 | | 9/30/2025 | | | | | | | | | | | | | | | | | | | | | | | | | | | | | | | | | | David B. Fountain | EAIP | | (3) | $ | 220,431 | | $ | 440,861 | | $ | 881,722 | | | | | | | 9/30/2023 | | | | LTP 2021 | | (4) | 281,250 | 562,500 | 1,125,000 | | | | | | 9/30/2023 | | | | LTR 2021-03 | | (5) | | 105,500 | 105,500 | | | | | | 9/30/2023 | | | | LTR 2022-02 | | (5) | | 110,000 | 110,000 | | | | | | 9/30/2023 | | | | LTR 2023-01 | | (5) | | 130,000 | 130,000 | | | | | | | 9/30/2023 | | | | LTP 2022 | | (6) | | | | | $ | 385,000 | | $ | 770,000 | | $ | 1,540,000 | | | 9/30/2024 | | | | LTR 2022-03 | | (5) | | | | | | 110,000 | | 110,000 | | | 9/30/2024 | | | | LTR 2023-02 | | (5) | | | | | | 130,000 | 130,000 | | 9/30/2024 | | | | LTP 2023 | | (6) | | | | | 485,000 | 970,000 | 1,940,000 | | 9/30/2025 | | | | LTR 2023-03 | | (5) | | | | | | 130,000 | 130,000 | | 9/30/2025 | | | | | | | | | | | | | | | | | | | | | | | | | | | | | | | | | | | | | | | | | | | | | | | | | | | | | | | | | | | | | | | | | | | | | | | | | | | | | | | | | | | | | | | | | | | | | | | | | | | | | | | | | | | | | | | | | | | | | | | | | | | | | | | | | | | | | | | | | | | | | | | | | | | | | | | | | | | | | | | | | | | | | | |
Notes (1)TVA does not have any equity securities and therefore has no equity-based awards.
(2)Threshold, Target, and Maximum represent amounts that could be earned by an NEO based on performance during the applicable performance cycle. Threshold, Target, and Maximum targets for EAIP and LTIP arewere 50 percent, 100 percent, and 150 percent.200 percent for 2023.
(3)Target incentive opportunities as a percentage of salaries were as follows: Mr. Lyash, 150 percent; Mr. Thomas, 80 percent; Mr. Skaggs,Moul, 80 percent; Ms. Quirk,Mr. Rausch, 70 percent; and Mr. RauschFountain, 70 percent. Additionally, a corporate multiplier ranging between 0.00 and 1.001.10 may be applied which can reduce the award to $0. An individual performance multiplier of up to 150 percent may also be applied which may increase the award to 225 percent of target. Actual EAIP awards earned for performance in 20202023 are reported for each of the NEOs under the "Non-Equity Incentive Plan Compensation" column in the Summary Compensation Table. See Compensation Discussion and Analysis for a discussion of how each award was determined. (4) LTP awards were granted October 1, 2017, and vested September 30, 2020. At the end of the performance period, TVA's LTIP Scorecard was applied to the grants in order to determine LTP award payouts. For 2023, the TVA Board subsequently exercised its discretion to adjust the calculated LTP payout percentage from 146 percent to 136 percent. Award payouts are reported for each of the NEOs under the "Non-Equity Incentive Plan Compensation" column in the Summary Compensation Table. (5)All LTR awards will be paid in a lump sum within two months of the September 30th vesting date.date except in the case of death or disability. The awards will be paid in cash after deducting applicable federal, state, and local withholding taxes. In the case of death, the beneficiary will be paid as soon as administratively practicable but in no event later than the last day of the second full calendar month following the participant's death. Disability awards will be paid as soon as administratively practicable but in no event later than the last day of the second full calendar month following the participant's separation from service due to disability. Actual LTR awards earned in 20202023 are reported for each of the NEOs under the "Non-Equity Incentive Plan Compensation" column in the Summary Compensation Table. (6) Mr. Lyash's LTP award was granted October 1, 2019, and will vest September 30, 2021. All other LTP awards were granted October 1, 2018, and will vest September 30, 2021. At the end of the performance period, TVA's LTIP Scorecard will be applied to the grants in order to determine LTP award payouts. The final award may be adjusted by the TVA Board based on the evaluation of the participant's individual achievements, peer group comparisons, and performance results over the performance cycle. (7) LTP awards were granted October 1, 2019, and will vest September 30, 2022. At the endReflects 27/36th of the performance period, TVA's LTIP Scorecard will be applied totarget grant amount of $785,000 for the grants in order to determine award payouts. The final award may be adjusted by the TVA Board based on the evaluation of the participant's individual achievements, peer group comparisons, and performance results over the2021-2023 LTP performance cycle. (8)Reflects the maximum award Mr. Rausch was eligible to receive under a PIA. The actual award to be paid to Mr. Rausch is reported in the "Non-Equity Incentive Plan Compensation" columnprorated amount of 27/36th of the Summary Compensation Table.LTR grant of $785,000 for the 2021-2023 retention cycle.
Retirement and Pension Plans
The table below provides the actuarial present value of the NEOs' accumulated benefits, including the number of years of credited service, under TVA's retirement and pension plans as of September 30, 2020,2023, determined using a methodology and interest rate and mortality rate assumptions consistent with those used in the financial statements in this Annual Report, set forth in Note 2120 — Benefit Plans.
PENSION BENEFITS TABLE | | Name | Name | Plan Name | Number of Years of Credited Service(1) | | Present Value of Accumulated Benefit | | Payments During Last Year | Name | Plan Name | Number of Years of Credited Service(1) | | Present Value of Accumulated Benefit | | Payments During Last Year | | Jeffrey J. Lyash | Jeffrey J. Lyash | TVARS | N/A | | N/A | (4) | $ | — | | Jeffrey J. Lyash | TVARS | N/A | | N/A | (3) | $ | — | | | | SERP Tier 1 | 11.417 | (2) | $ | 8,242,520 | | | — | | | SERP Tier 1 | 14.417 | (2) | $ | 14,425,040 | | | — | | | | John M. Thomas, III | John M. Thomas, III | TVARS | 14.833 | | 411,949 | | | — | | John M. Thomas, III | TVARS | 17.833 | | 409,548 | | | — | | | | SERP Tier 1 | 14.833 | | 4,634,859 | | | — | | | SERP Tier 1 | 17.833 | | 6,413,590 | | | — | | | Michael D. Skaggs | TVARS | 26.583 | | 772,678 | | | — | | | | SERP Tier 1 | 24.000 | (3) | 7,893,997 | | | — | | | | Sherry A. Quirk | TVARS | N/A | | N/A | (4) | — | | | | Donald A. Moul | | Donald A. Moul | TVARS | N/A | | N/A | (3) | — | | | | SERP Tier 1 | 5.583 | | 1,110,246 | | | — | | | SERP Tier 1 | 2.250 | | 472,596 | | | — | | | Timothy S. Rausch | Timothy S. Rausch | TVARS | N/A | | N/A | (4) | — | | Timothy S. Rausch | TVARS | N/A | | N/A | (3) | — | | | | SERP Tier 2 | 1.917 | | 179,212 | | | — | | | SERP Tier 1 | 4.917 | | 959,114 | | | — | | | David B. Fountain | | David B. Fountain | TVARS | N/A | | N/A | (3) | — | | | | | SERP Tier 1 | 3.333 | | 411,578 | | | — | | |
Notes (1) Limited to 24 years when determining supplemental benefits available under SERP Tier 1, described below. (2) Mr. Lyash was granted five years of credited service for calculating his SERP benefit. In the event of involuntary termination except for cause prior to five years of actual service, the vesting requirement will be waived, and he will be entitled to the additional five years of granted credited service plus his actual years of service for calculating his SERP benefit. In the event of termination for cause or voluntary termination for any reason prior to five years of actual service, the vesting requirement will be waived and his SERP benefit will be calculated based on a total of five years of credited service. After five years of actual service with TVA, he will be granted five additional years of credited service for a total of 15 years of credited service for calculating his SERP benefit. As of September 30, 2020,2023, Mr. Lyash had 1.4174.417 years of service. The Present Valuepresent value of the Accumulatedaccumulated SERP benefit with 6.4179.417 years of credited services is $9,828,493. The present value of the accumulated SERP benefit with 14.417 years of credited service is $4,558,306. The Present Value of the Accumulated SERP benefit with 11.417 years of credited service is $8,242,520.$14,425,040. (3) Mr. Skaggs has reached the 24 year service cap allowed under the SERP. (4)Lyash, Mr. Lyash, Ms. Quirk,Rausch, Mr. Fountain, and Mr. RauschMoul are not eligible to participate in the TVARS Pension Plan since they were hired after June 30, 2014.
Qualified Retirement Plans
The retirement benefits for which employees are eligible and receive under the TVARS pension plan and 401(k) plan depend on the employee's hire date, years of service, and individual elections, as follows:
•Employees who were first hired prior to January 1, 1996, receive (i) a traditional pension benefit calculated based on the employee's creditable service, the employee's average monthly salary for the highest three consecutive years of eligible compensation, and a pension factor based on the employee's age and years of service, less a Social Security offset, and (ii) 401(k) plan matching contributions from TVA. The 401(k) plan matching contribution is $0.25 on every dollar contributed by the employee up to six percent of eligible compensation, for a maximum matching contribution of 1.5 percent of eligible compensation. None of the NEOs are in this group.
•Employees who were first hired prior to January 1, 1996, and who elected to switch pension structures from traditional to cash balance, receive (i) a cash balance pension benefit calculated based on (a) pay-based credits and interest that accrue over time in the employee's account and (b) the employee's age at the time of retirement, and (ii) 401(k) plan matching contributions from TVA. The monthly pay credits are equal to six percent of eligible compensation, and monthly interest is credited at an annual interest rate equal to the change in the CPI-U plus three percent (with a minimum of six percent and maximum of 10 percent). The interest rate during 20202023 was sixten percent. The 401(k) plan matching contribution is $0.75 on every dollar contributed by the employee up to six percent of eligible compensation, for a maximum matching contribution of 4.5 percent of eligible compensation. Mr. Skaggs isNone of the NEOs are in this group.
•Employees who were first hired on or after January 1, 1996, and who had 10 or more years of service as of October 1, 2016, receive (i) a cash balance pension benefit calculated based on (a) pay-based credits and interest that accrue over time in the employee's account and (b) the employee's age at the time of retirement, and (ii) 401(k) plan non-elective and matching contributions from TVA. The monthly pay credits are equal to three percent of eligible compensation, and monthly interest is credited at an annual interest rate equal to the change in the CPI-U plus two percent (with a minimum of 4.75 percent and a maximum of 6.25 percent). The interest rate during 20202023 was 4.756.25 percent. The 401(k) plan automatic, non-elective contribution is equal to three percent of eligible compensation, and the matching contribution is $0.75 on every dollar contributed by the employee up to six percent of eligible compensation, for a maximum matching contribution of 4.5 percent of eligible compensation. Mr. Thomas is in this group.
•Employees who were first hired on or after January 1, 1996, and who had less than 10 years of service as of October 1, 2016, receive (i) a cash balance pension benefit calculated based on pay-based credits and interest that accrue over time in the employee's account and the employee's age at the time of retirement, and (ii) 401(k) plan non-elective and matching contributions from TVA. As of October 1, 2016, the cash balance accounts of these employees receive no additional pay-based credits; however, the accounts continue to receive monthly interest credits at an annual interest rate equal to the change in the CPI-U plus two percent (with a minimum of 4.75 percent and a maximum of 6.25 percent). The interest rate during 20202023 was 4.756.25 percent. The 401(k) plan automatic, non-elective contribution is equal to six percent of eligible compensation, and the matching contribution is dollar-for-dollar on employee contributions up to six percent of eligible compensation, for a maximum matching contribution of six percent of eligible compensation. None of the NEOs are in this group.
•Employees who were hired prior to July 1, 2014, and who elected to waive their cash balance retirement benefit and transfer their cash balance account to the 401(k) plan effective October 1, 2018, receive a retirement benefit in the 401(k) plan only. The 401(k) plan is an automatic, non-elective contribution that is equal to six percent of eligible compensation, and the matching contribution is dollar-for-dollar on employee contributions up to six percent of the eligible compensation, for a maximum matching contribution of six percent of eligible compensation. None of the NEOs are in this group.
•Employees who were first hired on or after July 1, 2014 (or who were rehired and were either previously not vested in the pension plan or cashed out their pension benefit) receive a retirement benefit in the 401(k) plan only. The 401(k) plan automatic, non-elective contribution is equal to 4.5 percent of eligible compensation, and the matching contribution is $0.75 on every dollar contributed by the employee up to six percent of eligible compensation, for a maximum matching contribution of 4.5 percent of eligible compensation. Mr. Lyash, Mr. Moul, Mr. Rausch, and Ms. QuirkMr. Fountain are in this group.
Cash Balance Pension. For NEOs who are eligible for retirement benefits under the pension plan, which includes Mr. Thomas, and Mr. Skaggs, eligible compensation is defined as annual salary only for benefit calculation purposes and is shown under the column titled "Salary" in the Summary Compensation Table. The eligible compensation in 20202023 could not exceed $280,000$305,000 pursuant to the IRS annual compensation limit applicable to qualified plans. Employees with cash balance benefits who have at least five years of cash balance service are eligible at retirement or termination of employment to receive an immediate benefit in the form of a monthly pension with survivor benefit options or in a lump-sum payment with cash out or rollover options. The pension plan does not provide for early retirement benefits to any NEO or any other employee eligible for cash balance benefits.
401(k) Plan. All employees eligible to participate in the 401(k) plan, including the NEOs, may elect to contribute to the 401(k) plan on a before-tax, Roth, and/or after-tax basis.basis, and in-plan Roth rollovers by participant election are available. Contributions to a participant's 401(k) plan account by TVA and the participant during 2023 could not exceed $66,000 pursuant to the IRS annual contribution limit applicable to qualified plans. For purposes of matching and non-elective contributions from TVA to the 401(k) accounts of the NEOs, eligible compensation is defined as annual salary only for benefit calculation purposes and is shown under the column titled "Salary" in the Summary Compensation Table. The eligible compensation in 20202023 could not exceed $280,000$305,000 pursuant to the IRS annual compensation limit applicable to qualified plans. Any participant in the 401(k) plan must have three years of TVA service to be vested in matching and non-elective contributions from TVA.
Supplemental Executive Retirement Plan
All NEOs are participants in the SERP. The SERP is a non-qualified defined benefitbenefit pension planplan similar to those typically found in other companies in TVA's peer group and is provided to a limited number of executives, including the NEOs. TVA's SERP was created to recruit and retain key executives. The plan is designed to provide a competitive level of retirement benefits in excess of the limitations on contributions and benefits imposed by TVA's qualified defined benefit plan and Internal Revenue Code Section 415 limits on qualified retirement plans.
The SERP provides two distinct levels of participation, Tier 1 and Tier 2. Each participant is assigned to one of the two tiers at the time he or she is approved to participate in the SERP. The level of participation ("Tier") defines the level of retirement benefits under the SERP at the time of retirement.
Under the SERP, normal retirement eligibility is age 62 with five years of vesting service. No vested and accrued benefits are payable prior to age 55, and benefits are reduced for retirements prior to age 62. The level of reduction in benefits for retirements prior to age 62 depends on whether a participant's termination is "approved" or "unapproved." In the event of an approved termination of TVA employment, any vested and accrued benefits are reduced by 5/12 percent for each month that the date of benefit commencement precedes the participant's 62nd birthday, up to a maximum reduction of 35 percent. In the event of an unapproved termination of TVA employment, the participant's accrued benefits are first subject to a reduced percentage of vesting if the participant's years of service are between five and 10. At five years of vesting service, the vested percentage of retirement benefits is 50 percent and increases thereafter by 10 percent for each full additional year of service, reaching 100 percent vesting for 10 or more years of vesting service. Thereafter, any vested and accrued benefits are reduced by 10/12 percent for each month that the date of benefit commencement precedes the participant's 62nd birthday up to a maximum reduction of 70 percent.
For purposes of the SERP, an "approved" termination means termination of employment with TVA due to (i) retirement on or after the participant's 62nd birthday, (ii) retirement on or after attainment of actual age 55, if such retirement has the approval of the TVA Board or its delegate, (iii) death in service as an employee, (iv) disability (as defined under the Rules and Regulations of the TVARS) as determined by the Retirement Committee, or (v) any other circumstance approved by the TVA Board or its delegate. For purposes of the SERP, an "unapproved" termination means a termination of employment with TVA when such termination does not constitute an "approved" termination as defined in the preceding sentence.
SERP Tier 1. The Tier 1 structure is designed to replace 60 percent of the amount of a participant's compensation at the time the participant reaches age 62 and has accrued 24 years of TVA service. Tier 1 benefits are based on a participant's highest average compensation during three consecutive SERP years and a pension multiple of 2.5 percent for each year of credited service up to a maximum of 24 years. Compensation is defined as salary and EAIP for benefit calculation purposes. Tier 1 benefits are offset by Social Security benefits, benefits provided under TVA's qualified defined benefit pension plan, and prior employer pension benefits when applicable.
SERP Tier 2. The purpose of this restoration plan is to adjust qualified plan benefits to executives when benefits are lost due to IRS limits.limits. Pension benefitsbenefits are based on a participant's average compensation over three consecutive fiscal years and a pension multiplier of 1.3 percent for each year of service. For benefit calculation, pension includesincludes salary and annual incentives.
Nonqualified Deferred Compensation
The following table provides information regarding deferred contributions, earnings, and balances for each of the NEOs. The amounts reported under this table do not represent compensation in addition to the compensation that was earned in 20202023 and already reported in the Summary Compensation Table, but rather the amounts of compensation earned by the NEOs in 20202023 or prior years that were or have been deferred.
NONQUALIFIED DEFERRED COMPENSATION TABLE(1) | | | | | | | | | | | | | | | | | | | | | | | | | | | | | | | | | | Name | Executive
Contributions
in 2020 | | Registrant
Contributions
in 2020 | | Aggregate
Earnings in
2020 | | Aggregate
Withdrawals/
Distributions | | Aggregate
Balance at
September 30, 2020 | | | Jeffrey J. Lyash | $ | — | | | $ | — | | | $ | — | | | $ | — | | | $ | — | | | | John M. Thomas, III | — | | | — | | | — | | | — | | | — | | | | Michael D. Skaggs | — | | | — | | | 358,568 | | (1) | — | | | 5,347,029 | | (2) | | Sherry A. Quirk | — | | | — | | | — | | | — | | | — | | | | Timothy S. Rausch | — | | | — | | | — | | | — | | | — | | |
| | | | | | | | | | | | | | | | | | | | | | | | | | | | | | | | | | Name | Executive
Contributions | |
Registrant
Contributions | | Aggregate
Earnings | | Aggregate
Withdrawals/
Distributions | | Aggregate
Balance at
September 30, 2023 | | | Jeffrey J. Lyash | $ | — | | | $ | — | | | $ | — | | | $ | — | | | $ | — | | | | John M. Thomas, III | — | | | — | | | — | | | — | | | — | | | | Donald A. Moul | — | | | — | | | — | | | — | | | — | | | | Timothy S. Rausch | — | | | — | | | — | | | — | | | — | | | | David B. Fountain | — | | | — | | | — | | | — | | | — | | | | | | | | | | | | | |
NotesNote
(1) Includes vested earnings. Because noneNone of the amounts are above marketTVA's NEOs had activity or preferential earnings under SEC rules, nonean outstanding balance in their nonqualified deferred compensation plans as of these amounts are included in the Summary Compensation Table.
(2) Includes vested contributions and earnings. $600,000 of this amount has been reported in the Summary Compensation Table as compensation for a prior fiscal year.September 30, 2023.
TVA's compensation plans may allow participants to defer all or a portion of compensation earned under the plans as defined by plan terms and IRS regulations. All deferrals are credited to each participant in a deferred compensation account, and the deferral amounts are then funded into a rabbi trust. Each participant may elect one or more investment options made available by TVA or allow some or all funds to accrue interest at the rate established by the beginning of each fiscal year equal to the composite rate of all Treasury issues. Participants may elect to change from either one notional investment option or the TVA interest bearing option to another at any time. UponGenerally, upon termination of employment, funds are distributed pursuant to elections made in accordance with applicable IRS regulations.
Executive Severance Plan
TVA established the TVA Executive Severance Plan (the “Severance Plan”), including the eligibility of TVA’s NEOs (other than the CEO) to participate in the Severance Plan. The TVA Board also approves the CEO’s participation in the Severance Plan as part of the overall market review of CEO compensation. The Severance Plan provides that if TVA terminates an NEO’s employment other than for Gross Misconduct (as defined below) or such participant terminates employment for Good Reason (as defined below), such participant will be eligible to receive the following benefits in addition to his or her accrued compensation:
•A lump sum severance payment equal to the applicable multiplier times the sum of the employee’s annual base salary and target annual incentive, and continued healthcare benefits for a number of complete or partial years equal to such multiplier. The applicable multiplier is 1.5 for the CEO and 1.0 for the other NEOs, or, if the qualifying separation occurs within 24 months following a Change in Control ("CIC") of TVA (as defined below), then the applicable multiplier is 3.0 for the CEO and 2.0 for the other NEOs.
•Any earned but unpaid incentive payments, and a prorated annual incentive payment for the year of termination based on actual (or, if the qualifying separation occurs within 24 months following a CIC of TVA, based on target) achievement of performance goals.
•If the qualifying separation occurs within 24 months following a CIC of TVA, then a lump sum cash payment equal to the sum of (a) any LTIP performance awards the performance cycle of which is in progress on the participant's separation date, non-prorated and calculated based on target achievement of performance goals, and (b) any LTIP retention awards the retention cycle of which is in progress on the participant's separation date, non-prorated and calculated as if all such awards are fully vested.
•If the qualifying separation occurs within 24 months following a CIC of TVA, a waiver of the five-year vesting requirement set forth in Section 4.1(a) of the TVA Supplemental Executive Retirement Plan pursuant to its terms.
For the avoidance of doubt, the occurrence of a CIC by itself does not entitle participants to benefits under the Executive Severance Plan; rather, a qualifying separation must also occur within 24 months following a CIC as discussed above in order for a participant to be entitled to CIC benefits.
In order to receive severance benefits under the Severance Plan, participants must timely execute (and not revoke) a release of claims in favor of TVA and comply with all applicable post-separation restrictive covenants. The terms of the Severance Plan will supersede rights and obligations with respect to severance under existing agreements to which Severance Plan participants are a party.
Under the Severance Plan, a CIC shall be deemed to have occurred on the earliest of the following dates:
•the date when the United States ceases to have an ownership interest of at least fifty percent (50%) of TVA;
•the date one or more entities acquire (or have acquired during the 12-month period ending on the date of the most recent acquisition by such entity or entities) assets from TVA that have a total gross fair market value (without regard to any debt) equal to or more than thirty percent (30%) of the total gross fair market value of all of the assets of TVA immediately before such most recent acquisition;
•the date that a majority of the members of the TVA Board is no longer appointed and confirmed in accordance with the provisions of Section 2(a)(1) of the TVA Act;
•the date a complete liquidation or winding-up of TVA is consummated;
•the date that an entity such as an organization, board, commission, authority, department, or agency succeeds to the principal functions of, or powers and duties granted to, TVA; or
•the date of enactment or effectiveness of any applicable law, statute, rule, regulation, order, decree, ruling, or writ of a governmental or regulatory agency, entity, or official of competent jurisdiction that materially limits the TVA Board’s authority to establish or renew a participant’s total direct compensation.
Under the Severance Plan, Good Reason shall mean the occurrence of any of the following:
•a material adverse change in the participant’s authority, duties, or responsibilities (excluding during any period of participant’s physical or mental incapacity) with respect to his or her employment with TVA without the participant’s prior written consent;
•a material reduction in the participant’s base salary without the participant’s prior written consent (other than any reduction applicable to management employees generally);
•an actual change in the participant’s principal work location by more than 50 miles and more than 50 miles from the participant’s principal place of abode as of the date of such change in job location without the participant’s prior written consent; or
•a material breach by TVA of any term or provision of the Severance Plan without the participant’s prior written consent.
A participant may be considered to have Good Reason to terminate employment for purposes of the Severance Plan only if the participant provides written notice to TVA of termination within 30 days of the occurrence of the applicable event(s) or, if later, within 30 days of the date the participant has knowledge that such event(s) occurred. An event constituting Good Reason shall no longer constitute Good Reason if the circumstances described in the Good Reason notice are cured by TVA within 30 days following receipt of the Good Reason notice.
Under the Severance Plan, Gross Misconduct shall mean any of the following:
•misconduct involving dishonesty, fraud, or gross negligence that directly results in significant economic or reputational harm to TVA;
•insubordination, intentional neglect of duties, or refusal to cooperate with investigations of TVA’s business practices;
•conviction of a crime amounting to a felony under the laws of the United States or any of the several states, or a crime of moral turpitude;
•a significant violation of TVA’s Code of Ethics or Code of Conduct; or
•disclosure without authorization of proprietary or confidential information of TVA.
Potential Payments on Account of Resignation, Retirement, Termination without Cause, Termination with Cause, Death, or Disability
The tables below show certain potential payments that would have been made to each NEO if his or her employment had been terminated on September 30, 2020,2023, under various scenarios. Allscenarios: retirement, resignation, resignation for Good Reason (with and without CIC), termination without Cause (with or without CIC), termination with Cause, death, and Disability. The tables below also include payments from the following sources: severance agreement, SERP, EAIP, deferred cash recruitment/relocation incentive, LTR, LTP, and deferred compensation.
The following provides background information on certain payments included in the termination tables:
•Resignation.The Resignation column covers resignations that do not qualify as resignations for Good Reason under TVA's Severance Plan. See Executive Compensation Tables and Narrative Disclosures - Executive SeverancePlan for a definition of Good Reason.
•Retirement. The Retirement column covers situations where an employee separates from service after having met one of the following criteria: (i) the employee has reached the age of 55 with at least 10 years of full-time TVA service, (ii) the employee has reached the age of 60 with at least five years of full-time TVA service, or (iii) the employee is in the Civil Service Retirement System or Federal Employees Retirement System and is eligible for an immediate retirement benefit upon termination as outlined in the applicable plan.
•Severance Agreement and Termination without Cause or Resignation for Good Reason (CIC). The Severance Plan provides that if TVA terminates an NEO's employment other than for Gross Misconduct or such participant terminates employment for Good Reason, such participant will be eligible to receive certain benefits in addition to his or her accrued compensation. The amount of additional benefits will vary depending on whether the qualifying separation from service occurs within 24 months following a CIC. See Executive Compensation Tables and Narrative Disclosures - Executive Severance Plan for definitions of Gross Misconduct, Good Reason, and CIC and for a discussion of the benefits provided to NEOs under the Severance Plan.
•SERP. The SERP payments in the tables represent the present value of the accumulated benefit unless otherwise noted.
•SERP Payment Following Change in Control.The Severance Plan provides that the five-year vesting requirement set forth in Section 4.1(a) of the SERP will be waived pursuant to the terms of such section with respect to each participant whose termination date occurs within 24 months following a CIC.
•SERP Payment in Event of Death. In the event of a participant’s death while employed by TVA, the participant’s beneficiary will receive a lump sum payment equal to the actuarial equivalent of the benefit that would have been paid had the participant terminated employment on the date of death and elected a joint and 50 percent survivor benefit. The beneficiary will receive 50 percent of the reported value.
•LTR Payment in Event of Retirement. The LTIP provides that if a participant retires, the participant is entitled to any portion of a LTR award that had vested at the time of the separation from service but not been paid as well as a prorated portion of any LTR grant that had not vested at the time of the participant's separation from service, provided the amount of any such LTR award for each vesting period within the retention cycle is prorated based on the number of whole months the participant was employed by TVA during such vesting period.
•LTR Payment in Event of Death. The LTIP provides that in the event of the death of a participant, the participant's beneficiary is entitled to any portion of a LTR award that had vested at the time of the participant's death but not been paid as well as a prorated portion of any LTR grant that had not vested at the time of the participant's separation from service, provided that the LTR award for each vesting period will be prorated based on the number of whole months the participant was employed by TVA during the vesting period in which the participant separated from service as compared to (1) 12 months for the vesting period that includes the day that the participant separated from service, (2) 24 months for the vesting period that immediately follows the vesting period during which the participant separated from service, and (3) 36 months for the second vesting period that follows the vesting period during which the participant separated from service.
•LTR Payment in Event of Disability. The LTIP provides that if a participant separates from service due to a disability, the participant is entitled to any portion of a LTR award that had vested at the time of the separation from service but not been paid as well as a prorated portion of any LTR grant that had not vested at the time of the participant's separation from service, provided that the LTR award will be prorated based on the number of whole months the participant was employed by TVA during the vesting period in which the participant separated from service as compared to (1) 12 months for the vesting period that includes the day that the participant separated from service, (2) 24 months for the vesting period that immediately follows the vesting period during which the participant separated from service, and (3) 36 months for the second vesting period that follows the vesting period during which the participant separated from service.
•LTP Payment in the Event of Retirement. The LTIP provides that if a participant retires, the participant is entitled to (1) any LTP award that had vested at the time of the participant's separation from service but not been paid and (2) a prorated portion of any LTP awards that had not vested at the time of the participant's separation from service, provided that the amount of any such LTP award (a) is calculated using the actual percent of opportunity achieved and (b) is prorated based on the number of whole months the participant is employed by TVA during the applicable performance cycle. John Thomas is the only NEO who was eligible to retire as of September 30, 2023, and the LTP amounts included in the Retirement column for Mr. Thomas assume that the percent of opportunity achieved will be 100 percent of target for the performance cycles ending on September 30, 2024 and September 30, 2025.
•LTP Payment in Event of Death. The LTIP provides that in the event of the death of a participant, the participant's beneficiary is entitled to (1) any LTP award that had vested at the time of the participant's death but not been paid and (2) any LTP awards that had not vested at the time of the participant's death and that covered a performance cycle for which the participant had received a LTP grant, provided that the amount of any such LTP award (a) will be calculated assuming that the percent of opportunity achieved is 100 percent of target and (b) will be prorated based on the number of whole months the participant was participating in the plan during the applicable performance cycle.
•LTP Payment in Event of Disability.The LTIP provides that if a participant separates from service due to a disability, the participant is entitled to (1) any LTP award that had vested at the time of the participant's separation from service but not been paid and (2) any LTP awards that had not vested at the time of the participant's separation from service and that covered a performance cycle for which the participant had received a LTP grant, provided that the amount of any such LTP award (a) will be calculated assuming that the percent of opportunity achieved is 100 percent of target and (b) will be prorated based on the number of whole months the participant was employed by TVA during the applicable performance cycle.
In addition to the amounts set forth in the termination tables, all NEOs would also be entitled to payments from plans generally available to TVA employees under the specific circumstances of termination of employment, including the health and welfare and pension plans and amounts in the 401(k) plan. | | | | | | | | | | | | | | | | | | | | | | | | | | | | | | | | | | | | | | | | Jeffrey J. Lyash | Resignation | | Retirement | | Termination without Cause | | Termination
with Cause | | Death | | Disability | | Severance Agreement(1) | $ | — | | | $ | — | | | $ | 2,645,000 | | | $ | — | | | $ | — | | | $ | — | | | SERP(2) | 3,483,046 | | | 3,483,046 | | | 4,558,306 | | | 3,483,046 | | | 4,558,306 | | (3) | 4,558,306 | | | | EAIP | 2,391,609 | | | 2,391,609 | | | 2,391,609 | | | 2,391,609 | | | 2,391,609 | | | 2,391,609 | | | Recruitment/Relocation Incentive(4) | 1,092,000 | | | 1,092,000 | | | 1,092,000 | | | 1,092,000 | | | 1,092,000 | | | 1,092,000 | | | | LTR | 338,000 | | | 338,000 | | | 338,000 | | | 338,000 | | | 619,667 | | (5) | 619,667 | | (6) | | LTP | — | | | 1,792,333 | | (7) | — | | | — | | | 1,792,333 | | (8) | 1,792,333 | | (9) | | Deferred Compensation | — | | | — | | | — | | | — | | | — | | | — | | | | Total Value of Potential Payments | $ | 7,304,655 | | | $ | 9,096,988 | | | $ | 11,024,915 | | | $ | 7,304,655 | | | $ | 10,453,915 | | | $ | 10,453,915 | | |
| | | | | | | | | | | | | | | | | | | | | | | | | | | | | | | | | | | | | | | | | | Jeffrey J. Lyash | Resignation | | Retirement | | Termination without Cause or Resignation for Good Reason
(Non-CIC) | | Termination without Cause or Resignation for Good Reason (CIC) | | Termination
with Cause | | Death/Disability | | | | | Severance Agreement | $ | — | | | $ | — | | | $ | 4,601,250 | | | $ | 9,202,500 | | | $ | — | | | $ | — | | | | | SERP(1) | 5,067,626 | | | 5,067,626 | | | 9,828,493 | | | 9,828,493 | | | 5,067,626 | | | 9,828,493 | | | | | | EAIP | 1,302,384 | | | 1,302,384 | | | 1,302,384 | | | 1,302,384 | | | 1,302,384 | | | 1,302,384 | | | | | | Deferred Cash Recruitment/Relocation Incentive | — | | | — | | | — | | | — | | | — | | | — | | | | | | LTR | 1,493,300 | | | 1,493,300 | | | 1,493,300 | | | 3,139,300 | | | 1,493,300 | | | 2,221,467 | | | | | | LTP | 3,963,176 | | | 3,963,176 | | (2) | 3,963,176 | | | 11,502,176 | | | 3,963,176 | | | 7,661,510 | | | | | | Deferred Compensation | — | | | — | | | — | | | — | | | | | — | | | | | | Total Value of Potential Payments | $ | 11,826,486 | | | $ | 11,826,486 | | | $ | 21,188,603 | | | $ | 34,974,853 | | | $ | 11,826,486 | | | $ | 21,013,854 | | | | |
Notes (1)(1 In February 2019, TVA entered into an arrangement with Mr. Lyash that provides a lump-sum payment equal to one year's annual salary and one year's executive annual incentive based on 100 percent target payout in the event TVA terminates his employment without cause. For purposes of this provision, termination without cause includes constructive termination which will be deemed to occur if Mr. Lyash terminates his employment because he is asked to take a new position with TVA with a material reduction in level of authority, duties, compensation, and benefits. This provision will not apply, and no lump-sum payment will be made, in the event Mr. Lyash voluntarily terminates his employment or voluntarily retires, or his employment is terminated "for cause" as defined in the agreement.
(2)) In February 2019, TVA entered into an arrangement with Mr. Lyash that provides that at the commencement of his employment with TVA, he will be granted five years of credited service for calculating his SERP benefit. In the event of involuntary termination except for cause prior to five years of actual service, the vesting requirement will be waived, and he will be entitled to the additional five years of granted credited service plus his actual years of service for calculating his SERP benefit. In the event of termination for cause or voluntary termination for any reason prior to five years of actual service, the vesting requirement will be waived and his SERP benefit will be calculated based on a total of five years of credited service.
(3)(2) InIs not eligible to retire based on definition in the event of death while employed by TVA, the beneficiary will receive a lump sum payment equal to the actuarial equivalent of the benefit that would have been paid had the participant terminated employment on the date of death and elected a joint and 50 percent survivor benefit. Survivor will receive 50 percent of the reported value.LTIP.
(4) Mr. Lyash received a Recruitment/Relocation Incentive of $1,784,000 upon employment, and $1,092,000 of this amount vested on September 30, 2020.
(5) The LTIP provides that in the event of the death of a participant, the participant's beneficiary is entitled to any portion of a LTR award that had vested at the time of the participant's death but not been paid as well as a prorated portion of any LTR grant that had not vested at the time of the participant's separation from service, provided that the LTR award for each vesting period will be prorated based on the number of whole months the participant was employed by TVA during the vesting period in which the participant separated from service as compared to (a) 12 months for the vesting period that includes the day that the participant separated from service, (b) 24 months for the vesting period that immediately follows the vesting period during which the participant separated from service, and (c) 36 months for the second vesting period that follows the vesting period during which the participant separated from service.
(6) The LTIP provides that if a participant separates from service due to a disability, the participant is entitled to any portion of a LTR award that had vested at the time of the separation from service but not been paid as well as a prorated portion of any LTR grant that had not vested at the time of the participant's separation from service, provided that the LTR award will be prorated based on the number of whole months the participant was employed by TVA during the vesting period in which the participant separated from service as compared to (a) 12 months for the vesting period that includes the day that the participant separated from service, (b) 24 months for the vesting period that immediately follows the vesting period during which the participant separated from service, and (c) 36 months for the second vesting period that follows the vesting period during which the participant separated from service.
(7) The LTIP provides that in the event of the retirement of a participant, the participant is entitled to (1) any LTP award that had vested at the time of the participant's separation from service but not been paid and (2) any LTP awards that had not vested at the time of the participant's separation from service and that covered a performance cycle for which the participant had received a LTP grant, provided that the amount of any such LTP award (a) will be calculated using the actual percent of opportunity achieved and (b) will be prorated based on the number of whole months the participant was employed by TVA during the applicable performance cycle. The amount included in the table assumes that the percent of opportunity achieved will be 100 percent of target for the performance cycles ending on September 30, 2021 and September 30, 2022.
(8) The LTIP provides that in the event of the death of a participant, the participant's beneficiary is entitled to (1) any LTP award that had vested at the time of the participant's death but not been paid and (2) any LTP awards that had not vested at the time of the participant's death and that covered a performance cycle for which the participant had received a LTP grant, provided that the amount of any such LTP award (a) will
be calculated assuming that the percent of opportunity achieved is 100 percent of target and (b) will be prorated based on the number of whole months the participant was participating in the plan during the applicable performance cycle
(9) The LTIP provides that if a participant separates from service due to a disability, the participant is entitled to (1) any LTP award that had vested at the time of the participant's separation from service but not been paid and (2) any LTP awards that had not vested at the time of the participant's separation from service and that covered a performance cycle for which the participant had received a LTP grant, provided that the amount of any such LTP award (a) will be calculated assuming that the percent of opportunity achieved is 100 percent of target and (b) will be prorated based on the number of whole months the participant was employed by TVA during the applicable performance cycle.
| | John M. Thomas, III | John M. Thomas, III | Resignation | | Retirement | | Termination without Cause | | Termination with Cause | | Death | | Disability | | John M. Thomas, III | Resignation | | Retirement | | Termination without Cause or Resignation for Good Reason
(Non-CIC) | | Termination without Cause or Resignation for Good Reason (CIC) | | Termination with Cause | | Death/Disability | | Severance Agreement(1) | Severance Agreement(1) | $ | — | | | $ | — | | | $ | — | | | $ | — | | | $ | — | | | $ | — | | | Severance Agreement(1) | $ | — | | | $ | — | | | $ | 1,503,684 | | | $ | 3,007,368 | | | $ | — | | | $ | — | | | | SERP | 4,634,859 | | (2)(3)(4) | 4,634,859 | | (2) (3) (4) | 4,634,859 | | (2) (3) (4) | 4,634,859 | | (2) (3) (4) | 4,634,859 | | (2) (5) | 4,634,859 | | (2) (3) | | SERP (1,2) | | SERP (1,2) | 6,413,590 | | | 6,413,590 | | | 6,413,590 | | | 6,413,590 | | | 6,413,590 | | | 6,413,590 | | | | EAIP | EAIP | 730,576 | | | 730,576 | | | 730,576 | | | 730,576 | | | 730,576 | | | 730,576 | | | EAIP | 788,181 | | | 788,181 | | | 788,181 | | | 788,181 | | | 788,181 | | | 788,181 | | | | Deferred Cash Recruitment/Relocation Incentive | | Deferred Cash Recruitment/Relocation Incentive | — | | | — | | | — | | | — | | | — | | | — | | | | LTR | LTR | 383,334 | | | 383,334 | | | 383,334 | | | 383,334 | | | 563,334 | | (6) | 563,334 | | (7) | LTR | 542,000 | | | 542,000 | | | 542,000 | | | 1,137,000 | | | 542,000 | | | 806,167 | | | | LTP | LTP | 1,096,500 | | | 2,009,833 | | (8) | 1,096,500 | | | 1,096,500 | | | 2,009,833 | | (9) | 2,009,833 | | (10) | LTP | 1,413,040 | | | 2,818,040 | | | 2,818,040 | | | 4,233,040 | | | 1,413,040 | | | 2,818,040 | | | | Deferred Compensation | Deferred Compensation | — | | | — | | | — | | | — | | | — | | | — | | | Deferred Compensation | — | | | — | | | — | | | — | | | — | | | — | | | | Total Value of Potential Payments | Total Value of Potential Payments | $ | 6,845,269 | | | $ | 7,758,602 | | | $ | 6,845,269 | | | $ | 6,845,269 | | | $ | 7,938,602 | | | $ | 7,938,602 | | | Total Value of Potential Payments | $ | 9,156,811 | | | $ | 10,561,811 | | | $ | 12,065,495 | | | $ | 15,579,179 | | | $ | 9,156,811 | | | $ | 10,825,978 | | | | |
Notes (1) Mr. Thomas does not have a severance agreement with TVA. (2) Represents the present value of the accumulated benefit.
(3) Actual benefit would be paid in five annual installments beginning at age 55.
(4)(2) Assumes that the TVA Board or its delegate determines that the termination is an approved termination under SERP. See RetirementExecutive Compensation Tables and Pension Plans Narrative Disclosures — Supplemental Executive Retirement Plan above for a discussion of approved and unapproved terminations under SERP.
(5) In the event of death while employed by TVA, the beneficiary would receive a lump sum payment equal to the actuarial equivalent of the benefit that would have been paid had the participant terminated employment on the date of death and elected a joint and 50 percent survivor benefit. Survivor will receive 50 percent of the reported value.
(6) The LTIP provides that in the event of the death of a participant, the participant's beneficiary is entitled to any portion of a LTR award that had vested at the time of the participant's death but not been paid as well as a prorated portion of any LTR grant that had not vested at the time of the participant's separation from service, provided that the LTR award for each vesting period will be prorated based on the number of whole months the participant was employed by TVA during the vesting period in which the participant separated from service as compared to (a) 12 months for the vesting period that includes the day that the participant separated from service, (b) 24 months for the vesting period that immediately follows the vesting period during which the participant separated from service, and (c) 36 months for the second vesting period that follows the vesting period during which the participant separated from service.
(7) The LTIP provides that if a participant separates from service due to a disability, the participant is entitled to any portion of a LTR award that had vested at the time of the separation from service but not been paid as well as a prorated portion of any LTR grant that had not vested at the time of the participant's separation from service, provided that the LTR award will be prorated based on the number of whole months the participant was employed by TVA during the vesting period in which the participant separated from service as compared to (a) 12 months for the vesting period that includes the day that the participant separated from service, (b) 24 months for the vesting period that immediately follows the vesting period during which the participant separated from service, and (c) 36 months for the second vesting period that follows the vesting period during which the participant separated from service.
(8) The LTIP provides that in the event of the retirement of a participant, the participant is entitled to (1) any LTP award that had vested at the time of the participant's separation from service but not been paid and (2) any LTP awards that had not vested at the time of the participant's separation from service and that covered a performance cycle for which the participant had received a LTP grant, provided that the amount of any such LTP award (a) will be calculated using the actual percent of opportunity achieved and (b) will be prorated based on the number of whole months the participant was employed by TVA during the applicable performance cycle. The amount included in the table assumes that the percent of opportunity achieved will be 100 percent of target for the performance cycles ending on September 30, 2021 and September 30, 2022.
(9) The LTIP provides that in the event of the death of a participant, the participant's beneficiary is entitled to (1) any LTP award that had vested at the time of the participant's death but not been paid and (2) any LTP awards that had not vested at the time of the participant's death and that covered a performance cycle for which the participant had received a LTP grant, provided that the amount of any such LTP award (a) will be calculated assuming that the percent of opportunity achieved is 100 percent of target and (b) will be prorated based on the number of whole months the participant was participating in the plan during the applicable performance cycle.
(10) The LTIP provides that if a participant separates from service due to a disability, the participant is entitled to (1) any LTP award that had vested at the time of the participant's separation from service but not been paid and (2) any LTP awards that had not vested at the time of the participant's separation from service and that covered a performance cycle for which the participant had received a LTP grant, provided that the amount of any such LTP award (a) will be calculated assuming that the percent of opportunity achieved is 100 percent of target and (b) will be prorated based on the number of whole months the participant was employed by TVA during the applicable performance cycle.
| | | | | | | | | | | | | | | | | | | | | | | | | | | | | | | | | | | | | | | | Michael D. Skaggs | Resignation | | Retirement | | Termination without Cause | | Termination with Cause | | Death | | Disability | | Severance Agreement(1) | $ | — | | | $ | — | | | $ | — | | | $ | — | | | $ | — | | | $ | — | | | | SERP | 7,893,997 | | (2) (3) (4) | 7,893,997 | | (2) (3) (4) | 7,893,997 | | (2) (3) (4) | 7,893,997 | | (2) (3) (4) | 7,893,997 | | (2) (5) | 7,893,997 | | (2) (3) | | EAIP | 799,795 | | | 799,795 | | | 799,795 | | | 799,795 | | | 799,795 | | | 799,795 | | | | LTR | 383,000 | | | 383,000 | | | 383,000 | | | 383,000 | | | 572,167 | | (6) | 572,167 | | (7) | | LTP | 967,500 | | | 1,950,833 | | (8) | 967,500 | | | 967,500 | | | 1,950,833 | | (9) | 1,950,833 | | (10) | Deferred Compensation(11) | 5,347,029 | | | 5,347,029 | | | 5,347,029 | | | 5,347,029 | | | 5,347,029 | | | 5,347,029 | | | | Total Value of Potential Payments | $ | 15,391,321 | | | $ | 16,374,654 | | | $ | 15,391,321 | | | $ | 15,391,321 | | | $ | 16,563,821 | | | $ | 16,563,821 | | |
Notes
(1) Mr. Skaggs does not have a severance agreement with TVA.
(2) Represents the present value of the accumulated benefit.
(3) Actual benefit would be paid in ten annual installments beginning on the date of Mr. Skaggs's separation from service.
(4) Assumes that the TVA Board or its delegate determines that the termination is an approved termination under SERP. See Retirement and Pension Plans — Supplemental Executive Retirement Plan above for a discussion of approved and unapproved terminations under SERP.
(5) In the event of death while employed by TVA, the beneficiary would receive a lump sum payment equal to the actuarial equivalent of the benefit that would have been paid had the participant terminated employment on the date of death and elected a joint and 50 percent survivor benefit. Survivor will receive 50 percent of the reported value.
(6) The LTIP provides that in the event of the death of a participant, the participant's beneficiary is entitled to any portion of a LTR award that had vested at the time of the participant's death but not been paid as well as a prorated portion of any LTR grant that had not vested at the time of the participant's separation from service, provided that the LTR award for each vesting period will be prorated based on the number of whole months the participant was employed by TVA during the vesting period in which the participant separated from service as compared to (a) 12 months for the vesting period that includes the day that the participant separated from service, (b) 24 months for the vesting period that immediately follows the vesting period during which the participant separated from service, and (c) 36 months for the second vesting period that follows the vesting period during which the participant separated from service.
(7) The LTIP provides that if a participant separates from service due to a disability, the participant is entitled to any portion of a LTR award that had vested at the time of the separation from service but not been paid as well as a prorated portion of any LTR grant that had not vested at the time of the participant's separation from service, provided that the LTR award will be prorated based on the number of whole months the participant was employed by TVA during the vesting period in which the participant separated from service as compared to (a) 12 months for the vesting period that includes the day that the participant separated from service, (b) 24 months for the vesting period that immediately follows the vesting period during which the participant separated from service, and (c) 36 months for the second vesting period that follows the vesting period during which the participant separated from service.
(8) The LTIP provides that in the event of the retirement of a participant, the participant is entitled to (1) any LTP award that had vested at the time of the participant's separation from service but not been paid and (2) any LTP awards that had not vested at the time of the participant's separation from service and that covered a performance cycle for which the participant had received a LTP grant, provided that the amount of any such LTP award (a) will be calculated using the actual percent of opportunity achieved and (b) will be prorated based on the number of whole months the participant was employed by TVA during the applicable performance cycle. The amount included in the table assumes that the percent of opportunity achieved will be 100 percent of target for the performance cycles ending on September 30, 2021 and September 30, 2022.
(9) The LTIP provides that in the event of the death of a participant, the participant's beneficiary is entitled to (1) any LTP award that had vested at the time of the participant's death but not been paid and (2) any LTP awards that had not vested at the time of the participant's death and that covered a performance cycle for which the participant had received a LTP grant, provided that the amount of any such LTP award (a) will be calculated assuming that the percent of opportunity achieved is 100 percent of target and (b) will be prorated based on the number of whole months the participant was participating in the plan during the applicable performance cycle.
(10) The LTIP provides that if a participant separates from service due to a disability, the participant is entitled to (1) any LTP award that had vested at the time of the participant's separation from service but not been paid and (2) any LTP awards that had not vested at the time of the participant's separation from service and that covered a performance cycle for which the participant had received a LTP grant, provided that the amount of any such LTP award (a) will be calculated assuming that the percent of opportunity achieved is 100 percent of target and (b) will be prorated based on the number of whole months the participant was employed by TVA during the applicable performance cycle.
(11) Amounts that Mr. Skaggs earned in past years but elected to defer, which are payable pursuant to elections he made and applicable IRS rules.
| | | | | | | | | | | | | | | | | | | | | | | | | | | | | | | | | | | | | | | | Sherry A. Quirk | Resignation | | Retirement | | Termination without Cause | | Termination with Cause | | Death | | Disability | | Severance Agreement(1) | $ | — | | | $ | — | | | $ | 557,291 | | | $ | — | | | $ | — | | | $ | — | | | | SERP | 1,110,246 | | (2) (3) (4) | 1,110,246 | | (2) (3) (4) | 1,110,246 | | (2) (3) (4) | 1,110,246 | | (2) (3) (4) | 1,110,246 | | (2) (5) | 1,110,246 | | (2) (3) | | EAIP | 534,442 | | | 534,442 | | | 534,442 | | | 534,442 | | | 534,442 | | | 534,442 | | | | LTR | 290,667 | | | 290,667 | | | 290,667 | | | 290,667 | | | 421,501 | | (7) | 421,501 | | (8) | | LTP | 870,750 | | | 1,559,083 | | (6) | 870,750 | | | 870,750 | | | 1,559,083 | | (9) | 1,559,083 | | (10) | | Deferred Compensation | — | | | — | | | — | | | — | | | — | | | — | | | | Total Value of Potential Payments | $ | 2,806,105 | | | $ | 3,494,438 | | | $ | 3,363,396 | | | $ | 2,806,105 | | | $ | 3,625,272 | | | $ | 3,625,272 | | |
Notes
(1) In December 2014, TVA entered into an arrangement with Ms. Quirk that provides a lump-sum payment equal to one year's annual salary in the event TVA terminates her employment without cause.
(2) Represents the present value of the accumulated benefit.
(3) Actual benefit would be paid in ten annual installments beginning on the date of Ms. Quirk's separation from service.
(4) Assumes that the TVA Board or its delegate determines that the termination is an approved termination under SERP. See Retirement and Pension Plans — Supplemental Executive Retirement Plan above for a discussion of approved and unapproved terminations under SERP.
(5) In the event of death while employed by TVA, the beneficiary would receive a lump sum payment equal to the actuarial equivalent of the benefit that would have been paid had the participant terminated employment on the date of death and elected a joint and 50 percent survivor benefit. Survivor will receive 50 percent of the reported value.
(6) The LTIP provides that in the event of the retirement of a participant, the participant is entitled to (1) any LTP award that had vested at the time of the participant's separation from service but not been paid and (2) any LTP awards that had not vested at the time of the participant's separation from service and that covered a performance cycle for which the participant had received a LTP grant, provided that the amount of any such LTP award (a) will be calculated using the actual percent of opportunity achieved and (b) will be prorated based on the number of whole months the participant was employed by TVA during the applicable performance cycle. The amount included in the table assumes that the percent of opportunity achieved will be 100 percent of target for the performance cycles ending on September 30, 2021 and September 30, 2022.
(7) The LTIP provides that in the event of the death of a participant, the participant's beneficiary is entitled to any portion of a LTR award that had vested at the time of the participant's death but not been paid as well as a prorated portion of any LTR grant that had not vested at the time of the participant's separation from service, provided that the LTR award for each vesting period will be prorated based on the number of whole months the participant was employed by TVA during the vesting period in which the participant separated from service as compared to (a) 12 months for the vesting period that includes the day that the participant separated from service, (b) 24 months for the vesting period that immediately follows the vesting period during which the participant separated from service, and (c) 36 months for the second vesting period that follows the vesting period during which the participant separated from service.
(8) The LTIP provides that if a participant separates from service due to a disability, the participant is entitled to any portion of a LTR award that had vested at the time of the separation from service but not been paid as well as a prorated portion of any LTR grant that had not vested at the time of the participant's separation from service, provided that the LTR award will be prorated based on the number of whole months the participant was employed by TVA during the vesting period in which the participant separated from service as compared to (a) 12 months for the vesting period that includes the day that the participant separated from service, (b) 24 months for the vesting period that immediately follows the vesting period during which the participant separated from service, and (c) 36 months for the second vesting period that follows the vesting period during which the participant separated from service.
(9) The LTIP provides that in the event of the death of a participant, the participant's beneficiary is entitled to (1) any LTP award that had vested at the time of the participant's death but not been paid and (2) any LTP awards that had not vested at the time of the participant's death and that covered a performance cycle for which the participant had received a LTP grant, provided that the amount of any such LTP award (a) will be calculated assuming that the percent of opportunity achieved is 100 percent of target and (b) will be prorated based on the number of whole months the participant was participating in the plan during the applicable performance cycle.
(10) The LTIP provides that if a participant separates from service due to a disability, the participant is entitled to (1) any LTP award that had vested at the time of the participant's separation from service but not been paid and (2) any LTP awards that had not vested at the time of the participant's separation from service and that covered a performance cycle for which the participant had received a LTP grant, provided that the amount of any such LTP award (a) will be calculated assuming that the percent of opportunity achieved is 100 percent of target and (b) will be prorated based on the number of whole months the participant was employed by TVA during the applicable performance cycle.
| | Timothy S. Rausch | Resignation | | Retirement | | Termination without Cause | | Termination with Cause | | Death | | Disability | | | | Donald A. Moul | | Donald A. Moul | Resignation | | Retirement | | Termination without Cause or Resignation for Good Reason
(Non-CIC) | | Termination without Cause or Resignation for Good Reason (CIC) | | Termination with Cause | | Death/Disability | | | Severance Agreement(1) | Severance Agreement(1) | $ | — | | | $ | — | | | $ | — | | | $ | — | | | $ | — | | | $ | — | | | Severance Agreement(1) | $ | — | | | $ | — | | | $ | 1,432,080 | | | $ | 2,864,160 | | | $ | — | | | $ | — | | | | | SERP | SERP | — | | (2) | — | | (2) | — | | (2) | — | | (2) | 179,212 | | (3) (4) | 179,212 | | (3) | SERP | — | | (1) | — | | (1) | — | | (1) | 472,596 | | | — | | (1) | 472,596 | | | | | EAIP | EAIP | 513,640 | | | 513,640 | | | 513,640 | | | 513,640 | | | 513,640 | | | 513,640 | | | EAIP | 750,649 | | | 750,649 | | | 750,649 | | | 750,649 | | | 750,649 | | | 750,649 | | | | Deferred Cash Recruitment/Relocation Incentive (2) | | Deferred Cash Recruitment/Relocation Incentive (2) | — | | | — | | | — | | | — | | | — | | | — | | | | | LTR | LTR | 167,750 | | | 167,750 | | | 167,750 | | | 167,750 | | | 288,291 | | (6) | 288,291 | | (7) | LTR | 719,916 | | | 719,916 | | | 719,916 | | | 1,505,250 | | | 719,916 | | | 1,068,972 | | | | | LTP | LTP | — | | | 436,167 | | (5) | — | | | — | | | 436,167 | | (8) | 436,167 | | (9) | LTP | 800,700 | | | 800,700 | | (3) | 800,700 | | | 3,400,700 | | | 800,700 | | | 2,059,033 | | | | | Deferred Compensation | Deferred Compensation | — | | | — | | | — | | | — | | | — | | | — | | | Deferred Compensation | — | | | — | | | — | | | — | | | — | | | — | | | | | Total Value of Potential Payments | Total Value of Potential Payments | $ | 681,390 | | | $ | 1,117,557 | | | $ | 681,390 | | | $ | 681,390 | | | $ | 1,417,310 | | | $ | 1,417,310 | | | Total Value of Potential Payments | $ | 2,271,265 | | | $ | 2,271,265 | | | $ | 3,703,345 | | | $ | 8,993,355 | | | $ | 2,271,265 | | | $ | 4,351,250 | | | |
Notes (1) Mr. Rausch does not have a severance agreement with TVA. (2) The five-year vesting requirement has not been met.
(3)2) Represents the present value of the accumulated benefit.
(4) In the event of death while employed byMr. Moul is required to repay to TVA the beneficiary will receive a lump sumdeferred cash recruitment and relocation incentive payment equal to the actuarial equivalent of the benefit that would have been paid had the participant terminated employment on the date of death and elected a joint and 50 percent survivor benefit. Survivor will receive 50 percent of the reported value.
(5) The LTIP provides that in the event of the retirement of a participant, the participant is entitled to (1) any LTP award that had vested at the time of the participant's separation from service but not been paid and (2) any LTP awards that had not vested at the time of the participant's separation from service and that covered a performance cycle for which the participant had received a LTP grant, provided that the amount of any such LTP award (a) will be calculated using the actual percent of opportunity achieved and (b) will be prorated based on the number of whole months the participant was employed by TVA during the applicable performance cycle. The amount included in the table assumes that the percent of opportunity achieved will be 100 percent of target for the performance cycles ending on September 30, 2021 and September 30, 2022.
(6) The LTIP provides that in the event of the death of a participant, the participant's beneficiary is entitled$450,000 if, prior to any portion of a LTR award that had vested at the time of the participant's death but not been paid as well as a prorated portion of any LTR grant that had not vested at the time of the participant's separation from service, provided that the LTR award for each vesting period will be prorated based on the number of whole months the participant was employed by TVA during the vesting period in which the participant separated from service as compared to (a) 12 months for the vesting period that includes the day that the participant separated from service, (b) 24 months for the vesting period that immediately follows the vesting period during which the participant separated from service, and (c) 36 months for the second vesting period that follows the vesting period during which the participant separated from service.
(7) The LTIP provides that if a participant separates from service due to a disability, the participant is entitled to any portion of a LTR award that had vested at the time ofJune 21, 2024, he (1) voluntarily terminates employment unless the separation from service but not been paid as well as a prorated portion of any LTR grant that had not vested at the time of the participant's separation from service, provided that the LTR award will be prorated based on the number of whole months the participant was employed byis for reasons beyond his control and acceptable to TVA, during the vesting period in which the participant separated from service as compared to (a) 12 monthsor (2) is terminated for the vesting period that includes the day that the participant separated from service, (b) 24 months for the vesting period that immediately follows the vesting period during which the participant separated from service, and (c) 36 months for the second vesting period that follows the vesting period during which the participant separated from service.cause
(8). The LTIP provides thatMr. Moul is required to repay to TVA deferred cash recruitment and relocation incentive payment in the event of the death of a participant, the participant's beneficiary is entitled to (1) any LTP award that had vested at the time of the participant's death but not been paid and (2) any LTP awards that had not vested at the time of the participant's death and that covered a performance cycle for which the participant had received a LTP grant, provided that the amount of any such LTP award (a) will be calculated assuming that$100,000 if, prior to June 21, 2025, he (1) voluntarily terminates employment unless the percent of opportunity achievedseparation is 100 percent of targetfor reasons beyond his control and (b) will be proratedacceptable to TVA, or (2) is terminated for cause.
(3)Is not eligible to retire based on the number of whole months the participant was participatingdefinition in the plan during the applicable performance cycle.LTIP. (9)
| | | | | | | | | | | | | | | | | | | | | | | | | | | | | | | | | | | | | | | | Timothy S. Rausch | Resignation | | Retirement | | Termination without Cause or Resignation for Good Reason
(Non-CIC) | | Termination without Cause or Resignation for Good Reason (CIC) | | Termination with Cause | | Death/Disability | | | Severance Agreement | $ | — | | | $ | — | | | $ | 1,083,988 | | | $ | 2,167,976 | | | $ | — | | | $ | — | | | | SERP | — | | (1) | — | | (1) | — | | (1) | 959,114 | | | — | | (1) | 959,114 | | | | EAIP | 807,165 | | | 807,165 | | | 807,165 | | | 807,165 | | | 807,165 | | | 807,165 | | | | Deferred Cash Recruitment/Relocation Incentive | — | | | — | | | — | | | — | | | — | | | — | | | | LTR | 330,000 | | | 330,000 | | | 330,000 | | | 660,000 | | | 330,000 | | | 476,667 | | | | LTP | 680,000 | | | 680,000 | | (2) | 680,000 | | | 2,001,000 | | | 680,000 | | | 1,319,000 | | | | Deferred Compensation | — | | | — | | | — | | | — | | | — | | | — | | | | Total Value of Potential Payments | $ | 1,817,165 | | | $ | 1,817,165 | | | $ | 2,901,153 | | | $ | 6,595,255 | | | $ | 1,817,165 | | | $ | 3,561,946 | | |
Notes (1) The LTIP provides that if a participant separates from service due to a disability, the participant is entitled to (1) any LTP award that had vested at the time of the participant's separation from service butfive-year vesting requirement has not been paid and met. (2) any LTP awards that hadIs not vested at the time of the participant's separation from service and that covered a performance cycle for which the participant had received a LTP grant, provided that the amount of any such LTP award (a) will be calculated assuming that the percent of opportunity achieved is 100 percent of target and (b) will be proratedeligible to retire based on definition in the number of whole monthsLTIP.
| | | | | | | | | | | | | | | | | | | | | | | | | | | | | | | | | | | | | | | | David B. Fountain | Resignation | | Retirement | | Termination without Cause or Resignation for Good Reason
(Non-CIC) | | Termination without Cause or Resignation for Good Reason (CIC) | | Termination with Cause | | Death/Disability | | | Severance Agreement | $ | — | | | $ | — | | | $ | 1,070,663 | | | $ | 2,141,327 | | | $ | — | | | $ | — | | | | SERP | — | | (1) | — | | (1) | — | | (1) | 411,578 | | | — | | (1) | 411,578 | | | | EAIP | 519,941 | | | 519,941 | | | 519,941 | | | 519,941 | | | 519,941 | | | 519,941 | | | | Deferred Cash Recruitment/Relocation Incentive | — | | | — | | | — | | | — | | | — | | | — | | | | LTR | 345,500 | | | 345,500 | | | 345,500 | | | 715,500 | | | 345,500 | | | 508,833 | | | | LTP | 765,000 | | | 765,000 | | (2) | 765,000 | | | 2,505,000 | | | 765,000 | | | 1,601,666 | | | | Deferred Compensation | — | | | — | | | — | | | — | | | — | | | — | | | | Total Value of Potential Payments | $ | 1,630,441 | | | $ | 1,630,441 | | | $ | 2,701,104 | | | $ | 6,293,346 | | | $ | 1,630,441 | | | $ | 3,042,018 | | |
Notes (1) The five-year vesting requirement has not been met. (2) Is not eligible to retire based on definition in the participant was employed by TVA during the applicable performance cycle.LTIP.
Other Agreements Except as described above and in the Compensation Discussion and Analysis, there are no other agreements between TVA and any of the NEOs.
Director Compensation
The TVA Act provides for up to nine directors on the TVA Board. As of November 16, 2020,13, 2023, the TVA Board consisted of fivenine members. Under the TVA Act, each director receives certain stipends that are increased annually by the same percentage increase applicable to adjustments under 5 U.S.C. § 5318, which adjusts the annual rates of pay of employees on the Executive Schedule of the U.S. Government. Effective January 5, 2020,1, 2023, the annual stipend for TVA directors was increased from $52,702$56,088 to $54,072$58,400 per year unless (1) the director chairs a TVA Board committee, in which case the stipend was increased from $53,745$57,197 to $55,142$59,500 per year, or (2) the director is the Chair of the TVA Board, in which case the stipend was increased from $58,650$62,418 to $60,175$65,000 per year. Directors are also reimbursed under federal law for travel, lodging, and related expenses while attending meetings and for other official TVA business. The annual stipends provided by the TVA Act for each director and for the Chair of the TVA Board as of November 16, 2020,13, 2023, are listed below: TVA BOARD ANNUAL STIPENDS | | | | | | | | |
Name | | Annual Stipend | John L. RyderJoe H. Ritch | | $ | 60,17565,000 | | Kenneth E. AllenBeth P. Geer | | 55,14258,400 | | | Beth H. Harwell | | 59,500 | | | William B. Kilbride | | 58,400 | | | Robert P. Klein | | 59,500 | | | L. Michelle Moore | | 58,400 | | | Brian E. Noland | | 59,500 | | | William J. Renick | | 58,400 | | A. D. FrazierWade White | | 55,14258,400 | | William Kilbride | | 55,142 | | Jeff W. Smith | | 55,142 | |
The following table provides information on the compensation received by TVA's directors during 2020:2023:
DIRECTOR COMPENSATION
| | | | | | | | | | | | | | | | | | | | | | | | | Name | Fees Earned or Paid in Cash | Stock
Awards | Option
Awards | Non-Equity
Incentive Plan
Compensation | Change in
Pension Value
and
Nonqualified
Deferred
Compensation
Earnings(1) | All Other
Compensation(2) | Total | | John L. Ryder | $ | 55,964 | | — | | — | | — | | — | | $ | 2,239 | | $ | 58,203 | | | Kenneth E. Allen | 55,020 | | — | | — | | — | | — | | 550 | | 55,570 | | | A. D. Frazier | 55,021 | | — | | — | | — | | — | | 2,751 | | 57,772 | | | William B. Kilbride | 53,864 | | — | | — | | — | | — | | 539 | | 54,403 | | | Jeff W. Smith | 55,308 | | — | | — | | — | | — | | 2,489 | | 57,797 | |
| | | | | | | | | | | | | | | | | | | | | | | | | Name | Fees Earned or Paid in Cash | Stock
Awards | Option
Awards | Non-Equity
Incentive Plan
Compensation | Change in
Pension Value
and
Nonqualified
Deferred
Compensation
Earnings(1) | All Other
Compensation(2) | Total | | Joe H. Ritch | $ | 43,023 | | $ | — | | $ | — | | $ | — | | $ | — | | $ | 2,151 | | $ | 45,174 | | | Beth P. Geer | 42,228 | | — | | — | | — | | — | | 422 | | 42,650 | | | Beth H. Harwell | 58,791 | | — | | — | | — | | — | | 2,939 | | 61,730 | | | William B. Kilbride | 64,206 | | — | | — | | — | | — | | 3,210 | | 67,416 | | | Robert P. Klein | 43,023 | | — | | — | | — | | — | | 2,151 | | 45,174 | | | L. Michelle Moore | 42,228 | | — | | — | | — | | — | | 1,860 | | 44,088 | | | Brian E. Noland | 58,791 | | — | | — | | — | | — | | 2,939 | | 61,730 | | | William J. Renick | 42,228 | | — | | — | | — | | — | | 2,111 | | 44,339 | | | A. Wade White | 42,228 | | — | | — | | — | | — | | 2,111 | | 44,339 | |
Notes (1) TVA directors do not participate in the TVARS Retirement Plans, TVA's SERP, or any non-qualified deferred compensation plan available to TVA employees. However, as appointed officers of the U.S. government, the directors are members of FERS. FERS is administered by the federal Office of Personnel Management, and information regarding the value of FERS pension benefits is not available to TVA. (2)These amounts include TVA's non-elective and matching contributions to the Thrift Savings Plan. The directors are not eligible to participate in any incentive programs available to TVA employees. The directors do not participate in the TVARS Retirement Plans and do not participate in TVA's SERP. However, as appointed officers of the U.S. government, the directors are members of the Federal Employees Retirement System ("FERS"). FERS is a tiered retirement plan that includes three components: (1) Social Security benefits, (2) the Basic Benefit Plan, and (3) the Thrift Savings Plan ("TSP"). As members of FERS, each director is required to make a mandatory percentage contribution of his or her stipend to the Basic Benefit Plan in the amount of 0.8 percent for those directors appointed prior to January 1, 2013, 3.1 percent for those
directors appointed between January 1, 2013, and December 31, 2013, and 4.4 percent for those directors appointed on or after January 1, 2014.
The FERS Basic Benefit Plan is a qualified defined benefit plan that provides a retirement benefit based on a final average pay formula that includes age, highest average salary during any three consecutive years of service, and years of creditable service. A director must have at least five years of creditable service to be eligible to receive retirement benefits. Directors are eligible for immediate, unreduced retirement benefits once (1) they reach age 62 and have five years of FERS creditable service, (2) they reach age 60 and have 20 years of FERS creditable service, or (3) they attain the minimum retirement age and accumulate the specified years of service as set forth in the FERS regulations. Generally, benefits are
calculated by multiplying 1.0 percent of the highest average salary during any three consecutive years of service by the number of years of creditable service. Directors who retire at age 62 or later with at least 20 years of FERS creditable service receive an enhanced benefit (a factor of 1.1 percent is used rather than 1.0 percent).
Each director is also eligible to participate in the TSP. The TSP is a tax-deferred retirement savings and investment plan that offers the same type of savings and tax benefits offered under 401(k) plans. Once a director becomes eligible, TVA contributes an amount equal to one percent of the director's stipend into a TSP account for the director. These contributions are made automatically every two weeks regardless of whether the director makes a contribution of his or her own money. Directors are eligible to contribute up to the TSP elective deferral limit. Directors receive matching contributions of 100 percent of each dollar for the first three percent of the director's stipend and 50 percent of each dollar for the next two percent of the director's stipend.
TVA offers a group of health and other benefits (medical, dental, vision, life and accidental death and disability insurance, and long-term disability insurance) that are available to a broad group of employees. Directors are eligible to participate in TVA's health benefit plans and other non-retirement benefit plans on the same terms and at the same contribution rates as other TVA employees.
Compensation Committee Interlocks and Insider Participation
The People and PerformanceGovernance Committee of the TVA Board currently consists of the following twofour directors: Kenneth AllenBrian E. Noland, Beth Harwell, Robert P. Klein, and A.D. Frazier.Adam W. White.
No member of this Committee was at any time during 2020 or 2023 or at any other time an officer or employee of TVA, and no member of this committee had any relationship with TVA requiring disclosure under Item 404 of Regulation S-K. No executive officer of TVA has served on the board of directors or compensation committee of any other entity that has or has had one or more executive officers who served as a member of the People and PerformanceGovernance Committee during 2020. 2023.
Compensation Committee Report
The People and PerformanceGovernance Committee has reviewed and discussed the Compensation Discussion and Analysis with management, and based on the review and discussions, the Committee recommended to the TVA Board that the Compensation Discussion and Analysis be included in this Annual Report.
PEOPLE AND PERFORMANCEGOVERNANCE COMMITTEE
Kenneth Allen,Brian E. Noland, Chair
A.D. FrazierBeth Harwell
Robert P. Klein Adam W. White
ITEM 12. SECURITY OWNERSHIP OF CERTAIN BENEFICIAL OWNERS AND MANAGEMENT AND RELATED STOCKHOLDER MATTERS
Not applicable.
ITEM 13. CERTAIN RELATIONSHIPS AND RELATED TRANSACTIONS, AND DIRECTOR INDEPENDENCE
Director Independence
The composition of the TVA Board is governed by the TVA Act. The TVA Act contains certain provisions that are similar to the considerations for independence under section 10A(m)(3) of the Exchange Act, including that to be eligible for appointment to the TVA Board, an individual shall not be an employee of TVA and shall make full disclosure to Congress of any investment or other financial interest that the individual holds in the energy industry.
Related Party Transactions
Conflict of Interest Provisions
All TVA employees, including directors and executive officers, are subject to the conflict of interest laws and regulations applicable to employees of the federal government. Accordingly, the general federal conflict of interest statute (18 U.S.C. § 208) and the Standards of Ethical Conduct for Employees of the Executive Branch (5 C.F.R. part 2635) ("Standards of Ethical
Conduct") form the basis of TVA's policies and procedures for the review, approval, or ratification of related party transactions. The general federal conflict of interest statute, subject to certain exceptions, prohibits each government employee, including TVA's directors and executive officers, from participating personally and substantially (by advice, decision, or otherwise) as a government employee in any contract, controversy, proceeding, request for determination, or other particular matter in which, to his or her knowledge, he or she (or his or her spouse, minor child, general partner, organization with which he or she serves as officer, director, employee, trustee, or general partner, or any person or organization with which he or she is negotiating, or has an arrangement, for future employment) has a financial interest. Exceptions to the statutory prohibition relevant to TVA employees are (1) financial interests which have been deemed by the U.S. Office of Government Ethics, in published regulations, to be too remote or inconsequential to affect the integrity of the employee's services, or (2) interests which are determined in writing, after full disclosure and on a case-by-case basis, to be not so substantial as to be deemed likely to affect the integrity of the employee's services for TVA. In accordance with the statute, individual waiver determinations are made by the official responsible for the employee's appointment. In the case of TVA directors, the determination may be made by the Chair of the TVA Board, and in the case of the Chair of the TVA Board, the determination may be made by the Counsel to the President of the U.S.
More broadly, Subpart E of the Standards of Ethical Conduct provides that where an employee (1) knows that a particular matter involving specific parties is likely to have a direct and predictable effect on the financial interests of a member of his or her household, or that a person with whom the employee has a "covered relationship" (which includes, but is not limited to, persons with whom the employee has a close family relationship and organizations in which the employee is an active participant) is or represents a party to the matter, and (2) determines that the circumstances would cause a reasonable person with knowledge of relevant facts to question his or her impartiality in the matter, the employee should not participate in the matter absent agency authorization. This authorization may be given by the employee's supervising officer, as agency designee, in consultation with the TVA Designated Agency Ethics Official, upon the determination that TVA's interest in the employee's participation in the matter outweighs the concern that a reasonable person may question the integrity of TVA's programs and operations.
The previously described restrictions are reflected in TVA's policies which require employees, including directors and executive officers, to comply with the guidelines outlined in the Standards of Ethical Conduct and which restate the standard of the conflict of interest statute.
Additionally, the TVA Board approved a written conflict of interest policy that applies to all TVA employees, including TVA's directors and executive officers. The conflict of interest policy reaffirms the requirement that all TVA employees must comply with applicable federal conflict of interest laws, regulations, and policies. It also establishes an additional policy that is applicable to TVA's directors and CEO. This additional policy provides that TVA's directors and CEO shall not hold a financial interest in (1) any distributor of TVA power; (2) any entity engaged primarily in the wholesale or retail generation, transmission, or sale of electricity, except where substantially all such business is conducted outside of North America; or (3) any entity that may reasonably be perceived as likely to be adversely affected by the success of TVA as a producer or transmitter of electric power. Any waiver of this additional policy may be made only by the TVA Board and will be disclosed promptly to the public, subject to the limitations on disclosure imposed by law.
TVA also has a protocol titled the "Obtaining Things of Value from TVA Protocol" (the "Protocol"). The Protocol describes what a TVA employee should do if a person covered by the Protocol asks for assistance in obtaining a specified thing of value from TVA. Similarly, the TVA Board Practice on External Inquiries describes what a member of the TVA Board should do if a person covered by the practice asks for assistance in obtaining a specified thing of value from TVA.
TVA relies on the policies, practices, laws, and regulations discussed above to regulate conflicts of interest involving employees, including directors and executive officers. TVA has no other written or unwritten policy for the approval or ratification of any transactions in which TVA was or is to be a participant and in which any director or executive officer of TVA (or any child, stepchild, parent, stepparent, spouse, sibling, mother-in-law, father-in-law, son-in-law, daughter-in-law, brother-in-law, or sister-in-law of any director or executive officer of TVA) had or will have a direct or indirect material interest.
Other Relationships
TVA is engaged in a number of transactions with other agencies of the U.S. government, although such agencies do not fall within the definition of "related parties" for purposes of Item 404(a) of Regulation S-K. These include, among other things, supplying electricity to other federal agencies, purchasing electricity from the Southeastern Power Administration, and engaging in various arrangements involving nuclear materials with the Department of Energy ("DOE").Energy. See Part I, Item 1, Business and Note 23 — Related Parties.
TVA also has access to a financing arrangement with the United States Department of the Treasury ("U.S. Treasury.Treasury"). TVA and the U.S. Treasury have a memorandum of understanding under which the U.S. Treasury provides TVA with a $150 million credit facility. There were no outstanding borrowings under the facility at September 30, 2020.2023. This credit facility has a maturity date of September 30, 2021,2024, and is typically renewed annually. This arrangement is pursuant to the TVA Act. Access to this credit facility or other similar financing arrangements with the U.S. Treasury has been available to TVA since the 1960s. See Note 1314 — Debt and Other Obligations —Credit Facility Agreements.
In addition, TVA is required by the 1959 amendment to the TVA Act to make annual payments to the U.S. Treasury from net power proceeds as a repayment of and as a return on the payments to the U.S. Treasury in repayment of and as a return on the government's appropriation investment in TVA's power facilities (the "Power Program Appropriation Investment") until $1.0 billion of the Power Program Appropriation Investment has been repaid. With the 2014 payment, TVA fulfilled its requirement to repay $1.0 billion of the Power Program Appropriation Investment. The TVA Act requires TVA to continue to make payments to the U.S. Treasury indefinitely as a return on the remaining $258 million of the Power Program Appropriation Investment. See Note 18 —23 ��� Proprietary Capital — Appropriation InvestmentRelated Parties.
The TVA Act requires the proceeds for each fiscal year derived from the sale of power or any other activities to be paid into the U.S. Treasury on March 31 of each year, except for the portion of such proceeds as in the opinion of the TVA Board shall be necessary for TVA in the operation of dams and reservoirs and in conducting its business in generating, transmitting, and distributing electric energy. For each fiscal year, the TVA Board adopts a resolution retaining for use in the operation of the TVA power system the entire margin of net power proceeds remaining at the conclusion of such fiscal year.
ITEM 14. PRINCIPAL ACCOUNTANT FEES AND SERVICES
The following table shows the fees of Ernst & Young LLP for audit, audit-related, and other services for the years ended September 30, 20202023 and 2019.2022. | Principal Accountant Fees and Services (in actual dollars) | Principal Accountant Fees and Services (in actual dollars) | Principal Accountant Fees and Services (in actual dollars) | | Year | Year | | Principal Accountant | | Audit Fees(1) | | Audit-Related Fees | | Tax Fees | All Other Fees(2) | | Total | Year | | Principal Accountant | | Audit Fees(1) | | Audit-Related Fees | | Tax Fees | All Other Fees(2) | | Total | | 2020 | | Ernst & Young LLP | | $ | 3,007,830 | | | $ | — | | | $ | — | | $ | 5,930 | | | $ | 3,013,760 | | | | 2019 | | Ernst & Young LLP | | 2,839,049 | | | — | | | — | | 7,020 | | | 2,846,069 | | | | 2023 | | 2023 | | Ernst & Young LLP | | $ | 3,581,554 | | | $ | — | | | $ | — | | $ | 255,040 | | | $ | 3,836,594 | | | 2022 | | 2022 | | Ernst & Young LLP | | 3,277,337 | | | — | | | — | | 3,545 | | | 3,280,882 | |
Notes (1) Audit fees consist of payments for professional services rendered in connection with the audit of TVA's annual financial statements, including the annual attestation on internal control over financial reporting and thereporting; review of interim financial statements included in TVA's quarterly reports; audit of TVA's fuel cost adjustment; federal financial reporting responsibilities for the preparation and audit of the 20202023 and 20192022 federal consolidated financial statements of which TVA is a component; Bond offering and other financing comfort letters; and accounting consultations related toattestation on TVA's adoptionmanagement report of the new revenue recognition and lease accounting standards.eligible green expenditures. (2) All other fees reflect accounting and financial reporting research software license costs.costs and advisory services related to the proposed SEC climate-related rule.
The TVA Board has an Audit, Finance, Risk, and RegulationCybersecurity Committee ("Audit Committee"). Under the TVA Act, the Audit Committee, in consultation with the Inspector General, recommends to the TVA Board the selection of an external auditor. TVA's Audit Committee, in consultation with the Inspector General, recommended that the TVA Board select Ernst & Young LLP as TVA's external auditor for the 20202023 and 20192022 audits and other related services, and the TVA Board approved these recommendations.
TVA has a policy (the "Policy") that requires all auditing services and permissible non-audit services provided by the external auditor to be pre-approved by the Audit Committee. The Policy also lists the following services as ones the external auditor is not permitted to perform:
•Bookkeeping or other services related to the accounting records or financial statements of TVA; •Financial information system design and implementation; •Appraisal or valuation services, fairness opinions, and contribution-in-kind reports; •Actuarial services; •Internal audit outsourcing services; •Management functions or human resources; •Broker or dealer, investment adviser, or investment banking services; •Legal services and expert services unrelated to the audit; and •Any other services that the Public Company Accounting Oversight Board determines, by regulation, are impermissible.
The Policy also delegates to the Chair of the Audit Committee the authority to pre-approve a permissible service so long as the amount of the service does not exceed $100,000 and the total amount of services pre-approved during the year by the Chair does not exceed $200,000. The Chair must report for informational purposes the services pre-approved under this provision at the Audit Committee's next meeting.
The Audit Committee pre-approved all audit services for 20202023 and 2019.2022.
PART IV
ITEM 15. EXHIBITS, FINANCIAL STATEMENT SCHEDULES
(a) The following documents have been filed as part of this Annual Report:Report on Form 10-K for the fiscal year ended September 30, 2023 ("Annual Report"):
(1) Consolidated Financial Statements. The following documents are provided in Part II, Item 8, Financial Statements and Supplementary Data herein:
Consolidated Statements of Operations Consolidated Statements of Comprehensive Income (Loss) Consolidated Balance Sheets Consolidated Statements of Cash Flows Consolidated Statements of Changes in Proprietary Capital Notes to Consolidated Financial Statements Report of Independent Registered Public Accounting Firm (Ernst & Young LLP)
(2) Consolidated Financial Statement Schedules.
Schedules not included are omitted because they are not required or because the required information is provided in the consolidated financial statements, including the notes thereto.
(3) List of Exhibits | | | | | | | Exhibit No. | Description | | 3.1 | | | | | | 3.2 | Bylaws of the Tennessee Valley Authority Adopted by the TVA Board of Directors on May 18, 2006, as amended on April 3, 2008, May 19, 2008, June 10, 2010, February 13, 2014, August 21, 2014, and November 6, 2014 (Incorporated by reference to Exhibit 3.2 to TVA's Annual Report on Form 10-K for the year ended September 30, 2014, File No. 000-52313) | | | | | 4.1 | | | | | | 10.1 | Second Amended and Restated SeptemberMarch Maturity Credit Agreement Dated as of September 28, 2018,March 25, 2022, Among Tennessee Valley Authority, as the Borrower, Toronto Dominion (Texas) LLC, as Administrative Agent, The Toronto-Dominion Bank, New York Branch, as Letter of Credit Issuer and a Lender, Bank of America, N.A., Canadian Imperial Bank of Commerce, New York Branch, First TennesseeHorizon Bank, National Association, Morgan Stanley Bank, N.A., and The Bank of New York Mellon (Incorporated by referencereference to Exhibit 10.1 to TVA's Current Report on Form 8-K filed on October 3, 2018,March 30, 2022, File No. 000-52313) | | | | 10.2 | Second Amended and Restated JuneSeptember Maturity Credit Agreement Dated as of June 13, 2018,September 21, 2021, Among Tennessee Valley Authority, as the Borrower, Royal Bank of Canada, as Administrative Agent, Letter of Credit Issuer, and a Lender, Barclays Bank PLC, BNP Paribas, Branch Banking and Trust Company, Mizuho Bank Ltd, Regions Bank, SunTrust Bank, and Wells Fargo Bank, National Associationthe Other Lenders Party Thereto (Incorporated by reference to Exhibit 10.1 to TVA's Current Report on Form 8-K filed on June 18, 2018,September 24, 2021, File No. 000-52313) | | | | 10.3 | First Amendment Dated as of March 29, 2023, to Second Amended and Restated September Maturity Credit Agreement Dated as of September 21, 2021, Among Tennessee Valley Authority, as the Borrower, Royal Bank of Canada, as Administrative Agent, Letter of Credit Issuer, and a Lender, and the Other Lenders Party Thereto (Incorporated by reference to Exhibit 10.2 to TVA's Current Report on Form 8-K filed on April 3, 2023, File No. 000-52313) | | | | 10.310.4 | $500,000,000 February Maturity Credit Agreement Dated as of August 7, 2015, Among TVA, Bank of America, N.A., as Administrative Agent, Letter of Credit Issuer, and a Lender, and the Other Lenders Party Thereto (Incorporated by reference to Exhibit 10.1 to TVA's Current Report on Form 8-K filed on August 7, 2015, File No. 000-52313) | | | 10.410.5 | First Amendment Dated as of February 28, 2017, to the $500,000,000 February Maturity Credit Agreement Dated as of August 7, 2015, Among TVA, Bank of America, N.A., as Administrative Agent, Letter of Credit Issuer, and a Lender, and the Other Lenders Party Thereto (Incorporated by referencereference to Exhibit 10.1 to TVA's Current Report on Form 8-K filed on March 3, 2017, File No. 000-52313) | | | 10.510.6 | Second Amendment Dated as of February 21, 2018, to the $500,000,000 February Maturity Credit Agreement Dated as of August 7, 2015, and Amended as of February 28, 2017, amongAmong TVA, Bank of America, N.A., as Administrative Agent, Letter of Credit Issuer, and a Lender, and the Other Lenders Party Thereto (Incorporated by referencereference to Exhibit 10.1 to TVA's Current Report on Form 8-K filed on February 26, 2018, File No. 000-52313) | | |
| | | | | | 10.610.7 | Third Amendment Dated as of February 27, 2020, to the $500,000,000 February Maturity Credit Agreement Dated as of August 7, 2015, and Amended as of February 28, 2017, and February 21, 2018, amongAmong TVA, Bank of America, N.A., as Administrative Agent, Letter of Credit Issuer, and a Lender, and the Other Lenders Party Thereto (Incorporated by reference to Exhibit 10.1 to TVA's Current Report on Form 8-K filed on March 3, 2020, File No. 000-52313) | | | | 10.8 | Fourth Amendment Dated as of January 5, 2023, to the $500,000,000 February Maturity Credit Agreement Dated as of August 7, 2015, and Amended as of February 28, 2017, February 21, 2018, and February 27, 2020, Among TVA, Bank of America, N.A., as Administrative Agent, Letter of Credit Issuer, and a Lender, and the Other Lenders Party Thereto (Incorporated by reference to Exhibit 10.1 to TVA's Current Report on Form 8-K filed on January 6, 2023, File No. 000-52313) | | | |
| | | | | | 10.710.9 | December 2019 Maturity Community Bank Credit Agreement Dated as of December 12, 2016, with SunTrust Bank as Administrative Agent and a Lender, Branch Banking and Trust Company as Letter of Credit Issuer and a Lender, First National Bank, First Tennessee Bank National Association, HomeTrust Bank, Pinnacle Bank, Regions Bank, Trustmark National Bank, and United Community Bank (Incorporated by reference to Exhibit 10.1 to TVA's Current Report on Form 8-K filed on December 15, 2016, File No. 000-52313) | | | 10.810.10 | | | | | 10.11 | | | | | 10.12 | Third Amendment Dated as of March 29, 2023, to December Maturity Community Bank Credit Agreement Dated as of December 12, 2016, and Amended as of December 11, 2018 and February 9, 2021, Among Tennessee Valley Authority, as the Borrower, Truist Bank, as Administrative Agent, Letter of Credit Issuer, and a Lender, and the Other Lenders Party Thereto (Incorporated by reference to Exhibit 10.1 to TVA's Current Report on Form 8-Kfiled on April 3, 2023, File No. 000-52313) | | | | 10.910.13 | | | | 10.1010.14 | Electronotes® Selling Agent Agreement Dated as of June 1, 2006, Among TVA, LaSalle Financial Services, Inc., A.G. Edwards & Sons, Inc., Citigroup Global Markets Inc., Edward D. Jones & Co., L.P., First Tennessee Bank National Association, J.J.B. Hilliard, W.L. Lyons, Inc., Merrill Lynch, Pierce, Fenner & Smith Incorporated, Morgan Stanley & Co. Incorporated, and Wachovia Securities, LLC (Incorporated by reference to Exhibit 10.4 to TVA's Annual Report on Form 10-K for the year ended September 30, 2006, File No. 000-52313) | | | | 10.1110.15 | Amendment Dated as of December 4, 2013, to Electronotes® Selling Agent Agreement Dated as of June 1, 2006, Among TVA, LaSalle Financial Services, Inc., A.G. Edwards & Sons, Inc., Citigroup Global Markets Inc., Edward D. Jones & Co., L.P., First Tennessee Bank National Association, J.J.B. Hilliard, W.L. Lyons, Inc., Merrill Lynch, Pierce, Fenner & Smith Incorporated, Morgan Stanley & Co. Incorporated, and Wachovia Securities, LLC (Incorporated by reference to Exhibit 10.3 to TVA's Quarterly Report on Form 10-Q for the quarter ended March 31, 2014, File No. 000-52313) | | | | 10.1210.16 | Second Amendment Dated as of August 28, 2015, to Electronotes® Selling Agent Agreement Dated as of June 1, 2006, and Amended as of December 4, 2013, Among TVA, LaSalle Financial Services, Inc., A.G. Edwards & Sons, Inc., Citigroup Global Markets Inc., Edward D. Jones & Co., L.P., First Tennessee Bank National Association, J.J.B. Hilliard, W.L. Lyons, Inc., Merrill Lynch, Pierce, Fenner & Smith Incorporated, Morgan Stanley & Co. Incorporated, and Wachovia Securities, LLC (Incorporated by reference to Exhibit 10.9 to TVA's Annual Report on Form 10-K for the year ended September 30, 2015, File No. 000-52313) | | | | 10.1310.17 | Assumption Agreement Between TVA and Incapital LLC Dated as of February 29, 2008, Relating to the Electronotes® Selling Agent Agreement Dated as of June 1, 2006, Among TVA, LaSalle Financial Services, Inc., A.G. Edwards & Sons, Inc., Citigroup Global Markets Inc., Edward D. Jones & Co., L.P., First Tennessee Bank National Association, J.J.B. Hilliard, W.L. Lyons, Inc., Merrill Lynch, Pierce, Fenner & Smith Incorporated, Morgan Stanley & Co. Incorporated, and Wachovia Securities, LLC (Incorporated by reference to Exhibit 10.1 to TVA's Quarterly Report on Form 10-Q for the quarter ended March 31, 2008, File No. 000-52313) | | | 10.14 | | | | 10.15 | | | | 10.16 | | | | 10.17 | | | | | 10.18 | | | | 10.19* | Participation Agreement Dated as of September 22, 2003, Among (1) TVA, (2) NVG Network I Statutory Trust, (3) Wells Fargo Delaware Trust Company, Not in Its Individual Capacity, Except to the Extent Expressly Provided in the Participation Agreement, But as Owner Trustee, (4) Wachovia Mortgage Corporation, (5) Wilmington Trust Company, Not in Its Individual Capacity, Except to the Extent Expressly Provided in the Participation Agreement, But as Lease Indenture Trustee, and (6) Wilmington Trust Company, Not in Its Individual Capacity, Except to the Extent Expressly Provided in the Participation Agreement, But as Pass Through Trustee (Incorporated by reference to Exhibit 10.10 to TVA's Annual Report on Form 10-K for the year ended September 30, 2006, File No. 000-52313) | | | 10.20* | |
| | | | | | 10.21* | | | | 10.22* | | | | 10.23 | | | | 10.2410.19 | | | | 10.25*10.20* | | | |
| | | | | | 10.2610.21 | | | | 10.2710.22 | | | | 10.28*10.23* | | | | | 10.29*10.24* | Consent Decree Among Alabama, Kentucky, North Carolina, Tennessee, the Alabama Department of Environmental Management, the National Parks Conservation Association, Inc., the Sierra Club, Our Children's Earth Foundation, and TVA (Incorporated by reference to Exhibit 10.3 to TVA's Quarterly Report on Form 10-Q for the quarter ended June 30, 2011, File No. 000-52313) | | | | | | | 10.30†10.25† | | | | | 10.31†10.26† | | | | 10.32†10.27† | | | | | 10.33†10.28† | | | | 10.34†10.29† | | | | 10.35†10.30† | | | | | 10.31† | | | | 10.36†10.32† | | | | 10.37†10.33† | | | | 10.38† | | | |
| | | | | | 10.39†10.34† | | | | | 10.35† | | | | | 10.36† | | | | | 14.1 | | | | | | 14.2 | | | | | 19.1 | | | | | 31.1 | |
| | | | | | | | | | 31.2 | | | | | | 32.1 | | | | | | 32.2 | | | | | | 97.1 | | | | | 101.INS | TVAInline XBRL Instance Document - the instance document does not appear in the Interactive Data File because its XBRL tags are embedded within the Inline XBRL document | | | | | 101.SCH | TVAInline XBRL Taxonomy Extension Schema | | | | 101.CAL | TVAInline XBRL Taxonomy Extension Calculation Linkbase | | | | 101.DEF | TVAInline XBRL Taxonomy Extension Definition Linkbase | | | | 101.LAB | TVAInline XBRL Taxonomy Extension Label Linkbase | | | | 101.PRE | TVAInline XBRL Taxonomy Extension Presentation Linkbase | | | | 104 | Cover Page Interactive Data File - formatted in Inline XBRL and contained in Exhibit 101 | † Management contract or compensatory arrangement. * Certain schedule(s) and/or exhibit(s) have been omitted. TVA hereby undertakes to furnish supplementally copies of any of the omitted schedules and/or exhibits upon request by the Securities and Exchange Commission. |
ITEM 16. FORM 10-K SUMMARY
Not applicable.
SIGNATURES
Pursuant to the requirements of Section 13, 15(d), or 37 of the Securities Exchange Act of 1934, the registrant has duly caused this report to be signed on its behalf by the undersigned, thereunto duly authorized.
| | | | | | | | | | | | | Date: | November 16, 202013, 2023 | | TENNESSEE VALLEY AUTHORITY | | | | (Registrant) | | | By: | /s/ Jeffrey J. Lyash | | | | Jeffrey J. Lyash | | | | President and Chief Executive Officer |
SIGNATURES
Pursuant to the requirements of the Securities Exchange Act of 1934, this report has been signed below by the following persons on behalf of the registrant and in the capacities and on the dates indicated.
| | | | | | | | | | Signature | Title | Date | | | | | | | | | | | | | | /s/ Jeffrey J. Lyash | President and Chief Executive Officer | November 16, 202013, 2023 | | Jeffrey J. Lyash | (Principal Executive Officer) | | | | | | | | | | /s/ John M. Thomas, III | Executive Vice President and | November 16, 202013, 2023 | | John M. Thomas, III | Chief Financial and Strategy Officer | | | | (Principal Financial Officer) | | | | | | | /s/ Diane Wear | Vice President and Controller | November 16, 202013, 2023 | | Diane Wear | (Principal Accounting Officer) | | | | | | | | | /s/ John RyderJoe H. Ritch | Chair | November 16, 202013, 2023 | John RyderJoe H. Ritch | | | | | | | | | /s/ Kenneth E. AllenWilliam B. Kilbride | Director | November 16, 202013, 2023 | Kenneth E. AllenWilliam B. Kilbride | | | | | | | | | /s/ A. D. FrazierBeth H. Harwell | Director | November 16, 202013, 2023 | A. D. FrazierBeth H. Harwell | | | | | | | | | | | /s/ Jeff W. SmithBrian E. Noland | Director | November 16, 202013, 2023 | Jeff W. SmithBrian E. Noland | | | | | | | | | | /s/ Beth P. Geer | Director | November 13, 2023 | | Beth P. Geer | | | | | | | | | | /s/ L. Michelle Moore | Director | November 13, 2023 | | L. Michelle Moore | | | | | | | | | | /s/ Robert P. Klein | Director | November 13, 2023 | | Robert P. Klein | | | | | | | | | | /s/ William B. KilbrideJ. Renick | Director | November 16, 202013, 2023 | William B. KilbrideJ. Renick | | | | | | | | | | /s/ A. Wade White | Director | November 13, 2023 | | A. Wade White | | | | | | | | | | | | | | | | | | | | | | | | | | | | | |
|