UNITED STATES SECURITIES AND EXCHANGE COMMISSION
Washington, D.C. 20549
Form 10-K
(Mark One)
| þ | ANNUAL REPORT PURSUANT TO SECTION 13 OR 15(d) OF THE SECURITIES EXCHANGE ACT OF 1934 | ||||
| For the fiscal year ended December 31, | |||||
OR
| ¨ | TRANSITION REPORT PURSUANT TO SECTION 13 OR 15(d) OF THE SECURITIES EXCHANGE ACT OF 1934 | ||||
| For the transition period from to | |||||
Commission file number 814-00733
Barings BDC, Inc.
(Exact name of registrant as specified in its charter)
| Maryland | 06-1798488 | |||||||
(State or other jurisdiction of incorporation or organization) | (I.R.S. Employer Identification No.) | |||||||
| 300 South Tryon Street, Suite 2500 Charlotte, North Carolina | 28202 (Zip Code) | |||||||
| (Address of principal executive offices) | ||||||||
Registrant’s telephone number, including area code:
(704) 805-7200
Securities registered pursuant to Section 12(b) of the Act:
| Title of Each Class | Trading Symbol | Name of Each Exchange on Which Registered | ||||||
| Common Stock, par value $0.001 per share | BBDC | The New York Stock Exchange | ||||||
Securities registered pursuant to Section 12(g) of the Act:
None
Indicate by check mark if the registrant is a well-known seasoned issuer, as defined in Rule 405 of the Securities Act. Yes ¨ No R
Indicate by check mark if the registrant is not required to file reports pursuant to Section 13 or Section 15(d) of the Act. Yes ¨ No R
Indicate by check mark whether the registrant (1) has filed all reports required to be filed by Section 13 or 15(d) of the Securities Exchange Act of 1934 during the preceding 12 months (or for such shorter period that the registrant was required to file such reports), and (2) has been subject to such filing requirements for the past 90 days. Yes þ No ¨
Indicate by check mark whether the registrant has submitted electronically every Interactive Data File required to be submitted pursuant to Rule 405 of Regulation S-T during the preceding 12 months (or for such shorter period that the registrant was required to submit such files). Yes ¨ No ¨
Indicate by check mark whether the registrant is a large accelerated filer, an accelerated filer, a non-accelerated filer, a smaller reporting company, or an emerging growth company. See the definitions of "large accelerated filer," "accelerated filer," "smaller reporting company," and "emerging growth company" in Rule 12b-2 of the Exchange Act. (Check one):
Large accelerated filer ¨ | Accelerated filer | Non-accelerated filer | Smaller reporting company ¨ | |||||||||||||||||
Emerging growth company ¨ | ||||||||||||||||||||
If an emerging growth company, indicate by check mark if the registrant has elected not to use the extended transition period for complying with any new or revised financial accounting standards provided pursuant to Section 13(a) of the Exchange Act. ¨ | ||||||||||||||||||||
Indicate by check mark whether the registrant has filed a report on and attestation to its management’s assessment of the effectiveness of its internal control over financial reporting under Section 404(b) of the Sarbanes-Oxley Act by the registered public accounting firm that prepared or issued its audit report. □
Indicate by check mark whether the registrant is a shell company (as defined in Rule 12b-2 of the Act). Yes ¨ No þ
The aggregate market value of the voting common stock held by non-affiliates of the registrant (assuming solely for the purpose of this disclosure that all executive officers, directors and 10% or more stockholders of the registrant are “affiliates”) as of June 28, 2019,30, 2021, based on the closing price on that date of $9.84$10.56 on the New York Stock Exchange, was $359,401,434.$540,334,238.
The number of shares outstanding of the registrant’s common stock on February 27, 202023, 2022 was 48,950,803.65,316,085.
DOCUMENTS INCORPORATED BY REFERENCE
Portions of the registrant’s definitive proxy statement relating to the registrant's 20202022 Annual Meeting of Stockholders, to be filed with the Securities and Exchange Commission within 120 days following the end of the registrant's fiscal year, are incorporated by reference in Part III of this Annual Report on Form 10-K as indicated herein.
BARINGS BDC, INC.
TABLE OF CONTENTS
ANNUAL REPORT ON FORM 10-K
For the Fiscal Year Ended December 31, 20192021
| Page | ||||||||
| PART I | ||||||||
| Item 1. | ||||||||
| Item 1A. | ||||||||
| Item 1B. | ||||||||
| Item 2. | ||||||||
| Item 3. | ||||||||
| Item 4. | ||||||||
| PART II | ||||||||
| Item 5. | ||||||||
| Item 6. | ||||||||
| Item 7. | ||||||||
| Item 7A. | ||||||||
| Item 8. | ||||||||
| Item 9. | ||||||||
| Item 9A. | ||||||||
| Item 9B. | ||||||||
| Item 9C. | ||||||||
| PART III | ||||||||
| Item 10. | ||||||||
| Item 11. | ||||||||
| Item 12. | ||||||||
| Item 13. | ||||||||
| Item 14. | ||||||||
| PART IV | ||||||||
| Item 15. | ||||||||
2
FORWARD-LOOKING STATEMENTS
3
PART I
Item 1. Business.
Organization
We are a Maryland corporation incorporated on October 10, 2006. We currently operate as a closed-end, non-diversified investment company and have elected to be treated as a business development company ("BDC") under the Investment Company Act of 1940, as amended (the "1940 Act"). We have elected for federal income tax purposes to be treated, and intend to qualify annually, as a regulated investment company ("RIC") under the Internal Revenue Code of 1986, as amended (the "Code"), for tax purposes.
Our headquarters are in Charlotte, North Carolina, and our Internet address is www.baringsbdc.com. We are not including the information contained on our website as a part of, or incorporating it by reference into, this Annual Report on Form 10-K. We make available free of charge through our website our Annual Reports on Form 10-K, Quarterly Reports on Form 10-Q, Current Reports on Form 8-K, and any amendments to these reports, as soon as reasonably practicable after we electronically file such material with, or furnish such material to, the Securities and Exchange Commission (the "SEC"). Copies of this Annual Report on Form 10-K and other reports are also available without charge upon written request to us.
The Asset Sale and Externalization Transactions
Also onin April 3, 2018, we entered into a stock purchase and transaction agreement (the "Externalization Agreement"), with Barings LLC ("Barings") through which Barings agreed to become our investment adviser in exchange for (1) a payment by Barings of $85.0 million, or approximately $1.78 per share, directly to our stockholders, (2) an investment by Barings of $100.0 million in newly issued shares of our common stock at net asset value and (3) a commitment from Barings to purchase up to $50.0 million of shares of our common stock in the open market at prices up to and including our then-current net asset value per share for a two-year period, after which Barings agreed to use any remaining funds from the $50.0 million to purchase additional newly-issued shares of our common stock at the greater of our then-current net asset value per share or market price (collectively, the "Externalization Transaction"). The Asset Sale Transaction and the Externalization Transaction are collectively referred to as the "Transactions." The Transactions were approved by our stockholders at our July 24, 2018 special meeting of stockholders (the "2018 Special Meeting").
The Asset SaleExternalization Transaction closed on July 31, 2018. The gross cash proceeds received from the Asset Buyer and certain affiliatesAugust 2, 2018 (the "Externalization Closing"). Effective as of the Asset Buyer in connection withExternalization Closing, we changed our name from Triangle Capital Corporation to Barings BDC, Inc. and on August 3, 2018, began trading on the Asset Sale Transaction were approximately $793.3 million, after adjustments to take into account portfolio activity and other matters occurring since December 31, 2017, as described in greater detail inNew York Stock Exchange ("NYSE") under the Asset Purchase Agreement. Adjustments to the purchase price included, among other things, approximately $208.8 million of principal payments and prepayments, sales proceeds and distributions related to our investment portfolio that were received and retained by us between December 31, 2017 and the closing of the Asset Sale Transaction, offset by approximately $29.5 million of loans and equity investments originated by us between December 31, 2017 and the closing of the Asset Sale Transaction.symbol "BBDC."
Our former wholly-owned subsidiaries, Triangle Mezzanine Fund LLLP ("Triangle SBIC"), Triangle Mezzanine Fund II LP ("Triangle SBIC II"), and Triangle Mezzanine Fund III LP ("Triangle SBIC III"), were specialty finance limited partnerships that were formed to make investments primarily in lower middle-market companies located throughout the United States. Each of Triangle SBIC, Triangle SBIC II and Triangle SBIC III held licenses to operate as Small Business Investment Companies ("SBICs"), under the authority of the United States Small Business Administration ("SBA"). In connection with the closing of the Asset Sale Transaction, we repaid all of our outstanding SBA-guaranteed debentures and surrendered the SBIC licenses held by Triangle SBIC,
Triangle SBIC II, and Triangle SBIC III. Triangle SBIC, Triangle SBIC II, and Triangle SBIC III were dissolved during the year ended December 31, 2019.
Prior to the Externalization Transaction, we were internally managed by our executive officers under the supervision of our Board of Directors (the "Board"). During this period, we did not pay management or advisory fees, but instead incurred the operating costs associated with employing executive management and investment and portfolio management professionals. In connection with the closing of the Externalization Transaction, we entered
4
into an investment advisory agreement (the "Advisory"Original Advisory Agreement") and an administration agreement (the "Administration Agreement") with Barings, pursuant to which Barings serves as our investment adviser and administrator and manages our investment portfolio which initially consisted primarily of the cash proceeds received in connection with the Asset Sale Transaction. In addition, on
MVC Capital, Inc. Acquisition
On December 23, 2020, we completed our acquisition of MVC Capital, Inc., a Delaware corporation (“MVC”) (the “MVC Acquisition”) pursuant to the terms and conditions of that certain Agreement and Plan of Merger (the “MVC Merger Agreement”), dated as of August 2, 2018, we10, 2020, with MVC, Mustang Acquisition Sub, Inc., a Delaware corporation and our wholly owned subsidiary (“Acquisition Sub”), and Barings. To effect the acquisition, Acquisition Sub merged with and into MVC, with MVC surviving the merger as our wholly owned subsidiary (the “First MVC Merger”). Immediately thereafter, MVC merged with and into us, with us as the surviving company (the “Second MVC Merger” and, together with the First MVC Merger, the “MVC Merger”).
Pursuant to the MVC Merger Agreement, MVC stockholders received the right to the following merger consideration in exchange for each share of MVC common stock issued 8,529,917and outstanding immediately prior to the effective time of the First MVC Merger (other than shares of MVC common stock issued and outstanding immediately prior to the effective time of the First MVC Merger that were held by a subsidiary of MVC or held, directly or indirectly, by us or the Acquisition Sub), in accordance with the MVC Merger Agreement: (i) an amount in cash from Barings, without interest, equal to $0.39492, and (ii) 0.9790836 shares of our common stock, which ratio gave effect to the Euro-dollar exchange rate adjustment mechanism in the MVC Merger Agreement, plus cash in lieu of fractional shares. We issued approximately 17,354,332 shares of our common stock to Barings at a price of $11.723443 per share, or an aggregate of $100.0 millionMVC’s then-existing stockholders in cash.
In connection with the MVC Acquisition, on December 23, 2020, following the closing of the MVC Merger, we entered into an amended and restated investment advisory agreement (the “Amended and Restated Advisory Agreement”) with Barings, obligation undereffective January 1, 2021, which amended the ExternalizationOriginal Advisory Agreement to, among other things, (i) reduce the annual base management fee payable to Barings from 1.375% to 1.250% of our gross assets, (ii) reset the commencement date for the rolling 12-quarter “look-back” provision used to calculate the income incentive fee and incentive fee cap to January 1, 2021 from January 1, 2020 and (iii) describe the fact that we may enter into guarantees, sureties and other credit support arrangements with respect to one or more of our investments, including the impact of these arrangements on the income incentive fee cap. See “—Management Agreements – Investment Advisory Agreement” in this Item 1 of Part I of this Annual Report on Form 10-K for more information.
In connection with the MVC Acquisition, on December 23, 2020, promptly following the closing of the MVC Merger, we entered into a trading planCredit Support Agreement (the “MVC Credit Support Agreement”) with Barings, pursuant to which Barings committedhas agreed to purchase $50.0provide credit support to us in the amount of up to $23.0 million relating to the net cumulative realized and unrealized losses on the acquired MVC investment portfolio over a 10-year period. The MVC Credit Support Agreement is intended to give stockholders of the combined company downside protection from net cumulative realized and unrealized losses on the acquired MVC portfolio and insulate the combined company’s stockholders from potential value volatility and losses in MVC’s portfolio following the
5
closing of the MVC Merger. There is no fee or other payment by us to Barings or any of its affiliates in connection with the MVC Credit Support Agreement. Any cash payment from Barings to us under the MVC Credit Support Agreement will be excluded from the incentive fee calculations under the Amended and Restated Advisory Agreement. See “Note 2. Agreements and Related Party Transactions” and “Note. 6 Derivative Instruments” in the Notes to our Consolidated Financial Statements included in this Annual Report on Form 10-K for more information.
Pending Sierra Income Corporation Acquisition
On September 21, 2021, we entered into an Agreement and Plan of Merger (the “Sierra Merger Agreement”) by and among us, Mercury Acquisition Sub, Inc., a Maryland corporation and our direct wholly owned subsidiary (“Sierra Acquisition Sub”), Sierra Income Corporation, a Maryland corporation (“Sierra”), and Barings. The Sierra Merger Agreement provides that, on the terms and subject to the conditions set forth in the Sierra Merger Agreement, Sierra Acquisition Sub will merge with and into Sierra, with Sierra continuing as the surviving company and as our wholly owned subsidiary (the “First Sierra Merger”) and, immediately thereafter, Sierra will merge with and into us, with Barings BDC, Inc. continuing as the surviving company (the “Second Sierra Merger” and, together with the First Sierra Merger, the “Sierra Merger”). Both the Board and the board of directors of Sierra, including all of the respective independent directors, have approved the Sierra Merger Agreement and the transactions contemplated therein. The parties to the Sierra Merger Agreement intend the Sierra Merger to be treated as a “reorganization” within the meaning of Section 368(a) of the Code.
In the First Sierra Merger, each share of Sierra common stock issued and outstanding immediately prior to the effective time of the First Sierra Merger (excluding any shares cancelled pursuant to the Sierra Merger Agreement) will be converted into the right to receive (i) $0.9783641 per share in cash, without interest, from Barings (such amount of cash, the “Sierra Cash Consideration”) and (ii) 0.44973 (such ratio, as may be adjusted pursuant to the Sierra Merger Agreement, the “Sierra Exchange Ratio”) of a validly issued, fully paid and non-assessable share of our common stock (the “Sierra Share Consideration” and, together with the Sierra Cash Consideration, the “Sierra Merger Consideration”).
The Sierra Merger Agreement contains representations, warranties and covenants, including, among others, covenants relating to the operation of each of our and Sierra’s businesses during the period prior to the closing of the Sierra Merger. We and Sierra have agreed to convene and hold stockholder meetings for the purpose of obtaining the approvals required of our and Sierra’s stockholders, respectively, and our Board and the board of directors of Sierra have agreed to recommend that their respective stockholders approve the applicable proposals (as described below).
The Sierra Merger Agreement provides that Sierra shall not, and shall cause its subsidiaries and instruct its representatives not to, directly or indirectly, solicit proposals relating to alternative transactions, or, subject to certain exceptions, initiate or participate in discussions or negotiations regarding, or provide information with respect to, any proposal for an alternative transaction. However, the Sierra board of directors may, subject to certain conditions, change its recommendation to the Sierra stockholders or, on payment of a termination fee of $11.0 million to us and the reimbursement of up to $2.0 million in expenses incurred by us and Barings, terminate the Sierra Merger Agreement and enter into an Alternative Acquisition Agreement (as defined in the Sierra Merger Agreement) for a Superior Proposal (as defined in the Sierra Merger Agreement) if it determines in good faith, after consultation with its outside legal counsel, that failure to do so would be inconsistent with the directors’ duties under applicable law.
Consummation of the First Sierra Merger, which is currently anticipated to occur during the first quarter of fiscal year 2022, is subject to certain customary closing conditions, including (1) approval of the First Sierra Merger by the holders of at least a majority of the outstanding shares of Sierra common stock entitled to vote thereon, (2) approval of the issuance of our common stock to be issued in the First Sierra Merger by a majority of the votes cast by our stockholders on the matter at our stockholders meeting, (3) approval of the issuance of our common stock in connection with the First Sierra Merger at a price below the then-current net asset value per share of sharesour common stock, if applicable, by the vote specified in open market transactions through an independent broker. The maximum aggregate purchase priceSection 63(2)(A) of all shares purchasedthe 1940 Act, (4) the absence of certain legal impediments to the consummation of the Sierra Merger, (5) effectiveness of the registration statement for our common stock to be issued as consideration in the First Sierra Merger, (6) approval for listing on the NYSE of our common stock to be issued as consideration in the First Sierra Merger, (7) subject to certain materiality standards,
6
the accuracy of the representations and warranties and compliance with the covenants of each party to the Sierra Merger Agreement, and (8) required regulatory approvals (including expiration of the waiting period under the 10b5-1 Plan was $50.0 million. On February 11, 2019, Hart-Scott-Rodino Antitrust Improvements Act of 1976, as amended, or early termination thereof).
Barings, fulfilled its obligations underas party to the 10b5-1 PlanSierra Merger Agreement, agreed to purchase an aggregate amount of $50.0 million invote all shares of our common stock and the 10b5-1 Plan terminatedover which it has voting power (other than in accordance with its terms. Upon completionfiduciary capacity) in favor of the 10b5-1 Plan, Barings had purchased 5,084,302 sharesproposals to be submitted by us to our stockholders for approval relating to the Sierra Merger.
In addition, we and Sierra will take steps necessary to provide for the repayment at closing of Sierra’s existing loan agreement. The Sierra Merger Agreement also contains certain termination rights in favor of us and Sierra, including if the First Sierra Merger is not completed on or before March 31, 2022 or if the requisite approvals of our common stock pursuant tostockholders or Sierra stockholders are not obtained.
Further, we will enter into an amendment and restatement of the 10b5-1 PlanAmended and Restated Advisory Agreement, effective as of December 31, 2019, owned a total of 13,639,681 shares of our common stock, or 27.9%the closing of the total shares outstanding.Sierra Merger, to raise the annualized hurdle rate thereunder from 8.0% to 8.25%. Following the closing of the Sierra Merger, we will also enter into a credit support agreement with Barings, for the benefit of the combined company, to protect against net cumulative unrealized and realized losses of up to $100.0 million on the acquired Sierra investment portfolio over the next ten years.
Overview of Our Business
Barings employs fundamental credit analysis, and targets investments in businesses with relatively low levels of cyclicality and operating risk. The hold size of each position will generally be dependent upon a number of factors including total facility size, pricing and structure, and the number of other lenders in the facility. Barings has experience managing levered vehicles, both public and private, and will seek to enhance our returns through the use of leverage with a prudent approach that prioritizes capital preservation. Barings believes this strategy and approach offers attractive risk/return with lower volatility given the potential for fewer defaults and greater resilience through market cycles.
Our investment objective is to generate current income by investing directly in privately-held middle-market companies to help these companies fund acquisitions, growth or refinancing. Barings employs fundamental credit analysis, and targets investments in businesses with low levels of cyclicality (i.e., the risk of business cycles or other economic cycles adversely affecting them) and operating risk relative to other businesses in this market segment. The holding size of each position will generally be dependent upon a number of factors including total facility size, pricing and structure, and the number of other lenders in the facility. Barings has experience managing levered vehicles, both public and private, and seeks to enhance our returns through the use of leverage with a prudent approach that prioritizes capital preservation. Barings believes this strategy and approach offers attractive risk/return with lower volatility given the potential for fewer defaults and greater resilience through market cycles. A significant portion of our investments are expected to be rated below investment grade by rating agencies or, if unrated, would be rated below investment grade if they were rated. Below investment grade securities, which are often referred to as “junk,” have predominantly speculative characteristics with respect to the issuer’s capacity to pay interest and repay principal. To a lesser extent, we may make investments in syndicated loan opportunities for cash management and other purposes, which includes but is not limited to maintaining more liquid investments to manage our share repurchase program.
7
Relationship with Our Adviser, Barings
Our investment adviser, Barings, a wholly-owned subsidiary of Massachusetts Mutual Life Insurance Company, ("MassMutual"), is a leading global asset management firm and is registered with the SEC as an investment adviser under the Investment Advisers Act of 1940, as amended (the "Advisers Act"). Barings’ primary investment capabilities include fixed income, private credit, real estate, equity, and alternative investments. Subject to the overall supervision of the Board, Barings’ Global Private Finance Group ("Barings GPFG"), manages our day-to-day operations, and provides investment advisory and management services to us. Barings GPFG is part of Barings' $251.7$305.2 billion Global Fixed Income Platform that invests in liquid, private and structured credit. Barings GPFG manages private funds and separately managed accounts, along with multiple public vehicles.
Among other things, Barings (i) determines the composition of our portfolio, the nature and timing of the changes therein and the manner of implementing such changes; (ii) identifies, evaluates and negotiates the structure of the investments made by us; (iii) executes, closes, services and monitors the investments that we make; (iv) determines the securities and other assets that we will purchase, retain or sell; (v) performs due diligence on prospective portfolio companies and (vi) provides us with such other investment advisory, research and related services as we may, from time to time, reasonably require for the investment of our funds.
Under the terms of the Administration Agreement, Barings has agreed to performperforms (or oversee,oversees, or arrangearranges for, the performance of) the administrative services necessary for our operation, including, but not limited to, office facilities, equipment, clerical, bookkeeping and record keeping services at such office facilities and such other services as Barings, subject to review by the Board, will from time to time determine to be necessary or useful to perform its obligations under the Administration Agreement. Barings will also, on our behalf and subject to the Board’s oversight, by the Board, arrangearranges for the services of, and oversee,oversees, custodians, depositories, transfer agents, dividend disbursing agents, other stockholder servicing agents, accountants, attorneys, valuation experts, underwriters, brokers and dealers, corporate fiduciaries, insurers, banks and such other persons in any such other capacity deemed to be necessary or desirable. Barings is responsible for the financial and other records that we are required to maintain and will prepare all reports and other materials that we are required to filebe filed with the SEC or any other regulatory authority.
Stockholder Approval of Reduced Asset Coverage Ratio
On July 24, 2018, our stockholders voted at the 2018 Special Meeting to approve a proposal to authorize us to be subject to a reduced asset coverage ratio of at least 150% under the 1940 Act. As a result of the stockholder approval at the 2018 Special Meeting, effective July 25, 2018, our applicable asset coverage ratio under the 1940 Act has been decreased to 150% from 200%. As a result, we are now permitted under the 1940 Act to incur indebtedness at a level that is more consistent with a portfolio of senior secured debt. As of December 31, 2019,2021, our asset coverage ratio was 184.5%153.8%.
Our Business Strategy
We seek attractive returns by generating current income primarily from directly-originated debt investments in middle-market companies located primarily in the United States. We also have investments in middle-market companies located outside the United States. Our strategy includes the following components:
•Leveraging Barings GPFG's Origination and Portfolio Management Resources. Barings GPFG has over 75 investment professionals located in six different offices in the U.S., Europe, Australia/New Zealand and Asia. These regional investment teams have been working together in their respective regions for a number
of years and have extensive experience advising, investing in and lending to companies across changing market cycles. In addition, the individual members of these teams have diverse investment backgrounds, with prior experience at investment banks, commercial banks, and privately and publicly held companies. We believe this diverse experience provides an in-depth understanding of the strategic, financial and operational challenges and opportunities of middle-market companies.
•Utilizing Long-Standing Relationships to Source Investments. Barings GPFG has worked diligently over decades to build strategic relationships with private equity firms globally. Barings GPFG's long history of providing consistent, predictable capital to middle-market sponsors, even in periods of market dislocation,
8
has earned Barings and us a reputation as a reliable partner. Barings GPFG also maintains extensive personal relationships with entrepreneurs, financial sponsors, attorneys, accountants, investment bankers, commercial bankers and other non-bank providers of capital who refer prospective portfolio companies to us. These relationships historically have generated significant investment opportunities. We believe that this network of relationships will continue to produce attractive investment opportunities.
•Focusing on the Middle-Market. We primarily invest in middle-market transactions. These companies tend to be privately owned, often by a private equity sponsor, and are companies that typically generate annual earnings before interest, taxes, depreciation and amortization, as adjusted (“Adjusted EBITDAEBITDA”), of $10.0 million to $75.0 million.
•Providing One-Stop Customized Financing Solutions. Barings GPFG's ability to commit to and originate larger hold positions (in excess of $200 million) in a given transaction is a differentiator to middle-market private equity sponsors. In today's market, it has become increasingly important to have the ability to underwrite an entire transaction, providing financial sponsors with certainty of close. Barings GPFG offers a variety of financing structures and has the flexibility to structure investments to meet the needs of our portfolio companies. Currently, we invest primarily in senior secured loans. In addition, in certain limited instances, we may invest in equity instruments of our portfolio companies, such as direct preferred or common equity interests.
•Applying Consistent Underwriting Policies and Active Portfolio Management. We believe robust due diligence on each investment is paramount due to the lack of an active secondary market. With limited ability to liquidate holdings, private credit investors must take a longer-term, “originate-to-hold” investment approach. Barings GPFG has implemented underwriting policies and procedures that are followed for each potential transaction. This consistent and proven fundamental underwriting process includes a thorough analysis of each potential portfolio company’s competitive position, financial performance, management team operating discipline, growth potential and industry attractiveness, which Barings GPFG believes allows it to better assess the company’s prospects. After closing, Barings GPFG maintains ongoing access to both the sponsor and portfolio company management in order to closely monitor investments and suggest or require remedial actions as needed to avoid a default.
•Maintaining Portfolio Diversification. While we focus our investments in middle-market companies, we seek to invest across various industries and in both United States-based and foreign-based companies. Barings GPFG monitors our investment portfolio to ensure we have acceptable industry balance, using industry and market metrics as key indicators. By monitoring our investment portfolio for industry balance, we seek to reduce the effects of economic downturns associated with any particular industry or market sector. Notwithstanding our intent to invest across a variety of industries, we may from time to time hold securities of a single portfolio company that comprise more than 5.0% of our total assets and/or more than 10.0% of the outstanding voting securities of the portfolio company. For that reason, we are classified as a non-diversified management investment company under the 1940 Act.
Investments
Debt Investments
The terms of our debt investments are tailored to the facts and circumstances of each transaction and prospective portfolio company, negotiating a structure that seeks to protect lender rights and manage risk while creating incentives for the portfolio company to achieve its business plan. We also seek to limit the downside risks of our investments by negotiating covenants that are designed to protect our investments while affording our portfolio companies as much flexibility in managing their businesses as possible. Such restrictions may include affirmative and negative covenants, default penalties, lien protections, change of control provisions, put rights and a pledge of the operating companies' stock which provides us with additional exit options in downside scenarios. Other lending protections may include term loan amortization, excess cash flow sweeps (effectively additional term loan amortization), limitations on a company’s ability to make acquisitions, maximums on capital expenditures and limits on allowable dividends and distributions. Further, up-front closing fees of typically 1-3% of the loan amount act effectively as pre-payment protection given the cost to a company to refinance early. Additionally, we will typically include call protection provisions effective for the first six to twelve months of an investment to enhance our potential total return.
9
We invest in senior and subordinated debt securities of privately-held lower middle-market companies, generally secured by security interests in portfolio company assets. Our senior and subordinated debt investments generally had terms of three to seven years, did not have scheduled amortization and were due at maturity. Our legacy senior secured debt investments generally provided for variable interest at rates ranging from LIBOR plus 550 basis points to LIBOR plus 950 basis points per annum. In addition, our legacy subordinated debt investments generally provided for fixed interest rates between 10.0% and 15.0% per annum. Our subordinated debt investments generally were secured by a second priority security interest in the assets of the borrower and generally included an equity component, such as common stock in the portfolio company. In addition, certain loan investments had PIK interest.
Equity Investments
On a limited basis, we may acquire equity interests in portfolio companies. In such cases, we generally seek to structure our equity investments as non-control investments that provide us with minority rights.
Investment Criteria
We utilize the following criteria and guidelines in evaluating investment opportunities. However, not all of these criteria and guidelines have been, or will be, met in connection with each of our investments.
•Established Companies With Positive Cash Flow. We seek to invest in later-stage or mature companies with a proven history of generating positive cash flows. We typically focus on companies with a history of profitability and trailing twelve-month Adjusted EBITDA ranging from $10.0 million to $75.0 million.
•Experienced Management Teams. Based on our prior investment experience, we believe that a management team with significant experience with a portfolio company or relevant industry experience is essential to the long-term success of the portfolio company. We believe management teams with these attributes are more likely to manage the companies in a manner that protects our debt investment.
•Strong Competitive Position. We seek to invest in companies that have developed strong positions within their respective markets, are well positioned to capitalize on growth opportunities and compete in industries with barriers to entry. We also seek to invest in companies that exhibit a competitive advantage, which may help to protect their market position and profitability.
•Varied Customer and Supplier Bases. We prefer to invest in companies that have varied customer and supplier bases. Companies with varied customer and supplier bases are generally better able to endure economic downturns, industry consolidation and shifting customer preferences.
•Significant Invested Capital. We believe the existence of significant underlying equity value provides important support to investments. We seek to identify portfolio companies that we believe have well-structured capital beyond the layer of the capital structure in which we invest.
Investment Process
Our investment origination and portfolio monitoring activities are performed by Barings GPFG. Barings GPFG has an investment committee that is responsible for all aspects of the investment process. The investment committee is comprised of six members, including our Chief Executive Officer, Eric Lloyd and our President, Ian Fowler. The investment process is designed to maximize risk-adjusted returns, minimize non-performing assets and avoid investment losses. In addition, the investment process is also designed to provide sponsors and prospective portfolio companies with efficient and predictable deal execution.
10
Origination
Our origination process is summarized in the following chart:
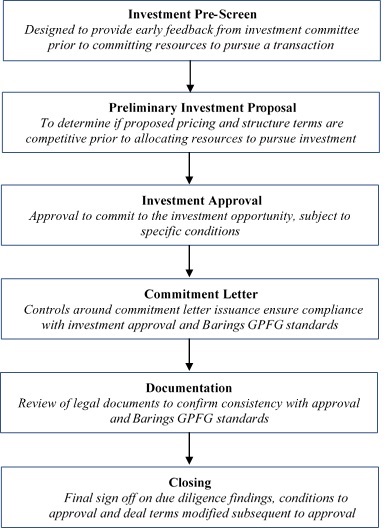
Investment Pre-Screen
The investment pre-screen process begins with a review of an offering memorandum or other high-level prospect information by an investment originator. A fundamental bottoms-up credit analysis is prepared and independent third-party research is gathered in addition to the information received from the sponsor. The investment group focuses on a prospective investment's fundamentals, sponsor/source and proposed investment structure. This review may be followed by a discussion between the investment originator and an investment group head to identify investment opportunities that should be passed on, either because they fall outside of Barings GPFG's stated investment strategy or offer an unacceptable risk-adjusted return. If the originator and investment group head agree that an investment opportunity is worth pursuing, a credit analyst assists the originator with preparation of a screening memorandum. The screening memorandum is discussed internally with the investment group head and other senior members of the investment group, and in certain instances, the investment group head may elect to review the screening memorandum with the investment committee prior to the preliminary investment proposal.
Preliminary Investment Proposal
Following the screening memorandum discussion, if the decision is made by the investment group head to pursue an investment opportunity, key pricing and structure terms may be communicated to the prospective borrower verbally or via a non-binding standard preliminary term sheet in order to determine whether the proposed terms are competitive.
Investment Approval
Upon acceptance by a sponsor/prospective borrower of preliminary key pricing and structure terms, the investment process continues with formal due diligence. The investment team attends meetings with the prospective portfolio company’s management, reviews historical and forecasted financial information and third-party diligence reports, conducts research to support preparation of proprietary financial models including both base case and
11
downside scenarios, valuation analyses, and ultimately, an underwriting memorandum for review by the investment committee. In order for an investment to be made by us,A majority of the investment must be approved byvotes cast at a meeting at which a majority affirmative vote of the members of the Investment Committee is present is required to approve all new investment committee.decisions.
Commitment Letter
For investments that require written confirmation of commitment, commitment letters must be approved by Barings GPFG's internal legal team. Commitment letters include customary conditions as well as any conditions specified by the investment committee. Such conditions could include, but are not limited to, specific confirmatory due diligence, minimum pre-close Adjusted EBITDA, minimum capitalization, satisfactory documentation, satisfactory legal due diligence and absence of material adverse change. Unless specified by the investment committee as a condition to approval, commitment letters need not include final investment committee approval as a condition precedent.
Documentation
Once an investment opportunity has been approved, negotiation of definitive legal documents occurs, usually simultaneously with completion of any third-party confirmatory due diligence. Typically, legal documentation will be reviewed by Barings GPFG’s internal legal team or by outside legal counsel to ensure that our security interest can be perfected and that all other terms of the definitive loan documents are consistent with the terms approved by the investment committee.
Closing
A closing memorandum is provided to the investment committee. The closing memorandum addresses final investment structure and pricing terms, the sources and uses of funds, any variances from the original approved terms, an update related to the prospect’s financial performance and, if warranted, updates to internal financial models. The closing memorandum also addresses each of the specific conditions to the approval of the investment by the investment committee, including results of confirmatory due diligence with any exceptions or abnormalities
highlighted, and includes an analysis of financial covenants with a comparison to the financial forecast prepared by management.
Portfolio Management and Investment Monitoring
Our portfolio management and investment monitoring processes are overseen by Barings GPFG. Barings GPFG's portfolio management process is designed to maximize risk-adjusted returns and identify non-performing assets well in advance of potentially adverse events in order to mitigate investment losses. Key aspects of the Barings GPFG investment and portfolio management process include:
•Culture of Risk Management. The investment team that approves an investment monitors the investment's performance through repayment. We believe this practice encourages accountability by connecting investment team members with the long-term performance of the investment. This also allows us to leverage the underwriting process, namely the comprehensive understanding of the risk factors associated with the investment that an investment team develops during underwriting. In addition, we foster continuous interaction between investment teams and the investment committee. This frequent communication encourages the early escalation of issues to members of the investment committee to leverage their experience and expertise well in advance of potentially adverse events.
•Ongoing Monitoring. Each portfolio company is assigned to an analyst who is responsible for the ongoing monitoring of the investment. Upon receipt of information (financial or otherwise) relating to an investment, a preliminary review is performed by the analyst in order to assess whether the information raises any issues that require increased attention. Particular consideration is given to information which may impact the value of an asset. In the event that something material is identified, the analyst is responsible for notifying the relevant members of the deal team and investment committee.
12
•Quarterly Portfolio Reviews. All investments are reviewed on at least a quarterly basis. The quarterly portfolio reviews provide a forum to evaluate the current status of each asset and identify any recent or long-term performance trends, either positive or negative, that may affect its current valuation.
•Focus Credit List Reviews. Certain credits are deemed to be on the “Focus Credit List” and are reviewed on a more frequent basis. These reviews typically occur monthly but can occur more or less frequently based on situational factors and the availability of updated information from the company. During these reviews, the investment team provides an update on the situation and discusses potential courses of action with the investment committee to ensure any mitigating steps are taken in a timely manner.
•Sponsor Relationships. We invest primarily in transactions backed by a private equity sponsor and when evaluating investment opportunities, we take into account the strength of the sponsor (e.g., track record, sector expertise, strategy, governance, follow-on investment capacity, relationship with Barings GPFG). Having a strong relationship and staying in close contact with sponsors and management during not only the underwriting process but also throughout the life of the investment allows us to engage the sponsor and management early to address potential covenant breaks or other issues.
•Robust Investment and Portfolio Management System. Barings' investment and portfolio management system serves as the central repository of data used for investment management, including both company-level metrics (e.g., probability of default, Adjusted EBITDA, geography) and asset-level metrics (e.g., price, spread/coupon, seniority). Barings GPFG portfolio management has established a required set of data that analysts must update quarterly, or more frequently when appropriate, in order to produce a one-page summary for each company, known as tearsheets, which are used during quarterly portfolio reviews.
Valuation Process and Determination of Net Asset Value
The most significant estimate inherent in the preparation of our financial statements is the valuation of investments and the related amounts of unrealized appreciation and depreciation of investments recorded. We have a valuation policy, as well as established and documented processes and methodologies for determining the fair values of portfolio company investments on a recurring (quarterly)(at least quarterly) basis in accordance with the 1940 Act and FASB ASC Topic 820, Fair Value Measurements and Disclosures ("ASC Topic 820"). Our current valuation policy and processes were established by Barings and were approved by the Board.
Under ASC Topic 820, there are three levels of valuation inputs, as follows:
Level 1 Inputs – include quoted prices (unadjusted) in active markets for identical assets or liabilities.
Level 2 Inputs – include quoted prices for similar assets and liabilities in active markets, and inputs that are observable for the asset or liability, either directly or indirectly, for substantially the full term of the financial instrument.
Level 3 Inputs – include inputs that are unobservable and significant to the fair value measurement.
A financial instrument is categorized within the ASC Topic 820 valuation hierarchy based upon the lowest level of input to the valuation process that is significant to the fair value measurement. For example, a Level 3 fair value measurement may include inputs that are observable (Levels 1 and 2) and unobservable (Level 3). Therefore, unrealized appreciation and depreciation related to such investments categorized as Level 3 investments within the tables belowin the notes to our consolidated financial statements may include changes in fair value that are attributable to both observable inputs (Levels 1 and 2) and unobservable inputs (Level 3).
13
Our investment portfolio includes certain debt and equity instruments of privately held companies for which quoted prices or other observable inputs falling within the categories of Level 1 and Level 2 are generally not available. In such cases, we determine the fair value of our investments in good faith primarily using Level 3 inputs. In certain cases, quoted prices or other observable inputs exist, and if so, we assess the appropriateness of the use of these third-party quotes in determining fair value based on (i) our understanding of the level of actual transactions used by the broker to develop the quote and whether the quote was an indicative price or binding offer and (ii) the depth and consistency of broker quotes and the correlation of changes in broker quotes with underlying performance of the portfolio company.
There is no single standard for determining fair value in good faith, as fair value depends upon the specific circumstances of each individual investment. The recorded fair values of our Level 3 investments may differ significantly from fair values that would have been used had an active market for the securities existed. In addition, changes in the market environment and other events that may occur over the life of the investments may cause the gains or losses ultimately realized on these investments to be different than the valuations currently assigned. For a discussion of the risks inherent in determining the value of securities for which readily available market values do not exist, see “Risk Factors — Risks Relating to Our Business and Structure — Our investment portfolio is and will continue to be recorded at fair value as determined in good faith by ourthe Board of Directors and, as a result, there is and will continue to be uncertainty as to the value of our portfolio investments” included in Item 1A of Part I of this Annual Report on Form 10-K.
Investment Valuation Process
Barings has established a Pricing Committeepricing committee that is, subject to the oversight of the Board, responsible for the approval, implementation and oversight of the processes and methodologies that relate to the pricing and valuation of assets we hold. Barings uses internal pricing models, in accordance with internal pricing procedures established by the Pricing Committee,independent third-party providers to price an assetthe portfolio, but in the event an acceptable price cannot be obtained from an approved external source.source, Barings will utilize alternative methods in accordance with internal pricing procedures established by Barings' pricing committee.
At least annually, Barings conducts reviews its valuation methodologies on an ongoing basis and updates are made accordinglyof the primary pricing vendors to meet changesvalidate that the inputs used in the marketplace.vendors’ pricing process are deemed to be market observable. While Barings has established internal controlsis not provided access to ensure our valuationproprietary models of the vendors, the reviews have included on-site walkthroughs of the pricing process, is operating inmethodologies and control procedures for each asset class and level for which prices are provided. The review also includes an effective manner.examination of the underlying inputs and assumptions for a sample of individual securities across asset classes, credit rating levels and various durations, a process Barings (1) maintains valuation and pricing procedures that describe the specific methodology
Our money market fund investments are generally valued using Level 1 inputs and our equity investments listed on an exchange or on the NASDAQ National Market System are valued using Level 1 inputs, using the last quoted sale price of that day. Our syndicated senior secured loans and structured product investments are generally valued using Level 2 inputs.inputs, which are generally valued at the bid quotation obtained from dealers in loans by an independent pricing service. Our senior secured, middle-market, private debt and equity investments willare generally be valued using Level 3 inputs.
For the fourth quarter of 2018,year ended December 31, 2019, we engaged an independent valuation firm to provide third-party valuation consulting services at the end of each fiscal quarter, which consistconsisted of certain limited procedures that we identified and requested the valuation firm to perform (hereinafter referred to as the "Procedures"). The Procedures generally consistconsisted of a review of the quarterly fair values of our middle-market investments, and arewere generally performed with respect to each investment every quarter beginning in the quarter after the investment iswas made.
Beginning with the first quarter of 2020, we revised our valuation process to require that the Procedures generally be performed with respect to each middle-market investment at least once in every calendar year and for
14
new investments, at least once in the twelve-month period subsequent to the initial investment. In addition, the Procedures were generally performed with respect to an investment where there was a significant change in the fair value or performance of the investment.
Beginning with the fourth quarter of 2020, the fair value of loans and equity investments that are not syndicated or for which market quotations are not readily available, including middle-market loans, are generally submitted to independent providers to perform an independent valuation on those loans and equity investments as of the end of each quarter. In certain instances, we may determine that it is not cost-effective, and as a result is not in the stockholders' best interests, to request thean independent valuation firm to perform the Proceduresan independent valuation on certain investments. Such instances include, but are not limited to, situations where the fair value of the investment in the portfolio company is determined to be insignificant relative to the total investment portfolio.
For a further discussion of the Procedures,our valuation procedures, see the section entitled “Critical Accounting Policies and Use of Estimates — Investment Valuation” included in “Management’s Discussion and Analysis of Financial Condition and Results of Operations” included in Item 7 of Part II of this Annual Report on Form 10-K.
Our valuation techniques are based upon both observable and unobservable pricing inputs. Observable inputs reflect market data obtained from independent sources, while unobservable inputs reflect ourthe Company's market assumptions. Our assessment of the significance of a particular input to the fair value measurement in its entirety requires judgment and considers factors specific to the financial instrument. We determine the estimated fair value of our loans and investments using primarily an income approach. Generally, anAn independent pricing service provider is the preferred source of pricing a loan, however, to the extent the independent pricing service provider price is unavailable or not relevant and reliable, we may usewill utilize alternative approaches such as broker quotes.quotes or manual prices. We attempt to maximize the use of observable inputs and minimize the use of unobservable inputs. The availability of observable inputs can vary from investment to investment and is affected by a wide variety of factors, including the type of security, whether the security is new and not yet established in the marketplace, the liquidity of markets and other characteristics particular to the security.
no readily determinable fair values, are reasonably estimated. We also perform back-testing of valuation information obtained from independent pricing service providers and brokers against actual prices received in transactions. In addition to ongoing monitoring and back-testing, we perform due diligence procedures surrounding independent pricing service providers to understand their methodology and controls to support their use in the valuation process.
Quarterly Net Asset Value Determination
We determine the net asset value per share of our common stock on at least a quarterly basis. The net asset value per share is equal to the value of our total assets minus total liabilities and any preferred stock outstanding divided by the total number of shares of common stock outstanding.
Exit Strategies/Refinancing
While we generally exit most investments through the refinancing or repayment of our debt, we typically assist our portfolio companies in developing and planning exit opportunities, including any sale or merger of our portfolio companies. We may also assist in the structure, timing, execution and transition of these exit strategies.
Competition
We compete for investments with a number of investment funds including public funds, private equity funds, other BDCs, as well as traditional financial services companies such as commercial banks and other sources of financing. Some of these entities have greater financial and managerial resources than we do. In addition, some of our competitors may have higher risk tolerances or different risk assessments, which could allow them to consider
15
more investments and establish more relationships than we do. Furthermore, many of our competitors are not subject to the regulatory restrictions that the 1940 Act imposes on us as a BDC.
We use the expertise of the investment professionals of Barings to assess investment risks and determine appropriate pricing for our investments in portfolio companies. We believe the relationship we have with Barings enables us to learn about, and compete for financing opportunities with companies in middle-market businesses that operate across a wide range of industries. For additional information concerning the competitive risks we face, see "Risk Factors — Risks Relating to Our Business and Structure — We operate in a highly competitive market for investment opportunities, which could reduce returns and result in losses" included in Item 1A of Part I of this Annual Report on Form 10-K.
Brokerage Allocation and Other Practices
We did not pay any brokerage commissions during the three years ended December 31, 20192021 in connection with the acquisition and/or disposal of our investments. We generally acquire and dispose of our investments in privately negotiated transactions; therefore, we infrequently use brokers in the normal course of our business. Barings is primarily responsible for the execution of any publicly traded securities portion of our portfolio transactions and the allocation of brokerage commissions. We do not expect to execute transactions through any particular broker or dealer, but will seek to obtain the best net results for us, taking into account such factors as price (including the applicable brokerage commission or dealer spread), size of order, difficulty of execution, and operational facilities of the firm and the firm’s risk and skill in positioning blocks of securities. While we will generally seek reasonably competitive trade execution costs, we will not necessarily pay the lowest spread or commission available. Subject to applicable legal requirements, if we use a broker, we may select a broker based partly upon brokerage or research services provided to us. In return for such services, we may pay a higher commission than other brokers would charge if we determine in good faith that such commission is reasonable in relation to the services provided.
Dividend Reinvestment Plan
We have adopted a dividend reinvestment plan that provides for reinvestment of our distributions on behalf of our common stockholders, unless a common stockholder elects to receive cash as provided below. As a result, if the Board authorizes, and we declare, a cash dividend, then our common stockholders who have not “opted out” of our dividend reinvestment plan will have their cash dividends automatically reinvested in additional shares of our common stock, rather than receiving the cash dividends.
No action will be required on the part of a registered common stockholder to have his or her cash dividend reinvested in shares of our common stock. A registered common stockholder may elect to receive an entire dividend in cash by notifying Computershare, Inc., the “Plan Administrator” and our transfer agent and registrar, in writing so that such notice is received by the Plan Administrator no later than three days prior to the recordpayment date fixed by the Board for dividends to common stockholders.the dividend. The Plan Administrator will set up an account for shares acquired through the plan for each common stockholder who has not elected to receive dividends in cash and hold such shares in non-certificated form. Upon request by a common stockholder participating in the plan, received in writing not less than 10three days prior to the recordpayment date, the Plan Administrator will, instead of crediting shares to the participant’s account, issue a certificate registered in the participant’s name for the number of whole shares of our common stock and a check for any fractional share. Those common stockholders whose shares are held by a broker or other financial intermediary may receive dividends in cash by notifying their broker or other financial intermediary of their election.
16
We intend to use primarily newly issued shares to implement the plan, so long as our shares are trading at or above net asset value. If our shares are trading below net asset value, we intend to purchase shares in the open market in connection with our implementation of the plan. If we use newly issued shares to implement the plan, the number of shares to be issued to a common stockholder is determined by dividing the total dollar amount of the dividend payable to such common stockholder by the market price per share of our common stock at the close of regular trading on the NYSE on the dividend payment date. Market price per share on that date will be the closing price for such shares on the NYSE or, if no sale is reported for such day, at the average of their reported bid and asked prices. If we purchase shares in the open market to implement the plan, the number of shares to be issued toreceived by a common stockholder is determined by dividing the total dollar amount of the dividend payable to such common stockholder by the average price per share for all shares purchased by the Plan Administrator in the open market in connection with the dividend. The number of shares of our common stock to be outstanding after giving effect to payment of the dividend cannot be established until the value per share at which additional shares will be issued has been determined and elections of our common stockholders have been tabulated.
There will be no brokerage charges or other charges to common stockholders who participate in the plan. However, certain brokerage firms may charge brokerage charges or other charges to their customers. We will pay the Plan Administrator’s fees under the plan. If a participant elects by written notice to the Plan Administrator to have the Plan Administrator sell part or all of the shares held by the Plan Administrator in the participant’s account and remit the proceeds to the participant, the Plan Administrator is authorized to deduct a $15.00 transaction fee plus a $0.10 per share brokerage commission from the proceeds.
Common stockholders who receive dividends in the form of stock generally are subject to the same federal, state and local tax consequences as are common stockholders who elect to receive their dividends in cash. A common stockholder’s basis for determining gain or loss upon the sale of stock received in a dividend from us will be equal to the total dollar amount of the dividend payable to the common stockholder. Any stock received in a dividend will have a holding period for tax purposes commencing on the day following the day on which the shares are credited to the U.S. common stockholder’s account. Stock received in a dividend may generate a wash sale if such shareholder sold out stock at a realized loss within 30 days either before or after such dividend.
Participants may terminate their accounts under the plan by notifying the Plan Administrator via its website at www.computershare.com/investor, by filling out the transaction request form located at the bottom of their statement and sending it to the Plan Administrator at Computershare, Inc., P.O. Box 505000, Louisville, Kentucky 40233 or by calling the Plan Administrator at (866) 228-7201.
We may terminate the plan upon notice in writing mailed to each participant at least 30 days prior to any record date for the payment of any dividend by us. All correspondence concerning the plan should be directed to the Plan Administrator by mail at Computershare, Inc., P.O. Box 505000, Louisville, Kentucky 40233.
Employees
We do not currently have any employees and do not expect to have any employees. The services necessary for our business are provided by individuals who are employees of Barings, pursuant to the terms of ourthe Amended and Restated Advisory Agreement and our Administration Agreement. Each of our executive officers is an employee of Barings and our day-to-day investment activities are managed by Barings. In addition, as of December 31, 2019, we employed two administrative professionals.
Management Agreements
On August 2, 2018, we entered into the Original Advisory Agreement and the Administration Agreement with Barings, an investment adviser registered under the Advisers Act. Our then-current board of directors unanimously approved the Original Advisory Agreement at an in-person meeting on March 22, 2018. Our stockholders approved the Original Advisory Agreement at the 2018 Special Meeting. In connection with the MVC Acquisition, we entered into the Amended and Restated Advisory Agreement on December 23, 2020, following approval of the Amended and Restated Advisory Agreement by our stockholders at our December 23, 2020 special meeting of stockholders. The Amended and Restated Advisory Agreement was approved on September 9, 2020 by the then-current Board, including a majority of the directors on the Board who are not “interested persons,” as defined in Section 2(a)(19) of
17
the 1940 Act, of the Company or Barings. The terms of the Amended and Restated Advisory Agreement became effective on January 1, 2021.
Investment Advisory Agreement
Pursuant to the Amended and Restated Advisory Agreement, Barings manages our day-to-day operations and provides us with investment advisory services. Among other things, Barings (i) determines the composition of our portfolio, the nature and timing of the changes therein and the manner of implementing such changes; (ii) identifies, evaluates and negotiates the structure of our investments; (iii) executes, closes, services and monitors the investments that we make; (iv) determines the securities and other assets that we will purchase, retain or sell; (v) performs due diligence on prospective portfolio companies and (vi) provides us with such other investment advisory, research and related services as we may, from time to time, reasonably require for the investment of ourits funds.
The Amended and Restated Advisory Agreement provides that, absent fraud, willful misfeasance, bad faith or gross negligence in the performance of its duties or by reason of the reckless disregard of its duties and obligations, Barings, and its officers, managers, partners, agents, employees, controlling persons, members and any other person or entity affiliated with Barings (collectively, the "IA Indemnified Parties"), are entitled to indemnification from us for any damages, liabilities, costs, demands, charges, claims and expenses (including reasonable attorneys’ fees and amounts reasonably paid in settlement) incurred by the IA Indemnified Parties in or by reason of any pending, threatened or completed action, suit, investigation or other proceeding (including an action or suit by or in the right of us or our security holders) arising out of any actions or omissions or otherwise based upon the performance of any of Barings' duties or obligations under the Amended and Restated Advisory Agreement or otherwise as our investment adviser. Barings' services under the Amended and Restated Advisory Agreement are not exclusive, and Barings is generally free to furnish similar services to other entities so long as its performance under the Amended and Restated Advisory Agreement is not adversely affected.
Barings has entered into a personnel-sharing arrangement with its affiliate, BaringsBaring International Investment Limited ("BIIL"). BIIL is a wholly-owned subsidiary of Baring Asset Management Limited, which in turn is an indirect, wholly-owned subsidiary of Barings. Pursuant to this arrangement, certain employees of BIIL may serve as "associated persons" of Barings and, in this capacity, subject to the oversight and supervision of Barings, may provide research and related services, and discretionary investment management and trading services (including acting as portfolio managers) to us on behalf of Barings. This arrangement is based on no-action letters of the staff of the SEC that permit SEC-registered investment advisers to rely on and use the resources of advisory affiliates or "participating affiliates," subject to the supervision of that SEC-registered investment adviser. BIIL is a "participating affiliate" of Barings, and the BIIL employees are "associated persons" of Barings.
Under the Amended and Restated Advisory Agreement, we pay Barings (i) a base management fee (the "Base Management Fee") and (ii) an incentive fee (the "Incentive Fee") as compensation for the investment advisory and management services it provides us thereunder.
Pre-January 1, 2021 Base Management Fee
Base Management Fee was 1.125% for the period commencing on January 1, 2019 through December 31, 2019; and
The Base Management Fee iswas payable quarterly in arrears on a calendar quarter basis. The Base Management Fee was calculated based on the average value of our gross assets, excluding cash and cash equivalents, at the end of the two most recently completed calendar quarters prior to the quarter for which such fees are being calculated. Base Management Fees for any partial month or quarter were appropriately pro-rated.
Post-December 31, 2020 Base Management Fee
Beginning January 1, 2021, the Base Management Fee is calculated based on our gross assets, including the MVC Credit Support Agreement, assets purchased with borrowed funds or other forms of leverage and excluding cash and cash equivalents, at an annual rate of 1.25%. The Base Management Fee is payable quarterly in arrears on a
18
calendar quarter basis, and is calculated based on the average value of our gross assets, excluding cash and cash equivalents, at the end of the two most recently completed calendar quarters prior to the quarter for which such fees are being calculated. Base Management Fees for any partial month or quarter arewill be appropriately pro-rated.
Pre-January 1, 2021 Incentive Fee
The Pre-2021 Income-Based Fee iswas calculated as follows:
(i)For each quarter from and after August 2, 2018 through December 31, 2019 (the "Pre-2020 Period"), the Pre-2021 Income-Based Fee was calculated and payable quarterly in arrears based on the Pre-Incentive Fee Net Investment Income for the immediately preceding calendar quarter for which such fees were being calculated. In respect of the Pre-2020 Period, "Pre-Incentive Fee Net Investment Income" meant interest income, dividend income and any other income (including any other fees, such as commitment, origination, structuring, diligence, managerial assistance and consulting fees or other fees that we receive from portfolio companies) accrued during the relevant calendar quarter, minus our operating expenses for such quarter (including the Base Management Fee, expenses payable under the Administration Agreement, any interest expense and any dividends paid on any issued and outstanding preferred stock, but excluding the Incentive Fee). Pre-Incentive Fee Net Investment Income included, in the case of investments with a deferred interest feature (such as original issue discount, debt instruments with payment-in-kind interest and zero coupon securities), accrued income not yet received in cash. Pre-Incentive Fee Net Investment Income did not include any realized capital gains, realized capital losses or unrealized capital appreciation or depreciation.
(ii)For each quarter beginning on and after January 1, 2020 (the "Post-2019 Period"), the Pre-2021 Income-Based Fee was calculated and payable quarterly in arrears based on the Pre-Incentive Fee Net Investment Income for the immediately preceding calendar quarter and the eleven preceding calendar quarters (or such fewer number of preceding calendar quarters counting each calendar quarter beginning on or after January 1, 2020) (each such period referred to as the "Pre-2021 Trailing Twelve Quarters") for which such fees were being calculated and was payable promptly following the filing of the Company’s financial statements for such quarter. In respect of the Post-2019 Period, "Pre-Incentive Fee Net Investment Income" meant interest income, dividend income and any other income (including any other fees, such as commitment, origination, structuring, diligence, managerial assistance and consulting fees or other fees that we receive from portfolio companies) accrued during the relevant Pre-2021 Trailing Twelve Quarters, minus our operating expenses for such Pre-2021 Trailing Twelve Quarters (including the Base Management Fee, expenses payable under the Administration Agreement, any interest expense and any dividends paid on any issued and outstanding preferred stock, but excluding the Incentive Fee) divided by the number of quarters that comprise the relevant Pre-2021 Trailing Twelve Quarters. Pre-Incentive Fee Net Investment Income included, in the case of investments with a deferred interest feature (such as original issue discount, debt instruments with payment-in-kind interest and zero coupon securities), accrued income not yet received in cash. Pre-Incentive Fee Net Investment Income did not include any realized capital gains, realized capital losses or unrealized capital appreciation or depreciation.
(iii)Pre-Incentive Fee Net Investment Income, expressed as a rate of return on the value of our net assets (defined as total assets less senior securities constituting indebtedness and preferred stock) at the end of the calendar quarter for which such fees were being calculated, was compared to a "hurdle rate", expressed as a rate of return on the value of our net assets at the end of the most recently completed calendar quarter, of 2% per quarter (8% annualized). We paid Barings the Pre-2021 Income-Based Fee with respect to our Pre-Incentive Fee Net Investment Income in each calendar quarter as follows:
19
(1)(a) With respect to the Pre-2020 Period, no Pre-2021 Income-Based Fee for any calendar quarter in which our Pre-Incentive Fee Net Investment Income (as defined in paragraph (i) above) did not exceed the hurdle rate;
(b) With respect to the Post-2019 Period, no Pre-2021 Income-Based Fee for any calendar quarter in which our Pre-Incentive Fee Net Investment Income (as defined in paragraph (ii) above) doesdid not exceed the hurdle rate;
(2)(a) With respect to the Pre-2020 Period, 100% of our Pre-Incentive Fee Net Investment Income (as defined in paragraph (i) above) for any calendar quarter with respect to that portion of the Pre-Incentive Fee Net Investment Income for such quarter, if any, that exceeded the hurdle rate but was less than 2.5% (10% annualized) (the "Pre-2020 Catch-Up Amount"). The Pre-2020 Catch-Up Amount was intended to provide Barings with an incentive fee of 20% on all of our Pre-Incentive Fee Net Investment Income (as defined in paragraph (i) above) when our Pre-Incentive Fee Net Investment Income (as defined in paragraph (i) above) reached 2% per quarter (8% annualized);
(b) With respect to the Post-2019 Period, 100% of our Pre-Incentive Fee Net Investment Income (as defined in paragraph (ii) above) with respect to that portion of the Pre-Incentive Fee Net Investment Income (as defined in paragraph (ii) above), if any, that exceedsexceeded the hurdle rate but iswas less than 2.5% (10% annualized) (the "Post-2019 Catch-Up Amount"). The Post-2019 Catch-Up Amount iswas intended to provide Barings with an incentive fee of 20% on all of our Pre-Incentive Fee Net Investment Income (as defined in paragraph (ii) above) when our Pre-Incentive Fee Net Investment Income (as defined in paragraph (ii) above) reachesreached 2% per quarter (8% annualized);
(3)(a) With respect to the Pre-2020 Period, 20% of the amount of our Pre-Incentive Fee Net Investment Income (as defined in paragraph (i) above) for any calendar quarter with respect to that portion of the Pre-Incentive Fee Net Investment Income (as defined in paragraph (i) above) for such quarter, if any, that exceeded the Pre-2020 Catch-Up Amount; and
(b) With respect to the Post-2019 Period, 20% of the amount of our Pre-Incentive Fee Net Investment Income (as defined in paragraph (ii) above) for any calendar quarter with respect to that portion of the Pre-Incentive Fee Net Investment Income (as defined in paragraph (ii) above), if any, that exceedsexceeded the Post-2019 Catch-Up Amount.
However, with respect to the Post-2019 Period, the Pre-2021 Income-Based Fee paid to Barings will notwould in no event be in excess of the Pre-2021 Incentive Fee Cap. With respect to the Post-2019 Period, the "Incentive"Pre-2021 Incentive Fee Cap" for any quarter iswas an amount equal to (a) 20% of the Cumulative Net Return (as defined below) during the relevant Pre-2021 Trailing Twelve Quarters minus (b) the aggregate Pre-2021 Income-Based Fee that was paid in respect of the first eleven calendar quarters (or the portion thereof) included in the relevant Pre-2021 Trailing Twelve Quarters.
Cumulative Net Return meansmeant (x) the aggregate net investment income in respect of the relevant Pre-2021 Trailing Twelve Quarters minus (y) any Net Capital Loss (as defined below), if any, in respect of the relevant Pre-2021 Trailing Twelve Quarters. If, in any quarter, the Pre-2021 Incentive Fee Cap iswas zero or a negative value, we paypaid no Pre-2021 Income-Based Fee to Barings for such quarter. If, in any quarter, the Pre-2021 Incentive Fee Cap for such quarter iswas a positive value but iswas less than the Pre-2021 Income-Based Fee that iswas payable to Barings for such quarter (before giving effect to the Pre-2021 Incentive Fee Cap) calculated as described above, we pay anpaid a Pre-2021 Income-Based Fee to Barings equal to the Pre-2021 Incentive Fee Cap for such quarter. If, in any quarter, the Pre-2021 Incentive Fee Cap for such quarter iswas equal to or greater than the Income-BasedPre-2021Income-Based Fee that iswas payable to Barings for such quarter (before giving effect to the Pre-2021 Incentive Fee Cap) calculated as described above, we pay anpaid a Pre-2021 Income-Based Fee to Barings equal to the Pre-2021 Income-Based Fee calculated as described above for such quarter without regard to the Pre-2021 Incentive Fee Cap.
Net Capital Loss in respect of a particular period meansmeant the difference, if positive, between (i) aggregate capital losses, whether realized or unrealized, in such period and (ii) aggregate capital gains, whether realized or unrealized, in such period.
20
The Pre-2021 Capital Gains Fee was determined and payable in arrears as of the end of each calendar year, commencing with the calendar year ended on December 31, 2018, and was calculated at the end of each applicable year by subtracting (1) the sum of our cumulative aggregate realized capital losses and aggregate unrealized capital depreciation from (2) our cumulative aggregate realized capital gains, in each case calculated from August 2, 2018. If such amount was positive at the end of such year, then the Pre-2021 Capital Gains Fee payable for such year was equal to 20% of such amount, less the cumulative aggregate amount of Pre-2021 Capital Gains Fees paid in all prior years. If such amount was negative, then there was no Pre-2021 Capital Gains Fee payable for such year.
Post-December 31, 2020 Incentive Fee
Beginning January 1, 2021, the Incentive Fee continues to consist of two components that are independent of each other, with the result that one component may be payable even if the other is not. Under the Amended and Restated Advisory Agreement, a portion of the Incentive Fee is based on our income (the “ Income-Based Fee”) and a portion is based on our capital gains (the “Capital Gains Fee ”), each as described below:
(i) The Income-Based Fee will be determined and paid quarterly in arrears based on the amount by which (x) the aggregate “Pre-Incentive Fee Net Investment Income” (as defined below) in respect of the current calendar quarter and the eleven preceding calendar quarters beginning with the calendar quarter that commences on or after January 1, 2021, as the case may be (or the appropriate portion thereof in the case of any of our first eleven calendar quarters that commences on or after January 1, 2021) (in either case, the “Trailing Twelve Quarters”) exceeds (y) the Hurdle Amount (as defined below) in respect of the Trailing Twelve Quarters. The Hurdle Amount will be determined on a quarterly basis, and will be calculated by multiplying 2.0% (8% annualized) by the aggregate of our net asset value at the beginning of each applicable calendar quarter comprising the relevant Trailing Twelve Quarters. For this purpose, under the Amended and Restated Advisory Agreement, “Pre-Incentive Fee Net Investment Income” means interest income, dividend income and any other income (including, without limitation, any accrued income that we have not yet received in cash and any other fees such as commitment, origination, structuring, diligence and consulting fees or other fees that we receive from portfolio companies) accrued during the calendar quarter, minus our operating expenses accrued during the calendar quarter (including, without limitation, the Base Management Fee, administration expenses and any interest expense and dividends paid on any issued and outstanding preferred stock, but excluding the Income-Based Fee and the Capital Gains Fee). For the avoidance of doubt, Pre-Incentive Fee Net Investment Income does not include any realized capital gains, realized capital losses or unrealized capital appreciation or depreciation.
The calculation of the Income-Based Fee for each quarter is as follows:
(A) No Income-Based Fee will be payable to Barings in any calendar quarter in which our aggregate Pre-Incentive Fee Net Investment Income for the Trailing Twelve Quarters does not exceed the Hurdle Amount;
(B) 100% of our aggregate Pre-Incentive Fee Net Investment Income for the Trailing Twelve Quarters, if any, that exceeds the Hurdle Amount but is less than or equal to an amount (the “Catch-Up Amount”) determined on a quarterly basis by multiplying 2.5% (10% annualized) by our net asset value at the beginning of each applicable calendar quarter comprising the relevant Trailing Twelve Quarters. The Catch-Up Amount is intended to provide Barings with an incentive fee of 20% on all of our Pre-Incentive Fee Net Investment Income when our Pre-Incentive Fee Net Investment Income reaches the Catch-Up Amount for the Trailing Twelve Quarters; and
(C) For any quarter in which our aggregate Pre-Incentive Fee Net Investment Income for the Trailing Twelve Quarters exceeds the Catch-Up Amount, the Income-Based Fee shall equal 20% of the amount of our Pre-Incentive Fee Net Investment Income for such Trailing Twelve Quarters, as the Hurdle Amount and Catch-Up Amount will have been achieved.
Subject to the Incentive Fee Cap described below, the amount of the Income-Based Fee that will be paid to Barings for a particular quarter will equal the excess of the aggregate Income-Based Fee so calculated less the
21
aggregate Income-Based Fees that were paid to Barings in the preceding eleven calendar quarters (or portion thereof) comprising the relevant Trailing Twelve Quarters.
(ii) The Income-Based Fee is subject to a cap (the “Incentive Fee Cap”). The Incentive Fee Cap in any quarter is an amount equal to (a) 20% of the Cumulative Pre-Incentive Fee Net Return (as defined below) during the relevant Trailing Twelve Quarters less (b) the aggregate Income-Based Fee that were paid to Barings in the preceding eleven calendar quarters (or portion thereof) comprising the relevant Trailing Twelve Quarters. For this purpose, “Cumulative Pre-Incentive Fee Net Return” during the relevant Trailing Twelve Quarters means (x) Pre-Incentive Fee Net Investment Income in respect of the Trailing Twelve Quarters less (y) any Net Capital Loss, if any, in respect of the Trailing Twelve Quarters. If, in any quarter, the Incentive Fee Cap is zero or a negative value, we will pay no Income-Based Fee to Barings in that quarter. If, in any quarter, the Incentive Fee Cap is a positive value but is less than the Income-Based Fee calculated in accordance with paragraph (i) above, we will pay Barings the Incentive Fee Cap for such quarter. If, in any quarter, the Incentive Fee Cap is equal to or greater than the Income-Based Fee calculated in accordance with paragraph (i) above, we will pay Barings the Income-Based Fee for such quarter.
“Net Capital Loss” in respect of a particular period means the difference, if positive, between (i) aggregate capital losses on our assets, whether realized or unrealized, in such period and (ii) aggregate capital gains or other gains on our assets (including, for the avoidance of doubt, the value ascribed to any credit support arrangement in our financial statements even if such value is not categorized as a gain therein), whether realized or unrealized, in such period.
(iii) The second part of the Incentive Fee (the “Capital Gains Fee”) will be determined and payable in arrears as of the end of each calendar year (or upon termination of the Amended and Restated Advisory Agreement), commencing with the calendar year endingended on December 31, 2018, and is calculated at the end of each applicable year by subtracting (1) the sum of our cumulative aggregate realized capital losses and aggregate unrealized capital depreciation from (2) our cumulative aggregate realized capital gains, in each case calculated from August 2, 2018. If such amount is positive at the end of such year, then the Capital Gains
Fee payable for such year is equal to 20% of such amount, less the cumulative aggregate amount of Capital Gains Fees paid in all prior years.years commencing with the calendar year ended on December 31, 2018. If such amount is negative, then there is no Capital Gains Fee payable for such year. If the Advisorythis Agreement is terminated as of a date that is not a calendar year end, the termination date will be treated as though it were a calendar year end for purposes of calculating and paying a Capital Gains Fee.
Under the Amended and Restated Advisory Agreement, the "cumulative aggregate realized capital gains" are calculated as the sum of the differences, if positive, between (a) the net sales price of each investment in our portfolio when sold and (b) the accreted or amortized cost basis of such investment.
The "cumulative aggregate realized capital losses" are calculated as the sum of the differences, if negative, between (a) the net sales price of each investment in our portfolio when sold and (b) the accreted or amortized cost basis of such investment.
The "aggregate unrealized capital depreciation" is calculated as the sum of the differences, if negative, between (a) the valuation of each investment in our portfolio as of the applicable Capital Gains Fee calculation date and (b) the accreted or amortized cost basis of such investment.
Under the Amended and Restated Advisory Agreement, the “accreted or amortized cost basis of an investment” shall mean the accreted or amortized cost basis of such investment as reflected in our financial statements.
Payment of Company Expenses
Under the Amended and Restated Advisory Agreement, all investment professionals of Barings and its staff, when and to the extent engaged in providing services required to be provided by Barings under the Amended and Restated Advisory Agreement, and the compensation and routine overhead expenses of such personnel allocable to
22
such services, are provided and paid for by Barings and not by us, except that all costs and expenses relating to our operations and transactions, including, without limitation, those items listed in the Amended and Restated Advisory Agreement, will be borne by us.
Duration and Termination of Amended and Restated Advisory Agreement
The Amended and Restated Advisory Agreement has an initial term of two years, or until August 2, 2020.December 23, 2022. Thereafter, it will continue to renew automatically for successive annual periods, so long as such continuance is specifically approved at least annually by: (i)by (A) the vote of the Board, or by the vote of stockholders holding a majority of our outstanding voting securities;securities and (ii)(B) the vote of a majority of our independent directors in either case, in accordance with the requirements of the 1940 Act. The Amended and Restated Advisory Agreement will automatically terminate in the event of its “assignment,” as such term is defined under the 1940 Act, and may be terminated at any time, without the payment of any penalty, upon 60 days’ written notice, by: (a)(i) by vote of a majority of the Board or by vote of a majority of our outstanding voting securities, (as defined in(ii) by the 1940 Act); or (b) Barings. Furthermore, the Advisory Agreement will automatically terminate in the event of its "assignment" (as such term is defined for purposes of Section 15(a)(4)vote of the 1940 Act).Board, or (iii) by Barings.
Administration Agreement
Under the terms of the Administration Agreement, Barings performs (or oversees, or arranges for, the performance of) the administrative services necessary for our operation, including, but not limited to, office facilities, equipment, clerical, bookkeeping and record-keeping services at such office facilities and such other services as Barings, subject to review by the Board, from time to time, determines to be necessary or useful to perform its obligations under the Administration Agreement. Barings also, on our behalf and subject to oversight by the Board, arranges for the services of, and oversees, custodians, depositories, transfer agents, dividend disbursing agents, other stockholder servicing agents, accountants, attorneys, valuation experts, underwriters, brokers and dealers, corporate fiduciaries, insurers, banks and such other persons in any such other capacity deemed to be necessary or desirable.
We are required towill reimburse Barings for the costs and expenses incurred and billed to us by Baringsit in performing its obligations and providing personnel and facilities under the Administration Agreement or such lesserin an amount as mayto be negotiated and mutually agreed to in writing by us and Barings from time to time. If we and Barings agree to a reimbursementquarterly in arrears. In no event will the agreed-upon quarterly expense amount for any period which is less thanexceed the full amount of expenses that would otherwise permittedbe reimbursable by us under the Administration Agreement thenfor the applicable quarterly period, and Barings will not be entitled to recoupthe recoupment of any difference thereofamounts in any subsequent period or otherwise.excess of the agreed-upon quarterly expense amount. The costs and expenses incurred by Barings on our behalf under the Administration Agreement include, but are not limited to:
•the allocable portion of Barings' rent for our Chief Financial Officer and Chief Compliance Officer and their respective staffs, which is based upon the allocable portion of the usage thereof by such personnel in connection with their performance of administrative services under the Administration Agreement;
•the allocable portion of the salaries, bonuses, benefits and expenses of our Chief Financial Officer and Chief Compliance Officer and their respective staffs, which is based upon the allocable portion of the time spent by such personnel in connection with performing administrative services for us under the Administration Agreement;
•the actual cost of goods and services used for us and obtained by Barings from entities not affiliated with us, which is reasonably allocated to us on the basis of assets, revenues, time records or other methods conforming with generally accepted accounting principles;
•all fees, costs and expenses associated with the engagement of a sub-administrator, if any; and
•costs associated with (a) the monitoring and preparation of regulatory reporting, including registration statements and amendments thereto, prospectus supplements, and tax reporting, (b) the coordination and oversight of service provider activities and the direct cost of such contractual matters related thereto and (c) the preparation of all financial statements and the coordination and oversight of audits, regulatory inquiries, certifications and sub-certifications.
23
The Administration Agreement has an initial term of two years, or until August 2, 2020, and thereafter will continue automatically for successive annual periods so long as such continuance is specifically approved at least annually by the Board, including a majority of the independent directors. The Administration Agreement may be terminated at any time, without the payment of any penalty, by vote of our directors,the Board, or by Barings, upon 60 days’ written notice to the other party. The Administration Agreement may not be assigned by a party without the consent of the other party.
Election to be Regulated as a Business Development Company and Regulated Investment Company
We are a closed-end, non-diversified management investment company that has elected to be treated as a BDC under the 1940 Act. In addition, we have elected to be treated as a RIC under Subchapter M of the Code. Our election to be regulated as a BDC and our election to be treated as a RIC for U.S. federal income tax purposes have a significant impact on our operations. Some of the most important effects on our operations of our election to be regulated as a BDC and our election to be treated as a RIC are outlined below.
•We report our investments at market value or fair value with changes in value reported through our consolidated statements of operations.
In accordance with the requirements of Article 6 of Regulation S-X, we report all of our investments, including debt investments, at market value or, for investments that do not have a readily available market value, at their “fair value” as determined in good faith by the Board. Changes in these values are reported through our statements of operations under the caption of “net unrealized appreciation (depreciation) of investments.” See “Valuation“—Valuation Process and Determination of Net Asset Value” above.
•We intend to distribute substantially all of our income to our stockholders. We generally will be required to pay income taxes only on the portion of our taxable income we do not distribute, actually or constructively, to stockholders.
As a RIC, so long as we meet certain minimum distribution, source-of-income and asset diversification requirements, we generally are required to pay U.S. federal income taxes only on the portion of our taxable income and gains we do not distribute (actually or constructively) and certain built-in gains. We intend to distribute to our stockholders substantially all of our income. We may, however, make deemed distributions to our stockholders of any retained net long-term capital gains. If this happens, our stockholders will be treated as if they received an actual distribution of the net capital gains and reinvested the net after-tax proceeds in us. Our stockholders also may be eligible to claim a tax credit (or, in certain circumstances, a tax refund) equal to their allocable share of the corporate-level U.S. federal income tax we pay on the deemed distribution. See “Material U.S. Federal Income Tax Considerations.” We met the minimum distribution requirements for 2017, 20182019, 2020 and 20192021 and continually monitor our distribution requirements with the goal of ensuring compliance with the Code.
In addition, we have one wholly-owned taxable subsidiary,subsidiaries, or the Taxable Subsidiary,Subsidiaries, which holdshold a portion of one or more of our portfolio investments that are listed on the Consolidated Schedule of Investments. The Taxable Subsidiary isSubsidiaries are consolidated for financial reporting purposes in accordance with U.S. GAAP, so that our consolidated financial statements reflect our investments in the portfolio companies owned by the Taxable Subsidiary.Subsidiaries. The purpose of the Taxable SubsidiarySubsidiaries is to permit us to hold certain interests in portfolio companies that are organized as partnerships or limited liability companies, or LLCs (or other forms of pass-
24
•Our ability to use leverage as a means of financing our portfolio of investments is limited.
As a BDC, and as a result of the stockholder vote to approve the proposal to authorize us to be subject to the reduced asset coverage ratio of at least 150% under the 1940 Act, we are required to meet a coverage ratio of total assets to total senior securities of at least 150%. For this purpose, senior securities include all borrowings and any preferred stock we may issue in the future. Additionally, our ability to continue to utilize leverage as a means of financing our portfolio of investments may be limited by this asset coverage test.
•We are required to comply with the provisions of the 1940 Act applicable to business development companies.
As a BDC, we are required to have a majority of directors who are not “interested” persons“interested persons" under the 1940 Act. In addition, we are required to comply with other applicable provisions of the 1940 Act, including those requiring the adoption of a code of ethics, fidelity bonding and investment custody arrangements. See “Regulation of Business Development Companies” below.
Exemptive Relief
As a BDC, we are required to comply with certain regulatory requirements. For example, we generally are not permitted to make loans to companies controlled by Barings or other funds managed by Barings. We are also not permitted to make any co-investments with Barings or its affiliates (including any fund managed by Barings or an investment adviser controlling, controlled by or under common control with Barings) without exemptive relief from the SEC, subject to certain exceptions. The Exemptive Relief that the SEC has granted to Barings permits certain present and future funds, including us, advised by Barings (or an investment adviser controlling, controlled by or under common control with Barings) to co-invest in suitable negotiated investments. Co-investments made under the Exemptive Relief are subject to compliance with the conditions and other requirements contained in the Exemptive Relief, which could limit our ability to participate in a co-investment transaction.
Regulation of Business Development Companies
The following is a general summary of the material regulatory provisions affecting BDCs. It does not purport to be a complete description of all of the laws and regulations affecting BDCs.
We have elected to be regulated as a BDC under the 1940 Act. The 1940 Act contains prohibitions and restrictions relating to transactions between BDCs and their affiliates, principal underwriters and affiliates of those affiliates or underwriters. The 1940 Act requires that a majority of the directors on a BDC's board of directors be persons other than “interested persons,” as that term is defined in the 1940 Act. In addition, the 1940 Act provides that we may not change the nature of our business so as to cease to be, or to withdraw our election as, a BDC unless approved by a majority of our outstanding voting securities.
In addition, the 1940 Act defines “a majority of the outstanding voting securities” as the lesser of (i) 67.0% or more of the voting securities present at a meeting if the holders of more than 50.0% of our outstanding voting securities are present or represented by proxy, or (ii) 50.0% of our voting securities.
Qualifying Assets
Under the 1940 Act, a BDC may not acquire any asset other than assets of the type listed in Section 55(a) of the 1940 Act, which are referred to as qualifying assets, unless, at the time the acquisition is made, qualifying assets represent at least 70.0% of the company’s total assets. The principal categories of qualifying assets relevant to our business are any of the following:
(1) Securities purchased in transactions not involving any public offering from the issuer of such securities, which issuer (subject to certain limited exceptions) is an eligible portfolio company, or from any person who is, or has been during the preceding 13 months, an affiliated person of an eligible portfolio company, or from any other person, subject to such rules as may be prescribed by the SEC. An eligible portfolio company is defined in the 1940 Act and rules adopted pursuant thereto as any issuer which:
(a) is organized under the laws of, and has its principal place of business in, the United States;
25
(b) is not an investment company (other than an SBIC wholly-owned by the BDC) or a company that would be an investment company but for exclusions under the 1940 Act for certain financial companies such as banks, brokers, commercial finance companies, mortgage companies and insurance companies; and
(c) satisfies any of the following:
(i) does not have any class of securities with respect to which a broker or dealer may extend margin credit;
(ii) is controlled by a BDC or a group of companies including a BDC and the BDC has an affiliated person who is a director of the eligible portfolio company;
(iii) is a small and solvent company having total assets of not more than $4.0 million and capital and surplus of not less than $2.0 million;
(iv) does not have any class of securities listed on a national securities exchange; or
(v) has a class of securities listed on a national securities exchange, but has an aggregate market value of outstanding voting and non-voting common equity of less than $250.0 million.
(2) Securities in companies that were eligible portfolio companies when we made our initial investment if certain other requirements are satisfied.
(3) Securities of any eligible portfolio company that we control.
(4) Securities purchased in a private transaction from a U.S. issuer that is not an investment company or from an affiliated person of the issuer, or in transactions incident thereto, if the issuer is in bankruptcy and subject to reorganization or if the issuer, immediately prior to the purchase of its securities, was unable to meet its obligations as they came due without material assistance (other than conventional lending or financing arrangements).
(5) Securities of an eligible portfolio company purchased from any person in a private transaction if there is no ready market for such securities and we already own 60.0% of the outstanding equity of the eligible portfolio company.
(6) Securities received in exchange for or distributed on or with respect to securities described in (1) through (5) above, or pursuant to the exercise of warrants or rights relating to such securities.
(7) Cash, cash equivalents, U.S. government securities or high-quality debt securities maturing in one year or less from the time of investment.
In addition, a BDC must have been organized and have its principal place of business in the United States and must be operated for the purpose of making investments in the types of securities described in (1), (2), (3) or (4) above.
Managerial Assistance to Portfolio Companies
In order to count portfolio securities as qualifying assets for the purpose of the 70.0% test, we must either control the issuer of the securities or must offer to make available to the issuer of the securities (other than small and solvent companies described above) significant managerial assistance; except that, where we purchase such securities in conjunction with one or more other persons acting together, one of the other persons in the group may make available such managerial assistance. Making available “significant managerial assistance” means, among other things, any arrangement whereby we, through our directors, officers or employees, offer to provide, and, if accepted, do so provide, significant guidance and counsel concerning the management, operations or business objectives and policies of a portfolio company. Barings provides such managerial assistance on our behalf to portfolio companies that request this assistance. We may receive fees for these services.
26
Temporary Investments
Pending investment in other types of “qualifying assets,” as described above, our investments may consist of cash, cash equivalents, U.S. government securities or high-quality debt securities maturing in one year or less from the time of investment, which we refer to, collectively, as temporary investments, so that 70.0% of our assets are qualifying assets. We may invest in U.S. Treasury bills or in repurchase agreements, provided that such agreements are fully collateralized by cash or securities issued by the U.S. Government or its agencies. A repurchase agreement involves the purchase by an investor, such as us, of a specified security and the simultaneous agreement by the seller to repurchase it at an agreed-upon future date and at a price that is greater than the purchase price by an amount that reflects an agreed-upon interest rate. There is no percentage restriction on the proportion of our assets that may be invested in such repurchase agreements. However, if more than 25.0% of our total assets constitute repurchase agreements from a single counterparty, we would not meet the asset diversification tests required to maintain our tax treatment as a RIC for U.S. federal income tax purposes. Thus, we do not intend to enter into repurchase agreements with a single counterparty in excess of this limit. Our management team will monitor the creditworthiness of the counterparties with which we enter into repurchase agreement transactions.
Senior Securities
The Small Business Credit Availability Act (“SBCAA”), which was signed into law onin March 23, 2018, among other things, amended Section 61(a) of the 1940 Act to add a new Section 61(a)(2) that reduces the asset coverage requirement applicable BDCs from 200% to 150% so long as the BDC meets certain disclosure requirements and obtains certain approvals. On July 24, 2018, our stockholders voted at the 2018 Special Meeting to approve a proposal to authorize us to be subject to a reduced asset coverage ratio of at least 150% under the 1940 Act. As a result of the stockholder approval at the 2018 Special Meeting, effective July 25, 2018, our applicable asset coverage ratio under the 1940 Act decreased to 150% from 200%. Thus, we are permitted, under specified conditions, to issue multiple classes of debt and one class of stock senior to our common stock if our asset coverage, as defined in the 1940 Act, is at least equal to 150% immediately after each such issuance. In addition, while any senior securities remain outstanding (other than senior securities representing indebtedness issued in consideration of a privately arranged loan which is not intended to be publicly distributed), we must make provisions to prohibit any distribution to our stockholders or the repurchase of such securities or shares unless we meet the applicable asset coverage ratios at the time of the distribution or repurchase. We may also borrow amounts up to 5.0% of the value of our total assets for temporary purposes without regard to asset coverage. For a discussion of the risks associated with leverage, see “Risk“Item 1A.— Risk Factors — Risks Relating to Our Business and Structure — Because we intendIncurring additional leverage may magnify our exposure to distribute substantially all of our income to our stockholders to maintain our tax treatment as a regulated investment company, we will continue to need additional capital to finance our growth and regulations governing our operation as a business development company willrisks associated with changes in leverage, including fluctuations in interest rates that could adversely affect our ability to, and the way in which we, raise additional capital and make distributions”profitability” included in Item 1A of Part I of this Annual Report on Form 10-K.
Code of Business Conduct and Ethics and Corporate Governance Guidelines
We and Barings have adopted a code of ethics (the “Global Code of Ethics Policy”) and corporate governance guidelines, which collectively cover ethics and business conduct. These documents apply to our and Barings' directors, officers and employees, including our principal executive officer, principal financial officer, principal
accounting officer or controller, and any person performing similar functions, and establish procedures for personal investments and restrict certain personal securities transactions. Personnel subject to the Global Code of Ethics Policy and corporate governance guidelines may invest in securities for their personal investment accounts, including securities that may be purchased or held by us, so long as such investments are made in accordance with the code's requirements. Our Global Code of Ethics Policy and corporate governance guidelines are publicly available on the Investor Relations section of our website under "Corporate Governance" at https://ir.barings.com/governance-docs. We will report any amendments to or waivers of a required provision of our Global Code of Ethics Policy and corporate governance guidelines on our website or in a Current Report on Form 8-K. Information contained on our website is not incorporated by reference into this Annual Report on Form 10-K, and you should not consider that information to be part of this Annual Report on Form 10-K.
27
Compliance Policies and Procedures
We and Barings have adopted and implemented written policies and procedures reasonably designed to prevent violation of the U.S. federal securities laws, and are required to review these compliance policies and procedures annually for their adequacy and the effectiveness of their implementation, and to designate a chief compliance officer to be responsible for administering such policies and procedures.procedures. Michael Cowart serves as our Chief Compliance Officer.
Proxy Voting Policies and Procedures
We delegate our proxy voting responsibilities to Barings. Barings votes proxies relating to our portfolio securities in a manner which we believe will be in the best interest of our stockholders. Barings reviews on a case-by-case basis each proposal submitted to a stockholder vote to determine its impact on the portfolio securities held by us. Although Barings generally votes against proposals that may have a negative impact on our portfolio securities, they may vote for such a proposal if there exists compelling long-term reasons to do so.
The proxy voting decisions of Barings are made by the investment professionals who are responsible for monitoring each of its clients’ investments. To ensure that their vote is not the product of a conflict of interest, Barings requires that: (i) anyone involved in the decision making process disclose to our chief compliance officer any potential conflict that he or she is aware of and any contact that he or she has had with any interested party regarding a proxy vote; and (ii) employees involved in the decision making process or vote administration are prohibited from revealing how we intend to vote on a proposal in order to reduce any attempted influence from interested parties.
Stockholders may, without charge, obtain information regarding how we voted proxies with respect to our portfolio securities by making a written request for proxy voting information to: Chief Compliance Officer, 300 South Tryon Street, Suite 2500, Charlotte, North Carolina 28202 or by calling our investor relations department at 888-401-1088.
Other
We may also be prohibited under the 1940 Act from knowingly participating in certain transactions with our affiliates without the prior approval of those members of the Board who are not interested persons and, in some cases, prior approval by the SEC. The 1940 Act prohibits us from making certain negotiated co-investments with affiliates unless we receive an order fromabsent prior approval of the SEC permitting us to do so.SEC. Barings' existing Exemptive Relief permits us and Barings' affiliated private funds and SEC-registered funds to co-invest in loans originated by Barings, which allows Barings to implement its senior secured private debt investment strategy for us on an accelerated timeline.us.
We are periodically examined by the SEC for compliance with the 1940 Act.
We are required to provide and maintain a bond issued by a reputable fidelity insurance company to protect us against larceny and embezzlement. Furthermore, as a BDC, we are prohibited from protecting any director or officer against any liability to us or our stockholders arising from willful misfeasance, bad faith, gross negligence or reckless disregard of the duties involved in the conduct of such person’s office.
Securities Exchange Act of 1934 and Sarbanes-Oxley Act Compliance
We are subject to the reporting and disclosure requirements of the Securities Exchange Act of 1934, as amended (the “Exchange Act”), including the filing of quarterly, annual and current reports, proxy statements and other required items. In addition, we are subject to the Sarbanes-Oxley Act of 2002 (the "Sarbanes-Oxley Act"), which imposes a wide variety of regulatory requirements on publicly-held companies and their insiders. For example:
•pursuant to Rule 13a-14 of the Exchange Act, our Chief Executive Officer and Chief Financial Officer are required to certify the accuracy of the financial statements contained in our periodic reports;
28
•pursuant to Item 307 of Regulation S-K, our periodic reports are required to disclose our conclusions about the effectiveness of our disclosure controls and procedures;
•pursuant to Rule 13a-15 of the Exchange Act, our management is required to prepare a report regarding its assessment of our internal control over financial reporting, and separately, our independent registered public accounting firm audits our internal controls over financial reporting; and
•pursuant to Item 308 of Regulation S-K and Rule 13a-15 of the Exchange Act, our periodic reports must disclose whether there were significant changes in our internal control over financial reporting or in other factors that could significantly affect these controls subsequent to the date of their evaluation, including any corrective actions with regard to significant deficiencies and material weaknesses.
The New York Stock Exchange Corporate Governance Regulations
The NYSE has adopted corporate governance regulations that listed companies must comply with. We believe we currently are in compliance with such corporate governance listing standards. We intend to monitor our compliance with all future listing standards and to take all necessary actions to ensure that we stay in compliance.
Material U.S. Federal Income Tax Considerations
The following discussion is a general summary of the material U.S. federal income tax considerations applicable to us and to an investment in our shares. This summary does not purport to be a complete description of the income tax considerations applicable to us or to investors in such an investment. For example, we have not described tax consequences that we assume to be generally known by investors or certain considerations that may be relevant to certain types of holders subject to special treatment under U.S. federal income tax laws, including stockholders subject to the alternative minimum tax, tax-exempt organizations, insurance companies, dealers in securities, pension plans and trusts, financial institutions, U.S. stockholders (as defined below) whose functional currency is not the U.S. dollar, persons who mark-to-market our shares and persons who hold our shares as part of a “straddle,” “hedge” or “conversion” transaction. This summary assumes that investors hold shares of our common stock as capital assets (within the meaning of the Code). The discussion is based upon the Code, Treasury regulations, and administrative and judicial interpretations, each as of the date of this Annual Report on Form 10-K and all of which are subject to change, possibly retroactively, which could affect the continuing validity of this discussion. This summary does not discuss any aspects of U.S. estate or gift tax or foreign, state or local tax. It does not discuss the special treatment under U.S. federal income tax laws that could result if we invested in tax-exempt securities or certain other investment assets.
For purposes of our discussion, a “U.S. stockholder” means a beneficial owner of shares of our common stock that is for U.S. federal income tax purposes:
•a citizen or individual resident of the United States;
•a corporation, or other entity treated as a corporation for U.S. federal income tax purposes, created or organized in or under the laws of the United States or any state thereof or the District of Columbia;
•an estate, the income of which is subject to U.S. federal income taxation regardless of its source; or
•a trust if (i) a U.S. court is able to exercise primary supervision over the administration of such trust and one or more U.S. persons have the authority to control all substantial decisions of the trust or (ii) it has a valid election in place to be treated as a U.S. person.
For purposes of our discussion, a “Non-U.S. stockholder” means a beneficial owner of shares of our common stock that is neither a U.S. stockholder nor a partnership (including an entity treated as a partnership for U.S. federal income tax purposes).
If an entity treated as a partnership for U.S. federal income tax purposes (a “partnership”) holds shares of our common stock, the tax treatment of a partner or member of the partnership will generally depend upon the status of the partner or member and the activities of the partnership. A prospective stockholder that is a partner or member in a partnership holding shares of our common stock should consult his, her or its tax advisors with respect to the purchase, ownership and disposition of shares of our common stock.
29
Tax matters are very complicated and the tax consequences to an investor of an investment in our shares will depend on the facts of his, her or its particular situation. We encourage investors to consult their own tax advisors regarding the specific consequences of such an investment, including tax reporting requirements, the applicability of U.S. federal, state, local and foreign tax laws, eligibility for the benefits of any applicable tax treaty and the effect of any changes in the tax laws.
Election to be Taxed as a RIC
We have qualified and elected to be treated as a RIC under Subchapter M of the Code commencing with our taxable year ended December 31, 2007. As a RIC, we generally are not subject to corporate-level U.S. federal income taxes on any income that we distribute to our stockholders from our tax earnings and profits. To qualify as a RIC, we must, among other things, meet certain source-of-income and asset diversification requirements (as described below). In addition, in order to obtain RIC tax treatment, we must distribute to our stockholders, for each taxable year, at least 90% of our "investment company taxable income" ("ICTI"), which is generally our net ordinary income plus the excess, if any, of realized net short-term capital gain over realized net long-term capital loss, (the "Annual Distribution Requirement"). Even if we qualify for tax treatment as a RIC, we generally will be subject to corporate-level U.S. federal income tax on our undistributed taxable income and could be subject to U.S. federal excise, state, local and foreign taxes.
Taxation as a RIC
Provided that we qualify for tax treatment as a RIC, we will not be subject to U.S. federal income tax on the portion of our ICTI and net capital gain (which we define as net long-term capital gain in excess of net short-term capital loss) that we timely distribute to stockholders. We will be subject to U.S. federal income tax at the regular corporate rates on any income or capital gain not distributed (or deemed distributed) to our stockholders.
We will be subject to a 4% nondeductible U.S. federal excise tax on certain undistributed income unless we distribute in a timely manner an amount at least equal to the sum of (i) 98.0% of our ordinary income for each calendar year, (ii) 98.2% of our capital gain net income for the calendar year and (iii) any income recognized, but not distributed, in preceding years and on which we paid no U.S. federal income tax.
In order to qualify for tax treatment as a RIC for U.S. federal income tax purposes, we must, among other things:
•meet the Annual Distribution Requirement;
•qualify to be treated as a BDC or be registered as a management investment company under the 1940 Act at all times during each taxable year;
•derive in each taxable year at least 90% of our gross income from dividends, interest, payments with respect to certain securities loans, gains from the sale or other disposition of stock or other securities or foreign currencies or other income derived with respect to our business of investing in such stock, securities or currencies and net income derived from an interest in a “qualified publicly traded partnership” (as defined in the Code), or the 90% Income Test; and
•diversify our holdings so that at the end of each quarter of the taxable year:
◦at least 50% of the value of our assets consists of cash, cash equivalents, U.S. Government securities, securities of other RICs, and other securities if such other securities of any one issuer do not represent more than 5% of the value of our assets or more than 10% of the outstanding voting securities of the issuer (which for these purposes includes the equity securities of a “qualified publicly traded partnership”); and
◦no more than 25% of the value of our assets is invested in the securities, other than U.S. Government securities or securities of other RICs, (i) of one issuer (ii) of two or more issuers that are controlled, as determined under applicable tax rules, by us and that are engaged in the same or similar or related trades or businesses or (iii) of one or more “qualified publicly traded partnerships,” or the Diversification Tests.
30
To the extent that we invest in entities treated as partnerships for U.S. federal income tax purposes (other than a “qualified publicly traded partnership”), we generally must include the items of gross income derived by the partnerships for purposes of the 90% Income Test, and the income that is derived from a partnership (other than a “qualified publicly traded partnership”) will be treated as qualifying income for purposes of the 90% Income Test only to the extent that such income is attributable to items of income of the partnership which would be qualifying income if realized by us directly. In addition, we generally must take into account our proportionate share of the assets held by partnerships (other than a “qualified publicly traded partnership”) in which we are a partner for purposes of the Diversification Tests.
In order to meet the 90% Income Test, we utilize the Taxable Subsidiary,Subsidiaries, and in the future may establish additional such corporations, to hold assets from which we do not anticipate earning dividend, interest or other qualifying income under the 90% Income Test. Any investments held through athe Taxable SubsidiarySubsidiaries generally are subject to U.S. federal income and other taxes, and therefore we can expect to achieve a reduced after-tax yield on such investments.
We may be required to recognize taxable income in circumstances in which we do not receive a corresponding payment in cash. For example, if we hold debt obligations that are treated under applicable tax rules as having original issue discount (such as debt instruments with PIK interest or, in certain cases, increasing interest rates or issued with warrants), we must include in income each year a portion of the original issue discount that accrues over the life of the obligation, regardless of whether cash representing such income is received by us in the same taxable year. We may also have to include in income other amounts that we have not yet received in cash, such as deferred loan origination fees that are paid after origination of the loan or are paid in non-cash compensation such as warrants or stock. We anticipate that a portion of our income may constitute original issue discount or other income required to be included in taxable income prior to receipt of cash.
Because any original issue discount or other amounts accrued will be included in our ICTI for the year of the accrual, we may be required to make a distribution to our stockholders in order to satisfy the Annual Distribution Requirement and to avoid the 4.0% U.S. federal excise tax, even though we will not have received any corresponding cash amount. As a result, we may have difficulty meeting the Annual Distribution Requirement necessary to obtain and maintain RIC tax treatment under the Code. We may have to sell some of our investments at times and/or at prices we would not consider advantageous, raise additional debt or equity capital or forgo new investment opportunities for this purpose. If we are not able to obtain cash from other sources, we may fail to qualify for RIC tax treatment and thus become subject to corporate-level income tax.
Furthermore, a portfolio company in which we invest may face financial difficulty that requires us to work-out, modify or otherwise restructure our investment in the portfolio company. Any such restructuring may result in unusable capital losses and future non-cash income. Any restructuring may also result in our recognition of a substantial amount of non-qualifying income for purposes of the 90% Income Test, such as cancellation of indebtedness income in connection with the work-out of a leveraged investment (which, while not free from doubt, may be treated as non-qualifying income) or the receipt of other non-qualifying income.
Gain or loss realized by us from warrants acquired by us as well as any loss attributable to the lapse of such warrants generally will be treated as capital gain or loss. Such gain or loss generally will be long-term or short-term, depending on how long we held a particular warrant.
Investments by us in non-U.S. securities may be subject to non-U.S. income, withholding and other taxes, and therefore, our yield on any such securities may be reduced by such non-U.S. taxes. Stockholders will generally not be entitled to claim a credit or deduction with respect to non-U.S. taxes paid by us.
If we purchase shares in a “passive foreign investment company,” or PFIC, we may be subject to U.S. federal income tax on a portion of any “excess distribution” or gain from the disposition of such shares even if such income is distributed as a taxable dividend by us to our stockholders. Additional charges in the nature of interest may be imposed on us in respect of deferred taxes arising from such distributions or gains. If we invest in a PFIC and elect to treat the PFIC as a “qualified electing fund” under the Code, or QEF, in lieu of the foregoing requirements, we will be required to include in income each year a portion of the ordinary earnings and net capital gain of the QEF,
31
even if such income is not distributed to it. Alternatively, we can elect to mark-to-market at the end of each taxable year our shares in a PFIC; in this case, we will recognize as ordinary income any increase in the value of such shares and as ordinary loss any decrease in such value to the extent it does not exceed prior increases included in income. Under either election, we may be required to recognize in a year income in excess of our distributions from PFICs and our proceeds from dispositions of PFIC stock during that year, and such income will nevertheless be subject to the Annual Distribution Requirement and will be taken into account for purposes of the 4% U.S. federal excise tax.
Under Section 988 of the Code, gain or loss attributable to fluctuations in exchange rates between the time we accrue income, expenses, or other liabilities denominated in a foreign currency and the time we actually collect such income or pay such expenses or liabilities are generally treated as ordinary income or loss. Similarly, gain or loss on foreign currency forward contracts and the disposition of debt denominated in a foreign currency, to the extent attributable to fluctuations in exchange rates between the acquisition and disposition dates, are also treated as ordinary income or loss.
We are authorized to borrow funds and to sell assets in order to satisfy distribution requirements. Under the 1940 Act, we are not permitted to make distributions to our stockholders while our debt obligations and other senior securities are outstanding unless certain “asset coverage” tests are met. See “Regulation of Business Development Companies — Qualifying Assets” and “Regulation of Business Development Companies — Senior Securities" above. Moreover, our ability to dispose of assets to meet our distribution requirements may be limited by (i) the illiquid nature of our portfolio and/or (ii) other requirements relating to our tax treatment as a RIC, including the Diversification Tests. If we dispose of assets in order to meet the Annual Distribution Requirement or to avoid the excise tax, we may make such dispositions at times that, from an investment standpoint, are not advantageous.
If we fail to satisfy the Annual Distribution Requirement or otherwise fail to qualify for tax treatment as a RIC in any taxable year, we will be subject to tax in that year on all of our taxable income, regardless of whether we make any distributions to our stockholders. In that case, all of such income will be subject to corporate-level U.S. federal income tax, reducing the amount available to be distributed to our stockholders. See “Failure To Obtain RIC Tax Treatment" below.
As a RIC, we are not allowed to carry forward or carry back a net operating loss for purposes of computing our ICTI in other taxable years. U.S. federal income tax law generally permits a RIC to carry forward (i) the excess of its net short-term capital loss over its net long-term capital gain for a given year as a short-term capital loss arising on the first day of the following year and (ii) the excess of its net long-term capital loss over its net short-term capital gain for a given year as a long-term capital loss arising on the first day of the following year. Future transactions we engage in may cause our ability to use any capital loss carryforwards, and unrealized losses once realized, to be limited under Section 382 of the Code. Certain of our investment practices may be subject to special and complex U.S. federal income tax provisions that may, among other things, (i) disallow, suspend or otherwise limit the allowance of certain losses or deductions, (ii) convert lower taxed long-term capital gain and qualified dividend income into higher taxed short-term capital gain or ordinary income, (iii) convert an ordinary loss or a deduction into a capital loss (the deductibility of which is more limited), (iv) cause us to recognize income or gain without a corresponding receipt of cash, (v) adversely affect the time as to when a purchase or sale of stock or securities is deemed to occur, (vi) adversely alter the characterization of certain complex financial transactions and (vii) produce income that will not be qualifying income for purposes of the 90% Income Test. We will monitor our transactions and may make certain tax elections in order to mitigate the effect of these provisions.
As described above, to the extent that we invest in equity securities of entities that are treated as partnerships for U.S. federal income tax purposes, the effect of such investments for purposes of the 90% Income Test and the Diversification Tests will depend on whether or not the partnership is a “qualified publicly traded partnership” (as defined in the Code). If the entity is a “qualified publicly traded partnership,” the net income derived from such investments will be qualifying income for purposes of the 90% Income Test and will be “securities” for purposes of the Diversification Tests. If the entity is not treated as a “qualified publicly traded partnership,” however, the consequences of an investment in the partnership will depend upon the amount and type of income and assets of the partnership allocable to us. The income derived from such investments may not be qualifying income for purposes of the 90% Income Test and, therefore, could adversely affect our tax treatment as a RIC. We intend to monitor our
32
investments in equity securities of entities that are treated as partnerships for U.S. federal income tax purposes to prevent our disqualification from tax treatment as a RIC.
We may invest in preferred securities or other securities the U.S. federal income tax treatment of which may not be clear or may be subject to recharacterization by the IRS. To the extent the tax treatment of such securities or the income from such securities differs from the expected tax treatment, it could affect the timing or character of income recognized, requiring us to purchase or sell securities, or otherwise change our portfolio, in order to comply with the tax rules applicable to RICs under the Code.
We may distribute taxable dividends that are payable in cash or shares of our common stock at the election of each stockholder. Under certain applicable provisions of the Code and the Treasury regulations, distributions payable in cash or in shares of stock at the election of stockholders are treated as taxable dividends. The Internal Revenue Service has published guidance indicating that this rule will apply even where the total amount of cash that may be distributed is limited to no more than 20% of the total distribution.distribution (10% in case of distributions through June 30, 2022). Under this guidance, if too many stockholders elect to receive their distributions in cash, the cash available for distribution must be allocated among the stockholders electing to receive cash (with the balance of the distribution paid in stock). If we decide to make any distributions consistent with this guidance that are payable in part in our stock, taxable stockholders receiving such dividends will be required to include the full amount of the dividend (whether received in cash, our stock, or a combination thereof) as ordinary income (or as long-term capital gain to the extent such distribution is properly reported as a capital gain dividend) to the extent of our current and accumulated earnings and profits for U.S. federal income tax purposes. As a result, a U.S. stockholder may be required to pay tax with respect to such dividends in excess of any cash received. If a U.S. stockholder sells the stock it receives in order to pay this tax, the sales proceeds may be less than the amount included in income with respect to the dividend, depending on the market price of our stock at the time of the sale. Furthermore, with respect to non-U.S. stockholders, we may be required to withhold U.S. tax with respect to such dividends, including in respect of all or a portion of such dividend that is payable in stock. In addition, if a significant number of our stockholders determine to sell shares of our stock in order to pay taxes owed on dividends, it may put downward pressure on the trading price of our stock.
Failure to Obtain RIC Tax Treatment
If we fail to satisfy the 90% Income Test or the Diversification Tests for any taxable year, we may nevertheless continue to qualify for tax treatment as a RIC for such year if certain relief provisions are applicable (which may, among other things, require us to pay certain corporate-level federal taxes or to dispose of certain assets).
If we were unable to obtain tax treatment as a RIC, we would be subject to tax on all of our taxable income at regular corporate rates. We would not be able to deduct distributions to stockholders, nor would they be required to be made. Distributions would generally be taxable to our stockholders as dividend income to the extent of our current and accumulated earnings and profits (in the case of non-corporate U.S. stockholders, generally at a maximum U.S. federal income tax rate applicable to qualified dividend income of 20%). Subject to certain limitations under the Code, corporate distributees would be eligible for the dividends-received deduction. Distributions in excess of our current and accumulated earnings and profits would be treated first as a return of capital to the extent of the stockholder’s tax basis, and any remaining distributions would be treated as a capital gain.
If we fail to meet the RIC requirements for more than two consecutive years and then, seek to re-qualify for tax treatment as a RIC, we would be subject to corporate-level taxation on any built-in gain recognized during the succeeding five-year period unless we made a special election to recognize all such built-in gain upon our re-qualification for tax treatment as a RIC and to pay the corporate-level tax on such built-in gain.
33
Possible Legislative or Other Actions Affecting Tax Considerations
Prospective investors should recognize that the present U.S. federal income tax treatment of an investment in our stock may be modified by legislative, judicial or administrative action at any time, and that any such action may affect investments and commitments previously made. The rules dealing with U.S. federal income taxation are constantly under review by persons involved in the legislative process and by the IRS and the U.S. Treasury Department, resulting in revisions of regulations and revised interpretations of established concepts as well as statutory changes. Revisions in U.S. federal tax laws and interpretations thereof could affect the tax consequences of an investment in our stock. See "Risk Factors - Risk Relating to Our Business and Structure - We cannot predict how tax reform legislation will affect us, our investments, or our stockholders, and any such legislation could adversely affect our business" included in Item 1A or Part I of this Annual Report on Form 10-K.
Withholding
Our distributions generally will be treated as dividends for U.S. tax purposes and will be subject to U.S. income or withholding tax unless the shareholder receiving the dividend qualifies for an exemption from U.S. tax or the distribution is subject to one of the special look-through rules described below. Distributions paid out of net capital gains can qualify for a reduced rate of taxation in the hands of an individual U.S. shareholder and an exemption from U.S. tax in the hands of a non-U.S. shareholder.
Under an exemption, properly reported dividend distributions by RICs paid out of certain interest income (such distributions, “interest-related dividends”) are generally exempt from U.S. withholding tax for non-U.S. shareholders. Under such exemption, a non-U.S. shareholder generally may receive interest-related dividends free of U.S. withholding tax if the shareholder would not have been subject to U.S. withholding tax if it had received the underlying interest income directly. No assurance can be given as to whether any of our distributions will be eligible for this exemption from U.S. withholding tax or, if eligible, will be reported as such by us. In particular, the exemption does apply to distributions paid in respect of a RIC’s non-U.S. source interest income, its dividend income or its foreign currency gains. In the case shares of our stock are held through an intermediary, the intermediary may withhold U.S. federal income tax even if we report the payment as a dividend eligible for the exemption.
State and Local Tax Treatment
The state and local tax treatment may differ from U.S. federal income tax treatment.
The discussion set forth herein does not constitute tax advice, and potential investors should consult their own tax advisors concerning the tax considerations relevant to their particular situation.
Available Information
We intend to make this Annual Report on Form 10-K, as well as our quarterly reports on Form 10-Q, our current reports on Form 8-K and, if applicable, amendments to those reports filed or furnished pursuant to Section 13(a) of the Exchange Act, publicly available on our website (www.baringsbdc.com) without charge as soon as reasonably practicable following our filing of such reports with the SEC. Our SEC reports can be accessed through the investor relations section of our website. The information found on our website is not part of this or any other report we file with or furnish to the SEC. We assume no obligation to update or revise any statements in this Annual Report on Form 10-K or in other reports filed with the SEC, whether as a result of new information, future events or otherwise, unless we are required to do so by law. A copy of this Annual Report on Form 10-K and our other reports is available without charge upon written request to Investor Relations, Barings BDC, Inc., 300 South Tryon Street, Suite 2500 Charlotte, North Carolina 28202. The SEC maintains an Internet site at www.sec.gov that contains our periodic and current reports, proxy and information statements and our other filings at www.sec.gov.filings.
34
Item 1A. Risk Factors.
Investing in our securities involves a number of significant risks. In addition to the other information contained in this Annual Report on Form 10-K, you should consider carefully the following information before making an investment in our securities. The risks set out below are not the only risks we face. Additional risks and uncertainties not presently known to us or not presently deemed material by us might also impair our operations and performance. If any of the following events occur, our business, financial condition and results of operations could be materially and adversely affected. In such case, our net asset value, the trading price of our common stock and the value of our other securities could decline, and you may lose all or part of your investment.
The following is a summary of the principal risk factors associated with an investment in our securities. Further details regarding each risk included in the below summary list can be found further below.
•We are dependent upon Barings’ access to its investment professionals for our success.
•Our investment portfolio is and will continue to be recorded at fair value as determined in good faith by our Board of Directors and, as a result, there is and will continue to be uncertainty as to the value of our portfolio investments.
•We operate in a highly competitive market for investment opportunities, which could reduce returns and result in losses.
•There are potential conflicts of interest, including the management of other investment funds and accounts by Barings, which could impact our investment returns.
•The fee structure under the Amended and Restated Advisory Agreement may induce Barings to pursue speculative investments and incur leverage, which may not be in the best interests of our stockholders.
•Regulations governing our operation as a BDC will affect our ability to, and the way in which we, raise additional capital.
•Our financing agreements contain various covenants, which, if not complied with, could accelerate our repayment obligations thereunder, thereby materially and adversely affecting our liquidity, financial condition, results of operations and ability to pay distributions.
•Incurring additional leverage may magnify our exposure to risks associated with changes in leverage, including fluctuations in interest rates that could adversely affect our profitability.
•Prepayments of our debt investments by our portfolio companies could adversely impact our results of operations and reduce our return on equity.
•Shares of closed-end investment companies, including BDCs, frequently trade at a discount to their net asset value, and may trade at premiums that may prove to be unsustainable.
•Sales of shares of the Company’s common stock after the completion of the Sierra Merger may cause the market price of the Company’s common stock to decline.
•The Company may be unable to realize the benefits anticipated by the Sierra Merger, including estimated cost savings, or it may take longer than anticipated to realize such benefits.
Risks Relating to Our Business and Structure
We are dependent upon Barings’ access to its investment professionals for our success.
We depend on the diligence, skill and network of business contacts of Barings’ investment professionals to source appropriate investments for us. We depend on members of Barings’ investment team to appropriately analyze our investments and Barings’ investment committee to approve and monitor our portfolio investments. Barings’ investment committee, together with the other members of its investment team, evaluate, negotiate, structure, close and monitor our investments. Our future success depends on the continued availability of the members of Barings’ investment committee and the other investment professionals available to Barings. We do not have employment agreements with these individuals or other key personnel of Barings, and we cannot provide any assurance that unforeseen business, medical, personal or other circumstances would not lead any such individual to terminate his or
35
her relationship with Barings. If these individuals do not maintain their existing relationships with Barings and its affiliates or do not develop new relationships with other sources of investment opportunities, we may not be able to identify appropriate replacements or grow our investment portfolio. The loss of any member of Barings’ investment committee or of other investment professionals of Barings and its affiliates would limit our ability to achieve our investment objectives and operate as we anticipate, which could have a material adverse effect on our financial condition, results of operations and cash flows. We expect that Barings will evaluate, negotiate, structure, close and monitor our investments in accordance with the terms of the Advisory Agreement. We can offer no assurance, however, that the investment professionals of Barings will continue to provide investment advice to us or that we will continue to have access to Barings’ investment professionals or its information and deal flow. Further, there can be no assurance that Barings will replicate its own historical success, and we caution you that our investment returns could be substantially lower than the returns achieved by other funds managed by Barings.
Our financial condition and results of operations will depend on our ability to manage and deploy capital effectively.
Our ability to continue to achieve our investment objectives will depend on our ability to effectively manage and deploy our capital, which will depend, in turn, on Barings' ability to continue to identify, evaluate, invest in and monitor companies that meet our investment criteria. We cannot assure you that we will continue to achieve our investment objectives.
Accomplishing this result on a cost-effective basis will be largely a function of Barings' handling of the investment process, their ability to provide competent, attentive and efficient services and our access to investments offering acceptable terms. In addition to monitoring the performance of our existing investments, Barings' investment professionals may also be called upon to provide managerial assistance to our portfolio companies. These demands on their time may distract them or slow the rate of investment.
Even if we are able to grow and build upon our investment operations in a manner commensurate with any capital made available to us as a result of our operating activities, financing activities and/or offerings of our securities, any failure to manage our growth effectively could have a material adverse effect on our business, financial condition, results of operations and prospects. The results of our operations will depend on many factors, including the availability of opportunities for investment, readily accessible short- and long-term funding alternatives in the financial markets and economic conditions. Furthermore, if we cannot successfully operate our business or implement our investment policies and strategies as described in this Annual Report on Form 10-K, it could negatively impact our ability to pay distributions and cause you to lose part or all of your investment.
Our investment portfolio is and will continue to be recorded at fair value as determined in good faith by our Board of Directors and, as a result, there is and will continue to be uncertainty as to the value of our portfolio investments.
Under the 1940 Act, we are required to carry our portfolio investments at market value or, if there is no readily available market value, at fair value as determined in good faith by the Board. Typically there is not a public market for the securities of the privately held middle-market companies in which we have invested and will generally continue to invest. As a result, we value these securities quarterly at fair value as determined in good faith by the Board based on input from Barings, a nationally recognized independent third-party valuation firmfirms and our audit committee. See "Valuation"Item 1. Business – Valuation Process and Determination of Net Asset Value" included in Item 1 of Part 1 of this Annual Report on Form 10-K for a detailed description of our valuation process.
The determination of fair value and consequently, the amount of unrealized appreciation and depreciation in our portfolio, is to a certain degree subjective and dependent on the judgment of the Board. Certain factors that may be considered in determining the fair value of our investments include the nature and realizable value of any collateral, the portfolio company’s earnings and its ability to make payments on its indebtedness, the markets in which the portfolio company does business, comparison to comparable publicly-traded companies, discounted cash flows and other relevant factors. Because such valuations, and particularly valuations of private securities and private companies, are inherently uncertain, may fluctuate over short periods of time and may be based on estimates, our determinations of fair value may differ materially from the values that would have been used if a ready market for these securities existed. Due to this uncertainty, our fair value determinations may cause our net asset value on a given date to materially understate or overstate the value that we may ultimately realize upon the sale or disposition of one or more of our investments. As a result, investors purchasing our securities based on an overstated net asset value would pay a higher price than the value of our investments might warrant. Conversely, investors selling shares
36
during a period in which the net asset value understates the value of our investments will receive a lower price for their shares than the value of our investments might warrant.
We operate in a highly competitive market for investment opportunities, which could reduce returns and result in losses.
A number of entities compete with us to make the types of investments that we make. We compete with public and private funds, commercial and investment banks, commercial financing companies and, to the extent they provide an alternative form of financing, private equity and hedge funds. Many of our competitors are substantially larger and some have considerably greater financial, technical and marketing resources than we do. For example, we believe some of our competitors may have access to funding sources that are not available to us. In addition, some of our competitors may have higher risk tolerances or different risk assessments, which could allow them to consider a wider variety of investments and establish more relationships than us. Furthermore, many of our competitors are not subject to the regulatory restrictions that the 1940 Act imposes on us as a BDC or the source of income, asset diversification and distribution requirements we must satisfy to maintain our qualification as a RIC. The competitive pressures we face may have a material adverse effect on our business, financial condition, results of operations and cash flows. As a result of this competition, we may not be able to take advantage of attractive investment opportunities from time to time, and we may not be able to identify and make investments that are consistent with our investment objective.
With respect to the investments we make, we do not seek to compete based primarily on the interest rates we offer, and we believe that some of our competitors may make loans with interest rates that will be lower than the rates we offer. In the secondary market for acquiring existing loans, we compete generally on the basis of pricing terms. With respect to all investments, we may lose some investment opportunities if we do not match our competitors’ pricing, terms and structure. However, if we match our competitors’ pricing, terms and structure, we may experience decreased net interest income, lower yields and increased risk of credit loss. We may also compete for investment opportunities with accounts managed or sponsored by Barings or its affiliates. Although Barings allocates opportunities in accordance with its allocation policy, allocations to such other accounts will reduce the amount and frequency of opportunities available to us and may not be in the best interests of us and our securityholders. Moreover, the performance of investments will not be known at the time of allocation.
There are potential conflicts of interest, including the management of other investment funds and accounts by Barings, which could impact our investment returns.
interest and create an incentive for Barings to favor such other funds or accounts. Although the professional staff of Barings will devote as much time to our management as appropriate to enable Barings to perform its duties in accordance with the Amended and Restated Advisory Agreement, the investment professionals of Barings may have conflicts in allocating their time and services among us, on the one hand, and the other investment vehicles managed by Barings or one or more of its affiliates on the other hand.
Barings may face conflicts in allocating investment opportunities between us and affiliated investment vehicles that have overlapping investment objectives with ours. Although Barings will endeavor to allocate investment opportunities in a fair and equitable manner in accordance with its allocation policies and procedures, it is possible that, in the future, we may not be given the opportunity to participate in investments made by investment funds managed by Barings or an investment manager affiliated with Barings if such investment is prohibited by the Exemptive Relief or the 1940 Act, and there can be no assurance that we will be able to participate in all investment opportunities that are suitable to us.
Conflicts may also arise because portfolio decisions regarding our portfolio may benefit Barings' affiliates. Barings' affiliates may pursue or enforce rights with respect to one of our portfolio companies on behalf of other funds or accounts managed by it, and those activities may have an adverse effect on us.
37
Barings may exercise significant influence over us in connection with its ownership of our common stock.
As of February 27, 2020,23, 2022, Barings, our external investment adviser, beneficially owns approximately 27.9% of20.9% of our outstanding common stock. As a result, Barings may be able to significantly influence the outcome of matters submitted for stockholder action, including the election of directors, approval of significant corporate transactions, such as amendments to our governing documents, business combinations, consolidations and mergers. Barings has substantial influence on us and could exercise its influence in a manner that conflicts with the interests of other stockholders. The presence of a significant stockholder such as Barings may also have the effect of making it more difficult for a third party to acquire us or discourage a third party from seeking to acquire us.
Principals of Barings and its affiliates and members of Barings’ investment committee may serve as directors of, or in a similar capacity with, companies in which we invest, the securities of which are purchased or sold on our behalf. In the event that material nonpublic information is obtained with respect to such companies, or we become subject to trading restrictions under the internal trading policies of those companies or as a result of applicable law or regulations, we could be prohibited for a period of time from purchasing or selling the securities of such companies, and this prohibition may have an adverse effect on us.
Our ability to enter into transactions with Barings and its affiliates of Barings areis restricted.
BDCs may, however, invest alongside certain related parties or their respective other clients in certain circumstances where doing so is consistent with current law and SEC staff interpretations. For example, a BDC may invest alongside such accounts consistent with guidance promulgated by the SEC staff permitting the BDC and such other accounts to make anypurchase interests in a single class of privately placed securities so long as certain conditions are met, including that the BDC’s investment adviser, acting on the BDC’s behalf and on behalf of other clients, negotiates no term other than price.
The 1940 Act generally prohibits BDCs from making certain negotiated co-investments with Barings or itscertain affiliates (including any fund managed by Barings orabsent an investment adviser controlling, controlled by or under common control with Barings) without exemptive relieforder from the SEC subjectpermitting the BDC to certain exceptions. Thedo so. Pursuant to the Exemptive Relief, we are generally permitted to co-invest with funds affiliated with Barings if a “required majority” (as defined in Section 57(o) of the 1940 Act) of our independent directors make certain conclusions in connection with a co-investment transaction, including that (1) the SEC has granted to Barings permits certain present and future funds,terms of the transaction, including the Company, advised by Barings (or anconsideration to be paid, are reasonable and fair to us and our stockholders and do not involve overreaching in respect of us or our stockholders on the part of any person concerned and (2) the transaction is consistent with the interests of our stockholders and is consistent with our investment adviser controlling, controlled by or under common control with Barings) to co-invest in suitable negotiated investments.objective and strategies. Co-investments made under the Exemptive Relief are subject to compliance with the conditions and other requirements contained in the Exemptive Relief, which could limit our ability to participate in a co-investment transaction.
In situations where co-investment with other affiliated funds or accounts is not permitted or appropriate, Barings will need to decide which account will proceed with the investment in accordance with its allocation policies and procedures. Although Barings will endeavor to allocate investment opportunities in a fair and equitable manner in accordance with its allocation policies and procedures, it is possible that, in the future, we may not be given the opportunity to participate in investments made by investment funds managed by Barings or an investment manager affiliated with Barings if such investment is prohibited by the 1940 Act. These restrictions, and similar
38
restrictions that limit our ability to transact business with our officers or directors or their affiliates, including funds managed by Barings, may limit the scope of investment opportunities that would otherwise be available to us.
We are subject to risks associated with investing alongside other third parties, including our joint venture.ventures.
We have invested in a joint venture,ventures, and may invest in additional or different joint ventures alongside third parties through partnerships, joint ventures or other entities in the future. Such investments may involve risks not present in investments where a third party is not involved, including the possibility that such third party may at any time have economic or business interests or goals which are inconsistent with ours, or may be in a position to take action contrary to our investment objectives. In addition, we may in certain circumstances be liable for actions of such third party.
More specifically, joint ventures involve a third party that has approval rights over activitycertain activities of the joint venture. The third party may take actions that are inconsistent with our interests. For example, the third party may decline to approve an investment for the joint venture that we otherwise want the joint venture to make. A joint venture may also use investment leverage which magnifies the potential for gain or loss on amounts invested. Generally, the amount of borrowingborrowings by the joint venture is not included when calculating our total borrowingborrowings and related leverage ratios and is not subject to asset coverage requirements imposed by the 1940 Act. If the activities of the joint venture were required to be consolidated with our activities because of a change in GAAP rules or SEC staff interpretations, it is likely that we would have to reorganize any such joint venture.
The fee structure under the Amended and Restated Advisory Agreement may induce Barings to pursue speculative investments and incur leverage, which may not be in the best interests of our stockholders.
The Income-Based Feeincome-based fee payable to Barings is calculated based on a percentage of our return on invested capital. The Income-Based Feeincome-based fee payable to Barings may create an incentive for Barings to make investments on our behalf that are risky or more speculative than would be the case in the absence of such a compensation arrangement. Unlike the Base Management Fee,base management fee, the Income-Based Feeincome-based fee is payable only if the hurdle rate is achieved. Because the portfolio earns investment income on gross assets while the hurdle rate is based on invested capital, and because the use of leverage increases gross assets without any corresponding increase in invested capital, Barings may be incentivized to incur leverage to grow the portfolio, which will tend to enhance returns where our portfolio has positive returns and increase the chances that such hurdle rate is achieved. Conversely, the use of leverage may increase losses where our portfolio has negative returns, which would impair the value of our common stock.
In addition, Barings receives the Capital Gains Feecapital gains fee based, in part, upon net capital gains realized on our investments. Unlike the Income-Based Fee,income-based fee, there is no hurdle rate applicable to the Capital Gains Fee.capital gains fee. As a result, Barings may have a tendency to invest more capital in investments that are likely to result in capital gains as compared to income producing securities. Such a practice could result in our investing in more speculative securities than would otherwise be the case, which may not be in the best interests of our stockholders and could result in higher investment losses, particularly during economic downturns.
Barings' liability is limited under the Amended and Restated Advisory Agreement, and we are required to indemnify Barings against certain liabilities, which may lead Barings to act in a riskier manner on our behalf than it would when acting for its own account.
39
their duties. We have agreed to indemnify, defend and protect Barings and its officers, managers, partners, agents, employees, controlling persons, members and any other person or entity affiliated with Barings with respect to all damages, liabilities, costs and expenses arising out of or otherwise based upon the performance of any of Barings' duties or obligations under the Advisory Agreement or otherwise, and not arising out of fraud, willful misfeasance, bad faith, gross negligence or reckless disregard in the performance of their duties under the Advisory Agreement. These protections may lead Barings to act in a riskier manner when acting on our behalf than it would when acting for its own account.
Barings is able to resign as our investment adviser and/or our administrator upon 60 days’ notice, and we may not be able to find a suitable replacement within that time, or at all, resulting in a disruption in our operations that could adversely affect our financial condition, business and results of operations.
Pursuant to the Amended and Restated Advisory Agreement, Barings has the right to resign as our investment adviser upon 60 days' written notice, whether a replacement has been found or not. Similarly, Barings'Barings has the right under the Administration Agreement to resign upon 60 days’ written notice, whether a replacement has been found or not. If Barings resigns, it may be difficult to find a replacement investment adviser or administrator, as applicable, or hire internal management with similar expertise and ability to provide the same or equivalent services on acceptable terms within 60 days, or at all. If a replacement is not found quickly, our business, results of operations and financial condition as well as our ability to pay distributions are likely to be adversely affected and the value of our shares may decline. In addition, the coordination of our internal management and investment or administrative activities is likely to suffer if we are unable to identify and reach an agreement with a single institution or group of executives having the expertise possessed by Barings. Even if a comparable service provider or individuals performing such services are retained, whether internal or external, their integration into our business and lack of familiarity with our investment objective may result in additional costs and time delays that may materially adversely affect our business, results of operations and financial condition.
Our business model depends to a significant extent upon strong referral relationships, and our inability to maintain or develop these relationships, as well as the failure of these relationships to generate investment opportunities, could adversely affect our business.
There can be no guarantee that we or BSF will be able to renew, extend, replace or replace the August 2018 Credit Facility or the February 2019 Credit Facility when principal payments are due and payableexpand our current borrowing arrangements on terms that are favorable to us, if at all. Our ability to obtain replacement financing when principal payments are due and payable will be constrained by then-current economic conditions affecting the credit markets. AnyOur inability of us or BSF to renew, extend, replace or replace the August 2018 Credit Facility or the February 2019 Credit Facility when principal payments are due and payableexpand these borrowing arrangements could have a material adverse effect on our liquidity and ability to fund new investments, our ability to make distributions to our stockholders and our ability to qualify for tax treatment as a RIC under the Code.
Regulations governing our operation as a business development companyBDC will affect our ability to, and the way in which we, raise additional capital.
Our business will require capital to operate and grow. We may acquire such additional capital from the following sources:
•Under the provisions of the 1940 Act, we are permitted, as a BDC, to issue senior securities only in amounts such that our asset coverage, as defined in the 1940 Act, equals at least 150% after each issuance of senior securities. If the value of our assets declines, we may be unable to satisfy this test. If that happens, we may be required to sell a portion of our investments and, depending on the nature of our leverage, repay a portion of our debt at a time when such sales and/or repayments may be disadvantageous. Further we may not be permitted to declareprohibited from declaring a dividend or makemaking any distribution to stockholders or repurchaserepurchasing our shares until such time as we satisfy this test.
•Any amounts that we use to service our debt or make payments on preferred stock will not be available for distributions to our common stockholders.
•Our current indebtedness is, and it is likely that any securities or other indebtedness we may issue will be, governed by an indenture or other instrument containing covenants restricting our operating flexibility. Additionally, some of these securities or other indebtedness may be rated by rating agencies, and in obtaining a rating for such securities and other indebtedness, we may be required to abide by operating and investment guidelines that further restrict operating and financial flexibility.
•We and, indirectly, our stockholders, will bear the cost of issuing and servicing such securities and other indebtedness.
40
•Preferred stock or any convertible or exchangeable securities that we issue in the future may have rights, preferences and privileges more favorable than those of our common stock, including separate voting rights and could delay or prevent a transaction or a change in control to the detriment of the holders of our common stock.
Our financing agreements contain various covenants, which, if not complied with, could accelerate our repayment obligations under the August 2018 Credit Facility or the February 2019 Credit Facility,thereunder, thereby materially and adversely affecting our liquidity, financial condition, results of operations and ability to pay distributions.
We will have a continuing need for capital to finance our investments. Our wholly-owned subsidiary, BSF, isWe are party to the August 2018 Credit Facility and as of December 31, 2019, BSF had borrowings of $107.2 million outstanding under the August 2018 Credit Facility. Under the August 2018 Credit Facility, BSF is requiredvarious financing agreements from time to comply with various covenants, reporting requirements and other customary requirements for similar credit facilities. In addition to other customary events of default included in financing transactions, the August 2018 Credit Facility contains the following events of default: (i) the failure to make principal payments when due or interest payments within two business days of when due; (ii) borrowings under the credit facility exceeding the applicable advance rates; (iii) the purchase by BSF of certain ineligible assets; (iv) the insolvency or bankruptcy of BSF and (v) the decline of BSF’s net asset value below a specified threshold. During the continuation of an event of default, BSF must pay interest at a default rate.
Incurring additional leverage may magnify our exposure to risks associated with changes in interest rates,leverage, including fluctuations in interest rates that could adversely affect our profitability.
As part of our business strategy, we borrow under the August 2018 Credit Facility, the February 2019 Credit Facility and the Debt Securitization,financing agreements with certain banks, and in the future may borrow money and issue debt securities to banks, insurance companies and other lenders. The lender party to the August 2018 Credit Facility isOur obligations under these arrangements are or may be secured by the assets of BSF and the noteholders party to the Debt Securitization are secured by the assets of Barings BDC Static CLO Ltd. 2019-I and Barings BDC Static CLO 2019-I, LLC, our wholly-owned and consolidated subsidiaries. The lenders party to the February 2019 Credit Facility are secured primarily by a material portion of our assets and guaranteed by certain of our subsidiaries. Theassets. As a result, these lenders and noteholders party to the August 2018 Credit Facility, the February 2019 Credit Facility and the Debt Securitizationare or may have claims that are superior to the claims of our common stockholders, and holders of any future loanshave or debt securities wouldmay have fixed-dollar claims on our assets that are superior to the claims of our stockholders. IfAlso, if the value of our assets decreases, leverage will cause our net asset
value to decline more sharply than it otherwise would have without leverage. Similarly, any decrease in our income would cause our net income to decline more sharply than it would have if we had not borrowed. This decline could negatively affect our ability to make dividend payments on our common stock.
41
Because we incur additional leverage, general interest rate fluctuations may have a more significant negative impact on our investments than they would have absent such additional leverage and, accordingly, may have a material adverse effect on our investment objective and rate of return on investment capital.operating results. A portion of our income will depend upon the difference between the rate at which we borrow funds and the interest rate on the debt securities in which we invest. Because we borrow money to make investments and may issue debt securities, preferred stock or other securities, our net investment income is dependent upon the difference between the rate at which we borrow funds or pay interest or dividends on such debt securities, preferred stock or other securities and the rate at which we invest these funds. As such, a significant increase in market interest rates could both reduce the value of our portfolio investments and increase our cost of capital, which would reduce our net investment income. Conversely, a decrease in interest rates may have an adverse impact on our returns by requiring us to seek lower yields on our debt investments and by increasing the risk that our portfolio companies will prepay our debt investments, resulting in the need to redeploy capital at potentially lower rates. Typically, our interest earning investments accrue and pay interest at variable rates, and our interest-bearing liabilities accrue interest at variable or potentially fixed rates. As a result, there can be no assurance that a significant change in market interest rates will not have a material adverse effect on our net investment income.
The following table illustrates the effect of leverage on returns from an investment in our common stock assuming that we employ (i) our actual asset coverage ratio as of December 31, 20192021 and (ii) a hypothetical asset coverage ratio of 150%, each at various annual returns on our portfolio as of December 31, 2019,2021, net of expenses. The purpose of this table is to assist investors in understanding the effects of leverage. The calculations in the table below are hypothetical, and actual returns may be higher or lower than those appearing in the table below.
| Assumed Return on our Portfolio (Net of Expenses) | |||||||||||||||||
| (10.0) | % | (5.0) | % | 0.0 | % | 5.0 | % | 10.0 | % | ||||||||
| Corresponding return to common stockholder assuming actual asset coverage as of December 31, 2021(1) | (35.6) | % | (21.0) | % | (6.5) | % | 8.1 | % | 22.7 | % | |||||||
| Corresponding return to common stockholder assuming 150% asset coverage as of December 31, 2021(2) | (37.3) | % | (22.1) | % | (6.8) | % | 8.4 | % | 23.7 | % | |||||||
Assumed Return on our Portfolio (Net of Expenses) | ||||||||||
| (10.0 | )% | (5.0 | )% | 0.0 | % | 5.0 | % | 10.0 | % | |
| Corresponding return to common stockholder assuming actual asset coverage as of December 31, 2019(1) | (25.9 | )% | (14.9 | )% | (3.9 | )% | 7.1 | % | 18.0 | % |
| Corresponding return to common stockholder assuming 150% asset coverage as of December 31, 2019(2) | (36.8 | )% | (21.7 | )% | (6.6 | )% | 8.5 | % | 23.6 | % |
(1) Assumes $1,252.6$2,160.9 million in total assets, $675.6$1,407.0 million in debt outstanding, $570.9$741.9 million in net assets and an average cost of funds of 3.306%3.412%, which was the weighted average borrowing cost of our outstanding borrowings at December 31, 2019.2021. The assumed amount of debt outstanding for this example includes $352.5$655.2 million of outstanding borrowings under both the August 2018 Credit Facility and the February 2019 Credit Facility as of December 31, 2019, $318.22021, $50.0 million aggregate principal amount of August 2025 Notes (as defined below under “Management’s Discussion and Analysis of Financial Condition and Results of Operations—Liquidity and Capital Resources” included in Item 7 of Part II of this Annual Report on Form 10-K) outstanding, indebtedness$175.0 million aggregate principal amount of November Notes (as defined below under the Debt Securitization “Management’s Discussion and Analysis of Financial Condition and Results of Operations—Liquidity and Capital Resources” included in Item 7 of Part II of this Annual Report on Form 10-K) outstanding, $150.0 million aggregate principal amount of February Notes (as defined below under “Management’s Discussion and Analysis of December 31, 2019,Financial Condition and Results of Operations—Liquidity and Capital Resources” included in Item 7 of Part II of this Annual Report on Form 10-K) outstanding, $350.0 million aggregate principal amount of November 2026 Notes (as defined below under "Management's Discussion and Analysis of Financial Condition and Results of Operations - Liquidity and Capital Resources" included in Item 7 of Part II of this Annual Report on Form 10-K) outstanding, and assumed additional borrowings of $4.9$26.8 million to settle our payable from unsettled transactions as of December 31, 2019.2021.
(2) Assumes $1,723.7$2,264.6 million in total assets, $1,141.7$1,483.9 million in debt outstanding and $570.9$741.9 million in net assets as of December 31, 2019,2021, and an average cost of funds of 3.306%3.412%, which was the weighted average borrowing cost of our borrowings at December 31, 2019.2021.
Based on our total outstanding indebtedness of $670.7$1,380.2 million as of December 31, 2019,2021, assumed additional borrowings of $4.9$26.8 million to settle our net payable from unsettled transactions as of December 31, 20192021 and an average cost of funds of 3.306%3.412%, which was the weighted average borrowing cost of our outstanding borrowings at
42
December 31, 2021, our investment portfolio must experience an annual return of at least 2.22% to cover annual interest payments on our outstanding indebtedness.
Based on outstanding indebtedness of $1483.9 million calculated assuming a 150% asset coverage ratio and an average cost of funds of 3.412%, which was the weighted average borrowing cost of our outstanding borrowings at December 31, 2019,2021, our investment portfolio must experience an annual return of at least 1.78%2.24% to cover annual interest payments on our outstanding indebtedness.
We may in the future determine to fund a portion of our investments with preferred stock, which would magnify the potential for gain or loss and the risks of investing in us in the same way as our borrowings.
Preferred stock, which is another form of leverage, has the same risks to our common stockholders as borrowings because the dividends on any preferred stock we issue must be cumulative. Payment of such dividends and repayment of the liquidation preference of such preferred stock must take preference over any dividends or other payments to our common stockholders, and preferred stockholders are not subject to any of our expenses or losses and are not entitled to participate in any income or appreciation in excess of their stated preference.
Our Board of Directors may change our investment objectives, operating policies and strategies without prior notice or stockholder approval, the effects of which may be adverse.
The Board has the authority to modify or waive our current investment objectives, operating policies and strategies without prior notice and without stockholder approval (except as required by the 1940 Act). However, absent stockholder approval, we may not change the nature of our business so as to cease to be, or withdraw our election as, a BDC. We cannot predict the effect any changes to our current operating policies, investment criteria and strategies would have on our business, net asset value, operating results and value of our stock. However, the effects might be adverse, which could negatively impact our ability to pay you distributions and cause you to lose all or part of your investment. Moreover, we will have significant flexibility in investing the net proceeds from any future offering and may use the net proceeds from such offerings in ways with which investors may not agree or for purposes other than those contemplated at the time of the offering.
We will be subject to corporate-level U.S. federal income tax if we are unable to maintain our tax treatment as a regulated investment companyRIC under Subchapter M of the Code, which will adversely affect our results of operations and financial condition.
We have elected to be treated as a RIC under the Code, which generally will allow us to avoid being subject to corporate-level U.S. federal income tax. To obtain and maintain RIC tax treatment under the Code, we must meet the following annual distribution, income source and asset diversification requirements:
•The Annual Distribution Requirement for a RIC will be satisfied if we distribute to our stockholders on an annual basis at least 90.0% of our net ordinary income and net short-term capital gain in excess of net long-term capital loss, or ICTI.ICTI, if any. We will be subject to a 4.0% nondeductible U.S. federal excise tax, however, to the extent that we do not satisfy certain additional minimum distribution requirements on a calendar year basis. Because we use debt financing, we are subject to certain asset coverage ratio requirements under the 1940 Act and are currently, and may in the future become, subject to certain financial covenants under loan and credit agreements that could, under certain circumstances, restrict us from making distributions necessary to satisfy the Annual Distribution Requirement. If we are unable to obtain cash from other sources, we could fail to qualify for RIC tax treatment and thus become subject to corporate-level U.S. federal income tax.
•The income source requirement will be satisfied if we obtain at least 90.0% of our income for each year from distributions, interest, gains from the sale of stock or securities or similar sources.
•The asset diversification requirement will be satisfied if we meet certain asset diversification requirements at the end of each quarter of our taxable year. To satisfy this requirement, at least 50.0% of the value of our assets must consist of cash, cash equivalents, U.S. government securities, securities of other RICs, and other acceptable securities, provided such other securities of any one issuer do not represent more than 5% of the value of our assets or more than 10% of the outstanding voting securities
43
of the issuer; and no more than 25.0% of the value of our assets can be invested in the securities, other than U.S. government securities or securities of other RICs, of one issuer, of two or more issuers that are controlled, as determined under applicable Code rules, by us and that are engaged in the same or similar or related trades or businesses or of certain “qualified publicly traded partnerships.” Failure to meet these requirements may result in our having to dispose of certain investments quickly in order to prevent the loss of RIC tax treatment. Because most of our investments will be in private companies, and therefore will be relatively illiquid, any such dispositions could be made at disadvantageous prices and could result in substantial losses.
If we fail to qualify for or maintain RIC tax treatment for any reason and are subject to corporate-level U.S. federal income tax, the resulting corporate taxes could substantially reduce our net assets, the amount of income available for distribution and the amount of our distributions. We may also be subject to certain U.S. federal excise taxes, as well as state, local and foreign taxes.
We may not be able to pay distributions to our stockholders, our distributions may not grow over time, a portion of distributions paid to our stockholders may be a return of capital and investors in any debt securities we may issue may not receive all of the interest income to which they are entitled.
We intend to pay quarterly distributions to our stockholders out of assets legally available for distribution. We cannot assure you that we will achieve investment results that will allow us to make a specified level of cash distributions or year-to-year increases in cash distributions. Our ability to pay distributions might be harmed by, among other things, the risk factors described in this Annual Report on Form 10-K. In addition, the inability to satisfy the asset coverage test applicable to us as a BDC could, in the future, limit our ability to pay distributions. All distributions will be paid at the discretion of the Board and will depend on our earnings, our financial condition, maintenance of our RIC tax treatment, compliance with applicable BDC regulations, compliance with the covenants of the August 2018 Credit Facilityunder our financing agreements and any debt securities we may issue and such other factors as the Board may deem relevant from time to time. We cannot assure you that we will pay distributions to our stockholders in the future.
When we make quarterly distributions, we will be required to determine the extent to which such distributions are paid out of current or accumulated earnings and profits, recognized capital gain or capital. To the extent there is a return of capital, investors will be required to reduce their basis in our stock for U.S. federal income tax purposes, which may result in a higher tax liability when the shares are sold, even if they have not increased in value or have lost value.
We may have difficulty paying our required distributions if we recognize income before or without receiving cash representing such income.
For U.S. federal income tax purposes, we may be required to recognize taxable income in circumstances in which we do not receive a corresponding payment in cash. For example, if we hold debt obligations that are treated under applicable tax rules as having original issue discount (such as debt instruments with contractual PIK interest or in certain cases, increasing interest rates or debt instruments that were issued with warrants), we must include in income each year a portion of the original issue discount that accrues over the life of the obligation, regardless of whether cash representing such income is received by us in the same taxable year. Investments structured with these features may represent a higher level of credit risk compared to investments generating income which must be paid in cash on a current basis. We may also have to include in income other amounts that we have not yet received in cash, such as deferred loan origination fees that are paid after origination of the loan or are paid in non-cash compensation such as warrants or stock.PIK interest. We anticipate that a portion of our income may constitute original issue discount or other income required to be included in taxable income prior to receipt of cash. Further, we may elect to amortize market discounts and include such amounts in our taxable income in the current year, instead of upon disposition, as an election not to do so would limit our ability to deduct interest expenses for U.S. federal income tax purposes.
44
Because any original issue discount or other amounts accrued will be included in our ICTI for the year of the accrual, we may be required to make a distribution to our stockholders in order to satisfy the annual distribution requirement, even though we will not have received any corresponding cash amount. As a result, we may have difficulty meeting the annual distribution requirement necessary to obtain and maintain RIC tax treatment under the Code. We may have to sell some of our investments at times and/or at prices we would not consider advantageous, raise debt or additional equity capital or forgoforego new investment opportunities for this purpose. If we are not able to obtain cash from other sources, we may fail to qualify for RIC tax treatment and thus become subject to corporate-level U.S. federal income tax. For additional discussion regarding the tax implications of a RIC, see “Material U.S. Federal Income Tax Considerations — Taxation as a RIC” included in Item 1 of Part 1 of this Annual Report on Form 10-K.
Because we intend to distribute substantially all of our income to our stockholders to maintain our tax treatment as a regulated investment company,RIC, we will continue to need additional capital to finance our growth, and regulations governing our operation as a business development company will affect our ability to, and the way in which we, raise additional capital and make distributions.growth.
In order to satisfy the requirements applicable to a RIC, and to avoid payment of U.S. federal excise tax, we intend to distribute to our stockholders substantially all of our net ordinary income and net capital gain income except for certain net long-term capital gains recognized after we became a RIC, some or all of which we may retain, pay applicable U.S. federal income taxes with respect thereto and elect to treat as deemed distributions to our stockholders. As a BDC, we generally are required to meet a coverage ratio of total assets to total senior securities, which includes all of our borrowings and any preferred stock we may issue, of at least 150%. This requirement limits the amount that we may borrow and may prohibit us from making distributions. If the value of our assets declines, we may be unable to satisfy this test. If that happens, we may be required to sell a portion of our investments or sell additional securities and, depending on the nature of our leverage, to repay a portion of our
indebtedness at a time when such sales may be disadvantageous. In addition, issuance of additional securities could dilute the percentage ownership of our current stockholders in us.
While we expect to be able to borrow and to issue debt and additional equity securities, we cannot assure you that debt and equity financing will be available to us on favorable terms, or at all. If additional funds are not available to us, we could be forced to curtail or cease new investment activities, and our net asset value could decline. In addition, as a BDC, we generally are not permitted to issue equity securities priced below our then-current net asset value per share without stockholder approval.
There is no assurance that any future share repurchase plans will result in future repurchases of our common stock or enhance long-term stockholder value, and repurchases, if any, could affect our stock price and increase its volatility and will diminish our cash reserves.
There can be no assurance that any future share repurchases will occur, or, if they occur, that they will enhance stockholder value. In addition, any future share repurchases could have a material adverse effect on our business for the following reasons:
•Repurchases may not prove to be the best use of our cash resources.
•Repurchases will diminish our cash reserves, which could impact our ability to finance future growth and to pursue possible future strategic opportunities.
•We may incur debt in connection with our business in the event that we use other cash resources to repurchase shares, which may affect the financial performance of our business during future periods or our liquidity and the availability of capital for other needs of the business.
•Repurchases could affect the trading price of our common stock or increase its volatility and may reduce the market liquidity for our stock.
45
•Repurchases may not be made at the best possible price and the market price of our common stock may decline below the levels at which we repurchased shares of common stock.
•Any suspension, modification or discontinuance of any future share repurchase plan could result in a decrease in the trading price of our common stock.
•Repurchases may make it more difficult for us to meet the diversification requirements necessary to qualify for tax treatment as a RIC for U.S. federal income tax purposes; failure to qualify for tax treatment as a RIC would render our taxable income subject to corporate-level U.S. federal income taxes.
•Repurchases may cause our non-compliance with covenants under the August 2018 Credit Facility or the February 2019 Credit Facility,our financing agreements, which could have an adverse effect on our operating results and financial condition.
We are highly dependent on information systems and systems failures could significantly disrupt our business, which may, in turn, negatively affect our liquidity, financial condition and results of operations, the market price of our common stock and our ability to pay dividends and other distributions.operations.
Our business depends on the communications and information systems of Barings, its affiliates and our or Barings' third-party service providers. Any failure or interruption of those systems or services, including as a result of the termination or suspension of an agreement with any third-party service providers, could cause delays or other problems in our or Barings’ business activities. Our or Barings’ financial, accounting, data processing, backup or other operating systems and facilities may fail to operate properly or become disabled or damaged as a result of a number of factors including events that are wholly or partially beyond our control and adversely affect our business. Among other things, there could be sudden electrical or telecommunications outages, natural disasters, disease pandemics, events arising from local or larger scale political or social matters and/or cyber-attacks, any one or more of which could have a material adverse effect on our business, financial condition and operating results and negatively affect the market price of our common stock and our ability to pay dividends to our stockholders.stock.
Cybersecurity risks and cyber incidents may adversely affect our business or the business of our portfolio companies by causing a disruption to our operations or the operations of our portfolio companies, a compromise or corruption of our confidential information or the confidential information of our portfolio companies and/or damage to our business relationships or the business relationships of our portfolio companies, all of which could negatively impact the business, financial condition and operating results of us or our portfolio companies.
A cyber incident is considered to be any adverse event that threatens the confidentiality, integrity or availability of the information resources of us, Barings or our portfolio companies. These incidents may be an intentional attack or an unintentional event and could involve gaining unauthorized access to our or Barings’ information systems or those of our portfolio companies for purposes of misappropriating assets, stealing confidential information, corrupting data or causing operational disruption. Barings’ employees may be the target of fraudulent calls, emails and other forms of activities. The result of these incidents may include disrupted operations, misstated or unreliable financial data, liability for stolen assets or information, increased cybersecurity protection and insurance costs, litigation and damage to business relationships. The costs related to cyber or other security threats or disruptions may not be fully insured or indemnified by other means. As our and our portfolio companies’ reliance on technology has increased, so have the risks posed to our information systems, both internal and those provided by Barings and third-party service providers, and the information systems of our portfolio companies. Barings has implemented processes, procedures and internal controls to help mitigate cybersecurity risks and cyber intrusions, but these measures, as well as our increased awareness of the nature and extent of a risk of a cyber incident, do not guarantee that a cyber incident will not occur and/or that our financial results, operations or confidential information will not be negatively impacted by such an incident. In addition, cybersecurity has become a top priority for regulators around the world, and some jurisdictions have enacted laws requiring companies to notify individuals of data security breaches involving certain types of personal data. If we fail to comply with the relevant laws and regulations, we could suffer financial losses, a disruption of our business, liability to investors, regulatory intervention or reputational damage.
46
Our business and operations may be negatively affected by securities litigation or stockholder activism, which could cause us to incur significant expense, hinder execution of our investment strategy and impact our stock price.
In the past, following periods of volatility in the market price of a company’s securities, securities class-action litigation has often been brought against that company. In addition, stockholder activism, which could take many forms or arise in a variety of situations, including making public demands that we consider strategic alternatives, engaging in public campaigns to attempt to influence our corporate governance and/or our management, and commencing proxy contests to attempt to elect the activists' representatives or others to the Board, or arise in a variety of situations, has been increasingincreased in the BDC space recently.in recent years. For example, we and certain of our former executive officers have previously been named defendants in two separatea class-action lawsuitslawsuit asserting claims under Section 10(b) and Section 20(a) of the Exchange Act, and, due to the potential volatility of our stock price and for a variety of other reasons, we may in the future become the target of further securities litigation or stockholder activism. See “Legal Proceedings” in Item 3 of Part I of this Annual Report on Form 10-K for more information. Securities litigation and stockholder activism, including
potential proxy contests, may result in substantial costs and divert management’s and the Board's attention and resources from our business. Additionally, such securities litigation and stockholder activism could give rise to perceived uncertainties as to our future, adversely affect our relationships with service providers and make it more difficult for Barings to attract and retain qualified personnel. Also, we may be required to incur significant legal fees and other expenses related to any securities litigation and activist stockholder matters. Further, our stock price could be subject to significant fluctuation or otherwise be adversely affected by the events, risks and uncertainties of any securities litigation and stockholder activism.
Risks Relating to Our Investments
Our investments in portfolio companies may be risky, and we could lose all or part of our investment.
Our portfolio consists primarily of syndicated senior secured loans and senior secured private, middle-market debt and equity investments. Investing in private and middle-market companies involves a number of significant risks. Among other things, these companies:
•may have limited financial resources to meet future capital needs and thus may be unable to grow or meet their obligations under their debt instruments that we hold, which may be accompanied by a deterioration in the value of any collateral and a reduction in the likelihood of us realizing any guarantees from subsidiaries or affiliates of our portfolio companies that we may have obtained in connection with our investment, as well as a corresponding decrease in the value of the equity components of our investments;
•may have shorter operating histories, narrower product lines, smaller market shares and/or more significant customer concentration than larger businesses, which tend to render them more vulnerable to competitors’ actions and market conditions, as well as general economic downturns;
•are more likely to depend on the management talents and efforts of a small group of persons; therefore, the death, disability, resignation or termination of one or more of these persons could have a material adverse impact on our portfolio company and, in turn, on us;
•generally have less predictable operating results, may be engaged in rapidly changing businesses with products subject to a substantial risk of obsolescence, and may require substantial additional capital to support their operations, finance expansion or maintain their competitive position; and
•generally have less publicly available information about their businesses, operations and financial condition. We rely on the ability of Barings' investment professionals to obtain adequate information to evaluate the potential returns from investing in these companies. If Barings is unable to uncover all material information about these companies, we may not make a fully informed investment decision, and we may lose all or part of our investment.
In addition, in the course of providing significant managerial assistance to certain of our portfolio companies, certain of our officers and directors or certain of Barings' investment professionals may serve as directors on the boards of such companies. We or Barings may in the future be subject to litigation that arises out of our investments
47
in these companies, and our officers and directors or Barings and/or its investment professionals may be named as defendants in such litigation, which could result in an expenditure of funds (through our indemnification of such officers and directors) and the diversion of our officers', directors' and Barings' time and resources.
The lack of liquidity in our investments may adversely affect our business.
We generally invest in companies whose securities are not publicly traded, and whose securities may be subject to legal and other restrictions on resale, or are otherwise less liquid than publicly traded securities. The illiquidity of these investments may make it difficult for us to sell these investments when desired. In addition, if we are required to liquidate all or a portion of our portfolio quickly, we may realize significantly less than the value at which we had previously recorded these investments. Our investments may be subject to contractual or legal restrictions on resale or are otherwise illiquid because there may be no established trading market for certain investments. The illiquidity of certain of our investments may make it difficult for us to dispose of them at a favorable price, and, as a result, we may suffer losses.
Price declines and illiquidity in the corporate debt markets may adversely affect the fair value of our portfolio investments, reducing our net asset value through increased net unrealized depreciation.
As a BDC, we are required to carry our investments at market value or, if no market value is ascertainable, at fair value as determined in good faith by the Board. As part of the valuation process, we may take into account the following types of factors, if relevant, in determining the fair value of our investments:
•a comparison of the portfolio company’s securities to publicly traded securities;
•the enterprise value of the portfolio company;
•the nature and realizable value of any collateral;
•the portfolio company’s ability to make payments and its earnings and discounted cash flow;
•the markets in which the portfolio company does business; and
•changes in the interest rate environment and the credit markets generally that may affect the price at which similar investments may be made in the future and other relevant factors.
When an external event such as a purchase transaction, public offering or subsequent equity sale occurs, we use the pricing indicated by the external event to corroborate our valuation. We record decreases in the market values or fair values of our investments as unrealized depreciation. Declines in prices and liquidity in the corporate debt markets may result in significant net unrealized depreciation in our portfolio. The effect of all of these factors on our portfolio may reduce our net asset value by increasing net unrealized depreciation in our portfolio. Depending on market conditions, we could incur substantial realized losses and may suffer additional unrealized losses in future periods, which could have a material adverse effect on our business, financial condition, results of operations and cash flows.
Our failure to make follow-on investments in our portfolio companies could impair the value of our portfolio.
Following an initial investment in a portfolio company, we may make additional investments in that portfolio company as “follow-on” investments, in seeking to:
•increase or maintain in whole or in part our position as a creditor or equity ownership percentage in a portfolio company;
•exercise warrants, options or convertible securities that were acquired in the original or subsequent financing; or
•preserve or enhance the value of our investment.
We have discretion to make follow-on investments, subject to the availability of capital resources. Failure on our part to make follow-on investments may, in some circumstances, jeopardize the continued viability of a portfolio company and our initial investment, or may result in a missed opportunity for us to increase our participation in a successful portfolio company. Even if we have sufficient capital to make a desired follow-on investment, we may elect not to make a follow-on investment because we may not want to increase our level of risk, because we prefer other opportunities or because of regulatory or other considerations. Our ability to make follow-on investments may also be limited by Barings’ allocation policy.
48
Our portfolio companies may incur debt that ranks equally with, or senior to, our investments in such companies and such portfolio companies may not generate sufficient cash flow to service their debt obligations to us.
We typically invest in senior debt and first lien notes, however, we have invested, and may invest in the future, a portion of our capital in second lien and subordinated loans issued by our portfolio companies. Our portfolio companies may have, or be permitted to incur, other debt that ranks equally with, or senior to, the debt securities in which we invest. Such subordinated investments are subject to greater risk of default than senior obligations as a result of adverse changes in the financial condition of the obligor or in general economic conditions. If we make a subordinated investment in a portfolio company, the portfolio company may be highly leveraged, and its relatively high debt-to-equity ratio may create increased risks that its operations might not generate sufficient cash flow to service all of its debt obligations. By their terms, such debt instruments may provide that the holders are entitled to receive payment of interest or principal on or before the dates on which we are entitled to receive payments in respect of the securities in which we invest. These debt instruments would usually prohibit the portfolio companies from paying interest on or repaying our investments in the event of and during the continuance of a default under such debt. Also, in the event of insolvency, liquidation, dissolution, reorganization or bankruptcy of a portfolio company, holders of securities ranking senior to our investment in that portfolio company would typically be entitled to receive payment in full before we receive any distribution in respect of our investment. After repaying senior creditors, the portfolio company may not have any remaining assets to use for repaying its obligation to us where we are junior creditor. In the case of debt ranking equally with debt securities in which we invest, we would have to share any distributions on an equal and ratable basis with other creditors holding such debt in the event of an insolvency, liquidation, dissolution, reorganization or bankruptcy of the relevant portfolio company.
Additionally, certain loans that we make to portfolio companies may be secured on a second priority basis by the same collateral securing senior secured debt of such companies. The first priority liens on the collateral will secure the portfolio company’s obligations under any outstanding senior debt and may secure certain other future debt that may be permitted to be incurred by the portfolio company under the agreements governing the loans. The holders of obligations secured by first priority liens on the collateral will generally control the liquidation of, and be entitled to receive proceeds from, any realization of the collateral to repay their obligations in full before us. In addition, the value of the collateral in the event of liquidation will depend on market and economic conditions, the availability of buyers and other factors. There can be no assurance that the proceeds, if any, from sales of all of the collateral would be sufficient to satisfy the loan obligations secured by the second priority liens after payment in full of all obligations secured by the first priority liens on the collateral. If such proceeds were not sufficient to repay amounts outstanding under the loan obligations secured by the second priority liens, then we, to the extent not repaid from the proceeds of the sale of the collateral, will only have an unsecured claim against the portfolio company’s remaining assets, if any.
We may in the future make unsecured loans to portfolio companies, meaning that such loans will not benefit from any interest in collateral of such companies. Liens on a portfolio company’s collateral, if any, will secure the portfolio company’s obligations under its outstanding secured debt and may secure certain future debt that is permitted to be incurred by the portfolio company under its secured loan agreements. The holders of obligations secured by such liens will generally control the liquidation of, and be entitled to receive proceeds from, any realization of such collateral to repay their obligations in full before us. In addition, the value of such collateral in the event of liquidation will depend on market and economic conditions, the availability of buyers and other factors. There can be no assurance that the proceeds, if any, from sales of such collateral would be sufficient to satisfy our unsecured loan obligations after payment in full of all loans secured by collateral. If such proceeds were not sufficient to repay the outstanding secured loan obligations, then our unsecured claims would rank equally with the unpaid portion of such secured creditors’ claims against the portfolio company’s remaining assets, if any.
The rights we may have with respect to the collateral securing any junior priority loans we make to our portfolio companies may also be limited pursuant to the terms of one or more intercreditor agreements that we enter into with the holders of senior debt. Under a typical intercreditor agreement, at any time that obligations that have the benefit of the first priority liens are outstanding, any of the following actions that may be taken in respect of the collateral will be at the direction of the holders of the obligations secured by the first priority liens:
49
•the ability to cause the commencement of enforcement proceedings against the collateral;
•the ability to control the conduct of such proceedings;
•the approval of amendments to collateral documents;
•releases of liens on the collateral; and
•waivers of past defaults under collateral documents.
We may not have the ability to control or direct such actions, even if our rights as junior lenders are adversely affected.
There may be circumstances where our debt investments could be subordinated to claims of other creditors or we could be subject to lender liability claims.
Even thoughif we have structured the majority of our investmentsstructure an investment as a senior loans,loan, if one of our portfolio companies were to go bankrupt, depending on the facts and circumstances and based upon principles of equitable subordination as defined by existing case law, a bankruptcy court could subordinate all or a portion of our claim to that of other creditors and transfer any lien securing such subordinated claim to the bankruptcy estate. The principles of equitable subordination defined by case law have generally indicated that a claim may be subordinated only if its holder is guilty of misconduct or where the senior loan is re-characterized as an equity investment and the senior lender has actually provided significant managerial assistance to the bankrupt debtor. We may also be subject to lender liability claims for actions taken by us with respect to a borrower’s business or instances where we exercise control over the borrower. It is possible that we could become subject to a lender’s liability claim, including as a result of actions taken in rendering managerial assistance or actions to compel and collect payments from the borrower outside the ordinary course of business.
Second priority liens on collateral securing loans that we make to our portfolio companies may be subject to control by senior creditors with first priority liens. If there is a default, the value of the collateral may not be sufficient to repay in full both the first priority creditors and us.
Certain loans that we make are secured by a second priority security interest in the same collateral pledged by a portfolio company to secure senior debt owed by the portfolio company to commercial banks or other traditional lenders. Often the senior lender has procured covenants from the portfolio company prohibiting the incurrence of additional secured debt without the senior lender’s consent. Prior to and as a condition of permitting the portfolio company to borrow money from us secured by the same collateral pledged to the senior lender, the senior lender will require assurances that it will control the disposition of any collateral in the event of bankruptcy or other default. In many such cases, the senior lender will require us to enter into an “intercreditor agreement” prior to permitting the portfolio company to borrow from us. Typically the intercreditor agreements we are requested to execute expressly subordinate our debt instruments to those held by the senior lender and further provide that the senior lender shall control: (i) the commencement of foreclosure or other proceedings to liquidate and collect on the collateral; (ii) the nature, timing and conduct of foreclosure or other collection proceedings; (iii) the amendment of any collateral document; (iv) the release of the security interests in respect of any collateral and (v) the waiver of defaults under any security agreement. Because of the control we may cede to senior lenders under intercreditor agreements we may enter, we may be unable to realize the proceeds of any collateral securing some of our loans.
Finally, the value of the collateral securing our debt investment will ultimately depend on market and economic conditions, the availability of buyers and other factors. Therefore, there can be no assurance that the proceeds, if any, from the sale or sales of all of the collateral would be sufficient to satisfy the loan obligations secured by our second priority liens after payment in full of all obligations secured by the senior lender’s first priority liens on the collateral. There is also a risk that such collateral securing our investments may decrease in
value over time, may be difficult to sell in a timely manner, may be difficult to appraise and may fluctuate in value based upon the success of the portfolio company and market conditions. If such proceeds are not sufficient to repay amounts outstanding under the loan obligations secured by our second priority liens, then we, to the extent not
50
repaid from the proceeds from the sale of the collateral, will only have an unsecured claim against the company’s remaining assets, if any.
Covenant-Lite Loans may expose us to different risks, including with respect to liquidity, price volatility, ability to restructure loans, credit risks and less protective loan documentation, than is the case with loans that contain financial maintenance covenants.
A significant number of high yield loans in the market, in particular the broadly syndicated loan market, may consist of covenant-lite loans, or “Covenant-Lite Loans.” A significant portion of the loans in which we may invest or get exposure to through our investments may be deemed to be Covenant-Lite Loans and it is possible that such loans may comprise a majority of our portfolio. Such loans do not require the borrower to maintain debt service or other financial ratios and do not include terms which allow the lender to monitor the performance of the borrower and declare a default if certain criteria are breached. Ownership of Covenant-Lite Loans may expose us to different risks, including with respect to liquidity, price volatility, ability to restructure loans, credit risks and less protective loan documentation, than is the case with loans that contain financial maintenance covenants.
Our investments in foreign companies may involve significant risks in addition to the risks inherent in U.S. investments.
Our investment strategy includes investments in foreign companies. Investing in foreign companies may expose us to additional risk not typically associated with investing in U.S. companies. These risks include changes in exchange control regulations, political and social instability, expropriation, imposition of foreign taxes (potentially at confiscatory levels), less liquid markets, less available information than is generally the case in the United States, higher transaction costs, less government supervision of exchanges, brokers and issuers, less developed bankruptcy laws, difficulty in enforcing contractual obligations, lack of uniform accounting and auditing standards and greater price volatility.
Although the majority of our investments are currently and are expected to be U.S.-dollar denominated, our investments that are denominated in a foreign currency will be subject to the risk that the value of a particular currency will change in relation to one or more other currencies. Among the factors that may affect currency values are trade balances, the level of short-term interest rates, differences in relative values of similar assets in different currencies, long-term opportunities for investment and capital appreciation and political developments. We may employ hedging techniques to minimize these risks, but we cannot assure you that such strategies will be effective or without risk to us.
We may expose ourselves to risks if we engage in hedging transactions.
We have and may in the future enter into hedging transactions, which may expose us to risks associated with such transactions. We have and may continue to utilize instruments such as forward contracts, currency options and interest rate swaps, caps, collars and floors to seek to hedge against fluctuations in the relative values of our portfolio positions from changes in currency exchange rates and market interest rates. Use of these hedging instruments may include counter-party credit risk. Hedging against a decline in the values of our portfolio positions does not eliminate the possibility of fluctuations in the values of such positions or prevent losses if the values of such positions decline. However, such hedging can establish other positions designed to gain from those same developments, thereby offsetting the decline in the value of such portfolio positions. Such hedging transactions may also limit the opportunity for gain if the values of the underlying portfolio positions should increase. Moreover, it may not be possible to hedge against an exchange rate or interest rate fluctuation that is so generally anticipated that we are not able to enter into a hedging transaction at an acceptable price. The success of our hedging transactions will depend on our ability to correctly predict movements in currencies and interest rates. Therefore, while we may enter into such transactions to seek to reduce currency exchange rate and interest rate risks, unanticipated changes in currency exchange rates or interest rates may result in poorer overall investment performance than if we had not engaged in any such hedging transactions. In addition, the degree of correlation between price movements of the instruments used in a hedging strategy and price movements in the portfolio positions being hedged may vary. Moreover, for a variety of reasons, we may not seek to (or be able to) establish a perfect correlation between such hedging instruments and the portfolio holdings being hedged. Any such imperfect correlation may prevent us from
51
achieving the intended hedge and expose us to risk of loss. In addition, it may not be possible to hedge fully or perfectly against currency fluctuations affecting the value of securities denominated in non- U.S.non-U.S. currencies because the value of those securities is likely to fluctuate as a result of factors not related to currency fluctuations.
If we do not invest a sufficient portion of our assets in qualifying assets, we could fail to qualify as a business development companyBDC or be precluded from investing according to our current business strategy.
As a BDC, we may not acquire any assets other than “qualifying assets” unless, at the time of and after giving effect to such acquisition, at least 70.0% of our total assets are qualifying assets. For further detail, see “Regulation“Item 1. —
Business — Regulation of Business Development Companies” included in Item 1 of Part I of this Annual Report on Form 10-K.
We may be precluded from investing in what we believe are attractive investments if such investments are not qualifying assets for purposes of the 1940 Act. If we do not invest a sufficient portion of our assets in qualifying assets, we could lose our status as a BDC. If we fail to maintain our status as a BDC, we might be regulated as a closed-end investment company that is required to register under the 1940 Act, which would subject us to additional regulatory restrictions and significantly decrease our operating flexibility. In addition, any such failure could cause an event of default under our outstanding indebtedness. For these reasons, loss of BDC status likely would have a material adverse effect on our business, financial condition and results of operations. Similarly, these rules could prevent us from making follow-on investments in existing portfolio companies (which could result in the dilution of our position).
We are a non-diversified investment company within the meaning of the 1940 Act, and therefore we are not limited with respect to the proportion of our assets that may be invested in securities of a single issuer.
We are classified as a non-diversified investment company within the meaning of the 1940 Act, which means that we are not limited by the 1940 Act with respect to the proportion of our assets that we may invest in securities of a single issuer. To the extent that we assume large positions in the securities of a small number of issuers, our net asset value may fluctuate to a greater extent than that of a diversified investment company as a result of changes in the financial condition or the market’s assessment of the issuer.issuer or industry in which it operates. We may also be more susceptible to any single economic or regulatory occurrence than a diversified investment company. Beyond our RIC asset diversification requirements under the Code and certain investment diversification requirements under our financial agreements, we do not have fixed guidelines for diversification, and our investments could be concentrated in relatively few portfolio companies.
We generally will not control our portfolio companies.
We do not, and do not expect to, control most of our portfolio companies, even though we or Barings may have board representation or board observation rights, and our debt agreements with such portfolio companies may contain certain restrictive covenants. As a result, we are subject to the risk that a portfolio company in which we invest may make business decisions with which we disagree, and the management of such company, as representatives of the holders of their common equity, may take risks or otherwise act in ways that do not serve our interests as debt investors. Due to the lack of liquidity for our investments in non-traded companies, we may not be able to dispose of our interests in our portfolio companies as readily as we would like or at an appropriate valuation. As a result, a portfolio company may make decisions that could decrease the value of our portfolio holdings.
Prepayments of our debt investments by our portfolio companies could adversely impact our results of operations and reduce our return on equity.
We are subject to the risk that the investments we make in our portfolio companies may be repaid prior to maturity. When this occurs, we will generally reinvest these proceeds in temporary investments, pending their future investment in new portfolio companies. These temporary investments will typically have substantially lower yields than the debt being prepaid and we could experience significant delays in reinvesting these amounts. Any future investment in a new portfolio company may also be at lower yields than the debt that was repaid. As a result, our results of operations could be materially adversely affected if one or more of our portfolio companies elect to prepay amounts owed to us. Additionally, prepayments could negatively impact our return on equity, which could result in a decline in the market price of our securities.
52
Any unrealized losses we experience on our loan portfolio may be an indication of future realized losses, which could reduce our income available for distribution.
As a BDC, we are required to carry our investments at market value or, if no market value is ascertainable, at the fair value as determined in good faith by the Board. Decreases in the market values or fair values of our investments will be recorded as unrealized depreciation. Any unrealized losses in our loan portfolio could be an indication of a portfolio company’s inability to meet its repayment obligations to us with respect to the affected loans. This could result in realized losses in the future and ultimately in reductions of our income available for distribution in future periods.
Defaults by our portfolio companies may harm our operating results.
A portfolio company’s failure to satisfy financial or operating covenants imposed by us or other lenders could lead to defaults and, potentially, termination of its loans and foreclosure on its secured assets, which could trigger cross-defaults under other agreements and jeopardize a portfolio company’s ability to meet its obligations under the debt or equity securities that we hold. We may incur expenses to the extent necessary to seek recovery upon default or to negotiate new terms, which may include the waiver of certain financial covenants, with a defaulting portfolio company.
We may not realize gains from our equity investments.
Certain investments that we have made in the past and may make in the future include equity securities. Investments in equity securities involve a number of significant risks, including the risk of further dilution as a result of additional issuances, inability to access additional capital and failure to pay current distributions. Investments in preferred securities involve special risks, such as the risk of deferred distributions, credit risk, illiquidity and limited voting rights. In addition, we may from time to time make non-control, equity co-investments in companies in conjunction with private equity sponsors. Our goal is ultimately to realize gains upon our disposition of such equity interests. However, the equity interests we receive may not appreciate in value and, in fact, may decline in value. Accordingly, we may not be able to realize gains from our equity interests, and any gains that we do realize on the disposition of any equity interests may not be sufficient to offset any other losses we experience. We also may be unable to realize any value if a portfolio company does not have a liquidity event, such as a sale of the business, recapitalization or public offering, which would allow us to sell the underlying equity interests.
Our investments in asset-backed securities are subject to additional risks.
Asset-backed securities often involve risks that are different from or more acute than risks associated with other types of debt instruments. For instance, asset-backed securities may be particularly sensitive to changes in prevailing interest rates. In addition, the underlying assets may be subject to prepayments that shorten the securities' weighted average maturity and may lower their return. Asset-backed securities are also subject to risks associated with their structure and the nature of the assets underlying the security and the servicing of those assets. Payment of interest and repayment of principal on asset-backed securities is largely dependent upon the cash flows generated by the assets backing the securities. Certain asset-backed securities are supported by letters of credit, surety bonds or other credit enhancements. However, if many borrowers on the underlying assets default, losses could exceed the credit enhancement level and result in losses to investors, such as the Company. The values of asset-backed securities may be substantially dependent on the servicing of the underlying asset pools, and are therefore subject to risks associated with the negligence by, or defalcation of, their servicers. Furthermore, debtors may be entitled to the protection of a number of state and federal consumer credit laws with respect to the assets underlying these securities, which may give the debtor the right to avoid or reduce payment.
53
Our investments in collateralized loan obligation vehicles are subject to additional risks.
We may invest in debt and equity interests of collateralized loan obligation (“CLO”) vehicles. Generally, there may be less information available to us regarding the underlying debt investments held by such CLOs than if we had invested directly in the debt of the underlying companies. As a result, we and our stockholders may not know the details of the underlying holdings of the CLO vehicles in which we may invest.
As a BDC, we may not acquire equity and junior debt investments in CLO vehicles unless, at the time of and after giving effect to such acquisition, at least 70% of our total assets are “qualifying assets.” CLO vehicles that we expect to invest in are typically very highly leveraged, and therefore, the junior debt and equity tranches that we expect to invest in are subject to a higher degree of risk of total loss. In particular, investors in CLO vehicles indirectly bear risks of the underlying debt investments held by such CLO vehicles. We will generally have the right to receive payments only from the CLO vehicles, and will generally not have direct rights against the underlying borrowers or the entity that sponsored the CLO vehicle. While the CLO vehicles we intend to target generally enable the investor to acquire interests in a pool of leveraged corporate loans without the expenses associated with directly holding the same investments, we will generally pay a proportionate share of the CLO vehicles’ administrative and other expenses. Although it is difficult to predict whether the prices of indices and securities underlying CLO vehicles will rise or fall, these prices (and, therefore, the prices of the CLO vehicles) will be influenced by the same types of political and economic events that affect issuers of securities and capital markets generally. The failure by a CLO vehicle in which we invest to satisfy certain financial covenants, specifically those with respect to adequate collateralization and/or interest coverage tests, could lead to a reduction in its payments to us. In the event that a CLO vehicle failed those tests, holders of debt senior to us may be entitled to additional payments that would, in turn, reduce the payments we would otherwise be entitled to receive. If any of these occur, it could materially and adversely affect our operating results and cash flows.
In addition to the general risks associated with investing in debt securities, CLO vehicles carry additional risks, including, but not limited to: (i) the possibility that distributions from collateral securities will not be adequate to make interest or other payments; (ii) the quality of the collateral may decline in value or default;(iii) the fact that our investments in CLO tranches will likely be subordinate to other senior classes of note tranches thereof; and (iv) the complex structure of the security may not be fully understood at the time of investment and may produce disputes with the CLO vehicle or unexpected investment results. Our net asset value may also decline over time if our principal recovery with respect to CLO equity investments is less than the price we paid for those investments.
Investments in structured vehicles, including equity and junior debt instruments issued by CLO vehicles, involve risks, including credit risk and market risk. Changes in interest rates and credit quality may cause significant price fluctuations. Additionally, changes in the underlying leveraged corporate loans held by a CLO vehicle may cause payments on the instruments we hold to be reduced, either temporarily or permanently. Structured investments, particularly the subordinated interests in which we intend to invest, may be less liquid than many other types of securities and may be more volatile than the leveraged corporate loans underlying the CLO vehicles we intend to target. Fluctuations in interest rates may also cause payments on the tranches of CLO vehicles that we hold to be reduced, either temporarily or permanently.
Any interests we acquire in CLO vehicles will likely be thinly traded or have only a limited trading market and may be subject to restrictions on resale. Securities issued by CLO vehicles are generally not listed on any U.S. national securities exchange and no active trading market may exist for the securities of CLO vehicles in which we may invest. Although a secondary market may exist for our investments in CLO vehicles, the market for our investments in CLO vehicles may be subject to irregular trading activity, wide bid/ask spreads and extended trade settlement periods. As a result, these types of investments may be more difficult to value. In addition, our investments in CLO warehouse facilities are short term investments and therefore may be subject to a greater risk relating to market conditions and economic recession or downturns.
We may be subject to risks associated with syndicated loans.
From time to time, we may acquire interests in syndicated loans. Under the documentation for syndicated loans, a financial institution or other entity typically is designated as the administrative agent and/or collateral agent.
54
This agent is granted a lien on any collateral on behalf of the other lenders and distributes payments on the indebtedness as they are received. The agent is the party responsible for administering and enforcing the loan and generally may take actions only in accordance with the instructions of a majority or two-thirds in commitments and/or principal amount of the associated indebtedness. In most cases, we do not expect to hold a sufficient amount of the indebtedness to be able to compel any actions by the agent. Consequently, we would only be able to direct such actions if instructions from us were made in conjunction with other holders of associated indebtedness that together with us compose the requisite percentage of the related indebtedness then entitled to take action. Conversely, if holders of the required amount of the associated indebtedness other than us desire to take certain actions, such actions may be taken even if we did not support such actions. Furthermore, if an investment is subordinated to one or more senior loans made to the applicable obligor, our ability to exercise such rights may be subordinated to the exercise of such rights by the senior lenders. Accordingly, we may be precluded from directing such actions unless we act together with other holders of the indebtedness. If we are unable to direct such actions, we cannot assure you that the actions taken will be in our best interests.
If an investment is a syndicated revolving loan or delayed drawdown loan, other lenders may fail to satisfy their full contractual funding commitments for such loan, which could create a breach of contract, result in a lawsuit by the obligor against the lenders and adversely affect the fair market value of our investment.
There is a risk that a loan agent in respect of one of our loans may become bankrupt or insolvent. Such an event would delay, and possibly impair, any enforcement actions undertaken by holders of the associated indebtedness, including attempts to realize upon the collateral securing the associated indebtedness and/or direct the agent to take actions against the related obligor or the collateral securing the associated indebtedness and actions to realize on proceeds of payments made by obligors that are in the possession or control of any other financial institution. In addition, we may be unable to remove the agent in circumstances in which removal would be in our best interests. Moreover, agented loans typically allow for the agent to resign with certain advance notice.
Our special situations investments involve a high degree of credit and market risk.
Our special situations investments, which consist of investments in the securities and debt of financially troubled issuers or borrowers and operationally troubled issuers or borrowers, involve a high degree of credit and market risk. Although the Company may invest in select companies that, in the view of Barings, have the potential over the long-term for capital growth, there can be no assurance that such financially troubled issuers or operationally troubled issuers can be successfully transformed into profitable operating companies. There is a possibility that the Company may incur substantial or total losses on investments or that such investments may not show any return for a considerable period of time. Under such circumstances, the returns generated from the investments may not compensate investors adequately for the risks assumed.
The level of analytical sophistication, both financial and legal, necessary for successful investment in companies experiencing significant business and financial difficulties is unusually high. There can be no assurance that Barings will correctly evaluate the value of a company’s assets or the prospects for a successful reorganization or similar action. During an economic downturn or recession, securities of financially troubled or operationally troubled issuers and borrowers are more likely to go into default than securities of other issuers. In addition, it may be difficult to obtain information about such issuers and borrowers.
Securities and debt of financially troubled issuers or borrowers and operationally troubled issuers or borrowers are less liquid and more volatile than securities of companies not experiencing financial or operational difficulties. The market prices of such securities are subject to erratic and abrupt market movements, and the spread between bid and asked prices may be greater than normally expected. In addition, it is anticipated that many investments may not be widely traded and that the Company’s investment in such securities may be substantial relative to the market for such securities. As a result, the Company may experience delays and incur losses and other costs in connection with the sale of investments.
Troubled company and other asset-based investments require active monitoring and may, at times, require participation in business strategy or reorganization proceedings by Barings. To the extent that Barings becomes involved in such proceedings, the Company may have a more active participation in the affairs of the issuer than that
55
assumed generally by an investor. In addition, involvement by Barings in an issuer’s reorganization proceedings could result in the imposition of restrictions limiting the Company’s ability to liquidate its position in the issuer or increase the likelihood of the Company being involved in litigation.
Risks Relating to Our Securities
Shares of closed-end investment companies, including business development companies,BDCs, frequently trade at a discount to their net asset value, and may trade at premiums that may prove to be unsustainable.
Shares of closed-end investment companies, including BDCs, frequently trade at a discount from net asset value, and may trade at premiums that may prove to be unsustainable. This characteristic of closed-end investment companies and BDCs is separate and distinct from the risk that our net asset value per share may decline. We cannot predict whether our common stock will trade at, above or below net asset value. The risk of purchasing shares of a BDC that might trade at a discount or unsustainable premium is more pronounced for investors who wish to sell their shares in a relatively short period of time because, for those investors, realization of a gain or loss on their investments is likely to be more dependent upon changes in premium or discount levels than upon increases or decreases in net asset value per share. As of December 31, 2019,2021, the closing price of our common stock on the NYSE was $10.28$11.02 per share, an approximately 11.8%3.0% discount to our net asset value per share as of December 31, 2019. 2021.
In addition, at times when our common stock trades below net asset value, we will generally not be able to issue additional common stock at the market price without first obtaining the approval of our stockholders and our independent directors. We may, however, sell our common stock, or warrants, options or rights to acquire our common stock, at a price below the current net asset value per share of our common stock if our board of directors determines that such sale is in our best interests and the best interests of our stockholders, and our stockholders approve such sale. Any such sale would be dilutive to the net asset value per share of our common stock. In any such case, the price at which our securities are to be issued and sold may not be less than a price that, in the determination of our board of directors, closely approximates the market value of such securities (less any commission or discount). If our common stock trades at a discount to net asset value, this restriction could adversely affect our ability to raise capital. Pursuant to approval granted at an annual meeting of stockholders held on May 20, 2021, we are permitted to issue and sell shares of our common stock at a price below our then-current net asset value per share in one or more offerings, subject to certain limitations and determinations that must be made by the Board (including, without limitation, that the number of shares issued and sold pursuant to such authority does not exceed 30% of our then-outstanding common stock immediately prior to each such offering). Such stockholder approval expires on May 20, 2022.
Investing in our securities may involve an above average degree of risk.
The investments we make in accordance with our investment objective may result in a higher amount of risk than alternative investment options and a higher risk of volatility or loss of principal. Our investments in portfolio companies may be highly speculative, and therefore, an investment in our shares may not be suitable for someone with lower risk tolerance.
The market price of our securities may be volatile and fluctuate significantly.
Fluctuations in the trading prices of our shares may adversely affect the liquidity of the trading market for our shares and, if we seek to raise capital through future equity financings, our ability to raise such equity capital. The market price and liquidity of the market for our securities may be significantly affected by numerous factors, some of which are beyond our control and may not be directly related to our operating performance. These factors include:
•significant volatility in the market price and trading volume of securities of BDCs or other companies in our sector, which are not necessarily related to the operating performance of these companies;
•changes in regulatory policies or tax guidelines, particularly with respect to RICs or BDCs ;
•inability to obtain certain exemptive relief from the SEC;
•loss of RIC tax treatment;
56
•changes in earnings or variations in operating results;
•changes in the value of our portfolio of investments;
•any shortfall in investment income or net investment income or any increase in losses from levels expected by investors or securities analysts;
•conversion features of subscription rights, warrants or convertible debt;
•loss of a major funding source;
•fluctuations in interest rates;
•the operating performance of companies comparable to us;
•departure of Barings' or any of its affiliatesaffiliates' key personnel;
•proposed, or completed, offerings of our securities, including classes other than our common stock;
•global or national credit market changes; and
•general economic trends and other external factors.
The market for any security is subject to volatility. The loans and securities purchased by us and issued by us are no exception to this fundamental investment truism that prices will fluctuate.
We may be unable to invest a significant portion of the net proceeds raised from our offerings on acceptable terms, which would harm our financial condition and operating results.
Delays in investing the net proceeds raised in our offerings may cause our performance to be worse than that of other fully invested BDCs or other lenders or investors pursuing comparable investment strategies. We cannot assure you that we will be able to identify any investments that meet our investment objective or that any investment that we make will produce a positive return. We may be unable to invest the net proceeds from any offering on acceptable terms within the time period that we anticipate or at all, which could harm our financial condition and operating results.
We anticipate that, depending on market conditions, it may take a substantial period of time to invest substantially all of the net proceeds from any offering in securities meeting our investment objective. During such a period, we have and will continue to invest the net proceeds from any offering primarily in cash, cash equivalents, U.S. government securities, repurchase agreements and high-quality debt instruments maturing in one year or less from the time of investment, which may produce returns that are significantly lower than the returns which we expect to achieve when our portfolio is fully invested in securities meeting our investment objective, and given our expense ratio and the prevailing interest rate climate, there is a possible risk of losing money on the offering proceeds from certain securities, such as debt securities during this interval. As a result, any dividends or distributions that we pay during such period may be substantially lower than the dividends or distributions that we may be able to pay when our portfolio is fully invested in securities meeting our investment objective. In addition, until such time as the net proceeds from any offering are invested in securities meeting our investment objective, the
market price for our securities may decline. Thus, the return on your investment may be lower than when, if ever, our portfolio is fully invested in securities meeting our investment objective.
Sales of substantial amounts of our common stock in the public market may have an adverse effect on the market price of our common stock.
Sales of substantial amounts of our common stock, or the availability of such common stock for sale, could adversely affect the prevailing market prices for our common stock. If this occurs and continues, it could impair our ability to raise additional capital through the sale of securities should we desire to do so.
57
If we sell common stock at a discount to our net asset value per share, stockholders who do not participate in such sale will experience immediate dilution in an amount that may be material.
Pursuant to approval granted at an annual meeting of stockholders held on May 20, 2021, we are permitted to issue and sell shares of our common stock at a price below our then-current net asset value per share in one or more offerings, subject to certain limitations and determinations that must be made by the Board (including, without limitation, that the number of shares issued and sold pursuant to such authority does not exceed 30% of our then-outstanding common stock immediately prior to each such offering). Such stockholder approval expires on May 20, 2022.
Provisions of the Maryland General Corporation Law and our charter and bylaws could deter takeover attempts and have an adverse impact on the price of our common stock.
The Maryland General Corporation Law and our charter and bylaws contain provisions that may have the effect of discouraging, delaying or making difficult a change in control of our Company or the removal of our incumbent directors. Specifically, the Board has adopted a resolution explicitly subjecting us to the Maryland Business Combination Act under the Maryland General Corporation Law, which, subject to limitations, prohibits certain business combinations between us and an “interested stockholder” (defined generally as any person who beneficially owns 10% or more of the voting power of our outstanding voting stock) or an affiliate thereof for five years after the most recent date on which the stockholder becomes an interested stockholder and thereafter imposes fair price and/or supermajority voting requirements on these combinations. In addition, our charter classifies the Board in three classes serving staggered three-year terms and provides that a director may be removed only for cause by the vote of at least two-thirds of the votes entitled to be cast for the election of directors generally. In addition, our bylaws provide that, subject to the satisfaction of certain procedural and informational requirements by the stockholders requesting the meeting, a special meeting of stockholders will be called by our secretary to act upon any matter that may properly be considered at a meeting of stockholders only upon the written request of the stockholders entitled to cast at least a majority of all the votes entitled to be cast on such matter at the meeting.
In addition, subject to the provisions of the 1940 Act, our charter permits the Board, without stockholder action, to authorize the issuance of shares of stock in one or more classes or series, including preferred stock. Subject to compliance with the 1940 Act, the Board may, without stockholder action, amend our charter from time to time to increase or decrease the number of shares of stock of any class or series that we have authority to issue. The existence of these provisions, among others, may have a negative impact on the price of our common stock and may discourage third-party bids for ownership of our company. These provisions may prevent any premiums being offered to you for shares of our common stock.
If we issue preferred stock and/or debt securities, the net asset value and market value of our common stock may become more volatile.
We cannot assure you that the issuance of preferred stock and/or debt securities would result in a higher yield or return to the holders of our common stock. The issuance of preferred stock and/or debt securities would likely cause the net asset value and market value of our common stock to become more volatile. If the dividend rate on the preferred stock, or the interest rate on the debt securities, were to approach the net rate of return on our investment portfolio, the benefit of leverage to the holders of our common stock would be reduced. If the dividend rate on the
preferred stock, or the interest rate on the debt securities, were to exceed the net rate of return on our portfolio, the
58
use of leverage would result in a lower rate of return to the holders of common stock than if we had not issued the preferred stock or debt securities. Any decline in the net asset value of our investment would be borne entirely by the holders of our common stock. Therefore, if the market value of our portfolio were to decline, the leverage would result in a greater decrease in net asset value to the holders of our common stock than if we were not leveraged through the issuance of preferred stock.stock or debt securities. This decline in net asset value would also tend to cause a greater decline in the market price for our common stock.
There is also a risk that, in the event of a sharp decline in the value of our net assets, we would be in danger of failing to maintain required asset coverage ratios which may be required by the preferred stock and/or debt securities or of a downgrade in the ratings of the preferred stock and/or debt securities or our current investment income might not be sufficient to meet the dividend requirements on the preferred stock or the interest payments on the debt securities. In order to counteract such an event, we might need to liquidate investments in order to fund redemption of some or all of the preferred stock and/or debt securities. In addition, we would pay (and the holders of our common stock would bear) all costs and expenses relating to the issuance and ongoing maintenance of the preferred stock and/or debt securities. Holders of preferred stock and/or debt securities may have different interests than holders of common stock and may at times have disproportionate influence over our affairs.
There is a risk that investors in our common stock may not receive a specified level of dividends or that our dividends may not grow over time and that investors in any debt securities we may issue may not receive all of the interest income to which they are entitled.
We intend to make distributions on a quarterly basis to our stockholders out of assets legally available for distribution. We cannot assure you that we will achieve investment results that will allow us to make a specified level of cash distributions or year-to-year increases in cash distributions. If we declare a dividend and if more stockholders opt to receive cash distributions rather than participate in our dividend reinvestment plan, we may be forced to sell some of our investments in order to make cash dividend payments.
In addition, due to the asset coverage and net asset value tests applicable to us as a BDC and under covenants under the August 2018 Credit Facility and the February 2019 Credit Facility,our financing agreements, we may be limited in our ability to make distributions. Further, if we invest a greater amount of assets in equity securities that do not pay current dividends, it could reduce the amount available for distribution. See “Market“Item 5. — Market for Registrant’s Common Equity, Related Stockholder Matters and Issuer Purchases of Equity Securities — Distribution Policy” included in Item 5 of Part II of this Annual Report on Form 10-K for further discussion of distributions.
The above-referenced restrictions on distributions may also inhibit our ability to make required interest payments to holders of our current debt including the August 2025 Notes, the November Notes, the February Notes and the November 2026 Notes (each as defined below under “Management’s Discussion and Analysis of Financial Condition and Results of Operations—Recent Developments” included in Item 7 of Part II of this Annual Report on Form 10-K), and any future debt we may issue, which may cause a default under the terms of the relevant debt agreements. Such a default could materially increase our cost of raising capital, as well as cause us to incur penalties under the terms of our debt agreements.
If you are holding debt securities issued by us and such securities are redeemable at our option, we may choose to redeem your debt securities at times when prevailing interest rates are lower than the interest rate paid on your debt securities. In addition, if you are holding debt securities issued by us and such securities are subject to mandatory redemption, we may be required to redeem your debt securities at times when prevailing interest rates are lower than the interest rate paid on your debt securities. In this circumstance, you may not be able to reinvest the redemption proceeds in a comparable security at an effective interest rate as high as your debt securities being redeemed.
Subject to the terms of the August 2020 NPA (as defined below under “Management’s Discussion and Analysis of Financial Condition and Results of Operations—Liquidity and Capital Resources” included in Item 7 of Part II of this Annual Report on Form 10-K), we may redeem the August 2025 Notes in whole or in part at any time
59
or from time to time at our option at par plus accrued interest to the prepayment date and, if redeemed on or before November 3, 2024, a make-whole premium. Subject to the terms of the November 2020 NPA (as defined below under “Management’s Discussion and Analysis of Financial Condition and Results of Operations—Liquidity and Capital Resources” included in Item 7 of Part II of this Annual Report on Form 10-K), we may redeem the Series B Notes and the Series C Notes in whole or in part at any time or from time to time at our option at par plus accrued interest to the prepayment date and, if redeemed on or before May 4, 2025, with respect to the Series B Notes, or on or before May 4, 2027, with respect to the Series C Notes, a make-whole premium.Subject to the terms of the February 2021 NPA (as defined below under “Management’s Discussion and Analysis of Financial Condition and Results of Operations—Recent Developments” included in Item 7 of Part II of this Annual Report on Form 10-K), we may redeem the Series D Notes and the Series E Notes in whole or in part at any time or from time to time at our option at par plus accrued interest to the prepayment date and, if redeemed on or before August 26, 2025, with respect to the Series D Notes, or on or before August 26, 2027, with respect to the Series E Notes, a make-whole premium. Subject to the terms of the indenture governing the November 2026 Notes (as defined below under “Management’s Discussion and Analysis of Financial Condition and Results of Operations—Liquidity and Capital Resources” included in Item 7 of Part II of this Annual Report on Form 10-K), we may redeem the November 2026 Notes in whole or in part at our option at any time or from time to time at the redemption prices set forth in the indenture.
If we choose to redeem any of the August 2025 Notes, the November Notes, the February Notes or the November 2026 Notes when the fair market value of the August 2025 Notes, the November Notes, the February Notes or the November 2026 Notes is above par value, you would experience dilutiona loss of any potential premium.
We may not be able to prepay the August 2025 Notes, the November Notes, the February Notes or the November 2026 Notes upon a change in their ownership percentage if they opt outcontrol.
The note purchase agreements governing the August 2025 Notes, the November Notes and the February Notes, and the indenture governing the November 2026 Notes, require us to offer to prepay all of the respective issued and outstanding notes upon the occurrence of certain change in control events, which could have a material adverse effect on our dividend reinvestment plan.
Future offerings of debt securities, which would be senior to our common stock upon liquidation, or equity securities, which could dilute our existing stockholders and may be senior to our common stock for the purposes of distributions, may harm the value of our common stock.
In the future, we may attempt to increase our capital resources by making offerings of additional debt securities or additional equity securities, including commercial paper, medium-term notes, senior or subordinated notes and classes of preferred stock or common stock subject to the restrictions of the 1940 Act. Upon a liquidation of our company, holders of our debt securities and shares of preferred stock and lenders with respect to other borrowings would receive a distribution of our available assets prior to the holders of our common stock. Additional equity
offerings by us may dilute the holdings of our existing stockholders or reduce the value of our common stock, or both. Any preferred stock we may issue would have a preference on distributions that could limit our ability to make distributions to the holders of our common stock. Because our decision to issue securities in any future offering will depend on market conditions and other factors beyond our control, we cannot predict or estimate the amount, timing or nature of our future offerings. Thus, our stockholders bear the risk of our future offerings reducing the market price of our common stock and diluting their stock holdings in us. In addition, proceeds from a sale of common stock will likely be used to increase our total assets or to pay down our borrowings, among other uses. This would increase our asset coverage ratio and permit us to incur additional leverage under rules pertaining to BDCs by increasing our borrowings or issuing senior securities such as preferred stock or debt securities.
60
You may have a current tax liability on distributions reinvested in our common stock pursuant to our dividend reinvestment plan or otherwise but would not receive cash from such distributions to pay such tax liability.
If you participate in our dividend reinvestment plan, you will be deemed to have received, and for U.S. federal income tax purposes will be taxed on, the amount reinvested in our common stock to the extent the amount reinvested was not a tax-free return of capital. As a result, unless you are a tax-exempt entity, you may have to use funds from other sources to pay your tax liability on the value of our common stock received from the distribution.
In addition, in order to satisfy the annual distribution requirement applicable to RICs, we have the ability to declare a large portion of a dividend in shares of our common stock instead of in cash. As long as a portion of such dividend is paid in cash (which portion may be as low as 20% of such dividend)the declared dividend, and 10% of the declared dividend through June 30, 2022) and certain requirements are met, the entire distribution will be treated as a dividend for U.S. federal income tax purposes. As a result, a stockholder generally would be subject to tax on 100% of the fair market value of the dividend on the date the dividend is received by the stockholder in the same manner as a cash dividend, even though most of the dividend was paid in shares of our common stock. We currently do not intend to pay dividends in shares of our common stock other than in connection with our dividend reinvestment plan.
A downgrade, suspension or withdrawal of the credit rating, if any, assigned by a rating agency to us or any of our outstanding unsecured notes, or change in the debt markets could cause the liquidity or market value of our securities to decline significantly.
Our credit ratings are an assessment by rating agencies of our ability to pay our debts when due. Consequently, real or anticipated changes in our credit ratings will generally affect the value and trading prices, if any, of our outstanding unsecured notes. These credit ratings may not reflect the potential impact of risks relating to the structure or marketing of the notes. Credit ratings are not a recommendation to buy, sell or hold any security, and may be revised or withdrawn at any time by the issuing organization in its sole discretion. We undertake no obligation to maintain our credit ratings or to advise any holders of our unsecured notes of any changes in our credit ratings, except as may be required under the terms of any applicable indenture or other governing document, including the August 2020 NPA, the November 2020 NPA, the February 2021 NPA and the indenture governing the November 2026 Notes. There can be no assurance that our credit ratings will remain for any given period of time or that such credit ratings will not be lowered or withdrawn entirely by the rating agency if in their judgment future circumstances relating to the basis of the credit ratings, such as adverse changes in our business or operations, so warrant. Any downgrades to us or our securities could increase our cost of capital or otherwise have a negative effect on our results of operations and financial condition. In this regard, the fixed rates of the November Notes and the February Notes are subject to increase in the event that a Below Investment Grade Event (as defined in relevant note purchase agreement) occurs. The conditions of the financial markets and prevailing interest rates have fluctuated in the past and are likely to fluctuate in the future, which could have an adverse effect on the market prices and value of our unsecured notes.
Risks Relating to the Sierra Merger
Sales of shares of the Company’s common stock after the completion of the Sierra Merger may cause the market price of the Company’s common stock to decline.
Based on the number of outstanding shares of Sierra’s common stock as of the close of business on September 20, 2021, the Company would issue approximately 46.0 million shares of the Company’s common stock pursuant to the Sierra Merger Agreement. Former Sierra stockholders may decide not to hold the shares of the Company’s common stock that they receive pursuant to the Sierra Merger Agreement. In addition, the Company’s stockholders may decide not to hold their shares of the Company’s common stock after completion of the Sierra Merger. In each case, such sales of the Company’s common stock could have the effect of depressing the market price for the Company’s common stock and may take place promptly following the completion of the Sierra Merger.
61
The Company’s stockholders will experience a reduction in percentage ownership and voting power in the combined company as a result of the Sierra Merger.
The Company’s stockholders will experience a substantial reduction in their respective percentage ownership interests and effective voting power in respect of the combined company relative to their respective ownership interests in the Company prior to the Sierra Merger. Consequently, the Company’s stockholders should expect to exercise less influence over the management and policies of the combined company following the Sierra Merger than they currently exercise over the management and policies of the Company.
If the Sierra Merger is consummated, based on the number of shares of the Company’s common stock and Sierra’s common stock issued and outstanding on September 20, 2021, it is expected that current stockholders of the Company will own approximately 58.7% of the Company’s outstanding common stock and former Sierra stockholders will own approximately 41.3% of the Company’s outstanding common stock. In addition, both prior to and after completion of the Sierra Merger, subject to certain restrictions in the Sierra Merger Agreement and the approval of the Company’s stockholders, the Company may issue additional shares of its common stock (including, subject to certain restrictions under the 1940 Act, at prices below the Company’s then-current net asset value (“NAV”) per share), all of which would further reduce the percentage ownership of the combined company held by current stockholders. In addition, the issuance or sale by the Company of shares of its common stock at a discount to NAV poses a risk of economic dilution to stockholders.
The NAV per share of the Company’s common stock will be diluted if the Company issues shares at a price below the then-current NAV per share in connection with the Sierra Merger.
At the special meeting of the Company’s stockholders to be held in connection with the Sierra Merger and subject to certain determinations required to be made by the Company’s board of directors, the Company’s stockholders will be asked to approve the Company’s ability to issue shares of its common stock at a price below the then-current NAV per share in connection with the Sierra Merger in the event that at the time of such issuance, the Company’s then-current NAV per share is greater than the value of the shares of Sierra’s common stock being exchanged.
Under the Sierra Merger Agreement, the Sierra Exchange Ratio was fixed on September 21, 2021, at the signing of the Sierra Merger Agreement, subject to certain adjustments pursuant to the Sierra Merger Agreement. The Sierra Exchange Ratio was determined taking into account the NAV per share of each of the Company’s common stock and Sierra’s common stock as of June 30, 2021 and is not subject to adjustment based on changes in the NAV per share of the Company’s common stock or Sierra’s common stock. In that regard, regardless of the date on which the Sierra Merger is consummated and the resulting date on which the shares of the Company’s common stock are issued, the Sierra Exchange Ratio upon which the shares of the Company’s common stock will be issued will not change (except for certain customary anti-dilution adjustments). Consequently, if, on the date that the Company’s common stock is issued in connection with the Sierra Merger, the per share value of Sierra’s common stock were to decrease from its per share value as of June 30, 2021 and the NAV of the Company’s common stock were to remain the same, then the Company could be deemed to be issuing shares at a price below its then-current NAV per share. As a result, it is not known at this time whether the Company will be issuing shares of its common stock at a price below the then-current NAV per share to Sierra stockholders in connection with the Sierra Merger. The determination of whether the Company is issuing shares of its common stock at a price below the then-current NAV per share will be made at or around the time of the closing of the Sierra Merger.
If the Company were to issue shares of its common stock below its then-current NAV per share in connection with the Sierra Merger, such sales would result in an immediate dilution to the NAV per share of the Company’s common stock. This dilution would occur as a result of the issuance of shares at a price below the then-current NAV per share of the Company’s common stock and a proportionately greater decrease in the stockholders’ interest in the Company’s earnings and assets and their voting interest in the Company than the increase in the Company’s assets resulting from such issuance. Because the NAV of shares of the Company’s common stock at or around the time of the Sierra Merger is not currently known, the actual dilutive effect cannot be predicted.
62
The Company may be unable to realize the benefits anticipated by the Sierra Merger, including estimated cost savings, or it may take longer than anticipated to realize such benefits.
The realization of certain benefits anticipated as a result of the Sierra Merger will depend in part on the integration of Sierra’s investment portfolio with the Company’s and the integration of Sierra’s business with the Company’s. There can be no assurance that Sierra’s investment portfolio or business can be operated profitably or integrated successfully into the Company’s operations in a timely fashion or at all. The dedication of management resources to such integration may divert attention from the day-to-day business of the combined company and there can be no assurance that there will not be substantial costs associated with the transition process or there will not be other material adverse effects as a result of these integration efforts. Such effects, including incurring unexpected costs or delays in connection with such integration and failure of Sierra’s investment portfolio to perform as expected, could have a material adverse effect on the financial results of the combined company.
The Company also expects to achieve certain cost savings from the Sierra Merger when the two companies have fully integrated their portfolios. It is possible that the estimates of the potential cost savings could ultimately be incorrect. The cost savings estimates also assume the Company will be able to combine the operations of the Company and Sierra in a manner that permits those cost savings to be fully realized. If the estimates turn out to be incorrect or if the Company is not able to successfully combine Sierra’s investment portfolio or business with the operations of the Company, the anticipated cost savings may not be fully realized, or realized at all, or may take longer to realize than expected.
The announcement and pendency of the proposed Sierra Merger could adversely affect both the Company’s and Sierra’s business, financial results and operations.
The announcement and pendency of the proposed Sierra Merger could cause disruptions in and create uncertainty surrounding both the Company’s and Sierra’s business, including affecting relationships with their respective borrowers and future borrowers, which could have a significant negative impact on the Company’s future revenues and results of operations, regardless of whether the Sierra Merger is completed. In addition, the Company and Sierra have diverted, and will continue to divert, significant management resources towards the completion of the Sierra Merger, which could have a significant negative impact on each of their future revenues and results of operations.
Sierra and the Company are also subject to restrictions on the conduct of each of their businesses prior to the completion of the Sierra Merger as provided in the Sierra Merger Agreement, generally requiring Sierra and the Company to conduct their business only in the ordinary course and subject to specific limitations, including, among other things, certain restrictions on their respective ability to make certain investments and acquisitions, sell, transfer or dispose of their respective assets, amend their respective organizational documents and, in the case of Sierra, enter into or modify certain material contracts. These restrictions could prevent Sierra or the Company from pursuing otherwise attractive business opportunities, industry developments and future opportunities and may otherwise have a significant negative impact on the Company’s future investment income and results of operations.
If the Sierra Merger does not close, neither the Company nor Sierra will benefit from the expenses incurred in their pursuit of the Sierra Merger and, under certain circumstances, Sierra may be required to pay an $11.0 million termination fee and to reimburse expenses incurred in connection with the Sierra Merger by the Company and Barings, subject to a maximum expense reimbursement payment of $2.0 million.
For various reasons, the Sierra Merger may not be completed. If the Sierra Merger is not completed, Sierra and the Company will have incurred substantial expenses for which no ultimate benefit will have been received. Both companies have incurred out-of-pocket expenses in connection with the Sierra Merger for investment banking, legal and accounting fees and financial printing and other related charges, much of which will be incurred even if the Sierra Merger is not completed. The Sierra Merger Agreement provides that, upon the valid termination of the Sierra Merger Agreement under certain circumstances, Sierra may be required to pay or cause to be paid to the Company a termination fee of $11.0 million and to pay the Company’s and Barings’ expenses incurred in connection with the Sierra Merger, subject to a maximum reimbursement payment of $2.0 million.
63
The termination of the Sierra Merger Agreement could negatively impact the Company.
The Sierra Merger may not be completed. For example, either Sierra or the Company may terminate the Sierra Merger Agreement if the Sierra Merger is not completed by March 31, 2022 (so long as the party seeking termination has not been the primary cause of the delay). If the Sierra Merger Agreement is terminated, there may be various consequences, including:
•the Company’s businesses may have been adversely impacted by the failure to pursue other beneficial opportunities due to the focus of management on the Sierra Merger, without realizing any of the anticipated benefits of completing the Sierra Merger; and
•the market price of the Company's common stock might decline to the extent that the market price prior to termination reflects a market assumption that the Sierra Merger will be completed.
Except in specified circumstances, if the Sierra Merger is not completed by March 31, 2022, either Sierra or the Company may choose not to proceed with the Sierra Merger.
Either Sierra or the Company may terminate the Sierra Merger Agreement if the effective time of the First Sierra Merger has not occurred by March 31, 2022. However, this right to terminate the Sierra Merger Agreement will not be available to Sierra or the Company if the failure of such party to perform any of its obligations under the Sierra Merger Agreement has been the primary cause of or resulted in the failure of the Sierra Merger to be complete on or before such date.
The Sierra Merger is subject to closing conditions, including stockholder approvals, that, if not satisfied or waived, will result in the Sierra Merger not being completed, which may result in material adverse consequences to the Company’s business and operations.
While there can be no assurances as to the exact timing, or that the Sierra Merger will be completed at all, the Company and Sierra are working to complete the Sierra Merger in the first quarter of 2022. The Sierra Merger is subject to closing conditions, including required regulatory approvals (including the expiration of the waiting period under the Hart-Scott-Rodino Antitrust Improvements Act of 1976, as amended, and the rules and regulations thereunder) and certain approvals of the Company’s and Sierra’s respective stockholders that, if not satisfied, will prevent the Sierra Merger from being completed. The closing condition that the Company’s stockholders approve the issuance of shares of the Company’s common stock in connection with the Sierra Merger and the issuance of shares of the Company’s common stock in connection with the Sierra Merger at a price below its then-current NAV may not be waived and must be satisfied for the Sierra Merger to be completed. The Company currently expects that all directors and executive officers of the Company will vote their shares of the Company’s common stock in favor of the proposals presented at the special meeting of the Company’s stockholders to be held in connection with the Sierra Merger. Additionally, Barings, as a party to the Sierra Merger Agreement, agreed to vote all shares of the Company’s common stock over which it has voting power (other than in its fiduciary capacity) in favor of the proposals presented at the Company’s special meeting of stockholders. Furthermore, the closing condition that Sierra stockholders approve the Sierra Merger may not be waived and must also be satisfied for the Sierra Merger to be completed. If the closing conditions to the Sierra Merger are not satisfied, including receipt of the required approvals by the stockholders of the Company and of Sierra, and the Sierra Merger is not completed, the resulting failure to complete the Sierra Merger could have a material adverse impact on the Company’s business and operations.
Sierra and the Company will be subject to contractual restrictions while the Sierra Merger is pending, including restrictions on pursuing alternatives to the Sierra Merger.
Uncertainty about the effect of the Sierra Merger may have an adverse effect on the Company and Sierra and, consequently, on the combined company following completion of the Sierra Merger. These uncertainties may impair the Company’s and Sierra’s abilities to motivate key personnel until the Sierra Merger is consummated and could cause those who deal with the Company and Sierra to seek to change their existing business relationships with the Company and Sierra, respectively. In addition, the Sierra Merger Agreement restricts the Company and Sierra from taking actions that they might otherwise consider to be in their best interests without the consent of the other party. These restrictions may prevent the Company and Sierra from pursuing certain business opportunities that may arise
64
prior to the completion of the Sierra Merger, including restrictions on them pursuing alternatives to the Sierra Merger.
Subject to applicable law, each party may waive one or more conditions to the Sierra Merger without resoliciting approval from its respective stockholders.
Certain conditions to the Company’s and Sierra’s obligations to complete the Sierra Merger may be waived, in whole or in part, to the extent legally allowed, either unilaterally or by agreement of the Company and Sierra. In the event that any such waiver does not require resolicitation of stockholders, the parties to the Sierra Merger Agreement will have the discretion to complete the Sierra Merger without seeking further stockholder approval. Accordingly, the terms and conditions as set forth in the Sierra Merger Agreement and described herein, including certain protections to the Company and Sierra, may be waived. The conditions requiring the approval of the Company’s stockholders and approval of Sierra’s stockholders, however, cannot be waived.
The market price of the Company’s common stock after the Sierra Merger may be affected by factors different from those affecting the Company’s common stock or Sierra’s common stock currently.
The businesses of the Company and Sierra differ in some respects and, accordingly, the results of operations of the combined company and the market price of the Company’s common stock after the Sierra Merger may be affected by factors different from those currently affecting the independent results of operations of each of the Company and Sierra. These factors include:
•a larger stockholder base;
•a different portfolio composition; and
•a different capital structure
Accordingly, the historical trading prices and financial results of the Company may not be indicative of these matters for the combined company following the Sierra Merger.
The Sierra Merger may trigger certain “change of control” provisions and other restrictions in certain of the Company’s and Sierra’s contracts and the failure to obtain any required consents or waivers could adversely impact the combined company.
Certain agreements of the Company and Sierra or their controlled affiliates will or may require the consent of one or more counterparties in connection with the Sierra Merger. The failure to obtain any such consent may permit such counter-parties to terminate, or otherwise increase their rights or the Company’s or Sierra’s obligations under, any such agreement because the Sierra Merger may violate an anti-assignment, change of control or similar provision. If this happens, the Company or Sierra may have to seek to replace that agreement with a new agreement or seek a waiver or amendment to such agreement. The Company cannot assure you that it or Sierra will be able to replace, amend or obtain a waiver under any such agreement on comparable terms or at all.
If any such agreement is material, the failure to obtain consents, amendments or waivers under, or to replace on similar terms or at all, any of these agreements could adversely affect the financial performance or results of operations of the combined company following the Sierra Merger, including preventing the Company from operating a material part of Sierra’s business.
In addition, the consummation of the Sierra Merger may violate, conflict with, result in a breach of any provision of or the loss of any benefit under, constitute a default (or an event that, with or without notice or lapse of time or both, would constitute a default) under, or result in the termination, cancellation, acceleration or other change of any right or obligation (including any payment obligation) under the Company’s or Sierra’s agreements. Any such violation, conflict, breach, loss, default or other effect could, either individually or in the aggregate, have a material adverse effect on the financial condition, results of operations, assets or business of the combined company following completion of the Sierra Merger.
65
The combined company may not be able to obtain financing for additional capital requirements.
Following completion of the Sierra Merger, the combined company may seek significant ongoing capital funding and, although the Company anticipates that the combined company will be able to obtain such funding through cash generated from operations and subsequent debt, equity or hybrid offerings, there can be no assurances that the combined company will be able to obtain financing on acceptable terms or at all.
The Company has incurred and expects to incur substantial transaction fees and costs in connection with the Sierra Merger, whether or not the Sierra Merger is completed.
The Company has incurred and expects to incur additional material non-recurring expenses in connection with the Sierra Merger and completion of the transactions contemplated by the Sierra Merger Agreement. The Company has incurred significant legal, advisory and financial services fees in connection with the process of negotiating and evaluating the terms of the Sierra Merger. Additional significant unanticipated costs may be incurred in the course of coordinating the businesses of Sierra and the Company after completion of the Sierra Merger.
Even if the Sierra Merger is not completed, the Company will need to pay certain costs relating to the Sierra Merger incurred prior to the date the Sierra Merger was abandoned, such as legal, accounting, financial advisory, filing and printing fees. Such costs may be significant and could have an adverse effect on the Company’s future results of operations, cash flows and financial condition.
Litigation filed against Sierra or the Company in connection with the Sierra Merger could result in substantial costs and could delay or prevent the Sierra Merger from being completed.
From time to time, Sierra and the Company may be subject to legal actions, including securities class action lawsuits and derivative lawsuits, as well as various regulatory, governmental and law enforcement inquiries, investigations and subpoenas in connection with the Sierra Merger. These or any similar securities class action lawsuits and derivative lawsuits, regardless of their merits, may result in substantial costs and divert management time and resources. An adverse judgment in such cases could have a negative impact on the Company’s liquidity and financial condition or could prevent the Sierra Merger from being completed.
General Risk Factors
Global capital markets could enter a period of severe disruption and instability or an economic recession. These conditions have historically affected and could again materially and adversely affect debt and equity capital markets in the United States and around the world and could impair our portfolio companies and harm our operating results.
The U.S. and global capital markets have from time to time experienced periods of disruption characterized by the freezing of available credit, a lack of liquidity in the debt capital markets, significant losses in the principal value of investments, the re-pricing of credit risk in the broadly syndicated credit market, the failure of major financial institutions and general volatility in the financial markets. During these periods of disruption, general economic conditions deteriorated with material and adverse consequences for the broader financial and credit markets, and the availability of debt and equity capital for the market as a whole, and financial services firms in particular, was reduced significantly. These conditions may reoccur for a prolonged period of time or materially worsen in the future.
The United Kingdom (the “UK”) formally left the European Union (the “EU”) on January 31, 2020 (commonly known as “Brexit”), followed by an implementation period, during which EU law continued to apply in the UK and the UK maintained its EU single market access rights and EU customs union membership. The implementation period expired on December 31, 2020. Consequently, the UK has become a third country vis-à-vis the EU, without access to the single market or membership of the EU customs union. During the implementation period, on December 30, 2020, the UK and the EU signed a trade and cooperation agreement (the “TCA”) to govern their ongoing relationship. The TCA was officially ratified by the UK Parliament on December 30, 2020, and was ratified by the EU Parliament and Council on April 27, 2021. It is anticipated that further details of the relationship between the UK and the EU will continue to be negotiated even after formal ratification of the TCA.Over time, UK
66
regulated firms and other UK businesses may be adversely affected by the terms of the TCA (assuming it is formally ratified by the EU), as compared with the position prior to the expiration of the implementation period on December 31, 2020. For example, the TCA introduces new customs checks, as well as new restrictions on the provision of cross-border services and on the free movement of employees. These changes have the potential to materially impair the profitability of a business, and to require it to adapt or even relocate. Although it is probable that any adverse effects flowing from the UK’s withdrawal from the EU will principally affect the UK (and those having an economic interest in, or connected to, the UK), given the size and global significance of the UK’s economy, the impact of the withdrawal is unpredictable and likely to be an ongoing source of instability, produce significant currency fluctuations, and/or have other adverse effects on international markets, international trade agreements and/or other existing cross-border cooperation arrangements (whether economic, tax, fiscal, legal, regulatory or otherwise). The withdrawal of the UK from the EU could therefore adversely affect us. In addition, although it seems less likely following the expiration of the transition period than at the time of the UK’s referendum, the withdrawal of the UK from the EU could have a further destabilizing effect if any other member states were to consider withdrawing from the EU, presenting similar and/or additional potential risks and consequences to our business and financial results.
Market conditions may in the future make it difficult to extend the maturity of or refinance our existing indebtedness and any failure to do so could have a material adverse effect on our business. If we are unable to raise or refinance debt, then our equity investors may not benefit from the potential for increased returns on equity resulting from leverage and we may be limited in our ability to make new commitments or to fund existing commitments to our portfolio companies.
Given the volatility and dislocation that the capital markets have historically experienced, many BDCs have faced, and may in the future face, a challenging environment in which to raise capital. We may in the future have difficulty accessing debt and equity capital on attractive terms, or at all, and a severe disruption or instability in the global financial markets or deteriorations in credit and financing conditions may cause us to reduce the volume of the loans we originate and/or fund, which may adversely affect the value of our portfolio investments or otherwise have a material adverse effect on our business, financial condition, results of operations and cash flows. In addition, significant changes in the capital markets, including instances of extreme volatility and disruption, have had, and may in the future have, a negative effect on the valuations of our investments and on the potential for liquidity events involving our investments. We monitor developments and seek to manage our investments in a manner consistent with achieving our investment objective, but there can be no assurance that we will be successful in doing so, and we may not timely anticipate or manage existing, new or additional risks, contingencies or developments, including regulatory developments in the current or future market environment.
An inability to raise capital, and any required sale of our investments for liquidity purposes, could have a material adverse impact on our business, financial condition or results of operations. The debt capital that will be available to us in the future, if at all, may be at a higher cost and on less favorable terms and conditions than what we currently experience, including being at a higher cost in rising rate environments. If we are unable to raise or refinance debt, then our equity investors may not benefit from the potential for increased returns on equity resulting from leverage and we may be limited in our ability to make new commitments or to fund existing commitments to our portfolio companies. In addition, equity capital may be difficult to raise during periods of adverse or volatile market conditions because, subject to some limited exceptions, as a BDC, we are generally not able to issue additional shares of our common stock at a price less than net asset value without first obtaining approval for such issuance from our stockholders and our independent directors. We generally seek approval from our stockholders so that we have the flexibility to issue up to a specified percentage of our then-outstanding shares of our common stock at a price below net asset value. Pursuant to approval granted at an annual meeting of stockholders held on May 20, 2021, we are permitted to issue and sell shares of our common stock at a price below our then-current net asset value per share in one or more offerings, subject to certain limitations and determinations that must be made by the Board (including, without limitation, that the number of shares issued and sold pursuant to such authority does not exceed 30% of our then-outstanding common stock immediately prior to each such offering). Such stockholder approval expires on May 20, 2022.
Many of the portfolio companies in which we make investments may be susceptible to economic slowdowns or recessions and may be unable to repay the loans we made to them during these periods. Therefore, our non-
67
performing assets may increase and the value of our portfolio may decrease during these periods as we are required to record our investments at their current fair value. Adverse economic conditions also may decrease the value of collateral securing some of our loans and the value of our equity investments. Economic slowdowns or recessions could lead to financial losses in our portfolio and a decrease in revenues, net income and assets. Unfavorable economic conditions also could increase our and our portfolio companies’ funding costs, limit our and our portfolio companies’ access to the capital markets or result in a decision by lenders not to extend credit to us or our portfolio companies. These events could prevent us from increasing investments and harm our operating results.
A portfolio company’s failure to satisfy financial or operating covenants imposed by us or other lenders could lead to defaults and, potentially, acceleration of the time when the loans are due and foreclosure on its secured assets, which could trigger cross-defaults under other agreements and jeopardize the portfolio company’s ability to meet its obligations under the debt that we hold. We may incur additional expenses to the extent necessary to seek recovery upon default or to negotiate new terms with a defaulting portfolio company. In addition, if one of our portfolio companies were to go bankrupt, depending on the facts and circumstances, including the extent to which we will actually provide significant managerial assistance to that portfolio company, a bankruptcy court might subordinate all or a portion of our claim to that of other creditors.
Terrorist attacks, acts of war, or national disasters, outbreaks or pandemics may affect any market for our securities, impact the businesses in which we invest and harm our business, operating results and financial condition.
Terrorist acts, acts of war, or national disasters, outbreaks or pandemics may disrupt our operations, as well as the operations of the businesses in which we invest. Such acts have created, and continue to create, economic and political uncertainties and have contributed to global economic instability. Future terrorist activities, militaryFor example, many countries have experienced outbreaks of infectious illnesses in recent decades, including swine flu, avian influenza, SARS and COVID-19. Since the initial outbreak of COVID-19, a large and growing number of cases have been confirmed around the world. The COVID-19 outbreak has resulted in numerous deaths and the imposition of both local and more widespread “work from home” and other quarantine measures, border closures and other travel restrictions, causing social unrest and commercial disruption on a global scale.
The spread of COVID-19, including the multiple variants thereof, has had, and will continue to have, a material adverse impact on local economies in the affected jurisdictions and also on the global economy, as cross-border commercial activity and market sentiment are increasingly impacted by the outbreak and government and other measures seeking to contain its spread. With respect to U.S. and global credit markets and the economy in general, this outbreak has resulted in, and until fully resolved is likely to continue to result in, the following (among other things): (i) restrictions on travel and the temporary closure of many corporate offices, retail stores, and manufacturing facilities and factories, resulting in significant disruption to the business of many companies, including supply chains and demand, as well as layoffs of employees; (ii) increased draws by borrowers on revolving lines of credit; (iii) increased requests by borrowers for amendments or security operations, waivers of their credit agreements to avoid default, increased defaults by borrowers and/or natural disasters could further weakenincreased difficulty in obtaining refinancing; (iv) volatility in credit markets, including greater volatility in pricing and spreads; and (v) rapidly evolving proposals and actions by state and federal governments to address the domestic/global economiesproblems being experienced by markets, businesses and create additional uncertainties,the economy in general, which may negatively impactnot adequately address the underlying problems. In addition to these developments having adverse consequences in the businesses in which we invest, directlythe operations of Barings (including those relating to the Company) have been, and could continue to be, adversely impacted, including through quarantine measures and travel restrictions imposed on Barings personnel or indirectlyservice providers based or temporarily located in affected countries, or any related health issues of such personnel or service providers. Any of the foregoing events could materially and adversely affect our ability to source, manage and divest its investments and its ability to fulfill its investment objectives. Similar consequences could arise with respect to other comparable infectious diseases. Although it is impossible to predict the precise nature and consequences of these events, or of any political or policy decisions and regulatory changes occasioned by emerging events or uncertainty on applicable laws or regulations that impact us and our portfolio companies and investments, it is clear that these types of events are impacting and will, for at least some time, continue to impact us and our portfolio companies. Any potential impact to our results of operations will depend to a large extent on future developments and new information that could emerge regarding the duration and severity of the COVID-19 pandemic and the actions taken by authorities and other entities to
68
contain the spread or treat its impact, all of which are beyond our control. These potential impacts, while uncertain, could adversely affect our and our portfolio companies' operating results.
We may experience fluctuations in our quarterly results.
We could experience fluctuations in our quarterly operating results due to a number of factors, including our ability or inability to make investments in companies that meet our investment criteria, the interest rate payable on the debt securities we acquire, the level of our expenses, variations in and the timing of the recognition of realized and unrealized gains or losses, the degree to which we encounter competition in our markets and general economic conditions. As a result of these factors, results for any period should not be relied upon as being indicative of performance in future periods.
Economic recessions or downturns could impair our portfolio companies and harm our operating results.
Many of our portfolio companies may be susceptible to economic downturns or recessions and may be unable to repay our loans during these periods. Therefore, during these periods our non-performing assets may increase and the value of these assets may decrease. Adverse economic conditions may also decrease the value of collateral securing some of our loans and the value of our equity investments. Economic slowdowns or recessions could lead to financial losses in our portfolio and a decrease in revenues, net income and assets. Unfavorable economic conditions also could increase our funding costs, limit our access to the capital markets or result in a decision by lenders not to extend credit to us. These events could prevent us from increasing investments and harm our operating results.
A portfolio company’s failure to satisfy financial or operating covenants imposed by us or other lenders could lead to defaults and, potentially, termination of its loans and foreclosure on its assets, which could trigger cross-defaults under other agreements and jeopardize our portfolio company’s ability to meet its obligations under the debt securities that we hold. We may incur expenses to the extent necessary to seek recovery upon default or to negotiate new terms with a defaulting portfolio company.
Changes to U.S. tariff and import/export regulations may have a negative effect on our portfolio companies and, in turn, harm us.
There have been ongoing discussion and commentary regarding potential significant changes to U.S. trade policies, treaties and tariffs, creating significant uncertainty about the future relationship between the United States and other countries with respect to trade policies, treaties and tariffs. These developments, or the perception that more of them could occur, may have a material adverse effect on global economic conditions and the stability of global financial markets, and may significantly reduce global trade and, in particular, trade between the impacted nations and the United States. Any of these factors could depress economic activity and restrict our portfolio companies’ access to suppliers or customers and have a material adverse effect on their business, financial condition and results of operations, which in turn would negatively impact us.
Changes in laws or regulations governing our operations may adversely affect our business or cause us to alter our business strategy.
We, our subsidiaries and our portfolio companies are subject to regulation at the local, state and federal level. New legislation may be enacted or new interpretations, rulings or regulations could be adopted, including those governing the types of investments we are permitted to make, any of which could harm us and our stockholders, potentially with retroactive effect. Additionally, new regulatory initiatives related to ESG could adversely affect our business.
Additionally, any changes to the laws and regulations governing our operations relating to permitted investments may cause us to alter our investment strategy in order to avail ourselves of new or different opportunities. Such changes could result in material differences to the strategies and plans set forth in this Annual Report on Form 10-K and may result in our investment focus shifting from the areas of expertise of our management team to other types of investments in which our management team may have less expertise or little or no experience.
69
Thus, any such changes, if they occur, could have a material adverse impacteffect on our business, operating results of operations and financial condition. Losses from terrorist attacks and natural disasters are generally uninsurable.the value of your investment.
Item 1B. Unresolved Staff Comments.
None.
Item 2. Properties.
We do not own any real estate or other physical properties materially important to our operation or any of our subsidiaries. Our headquarters are currently located at 300 South Tryon Street, Suite 2500 Charlotte, North Carolina 28202, where we occupy office space pursuant to the Administration Agreement with Barings. We believe that our current office facilities are adequate to meet our needs.
Item 3. Legal Proceedings.
Item 4. Mine Safety Disclosures.
Not applicable.
PART II
Item 5. Market for Registrant’s Common Equity, Related Stockholder Matters and Issuer Purchases of Equity Securities.
Common Stock and Holders
Our common stock is traded on the New York Stock Exchange, or NYSE, under the ticker symbol “BBDC.” As of February 27, 2020,23, 2022, there were approximately 2397 holders of record of our common stock. This number does not include stockholders for whom shares are held in “nominee” or “street name.”
Distributions Declared
The table below shows the detail of our distributions for the years ended December 31, 20192021 and 2018:2020:
| Year Ended December 31, | Year Ended December 31, | |||||||||||||||||||||||||||||||||||||||
| 2019 | 2018 | 2021 | 2020 | |||||||||||||||||||||||||||||||||||||
| Amount | % of Total | Amount | % of Total | Amount | % of Total | Amount | % of Total | |||||||||||||||||||||||||||||||||
| Ordinary income | $ | 0.54 | 100.0 | % | $ | 0.41 | 95.3 | % | Ordinary income | $ | 0.79 | 96.3 | % | $ | 0.65 | 100.0 | % | |||||||||||||||||||||||
| Long-term capital gains | — | — | — | — | ||||||||||||||||||||||||||||||||||||
| Tax return of capital | — | — | 0.02 | 4.7 | Tax return of capital | 0.03 | 3.7 | — | — | |||||||||||||||||||||||||||||||
| Total reported on IRS Form 1099-DIV | $ | 0.54 | 100.0 | % | $ | 0.43 | 100.0 | % | Total reported on IRS Form 1099-DIV | $ | 0.82 | 100.0 | % | $ | 0.65 | 100.0 | % | |||||||||||||||||||||||
Each year, a statement on IRS Form 1099-DIV identifying the source(s) of the distribution (i.e., paid from ordinary income, paid from net capital gains on the sale of securities, and/or a return of paid in capital surplus which is a nontaxable distribution) is mailed to our stockholders. To the extent that our distributions for a fiscal year exceed current and accumulated earnings and profits, a portion of those distributions may be deemed a return of capital to our stockholders for U.S. federal income tax purposes. Thus, the source of a distribution to our stockholders may be the original capital invested by the stockholder rather than our taxable ordinary income or capital gains. Stockholders should read any written disclosure accompanying a dividend payment carefully and should not assume that any distribution is taxable as ordinary income or capital gains.
Ordinary income is reported on IRS Form 1099-DIV as either qualified or non-qualified and capital gain distributions are reported on IRS Form 1099-DIV in various subcategories which have differing tax treatments to stockholders. Those subcategories are not presented herein.
We estimate the source of our distributions as required by Section 19(a) of the 1940 Act to determine whether payment of dividends are expected to be paid from any other source other than net investment income accrued for current period or certain cumulative periods, but we will not be able to determine whether any specific distribution will be treated as made out of our taxable earnings or as a return of capital until after the end of our taxable year. Any amount treated as a return of capital will reduce a stockholder’s adjusted tax basis in his or her common stock, thereby increasing his or her potential gain or reducing his or her potential loss on the subsequent sale or other disposition of his or her common stock. On a quarterly basis, for any payment of dividends estimated to be paid from any other source other than net investment income accrued for current period or certain cumulative periods based on the Section 19(a) requirement, we post a Section 19(a) notice through the Depository Trust Company’s Legal Notice System and our website, as well as send our registered stockholders a printed copy of such notice along with the dividend payment. The estimates of the source of the distribution are interim estimates based on GAAP that are subject to revision, and the exact character of the distributions for tax purposes cannot be determined until the final books and records are finalized for the calendar year. Therefore, these estimates are made solely in order to comply with the requirements of Section 19(a) of the 1940 Act and should not be relied upon for tax reporting or any other purposes and could differ significantly from the actual character of distributions for tax purposes.
Distribution Policy
We generally intend to make distributions on a quarterly basis to our stockholders of substantially all of our income. In order to avoid certain excise taxes imposed on RICs, we must distribute during each calendar year an amount at least equal to the sum of (i) 98.0% of our ordinary income for the calendar year, (ii) 98.2% of our capital
71
gains in excess of capital losses for the calendar year, and (iii) any ordinary income and net capital gains for the preceding year that were not distributed during such year. We will not be subject to excise taxes on amounts on which we are required to pay corporate income tax (such as retained net capital gains). In order to obtain the tax benefits applicable to RICs, we will be required to distribute to our stockholders with respect to each taxable year at least 90.0% of our ordinary income and realized net short-term capital gains in excess of realized net long-term capital losses. We may retain for investment realized net long-term capital gains in excess of realized net short-term capital losses. We may make deemed distributions to our stockholders of any retained net capital gains. If this happens, our stockholders will be treated as if they received an actual distribution of the capital gains we retain and then reinvested the net after-tax proceeds in our common stock. Our stockholders also may be eligible to claim a tax credit (or, in certain circumstances, a tax refund) equal to their allocable share of the tax we paid on the capital gains deemed distributed to them. Please refer to “Business — Material U.S. Federal Income Tax Considerations” included in Item 1 of Part I of this Annual Report on Form 10-K for further information regarding the consequences of our retention of net capital gains. We may, in the future, make actual distributions to our stockholders of some or all realized net long-term capital gains in excess of realized net short-term capital losses. We can offer no assurance that we will achieve results that will permit the payment of any cash distributions and, if we issue senior securities, we will be prohibited from making distributions if doing so causes us to fail to maintain the asset coverage ratio and related requirements stipulated by the 1940 Act or if distributions are limited by the terms of any of our borrowings.borrowings or financing arrangements. See “Business — Regulation of Business Development Companies” included in Item 1 of Part I of this Annual Report on Form 10-K.
We have adopted a dividend reinvestment plan that provides for reinvestment of our distributions on behalf of our common stockholders, unless a common stockholder elects to receive cash as provided in “Business — Dividend Reinvestment Plan” included in Item I of Part I of this Annual Report on Form 10-K.
Stockholders who receive dividends in the form of stock generally are subject to the same federal, state and local tax consequences as are stockholders who elect to receive their dividends in cash. A stockholder’s basis for determining gain or loss upon the sale of stock received in a dividend from us will be equal to the total dollar amount of the dividend payable to the stockholder. Any stock received in a dividend will have a holding period for tax purposes commencing on the day following the day on which the shares are credited to the U.S. stockholder’s account.
Sales of Unregistered Equity Securities
We did not sell any equity securities during the period covered by this report that were not registered under the Securities Act of 1933, as amended.amended (the “Securities Act”).
Issuer Purchases of Equity Securities
During the three months ended December 31, 2019,2021, in connection with our dividend reinvestment plan for our common stockholders, we directed the plan administratorPlan Administrator to purchase 8,507 shares56,343 shares of our common stock for an aggregate of $89,422$625,097 in the open market in order to satisfy our obligationsobligations to deliver shares of common stock to our stockholders with respect to our dividend declared on October 29, 2019.
| Period | Total number of shares purchased(1) | Average price paid per share | Total number of shares purchased as part of publicly announced plans or programs | Approximate dollar value of shares that may yet be purchased under the plans or programs | ||||||||||
| October 1 through October 31, 2019 | 142,313 | $ | 10.14 | 142,313 | $ | 3,404,967 | (3) | |||||||
| November 1 through November 30, 2019 | 251,226 | $ | 10.34 | 251,226 | $ | 836,121 | (4) | |||||||
| December 1 through December 31, 2019 | 82,707 | (2) | $ | 10.40 | 74,200 | $ | — | |||||||
November 9, 2021.
Performance Graph
The following graph compares the cumulative total return on our common stock with the cumulative total return of the Nasdaq Composite Index, the NYSE Composite Index and the Wells Fargo Business Development Company Index for the five years ended December 31, 2019.2021. This comparison assumes $100.00 was invested in our common stock (or that of Triangle Capital Corporation ("TCAP"), prior to the Transactions) at the closing price of our common stock on December 31, 20142016 and in the comparison groups and assumes the reinvestment of all cash dividends on the ex-dividend date prior to any tax effect. The stock price performance shown on the graph below is not necessarily indicative of future price performance.
72
Comparison of Annual Cumulative Total Return(1)
among Barings BDC, Inc., the Nasdaq Composite Index, the NYSE Composite Index
and the Wells Fargo Business Development Company Index
| 12/31/16 | 3/31/17 | 6/30/17 | 9/30/17 | 12/31/17 | 3/31/18 | 6/30/18 | 9/30/18 | 12/31/18 | ||||||||||||||||||||||||||||||||||||||||||||||||
| Barings BDC, Inc. | 100.00 | 107.01 | 101.71 | 85.67 | 59.06 | 71.33 | 73.70 | 88.01 | 80.03 | |||||||||||||||||||||||||||||||||||||||||||||||
| NASDAQ Composite Index | 100.00 | 110.13 | 114.71 | 121.67 | 129.64 | 132.99 | 141.79 | 152.29 | 125.96 | |||||||||||||||||||||||||||||||||||||||||||||||
| NYSE Composite Index | 100.00 | 104.58 | 107.78 | 112.54 | 118.73 | 116.09 | 117.41 | 123.58 | 108.10 | |||||||||||||||||||||||||||||||||||||||||||||||
| Wells Fargo Business Development Company Index | 100.00 | 106.09 | 102.97 | 103.43 | 102.56 | 101.32 | 106.45 | 113.61 | 98.42 | |||||||||||||||||||||||||||||||||||||||||||||||
| 3/31/19 | 6/30/19 | 9/30/19 | 12/31/19 | 3/31/20 | 6/30/20 | 9/30/20 | 12/31/20 | |||||||||||||||||||||||||||||||||||||||||||||||||
| Barings BDC, Inc. | 88.20 | 89.64 | 93.76 | 96.35 | 71.31 | 77.19 | 79.30 | 92.97 | ||||||||||||||||||||||||||||||||||||||||||||||||
| NASDAQ Composite Index | 147.13 | 152.82 | 153.09 | 172.17 | 148.15 | 193.99 | 215.80 | 249.51 | ||||||||||||||||||||||||||||||||||||||||||||||||
| NYSE Composite Index | 121.47 | 125.72 | 126.09 | 135.68 | 101.15 | 117.55 | 126.26 | 145.16�� | ||||||||||||||||||||||||||||||||||||||||||||||||
| Wells Fargo Business Development Company Index | 115.57 | 121.56 | 125.62 | 139.16 | 87.93 | 111.79 | 116.58 | 137.01 | ||||||||||||||||||||||||||||||||||||||||||||||||
| 3/31/21 | 6/30/21 | 9/30/21 | 12/31/21 | |||||||||||||||||||||||||||||||||||||||||||||||||||||
| Barings BDC, Inc. | 102.80 | 110.86 | 117.96 | 120.31 | ||||||||||||||||||||||||||||||||||||||||||||||||||||
| NASDAQ Composite Index | 256.88 | 281.74 | 281.10 | 304.85 | ||||||||||||||||||||||||||||||||||||||||||||||||||||
| NYSE Composite Index | 156.84 | 167.21 | 164.00 | 175.18 | ||||||||||||||||||||||||||||||||||||||||||||||||||||
| Wells Fargo Business Development Company Index | 162.68 | 179.72 | 190.81 | 203.45 | ||||||||||||||||||||||||||||||||||||||||||||||||||||
(1)From December 31, 2016 to December 31, 2021.
73
| 12/31/14 | 3/31/15 | 6/30/15 | 9/30/15 | 12/31/15 | 3/31/16 | 6/30/16 | 9/30/16 | 12/31/16 | |||||||||||||||||||
| Barings BDC, Inc. | 100.00 | 115.19 | 121.31 | 87.99 | 104.98 | 116.24 | 112.11 | 116.54 | 111.13 | ||||||||||||||||||
| NASDAQ Composite Index | 100.00 | 103.79 | 105.90 | 98.39 | 106.96 | 104.36 | 104.12 | 114.55 | 116.45 | ||||||||||||||||||
| NYSE Composite Index | 100.00 | 101.14 | 100.94 | 92.12 | 95.91 | 97.18 | 100.61 | 103.50 | 107.36 | ||||||||||||||||||
| Wells Fargo Business Development Company Index | 100.00 | 106.03 | 104.16 | 94.75 | 97.43 | 101.07 | 105.08 | 114.72 | 121.34 | ||||||||||||||||||
(dollar amounts in thousands, except per unit data)
Information about our senior securities is shown as of the dates indicated in the below table. The report of our independent registered public accounting firm, KPMG LLP, on the senior securities table as of December 31, 2021, is attached as an exhibit to this annual report on Form 10-K.
| Class and Year(1) | Total Amount Outstanding Exclusive of Treasury Securities(2) | Asset Coverage per Unit(3) | Involuntary Liquidating Preference per Unit(4) | Average Market Value per Unit(5) | ||||||||||||||||||||||
| 2019 Notes | ||||||||||||||||||||||||||
| 2012 | $ | 69,000 | $ | 1,580 | — | $ | 25.92 | |||||||||||||||||||
| 2013 | 69,000 | 2,259 | — | 25.99 | ||||||||||||||||||||||
| 2014 | 69,000 | 2,215 | — | 25.74 | ||||||||||||||||||||||
| December 2022 Notes | ||||||||||||||||||||||||||
| 2012 | 80,500 | 1,580 | — | 25.03 | ||||||||||||||||||||||
| 2013 | 80,500 | 2,259 | — | 24.94 | ||||||||||||||||||||||
| 2014 | 80,500 | 2,215 | — | 25.05 | ||||||||||||||||||||||
| 2015 | 80,500 | 1,972 | — | 25.23 | ||||||||||||||||||||||
| 2016 | 80,500 | 2,124 | — | 25.15 | ||||||||||||||||||||||
| 2017 | 80,500 | 2,120 | — | 25.51 | ||||||||||||||||||||||
| March 2022 Notes | ||||||||||||||||||||||||||
| 2015 | 86,250 | 1,972 | — | 25.46 | ||||||||||||||||||||||
| 2016 | 86,250 | 2,124 | — | 25.58 | ||||||||||||||||||||||
| 2017 | 86,250 | 2,120 | — | 25.85 | ||||||||||||||||||||||
SBA-guaranteed debentures payable(6) | ||||||||||||||||||||||||||
| 2012 | 213,605 | 1,580 | — | N/A | ||||||||||||||||||||||
| 2013 | 193,285 | 2,259 | — | N/A | ||||||||||||||||||||||
| 2014 | 224,780 | 2,215 | — | N/A | ||||||||||||||||||||||
| 2015 | 224,968 | 1,972 | — | N/A | ||||||||||||||||||||||
| 2016 | 250,000 | 2,124 | — | N/A | ||||||||||||||||||||||
| 2017 | 250,000 | 2,120 | — | N/A | ||||||||||||||||||||||
| May 2011 Credit Facility | ||||||||||||||||||||||||||
| 2012 | — | 1,580 | — | N/A | ||||||||||||||||||||||
| 2013 | 11,221 | 2,259 | — | N/A | ||||||||||||||||||||||
| 2014 | 62,620 | 2,215 | — | N/A | ||||||||||||||||||||||
| 2015 | 131,257 | 1,972 | — | N/A | ||||||||||||||||||||||
| 2016 | 127,011 | 2,124 | — | N/A | ||||||||||||||||||||||
| 2017 | 125,315 | 2,120 | — | N/A | ||||||||||||||||||||||
August 2018 Credit Facility(7) | ||||||||||||||||||||||||||
| 2018 | 570,000 | 1,988 | — | N/A | ||||||||||||||||||||||
| 2019 | 107,200 | 1,851 | — | N/A | ||||||||||||||||||||||
February 2019 Credit Facility(8) | ||||||||||||||||||||||||||
| 2019 | 245,288 | 1,851 | — | N/A | ||||||||||||||||||||||
| 2020 | 719,661 | 1,760 | — | N/A | ||||||||||||||||||||||
| 2021 | 655,189 | 1,538 | — | N/A | ||||||||||||||||||||||
| Debt Securitization | ||||||||||||||||||||||||||
| 2019 | 318,210 | 1,851 | — | N/A | ||||||||||||||||||||||
| August 2025 Notes | ||||||||||||||||||||||||||
| 2020 | 50,000 | 1,760 | — | N/A | ||||||||||||||||||||||
| 2021 | 50,000 | 1,538 | — | N/A | ||||||||||||||||||||||
74
| 3/31/17 | 6/30/17 | 9/30/17 | 12/31/17 | 3/31/18 | 6/30/18 | 9/30/18 | 12/31/18 | |||||||||||||||||||
| Barings BDC, Inc. | 118.45 | 112.11 | 93.91 | 64.40 | 77.46 | 80.03 | 81.76 | 74.35 | ||||||||||||||||||
| NASDAQ Composite Index | 128.24 | 133.58 | 141.68 | 150.96 | 154.87 | 165.11 | 177.34 | 146.67 | ||||||||||||||||||
| NYSE Composite Index | 112.28 | 115.72 | 120.82 | 127.46 | 124.64 | 126.05 | 132.68 | 116.06 | ||||||||||||||||||
| Wells Fargo Business Development Company Index | 130.07 | 126.37 | 126.37 | 123.07 | 120.84 | 128.01 | 134.86 | 119.43 | ||||||||||||||||||
| 3/31/19 | 6/30/19 | 9/30/19 | 12/31/19 | |||||||||||||||||||
| Barings BDC, Inc. | 81.94 | 83.27 | 87.10 | 89.51 | ||||||||||||||||||
| NASDAQ Composite Index | 171.32 | 177.95 | 178.27 | 200.49 | ||||||||||||||||||
| NYSE Composite Index | 130.40 | 134.97 | 135.37 | 145.66 | ||||||||||||||||||
| Wells Fargo Business Development Company Index | 136.79 | 142.36 | 147.80 | 155.33 | ||||||||||||||||||
| Class and Year(1) | Total Amount Outstanding Exclusive of Treasury Securities(2) | Asset Coverage per Unit(3) | Involuntary Liquidating Preference per Unit(4) | Average Market Value per Unit(5) | ||||||||||||||||||||||
| Series B Notes | ||||||||||||||||||||||||||
| 2020 | 62,500 | 1,760 | — | N/A | ||||||||||||||||||||||
| 2021 | 62,500 | 1,538 | — | N/A | ||||||||||||||||||||||
| Series C Notes | ||||||||||||||||||||||||||
| 2020 | 112,500 | 1,760 | — | N/A | ||||||||||||||||||||||
| 2021 | 112,500 | 1,538 | — | N/A | ||||||||||||||||||||||
| Series D Notes | ||||||||||||||||||||||||||
| 2021 | 80,000 | 1,538 | — | N/A | ||||||||||||||||||||||
| Series E Notes | ||||||||||||||||||||||||||
| 2021 | 70,000 | 1,538 | — | N/A | ||||||||||||||||||||||
| November 2026 Notes | ||||||||||||||||||||||||||
| 2021 | 350,000 | 1,538 | — | N/A | ||||||||||||||||||||||
| Total Senior Securities | ||||||||||||||||||||||||||
| 2012 | 363,105 | 1,580 | — | N/A | ||||||||||||||||||||||
| 2013 | 354,006 | 2,259 | — | N/A | ||||||||||||||||||||||
| 2014 | 436,900 | 2,215 | — | N/A | ||||||||||||||||||||||
| 2015 | 522,975 | 1,972 | — | N/A | ||||||||||||||||||||||
| 2016 | 543,761 | 2,124 | — | N/A | ||||||||||||||||||||||
| 2017 | 572,820 | 2,120 | — | N/A | ||||||||||||||||||||||
| 2018 | 570,000 | 1,988 | — | N/A | ||||||||||||||||||||||
| 2019 | 670,698 | 1,851 | — | N/A | ||||||||||||||||||||||
| 2020 | 944,661 | 1,760 | — | N/A | ||||||||||||||||||||||
| 2021 | 1,380,189 | 1,538 | — | N/A | ||||||||||||||||||||||
The selected financial data atinformation in the senior securities tables for 2017 - 2019 and for years prior to 2016 is unaudited. An independent registered public accounting firm has performed agreed-upon procedures related to the fiscal years endedaccuracy of the total amount outstanding exclusive of treasury securities as of December 31, 2015, 2016, 2017, 2018 and 2019 and the asset coverage per unit as of December 31, 2017, 2018 and 2019.
(2)Total amount of each class of senior securities outstanding at the end of the period presented.
(3)Asset coverage per unit is the ratio of the carrying value of our total consolidated assets, less all liabilities and indebtedness not represented by senior securities, to the aggregate amount of senior securities representing indebtedness. Asset coverage per unit is expressed in terms of dollar amounts per $1,000 of indebtedness. All prior period ratios have been derived fromconformed with this current presentation.
(4)The amount to which such class of senior security would be entitled upon the involuntary liquidation of the issuer in preference to any security junior to it. The “—” indicates information which the SEC expressly does not require to be disclosed for certain types of senior securities.
(5)Average market value per unit for our financial statements that have been audited by Ernst & Young LLP, an independent registered public accounting firm. You should read this selected financialunsecured notes issued in March 2012 due 2019 (the “2019 Notes”), our unsecured notes issued in October 2012 and other dataNovember 2012 due 2022 (the “December 2022 Notes”) and our unsecured notes issued in conjunctionFebruary 2015 due 2022 (the “March 2022 Notes”) represent the average of the daily closing prices as reported on the NYSE for each security during 2012, 2013, 2014, 2015, 2016 and 2017, as applicable. Average market value per unit for our SBA-guaranteed debentures payable, our terminated credit facility initially entered into in May 2011 (the “May 2011 Credit Facility”), Barings BDC Senior Funding I, LLC's terminated credit facility initially entered into in August 2018 with Bank of America, N.A. (the "August 2018 Credit Facility"), the February 2019 Credit Facility, our “Management’s Discussion and Analysis of Financial Condition and Results of Operations”$449.3 million term debt securitization in May 2019 (the “Debt Securitization”), the August 2025 Notes, the November Notes, the February Notes and the financial statements andNovember 2026 Notes are not applicable because these senior securities are not registered for public trading.
(6)We have obtained exemptive relief from the SEC to permit us to exclude the SBA-guaranteed debentures payable from the 200% asset coverage test under the Investment Company Act.
(7)The August 2018 Credit Facility was terminated at our election in June 2020.
(8)The remaining notes thereto.issued in connection with the Debt Securitization were repaid in full in October 2020.
75
| Year Ended December 31, | ||||||||||||||||||||
| 2015 | 2016 | 2017 | 2018 | 2019 | ||||||||||||||||
| (Dollars and share amounts in thousands, except per share data) | ||||||||||||||||||||
| Income statement data: | ||||||||||||||||||||
| Investment income: | ||||||||||||||||||||
| Total loan interest, fee and dividend income | $ | 121,062 | $ | 113,332 | $ | 122,290 | $ | 78,238 | $ | 75,638 | ||||||||||
| Interest income from cash | 225 | 348 | 715 | 1,985 | 10 | |||||||||||||||
| Total investment income | 121,287 | 113,680 | 123,005 | 80,223 | 75,648 | |||||||||||||||
| Operating expenses: | ||||||||||||||||||||
| Interest and other financing fees | 26,754 | 26,721 | 29,261 | 23,887 | 26,101 | |||||||||||||||
| Base management fee | — | �� | — | — | 4,219 | 12,112 | ||||||||||||||
| Compensation expenses | 19,009 | 23,676 | 16,136 | 37,487 | 442 | |||||||||||||||
| General and administrative expenses | 3,895 | 4,406 | 5,370 | 16,178 | 6,441 | |||||||||||||||
| Total operating expenses | 49,658 | 54,803 | 50,767 | 81,771 | 45,096 | |||||||||||||||
| Base management fee waived | — | — | — | (1,487 | ) | — | ||||||||||||||
| Net operating expenses | 49,658 | 54,803 | 50,767 | 80,284 | 45,096 | |||||||||||||||
| Net investment income (loss) | 71,629 | 58,877 | 72,238 | (61 | ) | 30,552 | ||||||||||||||
| Net realized gains (losses): | ||||||||||||||||||||
| Non-Control / Non-Affiliate investments | 9,003 | (2,414 | ) | (3,683 | ) | (130,870 | ) | (3,798 | ) | |||||||||||
| Affiliate investments | 2,315 | 4,399 | (3,980 | ) | 9,939 | — | ||||||||||||||
| Control investments | (38,807 | ) | — | (45,206 | ) | (38,542 | ) | — | ||||||||||||
| Net realized gains (losses) on investments | (27,489 | ) | 1,985 | (52,869 | ) | (159,473 | ) | (3,798 | ) | |||||||||||
| Foreign currency transactions | — | — | 1,269 | 1,081 | (12 | ) | ||||||||||||||
| Net realized gains (losses) | (27,489 | ) | 1,985 | (51,600 | ) | (158,392 | ) | (3,810 | ) | |||||||||||
| Net unrealized appreciation (depreciation): | ||||||||||||||||||||
| Non-Control / Non-Affiliate investments | (23,583 | ) | (9,080 | ) | (65,786 | ) | 27,025 | 33,021 | ||||||||||||
| Affiliate investments | 2,839 | (5,473 | ) | (7,356 | ) | 3,198 | 72 | |||||||||||||
| Control investments | 23,876 | (11,464 | ) | 27,547 | 24,387 | — | ||||||||||||||
| Net unrealized appreciation (depreciation) on investments | 3,132 | (26,017 | ) | (45,595 | ) | 54,610 | 33,093 | |||||||||||||
| Foreign currency transactions | 2,363 | (153 | ) | (2,822 | ) | (864 | ) | (1,005 | ) | |||||||||||
| Net unrealized appreciation (depreciation) | 5,495 | (26,170 | ) | (48,417 | ) | 53,746 | 32,088 | |||||||||||||
| Net realized and unrealized gains (losses) on investments and foreign currency transactions | (21,994 | ) | (24,185 | ) | (100,017 | ) | (104,646 | ) | 28,278 | |||||||||||
| Loss on extinguishment of debt | (1,394 | ) | — | — | (10,507 | ) | (297 | ) | ||||||||||||
| Benefit from (provision for) taxes | (384 | ) | (436 | ) | (871 | ) | 932 | (341 | ) | |||||||||||
| Net increase (decrease) in net assets resulting from operations | $ | 47,857 | $ | 34,256 | $ | (28,650 | ) | $ | (114,282 | ) | $ | 58,192 | ||||||||
| Net investment income (loss) per share — basic and diluted | $ | 2.16 | $ | 1.62 | $ | 1.55 | $ | — | $ | 0.61 | ||||||||||
| Net increase (decrease) in net assets resulting from operations per share — basic and diluted | $ | 1.44 | $ | 0.94 | $ | (0.62 | ) | $ | (2.29 | ) | $ | 1.16 | ||||||||
| Net asset value per common share | $ | 15.23 | $ | 15.13 | $ | 13.43 | $ | 10.98 | $ | 11.66 | ||||||||||
| Quarterly dividends / distributions per share | $ | 2.16 | $ | 1.89 | $ | 1.65 | $ | 0.43 | $ | 0.54 | ||||||||||
| Supplemental dividends / distributions per share | 0.20 | — | — | — | — | |||||||||||||||
| Total dividends/distributions declared per share | $ | 2.36 | $1.89 | $1.65 | $0.43 | $0.54 | ||||||||||||||
| Weighted average number of shares outstanding — basic and diluted | 33,234 | 36,405 | 46,498 | 49,897 | 50,185 | |||||||||||||||
Item 6. [Reserved].
| Year Ended December 31, | ||||||||||||||||||||
| 2015 | 2016 | 2017 | 2018 | 2019 | ||||||||||||||||
| (Dollars in thousands) | ||||||||||||||||||||
| Balance sheet data: | ||||||||||||||||||||
| Assets: | ||||||||||||||||||||
| Investments at fair value | $ | 977,277 | $ | 1,037,907 | $ | 1,016,284 | $ | 1,121,856 | $ | 1,173,644 | ||||||||||
| Cash | 52,615 | 107,088 | 191,850 | 12,427 | 21,992 | |||||||||||||||
| Interest and fees receivable | 4,892 | 10,190 | 7,807 | 6,009 | 5,266 | |||||||||||||||
| Prepaid expenses and other current assets | 947 | 1,660 | 1,855 | 2,732 | 1,112 | |||||||||||||||
| Deferred income taxes | — | — | — | 1,391 | — | |||||||||||||||
| Deferred financing fees | 3,480 | 2,700 | 5,186 | 252 | 5,366 | |||||||||||||||
| Receivable from unsettled transactions | — | — | — | 22,910 | 45,255 | |||||||||||||||
| Property and equipment, net | 106 | 106 | 81 | — | — | |||||||||||||||
| Total assets | $ | 1,039,317 | $ | 1,159,651 | $ | 1,223,063 | $ | 1,167,577 | $ | 1,252,635 | ||||||||||
| Liabilities: | ||||||||||||||||||||
| Accounts payable and accrued liabilities | $ | 7,464 | $ | 6,797 | $ | 9,863 | $ | 5,026 | $ | 5,192 | ||||||||||
| Interest payable | 3,714 | 3,997 | 3,997 | 750 | 2,492 | |||||||||||||||
| Taxes payable | 735 | 490 | 796 | 301 | — | |||||||||||||||
| Deferred income taxes | 4,988 | 2,054 | 1,332 | — | — | |||||||||||||||
| Payable from unsettled transactions | — | — | — | 28,533 | 4,924 | |||||||||||||||
| Borrowings under credit facilities | 131,257 | 127,012 | 156,071 | 570,000 | 352,488 | |||||||||||||||
| Debt securitization | — | — | — | — | 316,664 | |||||||||||||||
| Notes | 162,142 | 162,755 | 163,408 | — | — | |||||||||||||||
| SBA-guaranteed debentures payable | 220,649 | 245,390 | 246,321 | — | — | |||||||||||||||
| Total liabilities | 530,949 | 548,495 | 581,788 | 604,610 | 681,760 | |||||||||||||||
| Net assets | 508,368 | 611,156 | 641,275 | 562,967 | 570,875 | |||||||||||||||
| Total liabilities and net assets | $ | 1,039,317 | $ | 1,159,651 | $ | 1,223,063 | $ | 1,167,577 | $ | 1,252,635 | ||||||||||
| Other data: | ||||||||||||||||||||
| Weighted average yield on total investments(1)(2) | 10.6 | % | 10.2 | % | 9.6 | % | 6.2 | % | 6.2 | % | ||||||||||
| Number of portfolio companies | 92 | 88 | 89 | 139 | 147 | |||||||||||||||
| Expense ratios (as percentage of average net assets): | ||||||||||||||||||||
| Base management fee (net), compensation and general and administrative expenses | 4.4 | % | 5.0 | % | 3.2 | % | 9.0 | % | 3.3 | % | ||||||||||
| Interest and other financing fees | 5.1 | 4.8 | 4.4 | 3.8 | 4.5 | |||||||||||||||
| Total expenses, net of base management fee waived | 9.5 | % | 9.8 | % | 7.6 | % | 12.8 | % | 7.8 | % | ||||||||||
| Ratio of total expenses, net of base management fee waived, including loss on extinguishment of debt and (provision for) benefit from taxes, to average net assets | 9.8 | % | 9.9 | % | 7.7 | % | 14.3 | % | 7.9 | % | ||||||||||
Item 7. Management’s Discussion and Analysis of Financial Condition and Results of Operations.
The information in this section contains forward-looking statements that involve risks and uncertainties. Please see “Risk Factors” and “Forward-Looking Statements” for a discussion of the uncertainties, risks and assumptions associated with these statements. You should read the following discussion in conjunction with the combined financial statements and related notes and other financial information appearing elsewhere in this Annual Report on Form 10-K.
The following discussion is designed to provide a better understanding of our financial statements, including a brief discussion of our business, key factors that impacted our performance and a summary of our operating results. The following discussion should be read in conjunction with the consolidated financial statements and the notes thereto included or incorporated by reference in Item 8 of this Annual Report on Form 10-K. Historical results and percentage relationships among any amounts in the financial statements are not necessarily indicative of trends in operating results for any future periods.
On April 3, 2018, December 23, 2020, we entered into an asset purchase agreement, or the Asset Purchase Agreement, with BSP Asset Acquisition I, LLC, or the Asset Buyer (an affiliatecompleted our acquisition of Benefit Street Partners L.L.C.MVC Capital, Inc., a Delaware corporation (“MVC”), (the “MVC Acquisition”) pursuant to which we agreed to sellthe terms and conditions of that certain Agreement and Plan of Merger (the “MVC Merger Agreement”), dated as of August 10, 2020, with MVC, Mustang Acquisition Sub, Inc., a Delaware corporation and our December 31, 2017wholly owned subsidiary (“Acquisition Sub”), and Barings LLC, our external investment portfolioadviser and our administrator (“Barings”). To effect the acquisition, Acquisition Sub merged with and into MVC, with MVC surviving the merger as our wholly owned subsidiary (the “First MVC Merger”). Immediately thereafter, MVC merged with and into us, with us as the surviving company (the “Second MVC Merger” and, together with the First MVC Merger, the “MVC Merger”).
Pursuant to the Asset Buyer for gross proceeds of $981.2 million in cash, subject to certain adjustments to take into account portfolio activity and other matters occurring since December 31, 2017, such transaction referred to herein asMVC Merger Agreement, MVC stockholders received the Asset Sale Transaction.
In connection with the MVC Acquisition, on December 31, 2017, as described in greater detail in the Asset Purchase Agreement. Adjustments to the purchase price included, among other things, approximately $208.8 million of principal payments and prepayments, sales proceeds and distributions related to the investment portfolio that were received and retained by us between December 31, 2017 and23, 2020, following the closing of the Asset Sale Transaction, offset by approximately $29.5 million of loansMVC Merger, we entered into (1) an amended and equity investments originated byrestated investment advisory agreement (the “Amended and Restated Advisory Agreement”) with Barings, effective January 1, 2021, and (2) a credit support agreement (the “MVC Credit Support Agreement”) with Barings, pursuant to which Barings has agreed to provide credit support to us between December 31, 2017 andin the closing of the Asset Sale Transaction.
76
requirements, including covenants under our $875 million senior secured revolving credit facility with ING Capital LLC (as amended, restated and otherwise modified from time to time, the "February 2019 Credit Facility").
Pending Sierra Income Corporation Acquisition
On September 21, 2021, we entered into an Agreement and Plan of Merger (the “Sierra Merger Agreement”) by and among us, Mercury Acquisition Sub, Inc., a Maryland corporation and our direct wholly owned subsidiary (“Sierra Acquisition Sub”), Sierra Income Corporation, a Maryland corporation (“Sierra”), and Barings. The Sierra Merger Agreement provides that, on the terms and subject to the conditions set forth in the Sierra Merger Agreement, Sierra Acquisition Sub will merge with and into Sierra, with Sierra continuing as the surviving company and as our wholly owned subsidiary (the “First Sierra Merger”) and, immediately thereafter, Sierra will merge with and into us, with Barings BDC, Inc. continuing as the surviving company (the “Second Sierra Merger” and, together with the First Sierra Merger, the “Sierra Merger”). Both the Board and the board of directors of Sierra, including all of the respective independent directors, have approved the Sierra Merger Agreement and the transactions contemplated therein. The parties to the Sierra Merger Agreement intend the Sierra Merger to be treated as a “reorganization” within the meaning of Section 368(a) of the Internal Revenue Code of 1986, as amended (the “Code”).
In the First Sierra Merger, each share of Sierra common stock issued and outstanding immediately prior to the effective time of the First Sierra Merger (excluding any shares cancelled pursuant to the Sierra Merger Agreement) will be converted into the right to receive (i) $0.9783641 per share in cash, without interest, from Barings (such amount of cash, the “Sierra Cash Consideration”) and (ii) 0.44973 of a validly issued, fully paid and non-assessable share of our common stock (the “Sierra Share Consideration” and, together with the Sierra Cash Consideration, the “Sierra Merger Consideration”).
The Sierra Merger Agreement contains representations, warranties and covenants, including, among others, covenants relating to the operation of each of our and Sierra’s businesses during the period prior to the closing of the Sierra Merger. We and Sierra have agreed to convene and hold stockholder meetings for the purpose of obtaining the approvals required of our and Sierra’s stockholders, respectively, and our Board and the board of directors of Sierra have agreed to recommend that their respective stockholders approve the applicable proposals (as described below).
The Sierra Merger Agreement provides that Sierra shall not, and shall cause its subsidiaries and instruct its representatives not to, directly or indirectly, solicit proposals relating to alternative transactions, or, subject to certain exceptions, initiate or participate in discussions or negotiations regarding, or provide information with respect to, any proposal for an alternative transaction. However, the Sierra board of directors may, subject to certain conditions, change its recommendation to the Sierra stockholders or, on payment of a termination fee of $11.0 million to us and the reimbursement of up to $2.0 million in expenses incurred by us and Barings, terminate the Sierra Merger Agreement and enter into an Alternative Acquisition Agreement (as defined in the Sierra Merger Agreement) for a Superior Proposal (as defined in the Sierra Merger Agreement) if it determines in good faith, after consultation with its outside legal counsel, that failure to do so would be inconsistent with the directors’ duties under applicable law.
Consummation of the First Sierra Merger, which is currently anticipated to occur during the first quarter of fiscal year 2022, is subject to certain customary closing conditions, including (1) approval of the First Sierra Merger by the holders of at least a majority of the outstanding shares of Sierra common stock entitled to vote thereon, (2) approval of the issuance of our common stock to be issued in the First Sierra Merger by a majority of the votes cast by our stockholders on the matter at our stockholders meeting, (3) approval of the issuance of our common stock in connection with the First Sierra Merger at a price below the then-current net asset value per share of our common stock, if applicable, by the vote specified in Section 63(2)(A) of the Investment Company Act of 1940, as amended (the “1940 Act”), (4) the absence of certain legal impediments to the consummation of the Sierra Merger, (5) effectiveness of the registration statement for our common stock to be issued as consideration in the First Sierra Merger, (6) approval for listing on the NYSE of our common stock to be issued as consideration in the First Sierra Merger, (7) subject to certain materiality standards, the accuracy of the representations and warranties and compliance with the covenants of each party to the Sierra Merger Agreement, and (8) required regulatory approvals
77
(including expiration of the waiting period under the Hart-Scott-Rodino Antitrust Improvements Act of 1976, as amended, or early termination thereof).
Barings, as party to the Sierra Merger Agreement, agreed to vote all shares of our common stock and the 10b5-1 Plan terminatedover which it has voting power (other than in accordance with its terms. Upon completionfiduciary capacity) in favor of the 10b5-1 Plan, Barings had purchased 5,084,302 sharesproposals to be submitted by us to our stockholders for approval relating to the Sierra Merger.
In addition, we and Sierra will take steps necessary to provide for the repayment at closing of Sierra’s existing loan agreement. The Sierra Merger Agreement also contains certain termination rights in favor of us and Sierra, including if the First Sierra Merger is not completed on or before March 31, 2022 or if the requisite approvals of our common stock pursuant to the 10b5-1 Planstockholders or Sierra stockholders are not obtained.
Further, we will enter into an amendment and owned a total of 13,639,681 shares of our common stock, or 26.6%restatement of the total shares outstanding.Amended and Restated Advisory Agreement, effective as of the closing of the Sierra Merger, to raise the annualized hurdle rate thereunder from 8.0% to 8.25%. Following the closing of the Sierra Merger, we will also enter into a credit support agreement with Barings, for the benefit of the combined company, to protect against net cumulative unrealized and realized losses of up to $100.0 million on the acquired Sierra investment portfolio over the next ten years.
Overview of Our Business
We are a Maryland corporation incorporated on October 10, 2006. PriorIn August 2018, in connection with the closing of an externalization transaction through which Barings agreed to become our external investment adviser, we entered into an investment advisory agreement (the "Original Advisory Agreement") and an administration agreement (the "Administration Agreement") with Barings. In connection with the Externalization Transaction, we were internally managed bycompletion of our executive officers under the supervision of the Board. During this period, we did not pay management or advisory fees, but instead incurred the operating costs associated with employing executive management and investment and portfolio management professionals. On August 2, 2018,MVC Acquisition, we entered into the Amended and Restated Advisory Agreement with Barings on December 23, 2020, following approval of the Amended and Restated Advisory Agreement by our stockholders at our December 23, 2020 special meeting of stockholders. The terms of the Amended and Restated Advisory Agreement became effective on January 1, 2021. Under the terms of the Amended and Restated Advisory Agreement and became an externally-managed BDC managed by Barings. the Administration Agreement, Barings serves as our investment adviser and administrator and manages our investment portfolio and performs (or oversees, or arranges for, the performance of) the administrative services necessary for our operation.
An externally-managed BDC generally does not have any employees, and its investment and management functions are provided by an outside investment adviser and administrator under an advisory agreement and administration agreement. Instead of directly compensating employees, we pay Barings for investment and management services pursuant to the terms of the Amended and Restated Advisory Agreement (and, prior to January 1, 2021, pursuant to the terms of the Original Advisory Agreement) and the Administration Agreement. Under the terms of the Amended and Restated Advisory Agreement (and, prior to January 1, 2021, under the terms of the Original Advisory Agreement), the fees paid to Barings for managing our affairs will beare determined based upon an objective and fixed formula, as compared with
the subjective and variable nature of the costs associated with employing management and employees in an internally-managed BDC structure, which include bonuses that cannot be directly tied to Company performance because of restrictions on incentive compensation under the 1940 Act.
Barings employs fundamental credit analysis, and targets investments in businesses with relatively low levels of cyclicality and operating risk. The holdholding size of each position will generally be dependent upon a number of factors including total facility size, pricing and structure, and the number of other lenders in the facility. Barings has experience managing levered vehicles, both public and private, and will seek to enhance our returns through the use of leverage with a prudent approach that prioritizes capital preservation. Barings believes this strategy and approach
78
offers attractive risk/return with lower volatility given the potential for fewer defaults and greater resilience through market cycles.
We generate revenues in the form of interest income, primarily from our investments in debt securities, loan origination and other fees and dividend income. Fees generated in connection with our debt investments are recognized over the life of the loan using the effective interest method or, in some cases, recognized as earned. Our syndicated senior secured loans generally bear interest between LIBOR plus 300 basis points and LIBOR plus 400 points. Our senior secured, middle-market, private debt investments generally have terms of between five and seven years. Our senior secured, middle-market, first lien private debt investments generally bear interest between LIBOR (or the applicable currency rate for investments in foreign currencies) plus 450 basis points and LIBOR plus 650 basis points per annum. Our subordinated middle-market, private debt investments generally bear interest between LIBOR (or the applicable currency rate for investments in foreign currencies) plus 700 basis points and LIBOR plus 900 basis points per annum if floating rate, and between 8% and 15% if fixed rate. From time to time, certain of our investments may have a form of interest, referred to as payment-in-kind, or PIK, interest, which is not paid currently but is instead accrued and added to the loan balance and paid at the end of the term.
As of December 31, 2019,2021 and December 31, 2020, the weighted average yield on the principal amount of our syndicated senior secured loan portfolio and our middle-market privateoutstanding debt portfolioinvestments other than non-accrual debt investments was approximately 5.4%7.2% and 7.0%7.1%, respectively. As of December 31, 2019, theThe weighted average yield on these two portfolios on a combined basis was approximately 6.2%. The weighted-average yield onthe principal amount of all of our outstanding investments (including equity and equity-linked investments and short-term investments but excluding non-accrual debt investments) was approximately 5.8%6.1% and 6.4% as of December 31, 2019.
COVID-19 Developments
The weighted average yields across our investment portfolio dependspread of the Coronavirus and the COVID-19 pandemic, and the related effect on the relative seniorityU.S. and global economies, has had adverse consequences for the business operations of our investments within the capital structuressome of our portfolio companies and has adversely affected, and threatens to continue to adversely affect, our operations and the operations of Barings, including with respect to us. Barings has taken proactive steps around COVID-19 to address the potential impacts on their people, clients, communities and everyone they come in contact with, directly or through their premises. Protecting their employees and supporting the communities in which they live and work is a priority. Barings continues to operate with the majority of employees in the United States working remotely while maintaining service levels to our partners and clients. In the United States, Barings offices remained accessible throughout the fourth quarter of 2021 for employees who had a business need to work from an office location. All US-based employees have adopted a hybrid working pattern and started returning to office locations effective January 2022. In Europe, the majority of employees shifted to working remotely in the fourth quarter of 2021. In Asia-Pac, the majority of employees are working from office locations on average 2-3 days per week. Barings’ return-to-office taskforce continues to monitor the COVID-19 situation globally and are prepared to adapt office working patterns as required to ensure the safety of their employees and clients who visit Barings office locations. Barings’ cybersecurity policies are applied consistently when working remotely or in the office.
While we have been carefully monitoring the COVID-19 pandemic and its impact on our security interestsbusiness and the business of our portfolio companies, we have continued to fund our existing debt commitments. In addition, we have continued to make and originate, and expect to continue to make and originate, new loans.
We cannot predict the full impact of the COVID-19 pandemic, including its duration in portfolio company assets. Historically, priorthe United States and worldwide and the magnitude of the economic impact of the outbreak, including with respect to the Transactions, fromtravel restrictions, business closures and other quarantine measures imposed on service providers and other individuals by various local, state, and federal governmental authorities, as well as non-U.S. governmental authorities. We are unable to predict the timeextent and duration of any business and supply-chain disruptions, the extent to which COVID-19 will negatively affect our portfolio companies’ operating results or the impact that such disruptions may have on our results of operations and financial condition. Depending on the duration and extent of the disruption to the operations of our initial public offering, or IPO, in 2007,
79
companies may significantly curtail business operations, furlough or lay off employees and terminate service providers, and defer capital expenditures if subjected to prolonged and severe financial distress, which would likely impair their business on a balance between senior and subordinated securities. On August 2, 2018, Barings shifted our investment focus to invest initially in syndicated senior secured loans, bonds and other fixed income securities. Over time, Barings has been transitioning our portfolio to senior secured private debt investments in performing, well-established middle-market businesses that operate across a wide range of industries. This shift toward predominately senior securities is intended to reduce our credit risks in exchange for lower-yielding investments, which in turn has resultedpermanent basis. These developments would likely result in a decrease in the weighted average yieldvalue of our investment in any such portfolio company.
We will continue to monitor the situation relating to the COVID-19 pandemic and guidance from U.S. and international authorities, including federal, state and local public health authorities and may take additional actions based on their recommendations. In these circumstances, there may be developments outside our control requiring us to adjust our plan of operation. As such, given the dynamic nature of this situation, we cannot reasonably estimate the impacts of COVID-19 on our financial condition, results of operations or cash flows in the future. However, to the extent our portfolio companies are adversely impacted by the effects of the COVID-19 pandemic, it may have a material adverse impact on our future net investment portfolio.income, the fair value of our portfolio investments, our financial condition and the results of operations and financial condition of our portfolio companies.
Portfolio Composition
The total value of our investment portfolio was $1,173.6$1,800.6 million as of December 31, 2019,2021, as compared to $1,121.9$1,495.8 million as of December 31, 2018.2020. As of December 31, 2019,2021, we had investments in 147212 portfolio companies and two money market funds with an aggregate cost of $1,192.6$1,787.8 million. As of December 31, 2018,2020, we had investments in 139146 portfolio companies and onetwo money market fund with an aggregate cost of $1,173.9$1,486.1 million. As of both December 31, 20192021 and 2018,2020, none of our portfolio investments represented greater than 10% of the total fair value of our investment portfolio.
As of December 31, 20192021 and December 31, 2018,2020, our investment portfolio consisted of the following investments:
| Cost | Percentage of Total Portfolio | Fair Value | Percentage of Total Portfolio | |||||||||||||||||||||||
| December 31, 2021: | ||||||||||||||||||||||||||
| Senior debt and 1st lien notes | $ | 1,217,899,217 | 68 | % | $ | 1,221,597,953 | 68 | % | ||||||||||||||||||
| Subordinated debt and 2nd lien notes | 253,550,848 | 14 | 240,036,808 | 13 | ||||||||||||||||||||||
| Structured products | 37,054,829 | 2 | 40,270,659 | 2 | ||||||||||||||||||||||
| Equity shares | 145,790,765 | 8 | 154,476,657 | 9 | ||||||||||||||||||||||
| Equity warrants | 1,111,602 | — | 1,107,543 | — | ||||||||||||||||||||||
| Investments in joint ventures/PE fund | 132,416,803 | 8 | 143,104,332 | 8 | ||||||||||||||||||||||
| Short-term investments | — | — | — | — | ||||||||||||||||||||||
| $ | 1,787,824,064 | 100 | % | $ | 1,800,593,952 | 100 | % | |||||||||||||||||||
| December 31, 2020: | ||||||||||||||||||||||||||
| Senior debt and 1st lien notes | $ | 1,167,436,742 | 79 | % | $ | 1,171,250,512 | 79 | % | ||||||||||||||||||
| Subordinated debt and 2nd lien notes | 137,776,808 | 9 | 138,767,120 | 9 | ||||||||||||||||||||||
| Structured products | 30,071,808 | 2 | 32,508,845 | 2 | ||||||||||||||||||||||
| Equity shares | 44,693,645 | 3 | 44,651,114 | 3 | ||||||||||||||||||||||
| Equity warrants | 1,235,383 | — | 1,300,197 | — | ||||||||||||||||||||||
| Investments in joint ventures/PE fund | 39,282,532 | 3 | 41,759,922 | 3 | ||||||||||||||||||||||
| Short-term investments | 65,558,227 | 4 | 65,558,227 | 4 | ||||||||||||||||||||||
| $ | 1,486,055,145 | 100 | % | $ | 1,495,795,937 | 100 | % | |||||||||||||||||||
80
| Cost | Percentage of Total Portfolio | Fair Value | Percentage of Total Portfolio | |||||||||||
| December 31, 2019: | ||||||||||||||
Senior debt and 1st lien notes | $ | 1,070,031,715 | 90 | % | $ | 1,050,863,369 | 90 | % | ||||||
Subordinated debt and 2nd lien notes | 15,339,180 | 1 | $15,220,969 | 1 | ||||||||||
| Equity shares | 515,825 | — | $760,716 | — | ||||||||||
| Investment in joint venture | 10,158,270 | 1 | $10,229,813 | 1 | ||||||||||
| Short-term investments | 96,568,940 | 8 | $96,568,940 | 8 | ||||||||||
| $ | 1,192,613,930 | 100 | % | $ | 1,173,643,807 | 100 | % | |||||||
| December 31, 2018: | ||||||||||||||
Senior debt and 1st lien notes | $ | 1,120,401,043 | 95 | % | $ | 1,068,436,847 | 95 | % | ||||||
Subordinated debt and 2nd lien notes | 7,777,847 | 1 | 7,679,132 | 1 | ||||||||||
| Equity shares | 515,825 | — | 515,825 | — | ||||||||||
| Short-term investments | 45,223,941 | 4 | 45,223,941 | 4 | ||||||||||
| $ | 1,173,918,656 | 100 | % | $ | 1,121,855,745 | 100 | % | |||||||
Investment Activity
During the year ended December 31, 2019,2021, we purchased $18.1 million in syndicated senior secured loans, made 39112 new middle-market debt investments totaling $409.6$1,069.4 million, consisting of 38 senior secured, middle-market, private debtmade investments and one second lien, middle-market, private debt investment, made equity investments in our joint venture totaling $10.2 million and made additional debt investments in five existing portfolio companies totaling $12.2 million.$234.0 million, made a new joint venture equity investment totaling $13.7 million, made additional investments in existing joint venture equity portfolio companies totaling $79.4 million and made an $89.8 million equity co-investment alongside certain affiliates in a portfolio company focused on directly originated, senior-secured asset-based loans to middle-market companies. We had seven syndicated senior secured34 loans repaid at par totaling total $34.4$282.8 million had four middle-market portfolio company loans repaid at par totaling $44.0 million, received $28.2 million of syndicated senior secured loan principal payments and received $6.3$36.1 million of middle-market portfolio company principal payments. In addition, we sold $318.5$252.9 million of syndicated senior securedloans, recognizing a net realized gain on these transactions of $2.5 million, and sold $536.4 million of investments to our joint venture, realizing a loss on these transactions of $1.4 million. Lastly, we received proceeds related to the sale of equity investments totaling $8.6 million and recognized a net realized gain on such sales totaling $1.6 million.
During the year ended December 31, 2020, we made 76 new investments totaling $743.2 million, purchased $185.0 million of investments as part of the MVC Acquisition, made investments in existing portfolio companies totaling $114.6 million, made a new joint venture equity investment totaling $10.0 million and made an additional investment in one existing joint venture equity portfolio company totaling $10.0 million. We had 18 loans repaid at par totaling total $76.4 million and received $15.3 million of portfolio company principal payments. In addition, we sold $468.4 million of loans, recognizing a net realized loss on these transactions of $3.5$39.5 million, sold $4.8 million of a middle-market portfolio company debt investment and sold $36.1$126.1 million of middle-market portfolio company debt investments to our joint venture.venture realizing a loss on these transactions of $1.4 million. In addition, certain terms of one broadly syndicated loan investment were amended.was restructured. Under U.S. GAAP, this amendmentrestructuring was considered a material modification and as a result, we recognized a loss of approximately $0.2$0.6 million related to the amendment.this restructuring. Lastly, we received $0.5$0.8 million in escrow distributions from fourlegacy portfolio companies, which were recognized as realized gains and recognized a netrealized loss of $0.5$1.1 million relatedrelating to royalty payments due fromindemnification claims for a legacy Triangle Capital Corporation portfolio company.
Total portfolio investment activity for the years ended December 31, 20192021 and 20182020 was as follows:
| December 31, 2021 | Senior Debt and 1st Lien Notes | Subordinated Debt and 2nd Lien Notes | Structured Products | Equity Shares | Equity Warrants | Investments in Joint Ventures/ PE Fund | Short-term Investments | Total | |||||||||||||||||||||||||||||||||||||||
| Fair value, beginning of period | $ | 1,171,250,512 | $ | 138,767,120 | $ | 32,508,845 | $ | 44,651,114 | $ | 1,300,197 | $ | 41,759,922 | $ | 65,558,227 | $ | 1,495,795,937 | |||||||||||||||||||||||||||||||
| New investments | 1,104,331,866 | 160,737,734 | 19,815,398 | 108,111,475 | 163,000 | 93,134,271 | 297,560,982 | 1,783,854,726 | |||||||||||||||||||||||||||||||||||||||
| Proceeds from sales of investments | (765,417,430) | (13,683,500) | (10,068,420) | (8,269,168) | (450,000) | — | (363,118,408) | (1,161,006,926) | |||||||||||||||||||||||||||||||||||||||
| Loan origination fees received | (26,844,600) | (3,659,741) | — | — | — | — | — | (30,504,341) | |||||||||||||||||||||||||||||||||||||||
| Principal repayments received | (275,645,832) | (39,272,993) | (4,007,677) | — | — | — | — | (318,926,502) | |||||||||||||||||||||||||||||||||||||||
| Payment in kind interest | 3,112,247 | 8,503,991 | — | — | — | — | — | 11,616,238 | |||||||||||||||||||||||||||||||||||||||
| Accretion of loan premium/discount | 2,032,636 | 2,582,431 | 31,218 | — | — | — | — | 4,646,285 | |||||||||||||||||||||||||||||||||||||||
| Accretion of deferred loan origination revenue | 8,841,329 | 602,604 | — | — | — | — | — | 9,443,933 | |||||||||||||||||||||||||||||||||||||||
| Realized gain (loss) | 52,258 | (36,487) | 1,212,504 | 1,254,812 | 163,219 | — | (801) | 2,645,505 | |||||||||||||||||||||||||||||||||||||||
| Unrealized appreciation (depreciation) | (115,033) | (14,504,351) | 778,791 | 8,728,424 | (68,873) | 8,210,139 | — | 3,029,097 | |||||||||||||||||||||||||||||||||||||||
| Fair value, end of period | $ | 1,221,597,953 | $ | 240,036,808 | $ | 40,270,659 | $ | 154,476,657 | $ | 1,107,543 | $ | 143,104,332 | $ | — | $ | 1,800,593,952 | |||||||||||||||||||||||||||||||
81
| December 31, 2019 | Senior Debt and 1st Lien Notes | Subordinated debt and 2nd Lien Notes | Equity Shares | Investment in Joint Venture | Short-term Investments | Total | |||||||||||||||||
| Fair value, beginning of period | $ | 1,068,436,847 | $ | 7,679,132 | $ | 515,825 | $ | — | $ | 45,223,941 | $ | 1,121,855,745 | |||||||||||
| New investments | 429,318,922 | 10,615,730 | — | 10,158,270 | 913,641,727 | 1,363,734,649 | |||||||||||||||||
| Proceeds from sales of investments | (359,386,754 | ) | — | 49,854 | — | (862,296,728 | ) | (1,221,633,628 | ) | ||||||||||||||
| Loan origination fees received | (8,457,796 | ) | (148,551 | ) | — | — | — | (8,606,347 | ) | ||||||||||||||
| Principal repayments received | (109,909,128 | ) | (2,980,874 | ) | — | — | — | (112,890,002 | ) | ||||||||||||||
| Accretion of loan premium/discount | 278,897 | 797 | — | — | — | 279,694 | |||||||||||||||||
| Accretion of deferred loan origination revenue | 1,534,936 | 74,231 | 1,609,167 | ||||||||||||||||||||
| Realized loss | (3,748,409 | ) | — | (49,854 | ) | — | (3,798,263 | ) | |||||||||||||||
| Unrealized appreciation (depreciation) | 32,795,854 | (19,496 | ) | 244,891 | 71,543 | — | 33,092,792 | ||||||||||||||||
| Fair value, end of period | $ | 1,050,863,369 | $ | 15,220,969 | $ | 760,716 | $ | 10,229,813 | $ | 96,568,940 | $ | 1,173,643,807 | |||||||||||
| December 31, 2018 | Senior Debt and 1st Lien Notes | Subordinated Debt and 2nd Lien Notes | Equity Shares | Equity Warrants | Short-term Investments | Total | ||||||||||||||||||||||||||||||||||||||||||||||||||||||||||||||||
| December 31, 2020 | December 31, 2020 | Senior Debt and 1st Lien Notes | Subordinated Debt and 2nd Lien Notes | Structured Products | Equity Shares | Equity Warrants | Investment in Joint Venture | Short-term Investments | Total | |||||||||||||||||||||||||||||||||||||||||||||||||||||||||||||
| Fair value, beginning of period | $ | 262,803,297 | $ | 589,548,358 | $ | 162,543,691 | $ | 1,389,000 | $ | — | $ | 1,016,284,346 | Fair value, beginning of period | $ | 1,050,863,369 | $ | 15,220,969 | $ | — | $ | 760,716 | $ | — | $ | 10,229,813 | $ | 96,568,940 | $ | 1,173,643,807 | |||||||||||||||||||||||||||||||||||||||||
| New investments | 1,563,590,508 | 15,793,789 | 3,086,424 | — | 1,363,333,538 | 2,945,804,259 | New investments | 815,145,050 | 8,244,226 | 33,018,233 | 1,286,365 | 101,602 | 20,000,000 | 1,182,185,606 | 2,059,981,082 | |||||||||||||||||||||||||||||||||||||||||||||||||||||||
| Investment reclass | 8,617,000 | (8,617,000 | ) | — | — | — | — | |||||||||||||||||||||||||||||||||||||||||||||||||||||||||||||||
| Investments acquired in MVC merger | Investments acquired in MVC merger | 9,720,000 | 122,082,933 | — | 42,980,466 | 1,133,781 | 9,124,262 | — | 185,041,442 | |||||||||||||||||||||||||||||||||||||||||||||||||||||||||||||
| Proceeds from sales of investments | (405,187,718 | ) | — | (36,265,416 | ) | (708 | ) | (1,318,109,597 | ) | (1,759,563,439 | ) | Proceeds from sales of investments | (588,450,883) | (2,940,255) | (3,000,000) | 221,094 | — | — | (1,213,197,945) | (1,807,367,989) | ||||||||||||||||||||||||||||||||||||||||||||||||||
| Proceeds from sale of portfolio to Asset Buyer | (234,603,624 | ) | (418,521,991 | ) | (132,723,128 | ) | (1,202,274 | ) | — | (787,051,017 | ) | |||||||||||||||||||||||||||||||||||||||||||||||||||||||||||
| Loan origination fees received | (3,937,106 | ) | (168,690 | ) | — | — | — | (4,105,796 | ) | Loan origination fees received | (19,013,021) | (180,224) | — | — | — | — | — | (19,193,245) | ||||||||||||||||||||||||||||||||||||||||||||||||||||
| Principal repayments received | (43,281,056 | ) | (143,419,588 | ) | — | — | — | (186,700,644 | ) | Principal repayments received | (86,295,211) | (5,104,857) | (336,069) | — | — | — | — | (91,736,137) | ||||||||||||||||||||||||||||||||||||||||||||||||||||
| PIK interest earned | 259,414 | 3,517,139 | — | — | — | 3,776,553 | ||||||||||||||||||||||||||||||||||||||||||||||||||||||||||||||||
| PIK interest payments received | (1,403,097 | ) | (2,494,389 | ) | — | — | — | (3,897,486 | ) | |||||||||||||||||||||||||||||||||||||||||||||||||||||||||||||
| Payment in kind interest | Payment in kind interest | 453,896 | 41,753 | — | — | — | — | — | 495,649 | |||||||||||||||||||||||||||||||||||||||||||||||||||||||||||||
| Accretion of loan premium/discount | 183,527 | 14,188 | — | — | — | 197,715 | Accretion of loan premium/discount | 1,635,917 | 111,923 | 58,132 | — | — | — | — | 1,805,972 | |||||||||||||||||||||||||||||||||||||||||||||||||||||||
| Accretion of deferred loan origination revenue | 609,362 | 2,697,059 | — | — | — | 3,306,421 | Accretion of deferred loan origination revenue | 2,672,194 | 44,571 | — | — | — | — | — | 2,716,765 | |||||||||||||||||||||||||||||||||||||||||||||||||||||||
| Realized gain (loss) | (43,212,056 | ) | (147,889,422 | ) | 32,116,354 | (488,635 | ) | — | (159,473,759 | ) | Realized gain (loss) | (38,462,897) | 137,542 | 331,511 | (310,105) | — | — | 1,626 | (38,302,323) | |||||||||||||||||||||||||||||||||||||||||||||||||||
| Unrealized appreciation (depreciation) | (36,001,604 | ) | 117,219,679 | (28,242,100 | ) | 302,617 | — | 53,278,592 | Unrealized appreciation (depreciation) | 22,982,098 | 1,108,539 | 2,437,038 | (287,422) | 64,814 | 2,405,847 | — | 28,710,914 | |||||||||||||||||||||||||||||||||||||||||||||||||||||
| Fair value, end of period | $ | 1,068,436,847 | $ | 7,679,132 | $ | 515,825 | $ | — | $ | 45,223,941 | $ | 1,121,855,745 | Fair value, end of period | $ | 1,171,250,512 | $ | 138,767,120 | $ | 32,508,845 | $ | 44,651,114 | $ | 1,300,197 | $ | 41,759,922 | $ | 65,558,227 | $ | 1,495,795,937 | |||||||||||||||||||||||||||||||||||||||||
Non-Accrual Assets
Generally, when interest and/or principal payments on a loan become past due, or if we otherwise do not expect the borrower to be able to service its debt and other obligations, we will place the loan on non-accrual status and will generally cease recognizing interest income on that loan for financial reporting purposes until all principal and interest have been brought current through payment or due to a restructuring such that the interest income is deemed to be collectible. As of December 31, 20192021, we had two assets on non-accrual, the fair value of which was $36.0 million, which comprised 2.0% of the total fair value of our portfolio, and the cost of which was $50.9 million, which comprised 2.9% of the total cost of our portfolio. As of December 31, 2018,2020, we had noone asset on non-accrual, assets.the fair value of which was $3.0 million, which comprised 0.2% of the total fair value of our portfolio, and the cost of which was $3.0 million, which comprised 0.2% of the total cost of our portfolio.
A summary of our non-accrual assets as of December 31, 2021 is provided below:
Legal Solutions Holdings
In connection with the MVC Acquisition, we purchased our debt investment in Legal Solutions Holdings, or Legal Solutions. During the quarter ended September 30, 2021, we placed our debt investment in Legal Solutions on non-accrual status. As a result, under U.S. GAAP, we will not recognize interest income on our debt investment in Legal Solutions for financial reporting purposes. As of December 31, 2021, the cost of our debt investment in Legal Solutions was $10.1 million and the fair value of such investment was $5.9 million.
82
Custom Alloy Corporation
In connection with the MVC Acquisition, we purchased our debt investment in Custom Alloy Corporation, or Custom Alloy. During the quarter ended December 31, 2021, we placed our debt investment in Custom Alloy on non-accrual status. As a result, under U.S. GAAP, we will not recognize interest income on our debt investment in Custom Alloy for financial reporting purposes. As of December 31, 2021, the cost of our debt investment in Custom Alloy was $40.8 million and the fair value of such investment was $30.0 million.
Discussion and Analysis of Financial Condition and Results of Operations
Set forth below is a comparison of the results of operations and changes in financial condition for the years ended December 31, 2021 and 2020. The comparison of, and changes between, the fiscal years ended December 31, 2020 and 2019 can be found within “Item 7. Management's Discussion and Analysis of Financial Condition and Results of Operations” included in Part II of our annual report on Form 10-K for the fiscal year ended December 31, 2020, which is incorporated herein by reference.
Results of Operations
Comparison of years ended December 31, 20192021 and, 2018 and 20172020
Operating results for the years ended December 31, 2019, 20182021 and 2017 were as follows:2020:
| Year Ended December 31, | Year Ended December 31, | |||||||||||||||||||||||||||||||
| 2019 | 2018 | 2017 | 2021 | 2020 | ||||||||||||||||||||||||||||
| Total investment income | $ | 75,648,345 | $ | 80,223,625 | $ | 123,004,632 | Total investment income | $ | 135,335,374 | $ | 71,031,068 | |||||||||||||||||||||
| Net operating expenses | 45,096,749 | 80,284,347 | 50,766,815 | Net operating expenses | 76,367,540 | 39,972,665 | ||||||||||||||||||||||||||
| Net investment income (loss) | 30,551,596 | (60,722 | ) | 72,237,817 | ||||||||||||||||||||||||||||
| Net investment income before taxes | Net investment income before taxes | 58,967,834 | 31,058,403 | |||||||||||||||||||||||||||||
| Income taxes, including excise tax expense | Income taxes, including excise tax expense | 7,495 | 70,599 | |||||||||||||||||||||||||||||
| Net investment income after taxes | Net investment income after taxes | 58,960,339 | 30,987,804 | |||||||||||||||||||||||||||||
| Net realized losses | (3,810,448 | ) | (158,392,548 | ) | (51,599,927 | ) | Net realized losses | (3,379,062) | (38,289,580) | |||||||||||||||||||||||
| Net unrealized appreciation (depreciation) | 32,088,004 | 53,746,145 | (48,416,941 | ) | ||||||||||||||||||||||||||||
| Net unrealized appreciation | Net unrealized appreciation | 22,104,996 | 18,549,588 | |||||||||||||||||||||||||||||
| Loss on extinguishment of debt | (297,188 | ) | (10,507,183 | ) | — | Loss on extinguishment of debt | — | (3,088,728) | ||||||||||||||||||||||||
| Benefit from (provision for) taxes | (340,330 | ) | 932,172 | (871,410 | ) | |||||||||||||||||||||||||||
| Net increase (decrease) in net assets resulting from operations | $ | 58,191,634 | $ | (114,282,136 | ) | $ | (28,650,461 | ) | ||||||||||||||||||||||||
| Benefit from (provision) for taxes | Benefit from (provision) for taxes | (844) | 17,709 | |||||||||||||||||||||||||||||
| Net increase in net assets resulting from operations | Net increase in net assets resulting from operations | $ | 77,685,429 | $ | 8,176,793 | |||||||||||||||||||||||||||
Net increases or decreases in net assets resulting from operations vary substantially from period to period due to various factors. The net decrease in net assets resulting from operations for the year ended December 31, 2018 was primarily due to the net realized loss related to the Asset Sale Transaction and certain one-time compensation expenses and direct costs related to the Transactions. See further discussion regarding the Transactions above in
Investment Income
| Year Ended December 31, | Year Ended December 31, | |||||||||||||||||||||||||
| 2019 | 2018 | 2017 | 2021 | 2020 | ||||||||||||||||||||||
| Total interest income | $ | 73,471,393 | $ | 68,398,617 | $ | 98,039,869 | Total interest income | $ | 102,439,082 | $ | 65,620,891 | |||||||||||||||
| Total dividend income | 44,744 | 894,556 | 2,684,188 | Total dividend income | 8,879,156 | 2,603 | ||||||||||||||||||||
| Total fee and other income | 2,116,820 | 5,168,901 | 10,648,016 | Total fee and other income | 13,020,244 | 4,080,636 | ||||||||||||||||||||
| Total payment-in-kind interest income | 5,413 | 3,776,554 | 10,917,531 | Total payment-in-kind interest income | 10,996,305 | 1,326,307 | ||||||||||||||||||||
| Interest income from cash | 9,975 | 1,984,997 | 715,028 | Interest income from cash | 587 | 631 | ||||||||||||||||||||
| Total investment income | $ | 75,648,345 | $ | 80,223,625 | $ | 123,004,632 | Total investment income | $ | 135,335,374 | $ | 71,031,068 | |||||||||||||||