Washington, D.C.DC 20549
Form 10-K
| ANNUAL REPORT | |
For the fiscal year | |
Commission File No.: Number 000-16731
TherapeuticsMD, Inc.
(Exact nameName of registrantRegistrant as specifiedSpecified in its charter)
| Nevada | 87-0233535 | |
| (State or Incorporation or Organization) | (I.R.S. Employer | |
| Identification No.) |
6800 Broken Sound Parkway NW #320,
Third Floor
Boca Raton, FLFlorida 33487
(561) 961-1900
(Address, of principal executive offices)
including area code: (561) 961-1911
Securities registered pursuant to Section 12(b) of the Exchange Act: None
Title of | Name of Each Exchange | |
| Common Stock, | ||
Securities registered pursuant to Section 12(g) of the Act:None.
Indicate by check mark if the registrant is a well-known seasoned issuer, as defined in Rule 405 of the Securities Act. Yes¨☐ Nox☒
Indicate by check mark if the registrant is not required to file reports pursuant to Section 13 or Section 15(d) of the Exchange Act. Yes¨☐ Nox☒
Indicate by check mark whether the registrant has (1) has filed all reports required to be filed by Section 13 or 15(d) of the Securities Exchange Act of 1934 during the preceding 12 months (or for such shorter period that the registrant was required to file such reports), and (2) has been subject to such filing requirements for the past 90 days.
Indicate by check mark whether the registrant has submitted electronically and posted on its corporate Website, if any, every Interactive Data File required to be submitted and posted pursuant to Rule 405 of Regulation S-T (§232.405 of this chapter) during the preceding 12 months (or for such shorter period that the registrant was required to submit and post such files). Yesx☒ No¨☐
Indicate by check mark if disclosure of delinquent filers in responsepursuant to Item 405 of Regulation S-K (§229.405) is not contained herein, and will not be contained, to the best of the registrant’s knowledge, in definitive proxy or information statements incorporated by reference in Part III of this Form 10-K or any amendment to this Form 10-K. Yes x☐ No ¨
Indicate by check mark whether the registrant is a large accelerated filer, an accelerated filer, a non-accelerated filer, or a smaller reporting company. See the definitions of “large accelerated filer,” “accelerated filer” and “smaller reporting company” in Rule 12b-2 of the Exchange Act. (Check one):
| Large accelerated filer ☐ | Accelerated filer ☒ | |
| Non-accelerated filer ☐ | Smaller reporting company ☐ | |
| (Do not check if a smaller reporting company) |
Indicate by check mark whether the registrant is a shell company (as defined in Rule 12b-2 of the Exchange Act). Yes ¨☐ No x☒
The aggregate market value of the voting and non-voting common equitystock held by non-affiliates computed by reference tononaffiliates of the price at whichregistrant (91,907,740 shares) based on the common equity was last sold, or the average bid and askedclosing price of suchthe registrant’s common equity,stock as ofreported on NYSE MKT on June 28, 2013, which was the last business day of the registrant’s most recently completed second fiscal quarter: $42,509. (This calculation is based on historical data at June 30, 2011 and has not been adjusted relative to the subsequent reverse stock split effective October 3, 2011.)quarter, was $278,462,272. For purposes of the foregoing calculation only,this computation, all officers, directors, executive officers, and holders of 10% or morebeneficial owners of the issuer’s common capital stock have beenregistrant are deemed to be affiliates.
As of March 23, 2012 was 84,608,826.3, 2014, there were outstanding 145,017,060 shares of the registrant’s common stock, par value $0.001 per share.
Documents Incorporated by Reference
Portions of the registrant’s definitive Proxy Statement for its 2014 Annual Meeting of Stockholders are incorporated by reference into Part III of this Annual Report on Form 10-K where indicated. Such Proxy Statement will be filed with the Securities and Exchange Commission within 120 days of the registrant’s fiscal year ended December 31, 2013.
THERAPEUTICSMD, INC.
ANNUAL REPORT ON FORM 10-K
Fiscal Year Ended December 31, 2013
TABLE OF CONTENTS
vitaMedMD®, TherapeuticsMD®, and BocaGreenMD® are registered trademarks of our company. This Annual Report also contains trademarks and trade names of other companies.
This Annual Report includes market and industry data that we obtained from periodic industry publications, third-party studies and surveys, government agency sources, filings of public companies in our industry, and internal company surveys. Industry publications and surveys generally state that the information contained therein has been obtained from sources believed to be reliable. Although we believe the foregoing industry and market data to be reliable at the date of the report, this information could provide to be inaccurate as a result of a variety of matters.
Statement Regarding Forward-Looking Information
This Annual Report on Form 10-K (the “Report”),contains forward-looking statements that involve substantial risks and uncertainties. For example, statements regarding our operations, financial position, business strategy, product development, and other plans and objectives for future operations, and assumptions and predictions about future product development and demand, research and development, marketing, expenses and sales are all forward-looking statements. These statements may be found in the terms “we,items of this Annual Report entitled “Business” and “Management’s Discussion and Analysis of Financial Condition and Results of Operations,” “us,as well as in this Annual Report generally. These statements are generally accompanied by words such as “intend,” “our,“anticipate,” “Therapeutics,“believe,” “estimate,” “potential(ly),” “continue,” “forecast,” “predict,” “plan,” “may,” “will,” “could,” “would,” “should,” “expect,” or “our Company” refersthe negative of such terms or other comparable terminology.
We have based these forward-looking statements on our current expectations and projections about future events. We believe that the assumptions and expectations reflected in such forward-looking statements are reasonable, based on information available to TherapeuticsMD™, Inc., a Nevada corporation, together with its wholly owned subsidiary, vitaMedMD®, LLC, a Delaware limited liability company (“VitaMed”). Unless otherwise stated or unless the context otherwise requires, the description of our business set forth below is provided on a combined basis, taking into account our subsidiary, VitaMed.
We have identified some of the important factors that could cause future events to differ from our current expectations and they are described in this Annual Report in the section entitled “Risk Factors” that you should review carefully. Please consider our forward-looking statements in light of those risks as you read this Annual Report. If one or more of these or other risks or uncertainties materialize, or if our underlying assumptions prove to be incorrect, actual results may vary materially from what we project. We do not undertake, and specifically decline any obligation to update any forward-looking statements or to publicly announce the results of any revisions to any statements to reflect new information or future events or developments.
Overview
Our Company
We are a women’s health care product company focused on creating and commercializing products targeted exclusively for women. Currently, we are focused on conducting the clinical trials necessary for regulatory approval and commercialization of advanced hormone therapy pharmaceutical products. As compensation, LangThe current drug candidates used in our clinical trials are designed to alleviate the symptoms of and reduce the health risks resulting from menopause-related hormone deficiencies, including hot flashes, osteoporosis, and vaginal dryness. We are developing these hormone therapy drug candidates, which contain estradiol and progesterone alone or in combination, with the aim of demonstrating equivalent clinical efficacy at lower doses, thereby enabling an enhanced side effect profile compared with competing products. Our drug candidates are created from a platform of hormone technology that enables the administration of hormones with high bioavailability alone or in combination. In addition, we manufacture and distribute branded and generic prescription prenatal vitamins, as well as over-the-counter, or OTC, vitamins and cosmetics.
We have obtained U.S. Food and Drug Administration, or FDA, approval of our Investigational New Drug, or IND, applications to conduct clinical trials for four of our hormone therapy drug candidates: TX 12-001HR, our oral combination of progesterone and estradiol; TX 12-002HR, our oral progesterone alone; TX 12-003HR, our oral estradiol alone; and TX 12-004HR, our suppository estradiol alone.
Hormone Therapy Market
The menopause hormone therapy market includes two major components: an FDA-approved drug market and a non-FDA approved drug market supplied by compounding pharmacies. On November 27, 2013, the Drug Quality and Security Act became law and the FDA was issuedgiven additional oversight over compounding pharmacies. We believe FDA-approved products are easily measured and monitored, while non-FDA approved hormone therapy drug products, typically referred to as bioidenticals, when produced and sold by compounding pharmacies are not monitored or easily measured. We estimate the non-FDA approved compounded bioidentical hormone therapy combination sales of estradiol and progesterone products sold by compounding pharmacies approximate $1.5 billion per year and the FDA-approved market approximates $625 million per year. Our phase 3 trials are intended to establish an indication of the safety and efficacy of our bioidentical drug candidates at specific dosage levels. We intend our hormone therapy drug candidates, if approved, to provide hormone therapies with well characterized safety and efficacy profiles that can be consistently manufactured to target specifications. This would provide an alternative to the non-FDA approved compounded bioidentical market. This is based on our belief that our drug candidates will offer advantages in terms of demonstrated safety and efficacy consistency in the hormone dose, lower patient cost as a Company Warrantresult of insurance coverage, and improved access as a result of availability from major retail pharmacy chains than custom order or formulation by individual compounders.
Pipeline of our Hormone Therapy Drug Candidates
TX 12-001HR
TX 12-001HR, our combination estradiol and progesterone drug candidate, is undergoing clinical trials for the purchasetreatment of 800,000 shares.moderate to severe vasomotor symptoms due to menopause, including hot flashes, night sweats, sleep disturbances, and vaginal dryness, for post-menopausal women with an intact uterus. The ten-year Company Warrant has an exercise pricehormone therapy drug candidate is chemically identical to the hormones that naturally occur in a woman’s body, namely estradiol and progesterone, and is being studied as a continuous-combined regimen, in which the combination of $0.38 per shareestrogen and vested immediately upon issuance. No shares underprogesterone are taken together in one product daily. If approved by the Company Warrant have been exercised. In connection withFDA, we believe this would represent the Company Warrant, Lang executedfirst time a Lock-Up Agreement.
TX 12-002HR
TX 12-002HR is a specialty pharmaceutical company organizednatural progesterone formulation for the treatment of secondary amenorrhea without the potentially allergenic component of peanut oil. The product would be chemically identical to the hormones that naturally occur in a woman’s body. We believe it will be similarly effective to traditional treatments, but may be effective at lower dosages. According to Source Healthcare Analytics, the total FDA-approved market for oral progestin was approximately $364 million in U.S. sales for the 12 months ended December 31, 2013.
TX 12-003HR
TX 12-003HR is a natural estradiol formulation. This hormone therapy drug candidate would be chemically identical to the hormones that naturally occur in a woman’s body. We currently do not have plans to further develop this hormone therapy drug candidate. According to Source Healthcare Analytics, the total FDA-approved market for oral estradiol was approximately $130 million in U.S. sales for the 12 months ended December 31, 2013.
TX-12-004HR
TX 12-004HR is a vaginal suppository estradiol drug candidate for the treatment of vulvar and vaginal atrophy, or VVA, in post-menopausal women with vaginal linings that do not receive enough estrogen. We believe that our drug candidate will be at least as effective as the traditional treatments for VVA because of an early onset of action with less systemic exposure inferring a limited liability companygreater probability of dose administration to the target tissue and it will have an added advantage of being a simple, easier to use dosage form versus traditional VVA treatments. According to Source Healthcare Analytics, the total FDA-approved market for VVA treatment was approximately $1 billion in U.S. sales for the State12 months ended December 31, 2013.
Preclinical Development
Based upon leveraging our hormone platform technology, we have seven preclinical projects that include development of Delaware on May 13, 2008. VitaMed is focused on providingour proposed combination estradiol and progesterone and progesterone-alone products in a topical cream and transdermal patch form. We plan to advance these projects into the next stages of development as financial and personnel resources become available. We are also evaluating various other indications for our hormone technology, including oral contraception, treatment of preterm birth, and premature ovarian failure. According to South Healthcare Analytics, the total FDA-approved menopause-related market for estrogen alone and in combination was approximately $3.3 billion in U.S. sales for the 12 months ended December 31, 2013.
Current Products
As we continue the clinical development of our hormone therapy drug candidates, we continue to market our prescription and over-the-counter dietary supplement and cosmetic product lines, consisting of prenatal vitamins, iron supplements, vitamin D supplements, natural menopause relief products, and cosmetic stretch mark creams under our vitaMedMD® brand name and duplicate formulations of our prescription prenatal vitamin products, also referred to as “generic” formulations, under our BocaGreenMD® Prena1™ name. All of our prenatal vitamins are gluten-, sugar-, and lactose-free. We believe our product attributes result in greater consumer acceptance and satisfaction than competitive products while offering the highest quality productsand patented ingredients.
Industry and Market
Health Care and Pharmaceutical Market
According to EvaluatePharma® World Preview report, the pharmaceutical industry experienced an unprecedented decline in worldwide prescription drug sales in 2012. Worldwide prescription drug sales fell by 1.6% to $714 billion in 2012, with the United States representing about 36% of the market. Loss of patent protection on a number of blockbuster brands and fiscal austerity affecting Eurozone countries (compounded by a weak euro compared to the dollar) contributed to this unprecedented contraction. In total, $38 billion of sales were lost as a result of expired patent protection, including drugs such as Lipitor and Plavix. According to the report, this anomaly is not expected to continue and sustained sales growth should start returning at the end of 2013 at an average rate of 3.8% per annum between 2012 and 2018.
In terms of numbers of new drug approvals in the United States, 2012 was the best year since 1997 when the Pfizer drug, Lipitor, was approved. But perhaps more important than the large number of approvals in 2012 (45 versus 35 in 2011), quality was also significantly better than in previous years, as judged by analysts’ consensus expectations of sales five-year post launch. Looking ahead, EvaluatePharma expects this positive dynamic to continue, with 2013 being another good year for new drug approvals.
Women’s Health Care Market
According GBI Research (a provider of industry-leading business intelligence solutions on a global basis) report “Women’s Health Therapeutic Market through 2018”, the women’s health therapeutics market is one of the most attractive markets in the global pharmaceutical industry. Hormone therapy, gynecological disorders, and musculoskeletal disorders in women are the prime areas of focus in the women’s health therapeutics market. The women’s health therapeutics market in the United States was valued at $12.5 billion in 2011. Revenues are projected to increase to $15.1 billion in 2018 at a compound and growth rate of 2.7%. This can be attributed to the launch of new drug molecules.
Hormone Therapy Market
Menopause is the spontaneous and permanent cessation of menstruation, which naturally occurs in most women between the ages of 40 and 58. It is defined as the final menstrual period and is confirmed when a woman has not had her period for 12 consecutive months. Hormone therapy is the only government-approved treatment in the United States and Canada for relief of menopausal symptoms. These symptoms are caused by the reduced levels of circulating estrogen as the ovarian production shuts down. The symptoms include hot flashes, night sweats, sleep disturbances, and vaginal dryness. According to Source Healthcare Analytics, prescriptions for hormone therapy products for the treatment of menopause symptoms or prevention of osteoporosis generated total sales of over $3.8 billion on over 36 million prescriptions for the 12 months ended December 31, 2013. Oral hormone therapy accounted for $1.8 billion on 23 million prescriptions over the same time period.
Prescriptions for menopausal hormone therapy in the United States dropped significantly following the Women’s Health Initiative, or WHI, study in 2002 that found that subjects using estrogen plus synthetic progestin had, among other things, a greater incidence of coronary heart disease, breast cancer, stroke, and pulmonary embolism. A number of additional studies regarding the benefits and risks of hormone therapy have been conducted over the last decade since the WHI results were first published. In general, recommendations for hormone therapy use are to be judged on an individual basis, and the FDA recommends that women with moderate to severe menopausal symptoms who want to try menopausal hormone therapy for relief use it for the shortest time needed and at the lowest effective dose.
There were approximately 41.7 million women in the United States between the ages of 45 and 64 in 2010, projected to increase slightly (2.8%) to 42.9 million in 2015 and to approximately 44.3 million in 2040, according to the 2010 National Census population figures. These women are the target market for hormone therapy to treat menopausal related symptoms.
Hormone Therapy Products
Estrogen (with or without a progestin) is the most effective treatment for menopause-related vasomotor symptoms according to the North American Menopause Society, or NAMS. Sales of total oral, transdermal and suppositories for Estrogen (with and without a progestin) hormone therapy products were approximately $3.3 billion for the 12 months ended December 31, 2013. That was up approximately 7% over the comparable time period from the prior year according to Source Healthcare Analytics. The three primary hormone therapy products are estrogen, progestin, and combination of estrogen and progestin, which are produced in a variety of forms, including oral tablets or capsules, skin patches, gels, emulsion, or vaginal suppositories and creams.
Estrogen-Only Therapies
Estrogen therapies are used for vasomotor symptoms (hot flashes and night sweats) of menopause that are a direct result of the decline in estrogen levels associated with ovarian shutdown at menopause. Estrogen therapy has been used to manage these symptoms for more than 50 years. Estrogen is a generic term for any substance, natural or synthetic, that exerts biological effects characteristic of estrogenic hormones, such as estradiol. Based upon the age demographic for all women receiving prescriptions for estrogen therapy and the average age range during which women experience vasomotor symptoms, we believe that estrogen is primarily used for the treatment of vasomotor symptoms, but also prescribed for the prevention of osteoporosis.
Estrogen-only therapy, or ET, is used primarily in women who have had a hysterectomy and are undergoing a surgical menopause, as those women do not require a progestin to protect the uterine endometrium from proliferation. Approximately 600,000 women undergo a hysterectomy each year in the United States according to the United States Centers for Disease Control and Prevention. Sales of ET were approximately $2.7 billion for the 12-month period ended December 31, 2013, according to Source Healthcare Analytics.
ET is also used for vulvar and vaginal atrophy, which has a variety of indications, including vaginal dryness, vaginal itching and irritation, painful intercourse, painful urination, and other symptoms. Sales of ET for vulvar and vaginal atrophy were approximately $1 billion for the 12-month period ended December 31, 2013, according to Source Healthcare Analytics.
Estrogen therapy is approved for the prevention of osteoporosis. Multiple studies conducted on various estrogen compositions, including studies published in the Journal of the American Medical Association in 2002, Osteoporosis International in 2000, The Lancet in 2002, Maturitas in 2008, and Climacteric in 2005, demonstrated efficacy based on increases in bone mineral density. Epidemiological and some fracture prevention studies, such as the study published in the New England Journal of Medicine in 1980, also have demonstrated a decrease in bone fractures as a result of estrogen therapy.
Progestin-Only Therapies
Progestins include the naturally occurring hormone progesterone and a number of synthetic progestin compounds that have progestational activity. These agents are used for a variety of indications and conditions, but most often, progestins are used either alone or in combination with an estrogen for hormonal contraception and to prevent endometrial hyperplasia from unopposed estrogen in hormone therapy. Progestins alone are also used to treat women with secondary amenorrhea in order to create withdrawal bleeding in these women who have not had regular menses. Progestins are also used to treat dysfunctional uterine bleeding and endometriosis. Progesterone has also been used to prevent threatened or recurrent pregnancy loss and for the prevention of preterm birth. Progestins have also been used in fertility treatments. Progestins have also been used as a palliative measure for metastatic endometrial carcinoma and in the treatment of renal and breast carcinoma.
Estrogen/Progestin Combination Products
Progestins are used in combination with estrogen in post-menopausal women with uteruses to avoid an increase in the incidence of endometrial hyperplasia. This is a condition caused by chronic use of estrogen alone by a woman with a uterus and is associated with an increased incidence of uterine, or endometrial, cancer. Studies have shown that, after one year, the incidence of endometrial hyperplasia is less than 1% in women taking estrogen/progestin combinations, in contrast to up to 20% in women taking estrogen alone. In accordance with FDA recommendations, doctors typically recommend that a menopausal or post-menopausal woman who has a uterus take estrogen plus a progestin, either as a combination drug or as two separate drugs. Source Healthcare Analytics estimates that sales of FDA-approved estrogen/progestin combinations were approximately $625 million in the United States for the 12-month period ended December31, 2013.
Limitations of Existing Estrogen/Progestin Therapies
The most commonly prescribed progestin is a synthetic progestin (medroxyprogesterone acetate), which can cause some women to experience painful vaginal bleeding, breast tenderness, and bloating and may reduce cardio-protective benefits potentially associated with estrogen therapy by limiting the estrogen’s ability to raise HDL cholesterol and LDL cholesterol.
A widely prescribed naturally occurring progesterone is known as Prometrium® (progesterone USP), sold by AbbVie Inc., a spinoff of Abbott Laboratories. Natural progesterone is used in combination with estrogen for hormone therapy; however, we believe there are currently no FDA-approved hormone therapy combination products with natural progesterone.
Prenatal Vitamin Market
According to the American Pregnancy Association, approximately six million women become pregnant each year, resulting in approximately four million births. Of these women, over 75% receive prenatal care during the first trimester, and most doctors encourage taking a prenatal vitamin as the recommended standard of care. Prenatal vitamins are dietary supplements intended to be taken before and during pregnancy and during postnatal lactation that provide nutrients recognized by the various health organizations as helpful for a healthy pregnancy outcome.
There are hundreds of prenatal vitamins available, with both prescription and OTC (non-prescription) choices. According to Source Healthcare Analytics, there were approximately 7.7 million prescriptions for prenatal vitamins sold for a total of approximately $314 million for the 12 months ended July 31, 2013, with sales between branded and generic products split nearly evenly. According to the 2012 Gallup Target Market Report on Prenatal Vitamins, supplement use has been fairly constant overall between 2008 and 2011. However, shifts have occurred in terms of types used, with the trend toward OTC prenatal vitamins and away from prescription prenatal vitamins. During this same period, the use of OTC products surpassed the use of prescription products, largely driven by increased use among women currently pregnant.
Our Business Model
We are a women’s health care product company focused on creating and commercializing products targeted exclusively for women, including products specifically for pregnancy, childbirth, nursing, pre-menopause, menopause, and post-menopause. We intend to use our current prescription and over-the-counter dietary supplement and cosmetic product lines, consisting of prenatal vitamins, iron supplements, vitamin D supplements, natural menopause relief products, and stretch mark creams, as the foundation of our business platform. If approved and commercialized, our hormone therapy drug candidates will allow us to enter the $3.8 billion hormone therapy market, based on 2013 total sales of the hormone therapy market, according to Source Healthcare Analytics.
Our current product line is marketed and sold by a direct national sales force that calls on health care providers in the OB/GYN market space, as well as through our website to consumers who have been referred to our website by physicians. We market our prescription prenatal vitamins, over-the-counter dietary supplements, and other products under our vitaMedMD brand name and duplicate formulations of our prescription prenatal vitamin products, also referred to as “generic” formulations, under our BocaGreenMD brand name. We believe that our vitaMedMD brand name has become a recognized name for high quality women’s health care, while our BocaGreenMD products provide physicians, women, and pharmacies is enhanced bypayors with a lower cost alternative for prenatal supplements. We intend to leverage our patent-pending technologyexisting relationships and business methodology. This combination allowsdistribution system to introduce our hormone therapy drug candidates, if approved, which will enable us to provide a comprehensive line of women’s health care products all under one brand.
Our sales model focuses on the “4Ps”: patient, provider, pharmacist, and payor. We market bothand sell our current dietary supplement and cosmetic products primarily through a direct national sales force of approximately 30 full-time professionals that calls on health care providers in the OB/GYN market space as well as through our website directly to consumers. In addition, our products allow health care providers to offer an alternative to patients to meet their individual nutritional and financial requirements related to co-payment and cost-of-care considerations and help patients realize cost savings over competing products. We also believe that our combination of branded, generic, and over-the-counter (“OTC”)lines offers physicians, women, and payors cost-effective alternatives for top-quality care. We supply our prescription nutritional supplements, drugs, medical foodsdietary supplement products to consumers through retail pharmacies. We market our over-the-counter products either directly to consumers via our website and other medicalphone sales followed by direct shipment to their homes or offices or through physicians who then re-sell them to their patients. Our fully staffed customer care center uses current customer relationship management software to respond to health care providers, pharmacies, and consumers via incoming and outgoing telephone calls, e-mails, and live-chat. We also facilitate repeat customer orders for our non-prescription products through pharmacies and our web-site with the recommendation of physicians by creating a unique value propositions for patients, physician/providers and insurance payors.
As health market. As we continue our product development efforts for both new products and refinements to existing products, we are also seeking proprietary ingredients and formulations that can be exclusively licensed or patented for use in women’s healthcare that will further differentiate our products from the competition.
Our Growth Strategy
Our goal is to become the women’s health care company recommended by health care providers to all patients by becoming the new standard in women’s health with a complete line of products, all under one quality brand. Key elements of our strategy to achieve this goal are as follows:
Exclusive Focus on Women’s Health Issues. We plan to focus exclusively on women’s health issues to enable us to build long-term relationships with women as they move through their life cycles of birth control, pregnancy, child birth, and pre- and post- menopause.
Focus on Hormone Therapy Products. We plan to focus on the development, clinical trials, and commercialization of hormone therapy products designed to (1) alleviate the systems of and reduce the health effects resulting from menopause-related hormone deficiencies, including hot flashes, osteoporosis, and vaginal dryness, and (2) demonstrate equivalent clinical efficacy at lower doses, enabling an enhanced side effect profile compared with competing products.
Penetrate Bioidentical Market with FDA-approved Products. As we are not aware of any current FDA-approved bioidentical hormone therapy combination products, we believe that our hormone therapy drug candidate for combined estradiol and progesterone, if approved by the FDA, will provide a safer and more effective alternative to non-FDA approved compounded bioidentical hormone therapy products, at a lower price to patients due to insurance coverage.
Marketing Emphasis. We plan to maintain an emphasis on large group OB/GYN practices that provide opportunities to reach large patient physicianbases and payor.
Multiple Distribution Channels. We are pursuing multiple distribution channels, including physicians and pharmacies, through our sales force and our website. Geographical Expansion. We plan to expand our geographic market and sales team to cover the entire country by increasing our current 36 sales territories to 60 sales territories in the next 18 months. Introducing New Products. We plan to introduce a new prescription prenatal vitamin product under our branded vitaMedMD name and our generic Prena1 name in the first quarter of 2014, as well as the development of our hormone therapy drug candidates consisting of a (1) bioidentical oral combination of progesterone and estradiol product, (2) an oral progesterone product, and (3) a suppository vulvar and vaginal atrophy estradiol product. Early pharmacokinetic, or PK, studies of our combination estradiol and progesterone drug candidate demonstrate that the product is bioequivalent to the reference listed drug (based on the criterion that the 90% confidence interval on the test-to-reference ratio is contained entirely within the interval 0.800 to 1.250). Our Current Product Lines We offer a wide range of products targeted for women’s health specifically associated with pregnancy, child birth, nursing, post-child birth, and menopause, including prescription and over-the-counter prenatal vitamins, iron supplements, vitamin D supplements, natural menopause relief products, and stretch mark creams under our vitaMedMD brand name and duplicate formulations of our prescription prenatal vitamin products, referred to as “generic” formulations, under our BocaGreenMD Prena1 name. In March 2012, we launched our first prescription-only prenatal vitamin, vitaMedMD Plus Rx, with subsequent launches of our second prescription-only prenatal vitamin, vitaMedMD One Rx, in April 2012 and our third prescription-only prenatal vitamin, vitaMedMDRediChew™, Rx in May 2012. In the fourth quarter 2012, our BocaGreenMD Prena1 line brand was launched and our first products include three prescription products Prena1 Plus, Prena1, and Prena1 Chew, which are duplicate, or “generic” formulations, of our vitaMedMD-branded prescription prenatals. In the first quarter of 2014, we will introduce vitaPearl, a prescription prenatal vitamin. This “complete prenatal in one tiny pearl” features a unique, proprietary combination of FOLMAX™, FePlus™, and pur-DHA™. Our product line is detailed below. vitaMedMD Plus (Prenatal Women’s Multivitamin + DHA™) vitaMedMD Plus Prenatal is a once-daily, two pill combo pack that contains a complete multivitamin with 16 essential vitamins and minerals and 300 mg of plant based DHA, and is Vegan and Kosher certified. Based on recent medical and scientific research, we have optimized many of the nutrients found invitaMedMD Plus. All minerals, including iron, zinc, and copper, are chelated to improve absorption. vitaMedMD One Prenatal Multivitamin vitaMedMD One is a single-dose daily multivitamin that provides 14 vitamins and minerals and 200 mg of vegetarian, plant-based DHA. Each convenient, easy-to-swallow softgel also features 975 mcg of folic acid. vitaMedMD Plus Rx Prenatal Multivitamin vitaMedMD Plus Rx is a once-daily, two pill combo prescription-only product containing one prenatal vitamin tablet with Quatrefolic®, the fourth generation folate, and one plant-based DHA 300 mg capsule. Quatrefolic® is a registered trademark of Gnosis S.P.A. All minerals, including iron, zinc, and copper, are chelated to improve absorption. vitaMedMD One Rx Prenatal Multivitamin vitaMedMDOne Rx is a prescription-only product with a single-dose daily multivitamin that provides 14 vitamins and minerals, Quatrefolic®, and 200 mg of plant-based DHA. vitaMedMD RediChew™ Rx Prenatal Multivitamin vitaMedMDRediChew™Rx is a prescription-only, easy-to-chew, small, vanilla-flavored chewable tablet containing Quatrefolic, vitamin D3 to promote healthy birth weight, vitamin B2 to support bone, muscle, and nerve development, and vitamin B6 and vitamin B12 to help relieve nausea and morning sickness. We believevitaMedMD RediChew Rx is an excellent option for women who have difficulty swallowing tablets or softgels, or are experiencing nausea and morning sickness. vitaMedMD Iron 21/7 vitaMedMD Iron 21/7 is an iron replacement supplement with a 3-weeks-on/1-week-off dosing schedule intended to maximize absorption and enhance tolerability. It is formulated with 150 mg of chelated iron to help improve tolerability and limit typical side effects associated with iron replacements. Each easy-to-swallow single tablet serving also includes 800 mcg of folic acid, plus vitamins C and B12, and succinic acid to aid in absorption. vitaMedMD Menopause Relief with Lifenol® Plus Bone Support vitaMedMD Menopause Relief with Lifenol® Plus Bone Support offers a natural treatment for hot flashes, night sweats, and mood disturbances. Each single tablet dosage delivers 120 mg of Lifenol®, a well-studied female hops extract recognized for its potency and support in alleviating hot flashes, plus plant phytoestrogens. It also includes calcium and vitamin D3 for added bone support. vitaMedMD Vitamin D3 50,000 IU and Vitamin D3 2,000 IU vitaMedMD Vitamin D3 50,000 IU and Vitamin D3 2,000 IU are dietary supplements provided in a small, easy-to-swallow gel capsule that help replenish and maintain beneficial levels of vitamin D in the body. Sustaining adequate levels of vitamin D in the body is essential to bone health, enhancing the absorption of calcium and phosphorus. Vitamin D3, also known as cholecalciferol, is considered the most preferred form of vitamin D as it is the most active form of the nutrient. We believevitaMedMDVitamin D3 50,000 IU and Vitamin D3 2,000 IU are ideal for pregnant, breastfeeding, and menopausal women to sustain adequate levels of vitamin D. vitaMedMD Signature Collection Stretch Mark Body Cream vitaMedMD Signature Collection Stretch Mark Body Cream contains naturally derived ingredients, including peptides, shea butter, sweet almond oil, and fruit extracts. This combination of ingredients hydrates, soothes, and pampers skin to make it softer, smoother, and younger-looking. It helps reduce the appearance of stretch marks, scars, and other skin irregularities by hydrating and replenishing the skin’s moisture, diminishing the look of fine lines and wrinkles, and encouraging the fading of age spots and sun spots.vitaMedMD Stretch Mark Body Cream is hypoallergenic, paraben-free, and non-comedogenic. BocaGreenMD Prena1 Plus BocaGreenMD Prena1 Plus is a prescription-only, comprehensive single-dose dietary supplement containing one prenatal tablet with 16 vitamins and minerals, plus one softgel with 300 mg of plant-based life’s DHA. BocaGreenMD Prena1 BocaGreenMD Prena1 is a prescription-only, convenient single-dose softgel with 14 vitamins, minerals and 200 mg of plant-based DHA. BocaGreenMD Prena1 Chew BocaGreenMD Prena1 Chew is a prescription-only, single daily easy-to-chew, vanilla-flavored, chewable tablet well-suited for women planning a pregnancy and those with difficulty swallowing tablets or capsules or when nausea or morning sickness make taking tablets or capsules difficult. AllBocaGreenMD Prena1 multivitamins contain a combination of folic acid and Quatrefolic and are available by prescription only. Our Hormone Therapy Drug Candidates We have obtained FDA approval of our IND applications to conduct clinical trials for four of our proposed products: TX 12-001HR, our oral combination of progesterone and estradiol; TX 12-002HR, our oral progesterone alone; TX 12-003HR, our oral estradiol alone; and TX 12-004HR, our estradiol alone vaginal suppository. TX 12-001HR TX 12-001HR, our combination estradiol and progesterone drug candidate, is undergoing clinical trials for the treatment of moderate to severe vasomotor symptoms due to menopause, including hot flashes, night sweats, sleep disturbances, and vaginal dryness, for post-menopausal women with an intact uterus. The drug candidate is chemically identical to the hormones that naturally occur in a woman’s body, namely estradiol and progesterone, and is being studied as a continuous-combined regimen (where the combination of estrogen and progesterone are taken together in one product daily). If approved by the FDA, we believe this would represent the first time a combination product of estradiol and progesterone, the biologically identical or bioidentical to the estradiol and progesterone produced by the ovaries, would be approved for use in a single combined product. According to Source Healthcare Analytics, the total FDA-approved market for menopause-related combination estrogen/progestin was approximately $625 million in U.S. sales for the 12 months ended December 31, 2013. We conducted a PK study of Therapeutics’TX 12-001HR to demonstrate that our drug candidate is bioequivalent to the reference listed drug based on the criterion that the 90% confidence interval on the test-to-reference ratio is contained entirely within the interval 80% to 125%. The study compared our combined capsule TX 12-001HR of 2 mg estradiol and 200 mg of progesterone to 2 mg of Estrace® and 200 mg of Prometrium®. The study compared the mean plasma concentrations for free estradiol between TX 12-001HR and Estrace® in 62 female test subjects. When the results of a single dose-fed study were compared over 48 hours by the test drug versus reference drug, the ratio was 0.93 with the standard deviation within the subject being 0.409 for an upper 95% confidence bound of -0.089. The maximum plasma concentration levels of free estradiol showed drug versus reference drug ratio was 0.88 with the standard deviation within the subject being 0.344 for an upper 95% confidence bound of -0.040 over 48 hours. The study also compared the mean plasma concentrations for progesterone between TX 12-001HR and Prometrium® in 62 female test subjects. When the results were compared over 48 hours of the test drug verses reference drug, the ratio was 1.05 with the standard deviation within the subject being 0.956 for an upper 95% confidence bound of -0.542. The maximum plasma concentration levels of progesterone showed drug versus reference drug ratio as 1.16 with the standard deviation within the subject being 1.179 for an upper 95% confidence bound of -0.785 over 48 hours. We believe these data are sufficient to demonstrate the bioequivalence of TX 12-001HR to Estrace® and Prometrium® based on the criteria for demonstrating bioequivalence established in connection with the study. On September 5, 2013, we began enrollment of patients in the REPLENISH Trial, a phase 3 clinical trial designed to measure the safety and effectiveness in treating the symptoms of menopause and protecting the endometrium. TX 12-002HR TX 12-002HR is a natural progesterone formulation without the potentially allergenic component of peanut oil. The product would be chemically identical to the hormones that naturally occur in a woman’s body. We believe it will be similarly effective to traditional treatments, but may demonstrate efficacy at lower dosages. In January 2014, we began recruitment of patients in the SPRY Trial, a phase 3 clinical trial designed to measure the safety and effectiveness in treating secondary amenorrhea. According to Source Healthcare Analytics, the total FDA-approved market for oral progestin was approximately $364 million in U.S. sales for the 12 months ended December 31, 2013. TX 12-003HR TX 12-003HR is a natural estradiol formulation. This hormone therapy drug candidate would be chemically identical to the hormones that naturally occur in a woman’s body. We currently do not have plans to further develop this hormone therapy drug candidate. According to Source Healthcare Analytics, the total FDA-approved market for oral estradiol was approximately $130 million in U.S. sales for the 12 months ended December 31, 2013. TX 12-004HR TX 12-004HR is a vaginal suppository estradiol drug candidate for the treatment of vulvar and vaginal atrophy, or VVA, in post-menopausal women with vaginal linings that do not receive enough estrogen. We believe that our drug candidate will be as effective as the traditional treatments for VVA and that it will have an added advantage of being a simple, easier to use dosage form versus traditional VVA treatments. In August 2013, we initiated a phase 1 clinical trial for VVA, designed to measure the effect of TX 12-004HR on certain clinical endpoints, including a study candidate’s pH levels, vaginal cytology, and most bothersome symptom of VVA, out of the symptoms identified in FDA guidance. Based upon our phase 1 results, we believe we have a rapidly acting product that differs substantially from the reference listed drug Vagifem® sold by Novo Nordisk. According to Source Healthcare Analytics, the total FDA-approved market for VVA treatment was approximately $1 billion in U.S. sales for the 12 months ended December 31, 2013. Preclinical Development Based upon leveraging our hormone platform technology, we have seven preclinical projects that include development of our proposed combination estradiol and progesterone and progesterone-alone products in a topical cream and transdermal patch form. We plan to advance these projects into the next stages of development as financial and personnel resources become available. We are also evaluating various other indications for our hormone technology, including oral contraception, treatment of preterm birth, and premature ovarian failure. According to South Healthcare Analytics, the total FDA-approved menopause-related market for estrogen alone and in combination was approximately $3.3 billion in U.S. sales for the 12 months ended December 31, 2013. Sales and Marketing Although our direct | ||
Our national rollout strategy ishas been to focus first on the largest metropolitan areas in the United States. In order to accelerate the sales ramp in a new territory, we employ a national sales/large practice sales effort to identify key practices in new or expanding markets. Concurrent with our provider sales effort, we work with both commercial insurance and Medicaid insurance payors for partnerships in which the payor can support the prescribing and/or recommendation of our products for the benefit of patient, physician, and payor with an end result of providing better outcomes for all three constituents.
At the forefront of our sales approach is the philosophy that the physician should recommend or prescribe products based only on what is best for theirthe patient. In general, a better outcome is achieved by providing patients with the best products and care at the best value. HavingWe believe having an assortment of high qualityhigh-quality product options that can be recommended or prescribed by both the physician and payor is the foundation of providing valuable options to the patient.
We believe our sales force has developed strong relationships and partnerships in the OB/GYN market to sell our current products. We have also established relationships with some of the largest OB/GYN practices their respective markets. By delivering additional products through the same sales channel, we believe we can leverage our already deployed assets to increase our sales and achieve profitability. We intend to leverage and grow our current marketing and sales organization to commercialize our drug candidates in the United States assuming the successful completion of the FDA regulatory process.
Online Commerce
A vast majority of our over-the-counter product sales are completed online. The Internet has continued to increase its influence over communication, content, and commerce. We believe several factors will contribute to this continuing increase, including convenience, expanded range of available products targeted for women’s health and associated with pregnancy, child birth, nursing, post birthservices, improved security and menopause. Our OTC product line available through our website includes prenatal vitamins, DHA, iron supplements, calcium supplements, Vitamin D supplements, women’s multivitamins, natural (non-hormonal) menopause relief,electronic payment technology, increased access to broadband Internet connections and scar reduction creams. In March 2012, we launched our first prescription-only prenatal vitamin, vitaMedMD™ Plus Rx,widespread consumer confidence and plan to launch our second prescription-only prenatal vitamin, vitaMedMD™ One Rx, in April 2012. Our product line is detailed below.
Retail Commerce
The vast majority of our prescription product sales are completed through the traditional pharmacy distribution network. Although online and nutrients foundmail order pharmacy commerce continues to grow, the majority of products are still purchased directly by the consumer locally at traditional stores. As this division of our business expands, we will continue to employ strategies that help us reduce inefficiencies in this channel and develop relationships that allow our products to be differentiated from the competition.
Competition
The pharmaceutical industry is subject to intense competition and is characterized by extensive research efforts and rapid technological change. Competition in our latest version. All minerals,industry occurs in a variety of areas, including Iron, Zinc, Selenium, Copper, Manganesedeveloping and Molybdenum are chelatedbringing new products to market before others, developing new technologies to improve absorptionexisting products, developing new products to provide the same benefits as existing products at lower cost, and tolerability. developing new products to provide benefits superior to those of existing products. There are many companies, including generic manufacturers, drug compounding pharmacies, and large pharmaceutical companies, that have significantly greater financial and other resources than we do. In addition, academic and other research institutions could be engaged in research and development efforts for the indications targeted by our products.
Seasonality
The citrus-flavored tabletspecialty pharmaceutical industry is small and easynot subject to swallow. The fact that the DHA is plant based (most DHA comes from fish-based sources) is important to many pregnant women due to concerns over contamination and taste of fish-based DHA.
Products in Development
We introduced our branded prescription only)
Raw Materials for Our Products
We acquire all raw materials and ingredients for our proprietary products are purchased from a group of third-party suppliers specializing in raw material manufacturing, processing, and specialty distribution. Our manufacturers maintainprimary manufacturer maintains multiple supply and purchasing relationships throughout the raw materials marketplace to provide an uninterrupted supply of product to meet our manufacturing requirements.
Availability of and Dependence Upon Suppliers
We currently obtain over 90%approximately 98% of our vitaMedMD products from Lang; therefore,Lang Pharma Nutrition, or Lang, a full-service, private label and corporate brand manufacturer specializing in premium health benefit driven products, including medical foods, nutritional supplements, beverages, bars, and functional foods in the dietary supplement category. As a result, we are dependent upon themon Lang for the manufacture of most of our products. We believe the terms of our agreements with Lang are competitive with other suppliers and manufacturers. Although we anticipate continuing our relationship with Lang, we believe that we could obtain similar terms with other suppliers to provide the same services. We have experienced no difficulties in obtaining the products we need in the amounts we require and do not anticipate those issues in the future.
Manufacturing of Our Products
Our vitamin products are manufactured and regulated by the same FDA quality standards (Controls Usedin accordance with FDA’s current Good Manufacturing Practice, or cGMPs, for Manufacturing, Processing, Packing, or Holding Dietary Supplements for FDA 21 CFR Part 110/111 CGMP Regulations (“CFR 111”)) and current good manufacturing practices (“cGMP”) as prescription nutritional therapies.dietary supplements. In addition, we conduct two additional un-required certificates of analysis on every lot to ensure quality and we employ an outside third party to enforce rigorous quality audits.
All of our manufacturing is performed by third partythird-party manufacturers. Over 90%In addition to manufacturing substantially all of our manufacturing is handled byproducts, Lang a full-service, private label and corporate brand manufacturer specializing in premium health benefit driven™ products, including medical foods, nutritional supplements, beverages, bars, and functional foods in the dietary supplement category. Langalso provides a variety of additional services to us, including development processes, prototype development, raw materials sourcing, regulatory review, and packaging production. At present, we believe our relationship with Lang is excellent, and we intend to continue to use themLang as our third partythird-party manufacturer for most of our products. In the event our relationship with Lang terminates for any reason, there are a number of other manufacturers available to us; accordingly, management is of the opinionus. Accordingly, we do not believe that such termination would not have a material adverse effect on our business.
We use third-party manufacturers to source key raw materials and manufacture and package our products. The FDA must approve the manufacturing facility for compliance with the FDA’s cGMP regulations before a New Drug Application, or NDA, for a new drug is approved. Accordingly, we intend to engage only those third-party contract manufacturers that have consistently shown the ability to satisfy these requirements for our hormone therapy drug candidates.
Quality Control for Our Products
A quality assurance team establishes process controls and documents and tests every stage of the manufacturing process to ensure we meet product specifications and that our finished dietary supplements contain the correct ingredients, purity, strength, and composition in compliance with FDA regulations. We test incoming raw materials and finished goods to ensure they meet or exceed FDA and U.S. Pharmacopeia standards, including quantitative and qualitative assay and microbial and heavy metal contamination.
Our manufacturers’ quality and production standards are designed to meet or exceed the latestcurrent FDA regulations. To ensure the highest quality, our manufacturing operations are audited by AIB International, Inc. (“AIB”), or AIB, among others, for independent cGMP certification. AIB is an independent, not-for-profit organization that offers programs and services to augment and support the work of regulatory officials around the country, including standards development, product testing and certification, and onsite audits and inspections. The manufacturing facilities we primarily use are also ISO 9001 certified, which is a family of standards related to quality management systems and are designed to help organizations ensure they meet the needs of customers. In addition, our manufacturers are hazard analysis critical control point (“HACCP”) certified which is a systematic preventive approach for food and pharmaceutical safety that addresses physical, chemical and biological hazards as a means of prevention rather than finished product inspection.
Distribution of our Products
We use a variety of distribution channels dependent upon product type. OTCWe sell our prescription dietary supplement products are sold directly to consumer via the Internet and phone sales and the products are shipped directly from the Company to the consumer’s home. In a few instances, the Company sells product to physicians who then sell the product directly to their patients. Our prescription products are sold to the patient directlypatients through their pharmacy.pharmacies. Since the launch of our prescription products, in addition to third-party logistics providers, we use some of the same majornational and regional distributors as other pharmaceutical companies, including Cardinal, McKesson, AmerisourceBergen, H.D. Smith, and AmerisourceBergen.
Customer Service
Our goal is 100% customer satisfaction by consistently delivering superior customer experiences;experiences before, during, and after the sale. To achieve this goal, we maintain a fully staffed customer care center for both inbound and outboundthat uses current customer service using the most current technologiesrelationship management software to respond to customershealth care providers, pharmacies, and consumers and accept orders for non-prescription products via incoming and outgoing telephone calls, e-mails, and live-chat. We believe our customer service initiatives allow us to establish and maintain long-term customer relationships and facilitate repeat visits and purchases.
Our representatives receive regular training so that they can effectively and efficiently field questions from current and prospective customers and are also trained not to answer questions that should be directed to a customer’s physician. Having a quality customer care center allows our representatives to provide an array of valuable data in the areas of sales, market research, quality assurance, lead generation, and customer retention.
Our Return Policy
We sell our prescription products through third-party logistics providers, major distributors, and pharmacies, all of whom may return a product within six months prior to or after the expiration date of the product. Once customers buy a product from the pharmacy, the product may not be returned. Non-prescription customers may return or exchange our OTC products for any reason by returning the product within thirty (30)30 days of receipt. We will refund the entire purchase price, less shipping. The customer is responsible for the cost of returning the products to us, except in cases wherein which the product is being returned because of a defect or an error made in our order fulfillment. If the purchased product exceeded a thirty-day30-day supply, the unused product must be returned to receive the full refund. All unopened OTC products may be exchanged for different products; the customer will be responsible for the difference in price if the replacement product is more expensive or we will refund the difference if the replacement product is less expensive.
Our Quality Guarantee
We proudly stand behind the quality of our products. OurWe believe our guarantee makes it easy, convenient, and safe for customers to purchase our products. Under our quality guarantee, we:we
help health care providers and payors by delivering information on patient compliance and satisfaction;
ensure a safe, secure online shopping experience through our encrypted website.
We value frequent communication with and feedback from our customers in order to continue to improve our offerings and services.
Research and Development
Our product development programs are concentrated in the area of advanced hormone therapy pharmaceutical products. We engage in programs to provide alternatives to the non-FDA approved compounded bioidentical market for hormone therapy. Our programs seek to bring new products to market in unique delivery systems or formats that enhance the effectiveness, safety, and reliability of existing hormone therapy alternatives.
We intend our hormone therapy drug candidates, if approved, to provide an alternative to the non-FDA approved compounded bioidentical market based on our belief that our drug candidates will offer advantages in terms of proven safety, efficacy, and stability, lower patient cost as a result of insurance coverage, and improved access as a result of availability from major retail pharmacy chains rather than custom order or formulation by individual compounders.
Our research and development expenses were $13.6 million in 2013, $4.5 million in 2012, and $0.1 million in 2011.
Intellectual Property
Our success depends, in part, on our ability to obtain patents, maintain trade secret protection, and operate without infringing the proprietary rights of others. Our intellectual property portfolio is one of the means by which we attempt to protect our competitive position. We rely primarily on a combination of know-how, trade secrets, patents, trademarks, and contractual restrictions to protect our products and to maintain our competitive position. We are constantlydiligently seeking ways to protect our intellectual property through registrationsvarious legal mechanisms in relevant jurisdictions.
We have filed several patents pendingprovisional patent applications with the U.S. Patent and Trademark Office, (the “USPTO”).or the USPTO, with respect to our hormone therapy drug candidates. We intend to file additional patent applications when appropriate; however, we may not file any such applications or, if filed, the patents may not be issued. We hold numerousmultiple U.S. trademark registrations and have numerous pending trademark applications. Issuance of a federally registered trademark creates a rebuttable presumption of ownership of the mark; however, it is subject to challenge by others claiming first use in the mark in some or all of the areas in which it is used. Federally registered trademarks have a perpetual life as long as they are maintained and renewed on a timely basis and used properly as trademarks, subject to the rights of third parties to seek cancellation of the trademarks if they claim priority or confusion of usage. We believe our patents and trademarks are valuable and provide us certain benefits in marketing our products. We intend to actively protect our intellectual property with patents, trademarks, trade secrets, andor other legal avenues for the protection of intellectual property.
We intend to aggressively prosecute, enforce, and defend our patents, trademarks, and proprietary technology. The loss, by expiration or otherwise, of any one patent may have a material effect on our business. Defense and enforcement of our intellectual property rights can be expensive and time consuming, even if the outcome is favorable to us. It is possible that the patents issued or licensed to us will be successfully challenged, that a court may find that we are infringing on validly issued patents of third parties, or that we may have to alter or discontinue the development of our products or pay licensing fees to take into account patent rights of third parties.
OPERA™ is our patent-pendingpatented information technology platform used in our business. TheWe believe the deployment of OPERAOPERA™ and the further development and deployment of related technology creates a sustainable competitive advantage that has led to our market share growth.in clinical development and product improvement. We are currently developing additional intellectual propertyactively filing new patent application, when appropriate, that reflects incremental developments in the following areas:
As we continue to develop proprietary intellectual property, we will expand our protection by applying for additional patents around the business process for OPERA and patents on future technologies, including developing mobile applications to more effectively communicate with patients.technologies. As we examine our current product offerings and new product pipeline, we are in the process of modifying and developing new formulations that will enable us to gain patent protection for these products.
While we seek broad coverage under our patent applications, there is always a risk that an alteration to the process may provide sufficient basis for a competitor to avoid infringement claims. In addition, patents expire and we cannot provide any assurance that any patents will be issued from our pending application or that any potentially issued patents will adequately protect our intellectual property.
Government Regulation
In the United States, the FDA regulates pharmaceuticals, dietary supplements, and cosmetics under the Federal Food, Drug, and Cosmetic Act, or FDCA, and its influence over communication, content and commerce. According to Forrester Research, an independent research company providing advice to global leaders in business and technology, U.S. online retail sales increased 12.2% from 2010. Forrester projects online retail sales to grow at a 10% CAGR to $278.9 billion by 2015. We believe several factors will contribute to this increase including convenience, expanded range of available products and services, improved security and electronic payment technology, increased access to broadband Internet connections and widespread consumer confidence and acceptance of the Internet as a means of commerce.
Pharmaceutical Regulation
The process required by the FDA before a new drug product may be marketed in the United States generally involves the following:
An IND is a request for authorization from the FDA to administer an investigational drug product to humans. We currently have effective INDs for all of our business.
Clinical trials involve the administration of the investigational drug to human subjects under the supervision of qualified investigators in accordance with current Good Clinical Practices, or cGCPs, which include the requirement that all research subjects provide their informed consent for their participation in any clinical trial. A protocol for each clinical trial and any subsequent protocol amendments must be submitted to the FDA as part of the IND. Additionally, approval must also be obtained from each clinical trial site’s Institutional Review Board, or IRB, before the trials may be initiated, and the IRB must monitor the study until completed. There are also requirements governing the reporting of ongoing clinical trials and clinical trial results to public registries.
Clinical trials are usually conducted in three phases. Phase 1 clinical trials are normally conducted in small groups of healthy volunteers to assess safety and find the potential dosing range. After a safe dose has been established, the drug is currently great uncertaintyadministered to small populations of sick patients (Phase 2) to look for initial signs of efficacy in many statestreating the targeted disease or condition and to continue to assess safety. Phase 3 clinical trials are usually multi-center, double-blind controlled trials in hundreds or even thousands of subjects at various sites to assess as fully as possible both the safety and effectiveness of the drug.
The FDA, the IRB, or the clinical trial sponsor may suspend or terminate a clinical trial at any time on various grounds, including a finding that the research subjects are being exposed to an unacceptable health risk. Additionally, some clinical trials are overseen by an independent group of qualified experts organized by the clinical trial sponsor, known as a data safety monitoring board or committee, or DSMB. This group reviews unblended data from clinical trials and provides authorization for whether or how existing laws governing issuesnot a trial may move forward at designated check points based on access to certain data from the study. We may also suspend or terminate a clinical trial based on evolving business objectives and/or competitive climate.
Assuming successful completion of all required testing in accordance with all applicable regulatory requirements, detailed investigational drug product information is submitted to the FDA in the form of an NDA requesting approval to market the product for one or more indications. The application includes all relevant data available from pertinent preclinical and clinical trials, including negative or ambiguous results as well as positive findings, together with detailed information relating to the product’s chemistry, manufacturing, controls and proposed labeling, among other things.
Once the NDA submission has been accepted for filing, the FDA’s goal is to review applications within 10 months of filing. However, the review process is often significantly extended by FDA requests for additional information or clarification. The FDA may refer the application to an advisory committee for review, evaluation, and recommendation as to whether the application should be approved. The FDA is not bound by the recommendation of an advisory committee, but it typically follows such recommendations.
After the FDA evaluates the NDA and conducts inspections of manufacturing facilities in which the drug product will be formulated and its active pharmaceutical ingredient, or API, will be produced, it may issue an approval letter or, instead, a Complete Response Letter. An approval letter authorizes commercial marketing of the drug with specific prescribing information for specific indications. A Complete Response Letter indicates that the review cycle of the application is complete and the application is not ready for approval. A Complete Response Letter may require additional clinical data and/or an additional pivotal Phase 3 clinical trial(s), and/or other significant, expensive and time-consuming requirements related to clinical trials, preclinical studies or manufacturing. Even if such additional information is submitted, the FDA may ultimately decide that the NDA does not satisfy the criteria for approval. The FDA could also approve the NDA with a REMS plan to mitigate risks, which could include medication guides, physician communication plans, or elements to assure safe use, such as property ownership, salesrestricted distribution methods, patient registries and other taxes,risk minimization tools. The FDA also may condition approval on, among other things, changes to proposed labeling, development of adequate controls and libelspecifications, or a commitment to conduct one or more post-market studies or clinical trials. Such post-market testing may include Phase 4 clinical trials and personal privacy applysurveillance to further assess and monitor the Internetproduct’s safety and commercial online retailers. These issues may take yearseffectiveness after commercialization.
After regulatory approval of a drug product is obtained, we are required to resolve. For example, tax authorities incomply with a number of post-approval requirements. As a holder of an approved NDA, we would be required to report, among other things, certain adverse reactions and production problems to the FDA, to provide updated safety and efficacy information, and to comply with requirements concerning advertising and promotional labeling for any of our products. Also, quality control and manufacturing procedures must continue to conform to cGMP after approval to ensure and preserve the long-term stability of the drug product. The FDA periodically inspects manufacturing facilities to assess compliance with cGMP, which imposes extensive procedural, substantive, and record keeping requirements. In addition, changes to the manufacturing process are strictly regulated, and, depending on the significance of the change, may require prior FDA approval before being implemented. FDA regulations also require investigation and correction of any deviations from cGMP and impose reporting and documentation requirements upon us and any third-party manufacturers that we may decide to use. Accordingly, manufacturers must continue to expend time, money and effort in the area of production and quality control to maintain compliance with cGMP and other aspects of regulatory compliance.
We rely, and expect to continue to rely, on third parties for the production of clinical and commercial quantities of our drug candidates. Future FDA and state inspections may identify compliance issues at our facilities or at the facilities of our contract manufacturers that may disrupt production or distribution, or require substantial resources to correct. In addition, discovery of previously unknown problems with a product or the failure to comply with applicable requirements may result in restrictions on a product, manufacturer, or holder of an approved NDA, including withdrawal or recall of the product from the market or other voluntary, FDA-initiated or judicial action that could delay or prohibit further marketing. Newly discovered or developed safety or effectiveness data may require changes to a product’s approved labeling, including the addition of new warnings and contraindications, and also may require the implementation of other risk management measures. Also, new government requirements, including those resulting from new legislation, may be established, or the FDA’s policies may change, which could delay or prevent regulatory approval of our products under development.
Our hormone therapy drug candidates may compete with unapproved hormone therapy products supplied by compounding pharmacies. Pharmacy compounding is a practice in which a licensed pharmacist combines, mixes, or alters ingredients in response to a prescription to create a medication tailored to the medical needs of an individual patient. The medications created by the compounding pharmacy are technically “new drugs” subject to the new drug approval requirements of the FDCA. However, FDA’s 2002 Compliance Policy Guide 460.200 states that FDA will exercise enforcement discretion to exclude compounded drugs from the new drug approval requirements except where compounding pharmacies act more akin to traditional drug manufacturers. FDA does not exercise the same authority to regulate compounding pharmacies as pharmaceutical manufacturers. For example, compounding pharmacies are not required to report adverse events associated with compounded drugs, while commercial drug manufacturers are subject to stringent regulatory reporting requirements.
505(b)(2) Applications
We intend to submit NDAs for our hormone therapy drug candidates, assuming that the clinical data justify submission, under section 505(b)(2) of the FDCA. Section 505(b)(2) permits the filing of an NDA when at least some of the information required for approval comes from studies not conducted by or for the applicant and for which the applicant has not obtained a right of reference. The applicant may rely upon published literature and the FDA’s findings of safety and effectiveness based on certain pre-clinical or clinical studies conducted for an approved product. The FDA may also require companies to perform additional studies or measurements to support the change from the approved product. The FDA may then approve the new drug candidate for all or some of the label indications for which the referenced product has been approved, as well as a Congressional advisory commission,for any new indication sought by the Section 505(b)(2) applicant. In regards to TX 12-001HR, we are currently reviewing the appropriate tax treatmentrequired to conduct phase 3 studies for vasomotor symptoms versus placebo and an endometrial protection study.
Phase 3 clinical trials for secondary amenorrhea versus placebo will be required for TX 12-002HR. TX 12-003HR would be required to undergo phase 3 studies of companies engaged in online commerce and new state tax regulations may subject usvasomotor symptoms compared to additional state sales and income taxes. New legislation or regulation, the application of laws and regulations from jurisdictions whose lawsplacebo, though we currently do not currently applyhave plans to continue development of this drug candidate.
As part of our business,submission, we intend to certify that all of the patents for approved products referenced in the NDA for each of the hormone therapy drug candidates as listed in the FDA’s Orange Book have expired and that we will not be compelled to certify that any patent is invalid, unenforceable, or will not be infringed by the new product. If, in fact, this assessment is incorrect, it can have a change in application of existing lawsserious and regulations to the Internet and commercial online services could result in significant additional taxes on our business. These taxes could have an adverse effect on our resultsability to obtain FDA approval or market our new product. If we are compelled to certify that a patent is invalid, unenforceable, or not infringed, then the holder of operations.
Marketing Exclusivity
A 505(b)(2) NDA applicant may be eligible for its own regulatory exclusivity period, such as three-year exclusivity. The first approved 505(b)(2) NDA applicant for a particular condition of ourapproval, or change to a marketed product, such as a new extended release formulation for a previously approved product, may be granted three-year Hatch-Waxman exclusivity if one or more clinical studies, other than bioavailability or bioequivalence studies, was essential to the approval of the application and was conducted/sponsored by the applicant. Should this occur, the FDA would be precluded from making effective any other application for the same condition of use or for a change to the drug product that was granted exclusivity until after that three-year exclusivity period has run. Additional exclusivities may also apply.
Additionally, the 505(b)(2) NDA applicant may have relevant patents in the Orange Book, and if it does, it can initiate patent infringement litigation against those applicants that challenge such patents, which could result in a 30-month stay delaying those applicants.
Dietary Supplement and Cosmetic Regulation
Our currently marketed products are regulated as dietary supplements and cosmetics. The processing, formulation, safety, manufacturing, packaging, labeling, advertising, and distribution of these products are subject to extensive regulation inby one or more federal agencies, including the U.S. The FDA enforces the Federal Food, Drug and Cosmetic Act (FDCA) and related regulations which govern the identity, purity, quality, strength, and composition of dietary supplements and regulate the formulation, manufacture, packaging, labeling, holding, sale, and distribution of dietary supplements, foods and OTC and prescription drugs, and prohibit the sale of misbranded and adulterated dietary supplements and dietary supplements that by the intention of the manufacturer or distributor or label or labeling claims are unapproved new drugs.
Generally, our nutritional product formulations are proprietary in that in designing them, we attempt to blend an optimal combination of nutrients that appear to have beneficial impact based upon scientific literature and advertising actsinput from physicians; however, we are generally prohibited from making disease treatment and practices associated withprevention claims in the promotion and sale of these products. The U.S. Postal Inspection Service enforces federal laws governing fraudulent use of the mail. Regulation of certain aspects of the dietary supplement business at the federal level is also governed by the Consumer Product Safety Commission (CPSC) (e.g., concerning the presence of adulterated substances, such as toxic levels of lead or iron, that render products unsafe for consumption and require an ordered recall), the Department of Agriculture (e.g., forour products that are intended for ingestion as dietary supplements for animals) and the Environmental Protection Agency (e.g., in the methods of disposal used for certain dietary ingredients, such as colloidal silver). Federal and state anti-kickback statutes, the Ethics in Patient Referrals Act, false claims statutes and HIPPA also apply to our business.
The FDCA has been amended several times affecting provisions that concern dietary ingredients and dietary supplements, including by the Dietary Supplement Health and Education Act of 1994, (DSHEA).or DSHEA, formally defined what may be sold asamended the FDCA to establish a dietary supplement, defined statementsnew framework governing the composition, safety, labeling, manufacturing, and marketing of nutritional support and the conditions under which they may lawfully be used, and included provisions that permit the FDA to regulate manufacturing practices and labeling claims peculiar to dietary supplements. “Dietary supplements” are defined as vitamins, minerals, herbs, other botanicals, amino acids and other dietary substances that are used to supplement the diet, as well as concentrates, constituents, extracts, metabolites, or combinations of such dietary ingredients. Generally, under DSHEA,the FDCA, dietary ingredients that were onmarketed in the market beforeUnited States prior to October 15, 1994 may be used in dietary supplements without notifying the FDA. However, a “new”“New” dietary ingredient (i.e.ingredients (i.e., a dietary ingredientingredients that was notwere “not marketed in the U.S.United States before October 15, 1994)1994”) must be the subject of a new dietary ingredient notification submitted to the FDA unless the ingredient has been “present in the food supply as an article used for food” without having beenbeing “chemically altered.” A new dietary ingredient notification must provide the FDA with evidence of a “history of use or other evidence of safety” which establishesestablishing that use of the dietary ingredient “will reasonably be expected to be safe.” A new dietary ingredient notification must be submitted to the FDA at least 75 days before the initial marketing of the new dietary ingredient. The FDA may determine that a new dietary ingredient cannotification does not provide an adequate basis to conclude that a dietary ingredient is reasonably expected to be marketed. There can be no assurance that the FDA will accept evidence purporting to establish the safety of any new dietary ingredients that we may want to market and the FDA’s refusal to accept such evidencesafe. Such a determination could prevent the marketing of such dietary ingredients.
The FDA or other agencies could leadtake actions against products or product ingredients that in its determination present an unreasonable health risk to consumers that would make it illegal for us to sell such products. In addition, the FDA could issue consumer warnings with respect to challenge dietarythe products or ingredients alreadyin such products. Such actions or warnings could be based on information received through FDCA-mandated reporting of serious adverse events. The FDCA requires that reports of serious adverse events be submitted to the market as “illegal” underFDA, and based in part on such reports, the FDCA because of the failureFDA has issued public warnings to file a new dietary ingredient notification or because the substance may be one foundconsumers to be the subject of an investigational new drug application for which clinical trials have commenced and been publicized.
The FDA prohibits disease treatment claims entirely when made for a dietary supplement; however,FDCA permits “statements of nutritional support,” including so-called “structure/function claims” are permittedsupport” to be included in labeling for dietary supplements without premarket approval. Such statements must be submitted to the FDA pre-approval.within 30 days of marketing. Such statements may describe how a particular dietary ingredient affects the structure, function, or general well-being of the body, or the mechanism of action by which a dietary ingredient may affect thebody structure, function, or well-being, of the body, but such statements may not stateexpressly or implicitly represent that a dietary supplement will reduce the riskdiagnose, cure, mitigate, treat, or incidence ofprevent a disease unless such claim has been reviewed and approved by the FDA.disease. A company that uses a statement of nutritional support in labeling must possess scientific evidence substantiating that the statement is truthful and not misleading. Such statements must be submitted toIf the FDA no later than thirty days after first marketing the product with the statement and must be accompanied by the following FDA mandated label disclaimer: “This statement has not been evaluated by the Food and Drug Administration. This product is not intended to diagnose, treat, cure or prevent any disease.” There can be no assurance that the FDA will not determinedetermines that a particular statement of nutritional support that we want to use is an unacceptable diseasedrug claim, conventional food claim, or an unauthorized nutrient-disease relationship claim otherwise permitted with FDA approval asversion of a “health claim.claim,” Suchor, if the FDA determines that a determination might preventparticular claim is not adequately supported by existing scientific data or is false or misleading, we would be prevented from using the use of such a claim.
In addition, DSHEA provides that certainso-called “third-party literature,” such as a reprint of a peer-reviewed scientific publication linking a particular dietary ingredient with health benefits, may be used “in connection with the sale of a dietary supplement to consumers” without the literature being subject to regulation as labeling. The literature (1) must not be exemptfalse or misleading; (2) may not “promote” a particular manufacturer or brand dietary supplement; (3) must present a balanced view of the available scientific information on the subject matter; (4) if displayed in establishment, must be physically separate from labeling regulation. However, the FDA has adopted an “intentdietary supplements; and (5) should not have appended to use” doctrine wherebyit any information by sticker or another method. If the literature fails to satisfy each of these requirements, we may be prevented from disseminating such literature even if exempt from labeling, may nonetheless formwith our products, and any dissemination could subject our product to regulatory action as an illegal drug.
In June 2007, pursuant to the basis for an agency determination that the literature in context reveals a company’s intent to sell a dietary ingredient or dietary supplement as a drug, thereby rendering the supplement an unlawful, unapproved new drug. Because the “intent to use” doctrine is predicated on a subjective assessment of all facts and circumstances associated with the promotion and sale of a dietary supplement, we cannot know whether any particular piece of literature otherwise exempt from labeling will be deemed by the FDA unlawful for use in association with the sale of the dietary ingredient or dietary supplement.
The FDA has broad authority to enforce the provisions of the FDCA concerning medical foods,federal law applicable to dietary supplements, and drugs, including powers to issue a public “warning letter”Warning Letters or Untitled Letters to a company, to quarantine and prohibit the sale of products deemed adulterated or misbranded, to publicize information about illegal products, todetain products intended for import, require the reporting of serious adverse events, request a voluntary recall of illegal or unsafe products from the market, toand request that the Department of Justice initiate a seizure action, an injunction action, or a criminal prosecution in the U.S. courts,courts. The FSMA expands the reach and to seek disgorgement from a federal courtregulatory powers of all proceeds received from the sale of products deemed misbranded or adulterated. For instance, the FDA recently announced that any unapproved new drug introduced after September 19, 2011 will bewith respect to the production and importation of food, including dietary supplements. The expanded reach and regulatory powers include the FDA’s ability to order mandatory recalls, administratively detain domestic products, require certification of compliance with domestic requirements for imported foods associated with safety issues and administratively revoke manufacturing facility registrations, effectively enjoining manufacturing of dietary ingredients and dietary supplements without judicial process. The regulation of dietary supplements may increase or become more restrictive in the future.
Our cosmetic products, such as our topical creams, are also subject to immediate enforcement action, withoutregulation by the FDA. Such products and their ingredients do not require premarket approval prior notice and without regard to sale, but are subject to specific labeling regulations. While the enforcement priorities set out in CPG 440.100. The FDA will continuehas not promulgated specific cGMPs for the manufacture of cosmetics, the FDA has provided guidelines for cosmetic manufacturers to apply the enforcement priorities established in 2006. These give a higher priorityfollow to enforcement actions involving drugs in certain high-risk categories, such as drugsensure that pose a potential safety risk or lack evidence of effectiveness.
The FTC exercises jurisdiction over the advertising of medical foods, dietary supplements and drugs. cosmetics. In recent years, the FTC has instituted numerous enforcement actions against companies for failure to have adequate substantiation for claims made in advertising or for the use of false or misleading advertising claims.
In recent years, the FTC has instituted numerous enforcement actions against dietary supplement companies for making false or misleading advertising claims and for failing to adequately substantiate claims made in advertising. These enforcement actions have often resulted in consent decrees and the payment of civil penalties and/or restitution by the companies involved. The FTC also regulates other aspects of consumer purchases, including but not limited to, promotional offers of savings compared policies, telemarketing, continuity plans, and “free” offers.
We are also subject to regulation under various state, local, and international laws that include provisions governing, among other things, the formulation, manufacturing, packaging, labeling, advertising, and distribution of dietary supplements and drugs. For example, Proposition 65 in the Statestate of California is a list of substances deemed to pose a risk of carcinogenicity or birth defects at or above certain levels. If any such ingredient exceeds the permissible levels in a dietary supplement, cosmetic, or drug, the product may be lawfully sold in California only if accompanied by a prominent warning label alerting consumers that the product contains an ingredient linked to cancer or birth defect risk. Private attorney general actions as well as California attorney general actions may be brought against non-compliant parties and can result in substantial costs and fines.
Other U.S. Health Care Laws and Compliance Requirements
We are also subject to additional health care regulation and enforcement by the federal government and the states in which we conduct our business. Applicable federal and state healthcarehealth care laws and regulations include but are not limitedthe following:
Health Insurance Portability and Accountability Act of 1996, or HIPAA, imposes criminal and civil liability for executing a scheme to defraud any health care benefit program and also imposes obligations, including mandatory contractual terms, with respect to safeguarding the privacy, security, and transmission of individually identifiable health information.
Efforts to ensure that our business arrangements with third parties comply with applicable healthcarehealth care laws and regulations could be costly. Although we believe that our regulatory counsel has assisted us in establishing business practices are structured to be compliant with applicable laws, it is possible that governmental authorities will conclude that our business practices may not comply with current or future statutes, regulations, or case law involving applicable fraud and abuse or other healthcarehealth care laws and regulations. If our past or present operations, including activities conducted by our sales team or agents, are found to be in violation of any of these laws or any other governmental regulations that may apply to us, we may be subject to significant civil, criminal, and administrative penalties, damages, fines, exclusion from third party payor programs, such as Medicare and Medicaid, and the curtailment or restructuring of our operations. If any of the physicians, providers, or entities with whom we do business isare found to be not in compliance with applicable laws, they may be subject to criminal, civil, or administrative sanctions, including exclusionsexclusion from government funded healthcarehealth care programs.
Many aspects of these laws have not been definitively interpreted by the regulatory authorities or the courts, and their provisions are open to a variety of subjective interpretations whichthat increases the risk of potential violations. In addition, these laws and their interpretations are subject to change. Any action against us for violation of these laws, even if we successfully defend against it, could cause us to incur significant legal expenses, divert our management’s attention from the operation of our business, and damage our reputation.
In addition, from time to time in the future, we may become subject to additional laws or regulations administered by the FDA, the FTC, or by other federal, state, local, or foreign regulatory authorities, to the repeal of laws or regulations that we generally consider favorable, such as DSHEA, or to more stringent interpretations of current laws or regulations. We are not able to predict the nature of such future laws, regulations, repeals, or interpretations, and we cannot predict what effect additional governmental regulation, if and when it occurs, would have on our business in the future. Such developments could, however, require reformulation of certain products to meet new standards, recalls or discontinuance of certain products not able to be reformulated, additional record-keeping requirements, increased documentation of the properties of certain products, additional or different labeling, additional scientific substantiation, additional personnel, or other new requirements. Any such developments could have a material adverse effect on our business.
The growth and demand for eCommerce could result in more stringent consumer protection laws that impose additional compliance burdens on online retailers. These consumer protection laws could result in substantial compliance costs and could interfere with the Past Five Years
There is currently great uncertainty in many states whether or how existing laws governing issues such as property ownership, sales and do not directly handle, storeother taxes, and libel and personal privacy apply to the Internet and commercial online retailers. These issues may take years to resolve. For example, tax authorities in a number of states, as well as a Congressional advisory commission, are currently reviewing the appropriate tax treatment of companies engaged in online commerce and new state tax regulations may subject us to additional state sales and income taxes. New legislation or transport hazardous materials or waste products. We depend on these third parties to abide by all applicable federal, state and localregulation, the application of laws and regulations governing the use, manufacture, storage, handling and disposal of hazardous materials and waste products. Wefrom jurisdictions whose laws do not anticipate the costcurrently apply to our business, or a change in application of complying with theseexisting laws and regulations to be material.
Employees
As of December 31, 2011,2013, we had 5169 full-time employees, four (4) of whom are executive officers. Additionally, from time to time, we hire temporary contract employees. None of our employees are covered by a collective bargaining agreement, and we are unaware of any union organizing efforts. We have never experienced a major work stoppage, strike, or dispute. We consider our relationship with our employees to be good.
Our History
On October 3, 2011, we changed our name to TherapeuticsMD, Inc. On October 4, 2011, we closed a reverse merger with VitaMedMD, LLC, a Delaware limited liability company, or VitaMed, pursuant to which (1) all outstanding membership units of VitaMed were exchanged for shares of our common stock (2) all outstanding VitaMed options and warrants were exchanged and converted into options and warrants to purchase shares of our common stock, and (3) VitaMed became our wholly owned subsidiary. As of December 31, 2011, we determined that VitaMed would become the sole focus of our company and services previously performed relative to the aforementioned licensing agreement were discontinued.
We were incorporated in Utah in 1907 under the name Croff Mining Company. Prior to 2008, Croff’s operations consisted entirely of oil and natural gas leases. Due to a spin-off of its operations in December 2007, Croff had no business operations or revenue source and had reduced its operations to a minimal level although it continued to file reports required under the Securities Exchange Act of 1934, or the Exchange Act. As a result of the spin-off, Croff was a “shell company” under the rules of the Securities and Exchange Commission, or the SEC. In July 2009, Croff (i) closed a transaction to acquire America’s Minority Health Network, Inc. as a wholly owned subsidiary, (ii) ceased being a shell company, and (iii) experienced a change in control in which the former stockholders of America’s Minority Health Network, Inc. acquired control of our company. On June 11, 2010, we closed a transaction to acquire Spectrum Health Network, Inc. as a wholly owned subsidiary. On July 20, 2010, we filed Articles of Conversion and Articles of Incorporation to redomicile in the state of Nevada. On July 31, 2010, we transferred the assets of America’s Minority Health Network, Inc. to a secured noteholder in exchange for the satisfaction of certain associated debt. On February 15, 2011, we transferred the assets of Spectrum Health Network, Inc. to a secured noteholder in exchange for the satisfaction of associated debt and in exchange for a licensing agreement under which we subsequently sold subscription services and advertising on the Spectrum Health Network for commissions.
Available Information
We are locateda Nevada corporation. We maintain our principal executive offices at 9516800 Broken Sound Parkway NW, Suite 320,Third Floor, Boca Raton, FLFlorida 33487. Our telephone number is 561-961-1911(561) 961-1900. We maintain websites atwww.therapeuticsmd.com,www.vitamedmd.com,www.vitamedmdrx.com, andwww.bocagreenmd.com. The information contained on our fax numberwebsites or that can be accessed through our websites is 561-431-3389.
We are subject tofile reports with the requirements of Section 13(a) under the Exchange Act which requires us to file annual reportsSEC, including Annual Reports on Form 10-K, quarterly reportsQuarterly Reports on Form 10-Q, and current reportsCurrent Reports on Form 8-K, and any other filings required by the SEC. Through our website, we are required to comply with all other obligations of the Exchange Act applicable to issuers filing registration statements pursuant to Section 12(g) of the Exchange Act.
The public may read and copy any materials we file with, or furnish to, the SEC at the SEC’s Public Reference Room at 100 F Street, NE, Washington, DC 20549. The public may obtain further information furtheron the operation of the Public Reference Room by calling the SEC at 1-800-SEC-0330. The SEC maintains an Internet site (www.sec.gov) that contains reports, proxy and information aboutstatements, and other information regarding issuers that file electronically with the SEC.
Executive Officers
The following table sets forth certain information regarding our executive officers as of December 31, 2013:
| Name | Age | Position | ||
| Robert G. Finizio | 43 | Chief Executive Officer | ||
| John C.K. Milligan, IV | 51 | President and Secretary | ||
| Daniel A. Cartwright | 56 | Chief Financial Officer, Vice President of Finance, and Treasurer | ||
| Mitchell L. Krassan | 48 | Executive Vice President and Chief Strategy Officer |
Robert G. Finizio has served as Chief Executive Officer and a director of our company since October 2011. As co-founder of VitaMed, Mr. Finizio served as its Chief Executive Officer and a director from April 2008 to October 2011. Mr. Finizio has 16 years of successful early stage company development experience in the health care industry. Mr. Finizio co-founded and served from August 2001 to February 2008 as President of Care Fusion, LLC and then as Chief Executive Officer of CareFusion, Inc., which was acquired by Cardinal Health, Inc. Mr. Finizio’s early business experience was with Omnicell, Inc. (formerly known as Omnicell Technologies, Inc.) and Endoscopy Specialists, Inc. in the healthcare IT and surgical space, respectively. Mr. Finizio earned a B.A. from the University of Miami.
John C.K. Milligan, IV has served as President, Secretary, and a director of our company since October 2011. From December 2008 to October 2011, Mr. Milligan served as President and Director of VitaMed. Prior to VitaMed, Mr. Milligan co-founded CareFusion, LLC, serving as President and General Manager from August 2001 to February 2008, and then as President and Chief Operating Officer of CareFusion, Inc. From 1997 to 2001, Mr. Milligan was Vice President, Sales and Operations for Omnicell, Inc., a provider of pharmaceutical supply chain management systems and services. Prior to Omnicell, Mr. Milligan also held executive management positions at Serving Software Inc. and HBO & Co., both subsequently acquired by McKesson Corporation. Mr. Milligan is a graduate of the U.S. Naval Academy.
Daniel A. Cartwright has served as Chief Financial Officer, Vice President of Finance, and Treasurer of our company since October 2011. From July 2011 to October 2011, Mr. Cartwright served as Chief Financial Officer of VitaMed. From May 1996 to July 2011, Mr. Cartwright served as Chief Financial Officer and Executive Vice President of Circle F Ventures, LLC, an Arizona venture capital firm that made investments in more than 50 companies. During the same period, Mr. Cartwright served as Chief Financial Officer and Treasurer of Fleming Securities, formerly a registered broker dealer involved with raising capital for public and private companies. From 1993 to 1996, Mr. Cartwright served as Chief Financial Officer of American Wireless Systems, Inc., a provider of entertainment video services. Mr. Cartwright currently serves as a member of the board of directors of Primetrica, Inc., a private information research company for the telecommunications industry, and formerly served on the board of directors of Antenna Technologies Company, Inc. and WEB Corp. Mr. Cartwright earned his B.S. in Accounting from Arizona State University.
Mitchell L. Krassan has served as Executive Vice President and Chief Strategy Officer of our company since October 2011. From April 2010 to October 2011, Mr. Krassan served as Chief Strategy and Performance Officer of VitaMed. Mr. Krassan has been a partner with EquiMark Limited, a private investment partnership, since October 1997. From November 1994 to July 1997, Mr. Krassan served as Chief Financial Officer and Chief Operating Officer of The Reich Group/Telespectrum Worldwide, a fully integrated direct marketing firm that provided clients expertise in market research and analysis, strategic planning, marketing, creative, and production services, telemarketing and database development. The Reich Group became a leading company in a roll-up and $180 million initial public offering of Telespectrum Worldwide. Mr. Krassan earned a B.S. in Accounting from University of Maryland, received his certification as a CPA in the state of Maryland, and earned his M.B.A. in Management from New York University.
Non-Executive Officers
Dr. Brian Bernick has served as Chief Clinical Officer of our company since November 2012 and has served as a director of our company since October 2011. Dr. Bernick also has served as the Chief Medical Officer of our company from February 2012 until 2013. As co-founder of VitaMed, Dr. Bernick served on VitaMed’s board of directors from April 2008. Dr. Bernick is a practicing and board certified obstetrician/gynecologist with 20 years of clinical medical experience. Dr. Bernick is the past Chairman of the Department of Obstetrics and Gynecology at http://www.therapeuticsmd.comBoca Raton Regional Hospital and has served as a member of its Medical Executive Board. He has served on the board of directors of the Palm Beach Medical Society and VitalMD Group Holding, LLC, the largest physician-owned and managed group of obstetricians/gynecologists in Florida covering more than 250 physicians/practices. Dr. Bernick is an Associate Professor of Medicine at Florida Atlantic University and provides medical education in conjunction with Emory University and Florida Atlantic University School of Nursing and Medicine. Dr. Bernick earned a B.A. in economics from Northwestern University and a doctorate in medicine from the University of Chicago Medical School. He completed his residency at the University of Pennsylvania.
Julia Amadiohas served as Chief Product Officer of our company since January 16, 2012. Ms. Amadio has a 25-year background in general management and leading pharmaceutical marketing and product development organizations. From June 2011 to January 2012, Ms. Amadio was President of JMA Consulting, LLC, her own consulting company that she formed in 2008. From June 2009 to May 2011, she served as Global Vice President of Marketing for MeadWestvaco Healthcare Division. Previously, Ms. Amadio was President of a start-up, Patients’ & Consumers’ Pharma, in 2007. She was Vice President of Marketing & Marketing Services with Daiichi Pharmaceutical from 2004 to 2006; Vice President of Aventis Pharmaceutical from 1997 to 2004; Senior Director, New Products Women’s Health at Wyeth from 1991 to 1997; and started her career at J&J’s McNeil Pharmaceutical. Ms. Amadio is an active member and leader in the Healthcare Businesswomen’s Association. She was an adjunct lecturer at St. Joseph’s University in the pharmaceutical MBA program and authored a chapter on Marketing, Market Research and insights in the book Pharmaceutical Development for Woman (Wiley & Sons). You may obtain further information about VitamedMs. Amadio earned a B.S. in Accounting from St. Joseph’s University and a Masters in Business Administration from Drexel University.
Dr. Joel Krasnow has served as the Chief Scientific Officer of our company since December 2013. Dr. Krasnow has 15 years of pharmaceutical industry experience in clinical development and medical affairs. Mr. Krasnow was Chief Safety Officer for Intarcia Therapeutics in 2013. From 2010 to 2012, Dr. Krasnow served as Vice-President and Chief Medical Officer of Eisai Pharmaceuticals, Frontier Business Unit. He led the Actemra® (tocilizumab) and Boniva® (ibandronate sodium) development teams at http://www.vitamedmd.comRoche Pharmaceuticals, resulting in several global product approvals between 2006 to 2010. From 2004 to 2006, Dr. Krasnow led the global development team at Novartis for Zometa® (zoledronic acid), resulting in multiple regulatory approvals. Dr. Krasnow’s experience as a Medical Director in women’s health includes the development of contraceptive, hormone replacement, and fertility treatments while at Organon. In a medical affairs capacity at Pharmacia/Pfizer, Dr. Krasnow worked with Activella® (estradiol/norethindrone acetate), Vagifem® (estradiol vaginal tablets), Depo-Provera (medroxyprogesterone acetate injectable suspension), and Detrol® (tolterodine tartrate). Dr. Krasnow pursued his residency training in OB-GYN at the University of Chicago; a fellowship in Reproductive Endocrinology at Baylor College of Medicine; and was on faculty in the Department of Obstetrics, Gynecology and Reproductive Sciences at the University of Pittsburgh from 1991 to 1996. After receiving a Masters of Business Administration from the University of Pittsburgh, Dr. Krasnow worked in the healthcare practice at Deloitte Consulting.
http://www.vitamedmdrx.comDr. Sebastian Mirkin.
Jason Spitzhas served as Vice President - Marketing of our company since December 2011. Mr. Spitz has a 24-year career in marketing, advertising, and general management experience in pharmaceutical and biopharmaceutical markets. From June 2008 to December 2010, Mr. Spitz served as Managing Director, Oncology & Hematology at Beacon Healthcare Communications, a company specializing in pharmaceutical and health care advertising. From September 2004 to June 2008, he served as General Manager, Canada and Commercial Strategy and Development at MGI Pharma (later acquired by Eisai, Inc.), a company specializing in oncology and cancer supportive care products. From February 2004 to September 2004, he served as Vice President of Marketing and Sales at Aesgen, Inc., a company specializing in cancer products and drug delivery systems that was acquired by MGI Pharma. Mr. Spitz began his career at Schering Plough as a sales representative, rising within the organization over 15 years to lead a global pharmaceutical franchise. Mr. Spitz earned his Bachelor of Business Administration in Marketing from The University of Texas at Austin and his Master of Business Administration in Pharmaceutical Studies from Fairleigh Dickinson University.
Michael Donegan has served as Vice President – Finance of our company since April 2013. Mr. Donegan has a 23-year background in accounting and finance. From August 2012 to April 2013, Mr. Donegan served as an independent consultant exclusively for our company, where he conceptualized, designed and executed our Sarbanes-Oxley 404 compliance program. From August 2007 to August 2012, Mr. Donegan served as an independent consultant designing and implementing Sarbanes-Oxley 404 compliance programs for various non-accelerated filers and executed on pre-designed Sarbanes-Oxley 404 compliance programs for certain large accelerated filers. From January 2005 to August 2007, Mr. Donegan served as an independent consultant exclusively for Tyco International, where he enhanced and executed the Sarbanes-Oxley 404 compliance model with their corporate headquarters group. From November 2001 to December 2004, Mr. Donegan was Manager of Financial Systems at Tyco International at its global headquarters. From 1994 to 2001, Mr. Donegan held various positions in the global consolidation/SEC Reporting group at Sensormatic Electronics Corporation culminating with the acquisition of Sensormatic Electronics Corporation by Tyco International in the fall of 2001 when he was the Manager of Financial Systems. Mr. Donegan began his career at Ernst & Young, LLP where he worked in both the audit and tax departments. Mr. Donegan earned his Bachelor of Science in Accounting and his Master of Accounting from the University of Florida.
Christian Bloomgrenhas served as Vice President - Sales of our company since June 2011. Mr. Bloomgren has 14 years of leadership experience in the pharmaceutical, bio-technology, and diagnostic industry. From 2005 to 2011, Mr. Bloomgren served as Region Manager at ViaCell, Inc., a biotechnology company dedicated to enabling the widespread application of human cells as medicine, later acquired by PerkinElmer, Inc. While at ViaCell, Mr. Bloomgren built a successful national sales channel and helped lead the Specialty Diagnostics business. From 2000 to 2002, Mr. Bloomgren served as a specialty Account Manager at Eli Lilly & Co. and from 2002 to 2005 as District Manager at KV Pharmaceutical. Mr. Bloomgren served as an Officer in the United States Air Force and holds a Bachelor of Science degree from California State University and a Master of Science degree from Troy State University.
Marlan Walkerhas served as Corporate and Intellectual Property Counsel since June 2013. Mr. Walker’s experience is focused in the life science industries, including long-term portfolio strategy and management, patent preparation and prosecution, contract negotiation and drafting, life-cycle management, and Hatch-Waxman. After law school, he took a smaller reporting company,position at Greenberg Traurig LLP in August 2005. In March of 2009, he moved to Luce Forward Hamilton & Scripps. Mr. Walker accepted an in-house position as Intellectual Property Counsel for Medicis Pharmaceutical Corp. in June 2011, which was acquired by Valeant Pharmaceutical International, Inc. in December 2012. In February 2013, Mr. Walker accepted a position at Kilpatrick Townsend & Stockton, but chose to move in-house again in June 2013, when he accepted a position at our company. Mr. Walker graduated from Arizona State University’s Sandra Day O’Conner College of Law with his J.D. in 2004, and as such, is not required to provide information pursuant to this item.
Risk Factors
Investing in our common stock involves a 45-month lease for approximately 7,130 square feethigh degree of office space (the “Lease”). Overrisk. You should carefully consider the termfollowing risk factors, together with all of the Lease,information included in this Annual Report before you decide to purchase shares of our common stock. We believe the Company will pay an average monthly costrisks and uncertainties described below are the most significant we face. Additional risks and uncertainties of $9,352 which includes base rent, common area fees, taxes and insurance. Terms of the Lease provide for an extension for an additional two-year period. The Company’s management believes that the leased premises are suitable and adequate to meet its needs.
Risks Related to Our Business
We have incurred significant operating losses since inception and anticipate that we will incur continued losses for each quarter duringthe foreseeable future.
We have incurred recurring net losses, including net losses of $28 million, $35, and $13 million for the years ended December 31, 2013, 2012, and 2011, respectively. As of December 31, 2013, we had an accumulated deficit of approximately $81 million. We have generated limited revenue and 2010.have funded our operations to date primarily from public and private sales of equity and private sales of debt securities. We expect to incur substantial additional losses over the next several years as our research, development, and clinical trial activities increase, especially those related to our hormone therapy drug candidates. As a result, we may never achieve or maintain profitability unless we successfully commercialize our products, in particular, our hormone therapy drug candidates. If we are unable to make required payments under any of our obligations for any reason, our creditors may take actions to collect their debts, including foreclosing on our intellectual property that collateralizes our obligations. If we continue to incur substantial losses and are unable to secure additional financing, we could be forced to discontinue or curtail our business operations, sell assets at unfavorable prices, refinance existing debt obligations on terms unfavorable to us, or merge, consolidate, or combine with a company with greater financial resources in a transaction that might be unfavorable to us.
Our independent registered public accounting firm, in its audit reports related to our financial statements for the years ended December 31, 2012 and 2011, expressed substantial doubt about our ability to continue as a going concern.
As a result of our continued losses, our independent registered public accounting firm has included an explanatory paragraph in its reports on our financial statements for the years ended December 31, 2012 and 2011, expressing substantial doubt as to our ability to continue as a going concern. The inclusion of a going concern explanatory paragraph in the report of our independent registered public accounting firm may make it more difficult for us to secure additional financing or enter into strategic relationships on terms acceptable to us, if at all, and may materially and adversely affect the terms of any financing that we might obtain.
We currently derive all of our revenue from sales of our women’s health care products, and our failure to maintain or increase sales of these products would have a material adverse effect on our business, financial condition, results of operations, and growth prospects.
We currently derive all of our revenue from sales of women’s health care products, including prenatal and women’s multi-vitamins, iron supplements, vitamin D supplements, natural menopause relief, and scar reduction creams. While sales of our vitamin products grew from 2010 through 2013, we cannot assure you that such sales will continue to grow. In addition to other risks described herein, our ability to maintain or increase existing product sales is subject to a number of risks and uncertainties, including the following:
If revenue from sales of our existing prescription and over-the-counter dietary supplements and cosmetics does not continue or increase, we may be required to reduce our operating expenses or to seek to raise additional funds, which could have a material adverse effect on our business, financial condition, results of operations, and growth prospects, or we may not be able to commence or continue clinical trials to seek approval for and commercialize our hormone therapy drug candidates or any other products we may choose to develop in the future.
If our products do not have the effects intended or cause undesirable side effects, our business may suffer.
Although many of the ingredients in our current dietary supplement products are vitamins, minerals, and other substances for which there is a long history of human consumption, they also contain innovative ingredients or combinations of ingredients. Although we believe all of these products and the combinations of ingredients in them are safe when taken as directed, the products could have certain undesirable side effects if not taken as directed or if taken by a consumer who has certain medical conditions. In addition, these products may not have the effect intended if they are not taken in accordance with certain instructions, which include certain dietary restrictions. Furthermore, there can be no assurance that any of the products, even when used as directed, will have the effects intended or will not have harmful side effects in an unforeseen way or on an unforeseen cohort. If any of our products or products we develop or commercialize in the future are shown to be harmful or generate negative publicity from perceived harmful effects, our business, financial condition, results of operations, and prospects would be harmed significantly.
Our future success will depend in large part on our ability to commercialize our hormone therapy drug candidates designed to alleviate the symptoms of and reduce the health risks resulting from menopause, including hot flashes, osteoporosis, and vaginal dryness.
Our future success will depend in large part on our ability to successfully develop and commercialize our hormone therapy drug candidates designed to alleviate the symptoms of and reduce the health risks resulting from menopause, including hot flashes, osteoporosis, and vaginal dryness. We have submitted IND applications for our four hormone therapy drug candidates, which the FDA has made effective and which permit us to conduct clinical testing on these proposed products. We intend to clinically test three of those drug candidates. However, we may not be able to complete the development of these drug candidates, the results of the clinical trials may not be sufficient to support NDA for any of them, and even if we believe the results of our clinical trials are sufficient to support any NDA that we submit, the FDA may disagree and may not approve our NDA. In addition, even if the FDA approves one or more of our NDAs, it may do so with restrictions on the intended uses that may make commercialization of the product or products financially untenable. The failure to commercialize or obtain necessary approval for any one or more of these products would substantially harm our prospects and our business.
We may not be able to complete the development and commercialization of our hormone therapy drug candidates if we fail to obtain additional financing.
We need substantial amounts of cash to complete the clinical development of our hormone therapy drug candidates. Our existing cash and cash equivalents will not be sufficient to fund these requirements. In addition, changing circumstances may cause us to consume funds significantly faster than we currently anticipate, and we may need to spend more money than currently expected because of circumstances beyond our control. We do not currently have any committed external source of funds. We will attempt to raise additional capital from the issuance of equity or debt securities, collaborations with third parties, licensing of rights to these products, or other means, or a combination of any of the foregoing. Securing additional financing will require a substantial amount of time and attention from our management and may divert a disproportionate amount of their attention away from our day-to-day activities, which may adversely affect our ability to conduct our day-to-day operations. In addition, we cannot guarantee that future financing will be available in sufficient amounts or on terms acceptable to us, if at all. If we are unable to raise additional capital when required or on acceptable terms, we may be required to take one or more of the following actions:
Debt financing, if available, may involve agreements that include covenants limiting or restricting our ability to take specific actions, such as incurring additional debt, making capital expenditures, or declaring dividends. To the extent that we raise additional capital through the sale of equity or convertible debt securities, the ownership interest of our existing stockholders will be diluted, and the terms of these new securities may include liquidation or other preferences that adversely affect the rights of our existing stockholders. If we raise additional funds through collaborations, strategic alliances, or licensing arrangements with third parties, we may have to relinquish valuable rights to our technologies, future revenue streams, research programs, or proposed products or grant licenses on terms that may not be favorable to us.
If we are unable to raise additional capital in sufficient amounts or on terms acceptable to us, we will be prevented from pursuing discovery, development, and commercialization efforts, and our ability to generate revenue and achieve or sustain profitability will be substantially harmed.
We have no experience as a company in bringing a drug to regulatory approval.
We have never obtained regulatory approval for, or commercialized, a drug. It is possible that the FDA may refuse to accept any or all of our planned NDAs for substantive review or may conclude, after review of our data, that our applications are insufficient to obtain regulatory approval of any of our hormone therapy drug candidates. The FDA may also require that we conduct additional clinical or manufacturing validation studies, which may be costly and time-consuming, and submit that data before it will reconsider our applications. Depending on the extent of these or any other FDA required studies, approval of any NDA that we submit may be significantly delayed, possibly for years, or may require us to expend more resources than we have available or can secure. Any delay or inability in obtaining regulatory approvals would delay or prevent us from commercializing our hormone therapy drug candidates, generating revenue from these proposed products, and achieving and sustaining profitability. It is also possible that additional studies, if performed and completed, may not be considered sufficient by the FDA to approve any NDA we submit. If any of these outcomes occur, we may be forced to abandon our planned NDAs for one or more of our hormone therapy drug candidates, which would materially adversely affect our business and could potentially cause us to cease operations.
Clinical trials involve a lengthy and expensive process with an uncertain outcome, and results of earlier studies and trials may not be predictive of future trial results.
Three hormone therapy drug candidates are currently in various stages of clinical testing. We have recently begun phase 3 clinical trial of our estradiol and progesterone combination and our progesterone alone drug candidates. Clinic trials are expensive, can take many years to complete, and have highly uncertain outcomes. Failure can occur at any time during the clinical trial process as a result of inadequate performance of a drug, inadequate adherence by patients or investigators to clinical trial protocols, or other factors. New drugs in later stages of clinical trials may fail to show the desired safety and efficacy traits despite having progressed through earlier clinical trials. A number of companies in the biopharmaceutical industry have suffered significant setbacks in advanced clinical trials as a result of a lack of efficacy or adverse safety profiles, despite promising results in earlier trials. Our future clinical trials may not be successful or may be more expensive or time-consuming than we currently expect. If clinical trials for any of our hormone therapy drug candidates fail to demonstrate safety or efficacy to the satisfaction of the FDA, the FDA will not approve that drug and we would not be able to commercialize it, which will have a material adverse effect on our business, financial condition, results of operations, and prospects.
Delays in clinical trials are common for many reasons, and any such delays could result in increased costs to us and jeopardize or delay our ability to obtain regulatory approval and commence product sales as currently contemplated.
We may experience delays in clinical trials for our hormone therapy drug candidates. Our planned clinical trials might not begin on time; may be interrupted, delayed, suspended, or terminated once commenced; might need to be redesigned; might not enroll a sufficient number of patients; or might not be completed on schedule, if at all. Clinical trials can be delayed for a variety of reasons, including the following:
Patient enrollment, a significant factor in the timing of clinical trials, is affected by many factors, including the size and nature of the patient population, the proximity of patients to clinical sites, the eligibility criteria for the trial, the design of the clinical trial, competing clinical trials, and clinicians’ and patients’ perceptions as to the potential advantages of the drug being studied in relation to other available therapies, including any new drugs that may be approved for the indications we are investigating. Any of these delays in completing our clinical trials could increase our costs, slow down our product development and approval process, and jeopardize our ability to commence product sales and generate revenue.
We may be required to suspend or discontinue clinical trials because of adverse side effects or other safety risks that could preclude approval of our hormone therapy drug candidates.
Our clinical trials may be suspended or terminated at any time for a number of reasons. A clinical trial may be suspended or terminated by us, our collaborators, the FDA, or other regulatory authorities because of a failure to conduct the clinical trial in accordance with regulatory requirements or our clinical protocols, presentation of unforeseen safety issues or adverse side effects, failure to demonstrate a benefit from using the investigational drug, changes in governmental regulations or administrative actions, lack of adequate funding to continue the clinical trial, or negative or equivocal findings of the DSMB or the IRB for a clinical trial. An institutional review board may also suspend or terminate our clinical trials for failure to protect patient safety or patient rights. We may voluntarily suspend or terminate our clinical trials if at any time we believe that they present an unacceptable risk to participants. In addition, regulatory agencies may order the temporary or permanent discontinuation of our clinical trials at any time if they believe the clinical trials are not being conducted in accordance with applicable regulatory requirements or present an unacceptable safety risk to participants. If we elect or are forced to suspend or terminate any clinical trial of any proposed product that we develop, the commercial prospects of such proposed product will be harmed and our ability to generate product revenue from any of these proposed products will be delayed or eliminated. Any of these occurrences may harm our business, financial condition, results of operations, and prospects significantly.
We rely on third parties to conduct our research and development activities, including our clinical trials, and we may experience delays in obtaining or may be unsuccessful in obtaining regulatory approval for, or in commercializing our hormone therapy drug candidates if these third parties do not successfully carry out their contractual duties or meet expected deadlines.
| 29 |
We do not have the resources to independently conduct research and development activities. Therefore, we have relied, and plan to continue to rely, on various third-party CROs to conduct our research and development activities and to recruit patients and monitor and manage data for our on-going clinical programs for our hormone therapy drug candidates, as well as for the execution of our clinical studies. Although we control only certain aspects of our CROs’ activities, we are responsible for ensuring that each of our studies is conducted in accordance with the applicable protocol, legal, regulatory, and scientific standards and our reliance on the CROs does not relieve us of our regulatory responsibilities. We cannot assure you that the CROs will conduct the research properly or in a timely manner, or that the results will be reproducible. We and our CROs are required to comply with the FDA’s cGCPs, which are regulations and guidelines enforced by the FDA for all of our products in clinical development. The FDA enforces these cGCPs through periodic inspections of trial sponsors, principal investigators, and clinical trial sites. If we or our CROs fail to comply with applicable cGCPs, the clinical data generated in our clinical trials may be deemed unreliable or invalid, and the FDA may require us to perform additional clinical trials before approving our proposed products. We cannot assure you that, upon inspection, the FDA will determine that any of our clinical trials comply with cGCPs. In addition, to evaluate the safety and effectiveness compared to placebo of our hormone therapy drug candidates to a statistically significant degree, our clinical trials will require an adequately large number of test subjects. Any clinical trial that a CRO conducts abroad on our behalf is subject to similar regulation. Accordingly, if our CROs fail to comply with these regulations or recruit a sufficient number of patients, we may be required to repeat clinical trials, which would delay the regulatory approval process.
In addition, we do not employ the personnel of our CROs, and, except for remedies available to us under our agreements with such organizations, we cannot control whether or not they will devote sufficient time and resources to our on-going clinical and pre-clinical programs. Our CROs may also have relationships with other commercial entities, including one or more of our competitors, for which they may also be conducting clinical studies or other drug development activities, which could impede their ability to devote appropriate time to our clinical programs. If our CROs do not successfully carry out their contractual duties or obligations or meet expected deadlines, if they need to be replaced, or if the quality or accuracy of the clinical data they obtain is compromised because of the failure to adhere to our clinical protocols or regulatory requirements, or for other reasons, our clinical trials may be extended, delayed, or terminated, and we may not be able to obtain regulatory approval for or successfully commercialize our hormone therapy drug candidates that we seek to develop. As a result, our financial results and the commercial prospects for our hormone therapy drug candidates that we seek to develop would be harmed, our costs could increase, and our ability to generate revenue could be delayed or ended.
We typically engage one or more CROs on a project-by-project basis for each study or trial. While we have developed and plan to maintain our relationships with CROs that we have previously engaged, we also expect to enter into agreements with other CROs to obtain additional resources and expertise in an attempt to accelerate our progress with regard to on-going clinical programs and, specifically, the compilation of clinical trial data for submission with an NDA for each of our hormone therapy drug candidates. If any of our relationships with these third parties terminate, we may not be able to enter into arrangements with alternative CROs or do so on commercially reasonable terms. Switching or entering into new relationships with CROs involves substantial cost and requires extensive management time and focus. In addition, there is a natural transition period when a new CRO commences work. As a result, delays occur, which can materially affect our ability to meet our desired clinical development timelines and can increase our costs significantly. Although we try to carefully manage our relationships with our CROs, there can be no assurance that we will not encounter challenges or delays in the future or that these delays or challenges will not have a material adverse impact on our business, financial condition, results of operations, or prospects.
Future legislation, regulations, and policies adopted by the FDA or other regulatory authorities may increase the time and cost required for us to conduct and complete clinical trials for our hormone therapy drug candidates.
The FDA has established regulations, guidelines, and policies to govern the drug development and approval process, as have foreign regulatory authorities. Any change in regulatory requirements resulting from the adoption of new legislation, regulations, or policies may require us to amend existing clinical trial protocols or add new clinical trials to comply with these changes. Such amendments to existing protocols or clinical trial applications or the need for new ones, may significantly and adversely affect the cost, timing, and completion of the clinical trials for our hormone therapy drug candidates.
In addition, the FDA’s policies may change and additional government regulations may be issued that could prevent, limit, or delay regulatory approval of our drug candidates, or impose more stringent product labeling and post-marketing testing and other requirements. If we are slow or unable to adapt to such changes, our business, prospects, and ability to achieve or sustain profitability would be adversely affected.
Even if we obtain regulatory approval for our hormone therapy drug candidates, we will still face extensive, ongoing regulatory requirements and review, and our products may face future development and regulatory difficulties.
Even if we obtain regulatory approval for one or more of our hormone therapy drug candidates in the United States, the FDA may still impose significant restrictions on a product’s indicated uses or marketing or to the conditions for approval, or impose ongoing requirements for potentially costly post-approval studies, including Phase 4 clinical trials or post-market surveillance. As a condition to granting marketing approval of a product, the FDA may require a company to conduct additional clinical trials. The results generated in these post-approval clinical trials could result in loss of marketing approval, changes in product labeling, or new or increased concerns about side effects or efficacy of a product. For example, the labeling for our hormone therapy drug candidates, if approved, may include restrictions on use or warnings. The Food and Drug Administration Amendments Act of 2007, or FDAAA, gives the FDA enhanced post-market authority, including the explicit authority to require post-market studies and clinical trials, labeling changes based on new safety information, and compliance with FDA-approved Risk Evaluation and Mitigation Strategies, or REMS, programs. If approved, our hormone therapy drug candidates will also be subject to ongoing FDA requirements governing the manufacturing, labeling, packaging, storage, distribution, safety surveillance, advertising, promotion, record keeping, and reporting of safety and other post-market information. The FDA’s exercise of its authority could result in delays or increased costs during product development, clinical trials and regulatory review, increased costs to comply with additional post-approval regulatory requirements, and potential restrictions on sales of approved products. Foreign regulatory agencies often have similar authority and may impose comparable costs. Post-marketing studies, whether conducted by us or by others and whether mandated by regulatory agencies or voluntary, and other emerging data about marketed products, such as adverse event reports, may also adversely affect sales of our hormone therapy drug candidates once approved, and potentially our other marketed products. Further, the discovery of significant problems with a product similar to one of our products that implicate (or are perceived to implicate) an entire class of products could have an adverse effect on sales of our approved products. Accordingly, new data about our products could negatively affect demand because of real or perceived side effects or uncertainty regarding efficacy and, in some cases, could result in product withdrawal or recall. Furthermore, new data and information, including information about product misuse, may lead government agencies, professional societies, and practice management groups or organizations involved with various diseases to publish guidelines or recommendations related to the use of our products or the use of related therapies or place restrictions on sales. Such guidelines or recommendations may lead to lower sales of our products.
The holder of an approved NDA also is subject to obligations to monitor and report adverse events and instances of the failure of a product to meet the specifications in the NDA. Application holders must submit new or supplemental applications and obtain FDA approval for certain changes to the approved product, product labeling, or manufacturing process. Application holders must also submit advertising and other promotional material to the FDA and report on ongoing clinical trials. Legal requirements have also been enacted to require disclosure of clinical trial results on publicly available databases.
In addition, manufacturers of drug products and their facilities are subject to continual review and periodic inspections by the FDA and other regulatory authorities for compliance with the FDA’s cGMPs regulations. If we or a regulatory agency discovers previously unknown problems with a product, such as adverse events of unanticipated severity or frequency or problems with the facility where the product is manufactured, a regulatory agency may impose restrictions on that product, the manufacturing facility, or us, including requiring recall or withdrawal of the product from the market or suspension of manufacturing, requiring new warnings or other labeling changes to limit use of the drug, requiring that we conduct additional clinical trials, imposing new monitoring requirements, or requiring that we establish a REMS. Advertising and promotional materials must comply with FDA rules in addition to other potentially applicable federal and state laws. The distribution of product samples to physicians must comply with the requirements of the Prescription Drug Marketing Act. Sales, marketing, and scientific/educational grant programs must comply with the anti-fraud and abuse provisions of the Social Security Act, the False Claims Act, and similar state laws. Pricing and rebate programs must comply with the Medicaid rebate requirements of the Omnibus Budget Reconciliation Act of 1990 and the Veterans Healthcare Act of 1992. If products are made available to authorized users of the Federal Supply Schedule of the General Services Administration, additional laws and requirements apply. All of these activities are also potentially subject to federal and state consumer protection and unfair competition laws. If we or our third-party collaborators fail to comply with applicable regulatory requirements, a regulatory agency may take any of the following actions:
The occurrence of any of the foregoing events or penalties may force us to expend significant amounts of time and money and may significantly inhibit our ability to bring to market or continue to market our products and generate revenue. Similar regulations apply in foreign jurisdictions.
Our dependence upon third parties for the manufacture and supply of our existing women’s health care products and our hormone therapy drug candidates may cause delays in, or prevent us from, successfully developing, commercializing, and marketing our products.
We do not currently have nor do we plan to build the infrastructure or capability internally to manufacture our existing women’s health care products. For example, we depend on Lang to supply approximately 98% of our vitaMedMD products. We also rely on third-party contract manufacturing organizations, or CMOs to supply our hormone therapy drug candidates for use in the conduct of our clinical trials. We rely on these third parties to manufacture these products in accordance with our specifications and in compliance with applicable regulatory requirements. We do not have long-term contracts for the commercial supply of our products or our hormone therapy drug candidates. We intend to pursue long-term manufacturing agreements, but we may not be able to negotiate such agreements on acceptable terms, if at all.
In addition, regulatory requirements could pose barriers to the manufacture of our products, including our hormone therapy drug candidates. Our third-party manufacturers are required to comply with cGMP regulations. As a result, the facilities used by any of our current or future manufacturers must be approved by the FDA. Holders of NDAs, or other forms of FDA approvals or clearances, or those distributing a regulated product under their own name, are responsible for manufacturing even though that manufacturing is conducted by a third-party CMO. All of our existing products are and our hormone therapy drug candidates, if approved, will be manufactured by CMOs. These CMOs are required by the terms of our contracts to manufacture our products in compliance with the applicable regulatory requirements. If our manufacturers cannot successfully manufacture material that conforms to our specifications and the strict regulatory requirements of the FDA and any applicable foreign regulatory authority, they will not be able to secure the applicable approval for their manufacturing facilities. If these facilities are not approved for the commercial manufacture of our existing products or our hormone therapy drug candidates, we may need to find alternative manufacturing facilities, which would result in disruptions of our sales and significant delays of up to several years in obtaining approval for our hormone therapy drug candidates. In addition, our manufacturers will be subject to ongoing periodic unannounced inspections by the FDA and corresponding state and foreign agencies for compliance with cGMPs and similar regulatory requirements. Failure by any of our manufacturers to comply with applicable cGMP regulations could result in sanctions being imposed on us, including fines, injunctions, civil penalties, delays, suspensions or withdrawals of approvals, operating restrictions, interruptions in supply, recalls, withdrawals, issuance of safety alerts, and criminal prosecutions, any of which could have a material adverse impact on our business, financial condition, results of operations, and prospects. Finally, we also could experience manufacturing delays if our CMOs give greater priority to the supply of other products over our products and proposed products or otherwise do not satisfactorily perform according to the terms of their agreements with us.
If any supplier of the product for our hormone therapy drug candidates experiences any significant difficulties in its respective manufacturing processes, does not comply with the terms of the agreement between us, or does not devote sufficient time, energy, and care to providing our manufacturing needs, we could experience significant interruptions in the supply of our hormone therapy drug candidates, which could impair our ability to supply our hormone therapy drug candidates at the levels required for our clinical trials and commercialization and prevent or delay their successful development and commercialization.
The commercial success of our existing products and our hormone therapy drug candidates that we develop, if approved in the future, will depend upon gaining and retaining significant market acceptance of these products among physicians and payors.
Physicians may not prescribe our products, including any of our hormone therapy drug candidates, if approved by the appropriate regulatory authorities for marketing and sale, which would prevent us from generating revenue or becoming profitable. Market acceptance of our products, including our hormone therapy drug candidates, by physicians, patients, and payors, will depend on a number of factors, many of which are beyond our control, including the following:
Even if the medical community accepts that our products are safe and efficacious for their approved indications, physicians may not immediately be receptive to the use or may be slow to adopt our products as an accepted treatment for the symptoms for which they are intended. We cannot assure you that any labeling approved by the FDA will permit us to promote our products as being superior to competing products. If our products, including, in particular our hormone therapy drug candidates, if approved, do not achieve an adequate level of acceptance by physicians and payors, we may not generate sufficient or any revenue from these products and we may not become profitable. In addition, our efforts to educate the medical community and third-party payors on the benefits of our products may require significant resources and may never be successful.
Our products, including our hormone therapy drug candidates if approved, face significant competition from branded and generic products, and our operating results will suffer if we fail to compete effectively.
Development and awareness of our brand will depend largely upon our success in increasing our customer base. The dietary supplement and pharmaceutical industries are intensely competitive and subject to rapid and significant technological change. Our products, including any hormone therapy drug candidates that are approved, face intense competition, including from major multinational pharmaceutical and dietary supplement companies, established biotechnology companies, specialty pharmaceutical, and generic drug companies. Many of these companies have greater financial and other resources, such as larger research and development staffs and more experienced marketing and manufacturing organizations. As a result, these companies may obtain regulatory approval more rapidly and may be more effective in selling and marketing their products. They also may invest heavily to accelerate discovery and development of novel compounds or to in-license novel compounds that could make the products that we sell or develop obsolete. As a result, our competitors may succeed in commercializing products before we do. Smaller or early-stage companies may also prove to be significant competitors, particularly through collaborative arrangements with large, established companies. If we are unable to economically promote or maintain our brand, our business, results of operations and financial condition could be severely harmed. In addition, our efforts to provide an alternative to the non FDA-approved compound bioidentical market for estradiol and progesterone products sold by compounding pharmacies may not be successful.
Reimbursement may not be available for our products, which could make it difficult for us to sell our products profitably.
Market acceptance and sales of our products, including any hormone therapy drug candidates, will depend on coverage and reimbursement policies and may be affected by health care reform measures. Government authorities and third-party payors, such as private health insurers and health maintenance organizations, decide which products they will pay for and establish reimbursement levels. Third-party payors generally do not cover over-the-counter products, and coverage for vitamins and dietary supplements varies. We cannot be sure that coverage and reimbursement will be available for our products, including any hormone therapy drug candidates, if approved. We also cannot be sure that the amount of reimbursement available, if any, will not reduce the demand for, or the price of, our products. If reimbursement is not available or is available only at limited levels, we may not be able to successfully compete through sales of our existing dietary supplement products or successfully commercialize our hormone therapy drug candidates.
Specifically, in both the United States and some foreign jurisdictions, there have been a number of legislative and regulatory proposals to change the health care system in ways that could affect our ability to sell our products profitably. In the United States, the Medicare Prescription Drug, Improvement, and Modernization Act of 2003, also called the Medicare Modernization Act, or MMA, changed the way Medicare covers and pays for pharmaceutical products. The legislation expanded Medicare coverage for drug purchases by the elderly and certain others and introduced a new reimbursement methodology based on average sales prices for physician-administered drugs. In addition, this legislation provided authority for limiting the number of certain outpatient drugs that will be covered in any therapeutic class. As a result of this legislation and the expansion of federal coverage of drug products, we expect that there will be additional pressure to contain and reduce costs. These and future cost-reduction initiatives could decrease the coverage and price that we receive for our products, including our hormone therapy drug candidates, if approved, and could seriously harm our business. While the MMA applies only to drug benefits for Medicare beneficiaries, private payors often follow Medicare coverage policies and payment limitations in setting their own reimbursement rates, and any reduction in reimbursement under Medicare may result in a similar reduction in payments from private payors.
In March 2010, the Patient Protection and Affordable Care Act, as amended by the Health Care and Education Affordability Reconciliation Act, or collectively, PPACA, became law in the United States. The goal of PPACA is to reduce the cost of health care and substantially change the way health care is financed by both governmental and private insurers. Among other measures, PPACA imposes increased rebates on manufacturers for certain covered drug products reimbursed by state Medicaid programs. While we cannot predict the full effect PPACA will have on federal reimbursement policies in general or on our business specifically, the PPACA may result in downward pressure on drug reimbursement, which could negatively affect market acceptance of our products. In addition, we cannot predict whether new proposals will be made or adopted, when they may be adopted, or what impact they may have on us if they are adopted.
The availability of generic products at lower prices than branded products may also substantially reduce the likelihood of reimbursement for branded products, such as our hormone therapy drug candidates, if approved. We expect to experience pricing pressures in connection with the sale of our products generally due to the trend toward managed health care, the increasing influence of health maintenance organizations, and additional legislative proposals. If we fail to successfully secure and maintain adequate coverage and reimbursement for our products or are significantly delayed in doing so, we will have difficulty achieving market acceptance of our products and our business will be harmed.
Product liability lawsuits could divert our resources, result in substantial liabilities and reduce the commercial potential of our products.
We face an inherent risk of product liability claims as a result of the marketing of our current products and the clinical testing of our hormone therapy drug candidates despite obtaining appropriate informed consents from our clinical trial participants, and we will face an even greater risk if we obtain FDA approval and commercialize our hormone therapy drug candidates in the United States or other additional jurisdictions or if we engage in the clinical testing of proposed new products or commercialize any additional products. For example, we may be sued if any product we develop allegedly causes injury or is found to be otherwise unsuitable during clinical testing, manufacturing, marketing, or sale. Any such product liability claims may include allegations of defects in manufacturing, defects in design, a failure to warn of dangers inherent in the product, negligence, strict liability, or a breach of warranties. Claims could also be asserted under state consumer protection acts. If we cannot successfully defend ourselves against product liability claims, we may incur substantial liabilities or be required to limit commercialization of our existing products or hormone therapy drug candidates, if approved. Even successful defense would require significant financial and management resources. Regardless of the merits or eventual outcome, product liability claims may result in any of the following:
Although we maintain general liability insurance of up to $10 million in the aggregate and clinical trial liability insurance of $10 million in the aggregate for our hormone therapy drug candidates, this insurance may not fully cover potential liabilities. The cost of any product liability litigation or other proceeding, even if resolved in our favor, could be substantial. In addition, our inability to obtain or maintain sufficient insurance coverage at an acceptable cost or to otherwise protect against potential product liability claims could prevent or inhibit the development and commercial production and sale of our products, which could adversely affect our business, financial condition, results of operations, and prospects.
Our business may be affected by unfavorable publicity or lack of consumer acceptance.
We are highly dependent upon consumer acceptance of the safety and quality of our products, as well as similar products distributed by other companies. Consumer acceptance of a product can be significantly influenced by scientific research or findings, national media attention, and other publicity about product use. A product may be received favorably, resulting in high sales associated with that product that may not be sustainable as consumer preferences change. Future scientific research or publicity could be unfavorable to our industry or any of our particular products and may not be consistent with earlier favorable research or publicity. A future research report or publicity that is perceived by our consumers as less than favorable or that may question earlier favorable research or publicity could have a material adverse effect on our ability to generate revenue. Adverse publicity in the form of published scientific research, statements by regulatory authorities or otherwise, whether or not accurate, that associates consumption of our product or any other similar product with illness or other adverse effects, or that questions the benefits of our product or a similar product, or that claims that such products do not have the effect intended could have a material adverse effect on our business, reputation, financial condition, or results of operations.
If we use hazardous and biological materials in a manner that causes injury or violates applicable law, we may be liable for damages.
Our research and development activities involve the controlled use of potentially hazardous substances, including chemical, biological, and radioactive materials. In addition, our operations produce hazardous waste products. Federal, state, and local laws and regulations in the United States govern the use, manufacture, storage, handling, and disposal of hazardous materials. Although we believe that our procedures for use, handling, storing, and disposing of these materials (all of which only occur at third-party sites operated by our contractors) comply with legally prescribed standards, we may incur significant additional costs to comply with applicable laws in the future. We also cannot predict the impact on our business of new or amended environmental laws or regulations or any changes in the way existing and future laws and regulations are interpreted or enforced. Also, even if we are in compliance with applicable laws, we cannot completely eliminate the risk of contamination or injury resulting from hazardous materials, and we may incur liability as a result of any such contamination or injury. In the event of an accident, we could be held liable for damages or penalized with fines, and the liability could exceed our resources, and we do not carry liability insurance covering the use of hazardous materials. If we fail to comply with applicable requirements, we could incur substantial costs, including civil or criminal fines and penalties, clean-up costs, or capital expenditures for control equipment or operational changes necessary to achieve or maintain compliance. Compliance with applicable environmental laws and regulations is expensive, and current or future environmental regulations may impair our research, development and production efforts, which adversely affect our business, financial condition, results of operations, and prospects.
We are subject to extensive and costly government regulation.
The products we currently market, including the vitamins and cosmetic creams, and the pharmaceutical products we are developing and planning to develop in the future, are subject to extensive and rigorous domestic government regulation, including regulation by the FDA, the Centers for Medicare & Medicaid Services, or CMS, other divisions of the U.S. Department of Health and Human Services, including its Office of Inspector General, the U.S. Department of Justice, the Departments of Defense and Veterans Affairs, to the extent our products are paid for directly or indirectly by those departments, state and local governments, and their respective foreign equivalents. The FDA regulates dietary supplements, cosmetics, and drugs under different regulatory schemes. For example, the FDA regulates the processing, formulation, safety, manufacturing, packaging, labeling, advertising, and distribution of dietary supplements and cosmetics under its dietary supplement and cosmetic authority, respectively. The FDA also regulates the research, development, pre-clinical and clinical testing, manufacture, safety, effectiveness, record keeping, reporting, labeling, storage, approval, advertising, promotion, sale, distribution, import, and export of pharmaceutical products under various regulatory provisions. If any drug products we develop are tested or marketed abroad, they will also be subject to extensive regulation by foreign governments, whether or not we have obtained FDA approval for a given product and its uses. Such foreign regulation may be equally or more demanding than corresponding U.S. regulation.
Government regulation substantially increases the cost and risk of researching, developing, manufacturing, and selling products. Our failure to comply with these regulations could result in, by way of example, significant fines, criminal and civil liability, product seizures, recalls, withdrawals, withdrawals of approvals, and exclusion and debarment from government programs. Any of these actions, including the inability of our hormone therapy drug candidates to obtain and maintain regulatory approval, would have a materially adverse effect on our business, financial condition, results of operations, and prospects.
We are subject to additional federal and state laws and regulations relating to our business, and our failure to comply with those laws could have a material adverse effect on our results of operations and financial conditions.
We are subject to additional health care regulation and enforcement by the federal government and the states in which we conduct our business. The laws that may affect our ability to operate include the following:
Further, the recently enacted PPACA, among other things, amends the intent requirement of the federal anti-kickback and criminal health care fraud statutes. A person or entity can now be found guilty of fraud or false claims under PPACA without actual knowledge of the statute or specific intent to violate it. In addition, PPACA provides that the government may assert that a claim including items or services resulting from a violation of the federal Anti-Kickback Statute constitutes a false or fraudulent claim for purposes of the false claims statutes. Possible sanctions for violation of these anti-kickback laws include monetary fines, civil and criminal penalties, exclusion from Medicare, Medicaid and other government programs and forfeiture of amounts collected in violation of such prohibitions. Any violations of these laws, or any action against us for violation of these laws, even if we successfully defend against it, could result in a material adverse effect on our reputation, business, results of operations, and financial condition.
PPACA also imposes new reporting requirements on device and pharmaceutical manufacturers to make annual public disclosures of payments to health care providers and ownership of their stock by health care providers. Failure to submit required information may result in civil monetary penalties of up to an aggregate of $150,000 per year (or up to an aggregate of $1 million per year for “knowing failures”), for all payments, transfers of value, or ownership or investment interests that are not reported. Manufacturers were required to begin data collection on August 1, 2013 and will be required to report such data to CMS by March 31, 2014.
In addition, there has been a recent trend of increased federal and state regulation of payments made to physicians for marketing. Some states, such as California, Massachusetts and Vermont, mandate implementation of corporate compliance programs, along with the tracking and reporting of gifts, compensation, and other remuneration to physicians.
The scope and enforcement of these laws is uncertain and subject to change in the current environment of health care reform, especially in light of the lack of applicable precedent and regulations. We cannot predict the impact on our business of any changes in these laws. Federal or state regulatory authorities may challenge our current or future activities under these laws. Any such challenge could have a material adverse effect on our reputation, business, results of operations, and financial condition. Any state or federal regulatory review of us, regardless of the outcome, would be costly and time-consuming.
If we are not successful in attracting and retaining highly qualified personnel, we may not be able to successfully implement our business strategy.
Our ability to compete in the highly competitive pharmaceutical industry depends in large part on our ability to attract and retain highly qualified managerial, scientific, and medical personnel. In order to induce valuable employees to remain with us, we have, among other things, provided stock-based compensation that vests over time. The value to employees of stock-based compensation will be significantly affected by movements in our stock price that we cannot control and may at any time be insufficient to counteract more lucrative offers from other companies. Despite our efforts to retain valuable employees, members of our management, scientific, and medical teams may terminate their employment with us on short notice. We do not have employment agreements with a number of our key employees. As a result, most employees are employed on an at-will basis, which means that any of these employees could leave our employment at any time, with or without notice, and may go to work for a competitor. The loss of the services of any of our executive officers or other key employees could potentially harm our business, operating results, and financial condition. Our success also depends on our ability to continue to attract, retain, and motivate highly skilled scientific and medical personnel.
Any failure to adequately expand a direct sales force will impede our growth.
We expect to be substantially dependent on a direct sales force to attract new business and to manage customer relationships. We plan to expand our direct sales force and believe that there is significant competition for qualified, productive direct sales personnel with advanced sales skills and technical knowledge. Our ability to achieve significant growth in revenue in the future will depend, in large part, on our success in recruiting, training, and retaining sufficient direct sales personnel. New and future hires may not become as productive as expected, and we may be unable to hire sufficient numbers of qualified individuals in the future in the markets in which we do business. While there presently exists a high rate of unemployment, if we are unable to hire and develop sufficient numbers of productive sales personnel our business prospects could suffer.
Other pharmaceutical companies with which we compete for qualified personnel have greater financial and other resources, different risk profiles, and longer histories than we do. They also may provide more diverse opportunities and better chances for career advancement. Some of these characteristics may be more appealing to high-quality candidates than what we offer. If we are unable to continue to attract and retain high-quality personnel, our ability to commercialize drug candidates will be limited.
Our success is tied to our distribution channels.
We sell our prescription dietary supplement products to wholesale distributors, specialty pharmacies, specialty distributors, and chain drug stores that generally sell products to retail pharmacies, hospitals, and other institutional customers. However, over 98% of our product shipments since inception were to only three customers: AmerisourceBergen Corporation, Cardinal Health, Inc., and McKesson Corporation. Our business would be harmed if any of these customers refused to distribute our products or refused to purchase our products on commercially favorable terms to us.
A failure to maintain optimal inventory levels to meet commercial demand for our products could harm our reputation and subject us to financial losses.
Our ability to maintain optimal inventory levels to meet commercial demand depends on the performance of third-party contract manufacturers. In some instances, our products have unique ingredients used under license arrangements. If our manufacturers are unsuccessful in obtaining raw materials, if we are unable to manufacture and release inventory on a timely and consistent basis, if we fail to maintain an adequate level of product inventory, if inventory is destroyed or damaged, or if our inventory reaches its expiration date, patients might not have access to our products, our reputation and brands could be harmed, and physicians may be less likely to recommend our products in the future, each of which could have a material adverse effect on our business, financial condition, results of operations, and cash flows.
Our success depends on how efficiently we respond to changing consumer preferences and demand.
Our success depends, in part, on our ability to anticipate and respond to changing consumer trends and preferences. We may not be able to respond in a timely or commercially appropriate manner to these changes. Our failure to accurately predict these trends could negatively impact our inventory levels, sales, and consumer opinion of us as a source for the latest product. The success of our new product offerings depends upon a number of factors, including our ability to achieve the following:
| • | procure and maintain products in sufficient volumes and in a timely manner; and | |
| • | differentiate our product offerings from those of our competitors. |
If we do not introduce new products, make enhancements to existing products, or maintain the appropriate inventory levels to meet customers’ demand in a timely manner, our business, results of operations, and financial condition could be materially and adversely affected.
We may initiate product recalls or withdrawals, or may be subject to regulatory enforcement actions that could negatively affect our business.
We may be subject to product recalls, withdrawals, or seizures if any of the products we formulate, manufacture, or sell are believed to cause injury or illness or if we are alleged to have violated governmental regulations in the manufacture, labeling, promotion, sale, or distribution of any of our products. A recall, withdrawal, or seizure of any of our products could materially and adversely affect consumer confidence in our brands and lead to decreased demand for our products. In addition, a recall, withdrawal, or seizure of any of our products would require significant management attention, would likely result in substantial and unexpected expenditures, and could materially and adversely affect our business, financial condition, and results of operations.
We will need to grow our organization, and we may experience difficulties in managing this growth, which could disrupt our operations.
As of December 31, 2013, we had 69 employees. As our development and commercialization plans and strategies develop, we expect to expand our employee base for managerial, operational, financial, and other resources and, depending on our commercialization strategy, we may further expand our employee base for sales and marketing resources. Future growth would impose significant added responsibilities on members of management, including the need to identify, recruit, maintain, motivate, and integrate additional employees. Also, our management may need to divert a disproportionate amount of its attention away from their day-to-day activities and devote a substantial amount of time to managing these growth activities. We may not be able to effectively manage the expansion of our operations, which may result in weaknesses in our infrastructure, give rise to operational mistakes, loss of business opportunities, loss of employees and reduced productivity among remaining employees. Our growth could require significant capital expenditures and may divert financial resources from other projects, such as the development of additional drug candidates. If we are unable to effectively manage our expected growth, our expenses may increase more than expected, our ability to increase revenue could be reduced and we may not be able to implement our business strategy. Our future financial performance and our ability to commercialize our hormone therapy drug candidates, if approved, and compete effectively will depend, in part, on our ability to effectively manage any future growth in our organization.
Our employees may engage in misconduct or other improper activities, including noncompliance with regulatory standards and requirements and insider trading.
We are exposed to the risk of employee fraud or other misconduct. Misconduct by employees could include intentional failures to comply with FDA regulations, to provide accurate information to the FDA, to comply with federal and state health care fraud and abuse laws and regulations, to report financial information or data accurately, or to disclose unauthorized activities to us. In particular, sales, marketing, and business arrangements in the health care industry are subject to extensive laws and regulations intended to prevent fraud, misconduct, kickbacks, self-dealing, and other abusive practices. These laws and regulations may restrict or prohibit a wide range of pricing, discounting, marketing and promotion, sales commission, customer incentive programs, and other business arrangements. Employee misconduct could also involve the improper use of information obtained in the course of clinical trials, which could result in regulatory sanctions and serious harm to our reputation. We have adopted a Code of Conduct and Ethics, but it is not always possible to identify and deter employee misconduct, and the precautions we take to detect and prevent this activity may not be effective in controlling unknown or unmanaged risks or losses or in protecting us from governmental investigations or other actions or lawsuits stemming from a failure to be in compliance with these laws or regulations. If any such actions are instituted against us, and we are not successful in defending ourselves or asserting our rights, those actions could have a significant impact on our business, including the imposition of significant fines or other sanctions.
Risks Related to our Intellectual Property
Another party could develop hormone therapy products and obtain FDA regulatory exclusivity in the United States before we do, potentially preventing our ability to commercialize our hormone therapy drug candidates and other products in development.
We plan to seek to obtain market exclusivity for our hormone therapy drug candidates and any other drug candidates we develop in the future. To the extent that patent protection is not available or has expired, FDA marketing exclusivity may be the only available form of exclusivity available for these proposed products. Marketing exclusivity can delay the submission or the approval of certain marketing applications. Potentially competitive products may also be seeking marketing exclusivity and may be in various stages of development, including some more advanced than us. We cannot predict with certainty the timing of FDA approval or whether FDA approval will be granted, nor can we predict with certainty the timing of FDA approval for competing products or whether such approval will be granted. It is possible that competing products may obtain FDA approval with marketing exclusivity before we do, which could delay our ability to submit a marketing application or obtain necessary regulatory approvals, result in lost market opportunities with respect to our hormone therapy drug candidates, and materially adversely affect our business, financial condition, and results of operations.
If our efforts to protect the proprietary nature of the intellectual property covering our hormone therapy drug candidates and other products are not adequate, we may not be able to compete effectively in our market.
Our commercial success will depend in part on our ability to obtain additional patents and protect our existing patent positions as well as our ability to maintain adequate protection of other intellectual property for our hormone therapy drug candidates and other products. If we do not adequately protect our intellectual property, competitors may be able to use our technologies and erode or negate any competitive advantage we may have, which could harm our business and ability to achieve profitability. The patent positions of pharmaceutical companies are highly uncertain. The legal principles applicable to patents are in transition due to changing court precedent and legislative action, and we cannot be certain that the historical legal standards surrounding questions of validity will continue to be applied or that current defenses relating to issued patents in these fields will be sufficient in the future. Changes in patent laws in the United States, such as the America Invents Act of 2011, may affect the scope, strength, and enforceability of our patent rights or the nature of proceedings that may be brought by us related to our patent rights. In addition, the laws of some foreign countries do not protect proprietary rights to the same extent as the laws of the United States, and we may encounter significant problems in protecting our proprietary rights in these countries. We will be able to protect our proprietary rights from unauthorized use by third parties only to the extent that our proprietary technologies are covered by valid and enforceable patents or are effectively maintained as trade secrets.
These risks include the possibility of the following:
While we apply for patents covering our technologies and products, as we deem appropriate, many third parties may already have filed patent applications or have received patents in our areas of product development. These entities’ applications, patents, and other intellectual property rights may conflict with patent applications to which we have rights and could prevent us from obtaining patents or could call into question the validity of any of our patents, if issued, or could otherwise adversely affect our ability to develop, manufacture, or commercialize our hormone therapy drug candidates. In addition, if third parties file patent applications in the technologies that also claim technology to which we have rights, we may have to participate in interference, derivation, or other proceedings with the USPTO or foreign patent regulatory authorities to determine our rights in the technologies, which may be time-consuming and expensive. Moreover, issued patents may be challenged during in the courts or in post-grant proceedings at the USPTO, or in similar proceedings in foreign countries. These proceedings may result in loss of patent claims or adverse changes to the scope of the claims.
If we, our licensors, or strategic partners fail to obtain and maintain patent protection for our products, or our proprietary technologies and their uses, companies may be dissuaded from collaborating with us. In such event, our ability to commercialize our hormone therapy drug candidates or future product candidates, if approved, may be threatened, we could lose our competitive advantage, and the competition we face could increase, all of which could adversely affect our business, financial condition, results of operations, and prospects.
In addition, mechanisms exist in much of the world permitting some form of challenge by generic drug marketers to our patents prior to, or immediately following, the expiration of any regulatory exclusivity, and generic companies are increasingly employing aggressive strategies, such as “at risk” launches to challenge relevant patent rights.
Our business also may rely on unpatented proprietary technology, know-how, and trade secrets. If the confidentiality of this intellectual property is breached, it could adversely impact our business.
If we are sued for infringing intellectual property rights of third parties, litigation will be costly and time consuming and could prevent or delay us from developing or commercializing our drug candidates.
Our commercial success depends, in part, on our not infringing the patents and proprietary rights of other parties and not breaching any collaboration or other agreements we have entered into with regard to our technologies and products. We are aware of numerous third-party U.S. and non-U.S. issued patents and pending applications that exist in the areas of hormone therapy, including compounds, formulations, treatment methods, and synthetic processes, that may be applied towards the synthesis of hormones. Patent applications are confidential when filed and remain confidential until publication, approximately 18 months after initial filing, while some patent applications remain unpublished until issuance. As such, there may be other third-party patents and pending applications of which we are currently unaware with claims directed towards composition of matter, formulations, methods of manufacture, or methods for treatment related to the use or manufacture of our products or drug candidates. Therefore, we cannot ever know with certainty the nature or existence of every third-party patent filing. We cannot provide assurances that we or our partners will be free to manufacture or market our drug candidates as planned or that we or our licensors’ and partners’ patents will not be opposed or litigated by third parties. If any third-party patent was held by a court of competent jurisdiction to cover aspects of our materials, formulations, methods of manufacture, or methods of treatment related to the use or manufacture of any of our drug candidates, the holders of any such patent may be able to block our ability to develop and commercialize the applicable drug candidate unless we obtained a license or until such patent expires or is finally determined to be held invalid or unenforceable. There can be no assurances that we will be able to obtain a license to such patent on favorable terms or at all. Failure to obtain such license may have a material adverse effect on our business.
There is a substantial amount of litigation involving intellectual property in the pharmaceutical industry generally. If a third party asserts that we infringe its patents or other proprietary rights, we could face a number of risks that could adversely affect our business, financial condition, results of operations, and prospects, including the following:
We are party from time to time to legal proceedings relating to our intellectual property, and third parties in the future may file claims asserting that our technologies, processes, or products infringe on their intellectual property. We cannot predict whether third parties will assert these claims against us or our strategic partners or against the licensors of technology licensed to us, or whether those claims will harm our business. In addition, the outcome of intellectual property litigation is subject to uncertainties that cannot be adequately quantified in advance. If we or our partners were to face infringement claims or challenges by third parties relating to our drug candidates, an adverse outcome could subject us to significant liabilities to such third parties, and force us or our partners to curtail or cease the development of some or all of our drug candidates, which could adversely affect our business, financial condition, results of operations, and prospects.
We may be required to file lawsuits or take other actions to protect or enforce our patents or the patents of our licensors, which could be expensive and time-consuming.
Competitors may infringe our patents or the patents of our licensors. To counter infringement or unauthorized use, we may be required to file infringement claims, which can be expensive and time-consuming. Moreover, there can be no assurance that we will have sufficient financial or other resources to file and pursue such infringement claims, which typically last for years before they are concluded. The legal systems of certain countries, particularly certain developing countries, do not favor the enforcement of patents and other intellectual property protection, particularly those relating to pharmaceuticals, which could make it difficult for us to stop the infringement of our patents or marketing of competing products in violation of our proprietary rights generally.
In addition, in an infringement proceeding, a court may decide that a patent of ours or our licensors is not valid or is unenforceable, or may refuse to stop the other party from using the technology at issue on the grounds that our patents, or those of our licensors, do not cover the technology in question or on other grounds. An adverse result in any litigation or defense proceedings could put one or more of our patents, or those of our licensors, at risk of being invalidated, held unenforceable, or interpreted narrowly and could put our patent applications, or those of our licensors, at risk of not issuing. Moreover, we may not be able to prevent, alone or with our licensors, misappropriation of our proprietary rights, particularly in countries in which the laws may not protect those rights as fully as in the United States or in those countries in which we do not file national phase patent applications. Furthermore, because of the substantial amount of discovery required in connection with intellectual property litigation, there is a risk that some of our confidential information could be compromised by disclosure during this type of litigation. In addition, if securities analysts or investors perceive public announcements of the results of hearings, motions, or other interim proceedings or developments to be negative, the price of our common stock could be adversely affected. The occurrence of any of the above could adversely affect our business, financial condition, results of operations, and prospects.
If we are unable to protect the confidentiality of certain information, the value of our products and technology could be materially adversely affected.
We also rely on trade secrets, know-how, and continuing technological advancement to develop and maintain our competitive position. To protect this competitive position, we regularly enter into confidentiality and proprietary information agreements with third parties, including employees, independent contractors, suppliers, and collaborators. We cannot, however, ensure that these protective arrangements will be honored by third parties, and we may not have adequate remedies if these arrangements are breached. In addition, enforcement of claims that a third party has illegally obtained and is using trade secrets, know-how, or technological advancements is expensive, time-consuming, and uncertain. Non-U.S. courts are sometimes less willing than U.S. courts to protect this information. Moreover, our trade secrets, know-how, and technological advancements may otherwise become known or be independently developed by competitors in a manner providing us with no practical recourse against the competing parties. If any such events were to occur, they could adversely affect our business, financial condition, results of operations, and prospects.
We may be subject to claims that our employees have wrongfully used or disclosed alleged trade secrets of their former employers.
As is common in the pharmaceutical industry, we employ individuals who were previously employed at other biotechnology or pharmaceutical companies, including our competitors or potential competitors. We may be subject to claims that these employees, or we, have inadvertently or otherwise used or disclosed trade secrets or other proprietary information of their former employers. Litigation may be necessary to defend against these claims. Such claims may lead to material costs for us, or an inability to protect or use valuable intellectual property rights, which could adversely affect our business, financial condition, results of operations, and prospects.
Risks Related to Ownership of Our Common Stock
The market price of our common stock may be highly volatile, and you could lose all or part of your investment.
The trading price of our common stock on NYSE MKT is likely to be volatile. This volatility may prevent you from being able to sell your shares at or above the price you paid for your shares. Our stock price could be subject to wide fluctuations in response to a variety of factors, which include the following:
In addition, the stock market in general and the stock of biotechnology companies in particular, have experienced extreme price and volume fluctuations that have often been unrelated or disproportionate to the operating performance of these companies. Broad market and industry factors may negatively affect the market price of our common stock, regardless of our actual operating performance.
Our principal stockholders and management own a significant percentage of our stock and will be able to exert significant control over matters subject to stockholder approval.
At December 31, 2013, our executive officers, directors, holders of 5% or more of our stock, and their affiliates beneficially owned approximately 77% of our common stock on an as converted basis. These stockholders may be able to determine the outcome of all matters requiring stockholder approval. For example, these stockholders may be able to control elections of directors, amendments of our organizational documents, or approval of any merger, sale of assets, or other major corporate transaction. This may prevent or discourage unsolicited acquisition proposals or offers for our common stock that you may feel are in your best interest as one of our stockholders.
If we fail to maintain proper internal controls, our ability to produce accurate financial statements or comply with applicable regulations could be impaired.
Pursuant to Section 404 of the Sarbanes-Oxley Act, our management is required annually to deliver a report that assesses the effectiveness of our internal control over financial reporting and our independent registered public accounting firm is required annually to deliver an attestation report on the effectiveness of our internal control over financial reporting. If we are unable to maintain effective internal control over financial reporting or if our independent auditors are unwilling or unable to provide us with an attestation report on the effectiveness of internal control over financial reporting for future periods as required by Section 404 of the Sarbanes-Oxley Act, we may not be able to produce accurate financial statements, and investors may therefore lose confidence in our operating results, our stock price could decline and we may be subject to litigation or regulatory enforcement actions.
If securities or industry analysts do not publish research or publish inaccurate or unfavorable research about our business, our stock price and trading volume could decline.
The trading market for our common stock will depend in part on the research and reports that securities or industry analysts publish about us or our business. If one or more of the analysts who cover us downgrade our stock or publish inaccurate or unfavorable research about our business, our stock price would likely decline. If one or more of these analysts cease coverage of us or fail to publish reports on us regularly, we could lose visibility in the financial markets, which might cause our stock price and trading volume to decline.
We do not intend to pay dividends on our common stock so any returns will be limited to the value of our stock.
We have never declared or paid any cash dividends on our common stock. We currently anticipate that we will retain any future earnings for the development, operation, and expansion of our business and do not anticipate declaring or paying any cash dividends for the foreseeable future. Any return to stockholders will be limited to the value of their stock.
Some provisions of our charter documents and Nevada law may have anti-takeover effects that could discourage an acquisition of us by others, even if an acquisition would be beneficial to our stockholders and may prevent attempts by our stockholders to replace or remove our current management.
Provisions in our articles of incorporation and bylaws, as well as certain provisions of Nevada law, could make it more difficult for a third party to acquire us or increase the cost of acquiring us, even if an acquisition would benefit our stockholders, and could also make it more difficult to remove our current management. These provisions in our articles of incorporation and bylaws include the following:
In addition, we are subject to Nevada’s Combination with Interested Stockholders statute (Nevada Revised Statute Sections 78.411 - 78.444), which prohibits an “interested stockholder” from entering into a “combination” with a company, unless certain conditions are met. An “interested stockholder” is a person who, together with affiliates and associates, beneficially owns (or within the prior two years, did beneficially own) 10% or more of the corporation’s capital stock entitled to vote.
| Item 1B. | Unresolved Staff Comments |
None.
| Item 2. | Properties |
Our corporate headquarters is located in Boca Raton, Florida, where we lease 17,686 square feet of space. The primary functions performed at this location are executive, administrative, accounting, treasury, marketing, and human resources.
We believe that our current facility is in good working order and is capable of supporting our operations for the foreseeable future.
| Item 3. | Legal Proceedings |
From time to time, we are involved in litigation and proceedings in the ordinary course of our business. We are not currently involved in any legal proceeding that we believe would have a material effect on our business or financial condition.
| Item 4. | Mine Safety Disclosures |
Not applicable.
| Item 5. | Market for the Registrant’s Common Equity, Related Stockholder Matters, and Issuer Purchases of Equity Securities |
Market Information on Common Stock
Since April 23, 2013, our common stock has been listed on the NYSE MKT under the symbol “TXMD.” Prior to that time, our common stock was quoted on the OTCQB. The following table sets forth for the periods indicated the high and low bid or sales prices of our common stock on the OTCQB and the NYSE MKT, as applicable. The below quotations reflect inter-dealer prices, without retail mark-up, mark-down or commission, and may not represent actual transactions. Prices listed in 2011 are historic prices and were notthat have been adjusted to reflect the 1:100 Reverse Splitreverse split that was effective on October 3, 2011.
| Quarter Ended | High | Low | ||||||
| Fiscal Year 2011 | ||||||||
| Fourth Quarter | $ | 1.70 | $ | 0.01 | ||||
| Third Quarter | $ | 0.04 | $ | 0.01 | ||||
| Second Quarter | $ | 0.07 | $ | 0.01 | ||||
| First Quarter | $ | 0.10 | $ | 0.02 | ||||
| Fiscal Year 2010 | ||||||||
| Fourth Quarter | $ | 0.15 | $ | 0.03 | ||||
| Third Quarter | $ | 0.90 | $ | 0.06 | ||||
| Second Quarter | $ | 1.34 | $ | 0.25 | ||||
| First Quarter | $ | 1.60 | $ | 0.10 | ||||
| High | Low | |||||||
| 2013 | ||||||||
| Fourth Quarter | $ | 5.50 | $ | 2.86 | ||||
| Third Quarter | $ | 3.18 | $ | 2.03 | ||||
| Second Quarter | $ | 3.23 | $ | 1.73 | ||||
| First quarter | $ | 3.70 | $ | 1.65 | ||||
| 2012 | ||||||||
| Fourth quarter | $ | 3.50 | $ | 1.25 | ||||
| Third quarter | $ | 3.60 | $ | 2.61 | ||||
| Second quarter | $ | 2.84 | $ | 2.06 | ||||
| First quarter | $ | 2.50 | $ | 1.43 | ||||
| 2011 | ||||||||
| Fourth quarter | $ | 1.70 | $ | 0.51 | ||||
| Third quarter | $ | 4.00 | $ | 1.00 | ||||
| Second quarter | $ | 7.00 | $ | 1.00 | ||||
| First quarter | $ | 10.00 | $ | 2.00 | ||||
On March 3, 2014, the closing sale price of our common stock transfer agent indicate that as ofwas $6.75 per share. On March 23, 2012, we had 3983, 2014, there were approximately 324 record holders of our Common Stock. The number of registered shareholders excludes any estimate by us of the number ofand approximately 3,103 beneficial owners of shares of Common Stock held in “street name.” As of March 23, 2012,our common stock.
Dividends
Historically, we had 84,608,826 outstanding shares of Common Stock.
Performance Graph
The following line graph compares cumulative total shareholder return for the five years ended December 31, 2013 for (i) our common stock; (ii) NASDAQ Pharmaceutical Index; and (iii) Peer Group (includes: Acorda Therapeutics, Inc., AMAG Pharmaceuticals, Inc., Amarillo Biosciences Inc., Arena Pharmaceuticals, Inc., Avanir Pharmaceuticals, Inc., Cadence Pharmaceuticals Inc., Dendreon Corporation, Dyax Corporation, Exelixis, Inc., Halozyme Therapeutics, Inc., Orexigen Therapeutics, Inc., Spectrum Pharmaceuticals, Inc., and VIVUS Inc.). The graph assumes $100 invested on December 31, 2009 and includes reinvestment of dividends. Measurement points are at the last trading day of the fiscal years ended December 31, 2009, 2010, 2011, 2012, and 2013. The stock price performance on the following graph is not necessarily indicative of future stock price performance.
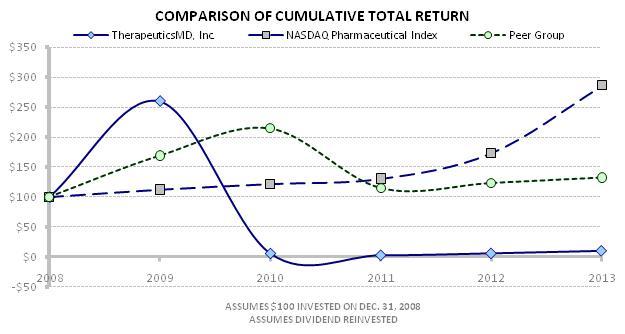
The following line graph compares cumulative total shareholder return for the period beginning when we became listed on the NYSE MKT exchange (April 23, 2013) and ended December 31, 2013 for (i) our common stock; (ii) NASDAQ Pharmaceutical Index; and (iii) our Peer Group (includes: Acorda Therapeutics, Inc., AMAG Pharmaceuticals, Inc., Amarillo Biosciences Inc., Arena Pharmaceuticals, Inc., Avanir Pharmaceuticals, Inc., Cadence Pharmaceuticals Inc., Dendreon Corporation, Dyax Corporation, Exelixis, Inc., Halozyme Therapeutics, Inc., Orexigen Therapeutics, Inc., Spectrum Pharmaceuticals, Inc., and VIVUS Inc.). The graph assumes $100 invested on December 31, 2009 and includes reinvestment of dividends. Measurement points are April 23, 2013 and the last trading day of the fiscal years ended December 31, 2013. The stock price performance on the following graph is not necessarily indicative of future stock price performance.
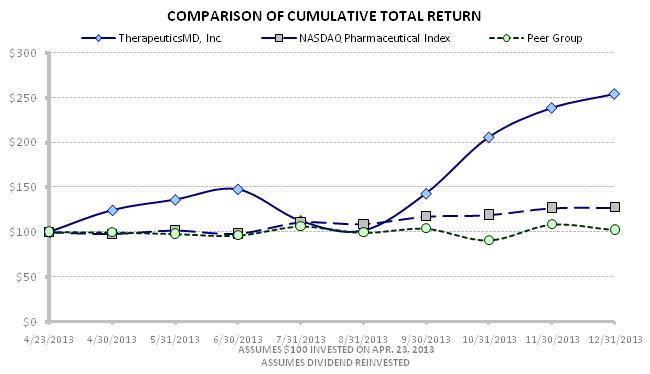
The performance graphs shall not be deemed “filed” for purposes of Section 18 of the Exchange Act or otherwise subject to the liability of that section. The performance graphs will not be deemed incorporated by reference into any filing of our company under the Exchange Act or the Securities Act.
| Item 6. | Selected Financial Data |
The following table sets forth selected consolidated financial and other data as of and for the periods indicated. You should read the following information together with the more detailed information contained in “Management’s Discussion and Analysis of Financial Condition and Results of Operations” and our consolidated financial statements and the related notes included elsewhere in this Annual Report. The consolidated statements of operations for the years ended December 31, 2013, 2012, and 2011 and the consolidated balance sheet data as of December 31, 2013, 2012, and 2011 are derived from our audited consolidated financial statements included in this Annual Report. The consolidated statements of operations for the year ended December 31, 2010, and the consolidated balance sheet data as of December 31, 2010, are derived from the audited consolidated financial statements of VitaMed, our predecessor, included in this Annual Report. The consolidated statements of operations for the period April 2, 2009 (inception) through December 31, 2009, and the consolidated balance sheet data as of December 31, 2009, are derived from the audited consolidated financial statements of AMHN, Inc., our predecessor, not included in this Annual Report.
| Year Ended December 31, | ||||||||||||||||||||
| 2013 | 2012 | 2011 | 2010 | 2009 | ||||||||||||||||
| (Restated) | (Restated) | |||||||||||||||||||
| (in thousands, except share data) | ||||||||||||||||||||
| Consolidated Statements of Operations Data: | ||||||||||||||||||||
| Revenue, net | $ | 8,776 | $ | 3,818 | $ | 2,088 | $ | 1,242 | $ | 221 | ||||||||||
| Gross profit | 6,816 | 2,470 | 1,141 | 556 | 205 | |||||||||||||||
| Operating expenses: | ||||||||||||||||||||
| Sales, general, and administration | 19,015 | 14,070 | 6,406 | 3,335 | 1,471 | |||||||||||||||
| Research and development | 13,551 | 4,492 | 107 | 65 | 23 | |||||||||||||||
| Depreciation and amortization | 58 | 56 | 55 | 23 | 4 | |||||||||||||||
| Total operating expense | 32,624 | 18,618 | 6,568 | 3,423 | 1,498 | |||||||||||||||
| Operating loss | (25,808 | ) | (16,148 | ) | (5,427 | ) | (2,867 | ) | (1,293 | ) | ||||||||||
| Other income (expense) | (2,611 | ) | (18,972 | ) | (7,486 | ) | 5 | |||||||||||||
| Net loss | $ | (28,419 | ) | $ | (35,120 | ) | $ | (12,913 | ) | $ | (2,867 | ) | $ | (1,288 | ) | |||||
| Net loss per share, basic and diluted | $ | (0.22 | ) | $ | (0.38 | ) | $ | (0.21 | ) | $ | (0.07 | ) | $ | (0.05 | ) | |||||
| Weighted average number of common shares outstanding | 127,570 | 91,630 | 62,516 | 38,289 | 27,424 | |||||||||||||||
| Consolidated Balance Sheet Data (at end of period) | ||||||||||||||||||||
| Total assets | $ | 62,016 | $ | 5,926 | $ | 1,439 | $ | 1,197 | $ | 585 | ||||||||||
| Total liabilities | $ | 7,318 | $ | 7,359 | $ | 3,151 | $ | 233 | $ | 102 | ||||||||||
| Total stockholders surplus (deficit) | $ | 54,698 | $ | (1,433 | ) | $ | (1,712 | ) | $ | 964 | $ | 484 | ||||||||
| Other Data: | ||||||||||||||||||||
| Capital expenditures | $ | 480 | $ | 273 | $ | 38 | $ | 27 | $ | 102 | ||||||||||
| Working Capital (deficit) (end of period) | $ | 52,085 | $ | 1,015 | $ | (1,914 | ) | $ | 826 | $ | 361 | |||||||||
| Item 7. | Management’s Discussion and Analysis of Financial Condition and Results of Operations |
You should read the following discussion and analysis in conjunction with the information set forth under “Selected Consolidated Financial and Other Data” and our consolidated financial statements and the notes to those financial statements included elsewhere in this Annual Report. This discussion contains forward-looking statements based upon current expectations that involve risks and uncertainties. See “Special Note Regarding Forward-Looking Statements.” Our actual results may differ materially from those contained in or implied by any forward-looking statements as a result of various factors, including the risks and uncertainties described under “Risk Factors” elsewhere in this Annual Report.
Company Overview
We are a women’s health care product company focused on creating and commercializing products targeted exclusively for women. Currently, we are focused on conducting the clinical trials necessary for regulatory approval and commercialization of advanced hormone therapy pharmaceutical products. The current drug candidates used in our organizational documents,clinical trials are designed to alleviate the symptoms of and any other factorsreduce the health risks resulting from menopause-related hormone deficiencies, including hot flashes, osteoporosis, and vaginal dryness. We are developing these hormone therapy drug candidates, which contain estradiol and progesterone alone or in combination, with the aim of demonstrating equivalent clinical efficacy at lower doses, thereby enabling an enhanced side effect profile compared with competing products. Our drug candidates are created from a platform of hormone technology that our Boardenables the administration of Directors deems relevant.
Results of Operations
Comparison of Years Ended December 31, 2013, 2012, and 2011:
Year ended December 31, 2013 compared with year ended December 31, 2012
| Year Ended December 31, | ||||||||||||
| 2013 | 2012 | Change | ||||||||||
| (000s) | ||||||||||||
| Revenue | $ | 8,776 | $ | 3,818 | $ | 4,958 | ||||||
| Cost of goods sold | 1,960 | 1,348 | 612 | |||||||||
| Operating expenses | 32,624 | 18,618 | 14,006 | |||||||||
| Operating loss | (25,808 | ) | (16,148 | ) | (9,660 | ) | ||||||
| Financing Costs | (1,504 | ) | — | (1,504 | ) | |||||||
| Interest expense | (1,166 | ) | (1,905 | ) | 739 | |||||||
| Other income (expense) net | 59 | (42 | ) | 101 | ||||||||
| Loss on extinguishment of debt | — | (10,308 | ) | 10,308 | ||||||||
| Beneficial conversion feature | — | (6,717 | ) | 6,717 | ||||||||
| Net loss | $ | (28,419 | ) | $ | (35,120 | ) | $ | (6,701 | ) | |||
Revenue
Revenue for Issuance under Equity Compensation Plans
Cost of Goods Sold
Cost of goods sold increased by approximately $611,000, or 45%, for the year ended December 31, 2013 compared with the year ended December 31, 2012. Our gross margins increased to 78% in 2013 compared to 65% in 2012. The gross margin change was primarily attributable to the increase in average sales price of each option; (iii) whetherproducts sold and product mix of prescription and OTC products.
Operating Expenses
Our principal operating costs included the following items as a percentage of total operating expenses.
| Year Ended December 31, | ||||||||
| 2013 | 2012 | |||||||
| Human resource costs | 33 | % | 39 | % | ||||
| Sales and marketing, excluding human resource costs | 15 | % | 24 | % | ||||
| Production design and development costs | 41 | % | 24 | % | ||||
| Professional fees and consulting | 4 | % | 6 | % | ||||
| Other | 7 | % | 7 | % | ||||
Operating expenses increased by approximately $14,006,000, or 75%, for the year ended December 31, 2013 from year ended December 31, 2012 as a result of the following items:
| (000s) | ||||
| Increase in product research and development costs | $ | 9,059 | ||
| Increase in human resource costs | 3,333 | |||
| Increase in sales and marketing, excluding human resource costs | 582 | |||
| Increase in professional and consulting | 79 | |||
| Increase in all other operating expenses | 953 | |||
| $ | 14,006 | |||
Research and development costs increased by approximately $9,059,000, primarily as a result of the commencement of phase 3 clinical trials for TX 12-001HR as well as the preparation for phase 3 clinical trials for TX 12-002HR, and phase 3 clinical trials for TX 12-004HR.
Human resource related costs, including salaries and benefits, increased by approximately $3,333,000, primarily as a result of an increase in amortization of non-cash compensation totaling approximately $3,152,000 related to employee stock option will be exercisable at any timeoptions issued during 2013 and 2012.
Sales and marketing costs increased approximately $582,000, primarily as a result of expanded marketing, advertising, education, and training. In addition, we increased spending in the option periodareas of ten (10)travel, product samples, and commissions. We also incurred added costs associated with our new product distribution channels introduced in 2013.
Financing Costs
Financing costs increased approximately $1,504,000 resulting from the amortization of costs associated with warrants granted in 2013 in connection with a $10,000,000 revolving line of credit.
Interest Expense
Interest expense decreased approximately $739,000, primarily as a result of the retirement of debt issued during 2012.
| 52 |
Year ended December 31, 2012 compared with year ended December 31, 2011
| Year Ended December 31, | ||||||||||||
| 2012 | 2011 | Change | ||||||||||
| (000s) | ||||||||||||
| Revenue | $ | 3,818 | $ | 2,088 | $ | 1,730 | ||||||
| Cost of goods sold | 1,348 | 947 | 401 | |||||||||
| Operating expenses | 18,618 | 6,568 | 12,050 | |||||||||
| Operating loss | (16,148 | ) | (5,427 | ) | (10,721 | ) | ||||||
| Loss on extinguishment of debt | (10,308 | ) | 7,390 | (2,918 | ) | |||||||
| Beneficial conversion feature | (6,717 | ) | -0- | (6,717 | ) | |||||||
| Interest expense | (1,905 | ) | (64 | ) | (1,841 | ) | ||||||
| Other expense, net | (42 | ) | (32 | ) | (10 | ) | ||||||
| Net loss | $ | (35,120 | ) | $ | (12,913 | ) | $ | (22,207 | ) | |||
Revenue
Revenue for year ended December 31, 2012 increased by $1,730,000, or 83%, from the year ended December 31, 2011. This increase was directly attributable to the introduction of our prescription prenatal product line and the use of various pharmaceutical distribution sources.
Cost of Goods Sold
Consistent with our increase in revenue, cost of goods sold increased by $401,000, or 42%, for the year ended December 31, 2012 compared with the year ended December 31, 2011. Our gross margins increased to 65% in 2012 compared to 55% in 2011. This change is primarily attributed to the fact that our 2012 revenue consisted of prescription and OTC products in contrast to revenue in prior years that consisted exclusively of OTC products. Our prescription products offer more favorable margins than those of our OTC products.
Operating Expenses
Our principal operating costs included the following items as a percentage of total operating expenses.
| Year Ended December 31, | ||||||||
| 2012 | 2011 | |||||||
| Human resource costs | 39 | % | 48 | % | ||||
| Sales and marketing, excluding human resource costs | 24 | % | 33 | % | ||||
| Production design and development costs | 24 | % | 2 | % | ||||
| Professional fees and consulting | 6 | % | 7 | % | ||||
| Other | 7 | % | 10 | % | ||||
Operating expenses increased by $12,050,000, or whether it shall be exercisable in installments or by vesting only.
| (000s) | ||||
| Increase in product research and development costs | $ | 4,385 | ||
| Increase in human resource costs | 4,155 | |||
| Increase in sales and marketing, excluding human resource costs | 2,238 | |||
| Increase in professional and consulting | 719 | |||
| Increase in all other operating expenses | 553 | |||
| $ | 12,050 | |||
During 2012 we began the numberdevelopment of securitiesdrug candidates designed to bealleviate the symptoms of and reduce the health risks resulting from menopause-related hormone deficiencies, including hot flashes, osteoporosis, and vaginal dryness. The increase in our product research and development costs was primarily attributable to these hormone therapy drug candidates, which contain estradiol and progesterone alone or in combination, with the aim of providing clinical efficacy at lower doses, thereby enabling an enhanced side effect profile compared with competing products. We have obtained FDA acceptance of our IND applications to conduct clinical trials for four drug candidates and have commenced or intend to commence clinical trials for three of those products.
Human resource related costs, including salaries and benefits, increased by approximately $4,155,000, primarily as a result of an increase in amortization of non-cash compensation totaling approximately $1,678,000 related to employee stock options issued upon exercise of outstanding options under equity compensation plans approved by the Company’s shareholders, which plans do not provide for the issuance of warrants or other rights.
| Plan Category | Number of Securities to be issued upon exercise of outstanding options (a) | Weighted-average exercise price of outstanding options (b) | Number of securities remaining available for future issuance under equity compensation plans (excluding securities reflected in column (a) (c) | |||||||||
| Equity compensation plans not approved by security holders | -0- | $ | -0- | -0- | ||||||||
| Equity compensation plan approved by security holders: LTIP | 10,536,161 | $ | 0.16 | 14,317,782 | ||||||||
| Total | 10,536,161 | $ | 0.16 | 14,317,782 | ||||||||
Sales and marketing costs increased approximately $2,238,000, primarily as a result of expanded marketing, advertising, education, and training. In addition, we increased spending in the previous three-year period, the Company issued the following unregistered securities.
Professional fees increased approximately $719,000 primarily because of an increase in legal fees of approximately $442,000 arising from contract and patent services, costs related to Merger
Loss on Extinguishment of Debt
In February 2012, we issued in reliance upon an exemption from the registration provisions of the Securities Act of 1933 due to Section 4(1) of the Act and Rule 144 and are covered by Lock Up Agreements.
| (000’s) | ||||
| At December 31, 2010 | $ | 423 | ||
| At December 31, 2011 | 126 | |||
| Decrease in cash and cash equivalents | $ | (297 | ) | |
| (000’s) | ||||
| At December 31, 2009 | $ | 123 | ||
| At December 31, 2010 | 423 | |||
| Increase in cash and cash equivalents | $ | 300 | ||
Beneficial Conversion Feature
Beneficial conversion feature of approximately $6,717,000 consisted of non-cash costs associated with the years ended December 31:
| 2011 | 2010 | |||||||
| Proceeds from notes payable and line of credit | $ | 3,084 | $ | -0- | ||||
| Proceeds from issuance of equity securities | 1,707 | 3,171 | ||||||
| Proceeds from exercise of stock options | 17 | -0- | ||||||
| Sources of cash and cash equivalents | 4,808 | 3,171 | ||||||
| Cash used in operating activities | 4,967 | 2,844 | ||||||
| Cash used to purchase equipment | 29 | 27 | ||||||
| Repayment of debt | 101 | -0- | ||||||
| Cash used in other investing activities | 8 | -0- | ||||||
| Uses of cash and cash equivalents | 5,105 | 2,871 | ||||||
| Increase (decrease) in cash and cash equivalents | $ | (297 | ) | $ | 300 | |||
| December 31, | ||||||||||||
| 2011 | 2010 | Change | ||||||||||
(000’s) | ||||||||||||
| Current assets | $ | 1,237 | $ | 1,059 | $ | 178 | ||||||
| Current liabilities | 3,151 | 233 | 2,918 | |||||||||
| Working capital | $ | (1,914 | ) | $ | 826 | $ | (2,740 | ) | ||||
Interest Expense
Interest expense increased short term loans used to fund operations.
| 54 |
Year ended December 31, 2011 compared towith year ended December 31, 2010
| Year Ended December 31, | ||||||||||||
| 2011 | 2010 | Change | ||||||||||
(000’s) | ||||||||||||
| Revenue | $ | 2,088 | $ | 1,242 | �� | $ | 846 | |||||
| Cost of goods sold | 947 | 556 | 391 | |||||||||
| Operating expenses | 6,568 | 3,553 | 3,015 | |||||||||
| Operating loss | (5,427 | ) | (2,867 | ) | (2,560 | ) | ||||||
| Settlement of debt | (7,390 | ) | -0- | (7,390 | ) | |||||||
| Other expense, net | (96 | ) | -0- | (96 | ) | |||||||
| Net loss | $ | (12,913 | ) | $ | (2,867 | ) | $ | (10,046 | ) | |||
| Year Ended December 31, | ||||||||||||
| 2011 | 2010 | Change | ||||||||||
| (000s) | ||||||||||||
| Revenue | $ | 2,088 | $ | 1,242 | $ | 846 | ||||||
| Cost of goods sold | 947 | 556 | 391 | |||||||||
| Operating expenses | 6,568 | 3,553 | 3,015 | |||||||||
| Operating loss | (5,427 | ) | (2,867 | ) | (2,560 | ) | ||||||
| Loss on extinguishment of debt | (7,390 | ) | -0- | (7,390 | ) | |||||||
| Other expense, net | (96 | ) | -0- | (96 | ) | |||||||
| Net loss | $ | (12,913 | ) | $ | (2,867 | ) | $ | (10,046 | ) | |||
Revenue and Cost of Goods Sold
Revenue for year ended December 31, 2011 were upincreased by $846,000, or approximately 68.1%, from the year ended December 31, 2010. This increase was directly attributable to the increase in the number of sales territories and the associated increase in number of sales people selling in those territories.
Cost of Goods Sold
Cost of goods sold increased $391,000, or approximately 70.3%, fromfor the year ended December 31, 2011 compared towith the year ended December 31, 2010. Approximately 96.9% of this increase was primarily due to an increase in the amount of product sold and approximately 3.1% of the increase was related to product mix. The Company’sOur costs of individual products did not change for year ended December 31, 2011 as compared towith 2010.
Operating Expenses
Our principal operating costs includeincluded the following items as a percentage of total expense.
Year Ended December 31, | ||||||||
| 2011 | 2010 | |||||||
| Human resource costs, including benefits | 52 | % | 52 | % | ||||
| Sales and marketing | 14 | % | 9 | % | ||||
| Product design and development costs | 2 | % | 2 | % | ||||
| Travel and entertainment | 6 | % | 5 | % | ||||
| Professional fees for legal, accounting and consulting | 7 | % | 8 | % | ||||
| Rent and other occupancy costs | 5 | % | 5 | % | ||||
| Non-cash costs | 3 | % | 5 | % | ||||
| Other | 11 | % | 14 | % | ||||
| Year Ended December 31, | ||||||||
| 2011 | 2010 | |||||||
| Human resource costs | 48 | % | 48 | % | ||||
| Sales and marketing, excluding human resources cost | 33 | % | 31 | % | ||||
| Professional fees and consulting | 7 | % | 4 | % | ||||
| Product design and development costs | 2 | % | 2 | % | ||||
| Other | 10 | % | 15 | % | ||||
Operating expenses increased by $3.0 million (84%)$3,015,000, or 84%, for year ended December 31, 2011 from year ended December 31, 2010 as a result of the following items:
| (000’s) | ||||
| Increase in human resource costs | $ | 1,551 | ||
| Increase in sales and marketing | 560 | |||
| Increase in product design and development costs | 424 | |||
| Increase in travel and entertainment | 233 | |||
| Increase in professional and consulting | 318 | |||
| Increase in rent and other occupancy costs | 23 | |||
| Increase in non-cash compensation | 19 | |||
| Increase in all other | 270 | |||
| $ | 3,015 | |||
| (000s) | ||||
| Increase in human resource costs | $ | 1,411 | ||
| Increase in sales and marketing | 1,094 | |||
| Increase in professional and consulting | 318 | |||
| Increase in product design and development costs | 42 | |||
| Increase in all other | 150 | |||
| $ | 3,015 | |||
Human resource related costs (including salaries and benefits) increased by $1.6 millionapproximately $1,411,000 primarily due to an increasethe addition of 25 employees in 2011. The CompanyWe had 5149 employees at December 31, 2011, which increased from 2725 for the comparable period fordate in the prior year.
Sales and marketing costs increased $0.6 million due to$1,094,000 because of the increase in both sales territories and sales personnel during 2011.
Professional fees increased $0.3 millionapproximately $318,000, primarily due to an increase in legal fees arising from contract and patent services as well as due diligence related to the above discussed Merger. The Companyour merger with VitaMed in October 2011. We incurred additional accounting and audit costs related to preparation of audits for 2010 and 2011 as required for the above discussed Merger.by our merger with VitaMed. Consulting cost also increased as a result of opening new sales territories and the additional resources needed to complete the Merger.
During 2011, we made improvements to products and packaging, which increased costs by a nominal amount.
Rent and occupancy costs increased slightly as a result of repairs and maintenance and other ancillary costs.
Loss on Extinguishment of debt
On October 18, 2011, the Companywe and the two noteholders entered into Debt Conversion Agreementsdebt conversion agreements and converted the $210,000 principal amount of their convertible notes ($210,000) into 20,000,000 shares of the Company’s Common Stockour common stock valued at $7,600,000.
Other Expense, net
Other non-operating expense increased by $0.1 million$96,000 for the year ended December 31, 2011 in comparison toover the same period in 2010 dueprior fiscal year, primarily toas a result of the addition of interest expense not incurred during 2010.
Liquidity and Capital Resources
We have funded our operations primarily through the private placement of equity, debt securities, and public offerings of our common stock. For the three year period ending December 31, 2013, we received $12 million in net proceeds from the issuance of debt securities and $88 million in net proceeds from the issuance of shares of our common stock. As of December 31, 2013, we had cash and cash equivalents totaling $54 million, however, changing circumstances may cause us to consume funds significantly faster than we currently anticipate, and we may need to spend more money than currently expected because of circumstances beyond our control.
We believe that our existing cash and cash equivalents will allow us to fund our operating plan through at least the next 12 months. If our available cash and cash equivalents are insufficient to satisfy our liquidity requirements, we may seek to sell additional equity or debt securities or obtain a credit facility. Debt financing, if available, may involve agreements that include covenants limiting or restricting our ability to take specific actions, such as incurring additional debt, making capital expenditures, or declaring dividends. To the extent that we raise additional capital through the sale of equity or convertible debt securities, the ownership interest of our existing shareholders will be diluted, and the terms of these new securities may include liquidation or other preferences that adversely affect the rights of our existing shareholders. If we raise additional funds through collaborations, strategic alliances, or licensing arrangements with third parties, we may have to relinquish valuable rights to our technologies, future revenue streams, research programs, or proposed products. Additionally, we may have to grant licenses on terms that may not be favorable to us.
We need substantial amounts of cash to complete the clinical development of our hormone therapy drug candidates. The following table sets forth the primary sources and uses of cash for each of the periods set forth below:
Summary of Sources and (Uses) of Cash
| Year Ended December 31, | ||||||||||||
| 2013 | 2012 | 2011 | ||||||||||
| Net cash flows used in operating activities | $ | (20,768,069 | ) | $ | (12,737,326 | ) | $ | (4,966,596 | ) | |||
| Net cash flows used in investing activities | $ | (583,561 | ) | $ | (272,506 | ) | $ | (37,636 | ) | |||
| Net cash flows provided by financing activities | $ | 73,989,416 | $ | 14,436,885 | $ | 4,707,714 | ||||||
Operating Activities
The use of cash in all periods resulted primarily from our net loss adjusted for non-cash charges and changes in components of working capital. The increase of $8 million in cash used in operating activities for the year ended December 31, 2013 in comparison to prior year was due primarily to research and development, sales, general and administrative costs. These were offset by $9 million in sales.
The increase of $8 million in cash used in operating activities for the year ended December 31, 2012 compared with the comparable period in the prior year was due to research and development, and sales, general and administrative costs. These were offset by $4 million in sales.
Investing Activities
The use of cash in all periods reflects patent costs, security deposits, and purchase of property and equipment. The increase of $300,000 in cash used in investing activities for the year ended December 31, 2013 compared with the comparable period in the prior year was due to patent costs and purchase of property and equipment.
The increase of $200,000 in cash used in investing activities for the year ended December 31, 2012 compared with the comparable period in the prior year was due to patent costs and purchase of property and equipment.
Financing Activities
Financing activities represent the principal source of our cash flow.
Our financing activities for the year ended December 31, 2013 provided net cash of $74 million.
On March 14, 2013, we entered into an underwriting agreement. The net proceeds to us from this offering was approximately $45 million, after deducting underwriting discounts and commissions and other offering expenses. In addition, under the terms of the underwritten offering, we granted the underwriters a 30-day option to purchase additional shares of our common stock. On April 12, 2013, the underwriters exercised their option to purchase 1,954,587 shares of our common stock, and we received net proceeds of approximately $3 million after deducting underwriting discounts and commissions and other offering expenses. On September 25, 2013, we entered into an underwriting agreement. The net proceeds to us from this offering was approximately $30 million, after deducting underwriting discounts and commissions and other offering expenses. In March 2013, we repaid approximately $5 million in notes and credit lines.
Our financing activities for the year ended December 31, 2012 provided net cash of $14 million.
In September 2012, we entered into a Securities Purchase Agreement with multiple investors, relating to the issuance and sale of our common stock in a private placement to raise approximately $8 million in net proceeds. During 2012, we issued notes in the aggregate amount of approximately $9 million to multiple parties, of which approximately $2 million was repaid.
Our financing activities for the year ended December 31, 2011 provided net cash of $5 million. During 2011, we entered into a securities purchase agreement with an investor, relating to the issuance and sale of our common stock in a private placement to raise approximately $1 million in net proceeds. Our predecessor company sold membership units prior to our merger for approximately $1 million of net proceeds. In 2011, we issued notes in the aggregate amount of approximately $3 million.
Critical Accounting Estimates and New Accounting Pronouncements
Critical Accounting Estimates
The preparation of financial statements in accordance with accounting principles generally accepted in the U.S.United States requires managementus to make estimates and assumptions that affect reported amounts and related disclosures in the financial statements. Management considersWe consider an accounting estimate to be critical if:if
changes in the estimate or different estimates that could have been selected could have a material impact on our results of operations or financial condition.
We base our estimates and judgments on our experience, our current knowledge, our beliefs of what could occur in the future, our observation of trends in the industry, information provided by our customers, and information available from other sources. Actual results may differ from these estimates under different assumptions or conditions. We have identified the following accounting policies and estimates as those that we believe are most critical to our financial condition and results of operations and that require management’sour most subjective and complex judgments in estimating the effect of inherent uncertainties: share-based compensation expense and income taxes,taxes.
Revenue Recognition.We recognize revenue on arrangements in accordance with ASC 605, Revenue Recognition. We recognize revenue only when the price is fixed or determinable, persuasive evidence of an arrangement exists, the service is performed, and derivative financial instruments.
Over-the-Counter Products
We generate OTC revenue from product sales primarily to retail consumers. We recognize revenue from product sales upon shipment, when the rights of ownership and risk of loss have passed to the consumer. We include outbound shipping and handling fees in sales and bill them upon shipment. We include shipping expenses in cost of sales. A majority of our customers pay for our products with credit cards, and we usually receive the cash settlement in two to three banking days. Credit card sales minimize accounts receivable balances relative to sales. We provide an unconditional 30-day money-back return policy under which we accept product returns from our retail and eCommerce customers. We recognize our revenue from OTC sales, net of returns, sales discounts, and eCommerce fees.
Prescription Products
We sell our name brand and generic prescription products primarily through drug wholesalers and retail pharmacies. We recognize revenue from prescription product sales, net of sales discounts, chargebacks, and rebates.
We accept returns of unsalable product from customers within a return period of six months prior to and following product expiration. Our prescription products currently have a shelf life of 24 months from the date of manufacture. Given the limited history of our prescription products, we currently cannot reliably estimate expected returns of the prescription products at the time of shipment. Accordingly, we defer recognition of revenue on prescription products until the right of return no longer exists, which occurs at the earlier of the time the prescription products are dispensed through patient prescriptions or expiration of the right of return.
We maintain various rebate programs in an effort to maintain a competitive position in the marketplace and to promote sales and customer loyalty. The consumer rebate program is designed to enable the end user to return a coupon to us. If the coupon qualifies, we send a rebate check to the end user. We estimate the allowance for consumer rebates based on our experience and industry averages, which is reviewed, and adjusted if necessary, on a quarterly basis.
Research and Development Expense.We rely on the services of external contract research organizations, or CRO’s, to facilitate our clinical studies. Certain of these CRO’s require us to make payments based on agreed-upon terms, which may include payments in advance of a study starting date. We capitalize these advance payments into prepaid expense when paid. We expense these nonrefundable advance payments for goods and services that will be used in future R&D activities when the activity has been performed rather than when the payment is made. As a result, we amortize certain of these amounts based on factors relating to the progress of our clinical studies. These factors include successful enrollment of patients, expected duration of studies, and completion of clinical trial milestones. On a quarterly basis we re-assess the factors by which these advanced payments are expensed. If these factors change we adjust these prepaid balances accordingly.
Share-Based Compensation Expense. Compensation.We calculate share-based compensation expenseperiodically issue stock options and warrants to employees and non-employees in non-capital raising transactions for services and for financing costs. We account for stock option awards and warrant issuances (“Share-based Awards”)grants issued and vesting to employees based on the estimated grant/issue-date fairauthoritative guidance provided by the Financial Accounting Standards Board whereas the value usingof the Black-Scholes-Mertonawards are measured on the date of grant and recognized over the vesting period. We account for stock option pricing model (“Black-Sholes Model”), and recognizewarrant grants issued and vesting to non-employees in accordance with the expense onauthoritative guidance of the Financial Accounting Standards Board whereas the value of the stock compensation is based upon the measurement date as determined at either a) the date at which a straight-line basisperformance commitment is reached, or b) at the date at which the necessary performance to earn the equity instruments is complete. Non-employee stock-based compensation charges generally are amortized over the vesting period neton a straight-line basis. In certain circumstances where there are no future performance requirements by the non-employee, option grants are immediately vested and the total stock-based compensation charge is recorded in the period of estimated forfeitures.the measurement date. Determining the fair value of share-based awards at the measurement date requires judgment, including estimating the expected term that stock options and warrants will be outstanding prior to exercise and the associated volatility. We estimate the fair value of options granted using the Black-Scholes-Merton valuation model. The Black-Scholes Model requiresexpected life of the use of a number of assumptions includingoptions used in this calculation is the period the options are expected to be outstanding and has been determined based on the simplified method in accordance with guidance provided by SEC Staff Accounting Bulletin 07 (ASC 718-10-S99). Expected stock price volatility is based on the historical volatility of the stock price,of peer entities whose stock prices were publicly available for a period approximating the weighted averageexpected life. We use the historical volatility of peer entities due to the lack of sufficient historical data or our stock prices. The risk-free interest rate andis based on the vesting period ofimplied yield available on US Treasury zero-coupon issues approximating the Share-based Awardexpected life. We believe that these assumptions are "critical accounting estimates" because significant changes in determining the fair value of Share-based Awards. Although we believe our assumptions used to calculate share-based compensation expense are reasonable, these assumptions can involve complex judgments about future events, which are open to interpretation and inherent uncertainty. In addition, significant changes to our assumptionsdevelop the estimates could significantly impact the amount of expense recorded in a given period.
Income Taxes
. As part of the process of preparing our consolidated financial statements, we are required to estimate income taxes in each of the jurisdictions in which we operate.The determination of our provision for income taxes requires significant judgment, the use of estimates, and the interpretation and application of complex tax laws. In the ordinary course of our business, there are transactions and calculations for which the ultimate tax determination is uncertain. In spite of our belief that we have appropriate support for all the positions taken on our tax returns, we acknowledge that certain positions may be successfully challenged by the taxing authorities. We determine the tax benefits more likely than not to be recognized with respect to uncertain tax positions. Although we believe our recorded tax assets and liabilities are reasonable, tax laws and regulations are subject to interpretation and inherent uncertainty; therefore, our assessments can involve both a series of complex judgments about future events and rely on estimates and assumptions. Although we believe these estimates and assumptions are reasonable, the final determination could be materially different than that which is reflected in our provision for income taxes and recorded tax assets and liabilities.
New Accounting Pronouncements
In December 2011,July, 2013, the FASB issued Accounting Standards Update, (“ASU”) 2011-11, Balance Sheet - Offsetting. Thisor ASU, No. 2013-11,Income Taxes (Topic 740): Presentation of an Unrecognized Tax Benefit when a Net Operating Loss Carryforward, a Similar Tax Loss, or a Tax Credit Carryforward Exists (a consensus of the FASB Emerging Issues Task Force),or ASU 2013-11. The amendments in ASU 2013-11 provide guidance requires disclosures about offsetting and related arrangements for recognized financial instruments and derivative instruments. The standard is effective for us as of January 1, 2013 and will not materially impact ouron the financial statement disclosures.
In July 2012, the FASB issued ASU No. 2012-02,Testing Indefinite-Lived Intangible Assets for Impairment,or ASU 2012-02. ASU 2012-02 gives entities an option to first assess qualitative factors to determine whether the existence of events and circumstances indicates that it is more likely than not that the long-lived intangible assets are impaired. If, based on its qualitative assessment, an entity concludes that it is more likely than not that the fair value of an indefinite lived intangible asset is less than its carrying amount, quantitative impairment testing is required. However, if an entity concludes otherwise, quantitative impairment testing is not required. ASU 2012-02 is effective for annual and interim impairment tests performed for fiscal years beginning after September 15, 2012, with early adoption is permitted. The adoptionASU 2012-02 is not expected to have a material impact on the Company’s results of operations,our financial position or cash flows.
In MayDecember 2011, the FASB issued ASU 2011-04, Fair Value Measurement: AmendmentsNo. 2011-11,Balance Sheet (Topic 210): Disclosures about Offsetting Assets and Liabilities, or ASU 2011-11. ASU 2011-11 enhances current disclosures about financial instruments and derivative instruments that are either offset on the statement of financial position or subject to Achieve Common Fair Value Measurementan enforceable master netting arrangement or similar agreement, irrespective of whether they are offset on the statement of financial position. Entities are required to provide both net and Disclosure Requirementsgross information for these assets and liabilities in U.S.order to facilitate comparability between financial statements prepared in conformity with GAAP and IFRSs. Thisfinancial statements prepared on the basis of International Financial Reporting Standards. ASU represents the converged guidance of the FASB and the IASB (the “Boards”) on fair value measurement, and results in common requirements2011-11 is effective for measuring fair value and for disclosing information about fair value measurements, including a consistent meaning of the term “fair value.” These amendments change some of the terminology used to describe many of the existing requirements in U.S. GAAP for measuring fair value and for disclosing information about fair value measurements. The amendments should be applied prospectively, and they are effective during interim and annual reporting periods beginning on or after December 15, 2011. Early application by public entities is not permitted. The adoptionJanuary 1, 2013, and interim periods within those years. ASU 2011-11 is not expected to have a material impact on the Company’s results of operations,our financial position or cash flows.
We do not believe there would behave been a material effect on the accompanying consolidated financial statements had any other recently issued, but not yet effective, accounting standards been adopted in the current period.
Off-Balance Sheet Arrangements
As of December 31, 2013, 2012 and 2011 we had no material off-balance sheet arrangements.
In the ordinary course of business, we enter into agreements with third parties that include indemnification provisions, which, in our judgment, are normal and customary for companies in our industry sector. These agreements are typically with business partners, clinical sites, and suppliers. Pursuant to these agreements, we generally agree to indemnify, hold harmless, and reimburse indemnified parties for losses suffered or incurred by the indemnified parties with respect to our productdrug candidates, use of such productdrug candidates, or other actions taken or omitted by us. The maximum potential amount of future payments we could be required to make under these indemnification provisions is unlimited. We have not incurred material costs to defend lawsuits or settle claims related to these indemnification provisions. As a result, the estimated fair value of liabilities relating to these provisions is minimal. Accordingly, we have no liabilities recorded for these provisions as of December 31, 2013, 2012 or 2011.
In the normal course of business, we may be confronted with issues or events that may result in a contingent liability. These generally relate to lawsuits, claims, environmental actions or the actions of various regulatory agencies. We consult with counsel and other appropriate experts to assess the claim. If, in our opinion, we have incurred a probable loss as set forth by accounting principles generally accepted in the U.S.,United States, an estimate is made of the loss and the appropriate accounting entries are reflected in our financial statements.
Effects of Inflation
For each of the periods for which financial information is presented, the Company’sfiscal years ended December 31, 2013, 2012, and 2011, our business and operations have not been materially affected by inflation.
| 59 |
Contractual Obligations
A summary of contractual cash obligations as of December 31, 2013 is as follows:
| Payments Due By Period | ||||||||||||||
| (in thousands) | ||||||||||||||
| Total | Less than 1 Year | 1-3 Years | 4-5 Years | |||||||||||
| Operating Lease Obligations | 1,766 | 316 | 1,147 | 303 | ||||||||||
Seasonality
The specialty pharmaceutical industry component of women’s health segmentis not subject to seasonal sales fluctuation.
| Item 7A. | Quantitative and Qualitative Disclosures about Market Risk |
We had cash and cash equivalents totaling $54 million as of December 31, 2013.We hold our cash in money market funds and the health care market. Weprimary objective of our investment policy is to preserve principal and maintain proper liquidity to meet operating needs.Our investment policy specifies credit quality standards for our investments and limits the amount of credit exposure to any single issue, issuer or type of investment.Our primary exposure to market risk is interest rate sensitivity, which is affected by changes in the general level of U.S. interest rates.To minimize this risk, we intend to sellmaintain a portfolio that may include cash, cash equivalents and investment securities available-for-sale in a variety of products including medical foods, nutritional supplements, prescription productssecurities which may include money market funds, government and ancillary productsnon-government debt securities and commercial paper, all with various maturity dates. Due to the low risk profile of our investments, an immediate 100 basis point change in interest rates would not have a material effect on the fair market value of our portfolio.
We do not hold or issue derivatives, derivative commodity instruments or other financial instruments for speculative trading purposes. Further, we do not believe our cash equivalents and investment securities have significant risk of default or illiquidity. We made this determination based on discussions with our investment advisors and a review of our holdings. While we believe our cash equivalents and investment securities do not contain excessive risk, we cannot provide absolute assurance that address women’s health needs. We plan to sell our products online and through physician’s offices and pharmacies. We anticipate the demand for our products to grow as we add territories, sales personnel and products. Our plan is to offer a complete line of products in the women’s healthfuture our investments will not be subject to adverse changes in market and we believe as we expand our product line and sales territories that our revenues will increase. Our sales team markets our products by detailing physicians who specialize in women’s health about the features and benefitsvalue. All of our products. We believe our sales and marketing strategy will enable usinvestments are held at fair value.
| Item 8. | Financial Statements and Supplementary Data |
Reference is made to increase demand for our products thereby allowing our revenues to grow in upcoming quarters.
| Changes in and Disagreements with Accountants on Accounting and Financial Disclosure |
We maintain disclosure controls and procedures designed to Rule 13a-15(b)ensure that information required to be disclosed in reports filed under the Securities Exchange Act of 1934, (“Exchange Act”),as amended, is recorded, processed, summarized and reported within the Company’sspecified time periods, and that such information is accumulated and communicated to management, including our Chief Executive Officer and Chief Financial Officer, as appropriate, to allow timely decisions regarding required disclosure.
Our management, with the participation of our Chief Executive Officer and our Chief Financial Officer, evaluated the effectiveness of the Company’sour disclosure controls and procedures (as defined under Rule 13a-15(e) underin the Securities Exchange Act)Act of 1934 Rules 13a-15(f) or 15d-15(f)) as of the end of the period covered by this report.
Management’s Annual Report on Internal Control Overover Financial Reporting
Our management is responsible for establishing and maintaining adequate internal control over financial reporting, as defined inunder Exchange Act Rules 13a-15(f) and 15d-15(f) under the Exchange Act. The Company’s. Our internal control over financial reporting is a process designed to provide reasonable assurance regarding the reliability of financial reporting and the preparation of financial statements for external purposes in accordance with accounting principles generally accepted in the United States of America (“GAAP”America. Internal control over financial reporting includes those policies and procedures that:
The management assessed the effectiveness of our internal control over financial reporting as of December 31, 2013. In making this assessment, the management used the criteria set forth by the Committee of Sponsoring Organizations of the Treadway Commission (COSO) in Internal Control—Integrated Framework. The Management’s assessment included an evaluation of the design of the Company’s internal control over financial reporting and testing of the operational effectiveness of its internal control over financial reporting. Based on the management’s assessment, we believe that our internal controls over financial reporting were effective as of December 31, 2013.
Rosenberg Rich Baker Berman & Company, an independent registered public accounting firm , has audited the consolidated financial statements included in this Annual Report; and, as part of its audit, has issued an attestation report, included herein, on the effectiveness of our internal control over financial reporting.
Changes in Internal Control over Financial Reporting
There was no change in our internal control over financial reporting during our most recent fiscal quarter that has materially affected, or is reasonably likely to materially affect, our internal control over financial reporting.
Inherent Limitations on Effectiveness of Controls
Our management, including our Chief Executive Officer and Chief Financial Officer, does not expect that our disclosure controls and procedures or our internal controls will prevent all error and all fraud. A control system, no matter how well conceived and operated, can provide only reasonable, not absolute, assurance that the objectives of the control system are met. Further, the design of a control system must reflect the fact that there are resource constraints, and the benefit of controls must be considered relative to their costs. Because of the inherent limitations in all control systems, no evaluation of controls can provide absolute assurance that all control issues, misstatements, errors, and instances of fraud, if any, within our company have been or will be prevented or detected. Further, internal controls may become inadequate as a result of changes in conditions, or through the deterioration of the degree of compliance with policies or procedures.
| Item 9B. | Other Information |
Not applicable.
| Item 10. | Directors, Executive Officers, and Corporate Governance |
The information required by this Item relating to our directors and corporate governance is incorporated herein by reference to the definitive Proxy Statement to be filed pursuant to Regulation 14A of the Exchange Act for our 2014 Annual Meeting of Stockholders.The information required by this Item relating to our executive officers is included under the caption “Executive Officers” within Item 1.
| Item 11. | Executive Compensation |
The information required by this Item is incorporated herein by reference to the definitive Proxy Statement to be filed pursuant to Regulation 14A of the Exchange Act for our 2014 Annual Meeting of Stockholders.
| Item 12. | Security Ownership of Certain Beneficial Owners and Management and Related Stockholder Matters |
The information required by this Item is incorporated by reference to the definitive Proxy Statement to be filed pursuant to Regulations 14A of the Exchange Act for our 2014 Annual Meeting of Stockholders.
| Item 13. | Certain Relationships and Related Transactions, and Director Independence |
The information required by this Item is incorporated herein by reference to the definitive Proxy Statements to be filed pursuant to Regulation 14A of the Exchange Act for our 2014 Annual Meeting of Stockholders.
| Item 14. | Principal Accountant Fees and Services |
The information required by this Item is incorporated herein by reference to the definitive Proxy Statement to be filed pursuant to Regular 14A of the Exchange Act for our 2014 Annual Meeting of Stockholders.
| Item 15. | Exhibits and Financial Statement Schedules |
| (a) | Financial Statements and Financial Statements Schedules |
| (1) | Financial Statements are listed in the Index to Consolidated Financial Statements on page F-1 of this Annual Report. |
| (2) | No financial statement schedules are included because such schedules are not applicable, are not required, or because required information is included in the consolidated financial statements or notes thereto. |
| (b) | Exhibits |
Exhibit | Date | Description |
| 2.1 | July 6, 2009 | Agreement and Plan of Reorganization among Croff Enterprises, Inc., AMHN Acquisition Corp., America’s Minority Health Network, Inc., and the Major Shareholders(1) |
| 2.2 | June 11, 2010 | Agreement and Plan of Reorganization among AMHN, Inc., SHN Acquisition Corp., Spectrum Health Network, Inc., and the Sole Shareholder of Spectrum Health Network, Inc.(2) |
| 2.3 | October 25, 2007 | Croff Enterprises, Inc. Plan of Corporate Division and Reorganization(3) |
| 2.4 | July 18, 2011 | Agreement and Plan of Merger among VitaMedMD, LLC, AMHN, Inc., and VitaMed Acquisition, LLC(4) |
| 3.1 | September 15, 2009 | Articles of Amendment to Articles of Incorporation (to change name to AMHN, Inc.)(5) |
| 3.2 | July 27, 2009 | Certificate of Merger of AMHN Acquisition Corp., with and into America’s Minority Health Network, Inc.(6) |
| 3.3 | December 27, 2007 | Articles of Amendment to Articles of Incorporation of Croff Enterprises, Inc. (to increase authorized common shares from 20,000,000 to 50,000,000)(3) |
| 3.4 | July 20, 2010 | Articles of Conversion of AMHN, Inc. filed in the State of Nevada(7) |
| 3.5 | July 20, 2010 | Articles of Incorporation of AMHN, Inc. filed in the State of Nevada(7) |
| 3.6 | August 29, 2011 | Certificate of Amendment and Restatement of Articles of Incorporation of AMHN, Inc. (to change name and increase authorized shares)(8) |
| 3.7 | n/a | Bylaws of AMHN, Inc.(9) |
| 4.1 | September 26, 2012 | Form of Securities Purchase Agreement (10) |
| 4.2 | n/a | Form of Certificate of Common Stock(11) |
| 10.1 | November 9, 2010 | Demand Promissory Note to Philip M. Cohen for $210,000(12) |
| 10.2 | April 18, 2011 | Convertible Promissory Note to First Conquest Investment Group, L.L.C. for $105,000(12) |
| 10.3 | April 18, 2011 | Convertible Promissory Note to Energy Capital, LLC for $105,000(12) |
| 10.4 | May 7, 2011 | Sales Representative Agreement between AMHN, Inc. and Mann Equity, LLC(12) |
| 10.5 | July 9, 2009 | Lease Agreement between Liberty Property Limited Partnership and VitaMedMD, LLC(13) |
| 10.6 | September 8, 2011 | Stock Purchase Agreement between AMHN, Inc. and Pernix Therapeutics, LLC(14) |
| 10.7 | September 8, 2011 | Lock-Up Agreement between AMHN, Inc. and Pernix Therapeutics, LLC(14) |
| 10.8 | n/a | Form of Common Stock Purchase Warrant (13) |
| 10.9* | n/a | Form of Non-Qualified Stock Option Agreement (13) |
| 10.10 | September 2011 | Form of Convertible Promissory Note(15) |
| 10.11 | September 20, 2011 | Financing Agreement between Lang Naturals, Inc. and VitaMedMD, LLC(16) |
| 10.12 | October 18, 2011 | Debt Conversion Agreement between the Company and Energy Capital, LLC(17) |
| 10.13 | October 18, 2011 | Debt Conversion Agreement between the Company and First Conquest Investment Group, LLC(17) |
| 10.14 | October 23, 2011 | Consulting Agreement among VitaMedMD, LLC, the Company, and Lang Naturals, Inc.(17) |
| 10.15 | October 23, 2011 | Common Stock Purchase Warrant to Lang Naturals, Inc.(17) |
| 10.16 | October 23, 2011 | Lock-Up Agreement between the Company and Lang Naturals, Inc. (17) |
| 10.17 | November 3, 2011 | Software License Agreement between vitaMedMD, LLC and Pernix Therapeutics, LLC(18) |
Exhibit | Date | Description |
| 10.18 | November 2011 | Form of Promissory Note (19) |
| 10.19 | February 24, 2012 | Note Purchase Agreement among the Company, Plato & Associates, Inc., and Steven G. Johnson(20) |
| 10.20 | February 24, 2012 | Form of Secured Promissory Note(20) |
| 10.21 | February 24, 2012 | Security Agreement among the Company, Plato & Associates, Inc., and Steven G. Johnson(20) |
| 10.22 | February 24, 2012 | Form of Common Stock Purchase Warrant(20) |
| 10.26 | April 17, 2012 | Master Services Agreement between the Company and Sancilio and Company, Inc.(21) |
| 10.27** | May 17, 2012 | Consulting Agreement between the Company and Sancilio and Company, Inc. (21) |
| 10.28* | November 8, 2012 | Form of Employment Agreement(22) |
| 10.29 | January 31, 2013 | Multiple Advance Revolving Credit Note, issued to Plato & Associates, LLC(23) |
| 10.30 | January 31, 2013 | Common Stock Purchase Warrant, issued to Plato & Associates, LLC(23) |
| 10.31* | May 8, 2013 | Agreement to Forfeit Non-Qualified Stock Options between the Company and Robert G. Finizio(24) |
| 10.32 | May 7, 2013 | Consulting Agreement between the Company and Sancilio and Company, Inc. (24) |
| 10.33 | May 16, 2013 | Lease between the Company and 6800 Broken Sound LLC(25) |
| 10.34* | n/a | Amended and Restated 2012 Stock Incentive Plan(26) |
| 10.35* | n/a | 2009 Long Term Incentive Compensation Plan, as amended(27) |
| 21.00 | December 31, 2012 | Subsidiaries of the Company(21) |
| 23.1 | March 5, 2014 | Consent of Rosenberg Rich Baker Berman & Company |
| 31.1 | March 5, 2014 | Certification of Chief Executive Officer pursuant to Rule 13a-14(a) and Rule 15d-14(a), promulgated under the Securities Exchange Act of 1934, as amended |
| 31.2 | March 5, 2014 | Certification of Chief Financial Officer pursuant to Rule 13a-14(a) and Rule 15d-14(a), promulgated under the Securities Exchange Act of 1934, as amended |
| 32.1 | March 5, 2014 | Certification pursuant to 18 U.S.C. Section 1350, as adopted pursuant to Section 906 of the Sarbanes-Oxley Act of 2002 |
| 32.2 | March 5, 2014 | Certification pursuant to 18 U.S.C. Section 1350, as adopted pursuant to Section 906 of the Sarbanes-Oxley Act of 2002 |
| 101.INS † | n/a | XBRL Instance Document |
| 101.SCH † | n/a | XBRL Taxonomy Extension Schema Document |
| 101.CAL † | n/a | XBRL Taxonomy Extension Calculation Linkbase Document |
| 101.DEF † | n/a | XBRL Taxonomy Extension Definition Linkbase Instance Document |
| 101.LAB † | n/a | XBRL Taxonomy Extension Label Linkbase Instance Document |
| 101.PRE † | n/a | XBRL Taxonomy Extension Presentation Linkbase Instance Document |
| * | Indicates a contract with management or compensatory plan or arrangement. |
| ** | Certain information in this exhibit has been omitted and filed separately with the Securities and Exchange Commission. Confidential treatment has been requested with respect to the omitted portions. |
| † | Pursuant to Rule 406T of Regulation S-T, these interactive data files are deemed not filed or part of a registration statement or prospectus for purposes of Sections 11 or 12 of the Securities Act of 1933, as amended, are deemed not filed for purposes of Section 18 of the Securities Exchange Act of 1934, as amended, and otherwise are not subject to liability under those sections. |
| (1) | Filed as an exhibit to Form 8-K filed with the Commission on July 10, 2009 and incorporated herein by reference. |
| (2) | Filed as an exhibit to Form 8-K filed with the Commission on June 14, 2010 and incorporated herein by reference. |
| (3) | Filed as an exhibit to Form 10-K for the year ended December 31, 2007 filed with the Commission on May 1, 2008 and incorporated herein by reference. |
| (4) | Filed as an exhibit to Form 8-K filed with the Commission on July 21, 2011 and incorporated herein by reference. |
| (5) | Filed as an exhibit to Form 10-Q for quarter ended September 30, 2009 filed with the Commission on November 16, 2009 and incorporated herein by reference. |
| (6) | Filed as an exhibit to Form 10-K for the year ended December 31, 2009 filed with the Commission on March 17, 2010 and incorporated herein by reference. |
| (7) | Filed as an exhibit to Form 10-Q for quarter ended June 30, 2010 filed with the Commission on August 3, 2010 and incorporated herein by reference. |
| (8) | Filed as an exhibit to Definitive 14C Information Statement filed with the Commission on September 12, 2011 and incorporated herein by reference. |
| (9) | Filed as an exhibit to Definitive 14C Information Statement filed with the Commission on June 29, 2010 and incorporated herein by reference. |
| (10) | Filed as an exhibit to Form 8-K filed with the Commission on October 2, 2012 and incorporated herein by reference. |
| (11) | Filed as an exhibit to Form S-3 filed with the Commission on January 25, 2013 and incorporated hereby by reference. |
| (12) | Filed as an exhibit to Form 10-Q for quarter ended March 31, 2011 filed with the Commission on May 19, 2011 and incorporated herein by reference. |
| (13) | Filed as an exhibit to Form 8-K filed with the Commission on October 11, 2011 and incorporated herein by reference. |
| (14) | Filed as an exhibit to Form 8-K filed with the Commission on September 14, 2011 and incorporated herein by reference. |
| (15) | Filed as an exhibit to Form 8-K/A filed with the Commission on November 22, 2011 and incorporated herein by reference. |
| (16) | Filed as an exhibit to Form 8-K/A filed with the Commission on February 2, 2012 and incorporated herein by reference. |
| (17) | Filed as an exhibit to Form 8-K filed with the Commission on October 24, 2011 and incorporated herein by reference. |
| (18) | Filed as an exhibit to Form 10-Q for quarter ended September 30, 2011 filed with the Commission on November 7, 2011 and incorporated herein by reference. |
| (19) | Filed as an exhibit to Form 8-K filed with the Commission on November 23, 2011 and incorporated herein by reference. |
| (20) | Filed as an exhibit to Form 8-K filed with the Commission on February 24, 2012 and incorporated herein by reference. |
| (21) | Filed as an exhibit to Form 10-Q for quarter ended June 30, 2012 filed with the Commission on August 9, 2012 and incorporated herein by reference. |
| (22) | Filed as an exhibit to Form 10-Q for quarter ended September 30, 2012 filed with the Commission on November 13, 2012 and incorporated herein by reference. |
| (23) | Filed as an exhibit to Form 8-K filed with the Commission on February 6, 2013 and incorporated herein by reference. |
| (24) | Filed as an exhibit to Form 10-Q for quarter ended March 31, 2013 filed with the Commission on May 10, 2013 and incorporated herein by reference. |
| (25) | Filed as an exhibit to Form 10-Q for quarter ended June 30, 2013 filed with the Commission on August 7, 2013 and incorporated herein by reference. |
| (26) | Filed as an exhibit to Form 8-K filed with the Commission on August 22, 2013 and incorporated herein by reference. |
| (27) | Filed as an exhibit to Registration Statement on Form S-8 filed with the Commission on October 15, 2013 and incorporated herein by reference. |
SIGNATURES
Pursuant to the requirements of Section 13 or 15(d) of the Securities Exchange Act of 1934, the registrant has duly caused this report to be signed on its behalf by the undersigned, thereunto duly authorized.
| THERAPEUTICSMD, INC. | ||
| /s/ Robert G. Finizio | ||
| Robert G. Finizio Chief Executive Officer | ||
Date: March 5, 2014
Pursuant to the requirements of the Securities Exchange Act of 1934, this report has been signed below by the following persons on behalf of the registrant and in the capacities and on the date indicated.
| Signature | Capacity | Date |
| /s/ Robert G. Finizio | Chief Executive Officer, Director (Principal Executive Officer) | March 5, 2014 |
| Robert G. Finizio | ||
| /s/ John C.K. Milligan, IV | President, Secretary, Director | March 5, 2014 |
| John C.K. Milligan, IV | ||
| /s/ Daniel A. Cartwright | Chief Financial Officer, Treasurer (Principal Financial and Accounting Officer) | March 5, 2014 |
| Daniel A. Cartwright | ||
| /s/ Tommy G. Thompson | Chairman | March 5, 2014 |
| Tommy G. Thompson | ||
| /s/ Brian Bernick | Director | March 5, 2014 |
| Brian Bernick | ||
| /s/ Cooper C. Collins | Director | March 5, 2014 |
| Cooper C. Collins | ||
| /s/ Robert V. LaPenta, Jr. | Director | March 5, 2014 |
| Robert V. LaPenta, Jr. | ||
| /s/ Nicholas Segal | Director | March 5, 2014 |
| Nicholas Segal | ||
| /s/ Jules Musing | Director | March 5, 2014 |
| Jules Musing | ||
| /s/ Randall Stanicky | Director | March 5, 2014 |
| Randall Stanicky |
INDEX TO FINANCIAL STATEMENTS
REPORT OF INDEPENDENT REGISTERED PUBLIC ACCOUNTING FIRM
To the Board of Directors and
Stockholders of TherapeuticsMD, Inc.
We have audited the accompanying consolidated balance sheets of TherapeuticsMD, Inc. as of December 31, 2013 and 2012, and the related consolidated statements of operations, stockholders’ equity (deficit), and cash flows for each of the years in the three year period ended December 31, 2013. TherapeuticsMD Inc.’s management is responsible for these consolidated financial statements. Our responsibility is to express an opinion on these consolidated financial statements based on our audits.
We conducted our audits in accordance with the standards of the Public Company Accounting Oversight Board (United States). TheThose standards require that we plan and perform the audit to obtain reasonable assurance about whether the financial statements are free of material misstatement. An audit includes examining, on a test basis, evidence supporting the amounts and disclosures in the financial statements. An audit also includes assessing the accounting principles used and significant estimates made by management, as well as evaluating the overall financial statement presentation. We believe that our audits provide a reasonable basis for our opinion.
In our opinion, the consolidated financial statements referred to above present fairly, in all material respects, the financial position of TherapeuticsMD, Inc. as of December 31, 2013 and 2012, and the results of its operations and its cash flows for each of the years in the three year period ended December 31, 2013 in conformity with accounting principles generally accepted in the United States of America.
We also have audited, in accordance with the standards of the Public Company Accounting Oversight Board (United States), TherapeuticsMD Inc.’s internal control over financial reporting as of December 31, 2013, based on criteria established in Internal Control—Integrated Framework issued by the Committee of Sponsoring Organizations of the Treadway Commission (COSO), and our report dated March 5, 2014 expressed an unqualified opinion on the effectiveness of TherapeuticsMD, Inc.’s internal control over financial reporting.
/s/ Rosenberg Rich Baker Berman & Company
Somerset, New Jersey
March 5, 2014
REPORT OF INDEPENDENT REGISTERED PUBLIC ACCOUNTING FIRM
To the Board of Directors and
Stockholders of TherapeuticsMD, Inc.
We have audited TherapeuticsMD, Inc.’s internal control over financial reporting as of December 31, 2013, based on criteria established in Internal Control—Integrated Framework issued by the Committee of Sponsoring Organizations of the Treadway Commission (COSO). TherapeuticsMD Inc.’s management is responsible for maintaining effective internal control over financial reporting and for its assessment of the effectiveness of internal control over financial reporting included in the accompanying Management’s Annual Report on Internal Control over Financial Reporting. Our responsibility is to express an opinion on the Company’s internal control over financial reporting based on our audit.
We conducted our audit in accordance with the standards of the Public Company Accounting Oversight Board (United States). Those standards require that we plan and perform the audit to obtain reasonable assurance about whether effective internal control over financial reporting was maintained in all material respects. Our audit of internal control over financial reporting included obtaining an understanding of internal control over financial reporting, assessing the risk that a material weakness exists, and testing and evaluating the design and operating effectiveness of internal control based on the assessed risk. Our audit also included performing such other procedures as we considered necessary in the circumstances. We believe that our audit provides a reasonable basis for our opinion.
A company’s internal control over financial reporting is a process designed to provide reasonable assurance regarding the reliability of financial reporting and the preparation of financial statements for external purposes in accordance with generally accepted accounting principles. A company’s internal control over financial reporting includes those policies and procedures that:
Because of its inherent limitations, internal control over financial reporting may not prevent or detect misstatements. Also, projections of any evaluation of effectiveness to future periods are subject to the risk that controls may become inadequate because of changes in conditions, or that the degree of compliance with the policies or procedures may deteriorate.
In connection with the preparation of our annual financial statements, we have assessed the effectiveness ofopinion, TherapeuticsMD, Inc. maintained, in all material respects, effective internal control over financial reporting as of December 31, 2011,2013, based on criteria established in Internal Control-IntegratedControl—Integrated Framework issued by the Committee of Sponsoring Organizations of the Treadway Commission or the COSO Framework. Management’s assessment included an evaluation of the design of our internal control over financial reporting and testing of the operational effectiveness of those controls. Based on this evaluation, management has determined that as of December 31, 2011, our internal controls over financial reporting were not effective and there were weaknesses in our internal control over financial reporting as outlined below.
| Name and Principal Position | Year | Salary ($) | Bonus ($) | Stock Awards ($) | Option Awards ($)(1) | Nonequity Incentive Plan Compensation ($) | Non-qualified deferred compensation earnings ($) | All other compensation ($) | Total ($) | ||||||||||||||||||
| Robert G. Finizio | 2011 | 156,000 | -0- | -0- | -0- | -0- | -0- | 15,986 | 171,986 | ||||||||||||||||||
Chief Exec. Officer(2) | 2010 | 140,282 | -0- | -0- | -0- | -0- | -0- | 2,250 | 142,532 | ||||||||||||||||||
| John C.K. Milligan | 2011 | 156,000 | -0- | -0- | -0- | -0- | -0- | 25,329 | 181,329 | ||||||||||||||||||
President/Secretary(3) | 2010 | 144,787 | -0- | -0- | -0- | -0- | -0- | 9,554 | 154,341 | ||||||||||||||||||
| Daniel A. Cartwright | 2011 | 79,615 | -0- | -0- | 46,216 | -0- | -0- | 730 | 126,561 | ||||||||||||||||||
CFO/Treasurer(4) | 2010 | -0- | -0- | -0- | -0- | -0- | -0- | -0- | -0- | ||||||||||||||||||
| Mitchell L. Krassan | 2011 | 110,000 | -0- | -0- | -0- | -0- | -0- | -0- | 110,000 | ||||||||||||||||||
Chief Strategy Officer(5) | 2010 | 15,096 | -0- | -0- | 62,301 | -0- | -0- | -0- | 77,397 | ||||||||||||||||||
| Option Awards | Stock Awards | ||||||||||||||||||||||||||||||||
| Name | Number of Securities Underlying Unexercised Options (#) Exercisable | Number of Securities Underlying Unexercised Options (#) Unexercisable | Equity Incentive Plan Awards: Number of Securities Underlying Unexercised Unearned Options (#) | Option Exercise Price ($) | Option Expiry Date | Number of Shares or Units of Stock That Have Not Vested (#) | Market Value of Shares or Units of Stock That Have Not Vested ($) | Equity Incentive Plan Awards: Number of Unearned Shares, Units or Other Rights That Have Not Vested (#) | Equity Incentive Plan Awards Market or Payout Value of Unearned Shares, Units or Other Rights That Have Not Vested ($) | ||||||||||||||||||||||||
| Robert G. Finizio, CEO | 1,431,987 | (1) | 40,914 | (1) | -0- | $ | 0.10 | 01/01/19 | -0- | -0- | -0- | -0- | |||||||||||||||||||||
| John CK Milligan, IV, Pres./Sec. | 1,995,248 | (1) | 57,007 | (1) | -0- | $ | 0.10 | 01/01/19 | -0- | -0- | -0- | -0- | |||||||||||||||||||||
| Daniel A. Cartwright, CFO/Treas. | -0- | 300,000 | (2) | -0- | $ | 0.38 | 10/21/21 | -0- | -0- | -0- | -0- | ||||||||||||||||||||||
| Mitchell Krassan, Exec. VP | 73,646 | (3) | -0- | -0- | $ | 0.19 | 05/01/20 | -0- | -0- | -0- | -0- | ||||||||||||||||||||||
| 23,015 | (4) | 69,042 | (4) | -0- | $ | 0.19 | 05/10/10 | -0- | -0- | -0- | -0- | ||||||||||||||||||||||
| 265,943 | (5) | 470,512 | (5) | -0- | $ | 0.20 | 09/01/20 | -0- | -0- | -0- | -0- | ||||||||||||||||||||||
| Brian Bernick, Director | 1,391,082 | (1) | 81,828 | (1) | -0- | $ | 0.10 | 01/01/19 | -0- | -0- | -0- | -0- | |||||||||||||||||||||
| Name (a) | Fees earned or paid in cash ($) (b) | Stock awards ($) (c) | Option awards ($) (d) | Non-equity incentive plan compensation ($) (e) | Nonqualified deferred compensation earnings ($) (f) | All other compensation ($) (g) | Total ($) (h) | |||||||||||||||||||||
Robert G. Finizio(1) | -0- | -0- | $ | -0- | -0- | -0- | -0- | $ | -0- | |||||||||||||||||||
John C.K. Milligan IV(2) | -0- | -0- | $ | -0- | -0- | -0- | -0- | $ | -0- | |||||||||||||||||||
Brian Bernick, MD(3) | -0- | -0- | $ | -0- | -0- | -0- | -0- | $ | -0- | |||||||||||||||||||
| Name and Address of Beneficial Owner | Title of Class | Number of Shares Beneficially Owned(1) | Percent of Class | |||||||
| Robert G. Finizio Chairman and Chief Executive Officer | Common Stock | 23,813,493 | (2) | 27.61 | % | |||||
| John C.K. Milligan, IV President, Secretary and Director | Common Stock | 8,660,642 | (3) | 9.97 | % | |||||
| Daniel A. Cartwright Chief Financial Officer, Vice Pres. Finance, Treasurer | Common Stock | 163,632 | (4) | 0.19 | % | |||||
| Mitchell L. Krassan Executive Vice President, Chief Strategy Officer | Common Stock | 677,128 | (5) | 0.79 | % | |||||
| Brian Bernick, M.D. Director | Common Stock | 10,654,049 | (6) | 12.37 | % | |||||
| Samuel A. Greco Director | Common Stock | 400,000 | (7) | 0.47 | % | |||||
| Cooper C. Collins Director | Common Stock | 2,631,579 | (8) | 3.11 | % | |||||
| Robert V. LaPenta, Jr. Director | Common Stock | 5,000 | (9) | 0.01 | % | |||||
| Nicholas Segal Director | Common Stock | 3,948,719 | (10) | 4.66 | % | |||||
| All directors and executive officers as a group (9 persons) | Common Stock | 50,95,242 | (11) | 55.94 | % | |||||
| Steven G. Johnson, Shareholder 804 Tree Haven Ct., Highland Village, TX 75077 | Common Stock | 8,318,283 | (12) | 9.38 | % | |||||
| Robert J. Smith, Shareholder 13650 Fiddlesticks Blvd., #202-324; Ft. Myers, FL 33912 | Common Stock | 8,304,334 | (13) | 9.36 | % | |||||
| Wellington Management Company, LLP 280 Congress St., Boston, MA 02210 | Common Stock | 5,000,000 | (14) | 5.90 | % | |||||
We have also audited, the accompanying balance sheet of TherapeuticsMD, Inc. as of December 31, 2011, and the related statements of operations, stockholders’ equity and cash flows for the year then ended. TherapeuticsMD, Inc’s management is responsible for these financial statements. Our responsibility is to express an opinion on these financial statements based on our audit.
Parks & Company, LLC
Certified Public Accountants & Consultants
1761 W. Hillsboro Boulevard, Suite 326
Deerfield Beach, FL 33442 Phone (954) 719-7569
www.parkscpas.com Fax (954) 719-3704
REPORT OF INDEPENDENT REGISTERED PUBLIC ACCOUNTING FIRM
To the Board of Directors andMembers’of VitamedMD, LLC
We have audited the accompanyingconsolidated balance sheet of VitamedMD, LLC as of December 31, 2010,sheets and the related consolidated statements of operations, changes in members’stockholders’ equity (deficit), and cash flows for the year ended December 31, 2010. VitamedMD, LLC’s management is responsible for theseof TherapeuticsMD, Inc., and our report dated March 5, 2014 expressed an unqualified opinion on those consolidated financial statements. Our responsibility is to express an opinion on these financial statements based on our audit.
We conducted our audit in accordance with the standards of the Public Company Accounting Oversight Board (United States). Those standards require that we plan and perform the audit to obtain reasonable assurance about whether the financial statements are free of material misstatement. The company is not required to have, nor were we engaged to perform, an audit of its internal control over financial reporting. Our audit included consideration of internal control over financial reporting as a basis for designing audit procedures that are appropriate in the circumstances, but not for the purpose of expressing an opinion on the effectiveness of the company’s internal control over financial reporting. Accordingly, we express no such opinion. An audit also includes examining, on a test basis, evidence supporting the amounts and disclosures in the financial statements, assessing the accounting principles used and significant estimates made by management, as well as evaluating the overall financial statement presentation. We believe that our audit provides a reasonable basis for our opinion.
In our opinion, the financial statements referred to above present fairly, in all material respects, the financial position of VitamedMD, LLC as of December 31, 2010, and the results of its operations and its cash flows for the year ended December 31, 2010 in conformity with accounting principles generally accepted in the United States of America.
The accompanying financial statements have been prepared assuming that the Company will continue as a going concern. As discussed in Note C to the financial statements, the Company has not yet established profitable operations and has incurred significant losses since inception. These factors raise substantial doubt about the Company’s ability to continue as a going concern. Management’s plans regarding these matters are also described in Note C. The accompanying financial statements do not include any adjustments that might result from the outcome of this uncertainty.
As discussed in Note N, the Company restated its 2010 financial statements to correct errors related to the valuation of compensation and consultant expense using the Black-Scholes option-pricing model.
Parks/s/ Rosenberg Rich Baker Berman & Company LLC
Deerfield Beach, FloridaSomerset, New Jersey
February 28, 2012March 5, 2014
THERAPEUTICSMD, INC. AND SUBSIDIARY
| December 31, | ||||||||
| 2011 | 2010 | |||||||
| ASSETS | (Restated) | |||||||
| Current Assets: | ||||||||
| Cash | $ | 126,421 | $ | 422,939 | ||||
| Accounts receivable, net of allowance for doubtful accounts of $1,500 and $0, respectively | 26,720 | 11,812 | ||||||
| Inventory | 588,073 | 618,069 | ||||||
| Other current assets | 496,060 | 6,292 | ||||||
| Total current assets | 1,237,274 | 1,059,112 | ||||||
| Fixed Assets: | ||||||||
| Property and equipment, net of accumulated depreciation of $81,500 and $26,655, respectively | 70,113 | 96,192 | ||||||
| Other Assets: | ||||||||
| Security deposit | 31,949 | 31,949 | ||||||
| Patent costs | 18,870 | 10,000 | ||||||
| Other assets | 80,515 | - | ||||||
| 131,334 | 41,949 | |||||||
| Total assets | $ | 1,438,721 | $ | 1,197,253 | ||||
| LIABILITIES AND STOCKHOLDERS' EQUITY | ||||||||
| Current Liabilities: | ||||||||
| Notes payable | $ | 2,150,000 | $ | - | ||||
| Accounts payable | 306,511 | 117,636 | ||||||
| Notes payable, related parties | 200,000 | - | ||||||
| Accrued interest | 28,321 | - | ||||||
| Other current liabilities | 465,747 | 115,206 | ||||||
| Total current liabilities | 3,150,579 | 232,842 | ||||||
| Commitments and Contingencies | ||||||||
| Stockholders’ Equity: | ||||||||
| Preferred stock - par value $0.001; 10,000,000 shares authorized; no shares issued and outstanding | - | - | ||||||
| Common stock - par value $0.001; 250,000,000 shares authorized; 82,978,804 and 55,487,321 issued and outstanding, respectively | 82,979 | 55,487 | ||||||
| Additional paid in capital | 15,198,241 | 4,988,637 | ||||||
| Accumulated deficit | (16,993,078 | ) | (4,079,713 | ) | ||||
| Total stockholders' equity (deficit) | (1,711,858 | ) | 964,411 | |||||
| Total liabilities and stockholders' equity | $ | 1,438,721 | $ | 1,197,253 | ||||
| December 31, | ||||||||
| 2013 | 2012 | |||||||
| ASSETS | ||||||||
| Current Assets: | ||||||||
| Cash | $ | 54,191,260 | $ | 1,553,474 | ||||
| Accounts receivable, net of allowance for doubtful accounts of $26,555 and $42,048, respectively | 1,690,753 | 714,425 | ||||||
| Inventory | 1,043,618 | 1,615,210 | ||||||
| Other current assets | 2,477,715 | 751,938 | ||||||
| Total current assets | 59,403,346 | 4,635,047 | ||||||
| Fixed assets, net | 61,318 | 65,673 | ||||||
| Other Assets: | ||||||||
| Prepaid expense | 1,750,455 | 953,655 | ||||||
| Intangible assets | 665,588 | 239,555 | ||||||
| Security deposit | 135,686 | 31,949 | ||||||
| Total other assets | 2,551,729 | 1,225,159 | ||||||
| Total assets | $ | 62,016,393 | $ | 5,925,879 | ||||
| LIABILITIES AND STOCKHOLDERS’ EQUITY | ||||||||
| Current Liabilities: | ||||||||
| Accounts payable | $ | 2,114,217 | $ | 1,641,366 | ||||
| Deferred revenue | 1,602,580 | 1,144,752 | ||||||
| Other current liabilities | 3,601,189 | 833,654 | ||||||
| Total current liabilities | 7,317,986 | 3,619,772 | ||||||
| Long-Term Liabilities: | ||||||||
| Notes payable, net of debt discount of $0 and $1,102,680, respectively | — | 3,589,167 | ||||||
| Accrued interest | — | 150,068 | ||||||
| Total long-term liabilities | — | 3,739,235 | ||||||
| Total liabilities | 7,317,986 | 7,359,007 | ||||||
| Commitments and Contingencies | ||||||||
| Stockholders’ Equity: | ||||||||
| Preferred stock - par value $0.001; 10,000,000 shares authorized; no shares issued and outstanding | — | — | ||||||
| Common stock - par value $0.001; 250,000,000 shares authorized; 144,976,757 and 99,784,982 issued and outstanding, respectively | 144,977 | 99,785 | ||||||
| Additional paid in capital | 135,086,056 | 50,580,400 | ||||||
| Accumulated deficit | (80,532,626 | ) | (52,113,313 | ) | ||||
| Total stockholders’ equity | 54,698,407 | (1,433,128 | ) | |||||
| Total liabilities and stockholders’ equity | $ | 62,016,393 | $ | 5,925,879 | ||||
The accompanying footnotes are an integral part of these consolidated financial statements.
THERAPEUTICSMD, INCINC. AND SUBSIDIARY
| Year Ended December 31, | ||||||||
| 2011 | 2010 | |||||||
| (Restated) | ||||||||
| Revenues, net | $ | 2,088,177 | $ | 1,241,921 | ||||
| Cost of goods sold | 947,112 | 556,390 | ||||||
| Gross profit | 1,141,065 | 685,531 | ||||||
| Operating expenses: | ||||||||
| Sales, general, and administration | 6,406,197 | 3,464,810 | ||||||
| Research and development | 107,241 | 65,402 | ||||||
| Depreciation and amortization | 54,845 | 22,783 | ||||||
| Total operating expense | 6,568,283 | 3,552,995 | ||||||
| Operating loss | (5,427,218 | ) | (2,867,464 | ) | ||||
| Other income and (expense) | ||||||||
| Settlement of debt | (7,390,000 | ) | - | |||||
| Interest expense | (64,380 | ) | - | |||||
| Loan guaranty costs | (38,159 | ) | - | |||||
| Other income | 6,392 | - | ||||||
| Total other income (expense) | (7,486,147 | ) | - | |||||
| Loss before taxes | (12,913,365 | ) | (2,867,464 | ) | ||||
| Provision for income taxes | - | - | ||||||
| Net loss | $ | (12,913,365 | ) | $ | (2,867,464 | ) | ||
| Loss per share, basic and diluted: | ||||||||
| Net loss per share, basic and diluted | $ | (0.21 | ) | $ | (0.07 | ) | ||
| Weighted average number of common shares outstanding | 62,516,461 | 38,289,463 | ||||||
| Year Ended December 31, | ||||||||||||
| 2013 | 2012 | 2011 | ||||||||||
| Revenues, net | $ | 8,775,598 | $ | 3,818,013 | $ | 2,088,177 | ||||||
| Cost of goods sold | 1,959,597 | 1,348,113 | 947,112 | |||||||||
| Gross profit | 6,816,001 | 2,469,900 | 1,141,065 | |||||||||
| Operating expenses: | ||||||||||||
| Sales, general, and administrative | 19,014,837 | 14,069,701 | 6,406,197 | |||||||||
| Research and development | 13,551,263 | 4,492,362 | 107,241 | |||||||||
| Depreciation and amortization | 58,145 | 56,260 | 54,845 | |||||||||
| Total operating expense | 32,624,245 | 18,618,323 | 6,568,283 | |||||||||
| Operating loss | (25,808,244 | ) | (16,148,423 | ) | (5,427,218 | ) | ||||||
| Other income and (expense) | ||||||||||||
| Miscellaneous income | 34,544 | 3,001 | 6,392 | |||||||||
| Interest income | 27,234 | — | — | |||||||||
| Financing costs | (1,503,922 | ) | — | — | ||||||||
| Interest expense | (1,165,981 | ) | (1,905,409 | ) | (64,380 | ) | ||||||
| Loan guaranty costs | (2,944 | ) | (45,036 | ) | (38,159 | ) | ||||||
| Loss on extinguishment of debt | — | (10,307,864 | ) | (7,390,000 | ) | |||||||
| Beneficial conversion feature | — | (6,716,504 | ) | — | ||||||||
| Total other income (expense) | (2,611,069 | ) | (18,971,812 | ) | (7,486,147 | ) | ||||||
| Loss before taxes | (28,419,313 | ) | (35,120,235 | ) | (12,913,365 | ) | ||||||
| Provision for income taxes | — | — | — | |||||||||
| Net loss | $ | (28,419,313 | ) | $ | (35,120,235 | ) | $ | (12,913,365 | ) | |||
| Net loss per share, basic and diluted | $ | (0.22 | ) | $ | (0.38 | ) | $ | (0.21 | ) | |||
| Weighted average number of common shares outstanding | 127,569,731 | 91,630,693 | 62,516,461 | |||||||||
The accompanying footnotes are an integral part of these consolidated financial statements.
THERAPEUTICSMD, INC. AND SUBSIDIARY
FOR THE YEARS ENDED DECEMBER 31, 20112013, 2012 AND 2010
| Additional | ||||||||||||||||||||
| Common Stock | Paid in | Accumulated | ||||||||||||||||||
| Shares | Amount | Capital | Deficit | Total | ||||||||||||||||
| Balance, December 31, 2009 | 39,516,450 | $ | 39,516 | $ | 1,656,364 | $ | (1,212,249 | ) | $ | 483,631 | ||||||||||
| Shares issued in private placement | 15,970,871 | 15,971 | 3,154,672 | - | 3,170,643 | |||||||||||||||
| Options issued as compensation | - | - | 177,601 | - | 177,601 | |||||||||||||||
| Net loss | - | - | - | (2,867,464 | ) | (2,867,464 | ) | |||||||||||||
| Balance, December 31, 2010 (Restated) | 55,487,321 | 55,487 | 4,988,637 | (4,079,713 | ) | 964,411 | ||||||||||||||
Effect of merger and recapitalization pursuant to execution of Security Exchange Agreement | 165,879 | 166 | (255,919 | ) | - | (255,753 | ) | |||||||||||||
| Shares issued in private placement | 5,551,589 | 5,552 | 1,701,448 | - | 1,707,000 | |||||||||||||||
| Shares issued in exchange for debt | 21,681,958 | 21,682 | 8,217,455 | - | 8,239,137 | |||||||||||||||
| Shares issued in exercise of warrants | 92,057 | 92 | 17,158 | - | 17,250 | |||||||||||||||
| Options issued as compensation | - | - | 183,355 | - | 183,355 | |||||||||||||||
| Warrants issued for services | - | - | 190,280 | - | 190,280 | |||||||||||||||
| Warrants issued for loan guaranty costs-related parties | - | - | 93,969 | - | 93,969 | |||||||||||||||
| Warrants issued for financing costs | - | - | 45,362 | - | 45,362 | |||||||||||||||
| Warrants issued as financing costs-related parties | 9,338 | - | 9,338 | |||||||||||||||||
| Warrants issued as compensation-related party | - | - | 7,158 | - | 7,158 | |||||||||||||||
| Net loss | - | - | - | (12,913,365 | ) | (12,913,365 | ) | |||||||||||||
| Balance, December 31, 2011 | 82,978,804 | $ | 82,979 | $ | 15,198,241 | $ | (16,993,078 | ) | $ | (1,711,858 | ) | |||||||||
| Additional | ||||||||||||||||||||
| Common Stock | Paid in | Accumulated | ||||||||||||||||||
| Shares | Amount | Capital | Deficit | Total | ||||||||||||||||
| Balance, December 31, 2010 | 55,487,321 | $ | 55,487 | $ | 4,988,637 | $ | (4,079,713 | ) | $ | 964,411 | ||||||||||
| Effect of merger and recapitalization pursuant to execution of Security Exchange Agreement | 165,879 | 166 | (255,919 | ) | — | (255,753 | ) | |||||||||||||
| Shares issued in private placement, net of cost | 5,551,589 | 5,552 | 1,701,448 | — | 1,707,000 | |||||||||||||||
| Shares issued in exchange for debt | 21,681,958 | 21,682 | 8,217,455 | — | 8,239,137 | |||||||||||||||
| Shares issued for exercise of options | 92,057 | 92 | 17,158 | — | 17,250 | |||||||||||||||
| Options issued as compensation | — | — | 183,355 | — | 183,355 | |||||||||||||||
| Warrants issued for services | — | — | 190,280 | — | 190,280 | |||||||||||||||
| Warrants issued for loan guaranty costs-related parties | — | — | 93,969 | — | 93,969 | |||||||||||||||
| Warrants issued for financing costs | — | — | 45,362 | — | 45,362 | |||||||||||||||
| Warrants issued for financing costs-related parties | — | — | 9,338 | — | 9,338 | |||||||||||||||
| Warrants issued as compensation-related party | — | — | 7,158 | — | 7,158 | |||||||||||||||
| Net loss | — | — | — | (12,913,365 | ) | (12,913,365 | ) | |||||||||||||
| Balance, December 31, 2011 | 82,978,804 | 82,979 | 15,198,241 | (16,993,078 | ) | (1,711,858 | ) | |||||||||||||
| Shares issued in private placement, net of cost | 3,953,489 | 3,954 | 7,891,531 | — | 7,895,485 | |||||||||||||||
| Shares issued in exchange for debt | 2,775,415 | 2,775 | 1,051,882 | — | 1,054,657 | |||||||||||||||
| Shares issued for exercise of options | 1,931,788 | 1,932 | 189,068 | — | 191,000 | |||||||||||||||
| Shares issued for exercise of warrants | 8,145,486 | 8,145 | 3,093,855 | — | 3,102,000 | |||||||||||||||
| Options issued as compensation | — | — | 1,832,061 | — | 1,832,061 | |||||||||||||||
| Warrants issued for financing costs | — | — | 13,014,784 | — | 13,014,784 | |||||||||||||||
| Warrants issued for services | — | — | 1,563,620 | — | 1,563,620 | |||||||||||||||
| Warrants issued as compensation-related party | — | — | 36,284 | — | 36,284 | |||||||||||||||
| Warrants issued for cash | — | — | 400 | — | 400 | |||||||||||||||
| Cancellation of warrants issued for loan guaranty costs-related parties | — | — | (7,830 | ) | — | (7,830 | ) | |||||||||||||
| Beneficial ownership feature | — | — | 6,716,504 | — | 6,716,504 | |||||||||||||||
| Net loss | — | — | — | (35,120,235 | ) | (35,120,235 | ) | |||||||||||||
| Balance, December 31, 2012 | 99,784,982 | 99,785 | 50,580,400 | (52,113,313 | ) | (1,433,128 | ) | |||||||||||||
| Shares issued in private placements, net of cost | 45,116,352 | 45,117 | 78,605,236 | — | 78,650,353 | |||||||||||||||
| Shares issued for exercise of options | 75,423 | 75 | 30,835 | — | 30,910 | |||||||||||||||
| Employee Share Based Compensation | — | — | 3,254,083 | — | 3,254,083 | |||||||||||||||
| Warrants issued for financing costs | — | — | 1,711,956 | — | 1,711,956 | |||||||||||||||
| Warrants issued for services | — | — | 867,262 | — | 867,262 | |||||||||||||||
| Warrants issued as compensation-related party | — | — | 36,284 | — | 36,284 | |||||||||||||||
| Net loss | — | — | — | (28,419,313 | ) | (28,419,313 | ) | |||||||||||||
| Balance, December 31, 2013 | 144,976,757 | $ | 144,977 | $ | 135,086,056 | $ | (80,532,626 | ) | $ | 54,698,407 | ||||||||||
The accompanying footnotes are an integral part of these consolidated financial statements.
THERAPEUTICSMD, INC. AND SUBSIDIARY
| Year Ended December, 31, | ||||||||
| 2011 | 2010 | |||||||
| (Restated) | ||||||||
| CASH FLOWS FROM OPERATING ACTIVITES | ||||||||
| Net loss | $ | (12,913,365 | ) | $ | (2,867,463 | ) | ||
| Adjustments to reconcile net loss to net cash flows used in operating activities: | ||||||||
| Effect of merger and recapitalization pursuant to execution of Security Exchange Agreement | (255,753 | ) | - | |||||
| Depreciation | 54,845 | 22,783 | ||||||
| Allowance for doubtful accounts | 1,500 | - | ||||||
| Amortization of debt discount | 28,719 | - | ||||||
| Stock based debt settlement | 7,600,000 | - | ||||||
| Stock based compensation | 190,513 | 177,601 | ||||||
| Warrants issued for services | 22,630 | - | ||||||
| Non-cash financing costs | 25,980 | - | ||||||
| Loan guaranty costs | 38,159 | - | ||||||
| Changes in operating assets and liabilities: | ||||||||
| Accounts receivable | (16,409 | ) | (6,008 | ) | ||||
| Inventory | 29,996 | (454,683 | ) | |||||
| Other current assets | (346,822 | ) | 152,916 | |||||
| Accounts payable | 188,876 | 95,034 | ||||||
| Accrued interest | 33,994 | - | ||||||
| Accrued expenses and other current liabilities | 350,541 | 36,033 | ||||||
| Net cash flows used in operating activities | (4,966,596 | ) | (2,843,787 | ) | ||||
| CASH FLOWS FROM INVESTING ACTIVITIES | ||||||||
| Purchase of property and equipment | (28,766 | ) | (27,348 | ) | ||||
| Patent costs, net of abandoned costs | (8,870 | ) | - | |||||
| Net cash flows used in investing activities | (37,636 | ) | (27,348 | ) | ||||
| CASH FLOWS FROM FINANCING ACTIVITIES | ||||||||
| Proceeds from notes and loans payable | 2,484,160 | - | ||||||
| Proceeds from sale of common stock | 1,000,000 | - | ||||||
| Proceeds from sale of membeship units, net of expenses | 707,000 | 3,170,645 | ||||||
| Proceeds bank line of credit | 300,000 | - | ||||||
| Proceeds from notes and loans payable-related parties | 300,000 | - | ||||||
| Proceeds from exercise of options | 17,250 | - | ||||||
| Repayment of notes payable-related party | (100,696 | ) | - | |||||
| Net cash flows provided by financing activities | 4,707,714 | 3,170,645 | ||||||
| Increase (decrease) in cash | (296,518 | ) | 299,510 | |||||
| Cash, beginning of period | 422,939 | 123,429 | ||||||
| Cash, end of period | $ | 126,421 | $ | 422,939 | ||||
| SUPPLEMENTAL DISCLOSURES OF CASH FLOW INFORMATION: | ||||||||
| Cash paid for interest | $ | 696 | $ | - | ||||
| Cash paid for income taxes | $ | - | $ | - | ||||
| SUPPLEMENTAL SCHEDULE OF NON-CASH FINANCING ACTIVITIES: | ||||||||
| Warrants issued for financing | $ | 148,668 | $ | - | ||||
| Warrants issued for services | $ | 190,280 | $ | - | ||||
| Conversion of notes payable and accrued interest into common stock | $ | 849,137 | $ | - | ||||
| Year Ended December, 31, | ||||||||||||
| 2013 | 2012 | 2011 | ||||||||||
| CASH FLOWS FROM OPERATING ACTIVITIES | ||||||||||||
| Net loss | $ | (28,419,313 | ) | $ | (35,120,235 | ) | $ | (12,913,365 | ) | |||
| Adjustments to reconcile net loss to net cash flows used in operating activities: | ||||||||||||
| Effect of merger and recapitalization pursuant to execution of Security Exchange Agreement | — | — | (255,753 | ) | ||||||||
| Depreciation | 47,883 | 27,484 | 25,686 | |||||||||
| Amortization of intangible assets | 10,262 | 28,776 | 29,159 | |||||||||
| Provision for doubtful accounts | (15,493 | ) | 40,548 | 1,500 | ||||||||
| Loss on extinguishment of debt | — | 10,307,864 | 7,390,000 | |||||||||
| Beneficial conversion feature | — | 6,716,504 | — | |||||||||
| Amortization of debt discount | 1,102,680 | 1,604,240 | 28,719 | |||||||||
| Stock based compensation | 3,207,238 | 1,868,345 | 190,513 | |||||||||
| Amortization of deferred financing costs | 1,451,934 | — | 25,980 | |||||||||
| Stock based expense for services | 636,917 | 338,457 | 22,630 | |||||||||
| Loan guaranty costs | 2,944 | 45,036 | 38,159 | |||||||||
| Changes in operating assets and liabilities: | ||||||||||||
| Accounts receivable | (1,068,619 | ) | (728,253 | ) | (16,409 | ) | ||||||
| Inventory | 571,592 | (1,027,137 | ) | 29,996 | ||||||||
| Other current assets | (1,386,319 | ) | 42,281 | (346,822 | ) | |||||||
| Other assets | (565,706 | ) | — | — | ||||||||
| Accounts payable | 472,851 | 1,334,855 | 188,876 | |||||||||
| Deferred revenue | 457,828 | 1,144,752 | — | |||||||||
| Accrued expenses and other current liabilities | 2,875,320 | 639,157 | 594,535 | |||||||||
| Other liabilities | (150,068 | ) | — | — | ||||||||
| Net cash flows used in operating activities | (20,768,069 | ) | (12,737,326 | ) | (4,966,596 | ) | ||||||
| CASH FLOWS FROM INVESTING ACTIVITIES | ||||||||||||
| Patent costs, net of abandoned costs | (439,034 | ) | (206,101 | ) | (8,870 | ) | ||||||
| Payment of security deposit | (103,737 | ) | — | — | ||||||||
| Purchase of property and equipment | (40,790 | ) | (66,405 | ) | (28,766 | ) | ||||||
| Net cash flows used in investing activities | (583,561 | ) | (272,506 | ) | (37,636 | ) | ||||||
| CASH FLOWS FROM FINANCING ACTIVITIES | ||||||||||||
| Proceeds from sale of common stock, net of costs | 78,650,353 | 7,895,485 | 1,000,000 | |||||||||
| Proceeds bank line of credit | 500,000 | — | 300,000 | |||||||||
| Proceeds from exercise of options | 30,910 | 191,000 | 17,250 | |||||||||
| Proceeds from notes and loans payable | — | 8,700,000 | 2,684,160 | |||||||||
| Proceeds from sale of warrants | — | 400 | — | |||||||||
| Proceeds from notes and loans payable-related parties | — | — | 300,000 | |||||||||
| Proceeds from sale of membership units, net of expenses | — | — | 707,000 | |||||||||
| Repayment of bank line of credit | (500,000 | ) | (300,000 | ) | — | |||||||
| Repayment of notes payable-related party | — | (200,000 | ) | (100,696 | ) | |||||||
| Repayment of notes payable | (4,691,847 | ) | (1,850,000 | ) | (200,000 | ) | ||||||
| Net cash flows provided by financing activities | 73,989,416 | 14,436,885 | 4,707,714 | |||||||||
| Increase in cash | 52,637,786 | 1,427,053 | (296,518 | ) | ||||||||
| Cash, beginning of period | 1,553,474 | 126,421 | 422,939 | |||||||||
| Cash, end of period | $ | 54,191,260 | $ | 1,553,474 | $ | 126,421 | ||||||
| SUPPLEMENTAL DISCLOSURES OF CASH FLOW INFORMATION: | ||||||||||||
| Cash paid for interest | $ | 212,853 | $ | 17,253 | $ | 696 | ||||||
| Cash paid for income taxes | $ | — | $ | — | $ | — | ||||||
| SUPPLEMENTAL SCHEDULE OF NON-CASH FINANCING ACTIVITIES: | ||||||||||||
| Warrants issued for financing | $ | 1,711,956 | $ | 2,509,537 | $ | 148,668 | ||||||
| Warrants issued for services | $ | 462,196 | $ | 1,532,228 | $ | 190,280 | ||||||
| Warrants exercised in exchange for debt and accrued interest | $ | — | $ | 3,102,000 | $ | — | ||||||
| Shares issued in exchange for debt and accrued interest | $ | — | $ | 1,054,658 | $ | 849,137 | ||||||
| Notes payable issued for accrued interest | $ | — | $ | 15,123 | $ | — | ||||||
The accompanying footnotes are an integral part of these consolidated financial statements.
THERAPEUTICSMD, INC. AND SUBSIDIARY
NOTE A1 – THE COMPANY
TherapeuticsMD, Inc., a Nevada corporation, (“Therapeutics”or TherapeuticsMD or the “Company”) was incorporated in Utah in 1907 under the name Croff Mining Company. The Company, changed its name to Croff Oil Company in 1952 and in 1996 changed its name to Croff Enterprises, Inc. In the twenty (20) years prior to 2008, Croff’s operations consisted entirely of oil and natural gas leases. Due to a spin-off of its operations in December 2007, Croff had no business operations or revenue source and had reduced its operations to a minimal level although it continued to file reports required under the Exchange Act. As a result of the spin-off, Croff was a “shell company” under the rules of the Commission. In July 2009, the Company (i) closed a transaction to acquire America’s Minority Health Network, Inc. as ahas two wholly owned subsidiary, (ii) ceased being a shell company, and (iii) experienced a change in control in which the former shareholders of America’s Minority Health Network, Inc. acquired control of the Company. On September 14, 2009, the Company changed its name to AMHN, Inc. On June 11, 2010, the Company closed a transaction to acquire Spectrum Health Network, Inc. as a wholly owned subsidiary. On July 20, 2010, the Company filed Articles of Conversion and Articles of Incorporation to redomicile in the State of Nevada and changed the par value of its shares of capital stock to $0.001 per share. On July 31, 2010, the Company transferred the assets of America’s Minority Health Network, Inc. to a secured noteholder in exchange for the satisfaction of debt associated therewith. On February 15, 2011, the Company transferred the assets of Spectrum Health Network, Inc. to a secured noteholder in exchange for the satisfaction of debt associated therewith and in exchange for an Exclusive Licensing, Distribution and Advertising Sales Agreement (“Licensing Agreement”) under which the Company could sell subscription services and advertising on the Spectrum Health Network for commissions. On August 3, 2011 (with an effective date of October 3, 2011), in anticipation of closing the Merger (as defined and described below), the Company filed Amended and Restated Articles of Incorporation to change its name to TherapeuticsMD, Inc. and to increase the shares of Common Stock authorized for issuance to 250,000,000. On October 4, 2011, the Company closed the Merger withsubsidiaries, vitaMedMD, LLC, a Delaware limited liability company (“VitaMed”). As of December 31, 2011, Company management determined thatorganized on May 13, 2008, or VitaMed, would become the sole focus of the Company and services performed relative to the Licensing Agreement were discontinued.BocaGreenMD, Inc., a Nevada corporation incorporated on January 10, 2012, or BocaGreen. Unless otherwise stated or unless the context otherwise requires, TherapeuticsMD, VitaMed, and BocaGreen collectively are sometimes referred to as “our company,” “we,” “our,” or “us.”
Nature of Business
We are a women’s healthcare product company focused on creating and commercializing products targeted exclusively for women. Currently, we are focused on conducting the descriptionclinical trials necessary for regulatory approval and commercialization of advanced hormone therapy pharmaceutical products. The current drug candidates used in our business set forth below is provided onclinical trials are designed to alleviate the symptoms of and reduce the health risks resulting from menopause-related hormone deficiencies, including hot flashes, osteoporosis, and vaginal dryness. We are developing these hormone therapy drug candidates, which contain estradiol and progesterone alone or in combination, with the aim of providing equivalent efficacy at lower doses, thereby enabling an enhanced side effect profile compared with competing products. Our drug candidates are created from a combined basis, taking into account our newly-acquired wholly owned subsidiary, VitaMed.
Agreement and Plan of Merger with VitaMed
On July 18, 2011, Therapeuticswe entered into an Agreement and Plan of Merger (“Merger Agreement”) by and amongwith VitaMed and VitaMed Acquisition, LLC, a Delaware limited liability company andour newly formed wholly owned subsidiary. In connection with the acquisition, our subsidiary of the Company (the “Merger Sub”), pursuant to which the Company would acquire 100% of VitaMed. The proposed acquisition was to be accomplished by the merger of Merger Submerged with and into VitaMed with VitaMed beingsurviving the surviving limited liability company (the “Merger”) in accordance with the Limited Liability Company Act of the State of Delaware.merger. The Mergermerger became effective upon the filing of the Certificate of Merger with the Secretary of State of the State of Delaware on October 4, 2011 (the “Effective Time”).2011. In preparation offor and prior to the closing of the Merger, Agreement, the Companywe completed the following required corporate actions with an effective date of October 3, 2011:
| · | a reverse split of | |
| · | an increase in the number of | |
| · | a change in the name of | |
| · | an amendment to |
On October 4, 2011, the Closing Dateeffective date of the Merger Agreement, the Companymerger, we acquired 100% of VitaMed in exchange for the issuance of shares of the Company’sour Common Stock, as more fully described below (the “Merger”). In accordance with the provisions of this triangulated merger, the Merger Sub was merged with and into VitaMed as of the Effective Date. Upon consummation of the Merger Agreement and all transactions contemplated therein, the separate existence of the Merger Sub ceased and VitaMed became a wholly owned subsidiary of the Company.
THERAPEUTICSMD, INC. AND SUBSIDIARIES
NOTES TO CONSOLIDATED FINANCIAL STATEMENTS
Exchange of Securities
On the Effective Time,effective date of the merger, all outstanding membership units of VitaMed (the “Units”) were exchanged for shares of the Company’sour Common Stock. In addition, all outstanding VitaMed options to purchase VitaMed membership units (the “VitaMed Options”) and all outstanding VitaMed warrants to purchase VitaMed membership units (the “VitaMed Warrants”) were exchanged for and converted into options and warrants for theto purchase of the Company’s Common Stock (“Company Options” and “Company Warrants”, respectively). All Units, VitaMed Options and VitaMed Warrants were exchanged on a pro-rata basis for shares of the Company’sour Common Stock which in the aggregate totaled 70,000,000 shares, resulting in a conversion ratio calculated by the sum of all outstanding Units, VitaMed Options and VitaMed Warrants divided by 70,000,000 (the “Conversion Ratio”).Stock. Pursuant to the Conversion Ratio,conversion ratio in the Companymerger, we issued 58,407,331 shares of the Company’sour Common Stock in exchange for the outstanding Units,VitaMed membership units, reserved for issuance an aggregate of 10,119,796 shares issuableof our Common Stock for issuance upon the exercise of the Company Options,VitaMed options, and reserved for issuance an aggregate of 1,472,916 shares issuableof our Common Stock for issuance upon the exercise of the Company Warrants.warrants. After giving effect to the Reverse Split,reverse split, and taking into consideration the 58,407,331 aforementioned shares issued in exchange for the Units,membership units, the number of shares of the Company’sour Common Stock issued and outstanding as of the Closing Dateeffective date of the merger was 58,573,187, of which the former members of VitaMed owned approximately 99%. All shares of the Company’sour Common Stock issued in exchange for the Units,VitaMed membership units and to be issuedissuable upon exercise of the Company Optionsoptions and Company Warrants, arewarrants were subject to a lock-up agreement for a period of eighteen (18)18 months from the Closing.
In the early part of 2009, we completed formulation of our first products, a prenatal multivitamin and a vegan docosahexaenoic acid (“DHA”) supplement and introduced the product to the market in June 2009 with sales primarily in South Florida. In September 2010, we achieved a milestone of $1 million in total sales and had begun to expand our sales force nationally and currently have product sales into 46 states. Our product line has been expanded to ten core products and our new product development continues to focus on the women’s health market. As we continue our product development efforts for both new products and refinements to existing products, we are also seeking proprietary ingredients and formulations that can be exclusively licensed or patented for use in women’s healthcare that will further differentiate our products from the competition.
Principles of Consolidation
The accompanying consolidated financial statements include the accounts of the Companyour company and itsour wholly owned subsidiary.subsidiaries, VitaMed and BocaGreen. All material intercompany balances and transactions have been eliminated in consolidation.
Cash and Cash Equivalents
We maintain cash at financial institutions and,that at times balances may exceed federally insured limits. The Company hasWe have never experienced any losses related to these balances.funds. All of our non-interest bearing cash balances were fully insured at December 31, 2012 and 2011, and 2010 due to aresulting from the temporary federal program in effect from December 31, 2010 through December 31, 2012. Under thethis program, there iswas no limit to the amount of insurance for eligible accounts. Beginning January 1, 2013, insurance coverage will revertreverted to $250,000 per depositor at each financial institution, andat which time our non-interest bearing cash balances may again exceedexceeded federally insured limits. The Company had no interest-bearing amounts on deposit in excess of federally insured limits at December 31, 2011 and 2010.
Trade Accounts Receivable and Allowance for Doubtful Accounts
Trade accounts receivable are customer obligations due under normal trade terms. The Company reviews theWe review accounts receivable for uncollectible accounts and credit card charge-backs and providesprovide an allowance for doubtful accounts, which is based upon a review of outstanding receivables, historical collection information, and existing economic conditions. TradeWe consider trade accounts receivable past due for more than 90 days are consideredto be delinquent. DelinquentWe write off delinquent receivables are written off to bad debt expenseagainst our allowance for doubtful accounts based on individual credit evaluations, the results of collection efforts, and specific circumstances of the customer. Recoveriescustomers. We record recoveries of accounts previously written off are recorded as reductions of bad debt expenseincrease in allowance for doubtful accounts when received.Historically, our bad debt expense has been limited becauseTo the majority of our trade receivables are paid via credit card. Dataextent data we use to calculate these estimates does not accurately reflect bad debts; adjustments to these reserves may be required.At December 31, 2011 and 2010, the Company recorded an allowance for doubtful accounts of $1,500 and $0, respectively.
THERAPEUTICSMD, INC. AND SUBSIDIARIES
NOTES TO CONSOLIDATED FINANCIAL STATEMENTS
Inventories
Inventories represent packaged nutritional products and supplements and raw materials, which are valued at the lower of cost or market using the average costaverage-cost method.
Fixed Assets
Equipment
We state equipment is stated at cost, net of accumulated depreciation. MaintenanceWe charge maintenance costs, which do not significantly extend the useful lives of the respective assets, and repair costs are charged to operating expense as incurred. Depreciation is computedWe compute depreciation using the straight-line method over the estimated useful lives of the related assets, which range from 3three to 7seven years. Depreciation expense totaled $25,686 and $5,105 for
Leasehold Improvements
We state improvements at cost, net of accumulated depreciation. We compute depreciation using the years ended December 31, 2011 and 2010, respectively.
IntangibleAssets
Patent and $17,678 for the years ended December 31, 2011 and 2010, respectively.Trademarks
The Company hasWe have adopted the provisions ofFinancial Accounting Standards Board, (“FASB”)or FASB, Accounting Standards Codification, or ASC,350,Intangible-Goodwill and Other,or(“ASC 350”)350.
Impairment of Long-Lived Assets
We review the carrying values of property and equipment and finite-livedlong-lived intangible assets are reviewed for impairment whenever events or changes in circumstances indicate that their carrying values may not be recoverable. Such events or circumstances include but are not limited to:
| · | ||
| · | ||
| · | ||
| · | ||
| · | ||
| · | ||
| · |
THERAPEUTICSMD, INC. AND SUBSIDIARIES
NOTES TO CONSOLIDATED FINANCIAL STATEMENTS
If impairment indicators are present, the Company determineswe determine whether an impairment loss should be recognized by testing the applicable asset or asset group’s carrying value for recoverability. This test requires long-lived assets to be grouped at the lowest level for which identifiable cash flows are largely independent of the cash flows of other assets and liabilities, the determination of which requires judgment. The Company estimatesWe estimate the undiscounted future cash flows expected to be generated from the use and eventual disposal of the assets and comparescompare that estimate to the respective carrying values in order to determine if such carrying values are recoverable. This assessment requires the exercise of judgment in assessing the future use of and projected value to be derived from the eventual disposal of the assets to be held and used. AssessmentsIn our assessments, we also consider changes in asset utilization, including the temporary idling of capacity and the expected timing for placing this capacity back into production. If the carrying value of the assets is not recoverable, then we record a loss is recorded for the difference between the assets’ fair value and respective carrying value. TheWe determine the fair value of the assets is determined using an “income approach” based upon a forecast of all the expected discounted future net cash flows associated with the subject assets. Some of the more significant estimates and assumptions include:include market size and growth, market share, projected selling prices, manufacturing cost, and discount rate. The Company’sWe base estimates are based upon its historical experience, itsour commercial relationships, market conditions, and available external information about future trends. The Company believes itsWe believe our current assumptions and estimates are reasonable and appropriate; however, unanticipatedappropriate. Unanticipated events and changes in market conditions, however, could affect such estimates, resulting in the need for an impairment charge in future periods.
Fair Value of Financial Instruments
Our financial instruments consist primarily of receivables,accounts receivable, accounts payable, accrued expenses, and short-term debt. The carrying amount of receivables,accounts receivable, accounts payable, and accrued expenses approximates itstheir fair value because of the short-term maturity of such instruments. Interestinstruments and are considered Level 1 assets under the fair value hierarchy. We use interest rates that are currently available to the Companyus for issuance of short-termshort- and long-term debt with similar terms and remaining maturities are used to estimate the fair value of our short- and long-term debt, which would be considered Level 3 inputs under the Company’s short-term debt.
We categorize our assets and liabilities that are valued at fair value on a recurring basis into a three-level fair value hierarchy as defined by ASC 820,“Fair Value Measurements and Disclosures” (“ASC 820”). Disclosures.The fair value hierarchy gives the highest priority to quoted prices in active markets for identical assets and liabilities (Level 1) and lowest priority to unobservable inputs (Level 3).
Assets and liabilities recorded in the consolidated balance sheet at fair value are categorized based on a hierarchy of inputs, as follows:
| Level 1 | ||
| Level 2 | ||
| Level 3 |
THERAPEUTICSMD, INC. AND SUBSIDIARIES
NOTES TO CONSOLIDATED FINANCIAL STATEMENTS
At December 31, 2013, 2012, and 2011, and 2010, the Companywe had no assets or liabilities that arewere valued at fair value on a recurring basis.
Income Taxes
With the advent of the Merger, we determined that VitaMed would become the sole focus of our company and previous business performed by our predecessor was discontinued. Because of these events, deferred income taxes are accounteddetermined by calculating the loss from operations of our company starting October 4, 2011.
We account for income taxes under the asset and liability method. DeferredWe recognize deferred tax assets and liabilities are recognized for the estimated future tax consequences attributable to differences between the financial statement carrying amounts of existing assets and liabilities and their respective tax basis. DeferredWe measure deferred tax assets and liabilities are measured using enacted tax rates expected to apply to taxable income in the years in which the related temporary differences are expected to be recovered or settled. TheWe recognize the effect on deferred tax assets and liabilities of a change in tax rates is recognized when the rate change is enacted. Valuation allowances are recorded to reduce deferred tax assets to the amount that will more likely than not be realized.
In accordance with ASC 740,Income Taxes, the Company recognizeswe recognize the effect of uncertain income tax positions only if the positions are more likely than not of being sustained in an audit, based on the technical merits of the position. RecognizedWe measure recognized uncertain income tax positions are measured atusing the largest amount that has a likelihood of being realized that is greater than 50% likely of being realized.. Changes in recognition or measurement are reflected in the period in which those changes in judgment occur. The Company recognizesAt December 31, 2013, 2012, and 2011 we had no uncertain income tax positions.
We recognize both interest and penalties related to uncertain tax positions as part of the income tax provision. As ofAt December 31, 20112013 and 2010, the Company has2012, we had no tax positions relating to open tax returns that were considered to be uncertain.
Our tax returns are subject to review by the Internal Revenue Service three years after they are filed. Currently, years filed after 2010 are subject to review.
Share-Based Compensation
In December 2004, the FASB issued ASC 718,Compensation – Stock Compensation(“ASC 718”).,orASC 718. Under ASC 718, companies are required to measure the compensation costs of unit-basedshare-based compensation arrangements based on the grant-date fair value and recognize the costs in the financial statements over the period during which employees are required to provide services. Unit-basedShare-based compensation arrangements include unit options, restricted share plans,stock, restricted stock units, performance-based awards, share appreciation rights, and employee
THERAPEUTICSMD, INC. AND SUBSIDIARIES
NOTES TO CONSOLIDATED FINANCIAL STATEMENTS
Equity instruments (“instruments”) issued to anyone other than employees are recorded on the basis of the fair value of the instruments, as required by ASC 718. FASB ASC 505,Equity Based Payments to Non-Employees,or ASC 505,defines the measurement date and recognition period for such instruments. In general, the measurement date is when either (a) a (a) performance commitment, as defined, is reached or (b) the earlier of (i) the non-employee performance is complete or (ii) the instruments are vested. The measured value related to the instruments is recognized over a period based on the facts and circumstances of each particular grant as defined in ASC 505.
We recognize the ASC.
Debt Discounts
Costs incurred withfrom parties whothat are providing long-term financing, which include warrants issued in connection with the underlying debt, are reflected as a debt discount based on the relative fair value of the debt and warrants to the total proceeds. These We generally amortize discounts are generally amortized over the life of the related debt using the effective interest rate method. In connection with debt issued during the years ended December 31, 2011 and 2010, the Company recorded debt discounts totaling $28,719 and $0, respectively. Amortization expense related to debt discounts totaled $28,719 and $0 for the years ended December 31, 2011 and 2010, respectively, and is included in interest expense on the accompanying consolidated financial statements. Debt discount was fully amortized at December 31, 2011.
Revenue Recognition
We recognize revenue on arrangements in accordance with ASC 605, “Revenue Recognition” (“ASC 605”)Recognition. Revenue is recognizedWe recognize revenue only when the price is fixed or determinable, persuasive evidence of an arrangement exists, the service is performed, and collectability is reasonably assured. The Company generates
Over-the-Counter Products
We generate OTC revenue byfrom product sales of products primarily to retail consumers. The Company’s policy is toWe recognize revenue from product sales upon shipment, when the rights of ownership and risk of loss have passed to the consumer. OutboundWe include outbound shipping and handling fees are included in sales and are billedbill them upon shipment. ShippingWe include shipping expenses are included in cost of sales. TheA majority of the Company’s sales are paidour customers pay for our products with credit cards, and the Companywe usually receivesreceive the cash settlement in two to three banking days. Credit card sales minimize accounts receivable balances relative to sales.We provide an unconditional thirty-day30-day money-back return policy wherebyunder which we accept product returns from our retail wholesale and eCommerce customers.We recognize our revenue from OTC sales, net of returns, sales discounts, and eCommerce fees.
Prescription Products
We sell our name brand and generic prescription products
We accept returns of unsalable product from customers within a return period of six months prior to and following product expiration. Our prescription products currently have a shelf life of 24 months from the date of manufacture. Given the limited history of our prescription products, we currently cannot reliably estimate expected returns of the prescription products at the time of shipment. Accordingly, we defer recognition of revenue on prescription products until the right of return no longer exists, which occurs at the earlier of the time the prescription products are dispensed through patient prescriptions or expiration of the right of return.
We maintain various rebate programs in an effort to maintaina competitive position in the marketplace and to promote sales and customer loyalty. The consumer rebate program is designed to enable the end user to return a coupon to us. If the coupon qualifies, we send a rebate check to the end user. We estimate the allowance for consumer rebates based on our experience and industry averages, which is reviewed, and adjusted if necessary, on a quarterly basis.
THERAPEUTICSMD, INC. AND SUBSIDIARY
NOTES TO CONSOLIDATED FINANCIAL STATEMENTS
Shipping and Handling Costs
We expense all shipping and handling costs as incurred. TheseWe include these costs are included in cost of sales on the accompanying consolidated financial statements.
Advertising Costs
We expense advertising costs when incurred. Advertising expenses totaled $19,408costs were $11,739, $65,944 and $25,698$19,480 during the years ended December 31, 2013, December 31, 2011 and 2010,December 31, 2012, respectively.
Research and Development Expenses
Research and development, expenditures,or R&D, expenses include internal R&D activities, services of external contract research organizations, or CROs, costs of their clinical research sites, and other activities. Internal R&D activity expenses include laboratory supplies, salaries, benefits, and non-cash share-based compensation expenses. CRO activity expenses include preclinical laboratory experiments and clinical trial studies. Other activity expenses include regulatory consulting and legal counsel. We charge internal R&D activities and other activity expenses to operations as incurred. We make payments to CROs based on agreed-upon terms, which aremay include payments in advance of a study starting date. We expense nonrefundable advance payments for goods and services that will be used in future R&D activities when the activity has been performed or when the goods have been received rather than when the payment is made. Advance payments to be expensed as incurred, totaled $107,241in future R&D activities were $2,091,809 and $65,402 during the$189,375 for years ended December 31, 20112013 and 2010,December 31, 2012, respectively.
Earnings Per Share
We calculate earnings per share, (“EPS”)or EPS, in accordance with ASC 260, “Earnings Per Share,” which requires the computation and disclosure of two EPS amounts,amounts: basic and diluted. BasicWe compute basic EPS is computed based on the weighted averageweighted-average number of shares of common stockCommon Stock outstanding during the period. DilutedWe compute diluted EPS is computed based on the weighted averageweighted-average number of common shares of our Common Stock outstanding plus all potentially dilutive common shares of our Common Stock outstanding during the period. Such potentialpotentially dilutive common shares of our Common Stock consist of stock options and warrants. Potential commonPotentially dilutive shares totaling 96,618,626of our Common Stock representing 29,926,241, 25,926,987, and 165,752 (Reverse Split shares) at December 31,13,647,788 shares of our Common Stock for 2013, 2012, and 2011, and 2010, respectively, have beenwere excluded from the calculation of diluted earnings per share calculation as they arefor these periods because their effect would have been anti-dilutive due to the net loss reported by the Company.
Use of Estimates
Our consolidated financial statements have been prepared in accordance with accounting principles generally accepted in the United States of America.America, or GAAP. The preparation of these financial statements requires us to make significant estimates and judgments that affect the reported amounts of assets, liabilities, revenues,revenue, expenses, and related disclosure of contingent assets and liabilities. We evaluate our estimates, including those related to contingencies, on an ongoing basis. We base our estimates on historical experience and on various other assumptions that are believedwe believe to be reasonable under the circumstances, the results of which form the basis for making judgments about the carrying values of assets and liabilities that are not readily apparent from other sources. Actual results may differ, at times in material amounts, from these estimates under different assumptions or conditions.
THERAPEUTICSMD, INC. AND SUBSIDIARY
NOTES TO CONSOLIDATED FINANCIAL STATEMENTS
Recently Issued Accounting Pronouncements
In December 2011,July, 2013, the FASB issued Accounting Standards Update, (“ASU”) 2011-11, Balance Sheet - Offsetting. Thisor ASU, No. 2013-11,Income Taxes (Topic 740): Presentation of an Unrecognized Tax Benefit when a Net Operating Loss Carryforward, a Similar Tax Loss, or a Tax Credit Carryforward Exists (a consensus of the FASB Emerging Issues Task Force),or ASU 2013-11. The amendments in ASU 2013-11 provide guidance requires disclosures about offsetting and related arrangements for recognized financial instruments and derivative instruments. The standard is effective for us as of January 1, 2013 and will not materially impact ouron the financial statement disclosures.
In July 2012, the FASB issued ASU No. 2012-02,Testing Indefinite-Lived Intangible Assets for Impairment,or ASU 2012-02. ASU 2012-02 gives entities an option to first assess qualitative factors to determine whether the existence of events and circumstances indicates that it is more likely than not that the long-lived intangible asset are impaired. If, based on its qualitative assessment, an entity concludes that it is more likely than not that the fair value of an indefinite lived intangible asset is less than its carrying amount, quantitative impairment testing is required. However, if an entity concludes otherwise, quantitative impairment testing is not required. ASU 2012-02 is effective for annual and interim impairment tests performed for fiscal years beginning after September 15, 2012, with early adoption is permitted. The adoptionASU 2012-02 is not expected to have a material impact on the Company’s results of operations,our financial position or cash flows.
In MayDecember 2011, the FASB issued ASU 2011-04, Fair Value Measurement: AmendmentsNo. 2011-11,Balance Sheet (Topic 210): Disclosures about Offsetting Assets and Liabilities, or ASU 2011-11. ASU 2011-11 enhances current disclosures about financial instruments and derivative instruments that are either offset on the statement of financial position or subject to Achieve Common Fair Value Measurementan enforceable master netting arrangement or similar agreement, irrespective of whether they are offset on the statement of financial position. Entities are required to provide both net and Disclosure Requirementsgross information for these assets and liabilities in U.S.order to facilitate comparability between financial statements prepared in conformity with GAAP and IFRSs. Thisfinancial statements prepared on the basis of International Financial Reporting Standards. ASU represents the converged guidance of the FASB and the IASB (the “Boards”) on fair value measurement, and results in common requirements2011-11 is effective for measuring fair value and for disclosing information about fair value measurements, including a consistent meaning of the term “fair value.” These amendments change some of the terminology used to describe many of the existing requirements in U.S. GAAP for measuring fair value and for disclosing information about fair value measurements. The amendments should be applied prospectively, and they are effective during interim and annual reporting periods beginning on or after December 15, 2011. Early application by public entities is not permitted. The adoptionJanuary 1, 2013, and interim periods within those years. ASU 2011-11 is not expected to have a material impact on the Company’s results of operations,our financial position or cash flows.
We do not believe there would behave been a material effect on the accompanying consolidated financial statements had any other recently issued, but not yet effective, accounting standards been adopted in the current period.
Reclassifications
Certain 2012 amounts have been reclassified to conform to current year presentation.
THERAPEUTICSMD, INC. AND SUBSIDIARY
NOTES TO CONSOLIDATED FINANCIAL STATEMENTS
NOTE 3 – INVENTORY
Inventory consists of the following:
| December 31, | ||||||||
| 2013 | 2012 | |||||||
| Finished product | $ | 621,679 | $ | 1,124,739 | ||||
| Raw material | 250,943 | 380,000 | ||||||
| Deferred costs | 170,996 | 110,471 | ||||||
| TOTAL INVENTORY | $ | 1,043,618 | $ | 1,615,210 | ||||
NOTE 4 – OTHER CURRENT ASSETS
Other current assets consist of the following:
| December 31, | ||||||||
| 2013 | 2012 | |||||||
| Prepaid R&D costs | $ | 1,267,588 | $ | 189,375 | ||||
| Prepaid consulting | 530,596 | 432,216 | ||||||
| Deferred financing costs | 260,022 | ─ | ||||||
| Other receivable – related party | 249,981 | ─ | ||||||
| Prepaid other | 169,528 | 127,403 | ||||||
| Prepaid guaranty costs | ─ | 2,944 | ||||||
| TOTAL OTHER CURRENT ASSETS | $ | 2,477,715 | $ | 751,938 | ||||
NOTE 5 – FIXED ASSETS
Fixed assets consist of the following:
| December 31, | ||||||||
| 2013 | 2012 | |||||||
| Equipment | $ | 108,458 | $ | 67,668 | ||||
| Furniture and fixtures | 46,625 | 46,625 | ||||||
| Leasehold improvements | ─ | 11,980 | ||||||
| 155,083 | 126,273 | |||||||
| Accumulated depreciation | (93,765 | ) | (60,600 | ) | ||||
| TOTAL FIXED ASSETS | $ | 61,318 | $ | 65,673 | ||||
Depreciation expense for the years ended December 31, 2013, 2012, and 2011 was $45,145, $27,484 and $25,686, respectively. In December 2013, accumulated depreciation was reduced by $11,980 associated with leasehold improvements of our previously leased office property.
THERAPEUTICSMD, INC. AND 2010
NOTES TO CONSOLIDATED FINANCIAL STATEMENTS
NOTE 6 –PREPAID EXPENSE
Prepaid expense consists of the following:
| December 31, | ||||||||
| 2013 | 2012 | |||||||
| Prepaid R & D costs | $ | 824,221 | $ | 953,655 | ||||
| Prepaid manufacturing costs | 899,000 | ─ | ||||||
| Accreted prepaid costs | 27,234 | ─ | ||||||
| TOTAL PREPAID EXPENSE | $ | 1,750,455 | $ | 953,655 | ||||
NOTE 7 – INTANGIBLE ASSETS
The following table sets forth the gross carrying amount and accumulated amortization of our intangible assets as of December 31, 2013 and December 31, 2012:
| December 31, 2013 | ||||||||||||||||
| Gross Carrying Amount | Accumulated Amortization | Net Amount | Weighted- Average Amortization Period (yrs.) | |||||||||||||
| Amortizing intangible assets: | ||||||||||||||||
| OPERA® software patent | $ | 31,951 | $ | (499 | ) | $ | 31,452 | 15.8 | ||||||||
| Development costs for corporate website | 91,743 | (89,661 | ) | 2,082 | 0.3 | |||||||||||
| Non-amortizing intangible assets: | ||||||||||||||||
Hormone therapy drug candidate patents | 572,726 | — | 572,726 | n/a | ||||||||||||
| Multiple trademarks for vitamins/supplements | 59,328 | — | 59,328 | n/a | ||||||||||||
| Total | $ | 755,748 | $ | (90,160 | ) | $ | 665,588 | |||||||||
| December 31, 2012 | ||||||||||||||||
| Gross Carrying Amount | Accumulated Amortization | Net Amount | Weighted- Average Amortization Period (yrs.) | |||||||||||||
| Amortizing intangible assets: | ||||||||||||||||
| OPERA ® software patent | $ | 23,722 | $ | 0 | $ | 23,722 | 0 | |||||||||
| Development costs for corporate website | 91,743 | (77,159 | ) | 14,584 | 1.3 | |||||||||||
| Non-amortizing intangible assets: | ||||||||||||||||
| Hormone therapy drug candidate patents | 180,194 | — | 180,194 | n/a | ||||||||||||
| Multiple trademarks for vitamins/supplements | 21,055 | — | 21,055 | n/a | ||||||||||||
| Total | $ | 316,714 | $ | (77,159 | ) | $ | 239,555 | |||||||||
THERAPEUTICSMD, INC. AND SUBSIDIARIES
NOTES TO CONSOLIDATED FINANCIAL STATEMENTS
The intangible asset related to development costs for corporate website is amortized over 36 months, which is the prescribed life for software and website development costs. The intangible asset related to OPERA® is amortized using the straight-line method over the estimated remaining useful life of 16 years, which is the life of the intellectual property patents. During the year ended December 31, 2013, there was no impairment recognized.
Amortization expense was $13,001, $28,776, $29,159 for the years ended December 31, 2013, 2012, and 2011, respectively. Estimated amortization expense for the next five years is as follows:
| Year Ending December 31, | Estimated Amortization | |||
| 2014 | $ | 4,080 | ||
| 2015 | $ | 1,997 | ||
| 2016 | $ | 1,997 | ||
| 2017 | $ | 1,997 | ||
| 2018 | $ | 1,997 | ||
NOTE 8 – OTHER CURRENT LIABILITIES
Other current liabilities consist of the following:
| December 31, | ||||||||
| 2013 | 2012 | |||||||
| Accrued payroll and commission costs | $ | 941,313 | $ | 397,210 | ||||
| Accrued financing costs | 850,000 | ─ | ||||||
| Accrued vacation | 256,920 | 114,899 | ||||||
| Allowance for wholesale distributor fees | 306,303 | 107,784 | ||||||
| Accrued legal and accounting expense | 224,550 | 90,000 | ||||||
| Accrued lab research | 536,574 | ─ | ||||||
| Accrued clinical trial costs | 129,208 | ─ | ||||||
| Allowance for coupons and returns | 126,233 | 53,002 | ||||||
| Other accrued expenses(1) | 230,088 | 70,759 | ||||||
| TOTAL OTHER CURRENT LIABILITIES | $ | 3,601,189 | $ | 833,654 | ||||
(1)In June 2008, we declared and paid a special dividend of $0.40 per share of our Common Stock to all shareholders of record as a going concern. The Company incurred a loss from operations of approximately $5,400,000, had negative cash flow from operationsJune 10, 2008, of approximately $5,000,000 and had an accumulated deficit of approximately $17,000,000which $41,359 remained unclaimed by certain shareholders at December 31, 2011. These matters raise substantial doubt about2013 and 2012.
NOTE 9 – NOTES PAYABLE
Issuance and Payment of Multiple Advance Revolving Credit Note
On January 31, 2013, we entered into a business loan agreement with Plato and Associates, LLC, or Plato, for a Multiple Advance Revolving Credit Note, or the Company’s abilityRevolving Credit Note. The Revolving Credit Note allowed us to continuedraw down funding up to a $10,000,000 maximum principal amount, at a stated interest rate of 6% per annum. Plato was able to make advances to us from time to time under the Revolving Credit Note at our request, which advances were of a revolving nature and were able to be,made, repaid, and made from time to time. Interest payments were due and payable on the tenth day following the end of each calendar quarter in which any interest was accrued and unpaid, commencing on April 10, 2013, and the principal balance outstanding under the Revolving Credit Note, together with all accrued interest and other amounts payable under the Revolving Credit Note, if any, was due and payable on February 24, 2014. The Revolving Credit Note was secured by substantially all of our assets. On each of February 25 and March 13, 2013, $200,000 was drawn against the Revolving Credit Note. On March 21, 2013, we repaid $401,085, including accrued interest, and there was no balance outstanding under the Revolving Credit Note as of December 31, 2013 and February 24, 2014 when it expired. As additional consideration for the Revolving Credit Note, we granted to Plato a going concern. Management’s plans include raising additional proceeds from debtwarrant to purchase 1,250,000 shares of our Common Stock at an exercise price $3.20 per share (see NOTE 10 for more details).
THERAPEUTICSMD, INC. AND SUBSIDIARIES
NOTES TO CONSOLIDATED FINANCIAL STATEMENTS
Borrowing under Business Loan Agreement and equity transactionsPromissory Note, as amended
In March 2011, VitaMed entered into a business loan agreement with First United Bank for a $300,000 bank line of credit for which personal guarantees and cash collateral were required. Personal guarantees and cash collateral limited to continue to increase its sales$100,000 each were provided by Robert Finizio and marketing activities; however, there are no assurances that management will be successful in their efforts.John Milligan, officers of our Company, and by Reich Family Limited Partnership, an entity controlled by Mitchell Krassan, also an officer of our Company. The financial statements do not include adjustments relatingbank line of credit accrued interest at the rate of 3.02% per annum based on a year of 360 days and was due on March 1, 2012. We negotiated a one-year extension with First United to the recoverabilitybank line of credit, which was executed on March 19, 2012. Under the extension, borrowings bear interest at a rate of 2.35% and realizationare due on March 1, 2013. On November 13, 2012, the outstanding balance of assets$299,220 was repaid in full, and classificationwe amended the line of liabilitiescredit to reflect a $100,000 bank line of credit. In accordance with the amended line of credit, the personal guarantee and cash collateral limited to $100,000 provided by the Reich Family Limited Partnership remained in place, while the personal guarantees and cash collateral were removed for Mr. Finizio and Mr. Milligan. In February 2013, we borrowed $100,000 from First United Bank under the amended bank line of credit. The amended bank line of credit required a personal guarantee and cash collateral limited to $100,000, which was provided by Reich Family Limited Partnership. On April 25, 2013, we re-paid $100,735, which represented the principal and interest that might be necessary shouldwas due under the Company be unableamended bank line of credit. On May 1, 2013, the amended bank line of credit expired and was not renewed. Accordingly, the personal guarantee was canceled, and the cash collateral was refunded to continuethe Reich Family Limited Partnership. During the years ended December 31, 2013, 2012, and 2011, we paid $735, $7,366, and $5,650, respectively, of interest expense, which are included in operation.
Issuance of the Company’s Common Stock. Promissory Notes
In addition, all VitaMed OptionsJanuary and VitaMed Warrants were exchanged and converted into Company Options and Company Warrants. All Units , VitaMed Options and VitaMed Warrants were exchanged on a pro-rata basis for shares of the Company’s Common Stock whichFebruary 2012, we issued 6% promissory notes in the aggregate totaled 70,000,000principal amount of $900,000, due March 1, 2012. As discussed below inIssuance and Settlement of February 2012 Notes, these promissory notes were modified on February 24, 2012 through the issuance of secured promissory notes.
Issuance and Settlement of February 2012 Notes
On February 24, 2012, we issued promissory notes, the February 2012 Notes, to an individual and an entity, or the Parties, both of which are stockholders of our company, in the principal amount of $1,358,014 and $1,357,110, respectively, and granted warrants to purchase an aggregate of 9,000,000 shares of our Common Stock pursuant to the terms of a Note Purchase Agreement, dated February 24, 2012. We received an aggregate of $1,000,000 of new funding from the Parties upon issuance of the February 2012 Notes and related warrants and surrender by the Parties of certain promissory notes, which we previously issued in the aggregate amount of $1,700,000 plus the aggregate accrued interest of $15,124 (collectively known as the “Prior Notes”). Under the February 2012 Notes, we borrowed an additional $3,000,000 from the Parties during March, April, and May 2012.
THERAPEUTICSMD, INC. AND SUBSIDIARIES
NOTES TO CONSOLIDATED FINANCIAL STATEMENTS
We granted 5,685,300 warrants in consideration of the modification of the Prior Notes and 3,314,700 warrants with the February Funding. We determined that the resulting modification of the Prior Notes was substantial in accordance with ASC 470-50,Modifications and Extinguishments. As such the modification was accounted for as an extinguishment and restructuring of the debt, and the 5,685,300 warrants issued in consideration of the modification were expensed (seeWarrant Activity During 2012in NOTE 10 for more details). The fair value of the Prior Notes was estimated by calculating the present value of the future cash flows discounted at a market rate of return for comparable debt instruments to be $1,517,741, resulting in a conversion ratio calculated bydebt discount of $197,383 and recognized a loss on extinguishment of debt of $10,307,864, which represented the sum of all Units, VitaMed Options and VitaMed Warrants divided by 70,000,000 (the “Conversion Ratio”). Pursuant to the Conversion Ratio, the Company issued 58,407,331 sharesfair value of the Company’s Common Stock5,685,300 warrants net of the difference between the carrying amount of the Prior Notes and their fair value as of the date of the modification on the accompanying consolidated financial statements.
On June 19, 2012, we settled an aggregate amount of $3,102,000 of principal and accrued interest of the February 2012 Notes in exchange for the Units, reservedexercise of warrants to purchase 8,145,486 shares of our Common Stock. As discussed below inIssuance and Payment of June 2012 Notes, the remaining balance of $2,691,847 of the February 2012 Notes was modified on June 19, 2012 through the issuance of secured promissory notes, or the June 2012 Notes (see NOTE 10 for issuancemore details).
Issuance and Payment of June 2012 Notes
On June 19, 2012, we issued secured promissory notes, or the June 2012 Notes, to the Parties in the principal amounts of $2,347,128 and $2,344,719, respectively, pursuant to the terms of a Note Purchase Agreement. In connection with the June 2012 Notes, the Parties surrendered the remaining balance of the February 2012 Notes in the aggregate amount of $1,347,128 and $1,344,719, respectively, which sums included principal and accrued interest through June 19, 2012, and we received an aggregate of 10,119,796 shares issuable upon$2,000,000 of new funding from the exerciseParties, or the June Funding. The principal amount of each of the Company OptionsJune 2012 Notes, plus any additional advance made to us thereafter, together with accrued interest at the annual rate of 6%, was due in one lump sum payment on February 24, 2014. As security for our obligations under the June 2012 Notes, we entered into a Security Agreement and reserved for issuancepledged all of our assets, tangible and intangible, as further described therein. We also granted warrants to purchase an aggregate of 1,472,9167,000,000 shares of our Common Stock in connection with the June Funding. On March 21, 2013, we repaid $4,882,019, including accrued interest, leaving a balance of $21,595 in accrued interest as of March 31, 2013 on the June 2012 Notes. On April 25, 2013, the balance of accrued interest was paid in full.
Issuance and Payment of Additional Notes in 2012
In August and September 2012, we issued 6% promissory notes in the amount of $1,600,000 due on October 1, 2012, which due date was subsequently extended. These notes were paid in full in October 2012.
In September 2012, we issued a 6% promissory note for $200,000 due on October 15, 2012. This note was paid in full in October 2012.
Conversion of July 2011 Secured Notes
In July 2011, VitaMed issued two senior secured promissory notes, or the Secured Notes, each in the amount of $500,000 and also entered into a security agreement under which VitaMed pledged all of its assets to secure the obligation. The Secured Notes were assumed by us upon the merger and bore interest at the rate of 6% per annum, were due on the one year anniversary thereof, and were convertible into shares of our Common Stock at our option. We were permitted to satisfy the obligation underlying the Secured Notes by delivering such number of shares of our Common Stock calculated by dividing the then-outstanding principal balance by the Share Price. For purposes of the Secured Notes, the “Share Price” meant the lower of the most recent price at which we offered and sold shares of our Common Stock (not including any shares of our Common Stock issued upon the exercise of options and/or warrants or upon the Company Warrants.
THERAPEUTICSMD, INC. AND SUBSIDIARIES
NOTES TO CONSOLIDATED FINANCIAL STATEMENTS
Issuance of VitaMed Promissory Notes
In June 2011, VitaMed issued promissory notes, or the VitaMed Notes, in the aggregate principal amount of $500,000. In connection with the VitaMed Notes, we granted warrants to purchase an aggregate of 613,718 shares of our Common Stock. The VitaMed Notes were assumed by us upon the merger and bore interest at a rate of 4% per annum and were due at the earlier of (i) the six month anniversary of the date of issuance and (ii) such time as VitaMed received the proceeds of a promissory note(s) issued in an amount of not less than $1,000,000, or the Funding. Upon the closing of the Funding in July 2011, as more fully described above inConversion of July 2011 Secured Notes, two of the VitaMed Notes in the aggregate of $200,000 were paid in full. By mutual agreement, the remaining VitaMed Notes in the aggregate of $300,000 were extended. In October 2011, one of the VitaMed Notes for $50,000 was paid in full, and, by mutual agreement, certain of the VitaMed Notes in the aggregate amount of $100,000 were converted into 266,822 shares of our Common Stock at $0.38 per share, which represented the fair value of the shares of our Common Stock on the date of conversion. In June 2012, a VitaMed Note held by an unaffiliated individual was paid in full, including $2,160 in accrued interest. The remaining VitaMed Notes, held by Mr. Milligan and by BF Investment Enterprises, Ltd., which is owned by Brian Bernick, a director of our company, in the aggregate amount of $100,000, were extended to October 15, 2012. On October 4, 2012, we re-paid the outstanding VitaMed Notes in full, including $5,341 in accrued interest.
In September and October 2011, VitaMed issued convertible notes, or the VitaMed Convertible Notes, in the aggregate amount of $534,160. The VitaMed Convertible Notes bore interest at the rate of 4% per annum and were due December 1, 2011. On November 18, 2011, we entered into Debt Conversion Agreements with the holders of VitaMed Convertible Notes, pursuant to which we converted the principal and accrued interest of the VitaMed Convertible Notes into 1,415,136 shares of our Common Stock at $0.38 per share, which represented the fair value of the shares of our Common Stock on the date of conversion.
In December 2011, we issued 4% promissory notes to Mr. Finizio and Mr. Milligan for an aggregate of $100,000 due March 1, 2012. These promissory notes were subsequently extended by mutual agreement to June 1, 2012. In June 2012, we paid the promissory note held by Mr. Finizio in full, including $888 in accrued interest. Mr. Milligan’s promissory note was extended to October 15, 2012. On October 4, 2012, we paid Mr. Milligan’s promissory note in full, including $1,519 in accrued interest.
For the years ended December 31, 2012 and 2011, we recorded an aggregate of $6,344 and $2,390, respectively, as interest expense on the accompanying consolidated financial statements.
THERAPEUTICSMD, INC. AND SUBSIDIARIES
NOTES TO CONSOLIDATED FINANCIAL STATEMENTS
NOTE 10 – STOCKHOLDERS’ EQUITY
Preferred Stock
At December 31, 2011, the Company2013, we had 10,000,000 shares of Preferred Stock,preferred stock, par value $0.001, authorized and none outstanding,for issuance, of which no shares can be designated by the Company’s Board of Directors.
Common Stock
At December 31, 2011, the Company2013, we had250,000,000 shares of Common Stock $0.001 par value authorized with 82,978,781for issuance, of which144,976,757 shares of our Common Stock were issued and outstanding.
Issuances During 2013
Pursuant to a shelf registration statement previously filed with the Securities and Exchange Commission, or the SEC, on March 14, 2013, we entered into an underwriting agreement with Jefferies LLC, or Jefferies, as the representative of the underwriters named therein, or the Jefferies Underwriters, relating to the issuance and sale of 29,411,765 shares of our Common Stock. The price to the public in the offering was $1.70 per share, and the Jefferies Underwriters agreed to purchase the shares of our Common Stock from us pursuant to the underwriting agreement at a price of $1.58 per share. The net proceeds to us from this offering was approximately $45.4 million, after deducting underwriting discounts and commissions and other offering expenses payable by us. In addition, under the terms of the underwriting agreement, we granted the Jefferies Underwriters a 30-day option to purchase up to an additional 4,411,765 shares of our Common Stock. The offering closed on March 20, 2013. On April 12, 2013, the Jefferies Underwriters exercised their option to purchase an additional 1,954,587 shares of our Common Stock to cover over-allotments. We issued these shares to the Jefferies Underwriters on April 18, 2013 and received proceeds of approximately $3.1 million, net of expenses.
On September 25, 2013, we entered into an underwriting agreement with Stifel, Nicolaus & Company, Incorporated, as the representative of the underwriters named therein, or the Stifel Underwriters, relating to the issuance and sale of 13,750,000 shares of our Common Stock. The price to the public in the offering was $2.40 per share, and the Stifel Underwriters agreed to purchase the shares of our Common Stock from us pursuant to the underwriting agreement at a price of $2.23 per share. The net proceeds to us from this offering were approximately $30.2 million, after deducting underwriting discounts and commissions and other offering expenses payable by us. The offering closed on September 30, 2013.
During 2013 certain individuals exercised their right to purchase shares of our Common Stock. Options to purchase an aggregate of 75,423 shares of our Common Stock were exercised for approximately $31,000. These shares of our Common Stock were issued in part in reliance upon an exemption from the registration provisions of the Securities Act of 1933, or the Act, provided by Section 4(a)(2) and Rule 506 of Regulation D promulgated thereunder.
Issuances During 2012
During 2012, certain individuals exercised their right to purchase shares of our Common Stock. These shares were issued in reliance upon an exemption from the registration provisions of the Act provided by Section 4(a)(2) and Rule 506 of Regulation D promulgated thereunder.
| · | Options to purchase an aggregate of 1,691,393 shares of our Common Stock were exercised for $191,000. | |
| · | Using the cashless exercise feature, options to purchase an aggregate of 240,395 shares of our Common Stock were exercised. |
THERAPEUTICSMD, INC. AND SUBSIDIARIES
NOTES TO CONSOLIDATED FINANCIAL STATEMENTS
During June 2012, we settled $3,102,000 in principal and accrued interest of the February 2012 Notes in exchange for the Parties’ exercise of a portion of the related warrants for an aggregate of 8,145,486 shares of our Common Stock. The shares were issued in reliance upon an exemption from the registration provisions of the Act provided by Section 4(a)(2) and May 2011, VitaMedRule 506 of Regulation D promulgated thereunder. During June 2012, we and the Parties also agreed to convert a portion of the February 2012 Notes, and principal and accrued interest through June 19, 2012, totaling $1,054,647, into 2,775,415 shares of our Common Stock at $0.38 per share. The shares were issued in reliance upon an exemption from the registration provisions of the Act provided by Section 4(a)(2) and Rule 506 of Regulation D promulgated thereunder.
In September 2012, we entered into a Securities Purchase Agreement with multiple investors, relating to the issuance and sale of our Common Stock in a private placement. The private placement closed on October 2, 2012, through which we sold 2,892,630 Unitsan aggregate of 3,953,489 shares of our Common Stock at $2.15 per share, for an aggregate purchase price of $707,000.
Issuances During 2011 the Company effected
In December 2011,a reverse splitformer director of its 16,575,209 issued and outstandingVitaMed,exercised options to purchase 92,057 shares of our Common Stock on a ratiofor an aggregate exercise price of 1 for 100 resulting$17,250.
In October and November 2011, we converted principal and accrued interest in 165,856the aggregate of $849,137 into shares issuedof our Common Stock totaling 20,266,822 and outstanding thereafter.
On October 5, 2011, the Company closedwe entered into a Stock Purchase Agreement with Pernix Therapeutics, LLC, a Louisiana limited liability company, (“Pernix”).or Pernix. Pursuant to the terms of the Stock Purchase Agreement, dated September 8, 2011, Pernix agreed to purchase 2,631,579 shares of the Company’sour Common Stock (the “Shares”) at a purchase price of $0.38 per share for a total purchase price of $1,000,000 (“Purchase Price”). In connection$1,000,000. Pernix is a related party. For further details, see NOTE 12
On October 3, 2011, we effected a reverse split of our 16,575,209 issued and outstanding shares of Common Stock on a ratio of 1- for -100, resulting in 165,856 shares issued and outstanding thereafter.
Warrants
As of December 31, 2013, we had warrants outstanding to purchase an aggregate of 14,293,499 shares of our Common Stock with the Stock Purchase Agreement, the Companya weighted-average contractual remaining life of 3.9 years, and Pernix entered intoexercise prices ranging from $0.24 to $3.20 per share, resulting in a Lock-Up Agreement which, among other things, restricts the sale, assignment, transfer, encumbrance and other dispositionweighted average exercise price of the Shares issued to Pernix. Pursuant to the terms of the Lock-Up Agreement, Pernix agreed
THERAPEUTICSMD, INC. AND SUBSIDIARY
NOTES TO CONSOLIDATED FINANCIAL STATEMENTS
The valuation methodology used to determine the fair value of Common Stock purchaseour warrants is the Black-Scholes-Merton option-pricing model (“Black-Scholes Model”), an acceptable model in accordance with ASC 718-10.Model. The Black-Scholes Model requires the use of a number of assumptions, including volatility of the stock price, the risk-free interest rate and the term of the warrant.
Warrant Activity During 2013
In January 2013, we granted warrants to purchase 1,250,000 shares of our Common Stock in connection with the issuance of the Revolving Credit Note, or the Plato Warrant, (see NOTE 9). The Plato Warrant has an exercise price of $3.20 per share. The Plato Warrant vested on October 31, 2013 and may be exercised prior to its expiration on January 31, 2019. The Plato Warrant, with a fair value of approximately $1,711,956, was valued on the date of the issuance using a term of six years; a volatility of 44.29%; risk free rate of 0.88%; and a dividend yield of 0%. At December 31, 2013, $260,022 was reported as deferred financing costs included in other current assets in the accompanying consolidated balance sheet and is being amortized over the life of the Plato Note. As of December 31, 2013, $1,451,934 was recorded as financing costs on the accompanying consolidated financial statements.
In May 2013, we entered into a consulting agreement with Sancilio & Company, Inc., or SCI, to develop drug platforms to be used in hormone replacement drug products, or the Drug Products. These services include support of our efforts to successfully obtain U.S. Federal Drug Administration, or FDA, approval for the Drug Products, including a vaginal capsule for the treatment of vulvar and vaginal atrophy. In connection with the agreement, SCI agreed to forfeit its rights to receive warrants to purchase warrant.
| 1. | 283,333 shares were earned on May 11, 2013 upon successful filing of the IND application with the FDA for the Drug Product for an estradiol-based product in a softgel vaginal capsule for the treatment of vulvar and vaginal atrophy; however, pursuant to the terms of the agreement, the shares did not vest until June 30, 2013. The fair value of $405,066 for the shares vested on June 30, 2013 was determined by using the Black-Scholes Model on the date of the vesting using a term of five years; a volatility of 45.89%; risk free rate of 1.12%; and a dividend yield of 0%. We recorded the entire $405,066 as non-cash compensation in the accompanying consolidated financial statements; |
| 2. | 283,333 shares vested on June 30, 2013. The fair value of $462,196 for these shares was determined by using the Black-Scholes Model on the date of the vesting using a term of five years; a volatility of 45.84%; risk free rate of 1.41%; and a dividend yield of 0%. At December 31, 2013 we had $154,068 recorded as prepaid expense-short term and $308,128 recorded as prepaid expense-long term in the accompanying consolidated financial statements. During the year ended December 31, 2013, we recorded $77,034 as non-cash compensation in the accompanying consolidated financial statements; and |
| 3. | 283,334 shares will vest upon the receipt by us of any final FDA approval of a Drug Product that SCI helped us design. It is anticipated that this event will not occur before December 2015. |
THERAPEUTICSMD, INC. AND SUBSIDIARIES
NOTES TO CONSOLIDATED FINANCIAL STATEMENTS
Warrant Activity During 2012
In February 2012, we issued an aggregate of 5,685,300 Warrants in connection with the modification of certain existing promissory notes, or the Modification Warrants, and warrants for the purchase of an aggregate of 3,314,700 shares of our Common Stock in connection with the issuance of the February 2012 Notes, or the February 2012 Warrants (see NOTE 9). Both the Modification Warrants and the February 2012 Warrants are exercisable at $0.38 per share. The Modification Warrants have a fair value of $10,505,247, and the February 2012 Warrants have a fair value of $6,124,873. Fair value was determined on the date of the issuance using a term of five years; a volatility of 44.5%; risk free rate of 0.89%; and a dividend yield of 0%. We recorded the fair value of the Modification Warrants as part of the loss on extinguishment of debt in the accompanying consolidated financial statements. The relative fair value of the February 2012 Warrants of $859,647 was recorded as debt discount. As a result of the surrender of the February 2012 Notes on June 19, 2012, we expensed the remaining unamortized debt discount.
In March 2012, we issued an aggregate of 31,000 Warrants to five unaffiliated individuals for services rendered. These Warrants were valued on the date of the issuance using a term of five years; a volatility of 44.81%; risk free rate of 1.04%; and a dividend yield of 0%; we recorded $29,736 as consulting expense in the accompanying consolidated financial statements.
In May 2012, we issued an aggregate of 1,300,000 Warrants to an unaffiliated entity for services to be rendered over approximately five years beginning in May 2012. Services provided are to include (a) services in support of our drug development efforts, including services in support our ongoing and future drug development and commercialization efforts, regulatory approval efforts, third-party investment and financing efforts, marketing efforts, chemistry, manufacturing and controls efforts, drug launch and post-approval activities, and other intellectual property and know-how transfer associated therewith; (b) services in support of our efforts to successfully obtain New Drug Approval; and (c) other consulting services as mutually agreed upon from time to time in relation to new drug development opportunities. The Warrants were valued at $1,532,228 on the date of the issuance using an exercise price of $2.57; a term of five years; a volatility of 44.71%; risk free rate of 0.74%; and a dividend yield of 0%. At December 31, 2013, we had $360,528 reported as prepaid expense-short term and $593,127 recorded as prepaid expense-long term. During the year ended December 31, 2013 and the year ended December 31, 2012, we recorded $360,528 and $218,045, respectively as non-cash compensation in the accompanying consolidated financial statements. The contract will expire upon the commercial manufacture of a drug product. Based on the review, we have determined that the process will take approximately five years. As a result, we are amortizing the $1,532,228 over five years.
In June 2012, we granted aggregate of 7,000,000 Warrants in connection with the issuance of the June 2012 Notes, or the June 2012 Warrants, (see NOTE 9). Of the June 2012 Warrants issued, 6,000,000 are exercisable at $2.00 per share and 1,000,000 are exercisable at $3.00 per share. The fair value of the June 2012 Warrants of $9,424,982 was determined on the date of the issuance using a term of five years; a volatility of 44.64%; risk free rate of 0.75%; and a dividend yield of 0%. The relative fair value of the June 2012 Warrants of $1,649,890 was determined by using the relative fair value calculation method on the date of the issuance. Of the $1,649,890, $547,210 was amortized to interest expense in 2012 and as a result of the repayment of the associated debt on March 21, 2013, we amortized the remaining unamortized debt discount of $1,102,680 to interest expense.
In June 2012, we issued an aggregate of 1,500 Warrants to three unaffiliated individuals for services rendered. The Warrants were valued on the date of the issuance using a term of five years; a volatility of 44.78%; risk free rate of 0.72%; and a dividend yield of 0%. A total of $1,656 was recorded as consulting expense in the accompanying consolidated financial statements.
THERAPEUTICSMD, INC. AND SUBSIDIARIES
NOTES TO CONSOLIDATED FINANCIAL STATEMENTS
Warrant Activity During 2011
In December 2011, we issued 500 Warrants with a fair value of $338 to an unrelated individual for consulting services covered under a three-month agreement. The Warrants were valued on the date of the issuance using a term of 10 years; volatility of 51.83%; risk free rate of 0.91%; and a dividend yield of 0%. The Warrants vested immediately. As of December 31, 2011, the Company had Company Warrants outstanding for an aggregate of 3,057,627 shares of the Company’s Common Stock (including$338 fair value, $15 was recorded as non-cash compensation and $323 was recorded as prepaid expense on the conversion of VitaMedaccompanying consolidated financial statements.
In October 2011, we issued 600,000 Warrants as described above) with a weighted average contractual lifefair value of 8.0 years and exercise prices ranging from $0.24$133,045 to $1.50 per share resulting in a weighted averagean officer of our company for services performed. The Warrants were valued on the date of the issuance using an exercise price of $0.39 per share.
In December 2011, we issued 184,211 Warrants with Companya fair value of $25,980 to an unrelated entity for consulting services covered under a two month agreement. The Warrants totaled approximately $349,000.
| Purpose | Number of Shares Under Company Warrants | Exercise Price | Exercise Term in Years | Fair Value | ||||||||||||
| Loan guaranty | 613,713 | $0.24 | 10 | $ | 93,969 | |||||||||||
| Loan consideration | 613,718 | $0.41 | 5 | 30,993 | ||||||||||||
| Product consulting | 1,045,485 | $0.38-$0.41 | 5-10 | 189,942 | ||||||||||||
| Services | 784,711 | $0.38-$1.50 | 5-10 | 159,363 | ||||||||||||
| 3,057,627 | $ | 474,267 | ||||||||||||||
In December 2011, VitaMed entered into a Business Loan Agreement and Promissory Note for a $300,000 bank line of credit (the “Bank LOC”) for which the bank required a personal guarantee and cash collateral. Personal guarantees and cash collateral limited to $100,000 each were provided by Robert Finizio and John Milligan, officers of VitaMed, and by Reich Family Limited Partnership,two-year consulting agreement with an entity controlled by Mitchell Krassan, alsoproviding help to evaluate improvements to existing products and new products as well as services, including research, design, compliance, scientific and regulatory affairs, and commercialization of products. As compensation, the consultant received 800,000 fully vested and non forfeitableWarrants. The Warrants were valued on the date of the issuance using an officerexercise price of VitaMed.$0.38; a term of 10 years; a volatility of 45.94%; risk free rate of 2.23%; and a dividend yield of 0%. The Bank LOC accrued interestWarrant vested immediately. The fair value of the warrants was $177,394 at the ratedate of 3.020% per annum based on a year of 360 daysgrant and was due on March 1, 2012. The bankamortized to research and development expense over the life of the agreement which is when the research and development activities were performed. During the years ended December 31, 2013, 2012 and 2011, we recognized $71,688, $95,582 and $10,124, respectively, in research and development expenses related to this agreement.
In July 2011, VitaMed negotiatedalso entered into a one-year extension toconsulting agreement with the Bank LOC which was executed on March 19, 2012 (the “Bank LOC Extension”). The Bank LOC Extension accrues interest atsame consultant, whereby Consultant would assist in the ratedesign, development, and distribution efforts of 2.35% and is due on March 1, 2013. In consideration forVitaMed’s initial product offering. As compensation, the personal guarantees and cash collateral, VitaMed issuedConsultant received 200,000 fully vested non forfeitable VitaMed Warrants (or a Warrant for an aggregate of 499,998 Units (or Company Warrants for an aggregate of 613,713245,485 shares pursuant to the Conversion Ratio). The ten-year Warrants vestVitaMed Warrant was valued on the date of the grant at the rate of an aggregate of 76,714 shares per calendar quarter end and have$12,548 using an exercise price of $0.2444 per share. In$0.41; a term of five years; a volatility of 39.44%; risk free rate of 1.56%; and a dividend yield of 0%. The Warrant vested immediately. The fair value of the event that the bank loan is repaid prior to being fully vested, the Company Warrants will be reissued only for the number of shares vested throughwarrants was $12,548 at the date of repayment. At Marchgrant and was amortized to research and development expense over the life of the agreement which is when the research and development activities were performed. During the years ended December 31, 2013, 2012 and 2011, we recognized $0, $6,936 and $5,612 respectively, in research and development expenses related to this agreement. In June 2011, VitaMed issued promissory notes, or the VitaMed Notes, in the aggregate of $500,000 with 500,000 accompanying VitaMed Warrants (or Warrants for an aggregate of 306,867613,718 shares will be vested thereunder. of our Common Stock taking into account the merger). The VitaMed Warrants were valued on the date of the grantissuance using an exercise price of $0.41; a term of 10 years; a volatility of 47.89%; risk free rate of 3.48%; and a dividend yield of 0%. Of the $93,969 fair value, $38,159 was recorded as loan guaranty costs in other income and expense and $55,810 was recorded as prepaid expense on the accompanying consolidated financial statements.
THERAPEUTICSMD, INC. AND SUBSIDIARIES
NOTES TO CONSOLIDATED FINANCIAL STATEMENTS
In March 2011,VitaMed entered into a one-year consultingbusiness loan agreement with Lang Naturals, Inc. (“Lang”), wherein Lang would assistFirst United for a $300,000 line of credit for which personal guarantees and cash collateral were required. Personal guarantees and cash collateral limited to $100,000 each were provided by Mr. Finizio, Mr. Milligan, and Reich Family Limited LP (See NOTE 9 for more details). In consideration for the personal guarantees and cash collateral, VitaMed issued an aggregate of 499,998 VitaMed Warrants (or Warrants for an aggregate of 613,713 shares of our Common Stock taking into account the merger). The ten-year Warrants vested at the rate of an aggregate of 76,714 shares per calendar quarter end and have an exercise price of $0.24 per share. On November 13, 2012, the outstanding balance was repaid in full and business loan agreement was amended to reflect a $100,000 bank line of credit. As part of the design, developmentamended line of credit, the personal guarantees and distribution effortscash collateral were removed for Mr. Finizio and Mr. Milligan. In accordance with the terms of VitaMed’s initial product offering. As compensation, Lang received a VitaMed Warrant for 200,000 shares (or a Company Warrant for 245,485 shares pursuantthe Warrants, Warrants previously issued to Mr. Finizio and Mr. Milligan were amended to reflect the amount vested prior to the Conversion Ratio)date of the amended line of credit (179,000 each). At December 31, 2013, an aggregate of 562,571 Warrants were vested. The VitaMed Warrant wasWarrants, with a fair value of $93,969 ($86,139 after adjusting for the effect of the amended line of credit ), were valued on the date of the grant using a term of five (5) years; a volatility of 39.44%; risk free rate of 1.56%; and a dividend yield of 0%. The Company Warrant vested immediately. Of the $12,548 fair value, $5,612 was recorded as non-cash compensation and $6,936 was recorded as prepaid expense on the accompanying consolidated financial statements.
| F-27 |
THERAPEUTICSMD, INC. AND SUBSIDIARIES
NOTES TO CONSOLIDATED FINANCIAL STATEMENTS
Summary of our Warrant activity and related information for 2011-2013
| Number of Shares Under Warrants | Weighted Average Exercise Price | Weighted Average Remaining Contractual Life in Years | Aggregate Intrinsic Value | |||||||||||||
| Balance at December 31, 2010 | ─ | |||||||||||||||
| Issued | 3,057,627 | $ | 0.36 | 7.9 | $ | 3,483,691 | ||||||||||
| Exercised | ─ | |||||||||||||||
| Expired | ─ | |||||||||||||||
| Cancelled | ─ | |||||||||||||||
| Balance at December 31, 2011 | 3,057,627 | $ | 0.36 | 7.9 | $ | 3,483,691 | ||||||||||
| Issued | 17,332,500 | $ | 1.26 | 4.3 | $ | 31,891,150 | ||||||||||
| Exercised | (8,145,486 | ) | $ | 0.38 | ||||||||||||
| Expired | ─ | |||||||||||||||
| Cancelled | (51,142 | ) | $ | 0.24 | ||||||||||||
| Balance at December 31, 2012 | 12,193,499 | $ | 1.63 | $ | 17,971,994 | |||||||||||
| Issued | 2,100,000 | $ | 2.72 | 4.8 | $ | 5,232,500 | ||||||||||
| Exercised | ─ | |||||||||||||||
| Expired | ─ | |||||||||||||||
| Cancelled | ─ | |||||||||||||||
| Balance at December 31, 2013 | 14,293,499 | $ | 1.79 | 3.9 | $ | 48,932,777 | ||||||||||
| Vested and Exercisable at December 31, 2013 | 13,764,710 | $ | 1.81 | 3.9 | $ | 46,840,559 | ||||||||||
As of December 28, 2011, the Company granted a Company Warrant for 500 shares31, 2013, we had warrants outstanding with a fair valueexercise prices ranging from $0.24 to $3.20 per share. As of $338 to an unrelated individual for consulting services covered under a three (3) month agreement. The Company Warrant was valued on the date of the grant using a term of 10 years; volatility of 51.83%; risk free rate of 0.91%; and a dividend yield of 0%. The Company Warrant vested immediately. Of the $338 fair value, $15 was recorded as
The weighted average fair value per share of Company Warrants grantedwarrants issued and the assumptions used in the Black-Scholes Model during the years ended December 31, 2013, 2012 and 2011 are set forth in the table below.
| 2013 | 2012 | 2011 | ||||||||||
| Weighted average fair value | $ | 2.83 | $ | 2.05 | $ | 0.16 | ||||||
| Risk-free interest rate | 0.88-1.12 | % | 0.72-1.04 | % | 0.91-3.48 | % | ||||||
| Volatility | 44.29-45.89 | % | 44.64-44.81 | % | 39.13-51.83 | % | ||||||
| Term (in years) | 5-6 | 5 | 5-10 | |||||||||
| Dividend yield | 0.00 | % | 0.00 | % | 0.00 | % | ||||||
The risk-free interest rate assumption is based upon observed interest rates on zero coupon U.S. Treasury bonds whose maturity period is appropriate for the term.
Estimated volatility is a measure of the amount by which the Company’sour stock price is expected to fluctuate each year during the term of the award. The Company’sOur estimated volatility is an average of the historical volatility of the stock prices of its peer entities whose stock prices were publicly available. The Company’sOur calculation of estimated volatility is based on historical stock prices over a period equal to the term of the awards. The CompanyWe used the historical volatility of peer entities due to the lack of sufficient historical data of itsour stock price during 2001-2011.
THERAPEUTICSMD, INC. AND SUBSIDIARY
NOTES TO CONSOLIDATED FINANCIAL STATEMENTS
Options to Purchase Common Stock purchase warrants during the year ended December 31, 2010.
| Number of Shares Under Company Warrant | Weighted Average Exercise Price | Weighted Average Remaining Contractual Life | Aggregate Intrinsic Value | |||||||||||||
| Balance at December 31, 2010 | -0- | |||||||||||||||
| Granted | 3,057,627 | $ | 0.36 | 8.7 | $ | 3,483,691 | ||||||||||
| Exercised | -0- | |||||||||||||||
| Expired | -0- | |||||||||||||||
| Cancelled | -0- | |||||||||||||||
| Balance at December 31, 2011 | 3,057,627 | $ | 0.36 | 8.7 | $ | 3,483,691 | ||||||||||
| Vested and Exercisable at December 31, 2011 | 2,254,758 | $ | 0.37 | 5.6 | $ | 2,361,339 | ||||||||||
In 2009, the Companywe adopted the 2009 Long Term Incentive Compensation Plan, (the “LTIP”)or the 2009 Plan, to provide financial incentives to employees, members of the Board, anddirectors, advisers, and consultants of the Companyour company who are able to contribute towards the creation of or who have created stockholdershareholder value by providing them stock options and other stock and cash incentives, (the “Awards”).or the Awards. The Awards available under the LTIP2009 Plan consist of stock options, stock appreciation rights, restricted stock, restricted stock units, performance stock, performance units, EVA awards, and other stock or cash awards as described in the LTIP.2009 Plan. There are 25,000,000 shares authorized for issuance thereunder. Prior to the Merger,merger, no awards had been issued under the LTIP.
| Number of Shares Under Company Option | Weighted Average Exercise Price | Weighted Average Remaining Contractual Life | Aggregate Intrinsic Value | |||||||||||||
| Balance at December 31, 2010 | -0- | |||||||||||||||
Granted (1) | 10,682,218 | $ | 0.16 | 7.6 | $ | 14,188,484 | ||||||||||
| Exercised | (92,057 | ) | $ | 0.19 | ||||||||||||
| Expired | -0- | |||||||||||||||
| Cancelled | -0- | |||||||||||||||
| Balance at December 31, 2011 | 10,590,161 | $ | 0.16 | 7.6 | $ | 14,067,649 | ||||||||||
| Vested and Exercisable at December 31, 2011 | 6,581,049 | $ | 0.13 | 7.5 | $ | 9,038,719 | ||||||||||
On February 23, 2012, we adopted the 2012 Stock Incentive Plan, or the 2012 Plan, a non-qualified plan that was amended in August 2013. The 2012 Plan was designed to serve as an aggregateincentive for retaining qualified and competent key employees, officers, directors, and certain consultants and advisors of 10,590,161our company. There are 10,000,000 shares with a weighted average contractual life of 7.6 years and exercise prices ranging from $0.10 to $1.22 per share resulting in a weighted average exercise priceour Common Stock authorized for issuance thereunder. As of $0.16 per share.
The valuation methodology used to determine the fair value of Company Optionsstock options is the Black-Scholes-Merton option-pricing model (“Black-Scholes Model”), an acceptable model in accordance with ASC 718-10.Model. The Black-Scholes Model requires the use of a number of assumptions including volatility of the stock price, the risk-free interest rate, and the expected life.
| 2011 | 2010 | |||
| Risk-free interest rate | 0.91-2.54% | 1.27-3.12% | ||
| Volatility | 37.92-40.48% | 36.34-42.46% | ||
| Expected life (in years) | 5.5-6.25 | 5-6.25 | ||
| Dividend yield | 0.00% | 0.00% |
| 2013 | 2012 | 2011 | ||||||||||
| Risk-free interest rate | 0.65-1.71 | % | 0.61-2.23 | % | 0.91-2.54 | % | ||||||
| Volatility | 33.35-45.76 | % | 40.77-46.01 | % | 37.92-40.48 | % | ||||||
| Term (in years) | 5-6.25 | 5-6.25 | 5.5-6.25 | |||||||||
| Dividend yield | 0.00 | % | 0.00 | % | 0.00 | % | ||||||
The risk-free interest rate assumption is based upon observed interest rates on zero coupon U.S. Treasury bonds whose maturity period is appropriate for the expected life. Estimated volatility is a measure of the amount by which the Company’sour stock price is expected to fluctuate each year during the term of the award. The Company’sOur estimated volatility is an average of the historical volatility of the stock prices of itsour peer entities whose stock prices were publicly available. The Company’sOur calculation of estimated volatility is based on historical stock prices over a period equal to the term of the awards. The CompanyWe used the historical volatility of our peer entities due to the lack of sufficient historical data of itson our stock price during 2001-2011.price. The average expected life is based on the contractual term of the option using the simplified method.
THERAPEUTICSMD, INC. AND SUBSIDIARIES
NOTES TO CONSOLIDATED FINANCIAL STATEMENTS
A summary of activity under the 2009 and 2012 Plans and related information for 2011-2013 follows:
| Number of Shares Under Options | Weighted Average Exercise Price | Weighted Average Remaining Contractual Life in Years | Aggregate Intrinsic Value | |||||||||||||
| Balance at December 31, 2010 | ─ | |||||||||||||||
| Granted(1) | 10,682,218 | $ | 0.16 | 7.6 | $ | 14,188,484 | ||||||||||
| Exercised | (92,057 | ) | $ | 0.19 | ||||||||||||
| Expired | ─ | |||||||||||||||
| Cancelled | ─ | |||||||||||||||
| Balance at December 31, 2011 | 10,590,161 | $ | 0.16 | 7.6 | $ | 14,067,649 | ||||||||||
| Granted | 5,121,250 | $ | 2.80 | 9.7 | $ | 1,737,530 | ||||||||||
| Exercised | (1,931,788 | ) | $ | 0.13 | ||||||||||||
| Expired | ─ | |||||||||||||||
| Cancelled | (46,135 | ) | ||||||||||||||
| Balance at December 31, 2012 | 13,733,488 | $ | 1.16 | 7.7 | $ | 26,804,117 | ||||||||||
| Granted | 2,583,677 | $ | 3.31 | 9.8 | $ | 4,920,981 | ||||||||||
| Exercised | (75,423 | ) | ||||||||||||||
| Expired | (250 | ) | ||||||||||||||
| Cancelled | (608,750 | ) | ||||||||||||||
| Balance at December 31, 2013 | 15,632,742 | $ | 1.44 | 7.2 | $ | 58,878,132 | ||||||||||
| Vested and Exercisable at December 31, 2013 | 11,282,627 | $ | .80 | 6.5 | $ | 48,321,930 | ||||||||||
(1)This includes (i) VitaMed Options granted between October 2008 and December 31, 2010 for an aggregate of 7,639,722 Units, of which 16,000 were canceled prior to conversion (or Options for 9,357,561 shares per the Conversion Ratio), (ii) VitaMed Options granted between January 1, 2011 and October 3, 2011 for an aggregate of 621,000 Units (or Options for 762,235 shares per the Conversion Ratio) and (iii) Options granted between October 4, 2011 and December 31, 2011 for an aggregate of 562,422 shares. The terms and conditions of the VitaMed Options were reflected in the replacement Options including the number of shares vested.
At December 31, 2013, our outstanding options had exercise prices ranging from $0.10 to $4.67 per share.
Share-based compensation expense for Company Optionsoptions recognized in our results for the years ended December 31, 2013, 2012, and 2011 ($3,200,655, $1,832,061, and 2010 ($180,087 and $177,601$183,355, respectively) is based on awards vested and we estimated no forfeitures. ASC 718-10 requires forfeitures to be estimated at the time of grant and revised in subsequent periods if actual forfeitures differ from the estimates.
At December 31, 2011 and 2010,2013, total unrecognized estimated compensation expense related to non-vested Company Optionsunvested options granted prior to that date was approximately $244,000 and $206,000, respectively,$3,921,000, which is expected to be recognized over a weighted-average period of 3.31.3 years. No tax benefit was realized due to a continued pattern of operating losses.
THERAPEUTICSMD, INC. AND SUBSIDIARIES
NOTES TO CONSOLIDATED FINANCIAL STATEMENTS
In December 2013, we issued a restricted stock unit, or the liability methodRSU, under our 2012 Plan to an officer for the temporary differences between the financial reporting basispurchase of 50,000 shares of our Common Stock. The RSU will vest on April 1, 2014 and income tax basishas a fair value of the Company’s assets and liabilities. Deferred income taxes are measured based on the tax rates expected to be in effect when the temporary differences are included in the Company’s tax return. Deferred tax assets and liabilities are recognized based on anticipated future tax consequences attributable to differences between financial statement carrying amounts of assets and liabilities and their respective tax bases.$233,500. As of December 31, 2013, we recorded $53,428 of non-cash compensation.
NOTE 11 – INCOME TAXES
For the years ended December 31, 2013, 2012 and 2011, there iswas no provision for income taxes, current or deferred.
At December 31, 2011, the Company had2013, we have a federal net operating loss carry forward of approximately $2.1 million,$37,000,000 available to offset future taxable income through 2031. The Company2033.
At December 31, 2013, 2012, and 2011, we have state net operating loss carryforwards of approximately $35,000,000 available to offset future losses through 2033. We established valuation allowances equal to the full amount of the deferred tax assets due tobecause of the uncertainty of the utilization of the operating losses in future periods. The CompanyWe periodically assessesassess the likelihood that itwe will be able to recover itsthe deferred tax assets. The Company considersWe consider all available evidence, both positive and negative, including historical levels of income, expectations and risks associated with estimates of future taxable income.
Our deferred tax asset and liability as presented in the accompanying consolidated financial statements consist of the following:
| 2013 | 2012 | 2011 | ||||||||||
| Deferred Income Tax Assets: | ||||||||||||
| Net operating losses | $ | 14,773,537 | $ | 5,920,861 | $ | 748,404 | ||||||
| R&D Credit | 547,511 | 186,346 | ||||||||||
| Total deferred income tax asset | 15,321,048 | 6,107,207 | 748,404 | |||||||||
| Valuation allowance | (15,321,048 | ) | (6,107,207 | ) | (748,404 | ) | ||||||
| Deferred Income Tax Assets, net | $ | -0- | $ | -0- | $ | -0- | ||||||
Our provision for income taxes differs from applying the statutory U.S. federal income tax rate to the income before income taxes. The primary differences result from deducting certain expenses for financial statement purposes but not for federal income tax purposes.
THERAPEUTICSMD, INC. AND SUBSIDIARY
NOTES TO CONSOLIDATED FINANCIAL STATEMENTS
A reconciliation between taxes computed at the differences between the actual income tax benefitfederal statutory rate and the amount computed by applying the statutory federalconsolidated effective tax rate (35%) to the loss before taxes areis as follows:
| Expected income tax benefit at statutory rate | $ | (4,519,678 | ) | |
| Non-deductible expenses: | ||||
| Debt settlement | 2,586,500 | |||
| VitaMed pre-merger loss | 1,164,629 | |||
| Other non-deductible expenses | 22,912 | |||
| Change in valuation account | 745,637 | |||
| Income tax expense (benefit) | $ | -0- |
| 2013 | 2012 | 2011 | ||||||||||
| Federal statutory tax rate | 35.0 | % | 35.0 | % | 35.0 | % | ||||||
| State tax rate, net of federal tax benefit | 5.8 | % | 5.5 | % | -0- | % | ||||||
| Adjustment in valuation allowances | (32.4 | )% | (18.2 | )% | (5.8 | )% | ||||||
| Permanent and other differences | (8.4 | )% | (22.3 | )% | (29.2 | )% | ||||||
| Provision (Benefit) for Income Taxes | -0- | % | -0- | % | -0- | % | ||||||
NOTE F12 – OTHER CURRENT ASSETS
| December 31, | ||||||||
| 2011 | 2010 | |||||||
| Deposits with vendors | $ | 300,503 | $ | -0- | ||||
| Prepaid consulting | 95,962 | -0- | ||||||
| Prepaid insurance | 52,611 | 6,292 | ||||||
| Prepaid guaranty costs | 46,984 | -0- | ||||||
| TOTAL OTHER CURRENT ASSETS | $ | 496,060 | $ | 6,292 | ||||
| December 31, | ||||||||
| 2011 | 2010 | |||||||
| Website | $ | 91,743 | $ | 65,791 | ||||
| Equipment | 33,651 | 30,837 | ||||||
| Furniture and fixtures | 26,219 | 26,219 | ||||||
| 151,613 | 122,847 | |||||||
| Accumulated depreciation | (81,500 | ) | (26,655 | ) | ||||
| TOTAL FIXED ASSETS | $ | 70,113 | $ | 96,192 | ||||
| December 31, | ||||||||
| 2011 | 2010 | |||||||
| Prepaid consulting | $ | 71,689 | $ | -0- | ||||
| Prepaid guaranty costs | 8,826 | -0- | ||||||
| TOTAL OTHER ASSETS | $ | 80,515 | $ | -0- | ||||
Loan Guaranty
In March 1, 2011, the Company entered into a Demand Promissory Note with the Company’s then majority shareholder wherein the Company could periodically borrow funds to satisfy its operational requirements. Interest accrued at 20% per annum. On October 4, 2011, this Demand Promissory Note plus accrued interest totaling $170,152 was forgiven. The forgiveness of this related party debt was included in additional paid in capital on the accompanying financial statements.
Loans from Affiliates
In June 2011, VitaMed issued promissory notes, or the VitaMed Notes, in the aggregate principal amount of $500,000, of which $100,000 was sold to affiliates. In June 2012, the affiliate notes were extended to October 15, 2012 (one held by Mitchell Krassan, also an officer of VitaMed. The Bank LOC accrued interest at the rate of 3.020% per annum based onMr. Milligan for $50,000 and one for $50,000 held by BF Investments, LLC, which is owned by Brian Bernick, a year of 360 days and was due on March 1, 2012. The bank and VitaMed negotiated a one-year extension to the Bank LOC which was executed on March 19, 2012 (the “Bank LOC Extension”). The Bank LOC Extension accrues interest at the rate of 2.35% and is due on March 1, 2013. At December 31, 2011, the outstanding principle balancemember of the Bank LOC was $300,000. board of directors of our company. On October 4, 2012 these VitaMed Promissory Notes were paid in full including $5,341 in accrued interest.
In consideration for the personal guaranteesDecember 2011, we issued 4% promissory notes to Mr. Finizio and cash collateral, VitaMed issued VitaMed WarrantsMr. Milligan and for an aggregate of 499,998 Units (or Company Warrants for an aggregate of 613,713 shares pursuant to the
| December 31, | ||||||||
| 2011 | 2010 | |||||||
| Accrued payroll | $ | 227.477 | $ | -0- | ||||
| Accrued vacation | 68,438 | 24,208 | ||||||
| Other accrued expenses | 128,473 | 90,998 | ||||||
Dividends payable(1) | 41,359 | -0- | ||||||
| TOTAL OTHER CURRENT LIABILITIES | $ | 465,747 | $ | 115,206 | ||||
Lock Up Agreements
As required by the terms of the Merger Agreement, a Lock Up Agreement (“Agreement”) wasmerger agreement with VitaMed dated July 18, 2011, we entered into between the Company and security holdersLock-Up Agreements with stockholders covering the aggregate of 70,000,000 shares of the Company’sour Common Stock issued pursuant to the Mergermerger or reserved for issuance pursuant to Company Optionsstock options and Company Warrants.warrants. Each security holderstockholder agreed that during a lock-up period from the date of the Agreementlock-up agreements until eighteen (18)18 months thereafter (the “Lock-Up Period”), they would not make or cause any sale of the Company’s securities.our common stock. After the completion, of the Lock-Up Period, the security holdereach stockholder agreed not to sell or dispose of more than 2.5 percent (2.5%)2.5% of the stockholder’s aggregate Common Stock or shares reserved for issuance for Company Optionsunder stock options and Company Warrantswarrants per quarter over the following twelve (12) month12-month period, (the “Dribbleor the Dribble Out Period”).Period. Upon the completion of the Dribble Out Period, the Agreements shallwill terminate.
THERAPEUTICSMD, INC. AND SUBSIDIARIES
NOTES TO CONSOLIDATED FINANCIAL STATEMENTS
Purchases by Related Parties
During 2013, 2012, and 2011, and 2010, the Companywe sold itsour products to Dr. Brian Bernick, a director of the Company,our company, in the amounts of $0, $2,632 and $20,669, respectively, while $0, $1,272 and $25,269, respectively. At$0 of receivables related thereto remained outstanding at December 31, 2013, 2012 and 2011, and 2010, $0 and $79, respectively, remained outstanding.
Agreements with Pernix Therapeutics, LLC
On February 29, 2012, Cooper C. Collins, President and largest shareholder of Pernix Therapeutics, LLC, or Pernix, was elected to serve on our board of directors. We closed a Stock Purchase Agreementstock purchase agreement with Pernix on October 4,5, 2011. From time to time, the Company has, and will continue to, enterwe have entered into agreements with Pernix in the normal course of business, whichbusiness. All such agreements are reviewed by independent directors or a committee consisting of independent directors. During the years ended December 31, 2013, 2012, and will be negotiated2011, we made purchases of approximately $0, $404,000 and $19,000, respectively, from Pernix. At December 31, 2013, 2012, and 2011, there were amounts due Pernix of approximately $46,000, $308,000 and 19,000 outstanding, respectively.
Additionally, there were amounts due to us from Pernix for legal fee reimbursement relating to a litigation matter pursuant to a license and supply agreement, in arms-length transactions. The Presidentthe amounts of $249,981 and largest shareholder$0 for the periods ending December 31, 2013 and December 31, 2012, respectively.
Warrants assigned to Related Party
In June 2012, a warrant to purchase 100,000 shares of Pernix, Cooper C. Collins,our Common Stock was recently electedassigned to serve on the Company’s Boardson of Directors.
NOTE L13 - BUSINESS CONCENTRATIONS
We purchase our products from several suppliers with approximately 98%, 76%, and 95% and 93% comingof our purchases supplied from one suppliervendor for the years ended ending December 31, 2013 2012, and 2011, respectively.
We sell our prescription dietary supplement products to wholesale distributors, specialty pharmacies, specialty distributors, and 2010,chain drug stores that generally sell products to retail pharmacies, hospitals, and other institutional customers. Revenue generated from sales to three customers, Cardinal Health, Inc., Amerisource Bergen, and McKesson Corporation accounted for 79%, 63% and 42% of our recognized revenue for years ended December 31, 2013, 2012, and 2011, respectively.
For the years ended December 31, 2013 and 2012, 64% and 28% of our recognized revenue and 97% and 98% of our deferred revenue was generated from sales to only three customers: AmerisourceBergen Corporation, Cardinal Health, Inc., and McKesson Corporation. We did not sell to these customers in prior years.
NOTE M14 – COMMITMENTS AND CONTINGENCIES
Operating Lease
We lease administrative and distribution facilitiesoffice space in Boca Raton, Florida pursuant to a forty-five63 month non-cancelable operating lease commencing on July 1, 2013 and expiring in 2013.on September 30, 2018. The lease stipulates, among other things, average base monthly rents of $5,443 plus the Company’s share$30,149 (inclusive of monthly estimated operating expenses of $3,500expenses) and sales tax. tax, for a total future minimum payments over the life of the lease of $1,899,414.
THERAPEUTICSMD, INC. AND SUBSIDIARIES
NOTES TO CONSOLIDATED FINANCIAL STATEMENTS
The straight line rental expense related to our current lease contains one renewal optiontotaled $180,894 for an additional two-year period.
As of December 31, 2011,2013, future minimum rental payments are as follows:
| Years Ending December 31, | ||||
| 2012 | $ | 111,725 | ||
| 2013 | 56,601 | |||
| 2014 | -0- | |||
| 2015 | -0- | |||
| Thereafter | -0- | |||
| Total | $ | 168,326 | ||
| Years Ending December 31, | |||||
| 2014 | $ | 316,039 | |||
| 2015 | 371,240 | ||||
| 2016 | 382,377 | ||||
| 2017 | 393,848 | ||||
| 2018 | 302,748 | ||||
| Total minimum lease payments | 1,766,252 | ||||
| Noncancelable sub-lease income | (38,956 | ) | |||
| Net minimum lease payments | $ | 1,727,296 | |||
NOTE 15 – SELECTED QUARTERLY FINANCIAL DATA (UNAUDITED)
Summarized quarterly financial data for fiscal years 2013 and 2012 is as follows:
| 2013 Quarters | ||||||||||||||||
| (In thousands, except per share) | 1st | 2nd | 3rd | 4th | ||||||||||||
| Revenues | $ | 1,537 | $ | 2,081 | $ | 2,295 | $ | 2,863 | ||||||||
| Gross profit | $ | 1,157 | $ | 1,617 | $ | 1,646 | $ | 2,396 | ||||||||
| Net loss | $ | (6,376 | ) | $ | (6,009 | ) | $ | (7,673 | ) | $ | (8,361 | ) | ||||
| Loss per common share, basic and diluted | $ | (0.06 | ) | $ | (0.05 | ) | $ | (0.06 | ) | $ | (0.06 | ) | ||||
| 2012 Quarters | ||||||||||||||||
| (In thousands, except per share) | 1st | 2nd | 3rd | 4th | ||||||||||||
| Revenues | $ | 722 | $ | 819 | $ | 1,036 | $ | 1,241 | ||||||||
| Gross profit | $ | 386 | $ | 447 | $ | 729 | $ | 908 | ||||||||
| Net loss | $ | (13,290 | ) | $ | (11,850 | ) | $ | (4,253 | ) | $ | (5,727 | ) | ||||
| Loss per common share, basic and diluted | $ | (0.16 | ) | $ | (0.14 | ) | $ | (0.04 | ) | $ | (0.06 | ) | ||||
NOTE 16_ – SUBSEQUENT EVENTS
On January 6, 2014, options for 390,000 shares of stock were granted to certain members of our Board of Directors under the Company paid approximately $245,0002012 Plan for their services to be rendered in 2014. The options were granted for a non-affiliated third party for fees related to research and developmentperiod of new products. The Company believes that it could incur additional related fees up to $950,000 in 2012.
| As of | ||||||||
| December 31, 2010 | ||||||||
| As Reported | As Restated | |||||||
| Additional paid in capital | $ | 537,561 | $ | 261,174 | ||||
| Accumulated deficit | $ | (4,356,100 | ) | $ | (4,079,713 | ) | ||
For the Year Ended December 31, 2010 | ||||||||
| As Reported | As Restated | |||||||
| Sales, general and administration | $ | 3,650,959 | $ | 3,464,810 | ||||
| Total operating expense | $ | 3,739,144 | $ | 3,552,994 | ||||
| Operating loss | $ | (3,053,613 | ) | $ | (2,867,464 | ) | ||
| Net loss | $ | (3,053,613 | ) | $ | (2,867,464 | ) | ||
On February 24, 2012, TherapeuticsMD, Inc. (the “Company”) sold and issued Secured Promissory Notes (the “Notes”) to Steven G. Johnson (“Johnson”) and Plato & Associates, LLC (“Plato”) in the principal base amount of $1,358,014 and $1,357,110 respectively (the “Principal Base Amount(s)”) pursuant to the terms of that certain Note Purchase Agreement (the “Note Purchase Agreement”) of even date therewith. As consideration for the Notes, Johnson and Plato surrendered certain promissory notes previously issued by the Company in the aggregate amount of $858,014 and $857,110 respectively (which sums include principle and interest through February 24, 2011) (collectively known as the “Prior Notes”). As a result of the foregoing the Company received an aggregate of $1,000,000 of new funding from Johnson and Plato. On March 23, 2012, each of Johnson and Plato loaned the Company an additional $500,000 under the Notes for an aggregate of $1,000,000.
Election of Additional Directors2014.
On February 29, 2012, the Company’s Board of Directors elected four additional individuals to serve as members of its Board of Directors, including: Samuel A. Greco, Cooper Collins, Robert V. LaPenta, Jr. and Nicholas Segal.
Issuance of Company Options
On February 27, 2012, the Company issued Company Options to Robert G. Finizio and John Milligan, officers and directors of the Company. The ten-year Company Options are for 300,000 shares each and have an exercise price of $2.20 per share. The Company Options vest in full on February 27, 2013.
Approval of Committee Charters and Committee Appointments
On February 29, 2012, the Company’s Board of Directors (i) approved charters for each of the Audit Committee, Compensation Committee and Corporate Governance Committee, (ii) appointed members to each committee and (iii) named a Chair of each committee.
Members of the Audit Committee include Robert V. LaPenta, Jr., Samuel A. Greco and Nicholas Segal. Mr. LaPenta, Jr. will serve as Chair.
Members of the Compensation Committee include Cooper Collins, Robert G. Finizio and Nicholas Segal. Mr. Collins will serve as Chair.
Members of the Corporate Governance Committee include John C.K. Milligan, IV, Brian Bernick and Robert LaPenta, Jr. Mr. Milligan will serve as Chair.
On March 1, 2012, the Company launched its first prescription prenatal vitamin,vitaMedMD™ Plus Rx,a single-dose product containing one prenatal vitamin tablet and one life’s DHA™ capsule.