CAUTIONARY NOTE REGARDING FORWARD LOOKING STATEMENTS
Certain oral and written statements made by Vystar Corporation about future events and expectations, including statements in this Annual Report on Form 10-K (the “Report”) contain forward-looking statements, within the meaning of the Securities Exchange Act of 1934, as amended (the “Exchange Act”) and the Securities Act of 1933, as amended ( the(the “Securities Act”), that involve risks and uncertainties. For those statements, we claim the protection of the safe-harbor for forward-looking statements contained in the Private Securities Litigation Act of 1995. In some cases, forward-looking statements are identified by words such as “believe,” “anticipate,” “expect,” “intend,” “plan,” “will,” “may” and similar expressions. You should not place undue reliance on these forward-looking statements, which speak only as of the date of this Report or the statement. All of these forward-looking statements are based on information available to us at this time, and we assume no obligation to update any of these statements. Actual results could differ from those projected in these forward-looking statements as a result of many factors, including those identified in “Risk Factors,” “Management’s Discussion and Analysis of Financial Condition and Results of Operations” and elsewhere. We urge you to review and consider the various disclosures made by us in this Report, and those detailed from time to time in our filings with the Securities and Exchange Commission (the “SEC”), that attempt to advise you of the risks and factors that may affect our future results. We qualify any forward-looking statements entirely by these cautionary factors.
The above-mentioned risk factors are not all-inclusive. Given these uncertainties and that such statements, speak only as of the date made; you should not place undue reliance on forward-looking statements. We undertake no obligation to update publicly or revise any forward-looking statements, whether as a result of new information, future events or otherwise.
3
| ITEM 1. | BUSINESS |
Products and Services
For more information, visitwww.vytex.com, www.vystarcorp.com.
Natural Rubber Latex
Vystar Corporation (“Vystar”, the “Company”, “we”, “us”, or “our”)is based in Worcester, Mass., Vystar® Corp is the exclusive creator and exclusive owner of the innovative technology to produce Vytex®Vytex Natural Rubber Latex (NRL), a multi-patented, all-natural, raw material that contains significantly reduced levels of the proteins found in natural rubber latex and can be used in over 40,000 products, and the owner of RxAir UV light air purification products. Vytex NRL is a 100% renewable resource, environmentally safe, “green” and fully biodegradable. Vystar is working with manufacturers across a broad range of consumer and medical products bringing Vytex NRL to market in adhesives, gloves, balloons, condoms, other medical devices and natural rubber latex foam mattresses, toppers, and pillows.
Vytex is currently used in multiple mattress lines, including Natura™ and Gold Bond®; Jeffco manufactured components for toppers and mattresses, which are sold to multiple manufacturers; and private label toppers, pillows and mattresses sold online via sites such as Amazon and Bed Bath & Beyond. Vytex is also used in industrial adhesives, apparel padding and threads, shoes, sports equipment and electrical gloves and Vytex 3D printed fabrics available through partners like Tami Care. Liquid Vytex can be ordered wholesale through Halcyon Agri’s RCMA and CentroTrade.
About RxAir
RxAir promotes a healthy lifestyle through the use of its innovative, patented ViraTech air purification technology, thereby improving the quality of life of each and every customer. Independently tested by EPA- and FDA-certified laboratories, the RxAir has been proven to destroy greater than 99% of bacteria and viruses and reduce concentrations of odors and Volatile Organic Compounds (“NRL”VOCs”). The RxAir uses high-intensity germicidal UV lamps that destroy bacteria and viruses instead of just trapping them, setting it apart from ordinary air filtration units. RxAir® and ViraTech ® are registered trademarks of UV Flu Technologies, Inc. For more information, visit http://www.RxAir.com
The Vytex Division contains our global multi-patented technology that reduces antigenic and total protein in natural rubber latex products to virtually undetectable levels. Vytex NRL, our “ultra-low protein” natural rubber latex has been introduced throughout the worldwide marketplace that uses NRL or latex substitutes as a raw material for end products. Natural rubber latex or latex substitutes are used in an extensive range of products including balloons, textiles, footwear and clothing (threads), adhesives, foams (mattresses, pillows, mattress toppers, etc.), furniture (foam and adhesives), carpet, paints, coatings, protective equipment, sporting equipment, and, especially health care products such as condoms, surgical and exam gloves, among others. Our challenge has been that a manufacturer’s conversion from the use of standard latex or synthetic raw material to Vytex NRL involves a protracted sales cycle ranging from eighteen to thirty-six months. We have seen that same cycle apply to the newest version of Vytex NRL, a dry rubber sampling targeted for the tire and tubing industries. Additionally, in the past, our primary method of distribution was via toll manufacturing. We now have several licensing agreements in place for global distribution that have allowed us to focus on and transition to sales and marketing with a technical oversight.
Natural rubber latex is an agricultural product produced from the sap of the rubber tree,Hevea brasiliensis. In presentations at the 5th World Elastomer Conference held in Dusseldorf, Germany during early March 2018 it was noted that there was a slowing growth rate in global NR consumption and it was predicted demand would fall over the next two years. The numbers 1 and 2 producers (Thailand and Indonesia) had a modest fall in production while Malaysia, China and India showed a large negative gap between output and capacity mainly based on current low prices. Vietnam continues at 85 to 95% capacity. There is a huge natural rubber capacity surplus until the early 2030s and prices will remain flat through 2025. With growing substitution of synthetics, that an uptick in prices may not occur and based on the pricing of synthetics the market share competition may weigh more to synthetics.
Substantially all the latex processors are in Southeast Asia, India, Africa and Latin America and are owned by local groups or large multinational corporations. This future demand is awakening interest in other areas of the world where the climate is suitable, particularly in Guatemala, where focus now shifts to certifications from the Forestry Stewardship Council and Rainforest Alliance, as a specialty latex. In addition to the resurgence of Central and South America in natural rubber latex production, countries such as Vietnam, Cambodia and Cameroon have launched major efforts to meet the needs of the global liquid natural rubber latex market. Vietnam is now a major processor of our Vytex NRL and severalNRL. Several trial runs of the specialty offerings discussed below that are in place for manufacturer trials and wetrials. We now have two producers in Guatemala, one in the trial phase.
Our initial product portfolio included Vytex NRL in high ammonia (HA) and low ammonia (LA) formulations. New specialized formulations are projected to come to market over the next year with trials in ultra-low ammonia, pre-vulcanized and low nitrosamine versions currently taking place. Vystar has used its technology to work with customers to solve production issues and provide them with a point of difference and guidance as research using Vytex has headed into directions previously thought to be off-limits to natural rubber latex. It appears to be the removal of the vast majority of the proteins, the carotenoids and the non-rubbers that affords Vytex NRL this opportunity.
Board of Directors Member and Research & Development Director Ranjit K. Matthan, Ph.D., revealed ongoing developments in the formulation of Vytex NRL with reduced or no ammonia and nitrosamines at the International Latex Conference (ILC) session titled “Advances in Environmentally Friendly Ultra Low Protein Natural Rubber Specialty Latices” on August 12, 2015. The significant advances in aluminum hydroxide-treated Vytex NRL properties and applications are potential game-changers for the issues of volatile organic content and nitrosamines for some critical latex products, such as balloons, catheters, condoms, and other medical devices, as well as enabling cleaner and more sustainable work environments. The expanded Vystar product grades make it applicable in a wider range of latex products with the advantage of improved environmental impact through reduced leachables/extractables. The advances deliver a simplified, sustainable, totally safe raw material that Vystar can offer for several applications without reservations about nitrosamines. Vystar has initiated a scale up to lab production of all three newer versions of Vytex NRL and has commenced a sample fulfillment mode with a significant manufacturer of women’s intimate apparel who is in the final testing stages of two of the grades (no ammonia and ultra-low ammonia) as possible replacements of their current raw materials.
Recently at the Nuremberg Toy Show (Speilwarenmesse) Vytex NRL was a targeted product for manufacturers of balloons, masks, etc. On the main page of the European Balloons and Party Council web sitewebsite there is still a Yahoo video still plus a recent press release that discusses the benefits of Vytex NRL in items such as balloons. As there is a new proposal for limits on protein content of balloons by virtue of an EN listing, Vytex has now gone in to full prevulcanized testing to start the sampling process in selected areas based on manufacturing needs.
Over the course of several years, our technical groups have presented technical papers of varying topics that still hold relevance. Vytex NRL is produced at the latex processor level and can be integrated into the current processing environments without additional capital equipment investment. The protein removal and modification process that leads to Vytex NRL allows manufacturers to lower manufacturing costs with the benefit of reduced protein levels. Reduced leaching times and resulting reductions in energy, water and material handling consumption can lead to realized cost savings.
Also, the article “Eco-Friendly Manufacturing of High Performance Latex using Ultra Low Antigenic Protein Latex” reviewed some of the learnings Vystar had made since commercializing Vytex NRL. Among these discoveries were: improved air and helium retention in balloons; reduced leaching needs for some dipped products; truer colors for dyed dipped products (such as balloons); and low latex odor in foams, which has now led to unique research into areas previously considered off-limits to NRL. Vystar published and presented a paper, “Further Development of Vytex® Natural Rubber Latex Leads to Strong Niche Market Advances”, that added additional learnings related to slow release (memory) foam formulations and other technical improvements helping customers solve their new product development challenges.
Vystar has transitioned from toll manufacturing agreements to licensing agreements that eliminate the need to maintain a costly infrastructure along with the other investment and regulatory compliance costs to develop and operate a processing or manufacturing facility. All of these costs are or will be borne by our manufacturing and distribution contractors and/or customers. This means we must show the NRL producers and product manufacturers the economic value proposition of including Vytex NRL in their product lines, hence the technical paper presentations we have made and continue to make. In addition, as an all-natural raw material, Vytex NRL puts the main component in gloves and other products back in the environmentally friendly arena.
To implement our licensing model, in March 2010 we signed a licensing agreement with Pica de Hule Natural, a division of Grupo Agroindustrial de Occidente (“Occidente”), located in Guatemala. Occidente is the largest processor of natural rubber latex in Latin America and the largest exporter serving more than 15 countries. Under the agreement, Occidente will manufacture, sell and market Vytex NRL throughout Latin America as well as supply Vytex NRL to North America and Europe. This agreement was continued in 2017 and remains in place currently.
Additionally, in 2017, Vystar began trials to process various Vytex offerings, including pre-vulcanized grades, at Forteleza’s new facility in Guatemala with initial good results. This is an important strategic maneuver to handle demand in the North, Central and South American regions as well as certain areas of Southeast Asia. This will lead to a new agreement between the two companies upon successful completion of the trials.
In addition, in January 2009, we entered into a Distribution Agreement with Centrotrade Minerals & Metals, US and Centrotrade Deutschland, GmbH, Germany, a leading global distributor of latex raw materials, to create a worldwide distribution network that will further enhance our ability to cost effectively reach and service manufacturer customers in these key manufacturing areas. This provides an expansive distribution network that facilitates both the licensing and toll manufacturing models and can assist with various processors in taking their products to market. On December 19, 2012, we amended our agreement with Centrotrade to expand Vytex NRL distribution rights to the world’s largest NRL consuming markets in Southeast Asia, specifically Malaysia and Thailand. Under this new license agreement, Centrotrade controls production scheduling of Vytex NRL, inventory in Thailand, sales, pricing and customer financing, while Vystar will focus on marketing, customized product development, as noted above, and support activities. Vystar currently has no exclusive areas under contract as RCMA, a Dutch based distributor was added in 2016.
In December 2017 Halcyon Agri, the owners of Centrotrade, announced that they had acquired RCMA’s polymer group and would operate it under the Wurfbain label.
The paper entitled, “The Non-Enzymatic Deproteinization of Natural Rubber Latex (DPNRL) Enabling the Greater Versatility in End Product Applications” discussed improvements that extend beyond the ultra-low allergenicity of the DPNRL and include improved color, absence of rubber odor, and improved physicochemical attributes. Improved air and helium retentions results were reported. The potential to extend applications into other non-conventional areas other than latex end products was discussed and we are currently in the final retail test market stages for the United States based manufacturing of mattresses, pillows and toppers to key furniture stores and buying groups, primarily in the Northeastern United States and signed a 5 year renewable agreement in January 2015 with Nature’s Home Solutions (NHS) to exclusively distribute these products in the United States. In September 2016, the Vystar Board of Directors voted to end the January 2015 NHS agreement and replace it with a global exclusive for foam manufactured with Vytex and sold into the home furnishings industry. This change reflects the global nature of the mattress, topper and pillow businesses, the need for local warehousing, and access to container loads of foam cores and pillows for European and Asian manufacturers.
In April of 2018 Vystar acquired the assets of NHS Holdings, LLC (NHS) executing on the first part of the Company’s vision to move into direct product offerings made from Vytex® latex. NHS was the exclusive U.S. distributor of Vystar’s Vytex® natural rubber latex foam to manufacturers for use in over 200 home furnishings products, including mattresses, toppers, pillows and upholstery, sold through multiple channels. This acquisition provides Vystar with roll packing and cutting equipment to support our bedding manufacturing partners, while lowering the cost of Vytex to the manufacturer by eliminating the middleman.
Now unified under the Vytex brand, we anticipate developing additional product offerings and solidifying partnerships with multiple major manufacturing partners throughout the home furnishings industry. We anticipate our new offerings will include cushions and padding for use in seating and other products which we believe will achieve higher margins.
NHS was a related party transaction for Vystar, approved by NHS members, who are also major Vystar shareholders, business partners and insiders. Notable NHS members include:
| ● | Lam Ngoc Minh, CEO of Lien ‘A, which is one of the world’s largest latex foam manufacturers, and a major producer of Vytex foam. Lien ‘A has worked closely with NHS to develop traditional and innovative new foam products; | |
| ● | Keith Osborn, MD; member of Vystar Board of Directors, orthopedic spine surgeon and Vystar’s largest shareholder; | |
| ● | Bryan Stone, MD, member of Vystar Board of Directors, nephrologist and CEO of Fluid Energy Conversion; | |
| ● | Joseph Allegra, MD, Director at Oncology Molecular Imaging LLC, a Director & Owner at Cyber Logistics, Inc., a Founder at Diamond Investments II LLC and an Owner at Lincoln Lee Investments LLC; and | |
| ● | Steven Rotman, now CEO of Vystar, and CEO of Rotmans Furniture and Carpet, a large independent furniture retailer. |
On April 18, 2018, Vystar acquired assets of NHS for 27,769,500 shares of restricted common stock of Vystar valued at approximately $1.1 million. NHS assets included: current inventory, equipment and intellectual property related to product development.
Vytex is considered by many as one the best foam product in the world, as it is sustainably sourced; biodegradable; purer and more resilient and durable than competitors’ latex; virtually free of odor, VOCs and allergenic proteins; and competitively priced for a wide array of over 40,000 products. Vytex is available in many offerings such as low/no ammonia and low/no nitrosamine formulations, which are now being required in certain countries and by certain manufacturers. Vystar anticipates fulfilling this multi-billion-dollar market need with Vytex.
Vystar has also expanded licensing arrangements into the consumer arena, with the licensing of foam products produced with and labeled as “Made with Vytex NRL”. Specifically working with partners, to introduce foam made with Vytex into the mattress, mattress topper and pillow arenas aligning with key foam manufacturers, mattress, mattress toppers and pillow producers, and furniture stores in specific areas of the Unites States. In May 2018, Vystar announced the signing of the aforementioned exclusive global distribution agreementacquisition with Worcester, MA based NHS who sources eco-friendly materials and technologies for use in furnishings and other markets. NHS has completed several trials with Vietnamese, European and Indian makers of foam products to use its Vytex NRL raw material in their current offerings in their own areas as well as to supply added needs for foam cores in both the mattress and topper arenas globally. The current requests from major mattress manufactures for Vytex foam trials involves different densities especially those used on the upper levels of mattresses. The samples have been presented to the manufacturers and feedback has been very positive with names such as Gold Bond, King CoilKoil (Natura) and SpringAirSpring Air (Nature’s Rest) adding Vytex to their current offerings. A similar trial occurred in October 2016 in Thailand focusing on specific densities and pillows, and a meeting with a Belgian foam maker using a unique drying concept occurred in May 2016 with discussions ongoing. In addition, with the acquisition of NHS and working with NHS and a large Vietnamese foam manufacturer, Lien A, the group attended the International Sleep Products Association (ISPA) in Orlando in March 2016 and has followed that joint effort with ISPA 2018 in Charlotte, North Carolina.and 2019. The significance of ISPA is the focus on components for use with major mattress and pillow manufacturers, which takes Vytex foam to an additional audience.
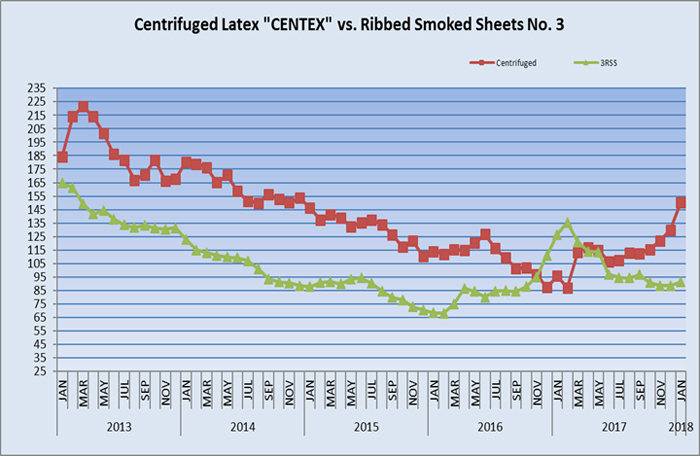
Pricing of materials in the rubber and latex industries continues to fluctuate as noted by the graph below courtesy of Centrotrade. Prices of centrifuged latex, thus Vytex, have risen throughout 2016, 2017, and into early 2018 due to various factors such as floods in southern Thailand, removal of older tress and replanting which is a seven-year process, newer plantations coming online, etc.Competition
Competition
Natural Rubber Latex
Synthetic raw materials such as ethylene, propylene, styrene and butadiene compete with NRL. Currently, it is estimated that NRL processors have lost one-half of the overall latex market to synthetic latex. Despite the switch to non-latex alternatives, it is estimated that almost 70% of exam gloves and nearly 80% of surgical gloves used in U.S. hospitals are still made with NRL.
During 2017 and 2018 Vystar contracted with varioustwo consultants and manufacturers to make exam and surgical gloves on an OEM basis. The testing and results were encouraging and led to further efforts prepare for a potential launch of these lines in 2018.2019. The company is going to proceed with testing and subsequent filing with the USFDA to obtain 510(k) allowances. With this new OEM structure, the Company will bring several versions (surgical, exam, household, etc) of the gloves to market under its own OEM brand label.
Several attempts, including new source crops, synthetic lattices and various treatment methods, have been made by competitors to eliminate problem proteins from Hevea NRL by biological, physical and/or chemical methods that act on proteins. One approach has been to introduce the latex articles to multiple leaching steps and chlorination. While it does reduce the protein levels in the finished product, it weakens the latex film thus compromising the desirable physical properties of the product. Another attempt to reduce proteins in NRL is the use of proteolytic enzymes to degrade the proteins in the latex solution but this approach introduces another protein (the enzyme) to the latex, which may itself be allergenic. Attempts to commercialize two other non-Hevea NRL materials have been made in the United States: guayule rubber latex and Taraxacum kok-saghyz, also known as the Russian dandelion. These materials are reported to be higher in cost compared to natural rubber latex and presently are available only in limited quantities.
These facts, coupled with the uncomplicated transition to the utilization of Vytex NRL, make it very attractive for processors to regain lost business by switching to Vytex NRL. We believe our unique patented technology offers a viable alternative to the marketplace. The licensing model will allow the message to spread through more sales channels than we could reach in the past.
Intellectual Property
Vystar has four issued patents by the United States Patent Trademark Office (“USPTO”) that were issued in 2005 (Patent No. 6,906,126), 2006 (Patent No. 7,056,970), 2011 (Patent No. 8,048,951) and 2012 (Patent No. 8,324,312). International patents include one issued patent from the Republic of South Africa in 2009 (2008/00886)(2008/00886), a second foreign patent issued by China in 2011 (No. 200580051526.1)200580051526.1), a third foreign patent issued by Japan in 2012 (No. 4944885) and a fourth foreign patent issued by Hong Kong in 2013 (HK1125959). In 2005, we sought international patent protection of our application that would become our U.S. Patent No. 6,906,126 pursuant to the Patent Cooperation Treaty (“PCT”) (No. PCT/US2005/025018), and this application has been nationalized in the following countries and regions: The European Union (No.05775523.3)(No.05775523.3), Canada (No. 2,614,945), India (No.295/DELNP/2008), and Sri Lanka (No.14827). Additionally, this PCT was nationalized back into the United States to expand our protection to both method and composition claims (No.11/988,498). We expect patents to be issued in these countries without objection.
On January 18, 2012, we converted the provisional patent filed January 18, 2011 (No. 61/433,853) to full utility applications based on new discoveries and unexpected results (No. 13/374,851). We also sought international protection for the new developments and unexpected results reflected in this 2009 USPTO patent application through another PCT application (No. PCT/US2009/031445). This PCT application was nationalized in the following countries in 2010: the European Union (No. 09702339.4)09702339.4), Brazil (No. PI0906513-0), Guatemala (No. 2010-000208)2010-000208), India (No.2487/KOLNP/2010), Indonesia (No. W-00201002436), and Malaysia (No. PI2010003317). In addition, we filed the same patent application that was the subject of our USPTO patent application No. 12/356,355 and PCT/US2009/031445 directly into Thailand (No. 0901000201)0901000201). Thailand has informed us our patent application is now published for open comments and Vystar has responded to various questions by Thailand’s patent office and is awaiting their response.
On January 18, 2017 Vystar was informed that the Indian Patent Office approved our application (2487/KOLNP/2010) entitled, “Natural Rubber Latex Having Reduced Allergenicity and Method of Making” under Patent Number 279323.
On February 8, 2017 Vystar received notice of grant from the Guatemalan Patent Office for application number 2010-000208 entitled, “Natural Rubber Latex Having Reduced Allergenicity and Method of Making” and is awaiting a grant number.
On October 27, 2017 Vystar was granted its second Indian patent (288824) from Application No.: 295/DELNP/2008 entitled: “Decreasing Allergenicity of Natural Latex Rubber Prior to Vulcanization.” The European Patent Office issued a Decision to Grant Vystar’s patent application under European Patent Number 1 902 089 titled “Decreasing Allergenicity of Natural Latex Rubber Prior to Vulcanization” greatly expanding the territory covered by the Company’s intellectual property portfolio. The mention of the grant was published in the European Patent Bulletin 13/35 dated 28 August 2013. Vystar selected the United Kingdom (065143-011612/UK)(065143-011612/UK), Germany (065143-011611/DE)(065143-011611/DE), and Austria (065143-001610/AT)(065143-001610/AT) as validation points for this specific patent. There is a
In March 2019 Vystar Corp.was granted European, EP Patent No. 2238183 (its second patent application still inEuropean patent) entitled “Natural Rubber Latex Having Reduced Allergenicity and Method of Making Same.” Vystar now holds 13 foreign and 4 U.S. patents related to its latex deproteinization process for the production of Vytex®, a natural rubber latex (NRL) that is virtually free of allergen-causing latex proteins, for products including balloons, examination and surgical gloves, condoms, breather bags, latex tubing, probe covers, catheters, threads, foams, cold seal and pressure sensitive adhesives. Vystar has now broadened its protected areas in Europe that can expandto include additional manufacturing areas in Germany, the countries that are validated.United Kingdom, France, Spain and Italy, which account for much of latex product manufacturing in Europe for another ten years.
On December 9, 2016 Vystar was notified by our Singaporean IP Counsel that Malaysia Application No PI 2010003317 entitled “Natural Rubber Latex Having Reduced Allergenicity and Method of Making” was cleared for issuance and that a Notice of Grant will be issued.
Vystar filed and has received registered trademark protected status in the United States for the marks “Vystar”, “Vytex” and “Created by Nature. Recreated by Science.” In 2010 Vystar filed for international trademark protection of “Vytex” in Malaysia (No.2010013149)(No.2010013149) and India (No. 1992991)1992991), which was granted in India. On November 18, 2014, the Company was informed that the “VYTEX” trademark was registered in Malaysia effective May 30, 2014. The aforementioned trademarks have been renewed successfully in each period as required.
While we believe that the pending patent and trademark applications will be granted without objection, there are no guarantees that all such patents or trademarks will be granted by each relevant governing body. No assurance can be given that such patent and trademark protection will provide substantial protection from competition. We realize that the market for Vytex NRL is an industrialized world concern and we are committed to aggressively challenging any infringements of our patents and/or trademarks. As of December 31, 2017,2018, Vystar has expended, since inception, approximately $290,195$370,245 on such patent and trademark costs and has budgeted approximately $25,000$55,000 more for the year ended December 31, 20182019 to continue to pursue and maintain its patents and trademarks around the world.
Research and Developmentworld
Vytex NRL has produced protein test results on finished products that are both “below detection” and “not detectable” in termsRXAIR Intellectual Property
In May of 2018, Vystar acquired substantially all of the amountassets of proteins remaining in these finished goods made with Vytex NRL. These results have been reproduced in many subsequent tests. From inception through December 31, 2017, Vystar’s researchUV Flu Technologies, Inc., formerly traded on the OTC under the ticker UVFT, whose patented ViraTech™ UV light air purification technology destroys greater than 99% of airborne bacteria, viruses and development costs have been approximately $2.4 million. These efforts pastother microorganisms and future have beenvirtually eliminates concentrations of odors and will continue to be patented and/or trademarked.volatile organic compounds (VOCs).
UV Flu’s product line includes:
| ● | RXair™ Residential Filterless Air Purifier |
| ● | UV400 ™ FDA cleared Class II Filterless Air Purifier |
| ● | RX3000™ Commercial FDA cleared Class II Air Purifier (news video with RX3000) |
Vystar acquired all UV Flu intellectual property, multiple patents, product lines, tooling, FDA clearances, research data, websites and other assets related to the business.
Government Regulation
In the United States, healthcare and many food and food-based packaging products are subject to regulation by the Food and Drug Administration (FDA). Vystar is not directly subject to regulation by the FDA due to the fact that it does not manufacture a finished medical device or other product, but only provides Vytex NRL as a component or raw material to healthcare or other product manufacturers. However, there will be FDA regulation of the labeling of healthcare and food-based packaging products that are produced with Vytex NRL and the FDA has promulgated standards for good manufacturing practices for manufacturing the end products, which makes the end product manufacturers responsible for seeing that all of their components and component manufacturers, including Vytex NRL, are produced using goodquality manufacturing processes. Additionally, the FDA prohibits the use of the term “hypoallergenic” or “low protein” on any natural rubber latex product it regulates. In order to make any such claim, the latex product manufacturer must seek a waiver from the FDA of such regulatory prohibitions. Commentary by the FDA in its guidance documents and other rulings indicate that the prohibition on the use of the “hypoallergenic” or “low protein” label is based, at least in part, on the fact that, although the use of such terms in such labeling may be intended to indicate that the risk of allergic reaction to residual levels of processing chemicals has been reduced, consumers may interpret the labeling to mean that the risk of allergic reactions to any component in the device would be minimal. Thus the hypoallergenic or low protein label is deemed misleading. There can be no assurance, however, that we will succeed in securing FDA approval for any claim regarding the “hypoallergenic” “low protein” or reduced allergy potential of latex produced with the Vytex NRL process. Failure to secure, if required, such FDA approval, could delay or otherwise detrimentally affect our introduction to natural rubber latex healthcare and/or food packaging products regulated by the FDA. Notwithstanding, the medical or food packaging manufacturer will be able to use the Vytex NRL trademark on its label if size permits to indicate only that the Vytex NRL component was used in the production of the healthcare product, and what protein levels the end product does contain, but no further claim is asserted. We have been able to provide sufficient testing data to the FDA to support our protein level claims with respect to the natural rubber latex antigenic and total proteins present in end products made with Vytex NRL. On May 1, 2009, a condom manufactured from Vytex NRL received 510(k) clearance from the U.S. Food and Drug Administration. This was the first medical product available in the U.S. made from Vytex NRL, which had less than 2 micrograms/dm2, virtually undetectable levels, of the antigenic proteins that cause an allergic response, while retaining and improving upon all of the desirable qualities of latex. While the product is no longer available, thisThis condom is a predicate device for future products and the 510(k) is still in existence. Vystar continues to seek other U.S. and global manufacturers interested in pursuing similar claims for products.
On July 22, 2009, a non-powdered medical exam glove manufactured with Vytex NRL received 510(k) clearance from the FDA, with an approved claim of less than 50 micrograms/gram of total proteins. As with the condom product, Vystar continues to pursue U.S. and global manufacturers using this exam glove as a predicate device and to help fill pending exam glove business. Late in 2016 the FDA banned the use of powder in medical gloves which took effect early in 2017 positioningadvantaging the position of the Vytex non-powdered exam glove in an excellent position.glove..
Inflation and Seasonality
We do not believe that our operations are significantly impacted by inflation. Our NRL business is not seasonal in nature but is subject to commodity pricing. Our NRL product is a commodity-based raw material and prices for such material fluctuate from day-to-day, though this will have less impact as we transition to sales via licensing fees.
Employees
As of December 31, 2017,2018, Vystar had a total of one associate.associate, Steven Rotman, CEO.
Corporate Information
Vystar Corporation is a Georgia corporation that was incorporated in 2003. Our predecessor company, Vystar LLC, was formed by our founder, Travis Honeycutt, in February 2000 as a Georgia limited liability company.
Our principal mailing address is 101 Aylesbury Rd., Worcester, MA 01609. Our website address is www.vytex.com. www.vytex.com & www.vystarcorp.com.
The information contained on, or that can be accessed through, our website is not a part of this Report. We have links on our website to reports, information statements, and other information that we file electronically with the Securities and Exchange Commission, or SEC, at the Internet website maintained by the SEC, www.sec.gov. In addition to visiting our website and the SEC’s website, you may read and copy public reports we file with or furnish to the SEC at the SEC’s Public Reference Room at 100 F Street, N.E., Washington, D.C. 20549. You may obtain information on the operation of the Public Reference Room by calling the SEC at 1-800-SEC-0330.
| ITEM 1A. | RISK FACTORS |
Our business is subject to a number of risks and uncertainties — many of which are beyond our control — that may cause our actual operating results or financial performance to be materially different from our expectations. If one or more of the events discussed in the following risksbelow were to occur, actual outcomes could differ materially from those expressed in or implied by any forward-looking statements we make in this report or our other filings with the SEC, and our business, financial condition, results of operations or liquidity could be materially adversely affected; furthermore, the trading price of our common stock could decline and our shareholders could lose all or part of their investment.
Vystar presently does not generate the cash needed to finance its current and anticipated operations.
The Company has had very limited revenue in its history prior to 2011 and transitioned from the development stage to the operational stage during the fourth quarter of 2009. The Company is still in the early stage of establishing our business including attracting new customers and increasing sales; oursales. Our financial success will be dependent upon the soundness of our business concept, our management’s ability to successfully and profitably execute our plan, and our ability to raise additional capital.
Our limited operating history makes it difficult to evaluate our business. We expect to make significant future operating expenditures to develop and expand our business into areas such as OEM product lines and offerings in the mattress and furniture arenas. We may incur significant losses in the future for a number of reasons, including due to the other risks described in this Report, and we may encounter unforeseen expenses, difficulties, complications and delays and other unknown events. Accordingly, we may not be able to achieve or maintain profitability, and we may incur significant losses for the foreseeable future. See additional discussion under Liquidity and Capital Resources.
At December 31, 20172018 our cash position was $50,052 and we had $13,502 cash on hand and an accumulated deficit of $27,999,122.$34,072,553. We plan to finance our operations for the next twelve (12) months through the use of cash on hand, stock warrant exercises from existing shareholders, raising of capital through private placements and the possible acquisition of a cash flow positive foam business in key areas of the furniture world that includes finished mattresses, component cores, topper cores and pillows. You should consider, among other factors, our prospects for success in light of the risks and uncertainties encountered by companies that, like us, have not generated net earnings on an annual basis. Various factors, such as economic conditions, regulatory and legislative considerations, and competition, may also impede our ability to expand our market presence. We may not successfully address these risks and uncertainties or successfully implement our operating strategies. If we fail to do so, it could materially harm our business and impair the value of our common stock. Even if we accomplish these objectives, we may not generate positive cash flows or profits we anticipate in the future.
The following risk factors apply to our Vytex Division:
Our Vytex operating results could fluctuate and differ considerably from our financial forecasts.
Our business model is based on assumptions derived from (i) the experience of the principals of the Company, and (ii) third party market information and analysis. There are no assurances that these assumptions will prove to be valid for our future operations or plans.
Our operating results may fluctuate significantly as a result of a variety of factors, including:
| ● | Acceptance by manufacturers of the Vytex Natural Rubber Latex technology; | |
| ● | Our ability to achieve and sustain profitability; | |
| ● | Consumer confidence in products manufactured using our Vytex Natural Rubber Latex technology; | |
| ● | Our ability to raise additional capital. |
Our Vytex NRL Division business is totally dependent on market demand for, and acceptance of, the Vytex Natural Rubber Latex process.
We expect to derive most of our Vytex NRL Division revenue from the sales of our Vytex Natural Rubber Latex raw material to various manufacturers of rubber and rubber end products using NRL through our distribution agreement with Centrotrade Deutschland. We pay natural rubber latex processors a fee for the service of manufacturing and creating Vytex NRL for us under our toll manufacturing agreements. Conversely, Vystar collects a fee under the Centrotrade and Occidente (PICA) licensing models. The agreement in the bedding and furniture industries with NHS also provides income based on a license model. Our Vytex NRL product operates within broad, diverse and rapidly changing markets. As a result, widespread acceptance and use of product is critical to our future growth and success. If the market for our product fails to grow or grows more slowly than we currently anticipate, demand for our product could be negatively affected.
Our ability to generate significant revenue in the Vytex Division is substantially dependent upon the willingness of consumers to make discretionary purchases and the willingness of manufacturers to utilize capital for research and development and the retooling of their manufacturing process, both of which are impacted by the state of the economy.
The current state of the world economy has and likely will in the future impact upon our ability to increase revenue. Certain of the products that we anticipate will be manufactured with our Vystar NRL process, such as mattresses and sponge products, are considered discretionary consumer purchases which decline during economic downturns. Additionally, certain manufacturers who might otherwise utilize the Vytex NRL process in the manufacturing of products with NRL have determined not to expend capital to complete the research of the Vytex NRL process or to retool their manufacturing process because of the general downturn in the economy. As part of a strategy to increase awareness of the Vytex NRL brand, the Company has been aggressively seeking to have end products produced and labeled “made with Vytex NRL” such as mattresses, toppers and pillows. As these products enter the market, the Company plans to create consumer awareness of these end products and in so doing begin to develop consumer demand pull through as part of the Company’s efforts to complete the push-pull cycle using an ingredient branding strategy.
Assertions by a third party that our Vytex process infringes its intellectual property, whether or not correct, could subject us to costly and time-consuming litigation or expensive licenses.
There is frequent litigation based on allegations of infringement or other violations of intellectual property rights. As we face increasing competition and become increasingly visible as an operating company, the possibility of intellectual property rights claims against us may grow.
Any intellectual property rights claim against us or our customers, with or without merit, could be time-consuming, expensive to litigate or settle and could divert management attention and financial resources. An adverse determination also could prevent us from offering our process, require us to pay damages, require us to obtain a license or require that we stop using technology found to be in violation of a third party’s rights or procure or develop substitute services that do not infringe, which could require significant resources and expenses.
The latex market in which we will participate is competitive and if we do not compete effectively, our operating results may be harmed.
The markets for our product are competitive and rapidly changing. With the introduction of new technologies, increasing scrutiny of alternative lattices such as Russian dandelion, and new market entrants, we expect competition to intensify in the future. In addition, pricing pressures and increased competition generally could result in reduced sales, reduced margins or the failure of our products to achieve or maintain widespread market acceptance.
While early interest was strong in a new innovative product in the natural rubber latex industry, pricing and regulatory approvals remain a key selling factor especially in the exam glove arena. There is no exam glove manufacturer signed to date that has accepted Vytex NRL into its product mix.
Our Vytex revenue will vary based on fluctuations in commodity prices for NRL.
NRL is a commodity and, as such, its price fluctuates on a daily basis. Our raw material revenue including licensing fees and cost of goods will also fluctuate upward or downward based upon changing market prices for the raw material used to produce Vytex NRL. Prolonged periods of lowered market prices can also cause manufacturers to review synthetic price drops as they look for even lower cost alternatives to NRL. A current example of the fluctuations is shown above in the Centrifuged Latex graph
While Vytex NRL has received 510(k) clearance from the FDA for condoms and exam gloves, there is no assurance that future applications will be cleared.
In order for Vytex to be used in medical device applications, the manufacturer of the end product must submit an application to the FDA. If the device is classified by the FDA as Class II (e.g., condoms, surgical gloves, and most non-cardiac and non-renal/dialysis catheters) and in some cases Class I (e.g., exam gloves), a 510(k) application must be filed with the FDA seeking clearance to market the device based on the fact that there is at least one other predicate or similar device already marketed. If the product is classified as a Class III product (e.g., most cardiac and renal/dialysis catheters, certain adhesives and other in vivo devices), or is otherwise a new device with no predicate on the market already, then the manufacturer of the end product must submit a Pre-Market Approval (“PMA”) application seeking approval by the FDA to market the device. The PMA approval process is much more in depth and lengthy and requires a greater degree of clinical data and FDA review than does a 510(k) clearance process.
Since Vytex is a raw material and not an end-product, Vystar is not the entity that files with the FDA for any clearance or approval to market a device. Instead, the end-product manufacturers who will be selling and marketing the device(s) must submit applications and seek FDA clearance or approval depending upon the device classification. Vystar’s role in this process is only as background support to the manufacturers to supply information and any technical or test data regarding the Vytex raw material if and to the extent needed.material.
An American manufacturer of condoms and exam gloves had been engaged in production work and had completed required testing and received FDA clearance for using Vytex NRL in their condom and exam glove lines. However, this manufacturer is not currently producing products made with Vytex NRL or any other type of raw material. Notwithstanding such approvals, we have no assurance that future products will provide acceptable test results and even if they do, there is no certainty that the FDA will approve the applications.
Each of the above mentioned 510(k)s have been sold to other manufacturers hence the need to pursue 510(k)s for the newer manufacturing facilities.
Vytex may seek to have lower protein claims than what is currently on the market today for exam gloves and may ultimately seek to have latex warnings removed from or modified on all FDA-regulated products, but it cannot guarantee that either of such actions will be approved by the FDA.
The FDA heavily scrutinizes any and all claims categorizing the protein levels and other claims of an NRL product. Currently, the FDA has allowed claims only stating the level of less than 50 micrograms/gram of total extractable proteins pursuant to only one of two FDA-recognized standards on exam or surgical gloves. Vystar intends to claim protein levels pursuant to both of the two FDA-recognized standards, which will result in claiming the lowest level of antigenic proteins for a Hevea NRL product currently on the market. Although the FDA has cleared such claims on the condom using Vytex NRL, the FDA rejected those claims for the exam glove. There is no guarantee that the FDA will ultimately or ever allow these claims on an exam glove.
Additionally, for many years, the FDA has required warnings on products containing latex due to the latex allergy issue that exists. Vystar plans on petitioning the FDA to have that label removed from or modified on products manufactured with Vytex NRL, by filing a Citizen’s Petition. The Petition will be filed when we see that the benefits of filing will far outweigh the costs since such Petition is likely to require clinical test results indicating acceptable allergic reactions associated with Vytex NRL. There are no assurances that the FDA will grant that request.
Manufacturers are implementing trials of Vytex NRL in their facilities but final data areis not yet available from all these manufacturers on its viability for their particular environments.
Over the past several years, samples of Vytex NRL have been made available to over 50 natural rubber latex and latex substitute end product manufacturers, 30 of which have been in place since early 2009. Since the completion of the Vytex NRL Standard Operation Procedures (SOPs), Vytex has been produced at Revertex (Malaysia), Occidente (Guatemala), KAPVL (India) and most recently Mardec-Yala (Thailand) and MMG (Thailand). Manufacturers that have signed a ‘sampling’’sampling’ agreement with us have been provided with samples of Vytex NRL for validating its use in their manufacturing processes. To date, a number of manufacturers have completed those runs and feedback is often minimal. Although most feedback to date has been positive, there is no assurance that such feedback continueswill continue to be satisfactory.
Another risk is the validity of the customer as testing completes. Recently Vystar has completed more than three years of a specialized version of Vytex NRL only to have the end product manufacturer fail to upgrade their production line and fulfill their own contract.
As part of the Company’s learnings, we have found that in listening closely to customer challenges and needs, our technical team has been able to develop solutions. The Company has come to realize that what we offer is not just a raw material but often a technology solution to a production or product development challenge.
While many of these new formulations look promising, there is no guarantee that these technological innovations will be successfully scaled up or successfully implemented by the customer.
The following risk factors apply to our company as a whole:whole:
Because our stock price may be volatile due to factors beyond our control, you could lose all or part of your investment.
Price and volume of stock, including additional stock issuances may cause price decline and dilution.
If we do not attract and retain highly qualified employees, we may not be able to grow effectively.
Our ability to compete and grow depends in large part on the efforts and talents of our executive officers or employees. We require the key employee(s) to enter into employment agreements, but in the U.S. employees are free to leave an employer at any time without penalties. The loss of key employees or the inability to hire additional skilled employees as necessary could result in significant disruptions of our business, and the integration of replacement personnel could be time-consuming and expensive and cause us additional disruptions.
We do not expect to declare any dividends in the foreseeable future.
We do not anticipate declaring any cash dividends to holders of our common stock in the foreseeable future. Consequently, shareholders must rely on sales of their common stock after price appreciation, which may never occur, as the only way to realize any future gains on their investment. Investors seeking cash dividends should not purchase our common stock.
There is no assurance that any significant public market for our shares of common stock will develop.
While our shares of common stock trade on the OTC Bulletin Board under the symbol “VYST”, there is currently no significant public market for our common stock and there is no assurance that there will be any such significant public market for our common stock in the future.
The utilization of our tax losses could be substantially limited if we experience an ownership change as defined in the Internal Revenue Code.
Because of net operating losses we have experienced for federal income tax purposes at December 31, 2017,2018, we had federal net operating loss (“NOL”) carry-forwards of approximately $18.6$20.0 million ($17.818.4 million for 2016) pretax2017) available to offset future taxable income. Our ability to utilize NOL carry-forwards to reduce future taxable income may be limited under Section 382 of the Internal Revenue Code if certain ownership changes in our Company occur during a rolling three-year period. These ownership changes include purchases of common stock under share repurchase programs, the offering of stock by us, the purchase or sale of our stock by 5% shareholders, as defined in the Treasury regulations, or the issuance or exercise of rights to acquire our stock. If such ownership changes by 5% shareholders result in aggregate increases that exceed 50 percentage points during the three-year period, then Section 382 imposes an annual limitation on the amount of our taxable income that may be offset by our NOL carry-forwards or tax credit carry-forwards at the time of ownership change. The limitation may affect the amount of our deferred income tax asset and, depending on the limitation, a significant portion of our NOL carry-forwards or tax credit carry-forwards could expire before we are able to use them. In such an event, our business, financial condition, results of operations or cash flows could be adversely affected.
We believe we have not experienced an ownership change under Section 382 of the Internal Revenue Code as of December 31, 2017;2018; however, the amount by which our ownership may change in the future could be affected by purchases and sales of stock by 5% shareholders and new issuances of stock by us, should we choose to do so.
| ITEM 1B. | UNRESOLVED STAFF COMMENTS |
None
| ITEM 2. | PROPERTIES |
Although we believe that our current space is adequate for the foreseeable future, if additional office space is required, we believe that suitable space will be available at market rates.
| ITEM 3. | LEGAL PROCEEDINGS |
None
On February 19, 2019, EMA Financial, Inc. filed a lawsuit in the Southern District of New York against the Company. The lawsuit alleged various breaches of an underlying convertible promissory note and stock purchase agreement, and sought four claims for relief: (i) specific performance to enforce a stock conversion and contractual obligations; (ii) breach of contract; (iii) permanent injunction to enforce the stock conversion and contractual obligations; and (iv) legal fees and costs of the litigation. The complaint was filed with a motion seeking: (i) a preliminary injunction seeking an immediate resolution of the case through the stock conversion; (ii) a consolidation of the trial with the preliminary injunctive hearing; and (iii) summary judgment on the first and third claims for relief. As of December 31, 2018, there was no accurate assumption of liability to be accrued.
The Company filed an opposition to the motion and at oral argument the motion for injunctive relief was denied. The Court issued a decision permitting a motion for summary judgment to proceed and permitted the Company the opportunity to supplement its opposition papers together with the plaintiff who was also provided opportunity to submit reply papers. On April 5, 2019, the Company filed the opposition papers as well as a motion to dismiss the first and third causes of action in the complaint.
| ITEM 4. | MINE SAFETY DISCLOSURES |
Not applicable
| ITEM 5. | MARKET FOR REGISTRANT’S COMMON EQUITY, RELATED STOCKHOLDER MATTERS AND PURCHASES OF EQUITY SECURITIES |
Market Price Information
Our common stock is traded in the United States on the Over the Counter Bulletin Board (OTCBB) under the symbol “VYST.” The following table shows the range of high and low closing prices for our common stock.
| December 31, 2016 | High | Low | ||||||||||||||
| December 31, 2017 | High | Low | ||||||||||||||
| First Quarter | $ | 0.19 | $ | 0.09 | ||||||||||||
| Second Quarter | $ | 0.18 | $ | 0.10 | ||||||||||||
| Third Quarter | $ | 0.11 | $ | 0.05 | ||||||||||||
| Fourth Quarter | $ | 0.07 | $ | 0.04 | ||||||||||||
| December 31, 2018 | ||||||||||||||||
| First Quarter | $ | 0.10 | $ | 0.06 | $ | 0.08 | $ | 0.02 | ||||||||
| Second Quarter | $ | 0.08 | $ | 0.03 | $ | 0.08 | $ | 0.04 | ||||||||
| Third Quarter | $ | 0.12 | $ | 0.02 | $ | 0.08 | $ | 0.01 | ||||||||
| Fourth Quarter | $ | 0.22 | $ | 0.10 | $ | 0.03 | $ | .0006 | ||||||||
| December 31, 2017 | ||||||||||||||||
| First Quarter | $ | 0.19 | $ | 0.09 | ||||||||||||
| Second Quarter | $ | 0.18 | $ | 0.10 | ||||||||||||
| Third Quarter | $ | 0.11 | $ | 0.05 | ||||||||||||
| Fourth Quarter | $ | 0.07 | $ | 0.04 | ||||||||||||
Holders
As of December 31, 2017,2018, there were 238437 holders of record of our common stock.
Dividends
We have never paid or declared any cash dividends on our common stock and we do not intend to pay or declare dividends on our common stock in the near future. We presently expect to retain any future earnings to fund continuing development and growth of our business. Our payment of dividends is subject to the discretion of our board of directors and will depend on earnings, financial condition, capital requirements and other relevant factors.
Issuer Purchases of Equity Securities
We did not make any repurchases of our equity securities during the 20172018 fiscal year.
Securities Authorized for Issuance Under Equity Compensation Plans
Information concerning our equity compensation plans is set forth in Item 12 of Part III of this Annual Report on Form 10-K.
Recent Sales of Unregistered Securities
Common Stock and Warrant Grants
From January 1, 20172018 through December 31, 2017,2018, we issued 7,244,2251,928,571 shares of our common stock valued at $490,000$90,000 for services rendered to the Company in 2017 and 9,503,9932018, 54,999,997 shares were issued in investments andfor cash for $165,000, 8,333,333 shares were issued to convert payables valued at $44,167, 721,408 shares were issued upon exercise of cashless conversion of options and warrants valued at $384,500.$34,806, and 55,687,500 shares were to be issued as part of a private placement valued at $2,931,019. During the period, 1,109,406203,267,791 shares of common stock valued at $55,359$1,444,320 were issued upon the conversion of convertible notes.notes and accrued interest.
From January 1, 20172018 through December 31, 2017,2018, we issued 1,240,250411,875 warrants to purchase shares of common stock for services rendered to the Company per the following:
| Warrants | Exercise Price per Share | ||||
| $ | |||||
| $ | |||||
Stock Option Grants
From January 1, 20172018 through December 31, 2017,2018, we issued 1,500,00021,800,000 options to purchase common stock to Board members and employeesconsultants valued at $1,161,132.
Proceeds from loans and shareholder, convertible and contingently convertible notes payable
On November 2, 2012, the Company executed a $1,500,000 unsecured line of credit agreement with CMA Investments, LLC, a related party and a Georgia limited liability company (the “CMA Note”). Three of the directors of the Company (“CMA directors”) were initially the members of CMA. Pursuant to the terms of the CMA Note, interest is computed at LIBOR plus 5.25% (8.22% at December 31, 2018) on amounts drawn and fees. The weighted average interest rate in effect on the borrowings for the year ended December 31, 2018 was 7.99%. There are no available borrowings under the CMA note at December 31, 2018. During the year ended December 31, 2018, the Company recorded approximately $123,000 of interest expense.
During the year ended December 31, 2018 certain investors have guaranteed $100,000 each with Fidelity Bank to establish a $500,000 revolving line of credit. At the present time, the Company is paying interest only at a rate of 4.5% per annum, with a balloon payment of $500,000 due in 2033.
From January 1, 2018 to February 9, 2018, the following:Company issued contingently convertible promissory notes (the “Notes”) for contract work performed by other entities in lieu of compensation and expense reimbursement in the amount of $195,635. The Notes are (i) unsecured, (ii) bear interest at an annual rate of five percent (5%) per annum from date of issuance, and (iii) are convertible at the Company’s option post April 19, 2018. The Notes mature one year from issuance but may be extended one (1) additional year by the Company. If converted, the Notes plus accrued interest are convertible into shares of the Company’s common stock at the prior twenty (20) day average closing price with a 50% discount.
From January 1, 2018 and through the date of these financial statements, the Company has issued certain convertible and contingently convertible promissory notes in varying amounts, in the aggregate of $710,000. The face amount of the notes represents the amount due at maturity along with the accrued interest, at which time that amount may be converted into shares of the Company stock based on the lowest 2 day closing price for the trailing 20 days prior to conversion and carrying a 35% discount. The contingently convertible notes provide for interest to accrue at an interest rate equal to 12% per annum or the maximum rate permitted under applicable law after the occurrence of any event of default as provided in the notes. At any time after 180 days from the issue date, the holder, at its option, may convert the outstanding principal balance and accrued interest into shares of common stock of the Company. The initial conversion price for the principal and interest in connection with voluntary conversions by a holder of the convertible notes ranges from $0.05 to $0.10 per share, subject to adjustment as provided therein. If the total outstanding balance of the contingent convertible notes were convertible as of December 31, 2018, they would have been convertible into approximately 343 million shares of the Company’s common stock. Based on the variable conversion price, the Company recorded initial derivative liabilities of $465,905, debt discount of $430,579 and interest expense related to the excess fair value of $35,326 upon the date such notes became convertible.
In connection with the issuance of the convertible notes, the Company issued warrants to purchase 411,875 shares of the Company’s common stock. The exercise term of the warrants ranges from issuance to any time on or after the six (6) month anniversary or prior to the maturity of the related note. The exercise price of the warrants is $0.40 per share of the Company’s common stock, as may be adjusted from time to time pursuant to the antidilution provisions of the related warrant. Pursuant to ASU 2017-11, such antidilution features do not subject the Company to derivative accounting pursuant to ASC 815.
During the year ended December 31, 2018, the Company entered into a financing agreement with Peak One Opportunity Fund, L.P. to receive $435,000 of original issue discount notes in three tranches as follows:
| 1. |
| 2. | September 14, 2018: $150,000 principal $135,000 net. |
| November 13, 2018: a final $200,000 principal, $180,000 net. |
Peak One Opportunity Fund is entitled to convert the note into common stock at a price equal to 65% of the lowest traded price for the twenty trading days immediately preceding the date of the date of conversion. The Company has the option to redeem the note at varying prices based upon the redemption date.
13
During the year ended December 31, 2018, the Company entered into a financing agreement with Crown Bridge Partners, LLC to receive $100,000 of original issue discount notes in two tranches as follows:
| 1. | August 6, 2018: principal $50,000 bearing interest at 8%, discounted by 10%, and $2,000 for legal fees, for a net of $43,000 due one year from the funding date; |
| 2. | The remaining tranche may be funded at the holder’s discretion. |
Crown Bridge Partners is entitled to convert the note into common stock at a price equal to 65% of the average of the two lowest traded prices for the twenty-five trading days immediately preceding the date of the date of conversion.
As of December 31, 2018, only the first tranche had been received and none of it has been converted to stock.
In addition, the following notes are convertible after six months from the issue date:
| Face | Interest | Net Cash | Amount | |||||||||||||||||
| Issue Date and Name | Amount | Rate | Maturity | Proceeds | Converted | |||||||||||||||
| Jan 29, 2018 EMA | $ | 80,000 | 12 | % | Jan 29, 2019 | $ | 72,300 | $ | 79,348 | |||||||||||
| Feb 14, 2018 Auctus | 80,000 | 12 | % | Nov 14, 2018 | 72,500 | 70,625 | ||||||||||||||
| Feb 13, 2018 FirstFire Global | 76,500 | 5 | % | Nov 13, 2018 | 72,500 | 81,500 | ||||||||||||||
| May 2, 2018 Power Up | 83,000 | 12 | % | May 23, 2019 | 80,000 | 83,000 | ||||||||||||||
| Jun 20, 2018 Power Up | 68,000 | 12 | % | Jun 25, 2019 | 65,000 | — | ||||||||||||||
During the year ended December 31, 2018 approximately $418,117 of the convertible notes and approximately $28,000 of accrued interest were exchanged for approximately 203,267,791 shares of common stock. In addition, approximately $75,000 of the notes have been subsequently converted to approximately 24,288,000 of common stock and 15,000,000 shares of common stock for CMA were still being held in escrow as of December 31, 2018.
Application of Securities Laws and Other Matters
No underwriters were involved in the foregoing sales of securities. The securities described above were issued to investors in reliance upon the exemption from the registration requirements of the Securities Act, as set forth in Section 4(2)4 (2) under the Securities Act and Regulation D promulgated thereunder, as applicable, relative to sales by an issuer not involving any public offering, to the extent an exemption from such registration was required.
The issuance of stock options as described above were issued pursuant to written compensatory plans or arrangements with our employees, directors and consultants, in reliance on the exemption provided by Rule 701 promulgated under the Securities Act. All recipients either received adequate information about us or had access, through employment or other relationships, to such information.
All of the foregoing securities are deemed restricted securities for purposes of the Securities Act. All certificates representing the issued shares of common stock, warrants and options described above included appropriate legends setting forth that the securities had not been registered and the applicable restrictions on transfer.
| ITEM 6. | SELECTED FINANCIAL DATA |
As a smaller reporting company, we are not required to provide the information required by this Item pursuant to 301(c) of Regulation S-K.
| ITEM 7. | MANAGEMENT’S DISCUSSION AND ANALYSIS OF FINANCIAL CONDITION AND RESULTS OF OPERATIONS |
This analysis of our results of operations should be read in conjunction with the accompanying financial statements, including notes thereto, contained in Item 8 of this Report. This Report contains certain forward-looking statements within the meaning of Section 27A of the Securities Act, and Section 21E of the Exchange Act. Statements that are predictive in nature and that depend upon or refer to future events or conditions are forward-looking statements. Although we believe that these statements are based upon reasonable expectations, we can give no assurance that projections will be achieved. Please refer to the discussion of forward-looking statements included in Part I of this Report.
Overview
Vystar LLC, the predecessor to the Company, was formed February 2, 2000, as a Georgia limited liability company by Travis W. Honeycutt. Operations under the LLC entity were focused substantially on the research, development and testing of the Vytex® Natural Rubber Latex (“NRL”) process, as well as attaining intellectual property rights. In 2003, the Company reorganized as Vystar Corporation, a Georgia corporation, at which time all assets and liabilities of the limited liability company became assets and liabilities of Vystar Corporation, including all intellectual property rights, patents and trademarks.
We are the creator and exclusive owner of the innovative technology to produce Vytex NRL. This technology reduces antigenic protein in natural rubber latex products to virtually undetectable levels in both liquid NRL and finished latex products. The process also removes many of the naturally occurring non-rubber particles superfluous to end product function, resulting in a cleaner latex base material. We have introduced Vytex NRL, our “ultra-low protein” natural rubber latex, throughout the worldwide marketplace that uses NRL or latex substitutes as a component of manufactured products. Natural rubber latex is used in an extensive range of products including balloons, textiles, footwear and clothing (threads), adhesives, foams, furniture, carpet, paints, coatings, protective equipment, sporting equipment, and especially health care products such as condoms, surgical and exam gloves. We produce Vytex through licensing agreements and have introduced Vytex NRL into the supply channels with aggressive, targeted marketing campaigns directed to the end users.
We transitioned from a development stage company to the operating stage during the last quarter of 2009. During the period of 2010 to 2015, our financial condition and results of operations have experienced substantial fluctuations as we provided introductory pricing in 2010 and then began to switch to a licensing rather than a toll model in 2011. Our licensing model will continue in 20182019 for the raw material business and we will continue our focus in 2019 onward on the licensing contracts associated with the foam and furniture offerings. Accordingly, the financial condition and results of operations reflected in our historical financial statements are not expected to be indicative of our future financial condition and results of operations.
We believe that the key for increased Vytex NRL product acceptance is to focus on companies seeking solutions to production challenges or ways to differentiate their product offering. Vystar’s technical team has been successful in developing customized formulations to meet specific manufacturer needs. Some of these formulations will become new line extensions. Vystar is becoming less of a raw material provider and more of a technology innovator through its technical consultation and formulation activities.
In addition to this technology focus, we are determined to have the “made with Vytex” claim added to products made using various forms of Vytex NRL. To help drive this effort we’re focusing on products that benefit from Vytex NRL low non-rubber features. As part of this effort, we are working with a licensee to launch a line of foam core products used in various bedding products including pillows, mattresses and mattress toppers.
In January 2015 Vystar announced that it had entered into an exclusive agreement with NHS to distribute mattresses, mattress toppers and pillows made with its multi-patented Vytex NRL raw material. NHS is a distribution company led by SteveSteven Rotman of Rotman’sRotmans Furniture and as of December 18, 2017 is the CEO of Vystar and focuses on innovative, sustainably sourced, eco-friendly material and technologies for use in furnishings and other markets. Our Vytex NRL fits the needs of this unique new distributor which has already attracted such firms as mattress manufacturer Gold Bond that was formed in 1899 to manufacture and then distribute mattresses, toppers and pillows along with a plan to reach specific segments of the United States by targeting other manufacturers. Vystar has focused on these segments since 2015 and will continue into 20182019 as we display at furniture and mattress conventions and attend and sell at sleep products meetings such as ISPA 2016 (International Sleep Products Association) held in Orlando, FL and ISPA 2017 in Tampa, FL and attendingattended ISPA 2018 in Charlotte, NC. Vystar will also continue to develop specialty versions of Vytex NRL after presenting to the International Latex Conference in Akron OH in July 2016 and 2017 and sending out samples for lab trials. Vystar is currently producing Vytex thread samples for an entry into the thread marketplace. In September 2016, the Vystar Board of Directors voted to end the January 2015 agreement with NHS and replace it with a global exclusive for foam manufactured with Vytex and sold into the home furnishings industry. This change reflects the global nature of the mattress, topper and pillow businesses.
In April of 2018 Vystar acquired the assets of NHS Holdings, LLC (NHS) executing on the first part of the company’s vision to move into direct product offerings made from Vytex® latex. NHS was the exclusive U.S. distributor of Vystar’s Vytex® natural rubber latex foam to manufacturers for use in over 200 home furnishings products, including mattresses, toppers, pillows and upholstery, sold through multiple channels. This acquisition provides Vystar with roll packing and cutting equipment to support our bedding manufacturing partners, while lowering the cost of Vytex to the manufacturer by eliminating the middleman.
Now unified under the Vytex brand, we anticipate developing additional product offerings and solidifying partnerships with multiple major manufacturing partners throughout the home furnishings industry. We anticipate our new offerings will include cushions and padding for use in seating and other products which we believe will achieve higher margins.
In May of 2018 Vystar acquired substantially all of the assets of UV Flu Technologies, Inc., formerly traded on the OTC under the ticker UVFT, whose patented ViraTech™ UV light air purification technology destroys greater than 99% of airborne bacteria, viruses and other microorganisms and virtually eliminates concentrations of odors and volatile organic compounds (VOCs).
As part of Vystar’s mission to offer eco-friendly, sustainable materials and products that create a better environment for consumers and workers throughout the product lifecycle, UV Flu Technologies is an excellent counterpart to our Vytex materials and Vytex bedding products. Vystar products will help create a perfect natural sleep environment starting with Vytex bedding made from the purest latex in the world and UV Flu’s RxAir™ air purifier ensuring every breath is free of harmful pathogens, VOCs and odors.”
UV Flu products use 48 inches of high-intensity germicidal UV lamps that destroy bacteria, viruses and other germs instead of just trapping them, setting it apart from ordinary air filtration units. RxAir is one of the few UV air purifiers that have been proven in independent EPA- and FDA-certified testing laboratories to destroy on the first pass 99.6% of harmful airborne viruses and bacteria. In addition to inactivating airborne viruses that cause influenza (flu) and colds, RxAir’s device disarms the airborne pathogens that cause MRSA (staph), strep (whooping cough), tuberculosis (TB), measles, pneumonia and a myriad of other antibiotic-resistant and viral infections. (see news video with RX3000 in use)
UV Flu’s product line includes:
| ● | RXair™ Residential Filterless Air Purifier | |
| ● | UV400 ™ FDA cleared Class II Filterless Air Purifier | |
| ● | RX3000™ Commercial FDA cleared Class II Air Purifier (news video with RX3000) |
Vystar acquired all UV Flu intellectual property and multiple patents, product lines, tooling, FDA clearances, research data, websites and other assets related to the business for the purchase price of $975,000 or 27,918,000 shares of Vystar restricted common stock which may not be assigned or sold by UV Flu for 12 months.
Manufacturing, Distribution and Sales
Vystar will continue production of UV Flu product lines with BOI, a world-class manufacturer. Vystar plans to sell RxAir residential and commercial units via Distributors, online and through retail channels.
Vystar is assembling the distribution network to relaunch sales of UV400 and Rx3000 units to the healthcare and medical markets, which UV Flu had ceased due to sales force, distribution and cash flow constraints. Once production and sales are firmly re-established, Vystar expects that the air purification products will produce margins of approximately 75%.
UV Flu’s products have world class engineering, are made to the highest quality standards and are extremely effective in settings ranging from homes to offices, healthcare facilities, salons, restaurants and nursing homes.
About RxAir
RxAir promotes a healthy lifestyle through the use of its innovative, patented ViraTech air purification technology, thereby improving the quality of life of each and every customer. Independently tested by EPA- and FDA-certified laboratories, the RxAir has been proven to destroy greater than 99% of bacteria and viruses and reduce concentrations of odors and VOCs. The RxAir uses high-intensity germicidal UV lamps that destroy bacteria and viruses instead of just trapping them, setting it apart from ordinary air filtration units. RxAir® and ViraTech® are registered trademarks of Vystar Corp. For more information, visit http://www.RxAir.com
Critical Accounting Policies and Estimates
Our discussion and analysis of our financial condition and results of operations are based upon our financial statements, which have been prepared in accordance with U.S. generally accepted accounting principles. As such, we are required to make estimates and assumptions that affect the reported amounts of assets and liabilities and disclosure of contingent assets and liabilities at the date of the financial statements and the reported amounts of revenue and expenses during the reporting period. By their nature, these estimates and judgments are subject to an inherent degree of uncertainty. Our management reviews its estimates on an on-going basis. We base our estimates and assumptions on historical experience, knowledge of current conditions and our understanding of what we believe to be reasonable that might occur in the future considering available information. Actual results may differ from these estimates, and material effects on our operating results and financial position may result.
We believe the following critical accounting policies affect our more significant judgments and estimates used in the preparation of our financial statements.
Fair Value Inputs Related to Share-based and Other Equity Compensation
Generally accepted accounting principles require all share-based payments, including grants of employee stock options, stock grants and warrants, to be recognized in the financial statements based on their fair values. We compute the value of awards granted by utilizing the Black-Scholes valuation model based upon their expected lives, expected volatility, expected dividend yield, and the risk-free interest rate. The value of the awards is then straight-line expensed over the service period of the awards.
Allowance for Doubtful AccountsInventories
Inventory cost includes those costs directly attributable to the product before sale. Inventory consists of foam toppers, mattresses and pillows and is carried at the lower of cost or market (net realizable value), using first-in, first-out method.
Revenue
We maintain allowances for doubtful accounts for estimated losses resultingrecognize revenue when we satisfy a performance obligation in a contract by transferring control over a product to a customer when product is shipped based on fulfillment by the Company. The Company considers fulfillment when it passes all liability at the point of shipping through third party carriers. Consideration is typically paid prior to shipment via credit card or check when our products are sold direct to consumers, which is typically within a 1 to 2 days or approximately 30 days from the inabilitytime control is transferred when sold to wholesalers, distributors and retailers. Taxes assessed by a governmental authority that are both imposed on and concurrent with a specific revenue-producing transaction, that are collected by us from a customer, are excluded from revenue. Shipping and handling costs associated with outbound freight after control over a product has transferred to a customer are accounted for as a fulfillment cost and are included in cost of our customers to make required payments. If the financial condition of our customers were to deteriorate, resulting in an impairment of their ability to make payments, additional allowances may be required. Our allowances for doubtful accounts amounted to $0 for both December 31, 2017 and 2016. For the fiscal year 2017, the Company generated revenue from three customers and we have no history of not collecting from any of them. We therefore determined there was no need currently to carry an allowance for doubtful accounts.product sales.
Fixed Asset Lives
We estimate the useful life of equipment and other fixed assets using judgment, conventions in the industries in which we operate, and research on resale values. The Company currently has no fixed assets on its balance sheet. If the Company were to acquire any fixed assets, we will review equipment and fixed asset lives annually in our impairment analyses.
Impairment Analyses
We review long-lived assets such as property and equipment for impairment whenever events or changes in circumstances indicate the carrying value may not be recoverable. If the total of the estimated undiscounted future cash flows is less than the carrying value of the assets, an impairment loss is recognized for the excess of the carrying value over the fair value of the long-lived assets.
Income Taxes
We account for income taxes using the assets and liability method. This method requires that the deferred tax consequences of temporary differences between the amounts recorded in our financial statements and the amounts included in our federal and state income tax returns be recognized in the balance sheet. Estimates are often required with respect to, among other things, the potential utilization of any operating and capital loss carry-forwards for both federal and state income tax purposes and valuation allowances required, if any, for tax assets that may not be realizable in the future. We believe that it is more likely than not that the amounts recorded as deferred income tax assets will not be recoverable through future taxable income generated by us. As a result, the Company recorded a 100% valuation allowance against our net deferred tax assets as of December 31, 20172018 and 2016.2017. We believe the procedures and estimates used in our accounting for income taxes are reasonable and in accordance with established tax law. A tax benefit arising from an uncertain tax position can only be recognized for financial reporting purposes if, and to the extent that, the position is more likely than not to be sustained in an audit by the applicable taxing authority. We had no material unrecognized tax benefits and related tax liabilities at December 31, 20172018 and 2016.2017. Penalties related to uncertain tax positions would be recorded as a component of general and administrative expenses. Interest relating to uncertain tax positions would be recorded as a component of interest expense. We do not believe there will be any such uncertain tax position, costs or liabilities for any of the years under audit and take a conservative approach to all tax matters.
15
RESULTS OF OPERATIONS
Year ended December 31, 20172018 compared to year ended December 31, 20162017
| Year Ended December 31, | Continuing | Consolidated | Year Ended December 31, | Continuing | Consolidated | |||||||||||||||||||||||||||||||||||||||||||||||||||||||||||||||||||||||||||
| 2017 | 2016 | $ change | % change | $ change | % change | 2018 | 2017 | $ change | % change | $ change | % change | |||||||||||||||||||||||||||||||||||||||||||||||||||||||||||||||||||||
| Continuing | Discontinued | Consolidated | Continuing | Discontinued | Consolidated | Continuing | Discontinued | Consolidated | Continuing | Discontinued | Consolidated | |||||||||||||||||||||||||||||||||||||||||||||||||||||||||||||||||||||
| Revenue, net | $ | 16,754 | $ | — | $ | 16,754 | $ | 40,193 | $ | 82,353 | $ | 122,546 | ($ | 23,439 | ) | (58.3 | %) | ($ | 105,792 | ) | (86.3 | %) | $ | 342,049 | $ | — | $ | 342,049 | $ | 16,754 | $ | — | $ | 16,754 | $ | 325,295 | 1942 | % | $ | 325,295 | 1942 | % | ||||||||||||||||||||||||||||||||||||||
| Cost of revenue | 21,498 | — | 21,498 | 20,473 | 20,222 | 40,695 | 1,025 | 5.0 | % | (19,197 | ) | (47.2 | %) | 385,803 | — | 385,803 | 21,498 | — | 21,498 | 364,305 | 1695 | % | 364,305 | 1695 | % | |||||||||||||||||||||||||||||||||||||||||||||||||||||||
| Gross profit | (4,744 | ) | — | (4,744 | ) | 19,720 | 62,131 | 81,851 | (24,464 | ) | (124.1 | %) | (86,595 | ) | (105.8 | %) | ||||||||||||||||||||||||||||||||||||||||||||||||||||||||||||||||
| Gross loss | (43,754 | ) | — | (43,754 | ) | (4,744 | ) | — | (4,744 | ) | (39,010 | ) | (822 | %) | (39,010 | ) | (822 | %) | ||||||||||||||||||||||||||||||||||||||||||||||||||||||||||||||
| Operating Expenses | ||||||||||||||||||||||||||||||||||||||||||||||||||||||||||||||||||||||||||||||||
| General and administrative | 1,125,638 | — | 1,125,638 | 1,096,354 | 24,045 | 1,120,399 | 29,284 | 2.7 | % | 5,239 | 0.5 | % | 3,671,356 | — | 3,671,356 | 1,125,638 | — | 1,125,638 | 2,545,935 | 226 | % | 2,545,935 | 226 | % | ||||||||||||||||||||||||||||||||||||||||||||||||||||||||
| Total operating expenses | 1,125,638 | — | 1,125,638 | 1,096,354 | 24,045 | 1,120,399 | 29,284 | 2.7 | % | 5,239 | 0.5 | % | 3,671,356 | — | 3,671,356 | 1,125,638 | — | 1,125,638 | 2,545,935 | 226 | % | 2,545,935 | 226 | % | ||||||||||||||||||||||||||||||||||||||||||||||||||||||||
| Profit (Loss) from Operations | (1,130,382 | ) | — | (1,130,382 | ) | (1,076,634 | ) | 38,086 | (1,038,548 | ) | (53,748 | ) | (5.0 | %) | (91,834 | ) | (8.8 | %) | (3,715,110 | ) | — | (3,715,110 | ) | (1,130,382 | ) | — | (1,130,382 | ) | (2,584,728 | ) | (229 | %) | (2,584,728 | ) | (229 | %) | ||||||||||||||||||||||||||||||||||||||||||||
| Interest income | — | — | — | 1 | — | 1 | (1 | ) | (100.0 | %) | (1 | ) | (100.0 | %) | ||||||||||||||||||||||||||||||||||||||||||||||||||||||||||||||||||
| Change in fair value of derivative liabilities | (269,539 | ) | — | (269,539 | ) | — | — | — | (269,539 | ) | (100.0 | %) | (269,539 | ) | (100.0 | %) | ||||||||||||||||||||||||||||||||||||||||||||||||||||||||||||||||
| Interest expense | (174,661 | ) | — | (174,661 | ) | (168,188 | ) | 2,594 | (165,594 | ) | (6,473 | ) | 3.8 | % | (9,067 | ) | 5.5 | % | (673,277 | ) | — | (673,277 | ) | (174,661 | ) | — | (174,661 | ) | (498,616 | ) | 285 | % | (498,616 | ) | 285 | % | ||||||||||||||||||||||||||||||||||||||||||||
| Loss on impairment | (848,462 | ) | — | (848,462 | ) | — | — | — | (848,462 | ) | (100 | %) | (848,462 | ) | (100 | %) | ||||||||||||||||||||||||||||||||||||||||||||||||||||||||||||||||
| Other income/(expense) | 78,513 | 42,056 | 120,569 | (14,456 | ) | (2,701 | ) | (17,157 | ) | 92,969 | (643.1 | %) | 137,726 | (802.7 | %) | 105,166 | — | 105,166 | 78,513 | 42,056 | 120,569 | 105,166 | 34 | % | (15,403 | ) | (13 | %) | ||||||||||||||||||||||||||||||||||||||||||||||||||||
| Total Other Income/Expense | (96,148 | ) | 42,056 | (54,092 | ) | (182,643 | ) | (107 | ) | (182,750 | ) | 86,495 | 47.4 | % | 128,658 | 70.4 | % | (1,686,112 | ) | — | (1,686,112 | ) | (96,148 | ) | 42,056 | (54,092 | ) | (1,589,964 | ) | 1654 | % | (1,632,020 | ) | 3017 | % | |||||||||||||||||||||||||||||||||||||||||||||
| Net loss | ($ | 1,226,530 | ) | $ | 42,056 | ($ | 1,184,474 | ) | ($ | 1,259,277 | ) | $ | 37,979 | ($ | 1,221,298 | ) | $ | 32,747 | 2.6 | % | $ | 36,824 | 3.0 | % | ($ | 5,401,222 | ) | $ | — | ($ | 5,401,222 | ) | ($ | 1,226,530 | ) | $ | 42,056 | ($ | 1,184,474 | ) | ($ | (4,174,692 | ) | 340 | % | ($ | (4,216,748 | ) | 356 | % | ||||||||||||||||||||||||||||||
| BASIC AND DILUTED LOSS PER SHARE: | ||||||||||||||||||||||||||||||||||||||||||||||||||||||||||||||||||||||||||||||||
| Net loss per share | ($ | 0.01 | ) | $ | 0.00 | ($ | 0.01 | ) | ($ | 0.01 | ) | $ | 0.00 | ($ | 0.01 | ) | ($ | 0.02 | ) | $ | 0.00 | ($ | 0.02 | ) | ($ | 0.01 | ) | $ | 0.00 | ($ | 0.01 | ) | ||||||||||||||||||||||||||||||||||||||||||||||||
| Basic and Diluted Weighted Average Number of Common Shares Outstanding | 125,868,534 | 125,868,534 | 125,868,534 | 106,985,632 | 106,985,632 | 106,985,632 | 257,499,751 | 257,499,751 | 257,499,751 | 125,868,534 | 125,868,534 | 125,868,534 | ||||||||||||||||||||||||||||||||||||||||||||||||||||||||||||||||||||
Revenues
Consolidated revenues for the fiscal year ended December 31, 20172018 and 20162017 from the Company were $16,754$342,049 and $122,546,$16,754, respectively, for a decreasean increase of $105,792$325,295 or 86.3%1942%. The decreaseincrease in revenues from operations was principally due to the closingacquisition of the Kiron division. RevenuesNHS. There was no difference in consolidated revenues for the fiscal year ended December 31, 20172018 and 20162017 from the Company’s continuing operations were $16,754 and $40,193, respectively, for a decrease of $23,439 or 58.3%. The decrease in revenues from continuing operations was due to fluctuations in latex prices and changes in customer product mix.operations.
Consolidated gross profitloss for the fiscal year ended December 31, 20172018 and 20162017 from the Company were $(4,744)$(43,754) and $81,851,$(4,744), respectively, for a decreasean increase of $86,595$39,010 or 105.8%822%. Gross profit from continuing operations for the fiscal year ended December 31, 2017Consolidated cost of revenue and 2016 was $(4,744) and $19,720, respectively, for a decrease of $24,464 or 124.1%. Costcost of revenue from continuing operations for fiscal year ended December 31, 2018 and 2017 was $385,803 and 2016 was $21,498, and $20,473, respectively, an increase of $1,025$364,305 or 5.0%1695%. The increase in gross loss and cost of revenue was mainly due to the increase of purchases which totaled $206,518 during 2018 and the large amount of amazon fees of $42,074 that were incurred by the Company during the year ended December 31, 2018.
Operating Expenses
The Company’s operating expenses consist of general and administrative expenses. General and administrative expenses consist primarily of compensation and support costs for management and administrative staff, and for other general and administrative costs, including professional fees related to accounting, finance, and legal services as well as other operating expenses. The Company’s consolidated operating expenses were $1,125,638$3,671,356 and $1,120,399$1,125,638 for the fiscal year ended December 31, 20172018 and 2016,2017, respectively, for an increase of $5,239$2,584,728 or 0.5%226%. TheThere was no difference in the Company’s consolidated operating expenses and operating expenses from continuing operations for the fiscal year ended December 31, 20172018 and 2016 were $1,125,638 and $1,096,354, respectively, for an increase of $29,284 or 2.7%.2017.
16
Other Income (Expense)
Other income (expense) for the fiscal year ended December 31, 2018 and 2017 and 2016 were $120,569$(1,686,112) and ($17,157)96,148), respectively, for ana net increase of $137,726$1,589,964 or 802.7%1654%. This large fluctuation was due to the write-off of discontinued operations related accounts payable in the amount of $42,056 and the derecognition and write-off of disputed Vystar related accounts payables. Interestinterest expense for the fiscal year ended December 31, 2017 and 2016 were $174,661 and $165,594, respectively for an increase of $9,067 or 5.5%.increasing by $498,616. This was a primarily a result of an increase in the LIBOR index rate on the CMA Loan as well as additional Shareholder Notesshareholder notes in 2017.2018. In addition, there was a change in fair value of derivative liabilities by $269,539 which was due to the revaluation of certain derivatives and there was a loss on impairment of $848,462.
Net Loss
Net loss for the fiscal year ended December 31, 2018 and 2017 were $5,401,222 and 2016 were $1,184,474, and $1,221,298, respectively, for a decreasean increase in net loss of $36,824$4,216,748 or 3.0%356%. The smallerlarger net loss the Company experienced in the fiscal year ended December 31, 20172018 versus the same period in 20162017 was primarily attributable to the reductionlarge increase in third-party contract services.operating expenses for the year, primarily related to the increase in stock based compensation expenses, in addition to increased interest expenses, change in fair values of derivative liabilities, and impairment losses of $498,616, $269,539, and $848,462, respectively.
LIQUIDITY AND CAPITAL RESOURCES
The Company'sCompany’s financial statements are prepared using the accrual method of accounting in accordance with accounting principles generally accepted in the United States of America and have been prepared on a going concern basis, which contemplates the realization of assets and the settlement of liabilities in the normal course of business. However, we have incurred significant losses and experienced negative cash flow since inception. At December 31, 2017,2018, the Company had cash of $13,502$50,053 and a deficit in working capital of $2,774,565.$1,691,520. For the year ended December 31, 2018, the Company had a net loss of $5,401,222 and an accumulated deficit of $33,400,345. For the year ended December 31, 2017, the companyCompany had a net loss of $1,184,474 and an accumulated deficit of $27,999,123. For the year ended December 31, 2016, the company had a net loss of $1,221,298 and the accumulated deficit amounted to $26,814,649.$27,999,123. We use working capital to finance our ongoing operations, and since those operations do not currently cover all of our operating costs, and managing working capital is essential to our Company'sCompany’s future success. Because of this history of losses and financial condition, there is substantial doubt about the Company’s ability to continue as a going concern.
Net cash used in operating activities was $1,508,036 for the year ended December 31, 2018 as compared to $498,963 for the year ended December 31, 2017 as compared to $907,441 for the year ended December 31, 2016.2017. During the year ended December 31, 2017,2018, cash used in operations was primarily due to the net loss for the year of $1,184,474$5,401,222 net of non-cash related add-back of share-based compensation expense of $710,348.$1,285,938.
The Company had no net$3,598 cash provided byused in investing activities during the year ended December 31, 2017. Net2018 related to the purchase of patents fees. There was no net cash provided by investing activities for the year ended December 31, 2016 was $2,701 was a result of selling some equipment.2017.
Net cash provided by financing activities was $1,548,185 during the year ended December 31, 2018, as compared to cash provided of $476,183 during the year ended December 31, 2017. During 2018, cash was provided from the proceeds in notes payable in the amount of $981,685, repayments on notes payable in the amount of $83,000, $149,500 in proceeds from common stock issuances, and $500,000 in proceeds from a bank loan. In 2017, as compared tothe cash provided of $911,963 during the year ended December 31, 2016. During 2017 cashby financing activities was provided from the issuance of common stock in the amount of $384,500 and $91,683 in proceeds from Shareholder Notes. In 2016, the cash provided by financing activities was provided from the issuance of common stock in the amount of $723,456, $53,500 from the exercise of common stock warrants and $135,000 in proceeds from Shareholder Notes.shareholder notes.
A successful transition to attaining profitable operations is dependent upon obtaining sufficient financing to fund the Company’s planned expenses and achieving a level of revenue adequate to support the Company’s cost structure. Management plans to finance future operations using cash on hand, increased revenue from Vytex license fees that now also include the company’sCompany’s association with foam cores made from Vytex used in mattresses, mattress toppers and pillows, stock warrant exercises from existing shareholders, and raising capital through private placement memoranda (see Note 13,16, Subsequent Events). Because of this history of losses and financial condition, there is substantial doubt about the Company’s ability to continue as a going concern.
There can be no assurances that we will be able to achieve projected levels of revenue in 20182019 and beyond. If we are not able to achieve projected revenue and obtain alternate additional financing of equity or debt, we would need to significantly curtail or reorient operations during 2018,2019, which could have a material adverse effect on our ability to achieve our business objectives and as a result, may require the Company to file for bankruptcy or cease operations. The financial statements do not include any adjustments relating to the recoverability and classification of recorded asset amounts or amounts classified as liabilities that might be necessary should the Company be forced to take any such actions.
Our future expenditures will depend on numerous factors, including: the rate at which we can introduce and license Vytex NRL raw material and the foam cores made from Vytex to manufacturers and subsequently retailers,retailers; the costs of filing, prosecuting, defending and enforcing any patent claims and other intellectual property rights; andrights, along with market acceptance of our products, and services and competing technological developments. As we expand our activities and operations, our cash requirements are expected to increase at a rate consistent with revenue growth after we achieve sustained revenue generation.
Off-Balance Sheet Arrangements
We do not have any material off-balance sheet arrangements.
Certain Relationships and Related Transactions
On April 29, 2011, the Company executed with CMA Investments, LLC, a Georgia limited liability company of which three of the directors of the Company (“CMA directors”) are the members (“CMA”), an unsecured line of credit (“CMA Note Payable”) bearing interest at LIBOR plus 5.25% per annum on amounts drawn and fees. The weighted average interest rate in effect on the borrowings for the years ended December 31, 2018 and 2017 was 7.99% and 2016 was 6.37% and 5.75%, respectively.
During the tenure of the CMA Note Payable, the Company has increased the amount of the Notenote and in exchange provided benefits to the CMA directors as follows:
| Date | Amount (increase) | Benefit to CMA | Impact to Company |
| Inception | $800,000 | Warrants to purchase 2,600,000 shares @ $0.45, vesting 20% immediately and 10% per $100,000 drawn | Warrant costs amortized over the term of the CMA Note Payable |
| Sept 4, 2011 | $200,000 | Modified warrant price on 2,600,000 shares from $0.45 to $0.27, and issued additional 1,600,000 shares @ $0.27 | Warrant costs amortized over the remaining term of the CMA Note Payable |
| Nov 2, 2012 | $500,000 | Warrants to purchase 2,100,000 shares @ $0.35 | Warrant costs amortized over the remaining term of the CMA Note Payable |
| Apr 29, 2013 | $0 (maturity date extended 1 year) | Modified warrant price on 6,300,000 shares from $0.10, and agreed to forfeit 630,000 of the warrants | Warrant costs amortized over the remaining term of the CMA Note Payable |
| Apr 29, 2014 | $0 (maturity date extended 1 year) | None | None |
| Apr 29, 2015 | $0 (maturity date extended 1 year) | None | None |
As of December 31, 2018, the Company had borrowed up to $1,500,000 from CMA Investments, LLC (the “Note”). Holders of the Note received the proceeds for the Note to make the loan from a financial institution (the “Holder Loan”). Pursuant to a Loan Payoff and Share Payment Agreement, as final payment of the Note, CMA Investments agreed to accept 15,000,000 shares of common stock of the Company. The note is currently dueshares of common stock were issued in the name of CMA Investments and delivered to an escrow agent for its benefit. The Company agreed to pay interest under lender’s bank loan for a six-month period which may be extended by 30 days under certain circumstances. After the six-month period, the escrow agent may sell the shares at a price no less than $.035 per share with expectation that sales would be complete by July 1, 2022. In the event of a short from the proceeds from the sale of the shares and the amount that was owed, the Company must pay the shortfall in shares based on demand.the fair market value of the shares, provided that the Company may pay cash at any time. In the event that CMA Investments sells the shares for more than the amount outstanding on the Note, the Company may repurchase the remaining shares held in Escrow at par value.
Per Steven Rotman’s Employment agreement, he is to be paid approximately $1 per year in cash, $20,833 per month to be paid in shares based on a 20-day average at a 0% discount to market, an option to purchase 11,000,000 shares of common stock at par value as a signing bonus, and $200,000 as a performance bonus. During the year ended December 31, 2018, the Company expensed approximately $222,000 related to shares issued, $550,000 related to options granted, and a performance bonus in the amount of $200,000 Of the expensed amount, approximately $257,473 was paid in cash, $195,000 related was related to the performance bonus and $57,473 for reimbursable company expenses.
Designcenters.com is owned by Jamie Rotman, who is the daughter of the Company’s CEO, Steven Rotman. Designcenters.com provides bookkeeping and management services to the Company. In January 2015, Vystar announced that it hadexchange for such services, the Company has entered into an exclusivea consulting agreement with NHSthe related party entity. Per Design’s consulting agreement, it is to distribute mattresses, mattress toppersbe paid approximately $7,100 per month to be paid in cash or shares, if shares it’s based on a 20-day average at a 50% discount to market, $10,000 quarterly bonus to be paid in shares using the same formula and pillows made300,000 shares of common stock as a one-time signing bonus. During the year ended December 31, 2018, the Company expensed approximately $222,010. Of the expensed amount, approximately $35,400 was paid in cash.
Blue Oar Consulting, Inc. is owned by Gregory Rotman, who is the son of the Company’s CEO, Steven Rotman. Blue Oar provides business consulting services to the Company. In exchange for such services, the Company has entered into a consulting agreement with its multi-patented Vytex NRL raw material. NHSthe related party entity.
Per Blue Oar’s consulting agreement, it is to be paid approximately $15,000 per month in cash for expenses, $12,500 per month to be paid in shares based on a distribution company led by20-day average at a 50% discount to market, an option to purchase 7,500,000 shares of common stock at par value as a signing bonus, and $175,000 as a bonus. During the year ended December 31, 2018, the Company expensed approximately $1,010,000. Of the expensed amount, approximately $212,500 was paid in cash.
During the year ended December 31, 2018, the Company had sales of approximately $60,000 to Murida, DBA Rotmans Furniture (“Rotmans”). Steve Rotman, of Rotman’s Furniture and as of December 17, 2017the Company’s CEO, is the CEOmajority owner of Vystar.Rotmans. At December 31, 2018, the Company had an amount receivable of approximately $75.
During the year ended December 31, 2018, the Company utilized certain warehouse staff, warehouse space/services and an executive assistant of Rotmans for the Company’s purposes. The Company estimates the cost of such services to be approximately $40,000 per month or approximately $480,000 for the year ended December 31, 2018 (based on the term such resources were used). The Company was not charged for these resources and does not owe any amounts to Rotmans for the services utilized through December 31, 2018.
| ITEM 7A. | QUANTITATIVE AND QUALITATIVE DISCLOSURES ABOUT MARKET RISK |
As a smaller reporting company, we are not required to provide the information required by this Item pursuant to 301(c) of Regulation S-K.
| ITEM 8. | Index to Financial Statements |
REPORT OF INDEPENDENT REGISTERED PUBLIC ACCOUNTING FIRM
To the Board of Directors and Stockholders
of Vystar Corporation
Atlanta, Georgia
Opinion on the Financial Statements
We have audited the accompanying balance sheetssheet of Vystar Corporation (the Company)"Company") as of December 31, 2017 and 2016, and2018, the related statements of loss,operations, stockholders’ deficit,equity and cash flows for the yearsyear then ended. ended, and the related notes (collectively referred to as the "financial statements"). In our opinion, the financial statements present fairly, in all material respects, the financial position of the Company as of December 31, 2018, and the results of its operations and its cash flows for the year then ended, in conformity with accounting principles generally accepted in the United States of America.
Going Concern
The accompanying financial statements have been prepared assuming that the Company will continue as a going concern. As discussed in Note 3 to the financial statements, the Company has experienced recurring losses from operations, has negative operating cash flows during the year ended December 31, 2018, has an accumulated deficit of approximately $33,000,000 as of December 31, 2018. These factors raise substantial doubt about the Company’s ability to continue as a going concern. Management's plans in regard to these factors are also described in Note 3. The accompanying financial statements do not include any adjustments that might result from the outcome of this uncertainty.
Basis for Opinion
These financial statements are the responsibility of the Company’sCompany's management. Our responsibility is to express an opinion on thesethe Company's financial statements based on our audits.audit. We are a public accounting firm registered with the Public Company Accounting Oversight Board (United States) ("PCAOB") and are required to be independent with respect to the Company in accordance with the U.S. federal securities laws and the applicable rules and regulations of the Securities and Exchange Commission and the PCAOB.
We conducted our auditsaudit in accordance with the standards of the Public Company Accounting Oversight Board (United States).PCAOB. Those standards require that we plan and perform the audit to obtain reasonable assurance about whether the financial statements are free of material misstatement.misstatement, whether due to error or fraud. The Company is not required to have, nor were we engaged to perform, an audit of its internal control over financial reporting. Our audits included considerationAs part of our audit we are required to obtain an understanding of internal control over financial reporting as a basis for designing audit procedures that are appropriate in the circumstances, but not for the purpose of expressing an opinion on the effectiveness of the Company’s internal control over financial reporting. Accordingly, we express no such opinion. An
Our audit includesincluded performing procedures to assess the risks of material misstatement of the financial statements, whether due to error or fraud, and performing procedures that respond to those risks. Such procedures included examining, on a test basis, evidence supportingregarding the amounts and disclosures in the financial statements, assessingstatements. Our audit also included evaluating the accounting principles used and significant estimates made by management, as well as evaluating the overall presentation of the financial statement presentation.statements. We believe that our audits provideaudit provides a reasonable basis for our opinion.

We have served as the Company’s auditor since 2018
Irvine, CA
April 22, 2019

REPORT OF INDEPENDENT REGISTERED PUBLIC ACCOUNTING FIRM
To the Stockholders and the Board of Directors of Vystar Corporation
Opinion on the Financial Statements
We have audited the accompanying balance sheet of Vystar Corporation (the Company) as of December 31, 2017, the related statements of loss, stockholders' deficit and cash flows for the year then ended, and the related notes to the financial statements (collectively, the financial statements). In our opinion, the financial statements referred to above present fairly, in all material respects, the financial position of Vystar Corporationthe Company as of December 31, 2017, and 2016, and the results of its operations and its cash flows for the yearsyear then ended, in conformity with U.S.accounting principles generally accepted accounting principles.in the United States of America.
Going Concern
The accompanying financial statements have been prepared assuming that the Company will continue as a going concern. As discussed in Note 2 to the financial statements, the Company’sCompany has suffered recurring losses from operations, a capital deficit andwith limited capital resources, raiseand total liabilities exceed total assets. This raises substantial doubt about itsthe Company’s ability to continue as a going concern. Management’s plans in regard to these matters also are described in Note 2 to the financial statements. These2. The financial statements do not include any adjustments that might result from the outcome of this uncertainty.
Basis for Opinion
These financial statements are the responsibility of the Company’s management. Our responsibility is to express an opinion on the Company’s financial statements based on our audit. We are a public accounting firm registered with the Public Company Accounting Oversight Board (United States) (PCAOB) and are required to be independent with respect to the Company in accordance with U.S. federal securities laws and the applicable rules and regulations of the Securities and Exchange Commission and the PCAOB.
We conducted our audit in accordance with the standards of the PCAOB. Those standards require that we plan and perform the audit to obtain reasonable assurance about whether the financial statements are free of material misstatement, whether due to error or fraud. The Company is not required to have, nor were we engaged to perform, an audit of its internal control over financial reporting. As part of our audit we are required to obtain an understanding of internal control over financial reporting but not for the purpose of expressing an opinion on the effectiveness of the Company's internal control over financial reporting. Accordingly, we express no such opinion.
Our audit included performing procedures to assess the risks of material misstatement of the financial statements, whether due to error or fraud, and performing procedures that respond to those risks. Such procedures included examining, on a test basis, evidence regarding the amounts and disclosures in the financial statements. Our audit also included evaluating the accounting principles used and significant estimates made by management, as well as evaluating the overall presentation of the financial statements. We believe that our audit provides a reasonable basis for our opinion.

We have served as the Company’s auditor since 2013.
Atlanta, Georgia
March 29, 2018

VYSTAR CORPORATION
| VYSTAR CORPORATION |
| BALANCE SHEETS |
| December 31, | December 31, | |||||||
| 2018 | 2017 | |||||||
| ASSETS | ||||||||
| Current assets: | ||||||||
| Cash | $ | 50,053 | $ | 13,502 | ||||
| Accounts receivable | 19,732 | 3,963 | ||||||
| Inventories | 570,587 | — | ||||||
| Prepaid expenses | 6,683 | 166,091 | ||||||
| Total current assets | 647,055 | 183,556 | ||||||
| Property and equipment, net | 291,346 | — | ||||||
| Other assets: | ||||||||
| Intangible assets, net | 1,383,919 | 123,882 | ||||||
| Goodwill | 147,092 | — | ||||||
| Total assets | $ | 2,469,412 | $ | 307,438 | ||||
| LIABILITIES AND STOCKHOLDERS’ DEFICIT | ||||||||
| Current liabilities: | ||||||||
| Accounts payable | $ | 538,461 | $ | 460,688 | ||||
| Accounts payable – related parties | 187,698 | 8,218 | ||||||
| Accrued expenses and interest payable | 101,979 | 294,995 | ||||||
| Accrued stock based compensation | 771,203 | 19,355 | ||||||
| Related party line of credit | — | 1,499,875 | ||||||
| Shareholder, convertible and contingently convertible notes payable and accrued interest, net of debt discount - current maturities | 504,149 | 674,990 | ||||||
| Derivative liabilities | 235,085 | — | ||||||
| Total current liabilities | 2,338,575 | 2,958,121 | ||||||
| Long-term liabilities: | ||||||||
| Loan payable Fidelity Bank | 500,000 | — | ||||||
| Related party line of credit | 1,499,875 | — | ||||||
| Shareholder, convertible and contingently convertible notes payable and accrued interest - net of current maturities | — | 206,683 | ||||||
| Total long-term liabilities | 1,999,875 | 206,683 | ||||||
| Total liabilities | 4,338,450 | 3,164,804 | ||||||
| Stockholders’ deficit: | ||||||||
| Preferred stock, $0.0001 par value 15,000,000 shares authorized; 13,828 issued and outstanding at December 31, 2018 and 2017 (liquidation preference of $77,447 and $63,600 at December 31, 2018 and 2017, respectively) | 1 | 1 | ||||||
| Common stock, $0.0001 par value, 1,500,000,000 shares authorized; 457,747,818 and 132,809,218 shares issued and outstanding at December 31, 2018 and 2017, respectively | 45,774 | 13,280 | ||||||
| Additional paid-in capital | 31,485,532 | 25,128,476 | ||||||
| Accumulated deficit | (33,400,345 | ) | (27,999,123 | ) | ||||
| Total stockholders’ deficit | (1,869,038 | ) | (2,857,366 | ) | ||||
| Total liabilities and stockholders’ deficit | $ | 2,469,412 | $ | 307,438 | ||||
For the Years Ended December 31, 2017 and 2016
The accompanying notes are an integral part of these financial statements.
| VYSTAR CORPORATION |
| STATEMENTS OF OPERATIONS |
| December 31, | ||||||||
| 2017 | 2016 | |||||||
| ASSETS | ||||||||
| CURRENT ASSETS | ||||||||
| Cash | $ | 13,502 | $ | 36,282 | ||||
| Accounts receivable | 3,963 | 17,370 | ||||||
| Prepaid expenses | 166,091 | 41,300 | ||||||
| TOTAL CURRENT ASSETS | 183,556 | 94,952 | ||||||
| OTHER ASSETS | ||||||||
| Intangible assets, net | 123,882 | 139,562 | ||||||
| TOTAL ASSETS | 307,438 | 234,514 | ||||||
| LIABILITIES AND STOCKHOLDERS’ DEFICIT | ||||||||
| CURRENT LIABILITIES | ||||||||
| Related party line of credit | $ | 1,499,875 | $ | 1,499,875 | ||||
| Accounts payable | 468,906 | 488,784 | ||||||
| Accrued compensation | 19,355 | 2,917 | ||||||
| Shareholder notes payable | 674,990 | 595,837 | ||||||
| Accrued expenses | 294,995 | 231,080 | ||||||
| TOTAL CURRENT LIABILITIES | 2,958,121 | 2,818,493 | ||||||
| Long-term Shareholder notes payable | 206,683 | 239,231 | ||||||
| TOTAL LIABILITIES | $ | 3,164,804 | $ | 3,057,724 | ||||
| STOCKHOLDERS’ DEFICIT | ||||||||
| Preferred stock, $0.0001 par value, 15,000,000 shares authorized; 13,828 issued and outstanding at December 31, 2017 and 2016 respectively | 1 | 1 | ||||||
| Common stock, $0.0001 par value, 250,000,000 shares authorized; 132,809,218 and 114,951,594 shares issued and outstanding at December 31, 2017 and 2016, respectively | 13,280 | 11,495 | ||||||
| Additional paid-in capital | 25,128,476 | 23,979,943 | ||||||
| Accumulated deficit | (27,999,123 | ) | (26,814,649 | ) | ||||
| TOTAL STOCKHOLDERS’ DEFICIT | (2,857,366 | ) | (2,823,210 | ) | ||||
| TOTAL LIABILITIES AND STOCKHOLDERS’ DEFICIT | $ | 307,438 | $ | 234,514 | ||||
| Years Ended | ||||||||
| December 31, | ||||||||
| 2018 | 2017 | |||||||
| Revenue | $ | 342,049 | $ | 16,754 | ||||
| Cost of revenue | 385,803 | 21,498 | ||||||
| Gross loss | (43,754 | ) | (4,744 | ) | ||||
| Operating expenses: | ||||||||
| General and administrative, including non-cash share-based compensation of $1,285,938 and $427,998 for the years ended December 31, 2018 and 2017, respectively. | 3,671,356 | 1,125,638 | ||||||
| Loss from operations | (3,715,110 | ) | (1,130,382 | ) | ||||
| Other income (expense): | ||||||||
| Other income | 105,166 | 78,513 | ||||||
| Loss on impairment | (848,462 | ) | — | |||||
| Interest (expense) | (673,277 | ) | (174,661 | ) | ||||
| Change in fair value of derivative liabilities | (269,539 | ) | — | |||||
| Total other expense, net | (1,686,112 | ) | (96,148 | ) | ||||
| Loss from continuing operations | (5,401,222 | ) | (1,226,530 | ) | ||||
| Income from discontinued operations | — | 42,056 | ||||||
| Net loss | $ | (5,401,222 | ) | $ | (1,184,474 | ) | ||
| Basic and diluted loss per share: | ||||||||
| Net loss per share | ($ | 0.02 | ) | ($ | 0.01 | ) | ||
| Basic and diluted weighted average number of common shares outstanding | 257,499,751 | 125,868,534 | ||||||
The accompanying notes are an integral part of these financial statements.
| VYSTAR CORPORATION |
| STATEMENT OF STOCKHOLDERS’ DEFICIT |
| For the Years Ended December 31, 2018 and 2017 |
| Numbers of Preferred Shares | Preferred Shares | Number of Common Shares | Common Stock | Additional Capital | Accumulated Deficit | Total | ||||||||||||||||||||||
| Ending Balance, December 31, 2016 | 13,828 | $ | 1 | 114,951,593 | $ | 11,495 | $ | 23,979,943 | $ | (26,814,649 | ) | $ | (2,823,210 | ) | ||||||||||||||
| Common stock issued in private placement | 7,690,000 | 769 | 383,731 | 384,500 | ||||||||||||||||||||||||
| Common stock issued upon exercise of cashless common stock warrants | 1,813,993 | 181 | (181 | ) | — | |||||||||||||||||||||||
| Share-based compensation to employees - options | 146,193 | 146,193 | ||||||||||||||||||||||||||
| Share-based compensation to employees - common stock | 750,000 | 75 | 37,452 | 37,500 | ||||||||||||||||||||||||
| Common stock and warrants issued for services | 6,494,226 | 649 | 526,006 | 526,655 | ||||||||||||||||||||||||
| Common stock issued upon conversion of convertible notes | 1,109,406 | 111 | 55,359 | 55,470 | ||||||||||||||||||||||||
| Net Loss | (1,184,474 | ) | (1,184,474 | ) | ||||||||||||||||||||||||
| Ending Balance, December 31, 2017 | 13,828 | $ | 1 | 132,809,218 | $ | 13,280 | $ | 25,128,476 | $ | (27,999,123 | ) | $ | (2,857,366 | ) | ||||||||||||||
| Common stock issued in acquisition | 55,687,500 | 5,569 | 2,925,450 | 2,931,019 | ||||||||||||||||||||||||
| Common stock issued for signing bonus | 721,408 | 72 | 34,734 | 34,806 | ||||||||||||||||||||||||
| Share-based compensation to employees - options | 1,161,132 | 1,161,132 | ||||||||||||||||||||||||||
| Common stock issued for cash received | 54,999,997 | 5,500 | 159,500 | 165,000 | ||||||||||||||||||||||||
| Common stock issued for conversion of payables | 8,333,333 | 833 | 43,334 | 44,167 | ||||||||||||||||||||||||
| Reclassification of derivative upon conversion | 500,359 | 500,359 | ||||||||||||||||||||||||||
| Relative fair value of warrant issued with convertible debt | 18,747 | 18,747 | ||||||||||||||||||||||||||
| Common stock and warrants issued for services | 1,928,571 | 193 | 89,807 | 90,000 | ||||||||||||||||||||||||
| Common stock issued upon conversion of convertible notes and settlement of debt | 203,267,791 | 20,327 | 1,423,993 | 1,444,320 | ||||||||||||||||||||||||
| Net Loss | (5,401,222 | ) | (5,401,222 | ) | ||||||||||||||||||||||||
| Ending Balance, December 31, 2018 | 13,828 | $ | 1 | 457,747,818 | $ | 45,774 | $ | 31,485,532 | $ | (33,400,345 | ) | $ | (1,869,038 | ) | ||||||||||||||
The accompanying notes are an integral part of these financial statements.
| CONDENSED STATEMENTS OF CASH FLOWS |
VYSTAR CORORATION
For the Years Ended December 31, 2017 and 2016
| For the Years Ended December 31, | ||||||||
| 2017 | 2016 | |||||||
| REVENUE | $ | 16,754 | $ | 40,193 | ||||
| COST OF REVENUE | 21,498 | 20,473 | ||||||
| Gross Margin | (4,744 | ) | 19,720 | |||||
| OPERATING EXPENSES | ||||||||
| General and administrative, including non-cash share-based compensation of $585,556 and $242,159 in 2017 and 2016, respectively | 1,125,638 | 1,096,354 | ||||||
| Total Operating Expenses | 1,125,638 | 1,096,354 | ||||||
| LOSS FROM OPERATIONS | (1,130,382 | ) | (1,076,634 | ) | ||||
| OTHER INCOME (EXPENSE) | ||||||||
| Interest income | — | 1 | ||||||
| Other (expense) income | 78,513 | (14,456 | ) | |||||
| Interest expense | (174,661 | ) | (168,188 | ) | ||||
| Total Other Income (Expense) | (96,148 | ) | (182,643 | ) | ||||
| LOSS FROM CONTINUING OPERATIONS | (1,226,530 | ) | (1,259,277 | ) | ||||
| DISCONTINUED OPERATIONS | 42,056 | 37,979 | ||||||
| NET LOSS | ($ | 1,184,474 | ) | ($ | 1,221,298 | ) | ||
| BASIC AND DILUTED LOSS PER SHARE: | ||||||||
| Net loss per share | ($ | 0.01 | ) | ($ | 0.01 | ) | ||
| Basic and Diluted Weighted Average Number of Common Shares Outstanding | 125,868,534 | 106,985,632 | ||||||
The accompanying notes are an integral part of these financial statements.
| Years Ended | ||||||||
| December 31, | ||||||||
| 2018 | 2017 | |||||||
| Cash flows from operating activities: | ||||||||
| Net loss | $ | (5,401,222 | ) | $ | (1,184,474 | ) | ||
| Adjustments to reconcile net loss to net cash used in operating activities: | ||||||||
| Gain on settlement of accounts payable | (108,854 | ) | ||||||
| Share-based compensation | 1,285,938 | 710,348 | ||||||
| Loss on impairment | 848,462 | — | ||||||
| Depreciation | 31,485 | — | ||||||
| Amortization of intangible assets | 113,561 | 15,680 | ||||||
| Amortization of debt discount | 463,084 | — | ||||||
| Excess fair value of derivatives upon grant | 35,326 | — | ||||||
| Change in fair value of derivative liabilities | 269,539 | — | ||||||
| (Increase) decrease in assets: | ||||||||
| Accounts receivable | (15,769 | ) | 13,407 | |||||
| Inventories | (330,730 | ) | — | |||||
| Prepaid expenses | 159,408 | (124,791 | ) | |||||
| Increase (decrease) in liabilities: | ||||||||
| Accounts payable | 186,627 | (28,096 | ) | |||||
| Accounts payable – related parties | 353,306 | 8,218 | ||||||
| Accrued expenses and interest payable | (150,045 | ) | 74,307 | |||||
| Accrued stock-based compensation | 751,848 | 16,438 | ||||||
| Net cash used in operating activities | (1,508,036 | ) | (498,963 | ) | ||||
| Cash flows from investing activities: | ||||||||
| Patent and trademark fees | (3,598 | ) | — | |||||
| Cash flows from financing activities: | ||||||||
| Proceeds of Fidelity Bank loan | 500,000 | — | ||||||
| Repayments of notes payable | (78,060 | ) | — | |||||
| Repayments of notes payable – related parties | (4,940 | ) | — | |||||
| Issuance of common stock, net of costs | 149,500 | 384,500 | ||||||
| Proceeds from the issuance of notes, net | 786,050 | — | ||||||
| Proceeds from the issuance of notes – related parties, net | 195,635 | 91,683 | ||||||
| Net cash provided by financing activities | 1,548,185 | 476,183 | ||||||
| Net increase (decrease) in cash | 36,551 | (22,780 | ) | |||||
| Cash - beginning of period | 13,502 | 36,282 | ||||||
| Cash - end of period | $ | 50,053 | $ | 13,502 | ||||
| Cash paid during the period for: | ||||||||
| Interest | $ | 93,540 | $ | 100,354 | ||||
| Non-cash transactions: | ||||||||
| Purchase of tangible and intangible assets with common stock | $ | 2,925,450 | $ | — | ||||
| Shareholder notes and accrued interest payable converted to common stock | 1,467,325 | 55,471 | ||||||
| Shares issued for accrued compensation | — | 710,348 | ||||||
| Derivatives issued as debt discount | 430,579 | — | ||||||
| Exercise of common stock warrants | — | 181 | ||||||
| Reclass of derivative liabilities to additional paid-in capital | 500,359 | — | ||||||
VYSTAR CORPORATION
STATEMENTS OF STOCKHOLDERS’ DEFICIT
For the Years Ended December 31, 2017 and 2016
| Number of Preferred Shares | Preferred Shares | Number of Common Shares | Common Stock | Additional Paid-in Capital | Accumulated Deficit | Total | ||||||||||||||||||||||
| Ending Balance, December 31, 2015 | 13,828 | $ | 1 | 96,443,907 | $ | 9,644 | $ | 22,962,678 | ($ | 25,593,351 | ) | ($ | 2,621,028 | ) | ||||||||||||||
| Common stock issued in private placement | 14,180,000 | 1,418 | 707,582 | 709,000 | ||||||||||||||||||||||||
| Common stock issued upon exercise of common stock warrants | 3,080,220 | 308 | 53,192 | 53,500 | ||||||||||||||||||||||||
| Share-based compensation to employees - warrants | 100,291 | 100,291 | ||||||||||||||||||||||||||
| Common stock and warrants issued for services | 1,247,466 | 125 | 141,744 | 141,869 | ||||||||||||||||||||||||
| Warrant/Option Repricing | 14,456 | 14,456 | ||||||||||||||||||||||||||
| Net Loss | (1,221,298 | ) | (1,221,298 | ) | ||||||||||||||||||||||||
| Ending Balance, December 31, 2016 | 13,828 | $ | 1 | 114,951,593 | $ | 11,495 | $ | 23,979,943 | ($ | 26,814,649 | ) | ($ | 2,823,210 | ) | ||||||||||||||
| Common stock issued in private placement | 7,690,000 | 769 | 383,731 | 384,500 | ||||||||||||||||||||||||
| Common stock issued upon exercise of cashless common stock warrants | 1,813,993 | 181 | (181 | ) | — | |||||||||||||||||||||||
| Share-based compensation to employees - warrants | 146,193 | 146,193 | ||||||||||||||||||||||||||
| Share-based compensation to employees - common stock | 750,000 | 75 | 37,425 | 37,500 | ||||||||||||||||||||||||
| Common stock and warrants issued for services | 6,494,226 | 649 | 526,006 | 526,655 | ||||||||||||||||||||||||
| Common stock issued upon conversion of convertible notes | 1,109,406 | 111 | 55,359 | 55,470 | ||||||||||||||||||||||||
| Net Loss | (1,184,474 | ) | (1,184,474 | ) | ||||||||||||||||||||||||
| Ending Balance, December 31, 2017 | 13,828 | $ | 1 | 132,809,218 | $ | 13,280 | $ | 25,128,476 | ($ | 27,999,123 | ) | ($ | 2,857,366 | ) | ||||||||||||||
The accompanying notes are an integral part of these financial statements.
VYSTAR CORPORATION
For the Years Ended December 31, 2017 and 2016
| For the years ended December 31, | ||||||||
| 2017 | 2016 | |||||||
| CASH FLOWS FROM OPERATING ACTIVITIES | ||||||||
| Net loss | ($ | 1,184,474 | ) | ($ | 1,221,298 | ) | ||
| Adjustments to reconcile net loss to cash used in operating activities | ||||||||
| Share-based compensation | 710,348 | 242,159 | ||||||
| Allowance for uncollectible accounts receivable | — | (60,266 | ) | |||||
| Depreciation | — | 278 | ||||||
| Amortization of intangible assets | 15,680 | 15,861 | ||||||
| (Increase) decrease in assets | ||||||||
| Accounts receivable | 13,407 | 40,409 | ||||||
| Prepaid expenses | (124,791 | ) | 192,516 | |||||
| Increase (decrease) in liabilities | — | — | ||||||
| Accounts payable | (19,878 | ) | (91,020 | ) | ||||
| Accrued compensation and expenses | 90,745 | (26,080 | ) | |||||
| Net cash used in operating activities | (498,963 | ) | (907,441 | ) | ||||
| CASH FLOWS FROM INVESTING ACTIVITIES | ||||||||
| Disposal (investment in) of equipment, net | — | 2,701 | ||||||
| Net cash provided by (used) in investing activities | — | 2,701 | ||||||
| CASH FLOWS FROM FINANCING ACTIVITIES | ||||||||
| (Payments) Advances D&O Financing | — | 7 | ||||||
| Issuance of common stock, net of costs | 384,500 | 723,456 | ||||||
| Proceeds from exercise of common stock warrants | — | 53,500 | ||||||
| Proceeds/(Payment) from Shareholder Notes | 91,683 | 135,000 | ||||||
| Net cash provided by financing activities | 476,183 | 911,963 | ||||||
| NET INCREASE (DECREASE) IN CASH | (22,780 | ) | 7,223 | |||||
| CASH - BEGINNING OF YEAR | 36,282 | 29,059 | ||||||
| CASH - END OF YEAR | $ | 13,502 | $ | 36,282 | ||||
| SUPPLEMENTAL DISCLOSURES OF CASH FLOW INFORMATION: | ||||||||
| NON-CASH TRANSACTIONS | ||||||||
| Common stock issued for services rendered | $ | 710,348 | $ | 242,160 | ||||
| Cashless exercise of common stock warrants | 181 | — | ||||||
| Cashless conversion of shareholder note | 55,471 | — | ||||||
| CASH PAID DURING THE PERIOD FOR | ||||||||
| Interest | $ | 100,354 | $ | 97,989 | ||||
The accompanying notes are an integral part of these financial statements.
VYSTAR CORPORATION
December 31, 20172018 and 20162017
NOTE 1 - SUMMARY– DESCRIPTION OF SIGNIFICANT ACCOUNTING POLICIESBUSINESS
History and Nature of Business
Vystar Corporation (“Vystar”, the “Company”, “we”, “us”, or “our”) is the creator and exclusive owner of the innovative technology to produce Vytex® Natural Rubber Latex (“NRL”). In addition, on June 28, 2013, Vystar Corporation (the “Company”) completed the acquisition of Kiron Clinical Sleep Lab, LLC (“Kiron”) a vertically integrated sleep diagnostic practice located in Durham, NC. We effectively closed Kiron in April 2016 due to changes in the healthcare insurance marketplace. Because of the closure of Kiron, Vystar Corporation has returned its focus to expanding the licensing and utilization of its proprietary source natural rubber latex technology. Vytex NRL uses a global multi-patented technology and proprietary formulation to reduce non-rubber particles including the antigenic proteins associated with latex allergies, resulting in a cleaner form of latex. In fact, the antigenic protein levels are reduced to virtually undetectable levels. On January 22, 2015, Vystar announced the signing of an exclusive domestic distribution agreement with Worcester, MA based Nature’s Home Solutions (NHS) who sources eco-friendly materials and technologies for use in furnishings and other markets. On March 4, 2015, the Company announced that Hartford, CT based Gold Bond formed a strategic alliance with NHS to produce and market the world’s first Vytex NRL based mattress. In June 2015, the first mattresses made with Vytex (hybrid and pure Vytex) were placed on the sales floor at Rotman’sRotmans Furniture and Carpet Store in Worcester, MA using the “Evaya” brand and Gold Bond had shipped four versions of their “Brilliance” inner coil and pure foam mattresses (Emerald, Ruby, Sapphire Plush and Sapphire Firm) to over 30 stores from Maine to Florida.
In April of 2018, Vystar acquired the assets of NHS Holdings, LLC (NHS) executing on the first part of the Company’s vision to move into direct product offerings made from Vytex® latex. NHS was the exclusive U.S. distributor of Vystar’s Vytex® natural rubber latex foam to manufacturers for use in over 200 home furnishings products, including mattresses, toppers, pillows and upholstery, sold through multiple channels. This acquisition provides Vystar with roll packing and cutting equipment to support our bedding manufacturing partners, while lowering the cost of Vytex to the manufacturer by eliminating the middleman.
In May of 2018, Vystar acquired substantially all of the assets of UV Flu Technologies, Inc., formerly traded on the OTC under the ticker UVFT, whose patented ViraTech™ UV light air purification technology destroys greater than 99% of airborne bacteria, viruses and other microorganisms and virtually eliminates concentrations of odors and volatile organic compounds (VOCs).
As part of Vystar’s mission to offer eco-friendly, sustainable materials and products that create a better environment for consumers and workers throughout the product lifecycle, UV Flu Technologies is an excellent counterpart to our Vytex materials and Vytex bedding products. Vystar products will help create a perfect natural sleep environment starting with Vytex bedding made from the purest latex in the world and UV Flu’s RxAir™ air purifier ensuring every breath is free of harmful pathogens, VOCs and odors.”
NOTE 2 - BASIS OF PRESENTATION AND SUMMARY OF SIGNIFICANT ACCOUNTING POLICIES
Basis of Presentation
The financial statements are presented in accordance with accounting principles generally accepted in the United States of America (“GAAP”) as codified in the Financial Accounting Standards Board’s (“FASB”) Accounting Standards Codification.
The Company has evaluated subsequent events through the date of the filing of its Form 10-K with the Securities and Exchange Commission. Other than those events disclosed in Note 15,16, the Company is not aware of any other significant events that occurred subsequent to the balance sheet date but prior to the filing of this report that would have a material impact on the Company’s financial statements.
Reclassification
Certain items in the prior year’s financial statements have been reclassified in order to conform with the current year presentation. Specifically note such reclassifications for discontinued operations.
Estimates
The preparation of financial statements in conformity with GAAP requires management to make estimates and assumptions that affect the amounts reported in the financial statements and accompanying disclosures. Although these estimates are based on management’s best knowledge of current events and actions the Company may undertake in the future, actual results could differ from these estimates. Examples include valuation allowances for deferred tax assets, provisions for bad debts, valuation of derivative liabilities, and fair values of share-based compensation and other equity issuances.
Stock-Based Compensation
The fair value of stock options is estimated on the grant date using the Black-Scholes option pricing model, based on weighted average assumptions. Expected volatility is based on historical volatility of our common stock. The Company has elected to use the simplified method described in the Securities and Exchange Commission Staff Accounting Bulletin Topic 14C to estimate the expected term of employee stock options. The risk-free rate is based on the U.S. Treasury yield curve in effect at the time of grant. The value of restricted stock awards are determined using the fair value of the Company’s common stock on the date of grant. The fair value of performance share awards are estimated using a Monte-Carlo simulation model utilizing several key assumptions including expected peer group share price volatility, correlation coefficients between peers, the risk-free rate of return, the expected dividend yield and other award design features. The Company accounts for forfeitures as they occur. Compensation expense is recognized on a straight-line basis over the requisite service period of the award.
Segment Reporting
Operating segments are identified as components of an enterprise about which separate discrete financial information is available for evaluation by the chief operating decision maker, or decision-making group, in making decisions on how to allocate resources and assess performance. The Company’s chief operating decision maker is the chief executive officer. The Company and the chief executive officer view the Company’s operations and manage its business as one reportable segment with different operating segments.
Derivatives
The Company records all derivatives on the balance sheet at fair value. The accounting for changes in the fair value of derivatives depends on the intended use of the derivative, whether the Company has elected to designate a derivative in a hedging relationship and apply hedge accounting and whether the hedging relationship has satisfied the criteria necessary to apply hedge accounting. Derivatives designated and qualifying as a hedge of the exposure to changes in the fair value of an asset, liability, or firm commitment attributable to a particular risk, such as interest rate risk, are considered fair value hedges. Derivatives designated and qualifying as a hedge of the exposure to variability in expected future cash flows, or other types of forecasted transactions, are considered cash flow hedges. Hedge accounting generally provides for the matching of the timing of gain or loss recognition on the hedging instrument with the recognition of the changes in the fair value of the hedged asset or liability that are attributable to the hedged risk in a fair value hedge or the earnings effect of the hedged forecasted transactions in a cash flow hedge. The Company may enter into derivative contracts that are intended to economically hedge certain of its risk, even though hedge accounting does not apply or the Company elects not to apply hedge accounting.
In accordance with the FASB’s fair value measurement guidance (ASU 2011-04), the Company made an accounting policy election to measure the credit risk of its derivative financial instruments that are subject to master netting agreements on a net basis by counterparty portfolio.
Convertible Notes Payable
Borrowings are recognized initially at the principal amount received. Borrowings are subsequently carried at amortized cost; any difference between the proceeds (net of transaction costs) and the redemption value is recognized as interest expense in the statements of operation over the period of the borrowings using the effective interest method.
Concentration of Credit Risk
Certain financial instruments potentially subject the Company to concentrations of credit risk. These financial instruments consist primarily of cash and accounts receivable. Cash held in operating accounts may exceed the Federal Deposit Insurance Corporation, or FDIC, insurance limits. While we monitorthe Company monitors cash balances in our operating accounts on a regular basis and adjust the balances as appropriate, these balances could be impacted if the underlying financial institutions fail. To date, we havethe Company has experienced no loss or lack of access to our cash; however, wethe Company can provide no assurances that access to our cash will not be impacted by adverse conditions in the financial markets.
Accounts Receivable
Accounts receivable are stated at the amount management expects to collect from outstanding balances. Management provides for uncollectible amounts through a charge to earningsOther Risks and a credit to an allowance for doubtful accounts based upon its assessment of the current status of individual accounts. Balances that are still outstanding after management has performed reasonable collection efforts are written off through a charge to the allowance and a credit to accounts receivable. As of December 31, 2017 and 2016, we have determined there were no amounts deemed uncollectible. We grant credit to our customers without requiring collateral. The amount of accounting loss for which we are at risk in these unsecured accounts receivable is limited to their carrying value.
Vytex customers are located in both the United States and internationally.
Property and Equipment
Property and equipment is stated at cost. Depreciation is provided by the use of the straight-line and accelerated methods for financial and tax reporting purposes, respectively, over the estimated useful lives of the assets, generally 5 years. As of December 31, 2017 and 2016, all of our property and equipment was fully depreciated resulting in no net balance being reflected.
Intangible Assets
Patents represent legal and other fees associated with the registration of patents. The Company has four issued patents with the United States Patent and Trade Office (USPTO) as well as four issued international PCT (Patent Cooperation Treaty) patents. Patents are carried at cost and are being amortized on a straight-line basis over their estimated useful lives, typically 20 years.Uncertainties
The Company has trademark protectionis exposed to commodity price risk, mainly associated with variations in the market price for “Vystar”, “Vytex”,NRL as well as wintering of the Hevea trees, which differs for each country. The timing and “Createdmagnitude of industry cycles are difficult to predict and are impacted by Nature. Recreatedgeneral economic conditions including the buying climate in China. The Company responds to changes in NRL prices by Science.” Trademarksadjusting sales prices on a weekly basis and by turning rather than holding inventory in anticipation of higher prices. The Company actively manages its exposure to commodity price risk and monitors the actual and expected spread between forward selling prices and purchase costs and processing and shipping expense. The Company also currently spreads the processing of Vytex NRL among three continents. Sales contracts are carried at costbased on forward market prices, and since their estimated lifegenerally orders are placed 30 to 90 days ahead of shipment date due to these fluctuations. However, financial results may be negatively impacted where selling prices fall more quickly than purchase price adjustments can be made or when levels of inventory have an anticipated net realizable value that is indeterminable, no amortization is recognized. Instead, they are evaluated annually for impairment.below cost.
Impairment of Long-lived AssetsLoss Per Share
Long-lived assets,The Company presents basic and diluted loss per share. Because the Company reported a net loss in 2018 and 2017, common stock equivalents, including propertystock options and equipmentwarrants, were anti-dilutive; therefore, the amounts reported for basic and intangible assets with finite lives, are evaluateddilutive loss per share were the same. Excluded from the computation of diluted loss per share were options to purchase 29,438,270 and 7,748,270 shares of common stock for impairment whenever events or changes in circumstances indicate that2018 and 2017, respectively, as their effect would be anti-dilutive. Warrants to purchase 14,888,832 and 14,699,582 shares of common stock for 2018 and 2017, respectively, were also excluded from the carrying amountcomputation of such assets may notdiluted loss per share as their effect would be recoverable. Ifanti-dilutive. In addition, preferred stock convertible to 4,314,537 and 4,037,977 shares of common stock for 2018 and 2017, respectively, were excluded from the sumcomputation of the expected future undiscounted cash flows is less than the carrying amount of the asset, an impairmentdiluted loss is recognized in the amount that the carrying amount of the asset exceeds its fair value. Fair value is determined based on discounted future net cash flows associated with the use of the asset.per share as their effect would be anti-dilutive.
Fair Value of Financial Instruments
The Company’s financial instruments consist of cash, accounts receivable, accounts payable, accrued expenses, lines of credit, shareholder notes payable, and long-term debt. The carrying values of all the Company’s financial instruments approximate fair value because of their short maturities. In addition to the short maturities, the carrying amounts of our line of credit and shareholder notes payable approximate fair value because the interest rates at December 31, 20172018 and 20162017 approximate market interest rates for the respective borrowings.
In specific circumstances, certain assets and liabilities are reported or disclosed at fair value. Fair value is the exit price that would be received to sell an asset or paid to transfer a liability in an orderly transaction between market participants at the measurement date in the Company’s principal market for such transactions. If there is not an established principal market, fair value is derived from the most advantageous market.
Valuation inputs are classified in the following hierarchy:
| ● | Level 1 inputs are unadjusted quoted prices in active markets for identical assets or liabilities. | |
| ● | Level 2 inputs are directly or indirectly observable valuation inputs for the asset or liability, excluding Level 1 inputs. | |
| ● | Level 3 inputs are unobservable inputs for the asset or liability. |
Highest priority is given to Level 1 inputs and the lowest priority to Level 3 inputs. Acceptable valuation techniques include the market approach, income approach, and cost approach. In some cases, more than one valuation technique is used. The derivative liabilities are recognized at fair value on a recurring basis at December 31, 2018 and are level 3 measurements. There has been no transfers between levels during the year ended December 31, 2018.
Income Taxes
Vystar recognizes income taxes on an accrual basis based on a tax position taken or expected to be taken in its tax returns. A tax position is defined as a position in a previously filed tax return or a position expected to be taken in a future tax filing that is reflected in measuring current or deferred income tax assets or liabilities. Tax positions are recognized only when it is more likely than not (i.e., likelihood of greater than 50%), based on technical merits, that the position would be sustained upon examination by taxing authorities. Tax positions that meet the more likely than not threshold areis measured using a probability-weighted approach as the largest amount of tax benefit that is greater than 50% likely of being realized upon settlement. Income taxes are accounted for using an asset and liability approach that requires the recognition of deferred tax assets and liabilities for the expected future tax consequences of events that have been recognized in our financial statements or tax returns. A valuation allowance is established to reduce deferred tax assets if all, or some portion, of such assets will more likely than not be realized. A valuation allowance for the full amount of the net deferred tax asset was recorded for the years ended December 31, 20172018 and 2016.2017. Should they occur, interest and penalties related to tax positions are recorded as interest expense. No such interest or penalties have been incurred as of December 31, 20172018 and 2016.2017. The Company is no longer subject to federal examination for years prior to 2013.2015.
On December 22, 2017, the Tax Cuts and Jobs Act was signed into law impacting corporations by reducing the maximum tax rate from 35% to 21%, as well as various other provisions relating to the deductibility of certain items. The Act is not expected to have an immediate impact on the Company due to the large net operating loss carryforward as well as the full valuation allowance.
Acquisition
Amounts paid for acquisitions are allocated to the assets acquired and liabilities assumed based on their estimated fair value at the date of acquisition. The fair value of identifiable intangible assets is based on valuations that use information and assumptions provided by management. Identifiable intangible assets with finite lives are amortized over their useful lives. Acquisition-related costs, including, legal, accounting, and other costs, are capitalized in asset acquisitions and for business combinations are expensed in the periods in which the costs are incurred. The results of operations of acquired assets are included in the financial statements from the acquisition date.
Accounts Receivable
Accounts receivable are stated at the amount management expects to collect from outstanding balances. Management provides for uncollectible amounts through a charge to earnings and a credit to an allowance for doubtful accounts based upon its assessment of the current status of individual accounts. Balances that are still outstanding after management has performed reasonable collection efforts are written off through a charge to the allowance and a credit to accounts receivable. As of December 31, 2018, and 2017, the Company determined there were no amounts deemed uncollectible. The Company grants credit to customers without requiring collateral. The amount of accounting loss for which Vystar is at risk in these unsecured accounts receivable is limited to their carrying value. Vytex customers are located in both the United States and internationally.
Inventories
Inventory cost includes those costs directly attributable to the product before sale. Inventory consists primarily of finished goods of foam toppers, mattresses and pillows and is carried at the lower of cost or market (net realizable value), using first-in, first-out method.
Loss Per ShareProperty and Equipment
Property and equipment is stated at cost. Depreciation is provided by the use of the straight-line and accelerated methods for financial and tax reporting purposes, respectively, over the estimated useful lives of the assets, generally 5 to 10 years. As of December 31, 2018, the net balance of property and equipment is $291,346 with accumulated depreciation of $31,485. As of December 31, 2017, all property and equipment was fully depreciated resulting in no net balance being reflected.
Intangible Assets
Patents represent legal and other fees associated with the registration of patents. The Company has four issued patents with the United States Patent and Trade Office (USPTO) as well as four issued international PCT (Patent Cooperation Treaty) patents. Patents are carried at cost and are being amortized on a straight-line basis over their estimated useful lives, typically 20 years.
The Company presents basichas trademark protection for “Vystar”, “Vytex”, and diluted loss per share. Because“Created by Nature. Recreated by Science.” Trademarks are carried at cost and since their estimated life is indeterminable, no amortization is recognized. Instead, they are evaluated annually for impairment.
We review our long-lived assets for impairment whenever events or changes in circumstances indicate that the carrying amount of the assets may not be fully recoverable. We evaluate assets for potential impairment by comparing estimated future undiscounted net cash flows to the carrying amount of the assets. If the carrying amount of the assets exceeds the estimated future undiscounted cash flows, impairment is measured based on the difference between the carrying amount of the assets and fair value. Assets to be disposed of would be separately presented in the consolidated balance sheet and reported at the lower of the carrying amount or fair value less costs to sell and are no longer depreciated. The assets and liabilities of a disposal group classified as held-for-sale would be presented separately in the appropriate asset and liability sections of the consolidated balance sheet, if material. During the year ended December 31, 2018, we recognized an impairment charge of $848,462 related to the increase in value of the Company’s common stock from the time of negotiation to closing and the fair value of the underlying assets. During the years ended December 31, 2017, we did not recognize any impairment of our long-lived assets.
Goodwill
Goodwill
Goodwill reflects the cost of an acquisition in excess of the fair values assigned to identifiable net assets acquired. Goodwill is not amortized; rather, it is subject to a periodic assessment for impairment by applying a fair value based test. We perform our annual impairment test at the end of each calendar year, or more frequently if events or changes in circumstances indicate that the asset might be impaired.
Accounting for acquisitions requires us to recognize, separately from goodwill, the assets acquired and the liabilities assumed at their acquisition-date fair values. Goodwill as of the acquisition date is measured as the excess of consideration transferred and the net of the acquisition-date fair values of the assets acquired and the liabilities assumed. While we use best estimates and assumptions to accurately value assets acquired and liabilities assumed at the acquisition date, the estimates are inherently uncertain and subject to refinement.
The impairment model permits, and we utilize, a simplified approach for determining goodwill impairment. In the first step, we evaluate the recoverability of goodwill by estimating the fair value of our reporting unit using multiple techniques, including an income approach using a discounted cash flow model and a market approach. Based on an equal weighting of the results of these two approaches, a conclusion of fair value is estimated. The fair value is then compared to the carrying value of our reporting unit. If the fair value of a reporting unit is less than its carrying value, the Company reported a net loss in 2017 and 2016, common stock equivalents, including stock options and warrants, were anti-dilutive; therefore,recognizes this amount as an impairment loss. Impairment losses, limited to the amounts reported for basic and dilutive loss per share werecarrying value of goodwill, represent the same. Excluded fromexcess of the computationcarrying amount of diluted loss per share were options to purchase 7,748,271 and 9,418,271 shares of common stock for 2017 and 2016, respectively, as their effect would be anti-dilutive. Warrants to purchase 14,699,582 and 16,122,332 shares of common stock for 2017 and 2016, respectively, were also excluded from the computation of diluted loss per share as their effect would be anti-dilutive. In addition, preferred stock convertible to 4,037,977 and 3,761,417 shares of common stock for 2017 and 2016, respectively, were excluded from the computation of diluted loss per share as their effect would be anti-dilutive.
Revenuegoodwill over its implied fair value.
Revenue
On January 1, 2018, we adopted FASB Accounting Standards Codification (“ASC”) Topic 606, Revenue from Contracts with Customers (“ASC 606”). The new guidance sets forth a new five-step revenue recognition model which replaces the prior revenue recognition guidance in its entirety and is derivedintended to eliminate numerous industry-specific pieces of revenue recognition guidance that have historically existed in U.S. GAAP. The underlying principle of the new standard is that a business or other organization will recognize revenue to depict the transfer of promised goods or services to customers in an amount that reflects what it expects to receive in exchange for the goods or services. The standard also requires more detailed disclosures and provides additional guidance for transactions that were not addressed completely in the prior accounting guidance.
We reviewed all contracts at the date of initial application and elected to use the modified retrospective transition method, where the cumulative effect of the initial application is recognized as an adjustment to opening retained earnings at January 1, 2018. Therefore, comparative prior periods have not been adjusted and continue to be reported under FASB ASC Topic 605,Revenue Recognition, (“ASC 605”). The adoption of the new revenue recognition guidance was immaterial to our condensed statements of operations, balance sheet, and cash flows as of and for the year ended December 31, 2018.
Our principal activities from saleswhich we generate our revenue are product sales. Revenue is measured based on considerations specified in a contract with a customer. A contract exists when it becomes a legally enforceable agreement with a customer. The contract is based on either the acceptance of standard terms and conditions on the websites for e-commerce customers and via telephone with our third-party call center for our print media and direct mail customers, or license feesthe execution of Vytex NRL raw materialterms and conditions contracts with retailers and wholesalers. These contracts define each party’s rights, payment terms and other contractual terms and conditions of the sale. Consideration is typically paid prior to manufacturersshipment via credit card or check when our products are sold direct to consumers, which is typically within a 1 to 2 days or approximately 30 days from the time control is transferred when sold to wholesalers, distributors and retailers. We apply judgment in determining the customer’s ability and intention to pay, which is based on a variety of factors including the customer’s historical payment experience and, in some circumstances, published credit and financial information pertaining to the customer.
A performance obligation is a promise in a contract to transfer a distinct product to the customer, which for us is transfer of finished goods to our customers. Performance obligations promised in a contract are identified based on the goods that will be transferred to the customer that are both capable of being distinct and are distinct in the context of the contract, whereby the transfer of the goods is separately identifiable from other promises in the contract. We have concluded the sale of finished goods and related shipping and handling are accounted for as the single performance obligation.
The transaction price of a contract is allocated to each distinct performance obligation and recognized as revenue when or as the customer receives the benefit of the performance obligation. The transaction price is determined based on the consideration to which we will be entitled to receive in exchange for transferring goods to the customer. We issue refunds to e-commerce and print media customers, upon request, within 30 days of delivery. We estimate the amount of potential refunds at each reporting period using a portfolio approach of historical data, adjusted for changes in expected customer experience, including seasonality and changes in economic factors. For retailers, distributors and wholesalers, we do not offer a right of rubberreturn or refund and rubber end products. Under both the direct and licensing agreement sales revenue is recognized at the time products are shipped to customers. In all cases, judgment is required in estimating these reserves. Actual claims for returns could be materially different from the estimates. As of December 31, 2018, reserves for estimated sales returns totaled $3,000. There was no reserve for 2017.
We recognize revenue when we satisfy a performance obligation in a contract by transferring control over a product to a customer when product is shipped based on fulfillment by the Company. The Company considers fulfillment when it passes all liability at the point of shipping through third party carriers. Taxes assessed by a governmental authority that are both imposed on and title passesconcurrent with a specific revenue-producing transaction, that are collected by us from a customer, are excluded from revenue. Shipping and handling costs associated with outbound freight after control over a product has transferred to the customer. Revenue is recognized when the following four criteriaa customer are met: (1) persuasive evidenceaccounted for as a fulfillment cost and are included in cost of an arrangement exists; (2) shipment or delivery has occurred; (3) the price is fixed or determinable and (4) collectability is reasonably assured.product sales.
Cost of Revenue
Cost of revenue consists primarily of product and freight costs.costs and fees paid to online retailers for costs of material.
Research and Development
Research and development costs are expensed when incurred. Research and development costs include all costs incurred related to the research, development and testing of the Company’s process to produce Vytex NRL.
Vytex NRL has produced protein test results on finished products that are both “below detection” and “not detectable” in terms of the amount of proteins remaining in these finished goods made with Vytex NRL. These results have been reproduced in many subsequent tests. From inception through December 31, 2018, Vystar’s research and development costs have been approximately $2.4 million.
Recent Accounting Pronouncements
In May 2014, the FASB issued Accounting Standards Update (“ASU”) No. 2014-09,Revenue from Contracts with Customers, a new standard on revenue recognition. The new standard will supersede existing revenue recognition guidance and apply to all entities that enter into contracts to provide goods or services to customers. The guidance also addresses the measurement and recognition of gains and losses on the sale of certain non-financial assets, such as real estate, property and equipment. In August 2015, the FASB issued ASU No. 2015-14, Revenue from Contracts with Customers: Deferral of the Effective Date, which defers the effective date of the guidance in ASU 2014-09 by one year. This update is now effective for annual and interim period beginning after December 15, 2017, which will require us to adopt these provisions inand has been adopted for the first quarteryear ended December 31, 2018. The Company has finalized its assessment of fiscal year 2018. Early application is permitted for annual reporting periods beginning after December 15, 2017, including interim reporting periods within that reporting period. This update permitsASU 2014-09 and adopted the use of eitherstandard using the modified retrospective or cumulative effect transition method. The Company has assessedconcluded that the impact that this guidance will have on its financial statements and determined itadoption will not have aan impact on the timing of its revenue recognition for revenue. Any cumulative effect from this change would be recorded to the accumulated deficit but as of the year ended December 31, 2018 there was no material effect.impact.
In February 2016, the FASB issued ASU 2016-02, Leases.Leases. ASU 2016-02 requires lessees to recognize the assets and liabilities on their balance sheet for the rights and obligations created by most leases and continue to recognize expenses on their income statements over the lease term. It will also require disclosures designed to give financial statement users information on the amount, timing, and uncertainty of cash flows arising from leases. The guidance is effective for annual reporting periods beginning after December 15, 2018, and interim periods within those years. Early adoption is permitted. The Company has adopted and is currently assessing the impact that this guidance will have on its financial statements.
In August 2016, the FASB issued ASU No. 2016-15,Statement of Cash Flows (Topic 230): Classification of Certain Receipts and Cash Payments.Payments. This update addresses eight specific cash flow issues with the objective of reducing the existing diversity in practice in how certain receipts and cash payments are presented and classified in the statement of cash flows. The new standard is effective for fiscal years, and interim periods within those fiscal years, beginning after December 15, 2017. The Company has adopted this update for the year ended December 31, 2018
In August 2018, the FASB issued ASU 2018-13, Fair Value Measurement (Topic 820), Disclosure Framework - Changes to the Disclosure Requirements for Fair Value Measurement, which eliminates, adds and modifies certain disclosure requirements for fair value measurements, including eliminating the requirement to disclose the amount of and reasons for transfers between Level 1 and Level 2 of the fair value hierarchy, and requiring the range and weighted average used to develop significant unobservable inputs for Level 3 fair value measurements. The new guidance is currently assessingeffective for fiscal years beginning after December 15, 2019, including interim periods within those fiscal years. Early adoption, either of the entire standard or only the provisions that eliminate or modify requirements, is permitted. The Company has evaluated the disclosure requirements of this standard and does not expect it to have a material impact on the Company’s financial statements.
In June 2018, the FASB issued ASU 2018-07, Compensation - Stock Compensation (Topic 718) to expand the scope of ASC 718, Compensation - Stock Compensation (Topic 718) (“ASU 2017-07”), to include share-based payment transactions for acquiring goods and services from non-employees. The pronouncement is effective for fiscal years, and for interim periods within those fiscal years, beginning after December 15, 2018, with early adoption permitted. We do not expect this ASU to have a significant impact on our financial statements and related disclosures.
In July 2017, the FASB issued ASU 2017-11, Earnings per share (Topic 260), Distinguishing Liabilities from Equity (Topic 480), and Derivatives and Hedging (Topic 815): Accounting for Certain Financial Instruments with Down Round Features. The update addresses the complexity of accounting for certain financial instruments with down round features and the liability or equity classification of financial instruments with warrants or convertible features. The guidance eliminates the requirement to consider “down round” features when determining whether certain equity-linked financial instruments or embedded features are indexed to an entity’s own stock. The ASU is effective for annual periods beginning after December 15, 2018, and for interim periods within those years, with early adoption permitted. We do not expect this ASU to have a significant impact on our financial statements and related disclosures.
In January 2017, the FASB issued ASU 2017-01, Business Combinations (Topic 805): Clarifying the Definition of a Business. The update provides that when substantially all the fair value of the assets acquired is concentrated in a single identifiable asset or a group of similar identifiable assets, the set is not a business. This update is effective for annual and interim periods beginning after December 15, 2017, and interim periods within that reporting period. We adopted this ASU on January 1, 2018 and the impact that this guidanceon our financial statements will havedepend on its financial statements.the facts and circumstances of any specific future transactions.
NOTE 23 – LIQUIDITY AND GOING CONCERN
The Company'sCompany’s financial statements are prepared using the accrual method of accounting in accordance with accounting principles generally accepted in the United States of America and have been prepared on a going concern basis, which contemplates the realization of assets and the settlement of liabilities in the normal course of business. However, we have incurred significant losses and experienced negative cash flow since inception. AtAs of December 31, 2017,2018, the Company had cash of $13,502$50,053 and a deficit in working capital of $2,774,565.$1,691,520. For the year ended December 31, 2018, the Company had a net loss of $5,401,222 and an accumulated deficit of $33,400,345. For the year ended December 31, 2017, the Company had a net loss of $1,184,474 and an accumulated deficit of $27,999,123. For the year ended December 31, 2016, the Company had a net loss of $1,221,298 and the accumulated deficit amounted to $26,814,649. We use working capital to finance our ongoing operations, and since those operations do not currently cover all of our operating costs, and managing working capital is essential to our Company'sCompany’s future success.
Net cash used in operating activities was $498,963 for the year ended December 31, 2017 as compared to $907,441 for the year ended December 31, 2016. During the year ended December 31, 2017, cash used in operations was primarily due to the net loss for the year of $1,153,730 net of non-cash related add-back of share-based compensation expense of $710,348.
The Company had no net cash provided by investing activities during the year ended December 31, 2017. Net cash provided by investing activities for the year ended December 31, 2016 was $2,701 was a result of selling some equipment.
Net cash provided by financing activities was $476,183 during the year ended December 31, 2017, as compared to cash provided of $911,963 during the year ended December 31, 2016. During 2017 cash was provided from the issuance of common stock in the amount of $384,500 and $91,683 in proceeds from Shareholder Notes. In 2016, the cash provided by financing activities was provided from the issuance of common stock in the amount of $723,456, $53,500 from the exercise of common stock warrants and $135,000 in proceeds from Shareholder Notes.
A successful transition to attaining profitable operations is dependent upon obtaining sufficient financing to fund the Company’s planned expenses and achieving a level of revenue adequate to support the Company’s cost structure. Management plans to finance future operations through the use of cash on hand, increased revenue from Vytex division license fees, stock warrant exercises from existing shareholders, and raising capital through private placement memoranda (see Note 13,16, Subsequent Events).
As a result of this history of losses and financial condition, there is substantial doubt about the Company’s ability to continue as a going concern.
There can be no assurances that the Company will be able to achieve projected levels of revenue in 20182019 and beyond. If the Company is not able to achieve projected revenue and obtain alternate additional financing of equity or debt, the Company would need to significantly curtail or reorient operations during 2018,2019, which could have a material adverse effect on the ability to achieve the business objectives and as a result may require the Company to file for bankruptcy or cease operations. The financial statements do not include any adjustments relating to the recoverability and classification of recorded asset amounts or amounts classified as liabilities that might be necessary should the Company be forced to take any such actions.
The Company’s future expenditures will depend on numerous factors, including: the rate at which the Company can introduce and license Vytex NRL to manufacturers; the costs of filing, prosecuting, defending and enforcing any patent claims and other intellectual property rights; and market acceptance of the Company’s products, and services and competing technological developments. As the Company expands our activities and operations, cash requirements are expected to increase at a rate consistent with revenue growth after the Company has achieved sustained revenue generation.
NOTE 4 – PROPERTY AND EQUIPMENT
Property and equipment, net consists of the following at December 31:
| 2018 | 2017 | |||||||
| Tooling and testing equipment | $ | 319,000 | $ | — | ||||
| Warehouse equipment | 3,831 | — | ||||||
| Furniture and fixtures | — | 8,522 | ||||||
| 322,831 | 8,522 | |||||||
| Accumulated depreciation | (31,485 | ) | (8,522 | ) | ||||
| Property and equipment, net | $ | 291,346 | $ | — | ||||
The Company incurred $31,485 in depreciation expense for the year ended December 31, 2018. There was no depreciation incurred in 2017.
NOTE 35 – INTANGIBLE ASSETS
Intangible assets were as follows at December 31:
| 2017 | 2016 | |||||||
| Patents | $ | 238,551 | $ | 238,551 | ||||
| Trademarks & trade name | 9,072 | 9,072 | ||||||
| Subtotal | 247,623 | 247,623 | ||||||
| Accumulated amortization | (123,741 | ) | (108,061 | ) | ||||
| Intangible assets, net | $ | 123,882 | $ | 139,562 | ||||
| 2018 | 2017 | Amortization (in years) | ||||||||||
| Amortized intangible assets | ||||||||||||
| Customer relationships | $ | 100,000 | $ | — | 10 | |||||||
| Proprietary technology | 610,000 | — | 10 | |||||||||
| Tradename and brand | 610,000 | — | 10 | |||||||||
| Patents | 242,149 | 238,551 | 6 - 20 | |||||||||
| Noncompete | 50,000 | — | 5 | |||||||||
| Total | 1,612,149 | 238,551 | ||||||||||
| Accumulated amortization | (237,302 | ) | (123,741 | ) | ||||||||
| Net amortized intangibles | 1,374,847 | 114,810 | ||||||||||
| Indefinite-lived intangible assets | ||||||||||||
| Goodwill | 147,092 | — | ||||||||||
| Trademarks | 9,072 | 9,072 | ||||||||||
| Total intangible assets | $ | 1,531,011 | $ | 123,882 | ||||||||
Amortization expense for the years ended December 31, 2018 and 2017 and 2016 was $15,680$113,561 and $15,861, respectively.
Estimated future amortization expense for finite-lived intangible assets is as follows:
| 2017 | 2018 | 2019 | 2020 | 2021 | Thereafter | |||||||||||||||||||
| Patents & trade name | $ | 15,680 | $ | 15,680 | $ | 15,680 | $ | 15,680 | $ | 15,680 | $ | 45,482 | ||||||||||||
| Amount | |||||
| 2019 | $ | 157,684 | |||
| 2020 | 157,684 | ||||
| 2021 | 157,684 | ||||
| 2022 | 157,684 | ||||
| 2023 & thereafter | 744,111 | ||||
| Total | $ | 1,374,847 | |||
As discussed in Note 13, in May 2018, nine (9) shareholders of the Company consented to purchase substantially all the assets of UV Flu Technologies, Inc., a Nevada corporation (“UV Flu”). Pursuant to the Asset Purchase Agreement, the purchase of substantially all assets of UV Flu was consummated on May 7, 2018. Vystar acquired all UV Flu intellectual property and two patents, product lines, tooling, FDA clearances, research data, websites and other assets for the purchase price of $1,814,670 or 27,918,000 shares of Vystar restricted common stock which may not be assigned or sold by UV Flu for twelve months. In addition, In April 2018, the Company issued 27,769,500 shares of its restricted common stock valued at approximately $1,110,780 based on the closing price of the Company’s common stock on April 18, 2018 in exchange for certain assets of NHS Holdings, LLC (NHS), the exclusive U.S. distributorship of Vystar’s Vytex® virtually allergen-, VOC-, and odor-free natural rubber latex (NRL) foam.
In determining the fair value of the intangible assets related to the purchases, the Company considered, among other factors, the best use of acquired assets such as tooling and testing equipment, analysis of historical financial performance of the products and estimates of future performance of the products and intellectual properties acquired. An analysis was done analysis of historical financial performance of the products and estimates of future performance of the products and intellectual properties acquired. This helped determine the fair values of the identified intangible assets related to the website, FDA Certification, tradename and branding, reacquired distribution rights, customer relationships. The Company originally recorded preliminarily purchase price allocations of the identified intangible assets. The Company has finalized the purchase price allocation through the use of management assumptions used above. Accordingly, differences between the preliminary estimates from the financial statements for nine months ended September 30, 2018 and the final allocation noted in Note 13 related to the intangible assets have incurred differences that had a material impact on the accompanying financial statements. As discussed in Note 2, an impairment loss was recorded in the amount of $848,462 and is recognized in other income (expense) in the statements of operations for the year ended December 31, 2018.
NOTE 46 – NOTES PAYABLE AND LOAN FACILITY
Related Party Line of CreditLoan (CMA Note Payable)
On April 29, 2011,November 2, 2012, the Company executed a $1,500,000 unsecured line of credit agreement with CMA Investments, LLC, a related party and a Georgia limited liability company of which three(the “CMA Note”). Three of the directors of the Company (“CMA directors”) arewere initially the members (“CMA”), an unsecured line of credit bearingCMA. Pursuant to the terms of the CMA Note, interest is computed at LIBOR plus 5.25% per annum(8.22% at December 31, 2018) on amounts drawn and fees. The weighted average interest rate in effect on the borrowings for the yearsyear ended December 31, 2017 and 20162018 was 6.37% and 5.75%, respectively.7.99%. There are no available borrowings under the CMA note at December 31, 2018.
DuringThe holders of CMA Investments, LLC agreed as of July 10, 2018, to change the tenureterms of the CMA Note Payable, the Company has increased the amount of the Note and in exchange provided benefits to the CMA directorsdebt as follows:
| The Company issued 15 million shares in escrow which CMA could start to | |||
TheDuring the year ended December 31, 2018, the Company recorded approximately $123,000 of interest expense. See note is currently due on demand.16 for subsequent reduction to the amount owed.
Fidelity Bank Note Payable
During the year ended December 31, 2018 certain investors have guaranteed $100,000 each with Fidelity Bank to establish a $500,000 revolving line of credit. At the present time, the Company is paying interest only at a rate of 4.5% per annum, with a balloon payment of $500,000 due in 2033.
Shareholder, Convertible and Contingently Convertible Notes Payable
The following table summarizes shareholder, convertible and contingently convertible notes payable:
| December 31, | ||||||||
| 2018 | 2017 | |||||||
| Shareholder, convertible and contingently convertible notes | $ | 542,528 | $ | 881,673 | ||||
| Accrued interest | 35,140 | 294,995 | ||||||
| Debt discount | (73,519 | ) | — | |||||
| Total notes and accrued interest | $ | 504,149 | $ | 1,176,668 | ||||
Shareholder Notes Payable
ShareholderIncluded in the table above, there were shareholder notes payable outstanding as of December 31, 2018 and 2017 totaled $200,695 and 2016 totaled $881,673, and $835,068, respectively.
On March 11, 2011,From January 1, 2018 to February 9, 2018, the Company issued to existing shareholders of the Company an aggregate of $175,000 ofcontingently convertible promissory notes together with warrants to purchase an aggregate(the “Notes”) for contract work performed by other entities in lieu of 160,000 sharescompensation and expense reimbursement in the amount of the Company’s common stock at $0.68 per share for two years from the date of issuance. Such notes$195,635. The Notes are (i) unsecured, (ii) bear interest at an annual rate of tenfive percent (10%(5%) per annum from date of issuance, and (iii) are convertible into shares of common stock.at the Company’s option post April 19, 2018. The outstanding notesNotes mature one year from issuance but may be extended one (1) additional year by the Company. If converted, the Notes plus accrued interest are currently due on demand and Vystar is currently working with the subscription holders of the matured notes to extend the maturity date beyond 2018. One subscription holder demanded payment for their matured note. The subscription holder and Vystar agreed to three installment payments of $52,785, the first of which was made in the fourth quarter of 2016; one installment was converted to Vystar common stock shares; and another holder of Vystar Shareholder Notes has agreed to purchase the third installment.
In May of 2013, the Company issued to existing shareholders of the Company an aggregate of $420,837 of convertible promissory notes together with warrants to purchase an aggregate of 50,000into shares of the Company’s common stock at $0.49 per share for two years fromthe prior twenty (20) day average closing price with a 50% discount.
Convertible and Contingently Convertible Notes Payable
From January 1, 2018 and through the date of issuance. Suchthese financial statements, the Company has issued certain convertible and contingently convertible promissory notes are (i) unsecured, (ii) bearin varying amounts, in the aggregate of $710,000. The face amount of the notes represents the amount due at maturity along with the accrued interest, at which time that amount may be converted into shares of the Company stock based on the lowest 2 day closing price for the trailing 20 days prior to conversion and carrying a 35% discount. The contingently convertible notes provide for interest to accrue at an annualinterest rate of ten percent (10%)equal to 12% per annum or the maximum rate permitted under applicable law after the occurrence of any event of default as provided in the notes. At any time after 180 days from the issue date, the holder, at its option, may convert the outstanding principal balance and (iii) are convertibleaccrued interest into shares of common stock. The outstanding notes are currently due on demand and Vystar is currently working with the subscription holdersstock of the matured notes to extend the maturity date beyond 2018.
A summary of termsCompany. The initial conversion price for the convertible promissory notes discussed aboveprincipal and additional convertible promissory notes issued to shareholders that are unsecured, bear interest at an annual rate, and have conversion privileges as follows:
| Date | Amount | Interest Rate | Conversion Rate | Maturity |
| March 11, 2011 | $75,000 | 10% | $0.10 of principal and interest for each share | Demand |
| March 11, 2011 | $54,922 | 10% | $0.05 of principal and interest for each share | Demand |
| May 6, 2013 | $390,830 | 10% | $0.05 of principal and interest for each share | Demand |
| May 31, 2013 | $30,007 | 10% | $0.10 of principal and interest for each share | Demand |
| Sept 6, 2013 | $40,769 | 10% | $0.075 of principal and interest for each share | Sept 6, 2018 |
| Dec 30, 2013 | $25,962 | 10% | $0.05 of principal and interest for each share | Dec 30, 2018 |
| Dec 31, 2015 | $37,500 | 10% | $0.08 of principal and interest for each share | Dec 30, 2018 |
| Dec 31, 2016 | $135,000 | 5% | $0.05 of principal and interest for each share | Dec 30, 2021 |
| Oct 10, 2017 | $20,000 | 5% | $0.05 of principal and interest for each share | Demand |
| Oct 10, 2017 | $25,000 | 5% | $0.05 of principal and interest for each share | Dec 30, 2019 |
| Nov 17, 2017 | $6,683 | 5% | $0.05 of principal and interest for each share | Dec 30, 2019 |
| Dec 13, 2017 | $30,000 | 5% | Convertible by the Company upon closing of NHS merger at prior 20-day average closing price, discounted 50% | Dec 13, 2019 |
| Dec 18, 2017 | $10,000 | 5% | Convertible by the Company upon closing of NHS merger at prior 20-day average closing price, discounted 50% | Dec 13, 2019 |
The maturities (by year)in connection with voluntary conversions by a holder of the principal amountconvertible notes ranges from $0.05 to $0.10 per share, subject to adjustment as provided therein. If the total outstanding balance of Shareholder Notes Payablethe contingent convertible notes were convertible as of December 31, 2017 are as follows:2018, they would have been convertible into approximately 343 million shares of the Company’s common stock. Based on the variable conversion price, the Company recorded initial derivative liabilities of $465,905, debt discount of $430,579 and interest expense related to the excess fair value of $35,326 upon the date such notes became convertible.
| Amount | |||||
| Matured | $ | 570,759 | |||
| 2018 | 104,231 | ||||
| 2019 | 71,683 | ||||
| 2020 | — | ||||
| 2021 | 135,000 | ||||
| 2022 & thereafter | — | ||||
| Total | $ | 881,673 | |||
The current base weighted-average conversion price forIn connection with the above referenced Shareholder and Promissory Notes with an outstanding balance asissuance of December 31, 2017 of $1,176,668 including accrued interest of $294,995, is $0.053 per share or 22,208,271the convertible notes, the Company issued warrants to purchase 411,875 shares of the Company’s common stock. The face valueexercise term of the Shareholder Notes at December 31, 2017warrants ranges from issuance to any time on or after the six (6) month anniversary or prior to the maturity of the related note. The exercise price of the warrants is $881,673.
NOTE 5 – COMMITMENTS
Employment Agreements
There are currently no employment agreements in place; however employment compensation and potential agreements are under discussion for 2018.
NOTE 6 – DISCONTINUED OPERATIONS
Kiron Clinical Sleep Lab’s post acquisition performance fell far below Vystar’s expectations. As part$0.40 per share of the Company’s strategycommon stock, as may be adjusted from time to focus on realizingtime pursuant to the potentialantidilution provisions of the Vytex foam business in the pillow and mattress markets as well as part of the Company’s cost reduction plan,related warrant. Pursuant to ASU 2017-11, such antidilution features do not subject the Company made the decision to discontinue the operations of the Kiron division acquired in June 2013 and the division was closed May of 2016derivative accounting pursuant to ASC 815.
There was no revenue from the Kiron division forPeak One Opportunity Fund, L.P.
During the year ended December 31, 2017.The Kiron division revenue was $82,3532018, the Company entered into a financing agreement with Peak One Opportunity Fund, L.P. to receive $435,000 of original issue discount notes in three tranches as follows:
| 1. | July 17, 2018, principal $85,000 with an imputed interest rate of 6%, discounted by 10%, and $5,000 for legal fees, for a net of $71,500 due three years from the funding date. The Company has the option of receiving two additional amounts ninety days apart; |
| 2. | September 14, 2018: $150,000 principal $135,000 net. |
| 3. | November 13, 2018: a final $200,000 principal, $180,000 net. |
Peak One Opportunity Fund is entitled to convert the note into common stock at a price equal to 65% of the lowest traded price for the twenty trading days immediately preceding the date of the date of conversion. The Company has the option to redeem the note at varying prices based upon the redemption date.
Crown Bridge Partners, LLC
During the year ended December 31, 2016. Net gains from discontinued operations were $42,056 and $37,9792018, the Company entered into a financing agreement with Crown Bridge Partners, LLC to receive $100,000 of original issue discount notes in two tranches as follows:
| 1. | August 6, 2018: principal $50,000 bearing interest at 8%, discounted by 10%, and $2,000 for legal fees, for a net of $43,000 due one year from the funding date; |
| 2. | The remaining tranche may be funded at the holder’s discretion. |
Crown Bridge Partners is entitled to convert the note into common stock at a price equal to 65% of the average of the two lowest traded prices for the fiscal yearstwenty-five trading days immediately preceding the date of the date of conversion.
As of December 31, 2018, only the first tranche had been received and none of it has been converted to stock.
In addition, the following notes are convertible after six months from the issue date:
| Face | Interest | Net Cash | Amount | |||||||||||||||||
| Issue Date and Name | Amount | Rate | Maturity | Proceeds | Converted | |||||||||||||||
| Jan 29, 2018 EMA | $ | 80,000 | 12 | % | Jan 29, 2019 | $ | 72,300 | $ | 79,348 | |||||||||||
| Feb 14, 2018 Auctus | 80,000 | 12 | % | Nov 14, 2018 | 72,500 | 70,625 | ||||||||||||||
| Feb 13, 2018 FirstFire Global | 76,500 | 5 | % | Nov 13, 2018 | 72,500 | 81,500 | ||||||||||||||
| May 2, 2018 Power Up | 83,000 | 12 | % | May 23, 2019 | 80,000 | 83,000 | ||||||||||||||
| Jun 20, 2018 Power Up | 68,000 | 12 | % | Jun 25, 2019 | 65,000 | — | ||||||||||||||
During the year ended December 31, 2018 approximately $418,117 of the convertible notes and approximately $28,000 of accrued interest were exchanged for approximately 203,267,791 shares of common stock. In addition, approximately $75,000 of the notes have been subsequently converted to approximately 24,288,000 of common stock and 15,000,000 shares of common stock for CMA were still being held in escrow as of December 31, 2018.
NOTE 7 - DERIVATIVE LIABILITIES
As of December 31, 2018, the Company had a $235,085 derivative liability balance on the balance sheet and recorded a loss from derivative fair value adjustments of $269,539 during the year ended December 31, 2018. The derivative liability activity comes from the convertible notes payable. The Company analyzed the conversion features and warrants of the various note agreements for derivative accounting consideration under ASC 815-15 “Derivatives and Hedging” and determined that the embedded conversion features should be classified as a derivative because the exercise price of these convertible notes are subject to a variable conversion rate. The Company has determined that the conversion feature is not considered to be solely indexed to the Company’s own stock and is therefore not afforded equity treatment. In accordance with ASC 815, the Company has bifurcated the conversion feature of the notes and recorded a derivative liability.
The embedded derivatives for the notes are carried on the Company’s balance sheet at fair value. The derivative liability is marked-to-market each measurement period and any unrealized change in fair value is recorded as a component of the statement of operations and the associated fair value carrying amount on the balance sheet is adjusted by the change. The Company fair values the embedded derivative using the Black-Scholes option pricing model. The conversion feature is valued at the date the feature can be convertible which ranges from the issuance date of the note to 180 days after the issue date.
The following table summarizes the derivative liabilities included in the balance sheet at December 31, 2018:
| Fair Value of Embedded Derivative and Warrant Liabilities: | ||||
| Balance, December 31, 2017 | $ | — | ||
| Initial measurement of liabilities | 465,905 | |||
| Change in fair value | 269,539 | |||
| Reclassification due to conversion | (500,359 | ) | ||
| Balance, December 31, 2018 | $ | 235,085 | ||
NOTE 8 – STOCKHOLDERS’ EQUITY
Preferred Stock
On May 2, 2013, the Company began a private placement offering to sell up to 200,000 shares of the Company’s 10% Series A Cumulative Convertible Preferred Stock. Under the terms of the offering, the Company offered to sell up to 200,000 shares of preferred stock at $10.00 per share for a value of $2,000,000. The preferred stock accumulates a 10% per annum dividend and was convertible at a conversion price of $0.075 per common share at the option of the holder after a nine-month holding period. The conversion price was lowered to $0.05 per common share for those holders who invested an additional $25,000 or more in the Company’s common stock in the aforementioned September 2014 Private Placement. The preferred shares have full voting rights as if converted and have a fully participating liquidation preference.
As of December 31, 2018, the 13,828 shares of outstanding preferred stock had accumulated undeclared dividends of approximately $77,447 and could be converted into 4,314,537 shares of common stock, at the option of the holder.
As of December 31, 2017, the 13,828 shares of outstanding preferred stock had accumulated undeclared dividends of approximately $63,600 and could be converted into 4,037,977 shares of common stock, at the option of the holder.
Common Stock and Warrants
During the year ended December 31, 2017, the Company had 1,950,000 cashless common stock warrants exercised at $0.05 per share and issued 1,332,109 common shares.
During the year ended December 31, 2017, the Company had 1,750,000 cashless common stock options exercised at $0.05 per share and issued 481,884 common shares.
As part of the November 2016 respectively. Net gainsPrivate Placement Memorandum, the Company issued 7,690,000 shares of common stock to sixteen (16) accredited investors during the period from January 1, 2017 to September 30, 2017. Total gross proceeds of the issuances were $384,500. No commissions were paid. The shares of common stock were offered and sold in reliance upon exemptions from registration pursuant to Section 4(2) of the Securities Act of 1933, as amended, and Regulation D promulgated thereunder.
On March 15, 2017, the Company issued 1,150,000 common shares as compensation under Business Development Agreements.
On April 25, 2017, the Company issued 1,109,406 common shares as a result of a partial conversion of a shareholder note and accrued interest.
On May 22, 2017, the Company signed a sales and marketing agreement issuing restricted common shares quarterly as goals are achieved and issued 363,985 shares on September 28, 2017 and 368,218 on October 10, 2017.
On July 1, 2017, the Company issued 3,125,000 shares under the Company’s Public Relations Services Agreement through December 2018.
On September 29, 2017, the Company issued 500,000 shares of common stock as part of the existing PPM to its CEO in lieu of salary earned in August and September 2017.
On September 27, 2017, the Company issued an additional 200,000 common shares as compensation under a Business Development Agreement.
On July 30, 2017, the Company issued 200,000 common shares as compensation under a Business Development Agreement.
On July 25, 2017, the Company issued 1,087,023 shares as part of a prior contract for business development.
On November 1, 2017, the Company issued 250,000 shares of common stock as part of the existing PPM to its CEO in lieu of salary earned in October 2017.
On April 27, 2018, the Company issued 300,000 common shares as compensation under the Company’s Business Development Agreement with Designcenters.com, a related party, with an effective date of January 3, 2018. The Company recorded directly relatedan expense of $15,000 for these shares. In addition, the Company accrued approximately $171,610, which approximates the fair value of the additional common stock compensation, included in the terms of the agreement, on the measurement dates (included in accrued stock-based compensation on the balance sheet). The terms of this agreement will remain in force unless terminated by either party after nine months from the effective date, upon thirty days prior written notice to the write-offother party.
On April 27, 2018, the Company issued 11,000,000 options as a signing bonus under an employment agreement to the CEO Steven Rotman with an effective date of payables determinedJanuary 3, 2018. The Company recorded an expense of $550,000 for these options and accrued stock compensation for shares amounting to $222,173.
On April 27, 2018, the Company issued 7,500,000 options as a signing bonus under a consulting agreement with Blue Oar Consulting, Inc. The Company recorded an expense of $375,000 for these options and accrued stock compensation for shares amounting to $266,608.
On April 27, 2018, the Company issued 421,408 common shares as compensation under the Company’s Business Development Agreement with Anchor Group, LLC with an effective date of January 3, 2018. The Company recorded an expense of $19,806 for these shares. In addition, the Company accrued approximately $119,610, which approximates the fair value of the additional common stock, included in the terms of the agreement, on the measured dates (included in accrued stock-based compensation on the condensed balance sheet). The terms of this agreement will remain in force unless terminated by either party after nine months from the effective date, upon thirty days prior written notice to the other party. During the third quarter 2018, the majority of Anchor Group’s compensation was paid in cash in lieu of shares.
In the fourth quarter of 2018, the following shares issued on April 27, 2018 were cancelled on December 28, 2018; 7,500,000 shares under the terms of a Consulting Agreement to Blue Oar Consulting, Inc; 11,000,000 shares under the terms of an Employment Agreement to Steven Rotman; 3,300,000 shares under the terms of a Consulting Agreement to The Anchor Group. Due to an administrative error in the form of compensation, the stock based compensation was to be options, not shares. Based on the terms of the options, there was no longer due.difference in the fair value from the shares (see note 10).
From January 1, 2018 through December 31, 2018, we issued 1,928,571 shares of our common stock valued at approximately $92,000 for services rendered to the Company in 2018, 54,999,997 shares were to be issued for cash for $165,000 (these shares were issued in January 2019 but included in the issued and outstanding shares at December 31, 2018, see note 16), 4,166,667 shares were issued to convert payables valued at $12,500, 721,408 shares were issued as a signing bonuses valued at $34,806, and 55,687,500 shares were issued as part of acquisitions valued at $2,925,450. During the year ended December 31, 2018, 203,267,791 shares of common stock valued at $1,444,320 were issued upon the conversion of convertible notes.
Other Shares Issued
On February 5, 2018, the Company issued 1,500,000 shares under the terms of a Consulting Agreement dated January 26, 2018 to STILLH20s Financial, LLC. The shares were valued at $75,000.
On April 9, 2018, the Company issued 428,571 shares under the terms of a Consulting Agreement dated April 9, 2018 to vSource1 Capital Corporation. The shares were valued at $17,143.
NOTE 79 – STOCKHOLDERS’ EQUITYSHARE-BASED COMPENSATION
Preferred Stock
At December 31, 2017 and 2016, the 13,828 shares of outstanding preferred stock had accumulated undeclared dividends of approximately $63,600 and $49,800 and could be converted into 4,037,977 and 3,761,417 shares of common stock, respectively, at the option of the holder.
Common Stock and Warrants
As part of a September 2014 Private Placement Memorandum, updated in February 2015 and September 2015, the Company issued 12,480,000 shares of common stock to six (6) accredited investors during the fiscal year ended December 31, 2016. Total gross proceeds of the issuances were $624,000. No commissions were paid. The shares of common stock were offered and sold in reliance upon exemptions from registration pursuant to Section 4(2) of the Securities Act of 1933, as amended, and Regulation D promulgated thereunder.
As part of a November 2016 Private Placement Memorandum, the Company issued 1,700,000 shares of common stock to four (4) accredited investors during the fiscal year ended December 31, 2016. Total gross proceeds of the issuances were $85,000. No commissions were paid. The shares of common stock were offered and sold in reliance upon exemptions from registration pursuant to Section 4(2) of the Securities Act of 1933, as amended, and Regulation D promulgated thereunder.
During the year ended December 31, 2016, the Company had 1,783,335 common stock warrants exercised at $0.03 per share for $53,500 and issued 1,296,885 common shares for cashless warrants that were exercised.
On June 30, 2016, the Company issued 997,466 common shares as compensation under the Company’s Business Development Agreement with Blue Oar Consulting, Inc. executed in March 2013 as amended in August 2013 and amended February 2014 and 250,000 common shares as compensation under the Company’s Business Development Agreement with Byron Novosad executed in February 26, 2014.
During the year ended December 31, 2017, the Company had 1,950,000 cashless common stock warrants exercised at $0.05 per share and issued 1,332,109 common shares.
During the year ended December 31, 2017, the Company had 1,750,000 cashless common stock options exercised at $0.05 per share and issued 481,884 common shares.
As part of the November 2016 Private Placement Memorandum, the Company issued 7,690,000 shares of common stock to sixteen (16) accredited investors during the period from January 1, 2017 to September 30, 2017. Total gross proceeds of the issuances were $384,500. No commissions were paid. The shares of common stock were offered and sold in reliance upon exemptions from registration pursuant to Section 4(2) of the Securities Act of 1933, as amended, and Regulation D promulgated thereunder.
On March 15, 2017, the Company issued 1,150,000 common shares as compensation under Business Development Agreements.
On April 25, 2017, the Company issued 1,109,406 common shares as a result of a partial conversion of a Shareholder Note and accrued interest.
On May 22, 2017, the Company signed a sales and marketing agreement issuing restricted common shares quarterly as goals are achieved and issued 363,985 shares on September 28, 2017 and 368,218 on October 10, 2017.
On July 1, 2017, the Company issued 3,125,000 shares under the Company’s Public Relations Services Agreement through December 2018.
On September 29, 2017, the Company issued 500,000 shares of common stock as part of the existing PPM to its CEO in lieu of salary earned in August and September 2017.
On September 27, 2017, the Company issued an additional 200,000 common shares as compensation under a Business Development Agreement.
On July 30, 2017, the Company issued 200,000 common shares as compensation under a Business Development Agreement.
On July 25, 2017, the Company issued 1,087,023 shares as part of a prior contract for business development.
On November 1, 2017, the Company issued 250,000 shares of common stock as part of the existing PPM to its CEO in lieu of salary earned in October 2017.
NOTE 8 – SHARE-BASED COMPENSATION
Generally accepted accounting principles requireGAAP requires share-based payments to employees, including grants of employee stock options, warrants, and common stock to be recognized in the income statement based on their fair values at the date of grant, net of estimated forfeitures.
In total, the Company recorded approximately $577,708 and $585,556 of stock-based compensation for the years ended December 31, 2018 and 2017, respectively, including shares to be issued related to consultants and board member stock options and common stock and warrants issued to non-employees.
The Company used the Black-Scholes option pricing model to estimate the grant-date fair value of awards granted during 20172018 and 2016.2017. The following assumptions were used:
| ● | Expected Dividend Yield – because the Company does not currently pay dividends, the expected dividend yield is zero; | |
| ● | Expected Volatility in Stock Price – Expected volatility calculations were based on the Company’s trading activity which | |
| ● | Risk-free Interest Rate – reflects the average rate on a United States Treasury bond with maturity equal to the expected term of the option or warrant, |
| ● | Expected Life of Awards –because |
In total the Company recorded $60,795 and $55,143 for the years ended December 31, 2018 and 2017, the Company recorded $1,161,132 and 2016,$60,795, respectively, of share-based compensation expense related to employee and Board members’ stock options. The unrecognized compensation expense as of December 31, 20172018 was $151,730$99,721 for non-vested share-based awards to be recognized over a period of approximately five years.
Stock Options
During 2004, the Board of Directors of the Company adopted a stock option plan (the “Plan”) and authorized up to 4,000,000 shares to be issued under the Plan. In April 2009, the Company’s Board of Directors authorized an increase in the number of shares to be issued under the Plan to 10,000,000 shares and to include the independent Board Members in the Plan in lieu of continuing the previous practice of granting warrants each quarter to independent Board Members for services. At December 31, 2017,2018, there were 2,251,729 shares of common stock reservedavailable for issuance under the Plan. In 2014, the Board adopted an additional stock option plan which provides for an additional 5,000,000 shares which are all available as of December 31, 2017.2018. The Plan is intended to permit stock options granted to employees to qualify as incentive stock options under Section 422 of the Internal Revenue Code of 1986, as amended (“Incentive Stock Options”). All options granted under the Plan that are not intended to qualify as Incentive Stock Options are deemed to be non-qualified options. Stock options are granted at an exercise price equal to the fair market value of the Company’s common stock on the date of grant, typically vest over periods up to 4 years and are typically exercisable up to 10 years.
There were 21,800,000 non-plan options granted during the year ended December 31, 2018. The following table summarizes all stock option activity of the Company for the period.
The weighted-average assumptions used in the option pricing model for stock option grants were as follows:
| 2017 | 2016 | 2018 | 2017 | |||||||||||||
| Expected Dividend Yield | 0.00 | % | 0.00 | % | 0.00 | % | 0.00 | % | ||||||||
| Expected Volatility in Stock Price | 149.81 | % | 145.82 | % | 263.33 | % | 149.81 | % | ||||||||
| Risk-Free Interest Rate | 2.35 | % | 1.87 | % | 2.25 | % | 2.35 | % | ||||||||
| Expected Life of Stock Awards – Years | 10.0 | 10.0 | 10.0 | 10.0 | ||||||||||||
| Weighted Average Fair Value at Grant Date | $ | 0.05 | $ | 0.05 | $ | 0.05 | $ | 0.05 | ||||||||
The following tables summarize all stock option activity of the Company for the years ended December 31, 20172018 and 2016:2017:
| Number of Shares | Weighted Average Exercise Price | |||||||||||||||||
| Outstanding, December 31, 2015 | 9,381,573 | $ | 0.19 | |||||||||||||||
| Granted | 500,000 | $ | 0.05 | |||||||||||||||
| Exercised | (400,000 | ) | $ | 0.05 | ||||||||||||||
| Forfeited | (63,302 | ) | $ | 0.07 | ||||||||||||||
| Options Number of Shares | Weighted AverageExercise Price | |||||||||||||||||
| Outstanding, December 31, 2016 | 9,418,271 | $ | 0.16 | 9,418,271 | $ | 0.16 | ||||||||||||
| Exercisable, December 31, 2016 | 6,783,271 | $ | 0.21 | |||||||||||||||
| Granted | 1,500,000 | $ | 0.05 | 1,500,000 | $ | 0.05 | ||||||||||||
| Exercised | (1,750,000 | ) | $ | 0.05 | (1,750,000 | ) | $ | 0.05 | ||||||||||
| Forfeited | (1,420,000 | ) | $ | 0.17 | (1,420,000 | ) | $ | 0.17 | ||||||||||
| Outstanding, December 31, 2017 | 7,748,271 | $ | 0.16 | 7,748,271 | $ | 0.16 | ||||||||||||
| Exercisable, December 31, 2017 | 5,158,271 | $ | 0.25 | 5,158,271 | $ | 0.25 | ||||||||||||
| Granted | 21,800,000 | $ | 0.02 | |||||||||||||||
| Exercised | — | $ | — | |||||||||||||||
| Forfeited | (450,000 | ) | $ | 0.68 | ||||||||||||||
| Outstanding, December 31, 2018 | 29,098,270 | $ | 0.06 | |||||||||||||||
| Exercisable, December 31, 2018 | 27,258,270 | $ | 0.06 | |||||||||||||||
Additional details, including the average remaining contractual life of the options, as well as the range of exercise prices are shown in the table below:
| Number of Shares | Weighted Average Remaining Contractual Life (Years) | Range of Exercise Prices | |||||||||||
| Outstanding, December 31, 2015 | 9,381,573 | 6.29 | $0.05 - $0.68 | ||||||||||
| Granted | 500,000 | 9.10 | $0.05 | ||||||||||
| Exercised | (400,000 | ) | $0.05 | ||||||||||
| Expired/Forfeited | (63,302 | ) | $0.07 | ||||||||||
| Outstanding, December 31, 2016 | 9,418,271 | 4.43 | $0.05 - $0.68 | ||||||||||
| Exercisable, December 31, 2016 | 6,783,271 | 5.99 | $0.10 - $0.68 | ||||||||||
| Granted | 1,500,000 | 9.96 | $0.05 | ||||||||||
| Exercised | (1,750,000 | ) | $0.05 | ||||||||||
| Expired/Forfeited | (1,420,000 | ) | $0.03 - $0.68 | ||||||||||
| Outstanding, December 31, 2017 | 7,748,271 | 5.80 | $0.03 - $0.68 | ||||||||||
| Exercisable, December 31, 2017 | 5,158,271 | 9.42 | $0.03 - $0.68 | ||||||||||
The Company added a director on May 18, 2016. The director was granted 500,000 options with a ten-year term and an exercise price of $0.05 respectively, the closing price of the Company’s common stock on the OTCBB on the grant date. The options vest 25,000 shares quarterly beginning on June 30, 2016 for a period of five years ending March 31, 2021.
Options - Number | Weighted Average Contractual Life | Range of Exercise Prices | |||||||||||
| Outstanding, December 31, 2016 | 9,418,271 | 4.43 | $0.05 - $0.68 | ||||||||||
| Granted | 1,500,000 | 9.96 | $0.05 | ||||||||||
| Exercised | (1,750,000 | ) | $0.05 | ||||||||||
| Expired/Forfeited | (1,420,000 | ) | $0.03 - $0.68 | ||||||||||
| Outstanding, December 31, 2017 | 7,748,271 | 5.80 | $0.03 - $0.68 | ||||||||||
| Exercisable, December 31, 2017 | 5,158,271 | 9.42 | $0.03 - $0.68 | ||||||||||
| Granted | 21,800,000 | 5.00 | $0.0001-$0.35 | ||||||||||
| Exercised | — | ||||||||||||
| Expired/Forfeited | (450,000 | ) | $0.68 | ||||||||||
| Outstanding, December 31, 2018 | 29,098,270 | 4.91 | $0.0001 - $0.68 | ||||||||||
| Exercisable, December 31, 2018 | 27,258,270 | 6.48 | $0.0001 - $0.68 | ||||||||||
The Company added three directors on December 17, 2017. Each director was granted 500,000 options with a ten-year term and an exercise price of $0.05, respectively, the closing price of the Company’s common stock on the OTCBB on the grant date. The options vest 25,000 shares quarterly beginning on December 31, 2017 for a period of five years ending December 31, 2022.
As of December 31, 2018 and 2017, the aggregate intrinsic value of the Company’s outstanding options was $4,000.$22,000 and $4,000, respectively. The aggregate intrinsic value will change based on the fair market value of the Company’s common stock.
Warrants
Warrants are issued to third parties as payment for services, debt financing compensation and conversion and in conjunction with the issuance of common stock. The fair value of each common stock warrant issued for services is estimated on the date of grant using the Black-Scholes option pricing model.
The weighted-average assumptions used in the option pricing model for stock warrant grants were as follows:
| 2017 | 2016 | 2018 | 2017 | |||||||||||||
| Expected Dividend Yield | 0.00 | % | 0.00 | % | 0.00 | % | 0.00 | % | ||||||||
| Expected Volatility in Stock Price | 152.54 | % | 121.20 | % | 295 | % | 152.54 | % | ||||||||
| Risk-Free Interest Rate | 2.01 | % | 2.18 | % | 3.05 | % | 2.01 | % | ||||||||
| Expected Life of Stock Awards – Years | 7.0 | 10.0 | 8.52 | 7.0 | ||||||||||||
The following table represents the Company’s warrant activity for the years ended December 31, 20172018 and 2016:2017:
| Number of Shares | Weighted Average Grant Date Fair Value | Weighted Average Exercise Price | Weighted Average Remaining Contractual Life (Years) | |||||||||||||
| Outstanding, December 31, 2015 | 18,178,158 | $ | 0.13 | 5.54 | ||||||||||||
| Granted | 1,713,244 | $ | 0.07 | $ | 0.07 | 9.07 | ||||||||||
| Exercised | (3,163,336 | ) | $ | 0.05 | 0.3 | |||||||||||
| Forfeited | (605,734 | ) | ||||||||||||||
| Outstanding, December 31, 2016 | 16,122,332 | $ | 0.13 | 5.54 | ||||||||||||
| Granted | 1,240,250 | $ | 0.13 | $ | 0.14 | 6.14 | ||||||||||
| Exercised | (1,950,000 | ) | $ | 0.08 | 0.18 | |||||||||||
| Forfeited | (713,000 | ) | $ | 0.18 | ||||||||||||
| Outstanding, December 31, 2017 | 14,699,582 | $ | 0.10 | 5.41 | ||||||||||||
| Exercisable, December 31, 2017 | 14,699,582 | $ | 0.10 | 5.41 | ||||||||||||
Warrants - Number | Weighted Average Grant Date Fair Value | Weighted Exercise Price | Weighted Average Remaining Contractual Life (Years) | ||||||||||||||
| Outstanding, December 31, 2016 | 16,122,332 | $ | 0.13 | 5.54 | |||||||||||||
| Granted | 1,240,250 | $ | 0.13 | $ | 0.14 | 6.14 | |||||||||||
| Exercised | (1,950,000 | ) | $ | 0.08 | 0.18 | ||||||||||||
| Forfeited | (713,000 | ) | $ | 0.18 | |||||||||||||
| Outstanding, December 31, 2017 | 14,699,582 | $ | 0.10 | 5.41 | |||||||||||||
| Granted | 411,875 | $ | 0.05 | $ | 0.40 | 3.36 | |||||||||||
| Exercised | — | — | $ | — | |||||||||||||
| Forfeited | — | — | $ | — | |||||||||||||
| Expired | (222,625) | — | $ | 0.90 | |||||||||||||
| Outstanding, December 31, 2018 | 14,888,832 | $ | 0.08 | 3.48 | |||||||||||||
| Exercisable, December 31, 2018 | 14,888,832 | $ | 0.08 | 3.48 | |||||||||||||
The stock compensation expense for 20172018 and 20162017 related to warrants was $18,747 and $159,553, respectively.
NOTE 10 – RELATED PARTY TRANSACTIONS
Officers and $115,054, respectively.Directors
During April 2009, the Company’s Board of Directors authorized the inclusion of the Board members in the Company’s stock option plan in lieu of continuing the previous practice of granting warrants each quarter to independent Board members. Each Board member was granted options to purchase 400,000 shares of the Company’s common stock, valued at approximately $84,346 each with an exercise price of $0.68 per share. Vesting occurred at the end of each complete calendar quarter served as an independent Board member of the Company at a rate of 20,000 shares each per quarter. The options are exercisable in whole or in part before September 30, 2019.
Beginning in July 2014, each Board member was granted options to purchase 500,000 shares of the Company’s common stock. The value of each grant ranged from approximately $14,714 to $53,513 depending on the date of the grant and the exercise price of the option. Exercise prices ranged between $0.03 and $0.11 per share and were equal to the closing price of Company’s common stock on the date of the grant. Vesting occurs at the end of each complete calendar quarter served as an independent Board member of the Company at a rate of 25,000 shares each per quarter. The options are exercisable in whole or in part before December 15, 2027.
One board member’s unvested options of 1,420,000 were forfeited when he resigned from the Board in 2017.
Per Steven Rotman’s Employment agreement, he is to be paid approximately $1 per year in cash, $20,833 per month to be paid in shares based on a 20-day average at a 0% discount to market, an option to purchase 11,000,000 shares of common stock at par value as a signing bonus, and $200,000 as a performance bonus. During the year ended December 31, 2018, the Company expensed approximately $222,000 related to shares issued, $550,000 related to options granted, and a performance bonus in the amount of $200,000 Of the expensed amount, approximately $195,000 was paid in cash related was related to the performance bonus for the year ended December 31, 2018.
Designcenters.com
This entity is owned by Jamie Rotman, who is the daughter of the Company’s CEO, Steven Rotman. Designcenters.com provides bookkeeping and management services to the Company. In exchange for such services, the Company has entered into a consulting agreement with the related party entity.
Per Design’s consulting agreement, it is to be paid approximately $7,100 per month to be paid in shares based on a 20-day average at a 50% discount to market, $10,000 quarterly bonus to be paid in shares using the same formula and 300,000 shares of common stock as a one-time signing bonus. During the year ended December 31, 2018, the Company expensed approximately $222,010. Of the expensed amount, approximately $35,400 was paid in cash.
Blue Oar Consulting, Inc.
This entity is owned by Gregory Rotman, who is the son of the Company’s CEO, Steven Rotman. Blue Oar Consulting provides business consulting services to the Company. In exchange for such services, the Company has entered into a consulting agreement with the related party entity.
Per Blue Oar’s consulting agreement, it is to be paid approximately $15,000 per month in cash for expenses, of which $12,500 per month is to be paid in cash or shares. If paid in shares, it will be based on a 20-day average at a 50% discount to market, an option to purchase 7,500,000 shares of common stock at par value as a signing bonus, and $175,000 as a bonus. During the year ended December 31, 2018, the Company expensed approximately $1,010,000. Of the expensed amount, approximately $212,500 was paid in cash.
Rotmans Furniture
During the year ended December 31, 2018, the Company had sales of approximately $60,000 to Murida, DBA Rotmans Furniture (“Rotmans”). Steve Rotman, the Company’s CEO, is the majority owner of Rotmans. At December 31, 2018, the Company had an amount receivable of approximately $75.
During the year ended December 31, 2018, the Company utilized certain warehouse staff, warehouse and office space/services and an executive assistant of Rotmans for the Company’s purposes. The Company estimates the cost of such services to be approximately $40,000 per month or approximately $480,000 for the year ended December 31, 2018 (based on the term such resources were used). The Company was not charged for these resources and does not owe any amounts to Rotmans for the services utilized through December 31, 2018.
NOTE 11 – COMMITMENTS
Employment and Consulting Agreements
We have entered into employment and consulting agreements with certain of our officers, employees, and affiliates. For employees, payment and benefits would become payable in the event of termination by us for any reason other than cause, or upon change in control of our Company, or by the employee for good reason.
There is currently one employment agreement in place for 2018 and 2019 with CEO, Steven Rotman. See compensation terms in Note 10.
During the year ended December 31, 2018, the Company entered into various services agreement with consultants for financial reporting, advisory, and compliance services. The services agreement calls for monthly payments.
Litigation
From time to time, the Company is party to certain legal proceedings that arise in the ordinary course and are incidental to our business.Future events or circumstances, currently unknown to management, will determine whether the resolution of pending or threatened litigation or claims will ultimately have a material effect on our consolidated financial position, liquidity or results of operations in any future reporting periods.
On February 19, 2019, EMA Financial, Inc. filed a lawsuit in the Southern District of New York against the Company. The lawsuit alleged various breaches of an underlying convertible promissory note and stock purchase agreement, and sought four claims for relief: (i) specific performance to enforce a stock conversion and contractual obligations; (ii) breach of contract; (iii) permanent injunction to enforce the stock conversion and contractual obligations; and (iv) legal fees and costs of the litigation. The complaint was filed with a motion seeking: (i) a preliminary injunction seeking an immediate resolution of the case through the stock conversion; (ii) a consolidation of the trial with the preliminary injunctive hearing; and (iii) summary judgment on the first and third claims for relief. As of December 31, 2018, there was no accurate assumption of liability to be accrued.
The Company filed an opposition to the motion and at oral argument the motion for injunctive relief was denied. The Court issued a decision permitting a motion for summary judgment to proceed and permitted the Company the opportunity to supplement its opposition papers together with the plaintiff who was also provided opportunity to submit reply papers. On April 5, 2019, the Company filed the opposition papers as well as a motion to dismiss the first and third causes of action in the complaint.
NOTE 9 – RELATED PARTY TRANSACTIONS
Officers and Directors
During April 2009, the Company’s Board of Directors authorized the inclusion of the Board members in the Company’s stock option plan in lieu of continuing the previous practice of granting warrants each quarter to independent Board members. Each Board member was granted options to purchase 400,000 shares of the Company’s common stock, valued at approximately $84,346 each with an exercise price of $0.68 per share. Vesting occurred at the end of each complete calendar quarter served as an independent Board member of the Company at a rate of 20,000 shares each per quarter. The options are exercisable in whole or in part before September 30, 2019.
Beginning in July 2014, each Board member was granted options to purchase 500,000 shares of the Company’s common stock. The value of each grant ranged from approximately $14,714 to $53,513 depending on the date of the grant and the exercise price of the option. Exercise prices ranged between $0.03 and $0.11 per share and were equal to the closing price of Company’s common stock on the date of the grant. Vesting occurs at the end of each complete calendar quarter served as an independent Board member of the Company at a rate of 25,000 shares each per quarter. The options are exercisable in whole or in part before December 15, 2027.
One board member’s unvested options were forfeited when he resigned from the Board in 2017.
NOTE 10 – DEFINED CONTRIBUTION PLAN
The Company’s tax-qualified retirement plan {401(k)} was terminated in 2016.
NOTE 1112 – MAJOR CUSTOMERS AND VENDORS
Major customers and vendors are defined as a customer or vendor from which the Company derives at least 10% of its revenue and cost of revenue, respectively.
During 207,2018, Vytex licensing revenue came from three major customers Natures Home Solutions, RCMA, andcustomers; Wurfbian Polymer, Centrotrade, Mast Global, which collectively comprised 100% total Vytex licensing revenue. No amounts were owed to major vendors at December 31, 20172018 and December 31, 2016.2017.
During 2018, Vytex Foam revenue came from three major customers; Jeffco, King Koil, and Rotmans. The receivable for Rotmans was $75 as of December 31, 2018. There was no receivable for Jeffco and King Koil as of December 31, 2018.
NOTE 1213 – RISKS AND UNCERTAINTIESASSET PURCHASES
NHS Holdings, LLC
The Company is exposedissued 27,769,500 shares of its restricted common stock valued at approximately $1,110,780 based on the closing price of the Company’s common stock on April 18, 2018 in exchange for certain assets of NHS Holdings, LLC (NHS), the exclusive U.S. distributorship of Vystar’s Vytex® virtually allergen-, VOC-, and odor-free natural rubber latex (NRL) foam. All shares of restricted common stock issued in conjunction with this transaction will be held in escrow for a minimum of nine months to commodity price risk, mainly associated with variationssecure certain potential indemnification obligations of NHS. Such shares will be voted by NHS while they are held in escrow until the shares have been released. In addition to acquiring the net assets and intangibles of the Company, Vystar recognized goodwill in this transaction. Goodwill reflects the cost of the acquisition in excess of the fair values assigned to the identifiable net assets acquired in the table below. Goodwill is not amortized; rather, it is subject to a periodic assessment for impairment by applying a fair value based test. We perform our annual impairment test at the end of each calendar year, or more frequently if events or changes in circumstances indicate that the asset might be impaired. The Company does not expect goodwill to be deductible for tax purposes.
The purpose of the transaction was to increase operations and while reducing costs and the the intention of lowering costs of Vytex by eliminating the middleman. As the exclusive global distributor of Vytex® in the home furnishing goods market, NHS worked extensively with NRL producers to create Vytex® foam products for the bedding industry. NHS was instrumental in introducing these products to manufacturers for use in mattresses, pillows and other bedding products. In addition, NHS was the non-exclusive, global distributor of products in other industries utilizing the Vytex® NRL process. Reacquiring the Vytex® distribution rights from NHS is expected to stimulate sales by lowering the cost of Vytex® to the manufacturer, which will allow the Company to realize the entire gross margin on the sale rather than a 7% royalty on the cost of the product to NHS previously provided in the distribution agreement.
The following summarizes the transaction with NHS Holdings, LLC at closing on April 18, 2018:
| Net assets | $ | 243,688 | ||
| Goodwill | 147,092 | |||
| Intangible assets | 720,000 | |||
| Total assets | $ | 1,110,780 | ||
| Net purchase (fair value of common stock issued) | $ | 1,110,780 |
In determining the fair value of the intangible assets, the Company considered, among other factors, the best use of acquired assets such as the reacquired distribution rights, customer relationships, analysis of historical financial performance of the products and estimates of future performance of the products and intellectual properties acquired. The Company had originally recorded preliminary purchase price allocations of the identified intangible assets and was amortizing such assets over their estimated useful lives of five years. The Company has finalized the purchase price allocation through use of management analysis and certain other factors. The preliminary allocation was properly adjusted for NRLthe finalized figures. Accordingly, differences between these preliminary estimates and the final allocation to the intangible assets have occurred and these differences have been reflected in the accompanying financial statements.
UV Flu Technologies, Inc.
Effective May 7, 2018, nine (9) shareholders of the Company consented to purchase substantially all the assets of UV Flu Technologies, Inc., a Nevada corporation (“UV Flu”). The consents were submitted pursuant to Rule 14(a)-2(b) (2) promulgated under the Securities and Exchange Act of 1934, as amended. Such Rule provides that, other than certain proxy solicitation rules which were either complied with or were otherwise not applicable to the consents submitted to the Company, the proxy solicitation rules set forth in SEC Regulation 14A do not apply to “[any] solicitation made otherwise than on behalf of the registrant where the total number of persons being solicited is not more than ten.” The Company has been presented with written consents which include (a) an approved form of Asset Purchase Agreement between the Company and UV Flu with respect to the purchase of substantially all the assets of UV Flu. The common stock held by the consenting shareholders totaled 118,211,379 shares or approximately 52.8% of the total outstanding shares of common stock of the Company.
The purpose of the transaction was toacquire a Company that could no longer continue operations with current resources and Vystar saw an opportunity of continuing production of UV Flu product lines withBlue Ocean Innovation, Ltd. (“BOI”), a world-class manufacturer. Vystar anticipates it will take 45 days to complete manufacture of the next orders of air purifier units and another 45 days to relaunch sales with a new, more robust distribution model. In addition, Vystar plans to sell RxAir residential units via online and retail channels andalso is reassembling the distribution network to relaunch sales of UV400 and Rx3000 units to the healthcare and medical markets, which UV Flu had ceased due to sales force, distribution and cash flow constraints. Pursuant to the Asset Purchase Agreement, the Company purchased substantially all assets of UV Flu and it was consummated on May 7, 2018. Vystar acquired all UV Flu intellectual property and two patents, product lines, tooling, FDA clearances, research data, websites and other assets for the purchase price of $1,814,670 or 27,918,000 shares of Vystar restricted common stock which may not be assigned or sold by UV Flu for twelve months.
All shares of restricted common stock issued to UV Flu at closing will be held for a minimum of one year before sale or distribution of such shares to the UV Flu shareholders and will be voted consistent with the vote of the Company’s other shareholders until such distribution.
The following summarizes the transaction with UV Flu at closing on May 7, 2018:
| Property and equipment | $ | 319,000 | ||
| Intangible assets | 650,000 | |||
| Total assets | 969,000 | |||
| Impairment loss | 845,670 | |||
| Net purchase (fair value of common stock issued) | $ | 1,814,670 |
In determining the fair value of the UV Flu intangible assets, the Company considered, among other factors, the best use of acquired assets such as tooling and testing equipment, analysis of historical financial performance of the products and estimates of future performance of the products and intellectual properties acquired. The Company originally recorded preliminarily purchase price allocations of the identified intangible assets, such as the FDA Certification, tradename and branding. The Company has finalized the purchase price allocation through the use of management assumptions above and certain other factors. Accordingly, differences between these preliminary estimates and the final allocation to the intangible assets have incurred differences that had a material impact on the accompanying financial statements. As discussed in Note 2, an impairment loss was recorded in the amount of $848,462 and is recognized in other income (expense) in the statements of operations for the year ended December 31, 2018.
The operating results of UV FLU and NHS from the dates of acquisition to December 31, 2018, were deemed immaterial. Any revenues and net income have been included in the Company’s statement of operations for the year ended December 31, 2018. The Company incurred a total of approximately $11,800 in combined transaction and legal costs in connection with the NHS and UV Flu transaction, which were included in operating expenses within the statement of operations for the year ended December 31, 2018.
NOTE 14 – DISCONTINUED OPERATIONS
Kiron Clinical Sleep Lab’s post acquisition performance fell far below Vystar’s expectations. As part of the Company’s strategy to focus on realizing the potential of the Vytex foam business in the pillow and mattress markets as well as winteringpart of the Hevea trees, which differsCompany’s cost reduction plan, the Company made the decision to discontinue the operations of the Kiron division acquired in June 2013 and the division was closed May of 2016
There was no revenue from the Kiron division for each country. the year ended December 31, 2018. There was no revenue for the Kiron division for the year ended December 31, 2017. Net gains from discontinued operations were $0 and $42,056 for the fiscal years ended December 31, 2018 and 2017, respectively. Net gains recorded were directly related to the write-off of payables determined to be no longer due.
NOTE 15 – INCOME TAXES
The timingprovision (benefit) for income taxes for the year ended December 31, 2018 and magnitude2017, assumes a 21% and 34% effective tax rate, respectively, for federal income taxes.
A reconciliation of industry cycles are difficult to predictthe federal statutory income tax rate and are impacted by general economic conditions including the buying climate in China. effective income tax rate as a percentage of income before income taxes is as follows:
| For the year ended December 31, 2018 | For the year ended December 31, 2017 | |||||||
| Federal statutory income tax rate | (21.0 | %) | (35.0 | %) | ||||
| Change in valuation allowance on net operating loss carry-forwards | 21.0 | 35.0 | ||||||
| Effective income tax rate | 0.0 | % | 0.0 | % | ||||
The Company respondshad deferred income tax assets as of December 31, 2018 and 2017 are as follows:
| 2018 | 2017 | |||||||
| NOL carry-forwards | $ | 19,953,984 | $ | 18,411,829 | ||||
| Less valuation allowance | (19,953,984 | ) | (18,411,829 | ) | ||||
| Deferred tax assets, net of valuation allowance | $ | — | $ | — | ||||
At December 31, 2018, the Company had approximately $20 million in Federal tax loss carryforwards that can be utilized in future periods to reduce taxable income and begin to expire in 2038. Pursuant to Internal Revenue Code Section 382, the future utilization of our net operating loss carryforwards to offset future taxable income may be subject to an annual limitation as a result of ownership changes that may have occurred previously or that could occur in NRL prices by adjusting sales prices on a weekly basis and by turning rather than holding inventory in anticipation of higher prices. the future.
The Company actively manages its exposure to commodity price risk and monitors the actual and expected spread between forward selling prices and purchase costs and processing and shipping expense. did not identify any material uncertain tax positions on tax returns that will be filed.
The Company also currently spreads the processing of Vytex NRL among three continents. Sales contractsfiscal years ended December 31, 2010 thru 2018 are based on forward market prices, and generally orders are placed 30 to 90 days ahead of shipment date due to these fluctuations. However, financial results may be negatively impacted where selling prices fall more quickly than purchase price adjustments can be made or when levels of inventory have an anticipated net realizable value that is below cost.open for examination.
NOTE 1316 – SUBSEQUENT EVENTS
In January 2019, through board approval, the Company increased the amount of authorized common stock shares to 1,500,000,000 which increased the available shares to be issued and outstanding.
From January 1, 20182019 and through the dateissuance of these financial statements, the Company has issued certain convertible promissory notes in varying amounts. The face amount of the notes represents the amount due at maturity along with the accrued interest, at which time that amount will be converted into shares of the Company stock based on the lowest 2 day closing price for the trailing 20 days prior to conversion and carrying a 35% discount. These notes are included in the table below:
| Issue Date | Face Amount | Interest Rate | Maturity | Net Cash Proceeds | ||||||||||||
| Jan 29, 2018 | $ | 80,000 | 12 | % | Jan 29, 2019* | $ | 72,300 | |||||||||
| Feb 14, 2018 | $ | 80,000 | 12 | % | Nov 14, 2018* | $ | 72,500 | |||||||||
| Feb 13, 2018 | $ | 76,500 | 5 | % | Nov 13, 2018* | $ | 72,500 | |||||||||
| Feb 14, 2018 | $ | 85,000 | 12 | % | Feb 14, 2019* | $ | 82,000 | |||||||||
| Issue Date | Face Amount | Interest Rate | Maturity | Net Cash Proceeds | ||||||||||||
| Jan 3, 2019 | $ | 4,500 | 5 | % | Jan 3, 2021 | $ | 4,500 | |||||||||
| Jan 3, 2019 | $ | 93,750 | 5 | % | Jan 3, 2021 | $ | 93,750 | |||||||||
| Jan 3, 2019 | $ | 102,200 | 5 | % | Jan 3, 2021 | $ | 102,200 | |||||||||
| Feb 4, 2019 | $ | 18,750 | 5 | % | Feb 4, 2021 | $ | 18,750 | |||||||||
*Note that these notes can be converted after 6 months from the issue datedate.
From January 1, 20182019 to February 9, 2018,April 22, 2019, the Company issued Convertible Promissory Notes (the “Notes”) related to contract work and for an investment and in lieu of salary and expense reimbursement in the amount of $195,635. The Notes are (i) unsecured, (ii) bear interest at an annual rate of five percent (5%) per annum from date of issuance, and (iii) are convertible byat the Company upon the closing of the previously announced intention to purchase all of the assets of NHS.Company’s option. The Notes mature one year from issuance but may be extended one (1) additional year by the Company. If converted, the Notes plus accrued interest are convertible into shares of the Company’s common stock at the prior twenty (20) day average closing price with a 50% discount.
On February 5, 2018,
From January 1, 2019 to April 22, 2019, the Company issued 1,500,000182,167,322 shares under equity purchase agreements for cash proceeds totaling $840,802. Included in this amount are 12,999,999 of shares purchased for $14,000 from related parties. Approximately 54,999,997 shares, were included in shares issued and outstanding at December 31, 2018 as the termsrelated cash was received prior to year end.
From January 1, 2019 to April 22, 2019, the Company issued 302,568,542 shares due to the conversion of a Consulting Agreement datedprincipal and interest totaling $89,889.64. Included in this amount are two conversions from Crown Bridge Partners, LLC totaling $5,948 for 32,240,000 shares which are still under review. In addition, transactions from FirstFire Global Opportunities Fund, LLC totaling approximately $15,000 are under review.
From January 26,1, 2019 to April 22, 2019, the Company issued 122,871,542 shares for consulting services valued at approximately $65,000, based on the respective measurement dates. Approximately 83,000,000 shares, or approximately $807,000, was accrued at December 31, 2018 and 8,333,300 was recorded as issued and outstanding based on the conversion notice date.
From January 1, 2019 through April 22, 2019, Vystar has reduced the amounts due by approximately $900,000 of the $1.5 million dollar CMA loan through the issuance of approximately 13,000,000 shares of its common stock, which were issued to escrow at December 31, 2018.
On January 7, 2018,February 25, 2019, Vystar issued an aggregate of 4,000,000 shares to each Board members for compensation. The shares valued at $2,800 for 6 board members (based on the Company signed a Letter of Intent to acquirefair value on the assets of NHS, the exclusive U.S. distributor of Vytex® virtually allergen-, VOC- and odor-free natural rubber latex (NRL) foam. The transaction is expected to close in the second quarter of 2018.measurement date).
| ITEM 9. | CHANGES IN |
None
On April 10, 2018, our President, Chief Executive Officer and Chief Financial Officer received formal notice that our independent auditors, Porter Keadle Moore, LLC (“PKM”), had made the decision to resign as our independent accountants effective April 10, 2018.
PKM audited the financial statements of the Company for the two years ended December 31, 2017. The report of PKM on such financial statements, dated March 29, 2018, did not contain an adverse opinion or disclaimer of opinion and was not qualified or modified as to uncertainty, audit scope or accounting principles.
For the past two fiscal years and subsequent interim periods though the date of resignation, there have been no disagreements with the former accountants on any matter of accounting principles or practices, financial statement disclosure, or auditing scope or procedure, which disagreement, if not resolved to the satisfaction of PKM, would have caused them to make reference thereto in their report on the financial statements.
On April 10, 2018, Hall & Company Certified Public Accountants, Inc. (“Hall & Company”), of Irvine, California, was approved by the audit committee of the Company to audit our financial statements for the year ending December 31, 2018, subject to the completion of Hall & Company’s standard client acceptance procedures. During our two most recent fiscal years and the subsequent interim periods preceding their appointment as independent accountants, neither the Company nor anyone on its behalf consulted Hall & Company regarding either (i) the application of accounting principles to a specified transaction, either completed or proposed, or the type of audit opinion that might be rendered of the Company’s consolidated financial statements, nor has Hall & Company provided to the Company a written report or oral advice regarding such principles or audit opinion, (ii) any matter that was the subject of a disagreement within the meaning of Item 304(a)(1)(iv) of Regulation S-K, or (iii) any reportable event within the meaning of Item 304(a)(1)(v) of Regulation S-K.
| ITEM 9.A | CONTROLS AND PROCEDURES |
The Company’s Chief Executive Officer and Chief Financial Officer (the Certifying Officer) is responsible for establishing and maintaining disclosure controls and procedures for the Company. Although the Certifying Officer has designed such disclosure controls and procedures to ensure that material information is made known to them, particularly during the period in which this report was prepared, certain material weaknesses occurred during the year ended December 31, 20172018 and subsequent to year end. The Certifying Officer has evaluated the effectiveness of the Company’s disclosure controls and procedures (as such term is defined in Exchange Act Rules 13a-15(e) and 15d-15(e) (the Rules) under the Securities Exchange Act of 1934 (or Exchange Act) as of the end of the period covered by this Annual Report and is working on improving controls with an outside CPA firm and a more dedicated internal resources.
Management’s Report on Internal Control Over Financial Reporting
Our management is responsible for establishing and maintaining adequate internal control over financial reporting (as defined in Exchange Act Rule 13a-15(f) and 15d - 15(f) under the Securities Exchange Act of 1934). Internal control over financial reporting is a process to provide reasonable assurance regarding the reliability of our financial reporting and the preparation of financial statements for external purposes in accordance with accounting principles generally accepted in the United States of America. Internal control over financial reporting includes those policies and procedures that: (i) in reasonable detail accurately and fairly reflect our transactions; (ii) provide reasonable assurance that transactions are recorded as necessary for preparation of our financial statements; (iii) provide reasonable assurance that our receipts and expenditures are made in accordance with management authorization; and (iv) provide reasonable assurance regarding prevention or timely detection of unauthorized acquisition, use or disposition of our assets that could have a material effect on the financial statements.
Because of its inherent limitations, internal control over financial reporting, however well designed and operated, can provide only reasonable, and not absolute, assurance that the controls will prevent or detect misstatements. In addition, the design of any control system is based in part upon certain assumptions about the likelihood of future events. Because of these and other inherent limitations of control systems, there is only the reasonable assurance that our controls will succeed in achieving their goals under all potential future conditions.
Management, under the supervision and with the participation of our Chief Executive Officer and our acting Chief Financial Officer, conducted an evaluation of our internal control over financial reporting as of December 31, 20172018 based on the framework in Internal Control-Integrated Framework issued by the Committee of Sponsoring Organizations of the Treadway Commission (COSO). 2013. Based on our evaluation under the COSO framework, management concluded that our internal control over financial reporting was not effective as of December 31, 2017.2018. Such conclusion was reached based on the following material deficienciesweaknesses noted by management:
a) We have a lack of segregation of duties due to the small size of the Company.
b) The Company did not maintain reasonable control over records underlying transactions necessary to permit preparation of the Company’s financial statements.
c) Lack of controls that provide reasonable assurance regarding prevention or timely detection of unauthorized acquisition, use or disposal of the Company’s assets that could have a material effect on the financial statements.
d) Lack of a formal CFO position who can devote significant attention to financial reporting resulted in multiple audit adjustments.
e) Lack of a functioning audit committee, resulting in ineffective oversight in the establishment and monitoring of required internal controls and procedures. Management believes the lack of a functioning audit committee results in ineffective oversight in the establishment and monitoring of required internal controls and procedures, which could result in a material misstatement in our financial statements in future period.
Management expects to strengthen internal control during 20182019 by developing stronger business and financial processes for accounting for transactions such as warrant/stock issuances, which will enhance internal control for the Company.
| ITEM 9B. | OTHER INFORMATION |
None
| ITEM 10. | DIRECTORS, EXECUTIVE OFFICERS AND CORPORATE GOVERNANCE |
Board of Directors
The following tables set forth the name and information of each director of Vystar as of December 31, 2017.2018. Each director is elected to serve until the next Annual Meeting of Stockholders.
| Name | Principal Occupation During Last Five Years | Age | Director Since | Principal Occupation During Last Five Years | Age | Director Since | ||||||
| Joseph C. Allegra, Jr. PhD | Joseph Allegra, PhD was elected Chairman of the Board on February 14, 2018 and has followed Vystar’s progress for numerous years and has assisted as an investment advisor and investor, providing insight into positioning the company to attract investors, particularly in the healthcare sector. He currently is an Instructor of Epidemiology and Biostatistics at the University of Georgia and an Investment Advisor at Lincoln Lee Investments in Atlanta. Previously he was a Senior Drug Safety Associate at Genentech. Dr. Allegra received his BA in Psychology from Boston University, and his Masters of Public Health and Doctor of Philosophy degrees from the University of Georgia. | 39 | 2017 | Joseph Allegra, PhD was elected Chairman of the Board on February 14, 2018 and has followed Vystar’s progress for numerous years and has assisted as an investment advisor and investor, providing insight into positioning the company to attract investors, particularly in the healthcare sector. He currently is an Instructor of Epidemiology and Biostatistics at the University of Georgia and an Investment Advisor at Lincoln Lee Investments in Atlanta. Previously he was a Senior Drug Safety Associate at Genentech. Dr. Allegra received his BA in Psychology from Boston University, and his Masters of Public Health and Doctor of Philosophy degrees from the University of Georgia. | 39 | 2017 | ||||||
| Steven Rotman | Steven Rotman, was elected Chief Executive Officer and a Director of Vystar Corporation. Mr. Rotman has been President and CEO of Rotmans, one of the oldest and largest, furniture and carpet retailers in New England, for more than 40 years. In addition, he is the founder and managing partner of NHS Holdings, a company that in 2015 became the exclusive distributor of Vytex™ natural rubber latex foam in the U.S. and laid the groundwork for Vytex’s entrance to the home furnishings industry. Mr. Rotman received a BBA degree from Clark University and an MS from New York University. | 78 | 2017 | Steven Rotman, was elected Chief Executive Officer and a Director of Vystar Corporation. Mr. Rotman has been President and CEO of Rotmans, one of the oldest and largest, furniture and carpet retailers in New England, for more than 40 years. In addition, he is the founder and managing partner of NHS Holdings, a company that in 2015 became the exclusive distributor of Vytex™ natural rubber latex foam in the U.S. and laid the groundwork for Vytex’s entrance to the home furnishings industry. Mr. Rotman received a BBA degree from Clark University and an MS from New York University. | 78 | 2017 | ||||||
| Mitsy Y. Mangum | Ms Mangum is currently a managing director/partner of Lakeview Capital Partners, LLC. From July 2009 to September 2015, Ms. Mangum was Vice President, Investments, WMS, RPC at American Capital Partners LLC., an independent investment banking firm in Atlanta, GA. From July 2004 to July 2009, Ms. Mangum was a Vice President-Investments, Financial Advisor WMS, RPC with Raymond James & Associates in the Atlanta area. Ms. Mangum is an accomplished investment professional with over 24 years of financial service and industry experience both from the retail side as well as the institutional side. Ms. Mangum maintains an in-depth knowledge of the financial markets, professional money management and managing portfolios. She has a Bachelor of Science in Business Administration/ Management from College of Charleston. | 53 | 2008 | Ms. Mangum is currently a managing director/partner of Lakeview Capital Partners, LLC. From July 2009 to September 2015, Ms. Mangum was Vice President, Investments, WMS, RPC at American Capital Partners LLC., an independent investment banking firm in Atlanta, GA. From July 2004 to July 2009, Ms. Mangum was a Vice President-Investments, Financial Advisor WMS, RPC with Raymond James & Associates in the Atlanta area. Ms. Mangum is an accomplished investment professional with over 24 years of financial service and industry experience both from the retail side as well as the institutional side. Ms. Mangum maintains an in-depth knowledge of the financial markets, professional money management and managing portfolios. She has a Bachelor of Science in Business Administration/ Management from College of Charleston. | 53 | 2008 | ||||||
Michael X. Ianacone
| Mr. Ianacone has over forty years of successful experience in leading large organizations and improving performance of operating units across the US. He has a proven track record of growing revenue and profit, forming executive teams and working cross organizationally to deliver results.
He recently retired from Xerox Corporation where during his 38-year tenure he held senior executive management positions in sales, marketing, operations and strategy in the US. These positions included both headquarters and field locations. He was a key member of the US senior team during Xerox’s turnaround in the early 2000s.
Michael holds an A.B. degree from Georgetown University in Washington, D.C. and currently resides in Atlanta, GA.
| 69
| 2014
| ||||||
| Ranjit K. Matthan | On March 12, 2015, Ranjit K. Matthan, Ph.D., an internationally renowned latex and rubber expert, joined the Company’s Board of Directors. Dr. Matthan has been a consultant to Vystar Corporation since 2008 and has played a significant role in the manufacturing scale up of reduced-protein Vytex® natural rubber latex (NRL) in Malaysia and refining the research and development of manufacturing processes for applications using Vytex NRL, such as latex foam, condoms, adhesives, medical devices, etc. | 74 | 2015 | On March 12, 2015, Ranjit K. Matthan, Ph.D., an internationally renowned latex and rubber expert, joined the Company’s Board of Directors. Dr. Matthan has been a consultant to Vystar Corporation since 2008 and has played a significant role in the manufacturing scale up of reduced-protein Vytex® natural rubber latex (NRL) in Malaysia and refining the research and development of manufacturing processes for applications using Vytex NRL, such as latex foam, condoms, adhesives, medical devices, etc.
Dr. Matthan has been associated with the development of natural rubber and rubber-based industries manufacturing in South Asia since the 1970s and introduced technically specified natural rubber into India. He has advised national and international companies and research bodies including the Government of India, the Malaysian Rubber Research and Development Board, Asian Development Bank, Industrial Development Bank of India, Revertex (Malaysia) as well as many private companies engaged in latex production and manufacturing. A founding Director of the Bangkok-based Asia Pacific Elastomer Science and Technology (APEST), he has played a key role in sustainability initiatives for natural rubber. He has also been associated with the development and commercial introduction of several eco-friendly natural rubber grades, including Vytex NRL.
Dr. Matthan has received numerous industry awards, including: the prestigious 2014 Institute of Materials, Minerals and Mining, U.K.’s Hancock Medal for his contributions to the development of the environmentally friendly sustainable growth of the global natural rubber industry, and the 2006 KMPhilip Award from the All India Rubber Industries Association for significant contributions toward the development of the Indian Rubber Industry. Dr. Matthan has published over 50 scientific and technical papers on natural rubber and lattices and is an invited speaker at several international conferences including the International Latex Conference.
Dr. Matthan holds an undergraduate degree from St. Stephens College, Delhi University, India and he earned his Ph.D. in Polymer Chemistry from the National College of Rubber Technology, London, England, where he was the first Ph.D. student of Dr. D.C. Blackley whose books and high polymer lattices and emulsion polymerization are the industry standard references.
| 74 | 2015 | ||||||
| Bryan Stone, MD | Bryan Stone, M.D, has advised Vystar over the past years relating to product development for the healthcare industry and brings to the Board an understanding of the challenges of new product development for start-up companies. He is the Chairman of Medicine at Desert Regional Medical Center in Palm Springs, Calif., and is the Medical Director at multiple DaVita Dialysis Centers. He is also an entrepreneur, serving as the Interim CEO of Fluid Energy Conversion, Inc., a firm specializing in molecular fluid mechanics, specifically high efficiency mass producible energy conversion technologies.
| 51 | 2017 | |||||||||
| Paul R. Oristaglio | (1) | Mr. Paul R. Oristaglio, was elected as a director to fill a vacancy on the Board. Mr. Oristaglio will also serve on the audit committee. Mr. Oristaglio is the CEO and Founder of CFO2higher, which provides financial solutions to business owners and managers, which Mr. Oristaglio started in May 2018. Prior to his position with CFO2higher, Mr. Oristaglio served as President and Sole Proprietor of RIPRO, a financial and operational services company, and prior to that, MR. Oristaglio was CFO, COO, CIO and Co-Founder of MassPRO, Inc., a financial/operation resources company and Small Business Exchange, ltd, a small business consulting and transaction facilitation firm. Mr. Oristaglio is a licensed CPA in the state of RI and was chosen to serve as a director due to his business acumen and financial background.
| 62 | 2018 | ||||||||
Keith Osborn, MD
| Dr. Osborn is a board-certified Orthopaedic Spine Surgeon with 30 years of experience after completing his Spine Fellowship at Harvard University. He received his medical degree from the University of Maryland School of Medicine and performed his residency at Harvard University and Johns Hopkins Hospital. Dr. Osborn currently specializes in Spinal Surgery at Resurgens Orthopaedics in Atlanta with a focus on adult spinal disorders and total disc arthroplasty.
| 60 | 2016 | |||||||||
(1) Mr. Oristaglio effectively resigned from the board effective April 19, 2019.
Dr. Matthan has been associated with the development of natural rubber and rubber-based industries manufacturing in South Asia since the 1970s and introduced technically specified natural rubber into India. He has advised national and international companies and research bodies including the Government of India, the Malaysian Rubber Research and Development Board, Asian Development Bank, Industrial Development Bank of India, Revertex (Malaysia) as well as many private companies engaged in latex production and manufacturing. A founding Director of the Bangkok-based Asia Pacific Elastomer Science and Technology (APEST), he has played a key role in sustainability initiatives for natural rubber. He has also been associated with the development and commercial introduction of several eco-friendly natural rubber grades, including Vytex NRL.
Dr. Matthan has received numerous industry awards, including: the prestigious 2014 Institute of Materials, Minerals and Mining, U.K.’s Hancock Medal for his contributions to the development of the environmentally friendly sustainable growth of the global natural rubber industry, and the 2006 KMPhilip Award from the All India Rubber Industries Association for significant contributions toward the development of the Indian Rubber Industry. Dr. Matthan has published over 50 scientific and technical papers on natural rubber and lattices and is an invited speaker at several international conferences including the International Latex Conference.
Dr. Matthan holds an undergraduate degree from St. Stephens College, Delhi University, India and he earned his Ph.D. in Polymer Chemistry from the National College of Rubber Technology, London, England, where he was the first Ph.D. student of Dr. D.C. Blackley whose books and high polymer lattices and emulsion polymerization are the industry standard references.
| ||||||
| Bryan Stone, MD | Bryan Stone, M.D, has advised Vystar over the past years relating to product development for the healthcare industry and brings to the Board an understanding of the challenges of new product development for start-up companies. He is the Chairman of Medicine at Desert Regional Medical Center in Palm Springs, Calif., and is the Medical Director at multiple DaVita Dialysis Centers. He is also an entrepreneur, serving as the Interim CEO of Fluid Energy Conversion, Inc., a firm specializing in molecular fluid mechanics, specifically high efficiency mass producible energy conversion technologies. | 51 | 2017 | |||
Keith Osborn, MD
| Dr. Osborn is a board-certified Orthopaedic Spine Surgeon with 30 years of experience after completing his Spine Fellowship at Harvard University. He received his medical degree from the University of Maryland School of Medicine and performed his residency at Harvard University and Johns Hopkins Hospital. Dr. Osborn currently specializes in Spinal Surgery at Resurgens Orthopaedics in Atlanta with a focus on adult spinal disorders and total disc arthroplasty. | 60 | 2016 |
Director Independence
Under Rule 5605(b)(1) of the Nasdaq Marketplace Rules, independent directors must comprise a majority of a listed company’s board of directors within one year of listing. In addition, Nasdaq Marketplace Rules require that, subject to specified exceptions, each member of a listed company’s audit, compensation and nominating and governance committees be independent. While Vystar does not currently qualify for listing on Nasdaq and will likely not qualify for some time after the date of this proxy statement, it does intend to seek such listing as soon as possible and complies with its Marketplace Rules. Audit committee members must also satisfy the independence criteria set forth in Rule 10A-3 under the Securities Exchange Act of 1934, as amended. Under Nasdaq Marketplace Rule 5605(a)(2), a director will only qualify as an “independent director” if, in the opinion of that company’s board of directors, that person does not have a relationship that would interfere with the exercise of independent judgment in carrying out the responsibilities of a director. In order to be considered to be independent for purposes of Rule 10A-3, a member of an audit committee of a public company may not, other than in his or her capacity as a member of the audit committee, the board of directors, or any other board committee: (1) accept, directly or indirectly, any consulting, advisory, or other compensatory fee from the public company or any of its subsidiaries; or (2) be an affiliated person of the listed company or any of its subsidiaries.
In March of 2013, our Board undertook a review of its composition, the composition of its committees and the independence of each director. Based upon information requested from and provided by each director concerning his or her background, employment and affiliations, including family relationships, our Board has determined none of the directors has a relationship that would interfere with the exercise of independent judgment in carrying out the responsibilities of a director and that each of these directors is “independent” as that term is defined under Nasdaq Marketplace Rule 5605(a)(2).
On December 17, 2017, William R Doyle retired from his positions with the Company as Chairman of the Board of Directors, a director and President and CEO of the Corporation. Mr. Doyle’s retirement did not result from any disagreement with the Company and he remains a Product Development Consultant.
On December 17, 2017 Jason Meggs resigned from his position with the Company as a director. Mr. Meggs’ resignation did not result from any disagreement with the Company.
Audit Committee
The Board member serving on our Audit Committee is Ms. Mangum.are Ms. Mangum chairs and is the sole member of the Audit Committee.and Paul Oristaglio through his resignation on April 19, 2019. Our Board has determined that Ms. Mangum satisfiesand Paul Oristaglio satisfy the requirements for financial literacy under the current requirements of the Nasdaq Marketplace Rules. Ms. Mangum is anBoth are “audit committee financial expert,experts,” as defined by SEC rules and satisfiessatisfy the financial sophistication requirements of The NASDAQ Global Market. Our Audit Committee assists our Board in its oversight of our accounting and financial reporting process and the audits of our financial statements. The Audit Committee’s responsibilities include:
| ● | appointing, approving the compensation of, and assessing the independence of our independent registered public accounting firm; | |
| ● | overseeing the work of our independent registered public accounting firm, including through the receipt and consideration of reports from such firm; | |
| ● | reviewing and discussing with management and the independent registered public accounting firm our annual and quarterly financial statements and related disclosures; | |
| ● | monitoring our internal control over financial reporting, disclosure controls and procedures and code of business conduct and ethics; | |
| ● | discussing our risk management policies; | |
| ● | establishing policies regarding hiring employees from the independent registered public accounting firm and procedures for the receipt and resolution of accounting related complaints and concerns; | |
| ● | meeting independently with our independent registered public accounting firm and management; | |
| ● | reviewing and approving or ratifying any related person transactions; and | |
| ● | preparing the audit committee report required by SEC rules. |
All audit and non-audit services, other than de minimus non-audit services, to be provided to us by our independent registered public accounting firm must be approved in advance by our Audit Committee.
Audit Committee Charter
We have adopted an Audit Committee Charter which sets out the duties and responsibilities of our Audit Committee. The Audit Committee Charter is available on our website atwww.vytex.comwww.vystarcorp.com. Any amendments to the Charter, or any waivers of its requirements, will be disclosed on our website.
Meetings of the Board and Committees
During fiscal year 2017,2018, our Board held eleven meetings, and its Audit Committee held four meetings. Each director attended at least 75% of the meetings of the Board in fiscal year 2017.2018. Members of our Board are encouraged to attend our annual meetings of shareholders.
CORPORATE GOVERNANCE
Corporate Governance Guidelines
We believe in sound corporate governance practices and have adopted formal Corporate Governance Guidelines to enhance our effectiveness. Our Board adopted these Corporate Governance Guidelines in order to ensure that it has the necessary practices in place to review and evaluate our business operations as needed and to make decisions that are independent of our management. The Corporate Governance Guidelines are also intended to align the interests of directors and management with those of our shareholders. The Corporate Governance Guidelines set forth the practices our Board follows with respect to Board and committee composition and selection, Board meetings, chief executive officer performance evaluation and management development and succession planning for senior management, including the chief executive officer position. A copy of our Corporate Governance Guidelines is available on our website atwww.vytex.comwww.vystarcorp.com.
Code of Business Conduct and Ethics
We adopted a Code of Business Conduct and Ethics applicable to all officers, directors and employees of Vystar that comply with NASDAQ listing standards. The Code of Business Conduct and Ethics includes an enforcement mechanism, and any waivers for directors or executive officers must be approved by our Board and disclosed in a current report on Form 8-K with the SEC. This Code of Business Conduct is publicly available on our website atwww.vytex.comwww.vystarcorp.com. There were no waivers of the Code of Business Conduct and Ethics for any of our directors or executive officers during fiscal year 2017.2018.
| ITEM 11. | EXECUTIVE COMPENSATION |
Overview
EXECUTIVE COMPENSATION
Summary Compensation Table
The following table sets forth information regarding compensation earned by our, Chief Executive Officer and President for 20172018 and 2016.2017.
| Name and Principal Position | Salary | Option Awards (1) | All Other Compensation (2) | Total | ||||||||||||
| William R. Doyle | ||||||||||||||||
| Chairman, Chief Executive Officer and President | ||||||||||||||||
| 2017 | $ | 106,855 | $ | 146,000 | $ | 38,900 | $ | 291,755 | ||||||||
| 2016 | $ | 150,000 | $ | 100,291 | $ | 2,000 | $ | 252,291 | ||||||||
| Name and Principal Position | Salary(2)(3) | Option Awards(1) | Total | |||||||||
| Steven Rotman - 2018 | $ | 200,000 | $ | 550,000 | $ | 750,000 | ||||||
| Chief Executive Officer, Chief Financial Officer, and President | ||||||||||||
| William R. Doyle – 2017 | $ | 145,755 | $ | 146,000 | $ | 291,755 | ||||||
| Former Chairman, Chief Executive Officer and President | ||||||||||||
| (1) | These amounts do not reflect the actual economic value realized by the executive officers. In accordance with SEC rules, the amounts in this column for |
| (2) |
Employment Agreements
On November 11, 2008, Vystar entered into an employment agreement with William R. Doyle to continue to serve as Vystar’s President, Chief Executive Officer and Chairman of the Board. The term of the agreement is effective until terminated by either party in accordance with the terms of the agreement. Under the agreement, Mr. Doyle receives a base salary of $185,000 per year, as such base salary may be adjusted by the Board, and an annual bonus equal to a maximum of 125% of Mr. Doyle’s base salary based on the success of the Company in meeting its objectives, as determined by the Board; provided, that no cash bonus is payable to Mr. Doyle on any date unless he is employed by the Company on that date. The amount of the annual bonus is determined by the Board based on the percentage of achievement of the stated company objectives. The effective date of the annual bonus calculation is the Company’s fiscal year-end and is payable in one or more installments as determined by the Board beginning in the first quarter of the following fiscal year. Mr. Doyle’s employment agreement is terminable at will by the Company for cause or without cause as defined in the agreement. However, if Mr. Doyle’s employment is terminated by Vystar without cause, Vystar is obligated to pay Mr. Doyle compensation earned through the date of termination plus a severance payment equal to six (6) months base salary from the date of termination payable as if he had remained an employee of the Company, plus, assuming Mr. Doyle complies with non-compete and non-solicitation covenants contained in the employment agreement, an amount equal to 75% of Mr. Doyle’s base salary amount for the one (1) year period after the date of termination. If Mr. Doyle is terminated for cause or he terminates the employment agreement without cause, he is only entitled to compensation accrued through the date of termination.
On January 15, 2016, the Board approved a change in Mr. Doyle’s compensation package that included a base annual salary of $150,000 paid monthly and an immediate award of $50,000 in warrants that vest at the end of each month of employment through the end of 2016.
On February 15, 2017, the Board approved a change in Mr. Doyle’s compensation package that included a base annual salary of $150,000 paid monthly and an immediate award of $50,000 in warrants that vest at the end of each month of employment through the end of 2017.
On December 17, 2017, Mr. Doyle retired.
| $200,000 was related to a performance bonus that was agree upon in 2018. Of this amount for Steven Rotman, $195,000 was paid in cash for the bonus for the year ended December 31, 2018. In addition, 27,000,000 shares of common stock valued at approximately $222,000 were accrued as of December 31, 2018. |
Risk Analysis of Performance-Based Compensation Programs
As of December 31, 2017, there are no officers under a performance-based compensation program.
DIRECTOR COMPENSATION
The following table sets forth certain information with respect to compensation awarded to, paid to or earned by each of Vystar’s non-employee directors during fiscal year 2017.2018.
| Name | Fees Earned or Paid in Cash ($) | Stock Awards ($) | Option Awards ($) (1) | Total ($) (2) | ||||||||
| Mitsy Y. Mangum | 10,703 | 10,703 | ||||||||||
| Michael X. Ianacone | 9,640 | 9,640 | ||||||||||
| Ranjit K. Matthan | 7,837 | 7,837 | ||||||||||
| Jason M. Meggs | 3,679 | 3,679 | ||||||||||
| Keith D. Osborn | 4,904 | 4,904 | ||||||||||
| Steven Rotman | 1,230 | 1,230 | ||||||||||
| Joseph C. Allegra, Jr., PhD | 1,230 | 1,230 | ||||||||||
| Bryan Stone, MD | 1,230 | 1,230 | ||||||||||
| Name | Fees Earned or Paid in Cash ($) | Stock Awards ($) | Option Awards ($)(1) | Total ($)(2) | |||||||||
| Mitsy Y. Mangum | |||||||||||||
| Michael X. Ianacone | |||||||||||||
| Ranjit K. Matthan | |||||||||||||
| Jason M. Meggs | |||||||||||||
| Keith D. Osborn | |||||||||||||
| Steven Rotman | |||||||||||||
| Joseph C. Allegra, Jr., PhD | |||||||||||||
| Bryan Stone, MD | |||||||||||||
| Paul Oristaglio | |||||||||||||
| (1) |
On December 15, 2017, Dr. Stone and Dr. Allegra as non-employee directors were granted 500,000 options at $0.05 per share which vest 25,000 options at the end of each fiscal quarter for five (5) years beginning December 31, 2017.
On December 15, 2017, Mr. Rotman as director was granted 500,000 options at $0.05 per share which vest 25,000 options at the end of each fiscal quarter for five (5) years beginning December 31, 2017.
The amounts included represent the portion of the original total grant date fair value of options that vested in 2017 together with the dollar amount recognized as compensation expense by Vystar for financial statement reporting purposes for fiscal year 2017 in accordance with applicable accounting guidance related to stock-based compensation. |
| (2) | These amounts do not reflect the actual economic value realized by the directors. In accordance with SEC rules, this column represents the dollar amount recognized as compensation expense by Vystar for financial statement reporting purposes for fiscal year 2017 for stock options granted to each of the non-employee directors during fiscal years 2015, 2016, and 2017 in accordance with applicable accounting guidance related to stock-based compensation. Pursuant to SEC rules, the amounts shown disregard the impact of estimated forfeitures related to service-based vesting conditions. |
22
Compensation Philosophy
The current policy of our Board is that compensation for non-employee directors should be equity-based compensation to reward directors for quarterly periods of service in fulfilling their oversight responsibilities.
Expenses
We reimburse our directors for their travel and related expenses in connection with attending Board and committee meetings, as well as costs and expenses incurred in attending director education programs and other Vystar-related seminars and conferences.
| ITEM 12. | SECURITY OWNERSHIP OF CERTAIN BENEFICIAL OWNERS AND MANAGEMENT AND RELATED STOCKHOLDER MATTERS |
The following table sets forth the beneficial ownership of our common stock as of December 31, 20172018 by each entity or person who is known to beneficially own 5% or more of our common stock, each of our directors, each Executive Officer identified in “Executive Compensation—Summary Compensation Table” contained in this proxy statement and all of our directors and current executive officers as a group. This table is based upon information supplied by executive officers, directors and principal shareholders. Unless otherwise indicated in the footnotes to this table and subject to community property laws where applicable, each of the shareholders named in this table has sole voting and investment power with respect to the shares indicated as beneficially owned. None of the shares beneficially owned by our executive officers and directors are pledged as security. Applicable percentages are based on shares outstanding on December 31, 2017,2018, adjusted as required by rules promulgated by the SEC.
| 5% Stockholders | ||||||||||||||||
| Officers & Directors | ||||||||||||||||
| Joseph C Allegra, Sr. M.D. Atlanta, GA | 9,771,899 | 7.273 | % | 9,771,899 | 2.134 | % | ||||||||||
| Lam Ngoc Minh Vietnam | 10,000,000 | 7.530 | % | |||||||||||||
| William R Doyle Atlanta, GA | 14,733,516 | 10.275 | % | |||||||||||||
| Officers & Directors | ||||||||||||||||
| Steven Rotman Worcester, MA | 3,097,466 | 2.324 | % | 3,097,466 | 0.676 | % | ||||||||||
| Keith Osborn Atlanta, GA | 23,785,908 | 16.358 | % | 23,785,908 | 5.196 | % | ||||||||||
| Michelle Mangum Atlanta, GA | 2,315,000 | 1.714 | % | 2,315,000 | 0.505 | % | ||||||||||
| Michael X. Ianacone Atlanta, GA | 1,040,000 | 0.780 | % | 1,040,000 | 0.780 | % | ||||||||||
| Ranjit K. Matthan India | 517,500 | 0.388 | % | 517,500 | 0.227 | % | ||||||||||
| Bryan Stone, M.D. Palm Springs, CA | 2,500,000 | 1.875 | % | 2,500,000 | 0.546 | % | ||||||||||
| Joseph Carmen Allegra, Jr. PhD Atlanta, GA | 500,000 | 0.375 | % | 500,000 | 0. 109 | % | ||||||||||
| All Directors and Executive Officers as a Group | 33,755,874 | 25.417 | % | 43,527,773 | 9.50 | % | ||||||||||
| Total Shares Outstanding | 132,809,218 | 457,747,818 | ||||||||||||||
SECTION 16(A) BENEFICIAL OWNERSHIP REPORTING COMPLIANCE
Section 16(a) of the Exchange Act requires our executive officers and directors, and any person or entity who owns more than ten percent of a registered class of our common stock or other equity securities, to file with the SEC certain reports of ownership and changes in ownership of our securities. Executive officers, directors and shareholders who hold more than ten percent of our outstanding common stock are required by the SEC to furnish us with copies of all required forms filed under Section 16(a). We prepare Section 16(a) forms on behalf of our executive officers and directors based on the information provided by them.
Based solely on review of this information and written representations by our executive officers and directors that no other reports were required, we believe that, during fiscal year 20172018 each director filed the forms required by Section 16(a) of the Exchange Act on a timely basis with respect to the repricing of option and warrants.
23
EQUITY COMPENSATION PLAN INFORMATION
The following table shows information related to our common stock which may be issued under our 2004 Long-Term Incentive Compensation Plan, as amended, as of December 31, 2017:2018:
| Plan Category | Number of securities to be issued upon exercise of outstanding options by Executive Officers | Number of securities remaining available for future issuance under equity compensation plans (excluding securities reflected in first column) | Number of securities to be issued upon exercise of outstanding options | Number of securities to be issued upon exercise of outstanding options | Number of securities remaining available for future issuance under equity compensation plans (excluding securities reflected in first column) | |||||||||||||||
| 2004 Long-Term Incentive Compensation Plan, as amended, approved by shareholders | 7,748,271 | 2,251,729 | 7,748,271 | $ | 5.80 | 2,251,729 | ||||||||||||||
| 2014 Long-Term Incentive Compensation Plan | 0 | 5,000,000 | 0 | 0 | 5,000,000 | |||||||||||||||
| Total | 7,748,271 | 7,251,729 | 7,748,271 | $ | 5.80 | 7,251,729 | ||||||||||||||
Our 2004 Long-Term Incentive Compensation Plan, as amended, which we refer to as the 2004 Plan, was adopted by our Board in 2004, and amended and approved by our shareholders in 2009. A maximum of 10,000,000 shares of common stock were authorized for issuance under the 2004 Plan.
The 2004 Plan provides for the grant of incentive stock options, non-statutory stock options, restricted stock and other stock-based awards. Our officers, employees, consultants and directors are eligible to receive awards under the 2004 Plan; however, incentive stock options may only be granted to our employees. In accordance with the terms of the 2004 Plan, our Board administers the 2004 Plan and, subject to any limitations in the 2004 Plan, selects the recipients of awards and determines:
| ● | the number of shares of common stock covered by options and the dates upon which those options become exercisable; | |
| ● | the exercise prices of options; | |
| ● | the duration of options; | |
| ● | the methods of payment of the exercise price; and | |
| ● | the number of shares of common stock subject to any restricted stock or other stock-based awards and the terms and conditions of those awards, including the conditions for repurchase, issue price and repurchase price. |
Pursuant to the terms of the 2004 Plan, in the event of a change in control of our company, each outstanding option under the 2004 Plan will vest, but the holders shall have the right, assuming the holder still maintains a continuous service relationship with us, immediately prior to such dissolution or liquidation, to exercise the option to the extent exercisable on the date of such dissolution or liquidation.
In the event of a merger or other reorganization event, our Board shall have the discretion to provide for any or all of the following: (a) the acceleration of vesting or the termination of our repurchase rights of any or all of the outstanding awards, (b) the assumption or substitution of all options by the acquitting or succeeding entity or (c) the termination of all options that remain outstanding at the time of the merger or other reorganization event.
For the year ended December 31, 2018, there were options granted outside of the 2004 plan in the amount of 21,800,000 options.
| ITEM 13. | CERTAIN RELATIONSHIPS AND RELATED TRANSACTIONS, AND DIRECTOR INDEPENDENCE |
Review, Approval or Ratification of Transactions with Related Persons
Vystar’s Code of Business Conduct requires that all employees and directors avoid conflicts of interests that interfere with the performance of their duties or are not in the best interests of Vystar.
In addition, pursuant to its written charter, the Audit Committee considers and approves or disapproves any related person transaction as defined under Item 404 of Regulation S-K promulgated by the SEC, after examining each such transaction for potential conflicts of interest and other improprieties. The Audit Committee has not adopted any specific written procedures for conducting such reviews and considers each transaction in light of the specific facts and circumstances presented.
Transactions with Related Persons
On April 29, 2011, the Company executed with CMA Investments, LLC, a Georgia limited liability company (“CMA”) a line of credit with a principal amount of up to $800,000 (the “CMA Note”). CMA is a limited liability company of which three of the directors of the Company were the members at such date. Proceeds under the line were drawn for general working capital purposes. Under the terms of the CMA Note, the Company may draw up to a maximum principal amount of $800,000. Interest on amounts drawn and fees were paid by an affiliate of Joseph C. Allegra, M.D., a director of the Company, to CMA, until February 6, 2012, at which time the Company took over responsibility for the payment of such interest and fees. Pursuant to an agreement between the Company and such affiliate, the Company issued common stock to such affiliate with a value equal to such interest and fees paid based on the closing price of the common stock on the OTC Bulletin Board on the date of such payments. The maturity date of the Note is April 29, 2013 and was subsequently renewed for one year. The CMA Note is unsecured, and no payments of principal are due until the second anniversary of the Note, at which time all outstanding principal is due and payable. As compensation to the directors for providing the CMA Note, the Company issued warrants to purchase 2,600,000 shares of the Company’s common stock to the directors at $.45 per share which was the closing price of the Company’s common stock on that day, later adjusted to $.27 per share, which was the closing price of the Company’s common stock on the day it was adjusted.
CMA is a limited liability company of which Joseph C. Allegra, M.D., J. Douglas Craft and Michelle Y. Mangum, each a director of the Company, are the members. Effective year ending December 31, 2014, Joseph C. Allegra, M.D. and J. Douglas Craft are no longer members of Vystar’s board of directors.
On September 14, 2011, the Company’s Board of Directors approved increasing the line of credit to $1,000,000 and William R. Doyle, the Company’s Chairman and Chief Executive Officer became a member of CMA. As compensation for increasing the line and for Mr. Doyle joining CMA, the directors approved issuing warrants to purchase an additional 1,600,000 shares of the Company’s common stock at $.27 per share, which was the closing price of the Company’s common stock on that day.
On November 2, 2012, the Board of Directors approved an increase in the CMA line of credit from $1,000,000 to $1,500,000. On January 10, 2013, as compensation to the CMA members for providing the increased CMA Note, the Company issued warrants to purchase 2,100,000 shares of the Company’s common stock to the CMA members at $0.35 per share and recorded as deferred financing cost to be amortized through interest expense over the remaining term of the CMA Note.
On April 29, 2013, the maturity date of the CMA Note was extended to April 29, 2014. As compensation to the CMA Directors for extending the maturity date of the CMA Note, the Board of Directors approved modifying the exercise price for the 6,300,000 compensatory stock purchase warrants previously issued to the Directors to $0.10 per share and the CMA Directors forfeited 630,000 of the warrants. Amortization of the financing costs associated with extending the CMA Note was amortized through interest expense.
On April 29, 2014, the maturity date of the CMA Note was extended to April 29, 2015 with no compensation being paid to the CMA Directors for this extension.
As of April 29, 2015, the maturity date of the CMA Note was again extended for one year to April 29, 2016. No compensation was paid to the CMA Directors for this extension. The note is currently due on demand.
Pursuant to the terms of the CMA Note, interest is computed at LIBOR plus 5.25% (8.22% at December 31, 2018), on amounts drawn and fees. The weighted average interest rate in effect on the borrowings for the year ended December 31, 2018 was 7.99%. There are no available borrowings under the CMA note at December 31, 2018. The holders of CMA Investments, LLC agreed as of July 10, 2018 to new terms express in Note 6 of the accompanying financial statements.
On January 7, 2018, Vystar Corporation has signed a Letter of Intent (LOI) to acquire the assets of NHS Holdings, LLC. (NHS), Vystar’s exclusive U.S. distributor of Vytex® virtually allergen-, VOC- and odor-free natural rubber latex (NRL) foam. Please refer to Form 8-K filed on December 17, 2017 for further information.
Per Steven Rotman’s Employment agreement, he is to be paid approximately $1 per year in cash, $20,833 per month to be paid in shares based on a 20-day average at a 0% discount to market, an option to purchase 11,000,000 shares of common stock at par value as a signing bonus, and $200,000 as a performance bonus. During the year ended December 31, 2018, the Company expensed approximately $222,000 related to shares issued, $550,000 related to options granted, and a bonus in the amount of $200,000. Of the expensed amount, approximately $195,000 was paid in cash for the performance bonus.
Designcenters.com is owned by Jamie Rotman, who is the daughter of the Company’s CEO, Steven Rotman. Designcenters.com provides bookkeeping and management services to the Company. In exchange for such services, the Company has entered into a consulting agreement with the related party entity. Per Design’s consulting agreement, it is to be paid approximately $7,100 per month to be paid in shares based on a 20-day average at a 50% discount to market, $10,000 quarterly bonus to be paid in shares using the same formula and 300,000 shares of common stock as a one-time signing bonus. During the year ended December 31, 2018, the Company expensed approximately $222,010. Of the expensed amount, approximately $35,400 was paid in cash.
Blue Oar Consulting, Inc. is owned by Gregory Rotman, who is the son of the Company’s CEO, Steven Rotman. Blue Oar Consulting provides business consulting services to the Company. In exchange for such services, the Company has entered into a consulting agreement with the related party entity. Per Blue Oar’s consulting agreement, it is to be paid approximately $15,000 per month in cash for expenses, of which $12,500 per month is to be paid in cash or shares. If paid in shares, it will be based on a 20-day average at a 50% discount to market, an option to purchase 7,500,000 shares of common stock at par value as a signing bonus, and $175,000 as a bonus. During the year ended December 31, 2018, the Company expensed approximately $1,010,000. Of the expensed amount, approximately $212,500 was paid in cash.
During the year ended December 31, 2018, the Company had sales of approximately $60,000 to Murida, DBA Rotmans Furniture (“Rotmans”). Steve Rotman, the Company’s CEO, is the majority owner of Rotmans. At December 31, 2018, the Company had an amount receivable of approximately $75.
During the year ended December 31, 2018, the Company utilized certain warehouse staff, warehouse and office space/services and an executive assistant of Rotmans for the Company’s purposes. The Company estimates the cost of such services to be approximately $40,000 per month or approximately $480,000 for the year ended December 31, 2018 (based on the term such resources were used). The Company was not charged for these resources and does not owe any amounts to Rotmans for the services utilized through December 31, 2018.
Director Independence
Under Rule 5605(b)(1) of the Nasdaq Marketplace Rules, independent directors must comprise a majority of a listed company’s board of directors within one year of listing. In addition, Nasdaq Marketplace Rules require that, subject to specified exceptions, each member of a listed company’s audit, compensation and nominating and governance committees be independent. While Vystar does not currently qualify for listing on Nasdaq and will likely not qualify for some time after the date of this proxy statement, it does intend to seek such listing as soon as possible and complies with its Marketplace Rules. Audit committee members must also satisfy the independence criteria set forth in Rule 10A-3 under the Securities Exchange Act of 1934, as amended. Under Nasdaq Marketplace Rule 5605(a)(2), a director will only qualify as an “independent director” if, in the opinion of that company’s board of directors, that person does not have a relationship that would interfere with the exercise of independent judgment in carrying out the responsibilities of a director. In order to be considered to be independent for purposes of Rule 10A-3, a member of an audit committee of a public company may not, other than in his or her capacity as a member of the audit committee, the board of directors, or any other board committee: (1) accept, directly or indirectly, any consulting, advisory, or other compensatory fee from the public company or any of its subsidiaries; or (2) be an affiliated person of the listed company or any of its subsidiaries.
| ITEM 14. | PRINCIPAL ACCOUNTANT FEES AND SERVICES |
During fiscal year 2017 and 2016,2018 we retained the firm of Hall and Company (“Hall”) and during fiscal year 2017 we retained the firm Porter Keadle Moore, LLC (“PKM”) to provide services in the following categories and amounts:
| Fee Category | 2017($) | 2016($) | 2018($) | 2017($) | ||||||||||||
| Audit Fees | 66,750 | 68,750 | 90,000 | 66,750 | ||||||||||||
| Audit-Related Fees | — | — | — | — | ||||||||||||
| Tax Fees | — | — | — | — | ||||||||||||
| All Other Fees | — | — | — | — | ||||||||||||
| Total | 66,750 | 68,750 | 90,000 | 66,750 | ||||||||||||
Audit fees include the audit of Vystar’s annual financial statements, review of financial statements included in each of our Quarterly Reports on Form 10-Q, and services that are normally provided in connection with statutory and regulatory filings or engagements for those fiscal years.
Audit-related fees consist of fees for assurance and related services that are reasonably related to the performance of the audit or review of our financial statements. This category includes fees related to accounting-related consulting services. No audit-related fees incurred for the current or previous period.
Tax fees consist of fees for professional services for tax compliance, tax advice and tax planning. This category includes fees primarily related to the preparation and review of federal, state and international tax returns and assistance with tax audits. No tax fees incurred for the current or previous period.
All other fees include assurance services not related to the audit or review of our financial statements. No other fees incurred for the current or previous period.
There were no non-audit services provided by PKM for the current or previous period.
AUDIT COMMITTEE PRE-APPROVAL OF SERVICES PERFORMED BY OUR
INDEPENDENT REGISTERED PUBLIC ACCOUNTANTS
It is the policy of our Audit Committee to pre-approve all audit and permissible non-audit services to be performed by PKM.Hall. Our Audit Committee pre-approves services by authorizing specific projects within the categories outlined above, subject to a budget for each category. Our Audit Committee’s charter delegates to one or more members of the Audit Committee the authority to address any requests for pre-approval of services between Audit Committee meetings, and the subcommittee or such member or members must report any pre-approval decisions to our Audit Committee at its next scheduled meeting.
All services related to audit fees provided by Hall and PKM during fiscal year 20172018 and 20162017 were pre-approved by the Audit Committee in accordance with the pre-approval policy described above.
REPORT OF THE AUDIT COMMITTEE
The Audit Committee’s role includes the oversight of our financial, accounting and reporting processes; our system of internal accounting and financial controls; our enterprise risk management program; and our compliance with related legal, regulatory and ethical requirements. The Audit Committee oversees the appointment, compensation, engagement, retention, termination and services of our independent registered public accounting firm, including conducting a review of its independence; reviewing and approving the planned scope of our annual audit; overseeing our independent registered public accounting firm’s audit work; reviewing and pre-approving any audit and non-audit services that may be performed by it; reviewing with management and our independent registered public accounting firm the adequacy of our internal financial and disclosure controls; reviewing our critical accounting policies and the application of accounting principles; and monitoring the rotation of partners of our independent registered public accounting firm on our audit engagement team as required by regulation. The Audit Committee establishes procedures, as required under applicable regulation, for the receipt, retention and treatment of complaints received by us regarding accounting, internal accounting controls or auditing matters and the submission by employees of concerns regarding questionable accounting or auditing matters. The Audit Committee’s role also includes meeting to review our annual audited financial statements and quarterly financial statements with management and our independent registered public accounting firm. The Audit Committee held four meetings during fiscal year 2017.2018.
The sole membermembers of the Audit Committee meets the independence criteria prescribed by applicable regulation and the rules of the SEC for audit committee membership and is anare “independent director” within the meaning of NASDAQ listing standards. The Audit Committee membermembers meets NASDAQ’s financial literacy requirements, and the Board further determined that Ms. Mangum is aboth members are “audit committee financial expert” is aexperts” “as such term is defined in Item 407(d) of Regulation S-K promulgated by the SEC also meets NASDAQ’s financial sophistication requirements. The Audit Committee acts pursuant to a written charter, which complies with the applicable provisions of the Sarbanes-Oxley Act of 2002 and related rules of the SEC and NASDAQ, a copy of which can be found on our website atwww.vytex.comwww.vystarcorp.com.
We have reviewed and discussed with management and PKMHall Vystar’s audited financial statements. We discussed with PKMHall and Vystar’s Chief Financial Officer the overall scope and plans of PKM’s audits.Hall’s audit. We met with PKM,Hall, with and without management present, to discuss results of its examinations, its evaluation of Vystar’s internal controls, and the overall quality of Vystar’s financial reporting.
We have reviewed and discussed with PKMHall matters required to be discussed pursuant to Statement on Auditing Standards No. 61, as amended (AICPA, Professional Standards, Vol. 1. AU section 380), as adopted by the Public Company Accounting Oversight Board in Rule 3200T. We have received from PKMHall the written disclosures and letter required by the applicable requirements of the Public Company Accounting Oversight Board regarding PKM’sHall’s communications with the Audit Committee concerning independence. We have discussed with PKMHall matters relating to its independence.
Based on the reviews and discussions referred to above and our review of Vystar’s audited financial statements for fiscal year 2017,2018, we recommended to the Board that Vystar’s audited financial statements be included in the Annual Report on Form 10-K for the fiscal year ended December 31, 2017,2018, for filing with the SEC.
Respectfully submitted,
AUDIT COMMITTEE
Mitsy Y. Mangum, Chair
| ITEM 15. | EXHIBITS AND FINANCIAL STATEMENT SCHEDULES |
1. FINANCIAL STATEMENTS
The following financial statements and notes thereto of Vystar Corporation, and the related Report of Independent Registered Public Accounting Firm are set forth in Item 8.
| F-1 | ||
| Balance Sheets | F-2 | |
| Statements of Loss | F-3 | |
| Statements of Stockholders’ Equity (Deficit) | F-4 | |
| Statements of Cash Flows | F-5 | |
| Notes to Financial Statements | F-6 |
2. FINANCIAL STATEMENT SCHEDULES
All schedules for which provision is made in the applicable accounting regulations of the SEC have been omitted because they are not applicable, or the required information is included in the financial statements or notes thereto.
3. EXHIBITS
Exhibit Index *
* Some Exhibits have certain confidential information redacted pursuant to a request for confidential treatment
| Number | ||
| Description | ||
| 3.1 | Articles of Incorporation of Vystar Acquisition Corporation (now named Vystar Corporation) dated December 17, 2003 (as amended) (incorporated by reference to Vystar’s Registration Statement on Form S-1 originally filed on November 13, 2008, Registration Statement No. 333-155344) | |
| 3.2 | Articles of Amendment to the Articles of Incorporation of Vystar Corporation | |
| 3.3 | Bylaws of Vystar Corporation (incorporated by reference to Vystar’s Registration Statement on Form S-1 originally filed on November 13, 2008, Registration Statement No. 333-155344) | |
| 4.1 | Specimen Certificate evidencing shares of Vystar common stock (incorporated by reference to Vystar’s Registration Statement on Form S-1 originally filed on November 13, 2008, Registration Statement No. 333-155344) | |
| 4.2 | Form of Share Subscription Agreements and Investment Letter (First Private Placement) (incorporated by reference to Vystar’s Registration Statement on Form S-1 originally filed on November 13, 2008, Registration Statement No. 333-155344) | |
| 4.3 | Form of Share Subscription Agreement and Investment Letter (Second Private Placement) (incorporated by reference to Vystar’s Registration Statement on Form S-1 originally filed on November 13, 2008, Registration Statement No. 333-155344) | |
| 4.4 | Form of Vystar Corporation Investor Questionnaire and Subscription Agreement (Third Private Placement) (incorporated by reference to Vystar’s Registration Statement on Form S-1 originally filed on November 13, 2008, Registration Statement No. 333-155344) | |
| 4.5 | Warrant to Purchase Shares of Common Stock of Vystar Corporation dated March 11, 2011 issued to Topping Lift Capital LLC (incorporated by reference to Vystar’s Current Report on Form 8-K dated March 11, 2011 and filed on March 15, 2011) | |
| 4.6 | Form of Warrant issued to Investor note holders (incorporated by reference to Vystar’s Current Report on Form 8-K dated March 11, 2011 and filed on March 15, 2011) |
| 4.7 | Form of Series A-1 Warrant (incorporated by reference to Vystar’s Current Report on Form 8-K filed on June 11, 2012) |
| 10.1* | Manufacturing Agreement between Vystar Corporation and Revertex (Malaysia) Sdn. Bhd. effective April 1, 2008 (incorporated by reference to Vystar’s Registration Statement on Form S-1 originally filed on November 13, 2008, Registration Statement No. 333-155344) | |
| 10.2 | Executive Employment Agreement between Vystar Corporation and William R. Doyle, dated November 11, 2008 (incorporated by reference to Vystar’s Registration Statement on Form S-1 originally filed on November 13, 2008, Registration Statement No. 333-155344) | |
| 10.3 | Management Agreement dated January 31, 2008 between Universal Capital Management, Inc. and Vystar Corporation (incorporated by reference to Vystar’s Registration Statement on Form S-1 originally filed on November 13, 2008, Registration Statement No. 333-155344) | |
| 10.4 | Letter Agreement dated August 15, 2008 between Universal Capital Management, Inc. and Vystar Corporation (incorporated by reference to Vystar’s Registration Statement on Form S-1 originally filed on November 13, 2008, Registration Statement No. 333-155344) | |
| 10.5 | Addendum to Management Agreement dated February 29, 2008 between Universal Capital Management, Inc. and Vystar Corporation (incorporated by reference to Vystar’s Registration Statement on Form S-1 originally filed on November 13, 2008, Registration Statement No. 333-155344) |
| 10.6 | ||
| Warrant Purchase Agreement dated January 31, 2008 between Universal Capital Management, Inc. and Vystar Corporation (incorporated by reference to Vystar’s Registration Statement on Form S-1 originally filed on November 13, 2008, Registration Statement No. 333-155344) | ||
| 10.7 | Management Agreement dated April 30, 2008 between Universal Capital Management, Inc. and Vystar Corporation (incorporated by reference to Vystar’s Registration Statement on Form S-1 originally filed on November 13, 2008, Registration Statement No. 333-155344) | |
| 10.8 | Warrant Purchase Agreement dated April 30, 2008 between Universal Capital Management, Inc. and Vystar Corporation (incorporated by reference to Vystar’s Registration Statement on Form S-1 originally filed on November 13, 2008, Registration Statement No. 333-155344) | |
| 10.9 | Vystar Corporation 2004 Long-Term Compensation Plan, as amended (incorporated by reference to Vystar’s Registration Statement on Form S-1 originally filed on November 13, 2008, Registration Statement No. 333-155344) | |
| 10.10 | Employment Agreement between Vystar Corporation and Sandra Parker dated April 1, 2008 (incorporated by reference to Vystar’s Registration Statement on Form S-1 originally filed on November 13, 2008, Registration Statement No. 333-155344) | |
| 10.10* | Distributor Agreement among Vystar Corporation, Centrotrade Minerals & Metals, Inc. and Centrotrade Deutschland, GmbH dated January 6, 2009 (incorporated by reference to Vystar’s Registration Statement on Form S-1 originally filed on November 13, 2008, Registration Statement No. 333-155344) | |
| 10.11 | Note agreement between Vystar Corporation and Climax Global Energy, Inc. dated August 15, 2008 (incorporated by reference to Vystar’s Registration Statement on Form S-1 originally filed on November 13, 2008, Registration Statement No. 333-155344) | |
| 10.12 | Form of Investor Note (incorporated by reference to Vystar’s Current Report on Form 8-K dated March 11, 2011 and filed on March 15, 2011) | |
| 10.13 | Promissory Grid Note dated April 29, 2011, in a principal amount of $800,000 from Vystar Corporation to CMA Investments, LLC (incorporated by reference to Vystar’s Current Report on Form 8-K dated April 29, 2011 and filed on May 2, 2011) |
| 10.14 | First Amendment to Agreement dated September 9, 2011, between Vystar Corporation, CMA Investments, LLC and Italia-Eire, LP, a Georgia limited partnership |
| 10.15 | Form of Securities Purchase Agreement dated May 2012 between Vystar and investors (incorporated by reference to Vystar’s Quarterly Report on Form 10-Q filed on August 10, 2012) | |
| 10.16 | LLC Ownership Interest Purchase Agreement dated September 13, 2012, between Vystar and Mary Ailene Miller (incorporated by reference to Vystar’s Current Report on Form 8-K filed on September 19, 2012) | |
| 10.17 | Second Amendment to Agreement dated November 2, 2012, among Vystar, CMA Investments, LLC and Italia – Eire LP (incorporated by reference to Vystar’s Quarterly Report on Form 10-Q filed on November | |
| 10.18** | Employment Agreement between W. Dean Waters and Vystar dated April 1, 2013 | |
| 10.19 | LLC Ownership Interest Purchase Agreement dated June 28, 2013, between the Company and Michal Soo, M.D. (incorporated by reference to the Company’s Current Report on Form 8-K filed on July 2, 2013) | |
| 10.20 | Note Subscription Agreement dated June 28, 2013 between the Company and the Investors (incorporated by reference to the Company’s Current Report on Form 8-K filed on July 2, 2013) | |
| 10.21 | Form of Senior Secured Convertible Promissory Note dated June 30, 2013 (incorporated by reference to the Company’s Current Report on Form 8-K filed on July 2, 2013) | |
| 10.22 | Form of Security Agreement dated July 1, 2013 (incorporated by reference to the Company’s Current Report on Form 8-K filed on July 2, 2013) | |
| 31*** | Certification of Chief Executive Officer and Chief Financial Officer pursuant to Section 302 of the Sarbanes-Oxley Act of 2002 | |
| 32*** | Certification of Chief Executive Officer and Chief Financial Officer pursuant to 18 U.S.C. Section 1350 as adopted pursuant to Section 906 of the Sarbanes-Oxley Act of 2002 |
| 101.INS*** | XBRL Instance Document | |
| 101.SCH*** | XBRL Taxonomy Extension Schema Document | |
| 101.CAL*** | XBRL Taxonomy Extension Calculation Linkbase Document |
| 101.DEF*** | XBRL Taxonomy Extension Definition Linkbase Document | |
| 101.LAB*** | XBRL Taxonomy Extension Label Linkbase Document | |
| 101.PRE*** | XBRL Taxonomy Extension Presentation Linkbase Document |
* Some Exhibits have certain confidential information redacted pursuant to a request for confidential treatment.
| * | Some Exhibits have certain confidential information redacted pursuant to a request for confidential treatment. |
** Exhibits and schedules to this exhibit have been omitted pursuant to Item 601(b)(2) of Regulation S-K. The Company will furnish copies of the omitted exhibits and schedules to the Securities and Exchange Commission upon its request. Confidential treatment has been requested as to a portion of this exhibit, which portion has been omitted and filed separately with the Securities and Exchange Commission.
| ** | Exhibits and schedules to this exhibit have been omitted pursuant to Item 601(b)(2) of Regulation S-K. The Company will furnish copies of the omitted exhibits and schedules to the Securities and Exchange Commission upon its request. Confidential treatment has been requested as to a portion of this exhibit, which portion has been omitted and filed separately with the Securities and Exchange Commission. |
*** Filed herewith.
| *** | Filed herewith. |
| ITEM 16. | FORM 10-K SUMMARY |
Not applicable.
Pursuant to the requirements of Section 13 or 15(d) of the Securities Exchange Act of 1934, the registrant has duly caused this report to be signed on its behalf by the undersigned, thereunto duly authorized.
| VYSTAR CORPORATION | ||
| Date: | By: | /s/ Steven Rotman |
| Steven Rotman | ||
| Chairman, President, Chief Executive Officer (Principal Executive Officer), Chief Financial Officer (Principal Financial and Accounting Officer) and Director | ||
Pursuant to the requirements of the Securities Exchange Act of 1934, this report has been signed below by the following persons on behalf of the registrant and in the capacities indicated, on March 30, 2018 .April 22, 2019.
| Signature | Title | |
| /s/ Steven Rotman | President, Chief Executive Officer, and Chief Financial Officer | |
| Steven Rotman | ||
| /s/ Joseph Allegra | Chairman of the Board of Directors | |
| Joseph Allegra, PhD | ||
| /s/ Keith D. Osborn | Director | |
| Keith D. Osborn, MD | ||
| /s Michael X. Ianacone | Director | |
| Michael X. Ianacone | ||
| /s/ Mitsy Y. Mangum | Director | |
| Mitsy Y. Mangum | ||
| /s/ Ranjit Matthan | Director | |
| Ranjit Matthan, PhD | ||
| /s/ Bryan Stone | Director | |
| Bryan Stone, MD |