Our General Partner has no business or operations other than managing our business. In addition, outside of its investment in us, our General Partner owns no assets or property other than a minimal amount of cash, which has been distributed by us to our General Partner in respect of its interest in us. Our partnership agreement imposes no additional material liabilities upon our General Partner or obligations to contribute to us other than those liabilities and obligations imposed on general partners under the Delaware Revised Uniform Limited Partnership Act.
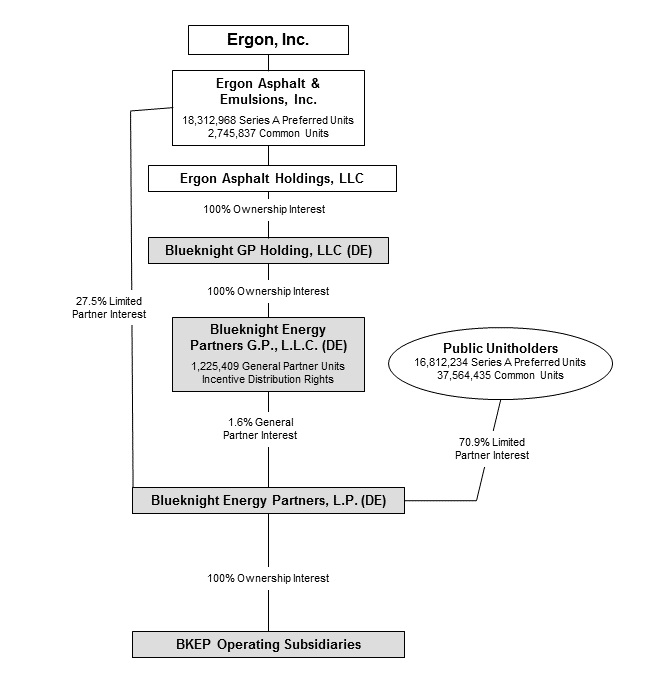
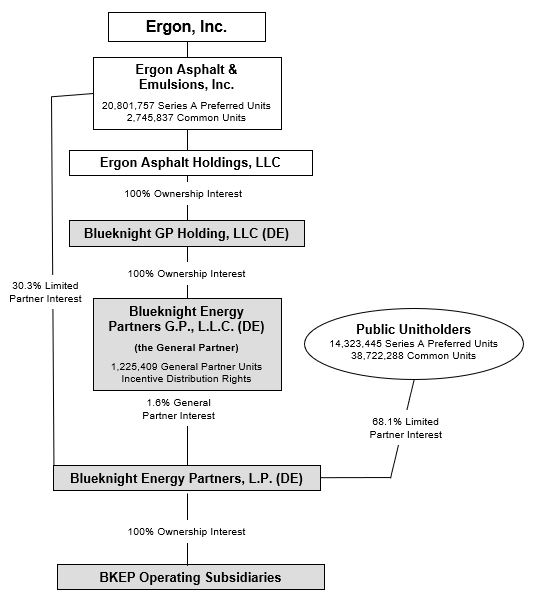
The following diagram depicts our organizational structure, including our relationship with our affiliates and subsidiaries, as of March 1, 2018:4, 2021:
Our Strengths and Strategies
Business strategy. Our new go-forward strategy is to transform Blueknight into a pure-play, downstream terminalling solutions provider focused on infrastructure and transportation end markets. During the firstquarter of 2021, we completed the transformational divestitures of our three crude oil business segments. Through these divestitures, we have improved our balance sheet and achieved financial flexibility to pursue accretive growth investments. We have refocused expansion activities on core competencies and inherent competitive advantages in specialty terminalling markets. We will redeploy capital and maximize risk-adjusted returns in both organic and non-organic growth projects.
Strategically placed assets
. We ownGrowth opportunities.
We evaluate growth opportunities from multiple angles, including growth through third-party acquisitions and optimizing our existing asset base. In addition, Ergon has indicated that itExperienced management team
. Our General Partner has an experienced and knowledgeable management team with extensive experience as a service provider in theOur relationship with Ergon
. Ergon owns our General Partner and therefore controls our operations. Ergon is a privately held company formed in 1954 and is based in Jackson, Mississippi, with overAsphalt Industry Overview
Liquid asphalt which includes liquid asphalt cement and residual fuel oils, is one of the oldest engineering materials. Liquid asphalt’s adhesive and waterproofing properties have been used for building structures, waterproofing ships, mummification, and numerous other applications.
Production of liquid asphalt begins with the refining of crude oil. When crude oil is separated in distillation towers at a refinery, the heaviest hydrocarbons with the highest boiling points settle at the bottom. These tar-like fractions, called residuum, require relatively little additional processing to become products such as liquid asphalt cement or residual fuel oil.asphalt. Liquid asphalt production typically represents only a small portion of the total product production in the crude oil refining process. The liquid asphalt produced by petroleum distillation can be sold by the refinery either directly into the wholesale and retail liquid asphalt markets or to a liquid asphalt marketer.
In its normal state, liquid asphalt is too viscous to be used at ambient temperatures. For paving applications, asphalt can be heated (hot mix asphalt), diluted or cut back with petroleum solvents (cutback asphalts), or emulsified in a water base with emulsifying chemicals by a colloid mill (asphalt emulsions). Hot mix asphalt is produced by mixing hot asphalt cement and heated aggregate (stone, sand and/or gravel). The hot mix asphalt is loaded into trucks for transport to the paving site, where it is placed on the road surface by paving machines and compacted by rollers. Hot mix asphalt is used for new construction, reconstruction, and for thin maintenance overlay on existing roads.
Asphalt emulsions and cutback asphalts are used for a variety of applications, including spraying as a tack coat between an old pavement and a new hot mix asphalt overlay, cold mix pothole patching material, and preventive maintenance surface applications such as chip seals. Asphalt emulsions are also used for fog seal, slurry seal, scrub seal, sand seal and microsurfacing maintenance treatments, warm mix emulsion/aggregate mixtures, base stabilization, and both central plant and in-place recycling. Asphalt emulsions and cutback asphalts are generally sold directly to government agencies but are also sold to contractors.
The asphalt industry in the United States is characterized by a high degree of seasonality. Much of this seasonality is due to the impact that weather conditions have on road construction schedules, particularly in cold weather states. Refineries produce liquid asphalt year-round, but the peak asphalt demand season is during the warm weather months when most of the road construction activity in the United States takes place. Liquid asphalt marketers and finished asphalt product producers with access to storage capacity possess the inherent advantage of being able to purchase supply from refineries on a year-round basis and then sell finished asphalt products in the peak summer demand season.
Asphalt Terminalling Services
We provide crude oil gathering, marketing, transportation andasphalt terminalling services to producers, marketers and refinersdistributors of crude oilliquid asphalt and asphalt-related products. The market we serve, which begins at the source of production and extendsWe do not take title to the point of distribution to the end user customer, is commonly referred to as the “midstream” market. Our crude oil operations are located primarily in Oklahoma, Kansas and Texas, where there are extensive crude oil production operations in place, and our assets extend from gathering systems and trucking networks in and around producing fields to transportation pipelines carrying crude oil to logistics hubs, such as the Cushing Interchange, where we have terminalling facilities that aid our customers in managing their crude oil.
We serve the asphalt industry by providing our customers access to their market areas through a combination of leasing our liquid asphalt facilities and providing terminalling services at certain facilities. We generate revenues by charging a fee for the lease of a facility or for services provided as asphalt products are terminalled in our facilities.
As of March 7, 2018,4, 2021, we have leases and storageterminalling agreements relating to all of our asphalt facilities. Lease and storagefacilities, including 28 under contract with Ergon. Our agreements related to 16 of these facilities have, terms that expirebased on a weighted average by the end of 2018, while the agreements relating to our additional 40 facilities have on averageremaining fixed revenue, approximately five5.8 years remaining under their terms. FifteenBased on tank capacity, approximately 20% of the contracts thatcapacity, all with third parties, expire in 2018 arelate 2021 if not renewed with Ergon.the current customer or a new customer, and the remaining capacity expires at varying times thereafter, through 2027. We may not be able to extend, renegotiate or replace these contracts when they expire and the terms of any renegotiated contracts may not be as favorable as the contracts they replace. We operate the asphalt facilities that are contracted by storage, throughput and handling agreements, while our contract counterparties operate the asphalt facilities that are subject to the lease agreements.
At leased facilities, our customers conduct the operations at the asphalt facility, including the storage and processing of asphalt products, and we collect a monthly rental fee relating to the lease of such facility. Generally, under the terms of those leases, (i) title to the asphalt, raw materials or finished asphalt products received, unloaded, stored, or otherwise handled at such asphalt facility is in the name of the lessee; (ii) the lessee is responsible for complying with environmental, health, safety, transportation and security laws; (iii) the lessee is required to obtain and maintain necessary permits, licenses, plans, approvals, or other such authorizations and is responsible for insuring such asphalt facility; and (iv) most routine maintenance and repairs of such asphalt facility are the responsibility of the lessee.
We do not take title to or have marketing responsibility for the liquid asphalt product thatat terminals we terminal.operate. As a result, our asphalt operations have minimal direct exposure to changes in commodity prices, but the volumes of liquid asphalt we terminal are indirectly affected by commodity prices.
The following table provides an overview of our asphalt facilities as of March 7, 2018:
Total Tankage | ||||
Location | Number of Facilities | (in thousands of bbls)(1) | ||
Alabama | 1 | 205 | ||
Arizona | 1 | 66 | ||
Arkansas | 1 | 21 | ||
California | 1 | 66 | ||
Colorado | 4 | 401 | ||
Georgia | 2 | 192 | ||
Idaho | 1 | 285 | ||
Illinois | 2 | 232 | ||
Indiana | 1 | 156 | ||
Kansas | 5 | 662 | ||
Missouri | 3 | 662 | ||
Mississippi | 1 | 202 | ||
Montana | 1 | 123 | ||
Nebraska | 1 | 292 | ||
New Jersey | 1 | 459 | ||
Nevada | 1 | 280 | ||
North Carolina | 1 | 243 | ||
Ohio | 1 | 38 | ||
Oklahoma | 7 | 1,420 | ||
Pennsylvania | 1 | 59 | ||
Tennessee | 4 | 770 | ||
Texas | 4 | 248 | ||
Utah | 2 | 300 | ||
Virginia | 2 | 635 | ||
Washington | 3 | 468 | ||
Wyoming | 1 | 220 | ||
Total | 53 | 8,705 |
(1) | Total tankage refers to the approximate total capacity of all tanks. |
| Location | Number of Facilities | Total Tankage (in thousands of bbls)(1) |
| Alabama | 1 | 212 |
| Arizona | 1 | 66 |
| Arkansas | 1 | 21 |
| California | 1 | 66 |
| Colorado | 4 | 401 |
| Georgia | 2 | 192 |
| Idaho | 1 | 285 |
| Illinois | 2 | 232 |
| Indiana | 1 | 156 |
| Kansas | 5 | 662 |
| Missouri | 3 | 643 |
| Mississippi | 1 | 202 |
| Montana | 1 | 123 |
| Nebraska | 1 | 292 |
| New Jersey | 1 | 459 |
| Nevada | 1 | 280 |
| North Carolina | 1 | 259 |
| Ohio | 1 | 38 |
| Oklahoma | 7 | 1,409 |
| Pennsylvania | 1 | 59 |
| Tennessee | 5 | 1,596 |
| Texas | 6 | 1,001 |
| Utah | 2 | 300 |
| Virginia | 2 | 635 |
| Washington | 3 | 470 |
| Wyoming | 1 | 220 |
| Total | 56 | 10,279 |
Our asphalt assets range in age from one year to over 50 years, and we expect that our storage tanks and related assets will have an average remaining life in excess of 20 years.
Significant Customers.
For the year ended December 31,| Year ended December 31, | |||||
| 2016 | 2017 | ||||
| (in thousands) | |||||
| Average crude oil barrels stored per month at our Cushing terminal | 5,536 | 5,413 | |||
| Average crude oil delivered (Bpd) to our Cushing terminal | 78 | 41 | |||
| Total storage capacity at our Cushing terminal (barrels at end of period) | 6,600 | 6,600 | |||
| Total other storage capacity (barrels at end of period) | 834 | 337 | |||
| Location | Storage Capacity (thousands of barrels) | Number of Tanks | ||
| Cushing, Oklahoma | 6,600 | 34 | ||
Other(1) | 337 | 177 | ||
| Total | 6,937 | 211 | ||
| System | Asset Type | Approximate Length (miles) | Average Throughput for Year Ended December 31, 2016 (Bpd) | Average Throughput for Year Ended December 31, 2017 (Bpd) | Pipe Diameter Range |
| Mid-Continent | Gathering and transportation pipelines | 655 | 26,505 | 21,931 | 4” to 20” |
Competition
We compete with national, regional, and local liquid asphalt terminalling companies and gathering, storage and pipeline companies, including the major integrated oil companies of widely varying sizes, financial resources, and experience. We are subject to competition from other crude oil gathering, pipeline transportation, terminalling operations and trucking operations that may be able to supply our customers with the same or comparable services on a more competitive basis.
The asphalt industry is highly fragmented and regional or local in nature. Participants range in size from major oil companies to small family-owned businesses. Participants in the asphalt business includeinclude: (i) refiners such as BP p.l.c., Flint Hills Resources, L.P., CHS, Inc., Exxon MobilExxonMobil Corporation, ConocoPhillips Co.,Phillips 66, NuStar Energy L.P., Ergon Refining, Inc., Marathon Petroleum Company LLC, Alon USA LP, Suncor Energy Inc., and Valero Energy Corporation; (ii) resellers such as Associated Asphalt Partners, LLC, Idaho Asphalt Supply, Inc., and Asphalt Materials, Inc.; and (iii) large road construction firms such as Old Castle Materials, Inc. and Colas SA. We compete for asphalt terminalling services with the national, regional and local industry participants as well as with liquid asphalt terminalling companies, including the major integrated oil companies and a variety of others, such as KinderMorgan Inc., International-Matex Tank Terminals and Houston Fuel Oil Terminal Company.
Our ability to compete could be harmed by factors we cannot control, including:
If we are unable to compete effectively with services offered by other midstream enterprises,asphalt terminalling companies, our financial results and ability to make distributions to our unitholders may be adversely affected. Additionally, we also compete with national, regional, and local companies for asset acquisitions and expansion opportunities. Some of these competitors are substantially larger than us and have greater financial resources and lower costs of capital than we do.
Environmental, Health and Safety Risks
Federal, state and local laws and regulations relatingrelated to the discharge of materials into the environment or otherwise relating to protection of the environment,zoning, land use, air emissions (including greenhouse gases), water discharges, waste management and disposal, noise, odor and dust control, and other environmental, health and safety. Varioussafety and security matters govern our operations. Some of our operations require permits or other government-issued authorizations, which may impose additional operating standards, and are required under thesesubject to modification renewal and revocation. We commit resources to achieve and maintain compliance with all applicable laws forand regulations, however the risk of liabilities, particularly environmental liabilities, is inherent in the operation of our terminals, pipelines and related operations, and may be subject to revocation, modification and renewal.businesses. These laws and regulations may also require notice to stakeholders of proposed and ongoing operations; require the installation of expensive pollution control equipment; restrict the types, quantities and concentrations of various substances that can be released into the environment in connection with transporting through pipelines; or establish specific safety and health criteria addressing worker protection. As with liquid asphalt and midstream industries generally, compliance with current and anticipated environmental laws and regulations increases our overall cost of business, including our capital costs to construct, maintain and upgrade equipment and facilities. Failure to comply with these laws and regulations maypotential liabilities could result in the assessment of significant administrative, civil and/or criminal penalties, the imposition of investigatory and remedial liabilities and issuance of injunctions that may restrict or prohibit some or all of our operations. We believe that our operations are in substantial compliance with applicable laws, regulations and permits. However, environmental laws and regulations are subject to change, along with varying degrees of interpretation and departmental policies, resulting in potentially more stringent requirements. The recent legislative and regulatory trend has been to place increasingly stringent restrictions and limitations on activities that may affect the environment. Federal, state or local administrative decisions, developments in the federal or state court systems or other governmental or judicial actions may influence the interpretation and/or enforcement of environmental laws and regulations and may thereby increase compliance costs. We cannot provide any assurance that the cost of compliance with current and future laws and regulations will not have a material effect on our results of operations, financial positioncosts, including for fines or cash flows.
Future events, including changes in existing laws impose restrictions, strict controls and permitting requirements on the discharge of pollutants into watersor regulations or enforcement policies, or further investigation or evaluation of the United States and state waters. We note that the term “waterspotential health hazards of the United States” is already broadly construedproducts handled or business activities may result in additional or unanticipated compliance and other costs. We could be required to invest in 2015, the United States Environmental Protection Agency (“EPA”) and U.S. Army Corps of Engineers adopted a rule to clarify the meaning of the term “waters of the United States.” Many interested parties believe that the rule expands federal jurisdiction under the CWA. In January 2018, the Supreme Court ruled that district courts have jurisdiction over challenges to the rule. Litigation surrounding this rule is ongoing, and the EPA has instituted rulemakings to both delay the effective date of the rule and to repeal the rule. Although the outcome of these legal challenges remains uncertain, with the changepreventive or remedial action, like control equipment, which could be substantial, or which could result in administration, the “waters of the United States” rule is not currently expected to survive those challenges. The CWA and analogous laws provide significant penalties for unauthorized discharges and impose substantial potential liabilities for cleaning up releases into water. In addition, the CWA and analogous state laws require individualrestrictions on our operations or delays in obtaining required permits or coverage under general permits for discharges of storm water runoff from certain types of facilities. Some states also maintain groundwater protection programs that require permits for discharges or operations that may impact groundwater conditions. We believe that we are in substantial compliance with any such applicable state requirements.
Our operations are subject to the federal Clean Air Act (“CAA”), as amended, as well as to comparable statemanufacturing, operating, and local laws. We believe that our operations are in substantial compliance with applicable laws in those areas in which we operate. Amendments to the CAA enacted in 1990 imposed a federal operating permit requirement for major sources of air emissions. Our crude oil terminal located in Cushing, Oklahoma holds such a permit, which is referred to as a “Title V permit.” The EPA approved final rules under the CAA that established new air emission controls for oil and natural gas production, pipelines and processing operations that took effect on October 15, 2012. To respond to challenges, the EPA revised certain aspects of the rules and has indicated it may reconsider other aspects. The EPA finalized a rule, which took effect August 2, 2016, to set standards for methane and volatile organic compound emissions from new and modified sources in the oil and gas sector, including transmission. The EPA is currently engaged in rulemaking to stay the effective date of these rules. The costs of compliance with any modified or newly issued rules cannot be predicted. The Obama administration also announced in January 2015 that other federal agencies, including the Bureau of Land Management (“BLM”), PHMSA and the Department of Energy, will impose new or more stringent regulations on the oil and gas sector that are said to have the effect of reducing methane emissions. For example, the BLM adopted rules that took effect on January 17, 2017, to reduce venting, flaring and leaks during oil and natural gas production activities on onshore federal and Indian leases. In December 2017, implementation of this rule was delayed until January 2019. Compliance with these rules could result in additional compliance costs for us and for others in our industry. In response to these and other regulatory developments, we may be required to incur certain capital expenditures in the next several years for air pollution control equipment and operational changes in connection with obtaining or maintaining permits and approvals and complying with applicable regulations addressing air emission related issues. However, the status of recent and future rules and rulemaking initiatives under the new administration is uncertain. Although we can provide no assurance, we believe future compliance with the CAA, as currently amended, will not have a material adverse effect on our financial condition, results of operations or cash flows.
Operational Hazards and Insurance
Terminals pipelines and similar facilities may experience damage as a result of an accident or natural disaster. These hazards can cause personal injury and loss of life, severe damage to and destruction of property and equipment, pollution or environmental damage and suspension of operations. We maintain insurance of various types and varying levels of coverage which we consider adequate under the circumstances to cover our operations and properties, including coverage for pollution-related events. However, such insurance does not cover every potential risk associated with operating terminals pipelines and other facilities. The overall cost of the insurance program has decreased over the last five years dueIn 2020, we experienced increased costs as insurers are increasing premiums to favorable claims history, improved risk management practices, collaborative relationships with our underwriters and competitive insurance markets.ameliorate recent losses. Through the utilization of deductibles and retentions, we self-insure the “working layer” of loss activity to create a more efficient and cost-effective program. The working layer consists of high-frequency/low-severity losses that are best retained and managed in-house. We continue to monitor our retentions as they relate to the overall cost and scope of our insurance program.
Employees
As of December 31, 2017,2020, we employedhad approximately 370 persons.147 employees related to our continuing operations. None of these employees are represented by labor unions or covered by any collective bargaining agreement. We believe that relations with these employees are satisfactory.
Financial Information about Segments
We operate our asphalt terminalling facilities under a single operating revenues, profit and loss and identifiable assets attributable to each of our segments is presented in Note 20 to our consolidated financial statements included in this annual report on Form 10-K.
Available Information
We provide public access to our annual reports on Form 10-K, quarterly reports on Form 10-Q, current reports on Form 8-K and amendments to these reports filed with the SEC under the Securities and Exchange Act of 1934. These documents may be accessed free of charge on our website, www.bkep.com, as soon as is reasonably practicable after their filing with the SEC. Information contained on our website is not incorporated by reference in this report or any of our other filings. The filings are also available through the SEC at the SEC’s Public Reference Room at 100 F Street, N.E., Washington, D.C. 20549. Information on the operation of the Public Reference Room is available by calling 1-800-SEC-0330. The SEC also maintains a website which contains reports, proxy and information statements and other information regarding issuers that file electronically with the SEC. The SEC’s website is
Limited partner interests are inherently different from the capital stock of a corporation, although many of the business risks to which we are subject are similar to those that would be faced by a corporation engaged in a similar business. You should carefully consider the following risk factors together with all of the other information included in this report. If any of the following risks were actually to occur, our business, financial condition, results of operations and cash flows could be materially adversely affected. In that case, we might not be able to pay distributions on our units, the trading price of our units could decline and our unitholders could lose all or part of their investment.
Risks Related to our Business
We may not have sufficient cash from operations following the establishment of cash reserves and payment of fees and expenses, including cost reimbursements to our General Partner, to enable us to make cash distributions to holders of our units at our current distribution rate.
In order to make cash distributions on our Preferred Units at the preference distribution rate of $0.17875$0.17875 per unit per quarter, or $0.715$0.715 per unit per year, and on our common units at the minimumcurrent quarterly distribution of $0.11$0.04 per unit per quarter, or $0.44$0.16 per unit per year, we will require available cash of approximately $10.9$8.1 million per quarter, or $43.7$32.4 million per year. We may not have sufficient available cash from operating surplus each quarter to enable us to make cash distributions on our Preferred Units at the preference rate or on our common units at the minimumcurrent quarterly distribution rate. The amount of cash we can distribute on our units principally depends upon the amount of cash we generate from our operations, which will fluctuate from quarter to quarter based on, among other things, the risks described herein.
In addition, the actual amount of cash we will have available for distribution will depend on other factors, including:
the level of capital expenditures we make;
the cost of acquisitions;
our debt service requirements and other liabilities;
fluctuations in our working capital needs;
our ability to borrow funds and access capital markets;
restrictions contained in our credit facility or other debt agreements; and
the amount of cash reserves established by our General Partner.
We depend on certain key customers for a portion of our revenues and are exposed to credit risks of these customers. The loss of or material nonpayment or nonperformance by any of these key customers could adversely affect our financial condition, results of operations and cash flows.
We rely on certain key customers for a portion of our revenues. For example, Ergon Asphalt & Emulsions,and Emulsion, Inc., a wholly-owned subsidiary of Ergon, Inc., represented approximately $56.4 million, or 50%,at least 40% but not more than 45% of our total asphalt terminalling services revenue in 2017. Vitol represented approximately $8.9 million, or 40%, of our total crude oil terminalling revenue, $6.4 million, or 30%, of our crude oil pipeline services revenue and $5.9 million, or 24%, of our total crude oil trucking and producer field services revenue in 2017. Vitol and2020. Ergon areis a private companiescompany and we have limited information regarding theirits financial condition. Vitol and Ergon Asphalt & Emulsions, Inc. comprised 9% and 29%, respectively,13% of total accounts receivable at December 31, 2017.
In addition to Vitol and Ergon, Asphalt & Emulsions, Inc., we have two other key customers. Asphalt & Fuel Supply, LLCcustomers that each accounted for at least 10% but not more than 15% of total asphalt terminalling services revenue in 2017. Citigroup Energy, Inc. and MVP Logistics, LLC2020. Three third-party customers each accounted for at leastbetween 10% but no more thanand 25% of total crude oil terminalling revenue in 2017. MV Purchasing, LLC and DCP Operating Company, LP each accounted foraccounts receivable at least 10% but no more than 30% of total crude oil trucking and producer field services revenue in 2017. CP Energy, LLC and CVR Energy, Inc. each accounted for at least 20% but no more than 35% of total crude oil pipeline services revenue in 2017.
We may be unable to negotiate extensions or replacements of contracts with key customers on favorable terms. In addition, some of these key customers may experience financial problems which could have a significant effect on their creditworthiness. Severe financial problems encountered by our customers could limit our ability to collect amounts owed to us
The amount of cash we have available for distribution to holders of our units depends primarily on our cash flows and not solely on earnings reflected in our financial statements. Consequently, even if we are profitable and are otherwise able to pay distributions, we may not be able to make cash distributions to holders of our units.
Our unitholders should be aware that the amount of cash we have available for distribution depends primarily upon our cash flows and not solely on earnings reflected in our financial statements, which will be affected by non-cash items. As a result, we may make cash distributions, if permitted by our credit agreement, during periods when we record losses for financial accounting purposes and may not make cash distributions during periods when we record net earnings for financial accounting purposes.
Our debt
levels under our credit agreement may limit our ability to make distributions and our flexibility in obtaining additional financing and in pursuing other business opportunities.As of December 31, 2017,2020, we had approximately $309.1$252.6 million in outstanding indebtedness, includingexcluding approximately $1.5$1.7 million in outstanding letters of credit, under our $450.0$400.0 million credit agreement. Our level of debt under the credit agreement could have important consequences for us, including the following:
Our ability to obtain additional financing, if necessary, for working capital, capital expenditures, acquisitions or other purposes may be impaired or such financing may not be available on favorable terms;terms.
We will need a substantial portion of our cash flows to make principal and interest payments on our debt, reducing the funds that would otherwise be available for operations, future business opportunities and distributions to unitholders;unitholders.
We could be more vulnerable to competitive pressures or a downturn in our business or the economy generally; andgenerally.
Our flexibility in responding to changing business and economic conditions. conditions may be limited.
Our ability to service our debt will depend upon, among other things, our future financial and operating performance, which will be affected by prevailing economic conditions and financial, business, regulatory and other factors. Our ability to service debt under our credit agreement also will depend on market interest rates, since the interest rates applicable to our borrowings will fluctuate with the eurodollar rate or the prime rate. If our operating results are not sufficient to service our current or future indebtedness, we will be forced to take actions such as reducing distributions, reducing or delaying our business activities, acquisitions, investments or capital expenditures, selling assets, restructuring or refinancing our debt or seeking additional equity capital. We may not be able to effect any of these actions on satisfactory terms, or at all.
Restrictions in our credit agreement could materially adversely affect our business, financial condition, results of operations, ability to make cash distributions to unitholders and value of our units
.We are dependent upon the earnings and cash flows generated by our operations to meet our debt service obligations and to make cash distributions to our unitholders. The operating and financial restrictions and covenants in our credit agreement and any future financing agreements could restrict our ability to finance future operations or capital needs or to expand or pursue our business activities, which may, in turn, limit our ability to make cash distributions to our unitholders. For example, our credit agreement restricts our ability to, among other things:
incur or guarantee certain additional debt;
make certain cash distributions on or redeem or repurchase certain units;
make certain investments and acquisitions;
make certain capital expenditures;
incur certain liens or permit them to exist;
enter into certain types of transactions with affiliates;
merge or consolidate with another company or otherwise engage in a change of control transaction; and
transfer, sell or otherwise dispose of certain assets.
Our credit agreement also contains covenants requiring us to maintain certain financial ratios and meet certain financial tests. Our ability to meet those financial ratios and financial tests can be affected by events beyond our control, and we cannot guarantee that we will meet those ratios and tests.
The provisions of our credit agreement may affect our ability to obtain future financing and pursue attractive business opportunities as well as affect our flexibility in planning for, and reacting to, changes in business conditions. In addition, a failure to comply with the provisions of our credit agreement could result in a default or an event of default that could enable our lenders to declare the outstanding principal of that debt, together with accrued and unpaid interest, to be immediately due and payable. If we were unable to repay the accelerated amounts, the lenders under our credit agreement could proceed against the collateral granted to them to secure such debt. If the payment of our debt is accelerated, our assets may be insufficient to repay such debt in full, and our unitholders could experience a partial or total loss of their investment. The credit agreement also has cross default provisions that apply to any other indebtedness we may have, and the indentures have cross default provisions that apply to certain other indebtedness.
We may not be able to raise sufficient capital to grow our business.
As of March 1, 2018,4, 2021, we have aggregate unused credit availability under our credit agreement, plus cash on hand, of approximately $139.9 million, although our$248.4 million. Our ability to borrow such funds under our credit facility may be limited by the financial covenants in our credit agreement, and cash on hand of approximately $1.3 million.agreement. Our ability to access the public capital markets on terms acceptable to us or at all may be limited due to, among other things, commodity price volatility and deterioration, general economic conditions, rising interest rates, capital market volatility, the uncertainty of our future cash flows, adverse business developments and other contingencies. In addition, we may have difficulty obtaining a credit rating or any credit rating that we do obtain may be lower than it otherwise would be due to these uncertainties. The lack of a credit rating or a low credit rating may also adversely impact our ability to access capital markets on terms acceptable to us or at all, and may increase significantly the costs of financing our growth potential.
If we fail to raise additional capital or an event of default occurs under our credit agreement, we may be forced to sell assets or take other action that could have a material adverse effect on our business, unit price and results of operations. In addition, if we are unable to access the capital markets for acquisitions or expansion projects on terms acceptable to us or at all, or if the financing cost related to any such acquisitions or expansion projects increases, it may have a material adverse effect on our business, cash flows, ability to make distributions to our unitholders, unit price, results of operations and ability to conduct our business.
If we borrow funds to make any permitted quarterly distributions, our ability to pursue acquisitions and other business opportunities may be limited and our operations may be materially and adversely affected.
Available cash for the purpose of making distributions to unitholders includes working capital borrowings. If we borrow funds to pay one or more quarterly distributions, such amounts will incur interest and must be repaid in accordance with the terms of our credit agreement. In addition, any amounts borrowed for permitted distributions to our unitholders will reduce the
Our revenues from third-party customers are generated under contracts that must be renegotiated periodically and that allow the customer to reduce or suspend performance in some circumstances, which could cause our revenues from those contracts to decline and reduce our ability to make distributions to our unitholders.
Some of our contract-based revenues from customers are generated under contracts with terms which allow the customer to reduce or suspend performance under the contract in specified circumstances, such as the occurrence of a catastrophic event to our or the customer’s operations. The occurrence of an event which results in a material reduction or suspension of our customer’s performance could have a material adverse effect on our financial condition, results of operations and cash flows.
Our contracts with some of our customers have remaining terms of one year or less. As these contracts expire, they must be extended and renegotiated or replaced. We may not be able to extend and renegotiate or replace these contracts when they expire, and the terms of any renegotiated contracts may not be as favorable as the contracts they replace. In particular, our ability to extend or replace contracts could be harmed by numerous competitive factors, such as those described above under “
Certain of our asphalt terminalling services contracts have short remaining terms, and certain leases relating to our asphalt operations may be terminated upon short notice.
As of March 7, 2018,4, 2021, we had leases or storageterminalling agreements with third-party customers relating to eachfor all of our 5653 asphalt facilities. Lease or storage agreements related to 16Approximately 20% of these facilities have terms thatour tank capacity, all with third-parties, will expire by the end of 2018.2021 if not renewed with the current customer or a new customer. We may not be able to renew or extend our existing contracts or enter into new leases or storage agreements when such contracts expire on terms acceptable to us or at all. In addition, certain key customers account for a significant portion of our asphalt terminalling services revenues, the loss of which could result in a significant decrease in revenues from our asphalt operations. A significant decrease in the revenues we receive from our asphalt operations could result in violations of covenants under our credit agreement and could have a material adverse effect on our business, cash flows, ability to make distributions to our unitholders, theunit price, of our units, our results of operations, and ability to conduct our business.
In addition, certain of our asphalt facilities are located on land that we lease from third parties. Some of these leases may be terminated by the lessor with as short as thirty days’ notice. We also have not yet received consent from certain of the lessors to sublease such facilities, which may result in a default under such lease or invalidate the subleases. If such leases were terminated, it could have a material adverse effect on our ability to provide asphalt terminalling services, which could have a material adverse effect on our business, cash flows, ability to make distributions to our unitholders, unit price, results of operations, and ability to conduct our business. In addition, in certain instances we have not entered into new leases with a lessor, although we continue to operate under expired leases and make payments to the lessor and are in the process of negotiating new leases. If it were determined that we did not have rights under these expired leases, it could have a material adverse effect on our ability to conduct our asphalt operations and on our financial condition, results of operations and cash flows.
We aremay not be fully insured against all risks incident to our business and could incur substantial liabilities as a result.
We may not be able to maintain or obtain insurance of the type and amount we desire at reasonable rates. As a result of changing market conditions, premiums and deductibles for certain of our insurance policies may increase substantially in the future. In some instances, certain insurance could become unavailable or available only for reduced amounts of coverage. If we were to incur a significant liability for which we were not fully insured, it could have a material adverse effect on our business, cash flows, ability to make distributions to our unitholders, unit price, results of operations, and ability to conduct our business.
A significant decrease in demand for liquid asphalt and/or crude oil products in the areas served by our operations could reduce our ability to make distributions to our unitholders.
A sustained decrease in demand for liquid asphalt and/or crude oil products in the areas served by our terminalling facilities and pipelines could significantly reduce our revenues and, therefore, reduce our ability to make or increase distributions to our unitholders. Factors that could lead to a decrease in market demand for liquid asphalt and crude oil products include:
A material decrease in the production of liquid asphalt could materially reduce our ability to make distributions to our unitholders.
The throughput at our asphalt facilities depends on the availability of attractively priced liquid asphalt produced from the various liquid asphalt producing refineries. Liquid asphalt production may decline for a number of reasons, including refiners processing more light, sweet crude oil or refiners installing coker units which further refine heavy residual fuel oil bottoms such as liquid asphalt. If our customers are unable to replace volumes lost due to a temporary or permanent material decrease in production from the suppliers of liquid asphalt, our throughput could decline, reducing our revenue and cash flows and adversely affecting our financial condition and results of operations.
If we are unable to make acquisitions on economically acceptable terms, our future growth may be limited.
Our ability to grow in the future will depend, in part, on our ability to make acquisitions that result in an increase in the cash generated per unit from operations. Ergon has indicated that it intends to useviews us as a growth vehicle to pursue the acquisition and expansion of midstream energy businesses and assets.growth. We cannot say with any certainty whether or not Ergon will develop any projects or, if they do, which, if any, of thesepursue future acquisition or expansion opportunities may be made available towith us, or if we will choose to pursue any such opportunity.
We may also make acquisitions directly from third parties. If we are unable to make accretive acquisitions because we are (i) unable to acquire projects from such a development company when they are available; (ii) unable to identify attractive acquisition candidates or negotiate acceptable purchase contracts with them; (iii) unable to obtain financing for these acquisitions on economically acceptable terms; or (iv) outbid by competitors, then our future growth and ability to increase distributions may be limited. Furthermore, even if we do make acquisitions that we believe will be accretive, these acquisitions may nevertheless result in a decrease in the cash generated from operations per unit.
Any acquisition involves potential risks, including, among other things:
mistaken assumptions about volumes, revenues and costs, including synergies;
an inability to integrate successfully the businesses we acquire;
an inability to hire, train or retain qualified personnel to manage and operate our business and assets;
the assumption of unknown liabilities;
limitations on rights to indemnity from the seller;
mistaken assumptions about the overall costs of equity or debt;
the diversion of management’s and employees’ attention from other business concerns;
unforeseen difficulties operating in new product areas or new geographic areas; and
customer or key employee losses at the acquired businesses.
If we consummate any future acquisitions, our capitalization and results of operations may change significantly and our unitholders likely will not have the opportunity to evaluate the economic, financial, and other relevant information that we will consider in determining the application of these funds and other resources.
If we acquire assets that are distinct and separate from our existing terminalling gathering and transportation operations, it could subject us to additional business and operating risks.
We may acquire assets that have operations in new and distinct lines of business from our liquid asphalt or crude oil operations. Integration of a new business is a complex, costly and time-consuming process. Failure to timely and successfully integrate acquired entities’ lines of business with our existing operations may have a material adverse effect on our business, financial condition, results of operations and cash flows. The difficulties of integrating a new business with our existing operations include, among other things:
operating distinct businesses which require different operating strategies and different managerial expertise;
the necessity of coordinating organizations, systems and facilities in different locations;
integrating personnel with diverse business backgrounds and organizational cultures; and
consolidating corporate and administrative functions.
In addition, the diversion of our attention and any delays or difficulties encountered in connection with the integration of a new business, such as unanticipated liabilities or costs, could harm our existing business, results of operations, financial condition, and prospects. Furthermore, new lines of business may subject us to additional business and operating risks. For example, we may in the future determine to acquire businesses that are subject to direct exposure to fluctuations in commodity prices. These new business and operating risks could have a material adverse effect on our financial condition, results of operations and cash flows.
Expanding our business by constructing new assets subjects us to risks that projects may not be completed on schedule and that the costs associated with projects may exceed our expectations and budgets, which could cause our cash available for distribution to our unitholders to be less than anticipated.
The construction of additions or modifications to our existing assets and the construction of new assets involves numerous regulatory, environmental, political, legal, and operational uncertainties and requires the expenditure of significant amounts of capital. If we undertake these types of projects, they may not be completed on schedule or at all or within the budgeted cost. Moreover, we may construct facilities to capture anticipated future growth in demand in a market in which such growth does not materialize.
Our expansion projects may not immediately produce operating cash flows.
Expansion projects require us to make significant capital investments over time and we will incur financing costs during the planning and construction phases of these projects; however, the operating cash flows we expect these projects to generate will not materialize, if at all, until sometime after the projects are completed and placed into service. As a result, to the extent we finance our projects with borrowings, our leverage may increase during the period prior to the generation of those operating cash flows and, to the extent we finance our projects with equity, our cash available for distribution on a common unit basis may decrease during the period prior to the generation of those operating cash flows. If we experience unanticipated or extended delays in generating operating cash flows from construction projects, or if such operating cash flows do not materialize as expected, we may need to reduce or reprioritize our capital budget in order to meet our capital requirements, and our liquidity and capital position could be adversely affected.
Our business involves many hazards and operational risks, including adverse weather conditions, which could cause us to incur substantial liabilities.
Our operations are subject to the many hazards inherent in the transportation and terminalling of crude oil and the terminalling of liquid asphalt cement, including:
explosions, earthquakes, fires and accidents, including road and highway accidents involving our tanker trucks;accidents;
extreme weather conditions, such as hurricanes, which are common in the Gulf Coast, and tornadoes and flooding, which are common in the Midwest and other areas of the United States in which we operate;
damage to our terminals pipelines and equipment;
leaks or releases of crude oilliquid asphalt product into the environment; and
acts of terrorism or vandalism.
If any of these events were to occur, we could suffer substantial losses because of personal injury or loss of life, severe damage to and destruction of property and equipment and pollution or other environmental damage resulting in curtailment or suspension of our related operations. In addition, mechanical malfunctions, faulty measurement or other errors may result in significant costs or lost revenues.
We could be negatively impacted by the outbreak of coronavirus (COVID-19).
In light of the uncertain situation relating to the spread of the coronavirus (COVID-19), this public health concern could pose a risk to our employees, our customers, our vendors and the communities in which we operate, which could negatively impact our business. The extent to which the coronavirus (COVID-19) may impact our business will depend on future developments, which are uncertain and cannot be predicted at this time. We continue to monitor the situation, have actively implemented policies and practices to address the situation, and may adjust our current policies and practices as more information and guidance become available.
We do not own all of the land on which our facilities and pipelines are located, which could disrupt our operations.
We do not own all of the land on which our asphalt and crude oil facilities and pipelines have been constructed, and we are therefore subject to the possibility of more onerous terms and/or increased costs to retain necessary land use if rights-of-way or any material real property leases are invalid, lapse or terminate. We obtain the rights to construct and operate some of our asphalt and crude oil facilities and pipelines on land owned by third parties and governmental agencies for a specific period of time. Our loss of these rights through our inability to renew leases, right-of-way contracts or otherwise could have a material adverse effect on our business, results of operations, financial condition, cash flows and ability to make cash distributions to our unitholders. In addition, we are in the process of obtaining consents from the lessors for certain leased property that was transferred to us as part of the acquisition of our asphalt assets. If any consent is denied, it could have a material adverse effect on our business, results of operations, financial condition, cash flows and our ability to make cash distributions to our unitholders.
Terrorist or cyber-attacks and threats, escalation of military activity in response to these attacks or acts of war could have a material adverse effect on our business, financial condition or results of operations.
Terrorist attacks and threats, cyber-attacks, escalation of military activity or acts of war may have significant effects on general economic conditions, fluctuations in consumer confidence and spending and market liquidity, each of which could materially and adversely affect our business. Terrorist or cyber-attacks, rumors or threats of war, actual conflicts involving the United States or its allies or military or trade disruptions may significantly affect our operations and those of our customers. Strategic targets, such as energy-related assets, may be at greater risk of future attacks than other targets in the United States. We do not maintain specialized insurance for possible exposures resulting from a cyber-attack on our assets that may shut down all or part of our business. Disruption or significant increases in energy prices could result in government-imposed price controls. It is possible that any of these occurrences, or a combination of them, could have a material adverse effect on our business, financial condition and results of operations.
The threat and impact of cyberattacks may adversely impact our operations and could result in information theft, data corruption, operational disruption, and/or financial loss.
We depend on digital technology, including information systems and related infrastructure as well as cloud applications and services, to store, transmit, process, and record sensitive information (including trade secrets, employee information and financial and operating data), communicate with our employees and business partners and for many other activities related to our business. Our business processes depend on the availability, capacity, reliability and security of our information technology infrastructure and our ability to expand and continually update this infrastructure in response to our changing needs and, therefore, it is critical to our business that our facilities and infrastructure remain secure. While we have implemented strategies to mitigate impacts from these types of events, we cannot guarantee that measures taken to defend against cybersecurity threats will be sufficient for this purpose. The ability of the information technology function to support our business in the event of a security breach or a disaster such as fire or flood and our ability to recover key systems and information from unexpected interruptions cannot be fully tested, and there is a risk that, if such an event occurs, we may not be able to address immediately the repercussions of the breach or disaster. In that event, key information and systems may be unavailable for a number of days or weeks, leading to our inability to conduct business or perform some business processes in a timely manner. Moreover, if any of these events were to materialize, they could lead to losses of sensitive information, critical infrastructure, personnel or capabilities essential to our operations and could have a material adverse effect on our reputation, financial condition or results of operations.
Our employees have been and will continue to be targeted by parties using fraudulent “spoof” and “phishing” emails to misappropriate information or to introduce viruses or other malware through “trojan horse” programs to our computers. These emails appear to be legitimate emails but direct recipients to fake websites operated by the sender of the email or request that the recipient send a password or other confidential information through email or download malware. “Spoof” and “phishing” activities are a serious risk that may damage our information technology infrastructure.
If we fail to maintain an effective system of internal controls, we may not be able to accurately report our financial results or prevent fraud. In addition, potential changes in accounting standards might cause us to revise our financial results and disclosure in the future.
Effective internal controls are necessary for us to provide timely and reliable financial reports and effectively prevent fraud. If we cannot provide timely and reliable financial reports or prevent fraud, our reputation and operating results would be harmed. We continue to enhance our internal controls and financial reporting capabilities. These enhancements require a significant commitment of resources, personnel and the development and maintenance of formalized internal reporting procedures to ensure the reliability of our financial reporting. Our efforts to update and maintain our internal controls may not be successful, and we may be unable to maintain adequate controls over our financial processes and reporting now or in the future, including future compliance with the obligations under Section 404 of the Sarbanes-Oxley Act of 2002. Any failure to maintain effective controls or difficulties encountered in the effective improvement of our internal controls could prevent us from timely and reliably reporting our financial results and may harm our operating results. Ineffective internal controls could also cause investors to lose confidence in our reported financial information. In addition, the Financial Accounting Standards Board or the SEC could enact new accounting standards that might affect how we are required to record revenues, expenses, assets and liabilities. Any significant change in accounting standards or disclosure requirements could have a material effect on our business, results of operations, financial condition and ability to comply with our debt obligations.
Ergon controls our General Partner, which has sole responsibility for conducting our business and managing our operations. Our General Partner has conflicts of interest with us and limited fiduciary duties, which may permit it to favor its own interests to the detriment of our unitholders.
Ergon owns and controls our General Partner. Some of our General Partner’s directors are directors and officers of Ergon. Therefore, conflicts of interest may arise between our General Partner, on the one hand, and us and our unitholders, on the other hand. In resolving those conflicts of interest, our General Partner may favor its own interests and the interests of its affiliates over the interests of our unitholders. Although the conflicts committee of the board of directors of our General Partner (the “Board”) may review such conflicts of interest, the Board is not required to submit such matters to the conflicts committee. These conflicts include, among others, the following situations:
Neither our partnership agreement nor any other agreement requires our General Partner or Ergon to pursue a business strategy that favors us. Such persons may make decisions in their best interest, which may be contrary to our interests.
Our General Partner is allowed to take into accountconsider the interests of parties other than us and our unitholders, such as Ergon and its affiliates, in resolving conflicts of interest.
If we do not have sufficient available cash from operating surplus, our General Partner could cause us to use cash from non-operating sources, such as asset sales, issuances of securities and borrowings, to pay distributions, which means that we could make distributions that deteriorate our capital base and that our General Partner could receive distributions on its incentive distribution rights to which it would not otherwise be entitled if we did not have sufficient available cash from operating surplus to make such distributions.
Ergon is a holder of our Preferred Units and may favor its own interests in actions relating to such units, including causing us to make distributions on such units even if no distributions are made on the common units.
Ergon may compete with us, including with respect to future acquisition opportunities.
Ergon may favor its own interests in proposing the terms of any acquisitions we make directly from them, and such terms may not be as favorable as those we could receive from an unrelated third party.
Our General Partner has limited liability and reduced fiduciary duties and our unitholders have restricted remedies available for actions that, without the limitations, might constitute breaches of fiduciary duty.
Our General Partner determines the amount and timing of asset purchases and sales, borrowings, issuance of additional partnership securities and reserves, each of which can affect the amount of cash that is distributed to unitholders.
Our General Partner determines the amount and timing of any capital expenditures and whether a capital expenditure is a maintenance capital expenditure, which reduces operating surplus, or an expansion capital expenditure, which does not reduce operating surplus. This determination can affect the amount of cash that is distributed to our unitholders.
Our General Partner may make a determinationdecide to receive a quantity of our Class B units in exchange for resetting the target distribution levels related to its incentive distribution rights without the approval of the conflicts committee of our General Partner or our unitholders.
Our General Partner determines which costs incurred by it and its affiliates are reimbursable by us.
Our partnership agreement does not restrict our General Partner from causing us to pay it or its affiliates for any services rendered to us or entering into additional contractual arrangements with any of these entities on our behalf.
Our General Partner intends to limit its liability regarding our contractual and other obligations and, in some circumstances, is entitled to be indemnified by us.
Our General Partner may exercise its limited right to call and purchase common units if it and its affiliates own more than 80% of the common units.
Our General Partner controls the enforcement of obligations owed to us by our General Partner and its affiliates.
Our General Partner decides whether to retain separate counsel, accountants or others to perform services for us.
Our partnership agreement limits the fiduciary duties our General Partner owes to holders of our units and restricts the remedies available to holders of our units for actions taken by our General Partner that might otherwise constitute breaches of fiduciary duty.
Our partnership agreement contains provisions that reduce the fiduciary standards to which our General Partner would otherwise be held by state fiduciary duty laws. For example, our partnership agreement:
permits our General Partner to make a number of decisions in its individual capacity, as opposed to in its capacity as our General Partner. This entitles our General Partner to consider only the interests and factors that it desires, and it has no duty or obligation to give any consideration to any interest of, or factors affecting, us, our affiliates or any limited partner. Examples include the exercise of its right to receive a quantity of our Class B units in exchange for resetting the target distribution levels related to its incentive distribution rights, the exercise of its limited call right, the exercise of its rights to transfer or vote the units it owns, the exercise of its registration rights and its determination whether or not to consent to any merger or consolidation of the partnership or amendment to the partnership agreement;
provides that our General Partner will not have any liability to us or our unitholders for decisions made in its capacity as a general partner so long as it acted in good faith, meaning it believed the decision was in the best interests of our partnership;
generally provides that affiliated transactions and resolutions of conflicts of interest not approved by the conflicts committee of the Board acting in good faith and not involving a vote of unitholders must be on terms no less favorable to us than those generally being provided to or available from unrelated third parties or must be “fair and reasonable” to us, as determined by our General Partner in good faith. In determining whether a transaction or resolution is “fair and reasonable,” our General Partner may consider the totality of the relationships between the parties involved, including other transactions that may be particularly advantageous or beneficial to us;
provides that our General Partner and its officers and directors will not be liable for monetary damages to us, our limited partners or assignees for any acts or omissions unless there has been a final and non-appealable judgment entered by a court of competent jurisdiction determining that our General Partner or its officers and directors acted in bad faith or engaged in fraud or willful misconduct or, in the case of a criminal matter, acted with knowledge that the conduct was criminal; and
provides that in resolving conflicts of interest, it will be presumed that in making its decision, our General Partner acted in good faith, and in any proceeding brought by or on behalf of any limited partner or us, the person bringing or prosecuting such proceeding will have the burden of overcoming such presumption.
By purchasing a common unit, a common unitholder will become bound by the provisions in the partnership agreement, including the provisions discussed above.
Ergon may compete with us, which could adversely affect our existing business and limit our ability to acquire additional assets or businesses.
Neither our partnership agreement nor any other agreement with Ergon prohibits Ergon from owning assets or engaging in businesses that compete directly or indirectly with us. In addition, Ergon may acquire, construct or dispose of assets in the future, without any obligation to offer us the opportunity to purchase or construct any of those assets. Ergon is a privately held company engaged in a wide range of operations. Ergon has significantly greater resources and experience than we have, which may make it more difficult for us to compete with Ergon with respect to commercial activities as well as for acquisition candidates. As a result, competition from Ergon could adversely impact our results of operations and cash available for distribution.
Cost reimbursements due to our General Partner and its affiliates for services provided, which are determined by our General Partner, may be substantial and will reduce our cash available for distribution to our unitholders.
Pursuant to our partnership agreement, our General Partner is entitled to receive reimbursement for the payment of expenses related to our operations and for the provision of various general and administrative services for our benefit. Payments for these services may be substantial and reduce the amount of cash available for distribution to unitholders. In addition, under Delaware partnership law, our General Partner has unlimited liability for our obligations, such as our debts and environmental liabilities, except for our contractual obligations that are expressly made without recourse to our General Partner. To the extent our General Partner incurs obligations on our behalf, we are obligated under our partnership agreement to reimburse or indemnify our General Partner. If we are unable or unwilling to reimburse or indemnify our General Partner, our General Partner may take actions to cause us to make payments of these obligations and liabilities. Any such payments would reduce the amount of cash otherwise available for distribution to our unitholders.
Holders of our Preferred Units and common units have limited voting rights and are not entitled to elect our General Partner or its directors.
Unlike the holders of common stock in a corporation, unitholders have only limited voting rights on matters affecting our business and, therefore, limited ability to influence management’s decisions regarding our business. Unitholders did not elect our General Partner or the Board and have no right to elect our General Partner or the Board on an annual or other continuing basis. The Board is chosen by Ergon. Furthermore, if the unitholders are dissatisfied with the performance of our General Partner, they have little ability to remove our General Partner. Amendments to our partnership agreement may be proposed only by or with the consent of our General Partner. As a result of these limitations, the price at which the common units will trade could be diminished because of the absence or reduction of a takeover premium in the trading price.
Control of our General Partner may be transferred to a third party without unitholder consent.
Our General Partner may transfer its general partner interest to a third party in a merger or in a sale of all or substantially all of its assets without the consent of the unitholders. Furthermore, our partnership agreement does not restrict the ability of Ergon, the owner of our General Partner, from transferring all or a portion of its ownership interest in our General Partner to a third party. The new owner of our General Partner would then be in a position to replace the Board and officers of our General Partner with its own choices and thereby influence the decisions made by the Board and officers.
We may issue additional units without approval of our unitholders, which would dilute our unitholders’ ownership interests.
Except in the case of the issuance of units that rank equal to or senior to the Preferred Units, our partnership agreement does not limit the number or price of additional limited partner interests we may issue at any time without the approval of our unitholders. In addition, because we are a limited partnership, we will not be subject to the shareholder approval requirements relating to the issuance of securities (other than in connection with the establishment or material amendment of a stock option or purchase plan or the making or material amendment of any other equity compensation arrangement) contained in Nasdaq Marketplace Rule 5635. The issuance by us of additional common units or other equity securities of equal or senior rank may have any or all of the following effects, among others:
Our unitholders’ proportionate ownership interest in us will decrease.
The amount of cash available for distribution on each unit may decrease.
The ratio of taxable income to distributions may increase.
The relative voting strength of each previously outstanding unit may be diminished.
The market price of the common units may decline.
Our partnership agreement restricts the voting rights of unitholders, other than our General Partner and its affiliates, including Ergon, owning 20% or more of any class of our partnership securities.
Unitholders’ voting rights are further restricted by the partnership agreement, which provides that any units held by a person that owns 20% or more of any class of units then outstanding, other than our General Partner, its affiliates, their transferees and persons who acquired such units with the prior approval of the Board, cannot vote on any matter. Our partnership agreement also contains provisions limiting the ability of unitholders to call meetings or to acquire information about our operations, as well as other provisions.
Even if our public unitholders are dissatisfied with our General Partner, it will be difficult for them to remove our General Partner without its consent.
It will be difficult for our public unitholders to remove our General Partner without its consent because our General Partner and its affiliates own a substantial number of our units. The vote of the holders of at least 66
2/3Affiliates of our General Partner may sell units in the public markets, which sales could have an adverse impact on the trading price of the units.
As of March 1, 2018,4, 2021, the executive officers and directors of our General Partner beneficially own an aggregate of 1,037,212465,712 common units and 20,400 Preferred Units and Ergon owns 3,049,1872,795,837 common units and 18,312,96820,801,757 Preferred Units. The sale of these units in the public markets could have an adverse impact on the public trading price of the units or on any trading market that may develop.
Our General Partner has a limited call right that may require our unitholders to sell their units at an undesirable time or price.
If at any time our General Partner and its affiliates own more than 80% of any class of units then outstanding, our General Partner will have the right, but not the obligation, which it may assign to any of its affiliates or to us, to acquire all, but not less than all, of such class of units held by unaffiliated persons at a price not less than the then-current market price. As a result, our unitholders may be required to sell their units at an undesirable time or price and may not receive any return on their investment. Our unitholders also may incur a tax liability upon a sale of their units. As of March 1, 2018,4, 2021, Ergon owned 52.1%59.2% of our outstanding Preferred Units.
Holders of our Preferred Units have a distribution preference and a liquidation preference, which may adversely impact the value of our common units.
The Preferred Units rank prior to our common units as to both distributions of available cash and distributions upon liquidation. Holders of our Preferred Units are entitled to preferred quarterly distributions of $0.17875$0.17875 per unit per quarter (or $0.7150$0.715 per unit on an annual basis). If we fail to pay in full any distribution on our Preferred Units, the amount of such unpaid distribution will accrue and accumulate from the last day of the quarter for which such distribution is due until paid in full. If we are liquidated, we may not have sufficient funds remaining after payment of amounts to our creditors and to holders of our Preferred Units to make any distribution to holders of our common units.
The conversion rate applicable to the Preferred Units will not be adjusted for all events that may be dilutive.
The number of our common units issuable upon conversion of the Preferred Units is subject to adjustment only for subdivisions, splits or certain combinations of our common units. The number of common units issuable upon conversion is not subject to adjustment for other events, such as employee option grants, offerings of our common units for cash or in connection with acquisitions or other transactions that may increase the number of outstanding common units and dilute the ownership of existing common unitholders. The terms of the Preferred Units do not restrict our ability to offer common units in the future or to engage in other transactions that could dilute our common units.
We have rights to require our preferred unitholders to convert their Preferred Units into common units, and we may exercise this mandatory conversion right at an undesirable time.
We have the right in certain circumstances to force the conversion of all outstanding Preferred Units to common units. These circumstances include a situation in which if the holders of a certain number of Preferred Units elect to convert the Preferred Units that they hold to common units, we could then force all remaining outstanding Preferred Units to convert to common units. Ergon, the owner of our General Partner, owns enough Preferred Units such that if they were all converted to common units, we would be able to exercise this mandatory conversion right. In addition, we also have the right effective October 25, 2015, to force the conversion of the outstanding Preferred Units at any time if (i) the daily volume-weighted average trading price of our common units is greater than $8.45 for 20 out of the trailing 30 trading days ending two trading days before we furnish notice of conversion and (ii) the average trading volume of our common units has exceeded 20,000 common units for 20 out of the trailing 30 trading days ending two trading days before we furnish notice of conversion. In addition, the conversion provisions may be modified with the consent of a majority of the outstanding Preferred Units. As of March 1, 2018,4, 2021, Ergon owned 52.1%59.2% of our outstanding Preferred Units and has the ability to consent to amendments to such conversion provisions. As a result, our preferred unitholders may be required to convert their Preferred Units at an undesirable time and may not receive their expected return on investment.
Ergon, as the holder of a majority of the outstanding Preferred Units, has the ability to consent to the amendments to the provisions of the Preferred Units.
The Preferred Units have voting rights that are identical to the voting rights of common units and vote with the common units as a single class, so that each Preferred Unit is entitled to one vote for each common unit into which such Preferred Unit is convertible on each matter with respect to which each common unit is entitled to vote. In addition, the approval of a majority of the Preferred Units, voting separately as a class, is necessary on any matter that adversely affects any of the rights of the Preferred Units or amends or modifies the terms of the Preferred Units in any material respect or affects the holders of the Preferred Units disproportionately in relation to the holders of common units, including, without limitation, any action that would (i) reduce the distribution amount to the Preferred Units or change the time or form of payment of distributions, (ii) reduce the amount payable to the Preferred Units upon the liquidation of our partnership, (iii) modify the conditions relating to the conversion of the Preferred Units or (iv) issue any equity security that, with respect to distributions or rights upon liquidation, ranks equal to or senior to the Preferred Units or issue any additional Preferred Units. As of March 1, 2018,4, 2021, Ergon owned 52.1%59.2% of our outstanding Preferred Units and has the ability to consent to amendments to the terms of the Preferred Units without the consent of other unitholders.
Holders of the Preferred Units will not have rights to distributions as holders of common units until they acquire our common units.
Until our preferred unitholders acquire common units upon conversion of the Preferred Units, such preferred unitholders will have no rights with respect to distributions on our common units. Upon conversion, our preferred unitholders will be entitled to exercise the rights of a holder of our common units only as to matters for which the record date occurs after the date on which such Preferred Units were converted to our common units.
The Preferred Units are limited partner interests in our partnership and therefore are subordinate to any indebtedness.
The Preferred Units are limited partner interests in our partnership and do not constitute indebtedness. As such, the Preferred Units will rank junior to all indebtedness and other non-equity claims on our partnership with respect to assets available to satisfy claims on our partnership, including in a liquidation of our partnership.
Market interest rates may affect the value of our units.
One of the factors that will influence the price of our units will be the distribution yield on our units relative to market interest rates. An increase in market interest rates could cause the market price of the units to go down. The trading price of the units will also depend on many other factors, which may change from time to time, including:
the market for similar securities;
government action or regulation;
general economic conditions or conditions in the financial markets; and
our financial condition, performance and prospects.
Our unitholders’ liability may not be limited if a court finds that unitholder action constitutes control of our business.
A general partner of a partnership generally has unlimited liability for the obligations of the partnership, except for those contractual obligations of the partnership that are expressly made without recourse to the general partner. Our partnership is organized under Delaware law and we conduct business in a number of other states. The limitations on the liability of holders of limited partner interests for the obligations of a limited partnership have not been clearly established in some of the other states in which we do business.
Our unitholders could be liable for our obligations as if they were a general partner if:
a court or government agency determined that we were conducting business in a state but had not complied with that particular state’s partnership statute; or
a unitholder’s right to act with other unitholders to remove or replace the general partner, to approve some amendments to our partnership agreement or to take other actions under our partnership agreement constitute “control” of our business.
Unitholders may have liability to repay distributions that were wrongfully distributed to them.
Under certain circumstances, unitholders may have to repay amounts wrongfully returned or distributed to them. Under Section 17-607 and 17-804 of the Delaware Revised Uniform Limited Partnership Act, we may not make a distribution to our unitholders if the distribution would cause our liabilities to exceed the fair value of our assets. Delaware law provides that for a period of three years from the date of the impermissible distribution, limited partners who received the distribution and who knew at the time of the distribution that it violated Delaware law will be liable to the limited partnership for the distribution amount. Substituted limited partners are liable for the obligations of the assignor to make contributions to the partnership that are known to the substituted limited partner at the time it became a limited partner and for unknown obligations if the liabilities could be determined from the partnership agreement. Liabilities to partners on account of their partnership interests and liabilities that are non-recourse to the partnership are not counted for purposes of determining whether a distribution is permitted.
Tax Risks to Unitholders
Our tax treatment depends on our status as a partnership for federal income tax purposes, as well as us not being subject to a material amount of entity-level taxation by individual states. If the IRS were to treat us as a corporation, or if we were to become subject to a material amount of entity-level taxation for state tax purposes, then our cash available for distribution to our unitholders would be substantially reduced.
The anticipated after-tax economic benefit of an investment in our common units depends largely on us being treated as a partnership for federal income tax purposes. If less than 90% of the gross income of a publicly traded partnership, such as us, for any taxable year is “qualifying income” from sources such as the transportation, marketing (other than to end users) or processing of crude oil, natural gas or products thereof, interest, dividends or similar sources, that partnership will be taxable as a corporation under Section 7704 of the Internal Revenue Code for federal income tax purposes for that taxable year and all subsequent years. We have not requested and do not plan to request a ruling from the IRS with respect to our treatment as a partnership for federal income tax purposes.
If we were treated as a corporation for federal income tax purposes, then we would pay federal income tax on our taxable income at the corporate tax rate, which is currently a maximum of 21%, and would likely pay additional state income tax at varying rates. Distributions would generally be taxed again to unitholders as corporate distributions and none of our income, gains, losses, deductions or credits would flow through to our unitholders. Because a tax would be imposed upon us as a corporation, cash available for distribution to our unitholders would be substantially reduced. Therefore, treatment of us as a corporation would result in a material reduction in the anticipated cash flows and after-tax return to unitholders and thus would likely result in a substantial reduction in the value of our units.
In addition, changes to the audit procedures for large partnerships and in certain circumstances for tax years beginning after 2017 would permit the IRS to assess and collect taxes (including any applicable penalties and interest) resulting from partnership-level federal income tax audits directly from us in the year in which the audit is completed. If we are required to make payments of taxes, penalties and interest resulting from audit adjustments, our cash available for distribution to our unitholders might be substantially reduced. Moreover, changes in current state or local law may subject us to additional entity-level taxation by individual states. Because of widespread state budget deficitsstates and other reasons, several states are evaluating ways to subject partnerships to entity-level taxation through the imposition of state income, franchise and other forms of taxation. For example, we are required to pay annually a Texas franchise tax on our total revenue, as adjusted and apportioned to the state under the applicable Texas rules and regulations, at a maximum effective tax rate of 0.525%.localities. Imposition of such a tax on us by Texas and, if applicable, by any other state willmay reduce the cash available for distribution to our unitholders.
Our partnership agreement provides that if a law is enacted or an existing law is modified or interpreted in a manner that subjects us to taxation as a corporation or otherwise subjects us to entity-level taxation for federal, state or local income tax purposes, the minimum quarterly distribution amount and the target distribution amounts will be adjusted to reflect the impact of that law on us. No such adjustments have been made to date, but there can be no assurance that no such adjustments will be made in the future.
The tax treatment of publicly traded partnerships or an investment in our common units could be subject to potential legislative, judicial or administrative changes and differing interpretations, possibly on a retroactive basis.
The present federal income tax treatment of publicly traded partnerships, including us or an investment in our common units, may be modified by administrative, legislative or judicial interpretation at any time. Any modification to the federal income tax laws and interpretations thereof may or may not be applied retroactively. Moreover, any such modification could make it more difficult or impossible for us to meet the exception which allows publicly traded partnerships that generate qualifying income to be treated as partnerships (rather than corporations) for U.S. federal income tax purposes, affect or cause us to change our business activities or affect the tax consequences of an investment in our common units. For example,From time to time, members of Congress have proposed and considered substantive changes to existing federal income tax laws that would affect the tax treatment of certain publicly traded partnerships. We are unable to predict whether any of these changes or other proposals will ultimately be enacted. Any such changes could negatively impact the value of an investment in our units.
Our unitholders have been and will be required to pay taxes on their share of our taxable income even if they have not received or do not receive any cash distributions from us.
Because our unitholders are treated as partners to whom we allocate taxable income which could be different in amount than the cash we distribute, our unitholders will be required to pay any federal income taxes and, in some cases, state and local income taxes, on their share of our taxable income, even if our unitholders receive no cash distributions from us. Our unitholders may not receive cash distributions from us equal to their share of our taxable income or even equal to the actual tax liability that results from that income.
If the IRS contests any of the federal income tax positions we take, the market for our common units may be adversely affected, and the costs of any such contest will reduce our cash available for distribution to our unitholders.
We have not requested a ruling from the IRS with respect to our treatment as a partnership for federal income tax purposes or any other matter affecting us. The IRS may adopt positions that differ from the conclusions of our counsel or from the positions we take. It may be necessary to resort to administrative or court proceedings to sustain some or all of our counsel’s conclusions or the positions we take. A court may not agree with some or all of our counsel’s conclusions or the positions we take. Any contest with the IRS may materially and adversely impact the market for our units and the price at which they trade. In addition, the costs of any contest with the IRS will be borne indirectly by our unitholders and our General Partner because the costs will reduce our cash available for distribution.
There are limits on the deductibility of losses that may adversely affect unitholders.
In the case of taxpayers subject to the passive activity loss rules (generally individuals, closely-held corporations and regulated investment companies), any losses generated by us will only be available to offset our future income and cannot be used to offset income from other activities, including other passive activities or investments. Unused losses may be deducted when the unitholder disposes of the unitholder’s entire investment in us in a fully taxable transaction with an unrelated party. A unitholder’s share of our net passive income may be offset by unused losses from us carried over from prior years, but not by losses from other passive activities, including losses from other publicly traded partnerships.
Other limitations described above, non-corporate taxpayers may only deduct business losses up to the gross income or gain attributable to such trade or business plus $250,000 ($500,000 for unitholders filing jointly). Amounts that may not be deductedfurther restrict the deductibility of our losses by a unitholder include the at-risk rules and the prohibition against loss allocations in a taxable yearexcess of the unitholder’s tax basis in its units.
Unitholders may be carried forward intosubject to limitation on their ability to deduct interest expense incurred by us.
Under the following taxable year. This limitation shall be applied afterTax Cuts and Jobs Act, as modified by the passive loss limitationsCoronavirus Aid, Relief and unless amended, applies only toEconomic Security Act, for taxable years beginning prior toafter December 31, 2025.
For purposes of this limitation, our unitholders and will be available to offset our future excessadjusted taxable income allocated to such unitholders. A unitholder’s tax basis in our interests will be reduced by the amount of disallowed interest deductions allocated to such unitholder, even if such amounts do not give rise to a deduction to the unitholder in that taxable year. Such unitholder’s tax basis in its partnership interests will be subsequently increased immediately prioris computed without regard to any disposition by such unitholder of itsbusiness interest in us in an amount equal to the difference between the prior basis reduction and the amount of the disallowed interest that has subsequently been used to offset excess taxable income of the unitholder.
Tax gain or loss on the disposition of our common units could be more or less than expected.
If our unitholders sell their units, they will recognize a gain or loss equal to the difference between the amount realized and their tax basis in those units. Because distributions to a unitholder that exceed the total net taxable income allocated to the unitholder decrease the unitholder’s tax basis in his or her units, any such prior excess distribution will, in effect, become taxable income to the unitholder if the common units are sold by the unitholder at a price greater than their tax basis, even if the price the unitholder receives is less than the original cost. Furthermore, a substantial portion of the amount realized, whether or not representing gain, may be taxed as ordinary income to the selling unitholder due to potential recapture items, including depreciation recapture. In addition, because the amount realized includes a unitholder’s share of our non-recourse liabilities, a unitholder who sells common units may incur a tax liability in excess of the amount of cash received from the sale.
If the IRS makes audit adjustments to our income tax returns for tax years beginning after 2017, it may collect any resulting taxes (including any applicable penalties and interest) directly from us, in which case our cash available for distribution to our unitholders might be substantially reduced.
If the IRS makes audit adjustments to income tax returns for tax years beginning after 2017, it may assess and collect taxes (including any applicable penalties and interest) directly from us in the year in which the audit is completed. If we are required to make payments of taxes, penalties and interest resulting from audit adjustments, our cash available for distribution to our unitholders might be substantially reduced. In addition, because payment would be due for the taxable year in which the audit is completed, unitholders during that taxable year would bear the expense of the adjustment even if they were not unitholders during the audited taxable year.
Tax-exempt entities and non-United States persons face unique tax issues from owning units that may result in adverse tax consequences to them.
Investment in our units by tax-exempt entities, such as individual retirement accounts (known as IRAs), pension plans and non-U.S. persons raises issues unique to them. For example, virtually all of our income allocated to organizations exempt from federal income tax, including individual retirement accounts and other retirement plans, will be unrelated business taxable income and will be taxable to them. Distributions to non-U.S. persons will be reduced by withholding taxes at the highest applicable effective tax rate, and non-U.S. persons will be required to file U.S. federal income tax returns and pay tax on their share of our taxable income. If a potential unitholder is a tax-exempt entity or a non-U.S. person, it should consult its tax advisor before investing in our units.
We will treat each purchaser of our common units as having the same tax benefits without regard to the specific common units purchased. The IRS may challenge this treatment, which could adversely affect the value of the common units.
Because we cannot match transferors and transferees of common units and because of other reasons, we will adopt depreciation and/or amortization positions that may not conform with all aspects of existing Treasury regulations. A successful IRS challenge to those positions could adversely affect the amount of tax benefits available to our unitholders. It also could affect the timing of these tax benefits or the amount of gain from their sale of common units and could have a negative impact on the value of our common units or result in audit adjustments to our unitholders’ tax returns.
Our unitholders likely will be subject to state and local taxes and return filing or withholding requirements in states in which they do not live as a result of investing in our units.
In addition to federal income taxes, our unitholders will likely be subject to other taxes, such as state and local income taxes, unincorporated business taxes and estate, inheritance or intangible taxes that are imposed by the various jurisdictions in which we conduct business or own property. Our unitholders may be required to file state and local income tax returns and pay state and local income taxes in certain of these various jurisdictions. Further, our unitholders may be subject to penalties for failure to comply with those requirements. We currently own property and conduct business in several states, most of which currently impose income taxes on corporations, and many of which impose income taxes on other entities and nonresident individuals. We may own property or conduct business in other states or foreign countries in the future. It is each unitholder’s responsibility to file all federal, state, local and foreign tax returns. Under the tax laws of some states where we conduct business, we may be required to withhold a percentage from amounts to be distributed to a unitholder who is not a resident of that state. For example, in the case of Oklahoma, we are required to either obtain a withholding exemption affidavit from and generally report detailed tax information about our non-Oklahoma resident unitholders or withhold an amount equal to 5% of the portion of our distributions to unitholders which is deemed to be the Oklahoma share of our income.
We hold certain assets located at certain of our liquid asphalt facilities in a subsidiary taxed as a corporation. Such subsidiary is subject to entity-level federal and state income taxes on its net taxable income and, if a material amount of entity-level taxes were incurred, then our cash available for distribution to our unitholders could be substantially reduced.
We hold certain of our liquid asphalt processing assets and related fee income through BKEP Asphalt, L.L.C., a subsidiary taxed as a corporation. Such subsidiary is required to pay federal income tax on its income at the corporate tax rate, which is currently a maximum of 21%, and will likely pay state (and possibly local) income tax at varying rates. Distributions from such subsidiary will generally be taxed againWe may elect to unitholders asconduct additional operations in corporate distributions and none ofform in the income, gains, losses, deductions or credits of such subsidiary will flow through to our unitholders. Currently, the maximum federal income tax rate applicable to dividend income from such subsidiary which is allocable to individuals is 20% plus an unearned Medicare tax of 3.8%. An individual unitholder’s share of dividend and interest income from such subsidiary would constitute portfolio income which could not be offset by the unitholder’s share of our other losses or deductions.future. If a material amount of entity-levelcorporate-level taxes is incurred by such a subsidiary, then our cash available for distribution to our unitholders could be substantially reduced.
We prorate our items of income, gain, loss and deduction between transferors and transferees of our common units each month based upon the ownership of our common units on the first day of each month, instead of on the basis of the date a particular common unit is transferred. The IRS may challenge this treatment, which could change the allocation of items of income, gain, loss and deduction among our common unitholders.
We prorate our items of income, gain, loss and deduction between transferors and transferees of our common units each month based upon the ownership of our common units on the first day of each month, instead of on the basis of the date a particular unit is transferred. The use of this proration method may not be permitted under existing Treasury regulations. The U.S. Department of the Treasury and the IRS issued final Treasury regulations pursuant to which a publicly traded partnership may use a similar monthly simplifying convention to allocate tax items among transferor and transferee unitholders, although such tax items must be prorated on a daily basis. However, these Treasury regulations do not specifically authorize the use of the proration method we have adopted. If the IRS were to successfully challenge our proration method, we may be required to change the allocation of items of income, gain, loss and deduction among our unitholders.
A unitholder whose units are loaned to a “short seller” to effect a short sale of units may be considered as having disposed of those units. If so, such unitholder would no longer be treated for tax purposes as a partner with respect to those units during the period of the loan and may recognize gain or loss from the disposition.
Because a unitholder whose units are loaned to a “short seller” to effect a short sale of units may be considered as having disposed of the loaned units, such unitholder may no longer be treated for tax purposes as a partner with respect to those units during the period of the loan to the short seller and the unitholder may recognize gain or loss from such disposition. Moreover, during the period of the loan to the short seller, any of our income, gain, loss or deduction with respect to those units may not be reportable by the unitholder, and any cash distributions received by the unitholder as to those units could be fully taxable as ordinary income. Unitholders desiring to assure their status as partners and avoid the risk of gain recognition from a loan to a short seller are urged to consult a tax advisor to discuss whether it is advisable to modify any applicable brokerage account agreements to prohibit their brokers from borrowing their units.
Unitholders converting Preferred Units into common units could under certain limited circumstances receive a gross income allocation that may materially increase the taxable income allocated to such unitholders.
Under our partnership agreement and in accordance with Treasury regulations, immediately after the conversion of a Preferred Unit, we will adjust the capital accounts of all of our partners to reflect any positive difference (“Unrealized Gain”) or negative difference (“Unrealized Loss”) between the fair market value and the carrying value of our assets at such time as if such Unrealized Gain or Unrealized Loss had been recognized on an actual sale of each such asset for an amount equal to its fair market value at the time of such conversion. Such Unrealized Gain or Unrealized Loss (or items thereof) will be allocated first to the converting preferred unitholder in respect to common units received upon the conversion until the capital account of each such common unit is equal to the per unit capital account for each existing common unit. This allocation of Unrealized Gain or Unrealized Loss will not be taxable to the converting preferred unitholder or to any other unitholders. If the Unrealized Gain or Unrealized Loss allocated as a result of the conversion of a Preferred Unit is not sufficient to cause the capital account of each common unit received upon such conversion to equal the per unit capital account for each existing common unit, then capital account balances will be reallocated among the unitholders as needed to produce this result. In the event that such a reallocation is needed, a converting preferred unitholder would be allocated taxable gross income in an amount equal to the amount of any such reallocation to it.
We may adopt certain valuation methodologies and monthly conventions for federal income tax purposes that may result in a shift of income, gain, loss or deduction between our General Partner and our common unitholders. The IRS may challenge this treatment, which could adversely affect the value of our outstanding units.
When we issue additional units or engage in certain other transactions, we will determine the fair market value of our assets and allocate any unrealized gain or loss attributable to our assets to the capital accounts of our common unitholders and our General Partner. Our methodology may be viewed as understating the value of our assets. In that case, there may be a shift of income, gain, loss or deduction between certain common unitholders and our General Partner, which may be unfavorable to such unitholders. Moreover, under our valuation methods, subsequent purchasers of units may have a greater portion of their Internal Revenue Code Section 743(b) adjustment allocated to our tangible assets and a lesser portion allocated to our intangible assets. The IRS may challenge our valuation methods, or our allocation of the Section 743(b) adjustment attributable to our tangible and intangible assets, and allocations of taxable income, gain, loss or deduction between our General Partner and certain of our common unitholders.
A successful IRS challenge to these methods or allocations could adversely affect the amount of taxable income or loss being allocated to our common unitholders. It also could affect the amount of taxable gain from our unitholders’ sale of units and could have a negative impact on the value of the units or result in audit adjustments to our unitholders’ tax returns without the benefit of additional deductions.
Compliance with and changes in tax law could adversely affect our performance.
We are subject to extensive tax laws and regulations, including federal and state income taxes and transactional taxes such as excise, sales/use, payroll, franchise and ad valorem taxes. New tax laws and regulations and changes in existing tax laws and regulations are continuously being enacted that could result in increased tax expenditures in the future. Many of these tax liabilities are subject to audits by the respective taxing authority. These audits may result in additional taxes as well as interest and penalties.
None.
A description of our properties is contained in “Item 1-Business.”
Title to Properties
Our asphalt assets are on real property owned or leased by us. Some of the real property leases that were transferred to us as part of the acquisition of our asphalt assets required the consent of the counterparty to such lease. In certain instances, we have not entered into new leases with a lessor although we continue to use such leases and make payments to the lessor and are in the process of negotiating new leases.
Other than as described above, we believe that we have satisfactory title to or rights in all of our assets. Although title or rights to such properties is subject to encumbrances in certain cases, such as customary interests generally retained in connection with acquisition of real property, liens related to environmental liabilities associated with historical operations, liens for current taxes and other burdens and minor easements, restrictions and other encumbrances to which the underlying properties were subject at the time of acquisition by our predecessor or us, we believe that none of these burdens will materially interfere with their use in the operation of our business.
The information required by this item is included under the caption “Commitments and Contingencies” in Note 1715 to our consolidated financial statements and is incorporated herein by reference thereto.
Not applicable.
Market for Registrant’s Common Equity, Related Unitholder Matters and Issuer Purchases of Equity Securities. |
Our common units are traded on the Nasdaq Global Market under the symbol “BKEP” and our Preferred Units are traded on the Nasdaq Global Market under the symbol “BKEPP”.
On March 1, 2018,4, 2021, there were 40,310,27241,468,125 common units outstanding, held by approximately 904695 unitholders of record and 35,125,202 Preferred Units outstanding held by approximately 31 unitholders of record. The actual number of unitholders is greater than the number of holders of record. Ergon holds 7.6%6.7% of the common units and 52.1%59.2% of the Preferred Units.
| Common Units | Low | High | Cash Distribution per Unit | ||||||||
| 2016: | |||||||||||
| First Quarter | $ | 3.81 | $ | 5.77 | $ | 0.1450 | |||||
| Second Quarter | 4.56 | 5.61 | 0.1450 | ||||||||
| Third Quarter | 5.07 | 6.50 | 0.1450 | ||||||||
| Fourth Quarter | 5.72 | 7.00 | 0.1450 | ||||||||
| 2017: | |||||||||||
| First Quarter | $ | 6.55 | $ | 7.55 | $ | 0.1450 | |||||
| Second Quarter | 6.17 | 7.35 | 0.1450 | ||||||||
| Third Quarter | 5.30 | 6.45 | 0.1450 | ||||||||
| Fourth Quarter | 4.65 | 5.95 | 0.1450 | ||||||||
| Preferred Units | |||||||||||
| 2016: | |||||||||||
| First Quarter | $ | 5.71 | $ | 7.13 | $ | 0.17875 | |||||
| Second Quarter | 4.56 | 5.61 | 0.17875 | ||||||||
| Third Quarter | 6.84 | 8.75 | 0.17875 | ||||||||
| Fourth Quarter | 7.60 | 8.39 | 0.17875 | ||||||||
| 2017: | |||||||||||
| First Quarter | $ | 7.62 | $ | 8.20 | $ | 0.17875 | |||||
| Second Quarter | 7.71 | 8.52 | 0.17875 | ||||||||
| Third Quarter | 7.28 | 8.05 | 0.17875 | ||||||||
| Fourth Quarter | 7.35 | 7.98 | 0.17875 | ||||||||
Distributions of Available Cash
Our partnership agreement requires that, within 45 days after the end of each quarter, we distribute all of our available cash (as defined in our partnership agreement) to unitholders of record on the applicable record date.
Available cash, for any quarter, consists of all cash on hand at the end of that quarter:
less the amount of cash reserves established by our General Partner to:
◦ | provide for the proper conduct of our business; |
◦ | comply with applicable law, any of our debt instruments or other agreements; or |
◦ | provide funds for distributions to our unitholders for any one or more of the next four quarters; |
plus all additional cash and cash equivalents on hand on the date of determination of available cash for the quarter resulting from working capital borrowings made after the end of the quarter. Working capital borrowings are generally borrowings that are made under a credit facility, commercial paper facility or similar financing arrangement, and in all cases are used solely for working capital purposes or to pay distributions to partners and with the intent of the borrower to repay such borrowings within 12 months.
Pursuant to our credit agreement, we are permitted to make quarterly distributions of available cash to unitholders so long as no default exists under the credit agreement on a pro forma basis after giving effect to such distribution.
Our partnership agreement requires that we make distributions of available cash from operating surplus for any quarter in the following manner:
first, 98.4% to the holders of Preferred Units, pro rata, and 1.6% to our General Partner, until we distribute for each outstanding Preferred Unit an amount equal to the Series A Quarterly Distribution Amount (as defined in the partnership agreement) for that quarter;quarterly distribution amount discussed below;
second, 98.4% to the holders of Preferred Units, pro rata, and 1.6% to our General Partner, until we distribute for each outstanding Preferred Unit an amount equal to any arrearages in the payment of the Series A Quarterly Distribution Amountquarterly distribution amount for any prior quarters;
third, 98.4% to all common unitholders and Class B unitholders (if any), pro rata, and 1.6% to our General Partner, until we distribute for each outstanding common and Class B unit an amount equal to the minimum quarterly distribution of $0.11 per unit for that quarter; and
thereafter, in the manner described in “-General“General Partner Interest and Incentive Distribution Rights” below.
The Preferred Units are convertible at the holders’ option into common units. Holders of the Preferred Units are entitled to quarterly distributions of $0.17875 per unit per quarter. If the Partnership fails to pay in full any distribution on the Preferred Units, the amount of such unpaid distribution will accrue and accumulate from the last day of the quarter for which such distribution is due until paid in full. The preceding discussion is based on the assumptions that our General Partner maintains its 1.6% general partner interest and that we do not issue additional classes of equity securities.
The following discussion assumes that our General Partner maintains its approximate 1.6% general partner’s interest and continues to own the incentive distribution rights.
Our partnership agreement provides that our General Partner will be entitled to approximately 1.6% of all distributions that we make prior to our liquidation. Our General Partner has the right, but not the obligation, to contribute a proportionate amount of capital to us to maintain its approximate 1.6% general partner interest if we issue additional units. Our General Partner’s approximate 1.6% interest, and the percentage of our cash distributions to which it is entitled, will be proportionately reduced if we issue additional units in the future (other than the issuance of partnership securities issued in connection with a reset of the incentive distribution target levels relating to our General Partner’s incentive distribution rights or the issuance of partnership securities upon conversion of outstanding partnership securities) and our General Partner does not contribute a proportionate amount of capital to us in order to maintain its then current general partner interest. Our General Partner will be entitled to make a capital contribution in order to maintain its then current general partner interest.
Incentive distribution rights represent the right to receive an increasing percentage (13.0%, 23.0% and 48.0%) of quarterly distributions of available cash from operating surplus after the minimum quarterly distribution and the target distribution levels have been achieved. Our General Partner currently holds the incentive distribution rights, but may transfer these rights separately from its general partner interest, subject to restrictions in the partnership agreement.
If for any quarter:
we have distributed available cash from operating surplus to the holders of our Preferred Units in an amount equal to the Series A Quarterly Distribution Amount;
we have distributed available cash from operating surplus to the holders of our Preferred Units in an amount necessary to eliminate any cumulative arrearages in the payment of the Series A Quarterly Distribution Amount; and
we have distributed available cash from operating surplus to the common unitholders and Class B unitholders in an amount equal to the minimum quarterly distribution;
then our partnership agreement requires that we distribute any additional available cash from operating surplus for that quarter among the unitholders and our General Partner in the following manner:
first, 98.4% to all unitholders holding common units or Class B units, pro rata, and 1.6% to our General Partner, until each unitholder receives a total of $0.1265 per unit for that quarter (the “first target distribution”);
second, 85.4% to all unitholders holding common units or Class B units, pro rata, and 14.6% to our General Partner, until each unitholder receives a total of $0.1375 per unit for that quarter (the “second target distribution”);
third, 75.4% to all unitholders holding common units or Class B units, pro rata, and 24.6% to our General Partner, until each unitholder receives a total of $0.1825 per unit for that quarter (the “third target distribution”); and
thereafter, 50.4% to all unitholders holding common units or Class B units, pro rata, and 49.6% to our General Partner.
For equity compensation plan information, see “Item 12. Security Ownership of Certain Beneficial Owners and Management and Related Stockholder Matters-Securities Authorized for Issuance under Equity Compensation Plans.”
Unregistered Sales of Securities
None.
We are a “smaller reporting company” as defined by Regulation S-K and as of the dates presented.
| 2013 | 2014 | 2015 | 2016 | 2017 | |||||||||||||||
| Statements of Operations Data: | (in thousands, except for per unit data) | ||||||||||||||||||
| Service revenue: | |||||||||||||||||||
| Third-party revenue | $ | 142,916 | $ | 139,426 | $ | 137,415 | $ | 126,215 | $ | 113,772 | |||||||||
Related-party revenue(1) | 51,755 | 42,788 | 39,103 | 30,211 | 56,688 | ||||||||||||||
| Product sales revenue: | |||||||||||||||||||
| Third-party revenue | — | 4,412 | 3,511 | 20,968 | 11,479 | ||||||||||||||
| Total revenue | 194,671 | 186,626 | 180,029 | 177,394 | 181,939 | ||||||||||||||
| Costs and expenses: | |||||||||||||||||||
| Operating expense | 133,610 | 134,184 | 127,974 | 111,091 | 123,805 | ||||||||||||||
| Cost of product sales | — | 61 | 3,231 | 14,130 | 8,807 | ||||||||||||||
| General and administrative expense | 17,482 | 17,498 | 18,976 | 20,029 | 17,112 | ||||||||||||||
| Asset impairment expense | 524 | — | 21,996 | 25,761 | 2,400 | ||||||||||||||
| Total costs and expenses | 151,616 | 151,743 | 172,177 | 171,011 | 152,124 | ||||||||||||||
| Gain (loss) on sale of assets | 1,073 | 2,464 | 6,137 | 108 | (975 | ) | |||||||||||||
| Operating income | 44,128 | 37,347 | 13,989 | 6,491 | 28,840 | ||||||||||||||
| Other income (expense): | |||||||||||||||||||
| Equity earnings (loss) in unconsolidated entity | (502 | ) | 883 | 3,932 | 1,483 | 61 | |||||||||||||
| Gain on sale of unconsolidated affiliate | — | — | — | — | 5,337 | ||||||||||||||
| Interest expense | (11,615 | ) | (12,268 | ) | (11,202 | ) | (12,554 | ) | (14,027 | ) | |||||||||
| Unrealized gain on investments | — | 2,079 | — | — | — | ||||||||||||||
| Income (loss) before income taxes | 32,011 | 28,041 | 6,719 | (4,580 | ) | 20,211 | |||||||||||||
| Provision for income taxes | 593 | 469 | 323 | 260 | 166 | ||||||||||||||
| Net income (loss) from continuing operations | 31,418 | 27,572 | 6,396 | (4,840 | ) | 20,045 | |||||||||||||
| Loss from discontinued operations | (3,383 | ) | — | — | — | — | |||||||||||||
| Net income (loss) | $ | 28,035 | $ | 27,572 | $ | 6,396 | $ | (4,840 | ) | $ | 20,045 | ||||||||
| Allocation of net income (loss) for purpose of calculating earnings per unit: | |||||||||||||||||||
| General partner interest in net income | $ | 647 | $ | 641 | $ | 554 | $ | 433 | $ | 944 | |||||||||
| Preferred interest in net income | $ | 21,564 | $ | 21,563 | $ | 21,564 | $ | 25,824 | $ | 25,115 | |||||||||
| Net income (loss) available to limited partners | $ | 5,824 | $ | 5,368 | $ | (15,722 | ) | $ | (31,097 | ) | $ | (6,014 | ) | ||||||
| Basic and diluted net income (loss) per common unit | $ | 0.25 | $ | 0.20 | $ | (0.47 | ) | $ | (0.87 | ) | $ | (0.15 | ) | ||||||
Cash distributions per unit to limited partners(2): | |||||||||||||||||||
| Paid | $ | 0.48 | $ | 0.52 | $ | 0.56 | $ | 0.58 | $ | 0.58 | |||||||||
| Declared | $ | 0.49 | $ | 0.53 | $ | 0.57 | $ | 0.58 | $ | 0.58 | |||||||||
| Cash distributions per unit to preferred partners: | |||||||||||||||||||
| Paid | $ | 0.72 | $ | 0.72 | $ | 0.72 | $ | 0.72 | $ | 0.72 | |||||||||
| Declared | $ | 0.72 | $ | 0.72 | $ | 0.72 | $ | 0.72 | $ | 0.72 | |||||||||
| Balance Sheet Data (at period end): | |||||||||||||||||||
| Property, plant and equipment, net | $ | 297,400 | $ | 310,163 | $ | 312,934 | $ | 307,334 | $ | 296,069 | |||||||||
| Total assets | $ | 354,748 | $ | 364,395 | $ | 364,746 | $ | 375,663 | $ | 340,869 | |||||||||
| Long-term debt and other long-term liabilities | $ | 275,707 | $ | 219,736 | $ | 247,548 | $ | 329,546 | $ | 312,542 | |||||||||
| Total partners’ capital | $ | 55,458 | $ | 119,956 | $ | 87,219 | $ | 25,576 | $ | 4,684 | |||||||||
Overview
We are a publicly traded master limited partnership with operations in 2726 states. We have the largest independent asphalt facility footprint in the nation, and through that we provide integrated terminalling services for companies engaged in the production of liquid asphalt. We manage our operations through a single operating segment, asphalt terminalling services.
We previously provided integrated terminalling, gathering, and transportation services for companies engaged in the production, distribution, and marketing of liquid asphalt and crude oil. We manage our operations through four operating segments: (i) asphalt terminalling services, (ii) crude oil terminalling services, (iii) crude oil pipeline services and (iv) crude oil trucking and producer field services.
Our 53 asphalt facilities are well-positioned to provide asphalt terminalling services in the market areas they serve throughout the continental United States. With our approximately 8.7 million barrels of total liquid asphalt storage capacity, we are able to provide our customers the ability to effectively manage their liquid asphalt inventories while allowing significant flexibility in their processing and marketing activities. Our asphalt terminalling business delivers a stable cash flow profile underpinned by long-term take-or-pay contracts that generally have original terms of 5 to 10 years with options to extend the term. The stability comes from the contract structure that is comprised primarily of fixed fees and cost reimbursements, which make up approximately 95% of our revenues. The remaining revenue is variable, primarily consisting of volume based throughput fees.
We have agreements for all our 53 asphalt terminalling facilities throughout the 26 states. We lease certain facilities for operation by our customers and at the remaining facilities we store, process, blend, and manufacture products, among other things, to meet our customers’ specifications. The agreements have, based on a weighted average by remaining fixed revenue, approximately 5.8 years remaining under their terms as of March 4, 2021. Approximately 20% of our tank capacity will expire at the end of 2021 if not renewed with the current customer or a new customer, and the remaining capacity expires at varying times thereafter, through 2027. Our varying contract expiration dates provide for staggered renewals, which provides additional stability to the cash flow.
Potential Impact of Certain Factors on Future Revenues
Due to the high percentage of fixed and reimbursement revenue from our long-term contracts, our focus and our primary risk is renewing contracts at favorable terms. Our ability to renew agreements on favorable terms, or at all, could be impacted if our customers experience negative market conditions. These factors include infrastructure spending, the strength of state and local economies, and the level of allocations of tax funding to transportation spending from state or federal funds. Public transportation infrastructure projects historically have been a relatively stable portion of state and federal budgets and represent a significant share of the United States construction market. Federal funds are allocated on a state-by-state basis, and each state is required to match a portion of the federal funds that it receives. Currently, from a macroeconomic view, there are positive indicators for the infrastructure and construction sector, such as continued discussion and support for infrastructure spending from all sides of the federal government, low interest rates, and a recovering economy since mid-2020. However, due to COVID-19, as discussed below, some uncertainty exists.
Due to the global pandemic related to the coronavirus disease, COVID-19, the economy experienced a significant downturn in 2020 that subsequently has been recovering. Despite this economic volatility, our cash flows remained stable in 2020 and are expected to remain stable moving into 2021. While our customers may be impacted by the recent economic volatility, they are primarily high-quality counterparties, with over 50% of our revenues earned from those that are investment grade quality, which minimizes our counterparty credit risk. As of March 4, 2021, we do not expect any supply chain disruptions from COVID-19 to affect our customers. Management is also actively monitoring the states and regions in which we operate, and, as of now, our operations are excluded from mandatory closings due to the essential designation of our assets. In addition, our business is related to infrastructure spending at the federal, state, and local levels, and the U.S. government has continued to indicate its support for infrastructure spending. At the same time, state revenue is down due to COVID-19, so we remain cautious about future spending on infrastructure and road construction absent an infrastructure bill passed by the federal government to support funding efforts. While we are unaware of any potential negative impact of COVID-19 on our business at this time, we are continuing to monitor the situation and have prepared our employees to take precautions and planning for unexpected events, which may include disruptions to our workforce, customers, vendors, facilities and communities in which we operate. In an effort to protect the health and safety of our employees and the customers and vendors we interact with, we took proactive action to adopt social distancing policies at our locations, including working from home, limiting the number of employees attending meetings, reducing the number of people in our sites at any one time, and suspending employee travel.
Another factor impacting us and our customers, from a short-term perspective, is weather patterns. Our customers’ volumes could be significantly impacted by prolonged rain or snow seasons or any severe weather that occurs. Damage to our terminal facilities from severe weather, such as flooding or hurricanes, could impact our operating results through additional costs and/or loss of revenue.
Ergon Agreements
Twenty-eight of our asphalt facilities are contracted to Ergon under multiple agreements. Service revenues under these agreements are primarily based on contracted monthly fees under the applicable agreement at rates, which we believe are fair and reasonable to us and our unitholders and are comparable with the rates we charge third parties. Agreements for six of the facilities expire in late 2025, and agreements for the remaining 22 facilities expire on December 31, 2027. We may not be able to extend, renegotiate or replace these contracts when they expire and the terms of any renegotiated contracts may not be as favorable as the contracts they replace. The Board’s conflicts committee reviewed and approved these agreements in accordance with our procedures for approval of related-party transactions and the provisions of the partnership agreement. For the years ended December 31, 2019 and 2020, we recognized revenues of $36.1 million and $44.4 million, respectively, for services provided to Ergon under these agreements.
Results of Operations
Non-GAAP Financial Measures
To supplement our financial information presented in accordance with GAAP, management uses additional measures that are known as “non-GAAP financial measures” in its evaluation of past performance and prospects for the future. The primary measure used by management is operating margin excluding depreciation and amortization.
Management believes that the presentation of this additional financial measure provides useful information to investors regarding our performance and results of operations because this measure, when used in conjunction with related GAAP financial measures, (i) provides additional information about our core operating performance and ability to generate and distribute cash flow; (ii) provides investors with the financial analytical framework upon which management bases financial, operational, compensation and planning decisions; and (iii) presents measurements that investors, rating agencies and debt holders have indicated are useful in assessing us and our results of operations. This additional financial measure is reconciled to the most directly comparable measures as reported in accordance with GAAP, and should be viewed in addition to, and not in lieu of, our consolidated financial statements and footnotes.
The table below summarizes our financial results for the years ended December 31, 2019 and 2020, and presents a reconciliation of our non-GAAP financial measure reconciled to the most directly comparable GAAP measure:
| Favorable/(Unfavorable) | ||||||||||||||||
Operating Results | Year ended December 31, | 2019-2020 | ||||||||||||||
(dollars in thousands) | 2019 | 2020 | $ | % | ||||||||||||
Fixed fee revenue | $ | 87,218 | $ | 91,879 | $ | 4,660 | 5 | % | ||||||||
Variable cost recovery revenue | 14,312 | 12,664 | (1,648 | ) | (12 | )% | ||||||||||
Variable throughput and other revenue | 4,988 | 5,702 | 714 | 14 | % | |||||||||||
| Total revenue | 106,518 | 110,245 | 3,726 | 3 | % | |||||||||||
Operating expenses, excluding depreciation and amortization | (46,367 | ) | (49,396 | ) | (3,028 | ) | (7 | )% | ||||||||
Total operating margin | 60,151 | 60,849 | 698 | 1 | % | |||||||||||
Depreciation and amortization | 15,196 | 13,416 | 1,780 | 12 | % | |||||||||||
General and administrative expense | 13,388 | 14,182 | (794 | ) | (6 | )% | ||||||||||
Asset impairment expense | 2,476 | - | 2,476 | 100 | % | |||||||||||
Loss on sale of assets | 131 | 67 | 64 | 49 | % | |||||||||||
Operating income | 28,960 | 33,184 | 4,224 | 15 | % | |||||||||||
Other income (expenses): | ||||||||||||||||
Other income | 530 | 1,169 | 639 | 121 | % | |||||||||||
Interest expense | (7,447 | ) | (5,665 | ) | 1,782 | 24 | % | |||||||||
Provision for income taxes | (44 | ) | 7 | 51 | 116 | % | ||||||||||
| Income from continuing operations | 21,999 | 28,695 | 6,696 | 30 | % | |||||||||||
| Loss from discontinued operations, net | (3,587 | ) | (42,175 | ) | (38,588 | ) | (1076 | )% | ||||||||
Net income(loss) | $ | 18,412 | $ | (13,480 | ) | (31,892 | ) | 30 | % | |||||||
Revenues. Total revenues were consistent with prior year which was expected based on the structure of our contracts, which consist primarily of fixed fees for items such as storage and minimum throughput requirements, with consideration of annual CPI index increases built into a majority of our agreements. We experienced a slight increase in variable throughput and other revenue due to a strong asphalt season that resulted in additional excess throughput. Variable reimbursement revenue is driven by certain reimbursable operating expenses, such as utility costs, and therefore have no net impact on operating margin or net income.
Operating expenses, excluding depreciation and amortization. Operating expense, excluding depreciation and amortization increased by 7%, or $3.0 million for 2020 as compared to 2019. Significant factors contributing to this change include certain facilities changing from a lease arrangement to an operating arrangement, insurance premiums due to overall market conditions, and maintenance and repair expenses due to the timing of required inspections.
Depreciation and amortization. Depreciation and amortization decreased to $13.4 million for 2020 compared to $15.2 million for 2019. The decrease is primarily the result of assets reaching the end of their depreciable lives.
General and administrative expense. General and administrative expense was $14.2 million for the year ended December 31, 2020, compared to $13.4 million for 2019. The increase from 2019 to 2020 is primarily due to legal and professional fees incurred with several different projects in 2020, including the crude asset sale transactions.
Asset impairment expense. We incurred an asset impairment expense of $2.2 million for the year ended December 31, 2017, we transported approximately 23,000 Bpd on our pipelines,2019, related to a decrease of 36% as comparedpipeline project that was cancelled. As this project was never put in service, the impairment was recorded at the corporate level. We had no asset impairment expense related to continuing operations for the year ended December 31, 2016. The decrease in volumes is primarily attributable to suspended service2020.
Gain on our Mid-Continent pipeline system due to a discoverysale of a pipeline exposure in April 2016. We are working to
Other income. Other income for additional detail. Vitol accounted for 57% and 33% of volumes transported in 2017 and 2016, respectively.
Income from discontinued operations. Income from discontinued operations represents the results of our former crude transport trucks, a decreaseoil trucking, pipeline, and terminalling services segments that were sold in February and March of 22% as compared to the2021. The year ended December 31, 2016. As noted above, we are working to restore service2020, included $39.1 million of losses on disposal and classification as held for sale the second Oklahoma pipeline system and expect to put the line back in service by the end of the second quarter of 2018. When our second Oklahoma pipeline system resumes service, we anticipate an increase in volumes transported by our crude oil transport trucks as we gather barrels to be transported on this pipeline. See
Interest expense. Interest expense was $5.7 million for products upon delivery and when the customer assumes the risks and rewards of ownership. We earn product
| Favorable/(Unfavorable) | ||||||||||||||||
Year ended December 31, | 2019-2020 | |||||||||||||||
2019 | 2020 | $ | % | |||||||||||||
| Credit agreement interest | $ | 6,414 | $ | 4,611 | $ | 1,803 | 28 | % | ||||||||
| Amortization of debt issuance costs | 1,005 | 1,005 | - | 0 | % | |||||||||||
| Other | 28 | 49 | (21 | ) | (75 | )% | ||||||||||
| Total interest expense | $ | 7,447 | $ | 5,665 | $ | 1,782 | 24 | % | ||||||||
The decrease is primarily attributable to expenses incurred in 2016 related to the Ergon Transactions. Our interest expense increased by $1.5 million in 2017 as compared to 2016. See
Income Taxes
As part of the process of preparing the consolidated financial statements, we are required to estimate the federal and state income taxes in each of the jurisdictions in which our subsidiary that is taxed as a corporation operates. This process involves estimating the actual current tax exposure together with assessing temporary differences resulting from differing treatment of items, such as depreciation, for tax and accounting purposes. These differences result in deferred tax assets and liabilities, which are included in our consolidated balance sheets. We must then assess, using all available positive and negative evidence, the likelihood that the deferred tax assets will be recovered from future taxable income. If we believe that recovery is not likely, we must establish a valuation allowance. To the extent we establish a valuation allowance or increase or decrease this allowance in a period, we must include an expense or reduction of expense within the tax provisions in the consolidated statements of operations.
Under
ASC 740 – Accounting for Income Taxes, an enterprise must use judgment in considering the relative impact of negative and positive evidence. The weight given to the potential effect of negative and positive evidence should be commensurate with the extent to which it can be objectively verified. The more negative evidence that exists (a) the more positive evidence is necessary and (b) the more difficult it is to support a conclusion that a valuation allowance is not needed for some portion, or all of the deferred tax asset. Among the more significant types of evidence that we consider are:taxable income projections in future years;
future revenue and operating cost projections that will produce more than enough taxable income to realize the deferred tax asset based on existing service rates and cost structures; and
our earnings history exclusive of the loss that created the future deductible amount coupled with evidence indicating that the loss is an aberration rather than a continuing condition.
Based on the consideration of the above factors for our subsidiary that is taxed as a corporation for purposes of determining the likelihood of realizing the benefits of the deferred tax assets, we have provided a full valuation allowance against our deferred tax asset as of December 31, 2017.
| Favorable/(Unfavorable) | |||||||||||||||||||||||||
| Operating Results | Year ended December 31, | 2015-2016 | 2016-2017 | ||||||||||||||||||||||
| (dollars in thousands) | 2015 | 2016 | 2017 | $ | % | $ | % | ||||||||||||||||||
| Operating margin, excluding depreciation and amortization | |||||||||||||||||||||||||
| Asphalt terminalling services operating margin | $ | 48,212 | $ | 56,769 | $ | 64,623 | $ | 8,557 | 18 | % | $ | 7,854 | 14 | % | |||||||||||
| Crude oil terminalling services operating margin | 18,842 | 20,048 | 17,977 | 1,206 | 6 | % | (2,071 | ) | (10 | )% | |||||||||||||||
| Crude oil pipeline services operating margin | 7,694 | 4,347 | (1,700 | ) | (3,347 | ) | (44 | )% | (6,047 | ) | (139 | )% | |||||||||||||
| Crude oil trucking and producer field services operating margin | 1,304 | 1,829 | (434 | ) | 525 | 40 | % | (2,263 | ) | (124 | )% | ||||||||||||||
| Total operating margin, excluding depreciation and amortization | 76,052 | 82,993 | 80,466 | 6,941 | 9 | % | (2,527 | ) | (3 | )% | |||||||||||||||
| Depreciation and amortization | 27,228 | 30,820 | 31,139 | (3,592 | ) | (13 | )% | (319 | ) | (1 | )% | ||||||||||||||
| General and administrative expense | 18,976 | 20,029 | 17,112 | (1,053 | ) | (6 | )% | 2,917 | 15 | % | |||||||||||||||
| Asset impairment expense | 21,996 | 25,761 | 2,400 | (3,765 | ) | (17 | )% | 23,361 | 91 | % | |||||||||||||||
| Gain (loss) on sale of assets | 6,137 | 108 | (975 | ) | (6,029 | ) | (98 | )% | (1,083 | ) | (1,003 | )% | |||||||||||||
| Operating income | 13,989 | 6,491 | 28,840 | (7,498 | ) | (54 | )% | 22,349 | 344 | % | |||||||||||||||
| Other income (expense): | |||||||||||||||||||||||||
| Equity earnings in unconsolidated affiliate | 3,932 | 1,483 | 61 | (2,449 | ) | (62 | )% | (1,422 | ) | (96 | )% | ||||||||||||||
| Gain on sale of unconsolidated affiliate | — | — | 5,337 | — | N/A | 5,337 | N/A | ||||||||||||||||||
| Interest expense | (11,202 | ) | (12,554 | ) | (14,027 | ) | (1,352 | ) | (12 | )% | (1,473 | ) | (12 | )% | |||||||||||
| Provision for income taxes | (323 | ) | (260 | ) | (166 | ) | 63 | 20 | % | 94 | 36 | % | |||||||||||||
| Net income (loss) | $ | 6,396 | $ | (4,840 | ) | $ | 20,045 | $ | (11,236 | ) | (176 | )% | $ | 24,885 | 514 | % | |||||||||
| Favorable/(Unfavorable) | |||||||||||||||||||||||||
| Operating results | Year ended December 31, | 2015-2016 | 2016-2017 | ||||||||||||||||||||||
| (dollars in thousands) | 2015 | 2016 | 2017 | $ | % | $ | % | ||||||||||||||||||
| Service revenue: | |||||||||||||||||||||||||
| Third-party revenue | $ | 72,152 | $ | 75,655 | $ | 57,486 | $ | 3,503 | 5 | % | $ | (18,169 | ) | (24 | )% | ||||||||||
| Related-party revenue | 1,278 | 11,762 | 56,378 | 10,484 | 820 | % | 44,616 | 379 | % | ||||||||||||||||
| Total revenue | 73,430 | 87,417 | 113,864 | 13,987 | 19 | % | 26,447 | 30 | % | ||||||||||||||||
| Operating expense (excluding depreciation and amortization) | 25,218 | 30,648 | 49,241 | (5,430 | ) | (22 | )% | (18,593 | ) | (61 | )% | ||||||||||||||
| Operating margin (excluding depreciation and amortization) | $ | 48,212 | $ | 56,769 | $ | 64,623 | $ | 8,557 | 18 | % | $ | 7,854 | 14 | % | |||||||||||
| Favorable/(Unfavorable) | |||||||||||||||||||||||||
| Operating Results | Year ended December 31, | 2015-2016 | 2016-2017 | ||||||||||||||||||||||
| (dollars in thousands) | 2015 | 2016 | 2017 | $ | % | $ | % | ||||||||||||||||||
| Service revenue: | |||||||||||||||||||||||||
| Third-party revenue | $ | 13,076 | $ | 16,387 | $ | 22,177 | $ | 3,311 | 25 | % | $ | 5,790 | 35 | % | |||||||||||
| Related-party revenue | 11,522 | 7,858 | — | (3,664 | ) | (32 | )% | (7,858 | ) | (100 | )% | ||||||||||||||
| Total revenue | 24,598 | 24,245 | 22,177 | (353 | ) | (1 | )% | (2,068 | ) | (9 | )% | ||||||||||||||
| Operating expense (excluding depreciation and amortization) | 5,756 | 4,197 | 4,200 | 1,559 | 27 | % | (3 | ) | — | % | |||||||||||||||
| Operating margin (excluding depreciation and amortization) | $ | 18,842 | $ | 20,048 | $ | 17,977 | $ | 1,206 | 6 | % | $ | (2,071 | ) | (10 | )% | ||||||||||
| Average crude oil stored per month at our Cushing terminal (in thousands of barrels) | 5,322 | 5,536 | 5,413 | 214 | 4 | % | (123 | ) | (2 | )% | |||||||||||||||
| Average crude oil delivered to our Cushing terminal (in thousands of barrels per day) | 117 | 78 | 41 | (39 | ) | (33 | )% | (37 | ) | (47 | )% | ||||||||||||||
| Favorable/(Unfavorable) | |||||||||||||||||||||||||
| Operating Results | Year ended December 31, | 2015-2016 | 2016-2017 | ||||||||||||||||||||||
| (dollars in thousands) | 2015 | 2016 | 2017 | $ | % | $ | % | ||||||||||||||||||
| Service revenue: | |||||||||||||||||||||||||
| Third-party revenue | $ | 15,148 | $ | 8,662 | $ | 9,580 | $ | (6,486 | ) | (43 | )% | $ | 918 | 11 | % | ||||||||||
| Related-party revenue | 10,687 | 5,433 | 310 | (5,254 | ) | (49 | )% | (5,123 | ) | (94 | )% | ||||||||||||||
| Product sales revenue: | |||||||||||||||||||||||||
| Third-party revenue | 3,511 | 20,968 | 11,094 | 17,457 | 497 | % | (9,874 | ) | (47 | )% | |||||||||||||||
| Total revenue | 29,346 | 35,063 | 20,984 | 5,717 | 19 | % | (14,079 | ) | (40 | )% | |||||||||||||||
| Operating expense (excluding depreciation and amortization) | 18,162 | 15,270 | 13,310 | 2,892 | 16 | % | 1,960 | 13 | % | ||||||||||||||||
| Operating expense (intersegment) | 259 | 890 | 417 | (631 | ) | (244 | )% | 473 | 53 | % | |||||||||||||||
| Cost of product sales | 3,231 | 14,130 | 8,807 | (10,899 | ) | (337 | )% | 5,323 | 38 | % | |||||||||||||||
| Cost of product sales (intersegment) | — | 426 | 150 | (426 | ) | N/A | 276 | 65 | % | ||||||||||||||||
| Operating margin (excluding depreciation and amortization) | $ | 7,694 | $ | 4,347 | $ | (1,700 | ) | $ | (3,347 | ) | (44 | )% | $ | (6,047 | ) | (139 | )% | ||||||||
| Average throughput volume (in thousands of barrels per day) | |||||||||||||||||||||||||
| Mid-Continent | 36 | 27 | 22 | (9 | ) | (25 | )% | (5 | ) | (19 | )% | ||||||||||||||
East Texas(1) | 16 | 9 | 3 | (7 | ) | (44 | )% | (6 | ) | (67 | )% | ||||||||||||||
| Favorable/(Unfavorable) | |||||||||||||||||||||||||
| Operating Results | Year ended December 31, | 2015-2016 | 2016-2017 | ||||||||||||||||||||||
| (dollars in thousands) | 2015 | 2016 | 2017 | $ | % | $ | % | ||||||||||||||||||
| Service revenue: | |||||||||||||||||||||||||
| Third-party revenue | $ | 37,039 | $ | 25,511 | $ | 24,529 | $ | (11,528 | ) | (31 | )% | $ | (982 | ) | (4 | )% | |||||||||
| Related-party revenue | 15,616 | 5,158 | — | (10,458 | ) | (67 | )% | (5,158 | ) | (100 | )% | ||||||||||||||
| Intersegment revenue | 259 | 890 | 417 | 631 | 244 | % | (473 | ) | (53 | )% | |||||||||||||||
| Product sales revenue: | |||||||||||||||||||||||||
| Third-party revenue | — | — | 385 | — | N/A | 385 | N/A | ||||||||||||||||||
| Intersegment revenue | — | 426 | 150 | 426 | N/A | (276 | ) | (65 | )% | ||||||||||||||||
| Total revenue | 52,914 | 31,985 | 25,481 | (20,929 | ) | (40 | )% | (6,504 | ) | (20 | )% | ||||||||||||||
| Operating expense (excluding depreciation and amortization) | 51,610 | 30,156 | 25,915 | 21,454 | 42 | % | 4,241 | 14 | % | ||||||||||||||||
| Operating margin (excluding depreciation and amortization) | $ | 1,304 | $ | 1,829 | $ | (434 | ) | $ | 525 | 40 | % | $ | (2,263 | ) | (124 | )% | |||||||||
| Average volume (in thousands of barrels per day) | 51 | 27 | 21 | (24 | ) | (47 | )% | (6 | ) | (22 | )% | ||||||||||||||
Effects of Inflation
In recent years, inflation has been modest and has not had a material impact upon the results of our operations.
Off-Balance Sheet Arrangements
We do not have any off-balance sheet arrangements as defined by Item 303 of Regulation S-K.
Cash Flows and Capital Expenditures
The following table summarizes our sources and uses of cash for the years ended December 31, 2015,
| Year ended December 31, | |||||||||||
| 2015 | 2016 | 2017 | |||||||||
| (in millions) | |||||||||||
| Net cash provided by operating activities | $ | 60.5 | $ | 52.8 | $ | 54.5 | |||||
| Net cash provided by (used in) investing activities | (44.6 | ) | (159.6 | ) | 17.1 | ||||||
| Net cash provided by (used in) financing activities | (15.6 | ) | 107.0 | (72.4 | ) | ||||||
Year ended December 31, | ||||||||
2019 | 2020 | |||||||
| Net cash provided by operating activities | $ | 49.8 | $ | 61.2 | ||||
Net cash used in investing activities | (4.3 | ) | (22.7 | ) | ||||
Net cash used in financing activities | (46.4 | ) | (38.3 | ) | ||||
Operating Activities
. Net cash provided by operating activities wasInvesting Activities. Net cash provided by operatingused in investing activities was $52.8$22.7 million for the year ended December 31, 2016, as compared to $60.5 million for the year ended December 31, 2015. The decrease in cash provided by operating activities is primarily the result of changes in working capital and lower net income.
Net cash used in investing activities was $159.6$4.3 million for the year ended December 31, 2016, as compared to $44.6 million for the year ended December 31, 2015. Capital expenditures for the years ended December 31, 2016, included acquiring nine asphalt terminal facilities from Ergon for $122.6 million, maintenance2019. Total capital expenditures of $8.7$12.7 million net of reimbursable expenditures of $1.9 million, expansion capital expenditures of $9.4 million and other acquisitions of $19.0 million. These expenditures were partially offset by proceeds from the sale of assets of $2.0$8.4 million. Of such proceeds, $2.6 million related to the December 2018 sale of linefill for which the cash consideration was not received until January 2019. Capital expenditures for the year ended December 31, 2015, included maintenance capital expenditures of $7.9$8.9 million, net of reimbursable expenditures of $0.5$0.2 million, and expansion capital expenditures of $33.2$3.5 million, primarily related to the Knight Warrior pipeline project, and acquisitionsnet of $21.0reimbursable expenditures of $0.1 million. These expenditures were partially offset by proceeds from the sale of assets of $14.7 million as well as $2.3 million related to proceeds from the sale of investments in 2015.
Financing Activities
. Net cash used in financing activities wasNet cash used in financing activities was $15.6$46.4 million for the year ended December 31, 2015. Financing activities for the year ended December 31, 2015, consisted2019, and primarily comprised of net borrowingspayments under our credit agreement of $29.0$10.0 million and distributions to unitholders of $41.6$34.0 million.
Our Liquidity and Capital Resources
Cash flows from operations and borrowings under our credit agreement are our primary sources of liquidity. Our ability to borrow funds under our credit agreement may be limited by financial covenants. At December 31, 2017,2020, we had a working capital deficit of $0.1$11.1 million. This is primarily a function of our approach to cash management. At December 31, 2017,2020, we had approximately $140.9$252.6 million of revolver borrowings and approximately $1.7 million of letters of credit outstanding under the credit agreement, leaving us with $145.7 million of availability under our revolving loan facility, subject to covenant restrictions, which limited our availability to $61.3 million. In conjunction with the closing of our asset sale transactions, our available credit facility was reduced from $400.0 million to $350.0 million. At March 4, 2021, we had approximately $99.6 million of revolver borrowings and we could borrow up to $317.0approximately $1.7 million or an additional $7.9of letters of credit outstanding under the credit agreement, leaving us with $248.7 million and still remain within our covenant restrictions. As of March 1, 2018, we have aggregate unused commitmentsavailability under our revolving loan facility, which is reflective of approximately $139.9the decrease in the total loan facility. The Partnership’s ability to borrow such funds may be limited by the financial covenants in the credit agreement.
The Partnership has certain financial covenants associated with its credit agreement which include a maximum permitted consolidated total leverage ratio. The consolidated total leverage ratio is assessed quarterly based on the trailing twelve months of EBITDA, as defined in the credit agreement. The maximum permitted consolidated total leverage ratio as of December 31, 2020, and for every quarter thereafter, is 4.75 to 1.00. The Partnership’s consolidated total leverage ratio was 3.83 to 1.00 as of December 31, 2020.
Management evaluates whether conditions and/or events raise substantial doubt about the Partnership’s ability to continue as a going concern within one year after the date that the consolidated financial statements are issued (the “assessment period”). In performing this assessment, management considered the risk associated with its ongoing ability to meet the financial covenants.
Based on the Partnership’s forecasted EBITDA during the assessment period, management believes that it will meet these financial covenants (as described below). However, there are certain inherent risks associated with our continued ability to comply with our consolidated total leverage ratio covenant. These risks relate, among other things, to potential future (a) decreases in storage volumes and rates as well as throughput and transportation rates realized; (b) weather phenomenon that may potentially hinder the Partnership’s asphalt business activity; and (c) other items affecting forecasted levels of expenditures and uses of cash resources. Violation of the consolidated total leverage ratio covenant would be an event of default under the credit agreement, which would cause our $252.6 million in outstanding debt, as of December 31, 2020, to become immediately due and cashpayable. If this were to occur, the Partnership would not expect to have sufficient liquidity to repay these outstanding amounts then due, which could cause the lenders under the credit facility to pursue other remedies. Such remedies could include exercising their collateral rights to the Partnership’s assets. Based on handour current forecasts, we believe we will be able to comply with the consolidated total leverage ratio during the assessment period. However, we cannot make any assurances that we will be able to achieve our forecasts. If we are unable to achieve our forecasts, further actions may be necessary to remain in compliance with our consolidated total leverage ratio covenant including, but not limited to, cost reductions, common and preferred unitholder distribution curtailments, and/or asset sales. We can make no assurances that we would be successful in undertaking these actions, or that we will remain in compliance with the consolidated total leverage ratio during the assessment period.
Capital Requirements
. Our capital requirements consist of the following:maintenance capital expenditures, which are capital expenditures made to maintain the existing integrity and operating capacity of our assets and related cash flows further extending the useful lives of the assets; and
expansion capital expenditures, which are capital expenditures made to expand or to replace partially or fully depreciated assets or to expand the operating capacity or revenue of existing or new assets, whether through construction, acquisition or modification.
The following table breaks out capital expenditures for organic growth projects totaled $10.0 million in the yearyears ended December 31,
Year ended December 31, | ||||||||||||||||
2019 | 2020 | |||||||||||||||
Continuing Operations | Discontinued Operations | Continuing Operations | Discontinued Operations | |||||||||||||
Acquisitions | $ | - | $ | - | $ | 12,221 | $ | - | ||||||||
Expansion capital expenditures | $ | 884 | $ | 2,709 | $ | 723 | $ | 5,571 | ||||||||
Reimbursable expenditures | (93 | ) | - | (289 | ) | - | ||||||||||
Net expansion capital expenditures | $ | 791 | $ | 2,709 | $ | 434 | $ | 5,571 | ||||||||
Gross Maintenance capital expenditures | $ | 6,974 | $ | 2,179 | $ | 8,260 | $ | 1,778 | ||||||||
Reimbursable expenditures | (223 | ) | - | (2,084 | ) | (120 | ) | |||||||||
Net maintenance capital expenditures | $ | 6,751 | $ | 2,179 | $ | 6,176 | $ | 1,658 | ||||||||
We currently expect our 2021 expansion capital expenditures for organic growth projects to be approximately $10.0$0.4 million to $12.0 million, net of reimbursable expenditures, in 2018. Maintenance capital expenditures totaled $7.9 million, net of reimbursable expenditures of $0.8 million, in the year ended December 31, 2017, compared to $8.7 million in the year ended December 31, 2016. We currently expectand our maintenance capital expenditures to be approximately $8.0$6.0 million, to $10 million,each net of reimbursable expenditures, in 2018.expenditures. Our sources of liquidity for these expansion and maintenance capital expenditures in 2018 are expected to be2020 were a combination of cash flows from operations and borrowings under our credit agreement.
Our Ability to Grow Depends on Our Ability to Access External Expansion Capital
. Our partnership agreement requires that we distribute all of our available cash to our unitholders. Available cash is reduced by cash reserves established by ourDescription of Credit Agreement
. On May 11, 2017, we entered into an amended and restated credit agreement. On June 28, 2018, the credit agreementOur credit agreement is guaranteed by all of our existing subsidiaries. Obligations under our credit agreement are secured by first priority liens on substantially all of our assets and those of the guarantors.
Our credit agreement includes procedures for adding financial institutions as revolving lenders or for increasing the revolving commitment of any currently committed revolving lender, subject to the consent of the new or increasing lenders and an aggregate maximum of
The credit agreement will mature on
May 11, 2022,Borrowings under our credit agreement bear interest, at our option, at either the reserve-adjusted eurodollar rate (as defined in the credit agreement) plus an applicable margin which ranges from 2.0% to 3.0%3.25% or the alternate base rate (the highest of the agent bank’s prime rate, the federal funds effective rate plus 0.5%, and the 30-day eurodollar rate plus 1.0%) plus an applicable margin which ranges from 1.0% to 2.0%2.25%.
We pay a per annum fee on all letters of credit issued under the credit agreement, which fee equals the applicable margin for loans accruing interest based on the eurodollar rate, and we pay a commitment fee on the unused commitments under the credit agreement. The applicable margins for the interest rate, the letters of credit fee and the commitment fee vary quarterly based on our consolidated total leverage ratio (as defined in the credit agreement, being generally computed as the ratio of consolidated total debt to consolidated earnings before interest, taxes, depreciation, amortization and certain other non-cash charges).
The credit agreement includes financial covenants which are tested on a quarterly basis, based on the rolling four-quarter period that ends on the last day of each fiscal quarter.
Prior to the date on which we issue qualified senior notes in an aggregate principal amount (when combined with all other qualified senior notes previously or concurrently issued) that equals or exceeds $200.0 million, the maximum permitted consolidated total leverage ratio is 4.75 to 1.00;1.00 for the fiscal quarter ending December 31, 2020, and each fiscal quarter thereafter; provided that the maximum permitted consolidated total leverage ratio will be 5.25 to 1.00 for certain quarters based on the occurrence of a specified acquisition (as defined in the Partnership’s credit agreement, but generally being an acquisition for which the aggregate consideration is $15.0 million or more). The acquisition of the nine asphalt terminals from Ergon in 2016 qualified as a specified acquisition.
From and after the date on which we issue qualified senior notes in an aggregate principal amount (when combined with all other qualified senior notes previously or concurrently issued) that equals or exceeds $200.0 million, the maximum permitted consolidated total leverage ratio is 5.00 to 1.00; provided that from and after the fiscal quarter ending immediately preceding the fiscal quarter in which a specified acquisition occurs to and including the last day of the second full fiscal quarter following the fiscal quarter in which such acquisition occurred, the maximum permitted consolidated total leverage ratio is 5.50 to 1.00.
The maximum permitted consolidated senior secured leverage ratio (as defined in the credit agreement, but generally computed as the ratio of consolidated total secured debt to consolidated earnings before interest, taxes, depreciation, amortization and certain other non-cash charges) is 3.50 to 1.00, but this covenant is only tested from and after the date on which we issue qualified senior notes in an aggregate principal amount (when combined with all other qualified senior notes previously or concurrently issued) that equals or exceeds $200.0 million.
The minimum permitted consolidated interest coverage ratio (as defined in the credit agreement, but generally computed as the ratio of consolidated earnings before interest, taxes, depreciation, amortization and certain other non-cash charges to consolidated interest expense) is 2.50 to 1.00.
In addition, the credit agreement contains various covenants that, among other restrictions, limit our ability to:
create, issue, incur or assume indebtedness;
create, incur or assume liens;
engage in mergers or acquisitions;
sell, transfer, assign or convey assets;
repurchase ourthe Partnership’s equity, make distributions to unitholders and make certain other restricted payments;
make investments;
modify the terms of certain indebtedness, or prepay certain indebtedness;
engage in transactions with affiliates;
enter into certain hedging contracts;
enter into certain burdensome agreements;
change the nature of ourthe Partnership’s business; and
make certain amendments to ourthe Fourth Amended and Restated Agreement of Limited Partnership of the Partnership (the “Partnership’s partnership agreement.agreement”).
At
December 31,The credit agreement permits us to make quarterly distributions of available cash (as defined in our partnership agreement) to unitholders so long as no default or event of default exists under the credit agreement on a pro forma basis after giving effect to such distribution. We are currently allowed to make distributions to our unitholders in accordance with this covenant; however, we will only make distributions to the extent we have sufficient cash from operations after establishment of cash reserves as determined by the General Partner in accordance with our cash distribution policy, including the establishment of any reserves for the proper conduct of our business.
In addition to other customary events of default, the credit agreement includes an event of default if:
(i) | our General Partner ceases to own 100% of our general partner interest or ceases to control us; |
(ii) | Ergon ceases to own and control 50.0% or more of the membership interests of our General Partner; or |
(iii) | during any period of 12 consecutive months, a majority of the members of the Board of our General Partner ceases to be composed of individuals: |
(A) | who were members of the Board on the first day of such period; |
(B) | whose election or nomination to the Board was approved by individuals referred to in clause (A) above constituting at the time of such election or nomination at least a majority of the Board; or |
(C) | whose election or nomination to the Board was approved by individuals referred to in clauses (A) and (B) above constituting at the time of such election or nomination at least a majority of the Board, provided that any changes to the composition of individuals serving as members of the Board approved by Ergon will not cause an event of default. |
If an event of default relating to bankruptcy or other insolvency events occurs with respect to our General Partner or us, all indebtedness under our credit agreement will immediately become due and payable. If any other event of default exists under our credit agreement, the lenders may accelerate the maturity of the obligations outstanding under our credit agreement and exercise other rights and remedies. In addition, if any event of default exists under our credit agreement, the lenders may commence foreclosure or other actions against the collateral.
If any default occurs under our credit agreement, or if we are unable to make any of the representations and warranties in our credit agreement, we will be unable to borrow funds or have letters of credit issued under our credit agreement.
| Payments Due by Period | |||||||||||||||||||
| Contractual Obligations | Total | Less than 1 Year | 1-3 Years | 4-5 Years | More than 5 Years | ||||||||||||||
| (in millions) | |||||||||||||||||||
Debt obligations(1) | $ | 368.8 | $ | 14.0 | $ | 28.1 | $ | 326.7 | $ | — | |||||||||
| Operating lease obligations | 12.9 | 4.8 | 5.0 | 1.8 | 1.3 | ||||||||||||||
Critical Accounting Policies and Estimates
Our discussion and analysis of our financial condition and results of operations is based upon our consolidated financial statements. We prepared these consolidated financial statements in conformity with accounting principles generally accepted in the United States of America. As such, we are required to make certain estimates, judgments and assumptions that affect the reported amounts of assets and liabilities at the date of the financial statements and the reported amounts of revenue and expenses during the periods presented. We based our estimates on historical experience, available information and various other assumptions we believe to be reasonable under the circumstances. On an ongoing basis, we evaluate our estimates; however, actual results may differ from these estimates under different assumptions or conditions. The accounting policies that we believe require our most difficult, subjective or complex judgments and are the most critical to our reporting of results of operations and financial position are as follows:
Use of Estimates.
The preparation of financial statements in conformity with accounting principles generally accepted in the United States of America requires management to make estimates and assumptions that affect the reported amounts and disclosure of contingencies. Management makes significant estimates including: (1) allowance for doubtful accounts receivable; (2) estimated useful lives of assets, which impacts depreciation; (3) estimated cash flows and fair values inherent in impairment tests; (4) accruals related to revenues and expenses; (5) the estimated fair value of financial instruments; and (6) liability and contingency accruals. Although management believes these estimates are reasonable, actual results could differ from these estimates.Property, Plant and Equipment
. Property, plant and equipment are recorded at cost. Expenditures for maintenance and repairs that do not add capacity or extend the useful life of an asset are expensed as incurred. The carrying value of the assets is based on estimates, assumptions and judgments relative to useful lives and salvage values. As assets are disposed of or sold, the cost and related accumulated depreciation are removed from the accounts, and any resulting gain or loss is included in operating income in the consolidated statements of operations.We calculate depreciation using the straight-line method based on estimated useful lives of our assets. These estimates are based on various factors, including age (in the case of acquired assets), manufacturing specifications, technological advances and historical data concerning useful lives of similar assets. Uncertainties that impact these estimates include changes in laws and regulations relating to restoration and abandonment requirements, economic conditions and supply and demand in the area. When assets are put into service, we make estimates with respect to useful lives and salvage values that we believe to be reasonable. However, subsequent events could cause us to change our estimates, thus impacting the future calculation of depreciation and amortization. The estimated useful lives of our asset groups are as follows:
Estimated Useful Lives | ||||
Asset Group | (Years) | |||
Land improvements | 10-20 | |||
Storage and terminal facilities | 10-35 | |||
Office property and equipment and other | 3-30 | |||
We capitalize certain costs directly related to the construction of assets, including interest and engineering costs. Upon disposition or retirement of property, plant and equipment, any gain or loss is included in operating income in the consolidated statements of operations.
We have contractual obligations to perform dismantlement and removal activities in the event that some of our assets are abandoned. These obligations include varying levels of activity, including completely removing the assets and returning the land to its original state. We have determined that the settlement dates related to the retirement obligations are indeterminate. The assets with indeterminate settlement dates have been in existence for many years and with regular maintenance will continue to be in service for many years to come. In addition, it is not possible to predict when demands for our services will cease, and we do not believe that such demand will cease for the foreseeable future. Accordingly, we believe the date when these assets will be abandoned is indeterminate. With no reasonably determinable abandonment date, we cannot reasonably estimate the fair value of the associated asset retirement obligations. We believe that if our asset retirement obligations were settled in the foreseeable future the potential cash flows that would be required to settle the obligations based on current costs are not material. We will record asset retirement obligations for these assets in the period in which sufficient information becomes available for us to reasonably determine the settlement dates.
Impairment of Long-Lived Assets
. Long-lived assets with recorded values that are not expected to be recovered through future cash flows are written down to estimated fair value. Assets are tested for impairment when events or circumstances indicate that their carrying values may not be recoverable. The carrying value of a long-lived asset is not recoverable if it exceeds the sum of the undiscounted cash flows expected to result from the use and eventual disposition of the asset. If the carrying value exceeds the sum of the undiscounted cash flows, an impairment loss equal to the amount the carrying value exceeds the fair value of the asset is recognized. Fair value is generally determined from estimated discounted future net cash flows.Goodwill.
Goodwill represents the excess of the cost of acquisitions over the amounts assigned to assets acquired and liabilities assumed. Goodwill is not amortized, but is tested annually for impairment and when events and circumstances warrant an interim evaluation. Goodwill is tested for impairment at a level of reporting referred to as a reporting unit. If the fair value of a reporting unit exceeds its carrying amount, goodwill of the reporting unit is not considered to be impaired. The impairment test is generally based on the estimated discounted future net cash flows of the respective reporting unit, utilizing discount rates and other factors in determining the fair value of the reporting unit. Inputs in the Partnership’s estimated discounted future net cash flows include existing and estimated future asset utilization, estimated growth rates in future cash flows and estimated terminal values.Recent Accounting Pronouncements
For information regarding recent accounting developments that may affect our future financial statements, see Note 2220 to our consolidated financial statements.
As a smaller reporting company, we are exposednot required to market risk due to variable interest rates under our credit agreement. As of
Our consolidated financial statements, together with the reportreports of our independent registered public accounting firm PricewaterhouseCoopers LLP,firms, are set forth on pages F-1 through F-32F-24 of this report and are incorporated herein by reference.
None.
Evaluation of disclosure controls and procedures.
Our General Partner’s management, including the Chief Executive Officer and Chief Financial Officer, the principal executive officer and principal financial officer, respectively, of our General Partner, evaluated as of the end of the period covered by this report, the effectiveness of our disclosure controls and procedures as defined in Rules 13a-15(e) and 15d-15(e) under the Securities Exchange Act of 1934. Based on that evaluation, the Chief Executive Officer and Chief Financial Officer of our General Partner concluded that our disclosure controls and procedures wereManagement’s Report on Internal Control Over Financial Reporting. Our General Partner’s management is responsible for establishing and maintaining adequate internal control over financial reporting. Our General Partner’s management, including the Chief Executive Officer and Chief Financial Officer of our General Partner, conducted an evaluation of the effectiveness of our internal control over financial reporting based on the framework in “InternalInternal Control - Integrated Framework”Framework (2013) issued by the Committee of Sponsoring Organizations of the Treadway Commission. A material weakness is a deficiency, or a combination of deficiencies,Based on its evaluation under the framework in internal control over financial reporting, such that there is a reasonable possibility that a material misstatement of Internal Control - Integrated Framework, our annual or unaudited interim financial statements will not be prevented or detected on a timely basis. Management did not maintain effective controls over the presentation of transactions within the consolidated statement of cash flows. Specifically, in connection with the preparation of our financial statements for the year ended December 31, 2017, management identified a material weakness in the operating effectiveness of internal control over financial reporting related to our process for identifying and presenting the non-cash components of an acquisition transaction. This material weakness was identified prior to the issuance of our consolidated financial statements for the year ended December 31, 2017, and resulted in an adjustment to the consolidated financial statements. Additionally, this material weakness could result in misstatements of cash flows that would result in a material misstatement to the annual or interim consolidated financial statements that would not be prevented or detected.
Changes in internal control over financial reporting.
There were no changesOur General Partner manages our operations and activities. Our General Partner is not elected by our unitholders and will not be subject to re-election on a regular basis in the future. The directors of our General Partner oversee our operations. Unitholders are not entitled to elect the directors of our General Partner or directly or indirectly participate in our management or operations. Our General Partner owes a limited fiduciary duty to our unitholders. Our General Partner will be liable, as general partner, for all of our debts (to the extent not paid from our assets), except for indebtedness or other obligations that are made specifically nonrecourse to it. Our General Partner, therefore, may cause us to incur indebtedness or other obligations that are nonrecourse to it. Borrowings under our existing credit facility are nonrecourse to our General Partner.
Directors and Executive Officers
The Board currently consists of W. R. “Lee” Adams (affiliated with Ergon), Edward D. Brooks (affiliated with Ergon), Jimmy A. LangdonJoel D. Pastorek (affiliated with Ergon), Robert H. Lampton (affiliated with Ergon), William W. Lampton (affiliated with Ergon), Duke R. Ligon (an independent director), Steven M. Bradshaw (an independent director) and John A. Shapiro (an independent director). Mr. Ligon serves as the Chairman of the Board, the chairman of the audit committee and a member of the compensation committee and the conflicts committee of the Board. Mr. Bradshaw serves as the chairman of the conflicts committee and a member of the compensation committee and the audit committee of the Board. Mr. Shapiro serves as the chairman of the compensation committee and a member of the conflicts committee and the audit committee of the Board.
The following table shows information regarding the current directors and executive officers of our General Partner as of March 1, 2018.
Name | Age | Position with Blueknight Energy Partners G.P., L.L.C. | |||
| Chief Financial Officer | |||||
Matthew R. Lewis | 34 | Chief Financial Officer | |||
Joel W. Kanvik | 51 | Chief Legal Officer and | |||
| 38 | Chief Accounting Officer | ||||
Jeffery A. Speer | 54 | Chief Operating Officer | |||
Duke R. Ligon | 79 | ||||
Director, | |||||
Steven M. Bradshaw | 72 | Director, chairman of the conflicts committee | |||
John A. Shapiro | 69 | Director, | |||
W.R. “Lee” Adams | 52 | Director | |||
Edward D. Brooks | 38 | Director | |||
Joel D. | 38 | Director | |||
Robert H. Lampton | 60 | Director | |||
William W. Lampton | 65 | Director | |||
Our directors hold office until the earlier of their death, resignation, removal or disqualification or until their successors have been elected and qualified. Officers serve at the discretion of the Board. Robert H. Lampton and William W. Lampton are brothers. There are no other family relationships between officers and directors.
D. Andrew Woodward became the Chief Executive Officer of our General Partner in September 2012.June 2020, after serving as the Chief Financial Officer of our General Partner since April 2019. Mr. HurleyWoodward has substantial financial experience across investment banking, corporate development, and corporate finance within the energy and midstream industry. Mr. Woodward previously served as the Senior Vice President, Crude OilFinance and OffshoreTreasurer of Enterprise Products, LLC from 2010 to 2012,Andeavor Logistics (NYSE: ANDX), where he was appointed by its board of directors to be the principal financial officer. Prior to this appointment, he led the newly formed crude oilinvestor relations for ANDX and offshore business segment. Mr. Hurley beganstarted his career with Andeavor, now Marathon Petroleum, in corporate development leading valuation, structuring and economic analysis on corporate and asset transactions. Before joining Andeavor, Mr. Woodward served as Vice President at Shell,RBC Capital Markets within its energy investment banking group where he served from 1981 to 2009, most
Matthew R. Lewis became the Chief Financial Officer of our General Partner in September 2020. Mr. Lewis has substantial financial experience having previously served in a number of corporate and operational finance roles in addition to middle market leveraged finance activities. Mr. Lewis previously served as Chief Financial Officer at Streamline Innovations, Inc., a privately held company providing specialty solutions for water and Secretary of our General Partner since March 2009. Mr. Stallings served as Chief Accounting Officergas treating processes within energy and Secretary of our General Partner from February 2007 to March 2009. Additionally, Mr. Stallings served as SemCorp’s Chief Accounting Officer from September 2002 to July 2008.industrial markets. Prior to joining SemCorp,Streamline, Mr. Stallings served as Chief Accounting Officer for Staffmark, Inc.Lewis was Director of Business Planning & Analysis at Andeavor Logistics (NYSE: ANDX), a temporary staffing company where he was responsible forserved on the public reportingextended leadership team and integration of numerous acquisitions during his tenure.coordinated all business planning and analysis activities. Previously, Mr. Stallings was also previously an audit manager for the public accounting firm of CoopersLewis served in multiple roles at Mid-Con Energy Partners, LP (NASDAQ: MCEP), prior to being appointed Vice President & Lybrand, workingChief Financial Officer in its Tulsa, Oklahoma office.2016. Mr. StallingsLewis received his Bachelor of Business Administration in accountingFinance from Baylor University and is a certified public accountant in the state of Oklahoma.
Jeffery A. Speer
has served as Chief Operating Officer of our General Partner since July 2013. Mr. Speer served as Senior Vice President-Operations of our General Partner from February 2010 to July 2013. Previously, Mr. Speer served as the Vice President of Operations of our asphalt and emulsion subsidiary since June 2009. Prior to joining our team, Mr. Speer served as Vice President of Operations for Koch Industries, Inc. and had operational responsibility for Koch’s crude oil, pipeline and trucking divisions in Oklahoma, Texas and Canada, as well as Koch’s agricultural and asphalt businesses. Mr. Speer has more thanJoel W. Kanvik has served as Chief CommercialLegal Officer since January 2017 and previously as Vice President Pipeline Marketing and Business Development of our General Partner since December 2013. Previously, heNovember 2016 and as Secretary since September 2018. Mr. Kanvik previously served as Vice Presidentthe Director of Business Development/Corporate StrategyU.S. Law and Assistant Secretary for Crestwood Equity Partners, L.P.Enbridge Energy Company, Inc., Crestwood Midstream Energy Partners, L.P.which he joined in January 2001. He provided legal and Inergy, L.P. from September 2008 until December 2013. Priorbusiness counsel to joining Inergy in 2008, he was a director infamily of corporations/limited partnerships, including the Energy Corporate Investment Banking groups of A.G. Edwards/Wachovia Securities. He has served on the board of directors of Abraxas Petroleum Corporation since October of 2009.development and execution for large-scale construction/acquisition projects, mergers and acquisitions, contracts and licenses, intellectual property, litigation management and corporate governance. Mr. MeltonKanvik received his Bachelor of ScienceArts in managementpolitical science from Northwestern University and his MasterJuris Doctor from the University of Business AdministrationWisconsin.
Michael McLanahan has served as the Chief Accounting Officer of our General Partner since April 2019. Mr. McLanahan previously served the Partnership in financevarious accounting roles, including the Corporate Controller, and prior to joining the Partnership, he served as an audit manager for the public accounting firm of Ernst & Young LLP. Mr. McLanahan received his Bachelor of Arts in accounting from Arkansas State University.
Duke R. Ligon
has served as a director of our General Partner since October 2008. He is an attorney and the current owner and manager of Mekusukey Oil Company, LLC. He served as Senior Vice President and General Counsel of Devon Energy Corporation from January 1997 until he retired in February 2007. From February 2007 to February 2010, Mr. Ligon served in the capacity of Strategic Advisor to Love’s Travel Stops & Country Stores, Inc., based in Oklahoma City, Oklahoma, and previously acted as Executive Director of the Love’s Entrepreneurship Center at Oklahoma City University. He is also a member of the board of directors of Heritage Trust Company, Security State Bank (in which he has a 14% beneficial ownership), Cavaloz Holdings, Inc. and Pardus Oil and Gas. He was formerly on the board of directors of PostRock Energy Corporation, System One, Orion California LP, Emerald Oil, Inc., SteelPath MLP, TransMontaigne Partners L.P., Pre-Paid Legal Services, Inc., Panhandle Oil and Gas Inc.,Vantage Drilling Company and TEPPCO Partners, L.P. Mr. Ligon received his undergraduate degree in chemistry from Westminster College and his law degree from the University of Texas School of Law. Mr. Ligon was selected to serve as a director on the Board due to his extensive business and leadership experience derived from his background as a director of various companies in the energy industry, as well as his financial and legal expertise.Steven M. Bradshaw
has served as a director of our General Partner since November 2009. He has over 35 years ofexperience in the global logistics and transportation industry and currently serves as the Managing Director at Global Logistics Solutions. From 2005 to 2009, Mr. Bradshaw served as Vice President-Administration of Premium Drilling, Inc., an offshore drilling contractor that provides jack-up drilling services to the international oil and gas industry. Previously, he served as Executive Vice President of Skaugen PetroTrans, Inc. from 2001 to 2003. He also served for 16 years in various operating andJohn A. Shapiro
has served as a director of our General Partner since November 2009. Mr. Shapiro retired as an officer at Morgan Stanley & Co., where he had served for more than 24 years in various capacities, most recently as Global Head of Commodities. While an officer at Morgan Stanley, Mr. Shapiro participated in the successful acquisitions of TransMontaigne Inc. and Heidmar Inc., and served as a member of the board of directors of both companies. Prior to joining Morgan Stanley & Co., Mr. Shapiro worked for Conoco, Inc. and New England Merchants National Bank. Mr. Shapiro has been a lecturer at Princeton University, Harvard University School of Government, HEC Business School (Paris, France) and Oxford University Energy Program (Oxford, UK). In addition, he serves on the board of directors of Citymeals-on-Wheels and serves as a senior advisor to Mountain Capital Partners, a Houston-based private equity firm focused on upstream E&P investments. Mr. Shapiro has served on the board of directors of Blue Wolf Mongolia Holdings. He received his Master of Business Administration from Harvard University and his bachelor’s degree in economics from Princeton University. Mr. Shapiro was selected to serve as a director on the Board due to his financial expertise and extensive industry experience developed through his work at Morgan Stanley & Co., and by serving as a director of other energy companies.W.R. “Lee” Adams has served as a director of our General Partner since February 2018. Mr. Adams joined Ergon, Inc. as the Vice President of Internal Audit in 2011 and continues to serve in that position.currently serves as Senior Vice President - Finance. He also serves as Chairman of Ergon’s Senior Management Team. He is a certified public accountant in the state of Mississippi and previously worked at Arthur Anderson and Haddox Reid Burkes & Calhoun, PLLC, where he specialized in assurance and advisory services in the areas of oil and gas, manufacturing, investments and employee benefit plans. Mr. Adams received his Bachelor of Accountancy from Mississippi State University, and also holds the designations of Chartered Global Management Accountant, Certified Fraud Examiner and Certified Internal Auditor. Mr. Adams currently serves as a member of the advisory council for Mississippi State’s Adkerson School of Accountancy and is the Chairman of the Board of Hartfield Academy. He has previously served as Chairman/President of the Petroleum Accounting Society of Mississippi and of the Mississippi Society of Certified Public Accountants, a 2,600-member trade association for CPAs practicing in the state of Mississippi. Mr. Adams was selected to serve as a director on the Board due to his affiliation with Ergon and his financial and business expertise.
Edward D. Brooks
has served as a director of our General Partner since October 2016. Mr. Brooks has been the Vice President of Business Development for Ergon Asphalt & Emulsions, Inc. since 2013. Mr. Brooks joined Ergon in 2007 to serve as the Manager of Business Development. Prior to joining Ergon, Mr. Brooks worked with Haddox Reid Burkes & Calhoun, PLLC as a manager in the assurance services division. Mr. Brooks received his Bachelor of Science in Business Administration in accounting and his Master of Business Administration from Mississippi College and is a certified public accountant in the state of Mississippi. He also holds a Chartered Global Management Accountant designation. Mr. Brooks was selected to serve as a director on the Board due to his affiliation with Ergon and his financial and business expertise.Joel D. Pastorek has served as a director of our General Partner since October 2016.August 2018. Mr. Langdon currently holdsPastorek serves as the following positions: Executive Vice President - Midstream & Logistics and Chief Operating Officer for Ergon; Sr. Viceas President for ISO Panels,of Ergon Terminalling, Inc.; Sr. Vice President for Ergon Teminalling, Inc.; Sr. Vice President for Ergon Baton Rouge, Inc.; Sr. Vice President for Ergon Knoxville, Inc.; Sr. Vice President for Ergon St. James, Inc.; Sr. Vice President for Ergon Texas Pipeline, Inc.; and Sr. Vice President for Ergon-Ironton, LLC. He also serves onas the Vice Chairman of the Ergon Operating Committee as the chairman and Ergon’s Executive Committee as a member.Senior Management Team. Mr. Langdon began his full-time professional career with Tenneco working as an associate engineer with their Tennessee Gas Pipeline group based in Houston, Texas. HePastorek joined Ergon Refining, Inc. in 1989 as a maintenance engineer in Vicksburg, Mississippi and held various other positions through 1997. In 1997, he assisted Ergon with2005. Prior to taking the formationrole of Ergon-West Virginia, Inc. in Newell, West Virginia and held the position of Maintenance/Engineering Manager until 2000. In 2000,Executive Vice President, Mr. Langdon joined the Ergon corporate office group and assisted the Real Estate segment of the company for the next two years in the development business. Over the next 14 years, hePastorek held various positions within Ergon including Vice President-Corporate Engineering and Vice President-CorporateSenior Project Manager, Manager of Corporate Maintenance, as well as Sr.General Manager - Ergon Terminaling, Inc., Vice President for- Ergon Asphalt & Emulsions,Terminaling, Inc., and President - Ergon Terminaling, Inc. Mr. LangdonPastorek received his degreeBachelor of Science in civilmechanical engineering from Mississippi State University.University and is a licensed professional engineer in the state of Mississippi. Mr. LangdonPastorek was selected to serve as a director on the Board due to his affiliation with Ergon and his financial and business expertise.
Robert H. Lampton
has served as a director of our General Partner since October 2016. Mr. Lampton has been with Ergon since 1983, and currently serves as President of the Supply and DistributionWilliam W. Lampton
has served as a director of our General Partner since October 2016. Mr. Lampton has been with Ergon since 1979, and currently is a member of Ergon’s board of directors. He previously served as President of Ergon’s Asphalt Groups and as Chairman of the board of directors of Ergon Asphalt & Emulsions, Inc. Mr. Lampton currently is a board member of Mississippi Economic Council, Boy Scouts of America, Andrew Jackson Council, Greater Jackson Chamber Partnership (of which he is a past chairman), and Mississippi Baptist Health Foundation. HeIndependence of Directors
Our General Partner currently has eight directors, three of whom (Messrs. Bradshaw, Ligon and Shapiro) are “independent” as defined under the independence standards established by Nasdaq. Nasdaq’s independence definition includes a series of objective tests, including that the director is not an employee of the company and has not engaged in various types of business dealings with the company. In addition, the Board has made a subjective determination as to each independent director that no relationships exist which, in the opinion of the Board, would interfere with the exercise of independent judgment in carrying out the responsibilities of a director. In making these determinations, the directors reviewed and discussed information provided by the directors and us with regard to each director’s business and personal activities as they may relate to us and our management. Nasdaq does not require a listed limited partnership like us to have a majority of independent directors on the Board or to establish a nominating committee.
In addition, the members of the audit committee also each qualify as “independent” under special standards established by the SEC for members of audit committees, and the audit committee includes at least one member who is determined by the Board to meet the qualifications of an “audit committee financial expert” in accordance with SEC rules, including that the person meets the relevant definition of an “independent” director. John A. Shapiro is the independent director who has been determined to be an audit committee financial expert. Unitholders should understand that this designation is a disclosure requirement of the SEC related to experience and understanding with respect to certain accounting and auditing matters. The designation does not impose any duties, obligations or liability that are greater than are generally imposed on a member of the audit committee and the Board, and the designation of a director as an audit committee financial expert pursuant to this SEC requirement does not affect the duties, obligations or liability of any other member of the audit committee or the Board.
Board Leadership Structure and Risk Oversight
The Chief Executive Officer and Chairmanchairman of the Board positions of our General Partner are held by separate individuals in recognition of the differences between the two roles. We have taken this position to achieve an appropriate balance with regard to our strategic direction, oversight of management, unitholder interests and director independence. Our General Partner’s Chief Executive Officer is responsible for setting our strategic direction and overseeing our day-to-day performance. Our General Partner’s Chairmanchairman of the Board is an independent director who provides guidance to the Chief Executive Officer and sets the agenda for and presides over Board meetings.
Our Board is engaged in the oversight of risk through regular updates from our management team regarding those risks confronting us, the actions and strategies necessary to mitigate those risks and the status and effectiveness of those actions and strategies. These regular updates are provided at meetings of the Board and the audit committee as well as other meetings with the Chairmanchairman of the Board, the Chief Executive Officer and other members of our General Partner’s management team.
Board Committees
We have standing conflicts, audit and compensation committees of the Board. Each member of the audit, compensation and conflicts committees is an independent director in accordance with Nasdaq and applicable securities laws. Each of the audit, compensation and conflicts committees has a written charter approved by the Board. The written charter for each of these committees is available on our web site at www.bkep.com under the “Investors - Corporate Governance” section. We will also provide a copy of any of our committee charters to any of our unitholders without charge upon written request to the attention of Investor Relations at 6060 American Plaza, Suite 600, Tulsa, Oklahoma 74135. The current members of the audit, compensation and conflicts committees of the Board and a brief description of the functions performed by each committee are set forth below.
Conflicts Committee
. The members of the conflicts committee are Messrs. Bradshaw (chairman), Ligon and Shapiro. The primary responsibility of the conflicts committee is to review matters that the directors believe may involve conflicts of interest. The conflicts committee determines if the resolution of the conflict of interest is fair and reasonable to us. The conflicts committee may retain independent legal and financial advisors to assist in its evaluation of a transaction. The members of the conflicts committee may not be officers or employees of our General Partner or directors, officers or employees of its affiliates and must meet the independence standards to serve on an audit committee of a board of directors established by any national securities exchange upon which our common units are traded and the SEC. Any matters approved by the conflicts committee will be conclusively deemed to be fair and reasonable to us, approved by all of our partners and not a breach by our General Partner of any duties it may owe us or our unitholders.Audit Committee
. The members of the audit committee are Messrs. Bradshaw, Ligon (chairman) and Shapiro. The primary responsibilities of the audit committee are to assist the Board in its general oversight of our financial reporting, internal controls and audit functions, and it is directly responsible for the appointment, retention, compensation and oversight of the work of our independent auditors.For information regarding our audit committee financial expert, see “Independence of Directors” above.
Compensation Committee
. The members of the compensation committee are Messrs. Bradshaw, Ligon and Shapiro (chairman). The primary responsibility of the compensation committee is to oversee compensation decisions for the outside directors of our General Partner and executive officers of our General Partner, as well as administer the General Partner’s Long-Term Incentive Plan.Code of Ethics and Business Conduct
Our General Partner has adopted a Code of Business Conduct and Ethics applicable to all of our General Partner’s employees, including all officers, and including our General Partner’s independent directors, who are not employees of our General Partner, with regard to their activities relating to us. The Code of Business Conduct and Ethics incorporates guidelines designed to deter wrongdoing and to promote honest and ethical conduct and compliance with applicable laws and regulations. It also incorporates our expectations of our General Partner’s employees that enable us to provide accurate and timely disclosure in our filings with the Securities and Exchange Commission and other public communications. The Code of Business Conduct and Ethics is publicly available under the “Investors - Corporate Governance - Code of Business Conduct and Ethics” section of our web sitewebsite at www.bkep.com. The information contained on, or connected to, our web sitewebsite is not incorporated by reference into this annual report on Form 10-K and should not be considered part of this or any other report that we file with, or furnish to, the SEC. We will also provide a copy of the Code of Business Conduct and Ethics to any of our unitholders without charge upon written request to the attention of Investor Relations at 6060 American Plaza, Suite 600, Tulsa, Oklahoma 74135. If any substantive amendments are made to the Code of Business Conduct and Ethics, or if we or our General Partner grant any waiver, including any implicit waiver, from a provision of the code to any of our General Partner’s executive officers and directors, we will disclose the nature of such amendment or waiver on that web site or in a current report on Form 8-K.
Reimbursement of Expenses of our General Partner
Pursuant to our partnership agreement, our General Partner and its affiliates are entitled to receive reimbursement for the payment of expenses related to our operations and for the provision of various general and administrative services for our benefit.
Throughout this section, each person who served as the Principal Executive Officer (“PEO”) during 2017, each person who served as2020, the Principal Financial Officer (“PFO”) during 2017 and the threetwo most highly compensated executive officers other
Mark A. Hurley, Chief Executive Officer;Officer through June 2020;
D. Andrew Woodward, Chief Executive Officer effective June 2020, Chief Financial Officer and Secretary;through June 2020;
• | Jeffery A. Speer, Chief Operating Officer; and | |
| • | Joel Kanvik, Chief Legal Officer. |
As is the case with many publicly traded partnerships, we have not historically directly employed any persons responsible for managing or operating us or for providing services relating to day-to-day business affairs. Our General Partner manages our operations and activities, and its Board and officers make decisions on our behalf. The compensation for the NEOs for services rendered to us is determined by the compensation committee of our General Partner.
Employment Agreements. Mr. Hurley, the awards vest on January 1, 2021. Mr. Hurley’s phantom units will vest on January 1, 2019. These phantom units contain distribution equivalent rights that entitle the holder of such units to receive a cash payment equal to the amount of any ordinary quarterly cash distribution paid to our common unitholders. Please see “-2017 Incentive Compensation” for a discussion of these awards.
Except in the event of termination for Cause as defined therein, termination by Mr. HurleyWoodward other than for Good Reason as defined therein, termination after the expiration of the term of Mr. Hurley’sWoodward’s employment agreement or termination due to death or disability, Mr. Hurley’sWoodward’s employment agreement provides for payment of any unpaid base salary and vested or unvested benefits under any incentive plans, a lump sum payment equal to 12 months of base salary, any unpaid make-whole payments and Mr. HurleyWoodward will also be entitled to continued
| Name | Benefit Type | Termination without Cause or Resignation for Good Reason | Termination without Cause or Resignation for Good Reason in Connection with A Change in Control | ||||||
| Mark A. Hurley | Lump Sum Severance | $ | 925,000 | (1) | $ | 925,000 | (1) | ||
| Benefits Continuation | $ | — | (2) | $ | — | (2) | |||
| Alex G. Stallings | Lump Sum Severance | $ | 326,000 | $ | 652,000 | ||||
| Benefits Continuation | $ | 34,000 | $ | 34,000 | |||||
Long-Term Incentive Plan.
General. Our General Partner has adopted the Long-Term Incentive Plan (“LTIP”)Restricted units have been granted to eligible individuals under the LTIP. A unit award is an awardindependent directors of common units that are fully vested upon grant and not subject to forfeiture.
Phantom units have been granted to employees, including executive officers. A phantom unit is a notional unit that entitles the grantee to receive a common unit upon the vesting of the phantom unit or, at the discretion of the compensation committee, cash equal to the fair market value of a common unit. The compensation committee may make grants of restricted units and phantom units under the LTIP to eligible individuals containing such terms, consistent with the LTIP, as the compensation committee may determine, including the period over which restricted units and phantom units granted will vest. The compensation committee may, at its discretion, base vesting on the grantee’s completion of a period of service or upon the achievement of specified performance goals or other criteria.
Unit Purchase Plan.
Separation Agreement with Mr. Hurley. In connection with Mr. Hurley’s departure as Chief Executive Officer on June 22, 2020 (the “Separation Date”), Mr. Hurley entered into a separation agreement and general release of claims (the “Separation Agreement”) pursuant to which Mr. Hurley received cash payments in a total amount of $353,500. In addition, pursuant to the Separation Agreement, Mr. Hurley's outstanding and unvested award of 75,400 phantom units was accelerated in full and settled in common units. The payments and benefits set forth in the Separation Agreement were provided in exchange for Mr. Hurley providing a customary release of claims in favor of our partnership. In addition, the Separation Agreement provided that Mr. Hurley would provide assistance with respect to transitioning matters related to his job responsibilities for the 60-day period following the separation date.
Summary Compensation Table
The following table summarizes the compensation of our NEOs for the years ended 2017, 20162020 and 2015.2019. Mr. Kanvik was not an NEO in 2016 or 2015.
| Name and Position | Year | Salary ($) | Bonus ($)(1) | Stock Awards ($)(2) | Option Awards ($) | Non-Equity Incentive Compensation ($) | All Other Compensation ($)(3) | Total ($) |
Mark A. Hurley Chief Executive Officer | 2017 | 448,750 | 400,000 | — | — | — | 42,991 | 891,741 |
| 2016 | 445,000 | 475,000 | — | — | — | 43,075 | 963,075 | |
| 2015 | 442,500 | 450,000 | — | — | — | 43,929 | 936,429 | |
Alex G. Stallings Chief Financial Officer and Secretary | 2017 | 324,450 | 160,000 | 155,870 | — | — | 76,541 | 716,861 |
| 2016 | 319,800 | 165,000 | 142,528 | — | — | 71,237 | 698,565 | |
| 2015 | 317,850 | 145,000 | 120,187 | — | — | 63,228 | 646,265 | |
Jeffery A. Speer Chief Operating Officer | 2017 | 258,333 | 187,000 | 160,904 | — | — | 73,424 | 679,661 |
| 2016 | 237,000 | 160,000 | 175,784 | — | — | 65,310 | 638,094 | |
| 2015 | 226,105 | 135,000 | 106,951 | — | — | 59,535 | 527,591 | |
Brian L. Melton Chief Commercial Officer | 2017 | 242,250 | 110,000 | 110,611 | — | — | 60,578 | 523,439 |
| 2016 | 237,000 | 155,000 | 104,520 | — | — | 57,005 | 553,525 | |
| 2015 | 235,250 | 155,000 | 101,858 | — | — | 45,154 | 537,262 | |
Joel W. Kanvik Chief Legal Officer | 2017 | 260,000 | 256,000 | 90,505 | — | — | 29,401 | 635,906 |
Stock | All Other | ||||||||||||||||||||
Salary | Bonus | Awards | Compensation | Total | |||||||||||||||||
Name and Position | Year | ($) | ($)(1) | ($)(2) | ($)(3) | ($) | |||||||||||||||
| Mark A. Hurley, | 2020 | 216,634 | — | 67,860 | 416,378 | 700,872 | |||||||||||||||
Chief Executive Officer through June 22, 2020 | 2019 | 450,000 | 150,000 | — | 24,888 | 624,888 | |||||||||||||||
| D. Andrew Woodward, | 2020 | 378,602 | 500,000 | 72,102 | 54,878 | 1,005,582 | |||||||||||||||
| CEO effective June 22, 2020; CFO through June 22, 2020 | 2019 | 238,718 | 435,000 | 49,861 | 63,123 | 786,702 | |||||||||||||||
| Jeffery A. Speer, | 2020 | 294,000 | 220,000 | 66,733 | 52,040 | 632,773 | |||||||||||||||
Chief Operating Officer | 2019 | 285,000 | 165,000 | 71,668 | 48,680 | 570,348 | |||||||||||||||
| Joel Kanvik, Chief Legal Officer | 2020 | 283,000 | 180,000 | 43,180 | 35,163 | 541,343 | |||||||||||||||
| (1) |
| $150,000. | |
(2) | Dollar amounts represent the grant date fair value of awards granted in each year with respect to phantom unit grants under the LTIP. |
| 2019. | |
(3) | We provide distribution equivalent rights (“DERs”) under the LTIP, |
| Estimated Future Payments Under Non-Equity Incentive Plan Awards | Estimated Future Payouts Under Equity Incentive Plan Awards | |||||||||||||
| Name | Grant Date | Threshold ($) | Target ($) | Maximum ($) | Threshold ($) | Target ($) | Maximum ($) | All Other Unit Awards: Number of Units (#)(1)(2) | All Other Unit Awards: Number of Securities Underlying Options (#) | Exercise or Base Price of Option Awards ($/Sh) | Grant Date Fair Value of Unit and Option Awards ($) | |||
| Alex G. Stallings | March 9, 2017 | — | — | — | — | — | — | 21,800 | — | — | 155,870 | |||
| Jeffrey A. Speer | March 9, 2017 | — | — | — | — | — | — | 22,504 | — | — | 160,904 | |||
| Brian L. Melton | March 9, 2017 | — | — | — | — | — | — | 15,471 | — | — | 110,611 | |||
| Joel W. Kanvik | March 9, 2017 | — | — | — | — | — | — | 12,658 | — | — | 90,505 | |||
DERs | Severance | 401(k) plan contributions | Other | Total | ||||||||||||||||
Mark A. Hurley | $ | 6,032 | $ | 353,500 | $ | 14,250 | $ | 42,596 | $ | 416,378 | ||||||||||
D. Andrew Woodward | $ | 17,000 | $ | - | $ | 14,250 | $ | 23,628 | $ | 54,878 | ||||||||||
Jeffery A. Speer | $ | 23,708 | $ | - | $ | 14,250 | $ | 14,082 | $ | 52,040 | ||||||||||
| Joel Kanvik | $ | 15,171 | $ | - | $ | 14,250 | $ | 5,742 | $ | 35,163 | ||||||||||
Outstanding Equity Awards at Fiscal Year-End 2017
The following tables providetable provides information concerning all outstanding equity awards made to a NEO as of December 31, 2017, including, but not limited to, awards made2020, under our General Partner’s LTIP.
| Option Awards | Stock Awards | |||||||||||||||||||
| Name | Number of Securities Underlying Unexercised Options (#) Exercisable | Number of Securities Underlying Unexercised Options (#) Unexercisable | Equity Incentive Plan Awards: Number of Securities Underlying Unexercised Unearned Options (#) | Option Exercise Price ($) | Option Expiration Date | Number of Units That Have Not Vested (#) | Market Value of Units That Have Not Vested ($) | Equity Incentive Plan Awards: Number of Unearned Units or Other Rights That Have Not Vested (#) | Equity Incentive Plan Awards: Market or Payout Value of Unearned Units or Other Rights That Have Not Vested ($)(1)(5) | |||||||||||
| Alex G. Stallings | — | — | — | — | — | — | — | 21,800 | (2) | 111,180 | ||||||||||
| — | — | — | — | — | — | — | 29,880 | (3) | 152,388 | |||||||||||
| — | — | — | — | — | — | — | 15,528 | (4) | 79,193 | |||||||||||
| Jeffery A. Speer | — | — | — | — | — | — | — | 22,504 | (2) | 114,770 | ||||||||||
| — | — | — | — | — | — | — | 26,892 | (3) | 137,149 | |||||||||||
| — | — | — | — | — | — | — | 13,818 | (4) | 70,472 | |||||||||||
| Brian L. Melton | — | — | — | — | — | — | — | 15,471 | (2) | 78,902 | ||||||||||
| — | — | — | — | — | — | — | 21,912 | (3) | 111,751 | |||||||||||
| — | — | — | — | — | — | — | 13,160 | (4) | 67,116 | |||||||||||
| Joel W. Kanvik | — | — | — | — | — | — | — | 12,658 | (2) | 64,556 | ||||||||||
Stock Awards | |||||||||
Name | Number of Units That Have Not Vested (#) | Market Value of Units That Have Not Vested ($)(1) | |||||||
D. Andrew Woodward | 80,113 | (2 | ) | 159,425 | |||||
| 46,168 | (3 | ) | 91,874 | ||||||
Jeffery A. Speer | 74,148 | (2 | ) | 147,555 | |||||
| 62,867 | (3 | ) | 125,105 | ||||||
| 29,700 | (4 | ) | 59,103 | ||||||
Joel Kanvik | 47,978 | (2 | ) | 95,476 | |||||
| 38,558 | (3 | ) | 76,730 | ||||||
| 20,278 | (4 | ) | 40,353 | ||||||
(1) | |
Market value of awards is calculated as the product of the closing market price of |
| 2020. | |
| (2) | Represents phantom units granted in |
(3) | Represents phantom units granted in |
(4) | |
Represents phantom units granted in |
Stock Awards(1) | ||||||
| Name | Number of Shares Acquired on Vesting (#) | Value Realized on Vesting ($) | ||||
| Mark A. Hurley | 100,000 | 575,000 | (2) | |||
| Alex G. Stallings | 17,089 | 120,477 | (3) | |||
| Jeffrey A. Speer | 16,538 | 116,593 | (3) | |||
| Brian L. Melton | 12,679 | 89,387 | (3) | |||
Director Compensation for Fiscal Year 2017
| Name | Fees Earned or Paid in Cash ($) | Stock Awards(3) ($) | Option Awards ($) | Non-Equity Incentive Plan Compensation ($) | Change in Pension Value and Nonqualified Deferred Compensation Earnings ($) | All Other Compensation ($) | Total ($) |
| Duke R. Ligon | 131,117 | 55,000 | — | — | — | — | 186,117 |
| Steven M. Bradshaw | 131,117 | 45,000 | — | — | — | — | 176,117 |
| John A. Shapiro | 131,117 | 45,000 | — | — | — | — | 176,117 |
Donald M. Brooks(1)(2) | — | — | — | — | — | — | — |
Edward D. Brooks(1) | — | — | — | — | — | — | — |
Jimmy A. Langdon(1) | — | — | — | — | — | — | — |
Robert H. Lampton(1) | — | — | — | — | — | — | — |
William W. Lampton(1) | — | — | — | — | — | — | — |
Fees Earned or Paid in Cash | Stock Awards(2) | Total | ||||||||||
Name | ($) | ($) | ($) | |||||||||
| Duke R. Ligon | 195,000 | 11,708 | 206,708 | |||||||||
| Steven M. Bradshaw | 185,000 | 11,708 | 196,708 | |||||||||
| John A. Shapiro | 185,000 | 11,708 | 196,708 | |||||||||
Edward D. Brooks(1) | — | — | — | |||||||||
Joel D. Pastorek(1) | — | — | — | |||||||||
W.R. “Lee” Adams(1) | — | — | — | |||||||||
Robert H. Lampton(1) | — | — | — | |||||||||
William W. Lampton(1) | — | — | — | |||||||||
(1) | |
Affiliated with Ergon. |
(2) |
These amounts represent the grant date fair value of restricted and unrestricted units awarded under the LTIP. The grant date fair value of these awards is computed in accordance with ASC 718 - Compensation—Stock Compensation. |
Directors who are not officers or employees of any controlling entity or their affiliates receive compensation for attending meetings of the Board and committees thereof. Such directors receive the following:
(i) | $75,000 per year as an annual retainer fee paid in cash; |
(ii) | $5,000 per year for each Board committee on which such director serves (except that the chairperson of each committee will receive $10,000 per year for serving as chairperson of such committee) |
| ; | ||
(iii) | $10,000 per year if Chairman of the |
| Board; | ||
(iv) | $2,000 per diem for each Board or committee meeting attended; |
(v) | 5,000 restricted units upon becoming a director, vesting in one-third increments over a three-year period; |
(vi) | 2,500 restricted units |
(vii) | reimbursement for out-of-pocket expenses associated with attending Board or committee meetings; and |
(viii) | director and officer liability insurance coverage. |
In addition, each director is fully indemnified by us for actions associated with being a director to the fullest extent permitted under Delaware law.
Item 12. Security Ownership of Certain Beneficial Owners and Management and Related Unitholder Matters.
Security Ownership of Certain Beneficial Owners and Management
The following table sets forth the beneficial ownership of our units as of March 1, 20184, 2021, held by:
each person or group of persons who beneficially own 5% or more of the then outstanding common units or Preferred Units;
all of the directors of our General Partner;
each NEO of our General Partner; and
all current directors and NEOsexecutive officers of our General Partner as a group.
Except as indicated by footnote, the persons named in the table below have sole voting and investment power with respect to all units shown as beneficially owned by them, subject to community property laws where applicable. Percentage of total common and Preferred Units beneficially owned is based on 40,310,27241,468,125 common units and 35,125,202 Preferred Units outstanding as of March 1, 2018.
Name of Beneficial Owner(1) | Common Units Beneficially Owned | Percentage of Common Units Beneficially Owned | Preferred Units Beneficially Owned | Percentage of Preferred Units Beneficially Owned | Percentage of Total Common and Preferred Units Beneficially Owned | ||
Ergon Asphalt & Emulsions, Inc.(2) | 2,745,837 | 6.8% | 18,312,968 | 52.1% | 27.9% | ||
Mark A. Hurley(5) | 362,999 | * | — | — | * | ||
Alex G. Stallings(3)(5) | 97,834 | * | 20,000 | * | * | ||
Jeffery A. Speer(5) | 52,031 | * | — | — | * | ||
| Joel W. Kanvik | 3,982 | * | — | — | * | ||
Brian L. Melton(5) | 22,371 | * | 400 | * | * | ||
Duke R. Ligon(4) | 58,101 | * | — | — | * | ||
Steven M. Bradshaw(4) | 39,356 | * | — | — | * | ||
John A. Shapiro(4) | 37,766 | * | — | — | * | ||
W.R. “Lee” Adams(2)(6) | 50,000 | * | — | — | * | ||
Edward D. Brooks(2)(6) | — | — | — | — | — | ||
Jimmy A. Langdon(2)(6) | — | — | — | — | — | ||
Robert H. Lampton(2)(6) | 150,000 | * | — | — | * | ||
William W. Lampton(2)(6) | 103,350 | * | — | — | * | ||
Blueknight Energy Holding, Inc.(7) | — | — | 2,488,789 | 7.1% | 3.3% | ||
CB-Blueknight, LLC(8) | — | — | 2,488,789 | 7.1% | 3.3% | ||
MSD Capital, L.P.(9) | 240,000 | * | 1,907,711 | 5.4% | 2.8% | ||
Swank Capital, L.L.C.(10) | 4,430,929 | 11.0% | 2,269,729 | 6.5% | 8.9% | ||
Neuberger Berman Group LLC(11) | 6,175,108 | 15.3% | — | — | 8.2% | ||
DG Capital Management, Inc.(12) | 3,175,947 | 7.9% | — | — | 4.2% | ||
Clearbridge Investments, LLC(13) | 3,278,894 | 8.1% | — | — | 4.3% | ||
Oppenheimer Funds, Inc.(14) | 2,825,482 | 7.0% | — | — | 3.7% | ||
| All current executive officers and directors as a group (14 persons) | 1,037,212 | 2.6% | 20,400 | * | 1.4% | ||
Name of Beneficial Owner(1) | Common Units Beneficially Owned | Percentage of Common Units Beneficially Owned | Preferred Units Beneficially Owned | Percentage of Preferred Units Beneficially Owned | Percentage of Total Common and Preferred Units Beneficially Owned | |||||||||||||||
| Ergon Asphalt & Emulsions, Inc.(2) | 2,745,837 | 6.6 | % | 20,801,757 | 59.2 | % | 30.7 | % | ||||||||||||
| D. Andrew Woodward(3) | 72,892 | * | — | — | * | |||||||||||||||
Jeffery A. Speer(3) | 106,542 | * | — | — | * | |||||||||||||||
Joel W. Kanvik(3) | 25,691 | * | — | — | * | |||||||||||||||
Duke R. Ligon(4) | 81,052 | * | — | — | * | |||||||||||||||
Steven M. Bradshaw(4) | 59,182 | * | — | — | * | |||||||||||||||
John A. Shapiro(4) | 57,592 | * | — | — | * | |||||||||||||||
W.R. “Lee” Adams(2)(5) | 50,000 | * | — | — | * | |||||||||||||||
Edward D. Brooks(2)(5) | — | * | — | — | * | |||||||||||||||
Joel D. Pastorek(2)(5) | — | * | — | — | * | |||||||||||||||
Robert H. Lampton(2)(5) | — | * | — | — | * | |||||||||||||||
William W. Lampton(2)(5) | — | * | — | — | * | |||||||||||||||
Zazove Associates, Inc.(6) | 3,035,178 | 7.3 | % | — | — | 4.0 | % | |||||||||||||
Invesco Ltd.(7) | 2,921,669 | 7.0 | % | — | — | 3.8 | % | |||||||||||||
| DG Capital Management, Inc.(8) | 2,447,437 | 5.9 | % | 1,112,623 | 3.2 | % | 4.6 | % | ||||||||||||
All current executive officers and directors as a group (13 persons) | 465,712 | 1.1 | % | — | — | 0.6 | % | |||||||||||||
* | |
Less than 1%. |
(1) | Unless otherwise indicated, the address for all beneficial owners in this table is 6060 American Plaza, Suite 600, Tulsa, Oklahoma 74135. |
(2) | Ergon Asphalt & Emulsions, Inc. owns Ergon Asphalt Holdings, LLC. The address for Ergon is 2829 Lakeland Drive, Suite 2000, Jackson, Mississippi 39215. Ergon Asphalt Holdings, LLC owns 100% of Blueknight GP Holding, LLC, which owns the membership interest in our General Partner. |
(3) | Does not include unvested phantom units |
| granted under the Long-Term Incentive Plan, none of which will vest within 60 days of the date hereof. | |
(4) | Does not include unvested restricted units granted under the Long-Term Incentive Plan, none of which will vest within 60 days of the date hereof. |
(5) |
Messrs. Adams, Brooks, |
| Based on a Schedule |
| 1001 Tahoe Blvd., Incline Village, NV 89451. | |
| Based on |
| 1800, Atlanta, GA 30309. | |
| Based on a Schedule 13G/A filed February |
Securities Authorized for Issuance under Equity Compensation Plans (as of March 1, 2018)
Equity Compensation Plan Information(1) | ||||||
(a) Number of securities to be issued upon exercise of outstanding options, warrants and rights | (b) Weighted-average exercise price of outstanding options, warrants and rights | (c) Number of securities remaining available for future issuance under equity compensation plans (excluding securities reflected in column (a)) | ||||
| Equity compensation plans approved by security holders | 702,548 | $— | 2,387,563 | |||
| Equity compensation plans not approved by security holders | N/A | N/A | N/A | |||
| Total | 702,548 | $— | 2,387,563 | |||
Equity Compensation Plan Information(1) | ||||||||||||
(a) Number of securities to be issued upon exercise of outstanding options, warrants and rights | (b) Weighted-average exercise price of outstanding options, warrants and rights | (c) Number of securities remaining available for future issuance under equity compensation plans (excluding securities reflected in column (a)) | ||||||||||
Equity compensation plans approved by security holders | 1,020,370 | $ | — | 4,981,888 | ||||||||
Equity compensation plans not approved by security holders | N/A | N/A | N/A | |||||||||
Total | 1,020,370 | $ | — | 4,981,888 | ||||||||
(1) | |
Our General Partner has adopted and maintains the LTIP and Unit Purchase Plan for employees, consultants and directors of our General Partner and its affiliates who perform services for us. An aggregate of |
Distributions and Payments to Our General Partner and Its Affiliates
Our General Partner is owned by Ergon, which also owns 18,312,96820,801,757 of the 35,125,202 outstanding Preferred Units and 3,049,1872,795,837 of the 40,310,27241,468,125 outstanding common units, representing an aggregate 28.3%30.8% limited partner interest in us as of March 1, 2018.4, 2021. In addition, our General Partner owns a 1.6% general partner interest in us and the incentive distribution rights. For a description of the distributions and payments our General Partner is entitled to receive, see “Item 5-Market for Registrant’s Common Equity, Related Unitholder Matters and Issuer Purchases of Equity Securities-General Partner Interest and Incentive Distribution Rights.”
Agreements with Related Parties and Affiliates
For information regarding material agreements with related parties and affiliates, see Note 1312 to our consolidated financial statements.
Indemnification of Directors and Officers
Under our partnership agreement, in most circumstances, we will indemnify the following persons, to the fullest extent permitted by law, from and against all losses, claims, damages or similar events:
• | our General Partner; | |
• | any departing general partner; | |
• | any person who is or was an affiliate of a general partner or any departing general partner; | |
• | any person who is or was a director, officer, member, partner, fiduciary or trustee of any entity set forth in the preceding three bullet points; | |
• | any person who is or was serving as director, officer, member, partner, fiduciary or trustee of another person at the request of our General Partner or any departing general partner; and | |
• | any person designated by our General Partner. |
Any indemnification under these provisions will only be out of our assets. Unless it otherwise agrees, our General Partner will not be liable for, or have any obligation to contribute or lend funds or assets to us to enable us to effectuate, indemnification. We may purchase insurance against liabilities asserted against us and expenses incurred by persons for our activities, regardless of whether we would have the power to indemnify the person against liabilities under our partnership agreement.
We and our General Partner have also entered into separate indemnification agreements with each of the directors and officers of our General Partner. The terms of the indemnification agreements are consistent with the terms of the indemnification provided by our partnership agreement and our General Partner’s limited liability company agreement. The indemnification agreements also provide that we and our General Partner must advance payment of certain expenses to such indemnified directors and officers, including fees of counsel, subject to receipt of an undertaking from the indemnitee to return such advance if it is it is ultimately determined that the indemnitee is not entitled to indemnification.
Approval and Review of Related-Party Transactions
If we contemplate entering into a transaction, other than a routine or ordinary course of business transaction, in which a related person will have a direct or indirect material interest, the proposed transaction is submitted for consideration to the Board of our General Partner or to our management, as appropriate. If the Board is involved in the approval process, it determines whether to refer the matter to the conflicts committee of the Board, as constituted under our limited partnership agreement. If a matter is referred to the conflicts committee, it obtains information regarding the proposed transaction from management and determines whether to engage independent legal counsel or an independent financial advisor to advise the members of the committee regarding the transaction. If the conflicts committee retains such counsel or financial advisor, it considers such advice and, in the case of a financial advisor, such advisor’s opinion as to whether the transaction is fair and reasonable to us and to our unitholders.
Director Independence
Please see “
PricewaterhouseCoopers LLP was engaged as our principal accountant.accountant through the first quarter of 2020. We engaged Ernst & Young as our principal accountant in June 2020. The following table summarizes fees we have paid PricewaterhouseCoopers LLP and Ernst & Young for independent auditing, tax and related services for each of the last two fiscal years:
| Year ended December 31, | ||||||||
| 2016 | 2017 | |||||||
Audit fees(1) | $ | 817,822 | $ | 671,164 | ||||
Audit-related fees(2) | — | — | ||||||
Tax fees(3) | 238,697 | 299,261 | ||||||
All other fees(4) | — | — | ||||||
Year ended December 31, | ||||||||
2019 | 2020 | |||||||
| Audit fees(1) | $ | 736,774 | $ | 480,510 | ||||
Audit-related fees(2) | - | - | ||||||
| Tax fees(3) | 280,705 | 164,526 | ||||||
All other fees(4) | - | - | ||||||
(1) | |
Audit fees represent amounts billed for each of the years presented for professional services rendered in connection with (a) the audit of our annual financial statements and internal controls over financial reporting, (b) the review of our quarterly financial statements and (c) those services normally provided in connection with statutory and regulatory filings or engagements, including comfort letters, consents and other services related to SEC matters. |
(2) | Audit-related fees represent amounts billed for each of the years presented for assurance and related services that are reasonably related to the performance of the annual audit or quarterly reviews. |
(3) | Tax fees represent amounts billed for each of the years presented for professional services rendered in connection with tax compliance, tax advice and tax planning. This category primarily includes services relating to the preparation of unitholder annual K-1 |
| statements by PricewaterhouseCoopers LLP. Ernst & Young does not provide us tax services. | |
(4) | All other fees represent amounts billed for each of the years presented for services not classifiable under the other categories listed in the table above. |
All audit and non-audit services provided by PricewaterhouseCoopers LLP and Ernst & Young were/are subject to pre-approval by our audit committee to ensure that the provisions of such services do not impair the auditor’s independence. Under our pre-approval policy, the audit committee is informed of each engagement of the independent auditor to provide services under the policy. The audit committee of our General Partner has approved the use of PricewaterhouseCoopers LLPErnst & Young as our independent principal accountant.
(a) | Financial Statements and Schedules |
(1) | See the Index to Financial Statements on page F-1. |
(2) | All schedules have been omitted because they are either not applicable, not required or the information called for therein appears in the consolidated financial statements or notes thereto |
(3) | Exhibits |
INDEX TO EXHIBITS
Exhibit Number | Description |
3.1 | |
| 3.2 | |
3.3 | |
3.4 | |
3.6 | |
4.1 | |
4.2 | |
4.3 | |
4.4 | |
10.1† |
10.2† | |
10.3† |
10.4† |
_________
* | |
Filed herewith. |
** | |
Furnished herewith |
# | |
Certain portions of this exhibit are subject to a request for confidential treatment by the Securities and Exchange Commission. The omitted portions have been separately filed with the Securities and Exchange Commission. |
† | |
As required by Item 15(a)(3) of Form 10-K, this exhibit is identified as a compensatory plan or arrangement. |
| & | |||
None.
SIGNATURES
Pursuant to the requirements of Section 13 or 15(d) of the Securities Exchange Act of 1934, the registrant has duly caused this report to be signed on its behalf by the undersigned thereunto duly authorized.
BLUEKNIGHT ENERGY PARTNERS, L.P. | |||
By: | Blueknight Energy Partners G.P., L.L.C. | ||
Its General Partner | |||
By: | /s/ Matthew R. Lewis | ||
Matthew R. Lewis | |||
Chief Financial Officer | |||
By: | /s/ Michael McLanahan | ||
Michael McLanahan | |||
Chief Accounting Officer | |||
Pursuant to the requirements of the Securities Exchange Act of 1934, this report has been signed below by the following persons on behalf of the registrant and in the capacities indicated on March 10, 2021
Signature | Title |
/s/ D. Andrew Woodward | Chief Executive Officer and Director (Principal Executive Officer) |
D. Andrew Woodward | |
/s/ Matthew R. Lewis | Chief Financial Officer (Principal Financial Officer) |
| Matthew R. Lewis | |
/s/ Michael McLanahan | Chief Accounting Officer (Principal Accounting Officer) |
Michael McLanahan | |
/s/ Duke R. Ligon | Director |
Duke R. Ligon | |
/s/ Steven M. Bradshaw | Director |
Steven M. Bradshaw | |
/s/ John A. Shapiro | Director |
John A. Shapiro | |
/s/ W.R. “Lee” Adams | Director |
W.R. “Lee” Adams | |
/s/ Edward D. Brooks | Director |
Edward D. Brooks | |
/s/ Joel D. Pastorek | Director |
Joel D. Pastorek | |
/s/ Robert H. Lampton | Director |
Robert H. Lampton | |
/s/ William W. Lampton | Director |
William W. Lampton |
INDEX TO BLUEKNIGHT ENERGY PARTNERS, L.P. CONSOLIDATED FINANCIAL STATEMENTS |
To the Board of Directors of Blueknight Energy Partners G.P., L.L.C., as the general partner of Blueknight Energy Partners, L.P. and unit holders of Blueknight Energy Partners, L.P.
Opinion on the Financial Statements and Internal Control over Financial Reporting
We have audited the accompanying consolidated balance sheets of Blueknight Energy Partners, L.P. and its subsidiaries(the Partnership) as of December 31, 2017 and 2016,
Basis for Opinion
These financial statements will not be prevented or detected on a timely basis. The material weakness referred to above is described in Management's Report on Internal Control Over Financial Reporting appearing under Item 9A. We considered this material weakness in determiningare the nature, timing, and extent of audit tests applied in our audit of the 2017 consolidated financial statements, and our opinion regarding the effectivenessresponsibility of the Partnership’s internal control over financial reporting does not affect our opinion on those consolidated financial statements.
We conducted our audits in accordance with the standards of the PCAOB. Those standards require that we plan and perform the auditsaudit to obtain reasonable assurance about whether the consolidated
Our audit included performing procedures to assess the risks of material misstatement of the financial statements, whether due to error or fraud, and performing procedures that respond to those risks. Such procedures included examining, on a test basis, evidence regarding the amounts and disclosures in the financial statements. Our audit also included evaluating the accounting principles used and significant estimates made by management, as well as evaluating the overall presentation of the financial statements. We believe that our audit provides a reasonable basis for our opinion.
Critical Audit Matters
Critical audit matters are matters arising from the current period audit of the financial statements that were communicated or required to be communicated to the audit committee and that: (1) relate to accounts or disclosures that are material to the financial statements and (2) involved our especially challenging, subjective or complex judgments. We determined that there are no critical audit matters.
/s/ Ernst & Young LLP
We have served as the Partnership’s auditor since 2020.
Tulsa, Oklahoma
March 10, 2021
Report of Independent Registered Public Accounting Firm
To the Board of Directors of Blueknight Energy Partners G.P., L.L.C as the general partner of Blueknight Energy Partners, L.P. and unit holders of Blueknight Energy Partners, L.P.
Opinion on the Financial Statements
We have audited the consolidated balance sheet of Blueknight Energy Partners, L.P. and its subsidiaries (the “Partnership”) as of December 31, 2019, and the related consolidated statements of operations, of changes in partners’ capital (deficit) and of cash flows for the year then ended, including the related notes (collectively referred to as the “consolidated financial statements”). In our opinion, the consolidated financial statements present fairly, in all material respects.
Basis for Opinion
The consolidated
financial statements are the responsibility of the Partnership’s management. Our responsibility is to express an opinion on the Partnership’s consolidated financial statements based on our audit. We are a public accounting firm registered with the Public Company Accounting Oversight Board (United States) (PCAOB) and are required to be independent with respect to the Partnership in accordance with the U.S. federal securities laws and the applicable rules and regulations of the Securities and Exchange Commission and the PCAOB.We conducted our audit of the consolidated financial statements in accordance with the standards of the PCAOB. Those standards require that we plan and perform the audit to obtain reasonable assurance about whether the consolidated financial statements are free of material misstatement, whether due to error or fraud.
Our audit included performing procedures to assess the risks of material misstatement of the consolidated
financial statements, whether due to error or fraud, and performing procedures that respond to those risks. Such procedures included examining, on a test basis, evidence regarding the amounts and disclosures in the consolidatedfinancial statements. Our/s/ PricewaterhouseCoopers LLP
Tulsa, Oklahoma
March 8, 2018
We have served as the Partnership’s auditor since 2007.
BLUEKNIGHT ENERGY PARTNERS, L.P. CONSOLIDATED BALANCE SHEETS (in thousands, except per unit data) | |||||||
| As of December 31, | |||||||
| 2016 | 2017 | ||||||
| ASSETS | |||||||
| Current assets: | |||||||
| Cash and cash equivalents | $ | 3,304 | $ | 2,469 | |||
| Accounts receivable, net of allowance for doubtful accounts of $49 and $28 at December 31, 2016 and 2017, respectively | 7,544 | 7,589 | |||||
| Receivables from related parties, net of allowance for doubtful accounts of $0 at both dates | 1,860 | 3,070 | |||||
| Prepaid insurance | 1,578 | 2,009 | |||||
| Other current assets | 7,934 | 8,438 | |||||
| Total current assets | 22,220 | 23,575 | |||||
| Property, plant and equipment, net of accumulated depreciation of $292,117 and $316,591 at December 31, 2016 and 2017, respectively | 307,334 | 296,069 | |||||
| Assets held for sale, net of accumulated depreciation of $3,041 at December 31, 2016 | 4,237 | — | |||||
| Investment in unconsolidated affiliate | 20,561 | — | |||||
| Goodwill | 4,746 | 3,870 | |||||
| Debt issuance costs, net | 2,050 | 4,442 | |||||
| Intangibles and other assets, net | 14,515 | 12,913 | |||||
| Total assets | $ | 375,663 | $ | 340,869 | |||
| LIABILITIES AND PARTNERS’ CAPITAL | |||||||
| Current liabilities: | |||||||
| Accounts payable | $ | 3,174 | $ | 4,439 | |||
| Accounts payable to related parties | 1,053 | 2,268 | |||||
| Accrued interest payable | 413 | 694 | |||||
| Accrued property taxes payable | 2,531 | 2,432 | |||||
| Unearned revenue | 2,350 | 2,393 | |||||
| Unearned revenue with related parties | 383 | 551 | |||||
| Accrued payroll | 6,358 | 6,119 | |||||
| Other current liabilities | 4,279 | 4,747 | |||||
| Total current liabilities | 20,541 | 23,643 | |||||
| Long-term unearned revenue with related parties | 640 | 1,052 | |||||
| Long-term interest rate swap liabilities | 1,947 | 225 | |||||
| Other long-term liabilities | 2,959 | 3,673 | |||||
| Long-term debt | 324,000 | 307,592 | |||||
| Commitments and contingencies (Note 17) | |||||||
| Partners’ capital: | |||||||
| Preferred Units (35,125,202 units issued and outstanding at both dates) | 253,923 | 253,923 | |||||
| Common unitholders (38,003,397 and 40,158,342 units issued and outstanding at December 31, 2016 and 2017, respectively) | 471,180 | 454,358 | |||||
| General partner interest (1.7% and 1.6% interest at December 31, 2016 and 2017, respectively, with 1,225,409 general partner units outstanding at both dates) | (699,527 | ) | (703,597 | ) | |||
| Total partners’ capital | 25,576 | 4,684 | |||||
| Total liabilities and partners’ capital | $ | 375,663 | $ | 340,869 | |||
BLUEKNIGHT ENERGY PARTNERS, L.P.
CONSOLIDATED BALANCE SHEETS
(in thousands, except per unit data)
As of December 31, | ||||||||
2019 | 2020 | |||||||
ASSETS | ||||||||
Current assets: | ||||||||
| Cash and cash equivalents | $ | 589 | $ | 805 | ||||
| Accounts receivable, net | 2,686 | 3,297 | ||||||
| Receivables from related parties, net | 1,110 | 507 | ||||||
| Other current assets | 2,378 | 2,355 | ||||||
| Current assets of discontinued operations | 27,359 | 96,945 | ||||||
| Total current assets | 34,122 | 103,909 | ||||||
| Property, plant and equipment, net of accumulated depreciation of $185,845 and $197,561 at December 31, 2019 and 2020, respectively | 107,373 | 104,709 | ||||||
| Goodwill | 6,728 | 6,728 | ||||||
| Debt issuance costs, net | 2,344 | 1,340 | ||||||
| Operating lease assets | 9,901 | 8,548 | ||||||
| Intangibles assets, net | 9,913 | 7,531 | ||||||
| Other noncurrent assets | 393 | 252 | ||||||
| Noncurrent assets of discontinued operations | 131,166 | - | ||||||
| Total assets | $ | 301,940 | $ | 233,017 | ||||
LIABILITIES AND PARTNERS’ CAPITAL (DEFICIT) | ||||||||
Current liabilities: | ||||||||
| Accounts payable | $ | 2,433 | 1,635 | |||||
| Accounts payable to related parties | 2,460 | 31 | ||||||
Contingent liability with related party (Note 12) | 12,221 | - | ||||||
| Accrued interest payable | 293 | 274 | ||||||
| Accrued property taxes payable | 1,709 | 1,757 | ||||||
| Unearned revenue | 1,504 | 1,789 | ||||||
| Unearned revenue with related parties | 2,934 | 4,603 | ||||||
| Accrued payroll | 3,357 | 4,977 | ||||||
| Current operating lease liability | 1,856 | 1,684 | ||||||
| Other current liabilities | 1,531 | 1,349 | ||||||
| Current liabilities of discontinued operations | 24,278 | 17,248 | ||||||
| Total current liabilities | 54,576 | 35,347 | ||||||
| Long-term unearned revenue with related parties | 2,149 | 4,153 | ||||||
| Other long-term liabilities | 1,596 | 168 | ||||||
| Noncurrent operating lease liability | 8,219 | 6,980 | ||||||
| Noncurrent liabilities of discontinued operations | 1,131 | - | ||||||
| Long-term debt | 255,592 | 252,592 | ||||||
Commitments and contingencies (Note 15) | ||||||||
Partners’ capital (deficit): | ||||||||
| Common unitholders (40,830,051 and 41,214,856 units issued and outstanding at December 31, 2019 and 2020, respectively) | 356,777 | 312,591 | ||||||
| Preferred unitholders (35,125,202 units issued and outstanding at both dates) | 253,923 | 253,923 | ||||||
| General partner interest (1.6% interest with 1,225,409 general partner units outstanding at both dates) | (632,023 | ) | (632,737 | ) | ||||
| Total partners’ capital (deficit) | (21,323 | ) | (66,223 | ) | ||||
| Total liabilities and partners’ capital (deficit) | $ | 301,940 | $ | 233,017 | ||||
The accompanying notes are an integral part of these consolidated financial statements.
BLUEKNIGHT ENERGY PARTNERS, L.P. CONSOLIDATED STATEMENTS OF OPERATIONS (in thousands, except per unit data) | |||||||||||
| Year ended December 31, | |||||||||||
| 2015 | 2016 | 2017 | |||||||||
| Service revenue: | |||||||||||
| Third-party revenue | $ | 137,415 | $ | 126,215 | $ | 113,772 | |||||
| Related-party revenue | 39,103 | 30,211 | 56,688 | ||||||||
| Product sales revenue: | |||||||||||
| Third-party revenue | 3,511 | 20,968 | 11,479 | ||||||||
| Total revenue | 180,029 | 177,394 | 181,939 | ||||||||
| Costs and expenses: | |||||||||||
| Operating expense | 127,974 | 111,091 | 123,805 | ||||||||
| Cost of product sales | 3,231 | 14,130 | 8,807 | ||||||||
| General and administrative expense | 18,976 | 20,029 | 17,112 | ||||||||
| Asset impairment expense | 21,996 | 25,761 | 2,400 | ||||||||
| Total costs and expenses | 172,177 | 171,011 | 152,124 | ||||||||
| Gain (loss) on sale of assets | 6,137 | 108 | (975 | ) | |||||||
| Operating income | 13,989 | 6,491 | 28,840 | ||||||||
| Other income (expense): | |||||||||||
| Equity earnings in unconsolidated affiliate | 3,932 | 1,483 | 61 | ||||||||
| Gain on sale of unconsolidated affiliate | — | — | 5,337 | ||||||||
| Interest expense (net of capitalized interest of $184, $41, and $18, respectively) | (11,202 | ) | (12,554 | ) | (14,027 | ) | |||||
| Income (loss) before income taxes | 6,719 | (4,580 | ) | 20,211 | |||||||
| Provision for income taxes | 323 | 260 | 166 | ||||||||
| Net income (loss) | $ | 6,396 | $ | (4,840 | ) | $ | 20,045 | ||||
| Allocation of net income (loss) for calculation of earnings per unit: | |||||||||||
| General partner interest in net income | $ | 554 | $ | 433 | $ | 944 | |||||
| Preferred interest in net income | $ | 21,564 | $ | 25,824 | $ | 25,115 | |||||
| Net loss available to limited partners | $ | (15,722 | ) | $ | (31,097 | ) | $ | (6,014 | ) | ||
| Basic and diluted net loss per common unit | $ | (0.47 | ) | $ | (0.87 | ) | $ | (0.15 | ) | ||
| Weighted average common units outstanding - basic and diluted | 32,945 | 35,093 | 38,342 | ||||||||
BLUEKNIGHT ENERGY PARTNERS, L.P.
CONSOLIDATED STATEMENTS OF OPERATIONS
(in thousands, except per unit data)
Year ended December 31, | ||||||||
2019 | 2020 | |||||||
Service revenue: | ||||||||
| Third-party revenue | $ | 28,689 | $ | 29,171 | ||||
| Related-party revenue | 15,696 | 18,028 | ||||||
Lease revenue: | ||||||||
| Third-party revenue | 41,690 | 36,630 | ||||||
Related-party revenue | 20,443 | 26,416 | ||||||
| Total revenue | 106,518 | 110,245 | ||||||
Costs and expenses: | ||||||||
| Operating expense | 61,563 | 62,812 | ||||||
| General and administrative expense | 13,388 | 14,182 | ||||||
| Asset impairment expense | 2,476 | - | ||||||
| Total costs and expenses | 77,427 | 76,994 | ||||||
Loss on sale of assets | (131 | ) | (67 | ) | ||||
| Operating income | 28,960 | 33,184 | ||||||
Other income (expenses): | ||||||||
| Other income | 530 | 1,169 | ||||||
| Interest expense | (7,447 | ) | (5,665 | ) | ||||
| Income before income taxes | 22,043 | 28,688 | ||||||
| Provision for income taxes | 44 | (7 | ) | |||||
| Income from continuing operations | 21,999 | 28,695 | ||||||
| Loss from discontinued operations, net | (3,587 | ) | (42,175 | ) | ||||
| Net income(loss) | $ | 18,412 | $ | (13,480 | ) | |||
Allocation of net income (loss) for calculation of earnings per unit: | ||||||||
| General partner interest in net income (loss) | $ | 337 | $ | (213 | ) | |||
| Preferred interest in net income | $ | 25,115 | $ | 25,115 | ||||
| Net loss available to limited partners | $ | (7,040 | ) | $ | (38,382 | ) | ||
| Basic and diluted net loss from discontinued operations per common unit | $ | (0.08 | ) | $ | (0.98 | ) | ||
| Basic and diluted net income(loss) from continuing operations per common unit | $ | (0.09 | ) | $ | 0.07 | |||
| Basic and diluted net loss per common unit | $ | (0.17 | ) | $ | (0.91 | ) | ||
| Weighted average common units outstanding - basic and diluted | 40,755 | $ | 41,104 | |||||
The accompanying notes are an integral part of these consolidated financial statements.
BLUEKNIGHT ENERGY PARTNERS, L.P. CONSOLIDATED STATEMENT OF CHANGES IN PARTNERS’ CAPITAL (in thousands) | |||||||||||||||
| Common Unitholders | Preferred Unitholders | General Partner Interest | Total Partners’ Capital | ||||||||||||
| Balance, December 31, 2014 | $ | 525,767 | $ | 204,599 | $ | (610,410 | ) | $ | 119,956 | ||||||
| Net income (loss) | (15,281 | ) | 21,564 | 113 | 6,396 | ||||||||||
| Equity-based incentive compensation | 2,095 | — | 36 | 2,131 | |||||||||||
| Profits interest contribution | — | — | 150 | 150 | |||||||||||
| Distributions | (18,943 | ) | (21,564 | ) | (1,093 | ) | (41,600 | ) | |||||||
| Proceeds from sale of 30,075 common units pursuant to the Employee Unit Purchase Plan | 186 | — | — | 186 | |||||||||||
| Balance, December 31, 2015 | $ | 493,824 | $ | 204,599 | $ | (611,204 | ) | $ | 87,219 | ||||||
| Net income (loss) | (30,004 | ) | 24,939 | 225 | (4,840 | ) | |||||||||
| Equity-based incentive compensation | 2,051 | — | 36 | 2,087 | |||||||||||
| Profits interest contribution | — | — | 923 | 923 | |||||||||||
| Distributions | (20,960 | ) | (24,939 | ) | (1,320 | ) | (47,219 | ) | |||||||
| Capital contributions | — | — | 2,384 | 2,384 | |||||||||||
| Proceeds from sale of 3,795,000 common units, net of underwriters’ discount and offering expenses of $1.5 million | 20,931 | — | — | 20,931 | |||||||||||
| Proceeds from sale of 71,807 common units pursuant to the Employee Unit Purchase Plan | 338 | — | — | 338 | |||||||||||
| Repurchase of 13,335,390 Preferred Units | — | (95,348 | ) | — | (95,348 | ) | |||||||||
Proceeds from issuance of 18,312,968 Preferred Units | — | 144,672 | — | 144,672 | |||||||||||
| Proceeds from issuance of 847,457 common units | 5,000 | — | — | 5,000 | |||||||||||
Proceeds from issuance of 97,654 general partner units | — | — | 680 | 680 | |||||||||||
| Consideration paid in excess of historical cost of assets acquired from Ergon | — | — | (91,251 | ) | (91,251 | ) | |||||||||
| Balance, December 31, 2016 | $ | 471,180 | $ | 253,923 | $ | (699,527 | ) | $ | 25,576 | ||||||
| Net income (loss) | (6,009 | ) | 25,116 | 938 | 20,045 | ||||||||||
| Equity-based incentive compensation | 1,424 | — | 27 | 1,451 | |||||||||||
| Distributions | (22,633 | ) | (25,116 | ) | (1,414 | ) | (49,163 | ) | |||||||
| Capital contributions | — | — | 104 | 104 | |||||||||||
| Proceeds from sale of 53,079 common units pursuant to the Employee Unit Purchase Plan | 240 | — | — | 240 | |||||||||||
| Value of 1,898,380 common units issued for acquisitions | 10,156 | — | — | 10,156 | |||||||||||
| Consideration paid in excess of historical cost of assets acquired from Ergon | — | — | (3,725 | ) | (3,725 | ) | |||||||||
| Balance, December 31, 2017 | $ | 454,358 | $ | 253,923 | $ | (703,597 | ) | $ | 4,684 | ||||||
BLUEKNIGHT ENERGY PARTNERS, L.P.
CONSOLIDATED STATEMENTS OF CHANGES IN PARTNERS’ CAPITAL (DEFICIT)
(in thousands)
Common | Preferred | General Partner | Total Partners’ | |||||||||||||
Unitholders | Unitholders | Interest | Capital(Deficit) | |||||||||||||
Balance, December 31, 2018 | $ | 370,972 | $ | 253,923 | $ | (631,791 | ) | $ | (6,896 | ) | ||||||
Net income (loss) | (6,990 | ) | 25,115 | 287 | 18,412 | |||||||||||
Equity-based incentive compensation | 953 | - | 20 | 973 | ||||||||||||
Distributions | (8,334 | ) | (25,115 | ) | (539 | ) | (33,988 | ) | ||||||||
Proceeds from sale of 161,971 common units pursuant to the Employee Unit Purchase Plan | 176 | - | - | 176 | ||||||||||||
Balance, December 31, 2019 | $ | 356,777 | $ | 253,923 | $ | (632,023 | ) | $ | (21,323 | ) | ||||||
| Net income (loss) | (38,382 | ) | 25,115 | (213 | ) | (13,480 | ) | |||||||||
| Equity-based incentive compensation | 804 | - | 12 | 816 | ||||||||||||
Distributions | (6,778 | ) | (25,115 | ) | (513 | ) | (32,406 | ) | ||||||||
Proceeds from sale of 158,326 common units pursuant to the Employee Unit Purchase Plan | 170 | - | - | 170 | ||||||||||||
| Balance, December 31, 2020 | $ | 312,591 | $ | 253,923 | $ | (632,737 | ) | $ | (66,223 | ) | ||||||
The accompanying notes are an integral part of thisthese consolidated financial statement.
BLUEKNIGHT ENERGY PARTNERS, L.P. CONSOLIDATED STATEMENTS OF CASH FLOWS (in thousands) | |||||||||||
| Year ended December 31, | |||||||||||
| 2015 | 2016 | 2017 | |||||||||
| Cash flows from operating activities: | |||||||||||
| Net income (loss) | $ | 6,396 | $ | (4,840 | ) | $ | 20,045 | ||||
| Adjustments to reconcile net income (loss) to net cash provided by operating activities: | |||||||||||
| Provision for uncollectible receivables from third parties | (184 | ) | 15 | (21 | ) | ||||||
| Provision for uncollectible receivables from related parties | — | (229 | ) | — | |||||||
| Depreciation and amortization | 27,228 | 30,820 | 31,139 | ||||||||
| Impairment of intangible assets | 7,498 | — | 1,107 | ||||||||
| Amortization and write-off of debt issuance costs | 884 | 1,107 | 1,816 | ||||||||
| Unrealized loss (gain) related to interest rate swaps | 469 | (1,156 | ) | (1,790 | ) | ||||||
| Fixed asset impairment charge | 14,498 | 25,761 | 1,293 | ||||||||
| Loss (gain) on sale of assets | (6,137 | ) | (108 | ) | 975 | ||||||
| Gain on sale of unconsolidated affiliate | — | — | (5,337 | ) | |||||||
| Equity-based incentive compensation | 2,131 | 2,087 | 1,451 | ||||||||
| Equity earnings in unconsolidated affiliate | (3,932 | ) | (1,483 | ) | (61 | ) | |||||
| Distributions from unconsolidated affiliate | 4,313 | — | — | ||||||||
| Gain related to investments | (267 | ) | — | — | |||||||
| Changes in assets and liabilities: | |||||||||||
| Decrease (increase) in accounts receivable | 538 | 1,138 | (24 | ) | |||||||
| Decrease (increase) in receivables from related parties | 472 | 213 | (1,210 | ) | |||||||
| Decrease in prepaid insurance | 3,998 | 3,008 | 2,507 | ||||||||
| Decrease (increase) in other current assets | (579 | ) | 237 | (983 | ) | ||||||
| Decrease (increase) in other assets | (1,485 | ) | (498 | ) | 84 | ||||||
| Increase (decrease) in accounts payable | (792 | ) | (237 | ) | 952 | ||||||
| Increase in payables to related parties | — | 1,053 | 749 | ||||||||
| Increase (decrease) in accrued interest payable | (42 | ) | 222 | 281 | |||||||
| Increase (decrease) in accrued property taxes | 727 | (242 | ) | (72 | ) | ||||||
| Increase (decrease) in unearned revenue | 2,075 | (1,568 | ) | 898 | |||||||
| Increase (decrease) in unearned revenue from related parties | (189 | ) | 187 | 580 | |||||||
| Increase (decrease) in accrued payroll | 743 | (905 | ) | (239 | ) | ||||||
| Increase (decrease) in other accrued liabilities | 2,169 | (1,733 | ) | 354 | |||||||
| Net cash provided by operating activities | 60,532 | 52,849 | 54,494 | ||||||||
| Cash flows from investing activities: | |||||||||||
| Acquisition of assets from Ergon | — | (122,572 | ) | — | |||||||
| Acquisitions | (20,951 | ) | (18,989 | ) | — | ||||||
| Capital expenditures | (41,609 | ) | (19,995 | ) | (18,715 | ) | |||||
| Proceeds from sale of assets | 14,687 | 1,993 | 9,297 | ||||||||
| Distributions from unconsolidated affiliate | 922 | — | — | ||||||||
| Proceeds from sale of investments | 2,346 | — | — | ||||||||
| Proceeds from sale of unconsolidated affiliate | — | — | 26,489 | ||||||||
| Net cash provided by (used in) investing activities | (44,605 | ) | (159,563 | ) | 17,071 | ||||||
| Cash flows from financing activities: | |||||||||||
| Payment on insurance premium financing agreement | (3,286 | ) | (3,425 | ) | (2,965 | ) | |||||
| Debt issuance costs | — | (956 | ) | (4,208 | ) | ||||||
| Borrowings under credit agreement | 112,000 | 170,000 | 378,592 | ||||||||
| Payments under credit agreement | (83,000 | ) | (91,000 | ) | (395,000 | ) | |||||
| Proceeds from issuance of common units, net of offering costs | 186 | 26,269 | 240 | ||||||||
| Proceeds from issuance of Preferred Units | — | 144,672 | — | ||||||||
| Proceeds from issuance of general partner units | — | 680 | — | ||||||||
| Repurchase of Preferred Units | — | (95,348 | ) | — | |||||||
| Capital contributions | — | 2,384 | 104 | ||||||||
| Capital contribution related to profits interest | 150 | 923 | — | ||||||||
| Distributions | (41,600 | ) | (47,219 | ) | (49,163 | ) | |||||
| Net cash provided by (used in) financing activities | (15,550 | ) | 106,980 | (72,400 | ) | ||||||
BLUEKNIGHT ENERGY PARTNERS, L.P.
CONSOLIDATED STATEMENTS OF CASH FLOWS
(in thousands)
Year ended December 31, | ||||||||
2019 | 2020 | |||||||
Cash flows from operating activities: | ||||||||
| Net income(loss) | $ | 18,412 | $ | (13,480 | ) | |||
Adjustments to reconcile net income (loss) to net cash provided by operating activities: | ||||||||
Depreciation and amortization | 25,533 | 23,068 | ||||||
Amortization and write-off of debt issuance costs | 1,005 | 1,004 | ||||||
Loss on disposal/classification of held for sale for discontinued operations | - | 39,096 | ||||||
Tangible asset impairment charge | 274 | 6,416 | ||||||
Other impairment charge (Note 12) | 2,202 | - | ||||||
Gain on sale of assets | (453 | ) | (1,123 | ) | ||||
Equity-based incentive compensation | 973 | 816 | ||||||
Changes in assets and liabilities: | ||||||||
Decrease in accounts receivable | 9,325 | 6,461 | ||||||
Decrease (increase) in receivables from related parties | (67 | ) | 603 | |||||
Decrease in other current assets | 2,672 | 4,094 | ||||||
Decrease in other non-current assets | 2,964 | 2,324 | ||||||
Decrease in accounts payable | (702 | ) | (557 | ) | ||||
Decrease in payables to related parties | (282 | ) | (1,792 | ) | ||||
Decrease in accrued crude oil purchases | (7,243 | ) | (2,838 | ) | ||||
Increase (decrease) in accrued crude oil purchases to related parties | 1,588 | (2,965 | ) | |||||
Decrease in accrued interest payable | (172 | ) | (19 | ) | ||||
Increase (decrease) in accrued property taxes | 158 | (671 | ) | |||||
Decrease in unearned revenue | (1,961 | ) | (1,618 | ) | ||||
Increase (decrease) in unearned revenue from related parties | (1,966 | ) | 2,954 | |||||
Increase in accrued payroll | 1,156 | 1,617 | ||||||
Decrease in other accrued liabilities | (3,579 | ) | (2,223 | ) | ||||
Net cash provided by operating activities | 49,837 | 61,167 | ||||||
Cash flows from investing activities: | ||||||||
Acquisition of DEVCO from Ergon (Note 12) | - | (12,221 | ) | |||||
Capital expenditures | (12,746 | ) | (16,332 | ) | ||||
Proceeds from sale of assets | 8,410 | 5,896 | ||||||
Net cash used in investing activities | (4,336 | ) | (22,657 | ) | ||||
Cash flows from financing activities: | ||||||||
Payments on other financing activities | (2,586 | ) | (3,027 | ) | ||||
Borrowings under credit agreement | 291,000 | 228,000 | ||||||
Payments under credit agreement | (301,000 | ) | (231,000 | ) | ||||
Proceeds from equity issuance | 176 | 170 | ||||||
Distributions | (33,988 | ) | (32,406 | ) | ||||
Net cash used in financing activities | (46,398 | ) | (38,263 | ) | ||||
Net increase (decrease) in cash and cash equivalents | (897 | ) | 247 | |||||
Cash and cash equivalents at beginning of period | 1,455 | 558 | ||||||
Cash and cash equivalents at end of period | $ | 558 | $ | 805 | ||||
Supplemental disclosure of non-cash financing and investing cash flow information: | ||||||||
Non-cash changes in property, plant and equipment | $ | 1,590 | $ | (259 | ) | |||
Increase in accrued liabilities related to insurance premium financing agreement | $ | 2,356 | $ | 2,324 | ||||
Cash paid for interest, net of amounts capitalized | $ | 15,150 | $ | 10,009 | ||||
Cash paid for income taxes | $ | 227 | $ | 30 | ||||
BLUEKNIGHT ENERGY PARTNERS, L.P. CONSOLIDATED STATEMENTS OF CASH FLOWS (in thousands) | |||||||||||
| Year ended December 31, | |||||||||||
| 2015 | 2016 | 2017 | |||||||||
| Net increase (decrease) in cash and cash equivalents | 377 | 266 | (835 | ) | |||||||
| Cash and cash equivalents at beginning of period | 2,661 | 3,038 | 3,304 | ||||||||
| Cash and cash equivalents at end of period | $ | 3,038 | $ | 3,304 | $ | 2,469 | |||||
| Supplemental disclosure of cash flow information: | |||||||||||
| Assets acquired through non-cash equity issuance | $ | — | $ | — | $ | 10,156 | |||||
| Increase (decrease) in accounts payable related to purchases of property, plant and equipment | $ | (1,598 | ) | $ | (1,825 | ) | $ | 779 | |||
| Increase in accrued liabilities related to insurance premium financing agreement | $ | 3,813 | $ | 3,189 | $ | 2,938 | |||||
| Cash paid for interest, net of amounts capitalized | $ | 9,915 | $ | 12,404 | $ | 13,732 | |||||
| Cash paid for income taxes | $ | 412 | $ | 282 | $ | 158 | |||||
The accompanying notes are an integral part of these consolidated financial statements.
NOTES TO CONSOLIDATED FINANCIAL STATEMENTS
1. | ORGANIZATION AND NATURE OF BUSINESS |
Blueknight Energy Partners, L.P. and subsidiaries (collectively, the “Partnership”) is a publicly traded master limited partnership with operations in 2726 states. The Partnership provides integrated terminalling, gathering and transportation services for companies engaged in the production, distribution and marketing of liquid asphalt and crude oil. The Partnership manages its operations through
The Partnership previously provided integrated terminalling, gathering, and transportation services for companies engaged in the production, distribution, and marketing of crude oil in three different operating segments: (i) crude oil terminalling services, (ii) crude oil pipeline services, and (iii) crude oil trucking services. On December 21, 2020, we announced we had entered into multiple definitive agreements to own, operatesee these segments. The transaction related to the crude oil pipeline services segment closed on February 1, 2021, the final transaction related to crude oil trucking services closed on February 2, 2021, and developthe transaction related to crude oil terminalling services closed on March 1, 2021. These segments are presented as discontinued operations for all periods presented. Unless otherwise noted, information in these notes to the consolidated financial statements relates to continuing operations. As the Partnership is only operating through one operating segment, a diversified portfolio of complementary midstream energy assets.
2. | BASIS OF CONSOLIDATION AND PRESENTATION |
The accompanying consolidated financial statements and related notes present and discuss the Partnership’s consolidated financial position as of December 31, 20162019 and 2017,2020, and the consolidated results of the Partnership’s operations, cash flows and changes in partners’ capital (deficit) for the years ended December 31, 2015, 20162019 and 2017.2020. The consolidated financial statements have been prepared in accordance with accounting principles generally accepted in the United States of America (“GAAP”). All significant intercompany accounts and transactions have been eliminated in the preparation of the accompanying consolidated financial statements. Certain reclassifications have been made to the prior period consolidated financial statements to conform to the current period presentation.
3. | SUMMARY OF SIGNIFICANT ACCOUNTING POLICIES |
USE OF ESTIMATES
- The preparation of financial statements in conformity with GAAP requires management to make estimates and assumptions that affect the reported amounts and disclosure of contingencies. Management makes significant estimates including: (1) allowance for doubtful accounts receivable; (2) estimated useful lives of assets, which impacts depreciation; (3) estimated cash flows and fair values inherent in impairment tests; (4) accruals related to revenues and expenses; (5) the estimated fair value of financial instruments; and (6) liability and contingency accruals. Although management believes these estimates are reasonable, actual results could differ from these estimates.CASH AND CASH EQUIVALENTS
- Cash and cash equivalents includes cash and all investments with original maturities of three months or less which are readily convertible into known amounts of cash.ACCOUNTS RECEIVABLE
-PROPERTY, PLANT AND EQUIPMENT
- Property, plant and equipment are recorded at cost. Expenditures for maintenance and repairs that do not add capacity or extend the useful life of an asset are expensed as incurred. The carrying values of the assets are based on estimates, assumptions and judgments relative to useful lives and salvage values. As assets are disposed of, the cost and related accumulated depreciation are removed from the accounts, and any resulting gain or loss is included in operating income in the consolidated statements of operations.Depreciation is calculated using the straight-line method based on estimated useful lives of the assets. These estimates are based on various factors, including age (in the case of acquired assets), manufacturing specifications, technological advances and historical data concerning useful lives of similar assets. Uncertainties that impact these estimates include changes in laws and regulations relating to restoration and abandonment requirements, economic conditions and supply and demand in the area. When assets are put into service, management makes estimates with respect to useful lives and salvage values that it believes are reasonable. However, subsequent events could cause management to change its estimates, thus impacting the future calculation of depreciation.
The Partnership has contractual obligations to perform dismantlement and removal activities in the event that some of its liquid asphalt cement and residual fuel oil terminalling assets are abandoned (see Note 17)15). Such obligations are recognized in the period incurred ifin which sufficient information becomes available for it to reasonably estimable.determine the settlement dates.
IMPAIRMENT OF LONG-LIVED ASSETSAND OTHER INTANGIBLE ASSETS - Long-lived assets with recorded values that are not expected to be recovered through future cash flows are written down to estimated fair value. A long-lived asset is tested for impairment when events or circumstances indicate that its carrying value may not be recoverable. The carrying value of a long-lived asset is not recoverable if it exceeds the sum of the undiscounted cash flows expected to result from the use and eventual disposition of the asset. If the carrying value exceeds the sum of the undiscounted cash flows, an impairment loss equal to the amount by which the carrying value exceeds the fair value of the asset is recognized. Fair value is generally determined from estimated discounted future net cash flows.
During the year ended December 31, 2015,2019, the Partnership recognized fixed asset impairment chargesexpenses of $12.6 million, $1.4 million and $0.5approximately $0.3 million related to the East Texas pipeline system, a portion of the Mid-Continent pipeline systemflood damage at certain asphalt facilities and the West Texas trucking stations, respectively.
Acquired customer relationships and non-compete agreements are capitalized and amortized over useful lives ranging from 4approximately 5 to 2010 years using the straight-line method of amortization. An impairment loss is recognized for definite-lived intangibles if the carrying amount of an intangible asset is not recoverable and its carrying amount exceeds its fair value. NoIntangible asset impairment charges were recognized duringare included in the line item “Asset impairment expense” on the consolidated statements of operations. The Partnership had no intangible asset impairment charges for the years ended December 31, 2015 or 2016, with respect to intangible assets. During the year ended December 31, 2017, the Partnership recognized intangible asset impairment charges of $0.2 million on customer relationships related to the producer field services business, primarily operated in the Texas panhandle.
DEBT ISSUANCE COSTS
- Costs incurred in connection with the issuance of long-term debt related to the Partnership’s credit agreement are capitalized and amortized using the straight-line method over the term of the related debt. Use of the straight-line method does not differ materially from the “effective interest” method of amortization.GOODWILL
- Goodwill represents the excess of the cost of acquisitions over the amounts assigned to assets acquired and liabilities assumed. Goodwill is not amortized but is tested annually in December for impairment or when events and circumstances warrant an interim evaluation. Goodwill is tested for impairment at a level of reporting referred to as a reporting unit. The Partnership currently hasAsphalt Terminalling Services | Crude Oil Pipeline Services | Crude Oil Trucking and Producer Field Services | Total | ||||||||||||
| Balance, December 31, 2014 | $ | — | $ | 6,340 | $ | 876 | $ | 7,216 | |||||||
| Acquisition | 3,511 | 1,158 | — | 4,669 | |||||||||||
| Impairment | — | (7,498 | ) | — | (7,498 | ) | |||||||||
| Balance, December 31, 2015 | $ | 3,511 | $ | — | $ | 876 | $ | 4,387 | |||||||
| Acquisition | 359 | — | — | 359 | |||||||||||
| Balance, December 31, 2016 | $ | 3,870 | $ | — | $ | 876 | $ | 4,746 | |||||||
| Impairment | — | — | (876 | ) | (876 | ) | |||||||||
| Balance, December 31, 2017 | $ | 3,870 | $ | — | $ | — | $ | 3,870 | |||||||
ENVIRONMENTAL MATTERS
- Liabilities for loss contingencies, including environmental remediation costs, arising from claims, assessments, litigation, fines, penalties and other sources are charged to expense when it is probable that a liability has been incurred and the amount of the assessment and/or remediation can be reasonably estimated. The Partnership had noREVENUE RECOGNITION
-INCOME AND OTHER TAXES
- For federal and most state income tax purposes, the majority of income, gains, losses, deductions and tax credits generated by the Partnership flow through to the unitholders of the Partnership and are subject to income tax at the individual partner level. The Partnership is subject to the Texas state franchise (margin) tax, and the earnings associated with the Partnership’s taxable subsidiary are subject to federal and state income taxes. TheSTOCK-BASED COMPENSATION
- The Partnership’s general partner adopted the Blueknight Energy Partners G.P. L.L.C. Long-Term Incentive Plan (the “LTIP”)The Partnership classifies unit award grants as either equity or liability awards. All award grants made under the LTIP from its inception through December 31, 2017,2020, have been classified as equity awards. Fair value for award grants classified as equity is determined on the grant date of the award and this value is recognized as compensation expense ratably over the requisite service period of unit award grants, which generally is the vesting period. Fair value for equity awards is calculated as the closing price of the Partnership’s common units representing limited partner interests in the Partnership (“common units”) on the grant date and is reduced by the present value of estimated cash distributions to be paid on common units during the vesting period to the extent a unit award does not include DERs. Compensation expense related to unit-based payments is included in operating and general and administrative expenses on the Partnership’s consolidated statements of operations.
FAIR VALUE OF FINANCIAL INSTRUMENTS
- The Partnership measures all financial instruments, including derivatives embedded in other contracts, at fair value and recognizes them in the consolidated balance sheets as an asset or a liability, depending on its rights and obligations under the applicable contract. The changes in the fair value of financial instruments are recognized currently in earnings in the consolidated statements of operations.LEASES - A lease is a contract, or part of a contract, that conveys the right to control the use of identified property, plant, or equipment (an identified asset) for a period of time in exchange for consideration. At the inception of a contract, and upon certain modifications, the Partnership determines whether the contract is or contains a lease. In evaluating whether a contract conveys a right to control the use of an asset, considerations include whether the contract conveys the right to substantially all of the economic benefits from use of the identified asset for a period of time and the right to direct the use of the identified asset. The determination of whether an arrangement represents a lease involves judgment in certain instances.
The Partnership is both a lessee and a lessor. For lessee contracts, the length of lease agreements vary from less than one year to approximately twenty-five years. The Partnership has elected to not record lease assets and liabilities for leases with a lease term at commencement of 12 months or less; such leases are expensed as paid. If a lease contains an option to extend the lease term and there is reasonable certainty the option will be exercised, the option is considered in the lease term at inception. The Partnership has elected to not separate non-lease components (e.g., common area maintenance) from lease components on real estate leases, accordingly the recognized lease asset and lease liability incorporate in their measurement payments for non-lease components. Certain leases include variable lease payments as the amounts are subject to change over the lease term. When the interest rate implicit in the leases is unable to be determined, the incremental borrowing rate related to the Partnership's revolving credit facility is used to capitalize the right-of-use asset and lease liability. See Note 4 for the Partnership’s policies on agreements in which it is the lessor.
REVENUE |
There are two types of asphalt terminalling contracts: (i) operating lease contracts, under which customers operate the facilities, and (ii) storage, throughput and handling contracts, under which the Partnership operates the facilities. The operating lease contracts are accounted for in accordance with ASC 842 - Leases. The storage, throughput and handling contracts contain both lease revenue and non-lease service revenue. In accordance with ASC 842 and 606, fixed consideration is allocated to the lease and service components based on their relative stand-alone selling price. The stand-alone selling price of the lease component is calculated using the average internal rate of return under the operating lease agreements. The stand-alone selling price of the service component is calculated by applying an appropriate margin to the expected costs to operate the facility. The service component contains a single performance obligation that consists of a stand-ready obligation to perform activities as directed by the customer, and revenue is recognized on a straight-line basis over time as the customer receives and consumes benefits. The lease component is recognized on a straight-line basis over the term of the initial lease. Fixed consideration, consisting of the monthly storage and handling fees, is billed a month prior to the performance of services and is due by the first day of the month of service. Payments received in advance of the month of service are recorded as unearned revenue until the service is performed, and the service component is treated as a contract liability.
Asphalt storage, throughput and handling contracts also contain variable consideration in the form of reimbursements of utility, fuel and power expenses and throughput fees. Utility, fuel and power reimbursements are allocated entirely to the service component of the contracts. Utility, fuel and power reimbursements relate directly to the distinct monthly service that makes up the overall performance obligation and revenue is recognized in the period in which the service takes place. Variable consideration related to reimbursements of utility, fuel and power expenses is billed in the month subsequent to the period of service, and payment is due within 30 days of billing. Throughput fees are allocated to both the lease and service component of the contracts using the allocation percentages from contract inception. In accordance with ASC 842, the lease component of variable throughput fees is recognized in the period when the changes in facts and circumstances on which the variable payment is based occur. Additionally, under ASC 842, when variable consideration contains both a lease and non-lease service component, the service component cannot be recognized until the period in which the changes in facts and circumstances on which the variable payment is based occur. At that time, it can be recognized in accordance with ASC 606. The service component of variable throughput fees is treated as a change in estimate in the period in when the changes in facts and circumstances on which the variable payment is based occur and is then recognized on a straight-line basis over time as the customer receives and consumes benefits. Payment on variable throughput consideration is due within 30 days of billing.
Certain asphalt storage, throughput and handling contracts contain provisions for reimbursement of specified major maintenance costs. Reimbursements of specified major maintenance costs are allocated to both the lease and service component of the contracts using the allocation percentages from contract inception, and they are recognized on a straight-line basis over the remaining term of the contract.
The following table includes revenue associated with contractual commitments in place related to future performance obligations as of the end of the reporting period, which are expected to be recognized in revenue in the specified periods (in thousands):
Revenue from | ||||||||
Contracts with | Revenue from | |||||||
Customers(1) | Leases | |||||||
2021 | $ | 39,003 | $ | 58,265 | ||||
2022 | 31,662 | 47,459 | ||||||
2023 | 27,985 | 40,265 | ||||||
2024 | 28,028 | 40,312 | ||||||
2025 | 26,711 | 37,397 | ||||||
Thereafter | 37,374 | 42,603 | ||||||
Total revenue related to future performance obligations | $ | 190,763 | $ | 266,301 | ||||
(1) | Excluded from the table is revenue that is either constrained or related to performance obligations that are wholly unsatisfied as of December 31, 2020. |
Disaggregation of Revenue
Disaggregation of revenue from contracts with customers by revenue type is presented as follows (in thousands):
Year ended December 31, 2019 | ||||||||||||||||
Revenue from contracts with customers | Lease revenue | |||||||||||||||
Third-party revenue | Related-party revenue | Third-party revenue | Related-party revenue | |||||||||||||
Fixed storage, throughput and other revenue | $ | 19,865 | $ | 11,117 | $ | - | $ | - | ||||||||
Fixed lease revenue | - | - | 37,176 | 19,060 | ||||||||||||
Variable cost recovery revenue | 7,121 | 4,473 | 2,270 | 448 | ||||||||||||
Variable throughput and other revenue | 1,703 | 106 | 2,244 | 935 | ||||||||||||
Total | $ | 28,689 | $ | 15,696 | $ | 41,690 | $ | 20,443 | ||||||||
Year ended December 31, 2020 | ||||||||||||||||
Revenue from contracts with customers | Lease revenue | |||||||||||||||
Fixed storage, throughput and other revenue | $ | 20,303 | $ | 14,531 | $ | - | $ | - | ||||||||
Fixed lease revenue | - | - | 32,498 | 24,547 | ||||||||||||
Variable cost recovery revenue | 6,620 | 3,076 | 2,205 | 763 | ||||||||||||
Variable throughput and other revenue | 2,248 | 421 | 1,927 | 1,106 | ||||||||||||
Total | $ | 29,171 | $ | 18,028 | $ | 36,630 | $ | 26,416 | ||||||||
Contract Balances
The timing of revenue recognition, billings and cash collections result in billed accounts receivable and unearned revenue (contract liabilities) on the consolidated balance sheets as noted in the contract discussions above. Accounts receivable are reflected in the line items “Accounts receivable” and “Receivables from related parties” on the consolidated balance sheets. Unearned revenue is included in the line items “Unearned revenue,” “Unearned revenue with related parties,” “Long-term unearned revenue with related parties” and “Other long-term liabilities” on the consolidated balance sheets.
Billed accounts receivable from contracts with customers were $2.1 million at both December 31, 2019 and 2020.
The Partnership records unearned revenues when cash payments are received in advance of performance. Unearned revenue related to contracts with customers was $2.2 million and $3.2 million at December 31, 2019 and 2020, respectively. For the year ended December 31, 2020, the Partnership recognized $1.8 million of revenues that were previously included in the unearned revenue balance for services provided during the period.
Practical Expedients and Exemptions
The Partnership does not disclose the value of unsatisfied performance obligations for contracts with an original expected length of one year or less.
5. | DISCONTINUED OPERATIONS |
On December 1, 2017,21, 2020, the Partnership acquired an asphaltannounced executed agreements to sell its crude oil trucking services, crude oil pipeline services, and crude oil terminalling facility in Bainbridge, Georgia, from Ergon Asphalt & Emulsions, Inc. and Ergon Terminaling, Inc., both subsidiaries of Ergon, for a total purchase price of $10.2 million, consisting of 1,898,380 common units representing limited partner interestsservices segments. These segments are reported as discontinued operations in the Partnership.results of operations and financial position for all periods presented. The acquisitioncrude oil trucking services agreement closed in two phases, one on December 15, 2020, and one on February 2, 2021. The crude oil pipeline services agreement closed on February 1, 2021. Loss recognized on the disposal and classification of held for sale of these assets is reflected in the Statement of Operations for Discontinued Operations for the year ended December 31, 2020 below. The transaction related to the crude oil terminalling services segment closed on March 1, 2021. The Partnership has allocated interest on debt that was accounted forrequired to be repaid as a transaction among entities under common control. As a result of the Partnership recordedsales of the acquired assets at Ergon’s historical cost of $6.4 million, net of accumulated depreciation of $7.9 million. The $3.7 million of consideration in excess of Ergon’s historical net book value was recorded as a deemed distribution tocrude oil pipeline and terminalling services segment for the Partnership’s general partneryears ended December 31, 2019 and is reflected as ”Consideration paid in excess of historical cost of assets acquired from Ergon” on the Partnership’s consolidated statement of changes in partners’ capital.
As part of the Ergon Transaction, the Partnership acquired nine asphalt terminals from Ergon. which accounted for as a transaction among entities under common control. As a result, the Partnership recorded the acquired assets at Ergon’s historical cost of $31.3 million, net of accumulated depreciation of $63.0 million. The $91.3 million of consideration in excess of Ergon’s historical net book value was recorded as a deemed distribution to the Partnership’s general partner and is reflected as “Consideration paid in excess of historical cost of assets acquired from Ergon” on the Partnership’s consolidated statement of changes in partners’ capital.
Exit and disposal costs related to prepay revolving debt (without a commitment reduction). The operating and administrative services agreement to which the Partnership and Advantage Pipeline were parties and under which the Partnership operated the 70-mile, 16-inch Advantage crude oil pipeline, locatedthese sales, in the southern Delaware Basin in Texas, was terminated at closing. The Partnership and the Plains/Noble joint venture entered into a short-term transition services agreement under which the Partnership provided certain services through August 1, 2017, when the agreement was terminated.
| As of December 31, | |||
| 2016 | |||
| Balance sheet | |||
| Current assets | $ | 2,075 | |
| Noncurrent assets | 89,065 | ||
| Total assets | $ | 91,140 | |
| Current liabilities | 1,327 | ||
| Long-term liabilities | 20,910 | ||
| Member’s equity | 68,903 | ||
| Total liabilities and member’s equity | $ | 91,140 | |
| Year ended December 31, | Period ended April 3, | ||||||||||
| 2015 | 2016 | 2017 | |||||||||
| Income statements | |||||||||||
| Operating revenues | $ | 26,398 | $ | 17,091 | $ | 3,150 | |||||
| Operating expenses | $ | 3,059 | $ | 2,776 | $ | 465 | |||||
| Net income | $ | 14,909 | $ | 5,434 | $ | 187 | |||||
During the year ended December 31, 2015:
| Year ended December 31, | |||
| 2015 | |||
| (in thousands) | |||
| Severance charges | $ | 315 | |
| Lease payments related to operating leases for idled equipment | 1,250 | ||
| Total restructuring costs | $ | 1,565 | |
Assets and Liabilities of Discontinued Operations (in thousands) | As of December 31, 2019 | |||||||||||||||
Crude Oil Trucking Services | Crude Oil Pipeline Services | Crude Oil Terminalling Services | Total | |||||||||||||
ASSETS | ||||||||||||||||
Accounts receivable, net | $ | 822 | $ | 20,041 | $ | 166 | $ | 21,029 | ||||||||
Other current assets | 256 | 2,699 | 3,375 | 6,330 | ||||||||||||
Plant, property, and equipment | 3,120 | 62,590 | 59,692 | 125,402 | ||||||||||||
Operating lease assets | 745 | 113 | - | 858 | ||||||||||||
Other noncurrent assets | 211 | 2,657 | 2,038 | 4,906 | ||||||||||||
Total assets of discontinued operations | $ | 5,154 | $ | 88,100 | $ | 65,271 | $ | 158,525 | ||||||||
LIABILITIES | ||||||||||||||||
Current liabilities | $ | 1,238 | $ | 21,277 | $ | 1,228 | $ | 23,743 | ||||||||
Current operating lease liability | 520 | 15 | - | 535 | ||||||||||||
Noncurrent operating lease liability | 223 | 88 | - | 311 | ||||||||||||
Other liabilities | 122 | 226 | 472 | 820 | ||||||||||||
Total liabilities of discontinued operations | $ | 2,103 | $ | 21,606 | $ | 1,700 | $ | 25,409 | ||||||||
Assets and Liabilities of Discontinued Operations (in thousands) | As of December 31, 2020 | |||||||||||||||
Crude Oil Trucking Services | Crude Oil Pipeline Services | Crude Oil Terminalling Services | Total | |||||||||||||
ASSETS | ||||||||||||||||
Accounts receivable, net | $ | 81 | $ | 13,711 | $ | 167 | $ | 13,959 | ||||||||
Plant, property, and equipment | 442 | 23,541 | 52,854 | 76,837 | ||||||||||||
Other assets | 331 | 547 | 5,271 | 6,149 | ||||||||||||
Total assets of discontinued operations | $ | 854 | $ | 37,799 | $ | 58,292 | $ | 96,945 | ||||||||
LIABILITIES | ||||||||||||||||
Current liabilities | $ | 1,017 | $ | 14,921 | $ | 1,310 | $ | 17,248 | ||||||||
Total liabilities of discontinued operations | $ | 1,017 | $ | 14,921 | $ | 1,310 | $ | 17,248 | ||||||||
| Year ended December 31, | |||||||||||
| 2015 | 2016 | 2017 | |||||||||
| (in thousands) | |||||||||||
| Beginning balance | $ | — | $ | 1,565 | $ | 474 | |||||
| Charged to expense | 1,565 | — | — | ||||||||
| Cash payments | — | 1,091 | 188 | ||||||||
| Ending balance | $ | 1,565 | $ | 474 | $ | 286 | |||||
Statement of Operations for Discontinued Operations (in thousands) | ||||||||||||||||
Year Ended December 31, 2019 | ||||||||||||||||
Crude Oil Trucking Services | Crude Oil Pipeline Services | Crude Oil Terminalling Services | Total | |||||||||||||
Revenue: | ||||||||||||||||
Third-party service revenue | $ | 11,061 | $ | 6,686 | $ | 15,362 | $ | 33,109 | ||||||||
Related-party service revenue | - | 266 | - | 266 | ||||||||||||
Intercompany service revenue | 5,555 | - | 931 | 6,486 | ||||||||||||
Third-party product sales revenue | - | 231,051 | - | 231,051 | ||||||||||||
Costs and expenses: | ||||||||||||||||
Operating expense | 16,763 | 16,088 | 9,012 | 41,863 | ||||||||||||
Intercompany operating expense | - | 6,486 | - | 6,486 | ||||||||||||
Cost of product sales | - | 83,319 | - | 83,319 | ||||||||||||
Cost of product sales from related party | - | 134,162 | - | 134,162 | ||||||||||||
General and administrative expense | 267 | 438 | 1 | 706 | ||||||||||||
(Gain) loss on sale of assets | (1,497 | ) | 836 | 77 | (584 | ) | ||||||||||
Interest expense | 11 | 1,598 | 6,919 | 8,528 | ||||||||||||
Income (loss) before income taxes | 1,072 | (4,924 | ) | 284 | (3,568 | ) | ||||||||||
Provision for income taxes | 15 | 4 | - | 19 | ||||||||||||
Net income (loss) from discontinued operations | $ | 1,057 | $ | (4,928 | ) | $ | 284 | $ | (3,587 | ) | ||||||
Statement of Operations for Discontinued Operations (in thousands) | Year Ended December 31, 2020 | |||||||||||||||
Crude Oil Trucking Services | Crude Oil Pipeline Services | Crude Oil Terminalling Services | Total | |||||||||||||
Revenue: | ||||||||||||||||
Third-party service revenue | $ | 5,293 | $ | 1,689 | $ | 16,856 | $ | 23,838 | ||||||||
Intercompany service revenue | 5,587 | - | - | 5,587 | ||||||||||||
Third-party product sales revenue | - | 157,544 | - | 157,544 | ||||||||||||
Costs and expenses: | ||||||||||||||||
Operating expense | 12,386 | 13,427 | 8,561 | 34,374 | ||||||||||||
Intercompany operating expense | - | 5,587 | - | 5,587 | ||||||||||||
Cost of product sales | - | 52,624 | - | 52,624 | ||||||||||||
Cost of product sales from related party | - | 86,247 | - | 86,247 | ||||||||||||
General and administrative expense | 284 | 385 | - | 669 | ||||||||||||
Asset impairment expense | 1,330 | 2,821 | 2,266 | 6,417 | ||||||||||||
Gain on sale of assets | (11 | ) | (445 | ) | (734 | ) | (1,190 | ) | ||||||||
Interest expense | 11 | 960 | 4,348 | 5,319 | ||||||||||||
Loss on disposal/classification as held for sale(1) | 1,847 | 37,249 | - | 39,096 | ||||||||||||
Income (loss) before income taxes | (4,967 | ) | (39,622 | ) | 2,415 | (42,174 | ) | |||||||||
Provision for income taxes | 3 | (2 | ) | - | 1 | |||||||||||
Net income (loss) from discontinued operations | $ | (4,970 | ) | $ | (39,620 | ) | $ | 2,415 | $ | (42,175 | ) | |||||
(1) | Included in the crude oil trucking services segment is a loss on disposal recorded during December 2020 for the first phase closing of $1.1 million, and a loss on the classification on assets held for sale as of December 31, 2020, for the second phase closing on February 2, 2021, of $0.7 million. |
Select cash flow information (in thousands) | ||||||||||||||||
Year Ended December 31, 2019 | ||||||||||||||||
Crude Oil Trucking Services | Crude Oil Pipeline Services | Crude Oil Terminalling Services | Total | |||||||||||||
Depreciation and amortization | $ | 538 | $ | 5,332 | $ | 4,466 | $ | 10,336 | ||||||||
Capital expenditures | $ | 2,168 | $ | 1,846 | $ | 874 | $ | 4,888 | ||||||||
Year Ended December 31, 2020 | ||||||||||||||||
Depreciation and amortization | $ | 719 | $ | 4,550 | $ | 4,383 | $ | 9,652 | ||||||||
| Capital expenditures | $ | 2,074 | $ | 4,555 | $ | 720 | $ | 7,349 | ||||||||
| Estimated Useful Lives (Years) | As of December 31, | ||||||||
| 2016 | 2017 | ||||||||
| (dollars in thousands) | |||||||||
| Land | N/A | $ | 25,863 | $ | 24,776 | ||||
| Land improvements | 10-20 | 6,698 | 6,787 | ||||||
| Pipelines and facilities | 5-30 | 165,293 | 166,004 | ||||||
| Storage and terminal facilities | 10-35 | 347,656 | 370,056 | ||||||
| Transportation equipment | 3-10 | 12,391 | 3,293 | ||||||
| Office property and equipment and other | 3-20 | 35,578 | 32,011 | ||||||
| Pipeline linefill and tank bottoms | N/A | 3,234 | 3,233 | ||||||
| Construction-in-progress | N/A | 2,738 | 6,500 | ||||||
| Property, plant and equipment, gross | 599,451 | 612,660 | |||||||
| Accumulated depreciation | (292,117 | ) | (316,591 | ) | |||||
| Property, plant and equipment, net | $ | 307,334 | $ | 296,069 | |||||
6. | PROPERTY, PLANT AND EQUIPMENT |
Estimated | ||||||||||||
Useful Lives | As of December 31, | |||||||||||
(Years) | 2019 | 2020 | ||||||||||
(dollars in thousands) | ||||||||||||
Land | N/A | $ | 21,876 | $ | 21,826 | |||||||
Land improvements | 10-20 | 5,139 | 5,024 | |||||||||
Storage and terminal facilities | 10-35 | 241,733 | 249,977 | |||||||||
Office property and equipment and other | 3-30 | 21,099 | 23,278 | |||||||||
Construction-in-progress | N/A | 3,371 | 2,165 | |||||||||
Property, plant and equipment, gross | 293,218 | 302,270 | ||||||||||
Accumulated depreciation | (185,845 | ) | (197,561 | ) | ||||||||
Property, plant and equipment, net | $ | 107,373 | $ | 104,709 | ||||||||
Property, plant and equipment under operating leases at December 31, 2020, in which the Partnership is the lessor, had a cost basis of $295.4 million and accumulated depreciation of $191.0 million.
Depreciation expense for the years ended December 31, 2015, 20162019 and 20172020 was $27.0 million, $29.6$12.8 million and $29.9$11.0 million, respectively. During the year ended December 31, 2015, the Partnership recorded fixed asset impairment expense of $14.0 million related to its crude oil pipeline services reporting unit and $0.5 million related to its crude oil trucking and field services reporting unit. During the year ended December 31, 2016, the Partnership recorded fixed asset impairment expense of $25.8 million, primarily due to an impairment recognized on the Knight Warrior pipeline project and the East Texas pipeline system. During the year ended December 31, 2017, the Partnership recorded fixed asset impairment expense of $1.2 million related to the crude oil trucking and field services reporting unit.
7. | INTANGIBLE ASSETS, NET |
Intangible assets, net of accumulated amortization, consist of the following:
As of December 31, | ||||||||
2019 | 2020 | |||||||
(in thousands) | ||||||||
Customer relationships | $ | 16,022 | $ | 16,022 | ||||
Accumulated amortization of intangible assets | (6,109 | ) | (8,491 | ) | ||||
Intangible assets, net | $ | 9,913 | $ | 7,531 | ||||
| As of December 31, | |||||||
| 2016 | 2017 | ||||||
| (in thousands) | |||||||
| Customer relationships | $ | 12,579 | $ | 12,221 | |||
| Deferred charges related to pipeline connection agreements | 2,653 | 2,716 | |||||
| Deposits | 435 | 302 | |||||
| Prepaid insurance | 428 | 353 | |||||
| Other prepaid expenses | 24 | 103 | |||||
| Intangibles and other assets, gross | 16,119 | 15,695 | |||||
| Accumulated amortization of intangible assets | (1,604 | ) | (2,782 | ) | |||
| Intangibles and other assets, net | $ | 14,515 | $ | 12,913 | |||
Amortization expense related to intangibles for each of the years ended December 31, 2015, 20162019 and 20172020, was $0.2 million, $1.2 million and $1.3 million, respectively.$2.4 million. The estimated aggregate future amortization expense on amortizable intangible assets currently owned by the Partnership is as follows (in thousands):
For year ending: | ||||
December 31, 2021 | $ | 2,382 | ||
December 31, 2022 | 2,382 | |||
December 31, 2023 | 958 | |||
December 31, 2024 | 958 | |||
December 31, 2025 | 851 | |||
Thereafter | - | |||
Total estimated aggregate amortization expense | $ | 7,531 |
| For year ending: | |||
| December 31, 2018 | $ | 1,314 | |
| December 31, 2019 | 1,269 | ||
| December 31, 2020 | 1,267 | ||
| December 31, 2021 | 1,267 | ||
| December 31, 2022 | 1,267 | ||
| Thereafter | 5,771 | ||
| Total estimated aggregate amortization expense | $ | 12,155 | |
Customer relationships include $7.6 million and $8.4 million related to the acquisition of asphalt facilities in March 2018 and February 2016, $3.5 million related to the acquisition of a pipeline and crude oil marketing business in November 2015 and $0.3 million related to the acquisition of a producer field services business in December 2010.respectively. The customer relationships are being amortized over a range of 45 to 2010 years.
8. | DEBT |
On May 11, 2017, the Partnership entered into an amended and restated credit agreement. On June 28, 2018, the credit agreement which consists of a
As of
MarchThe credit agreement is guaranteed by all of the Partnership’s existing subsidiaries. Obligations under the credit agreement are secured by first priority liens on substantially all of the Partnership’s assets and those of the guarantors.
The credit agreement includes procedures for additional financial institutions to become revolving lenders, or for any existing lender to increase its revolving commitment thereunder, subject to an aggregate maximum of
The credit agreement will mature on
May 11, 2022,Borrowings under the credit agreement bear interest, at the Partnership’s option, at either the reserve-adjusted eurodollar rate (as defined in the credit agreement) plus an applicable margin which ranges from
2.0% toThe credit agreement includes financial covenants which are tested on a quarterly basis, based on the rolling four-quarter period that ends on the last day of each fiscal quarter.
Prior to the date on which the Partnership issues qualified senior notes in an aggregate principal amount (when combined with all other qualified senior notes previously or concurrently issued) that equals or exceeds $200.0 million, the maximum permitted consolidated total leverage ratio iswill be 4.75 to 1.00;1.00 for the fiscal quarter ending and December 31, 2020, and each fiscal quarter thereafter; provided that the maximum permitted consolidated total leverage ratio willmay be increased to 5.25 to 1.00 for certain quarters, based on the occurrence of a specified acquisition (as defined in the Partnership’s credit agreement, but generally being an acquisition for which the aggregate consideration is $15.0 million or more). The acquisition of the nine asphalt terminals from Ergon in 2016 qualified as a specified acquisition.
From and after the date on which the Partnership issues qualified senior notes in an aggregate principal amount (when combined with all other qualified senior notes previously or concurrently issued) that equals or exceeds $200.0 million, the maximum permitted consolidated total leverage ratio is 5.00 to 1.00; provided that from and after the fiscal quarter ending immediately preceding the fiscal quarter in which a specified acquisition occurs, to and including the last day of the second full fiscal quarter following the fiscal quarter in which such acquisition occurred, the maximum permitted consolidated total leverage ratio is 5.50 to 1.00.
The maximum permitted consolidated senior secured leverage ratio (as defined in the credit agreement, but generally computed as the ratio of consolidated total secured debt to consolidated earnings before interest, taxes, depreciation, amortization and certain other non-cash charges) is
3.50 to 1.00, but this covenant is only tested from and after the date on which the Partnership issues qualified senior notes in an aggregate principal amount (when combined with all other qualified senior notes previously or concurrently issued) that equals or exceedsThe minimum permitted consolidated interest coverage ratio (as defined in the credit agreement, but generally computed as the ratio of consolidated earnings before interest, taxes, depreciation, amortization and certain other non-cash charges to consolidated interest expense) is
2.50 to 1.00.In addition, the credit agreement contains various covenants that, among other restrictions, limit the Partnership’s ability to:
create, issue, incur or assume indebtedness;
create, incur or assume liens;
engage in mergers or acquisitions;
sell, transfer, assign or convey assets;
repurchase the Partnership’s equity, make distributions to unitholders and make certain other restricted payments;
make investments;
modify the terms of certain indebtedness, or prepay certain indebtedness;
engage in transactions with affiliates;
enter into certain hedging contracts;
enter into certain burdensome agreements;
change the nature of the Partnership’s business; and
make certain amendments to the Partnership’s partnership agreement.
At
December 31,Management evaluates whether conditions and/or events raise substantial doubt about the Partnership’s ability to continue as a going concern within one year after the date that the consolidated financial statements are issued (the “assessment period”). In performing this assessment, management considered the risk associated with its ongoing ability to meet the financial covenants.
Based on the Partnership’s forecasted EBITDA during the assessment period, management believes that it will meet these financial covenants. However, the Partnership cannot make any assurances that it will be able to achieve management’s forecasts. If the Partnership is unable to achieve management’s forecasts, further actions may be necessary to remain in compliance with the Partnership’s consolidated total leverage ratio covenant, including, but not limited to, cost reductions, common and preferred unitholder distribution curtailments, and/or asset sales. The Partnership can make no assurances that it would be successful in undertaking these actions, or that the Partnership will remain in compliance with the consolidated total leverage ratio during the assessment period. Additionally, there are certain inherent risks associated with our continued ability to comply with our consolidated total leverage ratio covenant. These risks relate, among other things, to potential future (a) decreases in storage volumes and rates as well as throughput and transportation rates realized; (b) weather phenomenon that may potentially hinder the Partnership’s asphalt business activity; and (c) other items affecting forecasted levels of expenditures and uses of cash resources. Violation of the consolidated total leverage ratio covenant would be an event of default under the credit agreement, which would cause our $252.6 million in outstanding debt, as of December 31, 2020, to become immediately due and payable. If this were to occur, the Partnership would not expect to have sufficient liquidity to repay these outstanding amounts then due, which could cause the lenders under the credit facility to pursue other remedies. Such remedies could include exercising their collateral rights to the Partnership’s assets.
The credit agreement permits the Partnership to make quarterly distributions of available cash (as defined in the Partnership’s partnership agreement) to unitholders so long as no default or event of default exists under the credit agreement on a pro forma basis after giving effect to such distribution. The Partnership is currently allowed to make distributions to its unitholders in accordance with this covenant; however, the Partnership will only make distributions to the extent it has sufficient cash from operations after establishment of cash reserves as determined by the Board of the General Partner in accordance with the Partnership’s cash distribution policy, including the establishment of any reserves for the proper conduct of the Partnership’s business. See Note 1110 for additional information regarding distributions.
In addition to other customary events of default, the credit agreement includes an event of default if:
(i) | the general partner ceases to own 100% of the Partnership’s general partner interest or ceases to control the Partnership; |
(ii) | Ergon ceases to own and control 50.0% or more of the membership interests of the general partner; or |
(iii) | during any period of 12 consecutive months, a majority of the members of the Board of the general partner ceases to be composed of individuals: |
(A) | who were members of the Board on the first day of such period; |
(B) | whose election or nomination to the Board was approved by individuals referred to in clause (A) above constituting at the time of such election or nomination at least a majority of the Board; or |
(C) | whose election or nomination to the Board was approved by individuals referred to in clauses (A) and (B) above constituting at the time of such election or nomination at least a majority of the Board, provided that any changes to the composition of individuals serving as members of the Board approved by Ergon will not cause an event of default. |
If an event of default relating to bankruptcy or other insolvency events occurs with respect to the general partner or the Partnership, all indebtedness under the credit agreement will immediately become due and payable. If any other event of default exists under the credit agreement, the lenders may accelerate the maturity of the obligations outstanding under the credit agreement and exercise other rights and remedies. In addition, if any event of default exists under the credit agreement, the lenders may commence foreclosure or other actions against the collateral.
If any default occurs under the credit agreement, or if the Partnership is unable to make any of the representations and warranties in the credit agreement, the Partnership will be unable to borrow funds or have letters of credit issued under the credit agreement.
Debt issuance costs are being amortized over the term of the credit agreement. Interest expense related to debt issuance cost amortization for
During the years ended December 31, 2015, 20162019 and 2017,2020, the weighted average interest rate under the Partnership’s credit agreement excluding the $0.7 million of debt issuance costs related to the prior credit agreement that were expensed during the year ended December 31, 2017, was 3.37%, 3.95%6.00% and 4.43%3.97%, respectively, resulting in interest expense of approximately $7.9 million, $11.2$7.4 million and $13.8$5.6 million, respectively.
| Derivatives Not Designated as Hedging Instruments | Balance Sheet Location | Fair Values of Derivative Instruments | ||||||||
| December 31, 2016 | December 31, 2017 | |||||||||
| Interest rate swap assets - current | Other current assets | $ | — | $ | 68 | |||||
| Interest rate swap liabilities - noncurrent | Long-term interest rate swap liabilities | $ | 1,947 | $ | 225 | |||||
| Derivatives Not Designated as Hedging Instruments | Location of Gain (Loss) Recognized in Net Income on Derivatives | Amount of Gain (Loss) Recognized in Net Income on Derivatives | ||||||||||||
| Year ended December 31, | ||||||||||||||
| 2015 | 2016 | 2017 | ||||||||||||
| Interest rate swaps | Interest expense, net of capitalized interest | $ | (469 | ) | $ | 1,156 | $ | 1,790 | ||||||
9. | NET INCOME PER LIMITED PARTNER UNIT |
For purposes of calculating earnings per unit, the excess of distributions over earnings or excess of earnings over distributions for each period are allocated to the Partnership’s general partner based on the general partner’s ownership interest at the time. The following sets forth the computation of basic and diluted net income per common unit (in thousands, except per unit data):
Year ended December 31, | ||||||||
2019 | 2020 | |||||||
Net income(loss) | $ | 18,412 | $ | (13,480 | ) | |||
General partner interest in net income (loss) | 337 | (213 | ) | |||||
Preferred interest in net income | 25,115 | 25,115 | ||||||
Net loss available to limited partners | $ | (7,040 | ) | $ | (38,382 | ) | ||
Basic and diluted weighted average number of units: | ||||||||
Common units | 40,755 | 41,104 | ||||||
Restricted and phantom units | 1,023 | 1,285 | ||||||
Total units | 41,778 | 42,389 | ||||||
| Basic and diluted net loss from discontinued operations per common unit | $ | (0.08 | ) | $ | (0.98 | ) | ||
| Basic and diluted net income(loss) from continuing operations per common unit | $ | (0.09 | ) | $ | 0.07 | |||
Basic and diluted net loss per common unit | $ | (0.17 | ) | $ | (0.91 | ) | ||
| Year ended December 31, | |||||||||||
| 2015 | 2016 | 2017 | |||||||||
| Net income (loss) | $ | 6,396 | $ | (4,840 | ) | $ | 20,045 | ||||
| General partner interest in net income | 554 | 433 | 944 | ||||||||
| Preferred interest in net income | 21,564 | 25,824 | 25,115 | ||||||||
| Net loss available to limited partners | $ | (15,722 | ) | $ | (31,097 | ) | $ | (6,014 | ) | ||
| Basic and diluted weighted average number of units: | |||||||||||
| Common units | 32,945 | 35,093 | 38,342 | ||||||||
| Restricted and phantom units | 685 | 803 | 862 | ||||||||
| Total units | 33,630 | 35,896 | 39,204 | ||||||||
| Basic and diluted net loss per common unit | $ | (0.47 | ) | $ | (0.87 | ) | $ | (0.15 | ) | ||
PARTNERS’ CAPITAL (DEFICIT) AND DISTRIBUTIONS |
In accordance with the terms of its partnership agreement, each quarter the Partnership distributes all of its available cash (as defined in the partnership agreement) to its unitholders. Generally, distributions are allocated as follows:
first, 98.4% to the preferred unitholders and 1.6% to its general partner until the Partnership distributes for each Preferred Unit an amount equal to the Preferred Units quarterly distribution amount discussed below;
second, 98.4% to the preferred unitholders and 1.6% to its general partner until the Partnership distributes for each Preferred Unit an amount equal to any Preferred Units cumulative distribution arrearage; and
thereafter, 98.4% to the common unitholders and 1.6% to its general partner until the common unitholders receive the minimum quarterly distribution of $0.11 per unit.
The Preferred Units are convertible at the holders’ option into common units. Holders of the Preferred Units are entitled to quarterly distributions of $0.17875 per unit per quarter. If the Partnership fails to pay in full any distribution on the Preferred Units, the amount of such unpaid distribution will accrue and accumulate from the last day of the quarter for which such distribution is due until paid in full.
The general partner receives incentive distribution rights. Incentive distribution rights represent the right to receive an increasing percentage (13.0%, 23.0% and 48.0%) of quarterly distributions of available cash from operating surplus after the minimum quarterly distribution and the target distribution levels have been achieved. The general partner currently holds the incentive distribution rights, but may transfer these rights separately from its general partner interest, subject to restrictions in the partnership agreement. If for any quarter:
the Partnership has distributed available cash from operating surplus to the holders of our Preferred Units in an amount equal to the Preferred Units quarterly distribution amount;
the Partnership has distributed available cash from operating surplus to the holders of our Preferred Units in an amount necessary to eliminate any cumulative arrearages in the payment of the Preferred Units quarterly distribution amount; and
the Partnership has distributed available cash from operating surplus to the common unitholders and Class B unitholders in an amount equal to the minimum quarterly distribution;
then the partnership agreement requires that the Partnership distribute any additional available cash from operating surplus for that quarter among the unitholders and the general partner in the following manner:
first, 98.4% to all unitholders holding common units or Class B units, pro rata, and 1.6% to the general partner, until each unitholder receives a total of $0.1265 per unit for that quarter (the “first target distribution”);
second, 85.4% to all unitholders holding common units or Class B units, pro rata, and 14.6% to the general partner, until each unitholder receives a total of $0.1375 per unit for that quarter (the “second target distribution”);
third, 75.4% to all unitholders holding common units or Class B units, pro rata, and 24.6% to the general partner, until each unitholder receives a total of $0.1825 per unit for that quarter (the “third target distribution”); and
thereafter, 50.4% to all unitholders holding common units or Class B units, pro rata, and 49.6% to the general partner.
Distributions are also paid to the holders of restricted units and phantom units as disclosed in Note 14.
The Partnership paid the following distributions on the Preferred Units during the years ended December 31, 2015, 20162019 and 20172020 (in thousands):
Year | Paid to Preferred | Partner | ||||||||||||
Paid | Periods Covered | Total | Unitholders | Paid to General | ||||||||||
2019 | Quarters ending December 31, 2018, March 31, 2019, June 30, 2019 and September 30, 2019 | $ | 25,521 | $ | 25,115 | $ | 406 | |||||||
| 2020 | Quarters ending December 31, 2019, March 31, 2020, June 30, 2020 and September 30, 2020 | $ | 25,519 | $ | 25,115 | $ | 404 | |||||||
| Year Paid | Periods Covered | Total | Paid to Preferred Unitholders | Paid to General Partner | ||||||||
| 2015 | Quarters ending December 31, 2014, March 31, 2015, June 30, 2015 and September 30, 2015 | $ | 21,949 | $ | 21,563 | $ | 385 | |||||
| 2016 | Quarters ending December 31, 2015, March 31, 2016, June 30, 2016 and September 30, 2016 | $ | 22,837 | $ | 22,449 | $ | 388 | |||||
| 2017 | Quarters ending December 31, 2016, March 31, 2017, June 30, 2017 and September 30, 2017 | $ | 25,534 | $ | 25,115 | $ | 420 | |||||
In addition, on January 23, 2018,26, 2021, the Board approved a cash distribution of $0.17875$0.17875 per outstanding Preferred Unit for the quarter ending December 31, 2017.2020. The Partnership paid this distribution on the Preferred Units on February 14, 2018,12, 2021, to unitholders of record as of February 2, 2018.5, 2021. The total distribution was approximately $6.4$6.4 million, with approximately $6.3$6.3 million and $0.1$0.1 million paid to the Partnership’s preferred unitholders and general partner, respectively.
The Partnership paid the following distributions on the common units during the years ended December 31, 2015, 20162019 and 20172020 (in thousands):
Year | Paid to Common | Paid to General | Paid to Phantom and Restricted Unitholders Under | |||||||||||||||
Paid | Periods Covered | Total | Unitholders | Partner | the LTIP | |||||||||||||
2019 | Quarters ending December 31, 2018, March 31, 2019, June 30, 2019 and September 30, 2019 | $ | 8,468 | $ | 8,150 | $ | 135 | $ | 183 | |||||||||
| 2020 | Quarters ending December 31, 2019, March 31, 2020, June 30, 2020 and September 30, 2020 | $ | 6,887 | $ | 6,576 | $ | 109 | $ | 202 | |||||||||
| Year Paid | Periods Covered | Total | Paid to Common Unitholders | Paid to General Partner | Paid to Phantom and Restricted Unitholders Under the LTIP | |||||||||||
| 2015 | Quarters ending December 31, 2014, March 31, 2015, June 30, 2015 and September 30, 2015 | $ | 19,651 | $ | 18,567 | $ | 707 | $ | 376 | |||||||
| 2016 | Quarters ending December 31, 2015, March 31, 2016, June 30, 2016 and September 30, 2016 | $ | 21,900 | $ | 20,509 | $ | 933 | $ | 458 | |||||||
| 2017 | Quarters ending December 31, 2016, March 31, 2017, June 30, 2017 and September 30, 2017 | $ | 23,629 | $ | 22,147 | $ | 994 | $ | 488 | |||||||
In addition, on January 23, 2018,26, 2021, the Board approved a cash distribution of $0.1450$0.04 per outstanding common unit for the quarter ending December 31, 2017.2020. The distribution was paid on February 14, 2018,12, 2021, to unitholders of record as of February 2, 2018.5, 2021. The total distribution was approximately $6.2$1.7 million, with approximately $5.8 million and $0.3$1.7 million paid to the Partnership’s common unitholders and general partner, respectively, and $0.1less than $0.1 million paid to the both the Partnership’s general partner and holders of phantom and restricted units pursuant to awards granted under the LTIP.
11. | MAJOR CUSTOMERS AND CONCENTRATION OF CREDIT RISK |
Significant customers are defined as those who represent 10% or more of our total consolidated revenues during the year.
For the year ended December 31, 2015, Vitol2020, Ergon accounted for approximately 21%40% of the Partnership’s total revenues across allrevenues. In addition, two third-party customers accounted for 12% and 15% of the Partnership’s operating segments.
For the year ended December 31, 2016,2019, Ergon accounted for approximately 13%34% of the Partnership’s total revenues, all of which were earned in asphalt terminalling services. Vitol alsorevenues. In addition, two third-party customers accounted for approximately 13%12% and 16% of the Partnership’s total revenues, which were earned in all of the Partnership’s operating segments.revenues.
12. | RELATED-PARTY TRANSACTIONS |
The Partnership leases facilities to Ergon and provides liquid asphalt terminalling services to Ergon. For the yearyears ended December 31, 2015,2019 and 2020, the Partnership recognized revenues of $15.5$36.1 million and $44.4 million, respectively, for services provided to Ergon, allErgon. See additional discussion below regarding material asphalt operating lease contracts and storage, throughput and handling contracts. As of which is classified as third-party revenues. For the year ended December 31, 2016, the Partnership recognized revenues of $22.2 million for services provided to Ergon, of which $11.0 million is classified as related-party revenue. For the year ended December 31, 2017, the Partnership recognized revenues of $56.4 million for services provided to Ergon, all of which is classified as related-party revenue. As of December 31, 20162019 and 2017,2020, the Partnership had receivables from Ergon of $1.7$1.1 million and $3.1$0.5 million, respectively.
Effective April 1, 2018, the Partnership entered into an agreement with Ergon under which the Partnership purchases crude oil in connection with its crude oil marketing operations. For the years ended December 31, 2019 and 2020, the Partnership made purchases of crude oil under this agreement totaling $133.5 million and $92.1 million, respectively. As of December 31, 2020. the Partnership had payables to Ergon provides natural gas servicerelated to onethis agreement of $8.7 million related to the December crude oil settlement cycle, and this balance was paid in full on January 20, 2021. This agreement terminated upon the closing of the Partnership’s asphalt terminalling facilities. Forsale of the crude oil pipeline services business on February 1, 2021.
As of December 31, 2019, the Partnership had a contingent liability to Ergon of $12.2 million related to the Cimarron Express project, a previously disclosed joint venture between Kingfisher Midstream and Ergon's development company (“DEVCO”) that was cancelled in December 2018. The contingent liability reflected Ergon's investment in the joint venture and accrued interest, for which the Partnership, in accordance with the membership interest purchase agreement with Ergon, was meant to bear the risk of loss related to DEVCO’s portion of the project. The Partnership recognized other impairment charges of $2.2 million related to the accrued interest during the year ended December 31, 2017, the Partnership recognized $0.5 million of expense for services provided by this subsidiary.
Ergon 2016 Storage and Handling Agreement
In October 2016, the Partnership and Ergon entered into a storage, throughput and handling agreement (the “Ergon 2016 Storage and Handling Agreement”) pursuant to which the Partnership provides Ergon storage and terminalling services at nine asphalt terminal facilities. In July 2018, the Partnership sold one of the facilities to Ergon and the agreement was amended accordingly. The term of the Ergon 2016 Storage, Throughput and Handling Agreement commenced on October 5, 2016, and continues for seven years.in August 2020, was replaced with the Ergon 2020 Master Storage, Throughput and Handling Agreement; see below. The Board’s conflicts committee reviewed and approved this agreement in accordance
Ergon Fontana and Las Vegas Storage Throughput and Handling Agreement
In October 2016, the Partnership and Ergon entered into a storage, throughput and handling agreement (the “Ergon Fontana and Las Vegas Storage Throughput and Handling Agreement”) pursuant to which the Partnership provides Ergon storage and terminalling services at two asphalt facilities. The term of the Ergon Fontana and Las Vegas Storage Throughput and Handling Agreement commenced on October 5, 2016, and is scheduled to expire on December 31, 2018. The original Ergon Fontana and Las Vegas Master Facilities Lease Agreement commenced on May 18, 2009, and was a part of previous agreement that expired in 2018. A new agreement was executed in March 2019 with an effective date of January 1, 2019, and, on August 1, 2020, was replaced with the Ergon 2020 Master FacilitiesStorage, Throughput and Handling Agreement (as defined below). The Board’s conflicts committee reviewed and approved these agreements in accordance with the Partnership’s procedures for approval of related-party transactions and the provisions of the partnership agreement. During the years ended December 31, 2019 and 2020, the Partnership generated revenues under this agreement of $6.0 million and $3.5 million, respectively.
Ergon Lessee Operated Facility Lease Agreement and Sublease Agreement. SeePrevious Agreements
In March 2019, the Partnership and Ergon entered into a facilities lease agreement (the “Ergon Lessee Operated Facility Lease Agreement”) covering 12 facilities. The facilities covered by this agreement were previously accounted for under two separate agreements. This agreement was effective January 1, 2019, and on August 1, 2020, was replaced with the Ergon 2020 Master Facilities LeaseStorage, Throughput and Sublease Agreement for additional detail regarding prior terms and conditions.Handling Agreement; see below. The Board’s conflicts committee reviewed and approved this agreement in accordance with the Partnership’s procedures for approval of related-party transactions and the provisions of the partnership agreement. During the years ended December 31, 20162019 and 2017,2020, the Partnership generated revenues under this agreement of $1.5$8.3 million and $6.2$4.4 million, respectively, all of which is classified as related-party revenue.
Ergon 2020 Master Facilities LeaseStorage, Throughput and SubleaseHandling Agreement
In May 2009,August 2020, the Partnership and Ergon entered into a facilities leasethe “2020 Master Storage, Throughput and subleaseHandling Agreement”, effective August 1, 2020, which replaced the three agreements noted above and all related amendments. Pursuant to this agreement, (the “Ergon Master Facilities Lease and Sublease Agreement”) pursuant to which the Partnership leasesprovides Ergon certain facilities. The original term of the Ergon Master Facilities Leasewith storage and Sublease Agreement commenced on May 18, 2009, for two years, untilterminalling services at 22 facilities through December 31, 2011. The Ergon Master Facilities Lease and Sublease Agreement has been amended and extended several times and currently encompasses eight facilities and is scheduled to expire on December 31, 2018.2027. The Board’s conflicts committee reviewed and approved these agreementsthis agreement in accordance with the Partnership’s procedures for approval of related-party transactions and the provisions of the partnership agreement. During the year ended December 31, 2015,2020, the Partnership generated revenues under this agreement of $10.5 million, all of which is classified as third-party revenue. During the year ended December 31, 2016, the Partnership generated revenues under this agreement of $9.2 million, of which $1.8 million is classified as related-party revenue. During the year ended December 31, 2017, the Partnership generated revenues under this agreement of $5.2 million, all of which is classified as related-party revenue.
Ergon Master Facilities SubleaseOperating and SublicenseMaintenance Agreement
In May 2009,August 2020, the Partnership and Ergon also entered into multiple subleasethe Operating and sublicense agreements covering five facilities. The original terms of these agreements commenced on May 18, 2009, for two years, untilMaintenance Agreement, effective August 1, 2020, pursuant to which Ergon will provide certain operations and maintenance services to the 22 facilities also under the 2020 Master Storage, Throughput and Handling Agreement through December 31, 2011. In November 2010, these multiple leases were consolidated under one master sublease and sublicense agreement. This agreement was amended in June 2015 and has a term scheduled to expire on December 31, 2018. During the year ended December 31, 2015, the Partnership generated revenues under this agreement of $3.2 million, all of which is classified as third-party revenue. During the year ended December 31, 2016, the Partnership generated revenues under this agreement of $3.6 million, of which $1.0 million is classified as related-party revenue. During the year ended December 31, 2017, the Partnership generated revenues under this agreement of $3.7 million, all of which is classified as related-party revenue.
13. | LONG-TERM INCENTIVE PLAN |
In July 2007, the general partner adopted the LTIP, which is administered by the compensation committee of the Board. Effective April 29, 2014, theThe Partnership’s unitholders have approved an amendment to the LTIP to increase the number of8.1 million common units to be reserved for issuance under the incentive plan, to 4.1 million common units, subject to adjustment for certain events. Although other types of awards are contemplated under the LTIP, currently outstanding awards include “phantom” units, which convey the right to receive common units upon vesting, and “restricted” units, which are grants of common units restricted until the time of vesting. Certain of the phantom unit awards also include DERs.
Subject to applicable earning criteria, a DER entitles the grantee to a cash payment equal to the cash distribution paid on an outstanding common unit prior to the vesting date of the underlying award. Recipients of restricted and phantom units are entitled to receive cash distributions paid on common units during the vesting period which are reflected initially as a reduction of partners’ capital. Distributions paid on units that ultimately do not vest are reclassified as compensation expense. Awards granted to date are equity awards and, accordingly, the fair value of the awards as of the grant date is expensed over the vesting period.
In connection with each anniversary of joining the Board, restricted common units are granted to the independent directors. The units vest in one-third increments over three years. The following table includes information on grants made to the directors under the LTIP subject to vesting requirements:
Weighted Average | Grant Date Total Fair | |||||||||||
Number of | Grant Date Fair | Value | ||||||||||
Grant Date | Units | Value | (in thousands) | |||||||||
December 2018 | 23,436 | $ | 1.20 | $ | 28 | |||||||
December 2019 | 7,500 | $ | 1.07 | $ | 8 | |||||||
December 2020 | 7,500 | $ | 2.06 | $ | 15 | |||||||
| Grant Date | Number of Units | Weighted Average Grant Date Fair Value | Grant Date Total Fair Value | |||||||
| (in thousands) | ||||||||||
| December 2015 | 15,120 | $ | 5.06 | $ | 77 | |||||
| December 2016 | 10,950 | $ | 6.85 | $ | 75 | |||||
| December 2017 | 15,306 | $ | 4.85 | $ | 74 | |||||
| Grant Date | Number of Units | Weighted Average Grant Date Fair Value | Grant Date Total Fair Value | |||||||
| (in thousands) | ||||||||||
| December 2016 | 10,220 | $ | 6.85 | $ | 70 | |||||
| December 2017 | 14,286 | $ | 4.85 | $ | 69 | |||||
The Partnership also grants phantom units to employees. These grants are equity awards under
ASC 718 – Stock Compensation and, accordingly, the fair value of the awards as of the grant date is expensed over the vesting period. The following table includes information on the outstanding grants:Weighted Average | Grant Date Total Fair | |||||||||||
Number of | Grant Date Fair | Value | ||||||||||
Grant Date | Units | Value | (in thousands) | |||||||||
March 2018 | 396,536 | $ | 4.77 | $ | 1,891 | |||||||
March 2019 | 524,997 | $ | 1.14 | $ | 598 | |||||||
June 2019 | 46,168 | $ | 1.08 | $ | 50 | |||||||
March 2020 | 600,396 | $ | 0.90 | $ | 540 | |||||||
| October 2020 | 16,339 | $ | 1.53 | $ | 25 | |||||||
| Grant Date | Number of Units | Weighted Average Grant Date Fair Value | Grant Date Total Fair Value | |||||||
| (in thousands) | ||||||||||
| March 2015 | 266,076 | $ | 7.74 | $ | 2,059 | |||||
| March 2016 | 416,131 | $ | 4.77 | $ | 1,985 | |||||
| October 2016 | 9,960 | $ | 5.85 | $ | 58 | |||||
| March 2017 | 323,339 | $ | 7.15 | $ | 2,312 | |||||
Compensation expense for the equity awards is calculated as the number of unit awards less forfeitures, multiplied by the grand date fair value of those awards. The Partnership estimates forfeiture rates based on historical forfeitures under the LTIP. The unrecognized estimated compensation cost relating to outstanding phantom and restricted units at
December 31,The Partnership’s equity-based incentive compensation expense for the years ended December 31, 2015, 20162019 and 20172020 was $2.7 million, $2.5$0.9 million and $2.2$0.8 million, respectively.
Activity pertaining to phantom common units and restricted common unit awards granted under the LTIP is as follows:
Number of | Grant Date Fair | |||||||
Units | Value | |||||||
Nonvested, December 31, 2019 | 1,068,343 | $ | 3.42 | |||||
Granted | 624,235 | 0.93 | ||||||
Vested | 322,608 | 5.43 | ||||||
Forfeited | 19,604 | 1.90 | ||||||
Nonvested, December 31, 2020 | 1,350,366 | $ | 1.81 | |||||
| Number of Units | Weighted Average Grant Date Fair Value | |||||
| Nonvested, December 31, 2016 | 915,180 | $ | 6.61 | |||
| Granted | 352,931 | 6.96 | ||||
| Vested | 331,860 | 7.82 | ||||
| Forfeited | 12,700 | 6.69 | ||||
| Nonvested, December 31, 2017 | 923,551 | $ | 6.29 | |||
14. | EMPLOYEE BENEFIT PLAN |
Under the Partnership’s 401(k) Plan, which was instituted in
2009,The Partnership may also make annual lump-sum contributions to the 401(k) Plan irrespective of the employee’s contribution match. The Partnership may make a discretionary annual contribution in the form of profit sharing calculated as a percentage of an employee’s eligible compensation. This contribution is retirement income under the qualified 401(k) Plan. Annual profit sharing contributions to the 401(k) Plan are submitted to the Board for approval. The Partnership recognized expense of $0.9$0.4 million and $0.6 million for the yearyears ended December 31, 2015,2019 and $0.8 million for each of the years ended December 31, 2016 and
Under the Partnership’s Employee Unit Purchase Plan (the “Unit Purchase Plan”), which was instituted in January 2015, employees have the opportunity to acquire or increase their ownership of common units representing limited partner interests in the Partnership. Eligible employees who enroll in the Unit Purchase Plan may elect to have a designated whole percentage, up to a specified maximum, of their eligible compensation for each pay period withheld for the purchase of common units at a discount to the then current market value. A maximum of 1,000,000 common units may be delivered under the Unit Purchase Plan, subject to adjustment for a recapitalization, split, reorganization, or similar event pursuant to the terms of the Unit Purchase Plan. Expense for the Unit Purchase Plan was immaterial for both 2019 and 2020.
| For year ending: | Operating Leases | ||
| December 31, 2018 | $ | 4,813 | |
| December 31, 2019 | 3,307 | ||
| December 31, 2020 | 1,707 | ||
| December 31, 2021 | 1,022 | ||
| December 31, 2022 | 736 | ||
| Thereafter | 1,284 | ||
| Total future minimum lease payments | $ | 12,869 | |
15. | COMMITMENTS AND CONTINGENCIES |
The Partnership is from time to time subject to various legal actions and claims incidental to its business. Management believes that these legal proceedings will not have a material adverse effect on the financial position, results of operations or cash flows of the Partnership. Once management determines that information pertaining to a legal proceeding indicates that it is probable that a liability has been incurred and the amount of such liability can be reasonably estimated, an accrual is established equal to its estimate of the likely exposure.
The Partnership has contractual obligations to perform dismantlement and removal activities in the event that some of its liquid asphalt product and residual fuel oil terminalling assets are abandoned. These obligations include varying levels of activity, including completely removing the assets and returning the land to its original state. The Partnership has determined that the settlement dates related to the retirement obligations are indeterminate. The assets with indeterminate settlement dates have been in existence for many years and with regular maintenance will continue to be in service for many years to come. Also, it is not possible to predict when demands for the Partnership’s terminalling services will cease, and the Partnership does not believe that such demand will cease in the foreseeable future. Accordingly, the Partnership believes the date when these assets will be abandoned is indeterminate. With no reasonably determinable abandonment date, the Partnership cannot reasonably estimate the fair value of the associated asset retirement obligations. Management believes that if the Partnership’s asset retirement obligations were settled in the foreseeable future, the potential cash flows that would be required to settle the obligations based on current costs are not material. The Partnership will record asset retirement obligations for these assets in the period in which sufficient information becomes available for it to reasonably determine the settlement dates.
ENVIRONMENTAL REMEDIATION |
The Partnership maintains insurance of various types with varying levels of coverage that it considers adequate under the circumstances to cover its operations and properties. The insurance policies are subject to deductibles and retention levels that
At December 31, 20162019 and 2017,2020, the Partnership was aware of existing conditions that may cause it to incur expenditures in the future for the remediation of existing environmental matters. The Partnership had no relatedenvironmental remediation loss contingencies as of December 31, 2016. The Partnership had loss contingencies of $0.1 million related to environmental matters as of December 31, 2017.2019 and 2020. Changes in the Partnership’s estimates and assumptions may occur as a result of the passage of time and the occurrence of future events.
17. | FAIR VALUE MEASUREMENTS |
The Partnership uses valuation techniques, such as the market approach (comparable market prices), the income approach (present value of future income or cash flow) and the cost approach (cost to replace the service capacity of an asset or replacement cost) to value these assets and liabilities as appropriate. The Partnership uses an exit price when determining the fair value. The exit price represents amounts that would be received to sell an asset or paid to transfer a liability in an orderly transaction between market participants.
The Partnership utilizes a three-tier fair value hierarchy that prioritizes the inputs to valuation techniques used to measure fair value into three broad levels. The following is a brief description of those three levels:
Level 1 | Observable inputs such as quoted prices (unadjusted) in active markets for identical assets or liabilities. |
Level 2 | Inputs other than quoted prices that are observable for these assets or liabilities, either directly or indirectly. These include quoted prices for similar assets or liabilities in active markets and quoted prices for identical or similar assets or liabilities in markets that are not active. |
Level 3 | Unobservable inputs in which there is little market data, which requires the reporting entity to develop its own assumptions. |
This hierarchy requires the use of observable market data, when available, to minimize the use of unobservable inputs when determining fair value. In periods in which they occur, the Partnership recognizes transfers into and out of Level 3 as of the end of the reporting period. Transfers out of Level 3 represent existing assets and liabilities that were classified previously as Level 3 for which the observable inputs became a more significant portion of the fair value estimates. Determining the appropriate classification of the Partnership’s fair value measurements within the fair value hierarchy requires management’s judgment regarding the degree to which market data is observable or corroborated by observable market data.
| Fair Value Measurements as of December 31, 2016 | |||||||||||||||
| Description | Total | Quoted Prices in Active Markets for Identical Assets (Level 1) | Significant Other Observable Inputs (Level 2) | Significant Unobservable Inputs (Level 3) | |||||||||||
| Liabilities: | |||||||||||||||
| Interest rate swap liabilities | $ | 1,947 | $ | — | $ | 1,947 | $ | — | |||||||
| Total swap liabilities | $ | 1,947 | $ | — | $ | 1,947 | $ | — | |||||||
| Fair Value Measurements as of December 31, 2017 | |||||||||||||||
| Description | Total | Quoted Prices in Active Markets for Identical Assets (Level 1) | Significant Other Observable Inputs (Level 2) | Significant Unobservable Inputs (Level 3) | |||||||||||
| Assets: | |||||||||||||||
| Interest rate swap assets | $ | 68 | $ | — | $ | 68 | $ | — | |||||||
| Total swap assets | $ | 68 | $ | — | $ | 68 | $ | — | |||||||
| Liabilities: | |||||||||||||||
| Interest rate swap liabilities | $ | 225 | $ | — | $ | 225 | $ | — | |||||||
| Total swap liabilities | $ | 225 | $ | — | $ | 225 | $ | — | |||||||
Fair Value of Other Financial Instruments
The following disclosure of the estimated fair value of financial instruments is made in accordance with accounting guidance for financial instruments. The Partnership has determined the estimated fair values by using available market information and valuation methodologies. Considerable judgment is required in interpreting market data to develop the estimates of fair value. The use of different market assumptions or valuation methodologies may have a material effect on the estimated fair value amounts.
At
December 31,Based on the borrowing rates currently available to the Partnership for credit agreement debt with similar terms and maturities and consideration of the Partnership’s non-performance risk, long-term debt associated with the Partnership’s credit agreement at
December 31,18. | LEASES |
The Partnership provides liquid asphalt cementleases certain office space and residual fuel oil terminalling servicesland under operating leases. Leases with an initial term of 12 months or less are not recorded on the balance sheet; lease expense for these leases is recognized as paid over the lease term. For real property leases, the Partnership has elected the practical expedient to not separate nonlease components (e.g., common-area maintenance costs) from lease components and to instead account for each component as a single lease component. For leases that do not contain an implicit interest rate, the Partnership uses its most recent incremental borrowing rate.
Some real property leases contain options to renew, with renewal terms that can extend indefinitely. The exercise of such lease renewal options is at its 56 terminalling facilities located in 26 states.
Future commitments, including options to transport the crude oil to aggregation points and terminalling facilities located along pipeline gathering and transportation systems. Crude oil producer field services consist of a number of producer field services, ranging from gathering condensates from natural gas companies to hauling produced water to disposal wells.
Operating Leases | ||||
Twelve months ending December 31, 2021 | $ | 1,913 | ||
Twelve months ending December 31, 2022 | 1,502 | |||
Twelve months ending December 31, 2023 | 1,428 | |||
Twelve months ending December 31, 2024 | 798 | |||
Twelve months ending December 31, 2025 | 704 | |||
Thereafter | 5,386 | |||
Total | 11,731 | |||
Less: Interest | 3,067 | |||
Present value of lease liabilities | $ | 8,664 | ||
The following table reflects certain financial data for each segment forsummarizes the periods indicatedPartnership’s total lease cost by type as well as cash flow information (in thousands):
For the Year Ended December 31, | |||||||||
Classification | 2019 | 2020 | |||||||
Total Lease Cost by Type: | |||||||||
Operating lease cost(1) | Operating Expense | 1,916 | $ | 1,953 | |||||
Short-term lease cost | Operating Expense | 247 | $ | 172 | |||||
Net lease cost | $ | 2,163 | $ | 2,125 | |||||
Supplemental cash flow disclosures: | |||||||||
Cash paid for amounts included in the measurement of lease liabilities: | |||||||||
Payments on operating leases | $ | 1,349 | $ | 1,400 | |||||
| Leased assets obtained in exchange for new operating lease liabilities | $ | 1,714 | $ | 119 | |||||
| Year ended December 31, | |||||||||||
| 2015 | 2016 | 2017 | |||||||||
| Asphalt Terminalling Services | |||||||||||
| Service revenue: | |||||||||||
| Third-party revenue | $ | 72,152 | $ | 75,655 | $ | 57,486 | |||||
| Related-party revenue | 1,278 | 11,762 | 56,378 | ||||||||
| Total revenue for reportable segments | 73,430 | 87,417 | 113,864 | ||||||||
| Operating expense (excluding depreciation and amortization) | 25,218 | 30,648 | 49,241 | ||||||||
| Operating margin (excluding depreciation and amortization) | 48,212 | 56,769 | 64,623 | ||||||||
| Additions to long-lived assets | 19,769 | 148,622 | 22,046 | ||||||||
| Total assets (end of period) | $ | 98,848 | $ | 141,280 | $ | 146,966 | |||||
| Crude Oil Terminalling Services | |||||||||||
| Service revenue: | |||||||||||
| Third-party revenue | $ | 13,076 | $ | 16,387 | $ | 22,177 | |||||
| Related-party revenue | 11,522 | 7,858 | — | ||||||||
| Total revenue for reportable segments | 24,598 | 24,245 | 22,177 | ||||||||
| Operating expense (excluding depreciation and amortization) | 5,756 | 4,197 | 4,200 | ||||||||
| Operating margin (excluding depreciation and amortization) | 18,842 | 20,048 | 17,977 | ||||||||
| Additions to long-lived assets | 3,282 | 2,126 | 2,194 | ||||||||
| Total assets (end of period) | $ | 73,502 | $ | 71,689 | $ | 69,149 | |||||
| Crude Oil Pipeline Services | |||||||||||
| Service revenue: | |||||||||||
| Third-party revenue | $ | 15,148 | $ | 8,662 | $ | 9,580 | |||||
| Related-party revenue | 10,687 | 5,433 | 310 | ||||||||
| Product sales revenue: | |||||||||||
| Third-party revenue | 3,511 | 20,968 | 11,094 | ||||||||
| Total revenue for reportable segments | 29,346 | 35,063 | 20,984 | ||||||||
| Operating expense (excluding depreciation and amortization) | 18,162 | 15,270 | 13,310 | ||||||||
| Operating expense (intersegment) | 259 | 890 | 417 | ||||||||
| Cost of product sales | 3,231 | 14,130 | 8,807 | ||||||||
| Cost of product sales (intersegment) | — | 426 | 150 | ||||||||
| Operating margin (excluding depreciation and amortization) | 7,694 | 4,347 | (1,700 | ) | |||||||
| Additions to long-lived assets | 34,953 | 8,250 | 2,934 | ||||||||
| Total assets (end of period) | $ | 175,142 | $ | 150,043 | $ | 117,749 | |||||
| Crude Oil Trucking and Producer Field Services | |||||||||||
| Service revenue: | |||||||||||
| Third-party revenue | $ | 37,039 | $ | 25,511 | $ | 24,529 | |||||
| Related-party revenue | 15,616 | 5,158 | — | ||||||||
| Intersegment revenue | 259 | 890 | 417 | ||||||||
| Product sales revenue: | |||||||||||
| Third-party revenue | — | — | 385 | ||||||||
| Intersegment revenue | — | 426 | 150 | ||||||||
| Year ended December 31, | |||||||||||
| 2015 | 2016 | 2017 | |||||||||
| Total revenue for reportable segments | 52,914 | 31,985 | 25,481 | ||||||||
| Operating expense (excluding depreciation and amortization) | 51,610 | 30,156 | 25,915 | ||||||||
| Operating margin (excluding depreciation and amortization) | 1,304 | 1,829 | (434 | ) | |||||||
| Additions to long-lived assets | 4,556 | 2,558 | 1,701 | ||||||||
| Total assets (end of period) | $ | 17,256 | $ | 12,651 | $ | 7,005 | |||||
Total operating margin (excluding depreciation and amortization)(1) | $ | 76,052 | $ | 82,993 | $ | 80,466 | |||||
| Total segment revenues | 180,288 | 178,710 | 182,506 | ||||||||
| Elimination of intersegment revenues | (259 | ) | (1,316 | ) | (567 | ) | |||||
| Consolidated revenues | 180,029 | 177,394 | 181,939 | ||||||||
(1) | Includes variable lease costs, which are immaterial. |
As of | ||||
December31, | ||||
2020 | ||||
Lease Term and Discount Rate | ||||
Weighted-average remaining operating | 10.4 | |||
Weighted-average discount rate | 5.87 | % | ||
| Year ended December 31, | ||||||||||||
| 2015 | 2016 | 2017 | ||||||||||
| Operating margin (excluding depreciation and amortization) | $ | 76,052 | $ | 82,993 | $ | 80,466 | ||||||
| Depreciation and amortization | (27,228 | ) | (30,820 | ) | (31,139 | ) | ||||||
| General and administrative expenses | (18,976 | ) | (20,029 | ) | (17,112 | ) | ||||||
| Asset impairment expense | (21,996 | ) | (25,761 | ) | (2,400 | ) | ||||||
| Gain (loss) on sale of assets | 6,137 | 108 | (975 | ) | ||||||||
| Equity earnings in unconsolidated affiliate | 3,932 | 1,483 | 61 | |||||||||
| Gain on sale of unconsolidated affiliate | — | — | 5,337 | |||||||||
| Interest expense | (11,202 | ) | (12,554 | ) | (14,027 | ) | ||||||
| Income (loss) before income taxes | $ | 6,719 | $ | (4,580 | ) | $ | 20,211 | |||||
19. | INCOME TAXES |
The anticipated after-tax economic benefit of an investment in the Partnership’s common units depends largely on the Partnership being treated as a partnership for federal income tax purposes. If less than 90% of the gross income of a publicly traded partnership, such as the Partnership, for any taxable year is “qualifying income” from sources such as the transportation, marketing (other than to end users) or processing of crude oil, natural gas or products thereof, interest, dividends or similar sources, that partnership will be taxable as a corporation under Section 7704 of the Internal Revenue Code for federal income tax purposes for that taxable year and all subsequent years.
If the Partnership were treated as a corporation for federal income tax purposes, then it would pay federal income tax on its income at the applicable corporate tax rate and would likely pay state income tax at varying rates. Distributions would generally be taxed again to unitholders as corporate distributions and none of the Partnership’s income, gains, losses, deductions or credits would flow through to its unitholders. Because a tax would be imposed upon the Partnership as an entity, cash available for distribution to its unitholders would be substantially reduced. Treatment of the Partnership as a corporation would result in a material reduction in the anticipated cash flow and after-tax return to unitholders and thus would likely result in a substantial reduction in the value of the Partnership’s common units.
The Partnership has entered into storage or lease contracts and leases with third-party customers with respect to substantially all of its asphalt facilities. At the time of entering into such agreements, it was unclear under current tax law as to whether the rental income from the leases, and the fees attributable to certain of the processing services the Partnership provides under certain of the storage contracts, constitute “qualifying income.” In the second quarter of 2009, the Partnership submitted a request for a ruling from the IRS that rental income from the leases constitutes “qualifying income.” In October 2009, the Partnership received a favorable ruling from the IRS. As part of this ruling, however, the Partnership agreed to transfer, and has transferred, certain of its asphalt processing assets and related fee income to a subsidiary taxed as a corporation. This transfer occurred in the first quarter of 2010. Such subsidiary is required to pay federal income tax on its income at the applicable corporate tax rate and will likely pay state (and possibly local) income tax at varying rates. Distributions from this subsidiary will generally
| Deferred Tax Asset | |||
| Difference in bases of property, plant and equipment | $ | 484 | |
| Deferred tax asset | 484 | ||
| Less: valuation allowance | (484 | ) | |
| Net deferred tax asset | $ | — | |
20. | RECENTLY ISSUED ACCOUNTING STANDARDS |
In December 31, 2017.
21. | SUBSEQUENT EVENTS |
On February 1 and 2, 2021, the FASB issued ASU 2017-09, “Compensation - Stock Compensation (Topic 718): ScopePartnership closed on the final transactions to sell its crude oil pipeline and trucking services segments, respectively. On March 1, 2021, the Partnership closed on the transaction to sell its crude oil terminalling services segment. Net proceeds of Modification Accounting.” This update provides clarity and reduces both diversityapproximately $164.0 million were used to pay down the Partnership's revolving debt facility. On January 8, 2021, the credit agreement was amended to, among other things, reduce the revolving loan facility to $350.0 million in practice and cost and complexity when applying the guidance of Topic 718, Compensation - Stock Compensation, to a change in the terms or conditions of a share-based payment award. This update is effective for financial statements issued for annual periods beginning after December 15, 2017, and interim periods within those fiscal years. The Partnership has evaluated the impact of this guidance, which will be adopted beginningconjunction with the Partnership’s quarterly report forclosing of the three-month period ending March 31, 2018, and does not expect a material impact on the Partnership’s financial position, results of operations or cash flows.crude oil terminal transaction.
F-24
| First Quarter | Second Quarter | Third Quarter | Fourth Quarter | Full Year | |||||||||||||||
| 2016: | |||||||||||||||||||
| Revenues | $ | 41,009 | $ | 43,425 | $ | 46,939 | $ | 46,021 | $ | 177,394 | |||||||||
Operating income (loss)(1) | 5,013 | (15,348 | ) | 13,398 | 3,428 | 6,491 | |||||||||||||
Net income (loss)(1) | 726 | (18,936 | ) | 11,419 | 1,951 | (4,840 | ) | ||||||||||||
| Basic and diluted net income (loss) per common unit | (0.14 | ) | (0.71 | ) | 0.13 | (0.18 | ) | (0.87 | ) | ||||||||||
| 2017: | |||||||||||||||||||
Revenues(2) | $ | 46,340 | $ | 43,877 | $ | 47,474 | $ | 44,248 | $ | 181,939 | |||||||||
Operating income(2) | 6,557 | 6,505 | 12,219 | 3,559 | 28,840 | ||||||||||||||
Net income(2) | 3,542 | 6,371 | 9,771 | 361 | 20,045 | ||||||||||||||
| Basic and diluted net income (loss) per common unit | (0.08 | ) | — | 0.08 | (0.15 | ) | (0.15 | ) | |||||||||||