UNITED STATES SECURITIES AND EXCHANGE COMMISSION
WASHINGTON, D.C. 20549
FORM 10-K
(Mark One)
|
| | | | | | | |
| þ☒ | ANNUAL REPORT PURSUANT TO SECTION 13 OR 15(d) OF THE
SECURITIES EXCHANGE ACT OF 1934
FOR THE FISCAL YEAR ENDED DECEMBER 31, 2018
|
FOR THE FISCAL YEAR ENDED DECEMBER 31, 2020
|
| | | | | | | |
| ¨
☐ | TRANSITION REPORT PURSUANT TO SECTION 13 OR 15(d) OF THE SECURITIES EXCHANGE ACT OF 1934 FOR THE TRANSITION PERIOD FROM TO |
COMMISSION FILE NUMBER: 001-33776
RESOLUTE FOREST PRODUCTS INC.
(Exact name of registrant as specified in its charter)
|
| | | | | | | |
| Delaware | | 98-0526415 |
| (State or other jurisdiction of incorporation or organization) | | (I.R.S. employer identification number) |
|
| | | | | | | | | | | | | | | | |
| 111 Robert-Bourassa Boulevard | Suite 5000; Montréal, Quebec; 5000 | Montreal | Quebec | Canada | H3C 2M1 |
| (Address of principal executive offices) (Zip Code) |
|
(514) 875-2160
(Registrant’s telephone number, including area code)
Securities registered pursuant to Section 12(b) of the Act:
|
| | | | | | | |
| Common Stock, par value $0.001 per share | RFP | New York Stock Exchange
Toronto Stock Exchange
|
| (Title of class) | (Trading Symbol) | (Name of exchange on which registered) |
Securities registered pursuant to Section 12(g) of the Act: None
Indicate by check mark if the registrant is a well-known seasoned issuer, as defined in Rule 405 of the Securities Act. Yes ¨☐ No þ☒
Indicate by check mark if the registrant is not required to file reports pursuant to Section 13 or Section 15(d) of the Act. Yes ¨☐ No þ☒
Indicate by check mark whether the registrant (1) has filed all reports required to be filed by Section 13 or 15(d) of the Securities Exchange Act of 1934 during the preceding 12 months (or for such shorter period that the registrant was required to file such reports), and (2) has been subject to such filing requirements for the past 90 days. Yes þ☒ No ¨☐
Indicate by check mark whether the registrant has submitted electronically every Interactive Data File required to be submitted pursuant to Rule 405 of Regulation S-T (§232.405 of this chapter) during the preceding 12 months (or for such shorter period that the registrant was required to submit such files). Yes þ☒ No ¨
Indicate by check mark if disclosure of delinquent filers pursuant to Item 405 of Regulation S-K (§229.405 of this chapter) is not contained herein, and will not be contained, to the best of the registrant’s knowledge, in definitive proxy or information statements incorporated by reference in Part III of this Form 10-K or any amendment to this Form 10-K. ¨
Indicate by check mark whether the registrant is a large accelerated filer, an accelerated filer, a non-accelerated filer, smaller reporting company, or an emerging growth company. See the definitions of “large accelerated filer,” “accelerated filer,” “smaller reporting company,” and “emerging growth company” in Rule 12b-2 of the Exchange Act.
| | | | | | | | | | | | | | | | | | | | | | | | | | | | | | | | | | | | | | | | | |
| Large Accelerated Filer | ☐
| | Accelerated Filer | ☒ | | Non-accelerated Filer | ☐
| | Smaller Reporting Company | ☐ | | Emerging Growth Company | ☐ |
| | | | | | | | | | | | | |
Large accelerated filer | ¨
| | Accelerated filer | þ
| | Non-accelerated filer | ¨
| | Smaller reporting company | ¨
| | Emerging growth company | ¨
|
| | | | | | | | | | | | | |
If an emerging growth company, indicate by check mark if the registrant has elected not to use the extended transition period for complying with any new or revised financial accounting standards provided pursuant to Section 13(a) of the Exchange Act. ¨☐
Indicate by a check mark whether the registrant has filed a report on and attestation to its management’s assessment of the effectiveness of its internal control over financial reporting under Section 404(b) of the Sarbanes-Oxley Act (15 U.S.C.7262(b)) by the registered public accounting firm that prepared or issued its audit report. ☒
Indicate by check mark whether the registrant is a shell company (as defined in Rule 12b-2 of the Act). Yes ¨☐ No þ☒
The aggregate market value of the registrant’s common stock held by non-affiliates of the registrant as of the last business day of the registrant’s most recently completed second fiscal quarter (June 29, 2018)30, 2020) was $617 million.$118 million.
As of January 31, 2019,29, 2021, there were 90,730,71280,813,619 shares of Resolute Forest Products Inc. common stock, $0.001 par value, outstanding.
DOCUMENTS INCORPORATED BY REFERENCE
Portions of the registrant’s definitive proxy statement to be filed within 120 days of December 31, 2018,2020, are incorporated by reference in this Annual Report on Form 10-K in response to Part III, Items 10, 11, 12, 13 and 14.
TABLE OF CONTENTS
| | | | | | | | |
| | |
| Item 1. | | |
| Item 1A. | | |
| Item 1B. | | |
| Item 2. | | |
| Item 3. | | |
| Item 4. | | |
| | |
| | |
Item 1. | | |
Item 1A. | | |
Item 1B. | | |
Item 2. | | |
Item 3. | | |
Item 4. | | |
| | |
| | |
| Item 5. | | |
| Item 6. | | |
| Item 7. | | |
| Item 7A. | | |
| Item 8. | | |
| Item 9. | | |
| Item 9A. | | |
| Item 9B. | | |
| | |
| | |
| Item 10. | | |
| Item 11. | | |
| Item 12. | | |
| Item 13. | | |
| Item 14. | | |
| | |
| | |
| Item 15. | | |
| Item 16. | |
|
| |
| |
CAUTIONARY STATEMENTS REGARDING FORWARD-LOOKING INFORMATION AND USE OF
THIRD-PARTY DATA
Statements in this Annual Report on Form 10-K (or, “Form 10-K”) that are not reported financial results or other historical information of Resolute Forest Products Inc. (with its subsidiaries, either individually or collectively, unless otherwise indicated, referred to as “Resolute Forest Products,” “Resolute,” “we,” “our,” “us,” or the “Company”) are “forward-looking statements” within the meaning of the Private Securities Litigation Reform Act of 1995. They include, for example, statements relating to the impact of the novel coronavirus (or, “COVID-19”) pandemic and resulting economic conditions on our business, results of operations and market price of our securities, and to our: efforts and initiatives to reduce costs and increase revenues and profitability; business and operating outlook; future pension obligations; assessment of market conditions; growth strategies and prospects, and the growth potential of the Company and the industry in which we operate; liquidity; future cash flows;flows, including as a result of the changes to our pension funding obligations; estimated capital expenditures; and strategies for achieving our goals generally, including the strategies described in Part II, Item 7, “Management’s Discussion and Analysis of Financial Condition and Results of Operations – Overview – Our Business,” of this Form 10-K. Forward-looking statements may be identified by the use of forward-looking terminology such as the words “should,” “would,” “could,” “will,” “may,” “expect,” “believe,” “anticipate,” “attempt,” “project,” “estimate,” “guide,” “strive,” “continue,” “create,” “plan,” “see,” “seek,” “improve,” “move,” “position,” “build,” “grow,” “pursue,” and other terms with similar meaning indicating possible future events or potential impact on our business or Resolute Forest Products’ shareholders.
The reader is cautioned not to place undue reliance on these forward-looking statements, which are not guarantees of future performance. These statements are based on management’s current assumptions, beliefs, and expectations, all of which involve a number of business risks and uncertainties that could cause actual results to differ materially. The potential risks and uncertainties that could cause our actual future financial condition, results of operations, and performance to differ materially from those expressed or implied in this Form 10-K include, but are not limited to, the impact of: the COVID-19 pandemic on our business and resulting economic conditions, developments in non-print media, including changes in consumer habits, and the effectiveness of our responses to these developments; intense competition in the forest products industry; any inability to offer products certified to globally recognized forestry management and chain of custody standards; any inability to successfully implement our strategies to increase our earnings power; the possible failure to successfully integrate acquired businesses with ours or to realize the anticipated benefits of acquisitions, such as our entry into wood manufacturing in the U.S., and tissue production and sales, or divestitures or other strategic transactions or projects; uncertainty or changes in political or economic conditions in the United States,U.S., Canada or other countries in which we sell our products; global economic conditions; the highly cyclical nature of the forest products industry; any difficulties in obtaining timber or wood fiber at favorable prices, or at all; changes in the cost of purchased energy and other raw materials; physical, financial and financialregulatory risks associated with global, regional, and local weather conditions, and climate change; any disruption in operations or increased labor costs due to labor disputes; difficulties in our employee relations, attraction or retention; disruptions to our supply chain, operations, or the delivery of our products; disruptions to our information technology systems including cybersecurity and privacy incidents; risks related to the operation and transition of legacy system applications; negative publicity, even if unjustified; currency fluctuations; any increase in the level of required contributions to our pension plans, including as a result of any increase in the amount by which they are underfunded; our ability to maintain adequate capital resources to provide for all of our substantial capital requirements; the terms of our outstanding indebtedness, which could restrict our current and future operations; the replacement of the London Interbank Offered Rate (or, the “LIBOR”) with an alternative interest rate; losses that are not covered by insurance; any additional closure costs and long-lived asset or goodwill impairment or accelerated depreciation charges; any need to record additional valuation allowances against our recorded deferred income tax assets; our exports from one country to another country becoming or remaining subject to duties, cash deposit requirements, border taxes, quotas, or other trade remedies or restrictions; countervailing and anti-dumping duties on imports to the U.S. of substantially allthe vast majority of our softwood lumber products produced at our Canadian sawmills; any failure to comply with laws or regulations generally; any additional environmental or health and safety liabilities; any violation of trade laws, export controls, or other laws relating to our international sales and operations; adverse outcomes of legal proceedings, claims and governmental inquiries, investigations, and other disputes in which we are involved; the actions of holders of a significant percentage of our common stock; and the potential risks and uncertainties described in Part I, Item 1A, “Risk Factors.Factors,”which have been heightened by the COVID-19 pandemic, including related governmental responses and economic impacts, market disruptions and resulting changes in consumer habits.
All forward-looking statements in this Form 10-K are expressly qualified by the cautionary statements contained or referred to in this section and in our other filings with the United StatesU.S. Securities and Exchange Commission (or, the “SEC”) and the Canadian securities regulatory authorities. We disclaim any obligation to publicly update or revise any forward-looking information, whether as a result of new information, future events or otherwise, except as required by law.
Market and Industry Data
The information on industry and general economic conditions in this Form 10-K was derived from third-party sources and trade publications we believe to be widely accepted and accurate. We have not independently verified the information and cannot assure you of its accuracy.
PART I
ITEM 1. BUSINESS
We are a global leader in the forest products industry with a diverse range of products, including market pulp, tissue, wood products, newsprint and specialty papers.paper. We own or operate some 40 facilities, as well as power generation assets in the United StatesU.S. and Canada. Marketing our products in close to 70over 50 countries, we have third-party certified 100% of our managed woodlands to at least one internationally recognized forest management standard.
Resolute Forest Products Inc., a Delaware corporation, was formed on January 25, 2007, from the merger of Abitibi-Consolidated Inc. (or “Abitibi”) and Bowater Incorporated. Our common stock trades under the stock symbol “RFP” on both the New York Stock Exchange (or, the “NYSE”) and the Toronto Stock Exchange (or, the “TSX”).
Information About our Executive Officers
The following is information about our executive officers as of March 1, 2019:2021:
| | | Name | Age | Position | Officer Since | Name | Age | Position | Officer Since |
| Yves Laflamme | 62 | President and Chief Executive Officer | 2007 | |
| Remi G. Lalonde | | Remi G. Lalonde | 44 | President and Chief Executive Officer, and Chief Financial Officer | 2018 |
| Lori Kilgour | | Lori Kilgour | 50 | Senior Vice President, Process Improvement and Chief Information Officer | 2019 |
| John Lafave | 54 | Senior Vice President, Pulp and Paper Sales and Marketing | 2018 | John Lafave | 56 | Senior Vice President, Pulp and Paper Sales and Marketing | 2018 |
| Remi G. Lalonde | 42 | Senior Vice President and Chief Financial Officer | 2018 | |
| Patrice Minguez | 55 | President, Tissue Group | 2017 | Patrice Minguez | 57 | President, Tissue Group | 2017 |
| Daniel Ouellet | 48 | Senior Vice President, Human Resources | 2018 | Daniel Ouellet | 50 | Senior Vice President, Human Resources | 2018 |
| Hugues Simon | | Hugues Simon | 50 | President, Wood Products | 2021 |
| Richard Tremblay | 55 | Senior Vice President, Pulp and Paper Operations | 2014 | Richard Tremblay | 57 | Senior Vice President, Pulp and Paper Operations | 2014 |
| Jacques P. Vachon | 59 | Senior Vice President, Corporate Affairs and Chief Legal Officer | 2007 | Jacques P. Vachon | 61 | Senior Vice President, Corporate Affairs and Chief Legal Officer | 2007 |
| Sylvain A. Girard | | Sylvain A. Girard | 50 | Senior Vice President and Chief Financial Officer (as of March 2, 2021) | 2021 |
Mr. Lalonde became president and chief executive officer as of March 1, 2021, after Yves Laflamme stepped down and retired. Mr. Lalonde will cease to be chief financial officer upon the appointment of Sylvain Girard to this role as of March 2, 2021. Mr. Lalonde previously served as senior vice president wood products, global procurement and information technology,chief financial officer from January 2011November 2018 to January 2018, as senior vice president, wood products, from October 2007 to January 2011, as senior vice president, woodlandsMarch 1, 2021, and sawmills of Abitibi from 2006 to October 2007, and as vice president, sales, marketing and value-added wood products operations of Abitibi from 2004 to 2005. He is a 37-year veteran of the industry, as well as of Resolute and its predecessor companies.
Mr. Lafave previously served at Abitibi as vice president, sales, national accounts – paper sales, vice-president, sales, national accounts – newsprint, and vice president, sales, commercial printers, from 2004 to 2009. He held progressive positions in sales with UPM-Kymmene and Repap Enterprises.
Mr. Lalonde previously served aswas vice president, strategy and corporate development from May 2018 to November 2018. He was general manager of Resolute’s pulp and paper mill in Thunder Bay (Ontario), from February 2016 to May 2018. Before taking a leadership role in operations, Mr. Lalonde was treasurer and vice president, investor relations, from November 2014 to February 2016, and vice president, investor relations, from September 2011 to November 2014. He initially joined Resolute in 2009 as senior legal counsel, securities, following six years at a Wall Street law firm.
Ms. Kilgour previously served as vice president, information technology, from July 2017 to May 2019, as vice president and program director from July 2015 to July 2017, and as vice president, operational excellence, engineering and energy, from January 2013 to July 2015. Prior to joining Resolute in 2013, she worked at Tembec, Verso Corporation/International Paper and Catalyst.
Mr. Lafave previously served as vice president, sales, national accounts – paper sales, vice-president, sales, national accounts – newsprint, vice president, sales, national accounts – commercial printers, and executive sales representative from 2003 to 2009. Prior to joining Resolute, he held progressive positions in sales with UPM-Kymmene and Repap Enterprises.
Mr. Minguez previously served as special advisor to the former president and chief executive officer in July 2017. Prior to joining Resolute in August 2017, he was founder and former president of Cellynne Holdings, Inc., a tissue business, from January 1989 to August 2012. From February 1987 to January 1989, Mr. Minguez headed Société Antillaise de Service SARL, a distribution company he founded, specializing in janitorial supplies and proprietary systems.
Mr. Ouellet previously served as vice president, human resources, for Resolute’s Canadian and U.S. operations, from January 2016 to May 2018, and as vice president, human resources, for its Canadian operations, from November 2013 to January 2016. He held a range of other human resources positions since joining Resolute in September 2000, and also acquired operational experience leading the company’sCompany’s sawmill operations in the Saguenay – Lac-Saint-Jean region of Quebec. Prior to joining Resolute, Mr. Ouellet worked with Alliance Forest Products, Alcan, and a regional trade union.
Mr. Simon previously served as a special advisor to the senior vice president and chief financial officer from January 4, 2021 to March 1, 2021. Prior to joining Resolute in 2021, he was president of BarretteWood Inc., from July 2016 to November 2020,
and served as vice president, sales and procurement for BarretteWood Inc. from August 2012 to July 2016. He also served as vice president sales and marketing and value added operations of Resolute wood products and a range of other positions with Resolute and its predecessor companies, from 1999 to 2012.
Mr. Tremblay previously served as senior vice president, pulp and paper group, from June 2015 to February 2018, and as senior vice president, pulp and paper operations, from February 2014 to May 2015. He served as interim senior vice president, pulp and paper operations, from November 2013 to January 2014, and as vice president, pulp and paper operations from June 2011 to October 2013. Prior to joining Resolute in June 2011, he served as general manager of several mills at Smurfit Stone Container Corporation between 2002 and 2011.
Mr. Vachon previously served as senior vice president and chief legal officer from January 2011 to February 2012, as senior vice president, corporate affairs and chief legal officer from October 2007 to January 2011, and as senior vice president, corporate affairs and secretary, of Abitibi from 1997 to October 2007.
The Company announced the appointment of Sylvain A. Girard as the Company’s next senior vice president and chief financial officer, effective March 2, 2021. Mr. Girard joined Resolute as special advisor to Remi G. Lalonde, on February 15, 2021. Mr. Girard most recently served as executive vice president and chief financial officer of SNC-Lavalin Group Inc. from 2016 to 2020. Previously, he held senior executive positions in finance with SNC-Lavalin, following 22 years with General Electric Company (or, “GE”). He held a number of positions at GE, including 14 years as chief financial officer in the financial and healthcare sectors of GE in Europe.
Products
We manage our business based on the products we manufacture. Our reportable segments correspond to our principal product lines: market pulp, tissue, wood products, and paper. As of the second quarter of 2020, the results from our newsprint and specialty papers.papers operations have been combined to form the paper reportable segment. This better reflects management’s internal analysis, given the diminishing percentage newsprint and specialty papers represent in our product portfolio.
Market pulp
We produce market pulp at five facilities in North America, with total capacity of 1.3 million metric tons, or 8% of total North American capacity. Our market pulp includes:includes virgin pulp;pulp and recycled bleached kraft (or, “RBK”) pulp, for which we are the world’s largesta leading global producer. Approximately 70%80% of our virgin pulp capacity is softwood-based: northern bleached softwood kraft (or, “NBSK”) pulp, southern bleached softwood kraft (or, “SBSK”) pulp, and fluff pulp. The remainder of our virgin pulp capacity consists of northern bleached hardwood kraft (or, “NBHK”) pulp and southern bleached hardwood kraft (or, “SBHK”) pulp. Wood pulp is the most commonly used material to make paper and tissue. Pulp not converted into paper or tissue is sold as market pulp, which is used to make a range of consumer products including tissue, packaging, specialty paper products, diapers, and other absorbent products. 25%23% of our 20182020 market pulp shipments were exported outside of North America, including significant exports to Europe, Asia, and Latin America.
Tissue
We produce tissue products at three facilities in North America. With total capacity of 128,000 short tons (116,000 metric tons), we are a fully integrated manufacturer operating four tissue machines and 1213 converting lines.lines, including the converting facility in Hagerstown, Maryland, that we acquired in December 2020. We manufacture a range of tissue products for the away-from-home and at-homeretail markets, including recycled and virgin paper products, covering premium, value, and economy grades. We also sell parent rolls not converted into tissue products.
Wood products
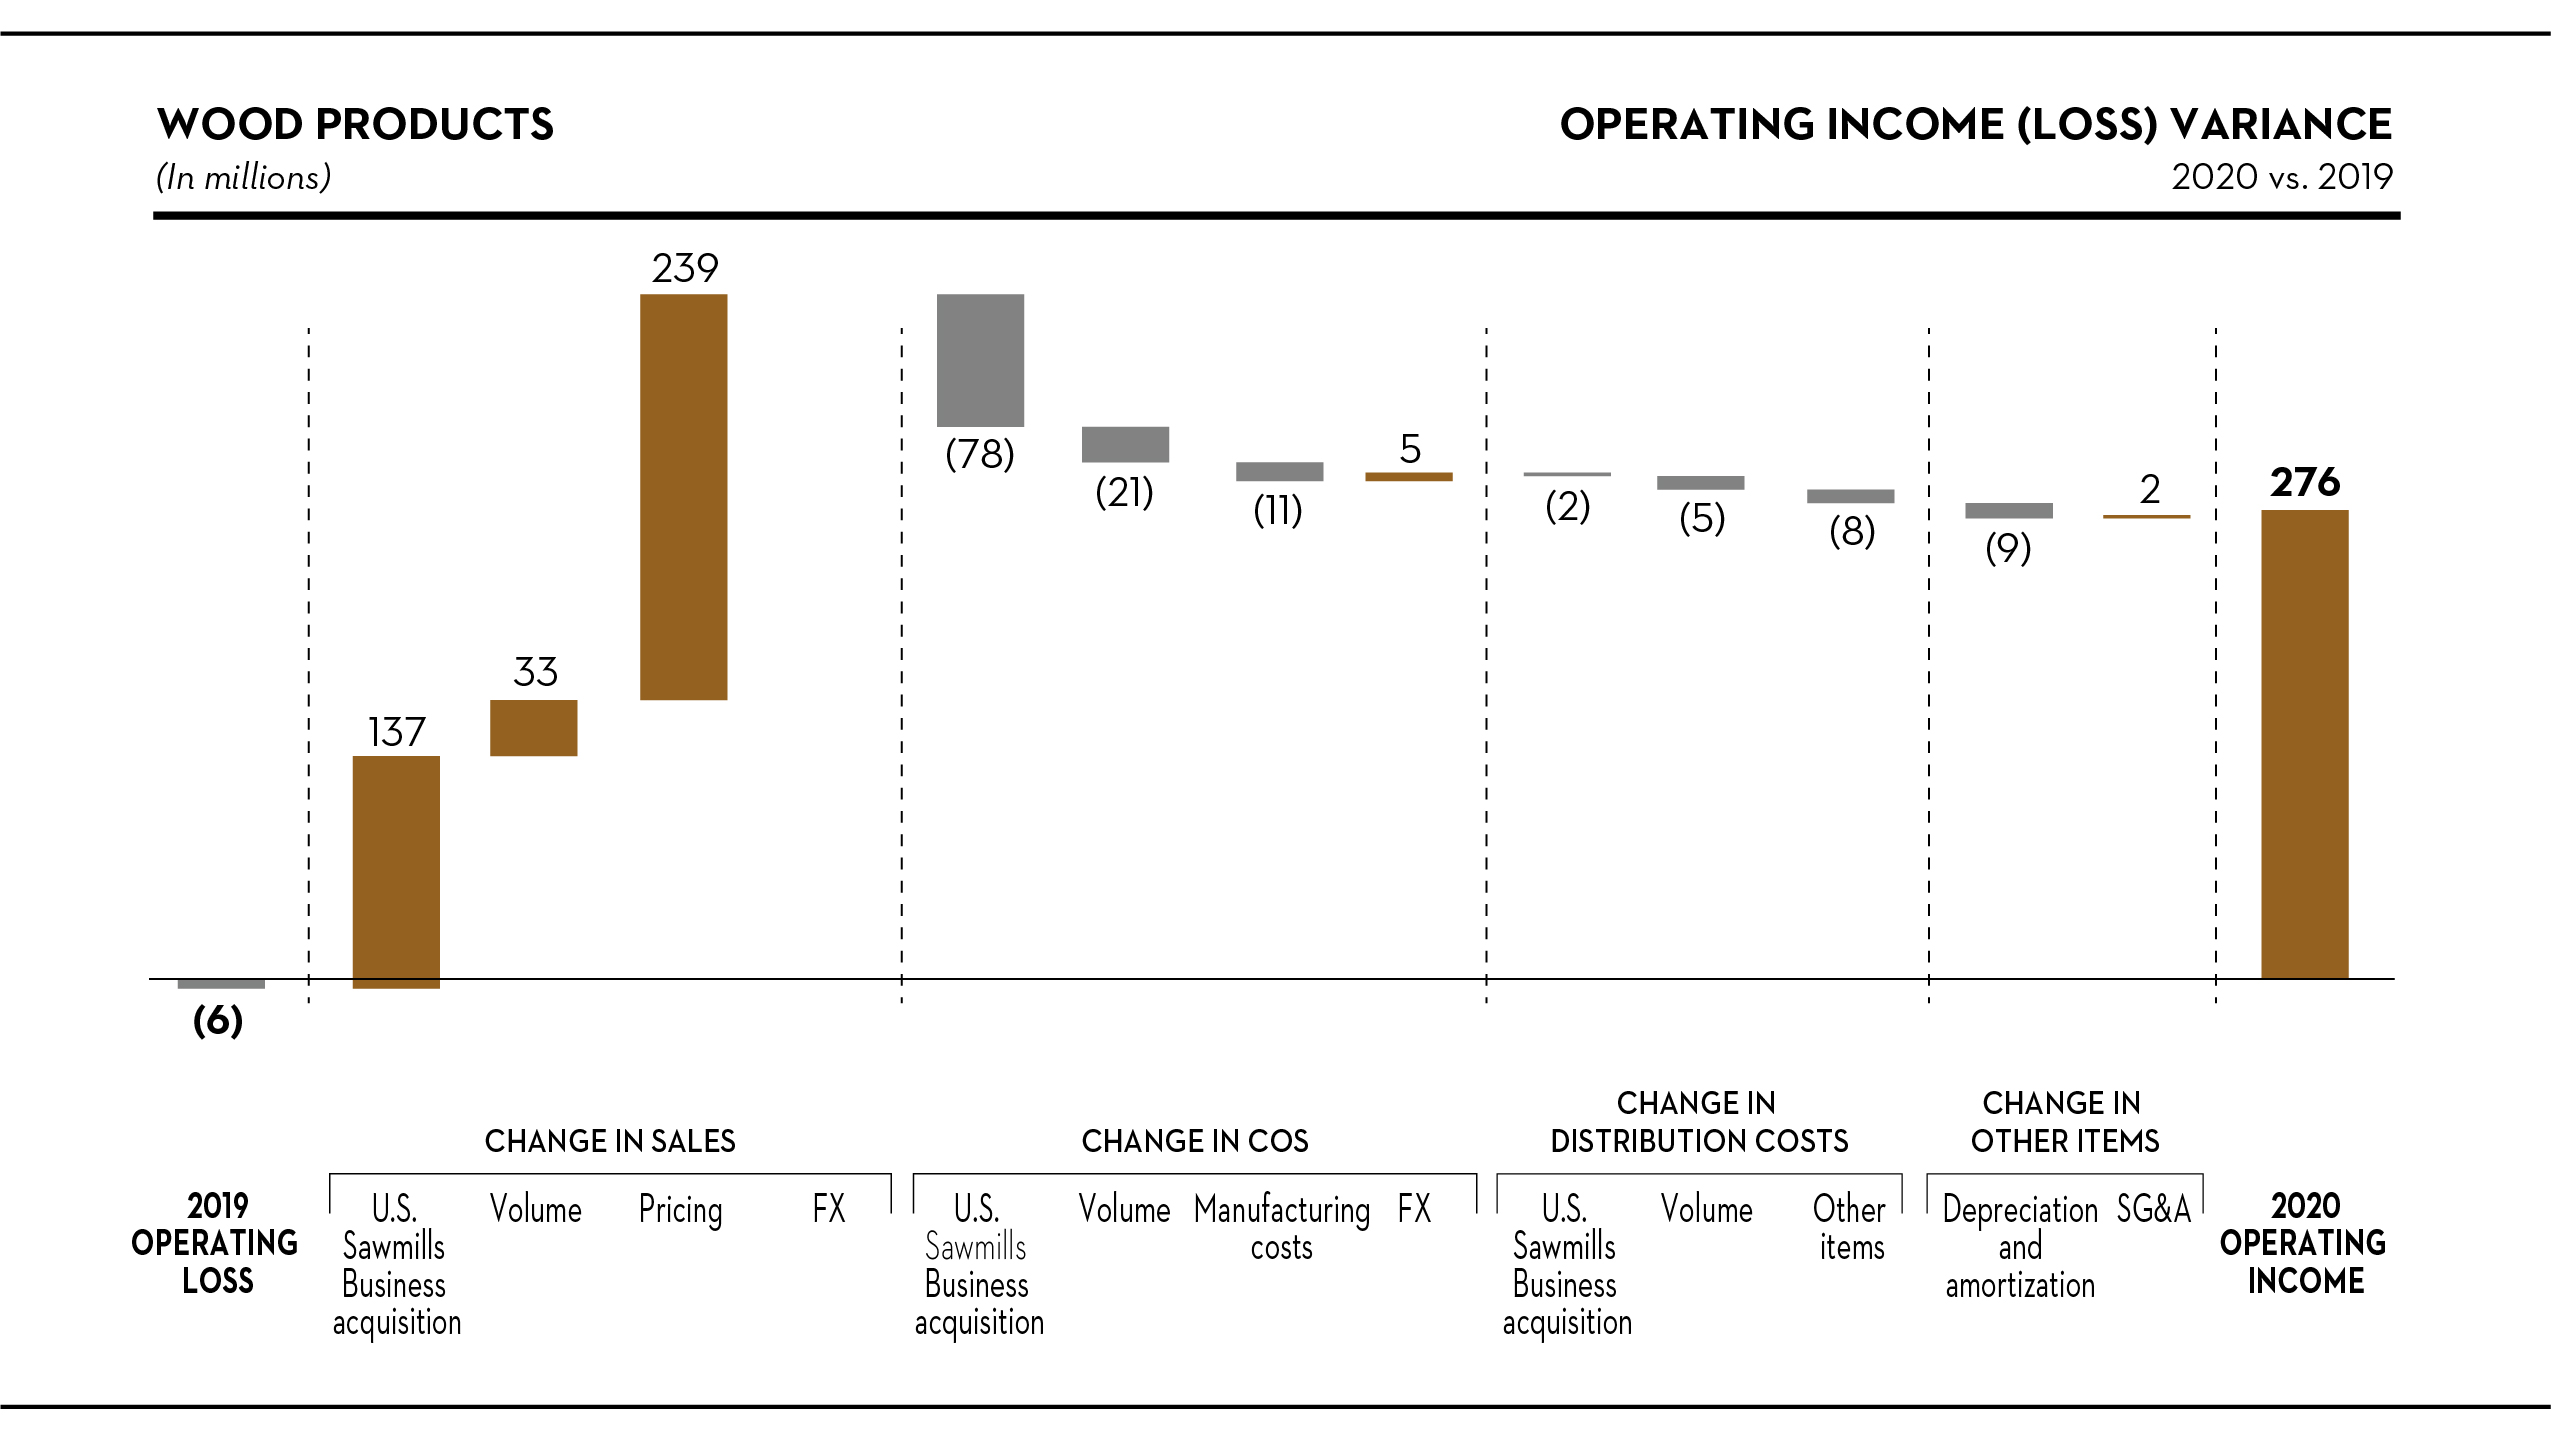
We operateown 14 sawmills in Canada that produce construction-grade lumber sold in North America. On February 1, 2020, we completed the acquisition of three sawmills in the U.S. South, bringing our number of sawmills to 17. The three sawmills have a combined production capacity of 550 million board feet once ramped-up. For more information, see Note 3, “Business Acquisition,” to our consolidated financial statements and related notes (or, “Consolidated Financial Statements”) appearing in Part II, Item 8, “Financial Statements and Supplementary Data,” of this Form 10-K.
Our Canadian sawmills produce dimension spruce-pine-fir lumber and provide wood chips to our pulp and paper mills in Canada. Our sawmills also supply wood residue to our other segments, to be used as fuel to produce electricity and steam based on renewable sources. Our U.S. sawmills produce dimension lumber and decking from southern yellow pine. In 2018,2020, we shipped 1.71.9 billion board feet of construction-grade lumber.lumber and decking. We also operate two remanufactured wood products facilities that manufacture bed frame components, finger joints, and furring strips, two engineered wood products facilities that manufacture I-joists for the construction industry, and one wood pellet facility, all of which are located in Quebec and Ontario.
Paper
We produce a wide range of papers at 10 mills strategically located to serve major markets, with total capacity of 2.1 million metric tons. We are a leading global producer of newsprint at eightand the largest producer of uncoated mechanical papers in North America.
We own six newsprint facilities in North America. WithAmerica, with total capacity of 1.81.4 million metric tons, which represents 8%9% of total worldwide capacity and 42%44% of total North American capacity, we are the largest producer of newsprint in the world.capacity. We sell newsprint to newspaper publishers worldwide and also to commercial printers in North America for uses such as inserts and flyers. In 2018,2020, North American deliveries represented 61%65% of our total newsprint shipments.
Specialty papers
We produce specialty papers at four facilities in North America. With total capacity of 0.9 million short tons (0.80.7 million metric tons),tons, our specialty papers segment is composed ofcomprise uncoated mechanical papers, including supercalendered paper and white paper, as well as uncoated freesheet papers. With 0.7 million short tons (0.6 million metric tons) of capacity, or 21%26% of total North American capacity, we are the largest producer of uncoated mechanical papers in North America, and the fourth largest in the world. Our specialty papers are used in books, retail inserts, direct mail, coupons, magazines, catalogs, bags and other commercial printing applications. We sell specialty papers to major commercial printers, direct mailers, publishers, catalogers and retailers, mostly in North America.
For additional information on our corporate strategy, see Part II, Item 7, “Management’s Discussion and Analysis of Financial Condition and Results of Operations – Overview – Our Business” of this Form 10-K.
Pulp, tissue, and paper manufacturing facilities
The following table lists the pulp, tissue, and paper manufacturing facilities and the number of machines we owned or operated as of December 31, 2018, and facilities sold in 2018, excluding facilities and machines that have been permanently closed or indefinitely idled as of December 31, 2018.2020. The table presents our total 20182020 production by product line (which represents all of our reportable segments except wood products), reflecting the impact of any downtime taken in 2018,2020, and our 20192021 capacity.Total capacity is based on an operating schedule of approximately 360 days. In certain cases, production can exceed capacity, due to changes in the manufacturing properties of the product.
|
| | | | | | | | | | | | | | | | | | | |
| | Number of Machines | 2019 | 2018 | 2018 Production By Product Line |
| (In thousands of metric tons) | Total Capacity | Total Production | Market Pulp | Tissue | Newsprint | Specialty Papers |
| Canada | | | | | | | | | | | | | |
| Alma (Quebec) | 3 | 360 |
| | 344 |
| | — |
| | — |
| | 7 |
| | 337 |
| |
| Amos (Quebec) | 1 | 194 |
| | 188 |
| | — |
| | — |
| | 183 |
| | 5 |
| |
| Baie-Comeau (Quebec) | 2 | 322 |
| | 312 |
| | — |
| | — |
| | 312 |
| | — |
| |
| Clermont (Quebec) | 1 | 225 |
| | 222 |
| | — |
| | — |
| | 222 |
| | — |
| |
| Dolbeau (Quebec) | 1 | 140 |
| | 140 |
| | — |
| | — |
| | 3 |
| | 137 |
| |
| Gatineau (Quebec) | 1 | 200 |
| | 201 |
| | — |
| | — |
| | 201 |
| | — |
| |
| Kénogami (Quebec) | 1 | 133 |
| | 120 |
| | — |
| | — |
| | — |
| | 120 |
| |
| Saint-Félicien (Quebec) | 1 | 348 |
| | 303 |
| | 303 |
| | — |
| | — |
| | — |
| |
| Thunder Bay (Ontario) | 2 | 541 |
| | 496 |
| | 302 |
| | — |
| | 191 |
| | 3 |
| |
| United States | | | | | | | | | | | | | |
| Augusta (Georgia) | 1 | 214 |
| | 196 |
| | — |
| | — |
| | 196 |
| | — |
| |
| Calhoun (Tennessee) | 3 | 389 |
| | 310 |
| | 141 |
| | 37 |
| | — |
| | 132 |
| |
| Coosa Pines (Alabama) | 1 | 274 |
| | 264 |
| | 264 |
| | — |
| | — |
| | — |
| |
| Grenada (Mississippi) | 1 | 230 |
| | 217 |
| | — |
| | — |
| | 217 |
| | — |
| |
| Hialeah (Florida) | 2 | 31 |
| | 30 |
| | — |
| | 30 |
| | — |
| | — |
| |
| Menominee (Michigan) | 1 | 178 |
| | 147 |
| | 147 |
| | — |
| | — |
| | — |
| |
| Sanford (Florida) | 1 | 25 |
| | 22 |
| | — |
| | 22 |
| | — |
| | — |
| |
Usk (Washington) (1) | 1 | 226 |
| | 226 |
| | — |
| | — |
| | 226 |
| | — |
| |
| Other | | | | | | | | | | | | | |
Sold facilities (2) | | | | 642 |
| | 348 |
| | — |
| | — |
| | 294 |
| |
| | 24 | 4,030 |
| | 4,380 |
| | 1,505 |
| | 89 |
| | 1,758 |
| | 1,028 |
| |
| |
(1)
| Ponderay Newsprint Company is located in Usk and is an unconsolidated partnership in which we have a 40% interest. The amounts in the above table represent the mill’s total capacity and production. |
| |
(2)
| On November 1, 2018, and December 31, 2018, we sold our RBK pulp mill at Fairmont (West Virginia), and our Catawba (South Carolina) paper and pulp mill, respectively. For additional information, see Note 4, “Net Gain on Disposition of Assets,” to our consolidated financial statements and related notes (or “Consolidated Financial Statements”) appearing in Part II, Item 8, “Financial Statements and Supplementary Data,” of this Form 10-K.
|
| | | | | | | | | | | | | | | | | | | | | | | | | | | | | | | | | | | |
| Number of Machines | 2021 | 2020 | 2020 Production By Product Line |
| (In thousands of metric tons) | Total
Capacity | Total
Production | Market
Pulp | Tissue | Paper |
| Canada | | | | | | | | | | | |
| Alma (Quebec) | 3 | 341 | | | 253 | | | — | | | — | | | 253 | | |
| Amos (Quebec) | 1 | 194 | | | 59 | | | — | | | — | | | 59 | | |
| Baie-Comeau (Quebec) | 2 | 336 | | | 58 | | | — | | | — | | | 58 | | |
| Clermont (Quebec) | 1 | 221 | | | 219 | | | — | | | — | | | 219 | | |
| Dolbeau (Quebec) | 1 | 137 | | | 112 | | | — | | | — | | | 112 | | |
| Gatineau (Quebec) | 1 | 197 | | | 190 | | | — | | | — | | | 190 | | |
| Kénogami (Quebec) | 1 | 132 | | | 121 | | | — | | | — | | | 121 | | |
| Saint-Félicien (Quebec) | 1 | 369 | | | 365 | | | 365 | | | — | | | — | | |
| | | | | | | | | | | |
| Thunder Bay (Ontario) | 2 | 530 | | | 495 | | | 306 | | | — | | | 189 | | |
| U.S. | | | | | | | | | | | |
| | | | | | | | | | | |
| Calhoun (Tennessee) | 3 | 356 | | | 307 | | | 128 | | | 49 | | | 130 | | |
| | | | | | | | | | | |
| Coosa Pines (Alabama) | 1 | 264 | | | 256 | | | 256 | | | — | | | — | | |
| | | | | | | | | | | |
| Grenada (Mississippi) | 1 | 229 | | | 204 | | | — | | | — | | | 204 | | |
| Hialeah (Florida) | 2 | 31 | | | 22 | | | — | | | 22 | | | — | | |
| Menominee (Michigan) | 1 | 170 | | | 112 | | | 112 | | | — | | | — | | |
| Sanford (Florida) | 1 | 25 | | | 24 | | | — | | | 24 | | | — | | |
| | | | | | | | | | | |
| | | | | | | | | | | |
| | | | | | | | | | | |
| | 22 | 3,532 | | | 2,797 | | | 1,167 | | | 95 | | | 1,535 | | |
Wood products facilities
The following table lists the sawmills we owned or operated as of December 31, 2018, excluding facilities that have been permanently closed as of December 31, 2018.2020. The table presents our total 20182020 production, reflecting the impact of any downtime taken in 2018,2020, and our 20192021 mechanical capacity. We do not have access to
enough timber to operate mostall of the sawmills at their total mechanical capacity. Total capacity is based on an operating schedule of approximately 355 days.
| | | | | | | | | | | | | | | | | | | | |
| | 2021 | | 2020 |
| (In million board feet) | | Total Capacity | | Total Production |
| Canada | | | | | | |
| Atikokan (Ontario) | | 145 | | | | 139 | | |
| Comtois (Quebec) | | 145 | | | | 47 | | |
| Girardville (Quebec) | | 220 | | | | 214 | | |
| Ignace (Ontario) | | 115 | | | | — | | |
| La Doré (Quebec) | | 198 | | | | 225 | | |
La Tuque (Quebec) (1) | | 186 | | | | 101 | | |
| Maniwaki (Quebec) | | 204 | | | | 96 | | |
| Mistassini (Quebec) | | 209 | | | | 203 | | |
Obedjiwan (Quebec) (2) | | 65 | | | | 47 | | |
| Pointe-aux-Outardes (Quebec) | | 184 | | | | 109 | | |
| Saint-Félicien (Quebec) | | 174 | | | | 105 | | |
| Saint-Thomas (Quebec) | | 93 | | | | 35 | | |
| Senneterre (Quebec) | | 167 | | | | 139 | | |
| | | | | | |
| Thunder Bay (Ontario) | | 330 | | | | 277 | | |
U.S. (3) | | | | | | |
| Cross city (Florida) | | 185 | | | | 128 | | |
El Dorado (Arkansas) (4) | | 180 | | | | 3 | | |
| Glenwood (Arkansas) | | 185 | | | | 98 | | |
| | | 2,985 | | | | 1,966 | | |
|
| | | | | | | | |
| | | 2019 | | 2018 |
| (In million board feet) | | Total Capacity | | Total Production |
| Atikokan (Ontario) | | 145 |
| | | 102 |
| |
| Comtois (Quebec) | | 145 |
| | | 95 |
| |
| Girardville (Quebec) | | 220 |
| | | 214 |
| |
| Ignace (Ontario) | | 115 |
| | | 85 |
| |
| La Doré (Quebec) | | 198 |
| | | 194 |
| |
La Tuque (Quebec) (1) | | 181 |
| | | 98 |
| |
| Maniwaki (Quebec) | | 204 |
| | | 110 |
| |
| Mistassini (Quebec) | | 205 |
| | | 205 |
| |
Obedjiwan (Quebec) (2) | | 65 |
| | | 51 |
| |
| Pointe-aux-Outardes (Quebec) | | 175 |
| | | 117 |
| |
| Saint-Félicien (Quebec) | | 174 |
| | | 136 |
| |
| Saint-Thomas (Quebec) | | 93 |
| | | 60 |
| |
| Senneterre (Quebec) | | 167 |
| | | 128 |
| |
| Thunder Bay (Ontario) | | 330 |
| | | 269 |
| |
| | | 2,417 |
| | | 1,864 |
| |
| |
(1)(2)Sociéte en Commandite Scierie Opitciwan is located in Obedjiwan and is an unconsolidated entity in which we have a 45% interest. The amounts in the above table represent the sawmill’s total capacity and production. (3)On February 1, 2020, we acquired from Conifex Timber Inc. all of the equity securities and membership interests in certain of its subsidiaries, the business of which consists mainly in the operation of three sawmills and related assets in Cross City and in Glenwood and El Dorado, with combined production capacity of 550 million board feet. When operating to capacity, almost 25% of our lumber production will be in the U.S. South. For more information, see Note 3, “Business Acquisition,” to our Consolidated Financial Statements. (4)The El Dorado mill, which was already idled at the time of the acquisition, was restarted in the fourth quarter of 2020. | Forest Products Mauricie L.P. is located in La Tuque and is a consolidated subsidiary in which we have a 93.2% interest. The amounts in the above table represent the mill’s total capacity and production. |
| |
(2)
| Sociéte en Commandite Scierie Opitciwan is located in Obedjiwan and is an unconsolidated entity in which we have a 45% interest. The amounts in the above table represent the mill’s total capacity and production. |
The following table lists the remanufactured wood, engineered wood, and wood pellet products facilities we owned or operated as of December 31, 2018,2020, and their respective 20192021 capacity and 20182020 production. Total capacity is based on an operating schedule of approximately 355 days.
| | | | | | | | | | | | | | | | | | | | |
| | 2021 | | 2020 |
| (In million board feet, except where otherwise stated) | | Total Capacity | | Total Production |
| Remanufactured Wood Products Facilities | | | | | | |
| Château-Richer (Quebec) | | 66 | | | | 40 | | |
| La Doré (Quebec) | | 16 | | | | 14 | | |
| Total Remanufactured Wood Products Facilities | | 82 | | | | 54 | | |
| Engineered Wood Products Facilities | | | | | | |
Larouche and Saint-Prime (Quebec) (in million linear feet) (1) | | 145 | | | | 134 | | |
| Wood Pellet Products Facility | | | | | | |
| Thunder Bay (Ontario) (in thousands of metric tons) | | 45 | | | | 41 | | |
(1)Resolute-LP Engineered Wood Larouche Inc. and Resolute-LP Engineered Wood St-Prime Limited Partnership are located in Larouche and Saint-Prime, respectively, and are unconsolidated entities in which we have a 50% interest in
|
| | | | | | | | |
| | | 2019 | | 2018 |
| (In million board feet, except where otherwise stated) | | Total Capacity | | Total Production |
| Remanufactured Wood Products Facilities | | | | | | |
| Château-Richer (Quebec) | | 66 |
| | | 49 |
| |
| La Doré (Quebec) | | 16 |
| | | 13 |
| |
| Total Remanufactured Wood Products Facilities | | 82 |
| | | 62 |
| |
| Engineered Wood Products Facilities | | | | | | |
Larouche and Saint-Prime (Quebec) (in million linear feet) (1) | | 145 |
| | | 103 |
| |
| Wood Pellet Products Facility | | | | | | |
| Thunder Bay (Ontario) (in thousands of metric tons) | | 45 |
| | | 42 |
| |
| |
(1)
| Resolute-LP Engineered Wood Larouche Inc. and Resolute-LP Engineered Wood St-Prime Limited Partnership are located in Larouche and Saint-Prime, respectively, and are unconsolidated entities in which we have a 50% interest in each entity. We operate the facilities and our joint venture partner sells the products. The amounts in the above table represent the mills’ total capacity and production. |
Other products
We sell green power produced from renewable sources and wood-related products to customers located in Canada and the United States.U.S. Sales of these other products are considered a recovery of the cost of manufacturing our primary products.
We also have a 49% interest in Serres Toundra Greenhouse Inc., a joint venture that produces vegetables from 19 hectares of greenhouses adjacent to our Saint-Félicien pulp mill. The greenhouses source a portion of their heat from our Saint-Félicien pulp mill which produces approximately 45 million cucumbers annually. The greenhouse isand are also expected to source a portion of its heat andtheir CO2 requirements from our Saint-Félicien pulpsuch mill by the end of 2019.2021.
Raw Materials
In the manufacture of our paper, tissue, pulp, and wood products, our operations consume substantial amounts of raw materials such as wood and chemicals, as well as energy. We purchase raw materials and energy sources (to complement internal generation) primarily on the open market. These raw materials are market-priced commodities and as such, are subject to fluctuations in market prices. For additional information about commodity price risk, see Part II, Item 7A, “Quantitative and Qualitative Disclosures About Market Risk – Commodity Price Risk” of this Form 10‑K.
Wood
Our sources of wood include purchases from local producers, including sawmills that supply residual wood chips, wood harvested from government-owned land on which we hold timber supply guarantees or harvesting rights, and property we own or lease. In Quebec, under the Sustainable Forest Development Act, volumes are allocated through timber supply guarantees, which are five years in length and renewable, subject to certain conditions. As of December 31, 2018,2020, we were allocated 4.44.5 million cubic meters of supply through the timber supply guarantees. In Ontario, we had long-term harvesting rights for 11.5 million acres of government-owned land, as of December 31, 2018.2020. The harvesting rights licenses in Ontario are 20 years in length and automatically renew every five years, contingent upon our continued compliance with environmental performance and reforestation requirements.
We depend heavily on harvesting rights and timber supply guarantees over government-owned land in Ontario and Quebec, respectively. The volume of harvest permitted under these licenses is subject to limits, which are generally referred to as the annual allowable cut (or, the “AAC”). The AAC is reviewed regularly, typically every five years in Quebec and every 10 years in Ontario. The chief forester of the province ofnext AAC revision in Quebec ordered significant reductionsis scheduled to the allowable harvest between 2006 and 2018, and announced an increase of 5.6% to thetake place in 2023 while Ontario is completing AAC revisions in 2021 for the spruce, pine, fir, and larch species, for the period of 2018 to 2023. This increase did not resultforests in a significant change in the volume allocated to us.which we operate. About 25% of the total allowable harvestharvesting rights in Quebec isare allocated through an open auction system. The prices generated by the auction system are used to set pricing for the remainder of the AAC. The timber requirements for our U.S. sawmills are met mostly by purchasing timber from timberland owners.
In addition to the forest management regulations that we must abide with, we have sought out independent certification for 100% of the forests that we manage or on which we hold significant harvesting rights in order to demonstrate our strong belief that it is possible to operate successfully with sustainable harvesting practices while maintaining biodiversity and protecting the forest, values important to a range of stakeholders. The woodlands that we manage are all independently certified to at least one internationally recognized forest management standard: Sustainable Forestry Initiative® (or, “SFI®”) and Forest Stewardship Council® (or, “FSC®”). In 2018,2020, we successfully maintained SFI forest management certificationcertifications for all of our managed woodlands in Quebec and Ontario. One FSC forest management certificate in the Abitibi region of Quebec was not renewed at the end of its five-year term and expired on January 2, 2018. We continuealso continued to maintain the other FSC forest management certificates that we held in Quebec and Ontario. In addition, we continue to be one of the largest holders of SFI and FSC forest management certificates in North America.
We have also instituted fiber-tracking systems at all of our North American facilities to ensure that our wood fiber supply comes from acceptable sources such as certified forests and legal harvesting operations, with the exception of our Calhoun tissue facility,three recently acquired sawmills in the U.S. South, which isare expected to have itstheir fiber-tracking systemsystems certified in place in 2019.2021. These systems are third-party certified according to one or more of three internationally recognized chain of custody standards, namely SFI, FSC, and Programme for the Endorsement of Forest Certification (or, “PEFC”). 100% of our wood and fiber sources are procured through the FSC Controlled Wood standard, the FSC chain of custody certification, the PEFC due diligence requirements, or the SFI fiber sourcing requirements, and in some cases a combination of these standards, with the exception of our Calhoun tissue facility, which sources 100% of its fiber supply from our U.S. pulp network.standards.
We strive to improve our forest management and wood fiber procurement practices and we encourage our wood and fiber suppliers to demonstrate continual improvement in forest resource management, wood and fiber procurement, and third-party certification.
Chemicals
We use various chemicals in our pulp, tissue, and paper manufacturing operations including caustic soda, sodium chlorate, hydrogen peroxide, liquid sodium hydrosulfite, and sulfuric acid.
Energy
Steam and electrical power constitute the primary forms of energy used in pulp, tissue, and paper production. Process steam is produced in boilers using a variety of fuel sources, as well as heat recovery units in mechanical pulp facilities. All of our pulp, paper and tissue operating sites generate 100% of their own steam requirements. In 2018,2020, the Alma, Calhoun, Catawba, Coosa Pines, Dolbeau, Gatineau, Kénogami, Saint-Félicien and Thunder Bay operations collectively consumed 58%61% of their electrical requirements from internal sources, notably on-site cogeneration and hydroelectric dams. We purchased the balance of our electrical energy needs from third parties. We have six sites that operate cogeneration facilities and all of these sites generate primarily green energy from renewable biomass. In addition, we utilize alternative fuels such as used oil and tire-derived fuel to reduce consumption of fossil fuels.
We also have one hydroelectric generation and transmission network (Hydro-Saguenay in the Saguenay – Lac-Saint-Jean region of Quebec), which consists of seven generating stations with 170 MW of capacity. The water rights agreements required to operate some of these facilities typically range from 10 to 2550 years and, subject to certain conditions, some are generally renewable for additional terms. In some cases, the agreements are contingent on the continued operation of the related paper mills and a minimum level of capital spending in the region. For the other facilities, the right to generate hydroelectricity stems from our ownership of the riverbed on which these facilities are located.
Competition
In general, our products, other than tissue, are globally-traded commodities. The markets in which we compete are highly competitive and, aside from quality specifications to meet customer needs, including designations to globally recognized forest management and chain of custody standards, the production of our products other than tissue, does not depend upon a proprietary process or formula. Pricing and the level of shipments of our products are influenced by the balance between supply and demand as affected by global economic conditions, changes in consumption and capacity, the level of customer and producer inventories, and fluctuations in currency exchange rates. Prices for our products have been and are likely to continue to be highly volatile.
We produce fivesix major grades of market pulp (NBSK, SBSK, NBHK, SBHK, RBK, and fluff), for which we compete with a number of major market pulp producers, primarily with operations in North America. Market pulp being a globally-traded commodity, we also compete with other producers from South America (eucalyptus hardwood and radiata pine softwood), Europe (northern hardwood and softwood), and Asia (mixed tropical hardwood). Price, quality, service, and fiber sources are considered the main competitive determinants.
We are an integrated manufacturer of tissue products and compete with several major competitors in the North American tissue market. The key competitive attributes in this market include price, product quality, service, and customer relationships. Competition is also significantly affected by geographic location, as freight costs represent a material portion of the costs. We compete with branded and private-label products within North America.
We compete in North America with both large North American and numerous smaller local lumber producers in a highly competitive market. We also compete with European producers in the North American market during periods of favorable currencies and prices. Because there are few distinctions between lumber from different producers, competition is primarily based on price. Competition is also affected by cost and availability of wood, freight cost, and labor. We have been required to pay cash deposits for estimated countervailing duties and anti-dumping duties on the vast majority of our U.S. imports of softwood lumber products produced at our Canadian sawmills, since April 28, 2017, and June 30, 2017, respectively. As of December 31, 2018,2020, the rates for such estimated countervailing and anti-dumping duties were 14.7%19.10% and 3.2%1.15%, respectively. During any period in which our U.S. imports of softwood lumber products from our Canadian sawmills are subject to countervailing duty or anti-dumping cash deposit requirements or duty requirements, our competitive position could be materially affected. For additional information, see Item 1A, “Risk Factors – Legal and Compliance RiskRisks – We are subject to countervailing and anti-dumping dutiesduty orders on substantially allthe vast majority of our U.S. imports of softwood lumber products produced at our Canadian sawmills, which could materially affect our operations and cash flows,” of this Form 10‑K.
In 2018,2020, the five largest North American newsprint producers represented 88% of North American newsprint capacity, and the five largest global producers represented 36%32% of global newsprint capacity. We face competition from both large global producers and numerous smaller regional producers. Price, quality, and customer relationships are important competitive determinants.
Our specialty papers, comprised of uncoated mechanical and uncoated freesheet papers compete on the basis of price, quality, service, and breadthrange of product line. We compete with numerous uncoated mechanical paper producers, with the five largest North American producers
representing 81%89% of the North American uncoated mechanical papers capacity, and the five largest global producers representing 48%54% of global uncoated mechanical papers capacity in 2018.2020. In addition, imports from overseas
accounted for 11%9% of North American uncoated mechanical paper demand in 2018.2020. There are also numerous worldwide suppliers of other grades of paper such as coated mechanical papers and coated freesheet.
As with other global commodities, the competitive position of our products is significantly affected by fluctuations in foreign currency exchange rates. For additional information, see Part II, Item 7A, “Quantitative and Qualitative Disclosures About Market Risk – Foreign Currency Exchange Risk,” of this Form 10-K.
Trends in non-print media are expected to continue to adversely affect demand for traditional print media, including our newsprint and specialty papers, and those of our customers.media. For additional information, see Item 1A, “Risk Factors – Strategic RiskRisks –Developments in non-print media and changes in consumer habits regarding the use of paper are expected to continue to adversely affect the demand for some of our key products, and our responses to these developments may not be successful,” of this Form 10-K.
Based on market interest, we offer a number of our products, particularly market pulp and wood products with specific designations to one or more globally recognized forest management and chain of custody standards. Our ability to conform to new or existing guidelines for certification depends on a number of factors, many of which are beyond our control, such as: changes to the standards or the interpretation or the application of the standards; the adequacy of government-implemented conservation measures; and the existence of territorial disputes between First NationsIndigenous peoples and governments. If we are unable to offer certified products, or to meet commitments to supply certified product, it could adversely affect the marketability of our products and our ability to compete with other producers.
EmployeesHuman Capital
As of December 31, 2018,2020, we employed approximately 7,4007,100 people, of whom approximately 4,5003,700 were represented by various unions, primarily Unifor, and the Confederation of National Trade Unions (or, the “CNTU”) in Canada, and predominantly by the United Steelworkers International (or, the “USW”) in the U.S. In the past year, we renewed or entered into a number of agreements with unions, covering approximately 1,500500 employees in Canada. Collective agreements covering approximately 300 employees in Canada have expired, and additional collective agreements covering approximately 1,100 employees in Canada and the U.S. are scheduled to expire in 2019, affectinginvolving certain pulp and paper mills, sawmills, and woodlands operations.Canadian sawmills.
While we intend to renew collective agreements, there can be no assurance that we will be able to renew agreements on satisfactory terms, or that we will maintain continuously satisfactory agreements with all of our unionized employees. Should we be unable to do so, it could result in strikes, work stoppages, or disturbances by affected employees, which could cause us to experience a disruption of operations and affect our business, financial condition, or results of operations.
Our long-term competitiveness is tied to the ability to recruit, develop and retain top-quality employees with the right skills. We are building a strong corporate culture that attracts results-driven and action-oriented employees and allows natural leaders to grow. We hired 970 new permanent and temporary employees, raising our employer profile through targeted recruitment practices. We assessed 100% of salaried employees’ effectiveness through the Demonstrated Effectiveness Appraisal process, which is focused on enhancing organizational capability through managerial accountability and people development. We continue to train every employee on Resolute’s Code of Business Conduct and have in place a Diversity Policy designed to ensure equal consideration and opportunities to all employees. We are equally committed to ensuring that our employees are consistently motivated and engaged by promoting individual professional development goals, support sharing of knowledge and resources across the Company, and create opportunities for growth and learning wherever possible.
The health and safety of our employees is a core Company value. We are committed to providing our employees with safe working environments, in addition to complying with applicable legal requirements at all our sites. Since 2015, our Occupational Safety and Health Administration (OSHA) incident rate world-class performance has been below 0.80, and we achieved an OSHA incident rate of 0.62 in 2020, which is one of the lowest rates within the North American forestry products industry.
Since the beginning of the COVID-19 pandemic, a vigilance committee has been set up to collect and analyze continuous relevant information through the appropriate public health authorities where we operate, and more than 30 pandemic crisis management protocols have been implemented to ensure the safety and health of employees and contractors working at all our sites, helping to mitigate disruptions of operations.
In addition, the board adopted a board-level diversity policy striving to maintain a minimum of 25% representation each of men and women on our board of directors, as well as an executive leadership-level diversity policy acknowledging diversity as a key factor in the Company’s talent management strategy. Currently there are two women on the board representing 29% of its membership.
Trademarks
We have registrations or pending applications for our key trademarks “RESOLUTE” and “resolute Forest Products & Design” in the countries of our principal markets, as well as “RESOLUTE FOREST PRODUCTS”, “R Design”, and “RESOLUTE TISSUE” in Canada and the United States,U.S., and “RÉSOLU” and “Produits forestiers résolu & Design” in Canada. The current registrations of these trademarks are effective for various periods of time and may be renewed periodically, provided that we, as the registered owner, comply with all applicable renewal requirements.
Environmental and Other Regulated Matters
We are subject to a varietynumber of federal or national, state, provincial, and local environmental laws and regulations in various jurisdictions relating to the jurisdictions in which we operate.environment, health and safety, and some of our infrastructure, including dams and bridges. We believe our operations are in material compliance with current applicable environmental, health and safety, as well as applicable infrastructure laws and regulations. While it is impossible to predict future environmentallaws and regulations that may be established,adopted, we believe that we will not be at a significant competitive disadvantage with regard to meeting future Canadian or United StatesU.S. standards. For additional information, see Note 14,18, “Commitments and Contingencies – Environmental matters,” to our Consolidated Financial Statements.
Internet Availability of Information
We make our Form 10-K, our Quarterly Reports on Form 10-Q and our Current Reports on Form 8-K, and any amendments to these reports, available free of charge on our website (www.resolutefp.com) as soon as reasonably practicable after we file or furnish such materials to the SEC. The SEC also maintains a website (www.sec.gov) that contains our reports and other information filed with the SEC. Our reports are also available on the System for Electronic Document Analysis and Retrieval website (www.sedar.com).
ITEM 1A. RISK FACTORS
In addition to the other information set forth in this Form 10-K and in other documents we file with the SEC, you should carefully consider the following factors, among others, which could materially affect our business, financial condition, or future results.results, reputation as well as the market price of our securities. In particular, the risks described below could cause actual events to differ materially from those contemplated in the forward-looking statements in this Form 10-K.
Risks related to the COVID-19 pandemic
The outbreak of the pandemic caused by COVID-19 has had, and could continue to have a negative impact on financial markets, economic conditions and portions of our business. While we are unable to predict the extent, nature and duration of these impacts at this time, the global COVID-19 pandemic could negatively affect our business and results of operations, as well as the market price of our securities, in a number of ways, including the following:
•While we expect to continue to operate in all of our business segments in Canada and the U.S., we have reduced our operational footprint to levels consistent with essential or reduced needs, including the temporary idling of certain machines or facilities and implementing temporary or permanent layoffs. Further adjustments to our operational footprint, temporary or permanent, could be made as the COVID-19 pandemic situation develops.
•The COVID-19 pandemic has already accelerated the secular demand decline for paper products like those we manufacture as widespread confinement alters consumer habits, which has had, and could continue to have an impact on pulp demand. The decline in demand and altered habits could have a permanent effect.
•Any construction slowdown in North America may result in a decline in demand for wood products. If the demand for wood products falls and we reduce harvesting and sawmill activity as a result, we could have greater difficulty obtaining the supply of timber and wood fiber required for our operations at favorable prices, or at all.
•There is lower demand for our away-from-home tissue products usually found in hotels, restaurants, schools, office buildings and other businesses or premises, and our ability to convert our tissue for the retail market may be limited.
•There is increased risk that we may not obtain raw materials, chemicals and other required supplies or services in a timely fashion and at favorable prices due to the impact of the reduced economic activity as a result of the COVID-19 pandemic on our suppliers, which could affect our production output and profitability.
•Additional trade restrictions or barriers could also negatively affect our supply chain as well as the sales or distribution of our products.
•The impact of the reduced economic activity as a result of the COVID-19 pandemic on our customers has increased our risk of credit exposure and that risk could continue to increase.
•Although the forest products industry has generally been recognized as critical or essential in locations where we operate, the current health restrictions, including social distancing measures, impact how our employees fulfill their duties, and limits the number of employees we can have at our operations, which in turn could impact our production output and costs.
•It could be difficult or costly to restart certain of our temporarily idled operations, and we could face personnel shortages if employees are no longer available or amenable to return to work.
•Should certain employees become ill from COVID-19 or unable to work, the attention of our management team could be diverted and our operations could be affected.
•The reduced operations and staffing at our facilities, remote working conditions and increased risk of obtaining supplies or services could increase the risk of non-compliance and incidents.
If necessary, to preserve liquidity, we could suspend or defer capital projects, as well as other strategic initiatives. Strategies to increase earnings power or generate additional cash flow, including acquisitions, divestitures and other transactions could be delayed or not materialize given the current economic uncertainty. In response to the COVID-19 pandemic, we could decide to permanently shut down machines or facilities and be required to record significant closure costs, remediation costs, long-lived asset impairment or accelerated depreciation charges.
The economic uncertainty resulting from the COVID-19 pandemic and the ensuing decline in financial market returns and low-interest rate environment could continue to result in an increase in the amount by which our pension plans are underfunded by the next measurement date at year-end. This could result in a significant increase in the amount of our required future pension contributions, which could have an adverse effect on our financial condition.
If we do not generate enough cash to fund our short-term or long-term obligations, we may have to draw further on our credit facilities to meet our obligations or seek additional sources of liquidity. The economic uncertainty resulting from the COVID-19 pandemic and any downgrade of our credit ratings could lead to greater difficulty in obtaining additional financing on favorable terms.
The COVID-19 pandemic, including related governmental responses and economic impacts, market disruptions and changes in consumer habits, has heightened the risks and uncertainties described in the risk factors below, and should be read in conjunction therewith.
Strategic RiskRisks
Strategic risks relate to our future business plans and strategies, including the risks associated with the global macro-environment in which we operate, trends in our industry, demand for our products, competitive threats, product innovation, public policy developments, changes to consumption habits, resource allocation, and strategic initiatives, including mergers and acquisitions, dispositions, and restructuring activity.
Developments in non-print media and changes in consumer habits regarding the use of paper are expected to continue to adversely affect the demand for some of our key products, and our responses to these developments may not be successful.products.
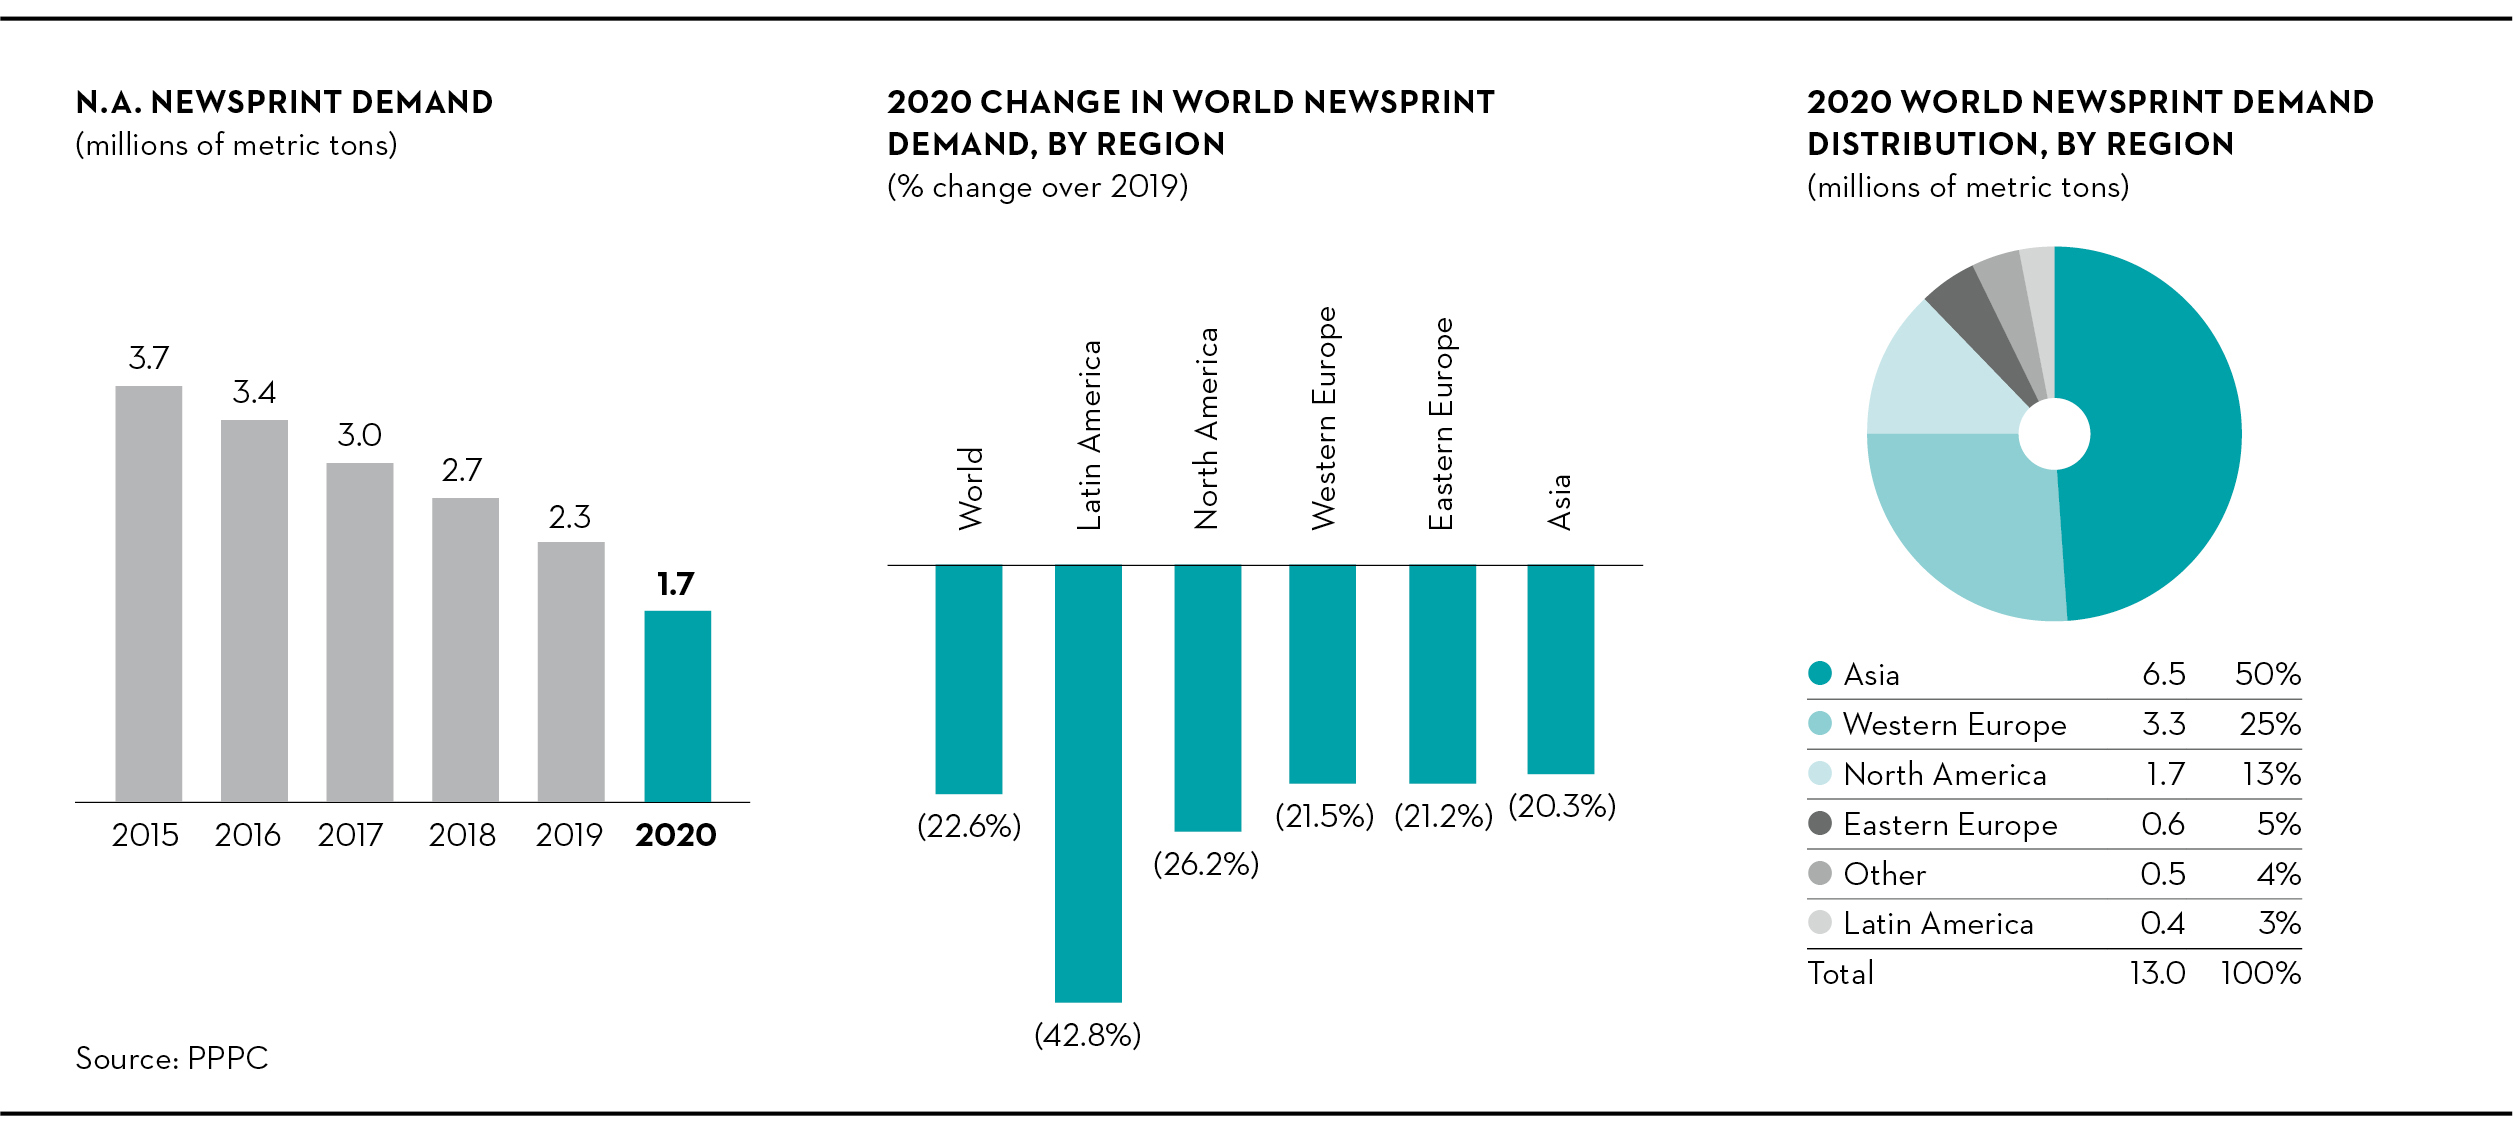
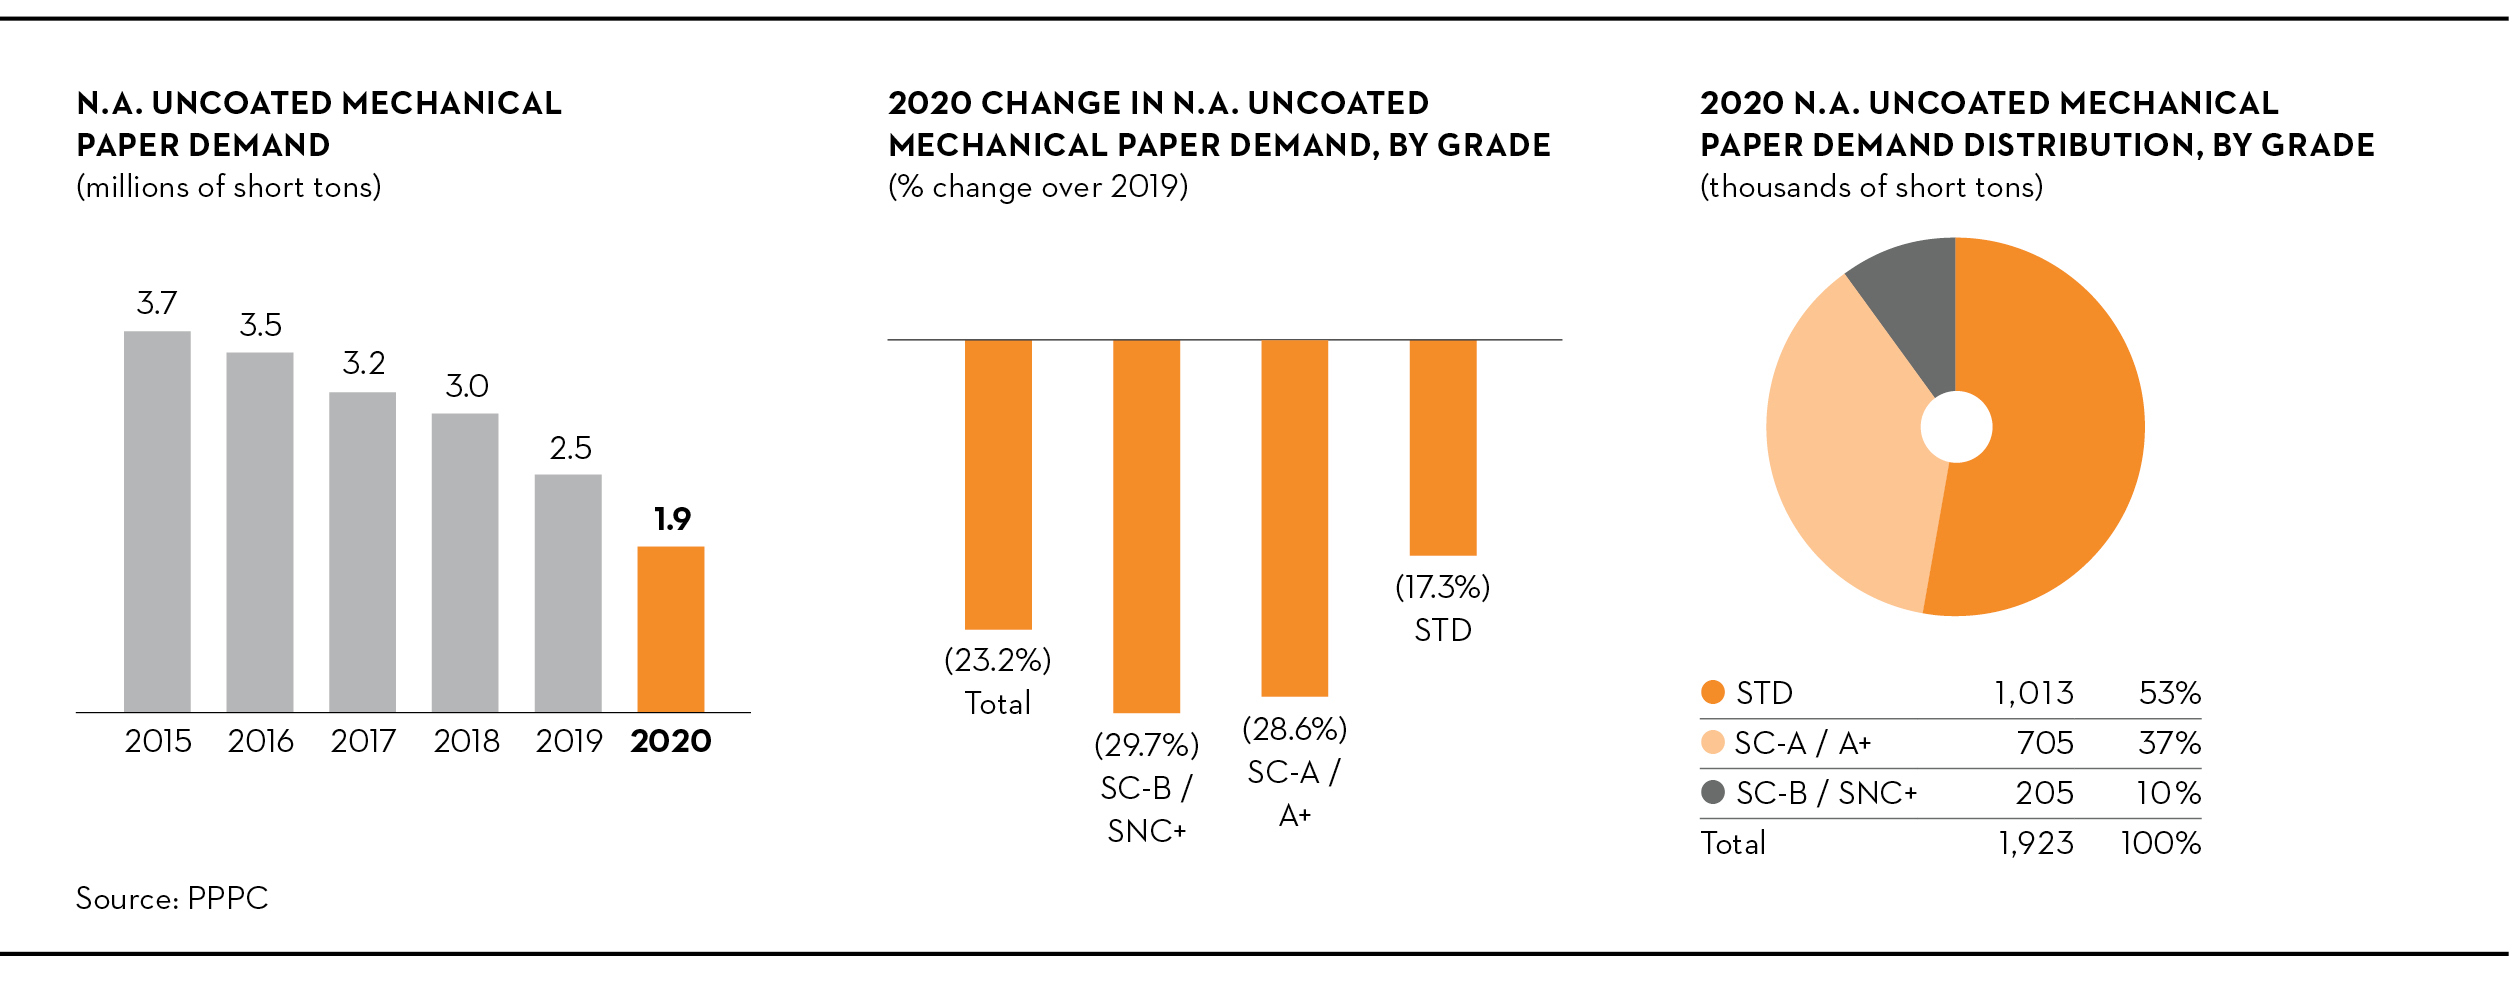
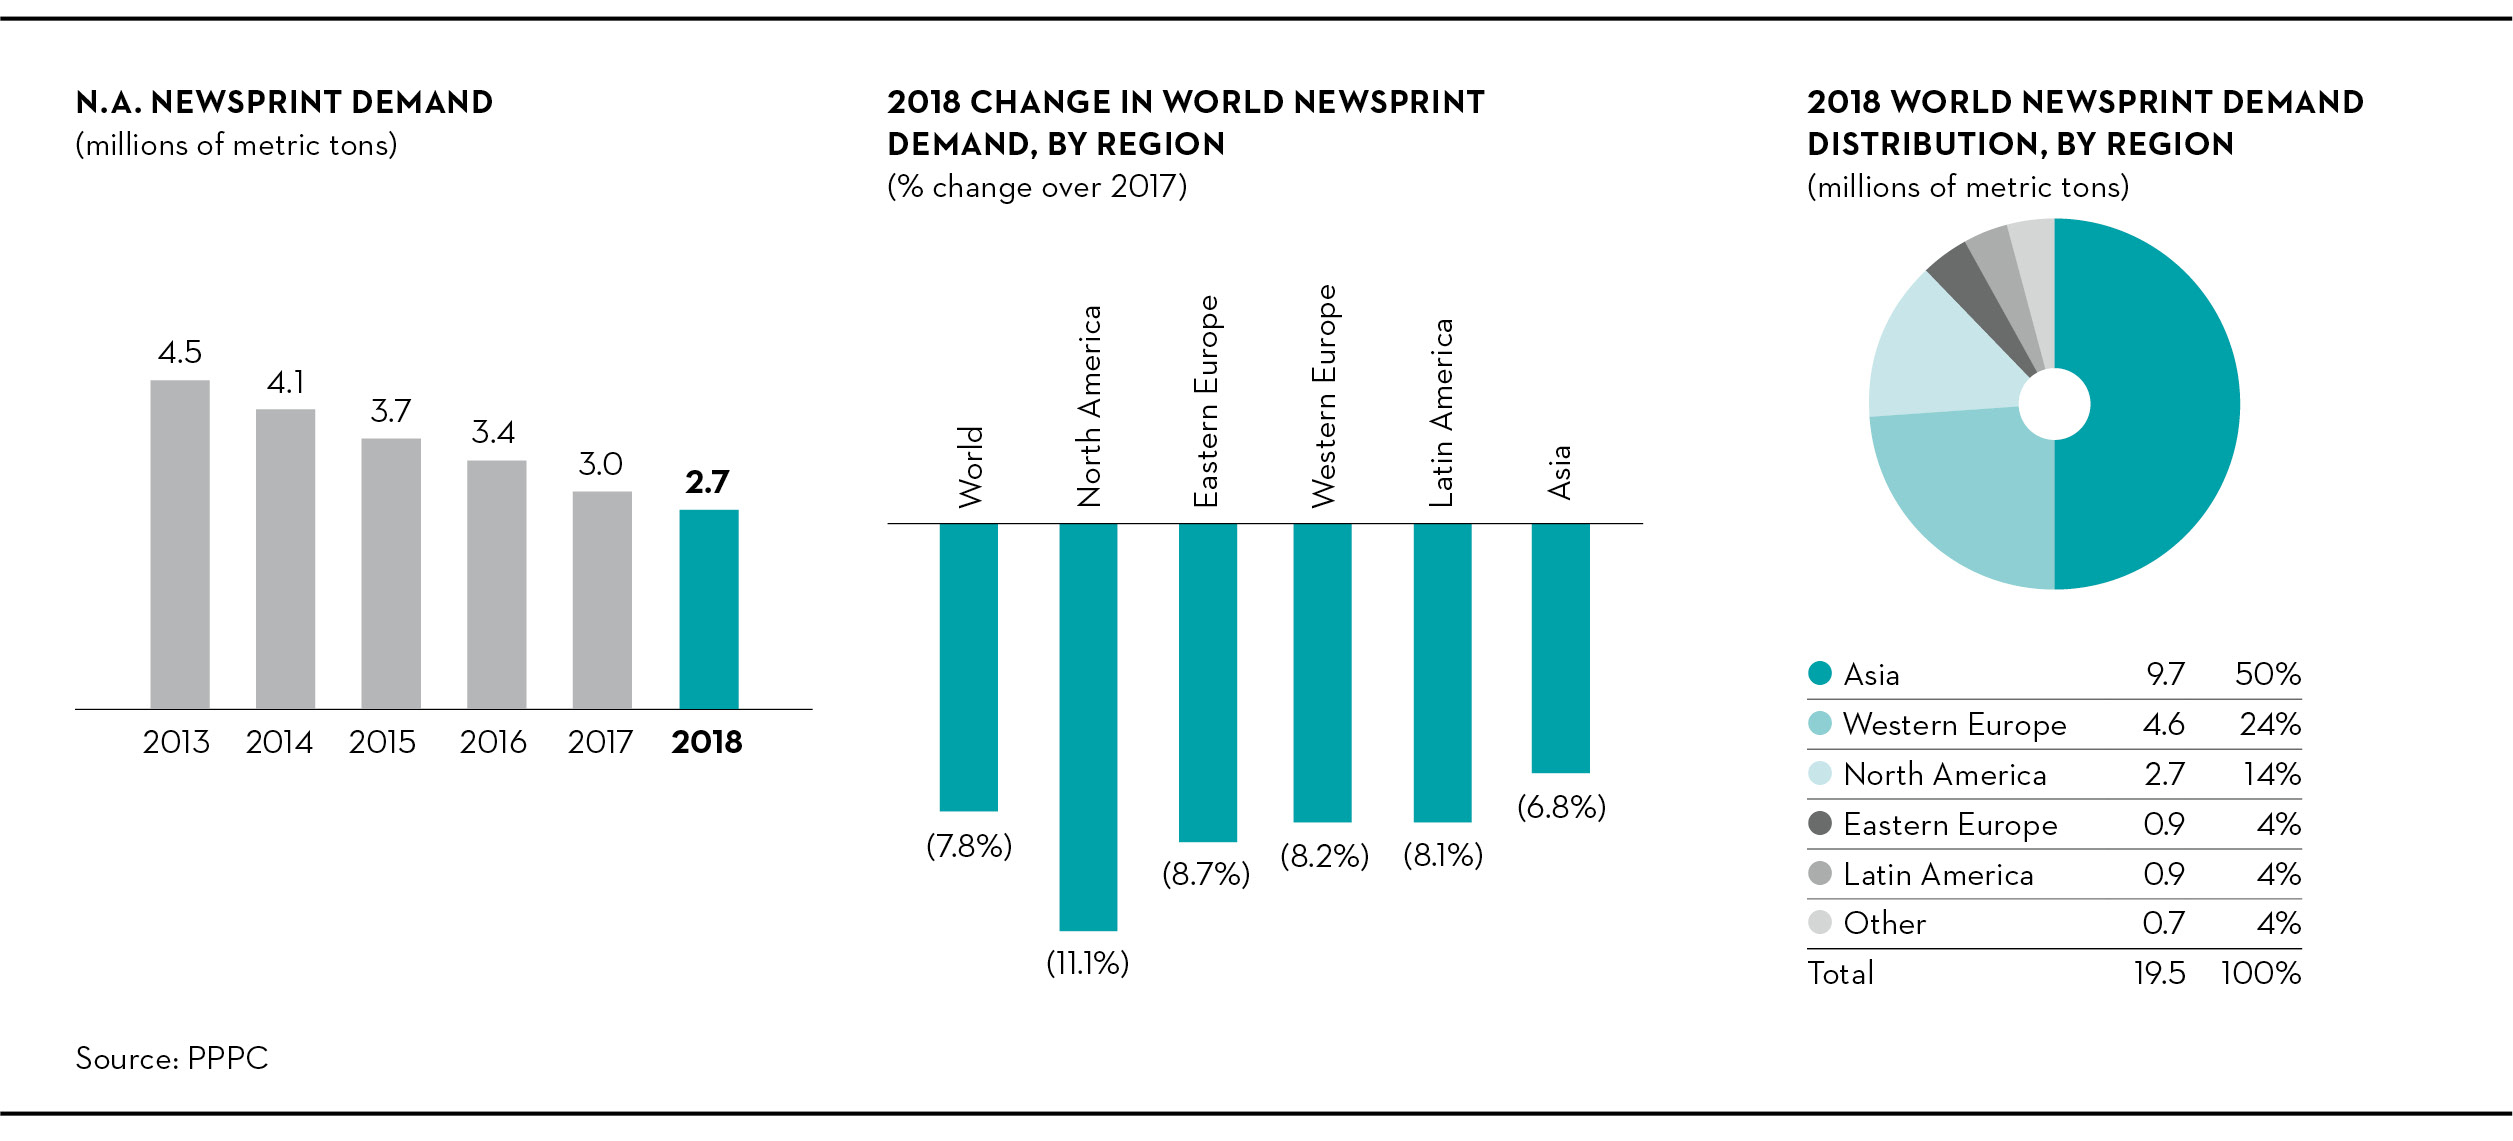
Trends in non-print media are expected to continue to adversely affect demand for traditional print media, including our newsprint and specialty papers, and those of our customers.customers’ products. Neither the timing nor the extent of these trends can be predicted with certainty. Our newspaper, magazine, book and catalog publishing customers could increase their use of, and compete with, non-print media, including videomultimedia technologies, electronic storage and audio-based advertising and data transmission, non-print storage technologies, and non-print communication platforms such as websites and social media, which could further reduce their consumption of newsprint, commercial printing papers or other products we manufacture.manufacture, including market pulp. The demand for some of our paper products has weakened significantly over the past decade. This situation has accelerated since the COVID-19 pandemic as confinement and work from home has altered consumer habits, which could become permanent and also impact the demand for pulp. For example, over the 10 years ended December 31, 2018,2020, according to industry statistics, North American newsprint demand fell by 65%. This trend, which similarly affects our specialty papers, could continue as a result of developments69%, and fell by 26% in non-print media, lower North American newspaper circulation, weaker paper-based advertising, grade substitution and conservation measures taken by publishers and retailers.2020.
We face intense competition in the forest products industry and the failure to compete effectively could have a material adverse effect on our business, financial condition and results of operations.industry.
We compete with numerous forest products companies, some of which have greater financial resources than we do.resources. The trend toward consolidation in the forest products industry has led to the formation of sizable global producers that have greater flexibility in pricing and financial resources for marketing, investment, research and expansion than we do.development, innovation, and expansion. Because the markets for our products are all highly competitive, actions by competitors can affect our ability to compete and the volatility of prices at which our products are sold.
The forest products industry is capital intensive, and requireswe require significant investment to remain competitive. Some of our competitors may be lower-cost producers in some of the businesses in which we operate. In particular,For example, the sizable low-cost hardwood and softwood grade pulp capacity in South America, which continues to grow as a result of ongoing investment and whose costs are thought to be very competitive, and the actions those mills take to gain market share, could continue to adversely affect our competitive position in similar grades. This in turn could affectimpact our sales and cash flows, and push us to consider significant capital investments to remain competitive. Failure to compete effectively could have a material adverse effect on our business, financial condition or results of operations.
If we are unable to offer products certified to globally recognized forestry management and chain of custody standards or meet customers’ product specifications, it could adversely affect our ability to compete.
Based on market interest, we offer a number of our products, including some paper grades, some grades of market pulp and paper, wood products,and tissue, with specific designations to one or more globally recognized forest management and chain of custody standards.standards as well as product specifications to meet customers’ requirements. Our ability to conform to new or existing guidelines for certification depends on a number of factors, many of which are beyond our control, such as: changes to the standards or the interpretation or the application of the standards; the collaboration of our suppliers in timely sharing product information; the adequacy of government-implemented conservation measures; and the existence of territorial disputes between First NationsIndigenous peoples and governments. If we are unable to offer certified products, or to meet commitments to supply certified product or meet the product specifications of our customers, it could adversely affect the marketability of our products and our ability to compete with other producers.
We may not be successful in implementing our strategies to increase earnings power.
Our corporate strategy includes,is focused on continuing to transform the one hand, keeping pace withCompany away from mature product markets and products in structurally declining paper demand toward a more profitable and onsustainable organization over the other, using our strong financial position to act on opportunities to diversify and grow.long run. This strategy has three core themes:
includes maximizing value generation from structurally declining paper, growing in pulp tissue, and wood products, and integrating our pulp into value-added quality tissue.tissue, and investing in product innovation, while maintaining a disciplined approach to capital allocation.
The implementation of our corporate strategy is subject to uncertainty and could require significant capital investments. In addition, strategic initiatives could have unintended consequences, including, for example, a loss of certain pulp customers if our tissue segment becomes competitive with tissue products sold by those customers.
As part of our corporate strategy, we pursue acquisitions, divestitures, and other strategic transactions and projects to complement, expand or optimize our business, such as our entry into wood manufacturing in the U.S., and tissue production and sales. In connection with any acquisition, divestiture, strategic transaction or project, we may not successfully integrate an acquired business, or assets, technologies, processes, controls, policies, and operations with ours or realize some or all of the anticipated benefits and synergies of the acquisition, divestiture, strategic transaction or project. In connection with such transactions, we may face challenges associated with entering into a new market, orproduction location, product category, such as our entry into tissue productionor meeting customers’ demands. We may also face issues with the separation of processes and sales, including competition for market share.loss of synergies following the divestiture of businesses. In addition, we may not be able to successfully negotiate potential acquisitions, divestitures, strategic transactions or projects that we identify, or may not be able to obtain financing that may be needed. Future acquisitions could result in potentially dilutive issuances of equity securities and the incurrence of debt and contingent liabilities, and substantial goodwill. The negotiation of any transaction and its completion may be complex, costly, and time consuming. To the extent we are unsuccessful in implementing our corporate strategy or our efforts do not achieve the anticipated outcomes, our results of operations and cash flows may be adversely affected.
Changes in the political or economic conditions in the United States,U.S., Canada or other countries in which we sell our products could adversely affect our results of operations.
We manufacture products in the United StatesU.S. and Canada, and we sell products throughout the world. The economic and political policies of each country and region have a significant impact on our costs and the prices of, and demand for, our products. Changes in regional economies and economic policies can affect demand for our products, manufacturing and distribution costs, pricing, sales volume, and the availability or cost of insurance. These changes, in turn, can affect our results of operations. Changes to regional economies and economic policies that can bring about such effects include, among others, changes in the terms of, or countries that are parties to, bilateral and multi-lateral trade agreements and arrangements, limitations on the ability of potential customers to import products or obtain foreign currency for payment of imported products, and political and economic instability, including pandemics, significant civil unrest, acts of war or terrorist activities, or unstable or unpredictable governments in countries in which we operate or trade.
Our business is subject to global economic conditions and is highly cyclical; soft conditions could cause a number of the risks we face to increase in likelihood, magnitude and duration.
Our operations and performance depend significantly on worldwide economic conditions. During periods of weak or weakening global economic conditions, we would expect any increase in unemployment or lower gross domestic product growth rates to adversely affect demand for our products as our customers delay or reduce their expenditures. For example, during an economic downturn, end consumers may reduce newspaper and magazine subscriptions as a direct result of their financial circumstances, contributing to lower demand for our products by our customers. Advertising demand in printed magazines and newspapers may also decline. Lower demand for print advertisements leads to fewer or smaller pages in, and may lead to less frequent publication of, printed newspapers, magazines and other advertisement circulars and periodicals, decreasing the demand for our products. In addition, demand for our market pulp products is generally associated with the production rates of paper producers, as well as consumption trends for products such as tissue, toweling and absorbent products.
An economic downturn in the U.S. or Canada could also negatively affect the U.S. or Canadian housing industry, which is a significant driver of demand for our lumber and other wood-based products. For example, a decline in housing starts or in the repair and remodeling segment could create a low level of primary demand for our lumber and other wood-based products, which we would expect to result in our wood products business operating at a lower level until there is a meaningful recovery in new residential construction demand.demand or in the repair and remodeling sector. In addition, with less lumber demand, sawmills could generate fewer wood chips that we use in our pulp and paper mills, which could lead those mills to increase their supply from the open market, where prices can fluctuate with market conditions. We could also have less wood residue to use internally, which would increase our fossil fuel consumption and, as a result, our costs and environmental impact.
The forest products industry is also highly cyclical. The overall levels of demand for the products we manufacture, and consequently, our sales and profitability, reflect fluctuations in levels of end user demand. As described above, end user demand depends at least in part on general economic conditions in North America and the world, and the effect can be significant. In addition to end user demand, we have experienced cyclical changes in prices, sales volume and margins for our commodity products as a result of changing market trends and the effect of capacity fluctuations on supply and demand as well as the
relative competitiveness of producers. Because our commodity products have few distinguishing qualities from producer to producer, competition is based mainly on price, which is determined by supply relative to demand, which is in turn affected by the factors described above.
Operational RiskRisks
Operational risks arise from external events, processes, people and systems that affect the operation of our businesses. These include risks affecting, among other things, marketing and sales, woodlands management, production, supply chains, information management, data protection and security, including cybersecurity, human resources, and reputation.
Our manufacturing businesses may have difficulty obtaining timber or wood fiber at favorable prices, or at all.
Wood fiber is the principal raw material we use in our business. We primarily use primarily wood chips and logs for our pulp, tissue, and paper mills. Our wood products business is also dependent on our timber supply.
We depend heavily on harvesting rights and timber supply guarantees over government-owned land in Ontario and Quebec, respectively. The volume of harvest permitted under these licenses is subject to limits, which are generally referred to as the AAC.annual allowable cut (or, “AAC”). The AAC is reviewed regularly, typically every five years in Quebec and every 10 years in Ontario. The chief forester of the province ofnext AAC revision in Quebec ordered significant reductionsis scheduled to the allowable harvest between 2006 and 2018, and announced an increase of 5.6% to thetake place in 2023 while Ontario is completing AAC revisions in 2021 for the spruce, pine, fir, and larch species, for the period of 2018 to 2023. This increase did not resultforests in a significant change in the volume allocated to us.which we operate. About 25% of the total allowable harvestharvesting rights in Quebec isare allocated through an open auction system. The prices generated by the auction system are used to set pricing for the remainder of the AAC.
In addition, regulatory developments, activist campaigns and litigation advanced by First NationsIndigenous groups or other interested partiesstakeholders have caused, and may cause in the future, significant reductions in the amount of timber available for commercial harvest in Canada, or that meet standards required for third-party certifications. Future regulation, particularly by Ontario, Quebec, or the federal Canadian government, as well as litigation, changes in forest management certification standards, and actions taken by activists to influence the availability of timber for commercial harvest could focus on any one or more of:
of the use of timberlands;
timberlands, forest management practices;
practices, forest management and chain of custody certification standards;
standards, consultation with First Nations groups;
theIndigenous groups, protection of habitats and endangered or other species, including the woodland caribou;
thecaribou, promotion of forest biodiversity;biodiversity, and
the response to, and prevention of, catastrophic wildfires.
Increased pressures on the Canadian provincial and federal governments to increase the protection of the woodland caribou, its habitat, and the boreal forest, could impact timber supply. For example, regulations relating to habitats, and endangered or other species in Ontario could significantly reduce timber supply in that province, including to our Ontario mills. Our access to timber may also be affected by factors such as fire and fire prevention, insect infestation, disease, ice storms, wind storms, drought, flooding, and other natural and man-made causes, which could potentially reduce supply and increase prices.
Though timber is our primary source of fiber, wood fiber is a commodity and we also buy a significant portion of our fiber requirements on the open market. Prices for wood fiber are cyclical and subject to market influences, which could be concentrated in one or more regions due to market shifts. The timber requirements for our U.S. sawmills are met mostly by purchasing timber from timberland owners.
If we are unable to obtain adequate supplies of timber or wood fiber at favorable prices for any of the reasons described above, our business operation could be materially and adversely affected.
A sustained increase in the cost of purchased energy and other raw materials would lead to higher manufacturing costs, which could reduce our margins.
Our operations consume large amounts of energy, such as electricity, natural gas, fuel oil, and wood residue, a substantial proportion of which we buy on the open market. The main raw materials we require in our manufacturing processes are wood fiber and chemicals. The prices for raw materials and energy are volatile and may change rapidly, which impacts our manufacturing costs, directly affects our results of operations and may contribute to earnings volatility.
For our commodity products, the relationship between industry supply and demand, rather than changes in the cost of raw materials, determines our ability to increase prices. Consequently, we may be unable to pass along increases in our operating costs to our customers. Any sustained increase in energy, chemical, or raw material prices without any corresponding increase
in product pricing would reduce our operating margins and potentially require us to limit or cease operations of one or more of our machines.facilities.
We also generate electricity for our operations at our hydroelectric facilities. There can be no certainty that we will be able to maintain ourthe water rights which are necessary for our hydroelectric power generating facilities, or to renew them on favorable conditions. The closure of certain machines or facilities located in Quebec could trigger the exercise of termination rights by the Quebec government under hydro water rights agreements. The amount of electricity we can generate from our hydroelectric power facilities is also subject to the volume of rain or snowfall and is therefore variable from one year to the next.
We are subject to physical, financial and financialregulatory risks associated with global, regional, and local weather conditions, and climate change.
Our operations and the operations of our suppliers are subject to climate variations, which impact the productivity of forests, the frequency and severity of wildfires, the availability of water, the distribution and abundance of species, and the spread of disease or insect epidemics, which in turn may adversely or positively affect timber production.production and availability. Over the past several years, changing weather patterns and climatic conditions due to natural and man-made causes have added to the unpredictability and frequency of natural disasters such as hurricanes, earthquakes, hailstorms, wildfires, drought, flooding, snow, ice storms, the spread of disease, and insect infestations. Any of these natural disasters could also affect our woodlands or cause variations in the cost of raw materials, such as virgin fiber. Changes in precipitation resulting in droughts could make wildfires more frequent or more severe, and could adversely affect timber harvesting or our hydroelectric production. The effects of global, regional, and local weather conditions, and climate change, including the costs of complying with evolving climate change regulations and transition costs relating to a low carbon economy could also adversely impact our results of operations.
We could experience disruptions in operations or increased labor costs due to labor disputes.disputes or occupational health and safety issues.
As of December 31, 2018,2020, we employed approximately 7,4007,100 people, of whom approximately 4,5003,700 were represented by various unions, primarily Unifor, and the Confederation of National Trade Unions (or, the “CNTU”) in Canada, and predominantly by the United Steelworkers International (or, the “USW”) in the U.S. In the past year, we renewed or entered into a number of agreements with unions, covering approximately 1,500500 employees in Canada. Collective agreements covering approximately 300 employees in Canada have expired, and additional collective agreements covering approximately 1,100 employees in Canada and the U.S. are scheduled to expire in 2019, affectinginvolving certain pulp and paper mills, sawmills, and woodlands operations.Canadian sawmills.
While we intend to renew collective agreements, there can be no assurance that we will be able to renew agreements on satisfactory terms, or that we will maintain continuously satisfactory agreements with all of our unionized employees. Should we be unable to do so, it could result in strikes, work stoppages, or disturbances by affected employees, which could cause us to experience a disruption of operations and affect our business, financial condition, or results of operations.
Occupational health and safety issues, including relating to the COVID-19 pandemic, could also cause disruptions in operations or otherwise affect labor-related costs.
Difficulties in our employee relations or difficulties identifying, attracting, and retaining employees for work, particularly in our remote locations and certain positions with specialized skills, could lead to operational delaysdisruptions or increase our costs.
Our ability to achieve our future goals and objectives is dependent, in part, on maintaining good relations with our employees and minimizing employee turnover at our corporate offices, mills, and woodlands operations. Work stoppages, excessive employee turnover, or difficulty in attracting and retaining employees, particularly for work in remote locations and certain positions with specialized skill sets, could lead to operational delaysdisruptions or increased costs.
Disruptions to our supply chain, operations, or the delivery of our products, could adversely affect our financial condition or results of operations.
The success of our businesses is largely contingent on the availability of, and direct access to, raw materials, as well as our ability to ship products on a timely and cost-efficient basis. As a result, any event that disrupts or limits transportation or delivery services or the operations of our suppliers could materially and adversely affect our business. In addition, our operating results depend on the continued operation of our various production facilities and our ability to complete construction and maintenance projects on schedule. Interruptions of operations at our facilities, including interruptions caused by the events described below, could materially reduce the productivity and profitability of a particular manufacturing facility, or our business as a whole, during and after the period of such operational difficulties.
Our operations, supply chain, and transportation and delivery services are subject to potential hazards, including explosions, fires, accidental release of toxic materials, severe weather and natural disasters, mechanical and power failures, structural failures at any of our dams or
hydroelectric facilities, supplier disruptions, labor shortages or other difficulties, public health measures to prevent or eradicate epidemics or pandemics, transportation interruptions, remediation complications, environmental and workplace risks, and terrorist or other violent acts.
Some of these hazards can cause personal injury and loss of life, severe damage to or destruction of property, equipment, or the environment, and can result in, among other things: the suspension of operations; the shutdown of affected facilities; reputational damage; the imposition of civil or criminal penalties; workers’ compensation; and claims against us with respect to workplace exposure, exposure of contractors on our premises, as well as other persons located nearby.
We are subject to disruptions to the information technology systems thatused to manage our operations and other business processes, including cybersecurity and privacy incidents that could involve sensitive company, employee, customer, employee,vendor, and vendorshareholder information.
We use information technologiestechnology to securely manage operations and various business functions. We rely on various technologies to process, store, and report on our business and interact with employees, customers, vendors, and employees.shareholders. The secure and reliable processing, maintenance, and transmission of this information is critical to our operations and business strategy. Despite our security design and controls, and those of our third-party providers, our information technology and infrastructure may be vulnerable to interruptions, breakdowns, cyberattacks or breaches due to employee error, malfeasance, hackers, computer viruses, ransomware, natural disasters, power or telecommunications failures, as well as other disruptions. AnyA cybersecurity breach could result in operational disruptions or the misappropriation of sensitive data or personal information and could subject us to civil and criminal penalties, litigation, or have a negative impact on our reputation. We may be required to expend capital and other resources to protect against such security breaches or cyberattacks, or to remediate problems caused by such breaches, attacks, or other disruptions. We have been the subject of cyberattacks from time to time, none of which have had a material impact on our business information systems or operations. There can be no assurance that such disruptions or misappropriations and the resulting repercussions will not negatively impact our cash flows and materially affect our results of operations or financial condition. Recent developments in cybersecurity and privacy legislation in different jurisdictions are imposing additional obligations on us and could expand our potential liability in the event of a cybersecurity or privacy incident.
We are currently transitioning from certain legacy system applications, and during the transition, such legacy systems may be more vulnerable to attack or failure and implementation of the transition may cause disruptions to our business information systems.
We are currently in the process of replacing certain legacy system applications with an integrated business management software platform. Prior to the completion of this upgrading process, we may not have supplier or third-party support for legacy systems in the event of failure or required updates, and such legacy systems may be more vulnerable to breakdown, malicious intrusion, and random attack. Prior to the completion of this upgrading process, we may also experience difficulties maintaining or replacing the hardware infrastructure required to operate these legacy systems. Such legacy systems, if not properly functioning prior to their replacement, could adversely affect our business.
During the process of replacing legacy systems, we could experience disruptions to our business information systems and normal operating processes because of the projects’ complexity. The potential adverse consequences could include delays, loss of information, decreased management reporting capabilities, damage to our ability to process transactions, harm to our control environment, diminished employee productivity, business interruptions, and unanticipated increases in costs. Further, our ability to achieve anticipated operational benefits from new platforms is not assured.
Negative publicity, even if unjustified, could have a negative impact on our brand and the marketability of our products.
We believe that we have established a reputation for transparent communications, social and corporate governance, responsible forestry practices, and overall sustainability leadership. We also believe that our commitment to sustainable and responsible forestry practices extends well beyond strict compliance with applicable forestry regulations, which in Quebec and Ontario are already among the most, if not the most, rigorous in the world. Negative publicity, whether or not justified, relating to our operations and our business could tarnish our reputation or reduce the value of our brand and market demand for our products. In addition, the actions of activists, whether or not justified, could impede or delay our ability to access raw materials or obtain third-party certifications with respect to forest management and chain of custody standards that we seek in order to supply certified products to our customers. In these cases, we may have to incur significant expenses and dedicate additional resources to defend ourselves against activist campaigns, rebuild our reputation, and restore the value of our brand.
Financial RiskRisks
Financial risks relate to our ability to meet financial obligations and mitigate exposure to broad market risks, including: volatility in foreign currency exchange rates, interest rates and commodity prices;prices, capital structure; andstructure, as well as credit and liquidity risk, including risk related to cash management, extension of credit, collections, credit ratings, and availability and cost of funding.
Currency fluctuations can adversely affect our competitive position, selling prices, manufacturing costs, and net monetary items.
We compete with producers from around the world, particularly North America, Europe, and South America, in most of our product lines, with the exception of wood products and tissue, where we compete primarily with other North American producers. We sell our products mainly in transactions denominated in U.S. dollars, but we also sell in certain local currencies, including the Canadian dollar, the euro, and the pound sterling. Changes in the relative strength or weakness of these currencies, particularly the U.S. dollar, could affect international trade flows inof these products. A stronger U.S. dollar might attract imports, thereby increasing product supply and possibly creating downward pressure on prices. On the other hand, a weaker U.S. dollar might encourage U.S. exports but also increase manufacturing costs in Canadian dollars.
We are particularly sensitive to changes in the value of the Canadian dollar versus the U.S. dollar. The actual impact of these changes depends primarily on the proportion of our production and sales that occur in Canada, the proportion of our financial assets and liabilities denominated in Canadian dollars, and the magnitude, direction and duration of changes in the exchange rate. We expect exchange rate fluctuations to continue to impact costs and revenues, but we cannot predict the magnitude or direction of this effect for any period, and there can be no assurance of any future effects. In 20172019 and 2018,2020, the Canadian dollar fluctuated between a low of US$0.731.27 in MayDecember of 20172020 and a high of US$0.831.45 in SeptemberMarch of 2017.2020. Based on operating projections for 2019,2021, if the Canadian dollar strengthens by one cent against the U.S. dollar, we expect that it will decrease our annual operating income by approximately $18$16 million, and vice versa.
Furthermore, certain monetary assets and liabilities, including a substantial portion of our net pension and other postretirement benefit obligations and our net deferred income tax assets, and certain of our indebtedness, including the Quebec secured term loan facility (or, the “Loan Facility”) are denominated in Canadian dollars. As a result, our earnings and the amounts borrowable under our Loan Facility can be subject to the potentially significant effect of foreign exchange gains or losses in respect of these Canadian dollar net monetary items. A fluctuation of the Canadian dollar against the U.S. dollar in any given period would generally cause a foreign exchange gain or loss.loss or change in the effective availability of the Loan Facility.
The amount by which our pension plans are underfunded could increase the level of required contributions, which could have an adverse impact on our financial condition.
As of December 31, 2018,2020, we had net pension obligations of $1,122$1,440 million, of which approximately 75%78% relates to our registered pension plans in the provinces of Quebec and Ontario, and approximately 25%22% of which relates to our U.S. qualified pension plan. See Note 12,16, “Pension and Other Postretirement Benefit Plans,” to our Consolidated Financial Statements, for a description of our pension plan funding obligations, including our unfunded pension obligations.
The amount by which our pension plans are funded or underfunded varies depending upon the return on pension fund investments, the level of interest rates used to determine minimum funding levels, the payments of benefits, and other actuarial assumptions and experience. Variations from our assumptions would cause the actual amount of our required contributions to vary from our current estimates. Any additional contributions to our pension plans to fund potential deficit increases would be required to be paid over a period of time ranging from seven to 1511 years depending upon the laws applicable to the funding of the specific pension plan. Any change to laws and regulations applicable to the funding of our pension plans could also increase or decrease our future funding obligations. Similarly, because we make our Quebec and Ontario pension plan contributions in Canadian dollars, the amount of our contributions as stated in U.S. dollars can be subject to the potentially significant effect of foreign currency exchange rate variations. Any such variations could materially affect our cash flows and financial condition, in each case either positively or negatively depending on the direction and magnitude of the variation. In addition, an increase in our net pension obligations could make it more difficult to obtain financing on favorable terms.
It is also possible that regulators, including Canadian provincial pension regulators, could attempt to compel additional funding of certain of our pension plans, including our Canadian registered pension plans, in respect of plan members associated with sites we formerly operated in their respective provinces.operated. On June 12, 2012, we filed a motion for directives with the Quebec Superior Court, the court with jurisdiction in the creditor protection proceedings under the Companies’ Creditors Arrangement Act (Canada) (or, the “CCAA Creditor Protection Proceedings”), seeking an order to prevent pension regulators in each of Quebec, New Brunswick, and Newfoundland and Labrador from declaring partial wind-ups of pension plans relating to employees of former operations in
New Brunswick, and Newfoundland and Labrador, or a declaration that any claim for accelerated reimbursements of deficits arising from a partial wind-up is a barred claim under the CCAA Creditor Protection Proceedings. A partial wind-up would likely shorten the period
in which any deficit within those plans, which could reach up to Cdn $150C$150 million ($110 million, based on the exchange rate in effect on December 31, 2018)118 million), would have to be funded if we do not obtain the relief sought. At this time, we cannot estimate the additional contributions, if any, that may be required in future years, but they could be material.
Our operations require substantial capital and we may be unable to maintain adequate capital resources to provide for all of our capital requirements.
Our businesses are capital intensive and require regular capital expenditures in order to maintain our equipment, increase our operating efficiency, and comply with environmental laws.laws, and innovate to remain competitive. If our available cash resources and cash generated from operations are not sufficient to fund our operating needs, make pension contributions, and finance our working capital, capital expenditures, and duty cash deposits, we would either need to borrow or reduce or delay capital expenditures. If we cannot maintain or upgrade our equipment as required, we may become unable to manufacture products that compete effectively. An inability to make required capital expenditures in a timely fashion could also have a material adverse effect on our growth, business, financial condition, or results of operations.
The terms of our ABL Credit Facility, our Senior Secured Credit Facility, and the indenture governing our 20232026 Notes and our Loan Facility could restrict our current and future operations.operations, and changes relating to LIBOR could impact our borrowings under some of these facilities.
The credit agreements governing our senior secured asset-based revolving credit facility (or, the “ABL Credit Facility”), our senior secured credit facility (or, the “Senior Secured Credit Facility”), and the indenture governing our 5.875%4.875% senior notes due 20232026 (or, the “20232026 Notes”), and our Loan Facility contain certain restrictive covenants that impose operating, borrowing, and financial restrictions on us and could limit our ability to engage in activities that might be in our long-term best interests. For a description of our ABL Credit Facility, Senior Secured Credit Facility, and the indenture governing the 20232026 Notes and the Loan Facility, including the covenants and restrictions they contain, see Note 11,15, “Long-Term Debt,” to our Consolidated Financial Statements.
A breach of the covenants under the ABL Credit Facility, the Senior Secured Credit Facility, the 2026 Notes or under the indenture governing the 2023 NotesLoan Facility could result in an event of default, which could allow holders and lenders, as the case may be, to accelerate the repayment of their debt and could result in the acceleration of the repayment of any other debt to which a cross-acceleration or cross-default provision applies. An event of default under the ABL Credit Facility, or the Senior Secured Credit Facility or the Loan Facility would also allow the lenders to terminate all commitments to extend further credit to us under those facilities. If we were unable to repay amounts due and payable under the ABL Credit Facility, or the Senior Secured Credit Facility or the Loan Facility, the lenders would have the right to proceed against the collateral securing the indebtedness. In any of these events, we may seek to refinance our indebtedness, but be unable to do so on commercially reasonable terms. As a result, we could be: limited in how we conduct our business; unable to raise additional debt or equity financing to operate during general economic or business downturns; or unable to compete effectively or to take advantage of new business opportunities.opportunities; or forced to sell assets.
In addition, our borrowings under the ABL Credit Facility and the Senior Secured Credit Facility bear interest at variable rates, primarily based on LIBOR as the reference. LIBOR is subject to national and international proposals for reform that may cause LIBOR to cease to exist after 2021 or to perform differently than in the past. While we expect that reasonable alternatives to LIBOR will be available, we cannot predict the consequences and timing of the development of alternative reference rates, and the transition to an alternative reference rate could result in an increase in our interest expense.
We may be subject to losses that might not be covered in whole or in part by our insurance coverage.
We maintain property, business interruption, credit, product, general liability, casualty, and other types of insurance, including pollution and legalenvironmental liability, that we believe are in accordance with customary industry practices, but we are not fully insured against all potential hazards inherent in our business, including losses resulting from human error, cybersecurity issues, natural disasters, war risks, or terrorist acts. As is typical in the industry, we also do not maintain insurance for any loss to our access to standing timber from natural disasters, regulatory changes, or other causes. Changes in insurance market conditions have caused, and may in the future cause, premiums and deductibles for certain insurance policies to increase substantially and in some instances, for certain insurance to become unavailable or available only for reduced amounts of coverage. If we were to incur a significant liability for which we were not fully insured, we might not be able to finance the amount of the uninsured liability on terms acceptable to us or at all, and might be obligated to divert a significant portion, or all, of our cash flow from normal business operations.
We could be required to recordcurtail production, shut down machines or facilities, restructure operations, or sell non-core assets, which could result in recording significant additional closure costs and long-lived asset impairment or accelerated depreciation charges.
We have respondedAs part of our transformation strategy, and in response to the changing market dynamics by optimizing assets and streamlining our production. Ifstructurally declining demand for anysome of our products, continues to decline, or if the pace of decline accelerates, it may be necessary to further curtail production, even further, or permanently shut down more machines and facilities.facilities, restructure operations, or sell non-core assets. In addition to the potential loss of production, curtailments and shutdowns could result in asset or goodwill impairments, accelerated depreciation, and cash closure costs for the affected facilities, including restructuring charges, and exit or disposal costs, and remediation and other environmental costs, which could negatively impact our cash flows and materially affect our results of operations and financial condition. The closure of machines or facilities could also trigger the payment of severance, additional pension contributions, or wind-up deficiencies.
Losses related to the impairment of long-lived assets to be held and used are recognized when circumstances, such as continuing losses or demand declines in certain businesses, indicate the carrying value of an asset group may not be recoverable. When indicators that the carrying value of an asset group may not be recoverable are triggered, we evaluate the carrying value of the asset group in relation to its expected undiscounted future cash flows. If the carrying value of an asset group is greater than the expected undiscounted future cash flows to be generated by the asset group, an impairment charge is recognized based on the excess of the asset group’s carrying value over its fair value. If it is determined that the carrying value of an asset group is recoverable, we review and adjust, as necessary, the estimated useful lives of the assets in the group. If there were to be a triggering event, it is possible that we could record significant non-cash long-lived asset impairment or accelerated depreciation charges in future periods, which would be recorded as operating expenses and would negatively impact our results of operations.
We also may be disposing of assets or businesses and be required to recognize additional impairment charges based on the excess of the asset group’s carrying value over the expected net proceeds from the sale, which could materially affect our results of operations and financial condition.
We could be required to record goodwill impairment charges on all or a significant amount of the goodwill on our Consolidated Balance Sheets.
We have goodwill of $31 million recorded in our Consolidated Balance Sheet as of December 31, 2020, all of which arose from our acquisition of the U.S. Sawmill Business. Goodwill represents the excess of the purchase price of an acquisition over the estimated fair values of identifiable tangible and intangible assets of the acquired business. Future acquisitions that we make may also result in significant amounts of additional goodwill. The determination of goodwill involves significant judgment and assumptions including the assessment of the results of the most recent fair value calculations, the identification of macroeconomic conditions, industry and market considerations, cost factors, overall financial performance, specific events affecting us and the business, and making the assessment on whether each relevant factor will impact the impairment test positively or negatively, and the magnitude of any such impact. The carrying value of goodwill is not amortized, and is tested for impairment at the reporting unit’s level annually, or more frequently if events or changes in circumstances indicate a potential impairment loss. In the event that the net carrying amount of the reporting unit exceeds its fair value, an impairment charge is recognized for the amount by which the reporting unit’s carrying amount exceeds its fair value, not to exceed the carrying amount of goodwill in that reporting unit.
We could be required to record additional valuation allowances against our recorded deferred income tax assets.
We recorded significant deferred income tax assets relating to our Canadian operations in our Consolidated Balance Sheet as of December 31, 2018.2020. If, in the future, we determine that we are unable to recognize these deferred income tax assets as a result of sustained cumulative losses in our Canadian operations, we could be required to record additional valuation allowances for the portion of the deferred income tax assets that is not more likely than not to be realized. Such valuation allowances, if taken, would be recorded as a charge to income tax expenseprovision and would adversely impact our results of operations.
Legal and Compliance RiskRisks
Legal and compliance risks arise from governmental and regulatory action, governanceoperations and business conduct, and environmental, contractual and other legal liabilities, including risks associated with: international trade regulation; legal proceedings; our shareholder relationships; commitments to customers;customers, suppliers or other stakeholders; and compliance with securities, governance and other laws and regulations, policies and procedures, such as those relating to financial reporting and disclosure obligations, the environment, forest management, health and safety, marketing, product safety and liability, and privacy and antitrust. Governmental and regulatory risk includes the risk that government or regulator actions will impose additional costs on us or cause us to have to change our operations and business models or practices.
Products we produce in one country and export to another may become subject to duties or other international trade remedies or restrictions.
We produce products in the U.S. and Canada, and we sell those products worldwide. Under international agreements and the domestic trade laws of many countries, trade remedies are available to domestic industries where imports are alleged to be “dumped” or “subsidized” and such imports are alleged to cause material injury, or an imminent threat of injury, to a domestic industry. Under such laws, dumping generally involves selling for export a product at a price lower than that at which the same or similar product is sold in the home market of the exporter, or where the export prices are lower than a value that typically must be at or above the full cost of production (including sales and marketing costs) and a reasonable amount for profit. International trade laws also generally provide that subsidies from governments may be subject to trade remedies under certain circumstances. A trade remedy investigation or proceeding may involve allegations of either dumping, subsidization, or both. Where injurious dumping is found, the trade remedy is typically an anti-dumping duty order. Where injurious subsidization is found, the trade remedy is typically a countervailing duty order. In principle, a duty equal to the amount of dumping or subsidization, as applicable, isshould be imposed on the importer of the product. However, whether or not consistent with treaty obligations or other applicable law, authorities have imposed assumed or estimated rates on products that may not be related to actual dumping by a particular producer or may not be based on subsidies actually received by the producer. Anti-dumping and countervailing duty orders do not prevent the export or import of the product, but rather require the importer of the product to pay to the government an anti-dumping duty or countervailing duty, or a deposit on estimated anti-dumping duties or countervailing duties, as applicable. The imposition of additional anti-dumping duties, countervailing duties, deposit requirements in respect of estimated duties, or any other trade remedy on one or more of our products could materially affect our cash flow, and the competitive position of our operations relating to the affected product.
In addition to risks related to the trade remedies discussed above, a country could impose taxes or tariffs on some or all imported products, whether or not consistent with existing trade treaties or agreements, and trade treaties, agreements and arrangements may be renegotiated or terminated, or one or more countries that are parties may withdraw. For example, the United States-Mexico-Canada Agreement (or “USMCA”), which is expected to replace the North American Free Trade Agreement (or “NAFTA”), and provides for free trade of many products and services among the U.S., Canada, and Mexico, has yet to be ratified by each of the countries through their own domestic process. The USMCA is not expected to materially
impact our business or results of operations. However, should the USMCA not be ratified by the parties, there could be uncertainty as to whether the U.S. may unilaterally withdraw from NAFTA altogether and as to how this would affect the import of any of our Canadian products to the U.S. As we sell a significant portion of our Canadian produced products in the U.S., a unilateral withdrawal from NAFTA by the U.S., without the USMCA in place, or similarSuch actions with respect to other trade treaties, agreements, or arrangements taken by other countriesany country where we sell our products internationally, could materially affect our cash flow, and the competitive position of our operations relating to the affected products.
We are subject to countervailing and anti-dumping dutiesduty orders on substantially allthe vast majority of our U.S. imports of softwood lumber products produced at our Canadian sawmills, which could materially affect our operations and cash flows.
Substantially allThe vast majority of our U.S. imports of softwood lumber products produced at our Canadian sawmills are subject to orders requiring us to pay cash deposits to the U.S. for estimated countervailing and anti-dumping duties. These cash deposit requirements are the result of petitions filed by U.S. softwood lumber products producers and forest landowners with the U.S. Department of Commerce (or, “Commerce”) and the U.S. International Trade Commission.
No such deposits paid to the U.S. will be converted into actual countervailing duties or anti-dumping duties unless and until a countervailing duty or anti-dumping rate is later set by Commerce in an administrative review, which is to be based on Commerce’s determinationall appeals of countervailable subsidies received during, or anti-dumping rates applicable to, a period subsequent to the period reviewedfinal determinations and orders have been exhausted. We requested and participated in the original investigation. We are eligible to request a first and second administrative review 12 months after the date of any Commerce order implementing a duty deposit requirementreviews and could remain subject to annual administrative reviews for five or more years following the initial Commerce order. We may also appeal final determinations and deposits cannot be converted into actual duties during the pendency of an appeal.orders.
We have been required to pay cash deposits for estimated countervailing duties and anti-dumping duties on the vast majority of our U.S. imports of softwood lumber products produced at our Canadian sawmills, since April 28, 2017, and June 30, 2017, respectively. As of December 31, 2018, the rates for such estimated countervailing and anti-dumping duties were 14.7%14.70% and 3.2%3.20%, respectively. Commerce issued its final results in the countervailing duties first administrative review on December 1, 2020 and its final results in the anti-dumping first administrative review on November 30, 2020 and established our new rates at 19.10% for countervailing duties and 1.15% for anti-dumping duties. These rates will apply until Commerce sets new duty rates in subsequent administrative reviews, or new rates may be set through a remand determination by a United States-Mexico-Canada Agreement binational panel (or, “Panel”) on appeal. Through December 31, 2018,2020, our aggregate cash deposits paid to the U.S. for all affected products totaled $103$243 million.
We cannot provide any assurance regarding the estimated or final duty rates that may be determined by Commerce in its investigations orfuture administrative reviews. During any period in which our U.S. imports of softwood lumber products from our Canadian sawmills are subject to countervailing duty or anti-dumping cash deposit requirements or duty requirements, our cash flows and the competitive position of those products and our related Canadian operations could be materially affected.
Any failure to comply with laws and regulations could require us to incur or record additional liabilities and adversely affect our results of operations.
We are subject to a variety of foreign, federal or national, state, provincial, and local laws and regulations dealing with financial reporting and disclosure obligations, corporate governance, antitrust, customs and trade, employees, contractors, transportation, taxes, timber and water rights, pensions, benefit plans, workplace health and safety, the manufacture and sale of consumer products, including product safety and liability, the environment, and First Nations,Indigenous peoples, among others. Many of these laws and regulations are complex and subject to differing interpretation, and the requirements of laws and regulations of different countries and jurisdictions in which we operate, have sales or otherwise do business, or in which our securities trade or in which our security holders reside, may differ or be inconsistent with one another. Compliance with these laws and regulations, including changes to them or their interpretations or enforcement, or introduction of new laws and regulations, has required in the past, and could require in the future, substantial expenditures by us and adversely affect our results of operations. In addition, noncompliance with laws and regulations, especially those related to the environment and First Nations,Indigenous peoples, could significantly damage, and require us to spend substantial amounts of money to rebuild our reputation.
In addition, our ability to comply with these laws and regulations often depends, at least in part, on compliance by independent third parties, such as contractors and agents we retain to provide services. For example, our compliance with customs requirements for international shipments depends in part on compliance by our customs brokers, sureties, transportation companies, and external advisors, in addition to our own employees and consultants, and we could be liable for noncompliance by any of them, even if inadvertent. Failure to comply with laws and regulations can also be the result of unintended consequences, such as unforeseen consequences of information technology modifications, upgrades, or replacements. Although we strive to comply with laws and regulations applicable to us, no company, including us,ours, can assure that it will successfully prevent, detect, or remediate all potential instances of non-compliance, and any failure to do so could be material, require substantial expenditures, and adversely affect our results of operations.
As an owner of real estate and manufacturing and processingindustrial facilities, we could be required to incur or record additional environmental and related health and safety liabilities.
As an owner and operator of real estate and manufacturing and processingindustrial facilities, we are subject in particular, to a wide range of general and industry-specific laws and regulations relating to pollution and the protection of the environment, as well as several requirements stipulated in our facilities’ permits, including those governing air emissions, water usage, wastewater discharges, timber harvesting, the storage, management and disposal of regulated substances and waste, the investigation and clean-up of contaminated sites, landfill and lagoonwastewater treatment system operation and closure, forestryforest management and operations, endangered species and their habitat, health and safety, carbon pricing and climate change. Changes to our operations and costs to comply with these laws and regulations may increase as the requirements of these laws and regulations evolve. Noncompliance with these regulations or permit conditions can result in significant civil, administrative or criminal fines or penalties, or regulatory or judicial orders enjoining or curtailing operations. This may include liability under environmental laws for cleanup, improvement or change of pollution control equipment, and other costs and damages, including investigation costs, tort liability and damages to natural resources, resulting from past or present spills, releases or threats of releases of regulated substances and waste on or from our current or former properties.properties or operations. We may also be liable under health and safety laws for related exposure of employees, contractors and other persons to substances and waste on or from our current or former properties.properties or injuries. We may incur liability under these laws without regard to whether we knew of, were responsible for, or owned the property at the time of, any exposure, spill, release or threats of releases of any regulated substances or waste on or from any current or former property, or at properties where we arranged for the disposal of regulated materials.materials or waste. Claims or liability may also arise out of currently unknown environmental conditions, obligations arising as a result of new or revised rules or regulations (e.g. regulation of perfluoroalkyl or polyfluoroalkyl substances, or “PFAS”) or aggressive enforcement efforts by government regulators, public interest groups or private parties. As a result, we may be required to incur or record additional environmental or related health and safety liabilities.
Our international sales and operations are subject to applicable laws relating to trade, export controls, and foreign corrupt practices, the violation of which could adversely affect our operations.
As a result of our international sales and operations, we are required to comply with trade and economic sanctions and other restrictions imposed by the United States,U.S., Canada, and other governments or organizations. We are also subject to the U.S. Foreign Corrupt Practices Act, the Corruption of Foreign Public Officials Act (Canada), the United Kingdom Bribery Act 2010 and other anti-bribery laws that generally bar bribes or unreasonable gifts to foreign governments or officials and, in some jurisdictions, to other commercial parties. Changes in trade sanctions laws could restrict our business practices, including cessation of business activities in sanctioned countries or with sanctioned entities, and may result in modifications to compliance programs. Violations of these laws or regulations could result in sanctions, including fines, loss of authorizations
needed to conduct our international business, and other penalties, as well as result in a default under certain of our financing agreements, each of which could adversely impact our business, operating results, and financial condition.
We are and may become a party to a number of legal proceedings, claims, and governmental inquiries, investigations, and other disputes, and adverse judgments could have a material adverse effect on our financial condition.
We become involved in various legal proceedings, claims, and governmental inquiries, investigations, and other disputes in the normal course of business. These could include, for example, matters related to contracts, transactions, commercial and trade disputes, taxes, environmental issues, activist damages, employment and workers’ compensation claims, grievances, human rights complaints, pension and benefit plans and obligations, health and safety, product safety and liability, asbestos exposure, intellectual property, financial reporting and disclosure obligations, corporate governance, First NationsIndigenous peoples’ claims, antitrust, governmental regulations, and other matters. In addition to claims against us and our consolidated subsidiaries, these matters may involve claims asserted by others against unconsolidated partnerships and joint ventures in which we have an interest. Although the final outcome of these matters is subject to many variables and cannot be predicted with any degree of certainty, we regularly assess the status of the matters and establish provisions (including legal costs expected to be incurred) when we believe an adverse outcome is probable, and the amount can be reasonably estimated. Legal proceedings that we believe could have a material adverse effect if not resolved in our favor, or that we believe to be significant, are discussed in Item 3 of this Form 10-K and in Note 14,18, “Commitments and Contingencies – Legal Matters”matters” to our Consolidated Financial Statements. However, our reports do not disclose or discuss all matters of which we are aware. If our assessment of the probable outcome or materiality of a matter is not correct, we may not have made adequate provision for such loss and our financial condition, cash flows, or results of operations could be adversely impacted.
In addition, if a loss resulting from an adverse outcome in connection with a matter were to affect the solvency of certain of our subsidiaries or remain unpaid for certain periods, it could result in a default under the ABL Credit Facility, the Senior Secured Credit Facility, or the indenture governing the 2026 Notes and the 2023 Notes.Loan Facility. For additional information, see “Financial RiskRisks – The terms of our ABL Credit Facility, our Senior Secured Credit Facility, and the indenture governing our 20232026 Notes and our Loan Facility could restrict our current and future operations”operations, and changes relating to LIBOR could impact our borrowings under some of these facilities” above.
Some matters that we may be involved in from time to time result from claims brought by us against third parties, including customers, suppliers, shareholders, governments or governmental agencies, activists and others. Even if such a matter does not involve a
claim for damages or other penalty or remedial action against us, such a matter could nevertheless adversely affect our relationships with those and other third parties.
There is a shareholder who owns a substantial percentage of our common stock, and its interests could differ from those of other stockholders, and its actions could affect the price of our common stock.
There is a shareholder who owns a substantial percentage of the outstanding shares of our common stock, and could increase its percentage ownership even further. This shareholder could be in a position to influence the outcome of actions requiring shareholder approval, including, among other things, the election of board members. The concentration of ownership could also facilitate or hinder a negotiated change of control and consequently, impact the value of our common stock. In addition, the possibility that this shareholder may sell all or a large portion of our common stock in a short period of time may adversely affect the trading price of our common stock.
ITEM 1B. UNRESOLVED STAFF COMMENTS
None.
ITEM 2. PROPERTIES
Information regarding our owned properties is included in Item 1, “Business.”
In addition to the properties that we own, we also lease under long-term leases office and manufacturing premises, andmachinery, chemical equipment, office equipment, and rail cars, have water rights on certain government-owned waters, and have harvesting rights or timber supply guarantees with respect to certain government-owned land. For additional information, see Note 17,12, “Operating LeasesLeases” and Purchase Obligations,Note 18, “Commitments and Contingencies – Commitments,” to our Consolidated Financial Statements.
We hold the properties that we own or lease, and the rights and supply guarantees described above, through various operating subsidiaries, including our principal U.S. operating subsidiary, Resolute FP US Inc., and our principal Canadian operating subsidiary, Resolute FP Canada Inc., and Resolute Growth Canada Inc., which holds or operates assets related to our growth and diversification initiatives in Canada, including our Ontario sawmills and wood pellet facility, as well as our Saint-Félicien pulp mill. For a list of our subsidiaries as of December 31, 2020, see Exhibit 21.1, “Subsidiaries of the registrant,” of this Form 10-K.
The obligations under the Senior Secured Credit Facility are secured by a first priority mortgage on the real property of our Calhoun facility and a first priority security interest on the fixtures and equipment located therein,therein. On November 13, 2019, a legal hypothec in the amount of C$30 million ($24 million) was registered on our Saint-Félicien immovable and related assets.movable property, for more information see Note 18, “Commitments and Contingencies – Legal matters – Fibrek acquisition,” to our Consolidated Financial Statements.
ITEM 3. LEGAL PROCEEDINGS
In addition to the proceedings described below, seeSee the description of our material pending legal proceedings in Note 14,18, “Commitments and Contingencies – Legal matters,” to our Consolidated Financial Statements, which is incorporated in this “Item 3 – Legal Proceedings” by reference.
Resolute has been informed that the investigation of Resolute by the Autorité des marchés financiers, the securities regulatory authority in the Province of Quebec, has been closed. The investigation concerned the possibility of non-compliance with applicable securities laws and regulations relating to takeover bids and the possibility of illegal insider trading and/or tipping (not involving any personal trading by individuals) in connection with Resolute’s December 15, 2011 offer to purchase the shares of Fibrek Inc.
ITEM 4. MINE SAFETY DISCLOSURES
Not applicable.
PART II
| |
ITEM 5. | MARKET FOR REGISTRANT’S COMMON EQUITY, RELATED STOCKHOLDER MATTERS AND ISSUER PURCHASES OF EQUITY SECURITIES |
ITEM 5. MARKET FOR REGISTRANT’S COMMON EQUITY, RELATED STOCKHOLDER MATTERS AND ISSUER PURCHASES OF EQUITY SECURITIES
Our common stock trades under the stock symbol “RFP” on both the NYSE and the TSX. As of January 31, 2019,29, 2021, there were 2,9872,377 holders of record of our common stock.
We declared and paid a special dividend of $1.50 per share ($136 million) on our common stock in 2018. We did not declare or pay any dividends on our common stock in 2017.2020 or 2019. Any future determination to pay dividends will be at the discretion of the board of directors and will be dependent on then-existing conditions, including our financial condition, results of operations, capital requirements, contractual and legal restrictions, business prospects and other factors that the board of directors considers relevant. Our debt agreements contain restrictions on our ability to pay dividends and repurchase shares, as further described in Item 7, “Management’s Discussion and AnalysisNote 15, “Long-Term Debt,” to our Consolidated Financial Statements.
On March 2, 2020, our board of Financial Condition and Resultsdirectors authorized a share repurchase program of Operations – Liquidity and Capital Resources – Capital Resources,”up to 15% of our common stock, for an aggregate consideration of up to $100 million. In 2020, we repurchased 6.9 million shares at a cost of $30 million under this Form 10-K.
There remainsprogram. In 2019, we repurchased 4.8 million shares at a cost of $24 million, undercompleting our $150 million share repurchase program which was launched in May of 2012. We did not
The following table sets forth information about our stock repurchases for the three months ended December 31, 2020:
| | | | | | | | | | | | | | | | | | | | | | | | | | | | | | | | | | | | | | |
| Period | Total Number of Shares Purchased | Average Price Paid per Share | Total Number of Shares Purchased as Part of Publicly Announced Plans or Programs | Approximate Dollar Value of Shares That May Yet Be Purchased Under the Plans or Programs (1) |
| October 1 to October 31 | | 1,066,988 | | | $ | 4.71 | | | | 1,066,988 | | | $ | 75,866,143 | | |
| November 1 to November 30 | | 877,799 | | | $ | 4.92 | | | | 877,799 | | | $ | 71,546,792 | | |
| December 1 to December 31 | | 191,029 | | | $ | 5.69 | | | | 191,029 | | | $ | 70,460,359 | | |
| Total | | 2,135,816 | | | $ | 4.88 | | | | 2,135,816 | | | $ | 70,460,359 | | |
(1)$100 million share repurchase any sharesprogram launched in 2018 or 2017.2020.
See Part III, Item 12 of this Form 10-K, “Security Ownership of Certain Beneficial Owners and Management and Related Stockholder Matters,” for information regarding our equity compensation plan.
The following graph compares the cumulative total return attained by shareholders of our common stock versus the cumulative total returns of the Standard & Poor’s 500 (or, the “S&P 500”) index and the Peer Group (as defined below), and the Prior Peer Group (as defined below) since December 31, 2013.2015. The graph tracks the performance of a $100 investment in our common stock, in the S&P 500 index, in the Peer Group, and in the Prior Peer Group on December 31, 20132015 (with the reinvestment of all dividends) to December 31, 2018.2020. The stock price performance included in the graph is not necessarily indicative of future stock price performance.
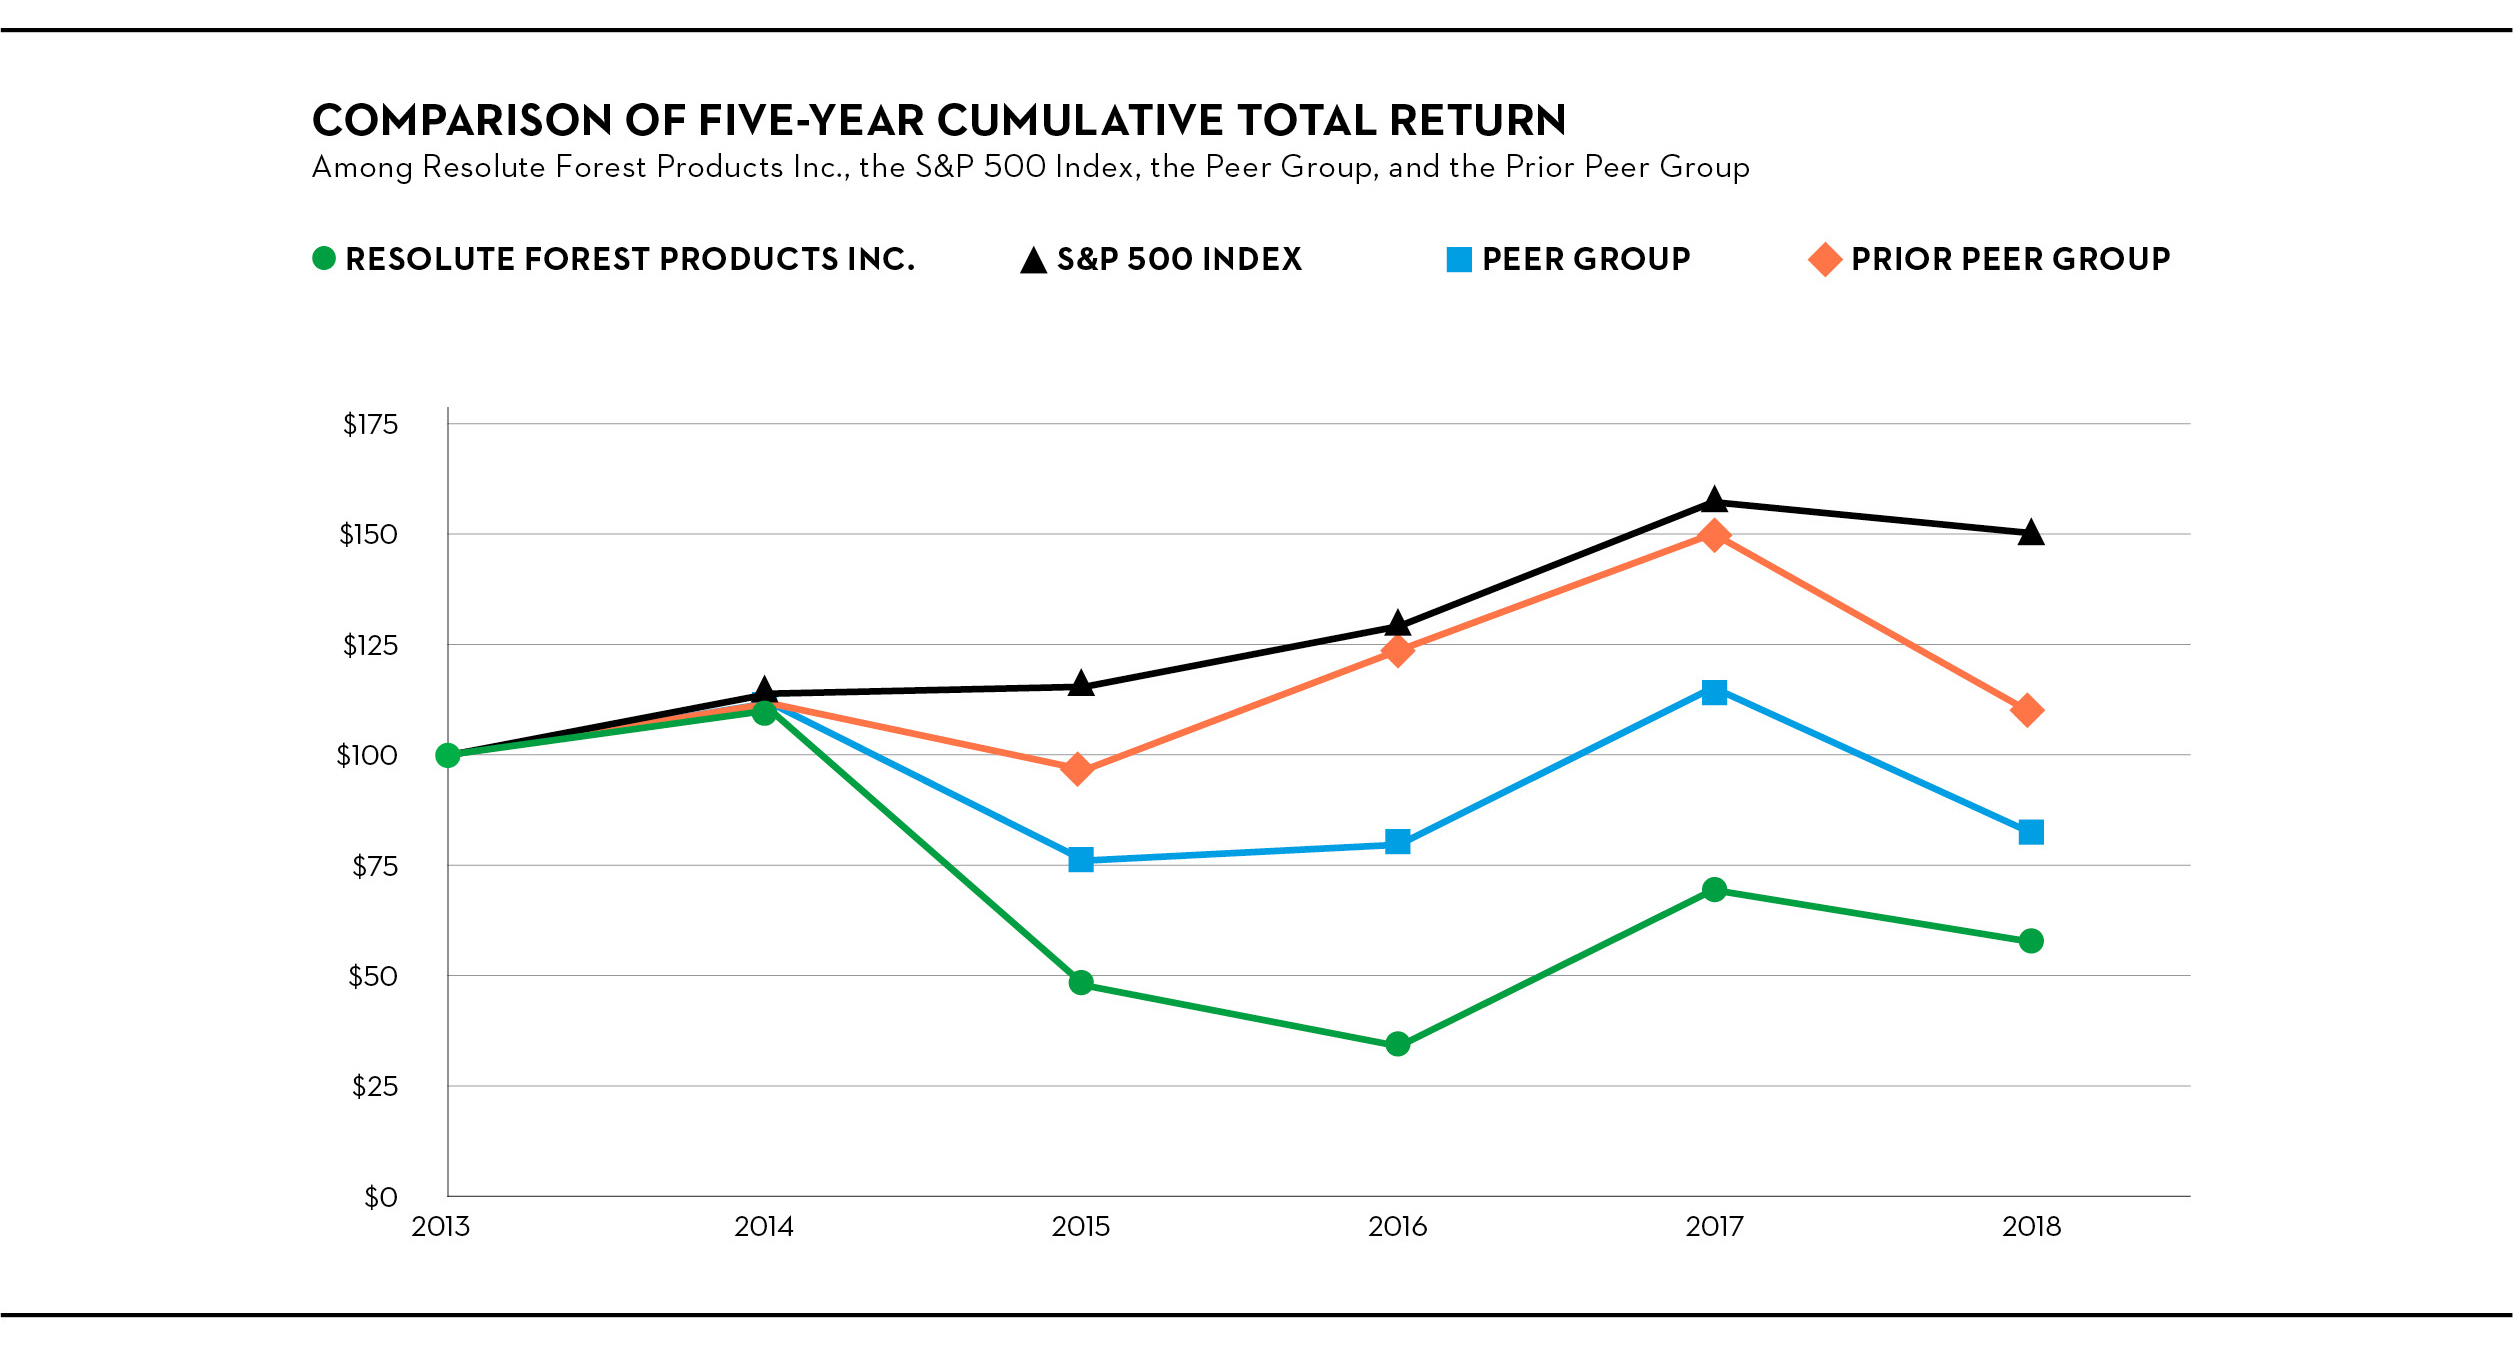
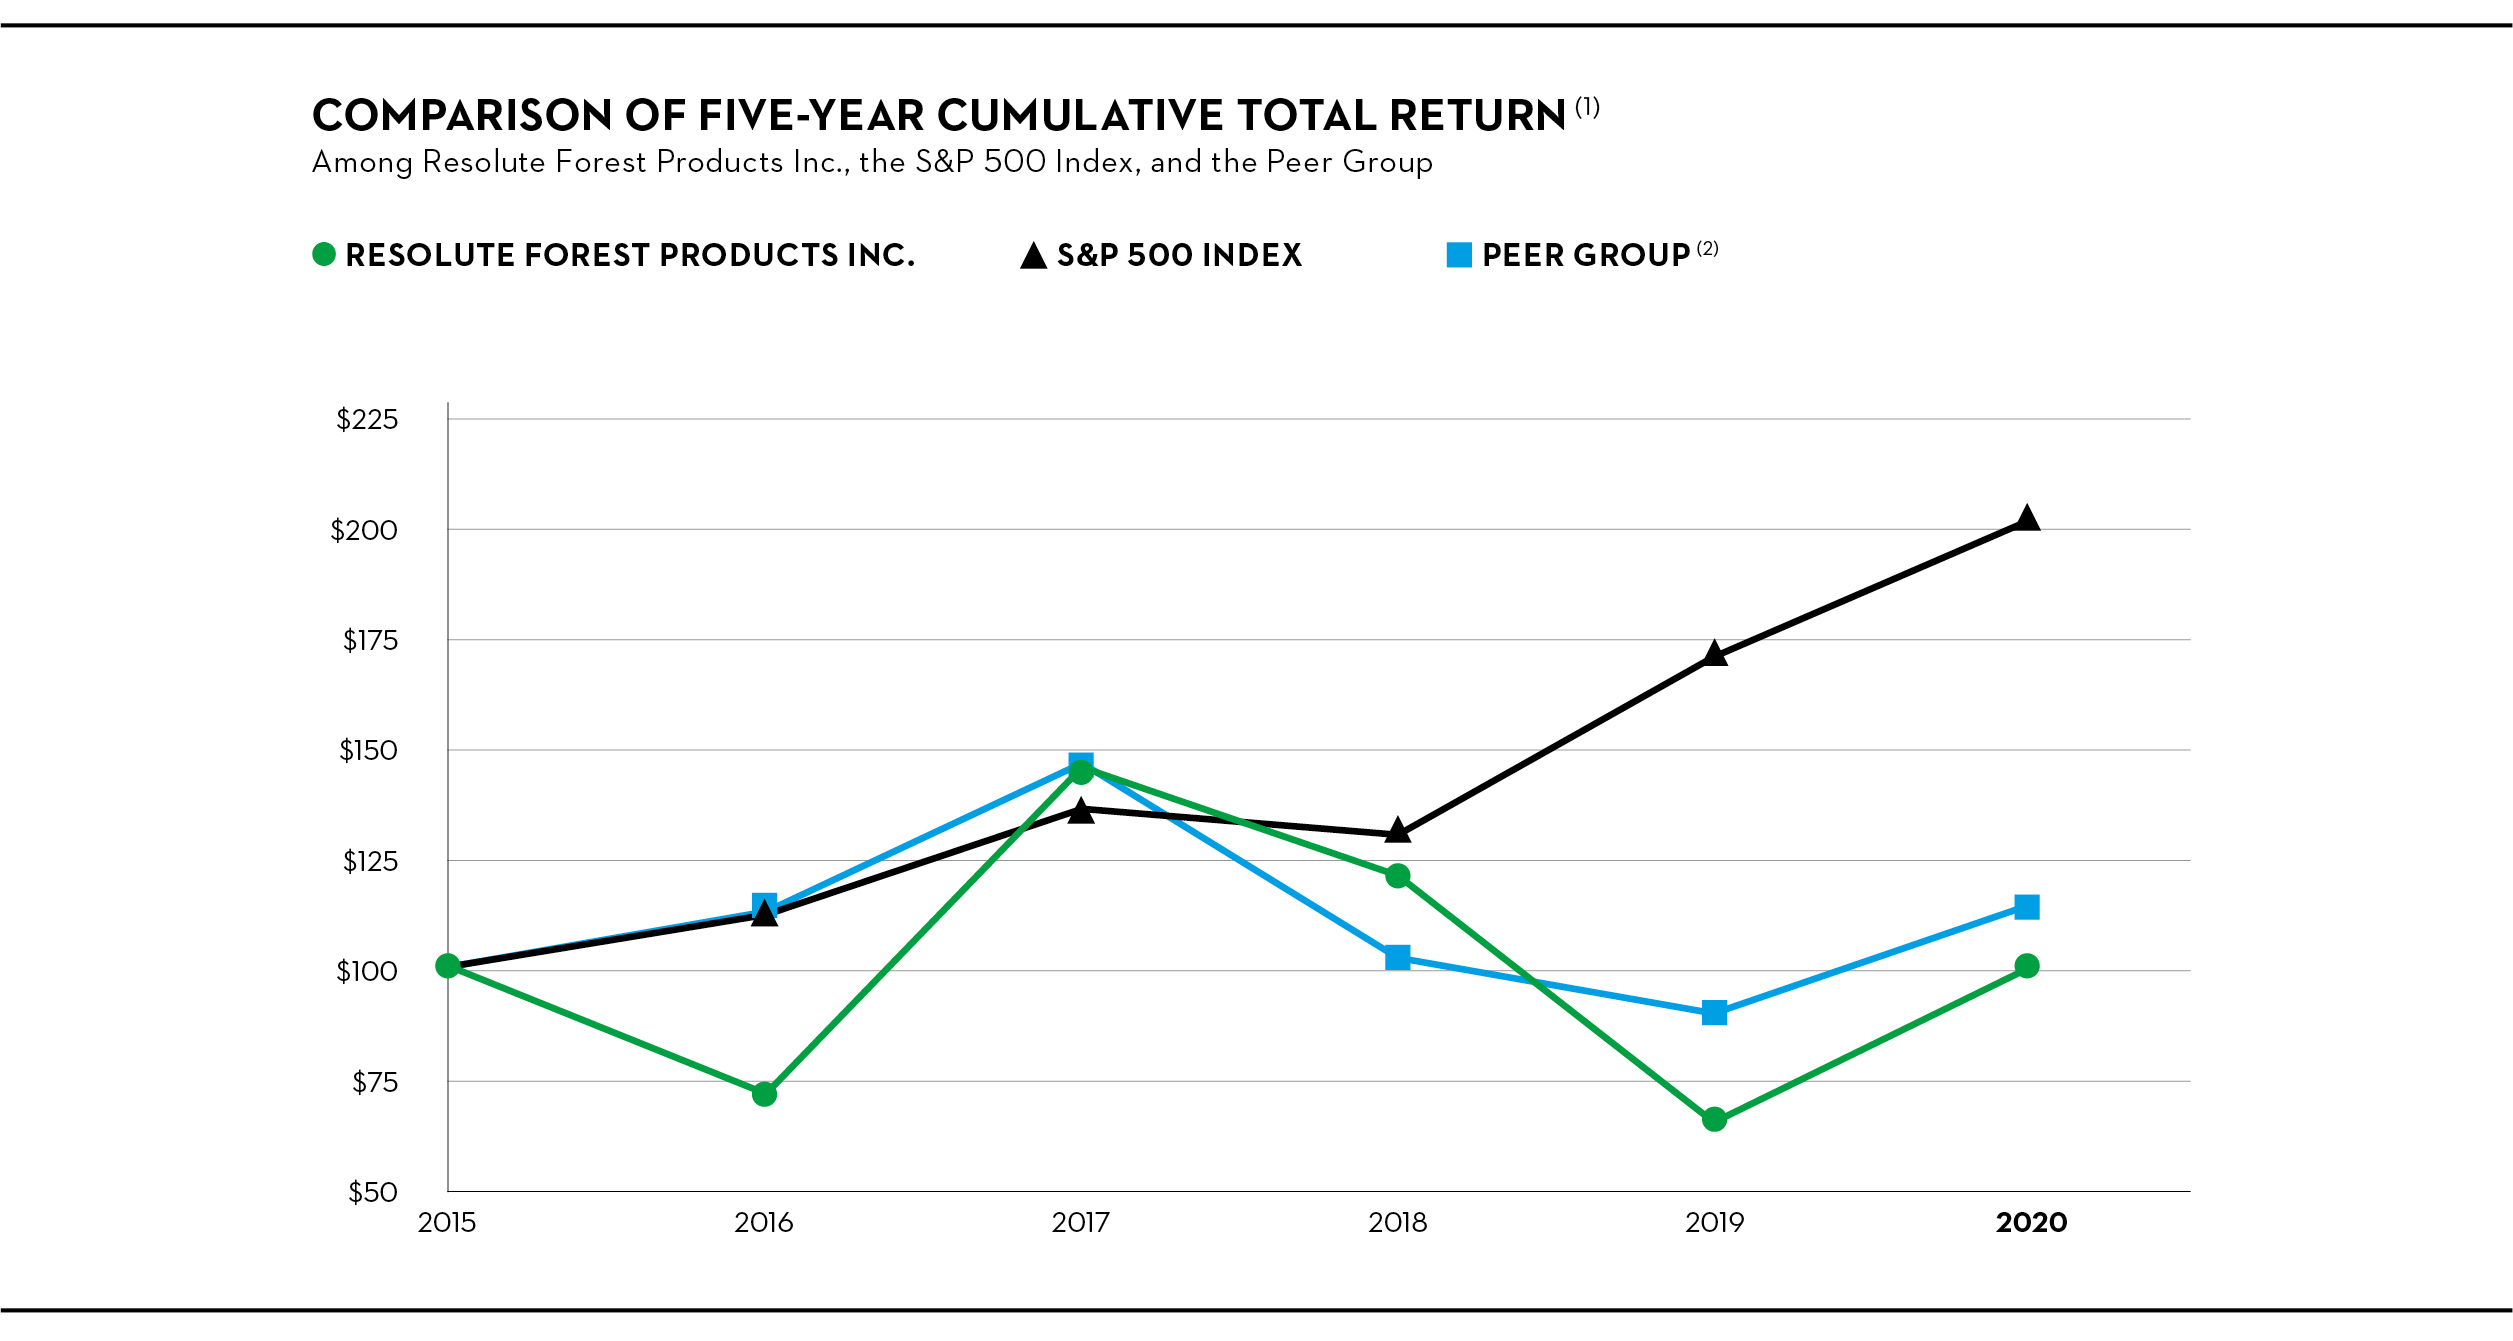
| |
(1)(1)The information contained in this stock performance graph shall not be deemed to be “soliciting material” or “filed” or incorporated by reference in future filings with the SEC, or subject to the liabilities of Section 18 of the Securities Exchange Act of 1934, as amended (or, the “Exchange Act”), except to the extent that we specifically incorporate it by reference into a document filed under the Securities Act of 1933, as amended, or the Exchange Act. (2)The group of individual peer companies comprising the peer group (or, the “Peer Group”) are: Clearwater Paper Corporation, Domtar Corporation, Verso Corporation, Mercer International Incorporated, Rayonier Advanced Materials, Canfor Corporation, Interfor Corporation, Western Forest Products Inc and West Fraser Timber Company Limited. Conifex Timber Incorporated is no longer considered in the Peer Group.
| In 2018, the Human Resources and Compensation/Nominating and Governance Committee of our Board of Directors established performance metrics related to our performance stock units including total shareholder return relative to a group of peer companies (or the “Peer Group”), which is comprised of Clearwater Paper Corporation, Domtar Corporation, Verso Corporation, Mercer International Incorporated, Rayonier Advanced Materials, Orchids Paper Products Company, Canfor Corporation, Conifex Timber Incorporated, Interfor Corporation, and West Fraser Timber Company Limited. The Peer Group replaces the index of five companies used previously (or the “Prior Peer Group”).
|
| |
(2)
| The Prior Peer Group is comprised of Domtar Corporation, International Paper Company, UPM-Kymmene Corporation, Verso Corporation and Weyerhaeuser Company. |
ITEM 6. SELECTED FINANCIAL DATA
The following table presents a summary of historical consolidated financial information for each of the last five years and should be read in conjunction with Items 7 and 8 of this Form 10-K. The selected financial information for the years ended December 31, 2018, 20172020, 2019 and 2016,2018, and as of December 31, 20182020 and 2017,2019, under the captions “Statement of Operations Data,” “Segment Sales Information,” “Statement of Cash Flows Data” and “Financial Position” shown below has been derived from our audited Consolidated Financial Statements.
As a result | | | | | | | | | | | | | | | | | | | | | | | | | | | | | | | | | | | | | | | | | | | | | | | |
| Years Ended December 31, |
| (In millions, except per share amounts) | | 2020 | | | 2019 | | | 2018 | | | 2017 | | | 2016 | |
| Statement of Operations Data | | | | | | | | | | | | | | | |
| Sales | | $ | 2,800 | | | | $ | 2,923 | | | | $ | 3,756 | | | | $ | 3,513 | | | | $ | 3,545 | | |
| Operating income (loss) | | $ | 99 | | | | $ | 17 | | | | $ | 379 | | | | $ | 42 | | | | $ | (18) | | |
| Net income (loss) including noncontrolling interests | | $ | 10 | | | | $ | (47) | | | | $ | 235 | | | | $ | (78) | | | | $ | (76) | | |
| Net income (loss) attributable to Resolute Forest Products Inc. | | $ | 10 | | | | $ | (47) | | | | $ | 235 | | | | $ | (84) | | | | $ | (81) | | |
| Basic net income (loss) per share attributable to Resolute Forest Products Inc. common shareholders | | $ | 0.12 | | | | $ | (0.51) | | | | $ | 2.57 | | | | $ | (0.93) | | | | $ | (0.90) | | |
| Diluted net income (loss) per share attributable to Resolute Forest Products Inc. common shareholders | | $ | 0.12 | | | | $ | (0.51) | | | | $ | 2.52 | | | | $ | (0.93) | | | | $ | (0.90) | | |
| Dividend declared per common share | | $ | — | | | | $ | — | | | | $ | 1.50 | | | | $ | — | | | | $ | — | | |
| Segment Sales Information | | | | | | | | | | | | | | | |
| Market pulp | | $ | 668 | | | | $ | 797 | | | | $ | 1,085 | | | | $ | 911 | | | | $ | 836 | | |
| Tissue | | 173 | | | | 165 | | | | 130 | | | | 81 | | | | 89 | | |
| Wood products | | 1,025 | | | | 616 | | | | 823 | | | | 797 | | | | 596 | | |
| Paper | | 934 | | | | 1,345 | | | | 1,718 | | | | 1,724 | | | | 2,024 | | |
| | | | | | | | | | | | | | | |
| | | $ | 2,800 | | | | $ | 2,923 | | | | $ | 3,756 | | | | $ | 3,513 | | | | $ | 3,545 | | |
| Statement of Cash Flows Data | | | | | | | | | | | | | | | |
| Net cash provided by operating activities | | $ | 334 | | | | $ | 85 | | | | $ | 435 | | | | $ | 158 | | | | $ | 81 | | |
| Cash invested in fixed assets | | $ | 78 | | | | $ | 113 | | | | $ | 155 | | | | $ | 164 | | | | $ | 249 | | |
| Disposition of assets | | $ | 14 | | | | $ | 3 | | | | $ | 336 | | | | $ | 21 | | | | $ | 5 | | |
| | | | | | | | | | | | | | | | | | | | | | | | | | | | | | | | | | | | | | | | | | | | | | | |
| As of December 31, |
| (In millions, except otherwise indicated) | | 2020 | | | 2019 | | | 2018 | | | 2017 | | | 2016 | |
| Financial Position | | | | | | | | | | | | | | | |
| Fixed assets, net | | $ | 1,441 | | | | $ | 1,459 | | | | $ | 1,515 | | | | $ | 1,716 | | | | $ | 1,842 | | |
| Total assets | | $ | 3,730 | | | | $ | 3,626 | | | | $ | 3,935 | | | | $ | 4,147 | | | | $ | 4,227 | | |
| Total debt | | $ | 561 | | | | $ | 449 | | | | $ | 645 | | | | $ | 789 | | | | $ | 762 | | |
| Additional Information | | | | | | | | | | | | | | | |
| Number of employees | | 7,100 | | | | 6,700 | | | | 7,400 | | | | 7,700 | | | | 8,300 | | |
|
| | | | | | | | | | | | | | | | | | | | | | | | | |
| | Years Ended December 31, |
| (In millions, except per share amounts) | | 2018 |
| | | 2017 |
| | | 2016 |
| | | 2015 |
| | | 2014 |
| |
| Statement of Operations Data | | | | | | | | | | | | | | | |
| Sales | | $ | 3,756 |
| | | $ | 3,513 |
| | | $ | 3,545 |
| | | $ | 3,645 |
| | | $ | 4,258 |
| |
| Operating income (loss) | | 379 |
| | | 42 |
| | | (18 | ) | | | (169 | ) | | | (193 | ) | |
| Net income (loss) including noncontrolling interests | | 235 |
| | | (78 | ) | | | (76 | ) | | | (255 | ) | | | (274 | ) | |
| Net income (loss) attributable to Resolute Forest Products Inc. | | 235 |
| | | (84 | ) | | | (81 | ) | | | (257 | ) | | | (277 | ) | |
| Basic net income (loss) per share attributable to Resolute Forest Products Inc. common shareholders | | 2.57 |
| | | (0.93 | ) | | | (0.90 | ) | | | (2.78 | ) | | | (2.93 | ) | |
| Diluted net income (loss) per share attributable to Resolute Forest Products Inc. common shareholders | | 2.52 |
| | | (0.93 | ) | | | (0.90 | ) | | | (2.78 | ) | | | (2.93 | ) | |
| Dividend declared per common share | | 1.50 |
| | | — |
| | | — |
| | | — |
| | | — |
| |
| Segment Sales Information | | | | | | | | | | | | | | | |
| Market pulp | | $ | 1,085 |
| | | $ | 911 |
| | | $ | 836 |
| | | $ | 889 |
| | | $ | 974 |
| |
| Tissue | | 130 |
| | | 81 |
| | | 89 |
| | | 11 |
| | | — |
| |
| Wood products | | 823 |
| | | 797 |
| | | 596 |
| | | 536 |
| | | 610 |
| |
| Newsprint | | 907 |
| | | 842 |
| | | 1,009 |
| | | 1,105 |
| | | 1,402 |
| |
| Specialty papers | | 811 |
| | | 882 |
| | | 1,015 |
| | | 1,104 |
| | | 1,272 |
| |
| | | $ | 3,756 |
| | | $ | 3,513 |
| | | $ | 3,545 |
| | | $ | 3,645 |
| | | $ | 4,258 |
| |
| Statement of Cash Flows Data | | | | | | | | | | | | | | | |
| Net cash provided by operating activities | | $ | 435 |
| | | $ | 158 |
| | | $ | 81 |
| | | $ | 138 |
| | | $ | 186 |
| |
| Cash invested in fixed assets | | 155 |
| | | 164 |
| | | 249 |
| | | 185 |
| | | 193 |
| |
| Disposition of assets | | 336 |
| | | 21 |
| | | 5 |
| | | — |
| | | 10 |
| |
|
| | | | | | | | | | | | | | | | | | | | | | | | | |
| | As of December 31, |
| (In millions, except otherwise indicated) | | 2018 |
| | | 2017 |
| | | 2016 |
| | | 2015 |
| | | 2014 |
| |
| Financial Position | | | | | | | | | | | | | | | |
| Fixed assets, net | | $ | 1,515 |
| | | $ | 1,716 |
| | | $ | 1,842 |
| | | $ | 1,810 |
| | | $ | 1,985 |
| |
| Total assets | | 3,935 |
| | | 4,147 |
| | | 4,227 |
| | | 4,220 |
| | | 4,914 |
| |
| Total debt | | 645 |
| | | 789 |
| | | 762 |
| | | 591 |
| | | 590 |
| |
| Additional Information | | | | | | | | | | | | | | | |
| Number of employees | | 7,400 |
| | | 7,700 |
| | | 8,300 |
| | | 8,000 |
| | | 7,700 |
| |
ITEM 7. MANAGEMENT’S DISCUSSION AND ANALYSIS OF FINANCIAL CONDITION AND RESULTS OF OPERATIONS
The following management’s discussion and analysis is intended to help the reader understand Resolute Forest Products, our results of operations, cash flows and financial condition. The discussion is provided as a supplement to, and should be read in conjunction with, our consolidated financial statements and the accompanying notes (or, the “Consolidated Financial Statements”) contained in Item 8, “Financial Statements and Supplementary Data” of this Annual Report on Form 10-K (or, “Form 10-K”).
When we refer to “Resolute Forest Products,” “Resolute,” “we,” “our,” “us,” or the “Company,” we mean Resolute Forest Products Inc. with its subsidiaries, either individually or collectively, unless otherwise indicated.
OVERVIEW
Resolute Forest Products is a global leader in the forest products industry with a diverse range of products, including market pulp, tissue, wood products, newsprint and specialty papers,paper, which are marketed in close to 70over 50 countries. The Company owns or operates some 40 facilities, as well as power generation assets, in the U.S. and Canada. We produce lumber in the U.S. and Canada, and we are the largest Canadian producer of wood products east of the Canadian Rockies, and a competitive pulp producer in North America. By capacity, we are the number one producer of newsprint in the world and the largest producer of uncoated mechanical papers in North America, and a competitive pulp producer in North America. We are also a leading global producer of newsprint and an emerging tissue producer. Resolute has third-party certified 100% of its managed woodlands to internationally recognized sustainable forest management standards.
We report our activities in fivefour business segments: market pulp, tissue, wood products, newsprint, and specialty papers.paper. We believe an integrated approach across these segments maximizes value creation for our Company and stakeholders.
We are guided by our vision and values, focusing on safety, sustainability, profitability, accountability, and teamwork. We believe we can be distinguished by the following competitive strengths:
•Competitive cost structure combined with diversified and integrated asset base
–large-scale efficient and cost-effective operations;
access to renewable virgin fiber;
operations, including significant internal energy production from cogeneration and hydroelectric facilities;facilities, which support our value proposition;
raw materials–control over fiber transformation chain from standing timber to end-product for the majority of our paper, pulpoffering;
–nearly 100% of our products sourced from high-quality virgin fiber;
–harvesting rights for the majority of fiber needs in Canada; and cogeneration facilities in Canada,
–sophisticated logistics capabilities to meet demanding customer expectations.
•Solid balance sheet
–favorable pricing and flexibility under borrowing agreements together with our pellet plant at Thunder Bay (Ontario), as well as our value-added and engineered wood facilities in Quebec provided primarily by our sawmills;
strategically located mills, including economical access to international markets;
competitive selling, general and administrative expenses (or “SG&A”) to sales ratio;
liquidity levels support ability to optimize staffing acrossweather challenging market cycles and to execute our various operations; andtransformation strategy;
–significant tax assets that helpto defer cash income taxes and provide synergies in the execution of our growth and diversification strategy.
Strong balance sheet
Our low debt, which has favorable pricing and flexibility, combined with strong liquidity levels, provide us with the ability to execute our strategy, particularly the continued transformation tothis strategy; and
–customers benefit from a more profitablefinancially stable and sustainable company for the long term.reliable business partner in a challenging industry.
•Seasoned management team
Our senior–deep industry expertise, with influential leaders in forestry, operations, environmental risk management team has many yearsand public policy;
–culture of experienceaccountability, encouraging transparency and straightforwardness; and
–core identity tied to renewable resources we harvest in the pulp, tissue, wood products, and paper industries. In addition, we have an integrated leadership system focused on increasing our organizational capability by optimizing organizational structure, clarifying each employee’s role and accountabilities, improving the link between compensation and individual performance, and improving our succession planning process.a truly sustainable manner.
Our Business
Products
For additional information on our products, see Part I, Item 1, “Business – Products” of this Form 10-K.
Strategy and highlights
Our corporate strategy is focused on continuing to transform the Company intoaway from mature product markets and products in structurally declining markets toward a more profitable and sustainable organization over the long run, one that we believe can generate consistent value for shareholders throughfounded on a competitive portfolio of manufacturing assets and a solid presence in long-term growth markets. This includes, on the one hand, keeping pace with structurally declining paper demand and, on the other, using our strong financial position to act on opportunities to diversify and grow. Our strategy is based on maximizingto drive value generation from paper,creation by growing in pulp and wood products, integrating our pulp into value-added quality tissue, and investing in product innovation, and maximizing cash generation from our paper assets, while maintaining a disciplined approach to capital allocation.
Maximizing value generation from paper
Our paper products (comprised of newsprint and specialty papers) remain an important part of our ongoing business, generating cash to help finance our strategy to diversify and grow. In order to remain competitive in the demand-challenged markets that our paper operations face, we strive to consistently:
maintain a stringent focus on controlling costs and optimizing our diversified asset base;
manage production and inventory levels; and
focus production at our most profitable and lower-cost facilities and machines.
Growing in pulp and wood products
WeMarket pulp and wood products are core segments for the Company, and we believe in takingtheir long-term, sustained growth potential. We are confident in our ability to generate attractive returns for shareholders as operators of these assets. Our strategy is to take an opportunistic approach to these strategic initiatives, pursuing only those that reduce our cost position, improve our product diversification, provide synergies, or position us to expand into markets that benefit from long-term growth. We believe that our market pulp and wood products segments are aligned with these criteria, and are the foundation of our transformation strategy. Opportunities to diversify and grow may arise in a number of ways, including:such as:
•spending to improve productivity and/or lower costs;
•investing selectively in organic expansions; and
•pursuing opportunistic strategic acquisitions.
For example, in 2020, we acquired three sawmills in the U.S. South, with combined production capacity of 550 million board feet once ramped-up, giving us immediate scale in an attractive region and providing an opportunity to create value by maintaining appropriate working capital and by deploying our operational expertise in sawmilling, with a focus on reliability, productivity and safety.
Integrating our pulp into value-added quality tissue
Consistent with our overall business transformation strategy, weWe entered the tissue market in 2015 with the announcementconstruction of our plans to build a greenfield tissue facility at our Calhoun (Tennessee) site and the acquisition of two tissue mills and a recovered paper facility in Florida. The purpose of our diversification into tissue is to acquire Atlas Paper Holdings Inc. and its subsidiaries (or “Atlas”). These significant steps supported our belief in addingadd value throughwith the integration of our market pulp, particularly as paperprinting and writing demand for pulp continues its steadyto decline. In addition, weWe also believe that the tissue business will provide a more stable source of revenue and profitability.
Our tissue operations are almost entirely supplied from our pulp mills, creating synergies and minimizing risks associated with cyclical market pulp pricing. For our Calhoun tissue facility, pulp production is transferred directly transferred as slush pulp into the tissue operation, reducing process, energy, handling and logistics costs.
Equipped with three modern converting lines sized specifically for the tissue machine, our Calhoun tissue facility mostly sells converted products that target the fast growing premium private-label markets ofin the U.S.
Since 2011,In December 2020, we have completed the acquisition of a number of strategic initiatives, leading to a relative shifttissue converting facility located in our business away from our structurally-challenged paper operations into marketsHagerstown, Maryland, with long-term growth potential (comprised of market pulp,three bath tissue and wood products), as illustrated below.towel converting lines. The Hagerstown assets will improve converting capacity, extend the Company's product offering and expand its territory in the attractive Northeast market.
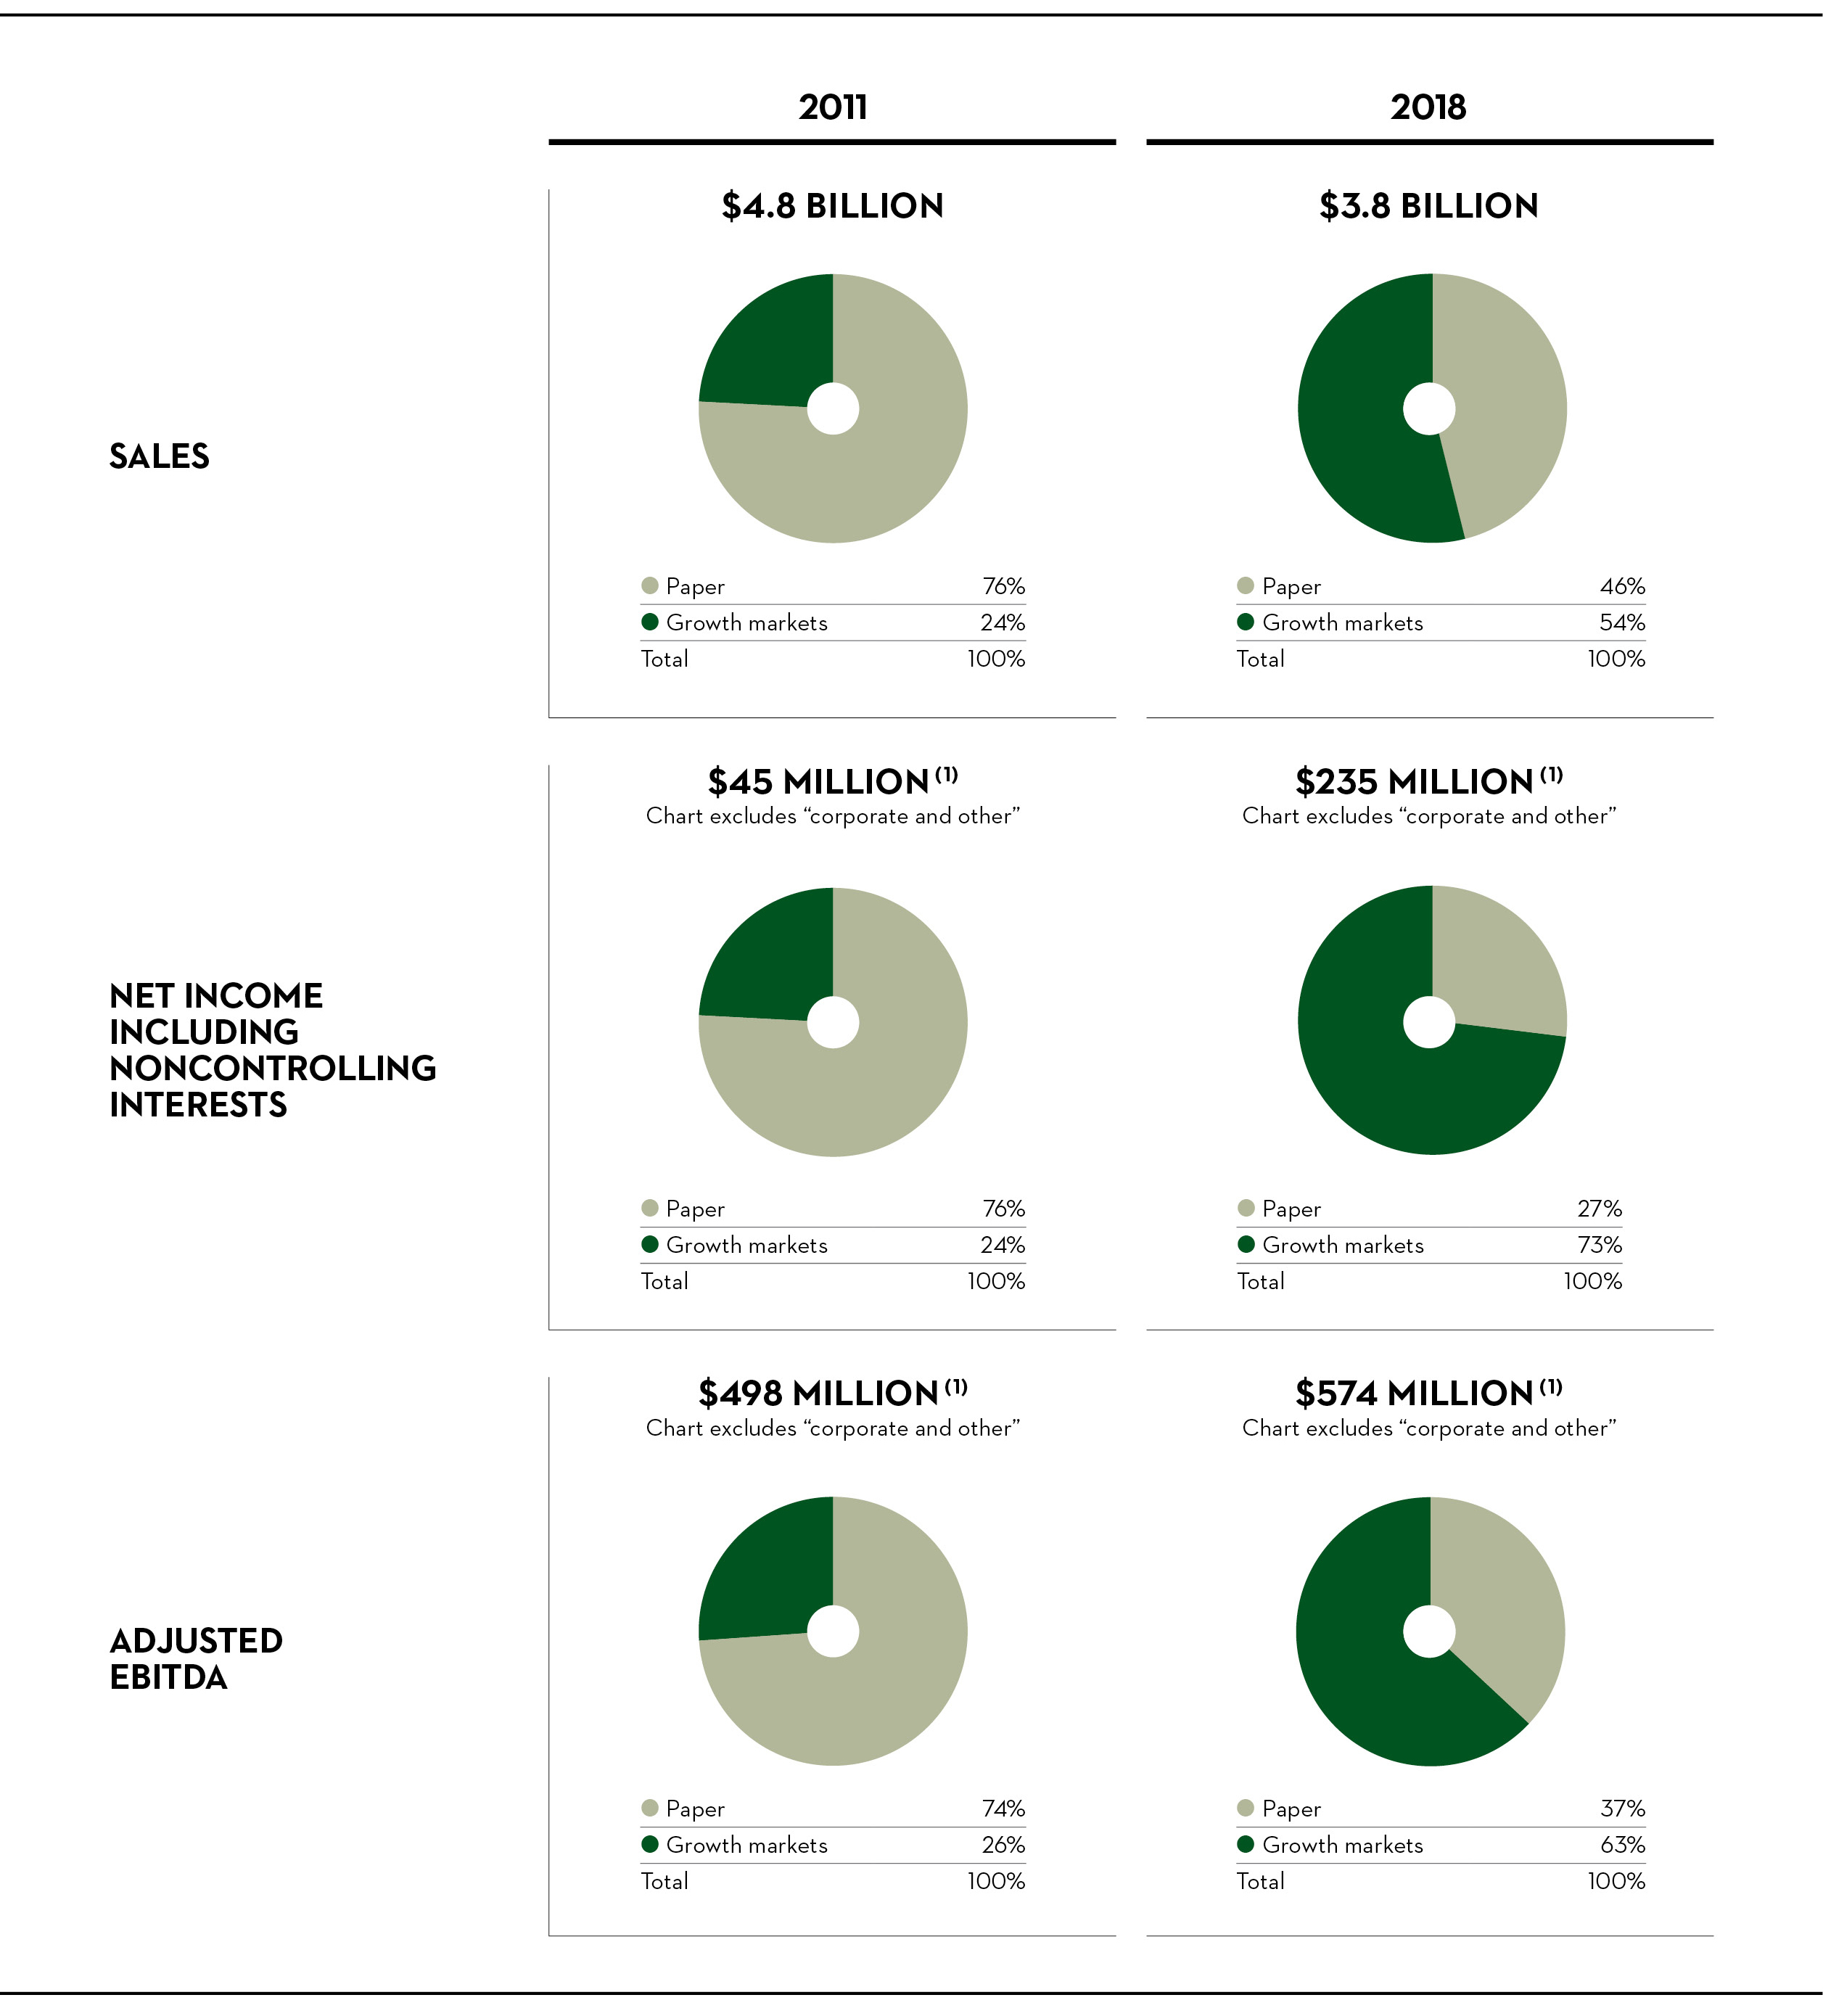
28
| |
(1)
| For a reconciliation of net income including noncontrolling interests to earnings before interest expense, income taxes, and depreciation and amortization, or “EBITDA,” and adjusted EBITDA, see “Reconciliations” below.
|
Investing in product innovation
Partnering with others,Fiber from trees is renewable, reusable and fossil-free, and we arebelieve that it can serve as a core pillar in the ongoing shift away from fossil-based materials toward renewable alternatives. With our large-scale access to high-quality fiber, our expertise in managing its value-transformation chain and our strategically-located manufacturing facilities, we believe in investing in our business to build a competitive forest products company for the future.
For example, today we manufacture wood pellets used in renewable energy production from sawmill byproducts and, in partnership with a leading industry research organization, we recently launched an innovative pilot bio-refinery plant to produce lignin and developmentcellulosic sugars for uses such as wood adhesives, animal feed and composites. In early 2020, we also announced the construction of a commercial plant to identifyproduce cellulose filaments, a new technologies that usesustainable biomaterial derived from wood fiber inthat can be integrated into commercial and consumer products for many industries, including transportation, construction and energy, increasing the resistance and durability of the future. For example, in 2018, we announced an investment in a pilot project, whichthose products. The cellulose filaments will be hosted at our Thunder Bay pulp and paper mill, to focus on developing new ways to efficiently produce and commercialize innovative bio-chemicals derived from wood. Also, in 2014, we announced our participation inmarketed with the help of Performance BioFilaments Inc., a joint venture focused onestablished in 2014 by Resolute and Mercer International Inc., dedicated to the development of commercialnon-traditional applications for cellulose filaments,filaments.
We see certain megatrends around evolving customer preferences toward more renewable alternatives, urbanization and demographic changes that could open opportunities for our Company in value-added engineered wood products to capitalize on the growing role of wood in multi-family residential and commercial construction, as well as innovative fiber-derived products.
Maximizing cash generation from paper assets
Our high quality paper assets position us to compete effectively in the industry. This segment remains an important part of our business, generating cash to help finance our transformation strategy. In order to remain competitive in mature and declining markets that our paper operations face, we strive to consistently:
•maintain a new biomaterial that holds the potential to make a variety of products stronger, lighter, more flexiblestringent focus on controlling costs and more durable, while leveraging a sustainableoptimizing our performance;
•manage production and renewable resource.inventory levels; and
•focus production at our most profitable and lower-cost facilities and machines.
Disciplined approach to capital allocation
We makeAs we operate in a capital-intensive and cyclical industry, we believe that the proper allocation of capital managementis a priority. To maintaintop priority, and that it should be done in a disciplined manner, with a view to maximize free cash flow through the business cycle and to generate attractive returns for our strong financial position and continued financial flexibility,shareholders. Accordingly, we:
•spend our capital in a disciplined, strategic and focused manner, concentrating on our most competitive sites;sites and the highest-return projects;
•explore value-creating opportunities for incremental organic growth projects, segment extensions, bolt-on acquisitions, position-repurposing activities, divestitures, investments, join ventures, capital market transactions and other similar transactions in order to divest idled, non-core or sub-optimized operations;calibrate and maximize the efficiency of our allocation of capital and other resources and optimize the value of our business;
•seek to maintain debt leverage andsolid financial liquidity that over time areis sufficient to support the evolution of our transformation strategy;
•based on market conditions, seek to retire, repay or refinance our outstanding indebtedness with a view to reducing costs and enhancing our financial flexibility; and
•return excess capital over time to our shareholders through dividends and share repurchases.
Here is a summary of some of our key strategic initiatives since 2011, leading2014:
(1)With the acquisition of Atlas Paper Holdings, Inc. and its subsidiaries (or, “Atlas”), we gained an immediate position in the North American consumer tissue market and access to a shiftcustomer base to accelerate the sale and distribution of our Calhoun tissue production.
(2)Incremental pulp capacity from the pulp digester serves in part to supply slush pulp to our business into marketsCalhoun tissue machine.
(3)The acquisition of three sawmills in the U.S. South from Conifex Timber Inc., with long-term growth potential, are summarized below:combined production capacity of 550 million board feet, gives us immediate scale in an attractive region, with quality assets in a rich fiber basket, close to growing end-markets. The facilities produce construction-grade dimensional lumber and decking products from locally sourced southern yellow pine for distribution within the U.S.
| |
(1)
| By acquiring Fibrek Inc., our market pulp capacity increased by over 70%. |
| |
(2)
| The installed steam turbine at our Thunder Bay pulp and paper mill maximizes our local woodlands, sawmill, pulp and paper, and energy operations by fully utilizing forest-based biomass to produce green electricity. |
| |
(3)
| With the acquisition of Atlas, we gained an immediate position in the North American consumer tissue market and access to a customer base to accelerate the sale and distribution of our Calhoun tissue production. |
| |
(4)
| Incremental pulp capacity from the pulp digester serves in part to supply slush pulp to our Calhoun tissue machine. |
(4)Subsequent to year-end 2020, we issued $300 million unsecured senior notes due in 2026 with a 4.875% coupon, the proceeds of which, together with cash on hand, were used to redeem the $375 million aggregate principal amount of our 5.875% senior notes due in 2023.
Sustainable development and performance
Our sustainability strategy is based on a balanced approach to environmental, social and economic performance, designed to enhance our competitive position. It is supported by public commitments in a number of key performance areas, focusing primarily on:
•improving resource efficiency, which helps control wood fiber, chemical, and energy costs, three significant input costs in our industry;
•moving beyond regulatory compliance and environmental incident management to differentiate ourselves as an environmental supplier of choice;
•positioning Resolute as a competitive employer; and
•building solid relations in our operating communities.
The overall responsibility for our sustainability performance resides with our president and chief executive officer, while we rely on our corporate sustainability committee to support the delivery of our key commitments and to implement related plans.
As an industry leader, we are committed to maintaining effective sustainability oversight and management practices, and have moved beyond already rigorous regulatory compliance and environmental incident management to commit to transparency and annual sustainability reporting. The environmental, health and safety committee of the board of directors of the Company periodically reviews the Company’s strategies, activities, policies and communications regarding sustainability and other related matters, and makes recommendations to the board.
Our recent key sustainability achievements include:
Beating•Achieving world-class safety performance, close to the targets we set at the beginning of the year, even with the integration of our safety target by achieving anthree new U.S. sawmills. The Company’s Occupational Safety and Health Administration (OSHA) incident rate was 0.62 for the year, with a severity rate of 0.46 in 2018.16.8. Safety is our first priority, and we strive for zero injuries.
•Achieving an 81%83.4% reduction in absolute greenhouse gas (or, “GHG”) emissions (scope 1 and 2), below compared to 2000 levels.
levels, and setting a new target to reduce absolute GHG emissions by 30% against 2015 levels by 2025.Joining forces with FPInnovations•Sourcing three quarters of our energy from renewable sources, and producing one third of the energy we consume internally.
•Announcing the construction of a $20 million commercial cellulose filament plant, slated for completion in 2022, at our Kénogami (Quebec) paper mill. Cellulose filaments, a sustainable biomaterial derived from wood fiber, are manufactured entirely from renewable sources, resulting in a $15low carbon footprint.
•Continuing implementation of a $45 million project to establish a biorefinery pilot plant hostedstrategic investment plan at our Thunder BaySaint-Félicien pulp mill to improve the operation, increase average daily production capacity, and reduce GHG emissions from the use of fossil fuels by 20%, or approximately 35,000 metric tons of CO2 equivalents per year.
•Increasing the energy efficiency of our facilities and lowering GHG emissions, including an initiative at our Dolbeau paper mill. The initiative is focused on developingmill to decrease the use of the auxiliary boiler fueled with bunker C oil, equivalent to a reduction of 1,600 metric tons of CO2 equivalents per year.
•Deploying a carbon capture unit and ancillary equipment at our Saint-Félicien pulp mill to improve growth rates at Toundra Greenhouse, a state-of-the-art vegetable-growing complex in which we hold a 49% interest, and announcing its third expansion since opening in 2016: a $39 million investment that will create 55 new waysjobs, in addition to efficiently produce consolidating Toundra Greenhouse’s position as a major player in the province’s greenhouse industry.
•Maintaining certification of 100% of Resolute-owned or managed woodlands to at least one internationally recognized forest management standard (Sustainable Forestry Initiative®, or “SFI®”,and commercialize innovative biochemicals derived from wood.Forest Stewardship Council®, or “FSC®”). As a result, our commitments extend well beyond strict compliance with applicable forestry regulations, which in Quebec and Ontario are already among the most – if not the most – rigorous in the world.
| |
• | Implementing a $20 million project at our Thunder Bay mill to increase the facility’s energy efficiency and pulp capacity, as well as lower its GHG emissions. By mid-2019, the project is expected to provide annual natural gas cost savings of more than 35%, while reducing the mill’s overall annual GHG emissions by over 20%, or approximately 43,000 metric tons of CO2 equivalents per year.
|
| |
• | Completing the first phase of the $45 million strategic investment plan at our Saint-Félicien pulp mill to improve several areas of the operation, increase average daily production capacity, and reduce GHG emissions from the use of fossil fuels by 20%, or approximately 35,000 metric tons of CO2 equivalents per year.
|
| |
• | Partnering with CO2 Solutions Inc. to deploy a carbon capture unit and ancillary equipment to improve growth rates at Toundra Greenhouse Inc. in Saint-Félicien, in which we hold a 49% interest.
|
| |
• | Maintaining certification of 100% of Resolute-owned or managed woodlands to at least one internationally recognized forest management standard (Sustainable Forestry Initiative®, or “SFI®”,and/or Forest Stewardship Council®, or “FSC®”). Accordingly, our commitments extend well beyond strict compliance with applicable forestry regulations, which in Quebec and Ontario are already among the most, if not the most, rigorous in the world.
|
•Maintaining internationally recognized chain of custody certifications at 100% of our certified manufacturing facilities (SFI, FSC, and the Programme for the Endorsement of Forest Certification)Certification, or “PEFC™”), with the exceptionand completing multisite chain of thecustody certification for all of our tissue operation atmills, including our Calhoun facility, which is expectedtissue operation.
•Deploying our Regional Supplier Registry web portal to have its fiber-tracking systemsupport the development of local, regional and Indigenous business in place in 2019.our Quebec operating communities as part of our commitment to further integrate sustainability practices into our procurement process.
•Continuing to report climate change, water security and forests disclosures to CDP.CDP, as we have done since 2006. We received an “A-” for our forests disclosures – the highest score achieved in this category by any North American forest products company – placing us at the leadership level and reflecting environmental best practices. We maintained management level scores for our climate change (“B-”) and water security (“B”) disclosures, reflecting the actions we have taken to evaluate and manage our risks in these categories. Full disclosures and scores are available on CDP’s website (https://www.cdp.net/)(www.cdp.net), though this information is not incorporated by reference into this Form 10-K and should not be considered part of this or any other report that we file with or furnish to the U.S. Securities and Exchange Commission (or, the “SEC”).
•Continuing to implement our proactive approach to preventing environmental management by beating our class 1 and 2 environmental incident target, recording 13 incidents completing the third year of the second three-year cycle ofin 2020, and maintaining ISO 14001:2015 environmental risk auditsmanagement system certification at all100% of our pulp, papercertified operations.
•Making new environmental commitments to include our wood products facilities in the Company’s GHG emissions inventory by 2022, develop scope 3 GHG emission commitments by working with suppliers and tissue mills. We recorded 17 environmental incidents (class 1other stakeholders, and 2)record fiber losses of no more than 40 kg per metric ton of production.
•Completing a consultative process of our internal and external stakeholders in 2018,order to assess, review and update our shared priorities, which inform our sustainability strategy and public commitments.
•Adopting a board-level diversity policy striving to maintain a minimum of 25% representation each of men and women, as well as an 11%executive leadership-level diversity policy acknowledging diversity as a key factor in the Company’s talent management strategy. Currently there are two women on the board representing 29% of its membership.
•Updating our Information Technology Security Policy, adopting a three-year continuous improvement comparedstrategy for managing data security and privacy, and making a commitment to 2017.review the strategy annually.
Active•Training 100% of all new employees on the Company's Code of Business Conduct, and committing to review it, as well as our Ethics Reporting Policy, on an annual basis.
•Ensuring 100% of our operations reported their community outreach activities, including active engagement of union officials, employees, mayors and other community leaders, First NationsIndigenous partners, small community business owners, customers, and representatives of governments at various levels.
•Maintaining long-term consultative and business relationships with close to 40 Indigenous communities and organizations.
•Achieving our annual commitment to making community and charitable contributions of more than $1 million by contributing $1.1 million toward various community organizations, as well as more than $420,000 toward scholarships and research grants.
•In addition to developingmaintaining information resources such as BorealForestFacts.com and The Resolute Blog, we expanded the scope of ourmaintained a social media presence. We also reinforced our engagement on thepresence with platforms such as Forum boréal and Boreal Forum social media platforms. These Quebec and Ontario sites provide a forum for fact-based discussion concerning sustainable forestry practices in the boreal forest and they help to ensure that individual and community voices are heard, particularly when it comes to the importance of forestry to Northern communities in Canada.Forum. The information contained on or connected to BorealForestFacts.com , The Resolute Blog and the Forum boréal and Boreal Forum
social media platforms is not incorporated by reference into this Form 10-K and should not be considered part of this or any other report that we file with or furnish to the SEC.
•Other sustainability performance indicators and disclosures prepared in accordance with the Global Reporting Initiative guidelinesInitiative’s GRI Standards are available on our website (www.resolutefp.com)(www.resolutefp.com/sustainability). We have reported publicly in accordance with GRI since 2010. Such sustainability disclosures on our website are not incorporated by reference into this Form 10-K and should not be considered part of this or any other report that we file with or furnish to the SEC.
Our leadership and sustainability accomplishmentsachievements have been recognized by independent organizations. In 2018,2020, we received extensive regional, North American and global recognition for our sustainability achievements.excellence and leadership in corporate social responsibility and sustainable development. Some of the more noteworthy included:awards include:
| |
• | the International Business Awards (known as the “Stevies®”), in the Best Health, Safety and Environment Program
•The Environment + Energy Leader top project of the Year for the U.S. and Canada category, for the second consecutive year (August 9, 2018); |
the Best in Biz Awards,year award for our Thunder Bay thermomechanical pulp biorefinery (July 21, 2020);
•The Business Intelligence Group’s BIG Award for Business for green company of the year in the Most Environmentally Responsible Company ofenterprise/manufacturing category (November 10, 2020);
•The American Forest & Paper Association’s leadership in sustainability award in the Yearenergy efficiency/greenhouse gas reduction (large company) category for the second consecutive year (November 28, 2018)13, 2020); and
•In partnership with FPInnovations and Performance BioFilaments, a partnership award at the Business Intelligence Group Sustainability Leadership Award,ADRIQ (Association pour le développement de la recherche et de l'innovation du Québec) Innovation Awards for our commercial plant specializing in the Organization category (July 17, 2018);production of cellulose filaments at the Kénogami paper mill (November 19, 2020).
For a complete list of Resolute’s public sustainability commitments, visit our corporate website at www.resolutefp.com/sustainability. The commitments on our website are not incorporated by reference into this Form 10-K and should not be considered part of this or any other report that we file with or furnish to the SEC.
the American Forest and Paper Association Sustainability Awards, in the Leadership in Sustainability category (November 8, 2018).
Power generation
We produce electricity at six cogeneration facilities and seven hydroelectric dams. The output is consumed internally or sold under contract to third parties. This allows us to reduce our costs by generating energy internally at a lower cost compared to open market purchases, and by producing revenue from external sales.
This table provides a breakdown of the output capacity (based on installed capacity and operating expectations in 2019)2021) available for internal consumption at our existing production facilities:
| | | | | | | | | | | | | | | | | |
| | Energy |
| INTERNAL CONSUMPTION | Type | Capacity
(MW) | Consumption
(MWh/Year) |
| Calhoun (Tennessee) | Cogeneration | 64 | | | 337,000 | | |
| | | | | |
| Coosa Pines (Alabama) | Cogeneration | 25 | | | 155,000 | | |
| Hydro Saguenay (Quebec) (7 dams) | Hydroelectric | 170 | | | 1,174,000 | | |
| Thunder Bay (Ontario) | Cogeneration | 25 | | | 192,000 | | |
|
| | | | | | | |
| | Energy |
| INTERNAL CONSUMPTION | Type | Capacity (MW) | Consumption (MWh/Year) |
| Calhoun (Tennessee) | Cogeneration | 64 |
| | 336,000 |
| |
| Coosa Pines (Alabama) | Cogeneration | 30 |
| | 164,000 |
| |
| Hydro Saguenay (Quebec) (7 dams) | Hydroelectric | 170 |
| | 1,010,000 |
| |
| Thunder Bay (Ontario) | Cogeneration | 25 |
| | 179,000 |
| |
TheWe estimate that the approximate annualized cost savings to our operations attributable to internal consumption from our cogeneration assets and hydroelectric facilities is between $40 million and $45 million.
The table below shows the facilities where we currently produce electricity to sell externally as green power produced from renewable sources at favorable rates, almost all of which we buy back at lower rates for use in our operations:
| | | | | | | | | | | | | | | | | |
| | Energy |
| EXTERNAL SALES | Type | Capacity
(MW) | Annualized Sales
(MWh/Year) |
| Dolbeau (Quebec) | Cogeneration | 28 | | | 193,000 | | |
| Gatineau (Quebec) | Cogeneration | 15 | | | 106,000 | | |
| Saint-Félicien (Quebec) | Cogeneration | 43 | | | 290,000 | | |
| Thunder Bay (Quebec) | Cogeneration | 65 | | | 431,000 | | |
|
| | | | | | | |
| | Energy |
| EXTERNAL SALES | Type | Capacity (MW) | Annualized Sales (MWh/Year) |
| Dolbeau (Quebec) | Cogeneration | 28 |
| | 192,000 |
| |
| Gatineau (Quebec) | Cogeneration | 15 |
| | 109,000 |
| |
| Saint-Félicien (Quebec) | Cogeneration | 43 |
| | 293,000 |
| |
| Thunder Bay (Ontario) | Cogeneration | 65 |
| | 432,000 |
| |
External sales generated from our cogeneration assets reduced cost of sales, excluding depreciation, amortization and distribution costs (or, “COS”), by $37$38 million, $40$36 million and $45$37 million for the years ended December 31, 2020, 2019 and 2018, 2017respectively.
2020 Overview
Impact of the COVID-19 pandemic
We have sustained operations across all of our business segments through the COVID-19 pandemic, but we had to take certain measures in the face of the dramatic reduction in economic activity, particularly for marketing-dependent products like newspapers, inserts, flyers and 2016, respectively.commercial paper. We continue to focus on key short-term priorities, including: operating under rigorous protocols around the health and safety of our employees, contractors and suppliers; reducing our paper production consistent with the dramatic decrease in economic activity affecting demand; maintaining disciplined liquidity management; monitoring customer credit risk; and controlling spending around selling, general and administrative (or, “SG&A”) expenses and capital expenditures. Specifically, as of December 31, 2020, we have reduced our operational footprint by temporarily idling paper machines representing in aggregate 28% of our run-rate capacity (equivalent to 48,000 metric tons per month). This decision led to workforce reductions and spending limitations or deferrals. We continue to monitor the market to adjust our capacity to market conditions.
Temporary idling of Amos and Baie-Comeau facilities
ReconciliationsDue to the overall decrease in demand for newsprint, accelerated by the economic context surrounding the COVID-19 pandemic, the Amos (Quebec) and Baie-Comeau (Quebec) paper mills have been temporarily idled since April 2020. As a result, we reassessed the remaining useful lives of the fixed assets and recognized an accelerated depreciation charge of $38 million and recognized additional provisions of $17 million. These charges are recorded in “Closure costs, impairment and other related charges” in our Consolidated Statement of Operations for the year ended December 31, 2020. We also recognized inventory write-downs of $25 million recorded in “Cost of sales, excluding depreciation, amortization and distribution costs” in our Consolidated Statement of Operations for the year ended December 31, 2020.
Business acquisition
On February 1, 2020, we acquired from Conifex Timber Inc. all of the equity securities and membership interests in certain of its subsidiaries, the business of which consists mainly in the operation of three sawmills and related assets in Cross City (Florida) and in Glenwood and El Dorado (Arkansas) (or, the “U.S. Sawmill Business”). The tableU.S. Sawmill Business acquired produces construction-grade dimensional lumber and decking products from locally-sourced southern yellow pine for distribution within the U.S. This acquisition diversified our lumber production, and increased our operating capacity in the U.S. South. The fair value of the consideration, paid in cash, for the acquired U.S. Sawmill Business was $173 million. For more information, see Note 3, “Business Acquisition,” to our Consolidated Financial Statements.
Liquidity and capital resources
On November 4, 2020, our Canadian subsidiary, Resolute FP Canada Inc., entered into a secured delayed draw term loan facility (or, the “Loan Facility”) with Investissement Québec as lender, for up to C$220 million ($173 million, based on the exchange rate in effect on December 31, 2020), with an availability of C$165 million ($130 million) as at December 31, 2020, subject to certain conditions. As of December 31, 2020, the Loan Facility was undrawn.
On February 2, 2021, we completed the private offering (or, the "Offering") of $300 million aggregate principal amount of our 4.875% senior notes due 2026 (or, the “2026 Notes”) at an issue price of 100%. We used the net proceeds of the Offering, together with cash on hand, to redeem all of the outstanding $375 million aggregate principal amount of our 5.875% senior notes due 2023 (or, the “2023 Notes”), at a price of 100% of the aggregate principal amount thereof, plus accrued and unpaid interest to, but not including, the redemption date. The redemption of the 2023 Senior Notes occurred on February 18, 2021.
See below showsunder “Liquidity and Capital Resources – Capital Resources” for more information.
Share repurchase program
On March 2, 2020, our board of directors authorized a share repurchase program of up to 15% of our common stock, for an aggregate consideration of up to $100 million. During the reconciliationyear ended December 31, 2020, we repurchased 6.9 million shares at a cost of $30 million under this program.
2020 vs. 2019
Our operating income was $99 million during the year, compared to $17 million in 2019. Excluding special items, we generated operating income of $169 million in 2020, compared to $46 million in 2019. Special items are described below.
Our net income in 2020 was $10 million, or $0.12 per diluted share, compared to net loss of $47 million, or $0.51 per share, in 2019. Our net income for 2020, excluding special items, was $56 million, or $0.65 per diluted share, compared to net loss of $46 million, or $0.50 per share, in 2019.
| | | | | | | | | | | | | | | | | | | | | | | | | | | | | |
| Year Ended December 31, 2020 | Operating Income | Net Income | EPS | |
| (In millions, except per share amounts) |
| GAAP, as reported | $ | 99 | | | $ | 10 | | | $ | 0.12 | | |
| Adjustments for special items: | | | | | | | | | |
| | | | | | | | | |
| Closure costs, impairment and other related charges | | 53 | | | | 53 | | | | 0.61 | | |
| Inventory write-downs related to closures | | 25 | | | | 25 | | | | 0.29 | | |
| Start-up costs | | 3 | | | | 3 | | | | 0.03 | | |
| Net gain on disposition of assets | | (11) | | | | (11) | | | | (0.13) | | |
| | | | | | | | | |
| | | | | | | | | |
| | | | | | | | | |
| Other expense, net | | — | | | | 4 | | | | 0.05 | | |
| | | | | | | | | |
| Income tax effect of special items | | — | | | | (28) | | | | (0.32) | | |
Adjusted for special items (1) | $ | 169 | | | $ | 56 | | | $ | 0.65 | | |
| | | | | | | | | | | | | | | | | | | | | | | | | | | | | |
| Year Ended December 31, 2019 | Operating Income | Net Loss | EPS | |
| (In millions, except per share amounts) |
| GAAP, as reported | $ | 17 | | | $ | (47) | | | $ | (0.51) | | |
| Adjustments for special items: | | | | | | | | | |
| | | | | | | | | |
| Closure costs, impairment and other related charges | | 18 | | | | 18 | | | | 0.19 | | |
| Inventory write-downs related to closures | | 13 | | | | 13 | | | | 0.14 | | |
| | | | | | | | | |
| Net gain on disposition of assets | | (2) | | | | (2) | | | | (0.02) | | |
| Non-operating pension and other postretirement benefit credits | | — | | | | (47) | | | | (0.51) | | |
| | | | | | | | | |
| | | | | | | | | |
| Other expense, net | | — | | | | 22 | | | | 0.24 | | |
| | | | | | | | | |
| Income tax effect of special items | | — | | | | (3) | | | | (0.03) | | |
Adjusted for special items (1) | $ | 46 | | | $ | (46) | | | $ | (0.50) | | |
(1)Operating income (loss), net income (loss) including noncontrolling interests to EBITDA and net income (loss) per share (or, “EPS”), in each case as adjusted EBITDA, whichfor special items, are not financial measures recognized under U.S. generally accepted accounting principles (or, “GAAP”). We calculate operating income (loss), as adjusted for the year ended December 31, 2011. For more information on the calculation and reasons we include these measures, see note 1 under “Resultsspecial items, as operating income (loss) from our Consolidated Statements of Operations, – Consolidated Results – Selected Annual Financial Information” below.
|
| | | | | | | | | | | | | | | | | | | | | | | | | | | | | | | | |
| Year ended December 31, 2011 | Market Pulp | Tissue | Wood Products | Newsprint | Specialty Papers | Segment Total | Corporate and Other | Total |
| (Unaudited, in millions) |
| Net income (loss) including noncontrolling interests | $ | 91 |
| | $ | — |
| | $ | (25 | ) | | $ | 89 |
| | $ | 122 |
| | $ | 277 |
| | $ | (232 | ) | | $ | 45 |
| |
| Interest expense | | — |
| | | — |
| | | — |
| | | — |
| | | — |
| | | — |
| | | 95 |
| | | 95 |
| |
| Income tax provision | | — |
| | | — |
| | | — |
| | | — |
| | | — |
| | | — |
| | | 19 |
| | | 19 |
| |
| Depreciation and amortization | | 30 |
| | | — |
| | | 33 |
| | | 73 |
| | | 84 |
| | | 220 |
| | | — |
| | | 220 |
| |
| EBITDA | $ | 121 |
| | $ | — |
| | $ | 8 |
| | $ | 162 |
| | $ | 206 |
| | $ | 497 |
| | $ | (118 | ) | | $ | 379 |
| |
| Foreign exchange loss | | — |
| | | — |
| | | — |
| | | — |
| | | — |
| | | — |
| | | 21 |
| | | 21 |
| |
| Severance costs | | — |
| | | — |
| | | — |
| | | — |
| | | — |
| | | — |
| | | 12 |
| | | 12 |
| |
| Closure costs, impairment and other related charges | | — |
| | | — |
| | | — |
| | | — |
| | | — |
| | | — |
| | | 46 |
| | | 46 |
| |
| Inventory write-downs related to closures | | — |
| | | — |
| | | — |
| | | — |
| | | — |
| | | — |
| | | 3 |
| | | 3 |
| |
| Net gain on disposition of assets | | — |
| | | — |
| | | — |
| | | — |
| | | — |
| | | — |
| | | (3 | ) | | | (3 | ) | |
| Non-operating pension and other postretirement benefit costs | | — |
| | | — |
| | | — |
| | | — |
| | | — |
| | | — |
| | | 8 |
| | | 8 |
| |
| Acquisition-related costs | | — |
| | | — |
| | | — |
| | | — |
| | | — |
| | | — |
| | | 5 |
| | | 5 |
| |
| Other expense, net | | — |
| | | — |
| | | — |
| | | — |
| | | — |
| | | — |
| | | 27 |
| | | 27 |
| |
| Adjusted EBITDA | $ | 121 |
| | $ | — |
| | $ | 8 |
| | $ | 162 |
| | $ | 206 |
| | $ | 497 |
| | $ | 1 |
| | $ | 498 |
| |
The table below shows the reconciliation of net income (loss) including noncontrolling interests to EBITDA, and adjusted EBITDA, which are not financial measures recognized under GAAP, for the year ended December 31, 2018. For more information on the calculation and reasons we include these measures, see note 1 under “Results of Operations – Consolidated Results – Selected Annual Financial Information” below.
|
| | | | | | | | | | | | | | | | | | | | | | | | | | | | | | | | |
| Year ended December 31, 2018 | Market Pulp | Tissue | Wood Products | Newsprint | Specialty Papers | Segment Total | Corporate and Other | Total |
| (Unaudited, in millions) |
| Net income (loss) including noncontrolling interests | $ | 172 |
| | $ | (30 | ) | | $ | 169 |
| | $ | 74 |
| | $ | 40 |
| | $ | 425 |
| | $ | (190 | ) | | $ | 235 |
| |
| Interest expense | | — |
| | | — |
| | | — |
| | | — |
| | | — |
| | | — |
| | | 47 |
| | | 47 |
| |
| Income tax provision | | — |
| | | — |
| | | — |
| | | — |
| | | — |
| | | — |
| | | 152 |
| | | 152 |
| |
| Depreciation and amortization | | 27 |
| | | 15 |
| | | 32 |
| | | 66 |
| | | 47 |
| | | 187 |
| | | 25 |
| | | 212 |
| |
| EBITDA | $ | 199 |
| | $ | (15 | ) | | $ | 201 |
| | $ | 140 |
| | $ | 87 |
| | $ | 612 |
| | $ | 34 |
| | $ | 646 |
| |
| Foreign exchange loss | | — |
| | | — |
| | | — |
| | | — |
| | | — |
| | | — |
| | | 2 |
| | | 2 |
| |
| Closure costs, impairment and other related charges | | — |
| | | — |
| | | — |
| | | — |
| | | — |
| | | — |
| | | 121 |
| | | 121 |
| |
| Reversal of inventory write-downs related to closures | | — |
| | | — |
| | | — |
| | | — |
| | | — |
| | | — |
| | | (1 | ) | | | (1 | ) | |
| Start-up costs | | — |
| | | — |
| | | — |
| | | — |
| | | — |
| | | — |
| | | 8 |
| | | 8 |
| |
| Net gain on disposition of assets | | — |
| | | — |
| | | — |
| | | — |
| | | — |
| | | — |
| | | (145 | ) | | | (145 | ) | |
| Non-operating pension and other postretirement benefit credits | | — |
| | | — |
| | | — |
| | | — |
| | | — |
| | | — |
| | | (50 | ) | | | (50 | ) | |
| Other income, net | | — |
| | | — |
| | | — |
| | | — |
| | | — |
| | | — |
| | | (7 | ) | | | (7 | ) | |
| Adjusted EBITDA | $ | 199 |
| | $ | (15 | ) | | $ | 201 |
| | $ | 140 |
| | $ | 87 |
| | $ | 612 |
| | $ | (38 | ) | | $ | 574 |
| |
2018 Overview
In the first quarter of 2018, we changed our presentation of operating income in accordance with Financial Accounting Standards Board Accounting Standards Update 2017-07, to present only the service cost component of net periodic pension and other postretirement benefit (or “OPEB”) cost in operating expenses (together with other employee compensation costs arising during the period). The other components of the net periodic pension and OPEB cost (or “Non-operating pension and OPEB costs”), recorded under “corporate and other,” are reported separately outside any subtotal of operating income. Prior period amounts have been reclassified to conform to the 2018 presentation. See Item 8. Financial Statements and Supplementary Data – Note 2. Summary of Significant Accounting Policies – New accounting pronouncements adopted in 2018 – ASU 2017-07 “Improving the Presentation of Net Periodic Pension Cost and Net Periodic Postretirement Benefit Cost” for more information.
2018 vs. 2017
Our operating income was $379 million during the year, compared to $42 million in 2017. Excluding special items we generated operating income of $362 million in 2018, compared to $160 million in 2017. Special items are described below.
Our net income in 2018 was $235 million, or $2.52 per diluted share, compared to a net loss of $84 million, or $0.93 per share, in 2017. Our net income for 2018, excluding special items, was $183 million, or $1.96 per diluted share, compared to $12 million, or $0.13 per diluted share, in 2017.
|
| | | | | | | | | | | | |
| Year Ended December 31, 2018 | Operating
Income
(Loss) | Net
Income
(Loss) | EPS | | |
| (Unaudited, in millions, except per share amounts) |
| GAAP, as reported | $ | 379 |
| | $ | 235 |
| | $ | 2.52 |
| |
| Adjustments for special items: | | | | | | | | | |
| Foreign exchange loss | | — |
| | | 2 |
| | | 0.02 |
| |
| Closure costs, impairment and other related charges | | 121 |
| | | 121 |
| | | 1.30 |
| |
| Reversal of inventory write-downs related to closures | | (1 | ) | | | (1 | ) | | | (0.01 | ) | |
| Start-up costs | | 8 |
| | | 8 |
| | | 0.09 |
| |
| Net gain on disposition of assets | | (145 | ) | | | (145 | ) | | | (1.55 | ) | |
| Non-operating pension and other postretirement benefit credits | | — |
| | | (50 | ) | | | (0.54 | ) | |
| Other income, net | | — |
| | | (7 | ) | | | (0.08 | ) | |
| Income tax effect of special items | | — |
| | | 20 |
| | | 0.21 |
| |
Adjusted for special items (1) | $ | 362 |
| | $ | 183 |
| | $ | 1.96 |
| |
|
| | | | | | | | | | | | |
| Year Ended December 31, 2017 | Operating
Income
(Loss) | Net
Income
(Loss) | EPS | | |
| (Unaudited, in millions, except per share amounts) |
| GAAP, as reported | $ | 42 |
| | $ | (84 | ) | | $ | (0.93 | ) | |
| Adjustments for special items: | | | | | | | | | |
| Foreign exchange gain | | — |
| | | (9 | ) | | | (0.10 | ) | |
| Closure costs, impairment and other related charges | | 82 |
| | | 82 |
| | | 0.91 |
| |
| Inventory write-downs related to closures | | 24 |
| | | 24 |
| | | 0.27 |
| |
| Start-up costs | | 27 |
| | | 27 |
| | | 0.30 |
| |
| Net gain on disposition of assets | | (15 | ) | | | (15 | ) | | | (0.17 | ) | |
| Non-operating pension and other postretirement benefit credits | | — |
| | | (7 | ) | | | (0.08 | ) | |
| Other expense, net | | — |
| | | 3 |
| | | 0.03 |
| |
| Income tax effect of special items | | — |
| | | (9 | ) | | | (0.10 | ) | |
Adjusted for special items (1) | $ | 160 |
| | $ | 12 |
| | $ | 0.13 |
| |
| |
(1)
| Operating income (loss), net income (loss) and net income (loss) per share (or “EPS”), in each case as adjusted for special items, are not financial measures recognized under GAAP. We calculate operating income (loss), as adjusted for special items, as operating income (loss) from our Consolidated Statements of Operations, adjusted for items such
|
such as closure costs, impairment and other related charges, inventory write-downs related to closures, start-up costs, and gains and losses on disposition of assets and other charges or credits that are excluded from our segment’s performance from GAAP operating income (loss). We calculate net income (loss), as adjusted for special items, as net income (loss) from our Consolidated Statements of Operations, adjusted for the same special items applied to operating income (loss), in addition to foreign exchange gains and losses, non-operating pension and other postretirement benefit (or, “OPEB”) costs and credits, other income and expense, net, and the income tax effect of the special items. EPS, as adjusted for special items, is calculated as net income (loss), as adjusted for special items, per diluted share. We believe that using these non-GAAP measures is useful because they are consistent with the indicators management uses internally to measure the Company’s performance, and it allows the reader to more easily compare our operations and financial performance from period to period. Operating income (loss), net income (loss) and EPS, in each case as adjusted for special items, are internal measures, and therefore may not be comparable to those of other companies. These non-GAAP measures should not be viewed as substitutes to financial measures determined under GAAP.
Fourth Quarter Overview
Three months ended December 31, 20182020 vs. December 31, 20172019
Our operating income was $75$4 million in the quarter, compared to $53operating loss of $69 million in the year-ago period. Excluding special items, we generatedincurred an operating income of $54$85 million in the quarter, compared to $51operating loss of $39 million in the year-ago period. Special items are described below.
Our net incomeloss in the quarter was $36$52 million, or $0.38$0.63 per diluted share, compared to $13net loss of $71 million, or $0.14$0.79 per diluted share, in the year-ago period. Our net income in the quarter, excluding special items, was $4$45 million, or $0.04$0.55 per diluted share, compared to $14net loss of $53 million, or $0.15$0.59 per diluted share, in the year-ago period.
| | | | | | | | | | | | | | | | | | | | | | | | | | | | | |
| Three Months Ended December 31, 2020 | Operating Income | Net (Loss) Income | EPS | |
| (In millions, except per share amounts) |
| GAAP, as reported | $ | 4 | | | $ | (52) | | | $ | (0.63) | | |
| Adjustments for special items: | | | | | | | | | |
| | | | | | | | | |
| Closure costs, impairment and other related charges | | 55 | | | | 55 | | | | 0.67 | | |
| Inventory write-downs related to closures | | 25 | | | | 25 | | | | 0.30 | | |
| Start-up costs | | 3 | | | | 3 | | | | 0.04 | | |
| Net gain on disposition of assets | | (2) | | | | (2) | | | | (0.02) | | |
| Non-operating pension and other postretirement benefit costs | | — | | | | 24 | | | | 0.29 | | |
| | | | | | | | | |
| | | | | | | | | |
| Other expense, net | | — | | | | 28 | | | | 0.34 | | |
| | | | | | | | | |
| Income tax effect of special items | | — | | | | (36) | | | | (0.44) | | |
Adjusted for special items (1) | $ | 85 | | | $ | 45 | | | $ | 0.55 | | |
| | | | | | | | | | | | | | | | | | | | | | | | | | | | | |
| Three Months Ended December 31, 2019 | Operating Loss | Net Loss | EPS | |
| (In millions, except per share amounts) |
| GAAP, as reported | $ | (69) | | | $ | (71) | | | $ | (0.79) | | |
| Adjustments for special items: | | | | | | | | | |
| | | | | | | | | |
| Closure costs, impairment and other related charges | | 18 | | | | 18 | | | | 0.20 | | |
| Inventory write-downs related to closures | | 13 | | | | 13 | | | | 0.14 | | |
| | | | | | | | | |
| Net gain on disposition of assets | | (1) | | | | (1) | | | | (0.01) | | |
| Non-operating pension and other postretirement benefit credits | | — | | | | (11) | | | | (0.12) | | |
| | | | | | | | | |
| | | | | | | | | |
| | | | | | | | | |
| | | | | | | | | |
| Income tax effect of special items | | — | | | | (1) | | | | (0.01) | | |
Adjusted for special items (1) | $ | (39) | | | $ | (53) | | | $ | (0.59) | | |
(1)Operating income (loss), net income (loss) and EPS, in each case as adjusted for special items, are non-GAAP financial measures. For more information on the calculation and reasons we include these measures, see note 1 under “Overview – 2020 Overview” above.
|
| | | | | | | | | | | | |
| Three Months Ended December 31, 2018 | Operating
Income
(Loss) | Net
Income
(Loss) | EPS | | |
| (Unaudited, in millions, except per share amounts) |
| GAAP, as reported | $ | 75 |
| | $ | 36 |
| | $ | 0.38 |
| |
| Adjustments for special items: | | | | | | | | | |
| Closure costs, impairment and other related charges | | 120 |
| | | 120 |
| | | 1.27 |
| |
| Net gain on disposition of assets | | (141 | ) | | | (141 | ) | | | (1.49 | ) | |
| Non-operating pension and other postretirement benefit credits | | — |
| | | (12 | ) | | | (0.13 | ) | |
| Other income, net | | — |
| | | (1 | ) | | | (0.01 | ) | |
| Income tax effect of special items | | — |
| | | 2 |
| | | 0.02 |
| |
Adjusted for special items (1) | $ | 54 |
| | $ | 4 |
| | $ | 0.04 |
| |
|
| | | | | | | | | | | | |
| Three Months Ended December 31, 2017 | Operating
Income
(Loss) | Net
Income
(Loss) | EPS | | |
| (Unaudited, in millions, except per share amounts) |
| GAAP, as reported | $ | 53 |
| | $ | 13 |
| | $ | 0.14 |
| |
| Adjustments for special items: | | | | | | | | | |
| Foreign exchange loss | | — |
| | | 1 |
| | | 0.01 |
| |
| Closure costs, impairment and other related charges | | 2 |
| | | 2 |
| | | 0.02 |
| |
| Start-up costs | | 9 |
| | | 9 |
| | | 0.10 |
| |
| Net gain on disposition of assets | | (13 | ) | | | (13 | ) | | | (0.14 | ) | |
| Non-operating pension and other postretirement benefit credits | | — |
| | | (1 | ) | | | (0.01 | ) | |
| Other expense, net | | — |
| | | 4 |
| | | 0.04 |
| |
| Income tax effect of special items | | — |
| | | (1 | ) | | | (0.01 | ) | |
Adjusted for special items (1) | $ | 51 |
| | $ | 14 |
| | $ | 0.15 |
| |
| |
(1)
| Operating income (loss), net income (loss) and EPS, in each case as adjusted for special items, are non-GAAP financial measures. For more information on the calculation and reasons we include these measures, see note 1 under “Overview – 2018 Overview” above.
|
RESULTSOF OPERATIONS
Consolidated Results
Selected annual financial information
| | | | | | | | | | | | | | | | | | | | | | | | | | | | | |
| Years Ended December 31, |
| (In millions, except per share amounts) | 2020 | | 2019 | | 2018 | |
| Sales | $ | 2,800 | | | $ | 2,923 | | | $ | 3,756 | | |
| Operating (loss) income per segment: | | | | | | | | | |
| Market pulp | $ | (1) | | | $ | 39 | | | $ | 172 | | |
| Tissue | | (1) | | | | (16) | | | | (30) | | |
| Wood products | | 276 | | | | (6) | | | | 169 | | |
| Paper | | (46) | | | | 82 | | | | 114 | | |
| | | | | | | | | |
| Segment total | | 228 | | | | 99 | | | | 425 | | |
| Corporate and other | | (129) | | | | (82) | | | | (46) | | |
| Operating income | $ | 99 | | | $ | 17 | | | $ | 379�� | | |
| Net income (loss) attributable to Resolute Forest Products Inc. | $ | 10 | | | $ | (47) | | | $ | 235 | | |
| Net income (loss) per share attributable to Resolute Forest Products Inc. common shareholders: | | | | | | | | | |
| Basic | $ | 0.12 | | | $ | (0.51) | | | $ | 2.57 | | |
| Diluted | $ | 0.12 | | | $ | (0.51) | | | $ | 2.52 | | |
Adjusted EBITDA (1) | $ | 338 | | | $ | 213 | | | $ | 574 | | |
| | | | | | | | | |
| | | | | | | | | | | | | | | | | | | | |
| As of December 31, |
| (In millions) | 2020 | 2019 |
| Cash and cash equivalents | $ | 113 | | | $ | 3 | | |
| Total assets | $ | 3,730 | | | $ | 3,626 | | |
(1)Earnings before interest expense, income taxes, and depreciation and amortization (or, “EBITDA”) and adjusted EBITDA are not financial measures recognized under GAAP. EBITDA is calculated as net income (loss) including noncontrolling interest from the Consolidated Statements of Operations, adjusted for interest expense, income taxes, and depreciation and amortization. Adjusted EBITDA means EBITDA, excluding special items, such as closure costs, impairment and other related charges, inventory write-downs related to closures, start-up costs, gains and losses on disposition of assets, non-operating pension and OPEB costs and credits, and other income and expense, net. We believe that using non-GAAP measures such as EBITDA and adjusted EBITDA is useful because they are consistent with the indicators management uses internally to measure the Company’s performance and it allows the reader to compare our operations and financial performance from period to period. EBITDA and adjusted EBITDA are internal measures, and therefore may not be comparable to those of other companies. These non-GAAP measures should not be viewed as substitutes to financial measures determined under GAAP.
|
| | | | | | | | | | | | |
| Years Ended December 31, |
| (In millions, except per share amounts) | 2018 | 2017 | 2016 |
| Sales | $ | 3,756 |
| | $ | 3,513 |
| | $ | 3,545 |
| |
| Operating income (loss) per segment: | | | | | | | | | |
| Market pulp | | 172 |
| | | 79 |
| | | 37 |
| |
| Tissue | | (30 | ) | | | (6 | ) | | | (10 | ) | |
| Wood products | | 169 |
| | | 186 |
| | | 69 |
| |
| Newsprint | | 74 |
| | | (23 | ) | | | (16 | ) | |
| Specialty papers | | 40 |
| | | (9 | ) | | | 19 |
| |
| Segment total | | 425 |
| | | 227 |
| | | 99 |
| |
| Corporate and other | | (46 | ) | | | (185 | ) | | | (117 | ) | |
| Operating income (loss) | | 379 |
| | | 42 |
| | | (18 | ) | |
| Net income (loss) attributable to Resolute Forest Products Inc. | | 235 |
| | | (84 | ) | | | (81 | ) | |
| Net income (loss) per share attributable to Resolute Forest Products Inc. common shareholders: | | | | | | | | | |
| Basic | $ | 2.57 |
| | $ | (0.93 | ) | | $ | (0.90 | ) | |
| Diluted | | 2.52 |
| | | (0.93 | ) | | | (0.90 | ) | |
Adjusted EBITDA (1) | $ | 574 |
| | $ | 364 |
| | $ | 263 |
| |
| | | | | | | | | | | | | | | | | | | | | | | | | | | | | |
| Years Ended December 31, |
| (In millions) | 2020 | | 2019 | | 2018 | |
| Net income (loss) including noncontrolling interest | $ | 10 | | | $ | (47) | | | $ | 235 | | |
| Interest expense | | 34 | | | | 31 | | | | 47 | | |
| Income tax provision | | 51 | | | | 58 | | | | 152 | | |
| Depreciation and amortization | | 169 | | | | 167 | | | | 212 | | |
| EBITDA | | 264 | | | | 209 | | | | 646 | | |
| | | | | | | | | |
| Closure costs, impairment and other related charges | | 53 | | | | 18 | | | | 121 | | |
| Inventory write-downs related to closures | | 25 | | | | 13 | | | | (1) | | |
| Start-up costs | | 3 | | | | — | | | | 8 | | |
| Net gain on disposition of assets | | (11) | | | | (2) | | | | (145) | | |
| Non-operating pension and other postretirement benefit credits | | — | | | | (47) | | | | (50) | | |
| | | | | | | | | |
| | | | | | | | | |
| Other expense (income), net | | 4 | | | | 22 | | | | (5) | | |
| | | | | | | | | |
| Adjusted EBITDA | $ | 338 | | | $ | 213 | | | $ | 574 | | |
|
| | | | | | | | |
| | As of December 31, |
| (In millions) | 2018 | 2017 |
| Cash and cash equivalents | $ | 304 |
| | $ | 6 |
| |
| Total assets | | 3,935 |
| | | 4,147 |
| |
| |
(1)
| EBITDA and adjusted EBITDA are not financial measures recognized under GAAP. EBITDA is calculated as net income (loss) including noncontrolling interests from the Consolidated Statements of Operations, adjusted for interest expense, income taxes, and depreciation and amortization. Adjusted EBITDA means EBITDA, excluding special items, such as foreign exchange gains and losses, severance costs, closure costs, impairment and other related charges, inventory write-downs related to closures, start-up costs, gains and losses on disposition of assets, non-operating pension and OPEB costs and credits, acquisition-related costs, and other charges or credits. We believe that using non-GAAP measures such as EBITDA and adjusted EBITDA is useful because they are consistent with the indicators management uses internally to measure the Company’s performance and it allows the reader to more easily compare our operations and financial performance from period to period. EBITDA and adjusted EBITDA are internal measures, and therefore may not be comparable to those of other companies. These non-GAAP measures should not be viewed as substitutes to financial measures determined under GAAP. |
|
| | | | | | | | | | | | |
| Years Ended December 31, |
| (In millions) | 2018 | | | 2017 | | | 2016 | | |
| Net income (loss) including noncontrolling interests | $ | 235 |
| | $ | (78 | ) | | $ | (76 | ) | |
| Interest expense | | 47 |
| | | 49 |
| | | 38 |
| |
| Income tax provision | | 152 |
| | | 84 |
| | | 19 |
| |
| Depreciation and amortization | | 212 |
| | | 204 |
| | | 206 |
| |
| EBITDA | $ | 646 |
| | $ | 259 |
| | $ | 187 |
| |
| Foreign exchange loss (gain) | | 2 |
| | | (9 | ) | | | 7 |
| |
| Closure costs, impairment and other related charges | | 121 |
| | | 82 |
| | | 62 |
| |
| (Reversal of) inventory write-downs related to closures | | (1 | ) | | | 24 |
| | | 7 |
| |
| Start-up costs | | 8 |
| | | 27 |
| | | 8 |
| |
| Net gain on disposition of assets | | (145 | ) | | | (15 | ) | | | (2 | ) | |
| Non-operating pension and other postretirement benefit (credits) costs | | (50 | ) | | | (7 | ) | | | 8 |
| |
| Other (income) expense, net | | (7 | ) | | | 3 |
| | | (14 | ) | |
| Adjusted EBITDA | $ | 574 |
| | $ | 364 |
| | $ | 263 |
| |
The operating results of our Calhoun tissue operations, previously recorded under “corporate and other,” have been recorded in our tissue segment since April 1, 2018.
20182020 vs. 20172019
Operating income variance analysis
Sales
Sales were $243$123 million lower in 2020, or 7%4%, higherto $2,800 million. After removing the sales related to the acquisition of the U.S. Sawmill Business in 2018, to $3,756 million. Including restructuring initiatives,the first quarter of 2020, sales volume declined by $289 million, mainly reflecting lower shipments in paper and market pulp, partly offset by higher shipments of wood products. Pricing had an unfavorablea favorable impact of $266$30 million, reflecting decreases of 213,000 short tons (193,000 metric tons) in shipments of specialty papers, and 131,000 metric tons in newsprint, mainly as a result of the 2017 capacity reduction initiatives. Sales volume in wood products also decreased, down 8%, largely due to lower production volumes and weaker market conditionsan increase in the latter part of 2018, while market pulp shipments were essentially unchanged, despite the extended investment-related downtime at the Saint-Félicien mill. Pricing had a $465 million favorable impact on sales, as higher average transaction prices were realized across all business segments. The average transaction price increased 19% for market pulp, 17% for newsprint, 13% for wood products and 9%tissue, up by 41% and 6%, respectively, partly offset by lower average transaction price for specialty papers. The inclusionmarket pulp and paper, down by 13% and 11%, respectively.
Cost of sales, excluding depreciation, amortization and distribution costs
COS improved by $39 million in 2018. Restructuring initiatives reduced COS by $170 million, including the elimination of $52 million in fixed manufacturing costs. After removing the lower volume, the COS related to Calhoun’s tissue operations, andthe acquisition of the U.S. Sawmill Business, the effects of restructuring initiativeslower volume and the effect of the weaker Canadian dollar, fluctuation, COS increaseddecreased by $112$84 million in 2020, largely reflecting:
an increase in•favorable maintenance costs ($4155 million), largely due to more scheduled repairsassociated with timing of outages and production disruptions;reduced spending;
•lower energy prices ($12 million);
•Canada Emergency Wage Subsidy (or “CEWS”) credit ($10 million);
•higher energycontribution from our internal power generation facilities ($7 million); and chemical costs ($31 million), mostly price-related;
higher market-driven wood•lower fiber costs ($286 million);
higher labor expense ($25 million), partly due to higher short-term incentive plan expense related to the Company’s performance, and an increase in maintenance-related labor costs; and
a rise in recycled fiber prices ($22 million);
partially offset by:
•increase in write-downs of mill stores and other supplies incurred in 2017 ($24 million), primarily as a resultinventory associated with the temporary idling of the permanent closure of twoAmos and Baie-Comeau paper machines at Calhoun atmills compared to the endprior year write-downs associated to the indefinite idling of the third quarter of 2017, a paper machine at Catawba (South Carolina) at the end of the second quarter of 2017, and the Mokpo (South Korea)Augusta (Georgia) paper mill in the first quarter of 2017; and
higher start-up costs incurred in 2017 ($1512 million), related to the Calhoun tissue manufacturing and converting facility, as well as the restart of a paper machine in Alma (Quebec).
Distribution costs
After removing the distribution costs related to Calhoun’s tissue operations, the lower volume, and the effect of restructuring initiatives, distribution costs increased by $59 million in 2018, largely due to higher truck and rail car rates, and an increase in the average length of haul.
Depreciation and amortization
Depreciation and amortization was $8$2 million greaterhigher in 2018, mainly explained2020, primarily due to the acquisition of the U.S. Sawmill Business ($7 million), offset by an increaselower depreciation on the integrated business management software, which was fully depreciated in the depreciation related to the Calhoun tissue manufacturing and converting facility, in line with the increase in production, partly offset by a decrease in the depreciation related to the Catawba facility, whose assets ceased to be depreciated at the end of the thirdfourth quarter of 2018 when they were classified as held for sale.2019 ($4 million).
Selling, general &and administrative expenses
Selling, general and administrative (or, “SG&A decreased by $5 million in 2018, largely reflecting:
cost reduction initiatives;
lower share-based compensation, which resulted from a decrease in share price; and
lower project costs;
partly offset by”) expenses were unchanged compared to the year-ago period, mainly due to higher short-term incentive plan expense, related to the Company’s performance.which is based on company performance, and higher stock-based compensation expense, offset by lower headcount, travel and entertainment expenses and overall lower expenses.
Closure costs, impairment and other related charges
See the corresponding variance analysis under “Corporate“Corporate and Other”Other” below.
Net gain on disposition of assets
See the corresponding variance analysis under “Corporate“Corporate and Other”Other” below.
Net income (loss) variance analysis
Non-operating pension and other postretirement benefit credits
We recorded non-operating pension and OPEB credits of $50nil for the full year in 2020, compared to $47 million in 2018,the year-ago period. The difference mainly reflects lower interest cost ($32 million) and an OPEB curtailment credit related to the indefinite idling of our Augusta mill ($14 million), partly offset by a settlement loss related to the wind-up of the pension plan of the Thorold paper mill that was indefinitely idled in 2017 and sold in 2020 ($28 million), higher amortization of actuarial losses ($29 million) and lower amortization of prior service credits ($7 million), lower expected return on plan assets ($25 million), and a pension special termination benefit cost related to the indefinite idling of our Augusta mill ($3 million).
Other expense, net
We recorded other expense, net of $4 million in 2020, compared to $7other expense, net of $22 million in the prior year. The increase is primarily due to: lower amortizationdifference mostly reflects a loss on forward commodities contracts of actuarial losses for$22 million, offset by a current period favorable insurance claim settlement of $15 million related to our U.S. pension plan, which became predominantly
inactive at year-endacquisition of Atlas in 2017, resulting in a longer amortization period; higher expected return on plan assets2015, compared to the $23 million provision related to the Fibrek Inc. (or, “Fibrek”) litigation recorded in the current year; and lower interest cost, as a result of the lower discount rate.year-ago period.
Income taxes
We recorded an income tax provision of $152$51 million in 2018,2020, on income before income taxes of $387$61 million, compared to an expected income tax provision of $81$13 million based on the U.S. federal statutory income tax rate of 21%. The difference reflects mostly:reflects: U.S. tax on non-U.S. earnings ($23 million); an increase to our valuation allowance related to our U.S. operations
($11 million) where we recognize a full valuation allowance against our net deferred income tax assets; foreign tax rate differences ($8910 million), including a $65 million income tax provision attributable to the global intangible low-taxed income (or “GILTI”) inclusion;; and foreign exchange items ($29 million); and the effect of a nondeductible goodwill impairment charge ($136 million); partly offset by a $59state income taxes ($6 million); and other, net ($6 million) mainly related to the settlement of an insurance claim in connection with our acquisition of Atlas.
We recorded an income tax provision of $58 million in 2019, on income before income taxes of $11 million, compared to an expected income tax provision of $2 million based on the U.S. federal statutory income tax rate of 21%. The difference mainly reflects: an increase to our valuation allowance reversal primarily related to our U.S. operations ($43 million) where we recognize a valuation allowance against virtually all of our net deferred income tax assets.
We recorded an income tax provision of $84 million in 2017, on income before income taxes of $6 million, compared to an expected income tax provision of $1 million based on the U.S. federal statutory income tax rate of 21%. The difference reflected mostly a $112 million valuation allowance primarily related to our U.S. operations where we recognized a valuation allowance against virtually all of our net deferred income tax assets, and a $12 million decrease to our deferred income tax assets due to the enactment of a lower foreign income tax rate, offset in part by state andassets; foreign tax rate differences ($3311 million),; and foreign exchange items ($6 million).
On December 22, 2017, the Tax Cuts and Jobs Act (or “TCJA”) was enacted into law which, among other changes, reduced the U.S. federal statutory income tax rate from 35% to 21%, and implemented a new system of taxation foron non-U.S. earnings including the imposition of a one-time transition tax on deemed repatriation of undistributed earnings of non-U.S. subsidiaries. Based on available information, we had provisionally estimated the impacts of the TCJA on our 2017 financial results, with the exception of the effects of the newly enacted GILTI regime as we were unable to determine a reasonable estimate. During the 12-month measurement period, we completed the accounting for the impacts of the TCJA with no material changes to provisional amounts recorded in the period of enactment. For more information, see Note 13, “Income Taxes,” to our Consolidated Financial Statements.($7 million); partly offset by state income taxes ($7 million).
Q4 of 20182020 vs. Q4 of 20172019
Operating income (loss) variance analysis
Sales
Sales increased by $34$101 million, or 4%15%, compared to the fourth quarter of 2017,2019, to $932$769 million. SalesAfter removing the sales related to the acquisition of the U.S. Sawmill Business in the first quarter of 2020, sales volume was $40 million lower, mainly due to lower shipments of paper, partially offset by higher volumes of wood products. Pricing had an unfavorablea favorable impact of $51$101 million, mainly reflecting a 46,000 metric ton decrease in market pulp shipments, as a result of lower production volumes associated with the timing of scheduled outages, operational disruptions, and weather-related wood shortages. Pricing contributed to a $72 millionan increase in sales, as the average transaction price increases of 21% for newsprint, 19%wood products, up by 67%, partly offset by lower average transaction price for market pulp, and 15% for specialty papers, more than offset the 21% drop in wood products. The inclusion of our Calhoun tissue operations’ results in our tissue segment increased salespaper, down by $15 million.
7%.
Cost of sales, excluding depreciation, amortization and distribution costs
COS was $25 million greater in the quarter. After removing the lower volume, the COS related to Calhoun’s tissue operations, and the effectacquisition of the Canadian dollar fluctuation, COS increased by $49 million, reflecting:
higher energy and chemical costs ($14 million), mainly due to higher prices;
an increase in maintenance costs ($12 million), in part due toU.S. Sawmill Business, the timingeffects of scheduled outages;
a rise in recycled fiber prices ($9 million);
higher wood fiber costs ($8 million), mostly market-driven; and
an increase in labor expense ($7 million);
partly offset by start-up costs incurred in the year-ago period ($8 million), related to the Calhoun tissue manufacturing and converting facility, as well as the restart of a paper machine in Alma.
Distribution costs
After removing the distribution costs related to Calhoun’s tissue operations, the lower volume and the effect of the weaker Canadian dollar, fluctuation, distribution costs roseCOS increased by $11 million in the fourth quarter of 2018, largely due to higher truck and rail car rates, and an increase in the average length of haul.
Depreciation and amortization
Depreciation and amortization was unchanged in the quarter, reflecting an increase in the depreciation related to the Calhoun tissue manufacturing and converting facility, in line with the increase in production, partly offset by a decrease in the depreciation related to the Catawba facility, whose assets ceased to be depreciated at the end of the third quarter of 2018 when they were classified as held for sale.
Selling, general & administrative expenses
SG&A decreased by $8$1 million in the quarter, primarily becausemainly reflecting higher stumpage costs related to current wood prices ($9 million) partly offset by favorable maintenance costs ($6 million), largely associated with timing of outages and reduced spending.
Selling, general and administrative expenses
SG&A expenses increased by $2 million in the quarter, mainly due to higher incentive plan expense, which is based on company performance, and higher stock-based compensation expense, mostly offset by lower project costs.headcount and lower overall expenses.
Closure costs, impairment and other related charges
In the fourth quarter of 2018,2020, we recorded closure costs, impairment and other related charges of $120$55 million, related to the assets from the 2015 acquisitiontemporary idling of Atlas, including: a goodwill impairment charge of $81 million; fixed assets impairmentour Amos and Baie-Comeau paper mills, including accelerated depreciation charges of $29 million;$38 million and intangible assets impairment chargesseverance and other costs of $10$17 million. This compares to closure costs, impairment and other related charges of $2 million recorded in the year-ago period.
Net gain on disposition of assets
We recorded a net gain on disposition of assets of $141 million in the fourth quarter of 2018, which included: the sale of the paper and pulp mill at Catawba for total cash consideration of $280 million (subject to final working capital adjustments), resulting in a net gain of $101 million; and the sale of the recycled bleached kraft (or “RBK”) pulp mill at Fairmont (West Virginia) for total cash consideration of $62 million, resulting in a net gain of $40 million. This compares to a net gain on disposition of assets of $13$18 million in the year-ago period, reflecting the sale of the assets of the permanently closed Mokpo paper mill for cash consideration of $18 million.
Net income variance analysis
Non-operating pension and other postretirement benefit credits
We recorded non-operating pension and OPEB credits of $12 million in the quarter, comparedmainly due to $1 million in the year-ago period. The increase is due in part to lower amortization of actuarial losses for our U.S. pension plan, which became predominantly inactive at year-end in 2017, resulting in a longer amortization period.
Income taxes
We recorded an income tax provision of $41 million in the fourth quarter of 2018, on income before income taxes of $77 million, compared to an expected income tax provision of $16 million based on the U.S. federal statutory income tax rate of
21%. The difference reflects mainly: foreign tax rate differences ($17 million), including a $12 million income tax provision attributable to the GILTI inclusion; foreign exchange items ($17 million); and the effect of a nondeductible goodwill impairment charge ($13 million); partly offset by a $19 million valuation allowance reversal primarily related to our U.S. operations where we recognize a valuation allowance against virtually all of our net deferred income tax assets.
We recorded an income tax provision of $21 million in the fourth quarter of 2017, on income before income taxes of $36 million, compared to an expected income tax provision of $8 million based on the U.S. federal statutory income tax rate of 21%. The difference reflected an $18 million valuation allowance primarily related to our U.S. operations where we recognized a valuation allowance against virtually all of our net deferred income tax assets, and foreign exchange items ($3 million), offset in part by state and foreign tax rate differences ($11 million).
2017 vs. 2016
Operating income (loss) variance analysis
Sales
Sales were $32 million, or 1%, lower in 2017, to $3,513 million. Despite higher shipments in wood products and market pulp, up 9% and 3%, respectively, sales volumes decreased, reflecting the capacity rationalization initiatives in newsprint and specialty papers, including the permanent closure of two paper machines at Calhoun, the permanent closure of a paper machine at Catawba, the indefinite idling of our Thorold (Ontario) paper mill in the first quarter of 2017, the permanent closure of the Mokpo paper mill, and the permanent closure of a newsprint machine at our Augusta, (Georgia) mill in the second quarter of 2016. Overall pricing had a favorable impact of $194 million, including the effect of currency of $3 million, reflecting a 23% increase in the average transaction price for wood products, and 6% for market pulp.
Cost of sales, excluding depreciation, amortization and distribution costs
COS improved by $122 million in 2017. Restructuring initiatives reduced COS by $237 million, including the elimination of $79 million in fixed manufacturing costs. After removing the higher volume and the effects of the Canadian dollar fluctuation and restructuring initiatives, COS increased by $84 million, reflecting:
write-downs of mill storesseverance and other supplies ($24 million), primarily as a resultcosts of the permanent closure$10 million and accelerated depreciation charges of two paper machines at Calhoun, a paper machine at Catawba, and the Mokpo paper mill, compared to write-downs$8 million.
start-up costs ($22 million) related to the Calhoun tissue manufacturing and converting facility and the restart of a paper machine at Alma, compared to start-up costs incurred in 2016 ($6 million) for the continuous pulp digester project and tissue manufacturing and converting facility in Calhoun;
lower contribution from our cogeneration assets that sell power externally ($8 million) and our hydroelectric facilities ($5 million), mostly due to planned maintenance outages;
unfavorable fiber costs ($12 million), mostly due to higher recycled fiber prices and wood costs;
higher natural gas prices ($10 million);
higher maintenance costs ($7 million);
a favorable power cost adjustment in Thunder Bay in 2016 ($6 million);
higher asset preservation costs ($6 million), primarily related to our indefinitely idled Thorold paper mill; and
the recognition of tax credits in connection with infrastructure investments in 2016 ($4 million);
partially offset by favorable chemical costs ($12 million), mainly price-related.
Distribution costs
After removing the unfavorable effect of the Canadian dollar fluctuation and the restructuring initiatives, distribution costs increased by $23 million in 2017, primarily due to higher freight rates, including the effect of the shortage of truck drivers, higher fuel surcharges, and an increase in the average length of haul.
Depreciation and amortization
Depreciation and amortization was $2 million lower in 2017, largely reflecting the reduced carrying value of our Coosa Pines assets after the impairment charge taken in the second quarter of 2017, the indefinite idling of our Thorold paper mill, and the permanent closure of a newsprint machine at our Augusta mill, partly offset by the amortization of costs associated with the Calhoun tissue manufacturing and converting facility, and the implementation of our integrated business management software.
Selling, general & administrative expenses
SG&A increased by $23 million in 2017, mainly because of higher compensation expense, including an $8 million increase in share-based compensation as a result of an increase in share price and the Company’s performance. The latter also caused a $5 million increase in short-term incentive plan expense. The additional SG&A related to our tissue facility in Calhoun contributed as well to the overall increase.
Closure costs, impairment and other related charges
See the corresponding variance analysis under “Corporate and Other” below.
Net gain on disposition of assets
See the corresponding variance analysis under “Corporate and Other” below.
Net loss variance analysis
Non-operating pension and other postretirement benefit (costs) credits (costs)
We recorded non-operating pension and OPEB creditscosts of $7$24 million in 2017,the quarter, compared to non-operating pension and OPEB costsa credit of $8$11 million in 2016.the year-ago period. The increase compared to 2016 is primarily due todifference mainly reflects: lower interest cost as a result($8 million); partly offset by settlement loss related to the wind-up of the lower discount rate,Thorold pension plan ($28 million), higher amortization of actuarial losses ($7 million) and higherlower expected return on plan assets.assets ($6 million).
Other expense, net
We recorded other expense, net of $28 million in the fourth quarter of 2020, compared to nil in the year-ago period. The difference mostly reflects a loss on forward commodities contracts of $15 million and a foreign exchange loss of $13 million in the current period.
Income taxes
We recorded an income tax provision of $84 million in 2017, on income before income taxes of $6 million. See the 2018 vs. 2017 variance analysis above.
We recorded an income tax provisionbenefit of $19$4 million in 2016,the fourth quarter of 2020, on a loss before income taxes of $57$56 million, compared to an expected income tax benefit of $12 million based on the U.S. federal statutory income tax rate of 21%. The difference reflectedreflects mostly a $99 milliondecrease to our valuation allowance primarily related to our U.S. operations where we recognized($10 million); partly offset by U.S. tax on non-U.S. earnings ($22 million).
We recorded an income tax provision of $6 million in the fourth quarter of 2019, on a fullloss before income taxes of $65 million, compared to an expected income tax benefit of $14 million based on the U.S. federal statutory income tax rate of 21%. The difference reflects mostly: an increase to our valuation allowance againstrelated to our net deferred income tax assets, and foreign exchange itemsU.S. operations ($925 million), partially; partly offset by a $55 million adjustment primarily related to the release of previously unrecognizedU.S. tax benefits due to the lapse of the statute of limitations of the applicable jurisdictions, and state and foreign tax rate differenceson non-U.S. earnings ($174 million).
2019 vs. 2018
For a variance analysis of our 2019 vs. 2018 results of operations, see Part II, Item 7, “Management’s Discussion and Analysis of Financial Condition and Results of Operations – Results of Operations – Consolidated Results – 2019 vs. 2018,” of our annual report on Form 10-K for the year ended December 31, 2019, filed with the SEC on March 2, 2020 (or, the “2019 Annual Report”).
Segment Earnings
We manage our business based on the products we manufacture. Our reportable segments correspond to our principal product lines: market pulp, tissue, wood products, and paper. As of the second quarter of 2020, the results from our newsprint and specialty papers.papers operations have been combined to form the paper reportable segment. This better reflects management’s internal analysis, given the diminishing percentage newsprint and specialty papers represent in our product portfolio. Comparative information has been modified to conform to this revised segment presentation.
We do not allocate any of the income or loss items following “operating income (loss)”income” in our Consolidated Statements of Operations to our segments because those items are reviewed separately by management. Similarly, we do not allocate to the segments: closure costs, impairment and other related charges; inventory write-downs related to closures; start-up costs; gains and losses on disposition of assets; as well as other discretionary charges or credits.
We allocate depreciation and amortization expense to our segments, although the related fixed assets and amortizable intangible assets are not allocated to segment assets. Additionally, all SG&A expenses are allocated to our segments, with the exception of certain discretionary charges and credits, which we present under “corporate and other.”
MARKET PULP
Highlights
| | | | | | | | | | | | | | | | | | | | | | | | | | | | | |
| Years Ended December 31, |
| (In millions, except where otherwise stated) | 2020 | | 2019 | | 2018 | |
| Sales | $ | 668 | | | $ | 797 | | | $ | 1,085 | | |
Operating (loss) income (1) | $ | (1) | | | $ | 39 | | | $ | 172 | | |
EBITDA (2) | $ | 23 | | | $ | 62 | | | $ | 199 | | |
| (In thousands of metric tons) | | | | | | | | | |
| Shipments | | 1,118 | | | | 1,156 | | | | 1,424 | | |
| Downtime | | 100 | | | | 56 | | | | 93 | | |
|
| | | | | | | | | | | | |
| Years Ended December 31, |
| (In millions, except where otherwise stated) | 2018 | | | 2017 | | | 2016 | | |
| Sales | $ | 1,085 |
| | $ | 911 |
| | $ | 836 |
| |
Operating income (1) | | 172 |
| | | 79 |
| | | 37 |
| |
EBITDA (2) | | 199 |
| | | 110 |
| | | 74 |
| |
| (In thousands of metric tons) | | | | | | | | | |
| Shipments | | 1,424 |
| | | 1,425 |
| | | 1,388 |
| |
| Downtime | | 93 |
| | | 84 |
| | | 65 |
| |
| | | | | | | | | | | | | | | | | | | | | | | | | | | | | |
| December 31, |
| (In thousands of metric tons) | 2020 | | 2019 | | 2018 | |
| Finished goods inventory | | 53 | | | | 68 | | | | 80 | | |
(1)Net (loss) income including noncontrolling interest is equal to operating (loss) income in this segment. |
| | | | | | | | | | | | |
| December 31, |
| (In thousands of metric tons) | 2018 | | | 2017 | | | 2016 | | |
| Finished goods inventory | | 80 |
| | | 89 |
| | | 91 |
| |
| |
(1)
| Net income including noncontrolling interests is equal to operating income in this segment. |
| |
(2)
| EBITDA, a non-GAAP financial measure, is reconciled below. For more information on the calculation and reasons we include this measure, see note 1 under “Results of Operations – Consolidated Results – Selected Annual Financial Information” above.
|
(2)EBITDA, a non-GAAP financial measure, is reconciled below. For more information on the calculation and reasons we include this measure, see note 1 under “Results of Operations – Consolidated Results – Selected annual financial information” above. | | | Years Ended December 31, | | Years Ended December 31, |
| (In millions) | 2018 | | | 2017 | | | 2016 | | | (In millions) | 2020 | | 2019 | | 2018 | |
| Net income including noncontrolling interests | $ | 172 |
| | $ | 79 |
| | $ | 37 |
| | |
| Net (loss) income including noncontrolling interest | | Net (loss) income including noncontrolling interest | $ | (1) | | | $ | 39 | | | $ | 172 | | |
| Depreciation and amortization | | 27 |
| | 31 |
| | 37 |
| | Depreciation and amortization | | 24 | | | 23 | | | 27 | | |
| EBITDA | | 199 |
| | 110 |
| | 74 |
| | EBITDA | $ | 23 | | | $ | 62 | | | $ | 199 | | |
Industry trends
World demand for chemical pulp fellgrew by 0.9%3% in 2018,2020 compared to the year-ago period, reflecting decreasesan increase of 4.6%7.7% in China and 2.5%of 6.5% in North America, and China, respectively, whilepartly offset by a decrease of 6.5% in Western Europe was up 1.4%.Europe. World capacity grew by 4.7%0.8% over the same period.
World demand for softwood pulp fell by 3.2%1.7% in 2018. This reflects decreases2020, reflecting a decrease of 7.3% and 2.1% in shipments toWestern Europe and China, respectively, while North America and Western Europe of 7.2%, 2.6%, and 1.9%, respectively. increased by 4.5%. The operating rate was 91%.
In the same period, demand for hardwood pulp was essentially unchanged,rose by 6.0%, with shipments to Western EuropeChina and North America up by 3.4%13.0% and 9.6%, respectively, while North AmericaWestern Europe was down by 7.8%, and China remained unchanged.
6.5%. The operating rate for softwood pulp was 88% in 2018, and for hardwood pulp was 86%, largely reflecting industry production disruptions, as well as softening in Chinese buying activity in the latter part of 2018.94%.
20182020 vs. 20172019
Operating (loss) income variance analysis
Sales
Sales were $174$129 million higher,lower, or 19%16%, decreasing to $1,085$668 million in 2018, virtually all attributable2020, primarily due to the $123lower pricing, reflecting a $92 per metric ton increasedecline in the average transaction price reflecting higher market prices across all grades. Shipments were largely unchanged, despite the extended investment-relatedVolume also decreased sales by $26 million primarily due to pandemic-induced market downtime at the Saint-Félicien mill in 2018.for recycled bleached kraft pulp.
Cost of sales, excluding depreciation, amortization and distribution costs
Manufacturing costs increased by $64 million afterAfter adjusting for the effect of the Canadian dollar fluctuation, reflecting:
an increase in maintenance and labor costs ($23 million), largely associated with scheduled outages and production disruptions;
higher recycled fiber prices ($22 million);
higher steam costs ($9 million), mostly due to unfavorable steam usage; and
higher chemical costs ($6 million), mostly price-related.
Distribution costs
Distribution costs rose by $16 million in 2018, largely reflecting higher truck and rail car rates, and an increase in the average length of haul.
Depreciation and amortization
Depreciation and amortization was $4 million lower in 2018, largely attributable to the assets of the paper and pulp mill at Catawba, which ceased to be depreciated at the end of the third quarter of 2018 when they were classified as held for sale.
2017 vs. 2016
Operating income variance analysis
Sales
Sales were $75 million higher, or 9%, to $911 million in 2017. The average transaction price rose by $37 per metric ton, mainly as a result of higher market prices across all grades. Shipments were also 37,000 metric tons higher, due to improved productivity, and incremental production following the closure of two paper machines in Calhoun, partly offset by lower shipments of RBK, given unfavorable market conditions.
We recorded 19,000 more metric tons of downtime in 2017 compared to the prior year, mainly as a result of additional production slowback at the RBK mills.
Cost of sales, excluding depreciation, amortization and distribution costs
COS increased by $30 million in 2017. After removing the higher volume and the effect of the Canadian dollar fluctuation, manufacturing costs increaseddecreased by $14$59 million, reflecting:
higher•favorable maintenance and labor costs ($626 million);, largely associated with timing of outages and reduced spending;
higher•lower wood fiber costs ($516 million); and
•lower energy prices ($8 million), mostly due toincluding higher recycled fiber prices, offset in part by better usage;
higher natural gas prices ($4 million); and
lower contribution from our cogeneration assets in Saint-Félicien that sellinternal power externally ($4 million);generation facilities.
partly offset by favorable chemicalDistribution costs ($4 million).
Depreciation and amortization
Depreciation and amortization was $6After adjusting for the effect of lower volume, distribution costs were $8 million lower in 2017, largely reflecting the reduced carrying value2020 due to lower freight rates and favorable destination mix.
2019 vs. 2018
For a variance analysis of our Coosa Pines assets after the impairment charge taken in the second quarter2019 vs. 2018 results of 2017.operations, see Part II, Item 7, “Management’s Discussion and Analysis of Financial Condition and Results of Operations – Results of Operations – Segment Earnings – Market Pulp – 2019 vs. 2018,” of our 2019 Annual Report.
TISSUE
Highlights
| | | | | | | | | | | | | | | | | | | | | | | | | | | | | |
| Years Ended December 31, |
| (In millions, except where otherwise stated) | 2020 | | 2019 | | 2018 | |
| Sales | $ | 173 | | | $ | 165 | | | $ | 130 | | |
Operating loss (1) | $ | (1) | | | $ | (16) | | | $ | (30) | | |
EBITDA (2) | $ | 17 | | | $ | 2 | | | $ | (15) | | |
| (In thousands of short tons) | | | | | | | | | |
Shipments (3) | | 95 | | | | 97 | | | | 84 | | |
| Downtime | | 8 | | | | 2 | | | | 2 | | |
|
| | | | | | | | | | | | |
| Years Ended December 31, |
| (In millions, except where otherwise stated) | 2018 | | | 2017 | | | 2016 | | |
| Sales | $ | 130 |
| | $ | 81 |
| | $ | 89 |
| |
Operating loss (1) | | (30 | ) | | | (6 | ) | | | (10 | ) | |
EBITDA (2) | | (15 | ) | | | (1 | ) | | | (5 | ) | |
| (In thousands of short tons) | | | | | | | | | |
Shipments (3) | | 84 |
| | | 53 |
| | | 54 |
| |
| Downtime | | 2 |
| | | 1 |
| | | — |
| |
| | | | | | | | | | | | | | | | | | | | | | | | | | | | | |
| December 31, |
| (In thousands of short tons) | 2020 | | 2019 | | 2018 | |
Finished goods inventory (3) | | 6 | | | | 8 | | | | 5 | | |
(1)Net loss including noncontrolling interest is equal to operating loss in this segment. |
| | | | | | | | | | | | |
| December 31, |
| (In thousands of short tons) | 2018 | | | 2017 | | | 2016 | | |
Finished goods inventory (3) | | 5 |
| | | 11 |
| | | 5 |
| |
| |
(1)
| Net loss including noncontrolling interests is equal to operating loss in this segment. |
| |
(2)
| EBITDA, a non-GAAP financial measure, is reconciled below. For more information on the calculation and reasons we include this measure, see note 1 under “Results of Operations – Consolidated Results – Selected Annual Financial Information” above.
|
| |
(3)
| Tissue converted products, which are measured in cases, are converted to short tons. |
(2)EBITDA, a non-GAAP financial measure, is reconciled below. For more information on the calculation and reasons we include this measure, see note 1 under “Results of Operations – Consolidated Results – Selected annual financial information” above. |
| | | | | | | | | | | | |
| Years Ended December 31, |
| (In millions) | 2018 | | | 2017 | | | 2016 | | |
| Net loss including noncontrolling interests | $ | (30 | ) | | $ | (6 | ) | | $ | (10 | ) | |
| Depreciation and amortization | | 15 |
| | | 5 |
| | | 5 |
| |
| EBITDA | | (15 | ) | | | (1 | ) | | | (5 | ) | |
The operating results of our Calhoun tissue operations, previously recorded under “corporate and other,” have been recorded in our tissue segment since April 1, 2018. | | | | | | | | | | | | | | | | | | | | | | | | | | | | | |
| Years Ended December 31, |
| (In millions) | 2020 | | 2019 | | 2018 | |
| Net loss including noncontrolling interest | $ | (1) | | | $ | (16) | | | $ | (30) | | |
| Depreciation and amortization | | 18 | | | | 18 | | | | 15 | | |
| EBITDA | $ | 17 | | | $ | 2 | | | $ | (15) | | |
Industry trends
Total U.S. tissue consumption in the U.S. grew by 2.5%8.6% in 2018. U.S. converted tissue products2020 compared to the year-ago period. Converted product shipments were upincreased by 2.1%8.1%, led by away-from homeat-home shipments which grewup by 3.4%16.3%, while at-homeaway-from-home shipments increaseddecreased by 1.5%8.5%.
U.S. parent roll production increased by 1.6%7.0% in 2018,2020, contributing to a 93%97% average industry production-to-capacity ratio, unchangedup from 2017.93% in the year-ago period.
2020 vs. 20172019
Operating loss variance analysis
Sales
Sales were $49$8 million greater,higher, or 60%5%, increasing to $130$173 million in 2018, reflecting an increase2020. Shipments were essentially unchanged as productivity gains for retail products manufactured at the Calhoun operations compensated for a pandemic-driven drop in shipments of 31,000away-from-home demand affecting Florida operations. The average transaction price was $107 per short tons attributableton higher, mainly due to the inclusion of Calhoun’s results in our tissue segment since April 1, 2018, and favorable product mix. Sales volumes from our Calhoun tissue facility increased in 2018, reflecting growing Resolute tissue brand awareness in the marketplace.prices for converted products.
Cost of sales, excluding depreciation, amortization and distribution costs
After removing the higher volume and the COS related to Calhoun’s operations, our manufacturing costs increased by $1 million in 2018, mainly due to scheduled maintenance costs. The operating cost per unit remained elevated at $1,916 per short ton, as we continued to ramp up the productioneffects of the tissue machine and converting lines at Calhoun in 2018, with a focus on improving productivity and quality.
Depreciation and amortization
Depreciation and amortization was $10 million higher in 2018, mostly attributable to the inclusion of Calhoun’s results in our tissue segment.
2017 vs. 2016
Operating loss variance analysis
The operating loss variance analysis for the tissue segment includes only the results of Atlas. The operating loss, excluding depreciation and amortization, of $25 million incurred in 2017, for our Calhoun tissue manufacturing and converting facility, was recorded as start-up costs under “corporate and other.”
Sales
Sales were $8 million lower, or 9%, to $81 million in 2017. The average transaction price dropped by $114 per short ton, or 7%, as a result of unfavorable product mix. The decrease in shipments was mainly attributable to converted products, in part due to the discontinuance of unprofitable away-from-home business, mostly offset by an increase in parent roll shipments.
Cost of sales, excluding depreciation, amortization and distribution costs
After removing the lower volume, our manufacturing costs decreased by $3 million compared to 2019, mainly due to lower fiber costs.
Distribution costs
Distribution costs improved by $6$3 million, in 2017, despite facility damagemainly as a result of better customer mix.
2019 vs. 2018
For a variance analysis of our 2019 vs. 2018 results of operations, see Part II, Item 7, “Management’s Discussion and business interruption costs associated with Hurricane Irma. The cost improvement was primarily attributable to lower maintenanceAnalysis of Financial Condition and related labor costs, improved material usage, as well as integration costs recorded in 2016.Results of Operations – Results of Operations – Segment Earnings – Tissue – 2019 vs. 2018,” of our 2019 Annual Report.
WOOD PRODUCTS
Highlights | | | | | | | | | | | | | | | | | | | | | | | | | | | | | |
| Years Ended December 31, |
| (In millions, except where otherwise stated) | 2020 | | 2019 | | 2018 | |
| Sales | $ | 1,025 | | | $ | 616 | | | $ | 823 | | |
Operating income (loss) (1) | $ | 276 | | | $ | (6) | | | $ | 169 | | |
EBITDA (2) | $ | 319 | | | $ | 28 | | | $ | 201 | | |
| (In million board feet) | | | | | | | | | |
Shipments (3) | | 2,043 | | | | 1,731 | | | | 1,846 | | |
| Downtime | | 279 | | | | 242 | | | | 147 | | |
|
| | | | | | | | | | | | |
| Years Ended December 31, |
| (In millions, except where otherwise stated) | 2018 | | | 2017 | | | 2016 | | |
| Sales | $ | 823 |
| | $ | 797 |
| | $ | 596 |
| |
Operating income (1) | | 169 |
| | | 186 |
| | | 69 |
| |
EBITDA (2) | | 201 |
| | | 219 |
| | | 100 |
| |
| (In million board feet) | | | | | | | | | |
Shipments (3) | | 1,846 |
| | | 2,011 |
| | | 1,844 |
| |
Downtime (3) | | 147 |
| | | 130 |
| | | 199 |
| |
| | | | | | | | | | | | | | | | | | | | | | | | | | | | | |
| December 31, |
| (In million board feet) | 2020 | | 2019 | | 2018 | |
Finished goods inventory (3) | | 97 | | | | 133 | | | | 157 | | |
(1)Net income (loss) including noncontrolling interest is equal to operating income (loss) in this segment. |
| | | | | | | | | | | | |
| December 31, |
| (In million board feet) | 2018 | | | 2017 | | | 2016 | | |
Finished goods inventory (3) | | 157 |
| | | 124 |
| | | 124 |
| |
| |
(1)
| Net income including noncontrolling interests is equal to operating income in this segment. |
| |
(2)
| EBITDA, a non-GAAP financial measure, is reconciled below. For more information on the calculation and reasons we include this measure, see note 1 under “Results of Operations – Consolidated Results – Selected Annual Financial Information” above.
|
| |
(3)
| Includes wood pellets measured by mass, converted to board feet using a density-based conversion ratio. |
(2)EBITDA, a non-GAAP financial measure, is reconciled below. For more information on the calculation and reasons we include this measure, see note 1 under “Results of Operations – Consolidated Results – Selected annual financial information” above. |
| | | | | | | | | | | | |
| Years Ended December 31, |
| (In millions) | 2018 | | | 2017 | | | 2016 | | |
| Net income including noncontrolling interests | $ | 169 |
| | $ | 186 |
| | $ | 69 |
| |
| Depreciation and amortization | | 32 |
| | | 33 |
| | | 31 |
| |
| EBITDA | | 201 |
| | | 219 |
| | | 100 |
| |
| | | | | | | | | | | | | | | | | | | | | | | | | | | | | |
| Years Ended December 31, |
| (In millions) | 2020 | | 2019 | | 2018 | |
| Net income (loss) including noncontrolling interest | $ | 276 | | | $ | (6) | | | $ | 169 | | |
| Depreciation and amortization | | 43 | | | | 34 | | | | 32 | | |
| EBITDA | $ | 319 | | | $ | 28 | | | $ | 201 | | |
Industry trends
2018 U.S. housing starts were 1.21.4 million on a seasonally adjusted basis in 2020, up by 3.6%7.9% compared to 2017,2019, which reflects a 5.5% increase in multi-family starts, and a 2.8%12.3% increase in single-family starts, offset by a decrease of 1.9% in multi-family starts.
The 2x4 – Random Length (or, “RL”) #1-2 Kiln Dried Great Lakes (or, “KD GL”) price rose by 44.3% in 2020 compared to the year ago period, and the 2x4x8 Stud KD GL price rose by 70.4%. The 2x4 – RL #2 KD Southern Pine (Eastside) price increased by 46.3%, and the 2x4 – RL #2 KD Southern Pine (Westside) price was up by 48.2%.
2020 vs. 20172019
Operating income (loss) variance analysis
Sales
Sales were $26$409 million higher, or 3%66%, to $823$1,025 million in 2018. The2020, reflecting new volume related to the acquisition of the U.S. Sawmill Business, the increase in market demand for home repairs and remodeling, and stronger U.S. market housing starts. Shipments rose by 312 million board feet and the average transaction price roseincreased by $50$146 per thousand board feet, or 13%, largely due41%. After removing the sales related to supply constraints in the first halfacquisition of the year, partly offset by weaker lumber market conditionsU.S. Sawmill Business, sales were $272 million higher. Pricing contributed to $239 million increase, reflecting a rise in the latter part of 2018. Shipments, however, were lower by 165average transaction price, and sales volume was $33 million board feet, reflecting:
a temporary production curtailment of 10% in the fourth quarter of 2018, given challenging market and weather conditions;
lower productivity; and
the sale of the Saint-Hilarion (Quebec) sawmill and the consolidation of our two sawmills at Senneterre in the third quarter of 2017.
Despite market and weather-related production curtailment in the fourth quarter of 2018, finishedhigher. Finished goods inventory increaseddropped to 15797 million board feet.
Cost of sales, excluding depreciation, amortization and distribution costs
After adjusting forremoving the lowerCOS related to the acquisition of the U.S. Sawmill Business, the effects of higher volume and the effect of theweaker Canadian dollar, fluctuation, manufacturing costs increased by $67$11 million, reflecting:mainly reflecting higher wood fiber costs ($51 million), almost entirely market-driven; and an increase in maintenance costs ($9 million).log costs.
Distribution costs
After removing the lowerCOS related to the acquisition of the U.S. Sawmill Business and the effects of higher volume, distribution costs increased by $7$8 million, in 2018, mostly reflectingmainly as a result of higher freight rates.rates and unfavorable destination mix.
Depreciation and amortization
2017Depreciation and amortization increased by $9 million compared to the year-ago period, primarily due to the acquisition of the U.S. Sawmill Business.
2019 vs. 20162018
For a variance analysis of our 2019 vs. 2018 results of operations, see Part II, Item 7, “Management’s Discussion and Analysis of Financial Condition and Results of Operations – Results of Operations – Segment Earnings – Wood Products – 2019 vs. 2018,” of our 2019 Annual Report.
PAPER
Highlights | | | | | | | | | | | | | | | | | | | | | | | | | | | | | |
| Years Ended December 31, |
| (In millions, except where otherwise stated) | 2020 | | 2019 | | 2018 | |
| Sales | $ | 934 | | | $ | 1,345 | | | $ | 1,718 | | |
Operating (loss) income (1) | $ | (46) | | | $ | 82 | | | $ | 114 | | |
EBITDA (2) | $ | 23 | | | $ | 154 | | | $ | 227 | | |
| (In thousands of metric tons) | | | | | | | | | |
| Shipments | | 1,577 | | | | 2,017 | | | | 2,532 | | |
| Downtime | | 514 | | | | 203 | | | | 42 | | |
| | | | | | | | | | | | | | | | | | | | | | | | | | | | | |
| December 31, |
| (In thousands of metric tons) | 2020 | | 2019 | | 2018 | |
| Finished goods inventory | | 96 | | | | 142 | | | | 150 | | |
(1)Net (loss) income including noncontrolling interest is equal to operating (loss) income in this segment.
(2)EBITDA, a non-GAAP financial measure, is reconciled below. For more information on the calculation and reasons we include this measure, see note 1 under “Results of Operations – Consolidated Results – Selected annual financial information” above.
| | | | | | | | | | | | | | | | | | | | | | | | | | | | | |
| Years Ended December 31, |
| (In millions) | 2020 | | 2019 | | 2018 | |
| Net (loss) income including noncontrolling interest | $ | (46) | | | $ | 82 | | | $ | 114 | | |
| Depreciation and amortization | | 69 | | | | 72 | | | | 113 | | |
| EBITDA | $ | 23 | | | $ | 154 | | | $ | 227 | | |
Industry trends
North American newsprint demand fell by 26.2% in 2020, compared to 2019. Demand from newspaper publishers fell by 29.4%, while demand from commercial printers also decreased, by 21.4%. The North American shipment-to-capacity ratio was 75%, compared to 83% in the year-ago-period.
Global demand for newsprint fell by 22.6% in 2020, with Asia down by 20.3%, and Western Europe down by 21.5%. Accordingly, the global operating rate decreased to 72%, down from 84% in 2019.
North American demand for uncoated mechanical papers was down by 23.2% in 2020 compared to the year-ago-period, reflecting a 29.0% decrease in supercalendered (or, “SC”) grades, and a 17.3% drop in standard grades. Compared to 2019, the shipment-to-capacity ratio for all uncoated mechanical papers decreased from 83% to 73%.
2020 vs. 2019
Operating (loss) income variance analysis
Sales
Sales were $201fell by $411 million, higher, or 34%31%, to $797$934 million in 2017.2020. Shipments were higherdecreased by 167 million board feet,440,000 metric tons, largely reflecting improved productivitymuch lower demand levels since the onset of the pandemic and our resulting capacity adjustments particularly for certain sawmills, incremental capacity from our sawmill in Senneterre – Lac-Clair (Quebec), which has been consolidated with our Senneterre sawmill, as well as a 69 million board feet reduction in downtime compared to 2016, which included downtime taken due to unfavorable pricing for eight-foot stud grades.marketing-dependent products and commercial paper. The average transaction price increaseddropped by $73$75 per thousand board feet, or 23%, largelymetric ton compared to 2019 due to supply constraints from a very active 2017 forest fire season in British Columbia and marginally improving demand inweaker market fundamentals accelerated by the U.S. housing market.pandemic.
Cost of sales, excluding depreciation, amortization and distribution costs
AfterManufacturing costs decreased by $41 million after adjusting for the higher volume and the effecteffects of the Canadian dollar fluctuation, manufacturing costs increased by $28 million, reflecting higher fiber costs ($12 million), including higher stumpage fees in the province of Quebec and higher transportation costs, and higher maintenance, log yard and other related costs ($8 million).
Distribution costs
After removing the higher volume and the effect of the Canadian dollar fluctuation, distribution costs increased by $6 million, primarily as a result of higher freight rates.
NEWSPRINT
|
| | | | | | | | | | | | |
| Years Ended December 31, |
| (In millions, except where otherwise stated) | 2018 | | | 2017 | | | 2016 | | |
| Sales | $ | 907 |
| | $ | 842 |
| | $ | 1,009 |
| |
Operating income (loss) (1) | | 74 |
| | | (23 | ) | | | (16 | ) | |
EBITDA (2) | | 140 |
| | | 43 |
| | | 58 |
| |
| (In thousands of metric tons) | | | | | | | | | |
| Shipments | | 1,507 |
| | | 1,638 |
| | | 1,992 |
| |
| Downtime | | 22 |
| | | 55 |
| | | 81 |
| |
|
| | | | | | | | | | | | |
| December 31, |
| (In thousands of metric tons) | 2018 | | | 2017 | | | 2016 | | |
| Finished goods inventory | | 101 |
| | | 78 |
| | | 105 |
| |
| |
(1)
| Net income (loss) including noncontrolling interests is equal to operating income (loss) in this segment. |
| |
(2)
| EBITDA, a non-GAAP financial measure, is reconciled below. For more information on the calculation and reasons we include this measure, see note 1 under “Results of Operations – Consolidated Results – Selected Annual Financial Information” above.
|
|
| | | | | | | | | | | | |
| Years Ended December 31, |
| (In millions) | 2018 | | | 2017 | | | 2016 | | |
| Net income (loss) including noncontrolling interests | $ | 74 |
| | $ | (23 | ) | | $ | (16 | ) | |
| Depreciation and amortization | | 66 |
| | | 66 |
| | | 74 |
| |
| EBITDA | | 140 |
| | | 43 |
| | | 58 |
| |
Industry trends
North American demand for newsprint declined by 11.1% in 2018, driven by a reduction in demand from newspaper publishers, down by 14.0%. Demand from commercial printers also decreased, dropping by 6.5%. The North American shipment-to-capacity ratio was 94% in 2018, unchanged from the prior year.
Global demand for newsprint was down by 7.8% in 2018, with Western Europe down 8.2%, and Asia 6.8%. The global operating rate was 90%, unchanged from 2017.
2018 vs. 2017
Operating income (loss) variance analysis
Sales
Newsprint sales increased by $65 million, or 8%, to $907 million in 2018, reflecting an increase of $88 per metric ton in the average transaction price, as price increases were realized in both North American and export markets. Shipments, however, were lower by 131,000 metric tons, or 8%, mostly due to the paper machine closures at Calhoun, and the permanent closure of the Mokpo paper mill. We recorded 22,000 metric tons of downtime in 2018, compared to 55,000 metric tons in the prior year, which included downtime taken in the latter part of 2017 due to softer market conditions.
Compared to 2017, our domestic shipments fell by 11%, and our international shipments by 4%. Domestic shipments represented 61% of total newsprint shipments in 2018, essentially unchanged from 2017.
Cost of sales, excluding depreciation, amortization and distribution costs
COS was $36 million lower in 2018. Restructuring initiatives reduced COS by $60 million, including the elimination of $18 million in fixed manufacturing costs. After removing the lower volume and the effects of theweaker Canadian dollar, fluctuation and restructuring initiatives, manufacturingreflecting:
•favorable maintenance costs increased by $27 million, reflecting:
higher maintenance and labor costs ($2328 million), mainly due to more planned repairs and production disruptions;
higher power prices ($5 million), largely related to unusual weather conditions in 2018;
lower contribution from our cogeneration facilities ($3 million), mostly the result of a turbine failure; and
higher chemical costs ($3 million), mostly price-related;
partly offset by lower wood fiber costs ($11 million), almost entirely market-driven.
Distribution costs
After removing the lower volume and the effect of restructuring initiatives, distribution costs increased by $15 million, mainly due to higher truck and rail car rates, and an increase in the average length of haul.
2017 vs. 2016
Operating loss variance analysis
Sales
Newsprint sales dropped by $167 million, or 17%, to $842 million in 2017, reflecting a 354,000 metric ton decrease in shipments, due to the lower production volumes following the paper machine closures at Calhoun,reduced spending as well as the indefinite idling of our Thorold paperAugusta mill, partly offset by the permanent closuretemporary idling of the MokpoAmos and Baie-Comeau paper mill,mills;
•lower energy prices ($6 million); and the permanent closure of a newsprint machine at our Augusta mill. In 2017, global capacity reductions exceeded declines in demand, resulting in favorable short-term market conditions for newsprint, particularly in the latter part of the year. The average transaction price increased by $8 per metric ton, as price increases were realized in North America, and our finished goods inventory fell by 27,000 metric tons.
Compared to 2016, our international shipments fell by 21%, and our domestic shipments by 15%. Accordingly, our domestic shipments represented 62% of total newsprint shipments in 2017, up by 1% from 2016.
We recorded 55,000 metric tons of downtime in 2017, compared to 81,000 metric tons in the prior year, which included downtime related to our Thorold paper mill, which has since been indefinitely idled.
Cost of sales, excluding depreciation, amortization and distribution costs
COS was $141 million lower in 2017. Restructuring initiatives reduced COS by $172 million, including the elimination of $47 million in fixed manufacturing costs. After removing the •higher volume and the effects of the Canadian dollar fluctuation and restructuring initiatives, manufacturing costs increased by $21 million, reflecting:
higher power costs ($10 million), mostly due to a favorable adjustment in Thunder Bay in 2016, and unfavorable usage;
lower contribution from our cogenerationinternal power generation facilities ($65 million), mostly the result of a more extensive planned maintenance outage in 2017 at Thunder Bay; and
unfavorable steam costs ($3 million), mainly due to higher natural gas prices.
Distribution costs
After removing the effect of restructuring initiatives, distribution costs increased by $7 million, primarily as a result of higher freight rates, higher fuel surcharges, and an increase in the average length of haul.
Depreciation and amortization
The lower depreciation and amortization was due to the indefinite idling of our Thorold paper mill and the permanent closure of a newsprint machine at our Augusta mill..
Selling, general and administrative expenses
The higher overall SG&A were mostly offsetexpenses decreased by $12 million in the year, mainly due to lower allocated expenses asheadcount and travel and entertainment expenses.
2019 vs. 2018
As of the second quarter of 2020, the results from our newsprint and specialty papers operations have been combined to form the paper reportable segment. For a resultvariance analysis of capacity reductions.our 2019 vs. 2018 results of operations, see Part II, Item 7, “Management’s Discussion and Analysis of Financial Condition and Results of Operations – Results of Operations – Segment Earnings – Newsprint – 2019 vs. 2018,” and “Management’s Discussion and Analysis of Financial Condition and Results of Operations – Results of Operations – Segment Earnings– Specialty Papers – 2019 vs. 2018,” of our 2019 Annual Report.
SPECIALTY PAPERS
CORPORATEAND OTHER
Highlights
| | | | | | | | | | | | | | | | | | | | | | | | | | | | | |
| Years Ended December 31, |
| (In millions) | 2020 | | 2019 | | 2018 | |
| Cost of sales, excluding depreciation, amortization and distribution costs | $ | (34) | | | $ | (23) | | | $ | (12) | | |
| Depreciation and amortization | | (15) | | | | (20) | | | | (25) | | |
| | | | | | | | | |
| Selling, general and administrative expenses | | (38) | | | | (23) | | | | (33) | | |
| Closure costs, impairment and other related charges | | (53) | | | | (18) | | | | (121) | | |
| Net gain on disposition of assets | | 11 | | | | 2 | | | | 145 | | |
| Operating loss | | (129) | | | | (82) | | | | (46) | | |
| Interest expense | | (34) | | | | (31) | | | | (47) | | |
| Non-operating pension and other postretirement benefit credits | | — | | | | 47 | | | | 50 | | |
| Other (expense) income, net | | (4) | | | | (22) | | | | 5 | | |
| Income tax provision | | (51) | | | | (58) | | | | (152) | | |
| Net loss including noncontrolling interest | $ | (218) | | | $ | (146) | | | $ | (190) | | |
|
| | | | | | | | | | | | |
| Years Ended December 31, |
| (In millions, except where otherwise stated) | 2018 | | | 2017 | | | 2016 | | |
| Sales | $ | 811 |
| | $ | 882 |
| | $ | 1,015 |
| |
Operating income (loss) (1) | | 40 |
| | | (9 | ) | | | 19 |
| |
EBITDA (2) | | 87 |
| | | 36 |
| | | 64 |
| |
| (In thousands of short tons) | | | | | | | | | |
| Shipments | | 1,130 |
| | | 1,343 |
| | | 1,514 |
| |
| Downtime | | 21 |
| | | 33 |
| | | 22 |
| |
|
| | | | | | | | | | | | |
| December 31, |
| (In thousands of short tons) | 2018 | | | 2017 | | | 2016 | | |
| Finished goods inventory | | 54 |
| | | 66 |
| | | 92 |
| |
| |
(1)
| Net income (loss) including noncontrolling interests is equal to operating income (loss) in this segment. |
| |
(2)
| EBITDA, a non-GAAP financial measure, is reconciled below. For more information on the calculation and reasons we include this measure, see note 1 under “Results of Operations – Consolidated Results – Selected Annual Financial Information” above.
|
|
| | | | | | | | | | | | |
| Years Ended December 31, |
| (In millions) | 2018 | | | 2017 | | | 2016 | | |
| Net income (loss) including noncontrolling interests | $ | 40 |
| | $ | (9 | ) | | $ | 19 |
| |
| Depreciation and amortization | | 47 |
| | | 45 |
| | | 45 |
| |
| EBITDA | | 87 |
| | | 36 |
| | | 64 |
| |
Industry trends
North American demand for uncoated mechanical papers was down by 6.1% in 2018. Lower demand for standard papers drove this decline, decreasing by 8.7%, while the demand for supercalendered (or “SC”) grades was down by only 0.7%. The operating rate increased to 92%, compared to 90% in the prior year.
North American coated mechanical paper demand was down by 7.6% in 2018. Industry production, however, was significantly lower, down by 324,000 short tons, or 13.8%, while imports rose by 88,000 short tons, or 22.3%. Operating rates in North America were 95% in 2018, unchanged from 2017. With the sale of the Catawba facility, we have exited coated mechanical grades.
2018 vs. 2017
Operating income (loss) variance analysis
Sales
Specialty paper sales decreased by $71 million, or 8%, to $811 million in 2018. While the average transaction price rose by $61 per short ton, reflecting price increases across all grades, shipments decreased by 213,000 short tons, or 16%, largely due to the permanent closure of two paper machines at Calhoun and one paper machine at Catawba.
Cost of sales, excluding depreciation, amortization and distribution costs
COS was $120 million lower in 2018. Restructuring initiatives reduced COS by $110 million, including the elimination of $34 million in fixed manufacturing costs. After removing the lower volume and the effects of the Canadian dollar fluctuation and restructuring initiatives, manufacturing costs improved by $6 million, reflecting:
lower wood fiber costs ($11 million), almost entirely market-driven; and
higher internal hydroelectric generation ($8 million), due to investments in 2017, in part to improve productivity;
offset in part by:
higher power and steam costs ($5 million), mostly due to unfavorable steam usage;
an increase in maintenance and related labor costs ($5 million); and
higher chemical prices ($4 million).
Distribution costs
After removing the lower volume and the effect of restructuring initiatives, distribution costs increased by $19 million, reflecting higher freight rates, and an increase in the average length of haul.
2017 vs. 2016
Operating (loss) income variance analysis
Sales
Specialty paper sales decreased by $133 million, or 13%, to $882 million in 2017. The average transaction price dropped by $14 per short ton, despite some pricing gains realized in the latter part of 2017. Shipments were 171,000 short tons lower, or 11%, mainly in white and coated paper grades, largely due to declining market conditions, which led to the permanent closure of two paper machines at Calhoun, and one paper machine at Catawba, partly offset by an increase due to the restart of a paper machine at Alma. Finished goods fell by 26,000 short tons.
Cost of sales, excluding depreciation, amortization and distribution costs
COS was $102 million lower in 2017. Restructuring initiatives reduced COS by $65 million, including the elimination of $32 million in fixed manufacturing costs. After removing the lower volume and the effects of the Canadian dollar fluctuation and restructuring initiatives, manufacturing costs improved by $9 million, reflecting:
favorable chemical costs ($9 million), mainly price-related;
lower power costs ($5 million), mostly price-related; and
higher contribution from our cogeneration assets in Dolbeau that sell power externally ($2 million);
offset in part by:
unfavorable steam costs ($6 million), mostly due to higher natural gas prices; and
lower internal hydroelectric generation ($5 million), due to a planned maintenance outage.
Distribution costs
After removing the lower volume, the restructuring initiatives, and the Canadian dollar fluctuation, distribution costs increased by $8 million, primarily as a result of an increase in the average length of haul, and higher freight rates, including the effect of the shortage of truck drivers.
Selling, general and administrative expenses
The higher overall SG&A were mostly offset by lower allocated expenses as a result of capacity reductions.
CORPORATEAND OTHER
Highlights
|
| | | | | | | | | | | | |
| Years Ended December 31, |
| (In millions) | 2018 | | | 2017 | | | 2016 | | |
| Cost of sales, excluding depreciation, amortization and distribution costs | $ | (12 | ) | | $ | (53 | ) | | $ | (17 | ) | |
| Depreciation and amortization | | (25 | ) | | | (24 | ) | | | (14 | ) | |
| Selling, general and administrative expenses | | (33 | ) | | | (41 | ) | | | (26 | ) | |
| Closure costs, impairment and other related charges | | (121 | ) | | | (82 | ) | | | (62 | ) | |
| Net gain on disposition of assets | | 145 |
| | | 15 |
| | | 2 |
| |
| Operating loss | $ | (46 | ) | | $ | (185 | ) | | $ | (117 | ) | |
| Interest expense | | (47 | ) | | | (49 | ) | | | (38 | ) | |
| Non-operating pension and other postretirement benefit credits (costs) | | 50 |
| | | 7 |
| | | (8 | ) | |
| Other income, net | | 5 |
| | | 6 |
| | | 7 |
| |
| Income tax provision | | (152 | ) | | | (84 | ) | | | (19 | ) | |
| Net loss including noncontrolling interests | $ | (190 | ) | | $ | (305 | ) | | $ | (175 | ) | |
The table below shows the reconciliation of net loss including noncontrolling interestsinterest to EBITDA and adjusted EBITDA, which are non-GAAP financial measures. For more information on the calculation and reasons we include these measures, see note 1 under “Results“Results of Operations – Consolidated Results – Selected Annual Financial Information”annual financial information” above.
| | | | | | | | | | | | | | | | | | | | | | | | | | | | | |
| Years Ended December 31, |
| (In millions) | 2020 | | 2019 | | 2018 | |
| Net loss including noncontrolling interest | $ | (218) | | | $ | (146) | | | $ | (190) | | |
| Interest expense | | 34 | | | | 31 | | | | 47 | | |
| Income tax provision | | 51 | | | | 58 | | | | 152 | | |
| Depreciation and amortization | | 15 | | | | 20 | | | | 25 | | |
| EBITDA | | (118) | | | | (37) | | | | 34 | | |
| | | | | | | | | |
| Closure costs, impairment and other related charges | | 53 | | | | 18 | | | | 121 | | |
| Inventory write-downs related to closures | | 25 | | | | 13 | | | | (1) | | |
| Start-up costs | | 3 | | | | — | | | | 8 | | |
| Net gain on disposition of assets | | (11) | | | | (2) | | | | (145) | | |
| Non-operating pension and other postretirement benefit credits | | — | | | | (47) | | | | (50) | | |
| | | | | | | | | |
| | | | | | | | | |
| Other expense (income), net | | 4 | | | | 22 | | | | (5) | | |
| | | | | | | | | |
| Adjusted EBITDA | $ | (44) | | | $ | (33) | | | $ | (38) | | |
|
| | | | | | | | | | | | |
| Years Ended December 31, |
| (In millions) | 2018 | | | 2017 | | | 2016 | | |
| Net loss including noncontrolling interests | $ | (190 | ) | | $ | (305 | ) | | $ | (175 | ) | |
| Interest expense | | 47 |
| | | 49 |
| | | 38 |
| |
| Income tax provision | | 152 |
| | | 84 |
| | | 19 |
| |
| Depreciation and amortization | | 25 |
| | | 24 |
| | | 14 |
| |
| EBITDA | $ | 34 |
| | $ | (148 | ) | | $ | (104 | ) | |
| Foreign exchange loss (gain) | | 2 |
| | | (9 | ) | | | 7 |
| |
| Closure costs, impairment and other related charges | | 121 |
| | | 82 |
| | | 62 |
| |
| (Reversal of) inventory write-downs related to closures | | (1 | ) | | | 24 |
| | | 7 |
| |
| Start-up costs | | 8 |
| | | 27 |
| | | 8 |
| |
| Net gain on disposition of assets | | (145 | ) | | | (15 | ) | | | (2 | ) | |
| Non-operating pension and other postretirement benefit (credits) costs | | (50 | ) | | | (7 | ) | | | 8 |
| |
| Other (income) expense, net | | (7 | ) | | | 3 |
| | | (14 | ) | |
| Adjusted EBITDA | $ | (38 | ) | | $ | (43 | ) | | $ | (28 | ) | |
20182020 vs. 20172019
Cost of sales, excluding depreciation, amortization and distribution costs
COS was $12$34 million in 2018,2020, mainly reflecting:
•write-downs of mill stores and other supplies inventory ($25 million) related to the temporary idling of our Amos and Baie-Comeau paper mills; and
•start-up costs ($73 million) for the Calhoun tissue manufacturingEl Dorado sawmill.
In 2019, we incurred COS of $23 million, which included:
•write-downs of mill stores and converting facility inother supplies inventory ($13 million) related to the first quarterindefinite idling of 2018;our paper mill at Augusta; and
•asset preservation costs ($65 million), primarilymainly related to our indefinitely idled Thorold (Ontario) paper mill and our permanently closed Fort Frances (Ontario) mill.
In 2017, we incurred COSDepreciation and amortization
Depreciation and amortization was $5 million lower in 2020 as the integrated business management software was fully depreciated in the fourth quarter of $53 million, which included:
write-downs of mill stores and other supplies2019 ($244 million), primarily related to the permanent closure of two paper machines at Calhoun, a paper machine at Catawba, and the Mokpo paper mill;
start-up costs ($22 million) related to the Calhoun tissue manufacturing and converting facility, and the restart of a paper machine in Alma; and
asset preservation costs ($9 million), primarily related to our indefinitely idled Thorold paper mill and our permanently closed Fort Frances mill..
Selling, general and administrative expenses
SG&A decreasedexpenses increased by $8$15 million in 2018,2020, mainly because of:due to higher start-up costs incurred in 2017, related to the Calhoun tissue manufacturingincentive plan expense, which is based on company performance, and converting facility; lower share-based compensation; and lower project costs.higher stock-based compensation expense.
Closure costs, impairment and other related charges
In 2018,2020, we recorded closure costs, impairment and other related charges of $121 million, mostly reflecting impairment charges of $120$55 million, related to the assets from the 2015 acquisitiontemporary idling of Atlas,our Amos and Baie-Comeau paper mills, including: a goodwill impairment charge of $81 million; fixed assets impairmentaccelerated depreciation charges of $29 million;$38 million, and severance and intangible assets impairment chargesother costs of $10$17 million.
This compares to closure costs, impairment and other related charges of $82$18 million in 2017, comprised of:
a long-lived asset impairment charge2019, related to the indefinite idling of our Coosa Pines pulppaper mill ($55 million);
a long-lived asset impairment charge ($5 million) and severance and other closure-related costs ($4 million) in connection with the permanent closure of a paper machine at the Catawba mill;
accelerated depreciation ($6 million) and severance and other closure-related costs ($2 million) associated with the permanent closure of two paper machines at Calhoun; and
Augusta, including: severance and other costs related to the permanent closure of the Mokpo paper mill ($7 million).$10 million; and accelerated depreciation charges of $8 million.
Net gain on disposition of assets
In 2018,2020, we recorded a net gain on disposition of assets of $145$11 million, reflecting:compared to $2 million in 2019, which reflected: the sale of the Augusta paper and pulp mill at Catawba for total cash consideration of $280 million (subject to final working capital adjustments), resulting in a net gain of $101 million; and the sale of the RBK pulp mill at Fairmont for total cash consideration of $62$10 million, resulting in a net gain of $40 million. This compares to a net gain on disposition of assets of $15 million recorded in 2017, including$9 million; and the sale of the assets of the permanently closed MokpoThorold paper mill for atotal cash consideration of $18$4 million, resulting in a net gain of $13$2 million.
20172019 vs. 20162018
Cost of sales, excluding depreciation, amortization and distribution costs
COS was $53 million in 2017 (as further discussed above) compared to $17 million in 2016, which included:
write-downs of mill stores and other supplies ($7 million), mostly asFor a result of the permanent closure of a newsprint machine at our Augusta mill;
start-up costs ($6 million) for the tissue manufacturing and converting facility and the continuous pulp digester project, both located in Calhoun; and
asset preservation costs ($3 million), primarily for our permanently closed Fort Frances mill.
Depreciation and amortization
Depreciation and amortization was $10 million higher in 2017, mainly because of the amortization of costs associated with the Calhoun tissue manufacturing and converting facility, and the additional costs related to the implementationvariance analysis of our integrated business management software.2019 vs. 2018 results of operations, see Part II, Item 7, “Management’s Discussion and Analysis of Financial Condition and Results of Operations – Results of Operations – Corporate and Other – 2019 vs. 2018,” of our 2019 Annual Report.
Selling, general and administrative expensesSG&A were $15 million higher in 2017, mainly because
Closure costs, impairment and other related charges
We recorded closure costs, impairment and other related charges of $82 million in 2017 (as further discussed above) compared to $62 million in 2016, which primarily included accelerated depreciation in connection with the permanent closure of a newsprint machine at our Augusta mill, and long-lived asset impairment charges mostly related to the Mokpo recycled newsprint assets, due to declining market conditions and rising recycled fiber prices.
LIQUIDITYAND CAPITAL RESOURCES
Capital Resources
We rely on cash and cash equivalents, net cash flows provided by operations, and our revolving credit facilitiesfacilities: to fund our operations,operations; to make pension contributions,contributions; and to finance our working capital, capital expenditures, and duty cash deposits.deposits and opportunities for our growth and transformation strategy. In addition, from time to time we may use available cash to reduce debt and to return capital to shareholders, including through share repurchases or special dividends. As of December 31, 2018,2020, we had cash and cash equivalents of $304$113 million and availability of $517$580 million under our revolving credit facilities.
Based on our current projections, we expect to have sufficient financial resources available to finance our business plan, make pension contributions, meet working capital and duty cash duty deposit requirements, and maintain an appropriate level of capital spending.
Based on market conditions, we may seek to retire, repay or refinance our outstanding indebtedness including under our 5.875% senior unsecured notes due 2023 (or the “2023 notes”) and credit facilities, through redemptions, prepayments, open market purchases or individually negotiated transactions, as we continue to focus on reducing costs and enhancing our flexibility.
Senior Unsecured Notes
The 2023 notes
The 2023 notes,Notes, issued on May 8, 2013, arewere unsecured and are guaranteed by substantially all of our U.S. subsidiaries. The 2023 notesNotes bear interest at a rate of 5.875%; they were sold at an offering price of 99.062% of the $600 million aggregate principal amount and began paying interest semi-annually on November 15, 2013.
The terms of the 2023 notes impose certain restrictions, subject to a number of exceptions and qualifications, including limits on our ability to:
incur, assume or guarantee additional indebtedness;
issue redeemable stock and preferred stock;
pay dividends or make distributions or redeem or repurchase capital stock;
prepay, redeem or repurchase certain debt;
make loans and investments;
incur liens;
restrict dividends, loans or transfer assets from our subsidiaries;
sell or otherwise dispose of assets, including capital stock of subsidiaries;
consolidate or merge with or into, or sell substantially all of our assets to, another person;
enter into transactions with affiliates; and
enter into new lines of business.
The 2023 notes are redeemable, in whole or in part, since May 15, 2017, at the redemption prices specified in the 2023 notes indenture, plus accrued and unpaid interest. We could be required to make an offer to purchase the notes upon the sale of certain assets or upon a change of control.
On January 3, 2019, (the “closing date”), we repurchased $225 million in aggregate principal amount of the 2023 notes,Notes, pursuant to a notes purchase agreement entered into on December 21, 2018, with certain noteholders, at a purchase price equal to 100% of the principal amount thereof, plus accrued and unpaid interest. As a result of the repurchase, we recorded a net loss on extinguishment of debt of $3 million in “Other (expense) income, net” in our Consolidated Statement of Operations for the year ended December 31, 2019.
On February 2, 2021, we completed the Offering of $300 million aggregate principal amount of our 2026 Notes at an issue price of 100%. The 2026 Notes are unsecured and are guaranteed by all of our current and, subject to certain conditions, future material wholly-owned U.S. subsidiaries. The Notes mature on March 1, 2026, unless earlier redeemed or repurchased, and will be recorded in “Long-term debt” in our consolidated balance sheet at their fair value of $300 million. Interest on the notes is payable semi-annually on March 1 and September 1 of each year, beginning on September 1, 2021.
We used the net proceeds of the Offering, together with cash on hand, to redeem all of the remaining outstanding $375 million aggregate principal amount of our 2023 Notes, at a price of 100% of the aggregate principal amount thereof, plus accrued and unpaid interest to, but not including, the redemption date. In connection with the redemption of all $375 million aggregate principal amount of the 2023 Notes (or, the “Redemption”), we placed, on February 2, 2021, the net proceeds of the closing date.of the Offering, together with additional cash, into trust for the benefit of the holders of the 2023 Notes. The Redemption occurred on February 18, 2021.
For more information, see Note 15, “Long-Term Debt – Debt instruments – Senior Unsecured Notes,” to our Consolidated Financial Statements.
Senior secured credit facilitySecured Credit Facility
On September 7, 2016, we entered into a senior secured credit facility (or the “Senior secured credit facility”) for up to $185 million. The SeniorThis senior secured credit facility providesprovided a term loan of $46 million with a maturity date of September 7, 2025, (or the “Term loan”),and a revolving credit facility of up to $139 million with a maturity date of September 7, 20222022. On October 28, 2019, we entered into an amended and restated senior secured credit facility (or, the “RevolvingSenior Secured Credit Facility”) for up to $360 million, replacing our existing $185 million senior secured credit facility. The Senior Secured Credit Facility provided a term loan facility of up to $180 million with a delayed draw period of up to three years, and the choice of maturities of six to 10 years (or, the “Term Loan Facility”), and a six-year revolving credit facility of up to $180 million with a maturity date of October 28, 2025 (or, the “Revolving Credit Facility”). In March 2020, we borrowed $180 million in term loans under the Term Loan Facility for 10 years, maturing in March 2030. There is also provides an uncommitted option to increase the Senior secured credit facilitySecured Credit Facility by up to $175an additional $360 million, subject to certain terms and conditions. As of December 31, 2018,On October 28, 2019, we had $139repaid our $46 million of availabilityterm loan by borrowing under the Revolving credit facility, which was undrawn.Credit Facility.
The obligations under the Senior secured credit facilitySecured Credit Facility are guaranteed by certain material U.S. subsidiaries of the Company and are secured by a first priority mortgage on the real property of our Calhoun facility and a first priority security interest on the fixtures and equipment located therein, and related assets.therein.
Interest rates under the Senior secured credit facility are based, at the Company’s election, on either a floating rate based on the London Interbank Offered Rate (or the “LIBOR”), or a base rate, in each case plus a spread over the index. The base rate is the highest
As of the Company’s funded indebtedness to the sumDecember 31, 2020, we had $180 million of the Company’s funded indebtedness and its net worth. For the Term loan, the applicable spread ranges from 0.875% to 1.5% for base rate loans, and from 1.875% to 2.5% for LIBOR loans. For loansavailability under the Revolving credit facility, the applicable spread ranges from 0.5%Credit Facility, which was undrawn.
For more information, see Note 15, “Long-Term Debt – Debt instruments – Senior Secured Credit Facility,” to 1.125% for base rate loans, and from 1.5% to 2.125% for LIBOR loans. The Senior secured credit facility was issued by lenders within the farm credit system and is eligible for patronage refunds. Patronage refunds are distributions of profits from lenders in the farm credit system, which are cooperatives that are required to distribute profits to their members. Patronage distributions, which are made in either cash or stock, are received in the year after they were earned. Future refunds are dependent on future farm credit lender profits, made at the discretion of each farm credit lender.our Consolidated Financial Statements.
In addition to paying interest on outstanding principal under the Senior secured credit facility,ABL Credit Facility
On May 14, 2019, we are required to pay a fee in respect of unutilized commitments under the Revolving credit facility equal to 0.325% per annum when average daily utilization under the Revolving credit facility for the prior fiscal quarter is less than or equal to 35% of the total revolving commitments, and 0.275% per annum when average daily utilization under the Revolving credit facility for the prior fiscal quarter is greater than 35% of the total revolving commitments.
Base rate loans under the Senior secured credit facility may be repaid from time to time at our discretion without premium or penalty. LIBOR loans may be repaid from time to time at our discretion, subject to breakage costs, if any. Amounts repaid on the Term loan may not be subsequently re-borrowed. Principal amounts under the Revolving credit facility may be drawn, repaid, and redrawn until September 6, 2022.
Pursuantentered into an amendment to the Senior securedfive-year credit facility, we are also required to maintain a capitalization ratio not greater than 45% at all times, available liquidity of not less than $100 million, and a collateral coverage ratio of not less than 1.8 to 1.0 (each as defined in the Senior secured credit facility). In addition, the Senior secured credit facility contains certain covenants applicable to the Company and its subsidiaries, including, among others: (i) requirements to deliver financial statements, other reports and notices; (ii) restrictions on the existence or incurrence and repayment of indebtedness; (iii) restrictions on the existence or incurrence of liens; (iv) restrictions on the Company and certain of its subsidiaries making certain restricted payments; (v) restrictions on making certain investments; (vi) restrictions on certain mergers, consolidations, and asset dispositions; (vii) restrictions on transactions with affiliates; and (viii) restrictions on modifications to material indebtedness. The Senior secured
credit facility includes customary representations and warranties, and, subject to customary grace periods and notice requirements, also contains certain customary events of default.
ABL credit facility
Onagreement dated May 22, 2015, we entered into a five-yearfor our ABL Credit Facility. The amended credit agreement provides for a senior secured asset-based revolving credit facility (oran extension of the “ABL credit facility”),maturity date to May 14, 2024, with an aggregate lender commitment of up to $600$500 million at any time outstanding, subject to borrowing base availability based on specified advance rates, eligibility criteria and customary reserves. The ABL credit facility will mature on May 22, 2020. As of December 31, 2018, we had $378 million of availability under the ABL credit facility, which was undrawn except for $53 million of ordinary course letters of credit outstanding.
The aggregate lender commitment under the facility includes a $60 million swingline sub-facility and a $200 million letter of credit sub-facility, and we may convert up to $50 million of the commitments under the facility to a first-in last-out facility, (or “FILO facility”), subject to the consent of each converting lender. The ABL credit facilityCredit Facility also provides for an uncommitted ability to increase the revolving credit facility by up to $500 million, subject to certain terms and conditions set forth in the agreement.
Revolving loan (and letter of credit) availability under the credit agreement is subject to a borrowing base, which is determined on the basis of eligible accounts receivable, inventory, and cash and the value of permitted investments held in deposit accounts controlled solely by the administrative and collateral agent. The FILO facility is also subject to a borrowing base, which is determined on the basis of eligible accounts receivable and inventory.
The obligations under the credit agreement are guaranteed by certain material subsidiaries of the Company and are secured by first priority liens on and security interests in accounts receivable, inventory and related assets.
LoansAs of December 31, 2020, we had $270 million of availability under the ABL Credit Facility, which was undrawn except for $56 million of ordinary course letters of credit agreementoutstanding.
Effective January 21, 2021, we reduced the commitment under the Canadian tranche of our senior secured asset-based revolving credit facility by $50 million, to $250 million, resulting in an aggregate commitment of $450 million, subject to borrowing base limitations.
For more information, see Note 15, “Long-Term Debt – Debt instruments – ABL Credit Facility,” to our Consolidated Financial Statements.
Loan Facility
On November 4, 2020, our Canadian subsidiary, Resolute FP Canada Inc., entered into a Loan Facility with Investissement Québec as lender for up to C$220 million ($173 million as of December 31, 2020), representing up to 75% of the countervailing and anti-dumping duty deposits (or, the “Duties”) imposed or expected to be imposed by the U.S. Department of Commerce and collected by Customs and Border Protection Agency (or, “U.S. Customs”) on U.S. imports of applicable softwood lumber products produced at sawmills of the Borrower and its affiliates located in the province of Quebec, Canada from April 28, 2017 to December 31, 2022.
The borrowings under the Loan Facility bear interest at a floating rate equal to 1.45% above the base rate,one-month Canadian Banker’s Acceptance rate. The Loan Facility provides for a maximum of 10 draws and the LIBOR, or the Canadian banker’s acceptance (or “BA”) rate, infulfillment of certain conditions upon each case plus an applicable margin.draw. The applicable margin is between 0.00% and 0.75% with respect to base rate loans and between 1.00% and 1.75% with respect to LIBOR and Canadian BA loans, in each case based on availability under the credit facility and a leverage ratio.
Loans outstanding under the FILO facility bear interest at a rate that is 1.25% per annum higher than the interest rate payable on revolving loans not made under the FILO facility.
In addition to paying interest on outstanding principal underis repayable in consecutive monthly installments over a period of eight years, after an interest only period of two years from the ABL credit facility, we are required to pay a fee in respect of unutilized commitments under the ABL credit facility equal to 0.30% per annum when average daily utilization under the ABL credit facility for the prior fiscal quarter is less than 35%date of the total revolving commitments, and 0.25% per annum when average daily utilization under the ABL credit facility for the prior fiscal quarter is greater than or equal to 35% of the total revolving commitments, as well as a fee in respect of outstanding letters of credit (equal to the applicable margin in respect of LIBOR and Canadian BA loans plus a fronting fee of 0.125% and certain administrative fees).
Base rate loans under the ABL credit facilityfirst draw. Outstanding amounts may be repaid from time toprepaid, partially or fully, at any time at our discretion, without premium or penalty. LIBOR and Canadian BA rate loans may be repaid from time to time at our discretion,penalty, but subject to breakage costs, if any. However, no loans under the FILO facility can be repaid unless all other loans under the credit agreement are repaid first.payment of accrued and unpaid interest. We are required to repay outstanding loans that exceedmake a prepayment equal to any amounts reimbursed by U.S. Customs on account of the maximum availability thenU.S. imports of certain softwood lumber products produced at our sawmills located in effect.the province of Quebec, Canada (or, the “Quebec Prepayments”).
The creditobligations under the Loan Facility will be secured by a first priority security interest and a control agreement contains customary covenants for asset-based credit agreements of this type, including, among other things: (i) requirements to deliver financial statements, other reports and notices; (ii) restrictions on the existence or incurrence and repayment of indebtedness by the Company and its subsidiaries; (iii) restrictions on the existence or incurrence of liens by the Company and its subsidiaries; (iv) restrictions on the Company and certain of its subsidiaries making certain restricted payments; (v) restrictionsour bank accounts identified to receive any Quebec Prepayments. In addition, we have agreed to transfer to the designated bank accounts any amounts constituting Quebec Prepayments, and may not grant any other security interest on the Company andsuch bank accounts. The Loan Facility is required to be used exclusively to finance certain of its subsidiaries making certain investments; (vi) restrictions on certain mergers, consolidationsour activities and asset dispositions; (vii) restrictions on transactions with affiliates; (viii) restrictions on amendmentsobligations in the province of Quebec, Canada, and may not be used to pay or modifications to the Canadian pension plans; (ix) restrictions on modifications to material indebtedness; and (x) a springing requirement for the Company to maintain a minimum consolidated fixed charge coverage ratio, as determined under the credit agreement,reimburse any Duties.
As of 1.0:1.0, anytimeDecember 31, 2020, we had C$165 million ($130 million) of availability under the facility falls below the greaterLoan Facility, subject to certain conditions. The Loan Facility was undrawn as of $50 million or 10%December 31, 2020.
For more information, see Note 15, “Long-Term Debt – Loan Facility,” to our Consolidated Financial Statements.
Credit rating risk
Although our debt agreements do not include any provision that would require material changes in payment schedules or terminations as a result of a credit rating downgrade, we believe our access to capital markets at a reasonable cost is determined in part by credit quality. A credit rating downgrade could impact our ability to access capital markets at a reasonable cost.
|
| | | |
| December 31, |
| | 2018 | 2017 | 2016 |
| Standard & Poor’s | | | |
| Senior unsecured debt | B+ | B+ | B+ |
| Long-term corporate credit rating | BB- | BB- | BB- |
Outlook (1) | Stable | Negative | Negative |
| Moody’s Investors Service | | | |
| Senior unsecured debt | B1 | B2 | B1 |
| Corporate family rating | Ba3 | B1 | Ba3 |
| Outlook | Stable | Stable | Stable |
| Liquidity rating | SGL-1 | SGL-1 | SGL-1 |
| |
(1)
| On January 7, 2019, Standard & Poor's revised the Company’s outlook from stable to positive. |
Subject to other factors affecting the credit markets as a whole, we believe our current ratings should provide a significant degree of flexibility in obtaining funds on competitive terms. These ratings reflect the views of the rating agencies only. An explanation of the significance of these ratings can be obtained from each rating agency. The ratings are not a recommendation to buy, sell or hold securities. Any rating can be revised upward or downward or withdrawn at any time by a rating agency.
| | | | | | | | | | | |
| December 31, |
| | 2020 | 2019 | 2018 |
| Standard & Poor’s | | | |
| | | |
| Senior unsecured debt | B | B+ | B+ |
| Long-term corporate credit rating | B+ | BB- | BB- |
| Outlook | Negative | Stable | Stable |
| Moody’s Investors Service | | | |
| Senior unsecured debt | B2 | B1 | B1 |
| Corporate family rating | B1 | Ba3 | Ba3 |
| Outlook | Negative | Stable | Stable |
| Liquidity rating | SGL-2 | SGL-1 | SGL-1 |
On January 19, 2021, both rating outlooks were revised from negative to stable and the Moody’s liquidity rating was upgraded to SGL-1.
Flow of Funds
Summary of cash flows
A summary of cash flows for the years ended December 31, 2018, 20172020, 2019 and 20162018 was as follows: | | | | | | | | | | | | | | | | | | | | | | | | | | | | | |
| Years Ended December 31, |
| (In millions) | 2020 | | 2019 | | 2018 | |
| Net cash provided by operating activities | $ | 334 | | | $ | 85 | | | $ | 435 | | |
| Net cash (used in) provided by investing activities | | (297) | | | | (162) | | | | 146 | | |
| Net cash provided by (used in) financing activities | | 78 | | | | (228) | | | | (281) | | |
| Effect of exchange rate changes on cash and cash equivalents, and restricted cash | | 2 | | | | 2 | | | | (4) | | |
| Net increase (decrease) in cash and cash equivalents, and restricted cash | $ | 117 | | | $ | (303) | | | $ | 296 | | |
|
| | | | | | | | | | | | |
| Years Ended December 31, |
| (In millions) | 2018 | | | 2017 | | | 2016 | | |
| Net cash provided by operating activities | $ | 435 |
| | $ | 158 |
| | $ | 81 |
| |
| Net cash provided by (used in) investing activities | | 146 |
| | | (191 | ) | | | (273 | ) | |
| Net cash (used in) provided by financing activities | | (281 | ) | | | 3 |
| | | 169 |
| |
| Effect of exchange rate changes on cash and cash equivalents | | (4 | ) | | | 6 |
| | | 1 |
| |
| Net increase (decrease) in cash and cash equivalents, and restricted cash | $ | 296 |
| | $ | (24 | ) | | $ | (22 | ) | |
20182020 vs. 20172019
Net cash provided by operating activities
We generated $435$334 million of cash from operating activities in 2018,2020, compared to $158$85 million last year. The increase is almost all attributable to higher profitability. The year-ago period also included cash closure costs in connection with the permanent closures of paper machines at the Catawba and Calhoun paper mills, as well as the permanent closure of the paper mill at Mokpo.
Net cash provided by (used in) investing activities
Investing activities provided $146 million of cash in 2018, compared to cash used of $191 million in the prior year. The difference reflects:
the disposition of the assets of the Catawba and Fairmont mills for total net proceeds of $333 million in the current year; and
the refund in 2018 of substantially all of the cash deposits of $61 million made on our U.S. imports of SC paper produced at our Canadian mills;
offset in part by:
higher countervailing and anti-dumping duty cash deposits on our imports of softwood lumber products to the U.S. from our Canadian sawmills ($51 million); and
the disposition of the assets of the permanently closed paper mill in Mokpo in 2017, for a cash consideration of $18 million.
Net cash (used in) provided by financing activities
We fully repaid our outstanding borrowings of $144 million under our revolving credit facilities and paid a special dividend of $1.50 per share, or $136 million, on our common stock in 2018. This compares to a net increase in borrowings of $19 million in the year-ago period, and a cash payment of $15 million for the acquisition of the 49% equity interest held by The New York Times Company in Donohue Malbaie Inc. We already owned 51% of the shares of Donohue Malbaie Inc.
2017 vs. 2016
Net cash provided by operating activities
We generated $158 million of cash from operating activities in 2017, compared to $81 million in 2016. The increase is mainly attributable to higher profitability, a favorable working capital variance in the current period, and lower pension contributions, partly offset by higher working capital and start-up costs for the tissue manufacturing and converting facility in Calhoun.contributions.
Net cash used in investing activities
We used $191$297 million of cash in investing activities in 2017, a decrease of $82 million2020, compared to $162 million in the previous year, reflecting lower cash invested in fixed assets of $85 million, mainly due to prior year. The difference reflects:
•the substantial completionacquisition of the tissue manufacturing and converting facility in CalhounU.S. Sawmill Business, net of cash acquired, in the first quarter of 2017,current period ($172 million); and the disposition of the assets of the permanently closed paper mill in Mokpo in 2017, for a cash consideration of $18 million, offset in part by
•higher countervailing and anti-dumping duty cash deposits ($29 million);
offset in part by:
•lower capital expenditures ($35 million) and higher disposition of assets ($11 million); and
•proceeds from an insurance recovery related to our importsacquisition of softwood lumber products toAtlas in 2015 ($15 million), in the U.S. from our Canadian sawmills in 2017.current period.
Net cash provided by (used in) financing activities
Net cash provided by financing activities
We borrowed $19 was $78 million under our credit facilities in 2017,2020, compared to $171cash used in financing activities of $228 million in 2016, primarily2019. The difference reflects:
•proceeds from long term debt of $180 million in 10-year term loans under the Senior Secured Credit Facility to supportfinance the tissue project, which was substantially completed at the endacquisition of the first quarter of 2017. We also acquiredU.S. Sawmill Business, whereas in 2017 the 49% equity interest held by The New York Times Company in Donohue Malbaie Inc. for a cash purchase price of $15 million.
2019 outlook
For 2019, we expect to invest $160 million in capital expenditures, net of support under existing business development programs, including the next phase in our organic capacity growth project at Saint-Félicien, and a number of investments to improve productivity and yields at our sawmills.
As further discussed above, on January 3, 2019,year ago period we repurchased $225 million in aggregate principal amount of our 2023 Notes and repaid our $46 million term loan;
partly offset by:
•repayments of $71 million under our revolving credit facilities in the 2023 notes.current year, compared to borrowings of $71 million in the prior year.
2019 vs. 2018
For a variance analysis of our 2019 vs. 2018 cash flows, see Part II, Item 7, “Management’s Discussion and Analysis of Financial Condition and Results of Operations – Liquidity and Capital Resources – Flow of Funds – 2019 vs. 2018,” of our 2019 Annual Report.
2021 outlook
For 2021, we expect to invest $95 million in capital expenditures, net of funding under existing business development programs, including: $10 million for the recently acquired U.S. Sawmill Business; and investments for the cellulose filament plant in Kénogami, and for the improvement of productivity and yields at our sawmills.
Countervailing duty and anti-dumping investigations
Beginning October 15, 2015, we were required to pay cash deposits at a subsidy rate of 17.87% for estimated countervailing duties on our U.S. imports of SC paper produced at our Canadian mills. On March 21, 2018, Verso Corporation, the sole remaining U.S. SC paper petitioner, filed a request with the U.S. Department of Commerce (or “Commerce”) for a changed circumstances review to revoke the countervailing duty order, retroactive to August 3, 2015, and for Commerce to refund all countervailing duty deposits with interest. On May 8, 2018, Commerce announced the initiation of a changed circumstances review, and on July 6, 2018, Commerce signed the revocation order. As a result, we were refunded substantially all of the cash deposits of $61 million made on our U.S. imports of SC paper produced at our Canadian mills, plus interest, and no further cash deposits are required going forward.softwood lumber
We also became required to pay cash deposits for estimated countervailing duties and anti-dumping duties on the vast majority of our U.S. imports of softwood lumber products produced at our Canadian sawmills, since April 28, 2017, and June 30, 2017, respectively. As of
December 31, 2018,2020, the rates for these estimated countervailing duties and anti-dumping duties were 14.7%19.10% and 3.2%1.15%, respectively. Based on our current operating parameters, the cash deposits could be as high as $75$80 million per year.
Additionally, since January 16, 2018, we had been required to make cash deposits at a subsidy rate of 4.42% for estimated countervailing duties on uncoated groundwood (or “UGW”) paper we import to the U.S. from our Canadian mills. On August 29, 2018, the U.S. International Trade Commission determined that the U.S. UGW paper producer was not materially injured nor threatened with material injury by U.S. imports of Canadian-origin UGW paper, and that no countervailing duty or anti-dumping orders would be issued. As a result, we will receive a refund of all cash deposits made on our U.S. imports of UGW paper produced at our Canadian mills, plus interest, and no further cash deposits are required going forward. Through December 31, 2018, cash deposits to be refunded totaled $6 million.
For additional information, see Part I, Item 1A, “Risk Factors – Legal and Compliance RiskRisks – We are subject to countervailing and anti-dumping dutiesduty orders on substantially allthe vast majority of our U.S. imports of softwood lumber products produced at our Canadian sawmills, which could materially affect our operations and cash flows,,” of this Form 10‑K.K, and Note 18, “Commitments and Contingencies – Legal matters – Countervailing duty and anti-dumping investigations of softwood lumber,” to our Consolidated Financial Statements.
Employee Benefit Plans
Pension and OPEB plans
In 2018,2020, we contributed $101$91 million to our defined benefit pension plans and $20$17 million to our defined contribution pension plans, while expensing anrecognizing a $19 million cost in aggregate, of $1 million, before special events. We also made payments of $13$11 million to OPEB plans, compared towhile recognizing a $12$5 million credit to the net periodic benefit cost, before special events.
In December 2020, the pension plan of the Thorold paper mill, which was indefinitely idled in 2017 and sold in 2020, was wound-up following the approval of the pension benefits distribution and assets liquidation. This resulted in the conversion of the buy-in annuity contract to a buy-out contract, and the recognition of a settlement loss of $28 million in "Non-operating pension and other postretirement benefit credits" in our Consolidated Statements of Operations for the year ended December 31, 2020, and the reduction of both pension plan assets and pension benefit obligations by $98 million.
For 2019,2021, we expect to make approximately $80$102 million of contributions to our defined benefit pension plans, $16$17 million to our defined contribution pension plans, and $14$12 million to OPEB plans. WeThe expected $11 million increase in defined benefit pension plan contributions is mainly a result of the substantial drop in discount rates from prior years.
For 2021, we expect to expense approximately $16$17 million of defined contribution pension plan costs, with creditsa defined benefit pension cost of $19$17 million and $11a $6 million credit for our defined benefit pension and OPEB plans, respectively.
plans. The expected $21$15 million decreaseincrease in defined benefit pension plan contributionsexpenses from 2020 is mainly explained by higher amortization of actuarial gains and losses, mostly as a result of the substantial drop in 2019 is in part due to lower contributions for past capacity reductions, and our exitdiscount rates from the Ontario funding relief, as further discussed below.prior years.
We fund our pension and OPEB plans as required by applicable laws and regulations; we could, from time to time, make additional contributions.
Canadian pension funding
Quebec plans
The funding of our Quebec pension plans areis subject to Quebec’s Supplemental Pension Plans Act (or, the “SPPA”), which is the pension plan funding regime generally applicable to pension plans in that province. Our contributions to our Quebec plans are determined on a going concern basis under the Quebec’s SPPA, as more fully described below.SPPA.
Ontario plans
Prior to December 31, 2018, the funding of our material Ontario pension plans (or the “affected plans”) was governed by regulation specific to us, adopted by the province of Ontario, which we refer to as the “funding relief regulation.” In accordance with the funding relief regulation, on December 21, 2018, we provided notice to the Ontario pension plan regulatory authorities that, effective December 31, 2018, we would voluntarily exit the Ontario funding relief regulation. As a result, sinceSince January 1, 2019, all of our Ontario pension plans have beenare subject to the Ontario Pension Benefits Act (or, the “PBA”), which is the pension plan funding regime generally applicable to pension plans in that province. The PBA provides for funding pension fund deficits on a going concern basis, or on a solvency basis if the solvency funded status of a pension plan is below 85%, as more fully described below. The funding relief regulation, as amended, provided that our annual basic contribution to the affected plans was Cdn $9 million.
As originally adopted, the funding relief regulation provided that corrective measures would be required if the aggregate solvency ratio of the affected plans fell below a prescribed level under the targets specified in the regulations as of December 31 in any year through 2014. This requirement was removed in 2013, but the 2011 and 2012 amounts (Cdn $110 million in the aggregate) had been deferred to after the expiration of the funding relief regulation in 2020. The funding relief regulation also required us to make a supplemental contribution, payable over a three-year period, should the affected plans’ aggregate solvency ratio be more than 2% below the target specified in the funding relief regulations for the preceding year. As a result of our exit from the funding relief regulation, these requirements were removed.
.
Funding deficit calculation
The assumptions used to calculate the pension funding deficit are materially different from the assumptions used to determine the net pension obligations for purposes of our Consolidated Financial Statements.
The funding deficit calculation of our Quebec pension plans areis subject to Quebec’s SPPA, which provides for the funding of pension deficits on a going concern basis. The funding deficit calculation of our Ontario pension plans areis subject to since January 1, 2019, Ontario’s PBA, which provides for the funding of pension fund deficits on a going concern basis, or on a solvency basis if the solvency funded status of a pension plan is below 85%. Under a going concern basis, the liabilities are calculated on the assumption that the plans will continue to operate indefinitely, and the liabilities are discounted using a rate determined by a model that develops an expected long-term return on assets, based on the asset mix of the plans as of the actuarial valuation date. The liabilities also include a provision for adverse deviation. Under a solvency basis, the liabilities are calculated on the assumption that the plans are terminated at the measurement date, (each December 31), and the liabilities are discounted primarily using a specified annuity purchase rate, which is the spot interest rate on government securities in Canada plus a prescribed margin at the measurement date.
The funding of our U.S. pension plan is governed by the Employee Retirement Income Security Act of 1974, as amended, and the Internal Revenue Code, and is also subject to the Moving Ahead for Progress in the 21st Century Act, the Highway and Transportation Funding Act of 2014, and the Bipartisan Budget Act of 2015. Under these regulations, the liabilities are discounted using 25-year average corporate bond rates within a specified corridor. The corridor will be maintained at 10% through 2020, will widen to 15% in 2021, and will widen an additional 5% each year to 30% in 2024 and beyond.
By contrast, for purposes of our Consolidated Financial Statements, the discount rate is determined with a model that develops a hypothetical high-quality bond portfolio, where the bonds are theoretically purchased to settle the expected benefit payments of the plans.
The weighted-average discount rate, funded ratio, and deficit of the pension plans for both accounting and funding purposes for the years ended December 31, 20182020 and 2017,2019, were as follows:
| | | | | | | | | | | | | | | | | | | | | | | | | | | | | | | | | | | | | | |
| Accounting | Funding |
| December 31, | December 31, |
(In millions, except percentages) | 2020 | | 2019 | | 2020 | (1) | 2019 | (2) |
| Discount rate | | 2.5 | % | | | 3.0 | % | | | 5.1 | % | | | 5.6 | % | |
| Funded ratio | | 73 | % | | | 74 | % | | | 86 | % | | | 88 | % | |
| Deficit | $ | (1,440) | | | $ | (1,326) | | | $ | (629) | | | $ | (497) | | |
|
| | | | | | | | | | | | | | | | |
| | Accounting | Funding |
| | December 31, | December 31, |
(In millions, except percentages) | 2018 | | | 2017 | | | 2018 | | (1) | 2017 | | (2) |
| Discount rate | | 3.8 | % | | | 3.6 | % | | | 5.7 | % | | | 5.1 | % | |
| Funded ratio | | 76 | % | | | 80 | % | | | 87 | % | | | 89 | % | |
| Deficit | $ | (1,122 | ) | | $ | (1,097 | ) | | $ | (572 | ) | | $ | (562 | ) | |
| |
(1)(2)Determined on a going concern basis for Canadian plans, and on a 25-year average interest rate basis for U.S. plans. | Determined on a going concern basis for Canadian plans, and on a 25-year average interest rate basis for U.S. plans. Preliminary, subject to final actuarial reports. |
| |
(2)
| Determined on a going concern basis for Quebec plans, on a solvency basis for Ontario plans, and on a 25-year average interest rate basis for U.S. plans. |
Additional undertakings
Our principal Canadian subsidiaries had entered into certain undertakings with the Government of Ontario and Quebec, which expired in 2015 and 2016, respectively. The expiration of those undertakings did not eliminate ongoing obligations we incurred under the terms of those undertakings prior to their expiration, including the undertaking requiring us to make an additional solvency deficit reduction contribution to our pension plans of Cdn $75,C$75, payable over four years, for each metric ton of capacity reduced in Quebec or Ontario, in the event of downtime of more than six consecutive months or nine cumulative months over a period of 18 months. Accordingly, we made additional contributions for past capacity reductions of Cdn $14C$4 million and Cdn $12 million in 2017 and 2018, respectively, and will also be required to make our final remaining contributions for past capacity reductions of approximately Cdn $4 million, and Cdn $2C$2 million in 2019 and 2020, respectively. The 2020 contribution was the last one required to be made in respect of these undertakings.
Partial wind-ups of pension plans
On June 12, 2012, we filed a motion for directives with the Quebec Superior Court, the court with jurisdiction in the creditor protection proceedings under the Companies’ Creditors Arrangement Act (Canada) (the(or, the “CCAA Creditor Protection Proceedings”), seeking an order to prevent pension regulators in each of Quebec, New Brunswick, and Newfoundland and Labrador from declaring partial wind-ups of pension plans relating to employees of former operations in New Brunswick and
Newfoundland and Labrador, or a declaration that any claim for accelerated reimbursements of deficits arising from a partial wind-up is a barred claim under the CCAA Creditor Protection Proceedings. We contend, among other things, that any such declaration, if issued, would be inconsistent with the Quebec Superior Court’s sanction order confirming the CCAA debtors’ CCAA Plan of Reorganization and Compromise, as amended, and the terms of our emergence from the CCAA Creditor Protection Proceedings. A partial wind-up would likely shorten the period in which any deficit within those plans, which could reach up to Cdn $150C$150 million ($110 million, based on the exchange rate in effect on December 31, 2018)118 million), would have to be funded if we do not obtain the relief sought. The hearing in this matter could occur in 2019.2021.
Share Repurchase Program
We areOn March 2, 2020, our board of directors authorized a share repurchase program of up to repurchase15% of our common stock, for an aggregate consideration of up to $100 million. During the year ended December 31, 2020, we repurchased 6.9 million shares at a cost of $30 million under this program. During the year ended December 31, 2019, we repurchased 4.8 million shares at a cost of $24 million under our $150 million of our outstanding common stock under our share repurchase program.program, which was completed in 2019. We did not repurchase any shares during 2018, 2017 and 2016. There remains $24 million under the program.2018.
Dividends
We declared and paid a special dividend of $1.50 per share ($136 million) on our common stock in 2018. We did not declare or pay any dividends on our common stock during the years ended December 31, 20172020 and 2016.2019.
Contractual Obligations
As of December 31, 2018,2020, the Company’s contractual obligations, including payments due by period, were as follows:
| | | | | | | | | | | | | | | | | | | | | | | | | | | | | | | | | | | | | | | | | | | | | | | |
| (In millions) | Total | | 2021 | | 2022-2023 | | 2024-2025 | | 2026 and thereafter | |
Long-term debt (1) | $ | 656 | | | $ | 28 | | | $ | 419 | | | $ | 10 | | | $ | 199 | | |
Non-cancelable operating lease obligations (2) | | 82 | | | | 12 | | | | 19 | | | | 13 | | | | 38 | | |
Purchase obligations (2) | | 202 | | | | 73 | | | | 109 | | | | 4 | | | | 16 | | |
| | $ | 940 | | | $ | 113 | | | $ | 547 | | | $ | 27 | | | $ | 253 | | |
|
| | | | | | | | | | | | | | | | | | | | |
| (In millions) | Total | | | 2019 | | | 2020-2021 | | | 2022-2023 | | | Thereafter | |
Long-term debt (1) | $ | 769 |
| | $ | 252 |
| | $ | 50 |
| | $ | 414 |
| | $ | 53 |
| |
Non-cancelable operating lease obligations (2) | | 34 |
| | | 9 |
| | | 13 |
| | | 5 |
| | | 7 |
| |
Purchase obligations (2) | | 340 |
| | | 78 |
| | | 127 |
| | | 105 |
| | | 30 |
| |
| | $ | 1,143 |
| | $ | 339 |
| | $ | 190 |
| | $ | 524 |
| | $ | 90 |
| |
| |
(2)Information on our operating leases and purchase obligations can be found in Note 12, “Operating Leases” and Note 18, “Commitments and Contingencies – Commitments,” to our Consolidated Financial Statements. (1)
| Long-term debt obligations primarily represent: interest payments, principal amount repurchase of $225 million in 2019, and the payment of the remaining principal balance at maturity of our 2023 notes; as well as interest payments and principal repayment at maturity of our Term loan. Interest on our Term loan is assumed to remain unchanged from the rates in effect as of December 31, 2018, assuming no repayments until maturity. Information on our long-term debt can be found in “Note 11, “Long-Term Debt,” to our Consolidated Financial Statements. |
| |
(2)
| Information on our operating leases and purchase obligations can be found in Note 17, “Operating Leases and Purchase Obligations,” to our Consolidated Financial Statements. |
The above table excludes the future obligations under our pension and OPEB plans due to the uncertainty in the timing and amount of future payments. Information on our pension and OPEB plans can be found in “Note 12,“Note 16, “Pension and Other Postretirement Benefit Plans,,” to our Consolidated Financial Statements.
RECENTACCOUNTING GUIDANCE
New accounting pronouncements adopted in 20182020
See Note 2, “Summary of Significant Accounting Policies – New accounting pronouncements adopted in 2018,2020,” to our Consolidated Financial Statements for more information.
Accounting pronouncements not yet adopted as of December 31, 20182020
See Note 2, “Summary of Significant Accounting Policies – Accounting pronouncements not yet adopted as of December 31, 2018,2020,” to our Consolidated Financial Statements for more information.
CRITICAL ACCOUNTING ESTIMATES
The preparation of financial statements in conformity with GAAP requires us to make accounting estimates based on assumptions, judgments and projections of future results of operations and cash flows. These estimates and assumptions affect the reported amounts of revenues and expenses during the periods presented and the reported amounts of assets and liabilities and the disclosure of contingent assets and liabilities as of the date of the financial statements.
We base our estimates, assumptions and judgments on a number of factors, including historical experience, recent events, existing conditions, internal budgets and forecasts, projections obtained from industry research firms, and other data that we believe are reasonable under the circumstances. We believe that our accounting estimates are appropriate and that the resulting financial statement amounts are reasonable. Due to the inherent uncertainties in making estimates, actual results could differ materially from these estimates, requiring adjustments to financial statement amounts in future periods.
A summary of our significant accounting policies is disclosed in Note 2, “Summary of Significant Accounting Policies,” to our Consolidated Financial Statements. Based upon a review of our significant accounting policies, we believe the following accounting policies require us to make accounting estimates that can significantly affect the results reported in our Consolidated Financial Statements. We have reported the development, selection and disclosures of our critical accounting estimates to the audit committee of our board of directors, and the audit committee has reviewed the disclosures relating to these estimates.
Pension and OPEB obligations
Description of accounts impacted by the accounting estimates
We record pension and OPEB obligations, net of pension plan assets that may be considered material to our financial position. We also record net periodic benefit costscost (credit) associated with these net obligations as our employees render service. As of December 31, 2018,2020, we had pension and OPEB obligations aggregating $4,922$5,382 million and accumulated pension plan assets at fair value of $3,652$3,806 million. In 2018,2020, we recorded a net periodic benefit creditcost of $41$15 million.
Judgments and uncertainties involved in the accounting estimates
The following inputs are used to determine our net obligations and our net periodic benefit cost (credit) each year and the determination of these inputs requires judgment:
•discount rate – used to determine the net present value of our pension and OPEB obligations and to determine the interest cost component of our net periodic benefit cost.cost (credit). The discount rate for our domestic and foreign plans was determined with a model that develops a hypothetical high-quality bond portfolio, where the bonds are theoretically purchased to settle the expected benefit payments of the plans. The discount rate reflects the single rate that produces the same discounted values as the value of the theoretical high-quality bond portfolio;
•return on assets – used to estimate the growth in the value of invested assets that are available to satisfy pension benefit obligations and to determine the expected return on plan assets component of our net periodic pension benefit cost.cost (credit). In determining the expected return on assets, we considered the historical returns and the future expectations for returns for each asset class, as well as the target asset allocation of the pension portfolio;
•life expectancy rate – used to estimate the impact of life expectancy on our pension and OPEB obligations. In determining the life expectancy rate of our domestic and foreign plans, we used the most recent actuarially-determined mortality tables and improvement scales. For the foreign plans, the mortality tables were adjusted with the result of our historical mortality experience study. The rates used are consistent with our future expectations of life expectancy for the employees who participate in our pension and OPEB plans;
•rate of compensation increase – used to calculate the impact future pay increases will have on our pension obligations. In determining the rate of compensation increase, we reviewed historical salary increases and promotions, while considering current industry conditions, the terms of collective bargaining agreements with our employees and the outlook for our industry; and
•health care cost trend rate – used to calculate the impact of future health care costs on our OPEB obligations. For the health care cost trend rate, we considered historical trends for these costs, as well as recently enacted healthcare legislation.
Effect if actual results differ from assumptions
Variations in assumptions could have a significant effect on the net periodic benefit cost and pension and OPEB obligations reported in our Consolidated Financial Statements. For example, a 25 basis point change in any one of these assumptions would have increased (decreased) our net periodic benefit cost for our pension and OPEB plans and our pension and OPEB obligations as follows:
| | | | 2018 Net Periodic Benefit Cost | | Pension and OPEB Obligations as of December 31, 2018 | | 2020 Net Periodic Benefit Costs | | Pension and OPEB Obligations as of December 31, 2020 |
| (In millions) | 25 Basis Point Increase | 25 Basis Point Decrease | | 25 Basis Point Increase | 25 Basis Point Decrease
| (In millions) | 25 Basis Point Increase | 25 Basis Point Decrease | | 25 Basis Point Increase | 25 Basis Point Decrease |
| Assumption: | | | | | | | | | | Assumption: | |
| Discount rate | $ | (1 | ) | | $ | 2 |
| | $ | (117 | ) | | $ | 128 |
| | Discount rate | $ | — | | | $ | 1 | | | $ | (128) | | | $ | 141 | | |
| Return on assets | | (10 | ) | | 10 |
| | — |
| | — |
| | Return on assets | $ | (9) | | | $ | 9 | | | $ | — | | | $ | — | | |
| Rate of compensation increase | | 1 |
| | (1 | ) | | 3 |
| | (3 | ) | | Rate of compensation increase | $ | — | | | $ | — | | | $ | 2 | | | $ | (2) | | |
| Health care cost trend rate | | — |
| | — |
| | 2 |
| | (2 | ) | | Health care cost trend rate | $ | — | | | $ | — | | | $ | 1 | | | $ | (1) | | |
As of December 31, 2018,2020, the most significant change in our assumptions affecting our pension and OPEB obligations was an increasea decrease in the discount rate to 3.8%2.5% from 3.6%3.0% as of December 31, 2017,2019, resulting in an actuarial gainloss of $109$285 million and a corresponding decreaseincrease in our pension and OPEB obligations.
The net periodic benefit cost of our pension plans incorporates an expected return on plan assets and not the actual return on plan assets. The difference between the expected and actual return on plan assets resulted in an actuarial lossgain of $365$15 million in 2018.2020.
These net actuarial losses of $256$244 million in 2018,2020, before tax, were recorded in “accumulated other comprehensive loss” and will be amortized into our Consolidated Statements of Operations in future years, including approximately $28$77 million in 2019.2021.
Deferred income tax assets
Description of accounts impacted by the accounting estimates
We have net deferred income tax assets of $876$915 million recorded in our Consolidated Balance Sheet as of December 31, 2018, almost2020, all of which is related to our Canadian operations,operations; and a full valuation allowance is recorded against virtually all of our U.S. net deferred income tax assets. Our net deferred income tax assets are primarily comprised of:
U.S.:
Deferred•deferred income tax assets of $688$804 million, comprised of $532which $544 million is for federal and state net operating loss carryforwards expiring between 2021 and 2038,2040; $103 million for federal and $156state net operating loss and deduction limitation carryforwards with no expiry; and $157 million for other temporary differences, mostly related to pension and OPEB plans.plans;
Deferred•deferred income tax liabilities of $35$67 million, mostly related to tax accelerated depreciation on fixed assets.assets; and
A•a valuation allowance of $652$737 million against the net deferred income tax assets, which are not more likely than not to be realized in the future.future;
Canada:
Deferred•deferred income tax assets of $915$981 million, comprised of $176$195 million related to undeducted research and development expenditures with no expiry, $72expiry; $78 million for tax credit carryforwards expiring between 20212022 and 2038, $192040; $12 million for federal and provincial non-capitalnet operating loss carryforwards expiring between 20262028 and 2038,2039; as well as $648$696 million for other temporary differences, mostly related to fixed asset undepreciated capital costs with no expiry, as well as pension and OPEB plans.plans;
Deferred•deferred income tax liabilities of $26$30 million for various temporary differences.differences; and
A•a valuation allowance of $14$36 million, virtually all of which is related to net capital loss carryforwards with no expiry.
Other:
Deferred income tax assets of $35 million, mostly comprised of other foreign subsidiaries net operating loss carryforwards expiring between 2020 and 2027.
A valuation allowance of $35 million against the net deferred income tax assets of other foreign subsidiaries, which are not more likely than not to be realized in the future.
Judgments and uncertainties involved in the accounting estimates
At each reporting period, we assess whether it is more likely than not that the deferred income tax assets will be realized, based on the review of all available positive and negative evidence, including future reversals of existing taxable temporary differences, estimates of future taxable income, past operating results, and prudent and feasible tax planning strategies. The carrying value of our deferred income tax assets reflects our expected ability to generate sufficient future taxable income in certain tax jurisdictions to realize these deferred income tax assets.
Following the assessment of our ability to realize the deferred income tax assets of our U.S. operations, we concluded that existing negative evidence outweighed positive evidence. As a result, we recognizerecognized a full valuation allowance against virtually all of our net U.S. deferred income tax assets. The cumulative losshistorical operating losses of our U.S. operations limited our ability to consider other subjective positive evidence. A valuation allowance does not reduce our underlying tax attributes, nor hinders our ability to use them in the future. If, in the future, sufficient objective positive evidence becomes available such that, based on the weight of available evidence, it is determined to be more likely than not that some or all of the deferred income tax assets associated with our U.S. operations can be realized, the valuation allowance will be reduced as appropriate, with the related adjustment being recognized as a decrease to the income tax provision.
The weight of positive evidence for our Canadian operations, which included a review of historical cumulative earnings and our forecasted future earnings, resulted in the conclusion by management that no significant valuation allowances were required for our deferred income tax assets, in Canada, as they were determined to be more likely than not to be realized.
The Company calculates its income tax provision for the period based on estimates and assumptions that could differ from the actual results reflected in income tax returns filed in subsequent years. Adjustments based on actual filed income tax returns are recorded when identified.
Tax benefits related to uncertain tax positions are recorded when it is more likely than not, based on the technical merits, that the position will be sustained upon examination by the relevant tax authority. The amount of tax benefit recognized may differ from the amount taken or expected to be taken on a tax return. These differences represent unrecognized tax benefits and are reviewed at each reporting period based on facts, circumstances and other available evidence. We have unrecognized tax benefits of $28$28 million as of December 31, 2018.2020. As income tax legislation and regulations are complex and subject to interpretation, our tax positions could be challenged by taxingtax authorities.
Effect if actual results differ from assumptions
Our forecasted future earnings represent important positive evidence in determining the recoverability of our deferred income tax assets. If actual future financial results are not consistent with the assumptions and judgments used, or if additional significant closure-related costs are recorded in future years, we may be required to reduce the carrying value of our net deferred income tax assets by recording additional valuation allowances, resulting in an income tax expenseprovision that could be material.
We do not expect a significant change to the amount of unrecognized tax benefits over the next 12 months. However, any adjustments arising from certain ongoing examinations by taxingtax authorities could alter the timing or amount of taxable income or deductions, or the allocation of income among tax jurisdictions, and these adjustments could differ from the amount accrued.
Long-lived assets
Description of accounts impacted by the accounting estimates
We have long-lived assets recorded in our Consolidated Balance Sheet of $1,565$1,564 million as of December 31, 2018.2020. These long-lived assets include fixed assets, net, and amortizable intangible assets, net.net, and operating lease right-of-use assets. In 2018,2020, we recorded depreciation and amortization of $212$169 million and impairmentaccelerated depreciation charges of $39$38 million associated with these long-livedrelated to fixed assets and amortizable intangible assets. Depreciation and amortization and impairmentaccelerated depreciation charges are based on accounting estimates.
The unit of accounting for impairment testing for long-lived assets is its asset group, (seesee Note 2, “Summary of Significant Accounting Policies – Impairment of long-lived assets,” to our Consolidated Financial Statements).Statements. The unit of accounting for
the depreciation and amortization of long-lived assets is at a lower level, either as a group of closely-related assets or at an individual asset level. The cost of a long-lived asset is amortized over its estimated remaining useful life, which is subject to change based on events and circumstances or management’s intention for the use of the asset.
Losses related to the impairment of long-lived assets to be held and used are recognized when circumstances indicate the carrying value of an asset group may not be recoverable, such as continuing losses in certain businesses. When indicators that the carrying value of an asset group may not be recoverable are triggered, we evaluate the carrying value of the asset group in relation to its expected undiscounted future cash flows. If the carrying value of an asset group is greater than the expected undiscounted future cash flows to be generated by the asset group, an impairment charge is recognized based on the excess of the asset group’s carrying value over its fair value. If it is determined that the carrying value of an asset group is recoverable, we review and adjust, as necessary, the estimated useful lives of the assets in the group.
When an asset group meets the criteria for classification as an asset held for sale, an impairment charge is recognized, if necessary, based on the excess of the asset group’s carrying value over the expected net proceeds from the sale (the estimated fair value minus the estimated costs to sell the asset group).
Our long-lived asset impairment and accelerated depreciation charges are disclosed in Note 3,5, “Closure Costs, Impairment and Other Related Charges,” to our Consolidated Financial Statements.
Judgments and uncertainties involved in the accounting estimates
The calculation of depreciation and amortization of long-lived assets requires us to apply judgment in selecting the remaining useful lives of the assets, which must address both physical and economic considerations. The remaining economic life of a long-lived asset is frequently shorter than its physical life. Estimates of future economic conditions for our long-lived assets and therefore, their remaining useful economic lives, require considerable judgment. The paper industry has been characterized by considerable uncertainty in business conditions.
Asset impairment for long-lived assets to be held and used is tested at the lowest asset group level having largely independent cash flows. Determining the asset groups for long-lived assets to be held and used requires management’s judgment.
Asset impairment loss calculations require us to apply judgment in estimating asset group fair values and future cash flows, including periods of operation, projections of product pricing, production levels, product costs, market supply and demand, foreign exchange rates, inflation, projected capital spending and, specifically for fixed assets acquired, assigned useful lives, functional obsolescence, asset condition and discount rates. When performing impairment tests, we estimate the fair values of the assets using management’s best assumptions, which we believe would be consistent with the assumptions that a
hypothetical marketplace participant would use. Estimates and assumptions used in these tests are evaluated and updated as appropriate. One key assumption, especially for our long-lived assets in Canada, is the foreign exchange rate, which was determined based on our budgeted exchange rates for 2019. The assessment of whether an asset group should be classified as held for sale requires us to apply judgment in estimating the probable timing of the sale, and in testing for impairment loss, judgment is required in estimating the net proceeds from the sale.
As a result of operating income observed, the Company performed an impairment test as of November 30, 2020, on one of its long-lived asset groups. The Company performed a Step 1 test which compares the carrying values of the asset group to its estimated future undiscounted cash flows. The undiscounted cash flows exceeded the carrying value of the asset group by a substantial margin, so no impairment was recognized.
Effect if actual results differ from assumptions
If our estimate of the remaining useful life changes, such a change is accounted for prospectively in our determination of depreciation and amortization. Actual depreciation and amortization charges for an individual asset may therefore be significantly accelerated if the outlook for its remaining useful life is shortened considerably.
A number of judgments were made in the determination of our asset groups. If a different conclusion had been reached for any one of those judgments, it could have resulted in the identification of asset groups different from those we actually identified, and consequently, could result in a different conclusion when comparing the expected undiscounted future cash flows or the fair value to the carrying value of the asset group.
Actual asset impairment losses could vary considerably from estimated impairment losses if actual results are not consistent with the assumptions and judgments used in estimating future cash flows and asset fair values. Assets of facilities that are idled have a greater risk of acceleration in depreciation and amortization or additional impairment.
GoodwillBusiness Combination
Description of accounts impacted by the accounting estimates
AsOn February 1, 2020, we acquired from Conifex Timber Inc. the U.S. Sawmill Business, which produces construction-grade dimensional lumber and decking products from locally sourced southern yellow pine for distribution within the U.S.
At Acquisition Date, we recognized fixed assets of December 31, 2018,$114 million, amortizable intangible assets of $21 million, goodwill of $31 million and other assets, net of other liabilities, of $7 million.
We account for business combinations using the acquisition method as of the date control is transferred to us. Under this approach, identifiable assets acquired and liabilities assumed are recorded at their respective fair values at the date of acquisition. Any amount of the purchase price paid that is in excess of the estimated fair values of net identifiable assets acquired is recorded in “Goodwill” in our Consolidated Balance Sheet did not include any goodwill, comparedSheets. In determining the estimated fair values of identifiable assets acquired and liabilities assumed in a business combination, we use various recognized valuation methods such as income, cost and market approaches. We utilized both the cost and market approaches to $81 million as of December 31, 2017. Goodwill was assignedvalue fixed assets, which consider external transactions and other comparable transactions, estimated replacement and reproduction costs, and estimated useful lives and consideration for physical, functional and economic obsolescence. We utilized the income approach to our tissue segment.
We reviewvalue intangible assets, which considers the carrying value of our goodwill for impairment annually as of November 30, or more frequently, whenever indicators of potential impairment exist. As more fully discussed in Note 2, “Summary of Significant Accounting Policies – Goodwill,” to our Consolidated Financial Statements, in the event that the net carrying amount of the reporting unit exceeds its fair value, an impairment charge will be recognized for the amount by which the reporting unit’s carrying amount exceeds its fair value, not to exceed the carrying amount of goodwill in that reporting unit.
Our goodwill impairment test for the tissue reporting unit as of November 30, 2018, concluded that the carryingpresent value of the reporting unit exceeded its estimated fair value. As a result, we recorded a goodwill impairment charge of $81 million for the year ended December 31, 2018, representing the entire goodwill amount. This impairment charge resulted from cumulative losses of the tissue business and lower-than-expected projectednet cash flows drivenexpected to be generated by operatingthe intangible assets, and market-related factors.
Our goodwill impairment chargesexcluding cash flows related to contributory assets. Valuations are disclosed in Note 3, “Closure Costs, Impairment and Other Related Charges,” to our Consolidated Financial Statements.performed by management or independent valuation specialists under management’s supervision, where appropriate.
Judgments and uncertainties involved in the accounting estimates
We test goodwill for impairment atThe judgments made in determining the reporting unit level. Determining which reporting units’ goodwill should beestimated fair value assigned to requires considerable judgment. A reporting unit is a component of an operating segment, or a combination of components of an operating segment that share similar economic characteristics. Based on our analysis of the components of our tissue segment, we concluded that all significant components of the tissue segment should be combined into a single reporting unit. Goodwill was entirely assigned to this reporting unit, which includes the netlong-lived assets of our Atlas manufacturing facilities in Hialeahacquired and Sanford, both located in Florida,goodwill, as well as our Calhoun tissue facility.the estimated useful life of the long-lived assets, could impact the net income of the periods subsequent to the acquisition through depreciation and amortization, and in certain instances through impairment charges, if the asset becomes impaired in the future.
When performing our goodwill impairment test,At Acquisition Date, we estimateidentified amortizable intangible assets primarily related to customer relationships. In determining the estimated fair value offor intangible assets, we used the reporting unit usingincome approach through a discounted cash flow model, and we validatemulti-period excess earning method. Estimates that are sensitive to the resulting fair value with a valuation technique based on multiples of earnings for comparable industry participants. The determination of the fair value involves many assumptionsof acquired customer intangibles include revenue stream and judgments, including: projectioneconomic life of sales volumeeach customer relationship, growth or attrition of the existing customers, forecasted revenues and pricing; projected levels of revenue growth and market penetration; product costs; inflation; projected capital spending; change in working capital; economic, industry and market conditions;operating expenses, contributory asset charges and discount rate.rates, all of which can have a material impact on the estimated fair values of customer relationship intangible assets.
Other significant judgments include the estimated fair value of fixed assets. We utilized both the cost and the market approaches in the estimation of fair value of fixed assets. Estimates that are consistent with our internal projectionssensitive to the determination of the fair value of fixed assets include external transactions and operating plans, which weother comparable transactions, estimated replacement and reproduction costs, and estimated useful lives and consideration for physical, functional and economic obsolescence.
We believe would be consistent with whatthat the estimated fair values assigned to the assets acquired and liabilities assumed are based on reasonable assumptions that a hypothetical marketplace participant would use. The discount rate assumption is based onWhile we use our best estimates and assumptions to accurately value assets acquired and liabilities assumed at the weighted-average cost of capital of comparable industry participants, adjustedacquisition date, our estimates are inherently uncertain and subject to consider the risks associated with the ramp-up of the Calhoun tissue facility and underlying risk associated with meeting projected levels of revenue growth and margin.
We have the option to first assess qualitative factors to determine whether it is more likely than not that the fair value of a reporting unit is less than its carrying amount, including goodwill. If, after assessing the totality of events or circumstances, we determine that it is more likely than not that the fair value of a reporting unit is less than its carrying amount, including goodwill, then an impairment test is performed.
We elected to bypass the optional qualitative assessment of the tissue reporting unit for our 2018 annual goodwill impairment test.refinement.
Effect if actual results differ from assumptions
A number of judgments were made inDuring the measurement period, we have recorded adjustments to the assets acquired and liabilities assumed with the corresponding offset to goodwill. Final determination of the reporting unit. If a different conclusion hadestimated fair values of assets acquired or liabilities assumed has been reached forcompleted and as such, any onesubsequent adjustments would be recorded in our Consolidated Statements of those judgments, it could have resultedComprehensive (loss) income.
SUPPLEMENTAL OBLIGOR GROUP INFORMATION
The following information is presented in a different reporting unit identification fromaccordance with Rule 13-01 of Regulation S-X adopted in 2020, and the one we identified, and consequently, could result in a different conclusion when comparing the fair valuepublic information requirements of Rule 144 promulgated pursuant to the carryingSecurities Act of 1933, as amended, in connection to the 2023 Notes issued by Resolute Forest Products Inc. (or, the “Issuer”) and fully guaranteed, on a joint and several basis, by all of our existing and subsequently acquired or organized direct or indirect wholly-owned U.S. subsidiaries that guarantee the ABL Credit Facility as further defined below (or, the “Guarantor Subsidiaries”) (together, the “Obligor Group”). The 2023 Notes are not guaranteed by our foreign subsidiaries (or, the “Non-Guarantor Subsidiaries”). The 2023 Notes were redeemed subsequent to December 31, 2020, and are no longer outstanding, see Note 23, “Subsequent Events,” to our Consolidated Financial Statements.
The following summarized financial information of the Obligor Group is presented on a combined basis, with all intercompany transactions between the Issuer and the Guarantor Subsidiaries eliminated and excluding any earnings from and investments in the Non-Guarantor Subsidiaries. Financial information of the Non-Guarantor Subsidiaries is not included.
Summarized financial information for the year ended December 31, 2020 was as follows:
| | | | | | | | | | | |
| (In millions) | | | |
Sales (1) | $ | 2,542 | |
| Operating loss | $ | (116) | |
| Net loss | $ | (126) | |
(1)Includes $41 million of sales to the Non-Guarantor Subsidiaries.
Summarized financial information as of December 31, 2020 was as follows:
| | | | | | | | | | | |
| (In millions) | | | |
| Total current assets | $ | 448 | |
| Total long-term assets | $ | 958 | |
Total current liabilities (1) | $ | 800 | |
| Total long-term liabilities | $ | 969 | |
(1)Includes accounts payable to the Non-Guarantor Subsidiaries of $676 million.
The 2023 Notes are unsecured and effectively junior to indebtedness under each of the ABL Credit Facility,the Senior Secured Credit Facility, and the Loan Facility, to the extent of the value of the reporting unit.
The actual fair valuecollateral securing each indebtedness and to future secured indebtedness. In addition, the 2023 Notes are structurally subordinated to all existing and future liabilities of our Non-Guarantor Subsidiaries, including the reporting unit could vary considerably from the estimated fair value if actual results are not consistent with the assumptions and judgments used in estimating future cash flows and the reporting unit fair value. For example, a 1% change in any one of these assumptions, assuming that all other assumptions remain constant, would have increased (decreased) the fair value of the reporting unit as of November 30, 2018, as follows:Loan Facility.
|
| | | | | | | | |
| (In millions) | 1% Increase | 1% Decrease |
| Assumption: | | | | | | |
| Sales pricing | $ | 35 |
| | $ | (35 | ) | |
| Product costs | | (21 | ) | | | 21 |
| |
| Discount rate | | (10 | ) | | | 10 |
| |
ITEM 7A. QUANTITATIVE AND QUALITATIVE DISCLOSURES ABOUT MARKET RISK
We are exposed to risks associated with fluctuations in foreign currency exchange rates, prices for the products we manufacture, commodity prices, and credit risk on accounts receivable from our customers.
Foreign Currency Exchange Risk
We compete with producers from around the world, particularly North America, Europe, and South America, in most of our product lines, with the exception of wood products and tissue, where we compete primarily with other North American producers. We sell our products mainly in transactions denominated in U.S. dollars, but we also sell in certain local currencies, including the Canadian dollar, the euro, and the pound sterling. Changes in the relative strength or weakness of these currencies, particularly the U.S. dollar, could affect international trade flows in these products. A stronger U.S. dollar might attract imports, thereby increasing product supply and possibly creating downward pressure on prices. On the other hand, a weaker U.S. dollar might encourage U.S. exports but also increase manufacturing costs in Canadian dollars.
We are particularly sensitive to changes in the value of the Canadian dollar versus the U.S. dollar. The actual impact of these changes depends primarily on the proportion of our production and sales that occur in Canada, the proportion of our financial assets and liabilities denominated in Canadian dollars, and the magnitude, direction and duration of changes in the exchange rate. We expect exchange rate fluctuations to continue to impact costs and revenues, but we cannot predict the magnitude or direction of this effect for any period, and there can be no assurance of any future effects. In 20172019 and 2018,2020, the Canadian dollar fluctuated between a low of US$0.731.27 in MayDecember of 20172020 and a high of US$0.831.45 in SeptemberMarch of 2017.2020. Based on operating projections for 2019,2021, if the Canadian dollar strengthens by one cent against the U.S. dollar, we expect that it will decrease our annual operating income by approximately $18$16 million, and vice versa.
Furthermore, certain monetary assets and liabilities, including a substantial portion of our net pension and OPEB obligations and our net deferred income tax assets, are denominated in Canadian dollars. As a result, our earnings can be subject to the potentially significant effect of foreign exchange gains or losses in respect of these Canadian dollar net monetary items. A fluctuation of the Canadian dollar against the U.S. dollar in any given period would generally cause a foreign exchange gain or loss.
Product Price Risk
Historically, economic and market shifts, fluctuations in capacity, and changes in foreign currency exchange rates have created cyclical changes in prices, sales volume and margins for our products. In general, our products, other than tissue, are commodities that are widely available from other producers; because these products have few distinguishing qualities from producer to producer, competition is based primarily on price, which is determined by supply relative to demand. The overall levels of demand for the products we manufacture, and consequently our sales and profitability, reflect fluctuations in end user demand. The demand for some of our products has weakened significantly over the past decade. For example, over the 10 years ended December 31, 2018,2020, according to industry statistics, North American newsprint demand fell by 65%69%. This trend, which similarly affects our specialty papers, couldpaper, is expected to continue as a result of developments in non-print media, lower North American newspaper circulation, weaker paper-based advertising, grade substitution and conservation measures taken by publishers and retailers. Without change in capacity, the lower demand in relation to supply can cause downward pressure on price.
In the table below, we show the impact of a $25 change to the average transaction price per unit of our products, other than tissue, based on our operating configuration as of December 31, 2018.2020. This presentation measures only the impact of pricing and items directly related to price, and assumes that every other factor is held constant.
|
| | | | | | | | | | |
| PRODUCT | PRODUCT | Unit | Projected change in annualized EBITDAoperating income ($ millions) based on $25
$25 change in price per unit |
|
| Market pulp | $ / metric ton | 29 |
| |
| | | |
| Wood products | $ / thousand board feet | 4548 |
| |
| Paper | Newsprint | $ / metric ton | 38 |
| |
| Specialty papers | $ / short ton | 21 |
| |
Commodity Price Risk
We purchase significant amounts of wood fiber, chemicals, and energy to supply our manufacturing facilities. These raw materials are market-priced commodities and as such, are subject to fluctuations in prices. Increases in the prices of these commodities will tend to reduce our reported earnings and decreases will tend to increase our reported earnings. From time to time, we may enter into contracts aimed at securing a stable source of supply for these commodities. These contracts typically require us to pay the market price at the time of purchase. Thus, under these contracts, we generally remain subject to market fluctuations in commodity prices.
Credit Risk
We are exposed to credit risk on the accounts receivable from our customers. In order to manage our credit risk, we have adopted policies, which include the analysis of the financial position of our customers and the regular review of their credit limits. The credit limits are dynamically reviewed based on fluctuations in the customers’ financial results and payment behavior. These customer credit limits are critical inputs in determining the conditions under which credit is extended to customers to reduce exposure to losses. We also subscribe to credit insurance and, in some cases, require bank letters of credit. Our customers are mainly in the business of newspaper publishing, advertising, printing, paper converting, consumer products, as well as lumber wholesale and retail.
ITEM 8. FINANCIAL STATEMENTS AND SUPPLEMENTARY DATA
Index to Financial Statements
RESOLUTE FOREST PRODUCTS INC.
CONSOLIDATED STATEMENTS OF OPERATIONS
(In millions of U.S. dollars, except per share amounts)
| | | | Years Ended December 31, | | Years Ended December 31, |
| | 2018 | | | 2017 | | | 2016 | | | | 2020 | | 2019 | | 2018 | |
| Sales | $ | 3,756 |
| | $ | 3,513 |
| | $ | 3,545 |
| | Sales | $ | 2,800 | | | $ | 2,923 | | | $ | 3,756 | | |
| Costs and expenses: | | | | | | | | Costs and expenses: | |
| Cost of sales, excluding depreciation, amortization and distribution costs | | 2,549 |
| | 2,588 |
| | 2,710 |
| | Cost of sales, excluding depreciation, amortization and distribution costs | | 2,010 | | | 2,198 | | | 2,549 | | |
| Depreciation and amortization | | 212 |
| | 204 |
| | 206 |
| | Depreciation and amortization | | 169 | | | 167 | | | 212 | | |
| Distribution costs | | 475 |
| | 442 |
| | 440 |
| | Distribution costs | | 344 | | | 389 | | | 475 | | |
| Selling, general and administrative expenses | | 165 |
| | 170 |
| | 147 |
| | Selling, general and administrative expenses | | 136 | | | 136 | | | 165 | | |
| Closure costs, impairment and other related charges | | 121 |
| | 82 |
| | 62 |
| | Closure costs, impairment and other related charges | | 53 | | | 18 | | | 121 | | |
| Net gain on disposition of assets | | (145 | ) | | (15 | ) | | (2 | ) | | Net gain on disposition of assets | | (11) | | | (2) | | | (145) | | |
| Operating income (loss) | | 379 |
| | 42 |
| | (18 | ) | | |
| Operating income | | Operating income | | 99 | | | 17 | | | 379 | | |
| Interest expense | | (47 | ) | | (49 | ) | | (38 | ) | | Interest expense | | (34) | | | (31) | | | (47) | | |
| Non-operating pension and other postretirement benefit credits (costs) | | 50 |
| | 7 |
| | (8 | ) | | |
| Other income, net | | 5 |
| | 6 |
| | 7 |
| | |
| Income (loss) before income taxes | | 387 |
| | 6 |
| | (57 | ) | | |
| Non-operating pension and other postretirement benefit credits | | Non-operating pension and other postretirement benefit credits | | 0 | | | 47 | | | 50 | | |
| Other (expense) income, net | | Other (expense) income, net | | (4) | | | (22) | | | 5 | | |
| Income before income taxes | | Income before income taxes | | 61 | | | 11 | | | 387 | | |
| Income tax provision | | (152 | ) | | (84 | ) | | (19 | ) | | Income tax provision | | (51) | | | (58) | | | (152) | | |
| Net income (loss) including noncontrolling interests | | 235 |
| | (78 | ) | | (76 | ) | | |
| Net income attributable to noncontrolling interests | | — |
| | (6 | ) | | (5 | ) | | |
| Net income (loss) including noncontrolling interest | | Net income (loss) including noncontrolling interest | | 10 | | | (47) | | | 235 | | |
| Net income attributable to noncontrolling interest | | Net income attributable to noncontrolling interest | | 0 | | | 0 | | | 0 | | |
| Net income (loss) attributable to Resolute Forest Products Inc. | $ | 235 |
| | $ | (84 | ) | | $ | (81 | ) | | Net income (loss) attributable to Resolute Forest Products Inc. | $ | 10 | | | $ | (47) | | | $ | 235 | | |
| Net income (loss) per share attributable to Resolute Forest Products Inc. common shareholders: | | | | | | | | Net income (loss) per share attributable to Resolute Forest Products Inc. common shareholders: | |
| Basic | $ | 2.57 |
| | $ | (0.93 | ) | | $ | (0.90 | ) | | Basic | $ | 0.12 | | | $ | (0.51) | | | $ | 2.57 | | |
| Diluted | | 2.52 |
| |
| (0.93 | ) | |
| (0.90 | ) | | Diluted | $ | 0.12 | | | $ | (0.51) | | | $ | 2.52 | | |
| Weighted-average number of Resolute Forest Products Inc. common shares outstanding: | | | | | | | | Weighted-average number of Resolute Forest Products Inc. common shares outstanding: | |
| Basic | | 91.3 |
| | 90.5 |
| | 89.9 |
| | Basic | | 86.1 | | | 91.4 | | | 91.3 | | |
| Diluted | | 93.3 |
| | 90.5 |
| | 89.9 |
| | Diluted | | 86.4 | | | 91.4 | | | 93.3 | | |
See accompanying notes to Consolidated Financial Statements.
RESOLUTE FOREST PRODUCTS INC.
CONSOLIDATED STATEMENTS OF COMPREHENSIVE (LOSS) INCOME (LOSS)
(In millions)millions of U.S. dollars)
| | | | | | | | | | | | | Years Ended December 31, | |
| | | Years Ended December 31, | | | 2020 | | 2019 | | 2018 | |
| | 2018 | | | 2017 | | | 2016 | | | |
| Net income (loss) including noncontrolling interests | $ | 235 |
| | $ | (78 | ) | | $ | (76 | ) | | |
| Net income (loss) including noncontrolling interest | | Net income (loss) including noncontrolling interest | $ | 10 | | | $ | (47) | | | $ | 235 | | |
| Other comprehensive loss: | | | | | | | | Other comprehensive loss: | |
| Unamortized prior service credits | | | | | | | | |
| Change in unamortized prior service credits | | (25 | ) | | (15 | ) | | (17 | ) | | |
| Unamortized prior service costs | | Unamortized prior service costs | |
| Change in unamortized prior service costs | | Change in unamortized prior service costs | | (17) | | | (12) | | | (25) | | |
| Income tax benefit | | 1 |
| | — |
| | — |
| | Income tax benefit | | 0 | | | 0 | | | 1 | | |
| Change in unamortized prior service credits, net of tax | | (24 | ) | | (15 | ) | | (17 | ) | | |
| Change in unamortized prior service costs, net of tax | | Change in unamortized prior service costs, net of tax | | (17) | | | (12) | | | (24) | | |
| Unamortized actuarial losses | | | | | | | | Unamortized actuarial losses | |
| Change in unamortized actuarial losses | | (194 | ) | | (10 | ) | | (183 | ) | | Change in unamortized actuarial losses | | (156) | | | (273) | | | (194) | | |
| Income tax benefit | | 51 |
| | 3 |
| | 31 |
| | Income tax benefit | | 38 | | | 55 | | | 51 | | |
| Change in unamortized actuarial losses, net of tax | | (143 | ) | | (7 | ) | | (152 | ) | | Change in unamortized actuarial losses, net of tax | | (118) | | | (218) | | | (143) | | |
| Foreign currency translation | | (1 | ) | | (3 | ) | | 1 |
| | Foreign currency translation | | 0 | | | 1 | | | (1) | | |
| Other comprehensive loss, net of tax | | (168 | ) | | (25 | ) | | (168 | ) | | Other comprehensive loss, net of tax | | (135) | | | (229) | | | (168) | | |
| Comprehensive income (loss) including noncontrolling interests | | 67 |
| | (103 | ) | | (244 | ) | | |
| Comprehensive income attributable to noncontrolling interests | | — |
| | (6 | ) | | (5 | ) | | |
| Comprehensive income (loss) attributable to Resolute Forest Products Inc. | $ | 67 |
| | $ | (109 | ) | | $ | (249 | ) | | |
| Comprehensive (loss) income including noncontrolling interest | | Comprehensive (loss) income including noncontrolling interest | | (125) | | | (276) | | | 67 | | |
| | Comprehensive loss attributable to noncontrolling interest | | Comprehensive loss attributable to noncontrolling interest | | 0 | | | 0 | | | 0 | | |
| Comprehensive (loss) income attributable to Resolute Forest Products Inc. | | Comprehensive (loss) income attributable to Resolute Forest Products Inc. | $ | (125) | | | $ | (276) | | | $ | 67 | | |
See accompanying notes to Consolidated Financial Statements.
RESOLUTE FOREST PRODUCTS INC.
CONSOLIDATED BALANCE SHEETS
(In millions of U.S. dollars, except per share amount)
|
| | | | | | | | |
| | December 31,
2018 | December 31,
2017 |
| Assets | | | | | | |
| Current assets: | | | | | | |
| Cash and cash equivalents | $ | 304 |
| | $ | 6 |
| |
| Accounts receivable, net: | | | | | | |
| Trade | | 347 |
| | | 399 |
| |
| Other | | 102 |
| | | 80 |
| |
| Inventories, net | | 508 |
| | | 526 |
| |
| Other current assets | | 43 |
| | | 33 |
| |
| Total current assets | | 1,304 |
| | | 1,044 |
| |
| Fixed assets, net | | 1,515 |
| | | 1,716 |
| |
| Amortizable intangible assets, net | | 50 |
| | | 65 |
| |
| Goodwill | | — |
| | | 81 |
| |
| Deferred income tax assets | | 876 |
| | | 1,076 |
| |
| Other assets | | 190 |
| | | 165 |
| |
| Total assets | $ | 3,935 |
| | $ | 4,147 |
| |
| Liabilities and equity | | | | | | |
| Current liabilities: | | | | | | |
| Accounts payable and accrued liabilities | $ | 427 |
| | $ | 420 |
| |
| Current portion of long-term debt | | 223 |
| | | 1 |
| |
| Total current liabilities | | 650 |
| | | 421 |
| |
| Long-term debt, net of current portion | | 422 |
| | | 788 |
| |
| Pension and other postretirement benefit obligations | | 1,257 |
| | | 1,257 |
| |
| Deferred income tax liabilities | | — |
| | | 13 |
| |
| Other liabilities | | 71 |
| | | 68 |
| |
| Total liabilities | | 2,400 |
| | | 2,547 |
| |
| Commitments and contingencies | |
| | |
| |
| Equity: | | | | | | |
| Resolute Forest Products Inc. shareholders’ equity: | | | | | | |
| Common stock, $0.001 par value. 118.8 shares issued and 90.8 shares outstanding as of December 31, 2018; 118.2 shares issued and 90.2 shares outstanding as of December 31, 2017 | | — |
| | | — |
| |
| Additional paid-in capital | | 3,802 |
| | | 3,793 |
| |
| Deficit | | (1,198 | ) | | | (1,294 | ) | |
| Accumulated other comprehensive loss | | (950 | ) | | | (780 | ) | |
| Treasury stock at cost, 28.0 shares as of December 31, 2018 and 2017 | | (120 | ) | | | (120 | ) | |
| Total Resolute Forest Products Inc. shareholders’ equity | | 1,534 |
| | | 1,599 |
| |
| Noncontrolling interests | | 1 |
| | | 1 |
| |
| Total equity | | 1,535 |
| | | 1,600 |
| |
| Total liabilities and equity | $ | 3,935 |
| | $ | 4,147 |
| |
| | | | | | | | | | | | | | | | | | | | |
| December 31,
2020 | December 31,
2019 |
| Assets | | | | | | |
| Current assets: | | | | | | |
| Cash and cash equivalents | $ | 113 | | | $ | 3 | | |
| Accounts receivable, net: | | | | | | |
| Trade | | 230 | | | | 273 | | |
| Other | | 48 | | | | 76 | | |
| Inventories, net | | 462 | | | | 522 | | |
| | | | | | |
| | | | | | |
| Other current assets | | 47 | | | | 33 | | |
| Total current assets | | 900 | | | | 907 | | |
| Fixed assets, net | | 1,441 | | | | 1,459 | | |
| Amortizable intangible assets, net | | 63 | | | | 48 | | |
| Goodwill | | 31 | | | | 0 | | |
| Deferred income tax assets | | 915 | | | | 915 | | |
| Operating lease right-of-use assets | | 60 | | | | 61 | | |
| Other assets | | 320 | | | | 236 | | |
| Total assets | $ | 3,730 | | | $ | 3,626 | | |
| Liabilities and equity | | | | | | |
| Current liabilities: | | | | | | |
| Accounts payable and accrued liabilities | $ | 369 | | | $ | 342 | | |
| Current portion of long-term debt | | 2 | | | | 1 | | |
| Current portion of operating lease liabilities | | 9 | | | | 8 | | |
| | | | | | |
| | | | | | |
| Total current liabilities | | 380 | | | | 351 | | |
| Long-term debt, net of current portion | | 559 | | | | 448 | | |
| Pension and other postretirement benefit obligations | | 1,562 | | | | 1,460 | | |
| | | | | | |
| Operating lease liabilities, net of current portion | | 55 | | | | 57 | | |
| Other liabilities | | 92 | | | | 75 | | |
| Total liabilities | | 2,648 | | | | 2,391 | | |
| Commitments and contingencies | | 0 | | | 0 | |
| Equity: | | | | | | |
| Resolute Forest Products Inc. shareholders’ equity: | | | | | | |
| Common stock, $0.001 par value. 120.6 million shares issued and 80.8 million shares outstanding as of December 31, 2020; 119.5 million shares issued and 86.7 million shares outstanding as of December 31, 2019 | | 0 | | | | 0 | | |
| Additional paid-in capital | | 3,804 | | | | 3,802 | | |
| Deficit | | (1,235) | | | | (1,245) | | |
| Accumulated other comprehensive loss | | (1,314) | | | | (1,179) | | |
| Treasury stock at cost, 39.8 million shares and 32.8 million shares as of December 31, 2020 and 2019, respectively | | (174) | | | | (144) | | |
| Total Resolute Forest Products Inc. shareholders’ equity | | 1,081 | | | | 1,234 | | |
| Noncontrolling interest | | 1 | | | | 1 | | |
| Total equity | | 1,082 | | | | 1,235 | | |
| Total liabilities and equity | $ | 3,730 | | | $ | 3,626 | | |
See accompanying notes to Consolidated Financial Statements.
RESOLUTE FOREST PRODUCTS INC.
CONSOLIDATED STATEMENTS OF CHANGES IN EQUITY
(In millions)millions of U.S. dollars)
| | | | | | | | | | | | | | | | | | | | | | | | Resolute Forest Products Inc. Shareholders’ Equity | |
| | Resolute Forest Products Inc. Shareholders’ Equity | | | | | | | Common
Stock | Additional
Paid-in
Capital | Deficit | Accumulated Other Comprehensive Loss | Treasury
Stock | Non-
controlling
Interests | Total Equity |
| | Common
Stock | Additional
Paid-in
Capital | Deficit | Accumulated Other Comprehensive Loss | Treasury
Stock | Non-
controlling
Interests | Total Equity | |
| Balance as of December 31, 2015 | $ | — |
| | $ | 3,765 |
| | $ | (1,126 | ) | | $ | (587 | ) | | $ | (120 | ) | | $ | 13 |
| | $ | 1,945 |
| | |
| Share-based compensation, net of withholding taxes | | — |
| | 10 |
| | — |
| | — |
| | — |
| | — |
| | 10 |
| | |
| Net (loss) income | | — |
| | — |
| | (81 | ) | | — |
| | — |
| | 5 |
| | (76 | ) | | |
| Stock unit awards vested (0.3 shares), net of shares forfeited for employee withholding taxes | | — |
| | — |
| | — |
| | — |
| | — |
| | — |
| | — |
| | |
| Other comprehensive loss, net of tax | | — |
| | — |
| | — |
| | (168 | ) | | — |
| | — |
| | (168 | ) | | |
| Balance as of December 31, 2016 | | — |
| | 3,775 |
| | (1,207 | ) | | (755 | ) | | (120 | ) | | 18 |
| | 1,711 |
| | |
| Share-based compensation, net of withholding taxes | | — |
| | 10 |
| | — |
| | — |
| | — |
| | — |
| | 10 |
| | |
| Net (loss) income | | — |
| | — |
| | (84 | ) | | — |
| | — |
| | 6 |
| | (78 | ) | | |
| Acquisition of noncontrolling interest (Note 1) | | — |
| | 8 |
| | — |
| | — |
| | — |
| | (23 | ) | | (15 | ) | | |
| Cumulative-effect adjustment upon deferred tax charge elimination (Note 13) | | — |
| | — |
| | (3 | ) | | — |
| | — |
| | — |
| | (3 | ) | | |
| Stock unit awards vested (0.4 shares), net of shares forfeited for employee withholding taxes | | — |
| | — |
| | — |
| | — |
| | — |
| | — |
| | — |
| | |
| Other comprehensive loss, net of tax | | — |
| | — |
| | — |
| | (25 | ) | | — |
| | — |
| | (25 | ) | | |
| Balance as of December 31, 2017 | | — |
| | 3,793 |
| | (1,294 | ) | | (780 | ) | | (120 | ) | | 1 |
| | 1,600 |
| | Balance as of December 31, 2017 | $ | 0 | | | $ | 3,793 | | | $ | (1,294) | | | $ | (780) | | | $ | (120) | | | $ | 1 | | | $ | 1,600 | | |
| Share-based compensation, net of withholding taxes | | — |
| | 6 |
| | — |
| | — |
| | — |
| | — |
| | 6 |
| | Share-based compensation, net of withholding taxes | | — | | | 6 | | | — | | | — | | | — | | | — | | | 6 | | |
| Net income | | — |
| | — |
| | 235 |
| | — |
| | — |
| | — |
| | 235 |
| | Net income | | — | | | — | | | 235 | | | — | | | — | | | — | | | 235 | | |
| | Special dividend | | — |
| | 3 |
| | (141 | ) | | — |
| | — |
| | — |
| | (138 | ) | | Special dividend | | — | | | 3 | | | (141) | | | — | | | — | | | — | | | (138) | | |
| Reclassification of stranded income tax (Note 2) | | — |
| | — |
| | 2 |
| | (2 | ) | | — |
| | — |
| | — |
| | |
| Stock unit awards vested (0.6 shares), net of shares forfeited for employee withholding taxes | | — |
| | — |
| | — |
| | — |
| | — |
| | — |
| | — |
| | |
| Reclassification of stranded income tax | | Reclassification of stranded income tax | | — | | | — | | | 2 | | | (2) | | | — | | | — | | | 0 | | |
| | Stock unit awards vested (0.6 million shares), net of shares forfeited for employee withholding taxes (Note 20) | | Stock unit awards vested (0.6 million shares), net of shares forfeited for employee withholding taxes (Note 20) | | — | | | — | | | — | | | — | | | — | | | — | | | — | | |
| Other comprehensive loss, net of tax | | — |
| | — |
| | — |
| | (168 | ) | | — |
| | — |
| | (168 | ) | | Other comprehensive loss, net of tax | | — | | | — | | | — | | | (168) | | | — | | | — | | | (168) | | |
| Balance as of December 31, 2018 | $ | — |
| | $ | 3,802 |
| | $ | (1,198 | ) | | $ | (950 | ) | | $ | (120 | ) | | $ | 1 |
| | $ | 1,535 |
| | Balance as of December 31, 2018 | | 0 | | | 3,802 | | | (1,198) | | | (950) | | | (120) | | | 1 | | | 1,535 | | |
| | Net loss | | Net loss | | — | | | — | | | (47) | | | — | | | — | | | — | | | (47) | | |
| | Purchase of treasury stock (4.8 million shares) (Note 19) | | Purchase of treasury stock (4.8 million shares) (Note 19) | | — | | | — | | | — | | | — | | | (24) | | | — | | | (24) | | |
| Stock unit awards vested (0.7 million shares), net of shares forfeited for employee withholding taxes (Note 20) | | Stock unit awards vested (0.7 million shares), net of shares forfeited for employee withholding taxes (Note 20) | | — | | | — | | | — | | | — | | | — | | | — | | | — | | |
| Other comprehensive loss, net of tax | | Other comprehensive loss, net of tax | | — | | | — | | | — | | | (229) | | | — | | | — | | | (229) | | |
| Balance as of December 31, 2019 | | Balance as of December 31, 2019 | | 0 | | | 3,802 | | | (1,245) | | | (1,179) | | | (144) | | | 1 | | | 1,235 | | |
| Share-based compensation, net of withholding taxes | | Share-based compensation, net of withholding taxes | | — | | | 2 | | | — | | | — | | | — | | | — | | | 2 | | |
| Net income | | Net income | | — | | | 10 | | | — | | | — | | | — | | | 10 | | |
| Purchases of treasury stock (6.9 million shares) (Note 19) | | Purchases of treasury stock (6.9 million shares) (Note 19) | | — | | | — | | | — | | | — | | | (30) | | | — | | | (30) | | |
| Stock unit awards vested (1.0 million shares), net of shares forfeited for employee withholding taxes (Note 20) | | Stock unit awards vested (1.0 million shares), net of shares forfeited for employee withholding taxes (Note 20) | | — | | | — | | | — | | | — | | | — | | | — | | | — | | |
| Other comprehensive loss, net of tax | | Other comprehensive loss, net of tax | | — | | | — | | | — | | | (135) | | | — | | | — | | | (135) | | |
| Balance as of December 31, 2020 | | Balance as of December 31, 2020 | $ | 0 | | | $ | 3,804 | | | $ | (1,235) | | | $ | (1,314) | | | $ | (174) | | | $ | 1 | | | $ | 1,082 | | |
See accompanying notes to Consolidated Financial Statements.
RESOLUTE FOREST PRODUCTS INC.
CONSOLIDATED STATEMENTS OF CASH FLOWS
(In millions)millions of U.S. dollars)
| | | | Years Ended December 31, | | Years Ended December 31, |
| | 2018 | | | 2017 | | | 2016 | | | | 2020 | | 2019 | | 2018 | |
| Cash flows from operating activities: | | | | | | | | Cash flows from operating activities: | |
| Net income (loss) including noncontrolling interests | $ | 235 |
| | $ | (78 | ) | | $ | (76 | ) | | |
| Adjustments to reconcile net income (loss) including noncontrolling interests to net cash provided by operating activities: | | | | | | | | |
| Net income (loss) including noncontrolling interest | | Net income (loss) including noncontrolling interest | $ | 10 | | | $ | (47) | | | $ | 235 | | |
| Adjustments to reconcile net income (loss) including noncontrolling interest to net cash provided by operating activities: | | Adjustments to reconcile net income (loss) including noncontrolling interest to net cash provided by operating activities: | |
| Share-based compensation | | 12 |
| | 15 |
| | 11 |
| | Share-based compensation | | 5 | | | 4 | | | 12 | | |
| Depreciation and amortization | | 212 |
| | 204 |
| | 206 |
| | Depreciation and amortization | | 169 | | | 167 | | | 212 | | |
| Closure costs, impairment and other related charges | | 120 |
| | 66 |
| | 59 |
| | Closure costs, impairment and other related charges | | 39 | | | 8 | | | 120 | | |
| (Reversal of) inventory write-downs related to closures | | (1 | ) | | 24 |
| | 7 |
| | |
| Inventory write-downs related to closures | | Inventory write-downs related to closures | | 25 | | | 13 | | | (1) | | |
| Deferred income taxes | | 164 |
| | 80 |
| | 14 |
| | Deferred income taxes | | 51 | | | 58 | | | 164 | | |
| Net pension contributions and other postretirement benefit payments | | (144 | ) | | (109 | ) | | (125 | ) | | Net pension contributions and other postretirement benefit payments | | (87) | | | (125) | | | (144) | | |
| Net gain on disposition of assets | | (145 | ) | | (15 | ) | | (2 | ) | | Net gain on disposition of assets | | (11) | | | (2) | | | (145) | | |
| Loss (gain) on translation of foreign currency denominated deferred income taxes | | 75 |
| | (71 | ) | | (28 | ) | | |
| (Gain) loss on translation of foreign currency denominated pension and other postretirement benefit obligations | | (63 | ) | | 58 |
| | 27 |
| | |
| Gain on disposition of equity method investment | | — |
| | — |
| | (5 | ) | | |
| Net planned major maintenance (payments) amortization | | (20 | ) | | 3 |
| | (3 | ) | | |
| (Gain) loss on translation of foreign currency denominated deferred income taxes | | (Gain) loss on translation of foreign currency denominated deferred income taxes | | (15) | | | (42) | | | 75 | | |
| Loss (gain) on translation of foreign currency denominated pension and other postretirement benefit obligations | | Loss (gain) on translation of foreign currency denominated pension and other postretirement benefit obligations | | 17 | | | 43 | | | (63) | | |
| | Net planned major maintenance amortization (payments) | | Net planned major maintenance amortization (payments) | | 6 | | | 13 | | | (20) | | |
| | Changes in working capital: | | | | | | | | Changes in working capital: | |
| Accounts receivable | | (19 | ) | | (37 | ) | | 26 |
| | Accounts receivable | | 80 | | | 88 | | | (19) | | |
| Inventories | | (46 | ) | | 23 |
| | (37 | ) | | Inventories | | 44 | | | (27) | | | (46) | | |
| Other current assets | | 1 |
| | 1 |
| | 7 |
| | Other current assets | | (12) | | | 0 | | | 1 | | |
| Accounts payable and accrued liabilities | | 38 |
| | (17 | ) | | (3 | ) | | Accounts payable and accrued liabilities | | 16 | | | (82) | | | 38 | | |
| Other, net | | 16 |
| | 11 |
| | 3 |
| | Other, net | | (3) | | | 16 | | | 16 | | |
| Net cash provided by operating activities | | 435 |
| | 158 |
| | 81 |
| | Net cash provided by operating activities | | 334 | | | 85 | | | 435 | | |
| Cash flows from investing activities: | | | | | | | | Cash flows from investing activities: | |
| Cash invested in fixed assets | | (155 | ) | | (164 | ) | | (249 | ) | | Cash invested in fixed assets | | (78) | | | (113) | | | (155) | | |
| Acquisition of a sawmill in Senneterre (Quebec) | | — |
| | — |
| | (6 | ) | | |
| Acquisition of business, net of cash acquired | | Acquisition of business, net of cash acquired | | (172) | | | 0 | | | 0 | | |
| Disposition of assets | | 336 |
| | 21 |
| | 5 |
| | Disposition of assets | | 14 | | | 3 | | | 336 | | |
| Decrease (increase) in countervailing duty cash deposits on supercalendered paper, net | | 48 |
| | (22 | ) | | (23 | ) | | |
| Decrease in countervailing duty cash deposits on supercalendered paper, net | | Decrease in countervailing duty cash deposits on supercalendered paper, net | | 0 | | | 1 | | | 48 | | |
| Increase in countervailing and anti-dumping duty cash deposits on softwood lumber | | (77 | ) | | (26 | ) | | — |
| | Increase in countervailing and anti-dumping duty cash deposits on softwood lumber | | (81) | | | (59) | | | (77) | | |
| Increase in countervailing duty cash deposits on uncoated groundwood paper | | (6 | ) | | — |
| | — |
| | |
| Net cash provided by (used in) investing activities | | 146 |
| | (191 | ) | | (273 | ) | | |
| Decrease (increase) in countervailing duty cash deposits on uncoated groundwood paper | | Decrease (increase) in countervailing duty cash deposits on uncoated groundwood paper | | 0 | | | 6 | | | (6) | | |
| Proceeds from insurance settlement | | Proceeds from insurance settlement | | 15 | | | 0 | | | 0 | | |
| Other investing activities, net | | Other investing activities, net | | 5 | | | 0 | | | 0 | | |
| Net cash (used in) provided by investing activities | | Net cash (used in) provided by investing activities | | (297) | | | (162) | | | 146 | | |
| Cash flows from financing activities: | | | | | | | | Cash flows from financing activities: | |
| Net (repayments) borrowings under revolving credit facilities | | (144 | ) | | 19 |
| | 125 |
| | Net (repayments) borrowings under revolving credit facilities | | (71) | | | 71 | | | (144) | | |
| Payment of special dividend | | (136 | ) | | — |
| | — |
| | Payment of special dividend | | 0 | | | 0 | | | (136) | | |
| Acquisition of noncontrolling interest in Donohue Malbaie Inc. | | — |
| | (15 | ) | | — |
| | |
| Issuance of long-term debt | | — |
| | — |
| | 46 |
| | |
| Payments of debt | | — |
| | (1 | ) | | (1 | ) | | |
| | Proceeds from long-term debt | | Proceeds from long-term debt | | 180 | | | 0 | | | 0 | | |
| | Repayments of debt | | Repayments of debt | | (1) | | | (271) | | | 0 | | |
| Purchases of treasury stock | | Purchases of treasury stock | | (30) | | | (24) | | | 0 | | |
| Payments of financing and credit facility fees | | (1 | ) | | — |
| | (1 | ) | | Payments of financing and credit facility fees | | 0 | | | (4) | | | (1) | | |
| Net cash (used in) provided by financing activities | | (281 | ) | | 3 |
| | 169 |
| | |
| | Net cash provided by (used in) financing activities | | Net cash provided by (used in) financing activities | | 78 | | | (228) | | | (281) | | |
| Effect of exchange rate changes on cash and cash equivalents, and restricted cash | | (4 | ) | | 6 |
| | 1 |
| | Effect of exchange rate changes on cash and cash equivalents, and restricted cash | | 2 | | | 2 | | | (4) | | |
| Net increase (decrease) in cash and cash equivalents, and restricted cash | | 296 |
| | (24 | ) | | (22 | ) | | Net increase (decrease) in cash and cash equivalents, and restricted cash | $ | 117 | | | $ | (303) | | | $ | 296 | | |
| Cash and cash equivalents, and restricted cash: | | | | | | | | Cash and cash equivalents, and restricted cash: | |
| Beginning of year | | 49 |
| | 73 |
| | 95 |
| | Beginning of year | $ | 42 | | | $ | 345 | | | $ | 49 | | |
| End of year | $ | 345 |
| | $ | 49 |
| | $ | 73 |
| | End of year | $ | 159 | | | $ | 42 | | | $ | 345 | | |
| Cash and cash equivalents, and restricted cash at year end: | | | | | | | | Cash and cash equivalents, and restricted cash at year end: | |
| Cash and cash equivalents | $ | 304 |
| | $ | 6 |
| | $ | 35 |
| | Cash and cash equivalents | $ | 113 | | | $ | 3 | | | $ | 304 | | |
| Restricted cash (included in “Other current assets” and “Other assets”) | | 41 |
| | 43 |
| | 38 |
| | |
| Restricted cash (included in “Other current assets”) | | Restricted cash (included in “Other current assets”) | $ | 4 | | | $ | 0 | | | $ | 0 | | |
| Restricted cash (included in “Other assets”) | | Restricted cash (included in “Other assets”) | $ | 42 | | | $ | 39 | | | $ | 41 | | |
| Supplemental disclosures of cash flow information: | |
| |
| |
| | Supplemental disclosures of cash flow information: | |
| Cash paid (received) during the year for: | | | | | | | | Cash paid (received) during the year for: | |
| Interest, including capitalized interest of $1, $1 and $7 in 2018, 2017 and 2016, respectively | $ | 40 |
| | $ | 47 |
| | $ | 40 |
| | |
| Interest, including capitalized interest of $1, $0 and $1 in 2020, 2019 and 2018, respectively | | Interest, including capitalized interest of $1, $0 and $1 in 2020, 2019 and 2018, respectively | $ | 32 | | | $ | 26 | | | $ | 40 | | |
| Income taxes | | (1 | ) | | 7 |
| | 3 |
| | Income taxes | $ | (1) | | | $ | (11) | | | $ | (1) | | |
See accompanying notes to Consolidated Financial Statements.
RESOLUTE FOREST PRODUCTS INC.
Notes to Consolidated Financial Statements
Note 1. Organization and Basis of Presentation
Nature of operations
Resolute Forest Products Inc. (with its subsidiaries, either individually or collectively, unless otherwise indicated, referred to as “Resolute Forest Products,” “we,” “our,” “us,” “Parent,” or the “Company”) is incorporated in Delaware. We are a global leader in the forest products industry with a diverse range of products, including market pulp, tissue, wood products, newsprint and specialty papers,paper, which are marketed in close to 70over 50 countries. We own or operate some 40 facilities, as well as power generation assets, in the United StatesU.S. and Canada.
Financial statements
We have prepared our consolidated financial statements and the accompanying notes (or, the “Consolidated Financial Statements”) in accordance with U.S. generally accepted accounting principles (or, “GAAP”). All amounts are expressed in U.S. dollars, unless otherwise indicated. Certain prior period amounts in the accompanying notes to our Consolidated Financial Statements of Operations, Consolidated Statements of Cash Flows, and footnotes have been reclassified to conform to the 20182020 presentation.
Consolidation
Our Consolidated Financial Statements include the accounts of Resolute Forest Products Inc. and its controlled subsidiaries. All transactions and balances between these companies have been eliminated. All consolidated subsidiaries are wholly-owned as of December 31, 2018,2020, with the exception of the following:
| | | | | | | | | | | |
| Consolidated Subsidiary | Resolute Forest Products Ownership | Partner | Partner
Ownership |
| Forest Products Mauricie L.P. | 93.2% | Coopérative Forestière du Haut Saint-Maurice | 6.8% |
In 2017, we acquired the 49% equity interest held by The New York Times Company in Donohue Malbaie Inc. for a cash purchase price of $15 million. We already owned 51% of the shares of Donohue Malbaie Inc. This acquisition was accounted for as an equity transaction and resulted in an increase of $8 million to “Additional paid-in capital” in our Consolidated Balance Sheet.
Equity method investments
We account for our investments in affiliated companies where we have significant influence but notor joint control, over their operations, using the equity method of accounting.
Note 2. Summary of Significant Accounting Policies
Use of estimates
In preparing our Consolidated Financial Statements in accordance with GAAP, management is required to make accounting estimates based on assumptions, judgments, and projections of future results of operations and cash flows. These estimates and assumptions affect the reported amounts of revenues and expenses during the periods presented, the reported amounts of assets and liabilities, and the disclosure of contingent assets and liabilities as of the date of the financial statements. The most critical estimates relate to the assumptions underlying the benefit obligations of our pension and other postretirement benefit (or, “OPEB”) plans, the recoverability of deferred income tax assets, and the carrying values of our long-lived assets, and the fair value estimates of the assets acquired and liabilities assumed in a business combination, including goodwill. Estimates, assumptions, and judgments are based on a number of factors, including historical experience, recent events, existing conditions, internal budgets and forecasts, projections obtained from industry research firms, and other data that management believes are reasonable under the circumstances. Actual results could differ materially from those estimates under different assumptions or conditions.
The uncertainties around the novel coronavirus (or, “COVID-19”) pandemic required the use of judgments and estimates that resulted in no significant impacts to our Consolidated Financial Statements as of and for the year ended December 31, 2020, except as disclosed in Note 5, “Closure Costs, Impairment and Other Related Charges” and Note 9, “Inventories, Net.” The future impact of the COVID-19 pandemic could generate, in future reporting periods, a significant risk of material adjustment to the carrying amounts of deferred income tax assets and long-lived assets.
RESOLUTE FOREST PRODUCTS INC.
Notes to Consolidated Financial Statements
Business combination
We account for business combinations using the acquisition method as of the date control is transferred to us. Under this approach, identifiable assets acquired and liabilities assumed are recorded at their respective fair values at the date of acquisition. Any amount of the purchase price paid that is in excess of the estimated fair values of net identifiable assets acquired is recorded in “Goodwill” in our Consolidated Balance Sheets. In determining the estimated fair values of identifiable assets acquired and liabilities assumed in a business combination, we use various recognized valuation methods such as present value modeling and referenced market values (where available). Valuations are performed by management or independent valuation specialists under management`s supervision, where appropriate. Transaction costs are expensed as incurred in our Consolidated Statements of Operations.
Cash and cash equivalents, and restricted cash
Cash and cash equivalents generally consist of direct obligations of the U.S. and Canadian governments and their agencies, demand deposits, and other short-term, highly liquid securities with a maturity of three months or less from the date of purchase. Restricted cash consists primarily of deposits held as collateral for letters of credit.
Accounts receivable
Accounts receivable are recorded at cost, net of an allowance for doubtful accountsexpected credit losses.
Accounts receivable are subject to impairment review that is based on the aging method. Impairment is calculated based on how long a receivable has been outstanding. The Company estimates expected collectibility,credit losses by considering historical credit loss experience (based on days past due), current conditions, and such carrying value approximates fair value.forward-looking factors specific to the customers and the economic environment.
We also consider if we are no longer doing business with the customer, and any other factors that may affect collectability from customers with significant outstanding balances. A receivable is written off when there is no reasonable expectation of recovering the contractual cash flows.
Inventories
Inventories are stated at the lower of cost or net realizable value using the average cost method. Cost includes labor, materials and production overhead, which is based on the normal capacity of our production facilities. Unallocated overhead, including production overhead associated with abnormal production levels, is recognized in “Cost of sales, excluding depreciation, amortization and distribution costs” in our Consolidated Statements of Operations when incurred.
Assets held for sale
Assets held for sale are carried in our Consolidated Balance Sheets at the lower of carrying value or fair value less costs to sell. We cease recording depreciation and amortization when assets are classified as held for sale.
Fixed assets
Fixed assets acquired, including internal-use software, are stated at acquisition cost less accumulated depreciation and impairment. The cost of the fixed assets is reduced by any investment tax credits or government capital grants earned. Depreciation is provided on a straight-line basis over the estimated useful lives of the assets. We capitalize interest on borrowings during the construction period of major capital projects as part of the related asset and amortize the capitalized interest in “Depreciation and amortization” in our Consolidated Statements of Operations over the related asset’s remaining useful life. Planned major maintenance costs are recorded using the deferral method, whereby the costs of each planned major maintenance activity are capitalized to “Other current assets” or “Other assets” in our Consolidated Balance Sheets, and amortized to “Cost of sales, excluding depreciation, amortization and distribution costs” in our Consolidated Statements of Operations on a straight-line basis over the estimated period until the next planned major maintenance activity. All other routine repair and maintenance costs are expensed as incurred.
RESOLUTE FOREST PRODUCTS INC.
Notes to Consolidated Financial Statements
Amortizable intangible assets
Amortizable intangible assets are stated at acquisition cost less accumulated amortization and impairment. Amortization is provided on a straight-line basis over the estimated useful lives of the assets.
Impairment of long-lived assets
The unit of accounting for impairment testing for long-lived assets is its group, which includes fixed assets, net, amortizable intangible assets, net, and operating lease right-of-use assets (collectively, “long-lived assets”) is its group, which includes long-lived assets and liabilities directly related to those assets (herein defined as “asset group”). For asset groups that are held and used, that group represents the lowest level for which identifiable cash flows are largely independent of the cash flows of other asset groups. For asset groups that are to be disposed of by sale or otherwise, that group represents assets to be disposed of together as a group in a single transaction and liabilities directly associated with those assets that will be transferred in the transaction.
Long-lived assets are reviewed for impairment when events or changes in circumstances indicate that the carrying value of an asset group may no longer be recoverable. The recoverability of an asset group that is held and used is tested by comparing the carrying value of the asset group to the sum of the estimated undiscounted future cash flows expected to be generated by that asset group. In estimating the undiscounted future cash flows, we use projections of cash flows directly associated with, and which are expected to arise as a direct result of, the use and eventual disposition of the asset group. If there are multiple plausible scenarios for the use and eventual disposition of an asset group, we assess the likelihood of each scenario occurring in order to determine a probability-weighted estimate of the undiscounted future cash flows. The principal assumptions include periods of operation, projections of product pricing, production levels and sales volumes, product costs, market supply and
RESOLUTE FOREST PRODUCTS INC.
Notes to Consolidated Financial Statements
demand, foreign exchange rates, inflation, and projected capital spending. Changes in any of these assumptions could have a material effect on the estimated undiscounted future cash flows expected to be generated by the asset group. If it is determined that an asset group is not recoverable, an impairment loss is recognized in the amount that the asset group’s carrying value exceeds its fair value. The fair value of a long-lived asset group is determined in accordance with our accounting policy for fair value measurements, as discussed below. If it is determined that the carrying value of an asset group is recoverable, we review and adjust, as necessary, the estimated useful lives of the assets in the group.
When an asset group meets the criteria for classification as an asset held for sale, an impairment charge is recognized, if necessary, based on the excess of the asset group’s carrying value over the expected net proceeds from the sale (the estimated fair value minus the estimated costs to sell).
Asset groupsLong-lived assets to be disposed of other than by sale are classified as held and used until the asset group is disposed of or use of the asset group has ceased.
Goodwill
Goodwill is not amortized and is evaluatedtested for impairment every year at the end of November, or more frequently whenever indicators ofif events or changes in circumstances indicate a potential impairment exist.loss. The impairment test of goodwill is performed at the reporting unit’s level.
We have the option to first assess qualitative factors to determine whether it is more likely than not that the fair value of a reporting unit is less than its carrying amount including goodwill. In performing the qualitative assessment, we identify the relevant drivers of fair value of a reporting unit and the relevant events and circumstances that may have an impact on those drivers of fair value. This process involves significant judgment and assumptions including the assessment of the results of the most recent fair value calculations, the identification of macroeconomic conditions, industry and market considerations, cost factors, overall financial performance, specific events affecting us and the business, and making the assessment on whether each relevant factor will impact the impairment test positively or negatively, and the magnitude of any such impact. If after assessing the totality of events or circumstances, we determinequalitative assessment indicates that it is more likely than not that the fair value of a reporting unit is less than its carrying amount, including goodwill, then ana quantitative impairment test is performed. We can also elect to bypass the qualitative assessment and proceed directly to the quantitative impairment test.
The first step of anquantitative impairment test is to compareconsists of comparing the fair value of a reporting unit to its carrying amount, including goodwill. Significant judgment is required to estimate the fair value of a reporting unit.
Using the income method toWe determine the fair value of a reporting unit by using the income method. Under this method, we estimate the fair value of a reporting unit based on the present value of estimated future cash flows. The assumptions used in the model requires estimating future sales volumes, selling prices and costs, changes in working capital, investments in fixed assets, and the selection of the appropriate discount rate. The assumptions used are consistent with internal projections and operating plans. Unanticipated market and macroeconomic events and circumstances may occur and could affect the exactitude and validity of management assumptions and estimates. Sensitivities of these fair value estimates to changes in assumptions are also performed.
RESOLUTE FOREST PRODUCTS INC.
Notes to Consolidated Financial Statements
In the event that the net carrying amount of the reporting unit exceeds its fair value, an impairment charge is recognized for the amount by which the reporting unit’s carrying valueamount exceeds its fair value, not to exceed the carrying amount of goodwill in that reporting unit.
Goodwill is assigned to the tissuewood segment for the purposes of impairment testing.
We elected the optional qualitative assessment for our 2020 annual goodwill impairment test. We concluded that it is not more likely than not that the fair value of the reporting unit is less than its carrying amount. As a result, no impairment was recognized.
Leases
We engage in short and long-term leases for building, machinery, chemical equipment, rail cars and office equipment. We determine if a contract contains a lease at inception. Leases are classified as either operating leases or finance leases. Operating leases are included in “Operating lease right-of-use assets,” “Current portion of operating lease liabilities,” and “Operating lease liabilities, net of current portion,” whereas finance leases are included in “Fixed assets, net,” “Current portion of long-term debt,” and “Long-term debt, net of current portion” in our Consolidated Balance Sheets. Leases with a term of 12 months or less are not recorded in our Consolidated Balance Sheets, and are expensed over the term of the lease in our Consolidated Statements of Operations.
Operating and finance lease right-of-use assets and the related liabilities are recognized at the lease commencement date based on the present value of the future lease payments over the lease term. Renewal and termination options are included in our lease terms when it is reasonably certain that they will be exercised. In determining the present value of lease payments, we use the implicit rate when readily determinable, or our estimated incremental borrowing rate, which is based on information available at the lease commencement date. Lease payments are expensed in our Consolidated Statements of Operations on a straight-line basis over the term of the lease.
For buildings, we account for the lease and non-lease components as a single lease component. For all other contracts, we account for the lease and non-lease components separately.
Income taxes
We use the asset and liability approach in accounting for income taxes. Under this approach, deferred income tax assets and liabilities are recognized for the expected future tax consequences attributable to differences between the carrying amounts in our Consolidated Financial Statements of existing assets and liabilities and their respective tax bases. This approach also requires the recording of deferred income tax assets related to operating loss and tax credit carryforwards. Deferred income tax assets and liabilities are measured using enacted tax rates applicable when temporary differences and carryforwards are expected to be recovered or settled.
We account for global intangible low-taxed income (or, “GILTI”) as a period cost, if and when incurred, and apply the tax law ordering approach to assess the impact of GILTI on the realizability of net operating loss carryforwards.
We have not provided for the additional U.S. and foreign income taxes that could become payable upon remittance of undistributed earnings of our foreign subsidiaries, as we have specific plans for the reinvestment of such earnings.
Valuation allowances are recognized to reduce deferred income tax assets to the amount that is more likely than not to be realized. In assessing the likelihood of realization, we consider all available positive and negative evidence, including future
RESOLUTE FOREST PRODUCTS INC.
Notes to Consolidated Financial Statements
reversals of existing taxable temporary differences, estimates of future taxable income, past operating results, and prudent and feasible tax planning strategies.
Tax benefits related to uncertain tax positions are recorded when it is more likely than not, based on technical merits, that the position will be sustained upon examination by the relevant taxing authorities. The amount of tax benefit recognized may differ from the amount taken or expected to be taken on a tax return. These differences represent unrecognized tax benefits and are reviewed at each reporting period based on facts, circumstances and available evidence. We recognize accrued interest and penalties related to unrecognized tax benefits as a component of the income tax expense.provision.
The Tax Cuts and Jobs Act (or “TCJA”)
RESOLUTE FOREST PRODUCTS INC.
Notes to be made during the 12-month measurement period following the enactment of the TCJA. Accordingly, we have elected to account for GILTI as a period cost, if and when incurred, and to apply the tax law ordering approach to assess the impact of GILTI on the realizability of net operating loss carryforwards. For more information, see Note 13, “Income Taxes.”Consolidated Financial Statements
Environmental costs
We expense environmental costs related to existing conditions resulting from past or current operations and from which no current or future benefit is discernible. These costs are included in “Cost of sales, excluding depreciation, amortization and distribution costs” in our Consolidated Statements of Operations. Expenditures that extend the life of the related property are capitalized. We determine our liability on a site-by-site basis and record a liability at the time it is probable and can be reasonably estimated. Such accruals are adjusted as further information develops or circumstances change. Costs of future expenditures for environmental remediation obligations are discounted to their present value when the amount and timing of expected cash payments are reliably determinable.
Pension and OPEB plans
For each defined benefit pension and OPEB plan, a liability is recognized for a plan’s under-funded status, net of the fair value of plan assets, and an asset is recognized for a plan’s over-funded status, net of the plan’s obligations. Changes in the funding status that have not been recognized in our net periodic benefit cost are reflected as an adjustment to our “Accumulated other comprehensive loss” in our Consolidated Balance Sheets. We recognize net periodic benefit cost or credit as employees render the services necessary to earn the pension and OPEB. The service cost component of net periodic pension and OPEB cost or credit is recorded in operating expenses (together with other employee compensation costs arising during the period). The other components of the net periodic pension and OPEB cost or credit (or, “non-operating pension and OPEB costscredits”) are reported separately outside any subtotal of operating income (loss).income. Amounts we contribute to our defined contribution plans are expensed as incurred.
Fair value measurements
Fair value is defined as the price that would be received to sell an asset or paid to transfer a liability (an exit price) in an orderly transaction between market participants at the measurement date, and is based on any principal market for the specific asset or liability. We consider the risk of non-performance of the obligor, which in some cases reflects our own credit risk, in determining fair value. We categorize assets and liabilities measured at fair value (other than those measured at net asset value, or “NAV,” per share, or its equivalent) into one of three different levels depending on the observability of the inputs employed in the measurement. This fair value hierarchy is as follows:
|
| | | | |
| Level 1 - | Valuations based on quoted prices in active markets for identical assets and liabilities. |
| |
| Level 2 - | Valuations based on observable inputs, other than Level 1 prices, such as quoted interest or currency exchange rates. |
| |
| Level 3 - | Valuations based on significant unobservable inputs that are supported by little or no market activity, such as discounted cash flow methodologies based on internal cash flow forecasts. |
The asset’s or liability’s fair value measurement level within the fair value hierarchy is based on the lowest level of any input that is significant to the fair value measurement. Valuation techniques used in the determination of fair value of our assets and liabilities, when required, maximize the use of observable inputs and minimize the use of unobservable inputs.
RESOLUTE FOREST PRODUCTS INC.
Notes to Consolidated Financial Statements
Share-based compensation
We recognize the cost of our share-based compensation over the requisite service period using the straight-line attribution approach, based on the grant date fair value for equity-based awards, and based on the fair value at the end of each reporting period for liability-based awards. The requisite service period is reduced for those employees who are retirement eligible at the date of the grant or who will become retirement eligible during the vesting period and who will be entitled to continue vesting in their entire award upon retirement.
Our stock incentive awards (as defined in Note 16,20, “Share-Based Compensation”) may be subject to market, performance and/or service conditions. For equity-based awards, the fair value of stock options is determined using a Black-Scholes option pricing formula, and the fair value of restricted stock units (or, “RSUs”), deferred stock units (or, “DSUs”) and performance stock units (or, “PSUs”) is determined based on the market price of a share of our common stock on the grant date. Liability-based awards, consisting of RSUs, DSUs, and PSUs, are initially measured based on the market price of a share of our common stock on the grant date and remeasured at the end of each reporting period, until settlement. Certain PSUs have a market condition considered in the determination of the fair value of the award, such that the ultimate number of units that vest will be
RESOLUTE FOREST PRODUCTS INC.
Notes to Consolidated Financial Statements
determined in part by total shareholder return relative to a group of peer companies. The fair value of those PSUs is determined using a Monte Carlo simulation model.
We estimate forfeitures of stock incentive awards and performance adjustments for our PSUs based on historical experience and forecasts, and recognize compensation cost only for those awards expected to vest. Estimated forfeitures and performance adjustments are updated to reflect new information or actual experience, as it becomes available.
Revenue recognition
Revenue arises from contracts with customers in which the sale of goods is the main performance obligation. A contract’s transaction price is allocated to each distinct performance obligation and recognized as revenue when or as the performance obligation is satisfied, which is when (point in time) or as (over time) control of the promised good or service is transferred to the customer.
Revenue is measured at the amount to which we are expected to be entitled in exchange for transferring goods based on consideration specified in the contract with the customer. Taxes assessed by a governmental authority that are both imposed on and concurrent with a specific revenue-producing transaction, that we collect from the customer, are excluded from revenue. When a contract with a customer includes variable consideration such as special pricing agreements and other volume-based incentives, revenue is recognized at the most likely amount based on sales forecasts, for which it is probable that a revenue reversal will not subsequently occur.
Revenue is recorded at a point in time when control over the goods transfers to the customer, which typically occurs upon shipment or delivery depending on the terms of the underlying contracts with customers. Pulp, tissue, paper and wood products are delivered to our customers in the United StatesU.S. and Canada directly from our mills primarily by truck or rail. Pulp and paper products are delivered to our international customers primarily by ship. For sales where control transfers to the customer at the shipping point, revenue is recorded when the product leaves the facility, whereas for sales where control transfers at the destination, revenue is recorded when the product is delivered to the customer’s delivery site.
Sales of our other products (green power produced from renewable sources and wood-related products) are recognized when the products are delivered and are included in “Cost of sales, excluding depreciation, amortization and distribution costs” in our Consolidated Statements of Operations.
Distribution costs
Shipping and handling costs associated with outbound freight after control over a product has transferred to a customer are accounted for as a fulfillment cost and are included in “Distribution costs” in our Consolidated Statements of Operations.
Translation
The functional currency of the majority of our operations is the U.S. dollar. Non-monetary assets and liabilities denominated in foreign currencies of these operations and the related income and expense items such as depreciation and amortization are remeasured into U.S. dollars using historical exchange rates. Remaining assets and liabilities are remeasured into U.S. dollars using the exchange rate as of the balance sheet date. Remaining income and expense items are remeasured into U.S. dollars
RESOLUTE FOREST PRODUCTS INC.
Notes to Consolidated Financial Statements
using a daily or monthly average exchange rate for the period. Gains and losses from foreign currency transactions and from remeasurement of the balance sheet items are reported in “Other (expense) income, net” in our Consolidated Statements of Operations.
The functional currency of our other operations is their local currency. Assets and liabilities of these operations are translated into U.S. dollars at the exchange rate in effect as of the balance sheet date. Income and expense items are translated using a daily or monthly average exchange rate for the period. The resulting translation gains or losses are recognized as a component of equity in “Accumulated other comprehensive loss.”
Derivatives financial instruments
We regularly enter into derivative financial instruments to manage our commodities price risk. These derivative instruments are not designated as hedging instruments and are recorded as either other assets or other liabilities at fair value in our Consolidated Balance Sheets. Changes in fair value are recognized in “Other (expenses) income, net” in our Consolidated Statements of Operations.
RESOLUTE FOREST PRODUCTS INC.
Notes to Consolidated Financial Statements
Net income (loss) per share
We calculate basic net income (loss) per share attributable to Resolute Forest Products Inc. common shareholders by dividing our net income (loss) by the basic weighted-average number of outstanding common shares. We calculate diluted net income per share attributable to Resolute Forest Products Inc. common shareholders by dividing our net income by the basic weighted-average number of outstanding common shares, as adjusted for dilutive potential common shares using the treasury-stock method. Potentially dilutive common shares consist of outstanding stock options, RSUs, DSUs and PSUs. To calculate diluted net lossincome (loss) per share attributable to Resolute Forest Products Inc. common shareholders, no adjustments to our basic weighted-averagesecurities that could have potentially dilutive effect on the weighted average number of outstanding common shares are made, since the impactinclude all or a portion of potentially dilutive common shares would be antidilutive.outstanding stock options, RSUs, DSUs and PSUs.
New accounting pronouncements adopted in 20182020
ASU 2014-09 “Revenue from Contracts from Customers”2016-13 “Measurement of Credit Losses on Financial Instruments”
Effective January 1, 2018,2020, we adopted on a modified retrospective basis Accounting Standards Update (or, “ASU”) 2014-09, “Revenue from Contracts from Customers,2016-13, “Measurement of Credit Losses on Financial Instruments,” issued by the Financial Accounting Standards Board (or, the “FASB”), in 2016 and the series of related accounting standard updates that followed (collectively, “Topic 606”). We utilized the modified retrospective method, which required the application of Topic 606 to: (i) all new revenue contracts entered into after January 1, 2018; and (ii) all existing revenue contracts as of January 1, 2018. The adoption of Topic 606 had no impact on our revenues, results of operations, or financial position.
ASU 2016-01 “Recognition and Measurement of Financial Assets and Financial Liabilities”
In January 2016, the FASB issued ASU 2016-01, “Recognition and Measurement of Financial Assets and Financial Liabilities,” which amends certain aspects of the recognition, measurement, presentation and disclosure of financial instruments. This update is effective for fiscal years beginning after December 15, 2017, including interim periods within those fiscal years. We adopted this ASU on January 1, 2018. The adoption of this accounting guidance did not impact our results of operations, financial position or cash flows.
ASU 2016-15 “Classification of Certain Cash Receipts and Cash Payments”
In August 2016, the FASB issued ASU 2016-15, “Classification of Certain Cash Receipts and Cash Payments,” which is intended to reduce diversity in practice in how certain transactions are classified in the statement of cash flows. This update is effective retrospectively for fiscal years beginning after December 15, 2017, and interim periods within those fiscal years. We adopted this ASU and all amendments to the guidance on January 1, 2018. The adoption of this accounting guidance did not impact the presentation of our cash flows.
ASU 2016-18 “Restricted Cash”
In November 2016, the FASB issued ASU 2016-18, “Restricted Cash,” which requires companies to include amounts generally described as restricted cash and restricted cash equivalents in cash and cash equivalents when reconciling beginning-of-period and end-of-period total amounts shown on the statement of cash flows. This update is effective for fiscal years beginning after December 15, 2017, and interim periods within those fiscal years. We adopted this ASU on January 1, 2018. Prior period amounts have been reclassified to conform to the 2018 presentation.
ASU 2017-05 “Clarifying the Scope of Asset Derecognition Guidance and Accounting for Partial Sales of Nonfinancial Assets”
In February 2017, the FASB issued ASU 2017-05, “Clarifying the Scope of Asset Derecognition Guidance and Accounting for Partial Sales of Nonfinancial Assets,” which clarifies the scope of Subtopic 610-20, “Other Income – Gains and Losses from the
RESOLUTE FOREST PRODUCTS INC.
Notes to Consolidated Financial Statements
Derecognition of Nonfinancial Assets” and adds guidance for partial sales of nonfinancial assets. This update is effective for fiscal years beginning after December 15, 2017, and interim periods within those fiscal years. We adopted this ASU on January 1, 2018. The adoption of this accounting guidance did not impact our results of operations, financial position or cash flows.
ASU 2017-07 “Improving the Presentation of Net Periodic Pension Cost and Net Periodic Postretirement Benefit Cost”
In March 2017, the FASB issued ASU 2017-07, “Improving the Presentation of Net Periodic Pension Cost and Net Periodic Postretirement Benefit Cost,” which requires employers that present a measure of operating income in their statements of earnings to disaggregate and present only the service cost component of net periodic pension and OPEB cost in operating expenses (together with other employee compensation costs arising during the period). Non-operating pension and OPEB costs are reported separately outside any subtotal of operating income. This update is effective retrospectively for fiscal years beginning after December 15, 2017, including interim periods within those fiscal years. We adopted this ASU on January 1, 2018.
The effect of this ASU on our Consolidated Statements of Operations for the year ended December 31, 2018, was as follows:
|
| | | | | | | | | | | | |
(In millions) | Before Accounting Standards Update | Effect of Change | As Reported |
| Cost of sales, excluding depreciation, amortization and distribution costs | $ | 2,497 |
| | $ | 52 |
| | $ | 2,549 |
| |
| Selling, general and administrative expenses | | 167 |
| | | (2 | ) | | | 165 |
| |
| Operating income | | 429 |
| | | (50 | ) | | | 379 |
| |
| Non-operating pension and other postretirement benefit credits | | — |
| | | 50 |
| | | 50 |
| |
The effect of this ASU on our Consolidated Statements of Operations for the year ended December 31, 2017, was as follows:
|
| | | | | | | | | | | | |
(In millions) | As Previously Reported | Effect of change | As Adjusted |
| Cost of sales, excluding depreciation, amortization and distribution costs | $ | 2,574 |
| | $ | 14 |
| | $ | 2,588 |
| |
| Selling, general and administrative expenses | | 172 |
| | | (2 | ) | | | 170 |
| |
| Closure costs, impairment and other related charges | | 87 |
| | | (5 | ) | | | 82 |
| |
| Operating income | | 49 |
| | | (7 | ) | | | 42 |
| |
| Non-operating pension and other postretirement benefit credits | | — |
| | | 7 |
| | | 7 |
| |
The effect of this ASU on our Consolidated Statements of Operations for the year ended December 31, 2016, was as follows:
|
| | | | | | | | | | | | |
(In millions) | As Previously Reported | Effect of change | As Adjusted |
| Cost of sales, excluding depreciation, amortization and distribution costs | $ | 2,716 |
| | $ | (6 | ) | | $ | 2,710 |
| |
| Selling, general and administrative expenses | | 149 |
| | | (2 | ) | | | 147 |
| |
| Operating loss | | (26 | ) | | | 8 |
| | | (18 | ) | |
| Non-operating pension and other postretirement benefit costs | | — |
| | | (8 | ) | | | (8 | ) | |
ASU 2018-02 “Reclassification of Certain Tax Effects from Accumulated Other Comprehensive Income”
In February 2018, the FASB issued ASU 2018-02, “Reclassification of Certain Tax Effects from Accumulated Other Comprehensive Income”, allowing an election to reclassify from accumulated other comprehensive income to retained earnings stranded income tax effects resulting from the TCJA. This update is effective for fiscal years beginning after December 15, 2018, and interim periods within those fiscal years and should be applied either in the period of adoption or retrospectively to each period in which the effect of the TCJA is recognized. As early adoption is permitted in a period for which financial
RESOLUTE FOREST PRODUCTS INC.
Notes to Consolidated Financial Statements
statements have not yet been issued, we adopted this ASUamended in 2018 and elected to reclassify the income tax effects, resulting in a $2 million decrease to “Deficit” and a corresponding increase to “Accumulated other comprehensive loss” in our Consolidated Balance Sheet as of December 31, 2018.
Accounting pronouncements not yet adopted as of December 31, 2018
ASU 2016-02 “Leases”
In February 2016, the FASB issued ASU 2016-02, “Leases,” amended in July by ASU 2018-10, “Codification Improvements to Topic 842, Leases,” ASU 2018-11, “Targeted Improvements,” and ASU 2018-20, “Narrow-Scope Improvements for Lessors,” which requires lessees to recognize leases on the balance sheet while continuing to recognize expenses in the income statement in a manner similar to current accounting standards. For lessors, the new standard modifies the classification criteria and the accounting for sales-type and direct financing leases. Enhanced disclosures will also be required to give financial statement users the ability to assess the amount, timing, and uncertainty of cash flows arising from leases.
This ASU may either be adopted on a modified retrospective approach at the beginning of the earliest comparative period, or through a cumulative-effect adjustment at the adoption date. This update is effective for fiscal years beginning after December 15, 2018, including interim periods within those fiscal years. We adopted these standards on January 1, 2019, through a cumulative-effect adjustment, resulting in an increase in total assets and total liabilities of approximately $65 million and no cumulative-effect adjustment to “Deficit” in our Consolidated Balance Sheet as of that date.
On adoption, we elected to apply the package of practical expedients that allows us not to reassess whether expired or existing contracts contain leases, the classification of these leases and whether previously capitalized initial direct costs would qualify for capitalization under Accounting Standards Codification (or “ASC”) 842. Furthermore, we elected to use hindsight in determining the lease term and assessing impairment of the right-of-use assets.
We are in the process of identifying and implementing appropriate changes in processes and internal controls to support the recognition of leases and disclosure under the new standard.
ASU 2016-13 “Measurement of Credit Losses on Financial Instruments”
In June 2016, the FASB issued ASU 2016-13, “Measurement of Credit Losses on Financial Instruments,” amended in November by ASU 2018-19, “Codification Improvements to Topic 326, Financial Instruments – Credit Losses,” which introduces the current expected credit losses model in the estimation of credit losses on financial instruments. This update is effective retrospectively for fiscal years beginning after December 15, 2019, and interim periods within those fiscal years, with earlyThe adoption being permitted for fiscal years beginning after December 15, 2018. We plan to adoptof this ASU onnew accounting guidance did not impact the opening deficit balance as of January 1, 2020. We are still evaluatingAs a result of the impactadoption of thisASU 2016-13, our accounts receivable accounting guidance on our results of operations and financial position as implementation of this project is at the assessment stage.policy was updated accordingly.
ASU 2018-14 “Changes2018-13 “Fair Value Measurement (Topic 820): Disclosure Framework-Changes to the Disclosure Requirements for Defined Benefit Plans”Fair Value Measurement”
In August 2018, the FASB issuedEffective January 1, 2020, we adopted ASU 2018-14, “Changes2018-13 “Fair Value Measurement (Topic 820): Disclosure Framework-Changes to the Disclosure Requirements for Defined Benefit Plans,” which intends to add, remove, and clarify disclosure requirements related to defined benefit pension and OPEB plans. This update is effective for fiscal years ending after December 15, 2020, with earlyFair Value Measurement” issued by the FASB in 2018. The adoption being permitted. We are still evaluating the impact of this standard onaccounting guidance did not impact our consolidated financial statements.Consolidated Financial Statements and disclosures.
ASU 2018-15 “Customer’s Accounting for Implementation Costs Incurred in a Cloud Computing Arrangement That Is a Service Contract”
In August 2018, the FASB issuedEffective January 1, 2020, we adopted ASU 2018-15, “Customer’s Accounting for Implementation Costs Incurred in a Cloud Computing Arrangement That Is a Service Contract,” issued by the FASB in 2018, which aligns the requirements for capitalizing implementation costs incurred in a hosting arrangement that is a service contract with the requirements for capitalizing implementation costs incurred to develop or obtain internal-use software (and hosting arrangements that include an internal-use software license). The adoption of this accounting guidance did not materially impact our results of operations or financial position.
Accounting pronouncements not yet adopted as of December 31, 2020
ASU 2019-12 “Simplifying the Accounting for Income Taxes”
In December 2019, the FASB issued ASU 2019-12, “Simplifying the Accounting for Income Taxes,” which removes the specific exceptions to the general principles in ASC 740, “Income Taxes,” and clarifies certain aspects of the existing guidance. This update is effective for fiscal years beginning after December 15, 2019,2020, including interim periods within those fiscal years, with early adoption being permitted as of the beginning of an interim or annual reporting period. All amendments to this ASU must be adopted in the same period on a prospective basis, with certain exceptions. We do not expect this accounting guidance to materially impact our results of operations or financial position.
ASU 2020-04 “Reference Rate Reform”
In March 2020, the FASB issued ASU 2020-04, “Reference Rate Reform,” which provides optional guidance for a limited period of time to ease the potential burden in accounting for (or recognizing the effects of) reference rate reform on financial reporting. This update provides optional expedients and exceptions for applying GAAP to contracts, hedging relationships, and other transactions that reference the London Interbank Offered Rate or another reference rate expected to be discontinued because of reference rate reform. This update is effective as of March 12, 2020, through December 31, 2022. We are stillcurrently evaluating thethis accounting guidance and have not elected an adoption date. We do not expect this accounting guidance to materially impact our results of this standard on our consolidatedoperations or financial statements.position.
RESOLUTE FOREST PRODUCTS INC.
Notes to Consolidated Financial Statements
Note 3. Business Acquisition
On February 1, 2020 (or, the “Acquisition Date”), we acquired from Conifex Timber Inc. all of the equity securities and membership interests in certain of its subsidiaries, the business of which consists mainly in the operation of three sawmills and related assets in Cross City (Florida) and in Glenwood and El Dorado (Arkansas) (or, the “U.S. Sawmill Business”). The U.S. Sawmill Business acquired produces construction-grade dimensional lumber and decking products from locally sourced southern yellow pine for distribution within the U.S. This acquisition diversified our lumber production, and increased our operating capacity in the U.S. South.
The fair value of the consideration, paid in cash, for the U.S. Sawmill Business acquired is $173 million. The acquisition is structured as an asset purchase for tax purposes, but treated as a business combination for accounting purposes.
The following table summarizes our final allocation of the purchase price to the fair values of assets acquired and liabilities assumed at the Acquisition Date:
| | | | | | | | |
| (In millions) | | |
Current assets (1) | $ | 19 | |
| Fixed assets | | 114 | |
Amortizable intangible assets (2) | | 21 | |
| Operating lease right-of-use assets | | 2 | |
Goodwill (3) | | 31 | |
| | |
| Total assets acquired and goodwill | $ | 187 | |
| Current liabilities | $ | 11 | |
| Long-term debt, net of current portion | | 2 | |
| Operating lease liabilities, net of current portion | | 1 | |
| Total liabilities assumed | $ | 14 | |
| Net assets acquired | $ | 173 | |
| | |
| Fair value of consideration transferred | $ | 173 | |
(1)Includes cash and cash equivalents of $1 million.
(2)Amortizable intangible assets identified relate to customer relationships, which have a weighted-average useful life of 10 years. The fair value of the customer relationships was determined using the income approach through an excess earnings analysis discounted at a rate of 12.6%.
(3)Goodwill represents the future economic benefit arising from other assets acquired that could not be individually identified and separately recognized and is mostly attributable to the U.S. Sawmill Business’s assembled workforce and synergies expected from combining our operations with the U.S. Sawmill Business. Goodwill is deductible for tax purposes.
The allocation of the purchase price was based on management’s estimate of the fair values of the acquired identifiable assets and assumed liabilities using valuation techniques including income, cost and market approaches (Level 3). We utilized both the cost and market approaches to value fixed assets, which consider external transactions and other comparable transactions, estimated replacement and reproduction costs, and estimated useful lives and consideration for physical, functional and economic obsolescence. We utilized the income approach to value intangible assets, which considers the present value of the net cash flows expected to be generated by the intangible assets, and excluding cash flows related to contributory assets.
From the Acquisition Date to the year ended December 31, 2020, our consolidated financial results included sales of $137 million and net income of $43 million attributable to the U.S. Sawmill Business. The U.S. Sawmill Business results of operations are included in the wood products segment, except for the El Dorado sawmill, which was idled at the time of the acquisition, and has been restarted in the fourth quarter of 2020. In connection with the acquisition of the U.S. Sawmill Business, we also recognized transaction costs of $3 million in “Other (expense) income, net” in our Consolidated Statement of Operations for the year ended December 31, 2020.
RESOLUTE FOREST PRODUCTS INC.
Notes to Consolidated Financial Statements
The following unaudited pro forma information for the years ended December 31, 2020 and 2019, represents our results of operations as if the acquisition of the U.S. Sawmill Business had occurred on January 1, 2019, excluding the results of operations of the El Dorado sawmill that has been idled since October 2019 and restarted in the fourth quarter of 2020. This pro forma information does not purport to be indicative of the results that would have occurred for the periods presented or that may be expected in the future.
| | | | | | | | | | | | | | | | | | | | | | | | | | | | | | | | | | | | | | |
| (Unaudited, in millions) | | | | | | 2020 | | 2019 | |
| Sales | | | | | | | $ | 2,808 | | | $ | 3,021 | | |
| Net income (loss) attributable to Resolute Forest Products Inc. | | | | | | | $ | 13 | | | $ | (70) | | |
Note 4. Other (Expense) Income, Net
Other (expense) income, net for the years ended December 31, 2020, 2019 and 2018, was comprised of the following:
| | | | | | | | | | | | | | | | | | | | | | | | | | | | | | | | | | | | | | |
| (In millions) | | | | | 2020 | | | 2019 | | | 2018 | |
| Foreign exchange loss | | | | $ | (4) | | | $ | (12) | | | $ | (2) | | |
Insurance recovery (1) | | | | | 15 | | | | 0 | | | | 0 | | |
Provision related to a litigation (2) | | | | | 0 | | | | (23) | | | | 0 | | |
| (Loss) gain on forward commodities contracts | | | | | (22) | | | | 0 | | | | 4 | | |
| Miscellaneous income | | | | | 7 | | | | 13 | | | | 3 | | |
| | | | $ | (4) | | | $ | (22) | | | $ | 5 | | |
(1)We recorded $15 million as other income for the year ended December 31, 2020, from the settlement of an insurance claim in connection with our acquisition of Atlas Paper Holdings, Inc. (or, “Atlas”) in 2015.
(2)We accrued C$30 million of legal indemnity and interest costs for the year ended December 31, 2019, in connection with the Quebec Superior Court decision of the fair value of the shares of former dissenting shareholders of Fibrek Inc. (or, “Fibrek”) upon acquisition in 2012. See Note 18, “Commitments and Contingencies - Fibrek acquisition,” for more information.
Note 3.5. Closure Costs, Impairment and Other Related Charges
Closure costs, impairment and other related charges for the year ended December 31, 2020, were comprised of the following:
| | | | | | | | | | | | | | | | | | | | | | | | | | | | | | | | |
| (In millions) | | Accelerated Depreciation | Severance and Other Costs | Total |
Paper mill at Amos (Quebec) (1) | | | | $ | 12 | | | $ | 5 | | | $ | 17 | | |
Paper mill at Baie-Comeau (Quebec) (1) | | | | | 26 | | | | 12 | | | | 38 | | |
| Other | | | | | 0 | | | | (2) | | | | (2) | | |
| | | | $ | 38 | | | $ | 15 | | | $ | 53 | | |
(1)Due to the overall decrease in demand for newsprint, accelerated by the economic context surrounding the COVID-19 pandemic, the Amos and Baie-Comeau paper mills have been temporarily idled since April 2020. As a result, we reassessed the remaining useful lives of the fixed assets and recognized an accelerated depreciation charge of $38 million. We also recognized additional provisions for severance and other costs of $17 million.
RESOLUTE FOREST PRODUCTS INC.
Notes to Consolidated Financial Statements
Closure costs, impairment and other related charges for the year ended December 31, 2019, were comprised of the following:
| | | | | | | | | | | | | | | | | | | | | | | | | | | | | | | | |
| (In millions) | | Accelerated Depreciation | Severance and Other Costs | Total |
| Indefinite idling | | | | | | | | | | | | |
| Paper mill at Augusta (Georgia) | | | | $ | 8 | | | $ | 10 | | | $ | 18 | | |
| | | | | | | | | | | | |
| | | | | | | | | | | | |
Closure costs, impairment and other related charges were $121 million for the year ended December 31, 2018, including $120 million of impairment charges related to the assets from the 2015 acquisition of Atlas Paper Holdings Inc. and its subsidiaries (or “Atlas”).subsidiaries.
Goodwill impairment charge
Following our 2018 annual impairment test of goodwill, we determined that the carrying value of the tissue reporting unit exceeded its estimated fair value. As a result, we recorded a goodwill impairment charge of $81 million for the year ended December 31, 2018, representing the entire goodwill amount.amount as of that date. This impairment charge resulted from cumulative losses of the tissue business and lower-than-expected projected cash flows, driven by operating and market-related factors. The fair value of the reporting unit was determined based on the present value of estimated future cash flows.
Long-lived assets impairment charges
As a result of the deterioration of estimated future cash flows of Atlas, we recorded for the year ended December 31, 2018, fixed assets impairment charges of $29 million and intangible assets impairment charges of $10 million to reduce the carrying value of these assets to their estimated fair value. The fair value of fixed assets was estimated using the market approach, by reference to estimated selling prices for similar assets, less costs to sell. The fair value of intangible assets was estimated using the income approach. Projected discounted cash flows utilized under the income approach included estimates regarding future revenues and expenses attributable to Atlas, projected capital expenditures and a discount rate of 12%. These fair value measurements are considered Level 3 measurements due to the significance of their unobservable inputs.
Closure costs, impairment and other related charges for the year ended December 31, 2017, were comprised of the following:
|
| | | | | | | | | | | | | | | | |
| (In millions) | Impairment of Assets | Accelerated Depreciation | Severance and Other Costs | Total |
Pulp mill at Coosa Pines (Alabama) (1) | $ | 55 |
| | $ | — |
| | $ | — |
| | $ | 55 |
| |
| Permanent closures | | | | | | | | | | | | |
| Paper machine at Catawba (South Carolina) | | 5 |
| | | — |
| | | 4 |
| | | 9 |
| |
| Paper machines at Calhoun (Tennessee) | | — |
| | | 6 |
| | | 2 |
| | | 8 |
| |
| Paper mill at Mokpo (South Korea) | | — |
| | | — |
| | | 7 |
| | | 7 |
| |
| Other | | — |
| | | — |
| | | 3 |
| | | 3 |
| |
| | $ | 60 |
| | $ | 6 |
| | $ | 16 |
| | $ | 82 |
| |
| |
(1)
| As a result of the continued deterioration of actual and projected cash flows, we recorded long-lived asset impairment charges of $55 million for the year ended December 31, 2017, to reduce the carrying value of the assets to their estimated fair value, which was determined using the market approach, by reference to market transaction prices for similar assets. The fair value measurement is considered a Level 3 measurement due to the significance of its unobservable inputs. |
Closure costs, impairment and other related charges for the year ended December 31, 2016, were comprised of the following:
|
| | | | | | | | | | | | | | | | |
| (In millions) | Impairment of Assets | Accelerated Depreciation | Severance and Other Costs | Total |
Paper mill at Mokpo (1) | $ | 13 |
| | $ | — |
| | $ | — |
| | $ | 13 |
| |
| Permanent closure | | | | | | | | | | | | |
| Paper machine at Augusta (Georgia) | | — |
| | | 32 |
| | | 4 |
| | | 36 |
| |
| Other | | 9 |
| | | 3 |
| | | 1 |
| | | 13 |
| |
| | $ | 22 |
| | $ | 35 |
| | $ | 5 |
| | $ | 62 |
| |
| |
(1)
| Due to declining market conditions and rising recycled fiber prices, we recorded long-lived asset impairment charges of $13 million for the year ended December 31, 2016, to reduce the carrying value of the assets to fair value. |
RESOLUTE FOREST PRODUCTS INC.
Notes to Consolidated Financial Statements
Management estimated fair value using the market approach, by reference to transactions on comparable assets adjusted for additional risks and uncertainties associated with the deteriorating market environment, as well as increased competition in Asia. The fair value measurement is considered a Level 3 measurement due to the significance of its unobservable inputs. In 2017, we announced the permanent closure of the Mokpo paper mill effective March 9, 2017.
Note 4.6. Net Gain on Disposition of Assets
During 2020, we recorded a net gain on disposition of assets of $11 million, which included: the sale of the Augusta paper mill for total cash consideration of $10 million, resulting in a net gain of $9 million; and the sale of the Thorold paper mill for total cash consideration of $4 million, resulting in a net gain of $2 million.
During 2018, we recorded a net gain on disposition of assets of $145 million, which included: the sale of the paper and pulp mill at Catawba (South Carolina) for total cash consideration of $280 million, (subject to final working capital adjustments), resulting in a net gain of $101 million; and the sale of the recycled bleached kraft pulp mill at Fairmont (West Virginia) for total cash consideration of $62 million, resulting in a net gain of $40 million.
During 2017, we recorded a net gain on disposition
RESOLUTE FOREST PRODUCTS INC.
Notes to Consolidated Financial Statements
Note 5.7. Accumulated Other Comprehensive Loss
The change in our accumulated other comprehensive loss by component (net of tax) for the yearyears ended December 31, 2020, 2019 and 2018, was as follows:
| | | | | | | | | | | | | | | | | | | | | | | | | | | | | | | | | | | | | | |
| (In millions) | Unamortized Prior Service (Costs) Credits | Unamortized Actuarial Losses | Foreign Currency Translation | Total |
| Balance as of December 31, 2017 | $ | 52 | | | $ | (826) | | | $ | (6) | | | $ | (780) | | |
| Other comprehensive loss before reclassifications | | (5) | | | | (162) | | | | (1) | | | | (168) | | |
Amounts reclassified from accumulated other comprehensive loss (1) | | (19) | | | | 19 | | | | 0 | | | | 0 | | |
| Net current period other comprehensive loss | | (24) | | | | (143) | | | | (1) | | | | (168) | | |
| Reclassification of stranded income tax | | 0 | | | | (2) | | | | 0 | | | | (2) | | |
| Balance as of December 31, 2018 | | 28 | | | | (971) | | | | (7) | | | | (950) | | |
| Other comprehensive (loss) income before reclassifications | | 0 | | | | (240) | | | | 1 | | | | (239) | | |
Amounts reclassified from accumulated other comprehensive loss (1) | | (12) | | | | 22 | | | | 0 | | | | 10 | | |
| Net current period other comprehensive (loss) income | | (12) | | | | (218) | | | | 1 | | | | (229) | | |
| | | | | | | | | | | | |
| Balance as of December 31, 2019 | | 16 | | | | (1,189) | | | | (6) | | | | (1,179) | | |
| Other comprehensive loss before reclassifications | | 0 | | | | (185) | | | | 0 | | | | (185) | | |
Amounts reclassified from accumulated other comprehensive loss (1) | | (17) | | | | 67 | | | | 0 | | | | 50 | | |
| Net current period other comprehensive loss | | (17) | | | | (118) | | | | 0 | | | | (135) | | |
| | | | | | | | | | | | |
| Balance as of December 31, 2020 | $ | (1) | | | $ | (1,307) | | | $ | (6) | | | $ | (1,314) | | |
|
| | | | | | | | | | | | | | | | |
| (In millions) | Unamortized Prior Service Credits | Unamortized Actuarial Losses | Foreign Currency Translation | Total |
| Balance as of December 31, 2017 | $ | 52 |
| | $ | (826 | ) | | $ | (6 | ) | | $ | (780 | ) | |
| Other comprehensive loss before reclassifications | | (5 | ) | | | (162 | ) | | | (1 | ) | | | (168 | ) | |
Amounts reclassified from accumulated other comprehensive loss (1) | | (19 | ) | | | 19 |
| | | — |
| | | — |
| |
| Net current period other comprehensive loss | | (24 | ) | | | (143 | ) | | | (1 | ) | | | (168 | ) | |
| Reclassification of stranded income tax (Note 2) | | — |
| | | (2 | ) | | | — |
| | | (2 | ) | |
| Balance as of December 31, 2018 | $ | 28 |
| | $ | (971 | ) | | $ | (7 | ) | | $ | (950 | ) | |
| |
(1)
| (1)See the table below for details about these reclassifications. |
The reclassifications out of accumulated other comprehensive loss for the year ended December 31, 2018, were comprised of the following:details about these reclassifications.
|
| | | | | |
| (In millions) | Amounts Reclassified From Accumulated Other Comprehensive Loss | Affected Line in the Consolidated Statements of Operations |
| Unamortized Prior Service Credits | | | | |
| Amortization of prior service credits | $ | (15 | ) | | Non-operating pension and other postretirement benefit credits (costs) (1) |
| Curtailment gain | | (5 | ) | | Net gain on disposition of assets (1) |
| | | 1 |
| | Income tax provision |
| | $ | (19 | ) | | Net of tax |
| Unamortized Actuarial Losses | | | | |
| Amortization of actuarial losses | $ | 33 |
| | Non-operating pension and other postretirement benefit credits (costs) (1) |
| Curtailment gain | | (8 | ) | | Net gain on disposition of assets (1) |
| Settlement loss | | 2 |
| | Net gain on disposition of assets (1) |
| Settlement loss | | 1 |
| | Non-operating pension and other postretirement benefit credits (costs) (1) |
| | | (9 | ) | | Income tax provision |
| | $ | 19 |
| | Net of tax |
| Total Reclassifications | $ | — |
| | Net of tax |
| |
(1)
| These items are included in the computation of net periodic benefit cost related to our pension and OPEB plans summarized in Note 12, “Pension and Other Postretirement Benefit Plans.” |
RESOLUTE FOREST PRODUCTS INC.
Notes to Consolidated Financial Statements
The reclassifications out of accumulated other comprehensive loss for the years ended December 31, 2020, 2019 and 2018, were comprised of the following:
| | | | | | | | | | | | | | | | | | | | | | | | | | | | | | | | |
| (In millions) | 2020 | 2019 | 2018 | Affected Line in the Consolidated Statements of Operations |
| Unamortized Prior Service Credits | | | | | | | | | | |
| Amortization of prior service credits | $ | (4) | | | $ | (11) | | | $ | (15) | | | Non-operating pension and other postretirement benefit credits (1) |
| Curtailment gain | | (13) | | | | (1) | | | | 0 | | | Non-operating pension and other postretirement benefit credits (1) |
| Curtailment gain | | 0 | | | | 0 | | | | (5) | | | Net gain on disposition of assets (1) |
| | | | | | | | | | |
| | 0 | | | | 0 | | | | 1 | | | Income tax provision |
| Net of tax | | (17) | | | | (12) | | | | (19) | | | |
| Unamortized Actuarial Losses | | | | | | | | | | |
| Amortization of actuarial losses | | 57 | | | | 28 | | | | 33 | | | Non-operating pension and other postretirement benefit credits (1) |
| Settlement loss | | 28 | | | | 1 | | | | 1 | | | Non-operating pension and other postretirement benefit credits (1) |
| | | | | | | | | | |
| Curtailment gain | | 0 | | | | 0 | | | | (8) | | | Net gain on disposition of assets (1) |
| Settlement loss | | 0 | | | | 0 | | | | 2 | | | Net gain on disposition of assets (1) |
| Other items | | 3 | | | | 0 | | | | 0 | | | |
| | (21) | | | | (7) | | | | (9) | | | Income tax provision |
| Net of tax | | 67 | | | | 22 | | | | 19 | | | |
| Total Reclassifications | $ | 50 | | | $ | 10 | | | $ | 0 | | | |
(1)These items are included in the computation of net periodic benefit cost (credit) related to our pension and OPEB plans summarized in Note 16, “Pension and Other Postretirement Benefit Plans.”
Note 6.8. Net Income (Loss) Per Share
The reconciliation of the basic and diluted net income (loss) per share for the years ended December 31, 2018, 20172020, 2019 and 2016,2018, was as follows:
| | | | | | | | | | | | | | | | | | | | | | | | | | | | | |
| (In millions, except per share amounts) | 2020 | | 2019 | | 2018 | |
| Numerator: | | | | | | | | | |
| Net income (loss) attributable to Resolute Forest Products Inc. | $ | 10 | | | $ | (47) | | | $ | 235 | | |
| Denominator: | | | | | | | | | |
| Basic weighted-average number of Resolute Forest Products Inc. common shares outstanding | | 86.1 | | | | 91.4 | | | | 91.3 | | |
| Dilutive impact of nonvested stock unit awards | | 0.3 | | | | 0 | | | | 2.0 | | |
| Diluted weighted-average number of Resolute Forest Products Inc. common shares outstanding | | 86.4 | | | | 91.4 | | | | 93.3 | | |
| Net income (loss) per share attributable to Resolute Forest Products Inc. common shareholders: | | | | | | | | | |
| Basic | $ | 0.12 | | | $ | (0.51) | | | $ | 2.57 | | |
| Diluted | $ | 0.12 | | | $ | (0.51) | | | $ | 2.52 | | |
RESOLUTE FOREST PRODUCTS INC.
Notes to Consolidated Financial Statements
|
| | | | | | | | | | | | |
| (In millions) | 2018 | | | 2017 | | | 2016 | | |
| Numerator: | | | | | | | | | |
| Net income (loss) attributable to Resolute Forest Products Inc. | $ | 235 |
| | $ | (84 | ) | | $ | (81 | ) | |
| Denominator: | | | | | | | | | |
| Basic weighted-average number of Resolute Forest Products Inc. common shares outstanding | | 91.3 |
| | | 90.5 |
| | | 89.9 |
| |
| Dilutive impact of nonvested stock incentive awards | | 2.0 |
| | | — |
| | | — |
| |
| Diluted weighted-average number of Resolute Forest Products Inc. common shares outstanding | | 93.3 |
| | | 90.5 |
| | | 89.9 |
| |
| Net income (loss) per share attributable to Resolute Forest Products Inc. common shareholders: | | | | | | | | | |
| Basic | $ | 2.57 |
| | $ | (0.93 | ) | | $ | (0.90 | ) | |
| Diluted | | 2.52 |
| | | (0.93 | ) | | | (0.90 | ) | |
The weighted-average number of outstanding stock options and nonvested equity-classified RSUs, DSUs and PSUs (collectively, “stock unit awards”) that were excluded from the calculation of diluted net income (loss) per share, as their impact would have been antidilutive, for the years ended December 31, 2018, 20172020, 2019 and 2016,2018, was as follows:
| | | | | | | | | | | |
| (In millions) | 2020 | 2019 | 2018 |
| Stock options | 0.9 | | 1.0 | | 1.2 | |
| Stock unit awards | 0.6 | | 2.1 | | 0 | |
|
| | | | | | |
| (In millions) | 2018 |
| 2017 |
| 2016 |
|
| Stock options | 1.2 |
| 1.4 |
| 1.4 |
|
| Stock unit awards | — |
| 4.1 |
| 2.6 |
|
Note 7.9. Inventories, Net
Inventories, net as of December 31, 20182020 and 2017,2019, were comprised of the following:
| | | (In millions) | 2018 | | | 2017 | | | (In millions) | 2020 | | 2019 | |
| Raw materials | $ | 106 |
| | $ | 108 |
| | Raw materials | $ | 132 | | | $ | 128 | | |
| Work in process | | 39 |
| | 38 |
| | Work in process | | 46 | | | 46 | | |
| Finished goods | | 180 |
| | 175 |
| | Finished goods | | 120 | | | 164 | | |
| Mill stores and other supplies | | 183 |
| | 205 |
| | Mill stores and other supplies | | 164 | | | 184 | | |
| | $ | 508 |
| | $ | 526 |
| | | $ | 462 | | | $ | 522 | | |
In 2017,2020, we recorded charges of $24$25 million for write-downs of mill stores and other supplies primarily relateddue to the permanent closuretemporary idling of twothe Amos and Baie-Comeau paper machines at Calhoun, a paper machine at the Catawba paper mill, and the Mokpo paper mill.mills. In 2016,2019, we recorded charges of $7$13 million for write-downs of mill stores and other supplies primarily as a resultdue to the indefinite idling of the permanent closure of a newsprint machine at our Augusta paper mill. These charges were included in “Cost of sales, excluding depreciation, amortization and distribution costs” in our Consolidated Statements of Operations.
RESOLUTE FOREST PRODUCTS INC.
Notes to Consolidated Financial Statements
Note 8.10. Fixed Assets, Net
Fixed assets, net as of December 31, 20182020 and 2017,2019, were comprised of the following:
| | | | | | | | | | | | | | | | | | | | | | | | | | | | | |
| (Dollars in millions) | Estimated Useful Lives (Years) | 2020 | | 2019 | |
| Land and land improvements | 5 | – | 20 | $ | 52 | | | $ | 52 | | |
| Buildings | 10 | – | 40 | | 328 | | | | 313 | | |
Machinery and equipment (1) | 2 | – | 25 | | 2,128 | | | | 2,256 | | |
| Hydroelectric power plants | 10 | – | 40 | | 301 | | | | 303 | | |
| Timberlands and timberlands improvements | 10 | – | 20 | | 136 | | | | 128 | | |
| Construction in progress | | | | | 100 | | | | 65 | | |
| | | | | 3,045 | | | | 3,117 | | |
| Less: Accumulated depreciation | | | | | (1,604) | | | | (1,658) | | |
| | | | | $ | 1,441 | | | $ | 1,459 | | |
|
| | | | | | | | | |
| (Dollars in millions) | Estimated Useful Lives (Years) | 2018 | | | 2017 | | |
| Land and land improvements | 5 – 20 | $ | 51 |
| | $ | 56 |
| |
| Buildings | 10 – 40 | | 305 |
| | | 298 |
| |
Machinery and equipment (1) | 2 – 25 | | 2,185 |
| | | 2,544 |
| |
| Hydroelectric power plants | 10 – 40 | | 297 |
| | | 292 |
| |
| Timberlands and timberlands improvements | 10 – 20 | | 113 |
| | | 110 |
| |
| Construction in progress | | | 62 |
| | | 30 |
| |
| | | | 3,013 |
| | | 3,330 |
| |
| Less: Accumulated depreciation | | | (1,498 | ) | | | (1,614 | ) | |
| | | $ | 1,515 |
| | $ | 1,716 |
| |
(1)Internal-use software included in fixed assets, net as of December 31, 20182020 and 2017,2019, was as follows: |
| | | | | | | | |
| (In millions) | 2018 | | | 2017 | | |
| Machinery and equipment | $ | 114 |
| | $ | 111 |
| |
| Less: Accumulated depreciation | | (59 | ) | | | (42 | ) | |
| | $ | 55 |
| | $ | 69 |
| |
| | | | | | | | | | | | | | | | | | | | |
| (In millions) | 2020 | | 2019 | |
| Machinery and equipment | $ | 124 | | | $ | 115 | | |
| | | | | | |
| Less: Accumulated depreciation | | (90) | | | | (76) | | |
| | $ | 34 | | | $ | 39 | | |
Depreciation expense related to internal-use software is estimated to be $17$14 million in 2019, $13 million from 2020 to 2021, $8$10 million in 2022, and $3$5 million in 2023.2023, $2 million in 2024 and $1 million in 2025.
We recorded accelerated depreciation of $38 million for the Amos and Baie-Comeau paper mills for the year ended December 31, 2020. We also recorded accelerated depreciation of $8 million for the year ended December 31, 2019, as a result of the indefinite idling of our paper mill in Augusta. See Note 5, “Closure Costs, Impairment and Other Related Charges” for more information.
RESOLUTE FOREST PRODUCTS INC.
Notes to Consolidated Financial Statements
Depreciation expense related to fixed assets was $163 million, $164 million, and $207 million for the years ended December 31, 2020, 2019 and 2018, respectively.
Note 9.11. Amortizable Intangible Assets, Net
Amortizable intangible assets, net as of December 31, 20182020 and 2017,2019, were comprised of the following:
| | | | | | | | | | | | | | | | | | | | | | | | | | | | | | | | | | | | | | | | | | | | | | | | | | | | | | | | | | | | | | | | | | | | | |
| | | | 2020 | | | 2019 |
| (Dollars in millions) | Estimated
Useful
Lives
(Years) | Gross
Carrying
Value | Accumulated
Amortization | Net | | | Gross
Carrying
Value | Accumulated
Amortization | Net |
Water rights (1) | 10 | – | 40 | $ | 19 | | | $ | 9 | | | $ | 10 | | | | | $ | 19 | | | $ | 8 | | | $ | 11 | | |
| Energy contracts | 15 | – | 25 | | 52 | | | | 21 | | | | 31 | | | | | | 52 | | | | 18 | | | | 34 | | |
Customer relationships (2) | 10 | | 23 | | | | 3 | | | | 20 | | | | | | 2 | | | | 1 | | | | 1 | | |
| Other | | | | | 2 | | | | 0 | | | | 2 | | | | | | 2 | | | | 0 | | | | 2 | | |
| | | | | $ | 96 | | | $ | 33 | | | $ | 63 | | | | | $ | 75 | | | $ | 27 | | | $ | 48 | | |
|
| | | | | | | | | | | | | | | | | | | | | | | | | | |
| | | 2018 | | 2017 |
| (Dollars in millions) | Estimated Useful Lives (Years) | Gross
Carrying
Value | Accumulated
Amortization | Net | | Gross
Carrying
Value | Accumulated
Amortization | Net |
Water rights (1) | 10 – 40 | $ | 19 |
| | $ | 7 |
| | $ | 12 |
| | | $ | 19 |
| | $ | 5 |
| | $ | 14 |
| |
| Energy contracts | 15 – 25 | | 52 |
| | | 16 |
| | | 36 |
| | | | 52 |
| | | 14 |
| | | 38 |
| |
Customer relationships (2) | 10 | | 2 |
| | | 1 |
| | | 1 |
| | | | 14 |
| | | 2 |
| | | 12 |
| |
| Other | | | 1 |
| | | — |
| | | 1 |
| | | | 1 |
| | | — |
| | | 1 |
| |
| | | $ | 74 |
| | $ | 24 |
| | $ | 50 |
| | | $ | 86 |
| | $ | 21 |
| | $ | 65 |
| |
| |
(1)(2)In connection with our acquisition of the U.S. Sawmill Business, we identified amortizable intangible assets primarily related to customer relationships. See Note 3, “Business Acquisition” for additional information. | In order to operate our hydroelectric generation and transmission network, we draw water from various rivers in Quebec. For some of our facilities, the use of such government-owned waters is governed by water power agreements with the province of Quebec, which set out the terms, conditions, and fees (as applicable). Terms of these agreements typically range from 10 to 25 years and are generally renewable, under certain conditions. In some cases, the agreements are contingent on the continued operation of the related paper mills and a minimum level of capital spending in the region. For our other facilities, the right to generate hydroelectricity stems from our ownership of the riverbed on which these facilities are located. |
| |
(2)
| As a result of the deterioration of estimated future cash flows of Atlas, we recorded intangible assets impairment charges of $10 million for the year ended December 31, 2018. See Note 3, “Closure Costs, Impairment and Other Related Charges” for more information. |
Amortization expense related to amortizable intangible assets was $6 million, $3 million and $5 million for the years ended December 31, 2020, 2019 and 2018, and 2017, respectively, and $4 million for the year ended December 31, 2016.respectively. Amortization expense related to amortizable intangible assets is estimated to be $4$6 million for each2021 and $5 million per year for 2022, 2023, 2024 and 2025.
Note 12. Operating Leases
We have operating leases for buildings, machinery, chemical equipment, rail cars, and office equipment with remaining terms of less than one year to 22 years. These leases may include renewal options for up to 15 years.
The components of lease expense for the years ended December 31, 2020 and 2019, were as follows:
| | | | | | | | | | | | | | | | | | | | | | | | | | | |
| (In millions) | 2020 | | | 2019 | | | | |
| Operating lease cost | $ | 13 | | | | $ | 13 | | | | | | |
Variable lease cost (1) | $ | 20 | | | | $ | 21 | | | | | | |
(1)Variable lease cost is determined by the consumption of the next three yearsunderlying asset.
Operating lease expense for the year ended December 31, 2018 was $12 million.
Supplemental information related to operating leases was as follows:
| | | | | | | | | | | | | | | | | | | | | | | |
| December 31,
2020 | | December 31,
2019 |
| | | | | | | |
| | | | | | | |
| | | | | | | |
| | | | | | | |
| | | | | | | |
| | | | | | | |
| | | | | | | |
| Weighted-average remaining operating lease term (in years) | | 10.8 | | | | 11.1 | |
| Weighted-average operating lease discount rate | | 4.6 | % | | | | 4.7 | % | |
RESOLUTE FOREST PRODUCTS INC.
Notes to Consolidated Financial Statements
| | | | | | | | | | | | | | | | | | | | | | | | | | | |
| (In millions) | Year Ended December 31, 2020 | | Year Ended December 31, 2019 | | |
| Operating cash flow payments for operating lease liabilities | $ | 12 | | | | $ | 11 | | | | | | |
| Operating lease right-of-use assets obtained in exchange for operating lease liabilities | $ | 8 | | | | $ | 4 | | | | | | |
The maturities of operating lease liabilities as of December 31, 2020, were as follows:
| | | | | | | | | | | |
| (In millions) | Operating Leases |
| 2021 | $ | 12 | | |
| 2022 | | 11 | | |
| 2023 | | 8 | | |
| 2024 | | 7 | | |
| 2025 | | 6 | | |
| 2026 and thereafter | | 38 | | |
| Total lease payments | | 82 | | |
| Less: imputed interest | | 18 | | |
| Total operating lease liabilities | $ | 64 | | |
Note 13. Other Assets
Other assets include countervailing and $3anti-dumping duty cash deposits on softwood lumber of $194 million in 2022 and 2023.$49 million, respectively, as of December 31, 2020, and of $128 million and $34 million, respectively, as of December 31, 2019. See Note 18, “Commitments and Contingencies” for more information.
Note 10.14. Accounts Payable and Accrued Liabilities
Accounts payable and accrued liabilities as of December 31, 20182020 and 2017,2019, were comprised of the following:
| | | | | | | | | | | | | | | | | | | | |
| (In millions) | 2020 | | 2019 | |
| Trade accounts payable | $ | 251 | | | $ | 255 | | |
| Accrued compensation | | 76 | | | | 52 | | |
| Accrued interest | | 4 | | | | 3 | | |
| Pension and other postretirement benefit obligations | | 14 | | | | 15 | | |
| | | | | | |
| | | | | | |
| Income and other taxes payable | | 5 | | | | 4 | | |
| | | | | | |
| | | | | | |
| Other | | 19 | | | | 13 | | |
| | $ | 369 | | | $ | 342 | | |
|
| | | | | | | | |
| (In millions) | 2018 | | | 2017 | | |
| Trade accounts payable | $ | 299 |
| | $ | 306 |
| |
| Payroll, bonuses and severance payable | | 63 |
| | | 55 |
| |
| Accrued interest | | 5 |
| | | 5 |
| |
| Pension and other postretirement benefit obligations | | 17 |
| | | 18 |
| |
| Income and other taxes payable | | 4 |
| | | 10 |
| |
| Deposits | | 20 |
| | | 3 |
| |
| Environmental liabilities | | 2 |
| | | 2 |
| |
| Other | | 17 |
| | | 21 |
| |
| | $ | 427 |
| | $ | 420 |
| |
RESOLUTE FOREST PRODUCTS INC.
Notes to Consolidated Financial Statements
Note 11.15. Long-Term Debt
Overview
Long-term debt, including current portion, as of December 31, 20182020 and 2017,2019, was comprised of the following:
| | | (In millions) | 2018 | | | 2017 | | | (In millions) | 2020 | | 2019 | |
| 5.875% senior unsecured notes due 2023: | | | | | | 5.875% senior unsecured notes due 2023: | |
| Principal amount | $ | 600 |
| | $ | 600 |
| | Principal amount | $ | 375 | | | $ | 375 | | |
| Deferred financing costs | | (5 | ) | | (5 | ) | | Deferred financing costs | | (2) | | | (3) | | |
| Unamortized discount | | (3 | ) | | (3 | ) | | Unamortized discount | | (1) | | | (1) | | |
| Total senior unsecured notes due 2023 | | 592 |
| | 592 |
| | |
| Term loan due 2025 | | 46 |
| | 46 |
| | |
| Total 5.875% senior unsecured notes due 2023 | | Total 5.875% senior unsecured notes due 2023 | | 372 | | | 371 | | |
| Term loans due 2030 | | Term loans due 2030 | | 180 | | | 0 | | |
| Borrowings under revolving credit facilities | | — |
| | 144 |
| | Borrowings under revolving credit facilities | | 0 | | | 71 | | |
| Capital lease obligation | | 7 |
| | 7 |
| | |
| Finance lease obligations | | Finance lease obligations | | 9 | | | 7 | | |
| Total debt | | 645 |
| | 789 |
| | Total debt | | 561 | | | 449 | | |
| Less: Current portion of 5.875% senior unsecured notes due 2023 | | (222 | ) | | — |
| | |
| Less: Current portion of capital lease obligation | | (1 | ) | | (1 | ) | | |
| | Less: Current portion of finance lease obligations | | Less: Current portion of finance lease obligations | | (2) | | | (1) | | |
| Long-term debt, net of current portion | $ | 422 |
| | $ | 788 |
| | Long-term debt, net of current portion | $ | 559 | | | $ | 448 | | |
Debt instruments
2023Senior Unsecured Notes
We issued $600 million in aggregate principal amount of 5.875% senior unsecured notes due 2023 (or, the “2023 Notes”) on May 8, 2013, pursuant to an indenture as of that date (the(or, the “indenture”). Upon their issuance, the notes were recorded at their fair value of $594 million, which reflected a discount of $6 million that is being amortized to “Interest expense” in our Consolidated Statements of Operations using the interest method over the term of the notes, resulting in an effective interest rate of 6%. Interest on the notes is payable semi-annually beginning November 15, 2013, until their maturity date of May 15, 2023. In connection with the issuance of the notes, we incurred financing costs of $9 million, which were deferred and recorded as a reduction of the notes. These deferredDeferred financing costs are being amortized to “Interest expense” in our Consolidated Statements of Operations using the interest method over the term of the notes. On May 27, 2014, the 2023 Notes and related guarantees were registered under the Securities Act of 1933 (as amended, the “Securities Act”).
On January 3, 2019, (the “closing date”), we repurchased $225 million in aggregate principal amount of the 2023 Notes, pursuant to a notes purchase agreement entered into on December 21, 2018, with certain noteholders, at a purchase price equal to 100% of the principal amount thereof, plus accrued and unpaid interest to, but not including, the closing date. The aggregate principal amount and related deferred financing costs and unamortized discount were included in “Current portion of long-term debt” in our Consolidated Balance Sheet as of December 31, 2018.interest. As a result of the repurchase, we will recordrecorded a net loss on extinguishment of debt of $3 million in “Other (expense) income, net” in our Consolidated StatementsStatement of Operations infor the first quarter ofyear ended December 31, 2019.
The 2023 Notes are guaranteed by all of our existing and subsequently acquired or organized direct or indirect wholly-owned U.S. subsidiaries that guarantee the ABL Credit Facility (as defined and discussed below). The notes are unsecured and effectively junior to indebtedness under both the ABL Credit Facility and the Senior Secured Credit Facility (as defined and discussed below), and to future secured indebtedness. In addition, the notes are structurally subordinated to all existing and future liabilities of our subsidiaries that do not guarantee the notes.
The terms of the indenture impose certain restrictions, subject to a number of exceptions and qualifications, including limits on our ability to: incur, assume or guarantee additional indebtedness; issue redeemable stock and preferred stock; pay dividends or make distributions or redeem or repurchase capital stock; prepay, redeem or repurchase certain debt; make loans and investments; incur liens; restrict dividends, loans or transfer assets from our subsidiaries; sell or otherwise dispose of assets, including capital stock of subsidiaries; consolidate or merge with or into, or sell substantially all of our assets to, another person; enter into transactions with affiliates; and enter into new lines of business.
RESOLUTE FOREST PRODUCTS INC.
Notes to Consolidated Financial Statements
In the event of a change of control, each holder will havehas the right to require us to repurchase all or any part of that holder’s notes at a purchase price in cash equal to 101% of the aggregate principal amount of the notes plus any accrued and unpaid interest. If we sell certain of our assets and do not use the proceeds to pay down certain indebtedness, purchase additional assets or make
RESOLUTE FOREST PRODUCTS INC.
Notes to Consolidated Financial Statements
capital expenditures, each as specified in the indenture, we must offer to purchase the notes at a redemption price of 100% of the principal amount thereof plus accrued and unpaid interest with the net cash proceeds from the asset sale.
The 2023 Notes are redeemable, in whole or in part, since May 15, 2017, at redemption prices equal to a percentage of the principal amount plus accrued and unpaid interest, as follows:
|
| |
| Year (beginning May 15) | Redemption Price |
| 2018 | 102.938% |
| 2019 | 101.469% |
| 2020 and thereafter | 100.000% |
interest. The fair value of the 2023 Notes (Level 1) was $598$375 million and $622$380 million as of December 31, 20182020 and 2017,2019, respectively.
On February 2, 2021, we completed the private offering (or, the “Offering”) of $300 million aggregate principal amount of our 4.875% senior notes due 2026 (or, the “2026 Notes”) at an issue price of 100%. We used the net proceeds of the Offering, together with cash on hand, to redeem all of the outstanding $375 million aggregate principal amount of our 2023 Notes at a price of 100% of the aggregate principal amount thereof, plus accrued and unpaid interest to, but not including, the redemption date. See Note 23, “Subsequent Events” for additional information.
Senior Secured Credit Facility
On September 7, 2016, we entered into a senior secured credit facility (or the “Senior Secured Credit Facility”) for up to $185 million. The Senior Secured Credit Facility providesThis senior secured credit facility provided a term loan of $46 million with a maturity date of September 7, 2025, (the “Term Loan”),and a revolving credit facility of up to $139 million with a maturity date of September 7, 2022 (the2022. On October 28, 2019, we entered into an amended and restated senior secured credit facility (or, the “RevolvingSenior Secured Credit Facility”) for up to $360 million, replacing our existing $185 million senior secured credit facility. The Senior Secured Credit Facility provided a term loan facility of up to $180 million with a delayed draw period of up to three years, and the choice of maturities of six to 10 years (or, the “Term Loan Facility”), and a six-year revolving credit facility of up to $180 million with a maturity date of October 28, 2025 (or, the “Revolving Credit Facility”). In March 2020, we borrowed $180 million in term loans under the Term Loan Facility for 10 years, maturing in March 2030. There is also provides an uncommitted option to increase the Senior Secured Credit Facility by up to $175an additional $360 million, subject to certain terms and conditions. On October 28, 2019, we repaid our $46 million term loan by borrowing under the Revolving Credit Facility.
The obligations under the Senior Secured Credit Facility are guaranteed by certain material U.S. subsidiaries of the Company and are secured by a first priority mortgage on the real property of our Calhoun (Tennessee) facility and a first priority security interest on the fixtures and equipment located therein, and related assets.therein.
Interest rates under the Senior Secured Credit Facility are based, at the Company’s election, on either a floating rate based on the London Interbank Offered Rate (or, the “LIBOR”), or a base rate, in each case plus a spread over the index. The Senior Secured Credit Facility also contains provisions for an expedited amendment procedure for replacing LIBOR if LIBOR quotes are no longer available. The base rate is the highest of (i) the prime rate; (ii) the federal funds effective rate plus 0.5%; and (iii) the one-month LIBOR plus 1%. The applicable spread over the index fluctuates quarterly based upon the Company’s capitalization ratio, which is defined as the ratio of the Company’s funded indebtedness to the sum of the Company’s funded indebtedness and its adjusted net worth. For loans under the Term Loan Facility, the applicable spread ranges from 0.875%1.0% to 1.5% for base rate loans, and from 1.875%2.0% to 2.5% for LIBOR loans. For loans under the Revolving Credit Facility, the applicable spread ranges from 0.5% to 1.125%1.0% for base rate loans, and from 1.5% to 2.125%2.0% for LIBOR loans. The Senior Secured Credit Facility was issued by a syndicate of lenders within the farm credit system and is eligible for patronage refunds. Patronage refunds are distributions of profits from lenders in the farm credit system, which are cooperatives that are required to distribute profits to their members. Patronage distributions, which are made in either cash or stock, are received in the year after they were earned. Future refunds are dependent on future farm credit lender profits, made at the discretion of each farm credit lender.
In addition to paying interest on outstanding principal under the Senior Secured Credit Facility, we are required to pay a fee in respect of unutilized commitments based on the average daily utilization for the prior fiscal quarter ranging from 0.275% to 0.325% per annum under the Revolving Credit Facility.
The outstanding principal balance under the Term Loan Facility is subject to annual payments of 5% of the initial principal amount commencing in March 2025 with the balance due at maturity in March 2030. Loans under the Revolving Credit Facility equal to 0.325% per annum when average daily utilization underand the Revolving Credit Facility for the prior fiscal quarter is less than or equal to 35% of the total revolving commitments, and 0.275% per annum when average daily utilization under the Revolving Credit Facility for the prior fiscal quarter is greater than 35% of the total revolving commitments.
Base rate loans under the Senior Secured CreditTerm Loan Facility may be repaidprepaid from time to time at our discretion without premium or penalty. LIBOR loans may be repaid from time to time at our discretion,penalty but subject to breakage costs, if any.any, in the case of LIBOR loans. Amounts repaid on the Term Loan Facility may not be subsequently re-borrowed. Principal amounts under the Revolving Credit Facility may be drawn, repaid, and redrawn until September 6, 2022.October 27, 2025.
Pursuant to the Senior Secured Credit Facility, we are also required to maintain (i) a capitalization ratio not greater than 45% at all times, available liquidity of not less than $100 million, andtimes; (ii) a collateral coverage ratio of not less than 1.81.8:1.0; and (iii) a springing consolidated fixed charge coverage ratio of 1.0:1.0, which is triggered only when adjusted availability under the ABL Credit Facility falls below the greater of $45 million
RESOLUTE FOREST PRODUCTS INC.
Notes to 1.0 (eachConsolidated Financial Statements
or 10% of the maximum available borrowing amount under the ABL Credit Facility for 2 consecutive business days. The consolidated fixed charge coverage ratio is the ratio of (a) consolidated EBITDA less certain capital expenditures and less cash taxes paid, to (b) consolidated fixed charges, as defined indetermined under the Senior Secured Credit Facility). Facility.
In addition, the Senior Secured Credit Facility contains certain covenants applicable to the Company and its subsidiaries, including, among others: (i) requirements to deliver financial statements, other reports and notices; (ii) restrictions on the existence or incurrence and repayment of indebtedness; (iii) restrictions on the existence or
RESOLUTE FOREST PRODUCTS INC.
Notes to Consolidated Financial Statements
incurrence of liens; (iv) restrictions on the Company and certain of its subsidiaries making certain restricted payments; (v) restrictions on making certain investments; (vi) restrictions on certain mergers, consolidations, and asset dispositions; (vii) restrictions on transactions with affiliates; and (viii) restrictions on modifications to material indebtedness. The Senior Secured Credit Facility includes customary representations, and warranties and events of default subject to customary grace periods and notice requirements, also contains certain customary events of default.requirements.
As of December 31, 2018,2020 we had $139$180 million of availability under the Revolving Credit Facility, which was undrawn.undrawn; there were $46 million of borrowings as of December 31, 2019. The fair valuesvalue of the Term Loan and Revolving Credit Facility (Level 2) approximated theirits carrying valuesvalue as of both December 31, 20182019 and 2017.was bearing interest at LIBOR plus a spread of 1.63%.The fair value of the Term Loan Facility (Level 2) approximated its carrying value as of December 31, 2020, and was bearing interest at LIBOR plus a spread of 2.13%.
ABL Credit Facility
On May 14, 2019, we entered into an amendment to thefive-year credit agreement dated May 22, 2015, we entered into a five-year credit agreement for a senior secured asset-based revolving credit facility (the(or, “ABL Credit Facility”),. The amended credit agreement provides for an extension of the maturity date to May 14, 2024, with an aggregate lender commitment of up to $600$500 million at any time outstanding, subject to borrowing base availability based on specified advance rates, eligibility criteria and customary reserves. The ABL Credit Facility will mature on May 22, 2020.
The aggregate lender commitment under the facility includes a $60 million swingline sub-facility and a $200 million letter of credit sub-facility, and we may convert up to $50 million of the commitments under the facility to a first-in last-out facility (or, “FILO Facility”), subject to the consent of each converting lender. The ABL Credit Facility also provides for an uncommitted ability to increase the revolving credit facility by up to $500 million, subject to certain terms and conditions set forth in the agreement.
Revolving loan (and letter of credit) availability under the credit agreementfacility is subject to a borrowing base, which at any time is equal to the sum of (i) 85% of eligible accounts receivable (or 90% with respect to certain insured or letter of credit backed accounts or with accounts owed by investment grade obligors), plus (ii) the lesser of (A) 70% of the lesser of the cost or market value of eligible inventory or (B) 85% of the net orderly liquidation value of eligible inventory, plus (iii) 100% of the value of eligible cash and 95% of the value of permitted investments held in deposit accounts controlled solely by the administrative and collateral agent (or, the “agent”). The FILOcredit agreement includes reserves that reduce the borrowing base, including: (i) a reserve commencing March 16, 2023 for the outstanding principal amount due under the 2023 Notes; and (ii) a reserve for the outstanding principal amount due under the Senior Secured Credit Facility, will becommencing 60 days before its maturity. The borrowing base is subject to a borrowing base, which at any time will be equal to (i) 5% of the eligible accounts receivable, plus (ii) 10% of the appraised net orderly value of the eligible inventory (subject to reduction to 5% over the term of the facility). Each borrowing base described above is subject toother customary reserves and eligibility criteria, in the exercise of the agent’s reasonable discretion.
The obligations under the credit agreement are guaranteed by certain material subsidiaries of the Company and are secured by first priority liens on and security interests in accounts receivable, inventory and related assets.
Loans under the credit agreement bear interest at a rate equal to thea base rate, the LIBOR, or the Canadian banker’s acceptanceDollar Offered Rate (or, the “BACDOR”) rate,, in each case plus an applicable margin. The applicable margin is between 0.00% and 0.75%0.50% with respect to base rate loans and between 1.00% and 1.75%1.50% with respect to LIBOR and Canadian BACDOR loans, in each case based on availability under the credit facility and a leverage ratio.
Loans outstanding under the FILO Facility bear interest at a rate that is 1.25% per annum higher than the interest rate payable on revolving loans not made under the FILO Facility.
In addition to paying interest on outstanding principal under the ABL Credit Facility, we are required to pay a fee in respect of unutilized commitments under the ABL Credit Facility equal to 0.30% per annum when average daily utilization under the ABL Credit Facility for the prior fiscal quarter is less than 35% of the total revolving commitments, and 0.25% per annum when average daily utilization under the ABL Credit Facility for the prior fiscal quarter is greater than or equal to 35% of the total revolving commitments, as well as a fee in respect of outstanding letters of credit (equal to the applicable margin in respect of LIBOR and Canadian BACDOR loans plus a fronting fee of 0.125% and certain administrative fees).
Base rate loansLoans under the ABL Credit Facility may be repaid from time to time at our discretion without premium or penalty.penalty, with the exception of breakage costs for LIBOR and Canadian BA rateCDOR loans, may be repaid from time to time at our discretion, subject to breakage costs, if any. However, no loans under the FILO Facility can be repaid
RESOLUTE FOREST PRODUCTS INC.
Notes to Consolidated Financial Statements
unless all other loans under the credit agreement are repaid first. We are required to repay outstanding loans that exceed the maximum availability then in effect.
The credit agreement contains customary covenants for asset-based credit agreements of this type, including, among other things: (i) requirements to deliver financial statements, other reports and notices; (ii) restrictions on the existence or incurrence and repayment of indebtedness by the Company and its subsidiaries; (iii) restrictions on the existence or incurrence of liens by
RESOLUTE FOREST PRODUCTS INC.
Notes to Consolidated Financial Statements
the Company and its subsidiaries; (iv) restrictions on the Company and certain of its subsidiaries making certain restricted payments; (v) restrictions on the Company and certain of its subsidiaries making certain investments; (vi) restrictions on certain mergers, consolidations and asset dispositions; (vii) restrictions on transactions with affiliates; (viii) restrictions on amendments or modifications to the Canadian pension and benefit plans; (ix) restrictions on modifications to material indebtedness; and (x) a springing requirement for the Company to maintain a minimum consolidated fixed charge coverage ratio, as determined under the credit agreement, of 1.0:1.0, anytime availability under the facility falls below the greater of $50$45 million or 10% of the maximum available borrowing amount for two consecutive business days. Subject to customary grace periods and notice requirements, the credit agreement also contains certain customary events of default.
As of December 31, 2018,2020, we had $378$270 million of availability under the ABL Credit Facility, which was undrawn except for $53$56 million of ordinary course letters of credit outstanding. The fair value of the ABL Credit Facility (Level 2) approximated its carrying value as of both December 31, 20182019. There were $25 million of borrowings as of December 31, 2019, bearing interest at the base rate.
Effective January 21, 2021, we reduced the commitment under the Canadian tranche of our senior secured asset-based revolving credit facility. See Note 23, “Subsequent Events” for additional information.
Loan Facility
On November 4, 2020, our Canadian subsidiary, Resolute FP Canada Inc., entered into a secured delayed draw term loan facility (or, the “Loan Facility”) with Investissement Québec as lender for up to C$220 million ($173 million as of December 31, 2020), representing up to 75% of the countervailing and 2017.anti-dumping duty deposits (or, the “Duties”) imposed or expected to be imposed by the U.S. Department of Commerce and collected by Customs and Border Protection Agency (or, “U.S. Customs”) on U.S. imports of applicable softwood lumber products produced at sawmills of the Borrower and its affiliates located in the province of Quebec, Canada from April 28, 2017 to December 31, 2022.
CapitalThe outstanding principal will be repaid in consecutive monthly installments over a period of eight years, after an interest only period of two years from the date of the first draw. Outstanding amounts may be prepaid, partially or fully, at any time at our discretion, without premium or penalty, but subject to payment of accrued and unpaid interest. We are required to make a prepayment equal to any amounts reimbursed by U.S. Customs on account of the U.S. imports of certain softwood lumber products produced at our sawmills located in the province of Quebec, Canada (or, the “Quebec Prepayments”).
The obligations under the Loan Facility will be secured by a first priority security interest and a control agreement on certain of our bank accounts identified to receive any Quebec Prepayments. In addition, we have agreed to transfer to the designated bank accounts any amounts constituting Quebec Prepayments, and may not grant any other security interest on such bank accounts. The Loan Facility is required to be used exclusively to finance certain of our activities and obligations in the province of Quebec, Canada, and may not be used to pay or reimburse any Duties.
The borrowings under the Loan Facility bear interest at a floating rate equal to 1.45% above the one-month Canadian banker’s acceptance rate. Interest will be payable on a monthly basis.
The Loan Facility provides for a maximum of 10 draws and the fulfillment of certain conditions upon each draw. We are required to pay a fee of 0.5% of the amounts drawn at the time of each draw.
The Loan Facility contains certain covenants, including, among others, a requirement that we do not move a substantial part of its assets outside the province of Quebec. The Lender reserves the right to terminate the Loan Facility in the event that we have not made any draw before June 30, 2023, subject to certain conditions. The Lender reserves the right to accelerate any outstanding amounts within 60 days of receiving notification of certain change of control events affecting us, if the Lender deems the transaction not to be in its best interest, acting reasonably.
RESOLUTE FOREST PRODUCTS INC.
Notes to Consolidated Financial Statements
As of December 31, 2020, we had C$165 million (approximately $130 million) of availability under the Loan Facility, which was undrawn.
Finance lease obligationobligations
We have a capitalfinance lease obligationobligations for machinery with maturity dates up to June 2025, and a warehouse with a maturity date of December 1, 2027 which can be renewed for 20 years at our option. Minimum monthly payments are determined by an escalatory price clause.
Debt maturities
The aggregate maturities of long-term debt as of December 31, 2020, were as follows:
| | | | | | | | | | | |
| (In millions) | Long-term debt |
| 2021 | $ | 2 | | |
| 2022 | | 2 | | |
| 2023 | | 373 | | |
| 2024 | | 1 | | |
| 2025 | | 1 | | |
| 2026 and thereafter | | 182 | | |
| | $ | 561 | | |
Assets pledged as collateral
The carrying value of assets pledged as collateral for our total debt obligations was $1,675$1,246 million as of December 31, 2018.2020.
RESOLUTE FOREST PRODUCTS INC.
Notes to Consolidated Financial Statements
Note 12.16. Pension and Other Postretirement Benefit Plans
We have a number of defined contribution plans covering a portion of our U.S. and Canadian employees. Under the U.S. qualified defined contribution plan, employees are allowed to make contributions that we match, and most employees also receive an automatic company contribution, regardless of the employee’s contribution. The amount of the automatic company contribution, in most instances, is a percentage of the employee’s pay, determined based on age and years of service. The Canadian registered defined contribution plans provide for mandatory contributions by employees and by us, as well as opportunities for employees to make additional optional contributions and receive, in somemost cases, matching contributions on those optional amounts. Our expense for the defined contribution plans totaled $17 million in 2020, $18 million in 2019, and $20 million in 2018, and $21 million in both 2017 and 2016.2018.
We also have multiple contributory and non-contributory defined benefit pension plans covering a portion of our U.S. and Canadian employees. Benefits are based on years of service and, depending on the plan, average compensation earned by employees either during their last years of employment or over their careers. Our plan assets and cash contributions to the plans have been sufficient to provide pension benefits to participants and meet the funding requirements of the Employee Retirement Income Security Act of 1974 in the United StatesU.S. as well as applicable legislation in Canada. We also sponsor a number of OPEB plans (e.g., health care and life insurance plans) for retirees at certain locations.
Certain of the above plans are covered under collective bargaining agreements.
In December 2020, the pension plan of the Thorold paper mill, which was indefinitely idled in 2017 and sold in 2020, was wound-up following the approval of the pension benefits distribution and assets liquidation. This resulted in the conversion of the buy-in annuity contract to a buy-out contract, and the recognition of a settlement loss of $28 million in “Non-operating pension and other postretirement benefit credits” in our Consolidated Statements of Operations for the year ended December 31, 2020, and the reduction of both pension plan assets and pension benefit obligations by $98 million.
The following tables include both our foreign (Canada) and domestic plans. The assumptions used to measure the obligations of each of our foreign and domestic plans are not significantly different from each other, with the exception of the health care trend rates, which are presented below.
RESOLUTE FOREST PRODUCTS INC.
Notes to Consolidated Financial Statements
The changes in our pension and OPEB benefit obligations and plan assets for the years ended December 31, 20182020 and 2017,2019, and the funded status and reconciliation of amounts recognized in our Consolidated Balance Sheets as of December 31, 20182020 and 2017,2019, were as follows:
| | | | Pension Plans | | OPEB Plans | | Pension Plans | | OPEB Plans |
| (In millions) | 2018 | | | 2017 | | | | 2018 | | | 2017 | | | (In millions) | 2020 | | 2019 | | | 2020 | | 2019 | |
| Change in benefit obligations: | | | | | | | | | | Change in benefit obligations: | |
| Benefit obligations as of beginning of year | $ | 5,474 |
| | $ | 5,196 |
| | $ | 172 |
| | $ | 172 |
| | Benefit obligations as of beginning of year | $ | 5,188 | | | $ | 4,774 | | | $ | 147 | | | $ | 148 | | |
| Service cost | | 19 |
| | 19 |
| | 1 |
| | 1 |
| | Service cost | | 14 | | | 15 | | | 1 | | | 0 | | |
| Interest cost | | 189 |
| | 199 |
| | 6 |
| | 7 |
| | Interest cost | | 151 | | | 181 | | | 4 | | | 6 | | |
| Actuarial (gain) loss | | (102 | ) | | 156 |
| | (7 | ) | | (7 | ) | | |
| Actuarial loss (gain) | | Actuarial loss (gain) | | 265 | | | 386 | | | (6) | | | 1 | | |
| Participant contributions | | 7 |
| | 7 |
| | 2 |
| | 2 |
| | Participant contributions | | 7 | | | 7 | | | 2 | | | 2 | | |
| Plan amendment | | — |
| | — |
| | 5 |
| | (1 | ) | | |
| | Special termination benefits | | — |
| | 5 |
| | — |
| | — |
| | Special termination benefits | | 3 | | | 0 | | | 0 | | | 0 | | |
| Curtailments | | — |
| | 1 |
| | — |
| | 4 |
| | Curtailments | | (2) | | | 0 | | | (1) | | | 0 | | |
| Settlements | | (25 | ) | | (29 | ) | | — |
| | — |
| | Settlements | | (118) | | | (18) | | | 0 | | | 0 | | |
| Divestiture | | (84 | ) | | — |
| | (8 | ) | | — |
| | |
| | Benefits paid | | (367 | ) | | (365 | ) | | (15 | ) | | (13 | ) | | Benefits paid | | (341) | | | (347) | | | (13) | | | (14) | | |
| Effect of foreign currency exchange rate changes | | (337 | ) | | 285 |
| | (8 | ) | | 7 |
| | Effect of foreign currency exchange rate changes | | 79 | | | 190 | | | 2 | | | 4 | | |
| Benefit obligations as of end of year | | 4,774 |
| | 5,474 |
| | 148 |
| | 172 |
| | Benefit obligations as of end of year | | 5,246 | | | 5,188 | | | 136 | | | 147 | | |
| Change in plan assets: | | | | | | | | | | Change in plan assets: | |
| Fair value of plan assets as of beginning of year | | 4,377 |
| | 4,073 |
| | — |
| | — |
| | Fair value of plan assets as of beginning of year | | 3,862 | | | 3,652 | | | 0 | | | 0 | | |
| Actual return on plan assets | | (101 | ) | | 346 |
| | — |
| | — |
| | Actual return on plan assets | | 241 | | | 336 | | | 0 | | | 0 | | |
| Employer contributions | | 101 |
| | 111 |
| | 13 |
| | 11 |
| | Employer contributions | | 91 | | | 81 | | | 11 | | | 12 | | |
| Participant contributions | | 7 |
| | 7 |
| | 2 |
| | 2 |
| | Participant contributions | | 7 | | | 7 | | | 2 | | | 2 | | |
| Settlements | | (25 | ) | | (29 | ) | | — |
| | — |
| | Settlements | | (118) | | | (18) | | | 0 | | | 0 | | |
| Divestiture | | (58 | ) | | — |
| | — |
| | — |
| | |
| | Benefits paid | | (367 | ) | | (365 | ) | | (15 | ) | | (13 | ) | | Benefits paid | | (341) | | | (347) | | | (13) | | | (14) | | |
| Effect of foreign currency exchange rate changes | | (282 | ) | | 234 |
| | — |
| | — |
| | Effect of foreign currency exchange rate changes | | 64 | | | 151 | | | 0 | | | 0 | | |
| Fair value of plan assets as of end of year | | 3,652 |
| | 4,377 |
| | — |
| | — |
| | Fair value of plan assets as of end of year | | 3,806 | | | 3,862 | | | 0 | | | 0 | | |
| Funded status as of end of year | $ | (1,122 | ) | | $ | (1,097 | ) | | $ | (148 | ) | | $ | (172 | ) | | Funded status as of end of year | $ | (1,440) | | | $ | (1,326) | | | $ | (136) | | | $ | (147) | | |
| Amounts recognized in our Consolidated Balance Sheets consisted of: | | | | | | | | | | Amounts recognized in our Consolidated Balance Sheets consisted of: | |
| Other assets | $ | 4 |
| | $ | 6 |
| | $ | — |
| | $ | — |
| | Other assets | $ | 0 | | | $ | 2 | | | $ | 0 | | | $ | 0 | | |
| Accounts payable and accrued liabilities | | (3 | ) | | (3 | ) | | (14 | ) | | (15 | ) | | Accounts payable and accrued liabilities | | (3) | | | (4) | | | (11) | | | (11) | | |
| Pension and OPEB obligations | | (1,123 | ) | | (1,100 | ) | | (134 | ) | | (157 | ) | | Pension and OPEB obligations | | (1,437) | | | (1,324) | | | (125) | | | (136) | | |
| Net obligations recognized | $ | (1,122 | ) | | $ | (1,097 | ) | | $ | (148 | ) | | $ | (172 | ) | | Net obligations recognized | $ | (1,440) | | | $ | (1,326) | | | $ | (136) | | | $ | (147) | | |
The total benefit obligations and the total fair value of plan assets for pension plans with benefit obligations in excess of plan assets were $4,548$5,067 million and $3,422$3,627 million, respectively, as of December 31, 2018,2020, and were $5,213$4,923 million and $4,110$3,595 million, respectively, as of December 31, 2017.2019. The total accumulated benefit obligations and the total fair value of plan assets for pension plans with accumulated benefit obligations in excess of plan assets were $4,510$5,034 million and $3,422$3,627 million, respectively, as of December 31, 2018,2020, and were $5,163$4,884 million and $4,110$3,595 million, respectively, as of December 31, 2017.2019. The total accumulated benefit obligations for all pension plans were $4,735$5,212 million and $5,421$5,149 million as of December 31, 20182020 and 2017,2019, respectively.
The actuarial losses and gains impacting the benefit obligations for our pension and OPEB plans in 2020 are primarily due to changes in the economic environment, which resulted in a decrease to the discount rates selected for the plans as of December 31, 2020, compared to December 31, 2019. The actuarial losses impacting the benefit obligations for our pension and OPEB plans in 2019 were primarily due to changes in the economic environment, which resulted in a decrease to the discount rates selected for the plans as of December 31, 2019, compared to December 31, 2018.
RESOLUTE FOREST PRODUCTS INC.
Notes to Consolidated Financial Statements
Components of net periodic benefit cost (credit)
The components of net periodic benefit cost (credit) relating to our pension and OPEB plans for the years ended December 31, 2018, 20172020, 2019 and 2016,2018, were as follows:
| | | | | | | | | | | | | | | | | | | | | | | | | | | | | | | | | | | | | | | | | | | | | | | | | | | | | | | | | | | |
| Pension Plans | | OPEB Plans |
| (In millions) | 2020 | | 2019 | | 2018 | | | 2020 | | 2019 | | 2018 | |
| Interest cost | $ | 151 | | | $ | 181 | | | $ | 189 | | | | $ | 4 | | | $ | 6 | | | $ | 6 | | |
| Expected return on plan assets | | (226) | | | | (251) | | | | (264) | | | | | 0 | | | | 0 | | | | 0 | | |
| Amortization of prior service credits | | 0 | | | | 0 | | | | (1) | | | | | (4) | | | | (11) | | | | (14) | | |
| Amortization of actuarial losses (gains) | | 63 | | | | 34 | | | | 38 | | | | | (6) | | | | (6) | | | | (5) | | |
| Non-operating credits | | (12) | | | | (36) | | | | (38) | | | | | (6) | | | | (11) | | | | (13) | | |
| Service cost | | 14 | | | | 15 | | | | 19 | | | | | 1 | | | | 0 | | | | 1 | | |
| Net periodic benefit costs (credits) before special events | | 2 | | | | (21) | | | | (19) | | | | | (5) | | | | (11) | | | | (12) | | |
Curtailments, settlements and other losses (gains) (1) | | 32 | | | | 0 | | | | 3 | | | | | (14) | | | | 0 | | | | (13) | | |
| $ | 34 | | | $ | (21) | | | $ | (16) | | | | $ | (19) | | | $ | (11) | | | $ | (25) | | |
|
| | | | | | | | | | | | | | | | | | | | | | | | | |
| | Pension Plans | | OPEB Plans |
| (In millions) | 2018 | | | 2017 | | | 2016 | | | | 2018 | | | 2017 | | | 2016 | | |
| Interest cost | $ | 189 |
| | $ | 199 |
| | $ | 215 |
| | | $ | 6 |
| | $ | 7 |
| | $ | 7 |
| |
| Expected return on plan assets | | (264 | ) | | | (254 | ) | | | (247 | ) | | | | — |
| | | — |
| | | — |
| |
| Amortization of prior service credits | | (1 | ) | | | (1 | ) | | | (1 | ) | | | | (14 | ) | | | (14 | ) | | | (15 | ) | |
| Amortization of actuarial losses (gains) | | 38 |
| | | 55 |
| | | 54 |
| | | | (5 | ) | | | (5 | ) | | | (5 | ) | |
| Non-operating (credits) costs | | (38 | ) | | | (1 | ) | | | 21 |
| | | | (13 | ) | | | (12 | ) | | | (13 | ) | |
| Service cost | | 19 |
| | | 19 |
| | | 20 |
| | | | 1 |
| | | 1 |
| | | 1 |
| |
| Net periodic benefit (credits) costs before special events | | (19 | ) | | | 18 |
| | | 41 |
| | | | (12 | ) | | | (11 | ) | | | (12 | ) | |
| Curtailments, settlements and other losses (gains) | | 3 |
| | | 7 |
| | | — |
| | | | (13 | ) | | | (1 | ) | | | — |
| |
| | $ | (16 | ) | | $ | 25 |
| | $ | 41 |
| | | $ | (25 | ) | | $ | (12 | ) | | $ | (12 | ) | |
The prior service credits and the actuarial gains and losses are amortized to “Cost of sales, excluding depreciation, amortization“Non-operating pension and distribution costs”other postretirement benefit credits” in our Consolidated Statements of Operations, over the expected average remaining service lifetime or the average future lifetime, as applicable, of the respective plans. We estimate that $28 million of actuarial losses and $11 million of prior service credits will be amortized from accumulated other comprehensive loss into our Consolidated Statements of Operations in 2019.
Assumptions used to determine benefit obligations and net periodic benefit costcosts (credits)
The weighted-average assumptions used to determine the benefit obligations at the measurement dates (each December 31) and the net periodic benefit costcosts (credits) for the years ended December 31, 2018, 20172020, 2019 and 2016,2018, were as follows:
| | | | Pension Plans | | OPEB Plans | | Pension Plans | | OPEB Plans |
| | 2018 |
| | 2017 |
| | 2016 |
| | 2018 |
| | 2017 |
| | 2016 |
| | 2020 | | 2019 | | 2018 | | 2020 | | 2019 | | 2018 |
| Benefit obligations: | | | | | | | | | | | | Benefit obligations: | |
| Discount rate | 3.8 | % | | 3.6 | % | | 3.8 | % | | 3.9 | % | | 3.6 | % | | 3.9 | % | Discount rate | 2.5 | % | | 3.0 | % | | 3.8 | % | | 2.5 | % | | 3.1 | % | | 3.9 | % |
| Rate of compensation increase | 2.1 | % | | 2.1 | % | | 2.5 | % | |
|
| |
|
| |
|
| Rate of compensation increase | 2.1 | % | | 2.1 | % | | 2.1 | % | |
| Net periodic benefit cost: | | | | | | | | | | | | |
| | Net periodic benefit cost (credit): | | Net periodic benefit cost (credit): | |
| Discount rate | 3.6 | % | | 3.8 | % | | 4.2 | % | | 3.6 | % | | 3.9 | % | | 4.4 | % | Discount rate | 3.0 | % | | 3.8 | % | | 3.6 | % | | 3.1 | % | | 3.9 | % | | 3.6 | % |
| Expected return on assets | 6.5 | % | | 6.3 | % | | 6.2 | % | |
|
| |
|
| |
|
| Expected return on assets | 6.0 | % | | 6.5 | % | | 6.5 | % | |
| Rate of compensation increase | 2.1 | % | | 2.5 | % | | 2.5 | % | |
|
| |
|
| |
|
| Rate of compensation increase | 2.1 | % | | 2.1 | % | | 2.1 | % | |
|
The discount rate for our domestic and foreign plans was determined with a model that develops a hypothetical high-quality bond portfolio, where the bonds are theoretically purchased to settle the expected benefit payments of the plans. The discount rate reflects the single rate that produces the same discounted values as the value of the theoretical bond portfolio. In determining the expected return on assets, we considered the historical returns and the future expectations for returns for each asset class, as well as the target asset allocation of the pension portfolio. In determining the rate of compensation increase, we reviewed historical salary increases and promotions, while considering current industry conditions, the terms of collective bargaining agreements with our employees, and the outlook for our industry. In determining the life expectancy rate of our domestic and foreign plans, we used the most-recentmost recent actuarially-determined mortality tables and improvement scales. For the foreign plans, the mortality tables were adjusted with the result of our historical mortality experience study. The rates used are consistent with our future expectations of life expectancy for the employees who participate in our pension and OPEB plans.
RESOLUTE FOREST PRODUCTS INC.
Notes to Consolidated Financial Statements
The assumed health care cost trend rates used to determine the benefit obligations for our domestic and foreign OPEB plans as of December 31, 20182020 and 2017,2019, were as follows:
| | | | 2018 | | 2017 | | 2020 | | 2019 |
| | Domestic Plan | Foreign Plans | | Domestic Plan | Foreign Plans | | Domestic Plan | Foreign Plans | | Domestic Plan | Foreign Plans |
| Health care cost trend rate assumed for next year | 7.2 | % | | 4.8 | % | | 7.2 | % | | 4.8 | % | | Health care cost trend rate assumed for next year | 7.2 | % | | 4.8 | % | | 7.2 | % | | 4.8 | % | |
| Rate to which the cost trend rate is assumed to decline (ultimate trend rate) | 4.5 | % | | 4.5 | % | | 4.5 | % | | 4.5 | % | | Rate to which the cost trend rate is assumed to decline (ultimate trend rate) | 4.5 | % | | 4.5 | % | | 4.5 | % | | 4.5 | % | |
| Year that the rate reaches the ultimate trend rate | 2031 |
| | 2031 |
| | 2030 |
| | 2028 |
| | Year that the rate reaches the ultimate trend rate | 2033 | | 2033 | | 2032 | | 2032 | |
For the health care cost trend rates, we considered historical trends for these costs, actual experience of the plans, recently enacted health care legislation as well as future expectations.
Variations of the health care cost trend rate can have a significant effect on the amounts reported. A 1% change in this assumption would have had the following impact on our 2018 OPEB obligation and costs for our domestic and foreign plans:
|
| | | | | | | | | | | | | | | | | | | | | | | | | | | | | |
| | 1% Increase | | 1% Decrease |
| (In millions, except percentages) | Domestic Plan | Foreign Plans | | Domestic Plan | Foreign Plans |
| OPEB obligation | $ | 2 |
| | 4 | % | | $ | 5 |
| | 5 | % | | | $ | (2 | ) | | (3 | )% | | $ | (4 | ) | | (4 | )% | |
| Service and interest costs | $ | — |
| | 6 | % | | $ | — |
| | 6 | % | | | $ | — |
| | (5 | )% | | $ | — |
| | (5 | )% | |
Fair value of plan assets
The fair value of plan assets held by our pension plans as of December 31, 2018,2020, was as follows:
|
| | | | | | | | | | | | |
| (In millions) | Total | | | Level 1 | | | Level 2 | | |
| Equity securities: | | | | | | | | | |
| U.S. companies | $ | 725 |
| | $ | 725 |
| | $ | — |
| |
| Non-U.S. companies | | 946 |
| | | 946 |
| | | — |
| |
| Debt securities: | | | | | | | | | |
| Corporate and government securities | | 1,021 |
| | | 71 |
| | | 950 |
| |
| Asset-backed securities | | 309 |
| | | — |
| | | 309 |
| |
| Cash and cash equivalents | | 216 |
| | | 216 |
| | | — |
| |
| Other plan assets, net | | 11 |
| | | — |
| | | 11 |
| |
| Total before investments measured at NAV | $ | 3,228 |
| | $ | 1,958 |
| | $ | 1,270 |
| |
| Investments measured at NAV | | 424 |
| | | | | | | |
| | $ | 3,652 |
| | | | | | | |
RESOLUTE FOREST PRODUCTS INC.
Notes to Consolidated Financial Statements
| | | | | | | | | | | | | | | | | | | | | | | | | | | | | | | | | | | | | | |
| (In millions) | Total | | Level 1 | | Level 2 | | Level 3 | |
| Equity securities: | | | | | | | | | | | | |
| U.S. companies | $ | 737 | | | $ | 737 | | | $ | 0 | | | $ | 0 | | |
| Non-U.S. companies | | 1,197 | | | | 1,197 | | | | 0 | | | | 0 | | |
| Debt securities: | | | | | | | | | | | | |
| Corporate and government securities | | 1,086 | | | | 36 | | | | 1,050 | | | | 0 | | |
| Asset-backed securities | | 148 | | | | 0 | | | | 148 | | | | 0 | | |
| Cash and cash equivalents | | 179 | | | | 179 | | | | 0 | | | | 0 | | |
| | | | | | | | | | | | |
| Other plan assets, net | | 9 | | | | 0 | | | | 9 | | | | 0 | | |
| | | | | | | | | | | | |
| Total before investments measured at NAV | $ | 3,356 | | | $ | 2,149 | | | $ | 1,207 | | | $ | 0 | | |
| Investments measured at NAV | | 450 | | | | | | | | | | | |
| $ | 3,806 | | | | | | | | | | | |
The fair value of plan assets held by our pension plans as of December 31, 2017,2019, was as follows:
| | | | | | | | | | | | | | | | | | | | | | | | | | | | | | | | | | | | | | |
| (In millions) | Total | | Level 1 | | Level 2 | | Level 3 | |
| Equity securities: | | | | | | | | | | | | |
| U.S. companies | $ | 717 | | | $ | 717 | | | $ | 0 | | | $ | 0 | | |
| Non-U.S. companies | | 978 | | | | 978 | | | | 0 | | | | 0 | | |
| Debt securities: | | | | | | | | | | | | |
| Corporate and government securities | | 1,154 | | | | 145 | | | | 1,009 | | | | 0 | | |
| Asset-backed securities | | 294 | | | | 0 | | | | 294 | | | | 0 | | |
| Cash and cash equivalents | | 158 | | | | 158 | | | | 0 | | | | 0 | | |
Certain insurance contracts (1) | | 106 | | | | 0 | | | | 0 | | | | 106 | | |
| | | | | | | | | | | | |
| Total before investments measured at NAV | $ | 3,407 | | | $ | 1,998 | | | $ | 1,303 | | | $ | 106 | | |
| Investments measured at NAV | | 455 | | | | | | | | | | | |
| $ | 3,862 | | | | | | | | | | | |
(1)The Level 3 plan assets were purchased during the year ended December 31, 2019. In December 2020, the Level 3 plan assets decreased by $106 million. The decrease includes assets settlements and sales of $98 million and $11 million, respectively, offset by gains of $2 million recognized in Accumulated other comprehensive loss and $1 million recognized in “Non-operating pension and other postretirement benefit credits” in our Consolidated Statements of Operations.
|
| | | | | | | | | | | | |
| (In millions) | Total | | | Level 1 | | | Level 2 | | |
| Equity securities: | | | | | | | | | |
| U.S. companies | $ | 882 |
| | $ | 882 |
| | $ | — |
| |
| Non-U.S. companies | | 1,132 |
| | | 1,132 |
| | | — |
| |
| Debt securities: | | | | | | | | | |
| Corporate and government securities | | 1,244 |
| | | 126 |
| | | 1,118 |
| |
| Asset-backed securities | | 275 |
| | | — |
| | | 275 |
| |
| Cash and cash equivalents | | 169 |
| | | 166 |
| | | 3 |
| |
| Other plan liabilities, net | | (2 | ) | | | — |
| | | (2 | ) | |
| Total before investments measured at NAV | $ | 3,700 |
| | $ | 2,306 |
| | $ | 1,394 |
| |
| Investments measured at NAV | | 677 |
| | | | | | | |
| | $ | 4,377 |
| | | | | | | |
RESOLUTE FOREST PRODUCTS INC.
Notes to Consolidated Financial Statements
Equity securities include large-cap, mid-cap and small-cap publicly-traded companies mainly located in the United States,U.S., Canada and other developed and emerging countries, as well as commingled equity funds invested in the same types of securities. The fair value of the equity securities is determined based on quoted market prices (Level 1).
Debt securities include corporate bonds of U.S. and Canadian companies from diversified industries, bonds and Treasuries issued by the U.S. government and the Canadian federal and provincial governments, asset-backed securities and commingled fixed income funds invested in these same types of securities. The fair value of the debt securities is determined based on quoted market prices (Level 1), and market-corroborated inputs such as matrix prices, yield curves and indices (Level 2).
Certain insurance contracts include group contracts that have been purchased to cover a portion of the plan members. The fair value of annuity buy-in contracts changes based on fluctuations in the obligation associated with the covered plan members (Level 3).
Other plan assets, and liabilitiesnet, include accrued interest and dividends, and amounts receivable or payable for unsettled security transactions. The fair value of accrued interest and dividends is determined based on market-corroborated inputs such as declared dividends and stated interest rates (Level 2). The fair value of receivables and payables for unsettled security transactions is determined based on market-corroborated inputs such as the trade date fair value of the security (Level 2).
Investments measured at NAV are excluded from the fair value hierarchy tables. These investments are commingled funds, composed of either debt securities, equity securities or real estate investments, where the corresponding NAV per share is equal to the total net assets divided by the total number of shares.
Long-term strategy and objective
Our investment strategy and objective is to maximize the long-term rate of return on our plan assets within an acceptable level of risk in order to meet our current and future obligations to pay benefits to qualifying employees and their beneficiaries while minimizing and stabilizing pension benefit costs and contributions. Diversification of assets is achieved through strategic allocations to various asset classes, and by retaining multiple, experienced third-party investment management firms with complementary investment styles and philosophies to implement these allocations. Risk is further managed by reviewing our investment policies at least annually and monitoring our fund managers at least quarterly for compliance with mandates and performance measures. A series of permitted and prohibited investments are listed in our respective investment policies, which are provided to our fund managers. The use of derivative financial instruments for speculative purposes and investments in the equity or debt securities of Resolute and its affiliates is prohibited.
We have established a target asset allocation policy and ranges for each participating defined benefit pension plan based upon analysis of risk and return tradeoffs and correlations of asset mixes given long-term historical returns, prospective capital market returns, forecasted benefit payments and the forecasted timing of those payments. The targeted asset allocation policy of the plan assets is designed to hedge the change in the pension liabilities resulting from fluctuations in the discount rate by investing in debt and other securities, while also generating excess returns required to reduce the unfunded pension deficit by investing in equity securities with higher potential returns. The targeted asset allocation policy of each participating defined benefit pension plan is 50% equity securities, with an allowable range of 30% to 60%, and 50% debt and other securities, with an allowable range of 40% to 70%, including up to 5% in short-term instruments required for near-term liquidity needs. Approximately 60% of the equity securities are targeted to be invested in the U.S. and Canada, with the balance in other developed and emerging countries. Substantially all of the debt securities are targeted to be invested in the U.S. and Canada.
RESOLUTE FOREST PRODUCTS INC.
Notes to Consolidated Financial Statements
The asset allocation for each participating defined benefit pension plan is reviewed periodically and, when necessary, rebalanced to bring the asset allocation within the prescribed ranges.
RESOLUTE FOREST PRODUCTS INC.
Notes to Consolidated Financial Statements
Expected benefit payments and future contributions
As of December 31, 2018,2020, benefit payments expected to be paid over the next 10 years are as follows:
| | | | | | | | | | | | | | | | | | | | | | | |
| (In millions) | Pension Plans (1) | OPEB Plans | |
| 2021 | $ | 342 | | | $ | 12 | | | | | |
| 2022 | $ | 335 | | | $ | 11 | | | | | |
| 2023 | $ | 328 | | | $ | 10 | | | | | |
| 2024 | $ | 321 | | | $ | 10 | | | | | |
| 2025 | $ | 314 | | | $ | 9 | | | | | |
| 2026 - 2030 | $ | 1,454 | | | $ | 40 | | | | | |
|
| | | | | | | | |
| (In millions) | Pension Plans (1) | OPEB Plans |
| 2019 | $ | 351 |
| | $ | 14 |
| |
| 2020 | | 344 |
| | | 13 |
| |
| 2021 | | 338 |
| | | 13 |
| |
| 2022 | | 333 |
| | | 12 |
| |
| 2023 | | 326 |
| | | 12 |
| |
| 2024 - 2028 | | 1,529 |
| | | 51 |
| |
| |
(1)
| Benefit payments are expected to be paid from the plans’ net assets. |
We expect our 20192021 pension contributions (excluding contributions to our defined contribution plans) to be approximately $80 million, including pension contributions of Cdn $73 million ($54 million, based on the exchange rate in effect on December 31, 2018) related to our Canadian plans.$102 million.
Canadian pension funding
Quebec plans
The funding of our Quebec pension plans areis subject to Quebec’s Supplemental Pension Plans Act, or (or, the “SPPA”),” which is the pension plan funding regime generally applicable to pension plans in that province. Our contributions to our Quebec plans are determined on a going concern basis under the Quebec’s SPPA.
Ontario plans
Prior to December 31, 2018, the funding of our material Ontario pension plans (or the “affected plans”) was governed by regulation specific to us, adopted by the province of Ontario, which we refer to as the “funding relief regulation.” In accordance with the funding relief regulation, on December 21, 2018, we provided notice to the Ontario pension plan regulatory authorities that, effective December 31, 2018, we would voluntarily exit the Ontario funding relief regulation. As a result, sinceSince January 1, 2019, all of our Ontario pension plans have been subject to the Ontario Pension Benefits Act, or (or, the “PBA”), which is the pension plan funding regime generally applicable to pension plans in that province. The PBA provides for funding pension fund deficits on a going concern basis, or on a solvency basis if the solvency funded status of a pension plan is below 85%. The funding relief regulation, as amended, provided that our annual basic contribution to the affected plans was Cdn $9 million.
As originally adopted, the funding relief regulation provided that corrective measures would be required if the aggregate solvency ratio of the affected plans fell below a prescribed level under the targets specified in the regulations as of December 31 in any year through 2014. This requirement was removed in 2013, but the 2011 and 2012 amounts (Cdn $110 million in the aggregate) had been deferred to after the expiration of the funding relief regulation in 2020. The funding relief regulation also required us to make a supplemental contribution, payable over a three-year period, should the affected plans’ aggregate solvency ratio be more than 2% below the target specified in the funding relief regulations for the preceding year. As a result of our exit from the funding relief regulation, these requirements were removed.
Additional undertakings
Our principal Canadian subsidiaries had entered into certain undertakings with the Government of Ontario and Quebec, which expired in 2015 and 2016, respectively. The expiration of those undertakings did not eliminate ongoing obligations we incurred under the terms of those undertakings prior to their expiration, including the undertaking requiring us to make an additional solvency deficit reduction contribution to our pension plans of Cdn $75,C$75, payable over four years, for each metric ton of capacity reduced in Quebec or Ontario, in the event of downtime of more than six consecutive months or nine cumulative months over a period of 18 months. Accordingly, we made additional contributions for past capacity reductions of Cdn $14C$4 million and CdnC$2 million in 2019 and 2020, respectively. The 2020 contribution was the last one required to be made.
RESOLUTE FOREST PRODUCTS INC.
Notes to Consolidated Financial Statements
$12 million in 2017 and 2018, respectively, and will also be required to make our final remaining contributions for past capacity reductions of approximately Cdn $4 million, and Cdn $2 million in 2019, and 2020, respectively.
Note 13.17. Income Taxes
(Loss) incomeIncome before income taxes by taxing jurisdiction for the years ended December 31, 2018, 20172020, 2019 and 2016,2018, was as follows:
| | | (In millions) | 2018 | | | 2017 | | | 2016 | | | (In millions) | 2020 | | 2019 | | 2018 | |
| United States | $ | (90 | ) | | $ | (289 | ) | | $ | (227 | ) | | |
| U.S. | | U.S. | $ | (126) | | | $ | (205) | | | $ | (90) | | |
| Foreign | | 477 |
| | 295 |
| | 170 |
| | Foreign | | 187 | | | 216 | | | 477 | | |
| | $ | 387 |
| | $ | 6 |
| | $ | (57 | ) | | | $ | 61 | | | $ | 11 | | | $ | 387 | | |
The income tax benefit (provision)provision for the years ended December 31, 2018, 20172020, 2019 and 2016,2018, was comprised of the following:
| | | | | | | | | | | | | | | | | | | | | | | | | | | | | |
| (In millions) | 2020 | | 2019 | | 2018 | |
| U.S. Federal and State: | | | | | | | | | |
| Current | $ | 0 | | | $ | 0 | | | $ | 0 | | |
| Deferred | | 0 | | | | 0 | | | | 0 | | |
| | | 0 | | | | 0 | | | | 0 | | |
| Foreign: | | | | | | | | | |
| Current | | 0 | | | | 0 | | | | 12 | | |
| Deferred | | (51) | | | | (58) | | | | (164) | | |
| | | (51) | | | | (58) | | | | (152) | | |
| Total: | | | | | | | | | |
| Current | | 0 | | | | 0 | | | | 12 | | |
| Deferred | | (51) | | | | (58) | | | | (164) | | |
| | $ | (51) | | | $ | (58) | | | $ | (152) | | |
|
| | | | | | | | | | | | |
| (In millions) | 2018 | | | 2017 | | | 2016 | | |
| U.S. Federal and State: | | | | | | | | | |
| Current | $ | — |
| | $ | — |
| | $ | — |
| |
| Deferred | | — |
| | | 2 |
| | | (11 | ) | |
| | | — |
| | | 2 |
| | | (11 | ) | |
| Foreign: | | | | | | | | | |
| Current | | 12 |
| | | (4 | ) | | | (5 | ) | |
| Deferred | | (164 | ) | | | (82 | ) | | | (3 | ) | |
| | | (152 | ) | | | (86 | ) | | | (8 | ) | |
| Total: | | | | | | | | | |
| Current | | 12 |
| | | (4 | ) | | | (5 | ) | |
| Deferred | | (164 | ) | | | (80 | ) | | | (14 | ) | |
| | $ | (152 | ) | | $ | (84 | ) | | $ | (19 | ) | |
Tax Cuts and Jobs Act
On December 22, 2017, the TCJA was enacted into law which, among other changes, reduced the U.S. federal statutory income tax rate from 35% to 21%, and implemented a new system of taxation for non-U.S. earnings, including the imposition of a one-time transition tax on deemed repatriation of undistributed earnings of non-U.S. subsidiaries. We were required to recognize the effects of tax law changes in the period of enactment. On December 22, 2017, the United States Securities and Exchange Commission (or the “SEC”) issued Staff Accounting Bulletin No. 118, Income Tax Accounting Implications of the TCJA, which allowed us to account for the TCJA provisions under the following scenarios: (a) reflect the tax effects of the TCJA for which the accounting is complete, (b) report provisional amounts for those income tax effects of the TCJA where the accounting is incomplete but a reasonable estimate can be determined, or (c) not to report provisional amounts for any income tax effects of the TCJA for which a reasonable estimate cannot be determined until the reporting period that a reasonable estimate can be determined, and to continue to apply ASC 740 based on the provision of the tax laws that were in effect immediately prior to the enactment of the TCJA. The SEC provided that the accounting must be completed during the 12-month measurement period following the enactment of the TCJA.
Based on available information, we had provisionally estimated the impacts of the TCJA on our 2017 financial results, with the exception of the effects of the newly enacted GILTI regime as we were unable to determine a reasonable estimate. Accordingly, we had provisionally decreased our net U.S. deferred income tax assets and related valuation allowance by $356 million and $359 million, respectively, in 2017, mainly to correspond to the lower U.S. federal statutory income tax rate. We also did not expect to be subject to the one-time transition tax on deemed repatriation of undistributed earnings of non-U.S. subsidiaries. During the 12-month measurement period, we completed the accounting for the impacts of the TCJA with no material changes to provisional amounts recorded in the period of enactment.
RESOLUTE FOREST PRODUCTS INC.
Notes to Consolidated Financial Statements
Effective income tax rate reconciliation
The income tax provision attributable to income (loss) before income taxes differs from the amounts computed by applying the U.S. federal statutory income tax rate of 21% for the years ended December 31, 2018, 20172020, 2019 and 2016,2018, as a result of the following:
| | | | | | | | | | | | | | | | | | | | | | | | | | | | | |
| (In millions) | 2020 | | 2019 | | 2018 | |
| Income before income taxes | $ | 61 | | | $ | 11 | | | $ | 387 | | |
| Income tax provision: | | | | | | | | | |
| Expected income tax provision | | (13) | | | | (2) | | | | (81) | | |
| Changes resulting from: | | | | | | | | | |
| | | | | | | | | |
Valuation allowance (1) | | (11) | | | | (43) | | | | 59 | | |
| | | | | | | | | |
| | | | | | | | | |
| Foreign exchange | | (6) | | | | 2 | | | | (29) | | |
| U.S. tax on non-U.S. earnings | | (23) | | | | (7) | | | | (65) | | |
| State income taxes, net of federal income tax benefit | | 6 | | | | 7 | | | | 4 | | |
| Foreign tax rate differences | | (10) | | | | (11) | | | | (24) | | |
Nondeductible expenses (2) | | 0 | | | | (6) | | | | (15) | | |
Other, net (3) | | 6 | | | | 2 | | | | (1) | | |
| | $ | (51) | | | $ | (58) | | | $ | (152) | | |
|
| | | | | | | | | | | | |
| (In millions) | 2018 | | | 2017 | | | 2016 | | |
| Income (loss) before income taxes | $ | 387 |
| | $ | 6 |
| | $ | (57 | ) | |
| Income tax provision: | | | | | | | | | |
| Expected income tax (provision) benefit | | (81 | ) | | | (1 | ) | | | 12 |
| |
| Changes resulting from: | | | | | | | | | |
| U.S. federal tax rate change reconciliation | | — |
| | | (1 | ) | | | 8 |
| |
Valuation allowance (1) | | 59 |
| | | 247 |
| | | (99 | ) | |
Enactment of change in tax rate (2) | | — |
| | | (368 | ) | | | — |
| |
Adjustments for unrecognized tax benefits (3) | | — |
| | | 1 |
| | | 55 |
| |
| Foreign exchange | | (29 | ) | | | 6 |
| | | (9 | ) | |
| State income taxes, net of federal income tax benefit | | 4 |
| | | 10 |
| | | 6 |
| |
Foreign tax rate differences (4) | | (89 | ) | | | 23 |
| | | 11 |
| |
Nondeductible expenses (5) | | (15 | ) | | | (2 | ) | | | 1 |
| |
| Other, net | | (1 | ) | | | 1 |
| | | (4 | ) | |
| | $ | (152 | ) | | $ | (84 | ) | | $ | (19 | ) | |
| |
(1)
| During 2018, we recorded a decrease in our valuation allowance of $59 million, primarily related to our U.S. operations. |
During 2017, we recorded a decrease in our valuation allowance of $359 million, due to the enactment of the TCJA, offset by an increase of $112$59 million, primarily related to our U.S. operations.
(2)During 2016,2018, we recorded an increaseincome tax provision of $13 million for a nondeductible goodwill impairment charge, before a corresponding adjustment to our valuation allowance of $99allowance.
(3)During 2020, we recorded a $4 million primarilyadjustment related to the settlement of an insurance claim in connection with our U.S. operations.acquisition of Atlas.
| |
(2)
| During 2017, we recorded decreases to our net deferred income tax assets of $356 million due to the enactment of the TCJA, and $12 million due to a lower foreign income tax rate. |
| |
(3)
| During 2016, we recorded an income tax benefit of $55 million, almost all of which related to the release of previously unrecognized tax benefits due to the lapse of the statute of limitations of the applicable jurisdictions. |
| |
(4)
| During 2018, we recorded an income tax provision of $65 million, before an adjustment to valuation allowance, attributable to the GILTI inclusion. |
| |
(5)
| Includes a $13 million increase to our income tax provision, before an adjustment to valuation allowance, for a nondeductible goodwill impairment charge in 2018. |
Deferred income taxes
At each reporting period, we assess whether it is more likely than not that the deferred income tax assets will be realized, based on the review of all available positive and negative evidence, including future reversals of existing taxable temporary differences, estimates of future taxable income, past operating results, and prudent and feasible tax planning strategies. The carrying value of our deferred income tax assets reflects our expected ability to generate sufficient future taxable income in certain tax jurisdictions to utilize these deferred income tax assets.
Following the assessment of our ability to realize the deferred income tax assets of our U.S. operations, we concluded that existing negative evidence outweighed positive evidence. As a result, we recognizerecognized a full valuation allowance against virtually all of our net U.S. deferred income tax assets. The cumulative losshistorical operating losses of our U.S. operations limited our ability to consider other subjective positive evidence. A valuation allowance does not reduce our underlying tax attributes, nor hinders our ability to use them in the future.
RESOLUTE FOREST PRODUCTS INC.
Notes to Consolidated Financial Statements
The weight of positive evidence for our Canadian operations, which included a review of historical cumulative earnings and our forecasted future earnings, resulted in the conclusion by management that no significant valuation allowances were required for our deferred income tax assets, in Canada, as they were determined to be more likely than not to be realized.
Net deferred income tax assets as
|
| | | | | | | | |
| (In millions) | 2018 | | | 2017 | | |
| Fixed assets | $ | (32 | ) | | $ | (4 | ) | |
| Other | | (29 | ) | | | (23 | ) | |
| Deferred income tax liabilities | | (61 | ) | | | (27 | ) | |
| Fixed assets | | 362 |
| | | 506 |
| |
| Pension and OPEB plans | | 328 |
| | | 330 |
| |
| Net operating loss carryforwards | | 586 |
| | | 619 |
| |
| Net capital loss carryforwards | | 13 |
| | | 12 |
| |
| Undeducted research and development expenditures | | 176 |
| | | 196 |
| |
| Tax credit carryforwards | | 93 |
| | | 119 |
| |
| Other | | 80 |
| | | 72 |
| |
| Deferred income tax assets | | 1,638 |
| | | 1,854 |
| |
| Valuation allowance | | (701 | ) | | | (764 | ) | |
| Net deferred income tax assets | $ | 876 |
| | $ | 1,063 |
| |
| Amounts recognized in our Consolidated Balance Sheets consisted of: | | | | | | |
| Deferred income tax assets | $ | 876 |
| | $ | 1,076 |
| |
| Deferred income tax liabilities | | — |
| | | (13 | ) | |
| Net deferred income tax assets | $ | 876 |
| | $ | 1,063 |
| |
RESOLUTE FOREST PRODUCTS INC.
Notes to Consolidated Financial Statements
Net deferred income tax assets as of December 31, 2020 and 2019, were comprised of the following:
| | | | | | | | | | | | | | | | | | | | |
| (In millions) | 2020 | | 2019 | |
| Fixed assets | $ | (57) | | | $ | (28) | | |
| Operating lease right-of-use assets | | (15) | | | | (16) | | |
| | | | | | |
| Other | | (25) | | | | (28) | | |
| Deferred income tax liabilities | | (97) | | | | (72) | | |
| Fixed assets | | 297 | | | | 346 | | |
| Pension and OPEB plans | | 408 | | | | 378 | | |
| Net operating loss carryforwards and deduction limitation | | 660 | | | | 616 | | |
| Net capital loss carryforwards | | 41 | | | | 35 | | |
| Undeducted research and development expenditures | | 195 | | | | 188 | | |
| Tax credit carryforwards | | 98 | | | | 96 | | |
| Operating lease liabilities | | 15 | | | | 16 | | |
| Other | | 72 | | | | 65 | | |
| Deferred income tax assets | | 1,786 | | | | 1,740 | | |
| Valuation allowance | | (774) | | | | (753) | | |
| Net deferred income tax assets | $ | 915 | | | $ | 915 | | |
| Amounts recognized in our Consolidated Balance Sheets consisted of: | | | | | | |
| Deferred income tax assets | $ | 915 | | | $ | 915 | | |
| | | | | | |
| | | | | | |
RESOLUTE FOREST PRODUCTS INC.
Notes to Consolidated Financial Statements
The balance of tax attributes and their dates of expiration as of December 31, 2018,2020, were as follows:
| | | | | | | | | | | | | | | | | |
| (In millions) | Related
Deferred
Income Tax
Asset | | Year of
Expiration |
| Net operating loss carryforwards and deduction limitation: | | | | | | | |
| U.S. federal: $2,072 | $ | 435 | | (1) | | | | 2023 – 2037 |
| U.S. federal and deduction limitation: $457 | | 96 | | (1) | | | | Indefinite |
| U.S. state: $2,164 | | 109 | | (1) | | | | 2021 – 2040 |
| U.S. state and deduction limitation: $221 | | 7 | | (1) | | | | Indefinite |
| Canadian federal and provincial (excluding Quebec): $39 | | 7 | | | | | | 2030 – 2039 |
| Quebec: $60 | | 5 | | | | | | 2028 – 2039 |
| Other | | 1 | | | | | | Indefinite |
| $ | 660 | | | | | | |
| Net capital loss carryforwards: | | | | | | | |
| U.S. federal and state: $23 | $ | 5 | | (1) | | | | 2025 |
| Canadian federal and provincial (excluding Quebec): $117 | | 31 | | | | | | Indefinite |
| Quebec: $53 | | 5 | | | | | | Indefinite |
| $ | 41 | | | | | | |
| Undeducted research and development expenditures: | | | | | | | |
| Canadian federal and provincial (excluding Quebec): $697 | $ | 119 | | | | | | Indefinite |
| Quebec: $831 | | 76 | | | | | | Indefinite |
| $ | 195 | | | | | | |
| Tax credit carryforwards: | | | | | | | |
| Canadian research and development, and other | $ | 78 | | | | | | 2022 – 2040 |
| | | | | | | |
| U.S. state and other | | 20 | | (1) | | | | 2021 – 2035 |
| $ | 98 | | | | | | |
| | | | | | | |
| | | | | | | |
|
| | | | | | |
| (In millions) | Related
Deferred
Income Tax
Asset | Year of Expiration |
| Net operating loss carryforwards: | | | | |
| U.S. federal: $2,109 | $ | 443 |
| (1 | ) | 2022 – 2037 |
| U.S. state: $1,771 | | 89 |
| (1 | ) | 2021 – 2038 |
| Canadian federal and provincial (excluding Quebec): $86 | | 16 |
| | 2026 – 2038 |
Quebec: $48 | | 3 |
| | 2026 – 2038 |
| Other | | 35 |
| | 2020 – 2027 |
| | $ | 586 |
| | |
| Net capital loss carryforwards: | | | | |
| Canadian federal and provincial (excluding Quebec): $42 | $ | 9 |
| | Indefinite |
| Quebec: $46 | | 4 |
| | Indefinite |
| | $ | 13 |
| | |
| Undeducted research and development expenditures: | | | | |
| Canadian federal and provincial (excluding Quebec): $626 | $ | 106 |
| | Indefinite |
| Quebec: $757 | | 70 |
| | Indefinite |
| | $ | 176 |
| | |
| Tax credit carryforwards: | | | | |
| Canadian research and development, and other | $ | 72 |
| | 2021 – 2038 |
| U.S. state and other | | 21 |
| (1 | ) | 2019 – 2033 |
| | $ | 93 |
| | |
| |
(1)
| As of December 31, 2018, we had a valuation allowance against virtually all of our U.S. operations net deferred income tax assets. |
Our U.S. federal net operating loss carryforwards are subject to annual limitations under § 382 of the U.S. Internal Revenue Code of 1986, as amended, (or, “IRC § 382”), resulting from a previous ownership change. We do not expect that IRC § 382 would limit the utilization of our available U.S. federal net operating loss carryforwards prior to their expiration.
We consider our foreign earnings to be permanently invested. Accordingly, we do not provide for the additional U.S. and foreign income taxes that could become payable upon remittance of undistributed earnings of our foreign subsidiaries. It is not practicable to estimate the income tax liability that might be incurred if such earnings were remitted to the U.S.
On January 1, 2017, we adopted ASU 2016-16, “Intra-Entity Transfers of Assets Other Than Inventory,” which eliminates the deferral of the tax effects of intra-entity asset transfers other than inventory until the transferred assets are sold to a third party or recovered through use. As a result, a cumulative-effect adjustment of $3 million was recorded to “Deficit” in our Consolidated Balance Sheet as of January 1, 2017.
RESOLUTE FOREST PRODUCTS INC.
Notes to Consolidated Financial Statements
Unrecognized tax benefits
The following table summarizes the activity related to our gross unrecognized tax benefits for the years ended December 31, 20182020 and 2017:2019:
| | | | | | | | | | | | | | | | | | | | |
| (In millions) | 2020 | | 2019 | |
| Beginning of year | $ | 29 | | | $ | 28 | | |
| Increase (decrease) resulting from: | | | | | | |
| | | | | | |
| | | | | | |
| Settlements with taxing authorities | | (2) | | | | 0 | | |
| Positions taken in the prior period | | 1 | | | | 2 | | |
| Expirations of statute of limitations | | 0 | | | | (1) | | |
| | | | | | |
| End of year | $ | 28 | | | $ | 29 | | |
|
| | | | | | | | |
| (In millions) | 2018 | | | 2017 | | |
| Beginning of year | $ | 28 |
| | $ | 44 |
| |
| Decrease resulting from: | | | | | | |
Enactment of change in tax rate (1) | | — |
| | | (15 | ) | |
| Settlements with taxing authorities | | — |
| | | (1 | ) | |
| End of year | $ | 28 |
| | $ | 28 |
| |
| |
(1)
| During 2017, previously unrecognized tax benefits decreased by $15 million due toIf the enactment of the TCJA. |
We recognize accrued interest and penalties on unrecognized tax benefits as components of the income tax provision. The total amount of unrecognized tax benefits that, ifwere recognized as of December 31, 2020, $2 million would affect the effective tax rate, is $2 million.rate.
In the normal course of business, we are subject to audits from federal, state, provincial and other tax authorities. U.S. federal tax returns for 20152016 and subsequent years, as well as Canadian tax returns for 20132016 and subsequent years, remain subject to examination by tax authorities.
We do not expect a significant change to the amount of unrecognized tax benefits over the next 12 months. However, any adjustments arising from certain ongoing examinations by taxingtax authorities could alter the timing or amount of taxable income or deductions, or the allocation of income among tax jurisdictions, and these adjustments could differ from the amount accrued. We believe that taxes accrued in our Consolidated Balance Sheets fairly represent the amount of income taxes to be settled or realized in the future.
Note 14.18. Commitments and Contingencies
Commitments
In the normal course of business, we have entered into various supply agreements, water rights agreements, purchase commitments and harvesting rights agreements (for land that we manage for which we make payments to various Canadian provinces based on the amount of timber harvested).
As of December 31, 2020, these commitments were as follows:
| | | | | | | | | | | |
| (In millions) | Commitments (1) |
| 2021 | $ | 73 | | |
| 2022 | | 64 | | |
| 2023 | | 45 | | |
| 2024 | | 3 | | |
| 2025 | | 1 | | |
| 2026 and thereafter | | 16 | | |
| | $ | 202 | | |
(1)Includes energy purchase obligations of $148 million through 2027 for certain of our pulp and paper mills.
Legal matters
We become involved in various legal proceedings, claims and governmental inquiries, investigations, and other disputes in the normal course of business, including matters related to contracts, commercial and trade disputes, taxes, environmental issues, activist damages, employment and workers’ compensation claims, grievances, human rights complaints, pension and benefit plans and obligations, health and safety, product safety and liability, asbestos exposure, financial reporting and disclosure obligations, corporate governance, First NationsIndigenous peoples’ claims, antitrust, governmental regulations, and other matters. Although the final outcome is subject to many variables and cannot be predicted with any degree of certainty, we regularly assess the status of the matters and establish provisions (including legal costs expected to be incurred) when we believe an adverse
RESOLUTE FOREST PRODUCTS INC.
Notes to Consolidated Financial Statements
outcome is probable, and the amount can be reasonably estimated. Except as described below and for claims that cannot be assessed due to their preliminary nature, we believe that the ultimate disposition of these matters outstanding or pending as of December 31, 2018,2020, will not have a material adverse effect on our Consolidated Financial Statements.
Countervailing duty and anti-dumping investigations on uncoated groundwood paper
On August 9, 2017, countervailing duty and anti-dumping petitions were filed with the U.S. Department of Commerce (or “Commerce”) and the U.S. International Trade Commission (or “ITC”) by a U.S. uncoated groundwood (or “UGW”) paper producer requesting that the U.S. government impose countervailing and anti-dumping duties on Canadian-origin UGW paper exported to the U.S. One of our subsidiaries was identified in the petitions as being a Canadian exporting producer of UGW paper to the U.S. and was selected as a mandatory respondent to be investigated by Commerce in both the countervailing duty and anti-dumping investigations.
On January 9, 2018, Commerce announced its preliminary determination in its countervailing duty investigation on Canadian-origin UGW paper exported to the U.S. As a result, beginning January 16, 2018, we were required to pay cash deposits to the U.S. Customs and Border Protection agency (or “U.S. Customs”) at a rate of 4.42% of the custom’s value for estimated countervailing duties on our U.S. imports of the UGW paper produced at our Canadian mills, with the exception of supercalendered (or “SC”) paper, which was subject to distinct countervailing duties, as further discussed below. The preliminary rate remained in effect until May 15, 2018. On March 13, 2018, Commerce also announced its preliminary
RESOLUTE FOREST PRODUCTS INC.
Notes to Consolidated Financial Statements
determination in the anti-dumping investigation, whereby it determined that we did not sell Canadian-origin UGW paper exported to the U.S. for less than fair market value during the relevant period (from July 1, 2016 to June 30, 2017).
On August 29, 2018, the ITC determined that the U.S. UGW paper producer was not materially injured nor threatened with material injury by U.S. imports of Canadian-origin UGW paper, and that no countervailing duty or anti-dumping orders would be issued. As a result, we will receive a refund of all cash deposits made on our U.S. imports of UGW paper produced at our Canadian mills, plus interest, and no further cash deposits are required going forward. Through December 31, 2018, cash deposits to be refunded totaled $6 million. These cash deposits were recorded in “Accounts receivable, net – Other” in our Consolidated Balance Sheets as of December 31, 2018.
Countervailing duty and anti-dumping investigations of softwood lumber
On November 25, 2016, countervailing duty and anti-dumping petitions were filed with Commerce and the ITC by certain U.S. softwood lumber producers and forest landowners, requesting that the U.S. government impose countervailing and anti-dumping duties on Canadian-origin softwood lumber exported to the U.S. One of our subsidiaries was identified in the petitions as being a Canadian exporting producer of softwood lumber to the U.S. and was selected as a mandatory respondent to be investigated by Commerce in both the countervailing duty and anti-dumping investigations.
On April 24, 2017, Commerce announced its preliminary determination in the countervailing duty investigation and, as a result, after April 28, 2017, we were required to pay cash deposits to the U.S. Customs at a rate of 12.82% for estimated countervailing duties on our U.S. imports of softwood lumber produced at our Canadian sawmills. The preliminary rate remained in effect until August 26, 2017. Commerce changed the rate in its final affirmative determination on November 2, 2017, but the new rate did not take effect until December 28, 2017, following the ITC’s final affirmative determination and the publication by Commerce of a countervailing duty order. Since that date, we have been required to resume paying cash deposits to the U.S. Customs at a rate of 14.7% for our softwood lumber U.S. imports from our Canadian sawmills. This rate will continue until Commerce sets a duty rate in an administrative review, or a new rate may be set through a remand determination should a North American Free Trade Agreement binational panel on appeal remand the final determination to Commerce. Through December 31, 2018, our cash deposits totaled $79 million and, based on the 14.7% rate and our current operating parameters, could be as high as $60 million per year.
On June 26, 2017, Commerce announced its preliminary determination in the anti-dumping investigation and, as a result, after June 30, 2017, we were required to pay cash deposits to the U.S. Customs at a rate of 4.59% for estimated anti-dumping duties on our U.S. imports of softwood lumber produced at our Canadian sawmills. On November 2, 2017, Commerce announced its final affirmative determination in the anti-dumping investigation and, as a result, since November 8, 2017, we have been required to pay cash deposits to the U.S. Customs, at a rate of 3.2% for our softwood lumber U.S. imports from our Canadian sawmills. This rate will apply until Commerce sets a duty rate in an administrative review, or in a possible remand determination. Through December 31, 2018, our cash deposits totaled $24 million and, based on the 3.2% rate and our current operating parameters, could be as high as $15 million per year.
We are not presently able to determine the ultimate resolution of these matters, but we believe it is not probable that we will ultimately be assessed with significant duties, if any, on our U.S. imports of Canadian-produced softwood lumber. Accordingly, no contingent loss was recorded in respect of these petitions in our Consolidated Statement of Operations for the year ended December 31, 2018, and our cash deposits were recorded in “Other assets” in our Consolidated Balance Sheets.
Countervailing duty investigation on supercalendered paper
On February 26, 2015, a countervailing duty petition was filed with Commerce and the ITC by certain U.S. SC paper producers requesting that the U.S. government impose countervailing duties on Canadian-origin SC paper exported to the U.S. market. One of our subsidiaries was identified in the petition as being a Canadian exporting producer of SC paper to the U.S. and was selected as a mandatory respondent to be investigated by Commerce. As a result of that investigation, after August 3, 2015, we were required to pay cash deposits to the U.S. Customs for estimated countervailing duties on our U.S. imports of SC paper produced at our Canadian mills. Between August 3, 2015 and October 15, 2015, we were required to make cash deposits at a rate of 2.04%. On October 15, 2015, that rate increased to 17.87%, 17.10% of which was not based on any countervailable subsidy we received, but rather on a punitive application of “adverse facts available.”
On March 21, 2018, Verso Corporation, the sole remaining U.S. SC paper petitioner, filed a request with Commerce for a changed circumstances review to revoke the countervailing duty order, retroactive to August 3, 2015, and for Commerce to refund all countervailing duty deposits with interest. On May 8, 2018, Commerce announced the initiation of a changed
RESOLUTE FOREST PRODUCTS INC.
Notes to Consolidated Financial Statements
circumstances review, and on July 6, 2018, Commerce signed the revocation order. As a result, we will receive a refund of all cash deposits made on our U.S. imports of SC paper produced at our Canadian mills, plus interest, and no further cash deposits are required going forward. In addition, this resulted in the termination of all pending administrative reviews.
Through December 31, 2018, we were refunded substantially all of the cash deposits of $61 million, plus interest.
Asbestos-related lawsuits
We are involved in a number of asbestos-related lawsuits filed primarily in U.S. state courts, including certain cases involving multiple defendants and plaintiffs that have been consolidated.defendants. These lawsuits principally allege direct or indirect personal injury or death resulting from exposure to asbestos-containing premises. While we dispute the plaintiffs'plaintiffs’ allegations and intend to vigorously defend these claims, the ultimate resolution of these matters cannot be determined at this time. These lawsuits frequently involve claims for unspecified compensatory and punitive damages, and we are unable to reasonably estimate a range of possible losses. However, unfavorable rulings, judgments or settlement terms could materially impact our Consolidated Financial Statements. The hearingsHearings for certain of these matters are scheduled to beginoccur in 2021.
Countervailing duty and anti-dumping investigations of softwood lumber
On November 25, 2016, countervailing duty and anti-dumping petitions were filed with the U.S. Department of Commerce (or, “Commerce”) and the U.S. International Trade Commission (or, “ITC”) by certain U.S. softwood lumber products producers and forest landowners, requesting that the U.S. government impose countervailing and anti-dumping duties on Canadian-origin softwood lumber products exported to the U.S. One of our subsidiaries was identified in the petitions as earlybeing a Canadian exporting producer of softwood lumber products to the U.S. and was selected as March 2019.a mandatory respondent to be investigated by Commerce in both the countervailing duty and anti-dumping investigations.
Jedson CaseOn April 24, 2017, Commerce announced its preliminary determination in the countervailing duty investigation and, as a result, after April 28, 2017, we were required to pay cash deposits to U.S. Customs at a rate of 12.82% for estimated countervailing duties on the vast majority of our U.S. imports of softwood lumber products produced at our Canadian sawmills. The preliminary rate remained in effect until August 26, 2017. Commerce changed the rate in its final affirmative determination on November 2, 2017, but the new rate did not take effect until December 28, 2017, following the ITC’s final affirmative determination and the publication by Commerce of a countervailing duty order. Until November 30, 2020, we have been required to pay cash deposits to U.S. Customs at a rate of 14.70% for the vast majority of our U.S. imports of Canadian-produced softwood lumber products. On December 1, 2020, Commerce issued its final results in the countervailing duties first administrative review and established our new rate at 19.10% for countervailing duties. This rate will apply until Commerce sets a new duty rate in subsequent administrative reviews, or a new rate may be set through a remand determination by a binational panel formed pursuant to the North American Free Trade Agreement or United States-Mexico-Canada Agreement, as the case may be (or, “Panel”) on appeal. Through December 31, 2020, our cash deposits totaled $194 million and, based on the 19.10% rate and our current operating parameters, could be as high as $75 million per year.
On June 26, 2017, Commerce announced its preliminary determination in the anti-dumping investigation and, as a result, after June 30, 2017, we were required to pay cash deposits to U.S. Customs at a rate of 4.59% for estimated anti-dumping duties on the vast majority of our U.S. imports of softwood lumber products produced at our Canadian sawmills. On November 2, 2017, Commerce announced its final affirmative determination in the anti-dumping investigation and, as a result, from November 8, 2017 to November 29, 2020, we have been required to pay cash deposits to U.S. Customs, at a rate of 3.20% for the vast majority of our U.S. imports of Canadian-produced softwood lumber products. On November 30, 2020, Commerce issued its final results in the anti-dumping first administrative review and established our new rate at 1.15% for anti-dumping duties. This rate will apply until Commerce sets a new duty rate in subsequent administrative reviews, or a new rate may be set through a remand determination by a Panel on appeal. Through December 31, 2020, our cash deposits totaled $49 million and, based on the 1.15% rate and our current operating parameters, could be as high as $5 million per year.
On April 1, 2019, Commerce published a notice initiating the administrative reviews of the countervailing duty and anti-dumping orders on softwood lumber products from Canada. We were selected as a mandatory respondent in these administrative reviews and we are in the process of responding to Commerce with the information requested. On March 9, 2017, Jedson Engineering, Inc.10, 2020, Commerce published a notice initiating the second administrative review of the countervailing duty and Jedson C.M., Inc.anti-dumping orders on softwood lumber products from Canada. We were selected as a mandatory respondent for the second administrative review of the countervailing duty order.
In parallel, on September 4, 2019, a Panel issued an interim decision upholding the affirmative final injury determinations of the ITC in both investigations of softwood lumber products from Canada. The Panel remanded the ITC to reconsider several findings and ordered the ITC to submit its redetermination on remand within 90 days from the date of the Panel interim
RESOLUTE FOREST PRODUCTS INC.
Notes to Consolidated Financial Statements
decision. On December 19, 2019, the ITC issued its redetermination on remand that maintained the affirmative final injury determinations, and on May 22, 2020, the Panel issued its final decision and affirmed in its entirety the ITC’s injury determination on remand. On January 6, 2021, and January 19, 2021, we filed our complaints supporting Panel reviews of the final results in the countervailing and anti-dumping first administrative reviews.
In addition, on August 24, 2020, the World Trade Organization’s (or, “WTO”) dispute panel issued a report (or, the “Jedson plaintiffs”“Panel Report”) filed a complaint against our subsidiary, Resolute FP US Inc.in the case brought by the government of Canada in “United States — Countervailing Measures on Softwood Lumber from Canada” (DS533), and other defendants in state court in Tennessee. The complaint alleged breach of contract and violation of Tennessee’s Prompt Pay Act for failure to pay for services in connection with the design and construction of our Calhoun tissue project, and sought a recovery of, and enforcement of mechanic’s liens for, approximately $10 million, plus interest and cost of litigation, which was later amended to include additional claims of up to approximately $20 million. On April 17, 2017, we filed an answer and counterclaim alleging,concluding, among other things, breach of contractthat Commerce acted inconsistently with the Agreement on Subsidies and professional negligence by the Jedson plaintiffs and seeking recovery for, among other things, resulting costsCountervailing Measures on the project. On December 12, 2018, the Company and the parties entered into a settlement agreement that did not result in any material impact on our Consolidated Financial Statements. An agreed order of dismissal of all claimsmost of the parties was issued by the Court on January 4, 2019.
Modification of U.S. OPEB plan
Effective January 1, 2015, we modified our U.S. OPEB plan so that unionized participants, upon reaching Medicare eligibility, are provided Medicare coverage via a Medicare Exchange program rather than via a Company-sponsored medical plan.matters. On March 2, 2016, a proposed class action lawsuit (Reynolds, et al v. Resolute Forest Products Inc., Resolute FP US Inc., Resolute FP US Health and Resolute Welfare Benefit Plan) was filed inSeptember 28, 2020, the United States District Court fornotified the Eastern DistrictWTO’s dispute settlement body of Tennessee (orits decision to appeal the “District Court”)Panel Report.
We are not presently able to determine the ultimate resolution of these matters, but we believe it is not probable that we will ultimately be assessed with significant duties, if any, on behalf of certain Medicare-eligible retirees who were previously unionized employees of the Calhoun, Catawba, and Coosa Pines mills, and their spouses and dependents (or the “proposed class”). The plaintiffs alleged that the modifications described above breached the collective bargaining agreements and plan covering the members of the proposed class in the lawsuit. Plaintiffs sought reinstatement of the health care benefits as in effect before January 1, 2015, for the proposed class in the lawsuit. On June 28, 2017, a settlement agreement in principle was reached between the parties to the lawsuit subject to court approval. The District Court issued a final order on August 3, 2018, approving the class action settlement and dismissing the case, resulting in an amendment of our U.S. OPEB plan.imports of Canadian-produced softwood lumber products. Accordingly, an increase0 contingent loss was recorded in respect of $3 million to both “Pensionthese petitions in our Consolidated Statements of Operations, and other postretirement benefit obligations” and “Accumulated other comprehensive loss” wasour cash deposits were recorded in “Other assets” in our Consolidated Balance Sheet in 2018.Sheets.
Fibrek acquisition
Effective July 31, 2012, we completed the final step of the transaction pursuant to which we acquired the remaining 25.4%25.40% of the outstanding Fibrek Inc. (or, “Fibrek”) shares, following the approval of Fibrek’s shareholders on July 23, 2012, and the issuance of a final order ofby the Quebec Superior Court in Canada (or, “Quebec Superior Court”) approving the arrangement on July 27, 2012. Certain former shareholders of Fibrek exercised (or purported to exercise) rights of dissent in respect of the transaction, asking for a judicial determination of the fair value of their claim under the Canada Business Corporations Act. No consideration has to date been paid toOn September 26, 2019, the former Fibrek shareholders who exercised (or purported to exercise) rights of dissent. Any such consideration will only be paid out upon settlement or judicial determination ofQuebec Superior Court rendered a decision fixing the fair value of their claimsthe shares of the dissenting shareholders at C$1.99 per share, or C$31 million in aggregate, plus interest and will be paid entirelyan additional indemnity, for a total currently estimated at C$44 million payable in cash. Accordingly,We had previously accrued C$14 million for the payment of the dissenting shareholders’ claims. Following the court decision, we cannot presently determineaccrued an additional C$30 million ($23 million), and as a result recorded $23 million in “Other (expense) income, net” in our Consolidated Statement of Operations for the amount that ultimately will be paid to former holders of Fibrek shares in connection with the proceedings, but we have accrued Cdn $14 million ($10 million, based on the exchange rate in effectyear ended on December 31, 2018) for2019. Of the eventualtotal amount of C$44 million, C$19 million ($14 million) was payable immediately and paid on October 2, 2019, bringing the remaining balance to C$25 million ($20 million and $19 million as of December 31, 2020 and 2019, respectively), which was recorded in “Other liabilities” in our Consolidated Balance Sheets as of December 31, 2020 and 2019. We are appealing the decision, therefore the payment of those claims.any additional consideration and its timing will depend on the outcome of the appeal. On November 13, 2019, a legal hypothec in the amount of C$30 million ($24 million) was registered on our Saint-Félicien (Quebec) immovable and movable property to secure the payment of any additional amounts following the outcome of the appeal. The hearing in this matter ishas not yet been scheduled to beginbut could occur in March 2019.
RESOLUTE FOREST PRODUCTS INC.
Notes to Consolidated Financial Statements
2021.
Partial wind-ups of pension plans
On June 12, 2012, we filed a motion for directives with the Quebec Superior Court, the court with jurisdiction in the creditor protection proceedings under the Companies’ Creditors Arrangement Act (Canada) (or, the “CCAA Creditor Protection Proceedings”), seeking an order to prevent pension regulators in each of Quebec, New Brunswick, and Newfoundland and Labrador from declaring partial wind-ups of pension plans relating to employees of former operations in New Brunswick, and Newfoundland and Labrador, or a declaration that any claim for accelerated reimbursements of deficits arising from a partial wind-up is a barred claim under the CCAA Creditor Protection Proceedings. We contend, among other things, that any such declaration, if issued, would be inconsistent with the Quebec Superior Court’s sanction order confirming the CCAA debtors’ CCAA Plan of Reorganization and Compromise, as amended, and the terms of our emergence from the CCAA Creditor Protection Proceedings. A partial wind-up would likely shorten the period in which any deficit within those plans, which could reach up to Cdn $150C$150 million ($110 million, based on the exchange rate in effect on December 31, 2018)118 million), would have to be funded if we do not obtain the relief sought. The hearing in this matter has not yet been scheduled but could occur in 2019.2021.
Environmental matters
We are subject to a varietynumber of federal or national, state, provincial, and local environmental laws, regulations, and regulationsorders in the jurisdictions in which we operate.various jurisdictions. We believe our operations are in material compliance with current applicable environmental laws and regulations. Environmental regulations promulgated and orders issued in the future could require substantial additional expenditures for compliance and could have a material impact on us, in particular, and the industry in general.
We may be a “potentially responsible party” with respect
RESOLUTE FOREST PRODUCTS INC.
Notes to a hazardous waste site that is being addressed pursuant to the Comprehensive Environmental Response, Compensation and Liability Act of 1980 (commonly known as Superfund). We believe we will not be liable for any significant amounts at this site.Consolidated Financial Statements
We have environmental liabilities of $15 million and $8 million recorded as of both December 31, 20182020 and 2017,2019, primarily related to environmental remediation related to closed sites. The amount of these liabilities represents management’s estimate of the ultimate settlement based on an assessment of relevant factors and assumptions and could be affected by changes in facts or assumptions not currently known to management for which the outcome cannot be reasonably estimated at this time. These liabilities are included in “Accounts payable and accrued liabilities” or “Other liabilities” in our Consolidated Balance Sheets.
We also have asset retirement obligations of $23$25 million and $24$26 million recorded as of December 31, 20182020 and 2017, respectively,2019, primarily consisting of liabilities associated with landfills, sludge basins and the dismantling of retired assets. These liabilities are included in “Accounts payable and accrued liabilities” orand “Other liabilities” in our Consolidated Balance Sheets.
Note 15.19. Share Capital
Common stock
We are authorized under our certificate of incorporation, as amended and restated, to issue up to 190 million shares of common stock, par value $0.001 per share, of which 9,020,96014,320,960 shares arehave been reserved for issuance under the Resolute Forest Products Equity Incentive PlanPlans (as amended, the “Incentive Plan”defined in Note 20, “Share-Based Compensation”).
Treasury stock
We areOn March 2, 2020, our board of directors authorized a share repurchase program of up to repurchase15% of our common stock, for an aggregate consideration of up to $100 million. During the year ended December 31, 2020, we repurchased 6.9 million shares at a cost of $30 million under this program. During the year ended December 31, 2019, we repurchased 4.8 million shares at a cost of $24 million under our $150 million of our outstanding common stock under our share repurchase program.program, which was completed in 2019. We did not0t repurchase any shares during 2018, 2017 and 2016. There remains $24 million under the program.2018.
Dividends
We declared and paid a special dividend of $1.50 per share ($136 million) on our common stock in 2018. We did not0t declare or pay any dividends on our common stock during the years ended December 31, 20172020 and 2016.2019.
Preferred stock
We are authorized under our certificate of incorporation, as amended and restated, to issue 10 million shares of preferred stock, par value $0.001 per share. As of December 31, 20182020 and 2017, no2019, 0 preferred shares were issued and outstanding.
RESOLUTE FOREST PRODUCTS INC.
Notes to Consolidated Financial Statements
Note 16.20. Share-Based Compensation
Incentive PlanPlans
The Resolute Forest Products Equity Incentive Plan, which became effective in 2010 and isas amended (or, the “Incentive Plan”), administered by the human resources and compensation/nominating and governance committee of the board of directors, became effective in 2010 and provides for the grant of equity-based and liability-based awards, including stock options, stock appreciation rights, restricted stock, RSUs, DSUs, PSUs (collectively, “stock incentive awards”), and cash incentive awards to certain of our officers, directors, employees, consultants and advisors. As discussed in Note 15, “Share Capital,” we have been authorized to issueThe Incentive Plan reserved for issuance 9 million shares for stock incentive awards for up to 9awards. In 2019, we established and adopted the Resolute Forest Products 2019 Equity Incentive Plan (or, the “2019 Incentive Plan”), which authorized 3 million shares to be issued as stock incentive awards. In 2020, an additional 2.3 million shares were authorized, for a total of 5.3 million shares. Since the adoption of the 2019 Incentive Plan, no more awards can be granted under the Incentive Plan. As of December 31, 2018, 0.92020, 2.2 million shares were available for issuance.grants under the 2019 Incentive Plan. We refer to both the Incentive Plan and the 2019 Incentive Plan as the “Incentive Plans”.
Awards for employees who retire (upon meeting certain age and service criteria) at least six months after the grant date and prior to the end of the vesting period will continue to vest after retirement, in accordance with the normal vesting schedule. The requisite service periods for the stock incentive awards are reduced on an individual basis, as necessary, to reflect the grantee’s individual retirement eligibility date.
For the years ended December 31, 2018, 20172020, 2019 and 2016,2018, share-based compensation expense under the Incentive PlanPlans was $14 million ($1.2 million tax benefit), $2 million (0 tax benefit) and $17 million ($1 million of tax benefit), $18 million (no tax benefit) and $11 million (no tax benefit), respectively. As of
RESOLUTE FOREST PRODUCTS INC.
Notes to Consolidated Financial Statements
December 31, 2018,2020, there was $9$13 million of unrecognized compensation cost, which is expected to be recognized over a remaining service period of three years.
Stock options
Under the Incentive Plan,Plans, stock options become exercisable ratably over a period of four years and, unless terminated earlier in accordance with their terms, expire 10 years from the date of grant. New shares of our common stock are issued upon the exercise of a stock option. In certain cases, we withhold shares in respect of option costs and applicable taxes. We have not granted any stock options since 2013. Since the adoption of the 2019 Incentive Plan, stock options can no longer be granted under our Incentive Plans.
The activity of outstanding stock options for the year ended December 31, 2018,2020, was as follows:
|
| | | | | | | | | |
| | Number of Shares | Weighted- Average Exercise Price | Weighted- Average Contractual Life (years) |
| Balance as of December 31, 2017 | 1,304,541 |
| | $ | 15.90 |
| | 4.8 | |
| Exercised | (67,003 | ) | | | 11.41 |
| | | |
| Expired | (172,517 | ) | | | 15.24 |
| | | |
| Balance as of December 31, 2018 | 1,065,021 |
| | $ | 16.30 |
| | 3.8 | |
| Exercisable as of December 31, 2018 | 1,065,021 |
| | $ | 16.30 |
| | 3.8 | |
| | | | | | | | | | | | | | | | | | | | | | | | | | |
| Number of
Shares | Weighted-
Average
Exercise
Price | Weighted-
Average
Contractual
Life (years) | |
| Balance as of December 31, 2019 | 959,399 | | | $ | 16.09 | | | 2.8 | | | | |
| | | | | | | | | | |
| | | | | | | | | | |
| Forfeited | (46,498) | | | $ | 16.14 | | | | | | | |
| | | | | | | | | | |
| Balance as of December 31, 2020 | 912,901 | | | $ | 16.09 | | | 1.8 | | | | |
| Exercisable as of December 31, 2020 | 912,901 | | | $ | 16.09 | | | 1.8 | | | | |
The total intrinsic value of stock options exercised in 2018 was less than $1 million. NoNaN stock options were exercised in 20172020 and 2016.2019.
Restricted stock units and deferred stock units
Under the Incentive Plan,Plans, each RSU and DSU granted provides the holder upon vesting the right to receive one1 share of our common stock for equity-based awards, and the equivalent in cash for liability-based awards. The awards vest ratably over a period of four years for employees and one year for directors. Awards to employees are settled upon vesting, while awards to directors are settled ratably over a period of three years or upon separation from the board of directors, as applicable, based on the director’s country of residency. We withhold shares in respect of applicable taxes.
RESOLUTE FOREST PRODUCTS INC.
Notes to Consolidated Financial Statements
The activity of nonvested RSUs and DSUs for the year ended December 31, 2018,2020, was as follows:
| | | | | | | | | | | | | | Number of Units | |
| | Number of Units | | | Equity-Based Awards | | Liability-Based Awards | | Total | Weighted-
Average Fair
Value at Grant
Date |
| | Equity-Based Awards | | Liability-Based Awards | | Total | Weighted- Average Fair Value at Grant Date | |
| Balance as of December 31, 2017 | 1,964,261 |
| | 17,161 |
| | 1,981,422 |
| | $ | 5.96 | | |
| Balance as of December 31, 2019 | | Balance as of December 31, 2019 | 1,356,016 | | | 755,934 | | | 2,111,950 | | | $ | 6.32 | |
| Granted | 346,757 |
| | 784,169 |
| | 1,130,926 |
| | 8.93 | | Granted | 688,797 | | | 1,200,163 | | | 1,888,960 | | | $ | 3.87 | |
| Vested | (724,856 | ) | | (265,540 | ) | | (990,396 | ) | | 7.20 | | Vested | (688,126) | | | (695,347) | | | (1,383,473) | | | $ | 5.20 | |
| Forfeited | (40,983 | ) | | (16,828 | ) | | (57,811 | ) | | 5.80 | | Forfeited | (77,672) | | | (132,486) | | | (210,158) | | | $ | 5.24 | |
| Balance as of December 31, 2018 | 1,545,179 |
| | 518,962 |
| | 2,064,141 |
| | $ | 7.00 | | |
| Balance as of December 31, 2020 | | Balance as of December 31, 2020 | 1,279,015 | | | 1,128,264 | | | 2,407,279 | | | $ | 5.14 | |
There were 259,230225,168 equity-based and 124,574316,435 liability-based RSUs and DSUs granted to directors that vested but were not settled as of December 31, 2018.2020.
The weighted-average grant-date fair value of all RSUs and DSUs granted in 20172019 and 2016,2018, was $7.34$5.55 and $3.97,$8.93, respectively. The total fair value of RSUs and DSUs vested in 2020, 2019 and 2018, 2017 and 2016, was $12$7 million, $8$5 million and $3$12 million, respectively. We paid $2$3 million, $1 million and $1$2 million for liability-based RSUs and DSUs in 2020, 2019 and 2018, and 2017, respectively. There was no cash paid for liability-based RSUs and DSUs in 2016.
RESOLUTE FOREST PRODUCTS INC.
Notes to Consolidated Financial Statements
Performance stock units
Under the Incentive Plan,Plans, each PSU provides the holder the right to receive upon vesting one1 share of our common stock for equity-based awards, and the equivalent in cash for liability-based awards, subject to an adjustment based on market and/or performance conditions. The awards vest after a period of up to 40 months upon which they are settled. No awards vest when the minimum thresholds are not achieved. We withhold shares in respect of applicable taxes. The fair value of certain PSUs granted in 2018 was initially estimated using a Monte Carlo simulation model, using the following assumptions:
|
| | | |
| 2018 |
Expected volatility two year | 57 | % | |
Risk-free interest rate 2019 | 2.73 | % | |
Risk-free interest rate 2020 | 2.92 | % | |
Risk-free interest rate 2021 | 2.99 | % | |
| | | | | | | | | | | | | | | | | | | | |
| 2020 | 2019 | 2018 |
| Expected volatility | 57% - 77% | | 56% - 58% | | 57 | % | |
| Risk-free interest rate | 0.11% - 2.99% | | 1.58% - 1.70% | | 2.73% - 2.99% | |
The activity of nonvested PSUs for the year ended December 31, 2018,2020, was as follows:
| | | | | | | | | | | | | | | Number of Units | |
| | Number of Units | | | | | Equity-Based Awards | | Liability-Based Awards | | Total | Weighted-
Average Fair
Value at Grant
Date |
| | Equity-Based Awards | | Liability-Based Awards | | Total | Weighted- Average Fair Value at Grant Date | |
| Balance as of December 31, 2017 | 2,204,102 |
| | 387,294 |
| | 2,591,396 |
| | $ | 6.94 |
| | |
| Balance as of December 31, 2019 | | Balance as of December 31, 2019 | 2,353,420 | | | 1,127,021 | | | 3,480,441 | | | $ | 5.99 | | |
| Granted | 468,954 |
| | 598,351 |
| | 1,067,305 |
| | 9.01 |
| | Granted | 688,797 | | | 700,693 | | | 1,389,490 | | | $ | 4.09 | | |
| Vested | (233,300 | ) | | — |
| | (233,300 | ) | | 18.61 |
| | Vested | (1,271,527) | | | (420,137) | | | (1,691,664) | | | $ | 4.22 | | |
| Performance adjustment | | Performance adjustment | 103,703 | | | 34,265 | | | 137,968 | | | $ | 3.95 | | |
| Forfeited | (57,582 | ) | | (9,713 | ) | | (67,295 | ) | | 13.48 |
| | Forfeited | (78,990) | | | (130,515) | | | (209,505) | | | $ | 5.38 | | |
| Balance as of December 31, 2018 | 2,382,174 |
| | 975,932 |
| | 3,358,106 |
| | $ | 6.66 |
| | |
| Balance as of December 31, 2020 | | Balance as of December 31, 2020 | 1,795,403 | | | 1,311,327 | | | 3,106,730 | | | $ | 6.05 | | |
The weighted-average grant-date fair value of all PSUs granted in 20172019 and 2016,2018, was $8.63$5.29 and $3.95,$9.01, respectively. The total fair value of PSUs vested in 2020, 2019 and 2018, was $5 million, $7 million and $2 million. Nomillion, respectively. We paid $1 million and $1 million for liability-based PSUs vested in 20162020 and 2017.2019, respectively. There was no0 cash paid for liability-based PSUs in 2018, 2017, and 2016.
RESOLUTE FOREST PRODUCTS INC.
Notes to Consolidated Financial Statements
2018.
Deferred Compensation Plan
In 2011, the board of directors adopted the Resolute Forest Products Outside Director Deferred Compensation Plan (the “Deferred Compensation Plan”), which allows non-employee directors to surrender 50% or 100% of their cash fees in exchange for DSUs or RSUs, as applicable, based on the director’s country of residency. The number of awards issued pursuant to the Deferred Compensation Plan is based on 110% of the fees earned, resulting in a 10% premium incentive.
Under the Deferred Compensation Plan, each RSU and DSU granted provides the holder the right to receive payment in cash in an amount equal to the fair market value of one1 share of our common stock upon vesting. The awards have a nonforfeitable right or vest ratably over a period of three years, as applicable, and are settled with cash ratably over a period of three years or upon separation from the board of directors, as applicable, based on the director’s country of residency. All of our outstanding stock incentive awards pursuant to the Deferred Compensation Plan were accounted for as liability awards.
Share-based compensation expense under the Deferred Compensation Planplan for the years ended December 31, 2020 and 2018 was less than $1 million, $1$2 million and less than $1 million, respectively. There was a $1 million reversal in share-based compensation expense for the yearsyear ended December 31, 2018, 2017 and 2016, respectively.2019.
RSUs and DSUs outstanding under the Deferred Compensation Plan as of December 31, 20182020 and 2017,2019 were 260,672481,056 and 183,046,330,900, respectively. The total fair value of RSUs and DSUs vested in 2020, 2019 and 2018 was $1 million, and less than $1 million, in 2017less than $1 million and 2016,$1 million, respectively.
108
Note 17. Operating Leases and Purchase Obligations
We lease office and manufacturing premises, office equipment, and rail cars under operating leases for which total expense was $12 million in 2018, $8 million in 2017 and $9 million in 2016. In the normal course of business, we have also entered into various supply agreements, guarantees, water rights agreements, purchase commitments and harvesting rights agreements (for land that we manage for which we make payments to various Canadian provinces based on the amount of timber harvested).
As of December 31, 2018, the commitments for purchase obligations and future minimum rental payments under operating leases were as follows: |
| | | | | | | | |
| (In millions) | Purchase Obligations (1) | Operating Leases |
| 2019 | $ | 78 |
| | $ | 9 |
| |
| 2020 | | 64 |
| | | 7 |
| |
| 2021 | | 63 |
| | | 6 |
| |
| 2022 | | 63 |
| | | 3 |
| |
| 2023 | | 42 |
| | | 2 |
| |
| Thereafter | | 30 |
| | | 7 |
| |
| | $ | 340 |
| | $ | 34 |
| |
| |
(1)
| Includes energy purchase obligations of $256 million through 2023 for certain of our pulp and paper mills. |
RESOLUTE FOREST PRODUCTS INC.
Notes to Consolidated Financial Statements
Note 18.21. Segment Information
We manage our business based on the products we manufacture. Accordingly, our reportable segments correspond to our principal product lines: market pulp, tissue, wood products, and paper. As of the second quarter of 2020, the results from our newsprint and specialty papers.papers operations have been combined to form the paper reportable segment. This better reflects management’s internal analysis, given the diminishing percentage newsprint and specialty papers represent in our product portfolio. Comparative year information has been modified to conform to this revised segment presentation.
None of the income or loss items following “Operating income (loss)”income” in our Consolidated Statements of Operations are allocated to our segments, since those items are reviewed separately by management. For the same reason, closure costs, impairment and other related charges, inventory write-downs related to closures, start-up costs, gains and losses on disposition of assets, as well as other discretionary charges or credits are not allocated to our segments. We allocate depreciation and amortization expense to our segments, although the related fixed assets and amortizable intangible assets are not allocated to segment assets. Additionally, all selling, general and administrative expenses are allocated to our segments, with the exception of certain discretionary charges and credits, which we present under “corporate and other.”
In each of 2018, 20172020, 2019 and 2016,2018, no assets were identifiable by segment and reviewed by management.
Information about certain segment data for the years ended December 31, 2018, 20172020, 2019 and 2016,2018, was as follows:
| | | | | | | | | | | | | | | | | | | | | | | | | | | | | | | | | | | | | | | | | | | | | | | | | | | | | | | | | | | | | | | | | |
| (In millions) | Market Pulp (1) | Tissue (2) | Wood Products (3) | Paper | Segment
Total | Corporate
and Other | Total |
| Sales |
| 2020 | $ | 668 | | | $ | 173 | | | $ | 1,025 | | | $ | 934 | | | $ | 2,800 | | | $ | 0 | | | $ | 2,800 | | |
| 2019 | $ | 797 | | | $ | 165 | | | $ | 616 | | | $ | 1,345 | | | $ | 2,923 | | | $ | 0 | | | $ | 2,923 | | |
| 2018 | $ | 1,085 | | | $ | 130 | | | $ | 823 | | | $ | 1,718 | | | $ | 3,756 | | | $ | 0 | | | $ | 3,756 | | |
| Depreciation and amortization |
| 2020 | $ | 24 | | | $ | 18 | | | $ | 43 | | | $ | 69 | | | $ | 154 | | | $ | 15 | | | $ | 169 | | |
| 2019 | $ | 23 | | | $ | 18 | | | $ | 34 | | | $ | 72 | | | $ | 147 | | | $ | 20 | | | $ | 167 | | |
| 2018 | $ | 27 | | | $ | 15 | | | $ | 32 | | | $ | 113 | | | $ | 187 | | | $ | 25 | | | $ | 212 | | |
| Operating income (loss) |
| 2020 | $ | (1) | | | $ | (1) | | | $ | 276 | | | $ | (46) | | | $ | 228 | | | $ | (129) | | | $ | 99 | | |
| 2019 | $ | 39 | | | $ | (16) | | | $ | (6) | | | $ | 82 | | | $ | 99 | | | $ | (82) | | | $ | 17 | | |
| 2018 | $ | 172 | | | $ | (30) | | | $ | 169 | | | $ | 114 | | | $ | 425 | | | $ | (46) | | | $ | 379 | | |
| Capital expenditures |
| 2020 | $ | 15 | | | $ | 8 | | | $ | 26 | | | $ | 23 | | | $ | 72 | | | $ | 6 | | | $ | 78 | | |
| 2019 | $ | 29 | | | $ | 8 | | | $ | 23 | | | $ | 43 | | | $ | 103 | | | $ | 10 | | | $ | 113 | | |
| 2018 | $ | 53 | | | $ | 27 | | | $ | 37 | | | $ | 34 | | | $ | 151 | | | $ | 4 | | | $ | 155 | | |
(1)Inter-segment sales of $28 million, $36 million and $39 million, were excluded from market pulp sales for the years ended December 31, 2020, 2019 and 2018, respectively. Effective July 1, 2019, these sales were transacted either at the lowest market price of the previous month or cost. Previously, these sales were transacted at cost.
(2)The operating results of our Calhoun tissue operations, previously recorded under “corporate and other,” have been recorded in our tissue segment since April 1, 2018.
(3)Wood products sales to our joint ventures, which are transacted at arm’s length negotiated prices, were $28 million, $22 million and $26 million for the years ended December 31, 2020, 2019 and 2018, respectively.
|
| | | | | | | | | | | | | | | | | | | | | | | | | | | | | | | | |
| (In millions) | Market Pulp (1) | Tissue (2)(3) | Wood Products (4) | Newsprint | Specialty Papers | Segment Total | Corporate and Other | Total |
| Sales |
| 2018 | $ | 1,085 |
| | $ | 130 |
| | $ | 823 |
| | $ | 907 |
| | $ | 811 |
| | $ | 3,756 |
| | $ | — |
| | $ | 3,756 |
| |
| 2017 | | 911 |
| | | 81 |
| | | 797 |
| | | 842 |
| | | 882 |
| | | 3,513 |
| | | — |
| | | 3,513 |
| |
| 2016 | | 836 |
| | | 89 |
| | | 596 |
| | | 1,009 |
| | | 1,015 |
| | | 3,545 |
| | | — |
| | | 3,545 |
| |
| Depreciation and amortization |
| 2018 | $ | 27 |
| | $ | 15 |
| | $ | 32 |
| | $ | 66 |
| | $ | 47 |
| | $ | 187 |
| | $ | 25 |
| | $ | 212 |
| |
| 2017 | | 31 |
| | | 5 |
| | | 33 |
| | | 66 |
| | | 45 |
| | | 180 |
| | | 24 |
| | | 204 |
| |
| 2016 | | 37 |
| | | 5 |
| | | 31 |
| | | 74 |
| | | 45 |
| | | 192 |
| | | 14 |
| | | 206 |
| |
Operating income (loss) (5) |
| 2018 | $ | 172 |
| | $ | (30 | ) | | $ | 169 |
| | $ | 74 |
| | $ | 40 |
| | $ | 425 |
| | $ | (46 | ) | | $ | 379 |
| |
| 2017 | | 79 |
| | | (6 | ) | | | 186 |
| | | (23 | ) | | | (9 | ) | | | 227 |
| | | (185 | ) | | | 42 |
| |
| 2016 | | 37 |
| | | (10 | ) | | | 69 |
| | | (16 | ) | | | 19 |
| | | 99 |
| | | (117 | ) | | | (18 | ) | |
| Capital expenditures |
| 2018 | $ | 53 |
| | $ | 27 |
| | $ | 37 |
| | $ | 18 |
| | $ | 16 |
| | $ | 151 |
| | $ | 4 |
| | $ | 155 |
| |
| 2017 | | 12 |
| | | 101 |
| | | 9 |
| | | 6 |
| | | 20 |
| | | 148 |
| | | 16 |
| | | 164 |
| |
| 2016 | | 20 |
| | | 156 |
| | | 23 |
| | | 2 |
| | | 23 |
| | | 224 |
| | | 25 |
| | | 249 |
| |
| |
(1)
| Inter-segment sales of $39 million, $36 million and $33 million, which are transacted at cost, were excluded from market pulp sales for the years ended December 31, 2018, 2017 and 2016, respectively. |
| |
(2)
| The operating results of our Calhoun tissue operations, previously recorded under “corporate and other,” have been recorded in our tissue segment since April 1, 2018. |
| |
(3)
| Tissue capital expenditures in 2017 and 2016 consisted almost entirely of expenditures for the tissue manufacturing and converting facility in Calhoun. |
| |
(4)
| Wood products sales to our joint ventures, which are transacted at arm’s length negotiated prices, were $26 million, $20 million and $17 million for the years ended December 31, 2018, 2017 and 2016, respectively. |
| |
(5)
| In the first quarter of 2018, we changed our presentation of operating income in accordance with FASB ASU 2017-07, to present only the service cost component of net periodic pension cost and OPEB cost in operating expenses (together with other employee compensation costs arising during the period). The non-operating pension and OPEB costs, presented under “corporate and other,” are reported separately outside any subtotal of operating income. Prior period amounts have been reclassified to conform to the 2018 presentation. See Note 2. Summary of Significant Accounting Policies – New accounting pronouncements adopted in 2018 – ASU 2017-07 “Improving the Presentation of Net Periodic Pension Cost and Net Periodic Postretirement Benefit Cost” for more information. |
RESOLUTE FOREST PRODUCTS INC.
Notes to Consolidated Financial Statements
Sales are attributed to countries based on the location of the customer. No single customer, related or otherwise, accounted for 10% or more of our 2018, 20172020, 2019 or 20162018 consolidated sales. No country in the “Other countries” group in the table below exceeded 2% of consolidated sales. Sales by country for the years ended December 31, 2018, 20172020, 2019 and 2016,2018, were as follows:
| | | | | | | | | | | | | | | | | | | | | | | | | | | | | |
| (In millions) | 2020 | | 2019 | | 2018 | |
| U.S. | $ | 2,038 | | | $ | 2,026 | | | $ | 2,581 | | |
| Foreign countries: | | | | | | | | | |
| Canada | | 463 | | | | 405 | | | | 513 | | |
| Mexico | | 63 | | | | 87 | | | | 148 | | |
| | | | | | | | | |
| | | | | | | | | |
| Other countries | | 236 | | | | 405 | | | | 514 | | |
| | | 762 | | | | 897 | | | | 1,175 | | |
| | $ | 2,800 | | | $ | 2,923 | | | $ | 3,756 | | |
|
| | | | | | | | | | | | |
| (In millions) | 2018 | | | 2017 | | | 2016 | | |
| United States | $ | 2,581 |
| | $ | 2,387 |
| | $ | 2,464 |
| |
| Foreign countries: | | | | | | | | | |
| Canada | | 513 |
| | | 517 |
| | | 428 |
| |
| Mexico | | 148 |
| | | 126 |
| | | 126 |
| |
| Other countries | | 514 |
| | | 483 |
| | | 527 |
| |
| | | 1,175 |
| | | 1,126 |
| | | 1,081 |
| |
| | $ | 3,756 |
| | $ | 3,513 |
| | $ | 3,545 |
| |
Certain long-livedLong-lived assets by country (comprised of fixed assets, net, water rights, net, energy contracts, net and other assets) as of December 31, 20182020 and 2017,2019, were as follows:
| | | | | | | | | | | | | | | | | | | | |
| (In millions) | 2020 | | 2019 | |
| U.S. | $ | 666 | | | $ | 540 | | |
| | | | | | |
| Canada | | 898 | | | | 1,028 | | |
| | | | | | |
| | | | | | |
| | $ | 1,564 | | | $ | 1,568 | | |
|
| | | | | | | | |
| (In millions) | 2018 | | | 2017 | | |
| United States | $ | 650 |
| | $ | 790 |
| |
| Canada | | 1,103 |
| | | 1,143 |
| |
| | $ | 1,753 |
| | $ | 1,933 |
| |
RESOLUTE FOREST PRODUCTS INC.
Notes to Consolidated Financial Statements
Note 19. Condensed Consolidating Financial Information
The following information is presented in accordance with Rule 3-10 of Regulation S-X and the public information requirements of Rule 144 promulgated pursuant to the Securities Act, as amended, in connection with Resolute Forest Products Inc.’s 2023 Notes that are fully and unconditionally guaranteed, on a joint and several basis, by all of our 100% owned material U.S. subsidiaries (or the “Guarantor Subsidiaries”). The 2023 Notes are not guaranteed by our foreign subsidiaries (or the “Non-guarantor Subsidiaries”).
The following condensed consolidating financial information sets forth the Statements of Operations and Comprehensive Income (Loss) for the years ended December 31, 2018, 2017 and 2016, the Balance Sheets as of December 31, 2018 and 2017, and the Statements of Cash Flows for the years ended December 31, 2018, 2017 and 2016, for the Parent, the Guarantor Subsidiaries on a combined basis, and the Non-guarantor Subsidiaries also on a combined basis. The condensed consolidating financial information reflects the investments of the Parent in the Guarantor Subsidiaries and Non-guarantor Subsidiaries, as well as the investments of the Guarantor Subsidiaries in the Non-guarantor Subsidiaries, using the equity method of accounting. The principal consolidating adjustments are entries to eliminate the investments in subsidiaries and intercompany balances and transactions.
|
| | | | | | | | | | | | | | | | | | | | |
| CONDENSED CONSOLIDATING STATEMENT OF OPERATIONS AND COMPREHENSIVE INCOME |
| For the Year Ended December 31, 2018 |
| (In millions) | Parent | Guarantor Subsidiaries | Non-guarantor Subsidiaries | Consolidating Adjustments | Consolidated |
| Sales | $ | — |
| | $ | 3,123 |
| | $ | 2,468 |
| | $ | (1,835 | ) | | $ | 3,756 |
| |
| Costs and expenses: | | | | | | | | | | | | | | | |
| Cost of sales, excluding depreciation, amortization and distribution costs | | — |
| | | 2,856 |
| | | 1,521 |
| | | (1,828 | ) | | | 2,549 |
| |
| Depreciation and amortization | | — |
| | | 78 |
| | | 134 |
| | | — |
| | | 212 |
| |
| Distribution costs | | — |
| | | 158 |
| | | 320 |
| | | (3 | ) | | | 475 |
| |
| Selling, general and administrative expenses | | 26 |
| | | 64 |
| | | 75 |
| | | — |
| | | 165 |
| |
| Closure costs, impairment and other related charges | | — |
| | | 120 |
| | | 1 |
| | | — |
| | | 121 |
| |
| Net gain on disposition of assets | | — |
| | | (141 | ) | | | (4 | ) | | | — |
| | | (145 | ) | |
| Operating (loss) income | | (26 | ) | | | (12 | ) | | | 421 |
| | | (4 | ) | | | 379 |
| |
| Interest expense | | (87 | ) | | | (7 | ) | | | (12 | ) | | | 59 |
| | | (47 | ) | |
| Non-operating pension and other postretirement benefit credits | | — |
| | | 14 |
| | | 36 |
| | | — |
| | | 50 |
| |
| Other income, net | | — |
| | | 52 |
| | | 38 |
| | | (85 | ) | | | 5 |
| |
| Equity in income of subsidiaries | | 348 |
| | | 99 |
| | | — |
| | | (447 | ) | | | — |
| |
| Income before income taxes | | 235 |
| | | 146 |
| | | 483 |
| | | (477 | ) | | | 387 |
| |
| Income tax provision | | — |
| | | — |
| | | (153 | ) | | | 1 |
| | | (152 | ) | |
| Net income including noncontrolling interests | | 235 |
| | | 146 |
| | | 330 |
| | | (476 | ) | | | 235 |
| |
| Net income attributable to noncontrolling interests | | — |
| | | — |
| | | — |
| | | — |
| | | — |
| |
| Net income attributable to Resolute Forest Products Inc. | $ | 235 |
| | $ | 146 |
| | $ | 330 |
| | $ | (476 | ) | | $ | 235 |
| |
| Comprehensive income attributable to Resolute Forest Products Inc. | $ | 67 |
| | $ | 118 |
| | $ | 185 |
| | $ | (303 | ) | | $ | 67 |
| |
RESOLUTE FOREST PRODUCTS INC.
Notes to Consolidated Financial Statements
|
| | | | | | | | | | | | | | | | | | | | |
| CONDENSED CONSOLIDATING STATEMENT OF OPERATIONS AND COMPREHENSIVE (LOSS) INCOME |
| For the Year Ended December 31, 2017 |
| (In millions) | Parent | Guarantor Subsidiaries | Non-guarantor Subsidiaries | Consolidating Adjustments | Consolidated |
| Sales | $ | — |
| | $ | 2,849 |
| | $ | 2,264 |
| | $ | (1,600 | ) | | $ | 3,513 |
| |
| Costs and expenses: | | | | | | | | | | | | | | | |
| Cost of sales, excluding depreciation, amortization and distribution costs | | — |
| | | 2,707 |
| | | 1,476 |
| | | (1,595 | ) | | | 2,588 |
| |
| Depreciation and amortization | | — |
| | | 74 |
| | | 130 |
| | | — |
| | | 204 |
| |
| Distribution costs | | — |
| | | 159 |
| | | 291 |
| | | (8 | ) | | | 442 |
| |
| Selling, general and administrative expenses | | 30 |
| | | 68 |
| | | 72 |
| | | — |
| | | 170 |
| |
| Closure costs, impairment and other related charges | | — |
| | | 71 |
| | | 11 |
| | | — |
| | | 82 |
| |
| Net gain on disposition of assets | | — |
| | | — |
| | | (15 | ) | | | — |
| | | (15 | ) | |
| Operating (loss) income | | (30 | ) | | | (230 | ) | | | 299 |
| | | 3 |
| | | 42 |
| |
| Interest expense | | (95 | ) | | | (9 | ) | | | (13 | ) | | | 68 |
| | | (49 | ) | |
| Non-operating pension and other postretirement benefit (costs) credits | | — |
| | | (1 | ) | | | 8 |
| | | — |
| | | 7 |
| |
| Other income (expense), net | | — |
| | | 76 |
| | | (2 | ) | | | (68 | ) | | | 6 |
| |
| Equity in income of subsidiaries | | 41 |
| | | 43 |
| | | — |
| | | (84 | ) | | | — |
| |
| (Loss) income before income taxes | | (84 | ) | | | (121 | ) | | | 292 |
| | | (81 | ) | | | 6 |
| |
| Income tax benefit (provision) | | — |
| | | 2 |
| | | (85 | ) | | | (1 | ) | | | (84 | ) | |
| Net (loss) income including noncontrolling interests | | (84 | ) | | | (119 | ) | | | 207 |
| | | (82 | ) | | | (78 | ) | |
| Net income attributable to noncontrolling interests | | — |
| | | — |
| | | (6 | ) | | | — |
| | | (6 | ) | |
| Net (loss) income attributable to Resolute Forest Products Inc. | $ | (84 | ) | | $ | (119 | ) | | $ | 201 |
| | $ | (82 | ) | | $ | (84 | ) | |
| Comprehensive (loss) income attributable to Resolute Forest Products Inc. | $ | (109 | ) | | $ | (135 | ) | | $ | 192 |
| | $ | (57 | ) | | $ | (109 | ) | |
RESOLUTE FOREST PRODUCTS INC.
Notes to Consolidated Financial Statements
|
| | | | | | | | | | | | | | | | | | | | |
| CONDENSED CONSOLIDATING STATEMENT OF OPERATIONS AND COMPREHENSIVE (LOSS) INCOME |
| For the Year Ended December 31, 2016 |
| (In millions) | Parent | Guarantor
Subsidiaries | Non-guarantor
Subsidiaries | Consolidating
Adjustments | Consolidated |
| Sales | $ | — |
| | $ | 2,907 |
| | $ | 2,145 |
| | $ | (1,507 | ) | | $ | 3,545 |
| |
| Costs and expenses: | | | | | | | | | | | | | | | |
| Cost of sales, excluding depreciation, amortization and distribution costs | | — |
| | | 2,752 |
| | | 1,458 |
| | | (1,500 | ) | | | 2,710 |
| |
| Depreciation and amortization | | — |
| | | 78 |
| | | 128 |
| | | — |
| | | 206 |
| |
| Distribution costs | | — |
| | | 168 |
| | | 273 |
| | | (1 | ) | | | 440 |
| |
| Selling, general and administrative expenses | | 20 |
| | | 60 |
| | | 67 |
| | | — |
| | | 147 |
| |
| Closure costs, impairment and other related charges | | — |
| | | 38 |
| | | 24 |
| | | — |
| | | 62 |
| |
| Net gain on disposition of assets | | — |
| | | — |
| | | (2 | ) | | | — |
| | | (2 | ) | |
| Operating (loss) income | | (20 | ) | | | (189 | ) | | | 197 |
| | | (6 | ) | | | (18 | ) | |
| Interest expense | | (80 | ) | | | — |
| | | (10 | ) | | | 52 |
| | | (38 | ) | |
| Non-operating pension and other postretirement benefit credits (costs) | | — |
| | | 6 |
| | | (14 | ) | | | — |
| | | (8 | ) | |
| Other income, net | | — |
| | | 57 |
| | | 2 |
| | | (52 | ) | | | 7 |
| |
| Equity in income of subsidiaries | | 19 |
| | | 24 |
| | | — |
| | | (43 | ) | | | — |
| |
| (Loss) income before income taxes | | (81 | ) | | | (102 | ) | | | 175 |
| | | (49 | ) | | | (57 | ) | |
| Income tax provision | | — |
| | | (11 | ) | | | (10 | ) | | | 2 |
| | | (19 | ) | |
| Net (loss) income including noncontrolling interests | | (81 | ) | | | (113 | ) | | | 165 |
| | | (47 | ) | | | (76 | ) | |
| Net income attributable to noncontrolling interests | | — |
| | | — |
| | | (5 | ) | | | — |
| | | (5 | ) | |
| Net (loss) income attributable to Resolute Forest Products Inc. | $ | (81 | ) | | $ | (113 | ) | | $ | 160 |
| | $ | (47 | ) | | $ | (81 | ) | |
| Comprehensive (loss) income attributable to Resolute Forest Products Inc. | $ | (249 | ) | | $ | (197 | ) | | $ | 73 |
| | $ | 124 |
| | $ | (249 | ) | |
RESOLUTE FOREST PRODUCTS INC.
Notes to Consolidated Financial Statements
|
| | | | | | | | | | | | | | | | | | | | |
| CONDENSED CONSOLIDATING BALANCE SHEET |
| As of December 31, 2018 |
| (In millions) | Parent | Guarantor Subsidiaries | Non-guarantor Subsidiaries | Consolidating Adjustments | Consolidated |
| Assets | | | | | | | | | | | | | | | |
| Current assets: | | | | | | | | | | | | | | | |
| Cash and cash equivalents | $ | — |
| | $ | 301 |
| | $ | 3 |
| | $ | — |
| | $ | 304 |
| |
| Accounts receivable, net | | — |
| | | 301 |
| | | 148 |
| | | — |
| | | 449 |
| |
| Accounts receivable from affiliates | | — |
| | | 588 |
| | | 1,071 |
| | | (1,659 | ) | | | — |
| |
| Inventories, net | | — |
| | | 194 |
| | | 327 |
| | | (13 | ) | | | 508 |
| |
| Note, advance and interest receivable from parent | | — |
| | | 422 |
| | | — |
| | | (422 | ) | | | — |
| |
| Interest receivable from affiliate | | — |
| | | 4 |
| | | — |
| | | (4 | ) | | | — |
| |
| Other current assets | | — |
| | | 15 |
| | | 28 |
| | | — |
| | | 43 |
| |
| Total current assets | | — |
| | | 1,825 |
| | | 1,577 |
| | | (2,098 | ) | | | 1,304 |
| |
| Fixed assets, net | | — |
| | | 523 |
| | | 992 |
| | | — |
| | | 1,515 |
| |
| Amortizable intangible assets, net | | — |
| | | 2 |
| | | 48 |
| | | — |
| | | 50 |
| |
| Deferred income tax assets | | — |
| | | 1 |
| | | 872 |
| | | 3 |
| | | 876 |
| |
| Notes receivable from parent | | — |
| | | 657 |
| | | — |
| | | (657 | ) | | | — |
| |
| Note receivable from affiliate | | — |
| | | 107 |
| | | — |
| | | (107 | ) | | | — |
| |
| Investments in consolidated subsidiaries and affiliates | | 4,119 |
| | | 2,205 |
| | | — |
| | | (6,324 | ) | | | — |
| |
| Other assets | | — |
| | | 126 |
| | | 64 |
| | | — |
| | | 190 |
| |
| Total assets | $ | 4,119 |
| | $ | 5,446 |
| | $ | 3,553 |
| | $ | (9,183 | ) | | $ | 3,935 |
| |
| Liabilities and equity | | | | | | | | | | | | | | | |
| Current liabilities: | | | | | | | | | | | | | | | |
| Accounts payable and accrued liabilities | $ | 7 |
| | $ | 170 |
| | $ | 250 |
| | $ | — |
| | $ | 427 |
| |
| Current portion of long-term debt | | 222 |
| | | 1 |
| | | — |
| | | — |
| | | 223 |
| |
| Accounts payable to affiliates | | 592 |
| | | 1,112 |
| | | — |
| | | (1,704 | ) | | | — |
| |
| Note, advance and interest payable to subsidiaries | | 422 |
| | | — |
| | | — |
| | | (422 | ) | | | — |
| |
| Interest payable to affiliate | | — |
| | | — |
| | | 4 |
| | | (4 | ) | | | — |
| |
| Total current liabilities | | 1,243 |
| | | 1,283 |
| | | 254 |
| | | (2,130 | ) | | | 650 |
| |
| Long-term debt, net of current portion | | 370 |
| | | 52 |
| | | — |
| | | — |
| | | 422 |
| |
| Notes payable to subsidiaries | | 657 |
| | | — |
| | | — |
| | | (657 | ) | | | — |
| |
| Note payable to affiliate | | — |
| | | — |
| | | 107 |
| | | (107 | ) | | | — |
| |
| Pension and other postretirement benefit obligations | | — |
| | | 342 |
| | | 915 |
| | | — |
| | | 1,257 |
| |
| Other liabilities | | 6 |
| | | 21 |
| | | 44 |
| | | — |
| | | 71 |
| |
| Total liabilities | | 2,276 |
| | | 1,698 |
| | | 1,320 |
| | | (2,894 | ) | | | 2,400 |
| |
| Total equity | | 1,843 |
| | | 3,748 |
| | | 2,233 |
| | | (6,289 | ) | | | 1,535 |
| |
| Total liabilities and equity | $ | 4,119 |
| | $ | 5,446 |
| | $ | 3,553 |
| | $ | (9,183 | ) | | $ | 3,935 |
| |
RESOLUTE FOREST PRODUCTS INC.
Notes to Consolidated Financial Statements
|
| | | | | | | | | | | | | | | | | | | | |
| CONDENSED CONSOLIDATING BALANCE SHEET |
| As of December 31, 2017 |
| (In millions) | Parent | Guarantor Subsidiaries | Non-guarantor Subsidiaries | Consolidating Adjustments | Consolidated |
| Assets | | | | | | | | | | | | | | | |
| Current assets: | | | | | | | | | | | | | | | |
| Cash and cash equivalents | $ | — |
| | $ | 3 |
| | $ | 3 |
| | $ | — |
| | $ | 6 |
| |
| Accounts receivable, net | | — |
| | | 319 |
| | | 160 |
| | | — |
| | | 479 |
| |
| Accounts receivable from affiliates | | — |
| | | 535 |
| | | 729 |
| | | (1,264 | ) | | | — |
| |
| Inventories, net | | — |
| | | 243 |
| | | 292 |
| | | (9 | ) | | | 526 |
| |
| Note, advance and interest receivable from parent | | — |
| | | 538 |
| | | — |
| | | (538 | ) | | | — |
| |
| Notes and interest receivable from affiliates | | — |
| | | 32 |
| | | — |
| | | (32 | ) | | | — |
| |
| Other current assets | | — |
| | | 16 |
| | | 17 |
| | | — |
| | | 33 |
| |
| Total current assets | | — |
| | | 1,686 |
| | | 1,201 |
| | | (1,843 | ) | | | 1,044 |
| |
| Fixed assets, net | | — |
| | | 692 |
| | | 1,024 |
| | | — |
| | | 1,716 |
| |
| Amortizable intangible assets, net | | — |
| | | 13 |
| | | 52 |
| | | — |
| | | 65 |
| |
| Goodwill | | — |
| | | 81 |
| | | — |
| | | — |
| | | 81 |
| |
| Deferred income tax assets | | — |
| | | 1 |
| | | 1,073 |
| | | 2 |
| | | 1,076 |
| |
| Notes receivable from parent | | — |
| | | 330 |
| | | — |
| | | (330 | ) | | | — |
| |
| Note receivable from affiliate | | — |
| | | 116 |
| | | — |
| | | (116 | ) | | | — |
| |
| Investments in consolidated subsidiaries and affiliates | | 3,939 |
| | | 2,111 |
| | | — |
| | | (6,050 | ) | | | — |
| |
| Other assets | | — |
| | | 98 |
| | | 67 |
| | | — |
| | | 165 |
| |
| Total assets | $ | 3,939 |
| | $ | 5,128 |
| | $ | 3,417 |
| | $ | (8,337 | ) | | $ | 4,147 |
| |
| Liabilities and equity | | | | | | | | | | | | | | | |
| Current liabilities: | | | | | | | | | | | | | | | |
| Accounts payable and accrued liabilities | $ | 4 |
| | $ | 171 |
| | $ | 245 |
| | $ | — |
| | $ | 420 |
| |
| Current portion of long-term debt | | — |
| | | 1 |
| | | — |
| | | — |
| | | 1 |
| |
| Accounts payable to affiliates | | 536 |
| | | 728 |
| | | — |
| | | (1,264 | ) | | | — |
| |
| Note, advance and interest payable to subsidiaries | | 538 |
| | | — |
| | | — |
| | | (538 | ) | | | — |
| |
| Notes and interest payable to affiliate | | — |
| | | — |
| | | 32 |
| | | (32 | ) | | | — |
| |
| Total current liabilities | | 1,078 |
| | | 900 |
| | | 277 |
| | | (1,834 | ) | | | 421 |
| |
| Long-term debt, net of current portion | | 592 |
| | | 196 |
| | | — |
| | | — |
| | | 788 |
| |
| Note payable to subsidiary | | 330 |
| | | — |
| | | — |
| | | (330 | ) | | | — |
| |
| Note payable to affiliate | | — |
| | | — |
| | | 116 |
| | | (116 | ) | | | — |
| |
| Pension and other postretirement benefit obligations | | — |
| | | 378 |
| | | 879 |
| | | — |
| | | 1,257 |
| |
| Deferred income tax liabilities | | — |
| | | — |
| | | 13 |
| | | — |
| | | 13 |
| |
| Other liabilities | | 5 |
| | | 24 |
| | | 39 |
| | | — |
| | | 68 |
| |
| Total liabilities | | 2,005 |
| | | 1,498 |
| | | 1,324 |
| | | (2,280 | ) | | | 2,547 |
| |
| Total equity | | 1,934 |
| | | 3,630 |
| | | 2,093 |
| | | (6,057 | ) | | | 1,600 |
| |
| Total liabilities and equity | $ | 3,939 |
| | $ | 5,128 |
| | $ | 3,417 |
| | $ | (8,337 | ) | | $ | 4,147 |
| |
RESOLUTE FOREST PRODUCTS INC.
Notes to Consolidated Financial Statements
|
| | | | | | | | | | | | | | | | | | | | |
| CONDENSED CONSOLIDATING STATEMENT OF CASH FLOWS |
| For the Year Ended December 31, 2018 |
| (In millions) | Parent | Guarantor
Subsidiaries | Non-guarantor
Subsidiaries | Consolidating
Adjustments | Consolidated |
| Net cash provided by operating activities | $ | — |
| | $ | 334 |
| | $ | 101 |
| | $ | — |
| | $ | 435 |
| |
| Cash flows from investing activities: | | | | | | | | | | | | | | | |
| Cash invested in fixed assets | | — |
| | | (51 | ) | | | (104 | ) | | | — |
| | | (155 | ) | |
| Disposition of assets | | — |
| | | 335 |
| | | 1 |
| | | — |
| | | 336 |
| |
| Decrease in countervailing duty cash deposits on supercalendered paper, net | | — |
| | | 48 |
| | | — |
| | | — |
| | | 48 |
| |
| Increase in countervailing and anti-dumping duty cash deposits on softwood lumber | | — |
| | | (77 | ) | | | — |
| | | — |
| | | (77 | ) | |
| Increase in countervailing duty cash deposits on uncoated groundwood paper | | — |
| | | (6 | ) | | | — |
| | | — |
| | | (6 | ) | |
| Advance to parent | | — |
| | | (1 | ) | | | — |
| | | 1 |
| | | — |
| |
| Increase in notes receivable from affiliate, net | | — |
| | | (135 | ) | | | — |
| | | 135 |
| | | — |
| |
| Net cash provided by (used in) investing activities | | — |
| | | 113 |
| | | (103 | ) | | | 136 |
| | | 146 |
| |
| Cash flows from financing activities: | | | | | | | | | | | | | | | |
| Net repayments under revolving credit facilities | | — |
| | | (144 | ) | | | — |
| | | — |
| | | (144 | ) | |
| Payment of special dividend | | (136 | ) | | | — |
| | | — |
| | | — |
| | | (136 | ) | |
| Payments of financing and credit facility fees | | (1 | ) | | | — |
| | | — |
| | | — |
| | | (1 | ) | |
| Advance from subsidiary | | 1 |
| | | — |
| | | — |
| | | (1 | ) | | | — |
| |
| Increase (decrease) in notes payable to affiliate | | 136 |
| | | — |
| | | (1 | ) | | | (135 | ) | | | — |
| |
| Net cash used in financing activities | | — |
| | | (144 | ) | | | (1 | ) | | | (136 | ) | | | (281 | ) | |
| Effect of exchange rate changes on cash and cash equivalents, and restricted cash | | — |
| | | — |
| | | (4 | ) | | | — |
| | | (4 | ) | |
| Net increase (decrease) in cash and cash equivalents, and restricted cash | | — |
| | | 303 |
| | | (7 | ) | | | — |
| | | 296 |
| |
| Cash and cash equivalents, and restricted cash: | | | | | | | | | | | | | | | |
| Beginning of year | | — |
| | | 3 |
| | | 46 |
| | | — |
| | | 49 |
| |
| End of year | $ | — |
| | $ | 306 |
| | $ | 39 |
| | $ | — |
| | $ | 345 |
| |
| Cash and cash equivalents, and restricted cash at year end: | | | | | | | | | | | | | | | |
| Cash and cash equivalents | $ | — |
| | $ | 301 |
| | $ | 3 |
| | $ | — |
| | $ | 304 |
| |
| Restricted cash | | — |
| | | 5 |
| | | 36 |
| | | — |
| | | 41 |
| |
RESOLUTE FOREST PRODUCTS INC.
Notes to Consolidated Financial Statements
|
| | | | | | | | | | | | | | | | | | | | |
| CONDENSED CONSOLIDATING STATEMENT OF CASH FLOWS |
| For the Year Ended December 31, 2017 |
| (In millions) | Parent | Guarantor
Subsidiaries | Non-guarantor
Subsidiaries | Consolidating
Adjustments | Consolidated |
| Net cash provided by operating activities | $ | — |
| | $ | 125 |
| | $ | 33 |
| | $ | — |
| | $ | 158 |
| |
| Cash flows from investing activities: | | | | | | | | | | | | | | | |
| Cash invested in fixed assets | | — |
| | | (116 | ) | | | (48 | ) | | | — |
| | | (164 | ) | |
| Disposition of assets | | — |
| | | — |
| | | 21 |
| | | — |
| | | 21 |
| |
| Increase in countervailing duty cash deposits on supercalendered paper | | — |
| | | (22 | ) | | | — |
| | | — |
| | | (22 | ) | |
| Increase in countervailing and anti-dumping duty cash deposits on softwood lumber | | — |
| | | (26 | ) | | | — |
| | | — |
| | | (26 | ) | |
| Decrease in notes receivable from affiliate, net | | — |
| | | 22 |
| | | — |
| | | (22 | ) | | | — |
| |
| Net cash used in investing activities | | — |
| | | (142 | ) | | | (27 | ) | | | (22 | ) | | | (191 | ) | |
| Cash flows from financing activities: | | | | | | | | | | | | | | | |
| Net borrowings under revolving credit facilities | | — |
| | | 19 |
| | | — |
| | | — |
| | | 19 |
| |
| Acquisition of noncontrolling interest in Donohue Malbaie Inc. | | — |
| | | — |
| | | (15 | ) | | | — |
| | | (15 | ) | |
| Payments of debt | | — |
| | | (1 | ) | | | — |
| | | — |
| | | (1 | ) | |
| Decrease in notes payable to affiliate, net | | — |
| | | — |
| | | (22 | ) | | | 22 |
| | | — |
| |
| Net cash provided by (used in) financing activities | | — |
| | | 18 |
| | | (37 | ) | | | 22 |
| | | 3 |
| |
| Effect of exchange rate changes on cash and cash equivalents, and restricted cash | | — |
| | | — |
| | | 6 |
| | | — |
| | | 6 |
| |
| Net increase (decrease) in cash and cash equivalents, and restricted cash | | — |
| | | 1 |
| | | (25 | ) | | | — |
| | | (24 | ) | |
| Cash and cash equivalents, and restricted cash: | | | | | | | | | | | | | | | |
| Beginning of year | | — |
| | | 2 |
| | | 71 |
| | | — |
| | | 73 |
| |
| End of year | $ | — |
| | $ | 3 |
| | $ | 46 |
| | $ | — |
| | $ | 49 |
| |
| Cash and cash equivalents, and restricted cash at year end: | | | | | | | | | | | | | | | |
| Cash and cash equivalents | $ | — |
| | $ | 3 |
| | $ | 3 |
| | $ | — |
| | $ | 6 |
| |
| Restricted cash | | — |
| | | — |
| | | 43 |
| | | — |
| | | 43 |
| |
RESOLUTE FOREST PRODUCTS INC.
Notes to Consolidated Financial Statements
|
| | | | | | | | | | | | | | | | | | | | |
| CONDENSED CONSOLIDATING STATEMENT OF CASH FLOWS |
| For the Year Ended December 31, 2016 |
| (In millions) | Parent | Guarantor
Subsidiaries | Non-guarantor
Subsidiaries | Consolidating
Adjustments | Consolidated |
| Net cash provided by operating activities | $ | — |
| | $ | 30 |
| | $ | 51 |
| | $ | — |
| | $ | 81 |
| |
| Cash flows from investing activities: | | | | | | | | | | | | | | | |
| Cash invested in fixed assets | | — |
| | | (179 | ) | | | (70 | ) | | | — |
| | | (249 | ) | |
| Acquisition of a sawmill in Senneterre | | — |
| | | — |
| | | (6 | ) | | | — |
| | | (6 | ) | |
| Disposition of assets | | — |
| | | — |
| | | 5 |
| | | — |
| | | 5 |
| |
| Increase in countervailing duty cash deposits on supercalendered paper | | — |
| | | (23 | ) | | | — |
| | | — |
| | | (23 | ) | |
| Increase in notes receivable from affiliate | | — |
| | | (8 | ) | | | — |
| | | 8 |
| | | — |
| |
| Net cash used in investing activities | | — |
| | | (210 | ) | | | (71 | ) | | | 8 |
| | | (273 | ) | |
| Cash flows from financing activities: | | | | | | | | | | | | | | | |
| Net borrowings under revolving credit facilities | | — |
| | | 125 |
| | | — |
| | | — |
| | | 125 |
| |
| Issuance of long-term debt | | — |
| | | 46 |
| | | — |
| | | — |
| | | 46 |
| |
| Payments of debt | | — |
| | | (1 | ) | | | — |
| | | — |
| | | (1 | ) | |
| Payments of financing and credit facility fees | | — |
| | | (1 | ) | | | — |
| | | — |
| | | (1 | ) | |
| Increase in notes payable to affiliate | | — |
| | | — |
| | | 8 |
| | | (8 | ) | | | — |
| |
| Net cash provided by financing activities | | — |
| | | 169 |
| | | 8 |
| | | (8 | ) | | | 169 |
| |
| Effect of exchange rate changes on cash and cash equivalents, and restricted cash | | — |
| | | — |
| | | 1 |
| | | — |
| | | 1 |
| |
| Net decrease in cash and cash equivalents, and restricted cash | | — |
| | | (11 | ) | | | (11 | ) | | | — |
| | | (22 | ) | |
| Cash and cash equivalents, and restricted cash: | | | | | | | | | | | | | | | |
| Beginning of year | | — |
| | | 13 |
| | | 82 |
| | | — |
| | | 95 |
| |
| End of year | $ | — |
| | $ | 2 |
| | $ | 71 |
| | $ | — |
| | $ | 73 |
| |
| Cash and cash equivalents, and restricted cash at year end: | | | | | | | | | | | | | | | |
| Cash and cash equivalents | $ | — |
| | $ | 2 |
| | $ | 33 |
| | $ | — |
| | $ | 35 |
| |
| Restricted cash | | — |
| | | — |
| | | 38 |
| | | — |
| | | 38 |
| |
RESOLUTE FOREST PRODUCTS INC.
Notes to Consolidated Financial Statements
Note 20.22. Quarterly Information (Unaudited)
| | | | | | | | | | | | | | | | | | | | | | | | | | | | | | | | | | | | | | | | | | | | | | | |
| 2020 |
| (In millions, except per share amounts) | First Quarter | Second Quarter | Third Quarter | Fourth Quarter | Year |
| Sales | $ | 689 | | | $ | 612 | | | $ | 730 | | | $ | 769 | | | $ | 2,800 | | |
| Operating (loss) income | $ | (8) | | | $ | 6 | | | $ | 97 | | | $ | 4 | | | $ | 99 | | |
| Net (loss) income attributable to Resolute Forest Products Inc. | $ | (1) | | | $ | 6 | | | $ | 57 | | | $ | (52) | | | $ | 10 | | |
| Basic net (loss) income per share attributable to Resolute Forest Products Inc. common shareholders | $ | (0.01) | | | $ | 0.07 | | | $ | 0.66 | | | $ | (0.63) | | | $ | 0.12 | | |
| Diluted net (loss) income per share attributable to Resolute Forest Products Inc. common shareholders | $ | (0.01) | | | $ | 0.07 | | | $ | 0.66 | | | $ | (0.63) | | | $ | 0.12 | | |
| | | | | | | | | | | | | | | | | | | | | | | | | | | | | | | | | | | | | | | | | | | | | | | |
| 2019 |
| (In millions, except per share amounts) | First Quarter | Second Quarter | Third Quarter | Fourth Quarter | Year |
| Sales | $ | 795 | | | $ | 755 | | | $ | 705 | | | $ | 668 | | | $ | 2,923 | | |
| Operating income (loss) | $ | 64 | | | $ | 40 | | | $ | (18) | | | $ | (69) | | | $ | 17 | | |
| Net income (loss) attributable to Resolute Forest Products Inc. | $ | 42 | | | $ | 25 | | | $ | (43) | | | $ | (71) | | | $ | (47) | | |
| Basic net income (loss) per share attributable to Resolute Forest Products Inc. common shareholders | $ | 0.45 | | | $ | 0.27 | | | $ | (0.47) | | | $ | (0.79) | | | $ | (0.51) | | |
| Diluted net income (loss) per share attributable to Resolute Forest Products Inc. common shareholders | $ | 0.45 | | | $ | 0.27 | | | $ | (0.47) | | | $ | (0.79) | | | $ | (0.51) | | |
|
| | | | | | | | | | | | | | | | | | | | |
| | 2018 |
| (In millions, except per share amounts) | First Quarter | Second Quarter | Third Quarter | Fourth Quarter | Year |
| Sales | $ | 874 |
| | $ | 976 |
| | $ | 974 |
| | $ | 932 |
| | $ | 3,756 |
| |
| Operating income | | 48 |
| | | 121 |
| | | 135 |
| | | 75 |
| | | 379 |
| |
| Net income attributable to Resolute Forest Products Inc. | | 10 |
| | | 72 |
| | | 117 |
| | | 36 |
| | | 235 |
| |
| Basic net income per share attributable to Resolute Forest Products Inc. common shareholders | | 0.11 |
| | | 0.79 |
| | | 1.28 |
| | | 0.39 |
| | | 2.57 |
| |
| Diluted net income per share attributable to Resolute Forest Products Inc. common shareholders | | 0.11 |
| | | 0.77 |
| | | 1.25 |
| | | 0.38 |
| | | 2.52 |
| |
|
| | | | | | | | | | | | | | | | | | | | |
| | 2017 |
| (In millions, except per share amounts) | First Quarter | Second Quarter | Third Quarter | Fourth Quarter | Year |
| Sales | $ | 872 |
| | $ | 858 |
| | $ | 885 |
| | $ | 898 |
| | $ | 3,513 |
| |
| Operating (loss) income | | (9 | ) | | | (48 | ) | | | 46 |
| | | 53 |
| | | 42 |
| |
| Net (loss) income attributable to Resolute Forest Products Inc. | | (47 | ) | | | (74 | ) | | | 24 |
| | | 13 |
| | | (84 | ) | |
| Basic net (loss) income per share attributable to Resolute Forest Products Inc. common shareholders | | (0.52 | ) | | | (0.82 | ) | | | 0.27 |
| | | 0.14 |
| | | (0.93 | ) | |
| Diluted net (loss) income per share attributable to Resolute Forest Products Inc. common shareholders | | (0.52 | ) | | | (0.82 | ) | | | 0.26 |
| | | 0.14 |
| | | (0.93 | ) | |
Note 21.23. Subsequent EventEvents
The following significant eventevents occurred subsequent to December 31, 2018:2020:
•On January 3, 2019,February 2, 2021, we repurchased $225completed the Offering of $300 million in aggregate principal amount of our 4.875% senior notes due 2026 at an issue price of 100%. The 2026 Notes are unsecured and are guaranteed by all of our current and, subject to certain conditions, future material wholly-owned U.S. subsidiaries. The Notes mature on March 1, 2026, unless earlier redeemed or repurchased, and will be recorded in “Long-term debt” in our consolidated balance sheet at their fair value of $300 million. Interest on the notes is payable semi-annually on March 1 and September 1 of each year, beginning on September 1, 2021.
We used the net proceeds of the Offering, together with cash on hand, to redeem all of the outstanding $375 million aggregate principal amount of our 5.875% senior notes due 2023, at a price of 100% of the aggregate principal amount thereof, plus accrued and unpaid interest to, but not including, the redemption date. In connection with the redemption of all $375 million aggregate principal amount of the 2023 Notes as further discussed(the “Redemption”), we placed the net proceeds of the closing of the Offering, together with additional cash, into trust for the benefit of the holders of the 2023 Notes. The Redemption occurred on February 18, 2021.
•Effective January 21, 2021, we reduced the commitment under the Canadian tranche of our senior secured asset-based revolving credit facility by $50 million, to $250 million, resulting in Note 11. Long-Term Debt – Debt instruments – 2023 Notes.an aggregate commitment of $450 million, subject to borrowing base limitations.
REPORT OF INDEPENDENT REGISTERED PUBLIC ACCOUNTING FIRM
To the Shareholders and Board of Directors of Resolute Forest Products Inc.
Opinions on the Financial Statements and Internal Control over Financial Reporting
We have audited the accompanying consolidated balance sheets of Resolute Forest Products Inc. and its subsidiaries (together, the “Company”(the “Company”) as of December 31, 20182020 and 2017,2019, and the related consolidated statements of operations, comprehensive (loss) income, (loss), changes in equity and cash flows for each of the three years in the period ended December 31, 2018,2020, including the related notes (collectively referred to as the “consolidated financial statements”). We also have audited the Company’s internal control over financial reporting as of December 31, 2018,2020, based on criteria established in Internal Control – Integrated Framework (2013) issued by the Committee of Sponsoring Organizations of the Treadway Commission (or “COSO”)(COSO).
In our opinion, the consolidated financial statements referred to above present fairly, in all material respects, the financial position of the Company as of December 31, 20182020 and 2017,2019, and theirthe results of theirits operations and theirits cash flows for each of the three years in the period ended December 31, 20182020 in conformity with accounting principles generally accepted in the United States of America. Also in our opinion, the Company maintained, in all material respects, effective internal control over financial reporting as of December 31, 2018,2020, based on criteria established in Internal Control – Integrated Framework (2013) issued by the COSO.
Basis for Opinions
The Company’s management is responsible for these consolidated financial statements, for maintaining effective internal control over financial reporting, and for its assessment of the effectiveness of internal control over financial reporting, included in the accompanying Management’s Report on Financial Statements and Assessment of Internal Control over Financial Reporting. Our responsibility is to express opinions on the Company’s consolidated financial statements and on the Company’s internal control over financial reporting based on our audits. We are a public accounting firm registered with the Public Company Accounting Oversight Board (United States) (the “PCAOB”)(PCAOB) and are required to be independent with respect to the Company in accordance with the U.S.US federal securities laws and the applicable rules and regulations of the Securities and Exchange Commission and the PCAOB.
We conducted our audits in accordance with the standards of the PCAOB. Those standards require that we plan and perform the audits to obtain reasonable assurance about whether the consolidated financial statements are free of material misstatement, whether due to error or fraud, and whether effective internal control over financial reporting was maintained in all material respects.
Our audits of the consolidated financial statements included performing procedures to assess the risks of material misstatement of the consolidated financial statements, whether due to error or fraud, and performing procedures that respond to those risks. Such procedures included examining, on a test basis, evidence regarding the amounts and disclosures in the consolidated financial statements. Our audits also included evaluating the accounting principles used and significant estimates made by management, as well as evaluating the overall presentation of the consolidated financial statements. Our audit of internal control over financial reporting included obtaining an understanding of internal control over financial reporting, assessing the risk that a material weakness exists, and testing and evaluating the design and operating effectiveness of internal control based on the assessed risk. Our audits also included performing such other procedures as we considered necessary in the circumstances. We believe that our audits provide a reasonable basis for our opinions.
As described in Management’s Report on Financial Statements and Assessment of Internal Control over Financial Reporting, management has excluded the subsidiaries acquired from Conifex Timber Inc. on February 1, 2020, the business of which consists mainly in the operation of three sawmills and related assets in Cross City (Florida) and in Glenwood and El Dorado (Arkansas), (the US Sawmill Business) from its assessment of internal control over financial reporting as of December 31, 2020 because it was acquired by the Company in a purchase business combination during 2020. We have also excluded the US Sawmill Business from our audit of internal control over financial reporting. The US Sawmill Business consists of wholly‑owned subsidiaries whose total assets and total sales excluded from management’s assessment and our audit of internal control over financial reporting represent $256 million and $137 million, respectively, of the related consolidated financial statement amounts as of and for the year ended December 31, 2020.
Definition and Limitations of Internal Control over Financial Reporting
A company’s internal control over financial reporting is a process designed to provide reasonable assurance regarding the reliability of financial reporting and the preparation of financial statements for external purposes in accordance with generally accepted accounting principles. A company’s internal control over financial reporting includes those policies and procedures that (i) pertain to the maintenance of records that, in reasonable detail, accurately and fairly reflect the transactions and dispositions of the assets of the company; (ii) provide reasonable assurance that transactions are recorded as necessary to permit preparation of financial statements in accordance with generally accepted accounting principles, and that receipts and expenditures of the company are being made only in accordance with authorizations of management and directors of the company; and (iii) provide reasonable assurance regarding prevention or timely detection of unauthorized acquisition, use, or disposition of the company’s assets that could have a material effect on the financial statements.
Because of its inherent limitations, internal control over financial reporting may not prevent or detect misstatements. Also, projections of any evaluation of effectiveness to future periods are subject to the risk that controls may become inadequate because of changes in conditions, or that the degree of compliance with the policies or procedures may deteriorate.
Critical Audit Matters
The critical audit matters communicated below are matters arising from the current period audit of the consolidated financial statements that were communicated or required to be communicated to the audit committee and that (i) relate to accounts or disclosures that are material to the consolidated financial statements and (ii) involved our especially challenging, subjective, or complex judgments. The communication of critical audit matters does not alter in any way our opinion on the consolidated financial statements, taken as a whole, and we are not, by communicating the critical audit matters below, providing separate opinions on the critical audit matters or on the accounts or disclosures to which they relate.
Long‑lived Assets Impairment Assessment for an asset group for which management identified impairment indicators
As described in notes 2, 10, 11 and 12 to the consolidated financial statements, the Company’s consolidated long‑lived assets balance was $1,564 million as of December 31, 2020 and comprised $1,441 million fixed assets, net, $63 million amortizable intangible assets, net and $60 million operating lease right‑of‑use assets. Management reviews long‑lived assets for impairment when events or changes in circumstances indicate that the carrying value of an asset group may no longer be recoverable. For asset groups that are held and used, the asset group represents the lowest level for which identifiable cash flows are largely independent of the cash flows of other asset groups. The recoverability of an asset group that is held and used is tested by comparing the carrying value of the asset group to the sum of the estimated undiscounted future cash flows expected to be generated by that asset group. The principal assumptions used by management to estimate these undiscounted future cash flows include, but are not limited to, periods of operation, projections of product pricing, production levels and sales volumes, product costs, market supply and demand, foreign exchange rates, inflation, and projected capital spending.If it is determined that an asset group is not recoverable, an impairment loss is recognized in the amount by which the asset group’s carrying value exceeds its fair value. No impairment charge was required in the current year.
The principal considerations for our determination that performing procedures relating to long‑lived assets impairment assessment for an asset group for which management identified impairment indicators is a critical audit matter are (i) the high degree of auditor judgment and subjectivity in applying procedures relating to the recoverability of the asset group being tested for impairment due to the significant judgment required by management when developing the undiscounted future cash flows and (ii) significant audit effort in evaluating the principal assumptions related to the projections of product pricing and sales volumes, product costs and projected capital spending.
Addressing the matter involved performing procedures and evaluating audit evidence in connection with forming our overall opinion on the consolidated financial statements. These procedures included testing the effectiveness of controls relating to management’s long‑lived assets impairment assessment for an asset group for which management identified impairment indicators, including controls over (i) the development of principal assumptions used in the undiscounted cash flow model and (ii) the determination of the recoverable amount of an asset group for which management identified impairment indicators. These procedures also included, among others, (i) testing management’s process for determining the recoverable amount of the asset group tested for impairment, (ii) evaluating the appropriateness of the undiscounted cash flow model, (iii) testing the completeness and accuracy of the underlying data used in the models and (iv) evaluating the reasonableness of the principal assumptions used by management, including projections of product pricing and sales volumes, product costs and projected capital spending. Evaluating the reasonableness of the principal assumptions related to projections of product pricing and sales volumes, product costs and projected capital spending involved considering the current and past performance of the asset group tested for impairment, management’s strategic plan, comparing market‑related assumptions used in the model to external market and industry data and whether these assumptions were consistent with evidence obtained in other areas of the audit.
Valuation of Fixed Assets acquired related to the US Sawmill Business
As described in notes 2 and 3 to the consolidated financial statements, in 2020 the Company completed the acquisition of certain subsidiaries, the business of which consisted mainly of three operating sawmills (the US Sawmill Business) for consideration of $173 million paid in cash. Management accounted for this transaction as a business combination using the acquisition method. Under this method, identifiable assets acquired and liabilities assumed are recorded at their respective fair values at the date of acquisition. Management recorded the acquired fixed assets at an aggregated fair value of $114 million on the date of acquisition based on both cost and market approaches. Management applied significant judgment in estimating the fair value of fixed assets acquired using the cost approach, which involved the use of principal assumptions with respect to estimated replacement and reproduction costs, estimated useful lives, and physical, functional and economic obsolescence at the time of acquisition.
The principal considerations for our determination that performing procedures relating to the valuation of fixed assets acquired related to the US Sawmill Business is a critical audit matter are (i) the high degree of auditor judgment and subjectivity in performing procedures relating to the fair value measurement of fixed assets acquired due to the significant amount of judgment required by management when developing the fair value applying the cost approach and (ii) the significant audit effort in evaluating the principal assumptions relating to this estimate, including replacement and reproduction costs, estimated useful lives and physical, functional and economic condition obsolescence at the time of acquisition. In addition, the audit effort involved the use of professionals with specialized skill and knowledge.
Addressing the matter involved performing procedures and evaluating audit evidence in connection with forming our overall opinion on the consolidated financial statements. These procedures included testing the effectiveness of controls relating to the acquisition accounting, including controls over management’s valuation of the acquired fixed assets and controls over the development of the principal assumptions used in the valuation of acquired fixed assets. These procedures also included, among others, (i) reading the securities purchase agreement, (ii) testing management’s process for estimating the fair value of the acquired fixed assets using the cost approach, (iii) testing the completeness and accuracy of underlying data used in the models, and (iv) with the assistance of professionals with specialized skill and knowledge, evaluating whether the principal assumptions were reasonable considering consistency with external market and industry data. Professionals with specialized skill and knowledge were also involved in evaluating the appropriateness of the valuation approach.
| | |
| /s/ PricewaterhouseCoopers LLP |
|
/s/ PricewaterhouseCoopers LLP / s.r.l / s.e.n.c.r.l. (1)
Montréal, Canada |
Montréal, Québec, Canada |
March 1, 20192021 |
(1) CPA auditor, CA, public accountancy permit No.A115888
|
We have served as the Company’s auditor since 2007.
MANAGEMENT’S REPORT ON FINANCIAL STATEMENTS AND ASSESSMENT OF INTERNAL CONTROL OVER FINANCIAL REPORTING
Financial Statements
Management of Resolute Forest Products Inc. is responsible for the preparation of the financial information included in this Form 10-K. The accompanying consolidated financial statements have been prepared in accordance with U.S. generally accepted accounting principles and include amounts that are based on the best estimates and judgments of management.
Assessment of Internal Control over Financial Reporting
Management is responsible for establishing and maintaining adequate internal control over financial reporting as defined in Rules 13a-15(f) and 15d-15(f) under the Securities Exchange Act of 1934. Resolute Forest Products Inc.’s internal control over financial reporting is a process designed to provide reasonable assurance regarding the reliability of financial reporting and the preparation of financial statements for external purposes in accordance with U.S. generally accepted accounting principles. Internal control over financial reporting includes those policies and procedures that:
|
| | | | |
| — | pertain to the maintenance of records that, in reasonable detail, accurately and fairly reflect the transactions and dispositions of the assets of Resolute Forest Products Inc.; |
| |
| — | provide reasonable assurance that transactions are recorded as necessary to permit preparation of financial statements in accordance with U.S. generally accepted accounting principles; |
| |
| — | provide reasonable assurance that receipts and expenditures of Resolute Forest Products Inc. are being made only in accordance with the authorizations of management and directors of Resolute Forest Products Inc.; and |
| |
| — | provide reasonable assurance regarding prevention or timely detection of unauthorized acquisition, use or disposition of assets that could have a material effect on the consolidated financial statements. |
Because of its inherent limitations, internal control over financial reporting may not prevent or detect misstatements. Projections of any evaluation of effectiveness to future periods are subject to the risk that controls may become inadequate because of changes in conditions, or that the degree of compliance with the policies or procedures may deteriorate.
Management assessed the effectiveness of Resolute Forest Products Inc.’s internal control over financial reporting as of December 31, 2018.2020. Management based this assessment on the criteria for effective internal control over financial reporting described in Internal Control – Integrated Framework(2013)issued by the Committee of Sponsoring Organizations of the Treadway Commission. Management has elected to exclude from its assessment of internal control over financial reporting as of December 31, 2020, the subsidiaries acquired from Conifex Timber Inc. on February 1, 2020, the business of which consists mainly in the operation of three sawmills and related assets in Cross City and in Glenwood and El Dorado, included in our consolidated financial statements with sales and assets of $137 million and $256 million, respectively, for the year ended December 31, 2020 because it was acquired by the Company in a purchase business combination during 2020.Management’s assessment included an evaluation of the design of Resolute Forest Products Inc.’s internal control over financial reporting and testing of the operational effectiveness of its internal control over financial reporting. Management reviewed the results of its assessment with the Audit Committeeaudit committee of our Boardboard of Directors.directors.
Based on this assessment, management determined that, as of December 31, 2018,2020, Resolute Forest Products Inc.’s internal control over financial reporting was effective.
The effectiveness of Resolute Forest Products Inc.’s internal control over financial reporting as of December 31, 2018,2020, has been audited by PricewaterhouseCoopers LLP, an independent registered public accounting firm, as stated in their report above.
| |
ITEM 9. | CHANGES IN AND DISAGREEMENTS WITH ACCOUNTANTS ON ACCOUNTING AND FINANCIAL DISCLOSURE |
ITEM 9. CHANGES IN AND DISAGREEMENTS WITH ACCOUNTANTS ON ACCOUNTING AND FINANCIAL DISCLOSURE
None.
ITEM 9A. CONTROLS AND PROCEDURES
Evaluation of Disclosure Controls and Procedures
Disclosure controls and procedures as defined in Exchange Act Rules 13a-15(e) and 15d-15(e) are our controls and other procedures that are designed to ensure that information required to be disclosed by us in the reports that we file or submit under the Exchange Act is recorded, processed, summarized and reported within the time periods specified in the SEC’s rules and forms. Disclosure controls and procedures include, without limitation, controls and procedures designed to ensure that information required to be disclosed by us in the reports that we file or submit under the Exchange Act is accumulated and communicated to our management, including our Presidentpresident and Chief Executive Officerchief executive officer and Senior Vice President and Chief Financial Officer,chief financial officer, as appropriate to allow timely decisions regarding required disclosure.
We have evaluated the effectiveness of the design and operation of our disclosure controls and procedures, as defined in Rules 13a-15(e) and 15d-15(e) of the Securities Exchange Act of 1934, as of December 31, 2018.2020. Based on that evaluation, the Presidentpresident and Chief Executive Officerchief executive officer and the Senior Vice President and Chief Financial Officerchief financial officer concluded that our disclosure controls and procedures were effective as of such date in recording, processing, summarizing and timely reporting information required to be disclosed in our reports to the SEC.
Management’s Report on Internal Control over Financial Reporting
Management has issued its report on internal control over financial reporting, which included management’s assessment that the Company’s internal control over financial reporting was effective as of December 31, 2018.2020. Management’s report on internal control over financial reporting can be found on page 127116 of this Form 10-K. Our independent registered public accounting firm, PricewaterhouseCoopers LLP, has issued an attestation report on the effectiveness of internal control over financial reporting as of December 31, 2018.2020. This report can be found on page 125113 of this Form 10-K.
Changes in Internal Control over Financial Reporting
In connection with the evaluation of internal control over financial reporting, there were no changes during the quarter ended December 31, 2018,2020, that have materially affected, or are reasonably likely to materially affect, our internal control over financial reporting.
ITEM 9B. OTHER INFORMATION
None.
PART III
ITEM 10. DIRECTORS, EXECUTIVE OFFICERS AND CORPORATE GOVERNANCE
The information appearing under the captions entitled “Management Proposals – Vote on the Election of Directors,” “Section 16 Beneficial Ownership Reporting Compliance,“Delinquent Section 16(a) Reports,” and “Corporate Governance and Board Matters” in our definitive proxy statement for our 20192021 annual meeting of shareholders to be held on May 24, 201921, 2021 (or, our “20192021 proxy statement”), which will be filed within 120 days of the end of our fiscal year ended December 31, 2018,2020, is incorporated herein by reference.
Information regarding our executive officers is presented in Part I, Item 1, “Business – Executive Officers,” of this Form 10-K.10-K and is incorporated by reference herein.
We have adopted a code of ethics that applies to our principal executive officer, principal financial officer and principal accounting officer. This code of ethics (which is entitled “Code of Business Conduct”) and our corporate governance policies are posted on our website at www.resolutefp.com. We intend to satisfy disclosure requirements regarding amendments to or waivers from our code of ethics by posting such information on this website. The charters of the Audit Committee and the Human Resources and Compensation/Nominating and Governance Committee of our Board of Directors are available on our website as well. This information is also available in print free of charge to any person who requests it.
ITEM 11. EXECUTIVE COMPENSATION
The information appearing under the captions entitled “Executive Compensation,” “Corporate Governance and Board Matters,” “Director Compensation,” and “Compensation Committee Interlocks and Insider Participation” in our 20192021 proxy statement is incorporated herein by reference.
| |
ITEM 12. | SECURITY OWNERSHIP OF CERTAIN BENEFICIAL OWNERS AND MANAGEMENT AND RELATED STOCKHOLDER MATTERS |
ITEM 12. SECURITY OWNERSHIP OF CERTAIN BENEFICIAL OWNERS AND MANAGEMENT AND RELATED STOCKHOLDER MATTERS
The information appearing under the caption entitled “Information on Stock Ownership” in our 20192021 proxy statement is incorporated herein by reference.
Equity Compensation Plan Information
The following table provides information as of December 31, 2018,2020, regarding securities to be issued upon exercise of outstanding stock options or pursuant to outstanding stock unit awards, and securities remaining available for issuance under our equity compensation plan.plans. The Incentive Plan isPlans are the only compensation planplans with shares authorized.
| | | | | | | | | | | | | | | | | | | | | | | |
| Plan category | (a)
Number of securities to be issued upon exercise of outstanding options, warrants and rights | (b)
Weighted-average exercise price of outstanding options, warrants and rights | (c)
Number of securities remaining available for future issuance under equity compensation plans (excluding securities reflected in column (a)) |
| Equity compensation plans approved by security holders | 3,012,924 | | (1) | $ | — | | | 2,211,394 | | |
Equity compensation plans not approved by security holders (2) | 2,043,813 | | (3) | $ | 16.09 | | (4) | — | | |
| Total | 5,056,737 | | | $ | 16.09 | | | 2,211,394 | | |
(1)Includes shares issuable upon the exercise of 1,087,568 RSUs issued under the 2019 Incentive Plan, at a rate of one share per unit. Also includes shares issuable upon the settlement of 1,241,295 PSUs issued under the 2019 Incentive Plan at the maximum payout rate (1,925,356 shares).
(2)The Incentive Plan was approved by the Courts in connection with the CCAA Creditor Protection Proceedings, and the creditor protection proceedings under Chapter 11 of the United States Bankruptcy Code, as amended, as applicable.
(3)Includes shares issuable upon the exercise of 912,901 stock options and shares issuable upon the settlement of 416,615 RSUs and DSUs issued under the Incentive Plan, at a rate of one share per unit. Also includes shares issuable upon the settlement of 554,107 PSUs issued under the Incentive Plan at the maximum payout rate (714,297 shares).
(4)The weighted-average exercise price in column (b) represents the weighted-average exercise price of the outstanding stock options disclosed in column (a). The stock unit awards do not have an exercise price and are not included in the calculation of the weighted-average exercise price in column (b).
|
| | | | | | | | | | |
| Plan category | (a) Number of securities to be issued upon exercise of outstanding options, warrants and rights | (b)
Weighted-average exercise price of outstanding options, warrants and rights | (c) Number of securities remaining available for future issuance under equity compensation plans (excluding securities reflected in column (a)) |
| Equity compensation plans approved by security holders | — |
| | $ | — |
| | — |
| |
Equity compensation plans not approved by security holders (1) | 6,227,695 |
| (2) | | 16.30 |
| (3) | 912,797 |
| |
| Total | 6,227,695 |
| | $ | 16.30 |
| | 912,797 |
| |
| |
(1)
| The Incentive Plan was approved by the Courts in connection with the CCAA Creditor Protection Proceedings, and the creditor protection proceedings under Chapter 11 of the United States Bankruptcy Code, as amended, as applicable. |
| |
(2)
| Includes shares issuable upon the exercise of 1,065,021 stock options and shares issuable upon the settlement of 1,804,409 RSUs and DSUs issued under the Incentive Plan, at a rate of one share per unit. Also includes shares issuable upon the settlement of 2,382,174 PSUs issued under the Incentive Plan at the maximum payout rate (3,358,265 shares). |
| |
(3)
| The weighted-average exercise price in column (b) represents the weighted-average exercise price of the outstanding stock options disclosed in column (a). The stock unit awards do not have an exercise price and are not included in the calculation of the weighted-average exercise price in column (b). |
ITEM 13. CERTAIN RELATIONSHIPS AND RELATED TRANSACTIONS, AND DIRECTOR INDEPENDENCE
The information appearing under the captions entitled “Related Party Transactions” and “Corporate Governance and Board Matters – Director Independence” in our 20192021 proxy statement is incorporated herein by reference.
ITEM 14. PRINCIPAL ACCOUNTING FEES AND SERVICES
The information appearing under the caption entitled “Management Proposals – Vote on the Ratification of the Appointment of PricewaterhouseCoopers LLP” in our 20192021 proxy statement is incorporated herein by reference.
PART IV
ITEM 15. EXHIBITS, FINANCIAL STATEMENT SCHEDULES
(a) The following are filed as a part of this Form 10-K:
(1) The following are included at the indicated page of this Form 10-K:
(2) Exhibits (numbered in accordance with Item 601 of Regulation S-K):
| | | | | |
| Exhibit No. | Description |
| |
Exhibit No. | Description |
| |
#2.1* | |
| |
#2.2* | |
| |
#2.3* | |
| |
3.1* | Securities Purchase Agreement, dated December 23, 2019, among Conifex USA Inc., Conifex Holdco LLC, Conifex Timber Inc. and Resolute FP US Inc.(incorporated by reference from Exhibit 2.1 to Resolute Forest Products Inc.’s Current Report on Form 8-K filed on December 27, 2019, SEC File No. 001-33776). |
| |
| Amended and Restated Certificate of Incorporation of Resolute Forest ProductProducts Inc. (incorporated by reference from Exhibit 3.1 to Resolute Forest Product Inc.’s Annual Report on Form 10-K for the year ended December 31, 2012, filed March 1, 2013, SEC File No. 001-33776). |
| |
3.2* | |
| |
4.1* | Description of the Securities Registered under Section 12 of the Securities Exchange Act of 1934. |
| |
| Indenture, dated as of May 8, 2013,February 2, 2021. among Resolute Forest Products Inc., the guarantors party thereto and Wells Fargo Bank, National Association, as trustee. (incorporated by reference from Exhibit 4.4 to Resolute Forest Products Inc.’s Quarterly Report on Form 10-Q for the quarter ended March 31, 2013, filed May 10, 2013, SEC File No. 001-33776). |
| |
4.2* | Supplemental Indenture, dated as of January 12, 2018 (to the Indenture dated as of May 8, 2013), by and among Resolute Forest Products Inc., certain subsidiary guarantors, and Wells Fargo Bank, N.A., as trustee (incorporated by reference from exhibit 10.1 to Resolute Forest Products Inc.’s Current Report on Form 8-K filed January 12, 2018, SEC File No. 001-33776). |
| |
4.3* | Registration Rights Agreement, dated as of May 8, 2013, among Resolute Forest Products Inc., the guarantors party thereto and Merrill Lynch, Pierce, Fenner & Smith Incorporated, as representative. (incorporated by reference from Exhibit 4.5 to Resolute Forest Products Inc.’s Quarterly Report on Form 10-Q for the quarter ended March 31, 2013, filed May 10, 2013, SEC File No. 001-33776). |
| |
|
| |
Exhibit No. | Description |
10.1* | Securities Purchase Agreement, dated February 11, 2011, among AbiBow Canada Inc., Caisse de dépôt et placement du Québec and CDP Investissements Inc., as vendors, and Infra H2O GP Partners Inc., Infra H2O LP Partners Inc. and BluEarth Renewables Inc., as the purchaser (incorporated by reference from Exhibit 2.1 to AbitibiBowater Inc.’s Current Report on Form 8-K filed February 17, 2011, SEC File No. 001-33776). |
| |
†10.2* | |
| |
†10.3* | |
| |
†10.4* | |
| |
†10.5* | |
| |
†10.6* | |
| |
†10.7* | |
| |
10.8* | |
| |
10.9* | |
| |
†10.10* | |
| |
†10.11* | |
| |
†10.12* | |
| |
†10.13* | |
| |
†10.14* | |
| |
†10.15* | |
| |
†10.16* | |
|
| |
Exhibit No. | Description |
| |
†10.17* | |
| |
†10.18* | |
| |
†10.19* | |
| |
†10.20* | |
| |
†10.21* | |
| |
10.22* | Credit Agreement, dated as of May 22, 2015, among Resolute Forest Products Inc., Resolute FP Canada Inc., certain other subsidiaries of Resolute Forest Products Inc. as borrowers or guarantors, various lenders, Bank of America, N.A., as U.S. Administrative Agent and Collateral Agent, and Bank of America, N.A. (through its Canada branch), as Canadian Administrative Agent (incorporated by reference from Exhibit 10.1 to Resolute Forest Products Inc.’s Current Report on Form 8-K filed May 26, 2015, SEC file No. 001-033776). |
| |
10.23* | Amended and Restated Credit Agreement, dated as of September 7, 2016,October 28, 2019, among Resolute Forest Products Inc., certain U.S. subsidiaries of Resolute Forest Products Inc. as borrowers and guarantors, various lenders, and American AgCredit, PCA,FLCA, as administrative agent and collateral agent (incorporated by reference from Exhibit 10.1 to Resolute Forest Products Inc.’s Current Report on Form 8-K filed October 30, 2019, SEC file No. 001-33776). |
| |
| | | | | |
| Exhibit No. | Description |
| Second Amendment to the Credit Agreement, dated as of May 14, 2019, among Resolute Forest Products Inc., Resolute FP Canada Inc., certain other subsidiaries of Resolute Forest Products Inc. as borrowers or guarantors, various lenders, Bank of America, N.A., as U.S. Administrative Agent and Collateral Agent, and Bank of America, N.A. (through its Canada branch), as Canadian Administrative Agent (incorporated by reference from Exhibit 10.1 to Resolute Forest Products Inc.’s Current Report on Form 8-K filed May 20, 2019, SEC file No. 001-33776). |
| |
| Secured Delayed Draw Term Loan Facility, dated as of November 4, 2020, among Resolute FP Canada Inc., a subsidiary of Resolute Forest Products Inc. as borrower, and Investissement Quebec, as lender. |
| |
| AbitibiBowater 2010 Canadian DB Supplemental Executive Retirement Plan, effective as of December 9, 2010 (incorporated by reference from Exhibit 10.4 to AbitibiBowater Inc.’s Annual Report on Form 10-K for the year ended December 31, 2010, filed April 5, 2011, SEC File No. 001-33776). |
| |
| AbitibiBowater Inc. 2010 Equity Incentive Plan Form of Director Nonqualified Stock Option Agreement (incorporated by reference from Exhibit 10.3 to AbitibiBowater Inc.’s Registration Statement on Form S-8 filed January 7, 2011, SEC Registration No. 333-171602). |
| |
| AbitibiBowater Inc. 2010 Equity Incentive Plan Form of Employee Nonqualified Stock Option Agreement (incorporated by reference from Exhibit 10.4 to AbitibiBowater Inc.’s Registration Statement on Form S-8 filed January 7, 2011, SEC Registration No. 333-171602). |
| |
| AbitibiBowater Inc. 2010 Equity Incentive Plan Form of Employee Nonqualified Stock Option Agreement (incorporated by reference from Exhibit 10.14 to AbitibiBowater Inc.’s Annual Report on Form 10-K for the year ended December 31, 2011, filed February 29, 2012, SEC File No. 001-33776). |
| |
| AbitibiBowater Executive Restricted Stock Unit Plan, effective as of April 1, 2011 (incorporated by reference from Exhibit 10.13 to AbitibiBowater Inc.’s Annual Report on Form 10-K for the year ended December 31, 2010, filed April 5, 2011, SEC File No. 001-33776). |
| |
| Retirement Compensation Trust Agreement (with Letter of Credit) between AbiBow Canada Inc. and AbitibiBowater Inc. and CIBC Mellon Trust Company, dated and effective as of November 1, 2011 (incorporated by reference from Exhibit 10.39 to AbitibiBowater Inc.’s Annual Report on Form 10-K for the year ended December 31, 2011, filed February 29, 2012, SEC File No. 001-33776). |
| |
| Agreement Concerning the Pulp and Paper Operations of AbiBow Canada in Ontario, dated November 10, 2010, between Bowater Canadian Forest Products Inc. and Abitibi-Consolidated Company of Canada and The Province of Ontario (incorporated by reference from Exhibit 10.32 to AbitibiBowater Inc.’s Annual Report on Form 10-K for the year ended December 31, 2010, filed April 5, 2011, SEC File No. 001-33776). |
| |
| Agreement Concerning the Pulp and Paper Operations of AbiBow Canada in Quebec, dated September 13, 2010, between Bowater Canadian Forest Products Inc. and Abitibi-Consolidated Company of Canada and The Government of Quebec (incorporated by reference from Exhibit 10.33 to AbitibiBowater Inc.’s Annual Report on Form 10-K for the year ended December 31, 2010, filed April 5, 2011, SEC File No. 001-33776). |
| |
| Offer Letter between Jacques Vachon and AbitibiBowater Inc., dated March 19, 2012 (incorporated by reference from Exhibit 10.2 to AbitibiBowater Inc.’s Quarterly Report on Form 10-Q for the quarter ended March 31, 2012, filed May 10, 2012, SEC File No. 001-33776). |
| |
| Resolute Forest Products DC Make-up Program, effective January 1, 2012 (incorporated by reference from Exhibit 10.3 to AbitibiBowater Inc.’s Quarterly Report on Form 10-Q for the quarter ended March 31, 2012, filed May 10, 2012, SEC File No. 001-33776). |
| |
| Resolute Forest Products Inc. Severance Policy – Chief Executive Officer and Direct Reports, effective as of August 1, 2012 (incorporated by reference from Exhibit 10.1 to Resolute Forest Products Inc.’s Quarterly Report on Form 10-Q for the quarter ended SeptemberJune 30, 2016,2012, filed NovemberAugust 9, 2016,2012, SEC File No. 001-33776). |
| |
| Resolute Forest Products Equity Incentive Plan (previously named the AbitibiBowater Inc. 2010 Equity Incentive Plan), effective as of December 9, 2010 (incorporated by reference from Exhibit 10.2 to Resolute Forest Products Inc.’s Quarterly Report on Form 10-Q for the quarter ended September 30, 2012, filed November 9, 2012, SEC File No. 001-33776). |
| |
| Resolute Forest Products Outside Director Deferred Compensation Plan (previously named the AbitibiBowater Inc. Outside Director Deferred Compensation Plan), effective as of April 1, 2011 (incorporated by reference from Exhibit 10.3 to Resolute Forest Products Inc.’s Quarterly Report on Form 10-Q for the quarter ended September 30, 2012, filed November 9, 2012, SEC File No. 001-33776). |
| |
| Form of Indemnification Agreement for Directors and Officers of Resolute Forest Products Inc. (incorporated by reference from Exhibit 10.41 to Resolute Forest Products Inc.’s Annual Report on Form 10-K for the year ended December 31, 2012, filed March 1, 2013, SEC File No. 001-33776). |
| |
| | | | | |
| Exhibit No. | Description |
| Resolute Forest Products Equity Incentive Plan Form of Employee Nonqualified Stock Option Agreement (incorporated by reference from Exhibit 10.41 to Resolute Forest Products Inc.’s Annual Report on Form 10-K for the year ended December 31, 2013, filed March 3, 2014, SEC File No. 001-33776). |
| |
| Offer Letter between Richard Tremblay and Resolute Forest Products Inc., dated February 4, 2014 (incorporated by reference from Exhibit 10.43 to Resolute Forest Products Inc.’s Annual Report on Form 10-K for the year ended December 31, 2013, filed March 3, 2014, SEC File No. 001-33776). |
| |
| First Amendment dated February 14, 2014 to the AbitibiBowater 2010 Canadian DB Supplemental Executive Retirement Plan, effective as of December 9, 2010 (incorporated by reference from Exhibit 10.44 to Resolute Forest Products Inc.’s Annual Report on Form 10-K for the year ended December 31, 2014, filed March 2, 2015, SEC File No. 001-33776). |
| |
| Resolute FP Canada Inc. and Resolute Forest Products Inc. Security Protocol with respect to the Resolute Forest Products 2010 Canadian DB Supplemental Executive Retirement Plan and the Resolute Canada SERP, amended and restated effective April 11, 2014 (incorporated by reference from Exhibit 10.45 to Resolute Forest Products Inc.’s Annual Report on Form 10-K for the year ended December 31, 2014, filed March 2, 2015, SEC File No. 001-33776). |
| |
| Form of Indemnification Agreement for Directors and Officers of Resolute Forest Products Inc. (incorporated by reference from Exhibit 10.46 to Resolute Forest Products Inc.’s Annual Report on Form 10-K for the year ended December 31, 2014, filed March 2, 2015, SEC File No. 001-33776). |
| |
| Resolute Forest Products Equity Incentive Plan Form of Director Deferred Stock Unit Agreement (incorporated by reference from Exhibit 10.39 to Resolute Forest Products Inc.’s Annual Report on Form 10-K for the year ended December 31, 2016, filed March 1, 2017, SEC File No. 001-33776). |
| |
| |
| |
| |
| |
| Guarantee Agreement, entered into on February 21, 2017, and dated as of June 18, 2014, between Resolute FP Canada Inc. and Resolute FP US Inc. as Guarantors, and Jacques Vachon as the Guaranteed Party (incorporated by reference from Exhibit 10.42 to Resolute Forest Products Inc.’s Annual Report on Form 10-K for the year ended December 31, 2016, filed March 1, 2017, SEC File No. 001-33776). |
| |
| |
| |
†10.29* | |
| |
†10.30* | |
| |
|
| |
Exhibit No. | Description |
†10.31* | |
| |
†10.32* | |
| |
†10.33* | |
| |
| |
| |
| |
| |
| |
| |
| |
| |
| |
| |
†10.39* | |
| |
| | | | | |
†10.40*Exhibit No. | Description |
| Offer Letter between Remi Lalonde and Resolute Forest Products Inc., dated January 30, 2019 (incorporated by reference from Exhibit 10.46 to Resolute Forest Products Inc.’s Annual Report on Form 10-K for the year ended December 31, 2018, filed March 1, 2019, SEC File No. 001-33776). |
| |
| Form of Resolute Forest Products Equity Incentive Plan Director Cash-Settled Deferred Stock Unit Agreement (incorporated by reference from Exhibit 10.47 to Resolute Forest Products Inc.’s Annual Report on Form 10-K for the year ended December 31, 2018, filed March 1, 2019, SEC File No. 001-33776). |
| |
| Form of Resolute Forest Products Equity Incentive Plan Director Cash-Settled Restricted Stock Unit Agreement (incorporated by reference from Exhibit 10.48 to Resolute Forest Products Inc.’s Annual Report on Form 10-K for the year ended December 31, 2018, filed March 1, 2019, SEC File No. 001-33776). |
| |
| Form of First Amendment to the Resolute Forest Products Equity Incentive Plan Director Deferred Stock Unit Agreement (incorporated by reference from Exhibit 10.51 to Resolute Forest Products Inc.’s Annual Report on Form 10-K for the year ended December 31, 2018, filed March 1, 2019, SEC File No. 001-33776). |
| |
| Form of First Amendment to the Resolute Forest Products Equity Incentive Plan Director Restricted Stock Unit Agreement (incorporated by reference from Exhibit 10.52 to Resolute Forest Products Inc.’s Annual Report on Form 10-K for the year ended December 31, 2018, filed March 1, 2019, SEC File No. 001-33776). |
| |
| 2020 Resolute Forest Products Inc. Short-Term Incentive Plan – U.S. (incorporated by reference from Exhibit 10.1 to Resolute Forest Products Inc.’s Quarterly Report on Form 10-Q for the quarter ended June 30, 2018,2020, filed August 9, 2018,10, 2020, SEC File No. 001-33776). |
| |
| |
| |
| |
| |
10.43** | ’s Quarterly Report on Form 10-Q for the quarter ended June 30, 2019, filed August 9, 2019, SEC File No. 001-33776). |
| |
| |
| |
†10.45** | |
| |
†10.46** | |
| |
†10.47** | Agreement (incorporated by reference from Exhibit 10.2 to Resolute Forest Products Inc.’s Quarterly Report on Form 10-Q for the quarter ended September 30, 2019, filed November 12, 2019, SEC File No. 001-33776). |
| |
| Agreement (incorporated by reference from Exhibit 10.49 to Resolute Forest Products Inc.’s Annual Report on Form 10-K for the year ended December 31, 2018, filed March 1, 2019, SEC File No. 001-33776). |
| |
| |
| |
| |
| |
| Summary of 2021 Resolute Forest Products Inc. Short-Term Incentive Plan (incorporated by reference from the description in Resolute Forest Products Inc.’s Current Report on Form 8-K filed February 9, 2021, SEC File No. 001-33776). |
| |
†10.48| Offer letter between John Lafave and AbitibiBowater Inc., dated February 14, 2011 (incorporated by reference from Exhibit 10.29 to AbitibiBowater Inc’s Annual Report on Form 10-K for the year ended December 31, 2010, filed April 5, 2011, SEC File No. 001-33776). | | | | Letter Agreement between Yves Laflamme and Resolute Forest Products Inc., dated February 8, 2021. | | | | | Exhibit No. | Description | | | †10.51** | | | Offer Letter between Sylvain A. Girard and Resolute Forest Products Inc., dated January 15, 2021. | | | | First Amendment to the Resolute Forest Products Inc. 2019 Equity Incentive Plan Director Deferred Stock Unit Agreement. | | | †10.52** | Inc.’s Registration Statement on Form S-8 filed August 5, 2020, SEC Registration No. 333-241026). | | | †10.53** | | | | †10.54** | | | | 21.1** | | | | 23.1** | Guarantor subsidiaries of the registrant. | | | | Consent of PricewaterhouseCoopers LLP. | | | 24.1** | |
| | | | | | | Exhibit No. | Description | 31.1** | | | Certification of President and Chief Executive Officer Pursuant to Section 302 of the Sarbanes-Oxley Act of 2002. | | | 31.2** | | | | 32.1** | | | | 32.2** | | | | 99.1*101.INS* | | | | 101.INS*** | XBRL Instance Document. | | | 101.SCH*** | XBRL Taxonomy Extension Schema Document. | | | 101.CAL*** | XBRL Taxonomy Extension Calculation Linkbase Document. | | | 101.LAB*** | XBRL Taxonomy Extension Label Linkbase Document. | | | 101.PRE*** | XBRL Taxonomy Extension Presentation Linkbase Document. | | | 101.DEF*** | XBRL Taxonomy Extension Definition Linkbase Document. |
| | | | * | Previously filed and incorporated herein by reference. | | | # | | | | | | | | | | | | | | | | | | | | | | | | | | | | | | | | | | | | | | | | | | | |
| | | | | | | | | | | # | Schedules and exhibits have been omitted pursuant to Item 601(b)(2) of Regulation S-K. A copy of any omitted schedule or exhibit will be furnished supplementally to the SEC upon request; provided, however, that the registrant may request confidential treatment pursuant to Rule 24b-2 of the Securities Exchange Act, as amended, for any schedules or exhibits so furnished. | | | | † | This is a management contract or compensatory plan or arrangement. | | | ** | Filed with this Form 10-K. | | | *** | Interactive data files furnished with this Form 10-K, which represent the following materials from this Form 10-K formatted in XBRL (eXtensible Business Reporting Language): (i) the Consolidated Statements of Operations, (ii) the Consolidated Statements of Comprehensive (Loss) Income, (Loss), (iii) the Consolidated Balance Sheets, (iv) the Consolidated Statement of Changes in Equity, (v) the Consolidated Statements of Cash Flows, and (vi) the Notes to Consolidated Financial Statements. The instance document does not appear in the Interactive Data File because its XBRL tags are embedded within the inline XBRL document. | | | | (b) | The above-referenced exhibits are being filed with this Form 10-K. | | | | (c) | None. |
ITEM 16. FORM 10-K SUMMARY None.
SIGNATURES Pursuant to the requirements of Section 13 or 15(d) of the Securities Exchange Act of 1934, the Registrant has duly caused this report to be signed on its behalf by the undersigned, thereunto duly authorized. | | | | | | | | | | RESOLUTE FOREST PRODUCTS INC. | | | | | RESOLUTE FOREST PRODUCTS INC. | | | | Date: March 1, 20192021 | By: | /s/ Yves LaflammeRemi G. Lalonde | | | Yves LaflammeRemi G. Lalonde | | | President and Chief Executive Officer |
Pursuant to the requirements of the Securities Exchange Act of 1934, this report has been signed below by the following persons on behalf of the Registrant and in the capacities and on the dates indicated. | | | | | | | | | | | | | | | | Signature | | Title | | Date | | | | | | | /s/ Remi G. Lalonde | | President and Chief Executive Officer | | March 1, 2021 | | Remi G. Lalonde | | (Principal Executive Officer) | | | | | | | | | /s/ Bradley P. Martin* | | Chairman, Director | | March 1, 2021 | | Bradley P. Martin | | | | | | | | | | Signature | | Title | | Date | | | | | | /s/ Yves Laflamme | | President and Chief Executive Officer | | March 1, 2019 | Yves Laflamme | | (Principal Executive Officer) | | | | | | | | /s/ Bradley P. Martin* | | Chairman, Director | | March 1, 2019 | Bradley P. Martin | | | | | | | | | | | /s/ Remi G. Lalonde | | Senior Vice President and Chief Financial Officer | | March 1, 20192021 | | Remi G. Lalonde | | (Principal Financial Officer) | | | | | | | | | /s/ Hugues Dorban | | Vice President and Chief Accounting Officer | | March 1, 20192021 | | Hugues Dorban | | (Principal Accounting Officer) | | | | | | | | | /s/ Randall C. Benson* | | Director | | March 1, 20192021 | | Randall C. Benson | | | | | | | | | | | /s/ Suzanne Blanchet* | | Director | | March 1, 20192021 | | Suzanne Blanchet | | | | | | | | | | | /s/ Jennifer C. Dolan* | | Director | | March 1, 20192021 | | Jennifer C. Dolan | | | | | | | | | | /s/ Richard D. Falconer* | | Director | | March 1, 2019 | Richard D. Falconer | | | | | | | | | | /s/ Jeffrey A. Hearn* | | Director | | March 1, 2019 | Jeffrey A. Hearn | | | | | | | | | | | /s/ Alain Rhéaume* | | Director | | March 1, 20192021 | | Alain Rhéaume | | | | | | | | | | | /s/ Michael S. Rousseau* | | Director | | March 1, 20192021 | | Michael S. Rousseau | | | | |
* Remi G. Lalonde, by signing his name hereto, does sign this document on behalf of the persons indicated above pursuant to powers of attorney duly executed by such persons that are filed herewith as Exhibit 24.1. | | | | | | | | | | By: | /s/ Remi G. Lalonde | | | Remi G. Lalonde, Attorney-in-Fact |
|