UNITED STATES SECURITIES AND EXCHANGE COMMISSION
Washington, D.C. 20549
FORM 10-K
(Mark One)
☒ANNUAL REPORT PURSUANT TO SECTION 13 OR 15(d) OF THE SECURITIES EXCHANGE ACT OF 1934
For the year ended December 31, 20192022
☐ TRANSITION REPORT PURSUANT TO SECTION 13 OR 15(d) OF THE SECURITIES EXCHANGE ACT OF 1934
For the transition period from to
Commission File Number 001-33378
DISCOVER FINANCIAL SERVICES
(Exact name of registrant as specified in its charter)
Delaware
(State or other jurisdiction of incorporation or organization)
36-2517428
(I.R.S. Employer Identification No.)
2500 Lake Cook Road, Riverwoods, Illinois 60015
(Address of principal executive offices, including zip code)
(224) 405-0900
(Registrant’s telephone number, including area code)
| Securities registered pursuant to Section 12(b) of the Act: | ||||||||
| Title of each class | Trading Symbol(s) | Name of each exchange on which registered | ||||||
| Common Stock, par value $0.01 per share | DFS | New York Stock Exchange | ||||||
| Securities registered pursuant to Section 12(g) of the Act: None | ||||||||
Indicate by check mark if the registrant is a well-known seasoned issuer, as defined in Rule 405 of the Securities Act. Yes ☒ No ☐
Indicate by check mark if the registrant is not required to file reports pursuant to Section 13 or Section 15(d) of the Exchange Act. Yes ☐ No ☒
Indicate by check mark whether the registrant (1) has filed all reports required to be filed by Section 13 or 15(d) of the Securities Exchange Act of 1934 during the preceding 12 months (or for such shorter period that the registrant was required to file such reports), and (2) has been subject to such filing requirements for the past 90 days. Yes ☒ No ☐
Indicate by check mark whether the registrant has submitted electronically every Interactive Data File required to be submitted pursuant to Rule 405 of Regulation S-T (§232.405 of this chapter) during the preceding 12 months (or for such shorter period that the registrant was required to submit such files). Yes ☒ No ☐
Indicate by check mark whether the registrant is a large accelerated filer, an accelerated filer, a non-accelerated filer, or a smaller reporting company. See the definitions of “large accelerated filer,” “accelerated filer” and “smaller reporting company” in Rule 12b-2 of the Exchange Act.
| Large Accelerated Filer | ☒ | Accelerated Filer | ☐ | Smaller Reporting Company | ☐ | |||||||||||||
| Non-accelerated Filer | ☐ | |||||||||||||||||
| Emerging Growth Company | ☐ | |||||||||||||||||
If an emerging growth company, indicate by check mark if the registrant has elected not to use the extended transition period for complying with any new or revised financial accounting standards provided pursuant to Section 13(a) of the Exchange Act.☐
Indicate by check mark whether the registrant has filed a report on and attestation of the effectiveness of its internal control over financial reporting under Section 404(b) of Sarbanes-Oxley Act (15 U.S.C. 7262(b)) by the registered public accounting firm that prepared or issued its audit report. ☒
If securities are registered pursuant to Section 12(b) of the Act, indicate by check mark whether the financial statements of the registrant included in the filing reflect the correction of an error to previously issued financial statements. ☐
Indicate by check mark whether any of those error corrections are restatements that required a recovery analysis of incentive-based compensation received by any of the registrant’s executive officers during the relevant recovery period pursuant to §240.10D-1(b). ☐
Indicate by check mark whether the registrant is a shell company (as defined in Rule 12b-2 of the Exchange Act). Yes ☐ No ☒
The aggregate market value of the common equity held by non-affiliates of the registrant on the last business day of the registrant’s most recently completed second fiscal quarter was approximately $24,729,798,496.
As of February 21, 2020,17, 2023, there were 308,337,638261,934,442 shares of the registrant’s Common Stock, par value $0.01 per share, outstanding.
DOCUMENTS INCORPORATED BY REFERENCE
Portions of the registrant’s definitive proxy statement for its annual stockholders’ meeting to be held on May 14, 202011, 2023 are incorporated by reference in Part III of this Form 10-K.
DISCOVER FINANCIAL SERVICES
Annual Report on Form 10-K for the year ended December 31, 20192022
TABLE OF CONTENTS
Except as otherwise indicated or unless the context otherwise requires, “Discover Financial Services,” “Discover,” “DFS,” “we,” “us,” “our,” and “the Company” refer to Discover Financial Services and its subsidiaries. See Item“Item 8 — Financial Statements and Supplementary Data — Glossary of AcronymsAcronyms” for terms and abbreviations used throughout the annual report.
We own or have rights to use the trademarks, trade names and service marks that we use in conjunction with the operation of our business, including, but not limited to: Discover®, PULSE®, Cashback Bonus®, Discover Cashback Checking®, Discover it®, Freeze it®, College Covered®, and Diners Club International®. All other trademarks, trade names and service marks included in this annual report on Form 10-K are the property of their respective owners.
Part I.
Introduction
Discover Financial Services (the “Company”) is a directdigital banking and payment services company. We were incorporated in Delaware in 1960. We are a bank holding company under the Bank Holding Company Act of 1956 as well as a financial holding company under the Gramm-Leach-Bliley Act and therefore are subject to oversight, regulation and examination by the Board of Governors of the Federal Reserve System (the “Federal Reserve”). We provide directdigital banking products and services and payment services through our subsidiaries. We offer our customers credit card loans, private student loans, personal loans, home equity loans and deposit products. We had $95.9$112.1 billion in loan receivables and $54.4$70.5 billion in deposits issued through direct-to-consumer channels and affinity relationships at December 31, 2019.2022. We also operate the Discover Network, the PULSE network (“PULSE”) and Diners Club International (“Diners Club”), collectively known as the Discover Global Network. The Discover Network processes transactions for Discover-branded credit and debit cards and provides payment transaction processing and settlement services. PULSE operates an electronic funds transfer network, providing financial institutions issuing debit cards on the PULSE network with access to ATMs domestically and internationally, as well as merchant acceptance throughout the United States of America (“U.S.”) for debit card transactions. Diners Club is a global payments network of licensees, which are generally financial institutions, that issue Diners Club branded charge cards and/or provide card acceptance services.
Available Information
We make available, free of charge through the investor relations page of our internet site www.discover.com, our annual reports on Form 10-K, quarterly reports on Form 10-Q, current reports on Form 8-K, proxy statements, Forms 3, 4 and 5 filed by or on behalf of our directors and executive officers, and any amendments to those documents filed with or furnished to the Securities and Exchange Commission (the “SEC”) pursuant to the Securities Exchange Act of 1934. These filings are available as soon as reasonably practicable after they are filed with or furnished to the SEC.
In addition, the following information is available on the investor relations page of our internet site: (i) our Corporate Governance Policies; (ii) our Code of Ethics and Business Conduct; and (iii) the charters of the Audit, Compensation and Leadership Development, Nominating, Governance and Governance,Public Responsibility and Risk Oversight Committees of our Board of Directors. These documents are also available in print without charge to any person who requests them by writing or telephoning our principal executive offices: Discover Financial Services, Office of the Corporate Secretary, 2500 Lake Cook Road, Riverwoods, Illinois 60015, U.S.A.,United States of America, telephone number (224) 405-0900.
Operating Model
We manage our business activities in two segments: DirectDigital Banking and Payment Services. Our DirectDigital Banking segment includes consumer banking and lending products, specifically Discover-branded credit cards issued to individuals on the Discover Network and other consumer banking products and services, including private student loans, personal loans, home equity loans and deposit products. Our Payment Services segment includes PULSE, Diners Club and our Network Partners business, which provides payment transaction processing and settlement services on the Discover Global Network.
We are principally engaged in providing products and services to customers in the United States; however,U.S. However, we also receive royalty and licensee revenue from sources outside of the United StatesU.S., including royalty and licensee revenue from our Diners Club licensees and network assessment, discount and interchange fees from our network-to-network partners (“Network Alliance partners.Alliances”). For quantitative information concerning our geographic distribution, see Note 4: Loan Receivables to our consolidated financial statements.
Below are descriptions of the principal products and services of each of our reportable segments. For additional financial information relating to our business and our operating segments, see Note 22: Segment Disclosures to our consolidated financial statements.
-1-
Digital Banking
Set forth below are descriptions of the credit cards, private student loans, personal loans, home equity loans and deposit products issued by Discover Bank.
Credit Cards
We currently offer and issue credit cards to consumers. Our credit card customers are permitted to “revolve” their balances and repay their obligations over a period of time and at an interest rate set forth in their cardmember agreements, which may be either fixed or variable. The interest that we earnearned on revolving credit card balances makes upcomprised approximately 81%83% of our total interest income.income for the year ended December 31, 2022. We also charge customers other fees as specified in the cardmember agreements. These fees may include fees for late payments, returned checks, balance transfer transactions and cash advance transactions.
Our credit card customers’ transactions in the U.S. are processed over the Discover Network. We receive discount and fee revenue from merchants with whom we have a direct relationship. Where we do not have a direct relationship with a merchant, we receive acquirer interchange and assessment fees.fees from acquirers.
All of our cards offer rewards programs, the costs of which are generally recorded as a reduction of discount and interchange revenue. See “— Marketing — Rewards/Rewards / Cashback Bonus” for further discussion of our programs offered.
The following chart* shows the Discover card transaction cycle as processed on the Discover Network:
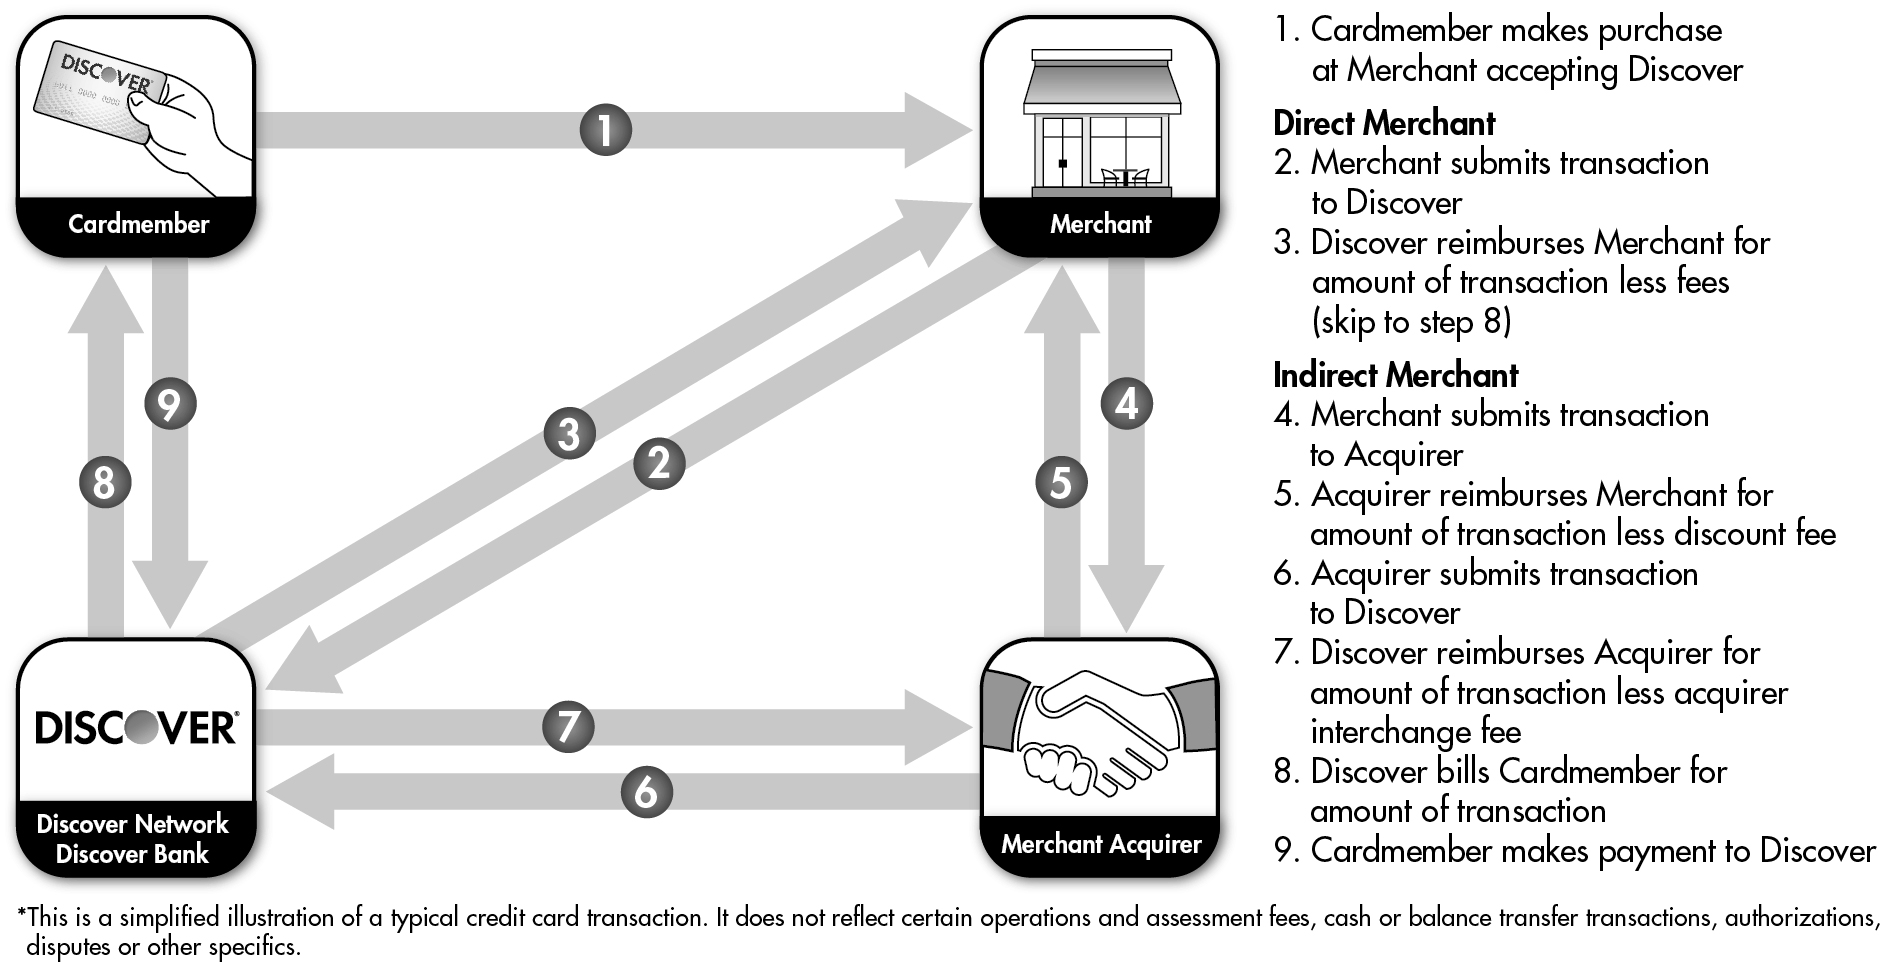
For information on how we market our credit card loans, see “— Credit Risk Management — Account Acquisition (New Customers)” and “— Marketing.”
Private Student Loans
Our private student loans are primarily available to students attending eligible non-profit undergraduate and graduate schools. We also offer parent loans and certain post-graduate loans, including consolidation, bar study and residency loans. All of our private student loans are unsecured and have terms and conditions that vary by product.type of student loan. We encourage students to borrow responsibly and maximize grants, scholarships and other free financial aid before taking student loans.
Our private student loans feature fixed or variable interest rates with zero origination fees, and customersfees. Customers can elect to make extra payments to pay their loans off earlier than contractually scheduled without penalty. The loans can feature potential rewards, such as for earning good grades, and we also offer optional in-school payment productsfeatures where students make monthly payments while in school. The standard repayment period is 15 to 20 years, depending on the type of student loan. StudentPrivate student loans may include a deferment period, during which interest continues to accrue and customers are not required to make payments while enrolled in school at least half time as determined by the school.
-2-
This period begins on the date the loan is first disbursed and ends six to nine months (depending on loan type) after the customerstudent ceases to be enrolled in school at least half time. As part of the loan approval process, all of our private student loans, except for bar study,
residency and private consolidation loans, are certified by and disbursed through the school to ensure students do not borrow more than the cost of attendance less other financial aid.
We market our private student loans primarily through digital channels, direct mail, email radio and television.media advertising. We also work with schools to create awareness of our products with students and their families. Students can apply for our private student loans online by telephone or by mail,telephone and we have dedicated staff within our call centers to service private student loans. We invite applicants who qualify to apply with a creditworthy cosigner, which may improve the likelihood of loan approval and a lower interest rate.
Personal Loans
Our personal loans are primarily intended to help customers consolidate existing debt, although they can be used for other purposes. These loans are unsecured with fixed interest rates, terms and payments, and have zero origination fees. The repayment period for personal loans is three3 to seven7 years and there is no prepayment penalty for repayingprepaying any portion of a personal loan balance prior to the scheduled maturity date.balance. Customers may be subject to other charges, including late fees when a customer hasif they have not made a minimum payment by the contractual due date.
We generally market personal loans primarily through direct mail, digital channels and email. Prospective applicants can obtain information regarding Discover Personal Loans and complete an application either online or by telephone and have the ability to apply online, by telephone or through the mail.telephone.
Home Equity Loans
Our home equity loans are intended for multiple purposes, including mortgage refinance, debt consolidation, home improvement and other major expenses. These loans are closed-end loans with fixed interest rates, terms and payments, and are secured by a first or second lien on a customer’s home. These loans require monthly payment over a 10 to 30 year30-year term. Customers may elect to make larger than minimum payments without being subject to a prepayment penalty, although certainpenalty. Customers do not pay origination fees or third-party costs during the application process or at closing, but they may be required to be reimbursed by the customerreimburse certain third-party costs if the loan is repaid in full within three years. Customers may also be subject to additional charges, including late fees and returned payment charges.
We market home equity loans primarily through a mix of direct mail, digital channels and email. Prospective applicants can obtain information and apply online or by telephone.
Deposits
We obtain deposits from consumers directly or through affinity relationships (“direct-to-consumer deposits”). Additionally, we obtain deposits through third-party securities brokerage firms that offer our deposits to their customers (“brokered deposits”). Our direct-to-consumer deposit products include online savings accounts, certificates of deposit, money market accounts, IRA savings accounts, IRA certificates of deposit and checking accounts, while our brokered deposit products include certificates of deposit and sweep accounts. All of our deposits are insured by the Federal Deposit Insurance Corporation (the “FDIC”) to the maximum permitted by law. We do not pay interest on checking account balances and instead offer cashback rewards for certain debit card purchases. Certificates of deposit are offered on a range of tenors from three months through ten years with interest rates that are fixed for the full period. There are minimum balance requirements to open certificates of deposit and penalties for early withdrawals. MoneyThere are no minimum balance requirements to open money market accounts areand savings accounts with minimum balance requirements.accounts. Money market accounts and savings accounts have limitations on withdrawal frequency as required by law, and interest rates on these accounts are subject to change at any time. Service charges apply to some transactionsoutgoing wire transfers only and availability of funds varies based on producttype and method of funding.deposit and other factors.
We market our direct-to-consumer deposit products through the use of radio,digital channels, direct mail, print materials, direct mail, affinityemail and arrangements with third parties and digital channels.parties. Customers can generally apply for deposit accounts online or by telephone. Cashback Debit checking account applications can only be initiated online. For more information regarding our deposit products, see “Management’s Discussion and Analysis of Financial Condition and Results of Operations — Liquidity and Capital Resources — Funding Sources — Deposits.”
-3-
Payment Services
Set forth below are descriptions of PULSE, Diners Club and our Network Partners business, which provides among other services, payment transaction processing and settlement services, among other services.
PULSE
Our PULSE network is one of the nation’s leading debit/ATM networks.a leader in debit payments, cash access and account transfers. PULSE links cardholders served by financial institutions to ATMs and point-of-sale (“POS”) terminals located throughout the United States,U.S., including cardholders at financial institutions with whichthat PULSE has direct relationships and through agreements PULSE has with other debit networks. PULSE also provides cash access at ATMs internationally.
PULSE’s primary source of revenue is transaction fees charged for switching and settling ATM and debit transactions initiated through the use of debit cards issued by participating financial institutions. In addition, PULSE offers a variety of optional products and services that produce income for the network, including signature debit transaction processing, debit card fraud detection and risk mitigation services and connections to other regional and national electronic funds transfer networks.
When a financial institution joins the PULSE network, debit cards issued by that institution are eligible to be used at all of the ATMs and POS debit terminals that participate in the PULSE network and the PULSE mark can be used on that institution’s debit cards and ATMs. In addition, financial institution participants may sponsor merchants, direct processors and independent sales organizations to participate in the PULSE POS and ATM debit service. A participating financial institution assumes liability for transactions initiated through the use of debit cards issued by that institution, as well as for ensuring compliance with PULSE’s operating rules and policies applicable to that institution’s debit cards, ATMs and, if applicable, sponsored merchants, direct processors and independent sales organizations.
When PULSE enters into a network-to-network agreement with another debit network, the other network’s participating financial institutions’ debit cards can be used at terminals in the PULSE network. PULSE does not have a direct relationship with these financial institutions and the other network bears the financial responsibility for transactions of those financial institutions’ cardholders and for ensuring compliance with PULSE’s operating rules.
Diners Club
Our Diners Club business maintains a global acceptance network through its relationships with licensees, which are generally financial institutions. We do not directly issue Diners Club cards to consumers, but grant our licensees the right to issue Diners Club brandedClub-branded cards and/or provide card acceptance services. Our licensees pay us royalties for the right to use the Diners Club brand, which is our primary source of Diners Club revenues. We also earn revenue from providing various support services to our Diners Club licensees, including processing and settlement of cross-border transactions. We also provide a centralized service center and technological services to our licensees.
When Diners Club cardholders use their cards outside the host country or territory of the issuing licensee, transactions are routed and settled over the Diners Club network through its centralized service center. In order to increase merchant acceptance in certain targeted countries and territories, we work with merchant acquirers to offer Diners Club and Discover acceptance to their merchants. These acquirers are granted licenses to market the Diners Club and Discover brands to existing and new merchants. As we continue to work toward achieving full card acceptance across our networks, Discover customers are using their cards at an increasing number of merchant and ATM locations that accept Diners Club and Discover cards around the world. Diners Club cardholders with cards issued by licensees outside of North America continue to use their cards on the Discover Network in North America and on the PULSE and Diners Club networks in their card-issuing territory and abroad.
Network Partners Business
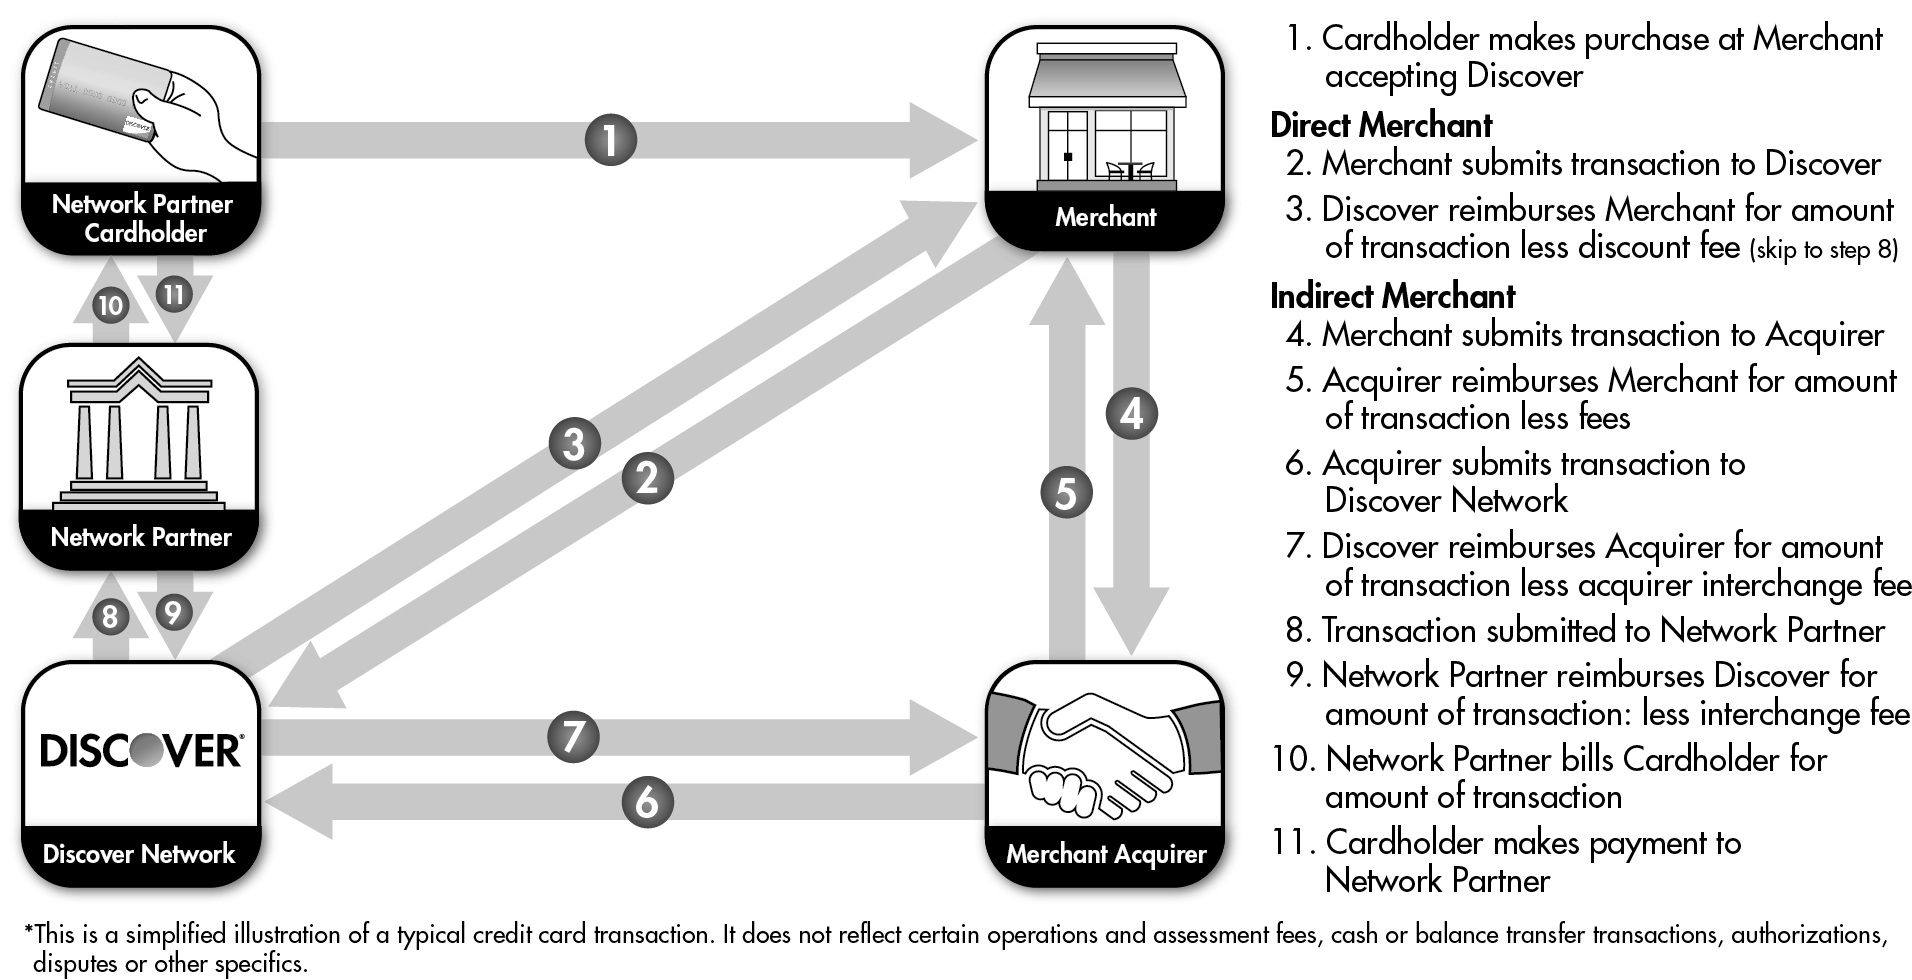
We have agreements with a number of financial institutions including financial technology firms, networks or network alliances,Network Alliances and commercial service providers for issuance of products or processing of payments on the Discover Global Network (i.e., Discover Network, PULSE and Diners Club). We refer to these financial institutions, networks and commercial service providers as “Network Partners.” We may earn merchant discount and acquirer assessments net of issuer fees paid, in addition to other fees, for processing transactions for Network Partners. We also leverage our payments infrastructure in other ways, such as business-to-business payment processing.
Our Network Partners business is comprisedcomposed of network-to-network partners (“Network Alliances”),Alliances, technology-enabled partners and our commercial payments network. Network Alliances allow Discover-enabled cards to be used at other networks’ participating merchants and allow other networks’ participating issuers’ cards to be used at Discover Network
-4-
merchants. Our commercial payments network facilitates transactions and business-to-business payments between buyers and suppliers using the existing payment infrastructure of Discover Network.
The following chart* shows an example of a Network Partners transaction cycle:
* * *
The discussion below provides additional detail concerning the supporting functions of our two segments. The credit card, private student loan, personal loan, home equity loan and deposit products issued through our DirectDigital Banking segment require significant investments in consumer portfolio risk management, marketing, customer service and related technology, whereas thetechnology. The operation of our Payment Services businesssegment requires that we invest in the technology to manage risk and service network partners, merchants and merchant acquirer relationships. We also make strategic investments in payment services entities to support our Payment Services segment.
Credit Risk Management
Account Acquisition (New Customers)
We acquire new credit card customers through direct mail, internet, media advertising, merchant or partner relationships, or through unsolicited individual applications. We also acquire new private student loan, personal loan and home equity loan customers through similar channels. In all cases we have a rigorous process for screening applicants.
We assess the creditworthiness of each consumer loan applicant throughby evaluating an applicant’s credit information provided by credit bureaus and information from other sources. The assessment is performed using our credit scoring systems, both externally developed and proprietary. For our unsecured lending products, we also use experienced credit underwriters to supplement our automated decision-making processes. For our home equityloan products, experienced credit underwriters must review and approve each application.
-5-
Upon approval of a customer’s application for one of our lending products, we assign a specific annual percentage rate using an analytically driven pricing framework that simultaneously provides competitive pricing for customers and seeks to maximize revenue on a risk-adjusted basis. For our credit card loans, we also assign a credit line based on risk level and expected return.
Portfolio Management (Existing Customers)
The revolving nature of our credit card loans requires that we regularly assess the credit risk exposure of such accounts. This assessment uses the individual’s Discover account performance information as well as information from credit bureaus. We utilize statistical evaluation models to support the measurement and management of credit risk. At the individual customer level, we use custom risk models together with genericmore generally available industry models as an integral part of the credit decision-making process. Depending on the duration of the customer’s account, risk profile and other performance metrics, the account may be subject to a range of account management treatments, including transaction authorization limits and increases or decreases on credit limits.
Customer Assistance
We provide our customers with a variety of tools to proactively manage their accounts, including email, text message, and push reminders and a websitepublicly accessible web pages dedicated to customer education, as further discussed under the heading “— Customer Service.” These tools are designed to limit a customer’s risk of becoming delinquent. When a customer’s account becomes delinquent or is at risk of becoming delinquent, we employ a variety of strategies to assist customers in preventing delinquency or returning delinquent accounts to current status on their accounts.status.
All monthly billing statements of accounts with past due amounts include a request for payment of such amounts. Customer assistance personnel generally initiate contact with customers within 30 days after any portion of their balance becomes past due. The nature and the timing of the initial contact are determined by a review of the customer’s prior account activity and payment habits.
We reevaluate our collection efforts and consider the implementation of other techniques as a customer becomes increasingly delinquent. We limit our exposure to delinquencies through controls within our process for authorizing transactions and credit limits and criteria-based account suspension and revocation. In situations involving customers with financial difficulties, we may enter into arrangements to extend or otherwise change payment schedules, lower interest rates and/or waive fees to aid customers in returning to current status on their obligations to us. For more information see Note 4: Loan Receivables to our consolidated financial statements.
Marketing
Our marketing group works closely with credit risk management to provide key functions including product development, management of our Cashback Bonus and other rewards programs, protection product management, and brand and advertising management, to acquire new customers and enhance our relationships with existing customers. These key functions include product development, Cashback Bonus and other rewards programs management, protection product management, and brand and advertising management.
Product Development
Rewards / Cashback Bonus
Our cardmembers use several card products, all with no annual fee, that allow them to earn their rewards based on their spend,purchases, which can be redeemed in any amount at any time, in general as set forth below.
•Discover it card offers a 5% Cashback Bonus in categories that change each quarter, which customers must activate each quarter, up to a quarterly maximum and a 1% Cashback Bonus on all other purchases. -6- •Discover it Chrome card offers a 2% Cashback Bonus at gas stations and restaurants on up to $1,000 in combined purchases each quarter and a 1% Cashback Bonus on all other purchases. •Discover it Miles card offers 1.5 miles for every dollar spent on purchases. •Discover it Business card, which we no longer offer for new accounts, offers a 1.5% Cashback Bonus on all purchases. •Discover More card, which we no longer offer for new accounts, offers a 5% Cashback Bonus in categories that change each quarter, which customers must activate each quarter, up to a quarterly maximum. Customers earn a full 1% after they make $3,000 in purchases annually, based on their anniversary date, and 0.25% on their first $3,000 and all wholesale and discount store purchases. |
Protection Products
We currently sell an identity theft protection product,Identity Theft Protection and we service and maintain existing enrollments of the paymentPayment and wallet protectionWallet Protection products detailed below for our credit card customers.
• |
•Payment Protection allows customers to suspend their minimum payments due for up to two years, depending on the qualifying event and product level, when certain qualifying life events occur. While on this benefit, customers have no minimum monthly payment and are not charged interest, late fees or other product fees. This product covers various events, such as unemployment, disability, Federal or State disasters and other life events, such as marriage or the birth of a child. Depending on the product level and availability under state laws, outstanding balances up to $10,000 or $25,000, are cancelled in the event of death. •Wallet Protection offers |
Brand and Advertising Management
We maintain a full-service marketing department charged with delivering integrated mass and direct communications to foster customer engagement with our products and services. We also leverage strategic partnerships and sponsorship properties such as the NHL and the Big Ten Conference to help drive loan growth. Our brand team utilizes consumer insights and market intelligence to define our mass communication strategy, create multi-channel advertising messages and develop marketing partnerships with sponsorship properties. This work is performed in housein-house as well as with a variety of external agencies and vendors.
Customer Service
Our credit card customers have the option to manage their accounts online via Discover.com, through Discover Mobile applications and by calling our U.S.-based customer service personnel. Our digital solutions offer a range of benefits, which may include:includes, but is not limited to, the following:
•Access to overall credit health tools such as Credit Scorecard, Freeze it, Social Security Number Alerts and New Account Alerts;
•Customer service via multiple communication channels, including 24/7 customer service by telephone and messaging; and
•Proactive notifications via email, text messaging and in-app messaging for monitoring transaction activity and account security.
Our private student loan, personal loan, home equity loan and deposit product customers can utilize our online account services to manage their accounts and to use interactive tools and calculators.
-7-
Processing Services
Our processing services cover four functional areas: card personalization, print/mail, remittance processing and documentitem processing. Card personalization is responsible for the mailing of credit and debit cards for new accounts, replacements and reissues. Print/mail specializes in statement and letter printing and mailing. Remittance processing
handles account payments and physical check processing. DocumentItem processing handles hard-copy forms and electronic documents received through fax and mobile channels, including new account applications submitted through the mail.bank deposits, credit disputes and general correspondence, among other items.
Fraud Prevention
We monitor our customers’ accounts to help prevent, detect, investigate and resolve fraud. Our fraud prevention processes are designed to protect the security of cards, applications and accounts in a manner consistent with our customers’ needs to easily acquire and use our products. Prevention systems monitor the authorization of application information, verification of customer identity, sales, processing of convenience and balance transfer checks and electronic transactions.
Each credit and debit card transaction is subject to screening, authorization and approval through externally developed and proprietary POS decision systems and each transaction for a deposit account is subject to screening and approval through a dynamic transaction evaluation and scoring methodology.systems. We use a variety of techniques that help identify and halt fraudulent transactions, including adaptivemachine-learning models, rules-based decision-making logic, report analysis, data integrity checks and manual account reviews. We manage accounts identified by the fraud detection system through technology that integrates fraud prevention and customer service. Strategies are subject to regular review and enhancement to enable us to respond quickly to changing conditions as well as to protect our customers and our business from emerging fraud activity.
Discover Global Network Operations
We support our merchants through a merchant acquiring model that includes direct relationships with large merchants in the United StatesU.S. and arrangements with merchant acquirers generally for small- and mid-size merchants. In addition to our U.S.-based merchant acceptance locations,Additionally, Discover Network cards are widely accepted and acceptance continues to grow in a growing number of countries around the world on the Diners Club network, or through reciprocal acceptance arrangements made with international payment networks (i.e., Network Alliances).
We maintain direct relationships with most of our large merchant accounts, which enables us to benefit from joint marketing programs and opportunities and to retain the entire discount revenue from the merchants. The terms of our direct merchant relationships are governed by merchant services agreements. These agreements are also accompanied by additional program documents that further define our network functionality and requirements, including operating regulations, technical specifications and dispute rules. To enable ongoing improvements in our network’s functionality and in accordance with industry convention, we publish updates to our program documents on a semi-annual basis.
Discover Global Network services the majority of its small- and mid-size merchant portfolios through third-party merchant acquirers to allow such acquirers to offer a comprehensive payments processing package to such merchants. Merchants also can apply to our merchant acquirer partners directly to accept Discover Global Network cards through the acquirers’ integrated payments solutions. Merchant acquirers provide merchants with consolidated servicing for Discover, Visa and MasterCard transactions, resulting in streamlined statements and customer service for merchants and reduced costs for us. These acquirer partners also perform credit evaluations and screen applications against unacceptable business types and the Office of Foreign Asset Control Specifically Designated Nationals list.
The Discover Global Network operates systems and processes that seek to ensure data integrity, prevent fraud and ensure compliance with our operating regulations. Our systems evaluate incoming transaction activity to identify abnormalities that require investigation and fraud mitigation. Designated Discover Global Network personnel are responsible for validating compliance with our operating regulations and law, including enforcing our data security standards and prohibitions against illegal or otherwise unacceptable activities. Discover Global Network is a founding and current member of the Payment Card Industry Security Standards Council, LLC (the “Council”) and is working to expand the adoption of the Council’s security standards globally for merchants and service providers that store, transmit or process cardholder data.
-8-
Technology
We provide technology systems processing through a combination of owned and hosted data centers and the use of third-party vendors. These data centers support our payment networks, provide customers with access to their accounts and manage transaction authorizations,authorization and settlement, among other functions. The Discover Global Network works with a number of vendors to maintain our connectivity in support of POS authorizations. This connectivity also enables merchants to receive timely payment for their Discover Global Network card transactions.
Our approach to technology development and management involves both third-party and in-house resources. We use third-party vendors for basic technology services (e.g., cloud, telecommunications, hardware and operating systems) as well as for processing and other services for our directdigital banking and payment services businesses. We subject each vendor to a formal approval process, which includes, among other things, a security assessment, to ensure that the vendor can assist us in maintaining a cost-effective, reliable and reliablesecure technology platform. We use our in-house resources to build, maintain and oversee some of our technology systems. We believe this approach enhances our operations and improves cost efficiencies.
Seasonality
In our credit card business, we experience fluctuations in transaction volumes and the level of loan receivables as a result of higher seasonal consumer spending and payment patterns around the winter holidays, summer vacations and back-to-school periods. In our private student loan business, our loan disbursements peak at the beginning of a school’s academic semester or quarter. Although there is a seasonal impact toon transaction volumes and the levels of credit card and private student loan receivables, seasonal trends have not caused significant fluctuations in our results of operations or credit quality metrics between quarterly and annual periods.
Revenues in our Diners Club business are generally higher in the first half of the year as a result of Diners Club’s tiered pricing system where licensees qualify for lower royalty rate tiers as cumulative volume grows during the course of the year.
Competition
The consumer financial services business is highly competitive. We compete with other consumer financial services providers, including non-traditional providers such as financial technology firms and payment networks, based on the basis of a number ofseveral factors, including brand, reputation, customer service, product and service offerings, incentives, pricing, e-commerce and digital wallet participation, and other terms. Our credit card business also competes on the basis of reward programs and merchant acceptance. We compete for accounts and utilization with cards issued by other financial institutions (including American Express, Bank of America, JPMorgan Chase, Capital One and Citi)Citibank) and, to a lesser extent, businesses that issue their own private label cards or otherwise extend credit to their customers. In comparison to our largest credit card competitors, our strengths include no annual fees, cash rewards, conservative portfolio management and strong, 100% U.S.-based customer service. Competition based on rewards and other card features and benefits continues to be strong. Our private student loan product competes for customers with Sallie Mae and Wells Fargo,Citizens Bank, as well as other lenders that offer private student loans. Our personal loan product competes for customers primarily with Citi, Wells Fargo, Goldman Sachsfinancial institutions (including Citibank and American Express) and non-traditional lenders including financial technology firms(including Lending Club and peer to peer lenders.Upstart). Our home equity loan product faces competition primarily from traditional branch lending institutionsnational and credit unions, as well as providers of cash-out refinance loans and home equity lines of credit.regional mortgage lenders.
Because most domestically-issued credit cards, other than those issued on the American Express network, are issued on the Visa and MasterCard networks, most other card issuers benefit from the dominant market share of Visa and MasterCard. The former exclusionary rules of Visa and MasterCard limited our ability to attract merchants and credit and debit card issuers, contributing to Discover not being as widely accepted in the U.S. as Visa and
-9-
MasterCard. Merchant acceptance of the Discover card has increased in the past several years, both in the number of merchants enabled for acceptance and the number of merchants actively accepting Discover. We continue to make investments in expanding Discover and Diners Club acceptance in key international markets where an acceptance gap exists.
In our payment services business, we compete with other networks for volume and to attract network partners to issue credit, debit and prepaid cards on the Discover, PULSE and Diners Club networks. We generally compete on the basis of customization of services and various pricing strategies, including incentives and rebates. We also compete on
the basis of issuer fees, fees paid to networks (including switch fees), merchant acceptance, network functionality, customer perception of service quality, brand image, reputation and market share. The Discover and Diners Club and Discover networks’ primary competitors are Visa, MasterCard and American Express, andExpress. PULSE’s network competitors include Visa’s Interlink, MasterCard’s Maestro and First Data’s STAR. American Express is a particularly strong competitor to Diners Club as both cards target international business travelers. As the payments industry continues to evolve, we are also facing increasingongoing competition from financial technology firms and alternative payment solutions, which leverage new technologies and a customer’s existing deposit and credit card accounts and bank relationships to create payment or other fee-based solutions.
In our direct-to-consumer deposits business, we have acquisition and servicing capabilities similar to other large direct banks, including Ally, American Express, Barclays, Capital One, (360), Goldman Sachs, Synchrony and USAA. We compete with traditional banks and credit unions that source deposits through branch locations and direct channels. We seek to differentiate our deposit product offerings on the basis of brand reputation, digital experience, customer service and value.
For more information regarding the nature of and the risks we face in connection with the competitive environment for our products and services, see “Risk Factors — Strategic Business Risk.”
Intellectual Property
We use a variety of methods, such as trademarks, patents, copyrights and trade secrets, to protect our intellectual property. We also place appropriate restrictions on our proprietary information to control access and prevent unauthorized disclosures. Our Discover, PULSE and Diners Club brands are important assets and we take steps to protect the value of these assets and our reputation.
Our purpose-driven, people-first culture and human capital management strategy is built on a foundational set of core values and Discover Behaviors and powered by significant investments in employee learning and development, market-competitive compensation and benefits and diversity, equity and inclusion (“DE&I”). One place we see the results from our human capital strategy is in our consistently high levels of employee engagement, which we measure through employee surveys.
Employee Learning and Development
Career and skill development are important components of our talent management system. In addition to on-the-job coaching and training, we provide a range of internal professional and leadership development programs that help our employees build better teams and develop the skills to advance their careers. For example, employees can access continuing education courses that cover a variety of subjects through our training and development platform. Additionally, we support our employees’ educational goals through programs that can reimburse up to 100% of tuition at certain schools.
Market-Competitive Compensation and Benefits
We offer a market-competitive compensation and benefits package to attract, retain and motivate highly qualified and diverse talent. We designed our compensation and benefits package using a pay-for-performance
-10-
philosophy to reward the achievement of our financial and strategic performance goals as well as individual performance. Our total compensation and benefits package for U.S. employees includes competitive holiday and flexible paid-time-off; a 401(k) retirement savings plan with matching and company contributions that can total up to 8% of an employee’s wages per year; subsidized medical, dental, vision, disability and supplemental life insurance; paid parental and caregiver leave; adoption and surrogacy assistance; and an employee assistance program, among other benefits.
Diversity, Equity and Inclusion
DE&I is a competitive differentiator for companies and something that we continue to advance at Discover. At December 31, 2022, our U.S.-based employee population was composed of 64% Women and 44% People of Color, including 12% who self-identify as Asian, 13% as Hispanic and 15% as Black. Our workforce diversity either meets or exceeds the workforce availability in each of the metropolitan areas where we have locations.
Our Executive Committee and Board of Directors regularly review our DE&I strategy and progress. Our VP, Chief Diversity Officer leads our DE&I office, which manages the development, implementation and monitoring of our enterprise-wide DE&I strategies, programs, initiatives and policies. We strive to incorporate our DE&I principles throughout our human capital management processes, including talent acquisition, learning and development, employee relations, performance management and total rewards (including pay equity).
Pay Equity
We seek to pay our employees fairly for their work and we regularly monitor our performance, addressing pay-equity discrepancies or issues as appropriate. We regularly benchmark roles and compensation data to help ensure internal pay equity. We partner with an independent, third-party consultant to conduct a company-wide pay equity analysis that considers race, ethnicity and gender. We use this analysis to identify groups with pay discrepancies, understand the underlying drivers and implement best practices to address inequity. Based on our most recent review using this approach, women and minorities at Discover earn, on average, between $0.99 and $1.03 for every $1 earned by men and non-minorities after accounting for factors such as role, tenure and geography.
Employee Engagement
Discover has consistently been recognized as a top place to work for its inclusivity and quality of the workplace, including the 100 Best Large Workplaces for Women as recognized by Fortune in 2022. We believe that a key to our employee strategy is establishing and maintaining employee engagement. We create, drive, and improve engagement through our actions and policies. In our most recent employee survey conducted in the fourth quarter of 2022, 87% of employees recommended Discover as a great place to work, which places Discover among the top 10% of all companies surveyed by Glint.
Risk Management
Our business exposes us to strategic, credit, market, liquidity, operational, compliance and legal risks. We use an enterprise-wide risk management framework to identify, measure, monitor, manage and report risks that affect or could affect the achievement of our strategic, financial and other objectives.
Enterprise Risk Management Principles
Our enterprise risk management philosophy is expressed through five key principles that guide our approach to risk management: Comprehensiveness, Accountability, Independence, Defined Risk Appetite and Transparency.
Comprehensiveness
We seek to maintain a comprehensive risk management framework for managing risk enterprise-wide, including policies, standards, risk management processes, monitoring and testing and reporting. Our framework is designed to be comprehensive with respect to our business units and their control and support functions, and across all risk types.
Accountability
We structure accountability across three lines of defense along the principles of risk management execution, oversight and independent validation. As the first line of defense, our business units seek to manage theachieve business objectives
-11-
while identifying and managing risks to which they are exposedthat arise from day-to-day operations as a result of their activities, includingwell as those risks arising from activities that have been outsourced to third parties.driven by change. The principles apply across all businesses and risk types and guide the definition of specific roles and responsibilities.
Independence
Our second and third lines of defense which are comprised of risk and control functions, operate independentindependently of the business units. The second line of defense includes our corporate risk management (“CRM”) department, which is led by our Chief Risk Officer (“CRO”), who is appointed by our Board of Directors. The CRM department sets(i) oversees the establishment of enterprise-level risk management standards and policiespolicies; (ii) oversees the processes that are designed to be consistent with the size and complexity of our business, industry practices and applicable legal and regulatory requirements; and (iii) independently test business units’ compliance with applicable regulatory requirements. The CRO is accountable for providing our Board
of Directors and executive management with an independent perspective on: the risks to which we are exposed; how well management is identifying, assessing and managing risk; and the capabilities we have in place to manage risks across the enterprise. Our internal audit department, as the third line of defense, performs periodic, independent reviews and tests compliance with risk management policies, procedures and standards across theour Company. It also periodically reviews the design and operating effectiveness of our risk management program and processes, including the independence and effectiveness of our CRM function, and reports the results to our Audit Committee of the Board of the Directors (“Audit Committee”) and, where appropriate, the Risk Oversight Committee of the Board of Directors (“Risk Oversight Committee”).
Defined Risk Appetite
We operate within a risk appetite framework approved by our Board of Directors, which guides an acceptable level of risk-taking consideringrelative to desired financial returns, strategic goals and other stakeholder objectives. To that end, limits and escalation thresholds are set consistent with the risk appetite approved by our Board of Directors.
Transparency
We seek to provide transparency of exposures and outcomes, which is core to our risk culture. We provide this risk transparency through our risk committee structure and standardized processes for escalating issues and reporting. This is accomplished at several levels within the organization, including quarterly meetings held by our Risk Committee and quarterly reports to the Risk Oversight Committee and Audit Committee,Committees of the Board of Directors, as well as regular reporting to our Risk subcommitteessub-committees commensurate with the needs of our businesses. Further, our CRO is a member of the Company’sour Executive Committee.
Enterprise Risk Management Governance Structure
Our governance structure is based on the principle that each line of business is responsible for managing risks inherent in its business with appropriate oversight from our senior management and Board of Directors. Various committees are in place to oversee the management of risks across our Company.business. We seek to apply operating principles consistently to each committee. These operating principles are detailed in committee charters, which are approved by the Risk Committee.its parent committee. Our banking subsidiaries have theirbank subsidiary has its own risk governance, compliance, auditing and other requirements. Our risk governance framework is designed such that bank-level risk governance requirements are satisfied as well.
Board of Directors
Our Board of Directors (i) approves certain risk management policies,policies; (ii) approves our capital targets and goals,goals; (iii) approves our risk appetite framework,framework; (iv) monitors our strategic plan,plan; (v) appoints our CRO and other risk governance function leaders, as appropriate,appropriate; (vi) receives reports on any exceptions to the Enterprise Risk Management policypolicy; and (vii) receives and reviews regulatory examination reports. The Board of Directors receives reports from the Audit Committee and Risk Oversight Committee on risk management matters and from the Compensation and Leadership Development Committee (“CLDC”) on risks associated with compensation and leadership development.
Risk Oversight Committee of our Board of Directors
Our Risk Oversight Committee is responsible for overseeing our risk management policies and the operations of our enterprise-wide risk management framework and our capital planning and liquidity risk management and resolution planning activities. The Committee is responsible for, among other things, (i) approving and periodically reviewing our risk management policies,policies; (ii) overseeing the operation of our policies, standards and procedures for establishing our risk management governance, risk management procedures and risk-control infrastructure,infrastructure; (iii) overseeing the operation of processes and
-12-
systems for implementing and monitoring compliance with such policies and procedures,procedures; (iv) reviewing and making recommendations to the Board of Directors, as appropriate, regarding the Company’sour risk management framework, key risk management policies and the Company’sour risk appetite and tolerance,tolerance; (v) receiving and reviewing regular reports from our CRO on risk management deficiencies and emergingsignificant risks, the status of and changes to risk exposures, policies, procedures and practices and the steps management has taken to monitor and control risk exposures,exposures; (vi) receiving reports on compliance with our risk appetite and limit structure and risk management policies, procedures and controls,controls; and (vii) overseeing capital planning, liquidity risk management and resolution planning related activities, and (viii) sharing information, liaising and meeting in joint session with the Audit Committee (which it may do through the Chairs of the Committees) as necessary or desirable to help ensure that the committees have received the information necessary to permit them to fulfill their duties and responsibilities with respect to oversight of risk management matters.
Audit Committee of our Board of Directors
With respect to the enterprise risk management framework, our Audit Committee is responsible forCommittee’s responsibilities include the following: (i) discussing policies with respect to risk assessment and management,management; (ii) receiving and reviewing reports from our CRO and other members of management as the Committee deems appropriate on the guidelines and policies for assessing and managing our exposure to risks, the corporation’s major financial risk exposures and the steps management has taken to monitor and control such exposures,exposures; (iii) receiving and (iii)reviewing reports from management with respect to the Company’s compliance with applicable legal and regulatory requirements; and (iv) sharing information and liaising with the Risk Oversight Committee as necessary or desirable to help ensure that the committees have received the information necessary to permit them to fulfill their duties and responsibilities with respect to oversight of risk management matters.
Compensation and Leadership Development Committee of our Board of Directors
Our Compensation and Leadership Development CommitteeCLDC is responsible for overseeing risk management associated with the Company’sour compensation and leadership development practices. The Committee receives reporting regarding the Company’sour compensation practices and evaluates whether these practices encourage excessive risk-taking. As a part of its reviews, the Committee considers input from our CRO and takes into account risk outcomes. The Compensation and Leadership Development CommitteeCLDC receives reporting regarding talent management practices and evaluates risks associated with leadership development and succession planning.
Risk Committee
Our Risk Committee is an executive management-level committee that establishes and oversees a comprehensive enterprise risk management program, which includes (i) providing a regular forum for representatives of our different functional groups to identify and discuss key risk issues and to recommend to senior management actions that should be taken to manage the level of risk taken by the business lines,lines; (ii) establishing and overseeing an enterprise-wide approach to risk management through the development of our Enterprise Risk Management Policy and the associated oversight framework for the identification, measurement, monitoring, management and reporting of enterprise risk,risk; (iii) communicating our risk appetite and philosophy, including establishing limits and thresholds for managing enterprise-wide risks,risks; and (iv) reviewing, on a periodic basis, our aggregate enterprise-wide risk exposures and the effectiveness of risk identification, measurement, monitoring, management and reporting policies and procedures and related controls within the lines of business.
Our Risk Committee has formed and designated a number of committeessub-committees to assist it in carrying out its responsibilities. These committees,sub-committees, made up of representatives from senior levels of management, escalate issues to our Risk Committee as guided by escalation thresholds. These risk management committeessub-committees include the Discover Bank Credit Committee, Asset/Liability Management Committees (Discover Financial Services and Discover Bank), the Counterparty Credit Committee, the New Initiatives Committee, the Operational Risk Committee, the Capital Planning Committee, the Compliance Committee, the Technology and Information Security ExecutiveRisk Committee, the Challenge Committee, the Resolution Planning Committee and the Human Resources Risk Committee.
Chief Executive Officer
The Chief Executive Officer (“CEO”) is ultimately responsible for risk management within our Company. In that capacity, the CEO establishes a risk management culture throughout theour Company and ensures that businesses operate in accordance with this risk culture.
-13-
Business Unit Heads
Our business unit heads are responsible for managing risk associated with pursuit of their strategic, financial and other business objectives. Business unit heads are responsible for (i) complying with all risk limits and risk policies,policies; (ii) identifying and documenting risks and implementing appropriate controls,controls; (iii) understanding and managing the overall level of risk in their organization, including the impact of the risks being accepted; (iv) explicitly considering risk when developing strategic plans, budgets and new products, (iv)(v) implementing appropriate controls when pursuing business strategies and objectives, (v)objectives; (vi) ensuring business units test and implement business unit processes, controls and monitoring to support corporate model risk management standards such as documentation standards and reporting standards, (vi)standards; (vii) coordinating with CRM to produce relevant, sufficient, accurate and timely risk reporting that is consistent with the processes and methodology established by CRM, (vii)CRM; (viii) ensuring sufficient financial resources and qualified personnel are deployed to control the risks inherent in the business activities,activities; and (viii)(ix) designating, in consultation with the CRO, a Business Risk Officer to assist with the above and to perform the specific duties described below.
above.
Chief Risk Officer
As a member of the Company’sour senior management team, the CRO chairs our Risk Committee. In addition, the CRO has oversight responsibility to establish the CRM function with capabilities to exercise its mandate across all risk categories. Our CRO reports directly to our Risk Oversight Committee and administratively to the CEO. Our CRO provides our Board of Directors and executive management with an independent viewperspective on (i) the key risks to which our Company is exposedexposed; (ii) how well management is identifying, assessing and managing risk; and (iii) the capabilities our Company has in place to our Risk Committee, our Audit Committee, our Risk Oversight Committee and our Board of Directors.manage risks across the enterprise.
Corporate Risk Management
The CRM department is led by the CRO and supports business units by providing objective oversight of our risk profile to help ensure that risks are managed, aggregated and reported to our Risk Committee, our Risk Oversight Committee and our Audit Committee. The CRM department participates in our Risk Committee and sub-committee meetings to provide an enterprise-wide perspective on risk, governance matters, policies and risk thresholds. The CRM department includes, but is comprisednot limited to, teams that are responsible for oversight of enterprise, operational, consumer credit, counterparty credit, market, liquidity, compliance, Bank Secrecy Act/anti-money laundering, third-party and business technology model,and information security risk, as well as model validation and insurance risk functions, each of which manages the risks associated with their respective area.testing functions.
Credit Risk Management
Credit Risk Management is responsible for (i) developing, validating and implementing credit policy criteria and predictive loan origination and servicing models in order to optimize the profitability of Companyour lending activities,activities; (ii) ensuring adherence to our credit risk policies and approval limits, and that departmental policies, procedures and internal controls are consistent with the standardsour defined by the Company,standards; (iii) ensuring that we manage credit risk within approved limits,limits; and (iv) monitoring performance for both new and existing consumer loan products and portfolios.
The law departmentlegal organization plays a significant role in managing our legal risk by, among other things, identifying, interpreting and advising on legal and regulatory risks. The CRM department collaborates and coordinates closely with other risk and control functions in exercising its oversight responsibilities, in particular with the law department.legal organization. Our law departmentlegal organization participates in meetings of the Risk Committee and the sub-committees of the Risk Committee in order to advise on legal and compliance risks and to inform the committees of any relevant legislative and regulatory developments. Further, our Chief Legal Officer is a member of our Executive Committee.
Internal Audit Department
Our internal audit department performs periodic, independent reviews and testing of compliance with risk management policies and standards across theour Company, as well as assessments of the design and operating effectiveness of these policies and standards. The internal audit department also validates that risk management controls are functioning as intended by reviewing and evaluating the design and operating effectiveness of the CRM program and processes, including the independence and effectiveness of the CRM function. The results of such reviews are reported to our Audit Committee and Risk Oversight Committee.
-14-
Risk Categories
We are exposed to a broad set of risks in the course of our business activities due to both internal and external factors, which we segment into sixseven major risk categories. The first fivesix are defined to be broadly consistent with guidance published by the Federal Reserve and the Basel Committee on Banking Supervision (“BCBS”): credit (consumer and counterparty), market, liquidity, operational, compliance and legal risk. We recognize the sixth,seventh, strategic risk, as a separate risk category. We evaluate the potential impact of a risk event on theour Company by assessing the financial impact, the impact to our reputation, the legal and regulatory impact and the client/customer impact. In addition, we have established various policies to help govern these risks.
Credit Risk
Our credit risk arises from the potential that a borrower or counterparty will fail to perform on an obligation. Our credit risk includes consumer credit risk and counterparty credit risk. Consumer credit risk is primarily incurred by Discover Bank through the issuance of (i) unsecured credit including credit cards, private student loans and personal loans and (ii) secured credit including deposit secured credit cards and home equity loans. Counterparty credit risk is incurred
through a number of business-facing activities including payment network settlement, certain marketing and incentive programs, treasury and asset/liability management, network incentive programs, guarantors, vendorguarantor and insurance relationships and insurers.strategic investments.
Market Risk
Market risk is the risk to our financial condition resulting from adverse movements in market rates or prices, such as interest rates, foreign exchange rates, credit spreads or equity prices. Given the nature of our business activities, we are exposed to various types of market risk; in particular interest rate risk, foreign exchange risk and other risks that arise through the management of our investment portfolio. Interest rate risk is more significant relative to other market risk exposures and results from potential mismatches in the repricing term of assets and liabilities (yield curve risk) and volatility in reference rates used to reprice floating-rate structures (basis risk). Foreign exchange risk is primarily incurred through exposure to currency movements across a variety of business activities and is derived, specifically, from the timing differences between transaction authorizations and settlement.
Liquidity Risk
Liquidity risk is the risk that we will be unable to meet our obligations as they become due because of an inability to liquidate assets or obtain adequate funding, or an inability to easily unwind or offset specific exposures without significantly lowering market prices because of inadequate market depth or market disruptions.
Operational Risk
Operational risk is defined as the risk of loss resulting from inadequate or failed internal processes, people and systems or from external events. Operational risk is inherent in all our businesses. Operational risk categories incorporate all of the operational loss event-type categories set forth by the BCBS, which include the following: (i) internal fraud,fraud; (ii) external fraud,fraud; (iii) employment practices and workplace safety,safety; (iv) clients, products and business practices,practices; (v) damage to physical assets,assets; (vi) business disruption and system failures,failures; and (vii) execution, delivery and process management.
One of our key operational risks is information security, which includes cybersecurity. Our information security program is led by our Chief Information Security Officer and overseen by our Technology and Information Risk Committee. The program is designed to safeguard the confidentiality, integrity and availability of information assets. We continuously monitor the cyber threat landscape, internal threats and technological changes to ensure controls are in place to mitigate risks to the organization and our customers. In concert with our lines of business and corporate functions, our enterprise-wide incident management framework enables us to manage risk mitigation activities that stem from incidents - including governance structure and organization, an incident management program, incident management and escalation principles, requirements for testing and exercising the program, risk management principles and external reporting guidance.
Compliance Risk
Compliance risk is the operational risk of legal or regulatory sanctions,material financial loss, or damage to reputation resulting fromor negative impact on business strategies that Discover Financial Services and its subsidiaries may suffer as a result of its failure to comply with laws, regulations, rules other regulatory requirements, or codes of conduct and other standards of self-regulatory organizationskey internal policies applicable to us.the activities of our Company. Compliance risk exposures are
-15-
actively and primarily managed by our business units in conjunction with our complianceCompliance department. Our compliance program governs the management of compliance risk and includes oversight by our Risk Committee and Compliance Committee.
Legal Risk
Legal risk arises from the potential that unenforceable contracts, lawsuits or adverse judgments can disrupt or otherwise negatively affect our operations or condition. These risks are inherent in all of our businesses. Legal risk exposures are primarily managed by our business units in conjunction with our law department.legal organization. Our Risk Committee and Compliance Committee oversee our legal risk management. Specifically, the law departmentlegal organization is responsible for providing advice, interpreting and identifying developments regarding laws, regulations, regulatory guidance and litigation and setting standards for communicating relevant changes to corporate compliance, the business and internal audit. The law departmentlegal organization also identifies and communicates legal risk associated with new products and business practices.
Strategic Risk
Strategic risk is the risk that our strategies and the execution of those strategies do not produce the desired outcome, resulting in a negative impact on our enterprise value. This risk can be driven by internal and external factors, including (i) our business model, market position, selection of strategies and execution of those strategies and (ii) competitor strategies, emergence of new competitors, emergence of new technologies, changing consumer preferences or other market factors.
Our Risk Committee actively manages strategic risk through the development, implementationby monitoring our risk appetite and key risk indicators (“KRIs”), identifying and providing oversight of key risks associated with our business strategies, including the developmentand working with our Risk Oversight Committee and Board of budgetsDirectors to identify and business plans.manage top strategic risks. Our business units take on and are accountable for managing strategic risk in pursuit of their objectives.
Enterprise Risk Management Framework
Our enterprise risk management principles are executed through a risk management framework that is based upon industry standards for managing risk and controls. While the detailed activities vary by risk type, there are common process elements that apply across risk types. We seek to apply these elements consistently in the interest of effective and efficient risk management. This framework seeks to link risk processes and infrastructure with the appropriate risk oversight to create a risk management structure that raises risk awareness, reduces impact of potential risk events, improves business decision-making and increases operational efficiency.
Risk Identification
We seek to identify potential exposures that could adversely affect our ability to successfully implement strategies and achieve objectives. To ensure that the full scale and scope of risk exposures from firm-wide activities are identified, we seek to identify risk exposures based on (i) significant enterprise-level risks that are strategic, systemic, or emerging in nature, including Company-specific risks that span across multiple lines of business; (ii) granular risk exposures from on-balance sheet and off-balance sheet positions, including concentrations,concentrations; and (iii) risk exposures from initiatives focused on new, expanded, customized, or modified products, services and processes.
Risk exposures identified through these three approaches are consolidated to create a comprehensive risk inventory. This inventory is leveraged by a number of processes within theour Company including stress scenario design and stress testing, capital planning, risk appetite setting and risk modeling. The risk inventory is reviewed and approved at least annually by the Risk Committee while the sub-committees review the risks mapped to the relevant risk categories for transparency and comprehensive coverage of risk exposures.
Risk Measurement
Our risk measurement process seeks to ensure that the identified risk exposures are appropriately assessed. Risk measurement techniques appropriate to the risk category, including econometric modeling, statistical analysis, peer benchmarking and qualitative assessments, are employed to measure our material risk exposures.
-16-
Risk Monitoring
Our risks are monitored through an integrated monitoring framework consisting of risk appetite metrics and key risk indicators (“KRIs”).KRIs. These metrics are established to monitor changes in our risk exposures and external environment. Risk appetite metrics are used to monitor the overall risk profile of theour Company by setting risk boundaries and expectations through quantitative limits and qualitative expressions. We use KRIs to monitor our risk profile through direct or indirect alignment with the risk appetite limits.
These metrics enable monitoring of risk by business management and by measuring risk and performance data against risk appetite and KRI escalation thresholds that are updated periodically. Escalation procedures are in place to notify the appropriate governance committees in the event of any actual risk limit breaches or potential upcoming breaches. In addition to metrics, independent CRM testing also informs how well risks are managed.
Risk Management
We have policies and a defined governance structure in place to manage risks. In the event of a risk exposure exceeding established thresholds, management determines appropriate response actions. Responses, which may be taken by the Board of Directors, the Risk Oversight Committee, the Audit Committee, the Risk Committee, sub-committees or the CRO, or business units, may include (i) actions to directly mitigate or resolve risk,risk; (ii) actions to terminate any activities resulting in an undesired or unintended risk position,position; or (iii) actions to prevent, avoid, modify, share or accept a risk position (or activity prior to its occurrence).
Risk Reporting
As the constituents primarily responsible for proactively managing the risks to which they are exposed, our business units and risk and control functions periodically report to the governance committees. The CRM function is responsible for independent reporting on risk matters to various constituencies across theour Company on a periodicregular basis. The CRM department periodically provides risk management reporting to the Risk Committee, the Audit Committee, the Risk Oversight Committee and the Board of Directors.
Stress Testing
We use stress testing to better understand the range of potential risks and their impacts to which theour Company is exposed. A stress testing framework is employed to provide a comprehensive, integrated and forward-looking assessment of material risks and vulnerabilities. Stress test results provide information for business strategy, risk appetite setting and decisions related to capital actions, contingency capital plans, liquidity buffer, contingency funding plans and balance sheet positioning. Our stress testing framework utilizes a risk inventory, which covers our risk exposures across our defined risk categories. The risk inventory provides a comprehensive view of our vulnerabilities capturing current and emergingsignificant risks from the Board of Directors’ and management’s view, granular risks relevant to business units and emerging risks associated with new initiatives.
Risk Management Review of Compensation
The design and administration of our compensation programs provide incentives that seek to appropriately balance risk and financial results in a manner that does not incentivize employees to take imprudent risks, is compatible with effective controls and enterprise-wide risk management and is supported by strong corporate governance, including oversight by our Board of Directors and the Compensation and Leadership Development CommitteeCLDC of our Board of Directors. At least annually, the CLDC meets with the CRO to review and discuss the results of the assessment of whether our compensation plans encourage imprudent risk-taking that could threaten the value of, or have a material adverse effect on, our Company or result in a failure to comply with regulatory requirements.
-17-
Risk Appetite and Strategic Limit Structure
Risk appetite is defined as the aggregate level and the type of risks we are willing to accept or avoid in order to achieve our strategic objectives. Risk appetite expressions are consistent with the Company’sour aspirations, mission statement and core values and also serve as tools to preclude business activities that could have a negative impact on our reputation.
Risk appetite is expressed through both quantitative limits and qualitative expressions to recognize a range of possible outcomes and to help set boundaries for proactive management of risks. Risk appetite measures take into account the risk profile of the businesses, the external macroeconomic environment and stakeholder views, including those of shareholders, regulators, ratings agencies and customers. These limits and expressions are revised at least annually or as warranted by changes in business strategy, risk profile and external environment.
Management and our CRM department monitor approved limits and escalation triggers to ensure that the business is operating within the approved risk appetite. Risk limits are monitored and reported on to various risk sub-committees, the Risk Committee and our Board of Directors, as appropriate. Through ongoing monitoring of risk exposures, management seeks to be able to identify appropriate risk response and mitigation strategies in order to react dynamically to changing conditions.
Capital Planning
Risk exposures identified through the risk identification process across risk categories and risk types are consolidated to create a comprehensive risk inventory. This inventory is leveraged by a number of processes within theour Company including stress scenario design, capital planning, risk appetite setting and risk modeling. The risk inventory is reviewed and approved at least annually by the Capital Planning Committee along with the Risk Committee and sub-committees to ensure transparency and comprehensive coverage of risk exposures. Our capital planning and management framework encompasses forecasting capital levels, establishing capital targets, monitoring capital adequacy against targets, maintaining appropriate contingency capital plans and identifying strategic options to deploy excess capital.
Supervision and Regulation
General
Our operations are subject to extensive regulation, supervision and examination under U.S. federal state and foreignstate laws and regulations.regulations, and under the legal or regulatory frameworks of certain foreign jurisdictions. As a bank holding company under the Bank Holding Company Act of 1956 and a financial holding company under the Gramm-Leach-Bliley Act, we are subject to the supervision, examination and regulation ofby the Federal Reserve. As a large provider of consumer financial services, we are subject to the supervision, examination and regulation of the Consumer Financial Protection Bureau (the “CFPB”(“CFPB”).
Bank Holding Company Regulation
Permissible activities for a bank holding company include owning a bank as well as those activities that are so closely related to banking as to be a proper incident thereto, such as consumer lending and other activities that have been approved by the Federal Reserve by regulation or order. Certain servicing activities are also permissible for a bank holding company if conducted for or on behalf of the bank holding company or any of its affiliates. Impermissible activities for bank holding companies include non-financial activities that are related to commerce such as manufacturing or retail sales of non-financial products.
A financial holding company and the non-bank companies under its control are permitted to engage in activities considered financial in nature, incidental to financial activities, or complementary to financial activities, if the Federal Reserve determines that such activities pose no risk to the safety or soundness of depository institutions or the financial system in general. Being a financial holding company under the Gramm-Leach-Bliley Act requires that the depository institutions thatinstitution we control meetmeets certain criteria, including capital, management and Community Reinvestment Act
-18-
requirements. In addition, under the Dodd-Frank Wall Street Reform and Consumer Protection Act (the “Dodd-Frank(“Dodd-Frank Act”) we are required to meet certain capital and management criteria to maintain our status as a financial holding company. Failure to meet the criteria for financial holding company status results in restrictions on new financial activities or acquisitions and could require discontinuance of existing activities that are not otherwise generally permissible for bank holding companies.
Federal Reserve regulations and the Federal Deposit Insurance Act (the “FDIA”(“FDIA”), as amended by the Dodd-Frank Act, require thata bank holding companiescompany to serve as a source of strength to eachits subsidiary bankbank(s) and commit resources to support each subsidiary bank. This support may be required at times when a bank holding company may not be able to provide such support without adversely affecting its ability to meet other obligations.
The Dodd-Frank Act addresses risks to the economy and the payments system, especially those posed by large systemically significantimportant financial firms.institutions. When the Dodd-Frank Act was first signed into law, all bank holding companies with $250 billion or more in total consolidated assets became subject to enhanced prudential standards. The Dodd-Frank Act was subsequently amended by the Economic Growth, Regulatory Relief, and Consumer Protection Act (“EGRRCPA”) amended the Dodd-Frank Act by raising the asset size thresholds for certain enhanced prudential standards. Under the amended statute,to provide the Federal Reserve is authorizedwith the authority to impose certain enhanced prudential standards on bank holding companies with total consolidated assets of at leastbetween $100 billion and $250 billion, including Discover,DFS, only after issuing a new regulation or order based on a risk-based determination. In October 2019, the federal banking regulators approvedagencies issued final rules that tailortailored the existing regulatory requirements in effect at that time related to capital, liquidity and enhanced prudential standards to an institution’salign with the risk and complexity profile forprofiles of banking institutions with total consolidated assets of $100 billion or more. Under the final rules, Discoverwhich became effective in December 2019, DFS is considered a Category IV institution and therefore subject to the least stringent category of enhanced prudential standards for bank holding companies with at least $100 billion in total assets. Among other things, DiscoverDFS is required to submit to supervisory stress tests every other year rather than annually, is no longer subject to regulations requiring DiscoverDFS to submit the results of company-run capital stress tests and is no longer subject to the liquidity coverage ratio. DiscoverHowever, DFS is however still required to submit annual capital plans to the Federal Reserve and remains subject to other core components of the enhanced prudential standards, rules, such as risk-management and risk committee requirements and liquidity risk management regulations. The final rules
In January 2021, the Federal Reserve finalized regulatory amendments that made targeted changes to the capital planning, regulatory reporting and stress capital buffer (“SCB”) requirements for firms subject to Category IV standards, including DFS, to be consistent with the Federal Reserve’s regulatory tailoring framework that became effective in December 31, 2019. Among other things, the amended rules provide Category IV institutions with the option to submit to supervisory stress tests during off years if they wish for the Federal Reserve to reset the stress test portion of their SCB requirement.
On June 23, 2022, the Federal Reserve released results of the 2022 CCAR exercise. Discover’s results showed strong capital levels under stress, test.well above regulatory minimums. These results were used to set the new SCB effective October 1, 2022. On August 4, 2022, the Federal Reserve disclosed the new SCB for DFS is 2.5%, the lowest possible requirement.
-19-
Regulatory and supervisory developments, findings and ratings could negatively impact our business strategies or require us to: limit or change our business practices, restructure our products in ways that we may not currently anticipate, limit our product offerings, invest more management time and resources in compliance efforts, limit the fees we can charge for services or limit our ability to pursue certain business opportunities and obtain related required regulatory approvals. For additional information regarding bank regulatory limitations on acquisitions and investments, see “— Acquisitions and Investments.” See Note 19: Litigation and Regulatory Matters to our consolidated financial statements for more information on recent matters affecting Discover.us. Regulatory developments could also influence our strategies, impact the value of our assets, or otherwise adversely affect our businesses. For more information regarding the regulatory environment and developments under the Dodd-Frank Act, see “Management’s Discussion and Analysis of Financial Condition and Results of Operations — Regulatory Environment and Developments” and “Risk Factors.”
Capital, Dividends and Share Repurchases
In addition to the supervisory minimum levels of capital described above, Federal Reserve rules applicable to Discover Financial ServicesDFS require maintenance of the following minimum capital ratios to be considered “well-capitalized” for certain purposes under Regulation Y (12 CFR 225): (i) a Tier 1 risk-based capital ratio of 6% and (ii) a total risk-based capital ratio of 10%. Our banking subsidiaries arebank subsidiary is required by the FDIC’s Prompt Corrective Action rules to maintain the following minimum capital ratios to be considered “well-capitalized”: (i) a common equity Tier 1 capital ratio of 6.5%; (ii) a Tier 1 risk-based capital ratio of 8%; (iii) a total risk-based capital ratio of 10%; and (iv) a Tier 1 leverage ratio of 5%. At December 31, 2019, Discover Financial Services2022, DFS met all requirements to be deemed “well-capitalized” pursuant to the applicable regulations. For related information regarding our bank subsidiariessubsidiary see “— FDIA” below.
There are various federal and state law limitations on the extent to which our banking subsidiariesbank subsidiary can provide funds to us through dividends, loans or otherwise. These limitations include minimum regulatory capital requirements, federal and state banking law requirements concerning the payment of dividends out of net profits or surplus, affiliate transaction limits and general federal and state regulatory oversight to prevent unsafe or unsound practices. In general, federal and applicable state banking laws prohibit, without first obtaining regulatory approval, insured depository institutions, such as our banking subsidiaries,Discover Bank, from making dividend distributions if such distributions are not paid out of available earnings or would cause the institution to fail to meet applicable capital adequacy standards. For more information, see “— FDIA” below.
Additionally, we are subject to regulatory requirements imposed by the Federal Reserve as part of its stress testing framework and its CCAR program. As discussed above, in 2019 Discover was notified that it was not required to participate in CCAR or submit to supervisory stress tests forFor the 2019 stress test cycle. However, Discover’sthird and fourth quarters of 2020, the Federal Reserve limited covered firms’ capital distributions, for the period between July 1, 2019including common stock dividends and June 30, 2020 are limitedrepurchases, based on a formula that is largelyrestricts most share repurchases and limits dividends based on results fromaverage net income during the preceding four quarters. The Federal Reserve extended these restrictions, with modifications, for all covered firms through the second quarter of 2021. In March 2021, the Federal Reserve extended the right to recalculate our SCB through June 30, 2021. In June 2021, the Federal Reserve announced that our SCB requirement would not be recalculated and, effective June 30, 2021, we were authorized to make capital distributions that are consistent with the Federal Reserve’s 2018 supervisory stress test. Discover is required to submit a capital plan torule, inclusive of our final SCB requirement of 3.5% that was previously announced by the Federal Reserve and participate in the 2020 CCAR stress tests. Therefore, Discover’s capital distributions during the period between July 1, 2020 and June 30, 2021 will be subject to regulatory constraints that are based on the results of the 2020 supervisory stress tests.August 2020.
For more information on capital planning, including additional conditions and limits on our ability to pay dividends and repurchase our stock, see “— Bank Holding Company Regulation,” “Risk Factors — Credit, MarketOperational and Liquidity RiskOther Risks — We may be limited in our ability to pay dividends on and repurchase our stock,” “Risk Factors — Operational and “—Other Risks — We are a holding company and depend on payments from our subsidiaries,” “Management’s Discussion and Analysis of Financial Condition and Results of Operations — Regulatory Environment and Developments,” “Management’s Discussion and Analysis of Financial Condition and Results of Operations — Liquidity and Capital Resources — Capital” and Note 17: Capital Adequacy to our consolidated financial statements.
-20-
FDIA
The FDIA imposes various requirements on insured depository institutions. For example, the FDIA requires, among other things, the federal banking agencies to take “prompt corrective action” in respect of depository institutions that do not meet minimum capital requirements. The FDIA sets forth the following five capital tiers: “well-capitalized,” “adequately capitalized,” “undercapitalized,” “significantly undercapitalized” and “critically undercapitalized.” A depository institution’s capital tier will depend upon how its capital levels compare with various relevant capital measures and certain other factors that are established by regulation. At December 31, 2019,2022, Discover Bank and Bank of New Castle met all applicable requirements to be deemed “well-capitalized.”
The FDIA also prohibits any depository institution from making any capital distributions (including payment of a dividend) or paying any management fee to its parent holding company if the depository institution would thereafter be “undercapitalized.” “Undercapitalized” institutions are subject to growth limitations and are required to submit a capital restoration plan. For a capital restoration plan to be acceptable, among other things, the depository institution’s parent holding company must guarantee that the institution will comply with the capital restoration plan.
If a depository institution fails to submit an acceptable capital restoration plan, it is treated as if it is “significantly undercapitalized.” “Significantly undercapitalized” depository institutions may be subject to a number of requirements and restrictions, including orders to sell sufficient voting stock to become “adequately capitalized,” requirements to reduce total assets and cessation of receipt of deposits from correspondent banks. “Critically undercapitalized” institutions are subject to the appointment of a receiver or conservator.
The FDIA prohibits insured banks from accepting brokered deposits or offering interest rates on any deposits significantly higher than the prevailing rate in the bank’s normal market area or nationally (depending upon where the deposits are solicited), unless it is “well-capitalized,” or it is “adequately capitalized” and receives a waiver from the FDIC. Under current FDIC regulations, a bank that is less than “well-capitalized” is generally prohibited from payingsoliciting deposits by offering an interest rate on deposits in excess ofthat exceeds 75 basis points over the national market average.average or 120 percent of the current yield on a similar maturity U.S. Treasury obligation plus 75 basis points, whichever is higher. There are no such restrictions under the FDIA on a bank that is “well-capitalized.” As of December 31, 2019,2022, Discover Bank and Bank of New Castle each met the FDIC’s definition of a “well-capitalized” institution for purposes of accepting brokered deposits. An inability to accept brokered deposits in the future could materially adversely impact our funding costs and liquidity. For more information, see “Risk Factors — Credit, Market and Liquidity Risk — An inability to accept or maintain deposits in the future could materially adversely affect our liquidity position and our ability to fund our business.”
The FDIA also affords FDIC insured depository institutions, such as Discover Bank, and Bank of New Castle, the ability to “export” interest rates permitted under the laws of the state where the bank is located. Discover Bank and Bank of New Castle are bothis located in Delaware and, therefore, can charge interest on loans to out-of-state borrowers at rates permitted under Delaware law, regardless of the usury limitations imposed by the state laws of the borrower’s residence. Delaware law does not limit the amount of interest that may be charged on loans of the type offered by
Discover Bank or Bank of New Castle.Bank. This flexibility facilitates the current nationwide lending activities of Discover Bank and Bank of New Castle.Bank.
The FDIA subjects Discover Bank to deposit insurance assessments. Under the Dodd-Frank Act, in orderIn an effort to bolster the reserves of the Deposit Insurance Fund, the Dodd-Frank Act raised the statutory minimum reserve ratio set byfor the FDIC was increasedFund to 1.35% and subsequently the FDIC set a reserve ratio of 2%. The Dodd-Frank Act removed the statutory cap for the designated reserve ratio leaving(“DRR”). The FDIA requires the FDIC free to setdesignate and publish a cap inDRR annually. For 2022, the future.DRR was 2.00%. The FDIC also previouslyrecently amended its deposit insurance regulations in ways that have raisedto increase initial base deposit insurance assessment rate schedules, beginning with the first quarterly assessment period of 2023, which will raise Discover Bank’s cost of deposit insurance. Further increases may occur in the future.
Discover Bank is subject to the FDIC’s final rule requiring periodic submission of a resolution plan to the FDIC. In June 2021, the FDIC announced a modified approach to its implementation of certain aspects of its resolution plan rule as it relates to insured depository institutions with $100 billion or more in total assets. Discover Bank is required to submit a resolution plan to the FDIC on a three-year cycle, with its first filing due on December 1, 2022, under the FDIC’s modified approach. Discover Bank submitted its most recent resolution plan to the FDIC in November 2022.
Acquisitions and Investments
Since we are a bank holding company, and Discover Bank and Bank of New Castle areis an insured depository institutions,institution, we are subject to banking laws and regulations that limit the types of acquisitions and investments that we can make. In addition, certain permitted acquisitions and investments that we seek to make are subject to the prior review and approval of our banking regulators, including the Federal Reserve and FDIC. Our banking regulators have broad discretion on whether
-21-
to approve proposed acquisitions and investments. In deciding whether to approve a proposed acquisition, federal bank regulators will consider, among other factors, the effect of the acquisition on competition,competition; our financial condition and our future prospects, including current and projected capital ratios and levels; the competence, experience and integrity of our management and our record of compliance with laws and regulations; the convenience and needs of the communities to be served, including our record of compliance under the Community Reinvestment Act; and our effectiveness in combating money laundering. Therefore, results of supervisory activities of the banking regulators, including examination results and ratings, can impact whether regulators approve proposed acquisitions and investments. For more information on recent matters affecting Discover,us, see Note 19: Litigation and Regulatory Matters to our consolidated financial statements. For information on the regulatory environment, see “Risk Factors.”
In addition, certain acquisitions of our voting stock may be subject to regulatory approval or notice under U.S. federal or Delaware state law. Investors are responsible for ensuring that they do not, directly or indirectly, acquire shares of our stock in excess of the amount that can be acquired without regulatory approval under the Change in Bank Control Act, the Bank Holding Company Act and the Delaware Change in Bank Control provisions, which prohibit any person or company from acquiring control of us without, in most cases, the prior written approval of each of the FDIC, the Federal Reserve and the Delaware Commissioner.
Consumer Financial Services
The relationship between us and our U.S. customers is regulated extensively under federal and state consumer protection laws. Federal laws include the Truth in Lending Act, the Equal Credit Opportunity Act, the Fair Credit Reporting Act, the Gramm-Leach-Bliley Act, the Credit Card Accountability Responsibility and Disclosure Act, the Servicemembers Civil Relief Act, the Military Lending Act, the Truth in Savings Act, the Electronic Fund Transfer Act and the Dodd-Frank Act. These and other federal laws, among other things, prohibit unfair, deceptive and abusive trade practices, require disclosures of the cost of credit and other terms of credit and deposit accounts, provide substantive consumer rights, prohibit discrimination in credit transactions, regulate the use of credit report information, provide privacy protections, require safe and sound banking operations, restrict our ability to raise interest rates, protect customers serving in the military and their dependents and subject us to substantial regulatory oversight. The CFPB has rulemaking and interpretive authority under the Dodd-Frank Act and other federal consumer financial services laws, as well as broad supervisory, examination and enforcement authority over large providers of consumer financial products and services, such as Discover.DFS. For more information, see “Management’s Discussion and Analysis of Financial Condition and Results of Operations — Regulatory Environment and Developments — Consumer Financial Services.” State and, in some cases, local laws also may regulate in these areas, as well as in the areas of collection practices, and may provide other additional consumer protections.
Violations of applicable consumer protection laws can result in significant potential liability in litigation by customers, including civil monetary penalties, actual damages, restitution and attorneys’ fees. Federal banking regulators, as well as state attorneys general and other state and local consumer protection agencies, also may seek to enforce consumer protection requirements and obtain these and other remedies. Further violations may cause federal banking regulators to deny, or delay approval of, potential acquisitions and investments. See “— Acquisitions and Investments.”
We are subject to additional laws and regulations affecting mortgage lenders. Federal, state and, in some instances, local laws apply to mortgage lending activities. These laws generally regulate the manner in whichthat mortgage lending and lending-related activities are conducted, including advertising and other consumer disclosures, payments for services and recordkeeping requirements. These laws include the Real Estate Settlement Procedures Act, the Fair Credit Reporting Act, the Truth in Lending Act, the Equal Credit Opportunity Act, the Fair Housing Act, the Home Mortgage Disclosure Act and various state laws. For more information, see “Management’s Discussion and Analysis of Financial Condition and Results of Operations — Regulatory Environment and Developments — Consumer Financial Services.”
Payment Networks
We operate the Discover and PULSE networks, which deliver switching and settlement services to financial institutions and other program participants for a variety of ATM, POS and other electronic banking transactions. These operations are regulated by certain federal and state banking, privacy and data security laws. Moreover, the Discover and PULSE networks are subject to examination under the oversight of the Federal Financial Institutions Examination Council, an interagency body composed of the federal bank regulators and the National Credit Union Administration. In addition, as our payments business has expanded globally through Diners Club, we are subject to government
-22-
regulation in countries in which our networks operate or our cards are used, either directly or indirectly through regulation affecting Diners Club network licensees. Changes in existing federal, state or international regulation could increase the cost or risk of providing network services, change the competitive environment, or otherwise materially adversely affect our operations. The legal environment regarding privacy and data security is particularly dynamic and any unpermitted disclosure of confidential customer information could have a material adverse impact on our business, including loss of consumer confidence.
The Dodd-Frank Act contains several provisions that are relevant to the business practices, network transaction volume, revenue and prospects for future growth of PULSE, our debit card network business. The Dodd-Frank Act requires that merchants control the routing of debit transactions and that interchange fees received by certain payment card issuers on debit card transactions be “reasonable and proportional” to the issuer’s cost in connection with such transactions, as determined by the Federal Reserve. The Dodd-Frank Act also requires the Federal Reserve to restrict debit card networks and issuers from requiring debit card transactions to be processed solely on a single payment network or two or more affiliated networks, or from requiring that transactions be routed over certain networks. For information regarding related impacts on our debit card business, see “Management’s Discussion and Analysis of Financial Condition and Results of Operations — Regulatory Environment and Developments — Payment Networks.”
Money Laundering & Terrorist Financing Prevention Program
We maintain an enterprise-wide program designed to comply with all applicable anti-money laundering and anti-terrorism laws and regulations, including the Bank Secrecy Act and the USA PATRIOT Act of 2001. This program includes policies, procedures, training and other internal controls designed to mitigate the risk of money laundering or terrorist financing posed by our products, services, customers and geographic locale. These controls include procedures and processes to detect and report suspicious transactions, perform customer due diligence and meet all recordkeeping and reporting requirements related to particular transactions involving currency or monetary instruments. The program is coordinated by our anti-money laundering compliance and sanctions officer and undergoes regular independent audits to assess its effectiveness. Our program is typically reviewed on an annual basis by federal banking regulators. On February 13, 2020, the Federal Reserve Board announced that the May 2015 written agreement between Discover Financial Services and the Federal Reserve Bank of Chicago related to Discover Financial Services’ anti-money laundering and related compliance programs had been terminated effective February 5, 2020. See Note 19: Litigation and Regulatory Matters to our consolidated financial statements for more information. For additional information regarding bank regulatory limitations on acquisitions and investments, see “— Acquisitions and Investments.”
Sanctions Programs
We have a program designed to comply with applicable economic and trade sanctions programs, including those administered and enforced by the U.S. Department of the Treasury’s Office of Foreign Assets Control. These sanctions are usually targeted against foreign countries, terrorists, international narcotics traffickers and those believed to be involved in the proliferation of weapons of mass destruction. These regulations generally require either the blocking of accounts or other property of specified entities or individuals, but they may also require the rejection of certain transactions involving specified entities or individuals. We maintain policies, procedures and other internal controls designed to comply with these sanctions programs.
-23-
Information About Our Executive Officers
Set forth below is information concerning our executive officers, each of whom is a member of our Executive Committee.
| Name | Age | Position | ||||||
| Roger C. Hochschild | Chief Executive Officer and President | |||||||
| John T. Greene | Executive Vice President, Chief Financial Officer | |||||||
| Executive Vice President, Chief | ||||||||
| Daniel P. Capozzi | Executive Vice President, President - | |||||||
| R. Andrew Eichfeld | Executive Vice President, Chief Human Resources and Administrative Officer | |||||||
| Executive Vice President, Chief Legal Officer and General Counsel | ||||||||
| Carlos M. Minetti | 60 | Executive Vice President, President - Consumer Banking | ||||||
| Diane E. Offereins | 65 | Executive Vice President, President - Payment Services | ||||||
| Michael E. Roemer | 60 | Executive Vice President, Chief Risk Officer | ||||||
| Keith E. Toney | 51 | Executive Vice President, Data and Analytics | ||||||
Roger C. Hochschild is our Chief Executive Officer and President, a position he has held since October 2018. Mr. Hochschild was also elected to the Discover Board of Directors in August 2018. From 2004 to 2018, Mr. Hochschild served as President and Chief Operating Officer. Prior to that, he was Executive Vice President, Chief Administrative and Strategic Officer (2001 to 2004) and Executive Vice President, Chief Marketing Officer - Discover (1998 to 2001) of our former parent company Morgan Stanley. Mr. Hochschild holds a Bachelor’s degree in Economics from Georgetown University and an M.B.A. from the Amos Tuck School at Dartmouth College.
John T. Greene is our Executive Vice President, Chief Financial Officer. He has held this role since September 2019. Prior to joining Discover, Mr. Greene served as Executive Vice President, Chief Financial Officer and Treasurer at Bioverativ, a global biopharmaceutical company. From 2014 to 2016, he was Chief Financial Officer for Willis Group Holdings, which was preceded by more than eight years at HSBC Holdings where he held CFO positions for several divisions, including retail bank and wealth management, insurance and consumer and mortgage lending. He also held various CFO roles in his 12-year tenure with General Electric from 1993 to 2005. Mr. Greene holds a Bachelor’s degree in accountingAccounting from the State University of New York and an M.B.A. from the Kellogg School of Management at Northwestern University.
Daniel P. Capozzi is our Executive Vice President, President - Credit Operations and Decision Management.U.S. Cards. He has held this role since December 2020. In October 2018, he was appointed to the role of Executive Vice President, President - Credit Operations and Decision Management and also previously served as Senior Vice President, Credit and Decision Management beginning in June 2017. Since joining Discover in 2007, Mr. Capozzi has held leadership positions in the Deposits business and Corporate Finance. Prior to joining Discover, he held various leadership positions in Finance at CitiCitibank and Bank of America. Mr. Capozzi holds a Bachelor’s degree in Business Administration from Northeastern University.
R. Andrew Eichfeld is our Executive Vice President, Chief Human Resources and Administrative Officer. He has held this role since September 2018. Prior to joining Discover, Mr. Eichfeld was an independent advisor from 2017 to 2018 and held various positions at McKinsey & Company from 1995 to 2017, where he was elected a senior partner in 2009. Mr. Eichfeld holds a Bachelor’s degree in Government from Oberlin College, as well as a Master’s degree in Middle Eastern studies and an M.B.A. in Marketing, both from the University of Chicago.
-24-
Carlos M. Minetti is our Executive Vice President, President - Consumer Banking. He has held this role since February 2014. Previously, he served as Executive Vice President, President - Consumer Banking and Operations (2010 to 2014), Executive Vice President, Cardmember Services and Consumer Banking (2007 to 2010), and Executive Vice President for Cardmember Services and Chief Risk Officer (2001 to 2007). Prior to joining us, Mr. Minetti worked in card operations and risk management for American Express from 1987 to 2000, most recentlywhere he last served as Senior Vice President. Mr. Minetti holds a Bachelor’s degree in Industrial Engineering from Texas A & M University and an M.B.A. from the Booth School of Business at The University of Chicago.
Diane E. Offereins is our Executive Vice President, President - Payment Services. She has held this role since April 2010. Previously, she served as Executive Vice President, Payment Services (2008 to 2010) and Executive Vice President and Chief Technology Officer (1998 to 2008). In 2006, she assumed leadership of the PULSE network. Prior to joining us, Ms. Offereins worked at MBNA America Bank from 1993 to 1998, most recentlywhere she last served as Senior Executive Vice President. Ms. Offereins holds a Bachelor’s degree in Accounting from Loyola University New Orleans.
-25-
Item 1A. Risk Factors
You should carefully consider each of the following risks described below and all of the other information in this annual report on Form 10-K in evaluating us. Our business, financial condition, cash flows and/or results of operations could be materially adversely affected by any of these risks. The trading price of our common stock could decline due to any of these risks. This annual report on Form 10-K also contains forward-looking statements that involve risks and uncertainties. Our actual results could differ materially from those anticipated in these forward-looking statements as a result of certain factors, including the risks faced by us described below and elsewhere in this annual report on Form 10-K. See “Special Note Regarding Forward-Looking Statements,” which immediately follows the risks below.
Summary
The following is a summary of the most important risks that could materially adversely affect our business, financial condition, cash flows and/or results of operations, and should be read together with the more detailed description of risks that follow:
•Economic and Regulatory: As a consumer financial services and payment services company, we are subject to risks stemming from new laws and regulations and an uncertain economic environment.
•Strategic: We must successfully compete against firms that are larger than we are and have more resources than we do as well as firms that are smaller and potentially disruptive to our industry as we manage the unique risks associated with each of our product offerings.
•Credit, Market and Liquidity: We must effectively manage our desire to grow our loan portfolio against the risk that those loans will not be repaid, while ensuring that we manage the underlying cost of the funds we use to make those loans and sources of funding we rely on to fund those loans.
•Operational and Other Risks: We must remain operationally effective and manage operational and reputational risks such as fraud and cybersecurity, while continuing to monitor and effectively respond to an external environment that may negatively impact the utilization or desirability of our products and services.
Current Economic and Regulatory Environment
Economic conditions could have a material adverse effect on our business, results of operations and financial condition.
As a provider of consumer financial services, our business, results of operations and financial condition are subject to the United StatesU.S. and global economic environment. While the economy appears to be stable, we are experiencing the normalization of delinquency and charge-off rates and entering a period during which these rates increase to long-run levels as the supply of consumer credit grows. A customer’s ability and willingness to repay us can be negatively impacted by not only economic conditions but also a customer’s other payment obligations.
Economic conditions also can reduce the usage of credit cards in general and the average purchase amount of transactions industry-wide, including our cards, which reduces interest income and transaction fees. We rely heavily on interest income from our credit card business to generate earnings. Our interest income from credit card loans was $9.7$10.6 billion for the year ended December 31, 2019,2022, which was 85%80% of net revenues (defined as net interest income plus other income), compared to $8.8$8.7 billion for the year ended December 31, 2018,2021, which was 83%72% of net revenues. Economic conditions combined with a competitive marketplace could result in slow loan growth, resulting in reduced revenue growth from our core directdigital banking business.
Financial regulatory developments have had an impact and will continue to significantly impact the environment for the financial services industry, which could adversely impact our business, results of operations and financial condition.
The EGRRCPA was signed into law on May 24, 2018. The act generally redefined a U.S. domestic Systemically Important Financial Institution as a banking institution with assets above $250 billion or that meets other risk-based criteria and required the federal banking agencies to tailor their enhanced prudential regulations for domestic bank holding companies accordingly. The banking agencies issued final rules to implementimplementing the tailoring requirements of the2018’s EGRRCPA became effective in November 2019, with an effective date of December 31, 2019. Under the final rules, DiscoverDFS is considered a Category IV institution and therefore subject to the least stringent category of enhanced prudential standards for domestic bank holding companies with at least $100 billion in total assets. Accordingly, Discover will beHowever, many of the core components of the regulations implementing enhanced prudential standards remain in place. Since 2020, DFS has been subject to slightly more tailored requirements for capital stress testing, liquidity risk management and resolution planning beginning in 2020. However, many of the core components of these regulations remain in place.planning.
Meanwhile, the portionsmajority of the provisions of the Dodd-Frank Act were unchanged by the EGRRCPA and remain law,in effect, including provisions governing the practices and oversight of financial institutions and other firms that participateengaged in financial markets. The Senate and regulatory agency leadership may continue to support tailoring of the regulatory burden on large financial institutions, including Discover. Further legislative changes to the Dodd-Frank Act remain uncertain due to the potentially divergent agendas of the House and Senate and upcoming elections. Further, the outcome of supervisory and regulatory reform efforts at the federal banking agencies remains uncertain. Also, it is possible that regulatory reform measures may disproportionately benefit our competitors or not benefit Discover at all due to our size, structure or product offerings, among other things.
services activities. The impact of the evolving regulatory environment on our business and operations depends upon a number of
-26-
factors, including (i) the supervisorylegislative priorities of the U.S. Congress, (ii) priorities and actions of the Federal Reserve, the FDIC and the CFPB, the actions ofConsumer Financial Protection Bureau (“CFPB”), (iii) implications resulting from our competitors and other marketplace participants as well as the behavior of consumers. and (iv) changing consumer behavior. For additional information regarding bank regulatory matters impacting us, see “Business — Supervision and Regulation.”
Regulatory and legislative developments, findings and actions have had and could continue to negativelyhave a negative impact on our business strategies or require us to: limit, exit or changemodify our business practices and product offerings; restructure our products in ways that we may not currently anticipate, limit our product offerings,unanticipated ways; invest more management time and resources in compliance efforts,efforts; limit the fees we can charge for services,services; impact the value of our assets; or limit our ability to pursue certain innovations and business opportunities and obtain related required regulatory approvals. For example, the Federal Reserve and the FDIC enforcement actions related to our anti-money laundering program have caused us to change our processes and incur significant expenses. For additional information regarding bank
regulatory limitations on acquisitions and investments, see “Business — Supervision and Regulation — Acquisitions and Investments.” See alsoFurthermore, see Note 19: Litigation and Regulatory Matters to our consolidated financial statements for more information on recent matters affecting Discover. Regulatory developments could also influenceus. It is possible that any new regulatory measures or legislation may disproportionately affect us due to our strategies, impact the value of our assets,size, structure or otherwise adversely affect our businesses.product offerings, among other things.
Compliance expectations and expenditures have steadily and significantly increased significantly for Discoverus and the same is true for other financial services firms, and are expectedwe expect this trend to continue to increase as regulators remain focusedescalate their focus on adequacy of controls to support business operations. We may face compliance and operational processes andregulatory risks if we introduce new or changed products or features or enter into new business arrangements. We may face additional compliance and regulatory risk to the extent that weservices or enter into new business arrangements with third-party service providers, alternative payment providers, or other industry participants. TheHeightened regulatory expectations and increased volume of regulatory changes may generate additional expense,expenses or require significant time and resources needed to comply with ongoing or additional regulatory requirements may adversely impact our business and results of operations.maintain compliance.
For more information regarding the regulatory environment and developments potentially impacting Discover,us, see “Management’s Discussion and Analysis of Financial Condition and Results of Operations — Regulatory Environment and Developments.”
Strategic Business Risk
We face competition in the credit card market from other consumer financial services providers and we may not be able to compete effectively, which could result in fewer customers and lower account balances and could materially adversely affect our financial condition, cash flows and results of operations.
The consumer financial services business is highly competitive. We compete with other consumer financial services providers, including non-traditional providers of financing and payment services such as financial technology firms, based on the basis of a number ofseveral factors, including brand, reputation, customer service, product offerings, incentives, pricing, e-wallete-commerce and digital wallet participation and other terms. Competition in credit cards is also based on merchant acceptance and the value provided to the customer by rewards programs.programs and other innovations. Many credit card issuers have instituted rewards programs that are similar to ours and, in some cases, could be viewed as more attractive to customers than our programs. These competitive factors affect our ability to attract and retain customers, increase usage of our products and maximize the revenue generated by our products. In addition, because most domestically-issued credit cards, other than those issued by American Express, are issued on the Visa and MasterCard networks, most other card issuers benefit from the dominant position and marketing and pricing power of Visa and MasterCard. The competitive marketplace could result in slower loan growth, resulting in reduced revenue growth from our core directdigital banking business. If we are unable to compete successfully, or if competing successfully requires us to take aggressive actions in response to competitors’ actions, our financial condition, cash flows and results of operations could be materially adversely affected.
We incur considerable costcosts in competing with other consumer financial services providers and many of our competitors have greater financial resources than we do, which may place us at a competitive disadvantage and negatively affect our financial results.
We incur considerable costcosts in competing with other consumer financial services providers to attract and retain customers and increase usage of our products. A substantial portion of this cost relates to marketing expenditures and rewards programs. Since 2013 our rewards rate, which represents rewards cost divided by Discover Card sales volume, has increased from less than 1% to 1.33%1.41% in 2019.2022. We expect the competitive intensity in the rewards space to continue, which could result in a continued increase in the cost of our rewards rate.programs. Our consumer financial services products compete primarily based on the basis of pricing, terms and service. Because of the highly competitive nature of the credit card-issuing business, a primary method of competition among credit card issuers, including us, has been to offer rewards programs, low introductory interest rates, attractive standard purchase rates and balance transfer programs
-27-
that offer a favorable annual percentage rate or other financial incentives for a specified length of time on account balances transferred from another credit card.
Competition is intense in the credit card industry and customers may frequently switch credit cards or transfer their balances to another card. We expect to continue to invest in initiatives to remain competitive in the consumer financial services industry, including the launch of new cards and features, brand awareness initiatives, targeted marketing, online and mobile enhancements, e-wallet participation, customer service improvements, credit risk management and operations enhancements and infrastructure efficiencies. ThereHowever, there can be no assurance that any of the costcosts we incur or incentives we offer to attempt to acquire and maintain accounts and increase usage of our products
will be effective. In addition, to the extent that we offer new products, features or services to remain competitive, we may be subject to increased operational or other risks.
Furthermore, many of our competitors are larger than we are, have greater financial resources than we do, have more breadth in banking products, have lower funding costs than we have and expect to have and have assets, such as branch locations and co-brand relationships, that may be appealing to certain customers. For example, larger credit card issuers, which have greater resources than we do, may be better positioned to fund appealing rewards, marketing and advertising programs. We may be at a competitive disadvantage as a result of the greater financial resources, diversification and scale of many of our competitors.
Our costs directly affect our earnings results. Many factors can influence the amount of our costs, as well as how quickly it may increase. Our ongoing investments in infrastructure, which may be necessary to maintain a competitive business, integrate newly-acquired businesses and establish scalable operations, increase our cost.costs. In addition, as our business develops, changes or expands, additional costcosts can arise as a result of a reevaluation of business strategies, management of outsourced services, asset purchases, structural reorganization, compliance with new laws or regulations or the acquisition of new businesses. If we are unable to successfully manage our costs successfully, our financial results will be negatively affected.
We face substantial and increasingly intense competition in the payments industry, both from traditional players and new, emerging alternative payment providers. For example, we compete with other payment networks to attract network partners to issue credit and debit cards and other card products on the Discover, PULSE and Diners Club networks, collectively the Discover Global Network. Competition with other operators of payment networks is generally based on issuer fees, fees paid to networks (including switch fees), merchant acceptance, network size and functionality, technological capabilities and other economic terms. Competition is also based on customer perception of service quality, brand image, reputation and market share. Further, we are facing increasedongoing competition from alternative payment providers, who may create innovative network or other arrangements with our primary competitors, large merchants or other industry participants, which could adversely impact our costs, transaction volume and ability to grow our business.
Many of our competitors are well established, larger than we are and/or have greater financial resources or scale than we do. These competitors have provided financial incentives to card issuers, such as large cash signing bonuses for new programs, funding for and sponsorship of marketing programs and other bonuses. Visa and MasterCard each enjoy greater merchant acceptance and broader global brand recognition than we do. Although we have made progress in merchant acceptance, we have not achieved global market parity with Visa and MasterCard. In addition, Visa and MasterCard have entered into long-term arrangements with many financial institutions that may have the effect of discouraging those institutions from issuing cards on the Discover Network or issuing debit cards on the PULSE network. Some of these arrangements are exclusive, or nearly exclusive, which further limits our ability to conduct material amounts of business with these institutions. If we are unable to remain competitive on issuer fees and other incentives, we may be unable to offer adequate pricing to network partners while maintaining sufficient net revenues.
We also face competition as merchants put pressure on transaction fees. Increasing merchant fees or acquirer fees could adversely affect our effort to increase merchant acceptance of credit cards issued on the Discover Global Network and may cause merchant acceptance to decrease. This, in turn, could adversely affect our ability to attract and retain network partners who may seek out more cost-effective alternatives from both traditional and non-traditional payment services providers, which may limit our ability to maintain or grow revenues from our proprietary network. In
-28-
addition, competitors’ settlements with merchants and related actions, including pricing pressures and/or surcharging, could negatively impact our business practices. Competitor actions related to the structure of merchant and acquirer fees and merchant and acquirer transaction routing strategies have adversely affected and are expected to continue to adversely affect our PULSE network’s business practices, network transaction volume, revenue and prospects for future growth and entry into new product markets. Visa has entered into arrangements with some merchants and acquirers that have, and are expected to continue to have, the effect of discouraging those merchants and acquirers from routing debit transactions to PULSE. In addition, the Dodd-Frank Act’s network participation requirements and competitor actions negatively impact PULSE’s ability to enter into exclusivity arrangements, which affects PULSE’s business practices and may materially adversely affect its network transaction volume and revenue. PULSE has a pending lawsuit against Visa with
respect to these competitive concerns. PULSE’s transaction processing revenue was $197$249 million and $178$227 million for the years ended December 31, 20192022 and 2018,2021, respectively.
American Express is also a strong competitor, with international acceptance, high transaction fees and an upscale brand image. Internationally, American Express competes in the same market segments as Diners Club. We may face challenges in increasing international acceptance on our networks, particularly if third parties that we rely on to issue Diners Club cards, increase card acceptance and market our brands do not perform to our expectations.
In addition, if we are unable to maintain sufficient network functionality to be competitive with other networks, or if our competitors develop better data security solutions or more innovative products and services than we do, our ability to retain and attract network partners and maintain or increase the revenues generated by our proprietary card-issuing business or our PULSE business may be materially adversely affected. Additionally, competitors may develop data security solutions, which as a consequence of the competitors’ market power, we may be forced to use. In whichthat case, our business may be adversely affected as they may be better positioned to absorb the costs over higher volumes or a larger customer base.
Our business depends upon relationships with issuers, merchant acquirers, other payment enablers and licensees, many of whom are financial institutions. The economic and regulatory environment and increased consolidation in the financial services industry decrease our opportunities for new business and may result in the termination of existing business relationships if a business partner is acquired or goes out of business. In addition, as a result of this environment, financial institutions may have decreased interest in engaging in new card issuance opportunities or expanding existing card issuance relationships, which would inhibit our ability to grow our payment services business. We continue to face substantial and intense competition in the payments industry, which impacts our revenue margins, transaction volume and business strategies.
If we are unsuccessful in maintaining our international network business and achieving meaningful global card acceptance, we may be unable to grow our international network business.
We continue to make progress toward, but have not completed, achieving global card acceptance for the Discover Global Network since we acquired the Diners Club network and related assets in 2008. Achieving global card acceptance would allow Discoverour customers, including third-party issuers leveraging the network, to use their cards at merchant and ATM locations around the world.
Our international network business depends upon the cooperation, support and continuous operation of the network licensees that issue Diners Club cards and that maintain a merchant acceptance network. As is the case for other card payment networks, our Diners Club network does not issue cards or determine the terms and conditions of cards issued by the network licensees. If we are unable to continue our relationships with network licensees or if the network licensees are unable to continue their relationships with merchants, our ability to maintain or increase revenues and to remain competitive would be adversely affected due to the potential deterioration in customer relationships and related demand that could result. If one or more licensees were to experience a significant impairment of their business or were to cease doing business for economic, regulatory or other reasons, we would face the adverse effects of business interruption in a particular market, including loss of volume, acceptance and revenue and exposure to potential reputational risk. If such conditions arise in the future, we may deploy resources and incur expenses in order to sustain network acceptance. Additionally, interruption of network licensee relationships could have an adverse effect on the acceptance of Discover cards when they are used on the Diners Club network outside of North America.
-29-
The success of our student loan strategy depends upon our abilityfailure to manage the risks of our student loan portfolio and the student lending environment. If we fail to do so, we may be unableenvironment could result in our inability to sustain and grow our student loan portfolio.
The long-term success of our student loan strategy depends upon our ability to manage the credit risk, pricing, funding, operations, including the transition away from London Interbank Offered Rate (“LIBOR”), and expenses of our student loan portfolio, as well as growthe growth of our student loan originations. Our student loan strategy is also impacted by external
factors such as the overall economic environment, a competitive marketplace and a challenging regulatory environment for private student loans and student loans generally. For more information on the regulatory environment, see “Management’s Discussion and Analysis of Financial Condition and Results of Operations — Regulatory Environment and Developments — Consumer Financial Services”Developments” and Note 19: Litigation and Regulatory Matters to our consolidated financial statements. Economic
There are several challenges to managing and growing our private student loan business in the future, including (i) economic weakness, (ii) new changes from federal and state legislation or prudential regulations, or other government and regulatory focus on higher education costs, student lending and student loan servicing, as well asservicing; and (iii) competitive factors, such as competition from non-traditional lenders such asincluding financial technology firms, may presentfirms. Examples of these challenges to managing and growing our privateinclude the recent legislative focus on federal student loan businessdebt forgiveness in bankruptcy and legislative proposals in a number of states and the future, and could causeDistrict of Columbia imposing new requirements on student loan servicing. These challenges may require us to restructure our private student loan products in ways that we may not currently anticipate. In addition, changes that adversely affect the private student loan market generally may negatively impact the profitability and growth of our student loan portfolio.
Acquisitions or strategic investments that we pursue may not be successful and could disrupt our business, harm our financial condition or reduce our earnings.
We may consider or undertake strategic acquisitions of, or material investments in, businesses, products, portfolios of loans or technologies in the future. We may not be able to identify suitable acquisition or investment candidates, or even if we do identify suitable candidates, they may be difficult to finance, expensive to fund and there is no guarantee that we can obtain any necessary regulatory approvals or complete the transactions on terms that are favorable to us. We generally must receive federal regulatory approvals before we can acquire a bank, bank holding company, deposits or certain assets or businesses. For additional information regarding bank regulatory limitations on acquisitions and investments, see “Business — Supervision and Regulation — Acquisitions and Investments.”
To the extent we pay the purchase price of any strategic acquisition or investment in cash, it may have an adverse effect on our financial condition; similarly,condition. Similarly, if the purchase price is paid with our stock, it may be dilutive to our stockholders. In addition, we may assume liabilities associated with a business acquisition or investment, including unrecorded liabilities that are not discovered at the time of the transaction, and thetransaction. The repayment or settlement of those liabilities may have an adverse effect on our financial condition.
We may not be able to successfully integrate the personnel, operations, businesses, products, or technologies of an acquisition or investment. Integration may be particularly challenging if we enter into a line of business in whichthat we have limited experience and the business operates in a difficult legal, regulatory or competitive environment. We may find that we do not have adequate operations or expertise to manage the new business. The integration of any acquisition or investment may divert management’s time and resources from our core business, which could impair our relationships with our current employees, customers and strategic partners and disrupt our operations. Additionally, any acquisition or investment may expose us to increased information security risk as we integrate new systems that we may not be as familiar with or bring them in line with the requirements of our information security and business continuity programs. Acquisitions and investments also may not perform to our expectations for various reasons, including the loss of key personnel, customers or vendors. If we fail to integrate acquisitions or investments or realize the expected benefits, we may lose the return on these acquisitions or investments or incur additional transaction costs, andcosts. As a result, our business, reputation and financial condition may be harmed as a result.harmed.
Credit, Market and Liquidity Risk
As a lender, we are exposed to the risk that our borrowers will be unable or unwilling to repay the principal of, or interest on, loans in accordance with their terms. We seek to grow our loan receivables while maintaining quality credit performance. Our success depends on our ability to manage our credit risk while attracting new customers with
-30-
profitable usage patterns. We select our customers, manage their accounts and establish terms and credit limits using externally developed and proprietary scoring models and other analytical techniques that are designed to set terms and credit limits to appropriately compensate us for the credit risk we accept, while encouraging customers to use their available credit. The models and approaches we use may not accurately predict future charge-offs due to, among other things, inaccurate assumptions. While we continually seek to improve our assumptions and models, we may make modifications that unintentionally cause them to be less predictive or we may incorrectly interpret the data produced by these models in setting our credit policies.
$800 million, or 1.27%0.85%, of our loan receivables were non-performing (defined as loans over 90 days delinquent and accruing interest, plus loans not accruing interest). While the U.S. economy appearsOur ability to be stable, we are experiencing the normalization of delinquencymanage credit risk and avoid high charge-off rates may be adversely affected by household, business, economic and enteringmarket conditions that may be difficult to predict. When these conditions deteriorate, we may experience reduced demand for credit and increased delinquencies or defaults, including loans which we have securitized and in which we retain a period during which these rates increase to long-run levels as the supplyresidual interest. The level of consumernonperforming loans, charge-offs and delinquencies could rise and require additional provision for credit grows. Although we offer loan modification programs, therelosses. There can be no assurance that our underwriting and portfolio management strategies will permit us to avoid high charge-off levels or that our allowance for loancredit losses will be sufficient to cover actual losses.
A customer’s ability and willingness to repay us can be negatively impacted by changes in their employment status, increases in their payment obligations to other lenders and by restricted availability of credit to consumers generally. Our collection operations may not compete effectively to secure more of customers’ diminished cash flow than our competitors. In addition, we may fail to quickly identify customers who are likely to default on their payment obligations and reduce our exposure by closing credit lines and restricting authorizations, which could adversely impact our financial condition and results of operations. Our ability to manage credit risk also may be adversely affected by legal or regulatory changes (such as restrictions on collections, bankruptcy laws, minimum payment regulations and re-age guidance), competitors’ actions and consumer behavior, as well as inadequate collections staffing, resources, techniques and models.
Adverse market conditions or an inability to effectively manage our liquidity risk could negatively impact our ability to meet our liquidity and funding needs, which could materially adversely impact our business, results of operations and overall financial condition.
We must effectively manage the liquidity risk to which we are exposed. We require liquidity in order to meet cash requirements such as day-to-day operating expenses, extensions of credit on our consumer loans and required payments of principal and interest on our borrowings. Our primary sources of liquidity and funding are payments on our loan receivables, deposits and proceeds from securitization transactions and securities offerings. We may maintain too much liquidity, which can be costly, and limit financial flexibility, or we may be too illiquid, which could limit financial flexibility and result in financial distress during a liquidity stress event. Our liquidity portfolio had a balance of approximately $16.6$19.8 billion as of December 31, 2019,2022, compared to $15.9$15.0 billion as of December 31, 2018.2021. Our total contingent liquidity sources amounted to $56.3$67.3 billion as of December 31, 2019,2022, compared to $52.9 billion as of December 31, 2018.2021. As of December 31, 2019,2022, our total contingent liquidity sources consisted of $16.6$19.8 billion in our liquidity portfolio, $34.2$3.5 billion of undrawn capacity in private securitizations, $1.7 billion in borrowing capacity with the FHLB of Chicago and $42.3 billion in incremental Federal Reserve discount window capacity, and $5.5 billion of undrawn capacity in private securitizations.capacity.
In the event that our current sources of liquidity do not satisfy our needs, we would be required to seek additional financing. The availability of additional financing will depend on a variety of factors such as market conditions, the general availability of credit to the financial services industry, new regulatory restrictions and requirements and our credit ratings. Disruptions, uncertainty or volatility in the capital, credit or deposit markets such as the volatility experienced in the capital and credit markets during the financial crisis of 2007, may limit our ability to repay or replace maturing liabilities in a timely manner. As such, we may be forced to delay the acquisition of additional funding or be forced to issue or raise funding at undesirable terms and/or costs, which could decrease profitability and significantly reduce financial flexibility. Further, in disorderly financial markets or for other reasons, it may be difficult or impossible to liquidate some of our investments to meet our liquidity needs.
There can be no assurance that significant disruption and volatility in the financial markets will not occur in the future. Likewise, adverse developments with respect to financial institutions and other third parties with whom we maintain important financial relationships could negatively impact our funding and liquidity. If we are unable to
-31-
continue to fund our assets through deposits or access capital markets on favorable terms, or if we experience an increase in our borrowing costs or otherwise fail to manage our liquidity effectively, our liquidity, operating results of operations and financial results and condition may be materially adversely affected.
An inability to accept or maintain deposits in the future could materially adversely affect our liquidity position and our ability to fund our business.
A major source of our funds is customer deposits, primarily in the form of savings accounts, certificates of deposits, money market accounts and checking accounts. We obtain deposits from consumers either directly or through affinity relationships and through third-party securities brokerage firms that offer our deposits to their customers. We had $54.4$70.5 billion in deposits acquired directly or through affinity relationships and $18.3$21.1 billion in deposits originated through securities brokerage firms as of December 31, 2019,2022, compared to $44.7$61.9 billion and $23.1$10.5 billion, respectively, as of December 31, 2018.2021. Our ability to attract and maintain deposits, as well as our cost of funds, has been, and will continue to be, significantly affected by general economic conditions. Competition from other financial services firms that use deposit funding, the rates and services we offer on our deposit products and our ability to maintain a high-quality customer experience may affect deposit renewal rates, costs or availability. Changes we make to the rates offered on our deposit products may affect our profitability (through funding costs) and our liquidity (through volumes raised). In addition, our ability to maintain existing or obtain additional deposits may be impacted by various factors, including factors beyond our control, such as:as perceptions about our reputation, brand, or financial strength orstrength; quality of deposit servicing or branchless banking generally, which could reduce the number of consumers choosing to place deposits with us; third parties continuing or entering into affinity relationships or marketing arrangements with us; disruptions in technology services or the internet, generally; or third-party securities brokerage firms continuing to offer our deposit products. Furthermore, while there are limitations on withdrawal frequency on certain deposit accounts, customers may withdraw deposits to ensure that their deposits are fully insured or make investments that have a higher yield. If our customers withdraw their deposits, our funding costs may increase, which may reduce our net interest income and net income.
Our ability to obtain deposit funding and offer competitive interest rates on deposits is also dependent on capital levels of our bank subsidiaries. The FDIA insubsidiary. In certain circumstances, the FDIA prohibits insured banks such as our subsidiary Discover Bank, from accepting brokered deposits (as defined in the FDIA) and applies other restrictions, such as a cap on interest rates we may pay. See “Business — Supervision and Regulation” and Note 17: Capital Adequacy to our consolidated financial statements for more information. While our subsidiary, Discover Bank, met the FDIC’s definition of “well-capitalized” as of December 31, 2019,2022 and has no restrictions regarding acceptance of brokered deposits or setting of interest rates, there can be no assurance that it will continue to meet this definition. Additionally, our regulators can adjust the requirements to be “well-capitalized” at any time and have authority to place limitations on our deposit businesses, including the interest rate we pay on deposits.
If we are unable to securitize our credit card receivables, it may have a material adverse effect on our liquidity, cost of funds and overall financial condition.
We use the securitization of credit card receivables which involves the transfer of receivables to a trust and the issuance by the trust of beneficial interests to third-party investors, as a significant source of funding as well as for contingent liquidity. The securitization of credit card receivables involves the transfer of credit card receivables to a trust, the transfer of the beneficial interest in those credit card receivables to a second trust through a special purpose entity and the issuance by the second trust of notes to third-party investors collateralized by the beneficial interest in the transferred credit card receivables. Our average level of credit card securitized borrowings from third parties was $14.4$9.0 billion and $16.0$9.5 billion for the years ended December 31, 20192022 and 2018,2021, respectively. There can be no assurance that therewe will not be future disruptions inable to complete additional credit card securitization transactions if the credit card securitization market similar to those experienced during the financial crisis. experiences significant and prolonged disruption or volatility.
Our ability to raise funding through the securitization market also depends, in part, on the credit ratings of the securities we issue from our securitization trusts. If we are not able to satisfy rating agency requirements to confirm the ratings of asset-backed securities issued by our trusts at the time of a new issuance of securities, it could limit our ability to access the securitization markets. Additional factors affecting the extent to which we may securitize our credit card receivables in the future include the overall credit quality of our credit card receivables, the costs of securitizing our credit card receivables, the demand for credit card asset-backed securities and the legal, regulatory, accounting or tax rules affecting securitization transactions and asset-backed securities, generally.
A prolonged inability to securitize our credit card receivables, or an increase in the costs of such issuances that would make such activities economically infeasible, may require us to seek alternative funding sources, which may be
-32-
less efficient and more expensive than raising capital via securitization transactions and may have a material adverse effect on our liquidity, cost of funds and overall financial condition.
The occurrence of events that result in the early amortization of our existing credit card securitization transactions or an inability to delay the accumulation of principal collections infor our existing credit card securitization truststransactions would materially adversely affect our liquidity.
Our liquidity and cost of funds would be materially adversely affected by the occurrence of events that could result in the early amortization of our existing credit card securitization transactions. Our credit card securitizationssecuritization transactions are structured as “revolving transactions” that do not distribute to securitization investors their share of monthly principal payments received on the underlying receivables during the revolving period and instead use those principal payments to fund the purchase of new credit card receivables. The occurrence of an “early amortization event” may result in termination of the revolving periods of one or more of our securitization transactions, which would require us to repay the affected outstanding securitized borrowings out of principal collections without regard to the original payment schedule. Early amortization events include, for example, insufficient cash flows in the securitized pool of credit card receivables to meet contractual requirements (i.e., excess spread less than zero) and certain breaches of representations, warranties or covenants in the agreements relating to the securitization.securitization transactions. For more information on excess spread, see Note 5: Credit Card and Private Student
Loan Securitization Activities to our consolidated financial statements. An early amortization event would negatively impact our liquidity and require us to rely on alternative funding sources, which may or may not be available at the time.time or may be less efficient and more expensive. An early amortization event also could impact our ability to access the undrawn conduitsecured credit facilities that we maintain for contingent liquidity purposes. Additionally, the occurrence of an early amortization event with respect to any of our securitization transactions may adversely impact investor demand for notes issued in our future credit card securitization transactions.
Our credit card securitization structure includes a requirement that we accumulate principal collections into a restricted account in the amount of scheduled maturities on a pro rata basis over the 12 months prior to a security’s maturity date. We have the option under our credit card securitization documents to shorten this accumulation period, subject to the satisfaction of certain conditions. Historically, we have exercised this option to shorten the accumulation period to one montha few months prior to maturity. If we were to determine that the payment rate on the underlying credit card receivables would not support a one-monthshort accumulation period, we would need to begin accumulating principal cash flows earlier than we have historically. A lengthening of the accumulation period wouldcould negatively impact our liquidity, requiring management to implement mitigating measures. During periods of significant maturity levels, absent management actions, the lengthening of the accumulation period could materially adversely affect our financial condition.
A downgrade in the credit ratings of our or our subsidiaries’ securities could materially adversely affect our businessliquidity, results of operations and financial condition.
We, along with Discover Bank, are regularly evaluated by the ratings agencies, and theiragencies. Their ratings for our long-term debt and other securities, including asset-backed securities issued by our securitization trusts, are based on a number of factors that may change from time to time, including our financial strength as well as factors that may not be within our control. Factors that affect our unsecured credit ratings include, but are not limited to, the macroeconomic environment in which we operate and the credit ratings of the U.S. government, the credit quality and performance of our assets, the amount and quality of our capital, the level and stability of our earnings and the structure and amount of our liquidity. In addition to these factors, the ratings of our asset-backed securities are also based on the quality of the underlying receivables and the credit enhancement structure of the trusts. Downgrades in our ratings, or those of Discover Bank or our trustsasset-backed securities could occur at any time and without notice by any of the rating agencies, which could, among other things, materially adversely affect our cost of funds, access to capital and funding and overall financial condition. There can be no assurance that we will be able to maintain our current credit ratings or that our credit ratings will not be lowered or withdrawn.
We may not be successful in managing the investments in our liquidity investment portfolio and investment performance may deteriorate due to market fluctuations, which would adversely affect our business and financial condition.
We must effectively manage the risks of the investments in our liquidity investment portfolio, which is comprisedcomposed of cash and cash equivalents and high-quality liquid investments. The value of our investments may be adversely affected by market fluctuations including changes in interest rates, prices, prepayment rates, credit risk premiums and overall
-33-
market liquidity. Also, investments backed by collateral could be adversely impacted by changes in the value of the underlying collateral. In addition, economic conditions may cause certain of the obligors, counterparties and underlying collateral on our investments to incur losses of their own or default on their obligations to us due to bankruptcy, lack of liquidity, operational failure or other reasons, thereby increasing our credit risk exposure to these investments. These risks could result in a decrease in the value of our investments, which could negatively impact our financial condition. These risks could also restrict our access to funding. While the securities in our investment portfolio are currently limited to obligations of high-quality sovereign and government-sponsored issuers, we may choose to expand the range of our investments over time, which may result in greater fluctuations in market value. While we expect these investments to be readily convertible into cash and do not believe they present a material increase to our risk profile or will have a material impact on our risk-based capital ratios, they are subject to certain market fluctuations that may reduce the ability to fully convert them into cash.
Changes in the level of interest rates could materially adversely affect our earnings.
Changes in interest rates cause our net interest income to increase or decrease, as some of our assets and liabilities carry interest rates that fluctuate with market benchmarks. External factors may causeBenchmark interest rates to increase. Tighterrose materially during 2022 as the Federal Reserve raised its federal funds target rate range in an effort to combat high inflation. Financial market participants expect 2023 will be a transitional year for monetary policy and risingU.S. economic growth, thus raising uncertainty as to the direction of benchmark interest rates would increase the cost of borrowing for consumers, businesses and governments.during 2023. Higher interest rates could negatively impact Discover’sour customers as total debt service payments would increase, impede Discover’sour ability to grow itsour consumer lending businesses and increase the cost of our funding, which would put Discoverus at a disadvantage as compared to some of our competitors that have less expensive funding sources.
Some of our consumer loan receivables bear interest at a fixed rate or do not earn interest and we are not able to increase the rate on those loans to offset any higher cost of funds, which could materially reduce earnings. At the same time, some of our variable-rate loan receivables most of which are based on the prime rate, may not change at the same rate as our floating-rate borrowings or may be subject to a cap, subjectingexposing us to basisinterest-rate risk. In addition, we utilize a combination of fixed- and variable-rate funding from various sources, and we may use derivative instruments to hedge the liabilities. However, timing mismatches between loan receivable growth and funding procurement could expose us to interest-rate risk.
Interest rates may also adversely impact our delinquency and charge-off rates. Many consumer lending products bear interest rates that fluctuate with certain base lending rates published in the market, such as the prime rate and LIBOR. As a result, higher interest rates often lead to higher payment requirements by consumers under obligations to us and other lenders, most of which may reduce their ability to remain current on their obligations to us and thereby lead to loan delinquencies and additions to our loancredit loss provision, which could materially adversely affect our earnings.
We continually monitor interest rates and have a number of tools, including the composition of our loans and investments, liability terms and interest rate derivatives, to manage our interest rate risk exposure. Changes in market assumptions regarding future interest rates could significantly impact our interest rate risk strategy, our financial position and results of operations. If our interest rate risk management strategies are not appropriately monitored or executed, these activities may not effectively mitigate our interest rate sensitivity or have the desired impact on our results of operations or financial condition. For information related to interest rate risk sensitivities, see “Quantitative“Item 7A — Quantitative and Qualitative Disclosures About Market Risk.”
-34-
Operational and Other Risk
Our risk management framework and models for managing risks may not be effective in mitigating our risk of loss.
Our risk management framework seeks to identify and mitigate risk and appropriately balance risk and return. We have established processes and procedures intended to identify, measure, manage, monitor and report the types of risk to which we are subject, including credit risk, market risk, liquidity risk, operational risk, compliance and legal risk and strategic risk. We seek to monitor and control our risk exposure through a framework of policies, procedures, limits and reporting requirements.
Management of our risks in some cases depends upon the use of analytical and/or forecasting models. We use a variety of models to manage and inform decision-making with respect to customers and for the measurement of risk including credit, market and operational risks and for our finance and treasury functions. Models used by Discover can vary in their complexity and are designed to identify, measure and mitigate risks at various levels such as loan-level, portfolio segments, entire portfolios and products. These models use a set of computational rules to generate numerical estimates of uncertain values to be used for assessment of price, financial forecasts and estimates of credit, interest rate, market and operational risk. These models and the quality of their outputs are dependent on the quality and accuracy of the data loaded into the models. To the extent that the quality and integrity of that data is compromised, the models could result in inaccurate forecasts, ineffective risk management practices or inaccurate risk reporting. All models carry some level of uncertainty that introduces risks in the estimates.
If the models that we use to mitigate risks are inadequate or do not accurately predict future outcomes, we may incur increased losses. In addition, there may be risks that exist, or that develop in the future, that we have not appropriately anticipated, identified or mitigated. If our risk management framework and models do not effectively identify or mitigate our risks, we could suffer unexpected losses and our financial condition and results of operations could be materially adversely affected.
If the security of our security systems, or thosethe systems of third parties containing information about us, our customers or third parties with which we do business, arerely upon, is compromised, our business could be disrupted and we may be subject to significant financial exposure, liability and damage to our reputation.
Our directdigital banking and network operations rely heavily on the secure processing, storage and transmission of confidential or sensitive information about us, our customers and third parties with whichwhom we do business. Information security risks for financial institutions have increased and continue to increase in part because of the proliferation of new technologies, the use of the internet and cloud, mobile and telecommunications technologies to conduct financial transactions and the increased sophistication and activities of organized crime, activists, hackers, terrorist organizations, nation state actors and other external parties. Those parties may also attempt to fraudulently induce employees, customers or other users of our systems (including third parties) to disclose confidential or sensitive information in order to gain access to our data or that of our customers.
Our technologies, systems, networks and software, those of other financial institutions and other firms (such as hardware vendors, cloud providers and others), have been, and are likely to continue to be, the target of increasingly frequent cyber-attacks, malicious code, ransomware, denial of service attacks, phishing and other social engineering, other remote access attacks and physical attacks that could result in unauthorized access, misuse, loss, unavailability or destruction of data (including confidential customer information), account takeovers, identity theft and fraud, unavailability of service or other events. These types of threats may derive from human error, fraud or malice on the part of external or internal parties or may result from technological failure or otherwise. Further, our vulnerability to these types of threats may be increased to the extent employees may continue to work remotely on a more frequent basis with the current trend toward hybrid work arrangements.
Despite our efforts to ensure the integrity of our systems through our information security and business continuity programs, we may not be able to anticipate or to implement effective preventive measures against all known and unknown security threats, attacks or breaches or events of these types, especially because the techniques used change frequently and are becoming increasingly more sophisticated or are not recognized until launched or vulnerabilities in software or hardware are unknown or are unable to be entirely addressed even after becoming known, and because:
•Security attacks can originate from a wide variety of sources and geographic locations and may be undetected for a period of time.
-35-
information is handled. For additional information see the risk factor “— Failure to manage our relationships with third-party service providers could result in our revenue or results of operations could bebeing materially adversely affected.”
We are subject to increasing risk related to information and data security as we increase acceptance of the Discover card internationally, expand our suite of online directdigital banking products, enhance our mobile payment technologies, acquire new or outsource some of our business operations, expand our internal usage of web-based products and applications, and otherwise attempt to keep pace with rapid technological changes in the financial services industry. Our efforts to mitigate this risk increase our expenses. While we continue to invest in our information security defenses (including cybersecurity defenses), if our security systems or those of third parties are penetrated or circumvented such that the confidentiality, integrity or availability of information about us, our customers, transactions processed on our networks or on third-party networks on our behalf or third parties with which we do business is compromised, we could be subject to significant liability that may not be covered by insurance, including significant legal and financial exposure, actions by our regulators, damage to our reputation, or a loss of confidence in the security of our systems, products and services that could materially adversely affect our business.
Cyber-attacks that are successful, or are perceived to be successful, in compromising the data or disrupting the services of other peer financial institutions, whether or not we are impacted, could lead to a general loss of customer confidence, which could negatively impact market perception of our products and services. Media reports of attempted cyber-attacks, service disruptions or vulnerabilities in our cybersecurityinformation systems or other third-parties,security procedures or those of any of the third-party service providers we engage, could cause significant legal and financial exposure, lead to regulatory and legislative intervention and cause an overall negative effect in our business. For additional information on risks in this area, see the risk factors below regarding fraudulent activity, the introduction of new products and services, the use of third parties for outsourcing, technology generally, and laws and regulations addressing consumer privacy and data use and security.
If we cannot remain organizationally effective, we will be unable to address the opportunities and challenges presented by our strategy and the increasingly dynamic and competitive economic and regulatory environment.
To remain organizationally effective, we must effectively empower, integrate and deploy our management and operational resources and incorporate global and local business, regulatory and consumer perspectives into our decisions and processes. In order to execute on our objective to be the leading consumer bank and payments partner, we must develop and implement innovative and efficient technology solutions and marketing initiatives while effectively managing legal, regulatory, compliance, security, operational and other risks as well as expenses. Examples include the implementation of a broader rollout of our checking product and a structure for a more competitive global network business. If we fail to develop and implement these solutions, we may be unable to expand quickly and the results of our expansion may be unsatisfactory. In addition, if we are unable to make decisions quickly, assess our opportunities and risks, execute our strategy and implement new governance, managerial and organizational processes as needed in this increasingly dynamic and competitive economic and regulatory environment, our financial condition, results of operations, relationships with our business partners, banking regulators, customers and shareholders, and ultimately our prospects for achieving our long-term strategies, may be negatively impacted.
We may be unable to increase or sustain Discover credit card usage, which could impair growth in, or lead to diminishing, average balances and total revenue.
A key element of our business strategy is to increase the usage of the Discover credit card by our customers, including making it their primary credit card, and thereby increase our revenue from transaction and service fees and interest income. However, our customers’ use and payment patterns may change because of social, legal and economic factors, and customers may decide to use debit cards or other payment products instead of credit cards, not increase credit card usage, or pay their balances within the grace period to avoid finance charges. We face challenges from competing card products in our attempts to increase credit card usage by our existing customers. Our ability to increase credit card usage also is dependent on customer satisfaction, which may be adversely affected by factors outside of our control, including competitors’ actions and legislative/regulatory changes. Existing legal and regulatory restrictions limit pricing changes that may impact an account throughout its lifecycle, which may reduce our capability to offer lower price promotions to drive account usage and customer engagement. As part of our strategy to increase usage, we have been increasing the number of merchants who accept credit cards issued on the Discover Network. If we are unable to continue increasing merchant acceptance or fail to improve awareness of existing merchant acceptance of our credit
-36-
cards, our ability to grow usage of Discover credit cards may be hampered. As a result of these factors, we may be unable to increase or sustain credit card usage, which could impair growth in or lead to diminishing average balances and total revenue.
Discover card net transaction dollar volume was concentrated among our top 100 merchants in 2019,2022, with our largest merchant accounting for approximately 5% of that net transaction volume. Transaction volume on the PULSE network was also concentrated among the top 100 merchants in 2019,2022, with our largest merchant accounting for approximately 20%19% of PULSE transaction volume. These merchants could seek to negotiate better pricing or other financial incentives by conditioning their continued participation in the Discover Network and/or PULSE network on a change in the terms of their economic participation. Loss of acceptance at our largest merchants would decrease transaction volume, negatively impact our brand and could cause customer attrition. In addition, some of our merchants, primarily our remaining small- and mid-size merchants, are not contractually committed to us for any period of time and may cease to participate in the Discover Network at any time on short notice.
Actual or perceived limitations on acceptance of credit cards issued on the Discover Network or debit cards issued on the PULSE network could adversely affect the use of Discover cards by existing customers and the attractiveness of the Discover cardcards to prospective customers. Also, we may have difficulty attracting and retaining network partners if we are unable to add or retain acquirers or merchants who accept cards issued on the Discover or PULSE networks. As a result of these factors, a reduction in the number of our merchants or the rates they pay could materially adversely affect our business, financial condition, results of operations and cash flows.
Our business, financial condition and results of operations may be adversely affected by merchants’ increasing focus on the fees charged by credit card and debit card networks.
Merchant acceptance and fees are critical to the success of both our card-issuing and payment processing businesses. Merchants are concerned with the fees charged by credit card and debit card networks. They seek to negotiate better pricing or other financial incentives as a condition of continued participation in the Discover Network and PULSE network. During the past few years, merchants and their trade groups have filed numerous lawsuits against Visa, MasterCard, American Express and their card-issuing banks, claiming that their practices toward merchants, including issuer fees, violate federal antitrust laws. There can be no assurance that they will not in the future bring legal proceedings against other credit card and debit card issuers and networks, including us. Merchants also may promote forms of payment with lower fees, such as ACH-based payments, or seek to impose surcharges at the point of sale for use of credit or debit cards. Merchant groups have also promoted federal and state legislation that would restrict issuer practices or enhance the ability of merchants, individually or collectively, to negotiate more favorable fees. The heightened focus by merchants on the fees charged by credit card and debit card networks, together with the Dodd-Frank Act and recent industry litigation, which would allow merchants to encourage customers to use other payment methods or cards and may increase merchant surcharging, could lead to reduced transactions on, or merchant acceptance of, Discover Network or PULSE network cards or reduced fees, any of which could adversely affect our business, financial condition and results of operations.
Political, economic or other instability in a country or geographic region, or other unforeseen or catastrophic events, could adversely affect our international business activities and reduce our revenue.
-37-
including on travel, to decline. The impact of such events and other catastrophes on the overall economy may also adversely affect our financial condition or results of operations.
Fraudulent activity associated with our products or our networks could cause our brands to suffer reputational damage, the use of our products to decrease and our fraud losses to be materially adversely affected.
We are subject to the risk of fraudulent activity associated with merchants, customers and other third parties handling customer information. The risk of fraud continues to increase for the financial services industry in general. We
Our risk of fraud continues to increase as third parties that handle confidential consumer information suffer security breaches, acceptance of the Discover card grows internationally and we expand our directdigital banking business and introduce new products and features. Our financial condition, the level of our fraud charge-offs and other results of operations could be materially adversely affected if fraudulent activity were to significantly increase. High-profileFurthermore, high-profile fraudulent activity could negatively impact our brand and reputation. In addition, significant increases in fraudulent activity could lead to regulatory intervention (such as mandatory card reissuance) and reputational and financial damage to our brands, which could negatively impact the use of our deposit accounts, cards and networks and thereby have a material adverse effect on our business. Further, fraudulent activity may result in lower license fee revenue from our Diners Club licensees.
The financial services and payment services industries are rapidly evolving and we may be unsuccessful in introducing new products or services on a large scale in response to these changes.
Technological changes continue to significantly impact the financial services and payment services industries. For example, we may be unsuccessful in deploying new technologies to strengthen our credit underwriting capabilities, enhance the effectiveness of our marketing efforts, ensure acceptance with new payment technologies, enhance customer service, drive efficiencies in back-office functions or reduce fraud. The increasingly competitive mobile, e-wallet and tokenization spaces are expected to continue to bring risks and opportunities to both our directdigital banking and payment services businesses.
The effect of technological changes on our business is both rapid and unpredictable. We depend, in part, on third parties for the development of and access to new technologies. We expect that new services and technologies relating to the payments business will continue to appear in the market and these new services and technologies may be superior to, or render obsolete, the technologies that we currently use in our products and services. Rapidly evolving technologies and new entrants in mobile and emerging payments pose a risk to Discoverus both as a card issuer and to theas a payments business. As a result, our future success may be dependent on our ability to identify and adapt to technological changes and evolving industry standards and to provide payment solutions for our customers, merchants and financial institution customers.
The process of developing new products and services or enhancing our existing products and services is complex, costly and uncertain. Difficulties or delays in the development, production, testing and marketing of new products or services may be caused by a number of factors including, among other things, operational, capital and regulatory constraints. The occurrence of such difficulties may affect the success of our products or services, and developingservices. Developing unsuccessful products and services could result in financial losses as well as decreased capital availability. In addition, the new products and services offered may not be attractive toadopted by consumers, merchants or financial institution customers. Also, the success of a new product or service may depend upon our ability to deliver it on a large scale, which may require a significant capital investment that we may not be in a position to make. If we are unable to successfully introduce and maintainsupport new income-generating products and services while also managing our expenses, it may impact our ability to compete effectively and materially adversely affect our business, financial condition and earnings.results of operations.
We depend on third-party service providers for many aspects of the operation of our business. For example, we depend on third parties for software and systems development, the timely transmission of information across our data
-38-
transportation network and for other telecommunications, processing, remittance, technology-related and other services in connection with our directdigital banking and payment services businesses. If a service provider fails to provide the services that we require or expect, or fails to meet contractual requirements, such as service levels, security requirements or compliance with applicable laws, the failure could negatively impact our business by adversely affecting our ability to process customers’ transactions in a secure, consistent, timely and accurate manner, otherwise hampering our ability to serve our customers, or subjecting us to litigation and regulatory risk for poor vendor oversight. Such a failure could adversely affect the perception of the reliability of our networks and services, and the quality of our brands, and could have a materially adverse effect on our reputation, revenues and/or our results of operations.
With the current trend toward hybrid work arrangements, we have become increasingly dependent on third-party service providers, including those with which we have no direct relationship, such as our employees’ internet service providers. If these third-parties experience service disruptions, our operations may be interrupted or negatively impacted.
Our ability to deliver services to our customers and run our business in compliance with applicable laws and regulations may be affected by the functionality of our technology systems. The implementation of technology changes as well as patches and upgrades to maintain current and integrated systems may result in compliance issues and may, at least temporarily, cause disruptions to our business, including, but not limited to, systems interruptions, transaction processing errors and system conversion delays, all of which could have a negative impact on us. In addition, our transaction processing systems and other operational systems may encounter service interruptions at any time due to system or software failure, natural disaster or other reasons. Such services could be disrupted at any of our primary or back-up facilities or our other owned or leased facilities. Third parties to whom we outsource the maintenance and development of certain technological functionality may experience errors or disruptions that could adversely impact us and over which we may have limited control. In addition, there is no assurance that we will be able to sustain our investment in new technology to avoid obsolescence of critical systems and applications. A failure to maintain current technology, systems and facilities or to control third-party risk, could cause disruptions in the operation of our business, which could materially adversely affect our transaction volumes, revenues, reputation and/or our results of operations.
Our success depends, in large part, on our ability to recruit, retain and motivate key officers and employees to manage and grow our business. Our senior management team has significant industry experience and would be difficult to replace. We believe we are in a critical period of competition in the financial services and payments industry. The market for qualified individuals is highly competitive and we may not be able to attract and retain qualified personnel or candidates to replace or succeed members of our senior management team or other key personnel or it may be expensive to do so. We may be subject to restrictions under future legislation or regulation limiting executive compensation. For example, the federal banking agencies have previously issued proposed rulemaking on incentive compensation practices for certain employees at banking organizations, including executives, and may issue additional rules relating to such activities in the future. These requirements could negatively impact our ability to compete with other companies in attracting, hiring and retaining key personnel and offer incentives that motivate our key personnel to perform and may require us to extensively restructure certain of our existing incentive compensation practices. Additionally, the market for individuals with skills in fields such as technology, advanced analytics, digital marketing and payments is increasingly competitive and we may not be able to attract and retain persons with the desired skill set or experience. If we are unable to recruit, retain and motivate key personnel to manage and grow our business well, our business could be materially adversely affected.
Merchant defaults may adversely affect our business, financial condition, cash flows and results of operations.
As an issuer and merchant acquirer in the United StatesU.S. on the Discover Network and as a holder of certain merchant agreements internationally for the Diners Club network, we may be contingently liable for certain disputed credit card sales transactions that arise between customers and merchants. If a dispute is resolved in the customer’s favor, we will cause a credit or refund of the amount to be issued to the customer and charge back the transaction to the merchant or merchant acquirer. If we are unable to collect this amount from the merchant or merchant acquirer, we will bear the loss for the amount credited or refunded to the customer. Where the purchased product or service is not provided until some
-39-
later date following the purchase, such as an airline ticket, the likelihood of potential liability increases. For the years ended December 31, 2019 and 2018 lossesLosses related to merchant chargebacks were not material.material for the years ended December 31, 2022 and 2021.
Damage to our reputation could damagenegatively affect our business.business and brand.
In recent years, financial services companies have experienced increased reputational risk as consumers protest and regulators scrutinize business and compliance practices of such companies. Maintaining a positive reputation is critical to attracting and retaining customers, investors and employees. Damage to our reputation can therefore cause significant harm to our business and prospects. Harm to our reputation can arise from numerous sources, including, among others, employee misconduct,misconduct; a breach of our or our service providers’ cybersecurity defenses,defenses; litigation or regulatory outcomes,outcomes; failing to deliver minimum standards of service and quality,quality; compliance failures,failures; and the activities of customers, business partners and counterparties. Social media also can cause harm to our reputation. By its very
nature, social media can reach a wide audience in a very short amount of time, which presents unique corporate communications challenges. Negative or ‘wrong’ type ofotherwise undesirable publicity generated through unexpected social media coverage can damage Discover’sour reputation and brand. Negative publicity regarding us, whether or not true, may result in customer attrition and other harm to our business prospects. There has also been increased focus on topics related to environmental, social and corporate governance policies, and criticism of our policies in these areas could also harm our reputation and/or potentially limit our access to some forms of capital or liquidity.
We may be unsuccessful in promoting and protecting or defending our brands or protecting our other intellectual property, or third parties may allege that we are infringing their intellectual property rights.
In addition, the Discover, PULSE and Diners Club brands have substantial economic and goodwillintangible value. Our success is dependent on our ability to promote and protect these brands and our other intellectual property. Our ability to attract and retain customers is highly dependent upon the external perception of our companyCompany and brands. Our brands are licensed for useWe strategically license our trademarks to business partners and network participants, some of whom have contractual obligations to promote and develop our brands. For example, the Discover card brand is now being issued by certain Diners Club licensees in their local markets.
If our business partners or other third parties do not adhere to contractual standards, engage in improper business practices, or otherwise misappropriate, usemisuse or diminish the value of our brands or our other intellectual property, we may suffer reputational and financial damage. If we will not be able to adequately protect our brands, our proprietary information and other intellectual property, our business success may be adversely affected. In addition, third parties may allege that our developed or licensed marketing, processes or systems may infringe upon their intellectual property rights. Given the potential risks and uncertainties of such claims, our business could be adversely affected by having to pay significant monetary damages, technology development expenses or licensing fees, and we may have to alter our business practices or be prevented from competing effectively.
Laws, regulations and supervisory guidance and practices, or the application thereof, may adversely affect our business, financial condition and results of operations.
We must comply with an array of banking, consumer lending and payment services laws and regulations in all of the jurisdictions in which we operate as described more fully in “Business — Supervision and Regulation”, the risk factor entitled "— Financial regulatory developments have and will continue to significantly impact the environment for the financial services industry, which could adversely impact our business, results of operations and financial condition” and “Management’s Discussion and Analysis of Financial Condition and Results of Operations — Regulatory Environment and Developments.” Regulatory developments and supervisory findings and ratings could negatively impact our business strategies or require us to: limit or change our business practices, restructure our products in ways that we may not currently anticipate, limit our product offerings, invest more management time and resources in compliance efforts, limit the fees we can charge for services, or limit our ability to pursue certain business opportunities and obtain related required regulatory approvals. For additional information regarding bank regulatory limitations on acquisitions and investments, see “Business — Supervision and Regulation — Acquisitions and Investments.” See Note 19: Litigation and Regulatory Matters to our consolidated financial statements for more information on recent matters affecting Discover and the second risk factor in this section regarding the regulatory environment for the businesses in which we engage.
In addition, we are subject to inquiries and enforcement actions from states’ attorney general offices and regulation by the Federal Trade Commission, state banking regulators and the U.S. Department of Justice, as well as the SEC and New York Stock Exchange in our capacity as a public company. We also are subject to the requirements of entities that set and interpret the accounting standards (such as the Financial Accounting Standards Board (“FASB”), the SEC, banking regulators and our independent registered public accounting firm), which may add new requirements or change their interpretations on how standards should be applied. In June 2016, the FASB issued a new accounting standard that requires lenders to adopt the current expected credit loss (“CECL”) approach to evaluate impairment of loans and financial instruments. The CECL approach, which replaces the incurred loss model, requires evaluation of credit impairment based on an estimate of life of loan losses. The CECL standard is effective January 1, 2020. See Note 1: Background and Basis of Presentation to our consolidated financial statements for more information on the new standard and its impact at adoption. Other guidanceGuidance not yet issued could potentially have a material impact on business lines, as well as how we record and report our financial condition and results of operations, and could have an impact on regulatory capital.
-40-
Failure to comply with laws, regulations and standards could lead to adverse consequences such as financial, structural, reputational and operational penalties, including our bank subsidiary being placed in receivership, litigation exposure and disgorgement and fines (as described further below). For example, failure to comply with anti-bribery and anti-corruption laws, including the U.S. Foreign Corrupt Practices Act and other laws regarding corporate conduct, can expose us and/or individual employees to potentially severe criminal and civil penalties.
Legislative, regulatory and tax code changes could impact the profitability of our business activities, alter consumer behavior in ways we did not anticipate, require us to limit or change our business practices or our product
offerings, or expose us to additional costs (including increased compliance costs).Significant changes in laws and regulations may have a more adverse effect on our results of operations than on the results of our competitors or may disproportionately benefit our competitors.
Current and proposed laws and regulations addressing consumer privacy and data use and security could affect the competitiveness of our products and increase our costs.
Legal or regulatory pronouncements relating to consumer privacy, data use and security affect our business. We are subject to a number of laws concerning consumer privacy and data use and security such as the European Union’s General Data PrivacyProtection Regulation and the California Consumer Privacy Act. Due to recent consumer data compromise events in the United States,U.S., which resulted in unauthorized access to millions of customers’ data, these areas continue to be a focus of the executive administration,U.S. Executive Branch and Congress, state legislators and attorneys general and other regulators. Developments in this area, such as new laws, regulations, regulatory guidance, litigation or enforcement actions, could result in new or different requirements on Discover and other card issuers or networks that could increase costs or adversely affect the competitiveness of our credit card or debit card products. See the discussion on recent security developments in “Management’s Discussion and Analysis of Financial Condition and Results of Operations — Regulatory Environment and Developments” for more information. In addition, failure to comply with the privacy and data use and security laws and regulations to which we are subject, including by reason of inadvertent disclosure of confidential information or the failure to provide timely notification of a disclosure, could result in litigation, fines, sanctions, penalties or other adverse consequences and loss of consumer confidence, which could materially adversely affect our results of operations, overall business and reputation.
Litigation and regulatory actions could subject us to significant fines, penalties and/or requirements resulting in increased expenses.expenses, oversight and reputation risk.
Historically, we have offered customers an arbitration clause in agreements to quickly and economically resolve disputes. The arbitration clause has, in some cases, also limited our exposure to consumer class action litigation, however,while still being able to resolve individual customer disputes. However, there can beis no assuranceguarantee that we will be able to continue to offer arbitration clauses in the future or that we will be successful in enforcing the arbitration clause.clause in court. Legal challenges to the enforceability of these clauses have led most card issuers, and may cause us to discontinue their use. ThereIn addition to court enforceability uncertainty, there have previously been bills pending in the U.S. Congress to directly or indirectly prohibit the use of pre-dispute arbitration clauses in some or all consumer banking products. Further,
We may be limited in our ability to pay dividends on and repurchase our stock.
We increased our quarterly common stock dividend in 2022 to $0.60 per share, an increase of $0.10 per share from time to time, we are involved in legal actions challenging the useprevious rate of $0.50 per share and repurchased approximately 7.5% of our arbitration clause. In addition, we have beenoutstanding common stock under our share repurchase program in 2022. The declaration and may again be involved in various actions or proceedings broughtpayment of future dividends, as well as the amount thereof, are subject to the discretion of our Board of Directors. The amount and size of any future dividends and share repurchases will depend upon regulatory limitations imposed by governmental regulatory and enforcement agencies, which could harm our reputation, require us to change our business activities and product offerings, or subject us to significant fines, penalties, customer restitution or other requirements, resulting in increased expenses. For example, complying with our agreements with the Federal Reserve and our results of operations, financial condition, capital levels, cash requirements, future prospects, regulatory review and other factors as further described in “Business — Supervision and Regulation — Capital, Dividends and Share Repurchases.” Holders of our
-41-
shares of common stock are subject to the FDIC consent order relatedprior dividend rights of holders of our preferred stock or the depositary shares representing such preferred stock outstanding. No dividend may be declared or paid on or set aside for payment on our common stock if full dividends have not been declared and paid on all outstanding shares of our preferred stock in any dividend period. Banking laws and regulations and our banking regulators may limit or prohibit our payment of dividends on or our repurchase of our stock at any time. There can be no assurance that we will declare and pay any dividends on or repurchase our stock in the future.
We are a holding company and depend on payments from our subsidiaries.
Discover Financial Services, our parent holding company, depends on dividends, distributions and other payments from its subsidiaries, particularly Discover Bank, to fund its dividend payments, share repurchases, payments on its obligations, including debt obligations, and to provide funding and capital as needed to its operating subsidiaries. Banking laws and regulations and our anti-money laundering program have caused usbanking regulators may limit or prohibit our transfer of funds freely, either to incur significant expenses. See Note 19: Litigationor from our subsidiaries, at any time. These laws, regulations and Regulatory Mattersrules may hinder our ability to access funds that we may need to make payments on our consolidated financial statements forobligations or otherwise achieve strategic objectives. For more information, on current matters affecting Discover.see “Business — Supervision and Regulation — Capital, Dividends and Share Repurchases.”
Special Note Regarding Forward-Looking Statements
This annual report on Form 10-K and materials we have filed or will file with the SEC (as well as information included in our other written or oral statements) contain or will contain certain statements that are forward-looking within the meaning of the Private Securities Litigation Reform Act of 1995. These statements are not guarantees of future performance and involve certain risks, uncertainties and assumptions that are difficult to predict. Actual outcomes and results may differ materially from those expressed in, or implied by, our forward-looking statements. Words such as “expects,” “anticipates,” “believes,” “estimates”“estimates,” “forecasts,” and other similar expressions or future or conditional verbs such as “will,” “should,” “would”“would,” and “could”“could,” are intended to identify such forward-looking statements. You should not rely solely on the forward-looking statements and should consider all uncertainties and risks throughout this annual report on Form 10-K, including those described under “Risk Factors.” The statements are only as of the date they are made and we undertake no obligation to update any forward-looking statement.
Possible events or factors that could cause results or performance to differ materially from those expressed in our forward-looking statements include the following:
•changes in economic variables, such as the availability of consumer credit, the housing market, energy costs, the number and size of personal bankruptcy filings, the rate of unemployment, the levels of consumer confidence and consumer debt and investor sentiment;
•the impact of current, pending and future legislation, regulation, supervisory guidance and regulatory and legal actions, including, but not limited to, those related to accounting guidance, tax reform, financial regulatory reform, consumer financial services practices, anti-corruption and funding, capital and liquidity;
•the actions and initiatives of current and potential competitors;
•our ability to manage our expenses;
•our ability to successfully achieve card acceptance across our networks and maintain relationships with network participants and merchants;
•our ability to sustain and grow our card, private student loan and personal loan products;growth;
•our ability to increase or sustain Discover card usage or attract new customers;
•difficulty obtaining regulatory approval for financing, closing, transitioning, integrating or managing the expenses of acquisitions of or investments in new businesses, products or technologies;
•our ability to manage our credit risk, market risk, liquidity risk, operational risk, compliance and legal risk and strategic risk;
•the availability and cost of funding and capital;
•access to deposit, securitization, equity, debt and credit markets;
•the impact of rating agency actions;
•the level and volatility of equity prices, commodity prices and interest rates, currency values, investments, other market fluctuations and other market indices;
-42-
•losses in our investment portfolio;
•limits on our ability to pay dividends and repurchase our common stock;
•limits on our ability to receive payments from our subsidiaries;
•fraudulent activities or material security breaches of our or others’ key systems;
•our ability to remain organizationally effective;
•the effect of political, economic and market conditions, geopolitical events, climate change, pandemics and unforeseen or catastrophic events;
•our ability to introduce new products or services;
•our ability to manage our relationships with third-party vendors;vendors, as well as those with which we have no direct relationship such as our employees’ internet service providers;
•our ability to maintain current technology and integrate new and acquired systems and technology;
•our ability to collect amounts for disputed transactions from merchants and merchant acquirers;
•our ability to attract and retain employees;
•our ability to protect our reputation and our intellectual property;
•our ability to comply with regulatory requirements; and
•new lawsuits, investigations or similar matters or unanticipated developments related to current matters.
We routinely evaluate and may pursue acquisitions of or investments in businesses, products, technologies, loan portfolios or deposits, which may involve payment in cash or our debt or equity securities.
The foregoing review of important factors should not be construed as exclusive and should be read in conjunction with the other cautionary statements that are included in this annual report on Form 10-K. These factors expressly qualify all subsequent oral and written forward-looking statements attributable to us or persons acting on our behalf. Except for any ongoing obligations to disclose material information as required under U.S. federal securities laws, we do not have any intention or obligation to update forward-looking statements after we distribute this annual report on Form 10-K, whether as a result of new information, future developments or otherwise.
-43-
Item 1B. Unresolved Staff Comments
None.
Item 2. Properties
Our principal properties are located in the United StatesU.S. and include our corporate headquarters, our call centers and a processing center. Our corporate headquarters is used by both our DirectDigital Banking and Payment Services segments and the call centers and processing center largely support our DirectDigital Banking segment. OurWe also have various offices located outside the U.S. that primarily support our Payment Services segment.
We have begun to reconfigure certain locations as we continue to work to optimize our physical space. As a result, our call centers and processing center are being utilized to a reasonable capacity. We believe our principal facilities that support both our Digital Banking and Payment Services segments are both suitable and adequate to meet our current and projected needs. We also have various offices located outside the United States that primarily support our Payment Services segment.
Item 3. Legal Proceedings
For a description of legal proceedings, see Note 19: Litigation and Regulatory Matters to our consolidated financial statements.
Item 4. Mine Safety Disclosures
None.
-44-
Part II.
Part II | Item 5. Market for Registrant’s Common Equity, Related Stockholder Matters and Issuer Purchases of Equity Securities
Our common stock is traded on the New York Stock Exchange (ticker symbol DFS). The approximate numberAs of February 17, 2023, there were approximately 38,376 holders of record holders of our common stock as of February 21, 2020 was 43,820.stock.
Issuer Purchases of Equity Securities
The following table sets forth information regarding purchases of our common stock related to our share repurchase program and employee transactions made by us or on our behalf during the most recent quarter:
| Period | Total Number of Shares Purchased | Average Price Paid Per Share | Total Number of Shares Purchased as Part of Publicly Announced Plan or Program(1) | Maximum Dollar Value of Shares that may yet be purchased under the Plans or Programs(1) | |||||||||||||||||||
| October 1-31, 2022 | |||||||||||||||||||||||
Repurchase program(1)(2) | — | $ | — | — | $ | 3,389,926,238 | |||||||||||||||||
Employee transactions(3) | 1,224 | $ | 97.44 | N/A | N/A | ||||||||||||||||||
| November 1-30, 2022 | |||||||||||||||||||||||
Repurchase program(1) | 850,874 | $ | 107.77 | 850,874 | $ | 3,298,228,352 | |||||||||||||||||
Employee transactions(3) | 5,312 | $ | 103.84 | N/A | N/A | ||||||||||||||||||
| December 1-31, 2022 | |||||||||||||||||||||||
Repurchase program(1) | 5,031,837 | $ | 101.08 | 5,031,837 | $ | 2,789,626,246 | |||||||||||||||||
Employee transactions(3) | 3,790 | $ | 105.09 | N/A | N/A | ||||||||||||||||||
| Total | |||||||||||||||||||||||
Repurchase program(1) | 5,882,711 | $ | 102.04 | 5,882,711 | $ | 2,789,626,246 | |||||||||||||||||
Employee transactions(3) | 10,326 | $ | 103.54 | N/A | N/A | ||||||||||||||||||
(1)In April 2022, our Board of Directors approved a new share repurchase program authorizing the purchase of up to $4.2 billion of our outstanding shares of common stock through June 30, 2023. This share repurchase authorization replaced our prior $2.4 billion share repurchase program, that expired on March 31, 2022.
(2)In July 2022, share repurchases were suspended because of an internal investigation relating to our student loan servicing practices and related compliance matters. Share repurchases resumed in November 2022 with the completion of the investigation. See "— Liquidity and Capital Resources — Capital" for additional information.
(3)Reflects shares withheld (under the terms of grants under employee stock compensation plans) to offset tax withholding obligations that occur upon the delivery of outstanding shares underlying restricted stock units or upon the exercise of stock options.
-45-
| The following table sets forth information regarding purchases of our common stock related to our share repurchase program and employee transactions that were made by us or on our behalf during the most recent quarter: | |||||||||||||
| Period | Total Number of Shares Purchased | Average Price Paid Per Share | Total Number of Shares Purchased as Part of Publicly Announced Plan or Program(1) | Maximum Dollar Value of Shares that may yet be purchased under the Plans or Programs(1) | |||||||||
| October 1-31, 2019 | |||||||||||||
Repurchase program(1) | 1,844,472 | $ | 79.03 | 1,844,472 | $ | 1,722,576,910 | |||||||
Employee transactions(2) | 2,889 | $ | 80.02 | N/A | N/A | ||||||||
| November 1-30, 2019 | |||||||||||||
Repurchase program(1) | 1,508,652 | $ | 83.39 | 1,508,652 | $ | 1,596,764,800 | |||||||
Employee transactions(2) | 5,762 | $ | 83.22 | N/A | N/A | ||||||||
| December 1-31, 2019 | |||||||||||||
Repurchase program(1) | 1,507,559 | $ | 85.19 | 1,507,559 | $ | 1,468,338,670 | |||||||
Employee transactions(2) | 4,157 | $ | 85.56 | N/A | N/A | ||||||||
| Total | |||||||||||||
Repurchase program(1) | 4,860,683 | $ | 82.29 | 4,860,683 | $ | 1,468,338,670 | |||||||
Employee transactions(2) | 12,808 | $ | 83.25 | N/A | N/A | ||||||||
Stock Performance Graph
The following graph compares the cumulative total stockholder return of our common stock, the S&P 500 Financials Index and the S&P 500 Index for the period from December 31, 20142017 through December 31, 2019.2022. The graph assumes an initial investment of $100 on December 31, 2014.2017. The cumulative returns include stock price appreciation and assume full reinvestment of dividends. This graph does not forecast future performance of our common stock.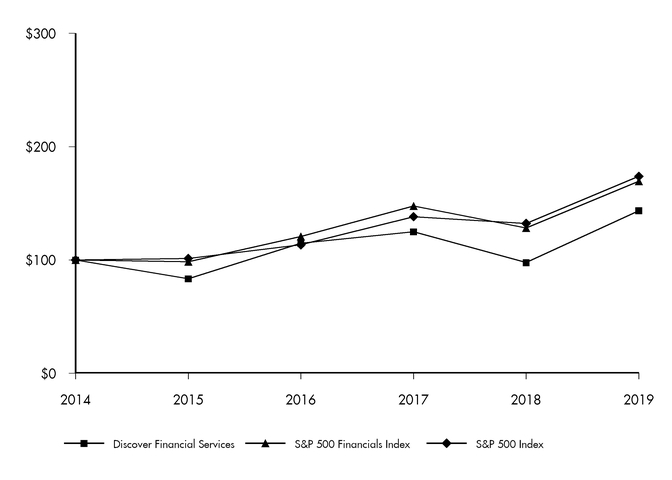
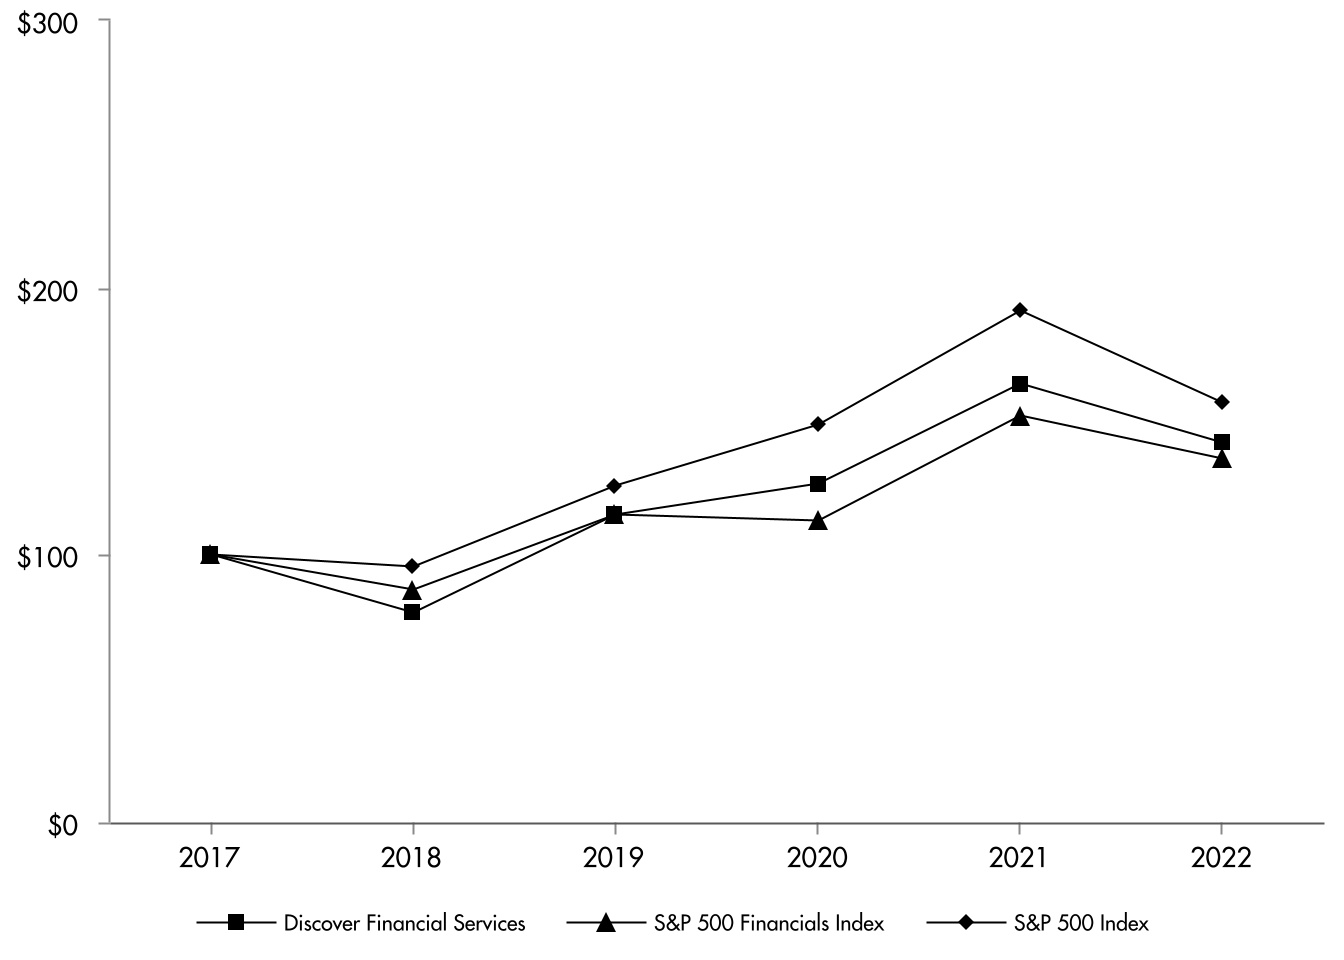
| December 31, | |||||||||||||||||||||||||||||||||||
| 2017 | 2018 | 2019 | 2020 | 2021 | 2022 | ||||||||||||||||||||||||||||||
| Discover Financial Services | $ | 100.00 | $ | 78.22 | $ | 114.94 | $ | 126.52 | $ | 164.21 | $ | 141.93 | |||||||||||||||||||||||
| S&P 500 Financials Index | $ | 100.00 | $ | 86.96 | $ | 114.87 | $ | 112.85 | $ | 152.20 | $ | 136.11 | |||||||||||||||||||||||
| S&P 500 Index | $ | 100.00 | $ | 95.61 | $ | 125.70 | $ | 148.81 | $ | 191.48 | $ | 156.77 | |||||||||||||||||||||||
Item 6. Reserved
-46-
| December 31, | |||||||||||||||||||||||
| 2014 | 2015 | 2016 | 2017 | 2018 | 2019 | ||||||||||||||||||
| Discover Financial Services | $ | 100.00 | $ | 83.45 | $ | 114.69 | $ | 124.90 | $ | 97.69 | $ | 143.56 | |||||||||||
| S&P 500 Financials Index | $ | 100.00 | $ | 98.44 | $ | 120.83 | $ | 147.58 | $ | 128.33 | $ | 169.52 | |||||||||||
| S&P 500 Index | $ | 100.00 | $ | 101.37 | $ | 113.49 | $ | 138.26 | $ | 132.19 | $ | 173.80 | |||||||||||
Contents
| For the Years Ended December 31, | |||||||||||||||||||
| 2019 | 2018 | 2017 | 2016 | 2015 | |||||||||||||||
| (in millions, except per share amounts) | |||||||||||||||||||
| Statement of Income Data | |||||||||||||||||||
| Interest income | $ | 11,993 | $ | 10,893 | $ | 9,648 | $ | 8,616 | $ | 7,945 | |||||||||
| Interest expense | 2,530 | 2,139 | 1,648 | 1,398 | 1,263 | ||||||||||||||
| Net interest income | 9,463 | 8,754 | 8,000 | 7,218 | 6,682 | ||||||||||||||
| Other income | 1,996 | 1,955 | 1,897 | 1,881 | 2,057 | ||||||||||||||
| Revenue net of interest expense | 11,459 | 10,709 | 9,897 | 9,099 | 8,739 | ||||||||||||||
| Provision for loan losses | 3,231 | 3,035 | 2,579 | 1,859 | 1,512 | ||||||||||||||
| Other expense | 4,393 | 4,077 | 3,781 | 3,584 | 3,615 | ||||||||||||||
| Income before income tax expense | 3,835 | 3,597 | 3,537 | 3,656 | 3,612 | ||||||||||||||
| Income tax expense | 878 | 855 | 1,438 | 1,263 | 1,315 | ||||||||||||||
| Net income | $ | 2,957 | $ | 2,742 | $ | 2,099 | $ | 2,393 | $ | 2,297 | |||||||||
| Net income allocated to common stockholders | $ | 2,908 | $ | 2,689 | $ | 2,031 | $ | 2,339 | $ | 2,246 | |||||||||
| Statement of Financial Condition Data (as of) | |||||||||||||||||||
| Loan receivables | $ | 95,894 | $ | 90,512 | $ | 84,248 | $ | 77,254 | $ | 72,385 | |||||||||
| Total assets | $ | 113,996 | $ | 109,553 | $ | 100,087 | $ | 92,308 | $ | 86,799 | |||||||||
| Total stockholders’ equity | $ | 11,859 | $ | 11,130 | $ | 10,892 | $ | 11,323 | $ | 11,275 | |||||||||
| Allowance for loan losses | $ | 3,383 | $ | 3,041 | $ | 2,621 | $ | 2,167 | $ | 1,869 | |||||||||
| Long-term borrowings | $ | 25,701 | $ | 27,228 | $ | 26,326 | $ | 25,443 | $ | 24,650 | |||||||||
| Per Share of Common Stock | |||||||||||||||||||
| Basic EPS from continuing operations | $ | 9.09 | $ | 7.81 | $ | 5.43 | $ | 5.77 | $ | 5.14 | |||||||||
| Diluted EPS from continuing operations | $ | 9.08 | $ | 7.79 | $ | 5.42 | $ | 5.77 | $ | 5.13 | |||||||||
| Weighted-average shares outstanding | 320 | 344 | 374 | 405 | 437 | ||||||||||||||
| Weighted-average shares outstanding (fully diluted) | 320 | 345 | 374 | 406 | 437 | ||||||||||||||
| Dividends declared per share of common stock | $ | 1.68 | $ | 1.50 | $ | 1.30 | $ | 1.16 | $ | 1.08 | |||||||||
| Common stock dividend payout ratio | 18.48 | % | 19.21 | % | 23.94 | % | 20.10 | % | 21.01 | % | |||||||||
| Ratios | |||||||||||||||||||
| Return on average total equity | 26 | % | 25 | % | 19 | % | 21 | % | 21 | % | |||||||||
| Return on average assets | 3 | % | 3 | % | 2 | % | 3 | % | 3 | % | |||||||||
| Average stockholders’ equity to average total assets | 11 | % | 11 | % | 12 | % | 13 | % | 14 | % | |||||||||
| Selected Financial Data (continued) | |||||||||||||||||||
| For the Years Ended December 31, | |||||||||||||||||||
| 2019 | 2018 | 2017 | 2016 | 2015 | |||||||||||||||
| (dollars in millions) | |||||||||||||||||||
| Selected Statistics | |||||||||||||||||||
| Total Loan Receivables | |||||||||||||||||||
| Loan receivables | $ | 95,894 | $ | 90,512 | $ | 84,248 | $ | 77,254 | $ | 72,385 | |||||||||
| Average loan receivables | $ | 90,886 | $ | 85,256 | $ | 78,525 | $ | 72,280 | $ | 69,061 | |||||||||
| Interest yield | 12.72 | % | 12.39 | % | 12.06 | % | 11.78 | % | 11.40 | % | |||||||||
| Net principal charge-off rate | 3.17 | % | 3.06 | % | 2.70 | % | 2.16 | % | 2.01 | % | |||||||||
| Delinquency rate (over 30 days) (excluding PCI) | 2.40 | % | 2.31 | % | 2.20 | % | 1.97 | % | 1.67 | % | |||||||||
| Delinquency rate (over 90 days) (excluding PCI) | 1.15 | % | 1.08 | % | 0.99 | % | 0.87 | % | 0.76 | % | |||||||||
| Credit Card Loans | |||||||||||||||||||
| Credit card loan receivables | $ | 77,181 | $ | 72,876 | $ | 67,291 | $ | 61,522 | $ | 57,896 | |||||||||
| Average credit card loan receivables | $ | 72,740 | $ | 67,953 | $ | 62,079 | $ | 57,238 | $ | 54,846 | |||||||||
| Interest yield | 13.32 | % | 13.00 | % | 12.74 | % | 12.50 | % | 12.08 | % | |||||||||
| Net principal charge-off rate | 3.43 | % | 3.26 | % | 2.91 | % | 2.34 | % | 2.22 | % | |||||||||
| Delinquency rate (over 30 days) | 2.62 | % | 2.43 | % | 2.28 | % | 2.04 | % | 1.72 | % | |||||||||
| Delinquency rate (over 90 days) | 1.32 | % | 1.22 | % | 1.12 | % | 0.97 | % | 0.85 | % | |||||||||
| Personal Loans | |||||||||||||||||||
| Personal loan receivables | $ | 7,687 | $ | 7,454 | $ | 7,374 | $ | 6,481 | $ | 5,490 | |||||||||
| Average personal loan receivables | $ | 7,522 | $ | 7,423 | $ | 7,020 | $ | 5,895 | $ | 5,245 | |||||||||
| Interest yield | 13.07 | % | 12.60 | % | 12.25 | % | 12.19 | % | 12.04 | % | |||||||||
| Net principal charge-off rate | 4.28 | % | 4.15 | % | 3.30 | % | 2.55 | % | 2.15 | % | |||||||||
| Delinquency rate (over 30 days) | 1.37 | % | 1.60 | % | 1.40 | % | 1.12 | % | 0.89 | % | |||||||||
| Delinquency rate (over 90 days) | 0.40 | % | 0.47 | % | 0.41 | % | 0.29 | % | 0.27 | % | |||||||||
| Private Student Loans (excluding PCI) | |||||||||||||||||||
| Private student loan receivables | $ | 8,402 | $ | 7,728 | $ | 7,076 | $ | 6,393 | $ | 5,647 | |||||||||
| Average private student loan receivables | $ | 8,124 | $ | 7,441 | $ | 6,764 | $ | 6,042 | $ | 5,272 | |||||||||
| Interest yield | 8.59 | % | 8.25 | % | 7.72 | % | 7.35 | % | 7.16 | % | |||||||||
| Net principal charge-off rate | 0.85 | % | 1.14 | % | 1.21 | % | 1.10 | % | 1.07 | % | |||||||||
| Delinquency rate (over 30 days) | 1.72 | % | 2.00 | % | 2.35 | % | 2.22 | % | 1.91 | % | |||||||||
| Delinquency rate (over 90 days) | 0.42 | % | 0.49 | % | 0.47 | % | 0.55 | % | 0.43 | % | |||||||||
The following discussion and analysis of our financial condition and results of operations should be read in conjunction with our audited consolidated financial statements and related notes included elsewhere in this annual report on Form 10-K. Some of the information contained in this discussion and analysis constitutes forward-looking statements that involve risks and uncertainties. Actual results could differ materially from those discussed in these forward-looking statements. Factors that could cause or contribute to these differences include, but are not limited to, those discussed below and elsewhere in this annual report on Form 10-K particularly under “Risk Factors” and “Special Note Regarding Forward-Looking Statements,” which immediately follows “Risk Factors.” Unless otherwise specified, references to Notes to our consolidated financial statements are to the Notes to our audited consolidated financial statements as of December 31, 20192022 and 20182021 and for years ended December 31, 2019, 20182022, 2021 and 2017.2020.
Introduction and Overview
Discover Financial Services (“DFS”) is a directdigital banking and payment services company. We provide directdigital banking products and services and payment services through our subsidiaries. We offer our customers credit card loans, private student loans, personal loans, home equity loans and deposit products. We also operate the Discover Network, the PULSE network (“PULSE”) and Diners Club International (“Diners Club”)., collectively known as the Discover Global Network. The Discover Network processes transactions for Discover-branded credit and debit cards and provides payment transaction processing and settlement services. PULSE operates an electronic funds transfer network, providing financial institutions issuing debit cards on the PULSE network with access to ATMs domestically and internationally as well asand merchant acceptance throughout the United States of America (“U.S.”) for debit card transactions. Diners Club is a global payments network of licensees, which are generally financial institutions, that issue Diners Club branded credit and charge cards and/or provide card acceptance services.
Our primary revenues consist of interest income earned on loan receivables and fees earned from customers, financial institutions, merchants and issuers. The primary expenses required to operate our business include funding costs (interest expense), loancredit loss provisions, customer rewards and expenses incurred to grow, manage and service our loan receivables and networks. Our business activities are funded primarily through consumer deposits, securitization of loan receivables and the issuance of unsecured debt.
The highlights below compare results as of and for the year ended December 31, 20192022 against results as of and for the year ended December 31, 2018.2021.
• | •Total loans grew $18.4 billion, or 20%, to $112.1 billion. •Credit card loans grew $15.7 billion, or 21%, to $90.1 billion. •The net charge-off rate for credit card loans decreased 4 basis points to 2.05% and the delinquency rate for credit card loans over 30 days past due increased 87 basis points to 2.53%. •Direct-to-consumer deposits grew $8.6 billion, or 14%, to $70.5 billion. •Payment Services transaction volume for the segment was $331.1 billion, up 5%. -47- |
Outlook
The outlook below provides our current expectations for our financial results based on market conditions, the regulatory and legal environment and our business reflective of our assumption that the U.S. economy will remain stable in 2020.strategies.
•We continue to focus on disciplined capital deployment through profitable organicexpect continued loan growth driven by recent account growth, moderation in the payment rate and executionour current expectations of our capital plan.sales trends.
•We expect the total net charge-off rate to increase, primarily duein comparison to the prior year, driven by continued credit normalization and seasoning of recent loanvintages.
•Total expenses are expected to increase, driven by employee compensation and benefits expense from higher headcount and marketing and business development expense, and we remain committed to managing expenses while continuing to make investments in profitable long-term growth.
Regulatory Environment and Developments
Capital Standards and Stress Testing
As a bank holding company, DFS is subject to mandatory supervisory stress tests every other year and is required to submit annual capital plans to the Federal Reserve based on forward-looking internal analysis of income and capital levels under expected and stressful conditions.DFS is also subject to capital buffer requirements, including the Stress Capital Buffer ("SCB"), which requires maintenance of regulatory capital levels above a threshold established based on the results of supervisory stress tests after accounting for planned dividend payments.
In January 2021, the Federal Reserve finalized regulatory amendments that made targeted changes to the capital planning, regulatory reporting and SCB requirements for firms subject to Category IV standards, including DFS, to be consistent with the Federal Reserve’s regulatory tailoring framework. The final rules generally align to instructions the Federal Reserve previously provided to Category IV firms regarding their respective capital plan submissions. The amended rules also provide Category IV firms with the option to submit to supervisory stress tests during off years if they wish for the Federal Reserve to reset the stress test portion of their SCB requirement. The Federal Reserve also revised the scope of application of its existing regulatory guidance for capital planning to align with the tailoring framework. However, the timing and substance of any additional changes to existing guidance or new guidance are uncertain.
In June 2021, the Federal Reserve announced the results of its supervisory stress tests for the firms required to participate in the 2021 Comprehensive Capital Analysis and Review (“CCAR”) process. In accordance with the capital plan rule amendments, DFS elected not to participate in the 2021 supervisory stress tests. Nevertheless, DFS was required to submit a capital plan based on a forward-looking internal assessment of income and capital under baseline and stressful conditions. The Federal Reserve thereafter used our 2021 capital plan submission to assess its capital planning process and positions and, in August 2021, announced DFS' adjusted SCB requirement of 3.6% to reflect DFS' planned common stock dividends. This adjusted SCB is effective through October 1, 2022. Discover was a full participant in the 2022 CCAR process and submitted the 2022 Capital Plan to the Federal Reserve by the April 5, 2022 due date.
In June 2022, the Federal Reserve released results of the 2022 CCAR exercise. Discover’s results showed strong capital levels under stress, well above regulatory minimums. These results were used to set the new SCB effective October 1, 2022. In August 2022, the Federal Reserve established the new SCB for DFS is 2.5%, the lowest possible requirement.
London Interbank Offered Rate
In July 2017, the UK Financial Conduct Authority ("FCA") announced that it would no longer encourage or compel banks to continue to develop, implementcontribute quotes and executemaintain the London Interbank Offered Rate ("LIBOR") after 2021. To support a smooth transition away from LIBOR, the Federal Reserve and the Federal Reserve Bank of New York convened the Alternative Reference Rates Committee ("ARRC"), a group of private-market participants tasked with facilitating a successful transition from U.S. dollar ("USD") LIBOR to a more robust reference rate. The ARRC identified the Secured Overnight Financing Rate ("SOFR") as its recommended alternative reference rate for USD LIBOR. The ARRC has also established several priorities and milestones to support the use of SOFR and SOFR-based indices,
-48-
including developing contractual “fallback” language for capital markets and consumer products; providing clarity on legal, tax, accounting and regulatory matters; promoting broad outreach and education efforts around the LIBOR transition; and recommending spread adjustments for SOFR and SOFR-based indices, which will be of critical importance to market participants once USD LIBOR settings cease in 2023.
In March 2021, the FCA announced the future cessation and loss of representativeness for all LIBOR benchmark settings. While non-USD and several less frequently referenced USD LIBOR settings ceased publication immediately after December 31, 2021, commonly referenced USD LIBOR settings will cease publication immediately after June 30, 2023; this future cessation event will trigger fallback provisions in many financial contracts that require conversion of the benchmark index from LIBOR to an alternative rate. In July 2021, the ARRC announced its recommendation of forward-looking term rates based on SOFR as additional alternative reference rate options.
In December 2021, the Consumer Financial Protection Bureau (“CFPB”) finalized a rule to facilitate transition from LIBOR, which became effective on April 1, 2022. Specifically, this final rule provides guidance on LIBOR replacements and the LIBOR transition for purposes of Regulation Z. We have communicated with the CFPB regarding our plans for the LIBOR transition.
A cross-functional team is overseeing and managing our transition away from the use of LIBOR. This team assesses evolving industry and marketplace norms and conventions for LIBOR-indexed instruments, evaluates the impacts stemming from the future cessation of LIBOR publication and oversees and takes actions to transition our LIBOR exposures to alternative benchmark rates, usually SOFR. Our existing LIBOR exposures are limited to two instruments — variable-rate student loans and capital markets securities.
As of December 31, 2022, LIBOR-indexed variable-rate loans comprised approximately 39% of our private student loan portfolio and approximately 4% of our aggregate loan portfolio. These outstanding student loans indexed to LIBOR will convert to a SOFR index in 2023 when 3-month USD LIBOR ceases to be a representative reference rate. As of November 2021, we no longer originate new variable-rate student loans indexed to LIBOR. Instead, new originations of such loans are indexed solely to 3-month term SOFR published by the Chicago Mercantile Exchange.
We ceased entering into new LIBOR-indexed interest rate derivatives in 2018 and have since actively reduced LIBOR exposures in our derivatives portfolio. During the third quarter of 2021, we terminated our last LIBOR-indexed interest rate swap maturing after June 2023; our last LIBOR-indexed interest rate swap matured in January 2022.
Most of our capital markets securities indexed to USD LIBOR are floating-rate asset-backed securities. Beginning in 2018, we included fallback provisions in all newly-issued securities that will facilitate an orderly transition from LIBOR to an appropriate reference rate, which may be based on SOFR, once 1- and 3-month LIBOR cease to be published after June 2023. Approximately $1.5 billion of our capital markets securities that mature after June 2023 with no fallback provisions would be covered under federal legislation enacted in March 2022. This legislation would allow us to replace the LIBOR index with SOFR under a safe harbor provision. Approximately $500 million of our capital markets securities have a rate reset in August 2023 that contains a fallback provision that may not be covered under the federal LIBOR legislation; however, we may decide to exercise our right to call and redeem those securities on their reset date.
We have prepared for the cessation of USD LIBOR by taking steps to avoid new exposures and actively reduce our remaining exposures. We completed scheduled transition work before year-end 2021, including providing our stakeholders with information about the cessation of USD LIBOR and how it will affect their contracts with us. The transition process will continue through the end of 2023.
Consumer Financial Services
The CFPB regulates consumer financial products and services and examines certain providers of consumer financial products and services, including Discover. The CFPB’s authority includes rulemaking, supervisory and enforcement priorities. The impactpowers with respect to federal consumer protection laws; preventing “unfair, deceptive or abusive acts or practices” (“UDAAP”) and ensuring that consumers have access to fair, transparent and competitive financial products and services. Historically, the CFPB’s policy priorities focused on several financial products of the evolvingtype we offer (e.g., credit cards and other consumer lending products). In addition, the CFPB is required by statute to undertake certain actions including its biennial review of the consumer credit card market.
Under Director Rohit Chopra’s leadership, the CFPB’s priorities have focused on and are expected to continue focusing on, among other things, increased enforcement of existing consumer protection laws, with a particular focus on
-49-
fees charged to consumers, UDAAP, fair lending, student lending and servicing, debt collection and credit reporting. Additionally, detection of repeat offenders, such as companies that violate a formal court or agency order, has become a priority for the CFPB. Director Chopra, in March 2022, identified, as repeat offenders, several companies that have had multiple enforcement actions, including us. The CFPB has recently taken action against financial institutions for violating prior enforcement actions. Enhanced regulatory environment on our business and operations depends upon a number of factors, including the actions of policymakers at the federal and state levels, our competitors, and consumers. For more information on how the regulatory andrequirements, potential supervisory environment, ongoingfindings, or enforcement actions and findings, and changes to laws and regulationsratings could negatively impact our ability to implement certain consumer-focused enhancements to product features and functionality and business strategies, limit or change our business practices, limit our consumer product offerings, cause us to invest more management time and resources in compliance efforts or limit our ability to obtain related required regulatory approvals. The additional expense, time and resources needed to comply with ongoing or new regulatory requirements may adversely impact the valuecost of and access to credit for consumers and results of business operations.
In December 2020, certain of our assets, or otherwise adversely affect our business see “Risk Factors — Current Economic and Regulatory Environment.” For more information on recent matters affecting us, seesubsidiaries entered into a consent order with the CFPB regarding identified private student loan servicing practices. See Note 19: Litigation and Regulatory Matters to our consolidated financial statements.statements for more information.
Policymakers at the federal and state levels are increasinglyremain focused on measures to enhanceenhancing data security and data breach incident response requirements. Furthermore, regulations and legislation at various levels of government have been proposed and enacted to augment consumer data privacy standards. For example, theThe California Consumer Privacy Act (“CCPA”("CCPA") creates a broad set of privacy rights and remedies modeled in part on the European Union’sUnion's General Data Protection Regulation. The CCPA went into effect onin January 1, 2020, and proposedthe California Attorney General’s final regulations have yet to be finalized.became effective in August 2020, with enforcement beginning in July 2020. The California Privacy Rights Act ("CPRA"), a ballot measure led by the original proponent of the CCPA, recently launched apassed in November 2020, California ballot initiative with the goalan effective date of expanding the rightsJanuary 1, 2023, and remedies created byenforcement set to begin on July 1, 2023. The CPRA replaces the CCPA while protectingto enhance consumer privacy protections further and creates a new California Privacy Protection Agency (“CPPA”). The CPPA Board released a Notice of Proposed Rulemaking with final regulations still forthcoming. While the new law from future legislative amendments. While it is too earlyCPRA retains an exemption for information collected, processed, sold, or disclosed subject to determine the fullGramm-Leach-Bliley Act, we continue to evaluate the impact of these developments, they may result in the imposition of requirementsCPRA on Discoverour businesses and other providers of consumer financial servicesservices.
Environmental, Social and Governance Matters
Environmental, social and governance (“ESG”) issues, including climate change, human capital and governance practices, are a significant area of focus by lawmakers at the state and federal levels, regulatory agencies, shareholders and other stakeholders. Proposed legislation and rulemakings have been issued or networks that could adversely affect our businesses.
In June 2016,particular, in March 2022, the Financial Accounting Standards Board issued Accounting Standards Update No. 2016-13, Financial Instruments—Credit Losses (Topic 326): Measurement of Credit Losses on Financial Instruments, which is
Results of Operations
The discussion below provides a summary of our results of operations and information about our loan receivables as of and for the year ended December 31, 20192022, compared to the year ended December 31, 2018.2021. Refer to our annual report on Form 10-K for the year ended December 31, 20182021, for discussion of our results of operations and loan receivables information as of and for the year ended December 31, 20182021, compared to the year ended December 31, 2017.2020.
-50-
Segments
We manage our business activities in two segments, DirectDigital Banking and Payment Services, based on the products and services provided. For a detailed description of the operations of each segment, as well as the allocation conventions used in our business segment reporting, see Note 22: Segment Disclosures to our consolidated financial statements.
The following table presents segment data (dollars in millions):
| For the Years Ended December 31, | |||||||||||||||||
| 2022 | 2021 | 2020 | |||||||||||||||
| Digital Banking | |||||||||||||||||
| Interest income | |||||||||||||||||
| Credit card loans | $ | 10,632 | $ | 8,717 | $ | 8,985 | |||||||||||
| Private student loans | 831 | 742 | 754 | ||||||||||||||
| Personal loans | 872 | 878 | 958 | ||||||||||||||
| Other loans | 167 | 114 | 106 | ||||||||||||||
| Other interest income | 362 | 200 | 292 | ||||||||||||||
| Total interest income | 12,864 | 10,651 | 11,095 | ||||||||||||||
| Interest expense | 1,865 | 1,134 | 1,865 | ||||||||||||||
| Net interest income | 10,999 | 9,517 | 9,230 | ||||||||||||||
| Provision for credit losses | 2,359 | 218 | 5,134 | ||||||||||||||
| Other income | 2,162 | 1,781 | 1,459 | ||||||||||||||
| Other expense | 5,069 | 4,549 | 4,292 | ||||||||||||||
| Income before income tax expense | 5,733 | 6,531 | 1,263 | ||||||||||||||
| Payment Services | |||||||||||||||||
| Other income | 176 | 789 | 399 | ||||||||||||||
| Other expense | 167 | 256 | 227 | ||||||||||||||
| Income before income tax expense | 9 | 533 | 172 | ||||||||||||||
| Total income before income tax expense | $ | 5,742 | $ | 7,064 | $ | 1,435 | |||||||||||
-51-
| The following table presents segment data (dollars in millions): | |||||||||||
| For the Years Ended December 31, | |||||||||||
| 2019 | 2018 | 2017 | |||||||||
| Direct Banking | |||||||||||
| Interest income | |||||||||||
| Credit card | $ | 9,690 | $ | 8,835 | $ | 7,907 | |||||
| Private student loans | 698 | 614 | 523 | ||||||||
| PCI student loans | 119 | 139 | 159 | ||||||||
| Personal loans | 983 | 935 | 860 | ||||||||
| Other | 502 | 369 | 199 | ||||||||
| Total interest income | 11,992 | 10,892 | 9,648 | ||||||||
| Interest expense | 2,530 | 2,139 | 1,648 | ||||||||
| Net interest income | 9,462 | 8,753 | 8,000 | ||||||||
| Provision for loan losses | 3,233 | 3,035 | 2,586 | ||||||||
| Other income | 1,648 | 1,645 | 1,607 | ||||||||
| Other expense | 4,231 | 3,918 | 3,629 | ||||||||
| Income before income tax expense | 3,646 | 3,445 | 3,392 | ||||||||
| Payment Services | |||||||||||
| Net interest income | 1 | 1 | — | ||||||||
| Provision for loan losses | (2 | ) | — | (7 | ) | ||||||
| Other income | 348 | 310 | 290 | ||||||||
| Other expense | 162 | 159 | 152 | ||||||||
| Income before income tax expense | 189 | 152 | 145 | ||||||||
| Total income before income tax expense | $ | 3,835 | $ | 3,597 | $ | 3,537 | |||||
| For the Years Ended December 31, | |||||||||||||||||
| 2022 | 2021 | 2020 | |||||||||||||||
| Network Transaction Volume | |||||||||||||||||
| PULSE Network | $ | 253,072 | $ | 247,913 | $ | 212,081 | |||||||||||
| Network Partners | 44,542 | 40,707 | 31,917 | ||||||||||||||
Diners Club(1) | 33,505 | 25,937 | 24,236 | ||||||||||||||
| Total Payment Services | 331,119 | 314,557 | 268,234 | ||||||||||||||
Discover Network — Proprietary(2) | 218,738 | 188,960 | 148,754 | ||||||||||||||
| Total Network Transaction Volume | $ | 549,857 | $ | 503,517 | $ | 416,988 | |||||||||||
| Transactions Processed on Networks | |||||||||||||||||
| Discover Network | 3,617 | 3,259 | 2,624 | ||||||||||||||
| PULSE Network | 6,200 | 5,632 | 4,954 | ||||||||||||||
| Total Transaction Processed on Networks | 9,817 | 8,891 | 7,578 | ||||||||||||||
| Credit Card Volume | |||||||||||||||||
Discover Card Volume(3) | $ | 224,477 | $ | 192,755 | $ | 153,943 | |||||||||||
Discover Card Sales Volume(4) | $ | 210,645 | $ | 182,125 | $ | 142,800 | |||||||||||
(1)Diners Club volume is derived from data provided by licensees for Diners Club branded cards issued outside North America and is subject to subsequent revision or amendment.
(2)Represents gross Discover card sales volume on the Discover Network.
| The following table presents information on transaction volume (in millions): | |||||||||||
| For the Years Ended December 31, | |||||||||||
| 2019 | 2018 | 2017 | |||||||||
| Network Transaction Volume | |||||||||||
| PULSE Network | $ | 192,067 | $ | 179,792 | $ | 157,128 | |||||
| Network Partners | 25,368 | 18,948 | 14,213 | ||||||||
Diners Club(1) | 33,967 | 33,877 | 31,544 | ||||||||
| Total Payment Services | 251,402 | 232,617 | 202,885 | ||||||||
Discover Network—Proprietary(2) | 151,243 | 143,865 | 133,044 | ||||||||
| Total Volume | $ | 402,645 | $ | 376,482 | $ | 335,929 | |||||
| Transactions Processed on Networks | |||||||||||
| Discover Network | 2,717 | 2,469 | 2,240 | ||||||||
| PULSE Network | 4,788 | 4,364 | 3,856 | ||||||||
| Total | 7,505 | 6,833 | 6,096 | ||||||||
| Credit Card Volume | |||||||||||
Discover Card Volume(3) | $ | 160,283 | $ | 152,826 | $ | 141,858 | |||||
Discover Card Sales Volume(4) | $ | 146,183 | $ | 139,031 | $ | 128,806 | |||||
Digital Banking
Our DirectDigital Banking segment reported pretax income of $3.6$5.7 billion for the year ended December 31, 20192022, as compared to $3.4$6.5 billion for the year ended December 31, 2018.2021.
Net interest income increased for the year ended December 31, 20192022, as compared to the year ended December 31, 20182021, primarily driven by loan growtha higher average level of receivables and higher yieldsyield on credit card loans, partially offset by higher funding costs. Interest income increased overcompared to the prior year primarily due to continued loan growth and yield expansion resulting froma higher average level of loan receivables and higher market rates and changes in portfolio mix.rates. Interest expense increased compared to the prior year primarily due to higher funding costs driven by higher market rates and a larger funding base and higher average market rates.base.
For the year ended December 31, 2019,2022, the provision for loancredit losses increased as compared to the year ended December 31, 20182021, primarily due to higher levels of net charge-offs, slightly offsetdriven by lower reserve builds.continued loan growth. For a detailed discussion on provision for loancredit losses, see “— Loan Quality — Provision and Allowance for LoanCredit Losses.”
Discover card sales volume was $146.2$210.6 billion for the year ended December 31, 2019,2022, which was an increase of 5.1%15.7% as compared to the year ended December 31, 2018.2021. This volume growth was primarily driven by higher consumer spending.spending across all spending categories.
-52-
Payment Services
Our Payment Services segment reported pretax income of $189$9 million for the year ended December 31, 20192022, as compared to pretax income of $152$533 million for the year ended December 31, 2018.2021. The increasedecrease in segment pretax income was primarily due to higher transaction volume across multiple channels.net losses on equity investments as a result of a decrease in the fair value of those investments.
Critical Accounting Estimates
In preparing our consolidated financial statements in conformity with GAAP,accounting principles generally accepted in the U.S. (“GAAP”), management must make judgments and use estimates and assumptions about the effects of matters that are uncertain. For estimates that involve a high degree of judgment and subjectivity, it is possible that different estimates could reasonably be derived for the same period. For estimates that are particularly sensitive to changes in economic or market conditions, significant changes to the estimated amount from period to period are also possible. Management believes the current assumptions and other considerations used to estimate amounts reflected in our consolidated financial statements are appropriate. However, if actual experience differs from the assumptions and other considerations used in estimating amounts in our consolidated financial statements, the resulting changes could have a material effect on our consolidated results of operations and, in certain cases, could have a material effect on our consolidated financial condition. Management has identified the estimates related to our allowance for loancredit losses the evaluation of goodwill for potential impairment and the accrual of income taxes as a critical accounting estimates.estimate.
Allowance for LoanCredit Losses
In deriving this estimate,estimating the expected credit losses, we consider the collectibilityuse a combination of principal, intereststatistical models and fees associated with our loan receivables. While our estimation process includes historical data and analysis, therequalitative analysis. There is a significant amount of judgment applied in selecting inputs and analyzing the results produced to estimate the allowance for credit losses. For more information on these judgments and our accounting policies and methodologies used to determine the allowance. We useallowance for credit losses, see "— Loan Quality," Note 4: Loan Receivables and Note 2: Summary of Significant Accounting Policies to our consolidated financial statements.
One of the key assumptions requiring significant judgment in estimating the current expected credit losses (“CECL”) on a migrationquarterly basis is the determination of the macroeconomic forecasts used in the loss forecast models. For the reasonable and supportable loss forecast period, we consider forecasts of multiple economic scenarios that generally include a base scenario with one or more optimistic (upside) or pessimistic (downside) scenarios. These scenarios comprise a variety of macroeconomic variables, including annualized gross domestic product growth and unemployment rate. The scenarios that are chosen each quarter and the amount of weighting given to each scenario depend on a variety of factors including recent economic events, leading economic indicators, views of internal and third-party economists and industry trends. Assumptions about the macroeconomic environment are inherently uncertain and, as a result, actual changes in the allowance for credit losses may be different from the simulated scenario presented below.
To demonstrate the sensitivity of the estimated credit losses to the macroeconomic scenarios, we measured the impact of altering the weighting of macroeconomic scenarios used in our loss forecast. Our allowance for credit losses would increase by approximately $589 million at December 31, 2022 if we applied 100% weight to the most adverse scenario in our sensitivity analysis to estimatereflect continued inflationary pressures, including persistent supply-chain disruptions and the likelihood that a loan will progress through the various stagesinfluence of delinquency. Management also estimates loss emergence by using other analysesgeopolitical events, as well as high interest rates.
The sensitivity disclosed above is hypothetical. It is difficult to estimate how potential changes in any one factor or input, such as the weighting of macroeconomic forecasts, might affect the overall allowance for credit losses incurred from non-delinquent accounts.because we consider a variety of factors and inputs in estimating the allowance for credit losses. The considerationsmacroeconomic scenarios used are constructed with interrelated projections of multiple economic variables, and loss estimates are produced that consider the historical correlation of those economic variables with credit losses. The inputs in these analyses include past and current loan performance, loan seasoning and growth, current risk management practices, account collection strategies, economic conditions, bankruptcy filings, policy changes and forecasting uncertainties. Giventhe macroeconomic scenarios may not change at the same information, othersrate and may reachnot be consistent across all geographies or product types, and changes in factors and inputs may be directionally inconsistent, such that improvement in one factor or input may offset deterioration in others. As a result, the sensitivity analysis above does not necessarily reflect the nature and extent of
-53-
future changes in the allowance for credit losses. It is intended to provide insights into the impact of different reasonable estimates.judgments about the economy on our modeled loss estimates for the loan portfolio and does not imply any expectation of future losses. Furthermore, the hypothetical increase in our allowance for credit losses for loans does not incorporate the impact of management judgment for qualitative factors applied in the current allowance for credit losses, which may have a positive or negative effect on our actual financial condition and results of operations.
The overall economic environment directly impacts the macroeconomic variables that are used in the loss forecast models. If management used different assumptions about the economic environment in estimating incurred net loanexpected credit losses, the impact to the allowance for loancredit losses could have a material effect on our consolidated financial condition and results of operations. For example, a 10% change in management’s estimate of incurred net loan losses could have resulted in a change of approximately $338 millionIn addition, if we experience significant instability in the allowance for loan losses at December 31, 2019, with a corresponding change ineconomic environment, the provision for loan losses. See “— Loan Quality” and Note 2: Summary of Significant Accounting Policiesuncertainty around the credit loss forecasts may increase, both due to our consolidated financial statements for further details about our allowance for loan losses.
Earnings Summary
The following table outlines changes in our consolidated statements of income (dollars in millions):
| For the Years Ended December 31, | 2022 vs. 2021 Increase (Decrease) | 2021 vs. 2020 (Decrease) Increase | |||||||||||||||||||||||||||||||||||||||
| 2022 | 2021 | 2020 | $ | % | $ | % | |||||||||||||||||||||||||||||||||||
| Interest income | $ | 12,864 | $ | 10,651 | $ | 11,095 | $ | 2,213 | 21 | % | $ | (444) | (4) | % | |||||||||||||||||||||||||||
| Interest expense | 1,865 | 1,134 | 1,865 | 731 | 64 | % | (731) | (39) | % | ||||||||||||||||||||||||||||||||
| Net interest income | 10,999 | 9,517 | 9,230 | 1,482 | 16 | % | 287 | 3 | % | ||||||||||||||||||||||||||||||||
| Provision for credit losses | 2,359 | 218 | 5,134 | 2,141 | NM | (4,916) | (96) | % | |||||||||||||||||||||||||||||||||
| Net interest income after provision for credit losses | 8,640 | 9,299 | 4,096 | (659) | (7) | % | 5,203 | 127 | % | ||||||||||||||||||||||||||||||||
| Other income | 2,338 | 2,570 | 1,858 | (232) | (9) | % | 712 | 38 | % | ||||||||||||||||||||||||||||||||
| Other expense | 5,236 | 4,805 | 4,519 | 431 | 9 | % | 286 | 6 | % | ||||||||||||||||||||||||||||||||
| Income before income tax expense | 5,742 | 7,064 | 1,435 | (1,322) | (19) | % | 5,629 | 392 | % | ||||||||||||||||||||||||||||||||
| Income tax expense | 1,350 | 1,615 | 294 | (265) | (16) | % | 1,321 | 449 | % | ||||||||||||||||||||||||||||||||
| Net income | $ | 4,392 | $ | 5,449 | $ | 1,141 | $ | (1,057) | (19) | % | $ | 4,308 | 378 | % | |||||||||||||||||||||||||||
| Net income allocated to common stockholders | $ | 4,304 | $ | 5,351 | $ | 1,104 | $ | (1,047) | (20) | % | $ | 4,247 | 385 | % | |||||||||||||||||||||||||||
-54-
| The following table outlines changes in our consolidated statements of income (dollars in millions): | |||||||||||||||||||||||||
| For the Years Ended December 31, | 2019 vs. 2018 Increase | 2018 vs. 2017 Increase (Decrease) | |||||||||||||||||||||||
| 2019 | 2018 | 2017 | $ | % | $ | % | |||||||||||||||||||
| Interest income | $ | 11,993 | $ | 10,893 | $ | 9,648 | $ | 1,100 | 10 | % | $ | 1,245 | 13 | % | |||||||||||
| Interest expense | 2,530 | 2,139 | 1,648 | 391 | 18 | % | 491 | 30 | % | ||||||||||||||||
| Net interest income | 9,463 | 8,754 | 8,000 | 709 | 8 | % | 754 | 9 | % | ||||||||||||||||
| Provision for loan losses | 3,231 | 3,035 | 2,579 | 196 | 6 | % | 456 | 18 | % | ||||||||||||||||
| Net interest income after provision for loan losses | 6,232 | 5,719 | 5,421 | 513 | 9 | % | 298 | 5 | % | ||||||||||||||||
| Other income | 1,996 | 1,955 | 1,897 | 41 | 2 | % | 58 | 3 | % | ||||||||||||||||
| Other expense | 4,393 | 4,077 | 3,781 | 316 | 8 | % | 296 | 8 | % | ||||||||||||||||
| Income before income tax expense | 3,835 | 3,597 | 3,537 | 238 | 7 | % | 60 | 2 | % | ||||||||||||||||
| Income tax expense | 878 | 855 | 1,438 | 23 | 3 | % | (583 | ) | (41 | )% | |||||||||||||||
| Net income | $ | 2,957 | $ | 2,742 | $ | 2,099 | $ | 215 | 8 | % | $ | 643 | 31 | % | |||||||||||
Net Interest Income
The tables that follow this section have been provided to supplement the discussion below and provide further analysis of net interest income, net interest margin and the impact of rate and volume changes on net interest income. Net interest income represents the difference between interest income earned on our interest-earning assets and the interest expense incurred to finance those assets. We analyze net interest income in total by calculating net interest margin (net interest income as a percentage of average total loan receivables) and net yield on interest-earning assets (net interest income as a percentage of average total interest-earning assets). We also separately consider the impact of the level of loan receivables and the related interest yield and the impact of the cost of funds related to each of our funding sources, along with the income generated by our liquidity portfolio, on net interest income.
Our interest-earning assets consist of: (i) cash and cash equivalents primarily related to amounts on deposit with the Federal Reserve Bank of Philadelphia, (ii) restricted cash, (iii) other short-term investments, (iv) investment securities and (v) loan receivables. Our interest-bearing liabilities consist primarily of deposits, both direct-to-consumer and brokered, and long-term borrowings, including amounts owed to securitization investors. NetThe following factors influence net interest income is influenced by the following:income:
•The level and composition of loan receivables, including the proportion of credit card loans to other loans, as well as the proportion of loan receivables bearing interest at promotional rates as compared to standard rates;
•The credit performance of our loans, particularly with regard to charge-offs of finance charges, which reduce interest income;
•The terms of long-term borrowings and certificates of deposit upon initial offering, including maturity and interest rate;
•The interest rates necessary to attract and maintain direct-to-consumer deposits;
•The level and composition of other interest-earning assets, including our liquidity portfolio, and interest-bearing liabilities;
•Changes in the interest rate environment, including the levels of interest rates and the relationships among interest rate indices, such as the prime rate, the Federal Fundsfederal funds rate, the interest rate on excess reservesreserve balances, LIBOR and LIBOR;SOFR; and
•The effectiveness of interest rate swaps in our interest rate risk management program; and
Net interest income increased for the year ended December 31, 20192022, as compared to the year ended December 31, 20182021, primarily driven by loan growtha higher average level of receivables and higher yieldsyield on credit card loans, partially offset by higher funding costs. Interest income increased overcompared to the prior year primarily due to continued loan growth and yield expansion resulting froma higher average level of loan receivables and higher market rates and changes in portfolio mix.rates. Interest expense increased compared to the prior year primarily due to higher funding costs driven by higher market rates and a larger funding basebase.
-55-
Average Balance Sheet Analysis
(dollars in millions)
| For the Years Ended December 31, | |||||||||||||||||||||||||||||||||||||||||||||||||||||
| 2022 | 2021 | 2020 | |||||||||||||||||||||||||||||||||||||||||||||||||||
| Average Balance | Yield/Rate | Interest | Average Balance | Yield/Rate | Interest | Average Balance | Yield/Rate | Interest | |||||||||||||||||||||||||||||||||||||||||||||
| Assets | |||||||||||||||||||||||||||||||||||||||||||||||||||||
| Interest-earning assets | |||||||||||||||||||||||||||||||||||||||||||||||||||||
| Cash and cash equivalents | $ | 9,279 | 1.89 | % | $ | 175 | $ | 14,236 | 0.13 | % | $ | 18 | $ | 11,348 | 0.30 | % | $ | 35 | |||||||||||||||||||||||||||||||||||
| Restricted cash | 515 | 1.48 | % | 8 | 695 | 0.03 | % | NM | 438 | 0.45 | % | 2 | |||||||||||||||||||||||||||||||||||||||||
| Other short-term investments | — | — | — | 176 | 0.12 | % | NM | 2,677 | 0.14 | % | 4 | ||||||||||||||||||||||||||||||||||||||||||
| Investment securities | 6,988 | 2.57 | % | 179 | 8,713 | 2.09 | % | 182 | 11,431 | 2.21 | % | 252 | |||||||||||||||||||||||||||||||||||||||||
Loan receivables(1) | |||||||||||||||||||||||||||||||||||||||||||||||||||||
Credit card loans(2)(3) | 79,243 | 13.42 | % | 10,632 | 69,365 | 12.57 | % | 8,717 | 71,447 | 12.58 | % | 8,985 | |||||||||||||||||||||||||||||||||||||||||
| Private student loans | 10,240 | 8.11 | % | 831 | 10,057 | 7.38 | % | 742 | 9,890 | 7.63 | % | 754 | |||||||||||||||||||||||||||||||||||||||||
| Personal loans | 7,295 | 11.95 | % | 872 | 6,945 | 12.64 | % | 878 | 7,406 | 12.93 | % | 958 | |||||||||||||||||||||||||||||||||||||||||
| Other | 2,895 | 5.77 | % | 167 | 2,054 | 5.57 | % | 114 | 1,660 | 6.35 | % | 105 | |||||||||||||||||||||||||||||||||||||||||
| Total loan receivables | 99,673 | 12.54 | % | 12,502 | 88,421 | 11.82 | % | 10,451 | 90,403 | 11.95 | % | 10,802 | |||||||||||||||||||||||||||||||||||||||||
| Total interest-earning assets | 116,455 | 11.05 | % | 12,864 | 112,241 | 9.49 | % | 10,651 | 116,297 | 9.54 | % | 11,095 | |||||||||||||||||||||||||||||||||||||||||
| Allowance for credit losses | (6,820) | (7,351) | (7,301) | ||||||||||||||||||||||||||||||||||||||||||||||||||
| Other assets | 6,070 | 6,237 | 5,853 | ||||||||||||||||||||||||||||||||||||||||||||||||||
Total assets(4) | $ | 115,705 | $ | 111,127 | $ | 114,849 | |||||||||||||||||||||||||||||||||||||||||||||||
| Liabilities and Stockholders’ Equity | |||||||||||||||||||||||||||||||||||||||||||||||||||||
| Interest-bearing liabilities | |||||||||||||||||||||||||||||||||||||||||||||||||||||
| Interest-bearing deposits | |||||||||||||||||||||||||||||||||||||||||||||||||||||
| Time deposits | $ | 23,988 | 2.02 | % | 484 | $ | 23,928 | 1.84 | % | 440 | $ | 32,226 | 2.40 | % | 772 | ||||||||||||||||||||||||||||||||||||||
Money market deposits(5) | 8,453 | 1.67 | % | 141 | 8,142 | 0.53 | % | 43 | 7,774 | 1.10 | % | 85 | |||||||||||||||||||||||||||||||||||||||||
| Other interest-bearing savings deposits | 44,276 | 1.43 | % | 632 | 40,912 | 0.43 | % | 178 | 35,077 | 1.06 | % | 374 | |||||||||||||||||||||||||||||||||||||||||
| Total interest-bearing deposits | 76,717 | 1.64 | % | 1,257 | 72,982 | 0.91 | % | 661 | 75,077 | 1.64 | % | 1,231 | |||||||||||||||||||||||||||||||||||||||||
| Borrowings | |||||||||||||||||||||||||||||||||||||||||||||||||||||
| Short-term borrowings | 225 | 0.70 | % | 2 | 72 | 0.18 | % | NM | 1,024 | 3.10 | % | 32 | |||||||||||||||||||||||||||||||||||||||||
Securitized borrowings(6)(7)(8) | 9,060 | 2.41 | % | 219 | 9,627 | 1.06 | % | 102 | 12,521 | 1.44 | % | 181 | |||||||||||||||||||||||||||||||||||||||||
Other long-term borrowings(7)(8)(9) | 9,334 | 4.15 | % | 387 | 9,888 | 3.75 | % | 371 | 10,996 | 3.83 | % | 421 | |||||||||||||||||||||||||||||||||||||||||
| Total borrowings | 18,619 | 3.26 | % | 608 | 19,587 | 2.42 | % | 473 | 24,541 | 2.58 | % | 634 | |||||||||||||||||||||||||||||||||||||||||
| Total interest-bearing liabilities | 95,336 | 1.96 | % | 1,865 | 92,569 | 1.23 | % | 1,134 | 99,618 | 1.87 | % | 1,865 | |||||||||||||||||||||||||||||||||||||||||
Other liabilities and stockholders’ equity(10) | 20,369 | 18,558 | 15,231 | ||||||||||||||||||||||||||||||||||||||||||||||||||
| Total liabilities and stockholders’ equity | $ | 115,705 | $ | 111,127 | $ | 114,849 | |||||||||||||||||||||||||||||||||||||||||||||||
| Net interest income | $ | 10,999 | $ | 9,517 | $ | 9,230 | |||||||||||||||||||||||||||||||||||||||||||||||
Net interest margin(11) | 11.04 | % | 10.76 | % | 10.21 | % | |||||||||||||||||||||||||||||||||||||||||||||||
Net yield on interest-earning assets(12) | 9.45 | % | 8.48 | % | 7.94 | % | |||||||||||||||||||||||||||||||||||||||||||||||
Interest rate spread(13) | 9.09 | % | 8.26 | % | 7.67 | % | |||||||||||||||||||||||||||||||||||||||||||||||
(1)Average balances of loan receivables and higheryield calculations include non-accruing loans. If the non-accruing loan balances were excluded, there would not be a material impact on the amounts reported above.
(2)Interest income on credit card loans includes $365 million, $295 million and $298 million of amortization of balance transfer fees for the years ended December 31, 2022, 2021 and 2020, respectively.
(3)Includes the impact of interest rate swap agreements used to change a portion of floating-rate assets to fixed-rate assets for the years ended December 31, 2022, 2021 and 2020.
(4)The return on average market rates.assets, based on net income, was 3.80%, 4.90% and 0.99% for the years ended December 31, 2022, 2021 and 2020, respectively.
(5)Includes the impact of interest rate swap agreements used to change a portion of floating-rate funding to fixed-rate funding for the year ended December 31, 2020.
(6)Includes the impact of one terminated derivative formerly designated as a cash flow hedge for the years ended December 31, 2022, 2021 and 2020.
(7)Includes the impact of interest rate swap agreements used to change a portion of fixed-rate funding to floating-rate funding for the years ended December 31, 2022, 2021 and 2020.
(8)Includes the impact of terminated derivatives formerly designated as fair value hedges for the years ended December 31, 2022 and 2021.
(9)Includes the impact of interest rate swap agreements used to change a portion of floating-rate funding to fixed-rate funding for the year ended December 31, 2022.
(10)The return on average stockholders’ equity, based on net income, was 31.00%, 43.12% and 11.28% for the years ended December 31, 2022, 2021 and 2020, respectively.
(11)Net interest margin represents net interest income as a percentage of average total loan receivables.
(12)Net yield on interest-earning assets represents net interest income as a percentage of average total interest-earning assets.
(13)Interest rate spread represents the difference between the rate on total interest-earning assets and the rate on total interest-bearing liabilities.
-56-
Average Balance Sheet Analysis (dollars in millions) | ||||||||||||||||||||||||||||||||
| For the Years Ended December 31, | ||||||||||||||||||||||||||||||||
| 2019 | 2018 | 2017 | ||||||||||||||||||||||||||||||
| Average Balance | Yield/Rate | Interest | Average Balance | Yield/Rate | Interest | Average Balance | Yield/Rate | Interest | ||||||||||||||||||||||||
| Assets | ||||||||||||||||||||||||||||||||
| Interest-earning assets | ||||||||||||||||||||||||||||||||
| Cash and cash equivalents | $ | 9,667 | 2.27 | % | $ | 219 | $ | 14,494 | 1.93 | % | $ | 280 | $ | 13,300 | 1.11 | % | $ | 148 | ||||||||||||||
| Restricted cash | 620 | 2.24 | % | 14 | 633 | 1.85 | % | 12 | 625 | 0.97 | % | 6 | ||||||||||||||||||||
| Other short-term investments | 754 | 2.66 | % | 20 | — | — | % | — | — | — | % | — | ||||||||||||||||||||
| Investment securities | 7,603 | 2.35 | % | 179 | 1,910 | 2.08 | % | 40 | 1,667 | 1.60 | % | 27 | ||||||||||||||||||||
Loan receivables(1) | ||||||||||||||||||||||||||||||||
Credit card(2) | 72,740 | 13.32 | % | 9,690 | 67,953 | 13.00 | % | 8,835 | 62,079 | 12.74 | % | 7,907 | ||||||||||||||||||||
| Personal loans | 7,522 | 13.07 | % | 983 | 7,423 | 12.60 | % | 936 | 7,020 | 12.25 | % | 860 | ||||||||||||||||||||
| Private student loans | 8,124 | 8.59 | % | 698 | 7,441 | 8.25 | % | 614 | 6,764 | 7.72 | % | 522 | ||||||||||||||||||||
| PCI student loans | 1,435 | 8.29 | % | 119 | 1,846 | 7.54 | % | 139 | 2,326 | 6.84 | % | 159 | ||||||||||||||||||||
| Other | 1,065 | 6.63 | % | 71 | 593 | 6.28 | % | 37 | 336 | 5.56 | % | 19 | ||||||||||||||||||||
| Total loan receivables | 90,886 | 12.72 | % | 11,561 | 85,256 | 12.39 | % | 10,561 | 78,525 | 12.06 | % | 9,467 | ||||||||||||||||||||
| Total interest-earning assets | 109,530 | 10.95 | % | 11,993 | 102,293 | 10.65 | % | 10,893 | 94,117 | 10.25 | % | 9,648 | ||||||||||||||||||||
| Allowance for loan losses | (3,167 | ) | (2,776 | ) | (2,335 | ) | ||||||||||||||||||||||||||
| Other assets | 4,627 | 4,324 | 4,189 | |||||||||||||||||||||||||||||
| Total assets | $ | 110,990 | $ | 103,841 | $ | 95,971 | ||||||||||||||||||||||||||
| Liabilities and Stockholders’ Equity | ||||||||||||||||||||||||||||||||
| Interest-bearing liabilities | ||||||||||||||||||||||||||||||||
| Interest-bearing deposits | ||||||||||||||||||||||||||||||||
Time deposits(3) | $ | 33,870 | 2.57 | % | 869 | $ | 31,236 | 2.22 | % | 695 | $ | 27,123 | 1.91 | % | 519 | |||||||||||||||||
Money market deposits(4) | 7,069 | 2.09 | % | 148 | 6,798 | 1.81 | % | 123 | 6,799 | 1.29 | % | 88 | ||||||||||||||||||||
| Other interest-bearing savings deposits | 28,209 | 2.02 | % | 570 | 23,886 | 1.76 | % | 420 | 20,155 | 1.18 | % | 239 | ||||||||||||||||||||
Total interest-bearing deposits(5) | 69,148 | 2.30 | % | 1,587 | 61,920 | 2.00 | % | 1,238 | 54,077 | 1.56 | % | 846 | ||||||||||||||||||||
| Borrowings | ||||||||||||||||||||||||||||||||
| Short-term borrowings | 1 | 2.33 | % | — | 2 | 2.07 | % | — | 2 | 1.10 | % | — | ||||||||||||||||||||
Securitized borrowings(3)(4) | 14,572 | 2.92 | % | 425 | 16,218 | 2.67 | % | 433 | 16,746 | 2.26 | % | 379 | ||||||||||||||||||||
Other long-term borrowings(3) | 11,060 | 4.68 | % | 518 | 10,231 | 4.57 | % | 468 | 9,767 | 4.33 | % | 423 | ||||||||||||||||||||
| Total borrowings | 25,633 | 3.68 | % | 943 | 26,451 | 3.41 | % | 901 | 26,515 | 3.02 | % | 802 | ||||||||||||||||||||
| Total interest-bearing liabilities | 94,781 | 2.67 | % | 2,530 | 88,371 | 2.42 | % | 2,139 | 80,592 | 2.04 | % | 1,648 | ||||||||||||||||||||
| Other liabilities and stockholders’ equity | 16,209 | 15,470 | 15,379 | |||||||||||||||||||||||||||||
| Total liabilities and stockholders’ equity | $ | 110,990 | $ | 103,841 | $ | 95,971 | ||||||||||||||||||||||||||
| Net interest income | $ | 9,463 | $ | 8,754 | $ | 8,000 | ||||||||||||||||||||||||||
Net interest margin(6) | 10.41 | % | 10.27 | % | 10.19 | % | ||||||||||||||||||||||||||
Net yield on interest-earning assets(7) | 8.64 | % | 8.56 | % | 8.50 | % | ||||||||||||||||||||||||||
Interest rate spread(8) | 8.28 | % | 8.23 | % | 8.21 | % | ||||||||||||||||||||||||||
Rate/Volume Variance Analysis(1)
(dollars in millions)
| Year Ended December 31, 2022 vs. | Year Ended December 31, 2021 vs. | ||||||||||||||||||||||||||||||||||
| Year Ended December 31, 2021 | Year Ended December 31, 2020 | ||||||||||||||||||||||||||||||||||
| Volume | Rate | Total | Volume | Rate | Total | ||||||||||||||||||||||||||||||
| Increase/(Decrease) in net interest income due to changes in: | |||||||||||||||||||||||||||||||||||
| Interest-earning assets | |||||||||||||||||||||||||||||||||||
| Cash and cash equivalents | $ | (9) | $ | 166 | $ | 157 | $ | 7 | $ | (24) | $ | (17) | |||||||||||||||||||||||
| Restricted cash | — | 8 | 8 | 1 | (3) | (2) | |||||||||||||||||||||||||||||
| Other short-term investments | — | — | — | (3) | (1) | (4) | |||||||||||||||||||||||||||||
| Investment securities | (40) | 37 | (3) | (57) | (13) | (70) | |||||||||||||||||||||||||||||
| Loan receivables | |||||||||||||||||||||||||||||||||||
| Credit card loans | 1,299 | 616 | 1,915 | (261) | (7) | (268) | |||||||||||||||||||||||||||||
| Private student loans | 14 | 75 | 89 | 13 | (25) | (12) | |||||||||||||||||||||||||||||
| Personal loans | 43 | (49) | (6) | (59) | (21) | (80) | |||||||||||||||||||||||||||||
| Other | 48 | 5 | 53 | 23 | (14) | 9 | |||||||||||||||||||||||||||||
| Total loan receivables | 1,404 | 647 | 2,051 | (284) | (67) | (351) | |||||||||||||||||||||||||||||
| Total interest income | 1,355 | 858 | 2,213 | (336) | (108) | (444) | |||||||||||||||||||||||||||||
| Interest-bearing liabilities | |||||||||||||||||||||||||||||||||||
| Interest-bearing deposits | |||||||||||||||||||||||||||||||||||
| Time deposits | 1 | 43 | 44 | (174) | (158) | (332) | |||||||||||||||||||||||||||||
| Money market deposits | 2 | 96 | 98 | 4 | (46) | (42) | |||||||||||||||||||||||||||||
| Other interest-bearing savings deposits | 15 | 439 | 454 | 54 | (250) | (196) | |||||||||||||||||||||||||||||
| Total interest-bearing deposits | 18 | 578 | 596 | (116) | (454) | (570) | |||||||||||||||||||||||||||||
| Borrowings | |||||||||||||||||||||||||||||||||||
| Short-term borrowings | 1 | 1 | 2 | (16) | (16) | (32) | |||||||||||||||||||||||||||||
| Securitized borrowings | (6) | 123 | 117 | (37) | (42) | (79) | |||||||||||||||||||||||||||||
| Other long-term borrowings | (22) | 38 | 16 | (42) | (8) | (50) | |||||||||||||||||||||||||||||
| Total borrowings | (27) | 162 | 135 | (95) | (66) | (161) | |||||||||||||||||||||||||||||
| Total interest expense | (9) | 740 | 731 | (211) | (520) | (731) | |||||||||||||||||||||||||||||
| Net interest income | $ | 1,364 | $ | 118 | $ | 1,482 | $ | (125) | $ | 412 | $ | 287 | |||||||||||||||||||||||
(1) The rate/volume variance for each category has been allocated on a consistent basis between rate and volume variances between the years ended December 31, 2022, 2021 and 2020 based on the percentage of the rate or volume variance to the sum of the two absolute variances.
-57-
Rate/Volume Variance Analysis(1) (dollars in millions) | |||||||||||||||||||||||
| Year Ended December 31, 2019 vs. | Year Ended December 31, 2018 vs. | ||||||||||||||||||||||
| Year Ended December 31, 2018 | Year Ended December 31, 2017 | ||||||||||||||||||||||
| Volume | Rate | Total | Volume | Rate | Total | ||||||||||||||||||
| (Decrease)/Increase in net interest income due to changes in | |||||||||||||||||||||||
| Interest-earning assets | |||||||||||||||||||||||
| Cash and cash equivalents | $ | (104 | ) | $ | 43 | $ | (61 | ) | $ | 15 | $ | 117 | $ | 132 | |||||||||
| Restricted cash | — | 2 | 2 | — | 6 | 6 | |||||||||||||||||
| Other short-term investments | 20 | — | 20 | — | — | — | |||||||||||||||||
| Investment securities | 133 | 6 | 139 | 4 | 9 | 13 | |||||||||||||||||
| Loan receivables | |||||||||||||||||||||||
| Credit card | 634 | 221 | 855 | 763 | 165 | 928 | |||||||||||||||||
| Personal loans | 12 | 35 | 47 | 51 | 25 | 76 | |||||||||||||||||
| Private student loans | 58 | 26 | 84 | 54 | 38 | 92 | |||||||||||||||||
| PCI student loans | (33 | ) | 13 | (20 | ) | (35 | ) | 15 | (20 | ) | |||||||||||||
| Other | 31 | 3 | 34 | 15 | 3 | 18 | |||||||||||||||||
| Total loan receivables | 702 | 298 | 1,000 | 848 | 246 | 1,094 | |||||||||||||||||
| Total interest income | 751 | 349 | 1,100 | 867 | 378 | 1,245 | |||||||||||||||||
| Interest-bearing liabilities | |||||||||||||||||||||||
| Interest-bearing deposits | |||||||||||||||||||||||
| Time deposits | 61 | 113 | 174 | 85 | 91 | 176 | |||||||||||||||||
| Money market deposits | 5 | 20 | 25 | — | 35 | 35 | |||||||||||||||||
| Other interest-bearing savings deposits | 83 | 67 | 150 | 49 | 132 | 181 | |||||||||||||||||
| Total interest-bearing deposits | 149 | 200 | 349 | 134 | 258 | 392 | |||||||||||||||||
| Borrowings | |||||||||||||||||||||||
| Securitized borrowings | (46 | ) | 38 | (8 | ) | (13 | ) | 67 | 54 | ||||||||||||||
| Other long-term borrowings | 38 | 12 | 50 | 21 | 24 | 45 | |||||||||||||||||
| Total borrowings | (8 | ) | 50 | 42 | 8 | 91 | 99 | ||||||||||||||||
| Total interest expense | 141 | 250 | 391 | 142 | 349 | 491 | |||||||||||||||||
| Net interest income | $ | 610 | $ | 99 | $ | 709 | $ | 725 | $ | 29 | $ | 754 | |||||||||||
Loan Quality
Loan receivables consist of the following (dollars in millions):
| December 31, | |||||||||||
| 2022 | 2021 | ||||||||||
| Credit card loans | $ | 90,113 | $ | 74,369 | |||||||
| Other loans | |||||||||||
| Private student loans | 10,308 | 10,113 | |||||||||
| Personal loans | 7,998 | 6,936 | |||||||||
| Other loans | 3,701 | 2,266 | |||||||||
| Total other loans | 22,007 | 19,315 | |||||||||
| Total loan receivables | 112,120 | 93,684 | |||||||||
| Allowance for credit losses | (7,374) | (6,822) | |||||||||
| Net loan receivables | $ | 104,746 | $ | 86,862 | |||||||
| Loan receivables consist of the following (dollars in millions): | |||||||||||||||||||
| December 31, | |||||||||||||||||||
| 2019 | 2018 | 2017 | 2016 | 2015 | |||||||||||||||
| Credit card loans | $ | 77,181 | $ | 72,876 | $ | 67,291 | $ | 61,522 | $ | 57,896 | |||||||||
| Other loans | |||||||||||||||||||
| Personal loans | 7,687 | 7,454 | 7,374 | 6,481 | 5,490 | ||||||||||||||
| Private student loans | 8,402 | 7,728 | 7,076 | 6,393 | 5,647 | ||||||||||||||
| Other | 1,373 | 817 | 423 | 274 | 236 | ||||||||||||||
| Total other loans | 17,462 | 15,999 | 14,873 | 13,148 | 11,373 | ||||||||||||||
PCI loans(1) | 1,251 | 1,637 | 2,084 | 2,584 | 3,116 | ||||||||||||||
| Total loan receivables | 95,894 | 90,512 | 84,248 | 77,254 | 72,385 | ||||||||||||||
| Allowance for loan losses | (3,383 | ) | (3,041 | ) | (2,621 | ) | (2,167 | ) | (1,869 | ) | |||||||||
| Net loan receivables | $ | 92,511 | $ | 87,471 | $ | 81,627 | $ | 75,087 | $ | 70,516 | |||||||||
Provision and Allowance for LoanCredit Losses
Provision for loancredit losses is the expense related to maintaining the allowance for loancredit losses at an appropriate level to absorb the estimated probableestimate of credit losses inanticipated over the remaining expected life of loan portfolioreceivables at each period end date. While establishingIn deriving the estimate of expected credit losses, we consider the collectability of principal, interest and fees associated with our loan receivables. We also consider expected recoveries of amounts that were either previously charged-off or are expected to be charged-off. Establishing the estimate for probableexpected credit losses requires significant management judgment, thejudgment. The factors that influence the provision for loancredit losses include:
•Increases or decreases in outstanding loan balances, including:
•Changes in consumer spending, payment and credit utilization behaviors;
•The level of new account and loan originations and loan maturities; and
•Changes in the overall mix of accounts and products within the portfolio;
•The credit quality of the loan portfolio, which reflects our credit granting practices and the effectiveness of collection efforts, among other factors;
•The impact of general economic conditions on the consumer, including national and regional conditions, unemployment levels, bankruptcy trends and interest rate movements;
•The level and direction of historical losses; and anticipated loan delinquencies and charge-offs;
•Regulatory changes or new regulatory guidance.
-58-
The following tables provide changes in our allowance for loan losses.credit losses (dollars in millions):
| For the Year Ended December 31, 2022 | |||||||||||||||||||||||||||||
| Credit Card Loans | Private Student Loans | Personal Loans | Other Loans | Total Loans | |||||||||||||||||||||||||
| Balance at December 31, 2021 | $ | 5,273 | $ | 843 | $ | 662 | $ | 44 | $ | 6,822 | |||||||||||||||||||
| Additions | |||||||||||||||||||||||||||||
Provision for credit losses(1) | 2,233 | 99 | 24 | 13 | 2,369 | ||||||||||||||||||||||||
| Deductions | |||||||||||||||||||||||||||||
| Charge-offs | (2,417) | (126) | (159) | — | (2,702) | ||||||||||||||||||||||||
| Recoveries | 794 | 23 | 68 | — | 885 | ||||||||||||||||||||||||
| Net charge-offs | (1,623) | (103) | (91) | — | (1,817) | ||||||||||||||||||||||||
| Balance at December 31, 2022 | $ | 5,883 | $ | 839 | $ | 595 | $ | 57 | $ | 7,374 | |||||||||||||||||||
| For the Year Ended December 31, 2021 | |||||||||||||||||||||||||||||
| Credit Card Loans | Private Student Loans | Personal Loans | Other Loans | Total Loans | |||||||||||||||||||||||||
| Balance at December 31, 2020 | $ | 6,491 | $ | 840 | $ | 857 | $ | 38 | $ | 8,226 | |||||||||||||||||||
| Additions | |||||||||||||||||||||||||||||
Provision for credit losses(1) | 229 | 67 | (75) | 6 | 227 | ||||||||||||||||||||||||
| Deductions | |||||||||||||||||||||||||||||
| Charge-offs | (2,255) | (89) | (190) | — | (2,534) | ||||||||||||||||||||||||
| Recoveries | 808 | 25 | 70 | — | 903 | ||||||||||||||||||||||||
| Net charge-offs | (1,447) | (64) | (120) | — | (1,631) | ||||||||||||||||||||||||
| Balance at December 31, 2021 | $ | 5,273 | $ | 843 | $ | 662 | $ | 44 | $ | 6,822 | |||||||||||||||||||
| For the Year Ended December 31, 2020 | |||||||||||||||||||||||||||||
| Credit Card Loans | Private Student Loans | Personal Loans | Other Loans | Total Loans | |||||||||||||||||||||||||
Balance at December 31, 2019(2) | $ | 2,883 | $ | 148 | $ | 348 | $ | 4 | $ | 3,383 | |||||||||||||||||||
Cumulative effect of ASU No. 2016-13 adoption(3) | 1,667 | 505 | 265 | 24 | 2,461 | ||||||||||||||||||||||||
| Balance at January 1, 2020 | 4,550 | 653 | 613 | 28 | 5,844 | ||||||||||||||||||||||||
| Additions | |||||||||||||||||||||||||||||
Provision for credit losses(1) | 4,379 | 251 | 476 | 11 | 5,117 | ||||||||||||||||||||||||
| Deductions | |||||||||||||||||||||||||||||
| Charge-offs | (3,101) | (85) | (289) | (1) | (3,476) | ||||||||||||||||||||||||
| Recoveries | 663 | 21 | 57 | — | 741 | ||||||||||||||||||||||||
| Net charge-offs | (2,438) | (64) | (232) | (1) | (2,735) | ||||||||||||||||||||||||
| Balance at December 31, 2020 | $ | 6,491 | $ | 840 | $ | 857 | $ | 38 | $ | 8,226 | |||||||||||||||||||
(1)Excludes a $10 million, $9 million and $17 million reclassification of the liability for expected credit losses on unfunded commitments for the years ended December 31, 2022, 2021 and 2020, respectively, as the liability is recorded in accrued expenses and other liabilities in our consolidated statements of financial condition.
(2)Prior to the adoption of Accounting Standards Update (“ASU”) No. 2016-13 on January 1, 2020, credit losses were estimated using the incurred loss approach.
(3)Represents the adjustment to the allowance for credit losses as a result of the adoption of ASU No. 2016-13 on January 1, 2020.
The allowance for credit losses was approximately $7.4 billion at December 31, 2022, which reflects a $552 million build from the amount of the allowance for credit losses at December 31, 2021. The buildin the allowance for credit losses between December 31, 2022 and December 31, 2021, was primarily driven by loan growth.
In estimating the allowance at December 31, 2022, we used a macroeconomic forecast that resulted in the following weighted average amounts: (i) peak unemployment rate of 4.68%, decreasing to 4.63% by the end of 2023 and (ii) 1.05% annualized growth in the real gross domestic product in 2023.
-59-
In estimating expected credit losses, we considered the uncertainties associated with borrower behavior and payment trends, as well as higher consumer price inflation experienced during 2022 and the fiscal and monetary policy responses to that inflation. In 2022, the Federal Reserve raised its federal funds rate target range and financial market participants expect additional increases during 2023 in an effort to reduce inflation. In recognition of the risks related to the macroeconomic environment, the estimation of the allowance for credit losses has required significant management judgment.
The forecast period we deemed to be reasonable and supportable was 18 months for all periods presented. The 18-month reasonable and supportable forecast period was deemed appropriate given the current economic conditions. For all periods presented, we determined that a reversion period of 12 months was appropriate for the same reason. We applied a weighted reversion method to provide a more reasonable transition to historical losses for all loan products for all periods presented.
The provision for loancredit losses is the amount of expense realized after considering the level of net charge-offs in the period and the required amount of allowance for loancredit losses at the balance sheet date. For the year ended December 31, 2019,2022, the provision for loancredit losses increased by $196 million, or 6%,$2.1 billion, as compared to the year ended December 31, 2018primarily due to higher levels of net charge-offs, slightly offset by lower reserve builds.
| The following tables provide changes in our allowance for loan losses (dollars in millions): | |||||||||||||||||||
| For the Year Ended December 31, 2019 | |||||||||||||||||||
| Credit Card | Personal Loans | Student Loans(1) | Other | Total | |||||||||||||||
| Balance at beginning of period | $ | 2,528 | $ | 338 | $ | 169 | $ | 6 | $ | 3,041 | |||||||||
| Additions | |||||||||||||||||||
| Provision for loan losses | 2,849 | 332 | 51 | (1 | ) | 3,231 | |||||||||||||
| Deductions | |||||||||||||||||||
| Charge-offs | (3,165 | ) | (369 | ) | (82 | ) | (1 | ) | (3,617 | ) | |||||||||
| Recoveries | 671 | 47 | 13 | — | 731 | ||||||||||||||
| Net charge-offs | (2,494 | ) | (322 | ) | (69 | ) | (1 | ) | (2,886 | ) | |||||||||
Other(2) | — | — | (3 | ) | — | (3 | ) | ||||||||||||
| Balance at end of period | $ | 2,883 | $ | 348 | $ | 148 | $ | 4 | $ | 3,383 | |||||||||
| For the Year Ended December 31, 2018 | |||||||||||||||||||
| Credit Card | Personal Loans | Student Loans(1) | Other | Total | |||||||||||||||
| Balance at beginning of period | $ | 2,147 | $ | 301 | $ | 162 | $ | 11 | $ | 2,621 | |||||||||
| Additions | |||||||||||||||||||
| Provision for loan losses | 2,594 | 345 | 95 | 1 | 3,035 | ||||||||||||||
| Deductions | |||||||||||||||||||
| Charge-offs | (2,734 | ) | (345 | ) | (97 | ) | (6 | ) | (3,182 | ) | |||||||||
| Recoveries | 521 | 37 | 12 | — | 570 | ||||||||||||||
| Net charge-offs | (2,213 | ) | (308 | ) | (85 | ) | (6 | ) | (2,612 | ) | |||||||||
Other(2) | — | — | (3 | ) | — | (3 | ) | ||||||||||||
| Balance at end of period | $ | 2,528 | $ | 338 | $ | 169 | $ | 6 | $ | 3,041 | |||||||||
| For the Year Ended December 31, 2017 | |||||||||||||||||||
| Credit Card | Personal Loans | Student Loans(1) | Other | Total | |||||||||||||||
| Balance at beginning of period | $ | 1,790 | $ | 200 | $ | 158 | $ | 19 | $ | 2,167 | |||||||||
| Additions | |||||||||||||||||||
| Provision for loan losses | 2,159 | 332 | 93 | (5 | ) | 2,579 | |||||||||||||
| Deductions | |||||||||||||||||||
| Charge-offs | (2,263 | ) | (258 | ) | (94 | ) | (3 | ) | (2,618 | ) | |||||||||
| Recoveries | 461 | 27 | 11 | — | 499 | ||||||||||||||
| Net charge-offs | (1,802 | ) | (231 | ) | (83 | ) | (3 | ) | (2,119 | ) | |||||||||
Other(2) | — | — | (6 | ) | — | (6 | ) | ||||||||||||
| Balance at end of period | $ | 2,147 | $ | 301 | $ | 162 | $ | 11 | $ | 2,621 | |||||||||
| (1) Includes both PCI and non-PCI private student loans. | |||||||||||||||||||
| (2) Net change in reserves on PCI pools having no remaining non-accretable difference. | |||||||||||||||||||
| The following tables provide changes in our allowance for loan losses (dollars in millions): | |||||||||||||||||||
| For the Year Ended December 31, 2016 | |||||||||||||||||||
| Credit Card | Personal Loans | Student Loans(1) | Other | Total | |||||||||||||||
| Balance at beginning of period | $ | 1,554 | $ | 155 | $ | 143 | $ | 17 | $ | 1,869 | |||||||||
| Additions | |||||||||||||||||||
| Provision for loan losses | 1,579 | 196 | 82 | 2 | 1,859 | ||||||||||||||
| Deductions | |||||||||||||||||||
| Charge-offs | (1,786 | ) | (172 | ) | (76 | ) | — | (2,034 | ) | ||||||||||
| Recoveries | 443 | 21 | 9 | — | 473 | ||||||||||||||
| Net charge-offs | (1,343 | ) | (151 | ) | (67 | ) | — | (1,561 | ) | ||||||||||
| Balance at end of period | $ | 1,790 | $ | 200 | $ | 158 | $ | 19 | $ | 2,167 | |||||||||
| For the Year Ended December 31, 2015 | |||||||||||||||||||
| Credit Card | Personal Loans | Student Loans(1) | Other | Total | |||||||||||||||
| Balance at beginning of period | $ | 1,474 | $ | 120 | $ | 135 | $ | 17 | $ | 1,746 | |||||||||
| Additions | |||||||||||||||||||
| Provision for loan losses | 1,300 | 147 | 64 | 1 | 1,512 | ||||||||||||||
| Deductions | |||||||||||||||||||
| Charge-offs | (1,660 | ) | (129 | ) | (65 | ) | (1 | ) | (1,855 | ) | |||||||||
| Recoveries | 440 | 17 | 9 | — | 466 | ||||||||||||||
| Net charge-offs | (1,220 | ) | (112 | ) | (56 | ) | (1 | ) | (1,389 | ) | |||||||||
| Balance at end of period | $ | 1,554 | $ | 155 | $ | 143 | $ | 17 | $ | 1,869 | |||||||||
Net Charge-offs
Our net charge-offs include the principal amount of losses charged off less principal recoveries and exclude charged-off and recovered interest and fees and fraud losses. Charged-off and recovered interest and fees are recorded in interest income and loan fee income, respectively, which is effectively a reclassification of the provision for loancredit losses, while fraud losses are recorded in other expense.
| The following table presents amounts and rates of net charge-offs of key loan products (dollars in millions): | ||||||||||||||||||||||||||||||||||
| For the Years Ended December 31, | ||||||||||||||||||||||||||||||||||
| 2019 | 2018 | 2017 | 2016 | 2015 | ||||||||||||||||||||||||||||||
| $ | % | $ | % | $ | % | $ | % | $ | % | |||||||||||||||||||||||||
| Credit card loans | $ | 2,494 | 3.43 | % | $ | 2,213 | 3.26 | % | $ | 1,802 | 2.91 | % | $ | 1,343 | 2.34 | % | $ | 1,220 | 2.22 | % | ||||||||||||||
| Personal loans | $ | 322 | 4.28 | % | $ | 308 | 4.15 | % | $ | 231 | 3.30 | % | $ | 151 | 2.55 | % | $ | 112 | 2.15 | % | ||||||||||||||
Private student loans (excluding PCI(1)) | $ | 69 | 0.85 | % | $ | 85 | 1.14 | % | $ | 83 | 1.21 | % | $ | 67 | 1.10 | % | $ | 56 | 1.07 | % | ||||||||||||||
| For the Years Ended December 31, | |||||||||||||||||||||||||||||||||||
| 2022 | 2021 | 2020 | |||||||||||||||||||||||||||||||||
| $ | % | $ | % | $ | % | ||||||||||||||||||||||||||||||
| Credit card loans | $ | 1,623 | 2.05 | % | $ | 1,447 | 2.09 | % | $ | 2,438 | 3.41 | % | |||||||||||||||||||||||
| Private student loans | $ | 103 | 1.00 | % | $ | 64 | 0.63 | % | $ | 64 | 0.65 | % | |||||||||||||||||||||||
| Personal loans | $ | 91 | 1.25 | % | $ | 120 | 1.73 | % | $ | 232 | 3.13 | % | |||||||||||||||||||||||
The net charge-off ratescharge-offs on our credit card and personal loans increased for the year ended December 31, 2019 as2022, increased when compared to the year ended December 31, 2018 as a result of2021, primarily due to continued credit normalization and the seasoning of continued loan growth and supply-drivenvintages from the past two years. The net charge-off rate on credit normalization. Net charge-offs on our private studentcard loans decreasedremained relatively flat for the year ended December 31, 2019 as2022, compared to the year ended December 31, 20182021. The net charge-offs and net charge-off rate on private student loans for the year ended December 31, 2022, increased when compared to the year ended December 31, 2021, primarily driven by credit normalization. The net charge-offs and net charge-off rate on personal loans for the year ended December 31, 2022, decreased when compared to the year ended December 31, 2021, due to more effective collection strategies.continued benefit from tighter credit underwriting standards implemented in 2020.
-60-
Delinquencies
Delinquencies are an indicator of credit quality at a point in time. A loan balance is considered delinquent when contractual payments on the loan become 30 days past due.
The following table presents the amounts and delinquency rates of key loan products that are 30 and 90 days or more delinquent, loan receivables that are not accruing interest regardless of delinquency and loans restructured in troubled debt restructuring (“TDR”) programs (dollars in millions):
| December 31, | |||||||||||||||||||||||
| 2022 | 2021 | ||||||||||||||||||||||
| $ | % | $ | % | ||||||||||||||||||||
| Loans 30 or more days delinquent | |||||||||||||||||||||||
| Credit card loans | $ | 2,278 | 2.53 | % | $ | 1,232 | 1.66 | % | |||||||||||||||
| Private student loans | $ | 212 | 2.05 | % | $ | 157 | 1.55 | % | |||||||||||||||
| Personal loans | $ | 63 | 0.80 | % | $ | 48 | 0.69 | % | |||||||||||||||
| Total loan receivables | $ | 2,578 | 2.30 | % | $ | 1,451 | 1.55 | % | |||||||||||||||
Loans 90 or more days delinquent(1) | |||||||||||||||||||||||
| Credit card loans | $ | 1,028 | 1.14 | % | $ | 562 | 0.76 | % | |||||||||||||||
| Private student loans | $ | 45 | 0.43 | % | $ | 36 | 0.35 | % | |||||||||||||||
| Personal loans | $ | 16 | 0.21 | % | $ | 13 | 0.20 | % | |||||||||||||||
| Total loan receivables | $ | 1,101 | 0.98 | % | $ | 618 | 0.66 | % | |||||||||||||||
| Loans not accruing interest | $ | 214 | 0.19 | % | $ | 225 | 0.24 | % | |||||||||||||||
| Troubled debt restructurings: | |||||||||||||||||||||||
Credit card loans(2)(3)(4) | |||||||||||||||||||||||
| Currently enrolled | $ | 1,608 | 1.78 | % | $ | 833 | 1.12 | % | |||||||||||||||
| No longer enrolled | 212 | 0.24 | 267 | 0.36 | |||||||||||||||||||
| Total credit card loans | $ | 1,820 | 2.02 | % | $ | 1,100 | 1.48 | % | |||||||||||||||
Private student loans(5) | $ | 328 | 3.18 | % | $ | 249 | 2.46 | % | |||||||||||||||
Personal loans(6) | $ | 178 | 2.23 | % | $ | 187 | 2.70 | % | |||||||||||||||
| The following table presents the amounts and delinquency rates of key loan products that are 30 and 90 days or more delinquent, loan receivables that are not accruing interest regardless of delinquency, and restructured loans (dollars in millions): | ||||||||||||||||||||||||||||||||||
| Years Ended December 31, | ||||||||||||||||||||||||||||||||||
| 2019 | 2018 | 2017 | 2016 | 2015 | ||||||||||||||||||||||||||||||
| $ | % | $ | % | $ | % | $ | % | $ | % | |||||||||||||||||||||||||
| Loans 30 or more days delinquent | ||||||||||||||||||||||||||||||||||
| Credit card loans | $ | 2,019 | 2.62 | % | $ | 1,772 | 2.43 | % | $ | 1,532 | 2.28 | % | $ | 1,252 | 2.04 | % | $ | 995 | 1.72 | % | ||||||||||||||
| Personal loans | $ | 105 | 1.37 | % | $ | 119 | 1.60 | % | $ | 103 | 1.40 | % | $ | 74 | 1.12 | % | $ | 49 | 0.89 | % | ||||||||||||||
Private student loans (excluding PCI loans(1)) | $ | 145 | 1.72 | % | $ | 155 | 2.00 | % | $ | 167 | 2.35 | % | $ | 141 | 2.22 | % | $ | 108 | 1.91 | % | ||||||||||||||
| Loans 90 or more days delinquent | ||||||||||||||||||||||||||||||||||
Credit card loans(2) | $ | 1,020 | 1.32 | % | $ | 887 | 1.22 | % | $ | 751 | 1.12 | % | $ | 597 | 0.97 | % | $ | 490 | 0.85 | % | ||||||||||||||
Personal loans(3) | $ | 31 | 0.40 | % | $ | 35 | 0.47 | % | $ | 30 | 0.41 | % | $ | 19 | 0.29 | % | $ | 15 | 0.27 | % | ||||||||||||||
Private student loans (excluding PCI loans(1))(4) | $ | 36 | 0.42 | % | $ | 38 | 0.49 | % | $ | 33 | 0.47 | % | $ | 35 | 0.55 | % | $ | 24 | 0.43 | % | ||||||||||||||
| Loans not accruing interest | $ | 266 | 0.28 | % | $ | 302 | 0.34 | % | $ | 233 | 0.28 | % | $ | 216 | 0.29 | % | $ | 224 | 0.32 | % | ||||||||||||||
| Restructured loans | ||||||||||||||||||||||||||||||||||
| Credit card loans | ||||||||||||||||||||||||||||||||||
| Currently enrolled | $ | 2,108 | 2.73 | % | $ | 1,649 | 2.26 | % | $ | 926 | 1.38 | % | $ | 781 | 1.27 | % | $ | 746 | 1.29 | % | ||||||||||||||
| No longer enrolled | 1,254 | 1.62 | 599 | 0.82 | 390 | 0.58 | 304 | 0.49 | 273 | 0.47 | ||||||||||||||||||||||||
Total credit card loans(2) | $ | 3,362 | 4.35 | % | $ | 2,248 | 3.08 | % | $ | 1,316 | 1.96 | % | $ | 1,085 | 1.76 | % | $ | 1,019 | 1.76 | % | ||||||||||||||
Personal loans(3) | $ | 208 | 2.71 | % | $ | 152 | 2.04 | % | $ | 111 | 1.51 | % | $ | 81 | 1.25 | % | $ | 68 | 1.24 | % | ||||||||||||||
Private student loans (excluding PCI loans(1))(4) | $ | 269 | 3.20 | % | $ | 182 | 2.36 | % | $ | 137 | 1.94 | % | $ | 86 | 1.35 | % | $ | 48 | 0.85 | % | ||||||||||||||
(2)We estimate that interest income recognized on credit card loans restructured in TDR programs was $131 million, $105 million and $221 million for the years ended December 31, 2022, 2021 and 2020, respectively. We do not separately track interest income on loans in TDR programs. We estimate this amount by applying an average interest rate to the average loans in the various TDR programs.
(3)We estimate that the incremental interest income that would have been recorded in accordance with the original terms of credit card loans restructured in TDR programs was $148 million, $137 million and $181 million for the years ended December 31, 2022, 2021 and 2020, respectively. We do not separately track the amount of incremental interest income that would have been recorded if the loans in TDR programs had not been restructured and interest had instead been recorded in accordance with the original terms. We estimate this amount by applying the difference between the average interest rate earned on non-modified loans and the average interest rate earned on loans in the TDR programs to the average loans in the TDR programs.
(4)Credit card loans restructured in TDR programs include $123 million, $45 million and $94 million at December 31, 2022, 2021 and 2020, respectively, which are also included in loans 90 or more days delinquent.
(5)Private student loans restructured in TDR programs include $10 million, $7 million and $6 million at December 31, 2022, 2021 and 2020, respectively, which are also included in loans 90 or more days delinquent.
(6)Personal loans restructured in TDR programs include $4 million, $4 million and $6 million at December 31, 2022, 2021 and 2020, respectively, which are also included in loans 90 or more days delinquent.
The 30-day and 90-day delinquency rates in the table above include all loans, whether the TDR designation applies or not. The 30-day and 90-day delinquency rates for credit card and private student loans at December 31, 20192022, increased as compared to December 31, 20182021, primarily due to seasoning of continued loan growth and supply-drivendriven by credit normalization. The increase in the 30-day and 90-day delinquency rates for credit card was also driven by the seasoning of prior vintages. The 30-day
-61-
delinquency rates for personal loans decreased at December 31, 20192022, increased compared to December 31, 2018 as a result2021, primarily driven by credit normalization and the seasoning of improved underwriting and more effective collection strategies.prior vintages. The 30-day and 90-day delinquency rates for studentpersonal loans decreased at December 31, 20192022, remained relatively flat compared to December 31, 2018 due to more effective collection strategies.2021.
The restructuredbalance of credit card personal and private student loan balancesloans reported as TDRs increased at December 31, 20192022, as compared to December 31, 20182021, primarily due to seasoningthe expiration of continued loan growth and improved awareness of programs available to assist borrowers having difficulties meeting payment obligations. To provide additional clarity with respect to credit card loans classified as troubled debt restructurings, the table above now discloses theCARES Act exemption for new modifications effective January 1, 2022. The balance of thosepersonal loans currently enrolled orreported as TDRs decreased at December 31, 2022, compared to December 31, 2021, primarily due to continued benefit from tighter credit underwriting standards implemented in 2020, partially offset by enrollments in loan modification programs that are no longer enrolled in a loan modification program. exempt from the TDR designation under the CARES Act.
We believe loan modification programs are useful in assisting customers experiencing financial difficulties and help to prevent defaults. Of the $1,254 million of credit card loans that had been modified and are classified as troubled debt restructurings but for which the borrowers
Modified and Restructured Loans
The table below reflects the number and balance of both new loan modifications reported as TDRs and new loan modifications excluded from the TDR designation pursuant to the CARES Act (dollars in millions)(1):
| Accounts that entered a loan modification program and were classified as TDRs during the period | Accounts that entered a loan modification program and were exempt from the TDR designation pursuant to the CARES Act(1) | ||||||||||||||||||||||
| Number of Accounts | Balances | Number of Accounts | Balances | ||||||||||||||||||||
| For the Year Ended December 31, 2022 | |||||||||||||||||||||||
| Credit card loans | 237,339 | $ | 1,545 | — | $ | — | |||||||||||||||||
| Private student loans | 6,841 | $ | 127 | — | $ | — | |||||||||||||||||
| Personal loans | 6,303 | $ | 86 | — | $ | — | |||||||||||||||||
| For the Year Ended December 31, 2021 | |||||||||||||||||||||||
| Credit card loans | 64,359 | $ | 399 | 127,878 | $ | 907 | |||||||||||||||||
| Private student loans | 477 | $ | 8 | 8,844 | $ | 170 | |||||||||||||||||
| Personal loans | 4,066 | $ | 51 | 1,378 | $ | 21 | |||||||||||||||||
(1)Accounts that entered into a loan modification on or after January 1, 2022, are not eligible for this exemption.
The number and balance of new credit card and personal loan modifications increased during the year ended December 31, 2022, when compared to total modifications, including both TDRs and those exempt from the TDR designation, in the same period in 2021. The increase was primarily due to the expiration of government stimulus and disaster relief programs.
The number and balance of new private student loan modifications decreased during the year ended December 31, 2022, when compared to total modifications, including both TDRs and those exempt from the TDR designation, in the same period in 2021. The decrease was primarily due to heightened utilization of programs in the prior periods driven by the impacts of the COVID-19 pandemic on student loan borrowers.
-62-
The following table provides the number of accounts that exited a temporary loan modification program that were exempt from the TDR designation pursuant to the CARES Act and corresponding outstanding balances along with the amount of the outstanding balances that were delinquent (30 or more days past due) upon exiting the temporary loan modification program (dollars in millions):(1)
| Number of Accounts | Outstanding Balances | Balances Delinquent(1) | |||||||||||||||
| For the Year Ended December 31, 2022 | |||||||||||||||||
| Credit card loans | 101,273 | $ | 552 | $ | 110 | ||||||||||||
| Private student loans | 3,897 | $ | 76 | NM | |||||||||||||
| Personal loans | 649 | $ | 9 | NM | |||||||||||||
| For the Year Ended December 31, 2021 | |||||||||||||||||
| Credit card loans | 198,506 | $ | 1,183 | $ | 166 | ||||||||||||
| Private student loans | 8,788 | $ | 157 | NM | |||||||||||||
| Personal loans | 4,809 | $ | 72 | NM | |||||||||||||
(1)Includes balances charged-off at the end of the month the account exited the temporary loan modification program. The balances charged-off were not meaningful for the years ended December 31, 2022 and 2021.
The following table provides the balance of loan receivables restructured through a temporary loan modification program that were exempt from the TDR designation pursuant to the CARES Act (dollars in millions):
| December 31, | |||||||||||||||||||||||
| 2022 | 2021 | ||||||||||||||||||||||
| $ | % | $ | % | ||||||||||||||||||||
| Credit card loans | $ | 1,187 | 1.32 | % | $ | 1,620 | 2.18 | % | |||||||||||||||
| Private student loans | $ | 193 | 1.87 | % | $ | 242 | 2.39 | % | |||||||||||||||
| Personal loans | $ | 16 | 0.20 | % | $ | 45 | 0.65 | % | |||||||||||||||
Our estimate of expected loss reflected in our allowance for credit losses includes the risk associated with all loans, including all modified and restructured loans, seeloans. Refer to “— Delinquencies” and Note 4: Loan Receivables to our consolidated financial statements.statements for additional details of our use of loan modification programs to provide relief to customers experiencing financial hardship, TDRs and the allowance for credit losses.
Maturities and Sensitivities of Loan Receivables to Changes in Interest Rates
Our loan portfolio had the following maturity distribution(1) (dollars in millions):
| At December 31, 2022 | Due One Year or Less | Due After One Year Through Five Years | Due After Five Years Through Fifteen Years | Due After Fifteen Years | Total | ||||||||||||||||||||||||
| Credit card loans | $ | 26,846 | $ | 47,894 | $ | 14,926 | $ | 447 | $ | 90,113 | |||||||||||||||||||
| Private student loans | 345 | 2,131 | 7,129 | 703 | 10,308 | ||||||||||||||||||||||||
| Personal loans | 2,224 | 5,364 | 410 | — | 7,998 | ||||||||||||||||||||||||
| Other loans | 115 | 487 | 1,353 | 1,746 | 3,701 | ||||||||||||||||||||||||
| Total loan portfolio | $ | 29,530 | $ | 55,876 | $ | 23,818 | $ | 2,896 | $ | 112,120 | |||||||||||||||||||
Our loan portfolio had the following maturity distribution(1) (dollars in millions): | |||||||||||||||
| At December 31, 2019 | Due One Year or Less | Due After One Year Through Five Years | Due After Five Years | Total | |||||||||||
| Credit card loans | $ | 23,147 | $ | 41,052 | $ | 12,982 | $ | 77,181 | |||||||
| Personal loans | 2,157 | 5,236 | 294 | 7,687 | |||||||||||
| Private student loans (excluding PCI) | 209 | 1,885 | 6,308 | 8,402 | |||||||||||
| PCI loans | 141 | 418 | 692 | 1,251 | |||||||||||
| Other loans | 50 | 247 | 1,076 | 1,373 | |||||||||||
| Total loan portfolio | $ | 25,704 | $ | 48,838 | $ | 21,352 | $ | 95,894 | |||||||
At December 31, 2019,2022, approximately $42.4$51.0 billion of our loan portfolio due after one year had interest rates tied to an index and approximately $27.8$31.6 billion were fixed-rate loans.
-63-
Other Income
The following table presents the components of other income (dollars in millions):
| For the Years Ended December 31, | 2022 vs. 2021 Increase (Decrease) | 2021 vs. 2020 Increase (Decrease) | |||||||||||||||||||||||||||||||||||||||
| 2022 | 2021 | 2020 | $ | % | $ | % | |||||||||||||||||||||||||||||||||||
Discount and interchange revenue, net(1) | $ | 1,424 | $ | 1,224 | $ | 933 | $ | 200 | 16 | % | $ | 291 | 31 | % | |||||||||||||||||||||||||||
| Protection products revenue | 172 | 165 | 180 | 7 | 4 | % | (15) | (8) | % | ||||||||||||||||||||||||||||||||
| Loan fee income | 632 | 464 | 414 | 168 | 36 | % | 50 | 12 | % | ||||||||||||||||||||||||||||||||
| Transaction processing revenue | 249 | 227 | 195 | 22 | 10 | % | 32 | 16 | % | ||||||||||||||||||||||||||||||||
| (Losses) gains on equity investments | (214) | 424 | 80 | (638) | (150) | % | 344 | 430 | % | ||||||||||||||||||||||||||||||||
| Other income | 75 | 66 | 56 | 9 | 14 | % | 10 | 18 | % | ||||||||||||||||||||||||||||||||
| Total other income | $ | 2,338 | $ | 2,570 | $ | 1,858 | $ | (232) | (9) | % | $ | 712 | 38 | % | |||||||||||||||||||||||||||
| The following table presents the components of other income (dollars in millions): | |||||||||||||||||||||||||
| For the Years Ended December 31, | 2019 vs. 2018 (Decrease) Increase | 2018 vs. 2017 Increase (Decrease) | |||||||||||||||||||||||
| 2019 | 2018 | 2017 | $ | % | $ | % | |||||||||||||||||||
Discount and interchange revenue, net(1) | $ | 1,066 | $ | 1,074 | $ | 1,052 | $ | (8 | ) | (1 | )% | $ | 22 | 2 | % | ||||||||||
| Protection products revenue | 194 | 204 | 223 | (10 | ) | (5 | )% | (19 | ) | (9 | )% | ||||||||||||||
| Loan fee income | 449 | 402 | 363 | 47 | 12 | % | 39 | 11 | % | ||||||||||||||||
| Transaction processing revenue | 197 | 178 | 167 | 19 | 11 | % | 11 | 7 | % | ||||||||||||||||
| Other income | 90 | 97 | 92 | (7 | ) | (7 | )% | 5 | 5 | % | |||||||||||||||
| Total other income | $ | 1,996 | $ | 1,955 | $ | 1,897 | $ | 41 | 2 | % | $ | 58 | 3 | % | |||||||||||
Total other income increased $41 milliondecreased for the year ended December 31, 20192022, as compared to the year ended December 31, 2018, which was2021, primarily drivendue to net losses on equity investments partially offset by higherincreases in net discount and interchange revenue and loan fee income and transaction processing revenue. Loan fee incomeincome. The net loss on equity investments was higher as a result of an increasea decrease in late fees.the fair value of those investments. The increase in transaction processing revenue was due to greater transaction volume on the PULSE network. Net discount and interchange revenue was relatively flat for the year ended December 31, 2019 as compared to the year ended December 31, 2018 with offsetting increasespartially offset by an increase in gross discount and interchange revenue and rewards, both of which were primarily the result ofdriven by higher sales volume. Loan fee income increased primarily due to higher volume of late payments.
Other Expense
| The following table represents the components of other expense (dollars in millions): | |||||||||||||||||||||||||
| For the Years Ended December 31, | 2019 vs. 2018 Increase | 2018 vs. 2017 Increase | |||||||||||||||||||||||
| 2019 | 2018 | 2017 | $ | % | $ | % | |||||||||||||||||||
| Employee compensation and benefits | $ | 1,738 | $ | 1,627 | $ | 1,512 | $ | 111 | 7 | % | $ | 115 | 8 | % | |||||||||||
| Marketing and business development | 883 | 857 | 776 | 26 | 3 | % | 81 | 10 | % | ||||||||||||||||
| Information processing and communications | 409 | 350 | 315 | 59 | 17 | % | 35 | 11 | % | ||||||||||||||||
| Professional fees | 753 | 672 | 655 | 81 | 12 | % | 17 | 3 | % | ||||||||||||||||
| Premises and equipment | 107 | 102 | 99 | 5 | 5 | % | 3 | 3 | % | ||||||||||||||||
| Other expense | 503 | 469 | 424 | 34 | 7 | % | 45 | 11 | % | ||||||||||||||||
| Total other expense | $ | 4,393 | $ | 4,077 | $ | 3,781 | $ | 316 | 8 | % | $ | 296 | 8 | % | |||||||||||
| For the Years Ended December 31, | 2022 vs. 2021 Increase (Decrease) | 2021 vs. 2020 Increase (Decrease) | |||||||||||||||||||||||||||||||||||||||
| 2022 | 2021 | 2020 | $ | % | $ | % | |||||||||||||||||||||||||||||||||||
| Employee compensation and benefits | $ | 2,139 | $ | 1,986 | $ | 1,894 | $ | 153 | 8 | % | $ | 92 | 5 | % | |||||||||||||||||||||||||||
| Marketing and business development | 1,035 | 810 | 659 | 225 | 28 | % | 151 | 23 | % | ||||||||||||||||||||||||||||||||
| Information processing and communications | 513 | 500 | 540 | 13 | 3 | % | (40) | (7) | % | ||||||||||||||||||||||||||||||||
| Professional fees | 871 | 797 | 717 | 74 | 9 | % | 80 | 11 | % | ||||||||||||||||||||||||||||||||
| Premises and equipment | 118 | 92 | 113 | 26 | 28 | % | (21) | (19) | % | ||||||||||||||||||||||||||||||||
| Other expense | 560 | 620 | 596 | (60) | (10) | % | 24 | 4 | % | ||||||||||||||||||||||||||||||||
| Total other expense | $ | 5,236 | $ | 4,805 | $ | 4,519 | $ | 431 | 9 | % | $ | 286 | 6 | % | |||||||||||||||||||||||||||
Total other expense increased $316 million for the year ended December 31, 20192022, as compared to the year ended December 31, 2018. The increase was2021, primarily driven by higherdue to increases in marketing and business development, employee compensation and benefits and professional fees,fees. These increases were partially offset by a decrease in other expense. The increase in marketing and information processingbusiness development was driven by growth investments in card and communications.consumer banking. Employee compensation and benefits increased as a result ofprimarily from higher average salaries.headcount. The increase in professional fees was due primarily to investments in technology and increased consulting costs. The decrease in other expense was driven by higher collection fees resulting from increased recoveries, as well as investmentscertain one-time items in technological capabilities. Information processing and communications was higher due to continued investment in infrastructure and analytic capabilities.the prior period.
-64-
Income Tax Expense
| The following table reconciles our effective tax rate to the U.S. federal statutory income tax rate: | |||||||||||
| For the Years Ended December 31, | |||||||||||
| 2019 | 2018 | 2017 | |||||||||
| U.S. federal statutory income tax rate | 21.0 | % | 21.0 | % | 35.0 | % | |||||
| U.S. state, local and other income taxes, net of U.S. federal income tax benefits | 3.5 | 3.6 | 3.1 | ||||||||
Revaluation of net deferred tax assets and other investments due to tax reform(1) | — | — | 5.1 | ||||||||
| Tax credits | (1.4 | ) | (1.3 | ) | (1.3 | ) | |||||
| Other | (0.2 | ) | 0.5 | (1.2 | ) | ||||||
| Effective income tax rate | 22.9 | % | 23.8 | % | 40.7 | % | |||||
| Income tax expense | $ | 878 | $ | 855 | $ | 1,438 | |||||
| For the Years Ended December 31, | |||||||||||||||||
| 2022 | 2021 | 2020 | |||||||||||||||
| U.S. federal statutory income tax rate | 21.0 | % | 21.0 | % | 21.0 | % | |||||||||||
| U.S. state, local and other income taxes, net of U.S. federal income tax benefits | 3.4 | 3.4 | 3.4 | ||||||||||||||
| Tax credits | (1.3) | (1.2) | (4.4) | ||||||||||||||
| Other | 0.4 | (0.3) | 0.5 | ||||||||||||||
| Effective income tax rate | 23.5 | % | 22.9 | % | 20.5 | % | |||||||||||
| Income tax expense | $ | 1,350 | $ | 1,615 | $ | 294 | |||||||||||
Liquidity and Capital Resources
Funding and Liquidity
We seek to maintain stable, diversified and cost-effective funding sources and a strong liquidity profile in order to fund our business and repay or refinance our maturing obligations under both normal operating conditions and periods of economic or financial stress. In managing our liquidity risk, we seek to maintain a prudent liability maturity profile and ready access to an ample store of primary and contingent liquidity sources. Our primary funding sources include direct-to-consumer and brokered deposits, public term asset-backed securitizations and other short-term and long-term borrowings. Our primary liquidity sources include a liquidity portfolio comprisedcomposed of highly liquid, unencumbered assets, including cash and cash equivalents and investment securities, andas well as secured borrowing capacity through
private term asset-backed securitizations.securitizations and Federal Home Loan Bank (“FHLB”) advances. In addition, we have unused borrowing capacity withat the Federal Reserve discount window, which provides another source of contingent liquidity.
Funding Sources
Deposits
We offer deposit products to customersobtain deposits from consumers directly or through two channels: (i) through direct marketing, internet origination and affinity relationships (“direct-to-consumer deposits”); and (ii) indirectly. Additionally, we obtain deposits through contractual arrangements withthird-party securities brokerage firms that offer our deposits to their customers (“brokered deposits”). Direct-to-consumer depositsdeposit products include online savings accounts, certificates of deposit, money market accounts, IRA savings accounts, IRA certificates of deposit and checking accounts, while brokered depositsaccounts. Brokered deposit products include certificates of deposit and sweep accounts. In accordance with the Federal Deposit Insurance Corporation’s (“FDIC”) final rule on revisions to its brokered deposits regulation, we no longer categorize certain retail deposit products such as affinity deposits and deposits generated through certain sweep deposit relationships as brokered for regulatory reporting purposes. At December 31, 2019,2022, we had $54.4$70.5 billion of direct-to-consumer deposits and $18.3$21.1 billion of brokered deposits, of which there are $76.6 billion of deposit balances due in less than one year and other deposits.$15.0 billion of deposit balances due in one year or thereafter.
Credit Card Securitization Financing
We securitize credit card receivables as a source of funding. We access the asset-backed securitization market using the Discover Card Master Trust I (“DCMT”) and the Discover Card Execution Note Trust (“DCENT”), through which we. In connection with our securitization transactions, credit card receivables are transferred to DCMT. DCMT has issued a certificate representing the beneficial interest in its credit card receivables to DCENT. We issue DCENT DiscoverSeries notes in both public and private transactions.transactions, which are collateralized by the beneficial interest certificate held by DCENT. From time to time, we may add credit card receivables to these trustsDCMT to create sufficient funding capacity for future securitizations while managing seller’s interest. We retain significant exposure to the performance of trust assetsthe securitized credit card receivables through holdings ofholding the seller’s interest and subordinated security classes of DCENT.DCENT DiscoverSeries notes. At December 31, 2022, we had $10.2 billion of outstanding public asset-backed securities and $3.3 billion of outstanding subordinated asset-backed securities that had been issued to our wholly-owned subsidiaries.
-65-
The securitization structures include certain features designed to protect investors. The primary feature relates to the availability and adequacy of cash flows in the securitized pool of receivables to meet contractual requirements, the insufficiency of which triggers early repayment of the securities. We refer to this as “economic early amortization”,amortization,” which is based on excess spread levels. Excess spread is the amount by which income received by a trustwith respect to the securitized credit card receivables during a collection period including interest collections, fees and interchange, exceeds the fees and expenses of the trustDCENT during such collection period, including interest expense, servicing fees and charged-off receivables. In the event of an economic early amortization, which would occur if the excess spread fell below 0% on a three-month rolling average basis, we would be required to repay the affectedall outstanding securitized borrowings using available collections received bywith respect to the trust;securitized credit card receivables. For the three months ended December 31, 2022, the DiscoverSeries three-month rolling average excess spread was 14.73%. The period of ultimate repayment would be determined by the amount and timing of collections received. An early amortization event would impair our liquidity, and may require us to utilize our available non-securitization related contingent liquidity or rely on alternative funding sources, which may or may not be available at the time. As of December 31, 2019, the DiscoverSeries three-month rolling average excess spread was 13.44%.
An early amortization event would impair our liquidity and may require us to utilize our available non-securitization related contingent liquidity or rely on alternative funding sources, which may or may not be available at the time. We have several strategies we can deploy to prevent an early amortization event. For instance, we could add receivables to DCMT, which would reduce our available borrowing capacity at the Federal Reserve discount window. As of December 31, 2022, there were $25.8 billion of credit card receivables in the trust and no accounts were added to those restricted for securitization investors for the year ended December 31, 2019.2022. Alternatively, we could employ structured discounting, which was used effectively in 2009 to bolster excess spread and mitigate early amortization risk.
| The following table summarizes expected contractual maturities of the investors’ interests in credit card securitizations, excluding those that have been issued to our wholly-owned subsidiaries (dollars in millions): | |||||||||||||||||||
| At December 31, 2019 | Total | Less Than One Year | One Year Through Three Years | Four Years Through Five Years | After Five Years | ||||||||||||||
| Scheduled maturities of long-term borrowings - owed to credit card securitization investors | $ | 14,124 | $ | 3,498 | $ | 7,841 | $ | 2,785 | $ | — | |||||||||
| At December 31, 2022 | Total | Less Than One Year | One Year and Thereafter | ||||||||||||||
| Scheduled maturities of borrowings - owed to credit card securitization investors | $ | 10,175 | $ | 1,472 | $ | 8,703 | |||||||||||
The triple-A rating“AAA(sf)” and “Aaa(sf)” ratings of the DCENT DiscoverSeries Class A Notes issued to date hashave been based, in part, on an FDIC rule, which created a safe harbor that provides that the FDIC, as conservator or receiver, will not usinguse its power to disaffirm or repudiate contracts, seek to reclaim or recover assets transferred in connection with a securitization, or recharacterize themassets transferred in connection with a securitization as assets of the insured depository institution, provided such transfer satisfies the conditions for sale accounting treatment under previous GAAP. Although the implementation of the Financial Accounting Standards Board (“FASB”) Accounting Standards Codification Topic 860, Transfers and Servicing, no longer qualified certain transfers of assets for sale accounting treatment, the FDIC approved a final rule that preserved the safe-harbor treatment applicable to revolving trusts and master trusts, including DCMT, so long as those trusts would have satisfied the original FDIC safe harbor if evaluated under GAAP pertaining to transfers of financial assets in effect prior to December 2009. OtherHowever, other legislative and regulatory developments may however, impact our ability and/or desire to issue asset-backed securities in the future.
-66-
Federal Home Loan Bank Advances
Discover Bank is a member bank of the FHLB of Chicago, one of 11 FHLBs that, along with the Office of Finance, compose the FHLB System. The FHLBs are government-sponsored enterprises of the U.S. (“U.S. GSEs”) chartered to improve the availability of funds to support home ownership. As such, senior debt obligations of the FHLBs feature the same credit ratings as U.S. Treasury securities and are considered high-quality liquid assets for bank regulatory purposes. Consequently, the FHLBs benefit from consistent capital market access during nearly all macroeconomic and financial market conditions and low funding costs, which they pass on to their member banks when they borrow advances. Thus, we consider FHLB advances a stable and reliable funding source for Discover Bank for short-term contingent liquidity and long-term asset-liability management.
As a member of the FHLB of Chicago, Discover Bank has access to short- and long-term advance structures with maturities ranging from overnight to 30 years. As of December 31, 2022, we had total committed borrowing capacity of $2.2 billion based on the amount and type of assets pledged, of which $525 million of long-term advances were outstanding with the FHLB of Chicago. Under certain stressed conditions, we could pledge our liquidity portfolio securities and borrow against them at a modest reduction to their value.
Other Long-Term Borrowings—Borrowings — Private Student Loans
At December 31, 2019, $1612022, $84 million of remaining principal balance was outstanding on securitized debt assumed as part of our acquisition of The Student Loan Corporation. Principal and interest payments on the underlying private student loans will reduce the balance of these secured borrowings over time.
Other Long-Term Borrowings—Borrowings — Corporate and Bank Debt
| The following table provides a summary of Discover Financial Services (Parent Company) and Discover Bank outstanding fixed-rate debt (dollars in millions): | |||
| At December 31, 2019 | Principal Amount Outstanding | ||
| Discover Financial Services (Parent Company) fixed-rate senior notes, maturing 2022-2027 | $ | 3,422 | |
| Discover Financial Services (Parent Company) fixed-rate retail notes, maturing 2021-2031 | $ | 344 | |
| Discover Bank fixed-rate senior bank notes, maturing 2020-2028 | $ | 6,850 | |
| Discover Bank fixed-rate subordinated bank notes, maturing 2020-2028 | $ | 1,000 | |
| At December 31, 2022 | Principal Amount Outstanding | ||||
| Discover Financial Services (Parent Company) fixed-rate senior notes, maturing 2024-2032 | $ | 3,350 | |||
| Discover Financial Services (Parent Company) fixed-rate retail notes, maturing 2023-2031 | $ | 155 | |||
| Discover Bank fixed-rate senior bank notes, maturing 2023-2030 | $ | 5,350 | |||
| Discover Bank fixed-rate subordinated bank notes, maturing 2028 | $ | 500 | |||
At December 31, 2022, $585 million of interest on our fixed-rate debt is due in less than one year and $1.6 billion of interest is due in one year and thereafter. See Note 9: Long-Term Borrowings to our consolidated financial statements for more information on the maturities of our long-term borrowings. Certain DFS senior notes require us to offer to repurchase the notes at a price equal to 101% of their aggregate principal amount plus accrued and unpaid interest in the event of a change of control involving us and a corresponding ratings downgrade to below investment grade.
Short-Term Borrowings
As part of our regular funding strategy, we may, from time to time, borrow short-term funds in the federal funds market or the repurchase (“repo”) market through repurchase agreements. Federal funds are short-term, unsecured loans between banks or other financial entities with a Federal Reserve account. Funds borrowed in the repo market are short-term, collateralized loans, usually secured with highly-rated investment securities such as U.S. Treasury bills or notes, or federal agency mortgage bonds or debentures.debentures issued by government agencies or U.S. GSEs. At December 31, 2019,2022, there were no outstanding balances in the federal funds market or under repurchase agreements. Additionally, we have access to short-term advance structures through the FHLB of Chicago and privately placed asset-backed securitizations. At December 31, 2022, there were no short-term advances outstanding from the FHLB and no private asset-backed securitizations.
Additional Funding Sources
Private Asset-Backed Securitizations
We have access to committed borrowing capacity through privately placed asset-backed securitizations. At December 31, 2019,While we had total committed capacity of $6.0 billion, $500 million of which was drawn. While we
may utilize funding from these private securitizations from time to time for normal business operations, their
-67-
committed nature also makes them a reliable contingency funding source. Therefore, we reserve some undrawn capacity, informed by our liquidity stress test results, for potential contingency funding needs. At December 31, 2022, we had a total committed capacity of $3.5 billion, none of which was drawn. We also seek to ensure the stability and reliability of these securitizations by staggering their maturity dates, renewing them approximately one year prior to their scheduled maturity dates and periodically drawing them for operational testing purposestests and seasonal funding needs.
Federal Reserve
Discover Bank has access to the Federal Reserve Bank of Philadelphia’s discount window. As of December 31, 2019,2022, Discover Bank had $34.2$42.3 billion of available borrowing capacity through the discount window based on the amount and type of assets pledged, primarily consumer loans. WeAs of December 31, 2022, we have no borrowings outstanding under the discount window and reserve this capacity as a source of contingent liquidity.
Funding Uses
Our primary uses of funds include the extensions of loans and credit to customers, primarily through Discover Bank,Bank; the maintenance of sufficient working capital for routine operations; the service of our debt and capital obligations, including interest, principal, and dividend payments; and the purchase of investment securities for our liquidity portfolio, working capital,portfolio.
In addition to originating consumer loans to new customers, we also extend credit to existing customers, which primarily arises from agreements for unused lines of credit on certain credit cards and certain other loan products, provided there is no violation of conditions established in the related agreement. At December 31, 2022, our unused credit arrangements were approximately $224.7 billion. These arrangements, substantially all of which we can terminate at any time and which do not necessarily represent future cash requirements, are periodically reviewed based on account usage, customer creditworthiness and loan qualification.
In the normal course of business, we enter into various contracts for goods and services, such as consulting, outsourcing, data, sponsorships, software licenses, telecommunications, and global merchant acceptance, among other things. These contracts are legally binding and specify all significant terms, including any applicable fixed future cash payments.
As of December 31, 2022, we have debt obligations, common stock and preferred stock outstanding. Refer to “— Funding Sources” and “— Capital” for more information related to our debt obligations and capital service. service, respectively, and the timing of expected payments.
We assess funding uses and liquidity needs under stressed and normal operating conditions, considering primary uses of funding, such as on-balance sheet loans and contingent uses of funding, such as the need to post additional collateral for derivatives positions. In order toTo anticipate funding needs under stress, we conduct liquidity stress tests to assess the impact of idiosyncratic, systemic and hybrid (idiosyncratic(i.e., idiosyncratic and systemic) scenarios with varying levels of liquidity risk reflecting a range of stress severity. If we determine we have excess cash and cash equivalents, we may invest in highly liquid, unencumbered assets that we expect to be able to convert to cash quickly and with little loss of value using the repo market or outright sales.
Guarantees
Guarantees are contracts or indemnification agreements that may require us to make payments to a guaranteed party based on changes in an underlying asset, liability, or equity security of a guaranteed party, rate or index. Also included in guarantees are contracts that may require the guarantor to make payments to a guaranteed party based on another entity’s failure to perform under an agreement. Our guarantees relate to transactions processed on the Discover Network and certain transactions processed by PULSE and Diners Club. In the ordinary course of business, we guarantee payment on behalf of subsidiaries relating to contractual obligations with external parties. The activities of the subsidiaries covered by any such guarantees are included in our consolidated financial statements. See Note 18: Commitments, Contingencies and Guarantees to our consolidated financial statements for further discussion regarding our guarantees.
Credit Ratings
Our borrowing costs and capacity in certain funding markets, including those for securitizations and unsecured senior and subordinated debt, may be affected by the credit ratings of DFS, Discover Bank and the securitization trusts.
-68-
Downgrades in these credit ratings could result in higher interest expense on our unsecured debt and asset securitizations, as well as higher collateralcredit enhancement requirements for both our public and private asset securitizations. In addition to increased funding costs, deterioration in our credit ratings could reduce our borrowing capacity in the unsecured debt and asset securitization capital markets.
The table below reflects our current credit ratings and outlooks:
(1)On December 7, 2022, Moody’s Investors Service placed all of the long-term ratings and assessments for Discover Financial Services and Discover Bank on review for upgrade. (2)An “sf” in the rating denotes rating agency identification for structured finance product ratings. A credit rating is not a recommendation to buy, sell or hold securities and may be subject to revision or withdrawal at any time by the assigning rating Liquidity We seek to ensure that we have adequate liquidity to sustain business operations, fund asset growth and satisfy debt obligations under stressed and normal operating conditions. In addition to the funding sources discussed in the previous section, we also maintain highly liquid, unencumbered assets in our liquidity portfolio that we expect to be able to convert to cash quickly and with little loss of value using either the repo market or outright sales. We maintain a liquidity risk and funding management policy, which outlines the overall framework and general principles we follow in managing liquidity risk across our business. The We employ a variety of metrics to monitor and manage liquidity. We utilize early warning indicators (“EWIs”) to detect In addition, we conduct liquidity stress tests regularly and ensure contingency funding is in place to address potential liquidity shortfalls. We evaluate a range of stress scenarios that are designed -69- requirements, including idiosyncratic, systemic and a combination of such events that could impact funding sources and our ability to meet liquidity needs. These scenarios measure the projected liquidity position at DFS and Discover Bank across a range of time horizons by comparing estimated contingency funding needs to available contingent liquidity. Our primary At December 31, At December 31,
(1)Cash in the process of settlement and restricted cash are excluded from cash and cash equivalents for liquidity purposes.
Bank Holding Company Liquidity The primary uses of funds at the unconsolidated DFS level include debt service obligations (interest payments and return of principal) and capital service and management activities, We utilize a measure referred to as Number of Months of Pre-Funding to determine the length of time -70- prudently the amount of debt maturing within a short Capital Our primary sources of capital are the earnings generated by our businesses and the proceeds from issuances of capital securities. We seek to manage capital to a level and composition sufficient to support Under regulatory capital requirements adopted by the Federal Reserve and the FDIC, DFS, along with Discover Bank, must maintain minimum In March 2020, federal bank regulatory agencies announced an interim and now final rule that allows banks that have implemented the CECL accounting model to delay the estimated impact of CECL on regulatory capital for two years, followed by a three-year transition period. For purposes of calculating regulatory capital, we have elected to defer recognition of the estimated impact of CECL on regulatory capital for two years in accordance with the final rule; after that period of deferral, the estimated impact of CECL on regulatory capital will be phased in over three years, beginning in 2022. Electing this option raised our Common Equity Tier 1 ("CET1") capital ratios in 2022 and 2021. The phase-in of the CECL accounting model decreased CET1 by $537 million as of January 1, The SCB requirement is institution-specific and is calculated as the greater of (i) 2.5% and (ii) the sum of (a) the difference between DFS' actual CET1 ratio at the beginning of the forecast and the projected minimum CET1 ratio based on the Federal Reserve's models in its nine-quarter Severely Adverse stress scenario, plus (b) the sum of the dollar amount of DFS' planned common stock dividend distributions for each of the -71- DFS elected not to At December 31, 2022, DFS and Discover Bank met the requirements for Basel III rules also require disclosures relating to market discipline. This series of disclosures is commonly referred to as We disclose tangible common equity, which represents common equity less goodwill and intangibles. Management believes that common stockholders’ equity excluding goodwill and intangibles is The following table reconciles total common stockholders’ equity (a GAAP financial measure) to tangible common equity (dollars in millions):
(1)Total common stockholders’ equity is calculated as total stockholders’ equity less preferred stock. -72-
Our Board of Directors declared the
-73- Our Board of Directors declared the following Series D preferred stock dividends during 2022 and 2021:
(1)The dividend includes $30.63 semi-annual dividend per depositary share plus $15.48 to account for the long first dividend period. On January 17, 2023, we declared a semi-annual cash dividend on our Series C and Series D preferred stock of Our Board of Directors approved a new share repurchase program The amount and size of any future dividends and share repurchases will depend -74- Item 7A. Quantitative and
Market risk refers to the risk that a change in the level of one or more market prices, rates, indices, correlations or other market factors will result in losses for an investment position or portfolio. We are exposed to market risk primarily from changes in interest rates. Interest Rate Risk We borrow money from competitors’ responses to those changes may influence customer payment rates, loan balances or deposit account activity. As a result, we may incur higher funding costs Our interest rate risk management policies are designed to measure and manage the potential volatility of earnings that may arise from changes in interest rates by having a We use an interest rate sensitivity simulation to assess our interest rate risk exposure. For purposes of presenting the possible earnings effect of a hypothetical, adverse change in interest rates over the Our Net interest income sensitivity -75-
An estimated impact on net interest income of a decrease in interest rates at December 31, 2021, was not provided as many of our interest-rate-sensitive assets and liabilities were tied to interest rates (i.e., prime and federal funds) that were near their historical minimum levels and, therefore, could not materially decrease. -76- Item 8. Financial Statements and Supplementary Data REPORT OF INDEPENDENT REGISTERED PUBLIC ACCOUNTING FIRM To the Stockholders and the Board of Directors of Discover Financial Services Riverwoods, IL Opinion on Internal Control over Financial Reporting We have audited the internal control over financial reporting of Discover Financial Services (the “Company”) as of December 31, We have also audited, in accordance with the standards of the Public Company Accounting Oversight Board (United States) (PCAOB), the consolidated statement of financial condition, and the related consolidated statements of income, comprehensive income, changes in stockholders’ equity, and cash flows as of and for the year ended December 31, Basis for Opinion The Company’s management is responsible for maintaining effective internal control over financial reporting and for its assessment of the effectiveness of internal control over financial reporting, included in the accompanying Management’s Annual Report on Internal Control over Financial Reporting. Our responsibility is to express an opinion on the Company’s internal control over financial reporting based on our audit. We are a public accounting firm registered with the PCAOB and are required to be independent with respect to the Company in accordance with the U.S. federal securities laws and the applicable rules and regulations of the Securities and Exchange Commission and the PCAOB. We conducted our audit in accordance with the standards of the PCAOB. Those standards require that we plan and perform the audit to obtain reasonable assurance about whether effective internal control over financial reporting was maintained in all material respects. Our audit included obtaining an understanding of internal control over financial reporting, assessing the risk that a material weakness exists, testing and evaluating the design and operating effectiveness of internal control based on the assessed risk, and performing such other procedures as we considered necessary in the circumstances. We believe that our audit provides a reasonable basis for our opinion. Definition and Limitations of Internal Control over Financial Reporting A company’s internal control over financial reporting is a process designed to provide reasonable assurance regarding the reliability of financial reporting and the preparation of financial statements for external purposes in accordance with generally accepted accounting principles. A company’s internal control over financial reporting includes those policies and procedures that (1) pertain to the maintenance of records that, in reasonable detail, accurately and fairly reflect the transactions and dispositions of the assets of the company; (2) provide reasonable assurance that transactions are recorded as necessary to permit preparation of financial statements in accordance with generally accepted accounting principles, and that receipts and expenditures of the company are being made only in accordance with authorizations of management and directors of the company; and (3) provide reasonable assurance regarding prevention or timely detection of unauthorized acquisition, use, or disposition of the company’s assets that could have a material effect on the financial statements. Because of its inherent limitations, internal control over financial reporting may not prevent or detect misstatements. Also, projections of any evaluation of effectiveness to future periods are subject to the risk that controls may become inadequate because of changes in conditions, or that the degree of compliance with the policies or procedures may deteriorate.
-77- REPORT OF INDEPENDENT REGISTERED PUBLIC ACCOUNTING FIRM To the Stockholders and the Board of Directors of Discover Financial Services Riverwoods, IL Opinion on the Financial Statements We have audited the accompanying consolidated statements of financial condition of Discover Financial Services (the “Company”) as of December 31, We have also audited, in accordance with the standards of the Public Company Accounting Oversight Board (United States) (PCAOB), the Company’s internal control over financial reporting as of December 31, Basis for Opinion These financial statements are the responsibility of the Company’s management. Our responsibility is to express an opinion on the Company’s financial statements based on our audits. We are a public accounting firm registered with the PCAOB and are required to be independent with respect to the Company in accordance with the U.S. federal securities laws and the applicable rules and regulations of the Securities and Exchange Commission and the PCAOB. We conducted our audits in accordance with the standards of the PCAOB. Those standards require that we plan and perform the audit to obtain reasonable assurance about whether the financial statements are free of material misstatement, whether due to error or fraud. Our audits included performing procedures to assess the risks of material misstatement of the financial statements, whether due to error or fraud, and performing procedures that respond to those risks. Such procedures included examining, on a test basis, evidence regarding the amounts and disclosures in the financial statements. Our audits also included evaluating the accounting principles used and significant estimates made by management, as well as evaluating the overall presentation of the financial statements. We believe that our audits provide a reasonable basis for our opinion. Critical Audit The critical audit Allowance for Credit Critical Audit Matter Description During the year ended December 31, 2022, the economic environment resulted in increased uncertainty and more -78- judgment to derive the CECL estimate. Specifically, the unknown impacts of the cessation of fiscal policy assistance and recent monetary policy actions, in response to inflation, have increased the uncertainty associated with the macroeconomic outlook and CECL estimate. The Given the significant estimates and assumptions management makes to estimate the allowance for credit losses How the Critical Audit Matter Was Addressed in the Audit Our audit procedures related to the •We tested the design and operating effectiveness of management’s controls over the •We evaluated whether the method (including the model), data, and significant assumptions are appropriate in the context of the applicable financial reporting framework •We tested the relevance and reliability of internal and external data used within the models, including whether the data is accurate and complete when internally derived •With assistance from credit modeling specialists, we evaluated whether the model is suitable for determining the estimate, which included understanding the model methodology and logic and whether the selected method for estimating loan losses is appropriate for each loan portfolio •We evaluated whether the significant economic assumptions were reasonable and internally and externally consistent •We evaluated the •We evaluated whether judgments have been applied consistently to the model and that any adjustments to the output of the model are consistent with the measurement objective of the applicable financial reporting framework and are appropriate in the •We considered any contradictory evidence that arose while performing our procedures, and whether or not this evidence was indicative of •We
We have served as the Company’s auditor since the spin-off from its former parent company in 2007 and as Discover Bank’s (a -79- DISCOVER FINANCIAL SERVICES Consolidated Statements of Financial Condition
The table below presents the carrying amounts of certain assets and liabilities of Discover Financial Services’ consolidated variable interest entities (“VIEs”), which are included in the consolidated statements of financial condition above. The assets in the table below include those assets that can only be used to settle obligations of the consolidated VIEs. The liabilities in the table below include third-party liabilities of consolidated VIEs only and exclude intercompany balances that eliminate in consolidation. The liabilities also exclude amounts for which creditors have recourse to the general credit of Discover Financial Services.
See Notes to the Consolidated Financial Statements. -80- DISCOVER FINANCIAL SERVICES Consolidated Statements of Income
See Notes to the Consolidated Financial Statements. -81- DISCOVER FINANCIAL SERVICES Consolidated Statements of Comprehensive Income
See Notes to the Consolidated Financial Statements. -82- DISCOVER FINANCIAL SERVICES Consolidated Statements of Changes in Stockholders’ Equity (dollars in millions, shares in thousands)
See Notes to the Consolidated Financial Statements. -83- DISCOVER FINANCIAL SERVICES Consolidated Statements of Cash Flows
See Notes to the Consolidated Financial Statements. -84- Notes to the Consolidated Financial Statements 1.Background and Basis of Presentation Description of Business Discover Financial Services (“DFS” or the “Company”) is a The Basis of Presentation The accompanying consolidated financial statements have been prepared in accordance with accounting principles generally accepted in the Principles of Consolidation The accompanying consolidated financial statements include the accounts of the Company and its wholly-owned subsidiaries. The Company’s policy is to consolidate all entities in which it owns more than 50% of the outstanding voting stock unless it does not control the entity. However, the Company did not have a controlling voting interest in any entity other than its wholly-owned subsidiaries in the periods presented in the accompanying consolidated financial statements. It is also the Company’s policy to consolidate any For investments in any entities in which the Company owns 50% or less of the outstanding voting stock but in which the Company has significant influence over operating and financial decisions, the Company applies the equity method of accounting. The Company also applies the equity method to its investments in qualified affordable housing projects and similar tax credit partnerships. In cases where the Company’s equity investment is less than 20% and significant influence does not exist, such investments are carried at cost as they typically do not have readily determinable fair values, and are adjusted for any impairment in value. Investments in actively traded stock are carried at fair value with changes in fair value recorded as an adjustment to earnings. -85- Recently Issued Accounting Pronouncements (Not Yet Adopted) In related to the elimination of the TDR recognition and measurement guidance. The ASU is effective for the Company on January 1, In 2. Summary of Cash and Cash Equivalents Cash and cash equivalents is defined by the Company as cash on deposit with banks, including time deposits and other highly liquid investments with maturities of 90 days or less when Restricted Cash Restricted cash includes cash Investment Securities At December 31, -86- Loan Receivables Loan receivables consist of credit card receivables and other Delinquent Loans and Net Charge-Offs The entire balance of an account is contractually past due if the minimum payment is not received by the specified date on the customer’s billing statement. Delinquency is reported on loans that are 30 days or more past due. Credit card loans are charged off at the end of the month during which an account becomes 180 days past due. Closed-end unsecured consumer loan receivables are charged off at the end of the month during which an account becomes 120 days contractually past due. Customer bankruptcies and probate accounts are charged off by the end of the month 60 days following the receipt of notification of the bankruptcy or death, but not later than the 180-day or 120-day time frame described above. Receivables associated with alleged or potential fraudulent transactions are The Company’s net charge-offs include the principal amount of loans charged off less principal recoveries and exclude charged-off interest and fees, recoveries of interest and fees and fraud losses. The practice of re-aging an account also may affect loan delinquencies and charge-offs. A re-age is intended to assist delinquent customers who have experienced financial difficulties but who demonstrate both an ability and willingness to repay. Accounts meeting specific criteria are re-aged when the Company and the customer agree on a temporary repayment schedule that may include concessionary terms. With re-aging, the outstanding balance of a delinquent account is returned to a current status. Customers may also qualify for a workout re-age when either a longer term or permanent hardship exists. The Company’s re-age practices are designed to comply with FFIEC guidelines. Allowance for The Company maintains an allowance for The Company calculates its allowance for -87- straight-line method to revert from the reasonable and supportable forecast period to the post-reversion period, but in certain stressed scenarios, a weighted approach may be deemed more appropriate. Several analyses For •Probability of default: this component estimates the probability of charge-off at different points in time over the life of each loan. •Exposure at default: this component estimates the portion of the balance sheet date balance remaining at any given time of charge-off for each loan. Given that there is no stated life of a receivable balance on a revolving credit card account, the Company applies a percentage of expected payments to estimate the •Loss given default: this component estimates the percentage of exposure (i.e., net loss) at time of charge-off that cannot be recovered, with the offsetting forecast recoveries being the driver of this estimate. •Recoveries from previously charged-off accounts are estimated separately and are netted as part of the aggregation of all of the components of the card loss modeling framework. For private student loans and personal loans, the Company uses vintage-based models that estimate expected credit losses over the life of the loan, The components described above for credit card, private student and personal loans are developed utilizing historical data and applicable macroeconomic variable inputs based on statistical analysis and customer behavioral relationships with credit performance. Expected recoveries from loans charged off as of the The considerations in these Accrued interest receivable on credit card loans is included in the estimate of expected credit losses once billed to the customer (i.e., once the interest becomes part of the loan balance). Except as noted in the following sentence, an allowance for credit losses is not recorded for unbilled credit card interest or accrued interest receivable on other loan classes as the impact to the allowance for credit losses is not material. Accrued interest receivable on student loans that have not yet entered repayment is included in the estimate of expected credit losses. No liability for expected credit losses is required for unused lines of credit on the Company’s credit card loans because they are unconditionally cancellable. The Company records a liability for expected credit losses for unfunded commitments on all other loans, which is presented as part of accrued expenses and other liabilities in the consolidated statements of financial condition. This liability is evaluated quarterly for appropriateness and is maintained through an adjustment to the provision for credit losses. -88- As part of certain collection strategies, the Company may modify the terms of loans to customers experiencing financial hardship. Temporary and permanent modifications on credit card and personal loans, as well as temporary modifications on private student loans and certain grants of private student loan forbearance are generally accounted for as troubled debt restructurings. The Company classifies a modified loan in which a concession has been granted to the borrower as a troubled debt restructuring based on the cumulative length of the concession period and credit quality of the borrower. Loan receivables Premises and Equipment, net Premises and equipment, net, are stated at cost less provisions for impairment and accumulated depreciation and amortization. Accumulated depreciation and amortization Purchased software and capitalized costs related to internally developed software are amortized over their useful lives of three years to ten Cloud computing arrangements involving the licensing of software that meet certain criteria are recognized as the acquisition of software. Such assets are measured at the present value of the license obligation, if the license is to be paid over time, in addition to any capitalized upfront costs and amortized over the life of the arrangement. Cloud computing arrangements that do not meet the criteria to be recognized as acquired software are accounted for as service contracts. To date, none of the Company’s cloud computing arrangements have met the criteria to be recognized as acquired software. Premises Goodwill is recorded as part of the Company’s -89- reporting unit below its carrying amount. The Company’s reported goodwill relates to PULSE, which it acquired in Stock-based Compensation The Company measures the cost of Advertising Costs The Company expenses television and radio advertising costs in the period in which the advertising is first aired and all other advertising costs as incurred. Advertising costs are recorded in marketing and business development and were Income Taxes Income tax expense is provided for using the asset and liability method, under which deferred tax assets and liabilities are determined based on the temporary differences between the financial Accumulated Other Comprehensive Income The Company records unrealized gains and losses on available-for-sale securities, changes in the fair value of cash flow hedges and certain pension and foreign currency translation adjustments in Significant Revenue Recognition Accounting Policies Loan Interest and Fee Income Interest on loans is in the estimation of the accrued unbilled portion of interest revenue that is included in The Company recognizes fees (except balance transfer fees and certain product fees) on loan receivables in interest income or loan fee income as the fees are assessed. Balance transfer fees and certain product fees are -90- recognized in interest income or loan fee income ratably over the periods to which they relate. Balance transfer fees are accreted to interest income over the estimated life of the related balance. As of December 31, Direct loan origination costs on credit card loans are deferred and amortized on a straight-line basis over a one year period and recorded in interest income from credit card loans. Direct loan origination costs on other loan receivables are deferred and amortized over the life of the loan using the interest method and are recorded in interest income from other loans. As of December 31, The Company accrues interest and fees on credit card and closed-end loan receivables until the loans are paid or charged off, except in instances of customer bankruptcy, death or suspected fraud, where no further interest and fee accruals occur following notification. Interest income from Discount and Interchange Revenue The Company earns discount revenue from fees charged to merchants with whom it has entered into card acceptance agreements for processing credit card purchase transactions. The Company earns acquirer interchange revenue primarily from merchant acquirers on The Company pays issuer interchange to card-issuing entities that have entered into contractual arrangements to issue cards on the Discover Network and on certain transactions on the Diners Club and PULSE networks. This cost is contractually established and is based on the card-issuing organization’s transaction volume. The Company classifies this cost as a reduction of discount and interchange revenue. Costs of cardholder reward arrangements, including the Cashback Bonus reward program, are classified as reductions of discount and interchange revenue pursuant to guidance under Accounting Standards Codification (“ASC”) Topic 606 governing consideration payable to a customer. For both issuer interchange and transaction-based cardholder rewards, the Company accrues the cost at the time each underlying card transaction is captured for settlement. Customer Rewards The Company offers its customers various reward programs, including the Cashback -91- ended December 31, Protection Products Revenue The Company earns revenue related to fees received for providing ancillary products and services, including payment protection and identity theft protection services, to its credit card customers. A portion of this revenue comprises amounts earned for arranging for the delivery of products offered by third-party service providers. The amount of revenue recorded is generally based on either a percentage of a customer’s outstanding balance or a flat fee, in either case assessed monthly and Transaction Processing Revenue Transaction processing revenue represents switch fees charged to financial institutions and merchants under network participation agreements for processing ATM Other Income Other income includes gains and losses on equity investments, sales-based royalty revenues earned by Diners Club, merchant fees, Future Revenue Associated with Customer Contracts For contracts under which the Company processes payment card transactions, the Company has the right to assess fees for services performed and to collect those fees through the settlement process. The Company generates essentially all of its discount and interchange revenue and transaction processing revenue, as well as some revenue reported as other income, through such contracts. There is no specified quantity of service promised in these contracts as the number of payment transactions is dependent upon cardholder behavior, which is outside the control of the Company and its network customers (i.e., merchants, acquirers, issuers and other network participants). As noted above, these contracts are typically without fixed durations and renew automatically. For these reasons, the Company does not make or disclose an estimate of revenue associated with performance obligations attributable to the remaining terms of these contracts. Future revenue associated with the Company’s sales-based royalty revenues earned from Diners Club licensees is similarly variable and open-ended and therefore the Company does not make or disclose an estimate of royalties associated with performance obligations attributable to the remaining terms of the licensing and royalty arrangements. Because of the nature of the services and the manner of collection associated with the majority of the Company’s revenue from contracts with customers, material receivables or deferred revenues are not generated. Incentive Payments The Company makes certain incentive payments under contractual arrangements with financial institutions, Diners Club licensees, merchants, acquirers and certain other customers. These payments are generally classified as contra-revenue unless a distinct good or service is received by the Company in -92- deferred incentive payments included in other assets on the consolidated statements of financial condition was 3. Investments The Company’s other short-term investments and investment securities consist of the following (dollars in millions):
(1)$97 million and
The amortized cost, gross unrealized gains and losses and fair value of available-for-sale and held-to-maturity investment securities are as follows (dollars in millions):
(1)Available-for-sale investment securities are reported at fair value. (2)Held-to-maturity investment securities are reported at amortized cost. (3)Amounts represent residential mortgage-backed securities (“RMBS”) that were classified as held-to-maturity as they were entered into as a part of the Company’s community reinvestment initiatives. The Company invests in U.S. Treasury obligations and securities issued by U.S. GSEs, which have long histories with no credit losses and are explicitly or implicitly guaranteed by the U.S. federal government. Therefore, management has concluded that there is no expectation of non-payment on its investment securities and does not record an allowance for credit losses on these investments. In addition, the Company did not have the intent to sell any available-for-sale securities with an unrealized loss position and did not believe it is more likely than not that it will be required to sell any such security before recovery of its amortized cost basis. -93- The following table provides information about investment securities with aggregate gross unrealized losses and the length of time that individual investment securities have been in a continuous unrealized loss position (dollars in millions):
During the year ended December 31, 2022, the Company had no sales of available-for-sale securities. During the year ended December 31, 2021, the Company received $5 million of proceeds from the sale of available-for-sale securities. As a result of the sale, the Company recognized an immaterial gain during the year ended December 31, 2021. There were no sales of available-for-sale securities during the 2020.
-94-
(2)The weighted-average yield for available-for-sale investment securities is calculated based on the amortized cost. Taxable interest on investment securities was $179 million, Other Investments As a part of the Company’s community reinvestment initiatives, the Company has made equity investments in certain limited partnerships and limited liability companies that finance the construction and rehabilitation of affordable rental housing Company had outstanding investments in these entities of -95- affordable housing projects as of December 31, The Company holds non-controlling equity positions in several The Company also holds non-controlling equity positions in payment service entities that have actively traded stock and therefore have readily determinable fair values. As a result, these investments are carried at fair value based on the quoted share prices. As of December 31, 2022 and 2021, the carrying value of these investments, which are recorded within other assets on the Company's consolidated statements of financial condition, were $41 million and $461 million, respectively. During the year ended December 31, 2022, the Company recognized a net loss of $214 million on the consolidated statements of income related to these investments. The Company recognized a net gain of $423 million during the year ended December 31, 2021. The Company recognized no gains or losses during the year ended December 31, 2020. 4. Loan Receivables The Company has The Company’s classes of receivables within the two portfolio segments are depicted in the following table (dollars in millions):
(1)Amounts include carrying values of $13.5 billion and $13.3 billion underlying investors’ interest in trust debt at December 31, 2022 and 2021, respectively, and $12.2 billion and $11.9 billion in seller’s interest at December 31, 2022 and 2021, respectively. See Note 5: Credit Card and Private Student Loan Securitization Activities for additional information. (2)Unbilled accrued interest receivable on credit card loans, which is presented as part of other assets in the Company’s consolidated statements of financial condition, was $611 million and $423 million at December 31, 2022 and 2021, respectively. (3)Accrued interest receivable on private student, personal and other loans, which is presented as part of other assets in the Company’s consolidated statements of financial condition, was $468 million, $49 million and (4)Amounts include carrying values of $176 million and $207 million in loans pledged as collateral against the note issued from a private student loan securitization trust at December 31, 2022 and 2021, respectively. See Note 5: Credit Card and Private Student Loan Securitization Activities for additional information.
-96- Credit Quality Indicators
As part of credit risk management activities, on an ongoing basis, the Company reviews information related to the performance of a FICO scores are generally obtained at the origination of the account and are refreshed monthly or quarterly thereafter to assist in predicting customer behavior. Historically, the Company has noted that The following table provides the distribution of the amortized cost basis (excluding accrued interest receivable presented in other assets) by the most recent FICO scores available for the Company's customers for credit card, private student and personal loan receivables (dollars in millions):
(1)Amounts include $645 million and $813 million of revolving line-of-credit arrangements that were converted to term loans as a result of a TDR program as of December 31, 2022 and 2021, respectively.
(3)FICO score represents the higher credit score of the cosigner or borrower. -97- Delinquencies are an indicator of credit quality at a point in time. A loan balance is considered delinquent when contractual payments on the loan become 30 days past due. The amortized cost basis (excluding accrued interest receivable presented in other assets) of delinquent loans in the Company’s loan portfolio is shown below for credit card, private student and personal loan receivables (dollars in millions):
(1)Private student loans may include a deferment period, during which borrowers are not required to make payments while enrolled in school at least half time as determined by the school. During a deferment period, these loans do not advance into delinquency. -98- Allowance for Credit Losses The following tables provide changes in the Company’s allowance for credit losses (dollars in millions):
(1)Excludes a $10 million, $9 million and $17 million reclassification of the liability for expected credit losses on unfunded commitments for the years ended December 31, 2022, 2021 and 2020, respectively, as the liability is recorded in accrued expenses and other liabilities in the Company’s consolidated statements of financial condition. (2)Prior to the adoption of ASU No. 2016-13 on January 1, 2020, credit losses were estimated using the incurred loss approach. (3)Represents the adjustment to the allowance for credit losses as a result of the adoption of ASU No. 2016-13 on January 1, 2020. The allowance for credit losses was approximately $7.4 billion at December 31, 2022, which reflects a $552 million build from the amount of the allowance for credit losses at December 31, 2021. The build in the allowance for credit losses between December 31, 2022 and December 31, 2021, was primarily driven by loan growth. -99- The allowance estimation process begins with a loss forecast that uses certain macroeconomic variables and multiple macroeconomic scenarios among its inputs. In estimating the allowance at December 31, 2022, the Company used a macroeconomic forecast that resulted in the following weighted average amounts: (i) peak unemployment rate of 4.68%, decreasing to 4.63% by the end of 2023 and (ii) 1.05% annualized growth in the real gross domestic product in 2023. In estimating expected credit losses, the Company considered the uncertainties associated with borrower behavior and payment trends, as well as higher consumer price inflation experienced during 2022 and the fiscal and monetary policy responses to that inflation. In 2022, the Federal Reserve raised its federal funds rate target range and financial market participants expect additional increases during 2023 in an effort to reduce inflation. In recognition of the risks related to the macroeconomic environment, the estimation of the allowance for credit losses has required significant management judgment. The forecast period the Company deemed to be reasonable and supportable was 18 months for all periods presented. The 18-month reasonable and supportable forecast period was deemed appropriate given the current economic conditions. For all periods presented, the Company determined that a reversion period of 12 months was appropriate for the same reason. The Company applied a weighted reversion method to provide a more reasonable transition to historical losses for all loan products for all periods presented. The net charge-offs on the Company’s credit card loans for the year ended December 31, 2022, increased when compared to the year ended December 31, 2021, due to continued credit normalization and the seasoning of vintages from the past two years. The net charge-offs on private student loans Net charge-offs of principal are recorded against the allowance for credit losses, as shown in the preceding table. Information regarding net charge-offs of interest and fee revenues on credit card and other loans is as follows (dollars in millions):
-100- Delinquent and Non-Accruing Loans The amortized cost basis (excluding accrued interest receivable presented in other assets) of delinquent and non-accruing loans in the Company’s loan portfolio is shown below for each class of loan receivables (dollars in millions):
(1)The Company estimates that the gross interest income that would have been recorded under the original terms of non-accruing credit card loans was $23 million, $28 million and $33 million for the years ended December 31, 2022, 2021 and 2020, respectively. The Company does not separately track the amount of
The payment status of modified loans, whether the TDR designation applies or not, is reflected in the Company’s delinquency reporting. Troubled Debt Restructurings The Company has internal loan modification programs that provide relief to credit card, For credit card customers, the Company offers both temporary and permanent hardship programs. The temporary hardship programs consist of an interest rate reduction and in some cases a reduced minimum payment, both lasting for a period no longer than 12 -101- The permanent modification program involves closing the account, changing the structure of the loan to a fixed payment loan with a maturity no longer than At December 31, 2022 and 2021, there were $6.0 billion and $5.8 billion, respectively, of private student loans in repayment and $81 million and $64 million, respectively, in forbearance. To assist private student loan borrowers who are experiencing temporary financial difficulties but are willing to resume making payments, the Company may offer hardship forbearance, payment deferral, a temporary payment reduction, a temporary interest rate reduction or extended terms. A modified loan typically meets the definition of a TDR based on the cumulative length of the concession period and a determination of financial distress based on an evaluation of the borrower’s credit quality using FICO scores. For personal loan customers,
The following table provides information on loans that entered a TDR program during the period (dollars in millions):
(1)Accounts that entered a credit card TDR program include $322 million, $351 million and $670 million that were converted from revolving line-of-credit arrangements to term loans during the years ended December 31, 2022, 2021 and 2020, respectively. The number and balance of enrollments in credit card, private student loan and personal loan modification
-102- provided by the Coronavirus Aid, Relief, and Economic Security Act (“CARES Act”), which expired on January 1, 2022, during the prior periods. The following table presents the carrying value of loans that experienced a default during the period that had been modified in a TDR during the 15 months preceding the end of each period (dollars in millions):
(1)For credit card loans that default from a temporary loan modification program, accounts revert back to the pre-modification terms and charging privileges remain suspended in most cases. (2)For credit card loans and personal loans, a customer defaults from a loan modification program after either two consecutive missed payments or at charge-off, depending on the program. The outstanding balance upon default is generally the loan balance at the end of the month prior to default.
Of the account balances that defaulted as shown above for the years ended December 31,
-103- Geographical Distribution of Loans
5. Credit Card and Private Student Loan Securitization Activities The Company’s securitizations are accounted for as secured borrowings and the related trusts are treated as consolidated subsidiaries of the Company. For a description of the Company’s principles of consolidation with respect to VIEs, see Note 1: Background and Basis of Presentation. Credit Card Securitization Activities The Company accesses the term asset securitization market through DCMT and DCENT. Credit card loan receivables are transferred into DCMT and beneficial interests in DCMT are transferred into DCENT. DCENT issues debt securities to investors that are reported primarily in long-term borrowings. -104- The DCENT debt structure consists of The Company’s retained interests in the trust’s assets, Upon transfer of credit card loan receivables to the trust, the receivables and certain cash flows derived from them become restricted for use in meeting obligations to the The carrying values of these restricted assets, which are presented on the Company’s consolidated statements of financial condition as relating to securitization activities, are shown in the following table (dollars in millions):
The debt securities issued by the consolidated trusts are subject to credit, payment and interest rate risks on the transferred credit card loan receivables. To protect investors in the securities, there are certain features or triggering events that The Company continues to own and service the accounts that generate the loan receivables held by the trusts. Discover Bank receives servicing fees from the trusts based on a percentage of the monthly investor principal balance outstanding. Although the fee income to Discover Bank offsets the fee expense to the trusts and thus is eliminated in consolidation, failure to service the transferred loan receivables in accordance with contractual requirements could lead to a termination of the servicing rights and the loss of future servicing income, net of related expenses. -105- Private Student Loan Securitization Activities
A summary of premises and equipment, net is as follows (dollars in millions):
Depreciation expense was 7. Goodwill As of December 31,
-106- 8. Deposits The Company Customer deposits held with Discover Bank are currently insured for up to $250,000 per account holder through the Federal Deposit Insurance Corporation (“FDIC”). At December 31, 2022 and 2021, the Company had approximately $8.9 billion and $8.2 billion of uninsured deposits, respectively. Uninsured deposits are the portion of deposit accounts in U.S. offices that exceed the FDIC insurance limit or similar state deposit insurance regime, and amounts in any other uninsured investment or deposit accounts that are classified as deposits and not subject to any federal or state deposit insurance regime. The amounts of uninsured deposits above were estimated based on the same methodologies and assumptions used for Discover Bank’s regulatory reporting requirements. The following table summarizes certificates of deposit in uninsured accounts and accounts that are in excess of the FDIC insurance limit by time remaining until maturity (dollars in millions):
The following table summarizes certificates of deposit maturing over each of the next five years and thereafter (dollars in millions):
-107- 9. Long-Term Borrowings Long-term borrowings consist of borrowings having original maturities of one year or more. The following table provides a summary of the Company’s long-term borrowings and weighted-average interest rates on outstanding balances (dollars in millions):
(1)The Company uses interest rate swaps to hedge portions of these long-term borrowings against changes in fair value attributable to changes in the applicable benchmark interest rates. The use of these interest rate swaps impacts the carrying value of the debt. See Note 21: Derivatives and Hedging Activities. (2)DCENT floating-rate asset-backed securities include issuances with the following interest rate terms: 1-month LIBOR + 33 to 60 basis points as of December 31, 2022.
(4)Repayment of this debt is dependent upon the timing of principal and interest payments on the underlying private student loans. The date shown represents the final maturity date.
The following table summarizes long-term borrowings maturing over each of the next five years and thereafter (dollars in millions):
-108- As a member of the FHLB of Chicago, the Company has access to both short- and long-term advance structures with maturities ranging from overnight to 30 years. As of December 31, 2022, the Company had total committed borrowing capacity of $2.2 billion based on the amount and type of assets pledged, of which the outstanding balance was comprised solely of a $525 million long-term advance. As of December 31, 2021, the Company had total committed borrowing capacity of $1.4 billion, of which the outstanding balance was comprised solely of a $1.3 billion short-term advance. These advances are presented as short- or long-term borrowings on the consolidated statements of financial condition as appropriate. Additionally, the Company has access to committed borrowing capacity through private securitizations to support the funding of its credit card loan receivables. As of December 31, private providers was 10. Stock-Based Compensation Plans The Company has Omnibus Plan The Omnibus Plan, which is Directors’ Compensation Plan The Directors’ Compensation Plan, which is -109- Stock-Based Compensation
(1)Total PSU expense for the year ended December 31, 2021, includes an incremental $1 million, representing a modification to the 2019 PSU award. Total PSU expense for the year ended December 31, 2020, includes an incremental $2 million, representing a modification to the 2018 PSU award. The nature of the modifications was to adjust the payout to compensate for the 2020 CECL adoption impact on earnings per share (“EPS”).
RSUs The following table sets forth the activity related to vested and unvested RSUs:
(1)Unvested RSUs represent awards where recipients have yet to satisfy either explicit vesting terms or retirement-eligibility requirements.
Compensation cost associated with RSUs is determined based on the number of units granted and the fair value on the date of grant. The fair value is amortized on a straight-line basis, net of estimated forfeitures, over the requisite service period for each separately vesting tranche of the award. The requisite service period is generally the vesting period.
-110- The following table summarizes the total intrinsic value of the RSUs converted to common stock and the total grant-date fair value of RSUs vested (dollars in millions, except weighted-average grant-date fair value amounts):
As of December 31, RSUs provide for accelerated vesting if there is a change in control or upon certain terminations (as defined in the Omnibus Plan or the award certificate). RSUs include the right to receive dividend equivalents in the same amount and at the same time as dividends paid to all Company common shareholders. PSUs The following table sets forth the activity related to vested and unvested PSUs:
(2) Includes 271,588 PSUs granted in 2020 that are earned based on the Company’s cumulative EPS as measured over the three-year performance period, which ended December 31, 2022, and are subject to the requisite service period, which ended February 1, 2023. (3) Includes 244,498 PSUs granted in 2021 that are earned based on the Company’s cumulative EPS as measured over the three-year performance period, which ends December 31, 2023, and are subject to the requisite service period, which ends February 1, 2024. (4) Includes 200,386 PSUs granted in 2022 that may be earned based on the Company’s cumulative EPS as measured over the three-year performance period, which ends December 31, 2024, and are subject to the requisite service period, which ends February 1, 2025. Compensation cost associated with PSUs is determined based on the number of instruments granted, the fair value on the date of grant and the performance factor. The fair value is amortized on a straight-line basis, net of estimated forfeitures, over the requisite service period. Each PSU outstanding at December 31,
As of December 31, -111- PSUs provide for accelerated vesting if there is a change in control or upon certain terminations (as defined in the Omnibus Plan or the award certificate). PSUs include the right to receive dividend equivalents, which will accumulate and pay out in cash if and when the underlying shares are issued. 11. Employee Benefit Plans The Company sponsors the Discover Financial Services Pension Plan (the “Discover Pension Plan”), which is a non-contributory defined benefit plan that is qualified under Section 401(a) of the Internal Revenue Code, for eligible employees in the U.S. Effective December 31, 2008, the Discover Pension Plan was amended to discontinue the accrual of future benefits. The Company also sponsors the Discover Financial Services 401(k) Plan (the “Discover 401(k) Plan”), which is a defined contribution plan that is qualified under Section 401(a) of the Internal Revenue Code, for its eligible U.S. employees. Discover Pension Plan The Discover Pension Plan generally provides retirement benefits that are based on each participant’s years of credited service prior to 2009 and on compensation specified in the Discover Pension Plan. The Company’s policy is to fund at least the amounts sufficient to meet minimum funding requirements under the Employee Retirement Income Security Act of 1974, as amended. Net periodic benefit cost (income) is recorded in employee compensation and benefits within the consolidated statements of income. For this plan, the net periodic benefit cost was immaterial for all periods presented.
Discover 401(k) Plan Under the Discover 401(k) Plan, eligible U.S. employees receive 401(k) matching contributions. Eligible employees also receive fixed employer contributions. The pretax expense associated with the Company contributions for the years ended December 31, -112- In July 2021, the Board of Directors approved a share repurchase program authorizing up to $2.4 billion of share repurchases. The program expired on March 31, 2022. On April 27, 2022, the Company’s Board of Directors approved a new share repurchase program authorizing the repurchase of up to $4.2 billion of its outstanding shares of common stock. This program expires on June 30, 2023. During the three months ended December 31, 2022, the Company repurchased approximately 5.9 million shares for approximately $600 million. During the year ended December 31, 2022, the Company repurchased approximately 21.5 million shares for approximately $2.3 billion. Preferred Stock The
(1) (2)Issued as depositary shares, each representing 1/100th (3) (4) (6)Any dividends declared are payable semi-annually in arrears at a rate of 6.125% per annum until September 23, 2025, after which the dividend rate will reset every 5 years to a fixed annual rate equal to the 5-year Treasury plus a spread of 5.783%. -113- 13. Accumulated Other Comprehensive Income Changes in each component of AOCI were as follows (dollars in millions):
-114- The following table presents each component of OCI before reclassifications and amounts reclassified from AOCI for
-115- Total other expense includes the
15. Income Taxes Income tax expense
The following table reconciles the
Deferred income taxes reflect the net tax effects of temporary differences between the financial reporting and tax bases of assets and liabilities and are measured using the enacted tax rates and laws that will be in effect when such differences are expected to -116- Significant components of the
A reconciliation of beginning and
The Company recognizes accrued interest and penalties related to unrecognized tax benefits as a component of income tax expense. Interest and penalties related to unrecognized tax benefits were The Company is subject to examination by the Internal Revenue Service (“IRS”) and tax authorities in various state, local and foreign tax jurisdictions. The Company’s federal income tax filings are open to examinations for the tax year ended December 31, 2019 and forward. The Company regularly assesses the likelihood of additional assessments or settlements in each of the taxing The Company has an immaterial amount of state net operating loss carryforwards that are subject to a partial valuation allowance as of December 31,
16. Earnings Per Share The following table presents the calculation of basic and diluted EPS (dollars and shares in millions, except per share amounts):
Anti-dilutive securities were not material and had no impact on the computation of diluted EPS for the years ended December 31, DFS is subject to the capital adequacy guidelines of the Federal In March 2020, federal bank regulatory agencies announced an interim and now final rule that allows banks that have implemented the CECL accounting model to delay the estimated impact of CECL on regulatory capital for two years, followed by a three-year transition As of December 31, -118- The following table shows the actual capital amounts and ratios of DFS and Discover Bank and comparisons of each to the regulatory minimum and “well-capitalized” requirements (dollars in millions):
(2)The Basel III rules do not establish well-capitalized thresholds for these measures for bank holding companies. Existing well-capitalized thresholds established in the Federal Reserve’s Regulation Y have been included where available. The amount of dividends that a bank may pay in any year is subject to certain regulatory restrictions. Under the current banking regulations, a bank may not pay dividends if such a payment would leave the bank inadequately capitalized. Discover Bank paid dividends of -119- 18. Commitments, Contingencies and Guarantees In the normal course of business, the Company enters into a number of off-balance sheet commitments, transactions and obligations under guarantee arrangements that expose the Company to varying degrees of risk. The Company’s commitments, contingencies and guarantee relationships are described below. Commitments Unused Credit Arrangements At December 31, Contingencies See Note 19: Litigation and Regulatory Matters for a description of potential liability arising from pending litigation or regulatory proceedings involving the Company. Guarantees The Company has obligations under certain guarantee arrangements, including contracts, indemnification agreements and representations and warranties, which contingently require the Company to make payments to the guaranteed party based on changes in an underlying asset, liability or equity security of a guaranteed party, rate or index. Also included as guarantees are contracts that contingently require the Company to make payments to a guaranteed party based on another entity’s failure to perform under an agreement. The Company’s use of guarantees is disclosed below by type of guarantee. Securitizations Representations and Warranties As part of the Company’s financing activities, the Company provides representations and warranties that certain assets pledged as collateral in secured borrowing arrangements conform to specified guidelines. Due diligence is performed by the Company, which is intended to ensure that asset guideline qualifications are met. If the assets pledged as collateral do not meet certain conforming guidelines, the Company may be required to replace, repurchase or sell such assets. In its credit card securitization activities, the Company would replace nonconforming receivables through the allocation of excess seller’s interest or from additional transfers from the unrestricted pool of receivables. If the Company could not add enough receivables to satisfy the requirement, an early amortization (or repayment) of investors’ interests would be triggered. In its student loan securitizations, the Company would generally repurchase the loans from the trust at the outstanding principal amount plus interest. The maximum potential amount of future payments the Company could be required to make would be equal to the current outstanding balances of third-party investor interests in credit card asset-backed securities and the principal amount of any private student loan secured borrowings, plus any unpaid interest for the corresponding secured borrowings. The Company has recorded substantially all of the maximum potential amount of future payments in long-term borrowings on the Company’s consolidated statements of financial condition. The Company has not recorded any incremental contingent liability associated with its secured borrowing representations and warranties. Management believes that the probability of having to replace, repurchase or sell assets pledged as collateral under secured borrowing arrangements, including an early amortization event, is low. -120- Counterparty Settlement Guarantees Diners Club and DFS Services LLC (on behalf of PULSE) have various counterparty exposures, which are listed
The maximum potential amount of future payments related to such contingent obligations is dependent upon the transaction volume processed between the time a potential counterparty defaults on its settlement and the time at which the Company disables the settlement of any further transactions for the defaulting party. The Company has some contractual remedies to offset these counterparty settlement exposures (such as letters of credit or pledged deposits), however, there is no limitation on the maximum amount the Company may be liable to pay. The actual amount of the potential exposure cannot be quantified as the Company cannot determine whether particular counterparties will fail to meet their settlement obligations. In the event The Company believes that the estimated amounts of maximum potential future payments are not representative of the Company’s actual potential loss exposure given Diners Club’s and PULSE’s insignificant historical losses from these counterparty exposures. As of December 31, Discover Network Merchant Chargeback Guarantees The Company operates the Discover Network, issues payment cards and permits third parties to issue payment cards. The Company is contingently liable for certain transactions processed on the Discover Network in the event of a dispute between the payment card customer and a merchant. The contingent liability arises if the disputed transaction involves a merchant or merchant acquirer with whom the Discover Network has a direct relationship. If a dispute is resolved in the customer’s favor, the Discover Network will credit or refund the disputed amount to the Discover Network card issuer, who in turn credits its customer’s account. The Discover Network will then charge back the disputed amount of the payment card transaction to the merchant or merchant acquirer, where permitted by the applicable agreement, to seek recovery of amounts already paid to the merchant for payment card transactions. If the Discover Network is unable to collect the amount subject to dispute from the merchant or merchant acquirer (e.g., in the event of merchant default or dissolution or after expiration of the time period for chargebacks in the applicable agreement), the Discover Network will bear the loss for the amount credited or refunded to the customer. In most instances, a loss by the Discover Network is unlikely to arise in connection with payments on card transactions because most products or services are delivered when purchased and credits are issued by merchants on returned items in a timely fashion, thus minimizing the likelihood of cardholder disputes with respect to amounts paid by the Discover Network. However, where the product or service is not scheduled to be provided to the customer until a later date following the purchase, the likelihood of a contingent payment obligation by the Discover Network increases. Losses related to merchant chargebacks were not material for the years ended December 31, The maximum potential amount of obligations of the Discover Network arising -121- experience. The actual amount of the potential exposure cannot be quantified as the Company cannot determine whether the current or cumulative transaction volumes may include or result in disputed transactions. The following table summarizes certain information regarding merchant chargeback guarantees (dollars in millions):
Represents transactions processed on the Discover Network for which a potential liability exists that, in aggregate, can differ from credit card sales volume. The Company did not record any contingent liability in the consolidated financial statements for merchant chargeback guarantees as of December 31, 19. Litigation and Regulatory Matters In the normal course of business, from time to time, the Company has been named as a defendant in various legal actions, including arbitrations, class actions and other litigation, arising in connection with its activities. Certain of the actual or threatened legal actions include claims for substantial compensatory and/or punitive damages or claims for indeterminate amounts of damages. The litigation process is not predictable and can lead to unexpected results. The Company contests liability and/or the amount of damages as appropriate in each pending matter. The Company has historically offered its customers an arbitration clause in its customer agreements. The arbitration clause allows the Company and its customers to quickly and economically resolve disputes. Additionally, the arbitration clause has in some instances limited the costs of, and the Company’s exposure to, litigation. Future legal and regulatory challenges and prohibitions may cause the Company to discontinue its offering and use of such clauses. From time to time, the Company is involved in legal actions challenging its arbitration clause. Bills may be periodically introduced in Congress to directly or indirectly prohibit the use of pre-dispute arbitration clauses. The Company is also involved, from time to time, in other reviews, investigations and proceedings (both formal and informal) by governmental agencies regarding the Company’s business including, among other matters, consumer regulatory, accounting, tax and other operational In accordance with applicable accounting guidance, the Company establishes an accrued liability for legal and regulatory matters when those matters present loss contingencies that are both probable and estimable. Litigation and regulatory There may be an exposure to loss in excess of any amounts accrued. The Company believes the estimate of the aggregate range of reasonably possible losses (meaning -122- loss exposure. Various aspects of the legal proceedings underlying the estimated range will change from time to time and actual results may vary significantly from the estimate. The Company’s estimated range noted above involves significant judgment, given the varying stages of the proceedings, the existence of numerous yet to be resolved issues, the breadth of the claims (often spanning multiple years and, in some cases, a wide range of business activities), unspecified damages and/or the novelty of the legal issues presented. The outcome of pending matters could adversely affect the Company’s reputation and be material to the Company’s consolidated financial condition, operating results and cash flows for a particular future period, depending on, among other things, the level of the Company’s income for such the 2015 Order. In connection with the 2020 Order, Discover is required to On March 8, 2016, a 20. Fair Value Measurements Fair value is defined as the price that would be received to sell an asset or paid to transfer a liability in an orderly transaction between market participants at the measurement date. ASC Topic 820, Fair Value Measurement, provides a three-level hierarchy for classifying the inputs to valuation techniques used to measure fair value of financial instruments
-123- The Company evaluates the classification of each fair value The Company’s assessment of the significance of a particular input to the fair value measurement in its entirety requires judgment and involves consideration of factors specific to the asset or liability. Furthermore, certain techniques used to measure fair value involve some degree of judgment and, as a result, are not necessarily indicative of the amounts the Company would realize in a current market exchange. Assets and Liabilities Measured at Fair Value on a Recurring Basis
(1)Derivative instrument carrying values in an asset or liability position are presented as part of other assets or accrued expenses and other liabilities, respectively, in the Company’s consolidated statements of financial condition. Available-for-Sale Investment Securities Investment securities classified as available-for-sale consist of U.S. Treasury and U.S. GSE securities and The Company validates the fair value estimates provided by pricing services primarily by -124- due diligence in understanding the procedures and techniques performed by the pricing services to derive fair value estimates. At December 31, Marketable Equity Securities The Company holds non-controlling equity positions in payment service entities that have actively traded stock and therefore have readily determinable fair values. The Company classifies these equity securities as Level 1, the fair value estimates of which are determined based on quoted share prices for the same securities. Derivative Financial Instruments The Company’s derivative financial instruments consist of interest rate swaps and foreign exchange forward contracts. These instruments are classified as Level 2 as their fair values are estimated using proprietary pricing models, containing certain assumptions based on readily observable market-based inputs, including interest rate curves, option volatility and foreign currency forward and spot rates. In determining fair values, the pricing models use widely accepted valuation techniques, including discounted cash flow analysis on the expected cash flows of each derivative. This analysis reflects the contractual terms of the derivatives, including the period to maturity and the observable market-based inputs. The fair values of the interest rate swaps are determined using the market standard methodology of netting the discounted future fixed cash receipts (or payments) and the discounted expected variable cash payments (or receipts). The variable cash payments are based on an expectation of future interest rates derived from the observable market interest rate curves. The Company considers collateral and master netting agreements that mitigate credit exposure to counterparties in determining the counterparty credit risk valuation adjustment. The fair values of the currency instruments are valued by comparing the contracted forward exchange rate pertaining to the specific contract maturities to the current market exchange rate. The Company validates the fair value estimates of interest rate swaps primarily through comparison to the fair value estimates computed by the counterparties to each of the derivative transactions. The Company evaluates pricing variances In October 2020, the Company revised its valuation methodology to reflect changes made by central clearinghouses that changed the discounting methodology and interest calculation of cash variation margin from Federal Funds Overnight Index Swap (“OIS”) to SOFR OIS for U.S. Dollar cleared interest rate swaps. The Company’s revised valuation methodology results in valuations for cleared interest rate swaps that better reflect cleared swap prices obtainable in the markets in which the Company transacts. Pursuant to ASC Topic 848, the Company has elected and applied certain optional expedients and exceptions that provide contract modification and hedge accounting relief to eligible interest rate swaps affected by the change in the discounting methodology. The changes in valuation methodology are applied prospectively as a change in accounting estimate and are immaterial to the Company’s financial statements. Assets and Liabilities Measured at Fair Value on a Non-Recurring Basis The Company also has assets that, under certain conditions, are subject to measurement at fair value on a non-recurring basis. These assets include those associated with acquired businesses, including -125- Financial Instruments Measured at Other Than Fair Value
The following tables disclose the estimated fair value of the Company’s financial assets and financial liabilities that are not required to be carried at fair value (dollars in millions):
-126-
(1) The carrying values of these assets and liabilities approximate fair value due to their short-term nature. (2) Accrued interest receivable and payable carrying values are presented as part of other assets and accrued expenses and other liabilities, respectively, in the Company’s consolidated statements of financial condition. (3) Excludes deposits without contractually defined maturities for all periods presented. 21. Derivatives and Hedging Activities The Company uses derivatives to manage its exposure to various financial risks. The Company does not enter into derivatives for trading or speculative purposes. Certain derivatives used to manage the Company’s exposure to foreign currency are not designated as hedges and do not qualify for hedge accounting. Derivatives may give rise to counterparty credit risk, which generally is All derivatives are recorded in other assets at their gross positive fair values and in accrued expenses and other liabilities at their gross negative fair values. See Note 20: Fair Value Measurements for a description of the valuation methodologies offsets to the associated derivatives balances recorded in other assets or in accrued expenses and other liabilities. Other cash collateral posted and held balances are recorded in other assets and deposits, respectively, in the -127- consolidated statements of financial condition. Collateral amounts recorded in the consolidated statements of financial condition are based on the net collateral posted or held position for each applicable legal entity’s master netting arrangement with each counterparty. Derivatives Designated as Hedges Derivatives designated and qualifying as a hedge of the exposure to variability in expected future cash flows arising from changes in interest rates, or other types of forecasted transactions, are considered cash flow hedges. Derivatives designated and qualifying as a hedge of the exposure to changes in the fair value of an asset, liability, or firm commitment attributable to a particular risk, such as interest rate risk, are considered fair value hedges. Cash Flow Hedges The Company uses interest rate swaps to manage its exposure to variability in cash flows related to changes in interest rates The change in the fair value of derivatives designated as cash flow hedges is recorded in OCI and is subsequently reclassified into earnings in the period that the hedged forecasted cash flows affect earnings. Amounts reported in AOCI related to derivatives at December 31, Fair Value Hedges The Company is exposed to changes in the fair value of its fixed-rate debt obligations due to changes in interest rates. The Company uses interest rate swaps to manage its exposure to changes in fair value of certain fixed-rate long-term borrowings, including securitized debt and bank notes, attributable to changes in Derivatives Not Designated as Hedges Foreign Exchange Forward Contracts The Company has foreign exchange forward contracts that are economic hedges and are not designated as accounting hedges. The Company enters into foreign exchange forward contracts to manage foreign currency risk. Changes in the fair value of these contracts are recorded in other income on the consolidated statements of income. Derivatives Cleared Through an Exchange -128- Derivatives Activity The following table summarizes the fair value (including accrued interest) and outstanding notional amounts of derivative instruments and related collateral balances (dollars in millions):
(2)The foreign exchange forward contracts have notional amounts of EUR 6 million, GBP 6 million, SGD 1 million, INR 788 million and AUD 2 million as of December 31, 2022, and notional amounts of EUR 6 million, GBP 6 million, SGD 1 million, INR 788 million and AUD 14 million as of December 31, 2021. (3)In addition to the derivatives disclosed in the table, the Company enters into forward contracts to purchase when-issued mortgage-backed securities as part of its community reinvestment initiatives. At December 31, 2022, the Company had one outstanding contract with a total notional amount of $48 million and an immaterial fair value. At December 31, 2021, the Company had one outstanding contract with a total notional amount of $50 million and an immaterial fair value. (4)Collateral amounts, which consist of cash and investment securities, are limited to the related derivative asset/liability balance and do not include excess collateral received/pledged. The following amounts were recorded on the statements of financial condition related to cumulative basis adjustments for fair value hedges (dollars in millions):
(1)The balance includes $28 million and $48 million of cumulative hedging adjustments related to discontinued hedging relationships as of December 31, 2022 and 2021, respectively.
-129-
For the impact of the derivative instruments on OCI, see Note 13: Accumulated Other Comprehensive Income. -130- Collateral Requirements and Credit-Risk Related Contingency Features The Company has master netting arrangements and minimum collateral posting thresholds with its counterparties for its fair value and cash flow hedge interest rate swaps and foreign exchange forward contracts. The Company has not sought a legal opinion in relation to the enforceability of its master netting arrangements and, as such, does not report any of these positions on a net basis. Collateral is required by either the Company or its subsidiaries or the counterparty depending on the net fair value position of The Company also has agreements with certain of its derivative counterparties that contain a provision 22. Segment Disclosures The Company •Digital Banking: The Digital Banking segment includes Discover-branded credit cards issued to individuals on the Discover Network and other consumer products and services, including private student loans, personal loans, home loans and other consumer lending and deposit products. The majority of Digital Banking revenues relate to interest income earned on the segment’s loan products. Additionally, the Company’s credit card products generate substantially all revenues related to discount and interchange, protection products and loan fee income.
The business segment reporting provided to and used by the Company’s chief operating •The Company aggregates operating segments when determining reportable segments. •Corporate overhead is not allocated between segments; all corporate overhead is included in the •Through its operation of the Discover Network, the •The Company’s assets •The revenues of each segment are derived from external sources. The segments do not earn revenue from intercompany sources. •Income taxes are not specifically allocated between the operating segments in the information reviewed by the Company’s chief operating decision maker.
-131- The following table presents segment data (dollars in millions):
-132-
ASC Topic 606, Revenue from Contracts with Customers (“ASC 606”), generally applies to the sales of any good or service for which no other specific accounting guidance is provided. ASC 606 defines a principles-based model under which revenue from a contract is allocated to the distinct performance obligations within the contract and recognized in income as each performance obligation is satisfied. The Company’s revenue that is subject to this model includes discount and interchange, protection products fees, transaction processing revenue and certain amounts classified as other income. The following table presents revenue from contracts with customers disaggregated by business segment and reconciles revenue from contracts with customers to total other income (dollars in millions):
(1) Net of rewards, including Cashback Bonus rewards, of $3.0 billion, $2.5 billion and $1.9 billion for the years ended December 31, 2022, 2021 and 2020, respectively.
For a detailed description of the Company’s significant revenue recognition accounting policies, see Note 2: Summary of Significant Accounting Policies. -133- 24.Related Party Transactions In the ordinary course of business, the Company offers consumer financial products to its directors, executive officers and certain members of their families. These products are offered on substantially the same terms as those prevailing at the time for comparable transactions with unrelated parties and these receivables are included in the loan receivables in the Company’s consolidated statements of financial condition. They were not material to the Company’s financial position or results of operations. 25.Parent Company Condensed Financial Information The following Parent Company financial statements are provided in accordance with SEC rules, which require such disclosure when the restricted net assets of consolidated subsidiaries exceed 25% of consolidated net assets. Discover Financial Services (Parent Company Only) Condensed Statements of Financial Condition
(1)The Parent Company had $3.1 billion and $3.0 billion in a money market deposit account at Discover Bank as of December 31, 2022 and 2021, respectively, which is included in cash and cash equivalents. These funds are available to the Parent for liquidity purposes.
Discover Financial Services (Parent Company Only) Condensed Statements of Comprehensive Income
-135- Discover Financial Services (Parent Company Only) Condensed Statements of Cash Flows
(1)Subsequent to the issuance of the audited financial statements for the year ended December 31, 2021, the Company identified an immaterial classification error within cash flows (used for)/provided by investing activities. The correction of this error had no impact on the net cash (used for)/provided by investing activities. Management has evaluated the materiality of this misstatement and concluded it was not material to the prior period.
-136- 26. Subsequent Events The Company has evaluated events and transactions that have occurred subsequent to December 31, -137-
Glossary of Acronyms
-138-
None. Item 9A. Controls and Procedures Evaluation of Disclosure Controls and Procedures Under the supervision and with the participation of our management, including our Chief Executive Officer and Chief Financial Officer, we conducted an evaluation of the effectiveness of our disclosure controls and procedures (as defined in Rule 13a-15(e) and 15d-15(e) of the Securities Exchange Act of 1934, as amended (the “Exchange Act”)), which are designed to ensure that information required to be disclosed by us in the reports that we file or submit under the Exchange Act is recorded, processed, summarized and reported within the time periods specified by the SEC’s rules and forms. Disclosure controls and procedures include, without limitation, controls and procedures designed to ensure that information required to be disclosed by us in the reports that we file or submit under the Exchange Act is accumulated and communicated to our management, including our Chief Executive Officer and Chief Financial Officer, as appropriate to allow timely decisions regarding required disclosure. Based on this evaluation, our Chief Executive Officer and Chief Financial Officer concluded that our disclosure controls and procedures were effective as of the end of the period covered by this report. Management’s Report on Internal Control over Financial Reporting Our management is responsible for establishing and maintaining adequate internal control over financial reporting (as such term is defined in Exchange Act Rule 13a-15(f) and 15d-15(f)) for the Company. Our internal control over financial reporting is designed to provide reasonable assurance regarding the reliability of financial reporting and the preparation of financial statements in accordance with generally accepted accounting principles. There are inherent limitations to the effectiveness of any system of internal control over financial reporting. These limitations include the possibility of human error, the circumvention or overriding of the system and reasonable resource constraints. Because of its inherent limitations, our internal control over financial reporting may not prevent or detect misstatements. Projections of any evaluation of effectiveness to future periods are subject to the risk that controls may become inadequate because of changes in conditions or that the degree of compliance with policies or procedures may deteriorate. Management assessed the effectiveness of our internal control over financial reporting as of December 31, The effectiveness of our internal control over financial reporting as of December 31, Changes in Internal Control over Financial Reporting Except for the implementation discussed above, there have been no changes in our internal control over financial reporting (as such term is defined in Exchange Act Rule 13a-15(f) and 15d-15(f)) that occurred during the period covered by this report that have materially affected, or are reasonably likely to materially affect, our internal control over financial reporting. Item 9B. Other Information None. Item 9C. Disclosure Regarding Foreign Jurisdictions that Prevent Inspections Not applicable. -139- Part III. Part III | Item 10. Directors, Executive Officers and Corporate Governance Information regarding our executive officers is included under the heading “Information About Our Executive Officers” in Item 1 of this annual report on Form 10-K. Information regarding our directors and corporate governance under the following captions in our proxy statement for our annual meeting of stockholders to be held on May “Corporate Governance — Information Concerning Nominees for Election as Directors” “Corporate Governance — Process for Nominating Directors — Shareholder Recommendations for Director Candidates” “Corporate Governance — Board Roles and Responsibilities — Board and Committee Meetings” Our Code of Ethics and Business Conduct applies to all directors, officers and employees, including our Chief Executive Officer and our Chief Financial Officer. You can find our Code of Ethics and Business Conduct on our internet site, www.discover.com. We will post any amendments to the Code of Ethics and Business Conduct and any waivers that are required to be disclosed by the rules of either the SEC or the New York Stock Exchange, on our internet site. Item 11. Executive Compensation Information regarding executive compensation under the following captions in our Proxy Statement is incorporated by reference herein. “Corporate Governance — Director Compensation” “Executive Compensation” “Compensation Discussion and Analysis” “ Item 12. Security Ownership of Certain Beneficial Owners and Management and Related Stockholder Matters Information
Information related to the beneficial ownership of our common stock is presented under the caption “Stock Ownership Information — Beneficial Ownership of Company Common Stock” in our Proxy Statement and is incorporated by reference herein. Item 13. Certain Relationships and Related Transactions, and Director Independence Information regarding certain relationships and related transactions, and director independence under the following captions in our Proxy Statement is incorporated by reference herein. “Other Matters — Certain Transactions” “Corporate Governance — Information Concerning Nominees for Election as Directors — Director Independence” Item 14. Principal Accounting Fees and Services Information regarding principal accounting fees and services is presented under the caption “Audit Matters” in our Proxy Statement and is incorporated by reference herein. -140- Part IV. Part IV | Item 15. Exhibits, Financial Statement Schedules (a) Documents filed as part of this Form 10-K: 1. Consolidated Financial Statements The consolidated financial statements required to be filed in this annual report on Form 10-K are listed below and appear on pages
| |||||||||||||||||||||||||||||||||||||||||||||||||||||||||||||||||||||||||||||||||||||||||||||||||||||||||||||||||||||||||||||||||||||||||||||||||||||||||||||||||||||||||||||||||||||||||||||||||||||||||||||||||||||||||||||||||||||||||||||||||||||||||||||||||||||||||||||||||||||||||||||||||||||||||||||||||||||||||||||||||||||||||||||||||||||||||||||||||||||||||||||||||||||||||||||||||||||||||||||||||||||||||||||||||||||||||||||||||||||||||||||||||||||||||||||||||||||||||||||||||||||||||||||||||||||||||||||||||||||||||||||||||||||||||||||||||||||||||||||||||||||||||||||||||||||||||||||||||||||||||||||||||||||||||||||||||||||||||||||||||||||||||||||||||||||||||||||||||||||||||||||||||||||||||||||||||||||||||||||||||||||||||||||||||||||||||||||||||||||||||||||||||||||||||||||||||||||||||||||||||||||||||||||||||||||||||||||||||||||||||||||||||||||||||||||||||||||||||||||||||||||||||||||||||||||||||||||||||||||||||||||||||||||||||||||||||||||||||||||||||||||||||||||||||||||||||||||||||||||||