UNITED STATES
SECURITIES AND EXCHANGE COMMISSION
Washington, D.C. 20549
Form 10-K
| | | | | |
| ☑ | |
þ | ANNUAL REPORT PURSUANT TO SECTION 13 OR 15(d) OF THE SECURITIES EXCHANGE ACT OF 1934 |
For the fiscal year ended January 28, 20182024
| | | | | |
| ☐ | |
o | TRANSITION REPORT PURSUANT TO SECTION 13 OR 15(d) OF THE SECURITIES EXCHANGE ACT OF 1934 |
For the transition period from to
Commission file number 001-33608
lululemon athletica inc.
(Exact name of registrant as specified in its charter)
| | | | | | | | |
| Delaware | | 20-3842867 |
| | |
Delaware | | 20-3842867 |
(State or other jurisdiction of
incorporation or organization)
| | (I.R.S. Employer
Identification Number)
|
| |
|
1818 Cornwall Avenue, Vancouver, British Columbia V6J 1C7
Vancouver, British Columbia
| V6J 1C7 | | (Address of principal executive offices) | | (Zip Code) |
Registrant's telephone number, including area code: (604) 732-6124
Securities registered pursuant to Section 12(b) of the Act:
| | | | | | | | | | | | | | |
| Title of each class | | Trading symbol(s) | | Name of each exchange on which registered |
| | |
Title of Each Class | | Name of Each Exchange on Which Registered |
| Common Stock, par value $0.005 per share | | LULU | | Nasdaq Global Select Market |
_______________________________________Indicate by check mark if the registrant is a well-known seasoned issuer, as defined in Rule 405 of the Securities Act. Yes þ☑ No o☐
Indicate by check mark if the registrant is not required to file reports pursuant to Section 13 ofor Section 15(d) of the Act. Yes o☐ No þ☑
Indicate by check mark whether the registrant (1) has filed all reports required to be filed by Section 13 or 15(d) of the Securities Exchange Act of 1934 during the preceding 12 months (or for such shorter period that the registrant was required to file such reports), and (2) has been subject to such filing requirements for the past 90 days. Yes þ☑ No o☐
Indicate by check mark whether the registrant has submitted electronically and posted on its corporate Website, if any, every Interactive Data File required to be submitted and posted pursuant to Rule 405 of Regulation S-T during the preceding 12 months (or for such shorter period that the registrant was required to submit and post such files). Yes þ☑ No o☐
Indicate by check mark if disclosure of delinquent filers pursuant to Item 405 of Regulation S-K is not contained herein, and will not be contained, to the best of registrant's knowledge, in definitive proxy or information statements incorporated by reference in Part III of this Form 10-K or any amendment to this Form 10-K. þ
Indicate by check mark whether the registrant is a large accelerated filer, an accelerated filer, a non-accelerated filer, a smaller reporting company, or an emerging growth company. See the definitions of "large accelerated filer," "accelerated filer," "smaller reporting company," and "emerging growth company" in Rule 12b-2 of the Exchange Act. (Check one): | | | | | | | | | | | | | | | | | | | | |
| Large Accelerated Filer | | ☑ | | Accelerated filer | | ☐ |
| | | | | | |
Large accelerated filer | | þ | | Accelerated filer | | o |
| Non-accelerated filer | | ☐ | | o (Do not check if a smaller reporting company)
| Smaller reporting company | | o☐ |
| Emerging growth company | | ☐ | | o | | | |
If an emerging growth company, indicate by check mark if the registrant has elected not to use the extended transition period for complying with any new or revised financial accounting standards provided pursuant to Section 13(a) of the Exchange Act. o☐
Indicate by check mark whether the registrant has filed a report on and attestation to its management's assessment of the effectiveness of its internal control over financial reporting under Section 404(b) of the Sarbanes-Oxley Act (15 U.S.C.7262(b)) by the registered public accounting firm that prepared or issued its audit report. ☑
If securities are registered pursuant to Section 12(b) of the Act, indicate by check mark whether the financial statements of the registrant included in the filing reflect the correction of an error to previously issued financial statements. ☐
Indicate by check mark whether any of those error corrections are restatements that required a recovery analysis of incentive-based compensation received by any of the registrant’s executive officers during the relevant recovery period pursuant to §240.10D-1(b). ☐
Indicate by check mark whether the registrant is a shell company (as defined in rule 12b-2 of the Act). Yes o☐ No þ☑
The aggregate market value of the voting stock held by non-affiliates of the registrant on July 28, 20172023 was approximately $4,703,000,000.$40,905,000,000. Such aggregate market value was computed by reference to the closing price of the common stock as reported on the Nasdaq Global Select Market on July 28, 2017.2023. For purposes of determining this amount only, the registrant has defined affiliates as including the executive officers, directors, and owners of 10% or more of the outstanding voting stock of the registrant on July 28, 2017.2023.
Common Stock:
At March 21, 201815, 2024 there were 125,679,588120,892,132 shares of the registrant's common stock, par value $0.005 per share, outstanding.
Exchangeable and Special Voting Shares:
At March 21, 2018,15, 2024, there were outstanding 9,776,4215,115,961 exchangeable shares of Lulu Canadian Holding, Inc., a wholly-owned subsidiary of the registrant. Exchangeable shares are exchangeable for an equal number of shares of the registrant's common stock.
In addition, at March 21, 2018,15, 2024, the registrant had outstanding 9,776,4215,115,961 shares of special voting stock, through which the holders of exchangeable shares of Lulu Canadian Holding, Inc. may exercise their voting rights with respect to the registrant. The special voting stock and the registrant's common stock generally vote together as a single class on all matters on which the common stock is entitled to vote.
DOCUMENTS INCORPORATED BY REFERENCE
Portions of the Proxy Statement for the 20182024 Annual Meeting of Stockholders have been incorporated by reference into Part III of this Annual Report on Form 10-K.
TABLE OF CONTENTS
| | | | | | | | |
| | Page |
| | Page |
| | |
| Item 1. | | |
| Item 1A. | | |
| Item 1C. | | |
| Item 2. | | |
| Item 3. | | |
| Item 4. | | |
| | |
| | |
| Item 5. | | |
| Item 6. | | |
| Item 7. | | |
| Item 7A. | | |
| Item 8. | | |
| | |
| Item 9A. | | |
| Item 9B. | | |
| Item 9C. | | |
| | |
| | |
| Item 10. | | |
| Item 11. | | |
| Item 12. | | |
| Item 13. | | |
| Item 14. | | |
| | |
| | |
| Item 15. | | |
| Item 16. | | |
| |
PART I
Special Note Regarding Forward-Looking Statements
This report and some documents incorporated herein by reference include estimates, projections, statements relating to our business plans, objectives, and expected operating results that are "forward-looking statements" within the meaning of the Private Securities Litigation Reform Act of 1995, Section 27A of the Securities Act of 1933 and Section 21E of the Securities Exchange Act of 1934. We use words such as "anticipates," "believes," "estimates," "may," "intends," "expects," and similar expressions to identify forward-looking statements. Discussions containing forward-looking statements may be found in the material set forth under "Business", "Management's Discussion and Analysis of Financial Condition and Results of Operations", and in other sections of the report. All forward-looking statements are inherently uncertain as they are based on our expectations and assumptions concerning future events. Any or all of our forward-looking statements in this report may turn out to be inaccurate. We have based these forward-looking statements largely on our current expectations and projections about future events and financial trends that we believe may affect our financial condition, results of operations, business strategy, and financial needs. They may be affected by inaccurate assumptions we might make or by known or unknown risks and uncertainties, including the risks, uncertainties and assumptions described in the section entitled "Item 1A. Risk Factors" and elsewhere in this report. In light of these risks, uncertainties and assumptions, the forward-looking events and circumstances discussed in this report may not occur as contemplated, and our actual results could differ materially from those anticipated or implied by the forward-looking statements. All forward-looking statements in this report are made as of the date hereof, based on information available to us as of the date hereof, and we assume no obligation to update any forward-looking statement.
This annual report includes website addresses and references to additional materials found on those websites. These websites and information contained on or accessible through these websites are not incorporated by reference into, and do not form a part of, this Annual Report or any other report or document we file with the SEC, and any references to any websites are intended to be inactive textual references only. ITEM 1. BUSINESS
General
lululemon athletica inc. is principally a designer, distributor, and retailer of healthy lifestyle inspiredtechnical athletic apparel, footwear, and accessories. We have a missionvision to create transformationaltransformative products and experiences which enable people to live a life they love,that build meaningful connections, unlocking greater possibility and have developed a brandwellbeing for those pursuing an active, mindful lifestyle.all. Since our inception, we have fostered a distinctive corporate culture; we promote a set of core values in our business which include taking personal responsibility, nurturing entrepreneurial spirit, acting with honesty and courage, valuing connection and inclusion, and choosing to have fun. These core values attract passionate and motivated employees who are driven to achieve personal and professional goals, and share our purpose of "elevating the world through the power of practice."to elevate human potential by helping people feel their best."
In this Annual Report on Form 10-K ("10-K" or "Report") for the fiscal year ended January 28, 2018 ("fiscal 2017"),2024, lululemon athletica inc. (together with its subsidiaries) is referred to as "lululemon," "the Company," "we," "us""us," or "our." We refer to the fiscal year ended January 28, 2024 as "2023," the fiscal year ended January 29, 2023 as "2022," and the fiscal year ended January 30, 2022 as "2021." Our next fiscal year ends on February 2, 2025 and is referred to as "2024."
Components of this discussion of our business include:
Our Products
Our healthy lifestyle inspired athletic apparel and accessories are marketed under the lululemon and ivivva brand names. We offer a comprehensive line of performance apparel, footwear, and accessories for women, men and female youth.marketed under the lululemon brand. Our apparel assortment includes items such as pants, shorts, tops, and jackets designed for a healthy lifestyle and including
athletic activities such as yoga, running, training, and most other sweaty pursuits.activities. We also offer fitness-related accessories, including items such as bags, socks, underwear, yoga matsapparel designed for being on the move and equipment, and water bottles.fitness-inspired accessories. We expect to continue to broaden our merchandise offerings through expansion across these product areas.
Our design and development team continues to source technically advanced fabrics, with new feel and fit, and craft innovative functional features for our products. Through our vertical retail strategy and direct connection with our customers, whom we refer to as guests, we are able to collect feedback and incorporate unique performance and fashion needs into our design process. In this way, we believe we solve problems forare better positioned to address the needs of our guests, helping us advance our product lines and differentiate us from the competition.our competitors.
Although we benefit from the growing numberDuring 2023, our women's range represented 64% of people that participate in yoga, we believe the percentagenet revenue and our men's range represented 23% of our products sold for other activities will continue to increase as we broaden our product range.
net revenue. Our Market
Our guests seek a combination of performance, style, and sensation in their athletic apparel, choosing products that allow them to feel great however they exercise. Since consumer purchase decisions are driven by both an actual need for functional products and a desire to live a particular lifestyle, we believe the credibility of our brand and the authentic community experiences we offer expand our potential market beyond just athletes to those who pursue an active, mindful, and balanced life.
Although our primary and largest customer group is made up of women, we also design a comprehensive men's line and haveis a targeted strategy in place to servekey pillar of our male guests. Our businessstrategic growth plans. We believe net revenue from our men's range is growing as more menguests discover the technical rigor and premium quality of our men's products, and are attracted by our distinctive brand.
North AmericaWe continue to innovate and introduce new products for our guests. This includes introducing new product categories and expanding our accessories assortment. We believe this is another way in which we can attract new guests and enable them to experience our largest market by geographical split, offering a mature health and wellness industry and sophisticated consumer. Additionally, we are expanding internationally across Europe (including the United Kingdom and Germany) and Asia Pacific (including China, South Korea, and Japan). We are expandingproducts. Net revenue from our other product categories represented 13% of net revenue in these regions via a decentralized model, allowing for local community insight and consumer preference to inform our strategic expansion.2023.
Our Segments
We primarily conduct our business through two channels: company-operated storesMarkets and direct to consumer.
We also generate net revenue from outlets, sales from temporary locations, sales to wholesale accounts, showrooms, warehouse sales, and license and supply arrangements. The net revenue we generate from these sources is combined in our other segment.Segments
We operate in bothover 25 countries around the physicalworld and digital spaceorganize our operations into four regional markets: Americas, China Mainland, Asia Pacific ("APAC"), and Europe and the Middle East ("EMEA").
We report three segments, Americas, China Mainland, and Rest of World, which is comprised of the APAC and EMEA regions on a combined basis.
During the fourth quarter of 2023, we revised the financial information which our Chief Executive Officer, who is our chief operating decision maker ("CODM"), uses to better caterevaluate performance and allocate resources. This resulted in a change in our identified operating segments. As we have further executed on our omni-channel retail strategy, and continued to the shopping desires ofexpand our guest. At the end of fiscal 2017, we had 404 storesoperations in 12 countries across the globe. In addition to being a venue to sell product,international markets, our stores give us a direct connection to our guest, which we view as a valuable tool in helping us build our brandperformance reviews and product line.
Our direct to consumer segment includes the net revenue which we generate from our e-commerce website www.lululemon.com, other country and region specific websites, and mobile apps, including mobile apps on in-store devices that allow demandresource allocation decisions have evolved to be fulfilled viamade on a regional market basis. Our segment results have been recast to reflect our distribution centers.regional market-based structure. Historically, our segments were based on selling channel. We continue to monitor our revenue performance by our selling channels which are further described below.
Segment information is included in Note 19We operate an omni-channel retail model and aim to efficiently and effectively serve our audited consolidated financial statements included in Item 8 of Part II of this report.
Company-Operated Stores
As of January 28, 2018, our retail footprint included 404 company-operated stores. While most of our company-operated stores are branded lululemon, seven of our company-operated stores are branded ivivva and specialize in athletic wear for female youth. Our retail stores are located primarily on street locations, in lifestyle centers, and in malls.
Our company-operated stores by brand, and by country, as of January 28, 2018 and January 29, 2017, are summarizedguests in the table below:
|
| | | | | | |
| | | January 28,
2018 | | January 29,
2017 |
| lululemon | | | | |
United States(1) | | 270 |
| | 246 |
|
| Canada | | 57 |
| | 51 |
|
| Australia | | 28 |
| | 27 |
|
China(2) | | 15 |
| | 6 |
|
| United Kingdom | | 9 |
| | 9 |
|
| New Zealand | | 6 |
| | 5 |
|
| Singapore | | 3 |
| | 3 |
|
| South Korea | | 3 |
| | 2 |
|
| Germany | | 2 |
| | 1 |
|
| Japan | | 2 |
| | — |
|
| Ireland | | 1 |
| | — |
|
| Switzerland | | 1 |
| | 1 |
|
| | | 397 |
| | 351 |
|
| ivivva | | | | |
| United States | | 4 |
| | 42 |
|
| Canada | | 3 |
| | 13 |
|
| | | 7 |
| | 55 |
|
| Total | | 404 |
| | 406 |
|
__________
| |
(1)
| Included within the United States as of January 28, 2018 and January 29, 2017, was one company-operated store in the Commonwealth of Puerto Rico. |
| |
(2)
| Included within China as of January 28, 2018, were three company-operated stores in the Hong Kong Special Administrative Region and one company-operated store in the Taiwan Province. As of January 29, 2017, there were three company-operated stores in the Hong Kong Special Administrative Region and no company-operated stores in the Taiwan Province. |
We opened 46 net new lululemon branded company-operated stores in fiscal 2017, including 16 net new stores outside of North America.
We perform ongoing evaluations of our portfolio of company-operated store locations. In fiscal 2017, we closed three of our lululemon branded company-operated stores, and on August 20, 2017, as part of the restructuring of our ivivva operations, we closed 48 of our 55 ivivva branded company-operated stores. The seven remaining ivivva branded stores remain in operation and are not expectedways most convenient to close. As we continue our evaluation we may, in future periods, close or relocate additional company-operated stores.
In fiscal 2018, our new store growth will come primarily from new company-operated stores in the United States and an acceleration in our company-operated store openings in Asia. Our real estate strategy over the next several years will not only consist of opening new company-operated stores, but also in overall square footage growth through store expansions and relocations.
We believe that our innovative retail concept and guest experience contribute to the success of our stores. During fiscal 2017, our company-operated stores open at least one year, which average approximately 3,012 square feet, averaged sales of $1,554 per square foot. The square footage of our company-operated stores excludes space used for non-retail activities such as yoga studios and office space.
Direct to Consumer
Direct to consumer is a substantial part of our business, representing approximately 21.8% of our net revenue in fiscal 2017. We believe that e-commerce is convenient for our core customer and enhances the image of our brand. Our direct to consumer channel makes our product accessible to more markets than our company-operated store channel alone. We believe this channel is effective in building brand awareness, especially in new markets.
them. We continue to evolve and integrate our digital and physical channels in order to enrich our interactions with our guests, and to provide an enhanceda seamless omni-channel experience. We have invested in technologies which enable our omni-channel retailing model. Our capabilities differ by market and include:
Other Channels•Buy online pick-up in store - guests can purchase our products via our website or digital app and then collect that product from a retail location;
Other•Back-back room - our store educators can access inventory located at our other locations and have product shipped directly to a guest's address or a store;
•Ship from store – we are able to fulfill e-commerce orders by accessing inventory at both our distribution centers and at our retail locations, expanding the pool of accessible inventory;
•Returns processing – e-commerce guests are able to return products either online or in-store; and
•One inventory pool – we are able to view and allocate the product held at our distribution centers to either our physical retail locations, or make it available to fulfill online demand.
We operate a combination of physical retail locations and e-commerce services via our websites, other region-specific websites, digital marketplaces, and mobile apps. Our physical retail locations remain a key part of our growth strategy and we view them as a valuable tool in helping us build our brand and product line as well as enabling our omni-channel capabilities. We plan to continue to expand square footage and open new company-operated stores to support our growth objectives.
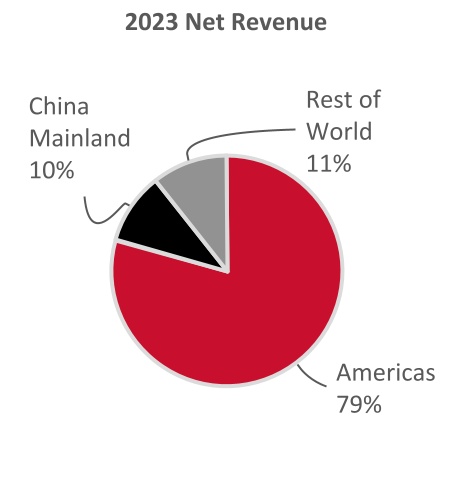
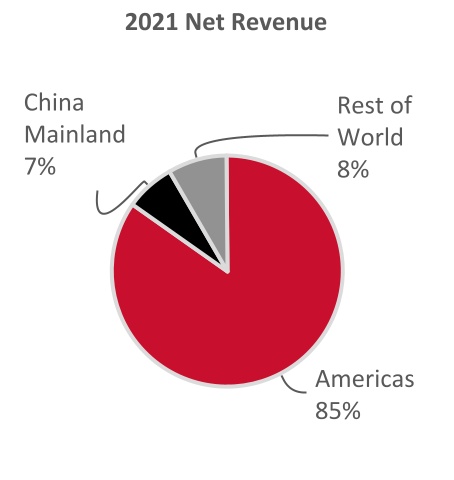
Americas
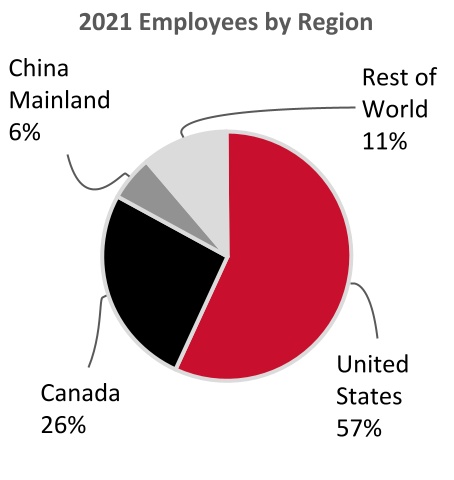
We have operated in the Americas for over 25 years. We opened our first ever store in Vancouver, Canada in 1998. In 2023, the net revenue accounted for 8.9%we generated in the Americas represented 79% of our total net revenue.
| | | | | | | | | | | | | | | | | | | | |
| | 2023 | | 2022 | | 2021 |
| | (In thousands) |
| Net revenue | | $ | 7,631,647 | | | $ | 6,817,454 | | | $ | 5,299,906 | |
| | | | | | |
| Net revenue growth | | 11.9 | % | | 28.6 | % | | 40.3 | % |
Our operations in the Americas are core to our business and we aim to continue to grow our net revenue in fiscal 2017, comparedthis market through ongoing product innovation and by building brand awareness. We also plan to 8.0%continue to invest in fiscal 2016,our omni-channel capabilities, to open new retail locations, and 6.9% of totalto relocate, optimize, and renovate our existing locations as needed.
We generate net revenue in the Americas through our lululemon branded retail locations which include different sizes of company-operated stores, outlets, pop-ups, other temporary locations, and stores operated by a third-party under a supply and license agreement in Mexico. We also serve our guests via our e-commerce website www.lululemon.com, our mobile app, our “Like New” re-commerce program, and through certain wholesale arrangements including certain yoga and fitness studios, university campus retailers, and other select partners.
China Mainland
We opened our first store in China Mainland in fiscal 2015. Other2014. In 2023, the net revenue we generated in China Mainland represented 10% of our total net revenue.
| | | | | | | | | | | | | | | | | | | | |
| | 2023 | | 2022 | | 2021 |
| | (In thousands) |
| Net revenue | | $ | 963,760 | | | $ | 576,503 | | | $ | 434,261 | |
| | | | | | |
| Net revenue growth | | 67.2 | % | | 32.8 | % | | 80.3 | % |
We have experienced significant net revenue growth in China Mainland and believe that as we continue to expand our operations and build our brand awareness, net revenue will continue to increase in this market. We believe China Mainland net revenue growth will drive an increase in our overall international net revenue. We plan to continue to invest in China Mainland and expect that the majority of our company-operated store openings in 2024 will be in this market.
We operate lululemon branded retail locations in China Mainland in a variety of different formats including different sizes of company-operated stores, outlets, pop-ups, and other temporary locations. We also serve our guests via our WeChat store and on third party marketplaces such as T-Mall and JD.com.
Rest of World
In 2023, the net revenue we generated in APAC and EMEA represented 11% of our total net revenue.
| | | | | | | | | | | | | | | | | | | | |
| | 2023 | | 2022 | | 2021 |
| | (In thousands) |
| Net revenue | | $ | 1,023,871 | | | $ | 716,561 | | | $ | 522,450 | |
| | | | | | |
| Net revenue growth | | 42.9 | % | | 37.2 | % | | 36.3 | % |
We have experienced significant net revenue growth in APAC and EMEA and intend to continue to invest in these markets to build brand awareness. Where we identify growth opportunities, we plan to open new retail locations, including in new markets across the EMEA and APAC regions.
We operate lululemon branded retail locations in these markets in a variety of different formats including different sizes of company-operated stores, outlets, pop-ups, and stores operated by third-parties under supply and license agreements in the Middle East and Israel. We also serve our guests via our country specific websites, our mobile app, and through third party regional marketplaces, such as Zalando, Lazada, and SSG.
Our Selling Channels
We conduct our business through a number of different channels in each market:
Company-operated stores: In addition to serving as a venue to sell our products, our stores give us a direct connection to our guests, which we view as a valuable tool in helping us build our brand and product lines as well as enabling our omni-channel capabilities. Our retail stores are located primarily on street locations, in lifestyle centers, and in malls. Our sales per square foot was $1,609, $1,580, and $1,443 for 2023, 2022, and 2021 respectively.
| | | | | | | | | | | | | | |
| Number of company-operated stores by market | | January 28, 2024 | | January 29, 2023 |
| United States | | 367 | | | 350 | |
| Canada | | 71 | | | 69 | |
| Americas | | 438 | | | 419 | |
| | | | |
| China Mainland | | 127 | | | 99 | |
| | | | |
| Australia | | 33 | | | 32 | |
| South Korea | | 19 | | | 16 | |
| Hong Kong SAR | | 9 | | | 9 | |
| Japan | | 8 | | | 7 | |
| New Zealand | | 8 | | | 8 | |
| Taiwan | | 8 | | | 7 | |
| Singapore | | 7 | | | 8 | |
| Malaysia | | 3 | | | 2 | |
| Macau SAR | | 2 | | | 2 | |
| Thailand | | 1 | | | — | |
| APAC | | 98 | | | 91 | |
| | | | |
| | | | | | | | | | | | | | |
| Number of company-operated stores by market | | January 28, 2024 | | January 29, 2023 |
| United Kingdom | | 20 | | | 20 | |
| Germany | | 9 | | | 10 | |
| France | | 6 | | | 4 | |
| Ireland | | 4 | | | 4 | |
| Spain | | 3 | | | 3 | |
| Netherlands | | 2 | | | 1 | |
| Sweden | | 2 | | | 2 | |
| Norway | | 1 | | | 1 | |
| Switzerland | | 1 | | | 1 | |
| EMEA | | 48 | | | 46 | |
| | | | |
| Total company-operated stores | | 711 | | | 655 | |
E-commerce: We believe e-commerce is convenient for our guests and also allows us to reach and serve guests in markets beyond where our physical retail locations are based. We believe this channel is effective in building brand awareness, especially in new markets. We serve our guests via our e-commerce websites, other country and region-specific websites, digital marketplaces, and mobile apps. E-commerce net revenue includes sales made throughour buy online pick-up in store, back-back room, and ship from store omni-channel retailing capabilities.
Other channels: We also use certain other distribution channels, generally with the following channels:goal of building brand awareness and providing broader access to our products. These other channels include:
Outlets and warehouse sales - We utilize outlets as well as physical warehouse sales, which are held from time to time, to sell slow moving inventory and inventory from prior seasons to retail customers at discounted prices.
•Temporary locations- Our temporary locations, including seasonal stores and pop-ups are typically opened for a short period of time enabling us to serve guests during peak shopping periods in markets in whichwhere we maydo not alreadyordinarily have a presence.
physical location, or to expand access in markets where we see high demand at our existing locations.•Wholesale - We sell to partners that offer convenient access for both core and new guests, including yoga and fitness studios, university campus retailers, and other select partners.
Wholesale•Outlets - We utilize outlets to sell slower moving inventory and inventory from prior seasons at discounted prices. As of January 28, 2024, we operated 47 outlets, the majority of which were in the Americas.
•Like New - Our wholesale accounts include premium yoga studios, health clubs,re-commerce program allows guests to exchange their gently used lululemon products for merchandise credit. Those products are then verified and fitness centers.quality checked before being resold online at likenew.lululemon.com. We believe these premium wholesale locations offer an alternative distribution channel thatthis program is convenient fora step towards a circular eco-system and helps reduce our core consumer and enhances the image of our brand. We do not intend wholesale to be a significant contributor to overall sales. Instead, we use the channel to build brand awareness, especially in new markets, including those outside of North America.
environmental footprint.Showrooms - Our showrooms are typically small locations that we open when we enter new markets and feature a limited selection of our product offering.
•License and supply arrangements- We enter into license and supply arrangements from time to time when we believe that it will be to our advantage to partner with companies and individualsthird parties with significant experience and proven success in certain target markets.
We Under these arrangements we have entered into license and supply arrangements with partners in the Middle East and Mexico which grant themgranted certain third parties the right to operate lululemon branded retail locations in the United Arab Emirates, Kuwait, Qatar, Oman, Bahrain, and Mexico. We retain the rights to sell lululemon products through our e-commerceon websites in thesespecific countries. Under these arrangements we supply the partners with lululemon products, training and other support. The initial term
| | | | | | | | | | | | | | |
| Number of retail locations operated by third parties by market | | January 28, 2024 | | January 29, 2023 |
| Mexico | | 15 | | | 12 | |
| United Arab Emirates | | 8 | | | 7 | |
| Saudi Arabia | | 6 | | | 3 | |
| Israel | | 3 | | | — | |
| Kuwait | | 3 | | | 1 | |
| Qatar | | 3 | | | 3 | |
| Bahrain | | 1 | | | — | |
| Total locations operated by third parties under license and supply arrangements | | 39 | | | 26 | |
Integrated Marketing
We believe that our brand awareness is relatively low, especially outside of the agreementAmericas, and also with our male guests. This represents an opportunity for the Middle East expires in January 2020,us and the initial term of the agreement for Mexico expires in November 2026. As of January 28, 2018, there were three licensed retail locations in the United Arab Emirates, one in Qatar, and one in Mexico, which are not included in the above company-operated stores table.
Community-Based Marketing
We utilizewe have a community-based approachmulti-faceted strategy to build brand awareness, affinity, and customerguest loyalty. We pursue a multi-facetedThis strategy which leveragesis designed to leverage owned and paid channels, our ambassador network, brand partners, events, and content – to drive awareness, consideration, engagement, conversion, and ultimately loyalty and engagement at the global, regional, and local teams and ambassadors, digital marketing and social media, in-store community boards, and a variety of grassroots initiatives. Our first global marketing campaign launched in fiscal 2017, and we plan to continue to explore how we complement and amplify our community-based initiatives with global brand-building activity.levels.
Product Design and Development
Our product design and development efforts are led by a team of researchers, scientists, engineers, and designers based in Vancouver, British Columbia, partnering with international designers. Our team is comprised of athletes and users of our products who embody our design philosophy and dedication to premium quality. Our design and development team identifies trends based on market intelligence and research, proactively seeks the input of our guests and our ambassadors, and broadly seeks inspiration consistent with our goals of function, style, and technical superiority.
As we strive to continue to provide our guests with technically advanced fabrics, our team works closely with our suppliers to incorporate the latest in technical innovation, bringing particular specifications to our products. We partner with independent inspection, verification, and testing companies, who conduct a variety of tests on our fabrics, testing performance characteristics including pilling, shrinkage, abrasion resistance, and colorfastness. We develop proprietary fabrics and collaborate with leading fabric and trims suppliers to manufacture fabrics and trims that we ultimatelygenerally seek to protect through agreements, trademarks, and as trade-secrets.
Sourcing and Manufacturing
We do not own or operate any manufacturing facilities. We rely on a limited number of suppliers to provide fabrics for, and to produce, our products. The following statistics are based on cost.
We work with a group of approximately 65 suppliers to provide the fabrics for our products. We work with a group of approximately 4749 vendors that manufacture our products, five of which produced approximately 64%55% of
our products in fiscal 2017.2023, with the largest manufacturer producing 17%. During fiscal 2017, no single manufacturer produced more than 25% of our product offerings. During fiscal 2017, approximately 53%2023, 42% of our products were manufactured in South East Asia, approximately 25%Vietnam, 16% in South Asia, approximatelyCambodia, 11% in Sri Lanka, 10% in China, approximatelyIndonesia, and 8% in the Americas,Bangladesh, and the remainder in other regions.
We work with a group of approximately 67 suppliers to provide the fabrics for our products. In 2023, 52% of our fabrics were produced by our top five fabric suppliers, with the largest manufacturer producing 19%. During 2023, 40% of our fabrics originated from Taiwan, 26% from China Mainland, and 12% from Sri Lanka, and the remainder from other regions.
We also source other raw materials which are used in our products, including items such as content labels, elastics, buttons, clasps, and drawcords from suppliers located predominantly in APAC and China Mainland.
We have developed long-standing relationships with a number of our vendors and take great care to ensure that they share our commitment to quality and ethics. We do not, however, have any long-term term contracts with the majority of our suppliers or manufacturing sources for the production and supply of our fabrics and garments, and we compete with other companies for fabrics, raw materials, and production. We require that all of our suppliers and manufacturers adhere to a vendor codeour Vendor Code of ethicsEthics regarding social and environmental sustainability practices. Our product quality and sustainability teams partner with leading inspectionclosely assess and verification firms to closely monitor each supplier's compliance with applicable laws and our vendor codeVendor Code of ethics.Ethics, including by partnering with leading inspection and verification firms.
Distribution Facilities
We operate and distribute finished products from our distribution facilities in the United States, Canada, and Australia. We own our distribution center in Columbus,Groveport, Ohio, and lease our other distribution facilities. The approximate square footage of each facility is included in Item 2 of Part I of this report. We also utilize third-party logistics providers in a number of countries in which we operate to warehouse and distribute finished products from their warehouse locations in Hong Kong, Rotterdam,locations. We regularly evaluate our distribution infrastructure and Shanghai.consolidate or expand our distribution capacity as we believe appropriate for our operations and to meet anticipated needs.
Competition
Competition in the athletic apparel industry is based principally on brand image and recognition as well as product quality, innovation, style, distribution, and price. We believe that we successfully compete on the basis of our premium brand image and our technical product innovation. We also believe our ability to introduce new product innovations, and combine function and fashion, and connect through in-store, online, and community experiences sets us apart from our competition. In
addition, we believe our vertical retail distribution strategy and community-based marketing differentiates us further, allowing us to more effectively control our brand image and connect with our guest.guests.
The market for athletic apparel is highly competitive. It includes increasing competition from established companies that are expanding their production and marketing of performance products, as well as from frequent new entrants to the market. We are in direct competition with wholesalers and direct sellers of athletic apparel and footwear, such as Nike, Inc., adidas AG, andPUMA, Under Armour, Inc., and Columbia Sportswear Company. We also compete with retailers specifically focused onwho have expanded to include women's athletic apparel including The Gap, Inc. (including the Athleta brand), Victoria's Secret with its sport and L Brands,lounge offering, and Urban Outfitters, Inc. (including the Victoria Sport assortment at Victoria's Secret).
Seasonality
Our business is affected by the general seasonal trends common to the retail apparel industry. Our annual net revenue is typically weighted more heavily toward our fourth fiscal quarter, reflecting our historical strength in sales during the holiday season in the Americas, while our operating expenses are generally more equally distributed throughout the year. As a result, a substantial portion of our operating profits are typically generated in the fourth quarter of our fiscal year. For example, we generated approximately 56%, 47%, and 45%43% of our full year operating profit during the fourth quartersquarter of fiscal 2017, fiscal 2016,2023.
Human Capital
Our Impact Agenda sets out our social and fiscal 2015, respectively. Excludingenvironmental goals and strategy across three pillars - Be Human, Be Well, and Be Planet. Details can be found in our Impact Report on our website (https://corporate.lululemon.com/our-impact).
Included within our Impact Agenda is a goal to invest a total of $75.0 million to advance equity in well-being by the costsend of 2025. As of January 28, 2024, we incurred in connection with the ivivva restructuring, we generated approximately 51%have invested a total of $44.8 million(1) towards this goal.
The Be Human pillar of our operating profit duringImpact Agenda sets out our focus areas with respect to human capital, including:
•Inclusion, Diversity, Equity, and Action (“IDEA”);
•Employee empowerment; and
•Fair labor practices and the fourth quarterwell-being of fiscal 2017.the people who make our products.
Inclusion, Diversity, Equity and Action
We believe IDEA is fundamental for shaping and building our company, industry, and communities, and for creating a shared sense of respect and belonging. By continuously striving to be an inclusive, diverse, and equitable organization, we aim to reflect a variety of perspectives and meet the needs of the global communities we serve. We are proud that as of January 28, 2024, approximately 50% of our board of directors, 70% of our senior executive leadership team, and 50% of our vice presidents and above are women, while approximately 75% of our overall workforce are women.(2)
(1) We have contributed $44.8 million to lululemon's Centre for Social Impact, $32.4 million of which has been contributed directly to social impact organizations. The remaining $12.4 million primarily consists of contributions toward a donor-advised fund for future grant making.
(2) While we track male and female genders, we acknowledge this is not fully encompassing of all gender identities.
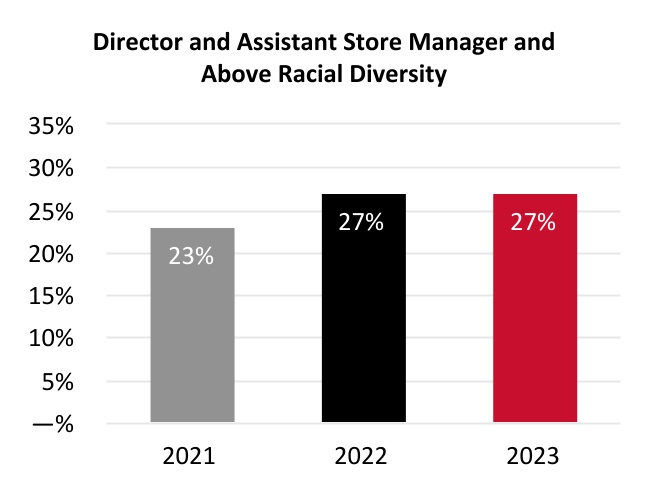
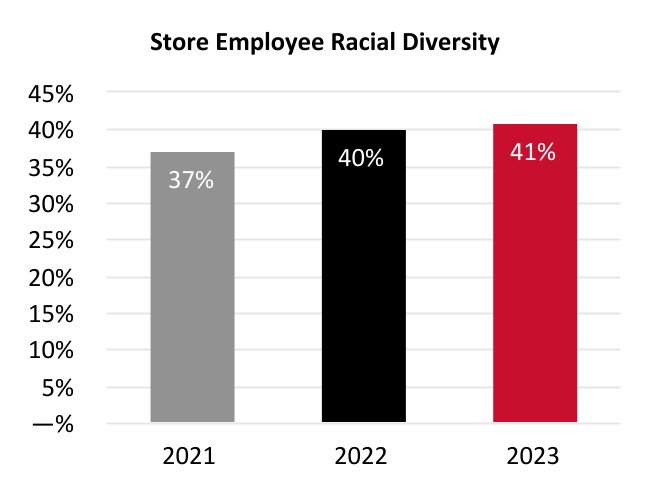
We use an annual voluntary global survey to help us understand the demographics of our employee base and provide us with access to tangible metrics to help us understand our employees’ sense of inclusion and belonging.(3) In 2023, the participation rate was approximately 85%. Our Employeesoverall goal is to reflect the racial diversity(4) of the communities we serve and in which we operate.
We seek to maintain 100% gender pay equity within our entire global employee population, meaning equal pay for equal work across genders, by geography. We have achieved full pay equity, including gender and race, in the United States, which is the only country where we currently collect individually attributable race data.
We offer all employees IDEA education, training, and guided conversations on a variety of topics, including anti-racism, anti-discrimination, and inclusive leadership behaviors. We have established People Networks, which are employee resource groups for employees who have marginalized and historically underrepresented identities. We see significant engagement in IDEA education and training across our global employee base. We aim to foster a culture of inclusion by making IDEA part of our everyday conversation, and frequently review our policies, programs, and practices to identify ways to be more inclusive and equitable.
Employee Empowerment
We believe that our people are key to the success of our business, andbusiness. As of January 28, 2024 we employed approximately 38,000 people worldwide. We strive to foster a distinctive corporate culture rooted in our core business values which attractthat attracts and retains passionate and motivated employees who are driven to achieve personal and professional goals. We believe our people succeed because we create an environment that fosters growth and is diverse and equitable.
As of January 28, 2018, we had approximately 13,400 employees, of which approximately 7,900 were employed in the United States, approximately 3,800 were employed in Canada, and approximately 1,700 were employed outside of North America. None
(3) The voluntary demographic survey results presented above relate to all of our employees in the Americas, Europe, Australia, and New Zealand.
(4) "Racial diversity" is used to measure the non-white population.
We assess our performance and identify opportunities for improvement through an annual employee engagement survey. In 2023, the participation rate was approximately 85% and our employee engagement score exceeded the retail industry average.(5) Our engagement score suggests our people are currently covered byproud to work for lululemon, they are motivated to contribute to work that aligns with their purpose, and they recommend lululemon as a great place to work.
We understand that health and wealth programs need to offer choice at all stages of life. Our current offerings support our goal of becoming the number one place where people come to develop and grow as inclusive leaders, and we regularly use feedback to inform opportunities to support this goal. These offerings include, among other things:
•Competitive compensation which rewards exceptional performance;
•A Fund your Future program for eligible employees which offers partial contribution matches to a pension plan and employee share purchase plan;
•An annual paid VALUES (Volunteer, Awareness, Life, Unity, Empowerment, Support) Day, competitive paid time off, and sick leave;
•An employee discount program, which includes a lifetime discount to celebrate the contribution of our long-tenured employees to keep them within our collective, bargaining agreement. Weeven when they have had no labor-related work stoppages bymoved on to pursue goals outside of lululemon;
•Reimbursement programs which reward physical activity;
•A parenthood program which is a gender-neutral benefit that provides all eligible employees up to six months of paid leave;
•An employee assistance program which provides free confidential support to all our employees and their families in a variety of areas from mental well-being to financial services to advice for new parents; and
•Training and development of all of our employees including, but not limited to, mentorship programs, IDEA internships, leadership development, vision and goals, and coaching.
Fair Labor Practices and the Well-Being of the People who Make our Products
We work with suppliers who we believe share our relationsvalues and collaborate with us to uphold robust standards, address systemic challenges, and support the well-being of people who make our employeesproducts. Our Responsible Supply Chain program is built on three pillars:
•Monitoring - Assessing and improving working conditions in factories.
•Integration - Integrating responsible purchasing practices across enterprise strategies, processes, and tools.
•Collaboration - Working with multi-stakeholder organizations, industry, suppliers, and brands to support systemic change and impact.
Our Vendor Code of Ethics outlines our commitment to respect human and labor rights, and promote safe and fair working conditions for people in our supply chain. The code, which is based on international standards, sets the minimum standards for our supplier partners and is a component of our supplier and manufacturer agreements. Our finished goods and fabric suppliers are excellent.assessed against the Vendor Code of Ethics prior to forming a business relationship, and regularly thereafter; we work with factories that can uphold our strict requirements.
Our Foreign Migrant Worker Standard sets out our minimum requirements for what we believe are the appropriate and ethical recruitment, employment, and repatriation of foreign migrant workers.
Intellectual Property
We have trademark rights on mostmany of our products and believe having distinctive marks that are readily identifiable is an important factor in building our brand image and in distinguishing our products from the products of others. We consider our lululemon and wave design trademarks to be among our most valuable assets. In addition, we own many other trademarks for
the names of several of our brands, slogans, fabrics and products. We own registered and pending U.S. and foreign utility and design patents, industrial designs in Canada, and registered community designs in Europe that protect our product innovations, distinctive apparel, and accessory designs.
(5) Based on an industry benchmark provided by the third party that administers this survey to our employees.
Securities and Exchange Commission Filings
Our website address is www.lululemon.com. We provide free access to various reports that we file with, or furnish to, the United States Securities and Exchange Commission, or the SEC, through our website, as soon as reasonably practicable after they have been filed or furnished. These reports include, but are not limited to, our annual reports on Form 10-K, quarterly reports on Form 10-Q, current reports on Form 8-K, and any amendments to those reports. Our SEC reports can also be accessed through the SEC's website at www.sec.gov. The public may read and copy any materials filed by us with the SEC at the SEC's Public Reference Room at 100 F Street, NE, Washington, DC 20549. The public may obtain information on the operation of the Public Reference Room by calling the SEC at 1-800-SEC-0330. Also available on our website are printable versions of our Global Code of Business Conduct and Ethics and charters of the Audit, Compensation, and Nominating and Governance Committeesstanding committees of our board of directors. Information contained on or accessible through our websitewebsites is not incorporated into, and does not constituteform a part of, this annual report on Form 10-KAnnual Report or any other report or document we file or furnish with the SEC.SEC, and any references to our websites are intended to be inactive textual references only.
ITEM 1A. RISK FACTORS
In addition to the other information contained in this Form 10-K, the following risk factors should be considered carefully in evaluating our business. Our business, financial condition, or results of operations could be materially adversely affected byas a result of any of these risks. Please note that additional risks not presently known
Risks related to us or that we currently deem immaterial could also impair our business and operations.industry
Our success depends on our ability to maintain the value and reputation of our brand.
Our success depends on the value and reputation of the lululemon brand. The lululemon name is integral to our business as well as to the implementation of our strategies for expanding our business.expansion strategies. Maintaining, promoting, and positioning our brand will depend largely on the success of our marketing and merchandising efforts and our ability to provide a consistent, high quality product, and guest experience. We rely on social media, as one of our marketing strategies, to have a positive impact on both our brand value and reputation. Our brand and reputation could be adversely affected if we fail to achieve these objectives, if our public image was to be tarnished by negative publicity, which could be amplified by social media, if we fail to deliver innovative and high quality products acceptable to our guests, or if we face or mishandle a product recall. NegativeOur reputation could also be impacted by adverse publicity, whether or not valid, regarding allegations that we, or persons associated with us or formerly associated with us, have violated applicable laws or regulations, including but not limited to those related to safety, employment, discrimination, harassment, whistle-blowing, privacy, corporate citizenship, improper business practices, or cybersecurity. Certain activities on the production methodspart of any ofstakeholders, including nongovernmental organizations and governmental institutions, could cause reputational damage, distract senior management, and disrupt our suppliers or manufacturers could adversely affect our reputation and sales and force us to locate alternative suppliers or manufacturing sources.business. Additionally, while we devote considerable effortseffort and resources to protecting our intellectual property, if these efforts are not successful the value of our brand may be harmed. Any harm to our brand and reputation could have a material adverse effect on our financial condition.
Changes in consumer shopping preferences, and shifts in distribution channels could materially impact our results of operations.
We operate an omni-channel retail model and aim to efficiently and effectively serve our guests in the ways most convenient to them. We operate a combination of physical retail locations and e-commerce services via our websites, other region-specific websites, digital marketplaces, and mobile apps. Our physical retail locations remain a key part of our growth strategy and we view them as a valuable tool in helping us build our brand and product line as well as enabling our omni-channel capabilities. We plan to continue to expand square footage and open new company-operated stores to support our growth objectives. The diversion of sales from our company-operated stores could adversely impact our return on investment and could lead to impairment charges and store closures, including lease exit costs. We could have difficulty in recreating the in-store experience through direct channels. Our failure to successfully integrate our digital and physical channels and respond to these risks might adversely impact our business and results of operations, as well as damage our reputation and brand.
If any of our products have manufacturing or design defects or are otherwise unacceptable to us or our guests, our business could be harmed.
We have occasionally received, and may in the future receive, shipments of products that fail to comply with our technical specifications or that fail to conform to our quality control standards. We have also received, and may in the future receive, products that are otherwise unacceptable to us or our guests. Under these circumstances, unless we are able to obtain replacement products in a timely manner, we risk the loss of net revenue resulting from the inability to sell those products and related increased administrative and shipping costs. Additionally, if the unacceptability of our products is not discovered until after such products are purchased by our guests,sold, our guests could lose confidence in our products or we could face a product recall and our results of operations could suffer and our business, reputation, and brand could be harmed.
Our lululemon Studio subsidiary offers complex hardware and software products and services that can be affected by design and manufacturing defects. Sophisticated operating system software and applications, such as those offered by lululemon Studio, often have issues that can unexpectedly interfere with the intended operation of hardware or software products. Defects may also exist in components and products that we source from third parties. Any defects could make our products and services unsafe and create a risk of environmental or property damage or personal injury and we may become subject to the hazards and uncertainties of product liability claims and related litigation. The occurrence of real or perceived defects in any of our products, now or in the future, could result in additional negative publicity, regulatory investigations, or lawsuits filed against us, particularly if guests or others who use or purchase our lululemon Studio products are injured. Even if injuries are not the result of any defects, if they are perceived to be, we may incur expenses to defend or settle any claims and our brand and reputation may be harmed.
We operate in a highly competitive market and the size and resources of some of our competitors may allow them to compete more effectively than we can, resulting in a loss of our market share and a decrease in our net revenue and profitability.
The market for technical athletic apparel is highly competitive. Competition may result in pricing pressures, reduced profit margins or lost market share, or a failure to grow or maintain our market share, any of which could substantially harm our business and results of operations. We compete directly against wholesalers and direct retailers of athletic apparel, including large, diversified apparel companies with substantial market share, and established companies expanding their production and marketing of technical athletic apparel, as well as against retailers specifically focused on women's athletic apparel. We also face competition from wholesalers and direct retailers of traditional commodity athletic apparel, such as cotton T-shirts and sweatshirts. Many of our competitors are large apparel and sporting goods companies with strong worldwide brand recognition. Because of the fragmented nature of the industry, we also compete with other apparel sellers, including those
specializing in yoga apparel and other activewear. Many of our competitors have significant competitive advantages, including longer operating histories, larger and broader customer bases, more established relationships with a broader set of suppliers, greater brand recognition and greater financial, research and development, store development, marketing, distribution, and other resources than we do.
Our competitors may be able to achieve and maintain brand awareness and market share more quickly and effectively than we can. In contrast
We may fail to our "grassroots" marketing approach, manyacknowledge or react appropriately to the entry or growth of a viable competitor or disruptive force, and could struggle to continue to innovate, differentiate, and sustain the growth of our competitors promote their brands through traditional formsbrand. The increasing dominance and presence of advertising, such as print media and television commercials, and through celebrity endorsements, and have substantial resources to devote to such efforts. Our competitorsour brand may also create and maintain brand awareness using traditional forms of advertising more quickly than we can. Our competitors may also be able to increase sales in their new and existing markets faster than we do by emphasizing different distribution channels than we do, such as catalog sales or an extensive franchise network.drive guests towards alternative emerging competitors.
In addition, because we hold limited patents and exclusive intellectual property rights in the technology, fabrics or processes underlying our products, our current and future competitors are able to manufacture and sell products with performance characteristics, fabrication techniques, and styling similar to our products.
Our reliance on suppliers to provide fabrics for and to produce our products could cause problems in our supply chain.
We do not manufacture our products or the raw materials for them and rely instead on suppliers. Many of the specialty fabrics used in our products are technically advanced textile products developed and manufactured by third parties and may be available, in the short-term, from only one or a very limited number of sources. We work with a group of approximately 65 suppliers to provide the fabrics for our products. In fiscal 2017, approximately 59% of our fabrics were produced by our top five fabric suppliers, and no single manufacturer produced more than 35% of raw materials used. We work with a group of approximately 47 vendors that manufacture our products, five of which produced approximately 64% of our products in fiscal 2017. During fiscal 2017, no single manufacturer produced more than 25% of our product offerings. We have no long-term contracts with any of our suppliers or manufacturing sources for the production and supply of our fabrics and garments, and we compete with other companies for fabrics, raw materials, and production.
We have experienced, and may in the future experience, a significant disruption in the supply of fabrics or raw materials from current sources and we may be unable to locate alternative materials suppliers of comparable quality at an acceptable price, or at all. In addition, if we experience significant increased demand, or if we need to replace an existing supplier or manufacturer, we may be unable to locate additional supplies of fabrics or raw materials or additional manufacturing capacity on terms that are acceptable to us, or at all, or we may be unable to locate any supplier or manufacturer with sufficient capacity to meet our requirements or to fill our orders in a timely manner. Identifying a suitable supplier is an involved process that requires us to become satisfied with its quality control, responsiveness and service, financial stability, and labor and other ethical practices. Even if we are able to expand existing or find new manufacturing or fabric sources, we may encounter delays in production and added costs as a result of the time it takes to train our suppliers and manufacturers in our methods, products, and quality control standards. Delays related to supplier changes could also arise due to an increase in shipping times if new suppliers are located farther away from our markets or from other participants in our supply chain. Any delays, interruption or increased costs in the supply of fabric or manufacture of our products could have an adverse effect on our ability to meet guest demand for our products and result in lower net revenue and income from operations both in the short and long term.
An economic downturn or economic uncertainty in our key markets may adversely affect consumer discretionary spending and demand for our products.
Many of our products may be considered discretionary items for consumers. Factors affecting the level of consumer spending for such discretionary items include general economic conditions, particularly those in North America, and other factors such as consumer confidence in future economic conditions, fears of recession, the availability and cost of consumer credit, levels of unemployment, and tax rates. As global economic conditions continue to be volatile or economic uncertainty remains, trends in consumer discretionary spending also remain unpredictable and subject to reductions due to credit constraints and uncertainties about the future. Unfavorable economic conditions may lead consumers to delay or reduce purchases of our products. Consumer demand for our products may not reach our targets, or may decline, when there is an economic downturn or economic uncertainty in our key markets, particularly in North America. Our sensitivity to economic cycles and any related fluctuation in consumer demand may have a material adverse effect on our financial condition.
Our sales and profitability may decline as a result of increasing product costs and decreasing selling prices.
Our business is subject to significant pressure on costs and pricing caused by many factors, including intense competition, constrained sourcing capacity and related inflationary pressure, the availability of qualified labor and wage inflation, pressure from consumers to reduce the prices we charge for our products, and changes in consumer demand. These and other factors have, and may in the future, cause us to experience increased costs, reduce
our prices to consumers or experience reduced sales in response to increased prices, any of which could cause our operating margin to decline if we are unable to offset these factors with reductions in operating costs and could have a material adverse effect on our financial conditions,condition, operating results, and cash flows.
If we are unable to anticipate consumer preferences and successfully develop and introduce new, innovative, and updateddifferentiated products, we may not be able to maintain or increase our sales and profitability.
Our success depends on our ability to identify and originate product trends as well as to anticipate and react to changing consumer demands in a timely manner. All of our products are subject to changing consumer preferences that cannot be predicted with certainty. If we are unable to introduce new products or novel technologies in a timely manner or our new products or technologies are not accepted by our guests, our competitors may introduce similar products in a more timely fashion, which could hurt our goal to be viewed as a leader in technical athletic apparel innovation. Our new products may not receive consumer acceptance as consumer preferences could shift rapidly to different types of athletic apparel or away from these types of products altogether, and our future success depends in part on our ability to anticipate and respond to these changes. Our failure to anticipate and respond in a timely manner to changing consumer preferences could lead to, among other things, lower sales and excess inventory levels. We may not have relevant data to effectively understand and react to consumer preferences and expectations. Even if we are successful in anticipating consumer preferences, our ability to adequately react to and address those preferences will in part depend upon our continued ability to develop and introduce innovative, high-quality products. Our failure to effectively introduce new products that are accepted by consumers could
result in a decrease in net revenue and excess inventory levels, which could have a material adverse effect on our financial condition.
Our results of operations could be materially harmed if we are unable to accurately forecast guest demand for our products.
To ensure adequate inventory supply, we must forecast inventory needs and place orders with our manufacturers based on our estimates of future demand for particular products. Our ability to accurately forecast demand for our products could be affected by many factors, including an increase or decrease in guest demand for our products or for products of our competitors, our failure to accurately forecast guest acceptance of new products, product introductions by competitors, unanticipated changes in general market conditions (for example, because of global economic concerns such as inflation, an economic downturn, or delays and disruptions resulting from local and international shipping delays and labor shortages), and weakening of economic conditions or consumer confidence in future economic conditions.conditions (for example, because of inflationary pressures, or because of sanctions, restrictions, and other responses related to geopolitical events). If we fail to accurately forecast guest demand, we may experience excess inventory levels or a shortage of products available for sale in our stores or for delivery to guests.
Inventory levels in excess of guest demand may result in inventory write-downs or write-offs and the sale of excess inventory at discounted prices, which would cause our gross margin to suffer and could impair the strength and exclusivity of our brand. Conversely, if we underestimate guest demand for our products, our manufacturers may not be able to deliver products to meet our requirements, and this could result in damage to our reputation and guest relationships.
Our inability to safeguard against security breaches with respect to our information technology systems could disrupt our operations.
Our business employs systems and websites that allow for the storage and transmission of proprietary or confidential information regarding our business, guests and employees including credit card information. Security breaches could expose us to a risk of loss or misuse of this information and potential liability. We may not have the resources or technical sophistication to be able to anticipate or prevent rapidly evolving types of cyber-attacks. Actual or anticipated attacks may cause us to incur increasing costs including costs to deploy additional personnel and protection technologies, train employees and engage third party experts and consultants. Advances in computer capabilities, new technological discoveries or other developments may result in the technology used by us to protect transaction or other data being breached or compromised. Data and security breaches can also occur as a result of non-technical issues including intentional or inadvertent breach by employees or persons with whom we have commercial relationships that result in the unauthorized release of personal or confidential information. Any compromise or breach of our security could result in a violation of applicable privacy and other laws, significant litigation and potential liability and damage to our brand and reputation or other harm to our business.
Any material disruption of our information technology systems or unexpected network interruption could disrupt our business and reduce our sales.
We are increasingly dependent on information technology systems and third-parties to operate our e-commerce websites, process transactions, respond to guest inquiries, manage inventory, purchase, sell and ship goods on a timely basis, and maintain cost-efficient operations. The failure of our information technology systems to operate properly or effectively, problems with transitioning to upgraded or replacement systems, or difficulty in integrating new systems, could adversely affect our business. In addition, we have e-commerce websites in the United States, Canada, and internationally. Our information technology systems, websites, and operations of third parties on whom we rely, may encounter damage or disruption or slowdown caused by a failure to successfully upgrade systems, system failures, viruses, computer "hackers" or
other causes, could cause information, including data related to guest orders, to be lost or delayed which could, especially if the disruption or slowdown occurred during the holiday season, result in delays in the delivery of products to our stores and guests or lost sales, which could reduce demand for our products and cause our sales to decline. In addition, if changes in technology cause our information systems to become obsolete, or if our information systems are inadequate to handle our growth, we could lose guests. We have limited back-up systems and redundancies, and our information technology systems and websites have experienced system failures and electrical outages in the past which have disrupted our operations. Any significant disruption in our information technology systems or websites could harm our reputation and credibility, and could have a material adverse effect on our business, financial condition and results of operations.
If the technology-based systems that give our customers the ability to shop with us online do not function effectively, our operating results, as well as our ability to grow our e-commerce business globally, could be materially adversely affected.
Many of our customers shop with us through our e-commerce websites and mobile apps. Increasingly, customers are using tablets and smart phones to shop online with us and with our competitors and to do comparison shopping. We are increasingly using social media and proprietary mobile apps to interact with our customers and as a means to enhance their shopping experience. Any failure on our part to provide attractive, effective, reliable, user-friendly e-commerce platforms that offer a wide assortment of merchandise with rapid delivery options and that continually meet the changing expectations of online shoppers could place us at a competitive disadvantage, result in the loss of e-commerce and other sales, harm our reputation with customers, have a material adverse impact on the growth of our e-commerce business globally and could have a material adverse impact on our business and results of operations.
Risks specific to our e-commerce business also include diversion of sales from our company-operated stores, difficulty in recreating the in-store experience through direct channels and liability for online content. Our failure to successfully respond to these risks might adversely affect sales in our e-commerce business, as well as damage our reputation and brands.
The fluctuating cost of raw materials could increase our cost of goods sold and cause our results of operations and financial condition to suffer.
The fabrics used by our suppliers and manufacturers include synthetic fabrics whose raw materials include petroleum-based products. Our products also include silver and natural fibers, including cotton. Our costs for raw materials are affected by, among other things, weather, consumer demand, speculation on the commodities market, the relative valuations and fluctuations of the currencies of producer versus consumer countries, and other factors that are generally unpredictable and beyond our control. Increases in the cost of raw materials, including petroleum or the prices we pay for silver and our cotton yarn and cotton-based textiles, could have a material adverse effect on our cost of goods sold, results of operations, financial condition, and cash flows.
Our limited operating experience and limited brand recognition in new international markets and new product categories may limit our expansion and cause our business and growth to suffer.
Our future growth depends in part on our expansion efforts outside of North America.the Americas. We have limited experience with regulatory environments and market practices internationally, and we may not be able to penetrate or successfully operate in any new market. In connection with our expansion efforts we may encounter obstacles we did not face in North America,the Americas, including cultural and linguistic differences, differences in regulatory environments, labor practices and market practices, difficulties in keeping abreast of market, business and technical developments, and foreigninternational guests' tastes and preferences. We may also encounter difficulty expanding into new international markets because of limited brand recognition leading to delayed acceptance of our technical athletic apparel by guests in these new international markets. Our failure to develop our business in new international markets or disappointing growth outside of existing markets could harm our business and results of operations.
If we encounter problems with our distribution system, our ability to deliver our products to the market and to meet guest expectations could be harmed.
We rely on our distribution facilities for substantially all of our product distribution. Our distribution facilities include computer controlled and automated equipment, which means their operations may be subject to a number of risks related to security or computer viruses, the proper operation of software and hardware, electronic or power interruptions, or other system failures. In addition, because substantially all of our products are distributed from four locations, our operations could also be interrupted by labor difficulties, extreme or severe weather conditions or by floods, fires or other natural disasters near our distribution centers. If we encounter problems with our distribution system, our ability to meet guest expectations, manage inventory, complete sales, and achieve objectives for operating efficiencies could be harmed.
Our fabrics and manufacturing technology generally are not patented and can be imitated by our competitors.
The intellectual property rightscontinued growth depends in the technology, fabrics, and processes used to manufacture our products generally are owned or controlled by our suppliers and are generally not unique to us. Our ability to obtain intellectual property protection for our products is therefore limited and we do not generally own patents or hold exclusive intellectual property rights in the technology, fabrics or processes underlying our products. As a result, our current and future competitors are able to manufacture and sell products with performance characteristics, fabrics and styling similar to our products. Because many of our competitors have significantly greater financial, distribution, marketing, and other resources than we do, they may be able to manufacture and sell products based on our fabrics and manufacturing technology at lower prices than we can. If our competitors do sell similar products to ours at lower prices, our net revenue and profitability could suffer.
Our failure or inability to protect our intellectual property rights could diminish the value of our brand and weaken our competitive position.
We currently rely on a combination of copyright, trademark, trade dress, and unfair competition laws, as well as confidentiality procedures and licensing arrangements, to establish and protect our intellectual property rights. The steps we take to protect our intellectual property rights may not be adequate to prevent infringement of these rights by others, including imitation of our products and misappropriation of our brand. In addition, intellectual property protection may be unavailable or limited in some foreign countries where laws or law enforcement practices may not protect our intellectual property rights as fully as in the United States or Canada, and it may be more difficult for us to successfully challenge the use of our intellectual property rights by other parties in these countries. If we fail to protect and maintain our intellectual property rights, the value of our brand could be diminished and our competitive position may suffer.
Our future success is substantially dependent on the continued service of our senior management and identifying and attracting our next Chief Executive Officer.
On February 2, 2018, our Chief Executive Officer resigned. In addition to this change, a number of members of our senior management team have left the Company in the last several years. These changes, or the loss of services of any of our other key executive officers or other members of our senior management team, or any negative public perception with respect to these individuals, may be disruptive to, or cause uncertainty in, our business and could have a negative impactpart on our ability to manageexpand our product categories and grow our business effectively. Such disruption could have a material adverse impact on our financial performance, financial condition, and the market price of our stock.
introduce new product lines. We may not be successfulable to successfully manage integration of new product categories or the new product lines with our existing products. Selling new product categories and lines will require our management to test and develop different strategies in identifyingorder to be successful. We may be unsuccessful in entering new product categories and attracting a highly qualified successordeveloping or launching new product lines, which requires management of new suppliers, potential new customers, and new business models. Our management may not have the experience of selling in these new product categories and we may not be able to grow our Chief Executive Officer,business as planned. For example, in July 2020, we acquired MIRROR, an in-home fitness company with an interactive workout platform that features live and on-demand classes. If we are unable to effectively and successfully further develop these and future new product categories and lines, we may not be able to increase or maintain our sales and our process to search for the successoroperating margins may be time-consumingadversely affected. This may also divert the attention of management and divert management's attention and resources away from our business. The search for our next Chief Executive Officer may have a negative impact on our senior management team, business, and financial performance and condition.cause additional expenses.
We domay, from time to time, evaluate and pursue other strategic investments or acquisitions. These involve various inherent risks and the benefits sought may not maintain a key person life insurance policy on any of the members of our senior management team. As a result, we would have no way to cover the financial loss if we were to lose the services of members of our senior management team.
Changes in tax laws or unanticipated tax liabilities could adversely affect our effective income tax rate and profitability.
We are subject to the income tax laws of the United States, Canada, and several other international jurisdictions. Our effective income tax rates could be unfavorably impacted by a number of factors, including changes in the mix of earnings amongst countries with differing statutory tax rates, changes in the valuation of deferred tax assets and liabilities, changes in tax laws, the outcome of income tax audits in various jurisdictions around the world, and any repatriation of unremitted earnings for which we have not previously accrued applicable U.S. income taxes and foreign withholding taxes.
We and our subsidiaries engage in a number of intercompany transactions across multiple tax jurisdictions. Although we believe that these transactions reflect the accurate economic allocation of profit and that proper transfer pricing documentation is in place, the profit allocation and transfer pricing terms and conditions may be scrutinized by local tax authorities during an audit and any resulting changes may impact our mix of earnings in countries with differing statutory tax rates.
Current economic and political conditions make tax rules in any jurisdiction, including the United States and Canada, subject to significant change. Changes in applicable U.S., Canadian, or other or foreign tax laws and regulations, or their interpretation and application, including the possibility of retroactive effect, could affect our income tax expense and profitability, as they have in fiscal 2017 upon passage of the U.S. Tax Cuts and Jobs Act.
We have recorded provisional amounts in fiscal 2017 in relation to the U.S. Tax Cuts and Jobs Act. We may make adjustments to the provisional amounts as additional information is collected and analyzed, and as we complete our assessment of the impact that the U.S. Tax Cuts and Jobs Act has, if any, upon our reinvestment plans for the accumulated earnings of the Company's foreign subsidiaries. As the Company completes its analysis of the U.S. Tax Cuts and Jobs Act it may also make adjustments to incorporate any additional interpretations or guidance that may be issued. The Company may also identify additional effects of the U.S. Tax Cuts and Jobs Act that are not reflected as of January 28, 2018. Any such adjustments may materially impact the provision for income taxes and our effective income tax rate in the period in which the adjustments are made, and in future periods.realized.
If we continue to grow at a rapid pace, we may not be able to effectively manage our growth and the increased complexity of our business and as a result our brand image and financial performance may suffer.
We have expanded our operations rapidly since our inception in 1998 and our net revenue has increased from $40.7 million in fiscal 2004 to $2.6 billion in fiscal 2017. If our operations continue to grow at a rapid pace, we may experience difficulties in obtaining sufficient raw materials and manufacturing capacity to produce our products, as well as delays in production and shipments, as our products are subject to risks associated with overseas sourcing and manufacturing. We could be required to continue to expand our sales and marketing, product development and distribution functions, to upgrade our management information systems and other processes and technology, and to obtain more space for our expanding workforce. This expansion could increase the strain on our resources, and we could experience operating difficulties, including difficulties in hiring, training, and managing an increasing number of employees. These difficulties could result in the erosion of our brand image which could have a material adverse effect on our financial condition.
We are subject to risks associated with leasing retail and distribution space subject to long-term and non-cancelable leases.
We lease the majority of our stores under operating leases and our inability to secure appropriate real estate or lease terms could impact our ability to grow. Our leases generally have initial terms of between fivetwo and ten15 years, and generally can be extended in five-year increments between two and five years, if at all. We generally cannot cancel these leases at our option. If an existing or new store is not profitable, and we decide to close it, as we have done in the past and may do in the future, we may nonetheless be committed to perform our obligations under the applicable lease including, among other things, paying the base rent for the balance of the lease term. Similarly, we may be committed to perform our obligations under the applicable leases even if current locations of our stores become unattractive as demographic patterns change. In addition, as each of our leases expire, we may fail to negotiate renewals, either on commercially acceptable terms or at all, which could require us to close stores in desirable locations.
We also lease the majority of our distribution centers and our inability to secure appropriate real estate or lease terms could impact our ability to deliver our products to the market.
Our future success is substantially dependent on the service of our senior management and our ability to maintain our culture and to attract, manage, and retain highly qualified individuals.
The performance of our senior management team and other key employees may not meet our needs and expectations. Also, the loss of services of any of these key employees, or any negative public perception with respect to these individuals, may be disruptive to, or cause uncertainty in, our business and could have a negative impact on our ability to manage and grow our business effectively. Such disruption could have a material adverse impact on our financial performance, financial condition, and the market price of our stock.
If we are unable to successfully maintain and evolve our unique culture, offer competitive compensation and benefits, and a desirable work model, we may be unable to attract and retain highly qualified individuals to support our business and continued growth. Our work model may not meet the needs and expectations of our employees and may not be perceived as favorable compared to other companies. Unionization efforts or other employee organizing activities could lead to higher people costs or reduce our flexibility to manage our employees which may negatively disrupt our operations. We also face risks related to employee engagement and productivity which could result in increased headcount and lead to increased labor costs.
Our business is affected by seasonality, which could result in fluctuations in our operating results.
Our business is affected by the general seasonal trends common to the retail apparel industry. Our annual net revenue is typically weighted more heavily toward our fourth fiscal quarter, reflecting our historical strength in sales during the holiday season, while our operating expenses are more equally distributed throughout the year. This seasonality, along with other factors that are beyond our control, including weather conditions and the effects of climate change, could adversely affect our business and cause our results of operations to fluctuate.
Risks related to our supply chain
Disruptions of our supply chain could have a material adverse effect on our operating and financial results.
Disruption of our supply chain capabilities due to trade restrictions, political instability, severe weather, natural disasters, public health crises, war, terrorism, product recalls, labor supply shortages or stoppages, the financial or operational instability of key suppliers and carriers, changes in diplomatic or trade relationships (including any sanctions, restrictions, and other responses such as those related to current geopolitical events), or other reasons could impair our ability to distribute our products. To the extent we are unable to mitigate the likelihood or potential impact of such events, there could be a material adverse effect on our operating and financial results.
We rely on international suppliers and any significant disruption to our supply chain could impair our ability to procure or distribute our products.
We do not manufacture our products or raw materials and rely on suppliers and manufacturers located predominantly in APAC and China Mainland. We also source other materials used in our products, including items such as content labels, elastics, buttons, clasps, and drawcords, from suppliers located primarily in this region. Based on cost, during 2023:
•Approximately 42% of our products were manufactured in Vietnam, 16% in Cambodia, 11% in Sri Lanka, 10% in Indonesia, and 8% in Bangladesh, and the remainder in other regions.
•Approximately 40% of the fabric used in our products originated from Taiwan, 26% from China Mainland, 12% from Sri Lanka, and the remainder from other regions.
The entire apparel industry, including our company, could face supply chain challenges as a result of the impacts of global public health crises, political instability, inflationary pressures, macroeconomic conditions, and other factors, including reduced freight availability and increased costs, port disruption, manufacturing facility closures, and related labor shortages and other supply chain disruptions.
Our supply chain capabilities may be disrupted due to these or other factors, such as severe weather, natural disasters, war or other military conflicts, terrorism, labor supply shortages or stoppages, the financial or operational instability of key suppliers or the countries in which they operate, or changes in diplomatic or trade relationships (including any sanctions, restrictions, and other responses to geopolitical events). Any significant disruption in our supply chain capabilities could impair our ability to procure or distribute our products, which would adversely affect our business and results of operations.
A relatively small number of vendors supply and manufacture a significant portion of our products, and losing one or more of these vendors could adversely affect our business and results of operations.
Many of the specialty fabrics used in our products are technically advanced textile products developed and manufactured by third parties and may be available, in the short-term, from only one or a limited number of sources. We have no long-term contracts with any of our suppliers or manufacturers for the production and supply of our raw materials and products, and we compete with other companies for fabrics, other raw materials, and production. During 2023, we worked with approximately 49 vendors to manufacture our products and 67 suppliers to provide the fabric for our products. Based on cost, during 2023:
•Approximately 55% of our products were manufactured by our top five vendors, the largest of which produced approximately 17% of our products; and
•Approximately 52% of our fabrics were produced by our top five fabric suppliers, the largest of which produced approximately 19% of fabric used.
We have experienced, and may in the future experience, a significant disruption in the supply of fabrics or raw materials and may be unable to locate alternative suppliers of comparable quality at an acceptable price, or at all. In addition, if we experience significant increased demand, or if we need to replace an existing supplier or manufacturer, we may be unable to locate additional supplies of fabrics or raw materials or additional manufacturing capacity on terms that are acceptable to us, or at all, or we may be unable to locate any supplier or manufacturer with sufficient capacity to meet our requirements or fill our orders in a timely manner. Identifying a suitable supplier is an involved process that requires us to become satisfied with its quality control, responsiveness and service, financial stability, and labor and other ethical practices. Even if we are able to expand existing or find new manufacturing or fabric sources, we may encounter delays in production and added costs as a result of the time it takes to train our suppliers and manufacturers in our methods, products, and quality control standards.
Our supply of fabric or manufacture of our products could be disrupted or delayed by economic or political or global health conditions, and the related government and private sector responsive actions such as closures, restrictions on product shipments, and travel restrictions. Delays related to supplier changes could also arise due to an increase in shipping times if new suppliers are located farther away from our markets or from other participants in our supply chain. In addition, freight capacity issues continue to persist worldwide as there is much greater demand for shipping and reduced capacity and equipment. Any delays, interruption, or increased costs in the supply of fabric or manufacture of our products could have an adverse effect on our ability to meet guest demand for our products and result in lower net revenue and income from operations both in the short and long term.
Our business could be harmed if our suppliers and manufacturers do not comply with our Vendor Code of Ethics or applicable laws.
While we require our suppliers and manufacturers to comply with our Vendor Code of Ethics, which includes labor, health and safety, and environment standards, we do not control their operations. If suppliers or contractors do not comply with these standards or applicable laws or there is negative publicity regarding the production methods of any of our suppliers or manufacturers, even if unfounded or not specific to our supply chain, our reputation and sales could be adversely affected, we could be subject to legal liability, or could cause us to contract with alternative suppliers or manufacturing sources.
The fluctuating cost of raw materials could increase our cost of goods sold.
The fabrics used to make our products include synthetic fabrics whose raw materials include petroleum-based products. Our products also include silver and natural fibers, including cotton. Our costs for raw materials are affected by, among other things, weather, consumer demand, speculation on the commodities market, the relative valuations and fluctuations of the currencies of producer versus consumer countries, and other factors that are generally unpredictable and beyond our control. Any and all of these factors may be exacerbated by global climate change. In addition, political instability, trade relations, sanctions, inflationary pressure, or other geopolitical or economic conditions could cause raw material costs to increase and have an adverse effect on our future margins. Increases in the cost of raw materials, including petroleum or the prices we pay for silver and our cotton yarn and cotton-based textiles, could have a material adverse effect on our cost of goods sold, results of operations, financial condition, and cash flows.
If we encounter problems with our distribution system, our ability to deliver our products to the market and to meet guest expectations could be harmed.
We rely on our distribution facilities for substantially all of our product distribution. Our distribution facilities include computer controlled and automated equipment, which means their operations may be subject to a number of risks related to security or computer viruses, the proper operation of software and hardware, electronic or power interruptions, or other system failures. In addition, our operations could also be interrupted by labor difficulties, pandemics, the impacts of climate change, extreme or severe weather conditions or by floods, fires, or other natural disasters near our distribution centers. If we encounter problems with our distribution system, our ability to meet guest expectations, manage inventory, complete sales, and achieve objectives for operating efficiencies could be harmed.
Increasing labor costs and other factors associated with the production of our products in South Asia and South East Asia could increase the costs to produce our products.
A significant portion of our products are produced in South Asia and South East Asia and increases in the costs of labor and other costs of doing business in the countries in this area could significantly increase our costs to produce our products and could have a negative impact on our operations and earnings. Factors that could negatively affect our business include labor shortages and increases in labor costs, labor disputes, pandemics, the impacts of climate change, difficulties and additional costs in transporting products manufactured from these countries to our distribution centers and significant revaluation of the currencies used in these countries, which may result in an increase in the cost of producing products. Also, the imposition of trade sanctions or other regulations against products imported by us from, or the loss of "normal trade relations" status with any country in which our products are manufactured, could significantly increase our cost of products and harm our business.
Risks related to information security and technology
We may be unable to safeguard against security breaches which could damage our customer relationships and result in significant legal and financial exposure.
As part of our normal operations, we receive confidential, proprietary, and personally identifiable information, including credit card information, and information about our customers, our employees, job applicants, and other third parties. Our business employs systems and websites that allow for the storage and transmission of this information. However, despite our safeguards and security processes and protections, security breaches could expose us to a risk of theft or misuse of this information, and could result in litigation and potential liability.
The retail industry, in particular, has been the target of many recent cyber-attacks. We may not have the resources or technical sophistication to be able to anticipate or prevent rapidly evolving types of cyber-attacks. Attacks may be targeted at us, our vendors or customers, or others who have entrusted us with information. In addition, despite taking measures to safeguard our information security and privacy environment from security breaches, our customers and our business could still be exposed to risk. Actual or anticipated attacks may cause us to incur increasing costs including costs to deploy additional personnel and protection technologies, train employees and engage third party experts and consultants. Advances in computer capabilities, new technological discoveries or other developments may result in the technology used by us to protect transaction or other data being breached or compromised. Measures we implement to protect against cyber-attacks may also have the potential to impact our customers' shopping experience or decrease activity on our websites by making them more difficult to use.
Data and security breaches can also occur as a result of non-technical issues including intentional or inadvertent breach by employees or persons with whom we have commercial relationships that result in the unauthorized release of personal or
confidential information. Any compromise or breach of our security could result in a violation of applicable privacy and other laws, significant legal and financial exposure, and damage to our brand and reputation or other harm to our business.
In addition, the increased use of employee-owned devices for communications as well as work-from-home arrangements present additional operational risks to our technology systems, including increased risks of cyber-attacks. Further, like other companies in the retail industry, we have in the past experienced, and we expect to continue to experience, cyber-attacks, including phishing, and other attempts to breach, or gain unauthorized access to, our systems. To date, these attacks have not had a material impact on our operations, but they may have a material impact in the future.
Privacy and data protection laws increase our compliance burden.
We are subject to a variety of privacy and data protection laws and regulations that change frequently and have requirements that vary from jurisdiction to jurisdiction. For example, we are subject to significant compliance obligations under privacy laws such as the General Data Privacy Regulation ("GDPR") in the European Union, the Personal Information Protection and Electronic Documents Act (“PIPEDA”) in Canada, the California Consumer Privacy Act ("CCPA") modified by the California Privacy Rights Act (“CPRA”), and the Personal Information Protection Law (“PIPL”) in the People's Republic of China ("PRC")(6). Some privacy laws prohibit the transfer of personal information to certain other jurisdictions. We are subject to privacy and data protection audits or investigations by various government agencies. Our failure to comply with these laws subjects us to potential regulatory enforcement activity, fines, private litigation including class actions, and other costs. Our efforts to comply with privacy laws may complicate our operations and add to our compliance costs. A significant privacy breach or failure or perceived failure by us or our third-party service providers to comply with privacy or data protection laws, regulations, policies or regulatory guidance might have a materially adverse impact on our reputation, business operations and our financial condition or results of operations.
Disruption of our technology systems or unexpected network interruption could disrupt our business.
We are increasingly dependent on technology systems and third-parties to operate our e-commerce websites, process transactions, respond to guest inquiries, manage inventory, purchase, sell and ship goods on a timely basis, and maintain cost-efficient operations. The failure of our technology systems to operate properly or effectively, problems with transitioning to upgraded or replacement systems, or difficulty in integrating new systems, could adversely affect our business. In addition, we have e-commerce websites in the United States, Canada, and internationally. Our technology systems, websites, and operations of third parties on whom we rely, may encounter damage or disruption or slowdown caused by a failure to successfully upgrade systems, system failures, viruses, computer "hackers", natural disasters, or other causes. These could cause information, including data related to guest orders, to be lost or delayed which could, especially if the disruption or slowdown occurred during the holiday season, result in delays in the delivery of products to our stores and guests or lost sales, which could reduce demand for our products and cause our sales to decline. The concentration of our primary offices, several of our distribution centers, and a number of our stores along the west coast of North America could amplify the impact of a natural disaster occurring in that area to our business, including to our technology systems. In addition, if changes in technology cause our information systems to become obsolete, or if our information systems are inadequate to handle our growth, we could lose guests. We have limited back-up systems and redundancies, and our technology systems and websites have experienced system failures and electrical outages in the past which have disrupted our operations. Any significant disruption in our technology systems or websites could harm our reputation and credibility, and could have a material adverse effect on our business, financial condition, and results of operations.
Our technology-based systems that give our customers the ability to shop with us online may not function effectively.
Many of our customers shop with us through our e-commerce websites and mobile apps. Increasingly, customers are using tablets and smart phones to shop online with us and with our competitors and to do comparison shopping. We are increasingly using social media and proprietary mobile apps to interact with our customers and as a means to enhance their shopping experience. Any failure on our part to provide attractive, effective, reliable, user-friendly e-commerce platforms that offer a wide assortment of merchandise with rapid delivery options and that continually meet the changing expectations of online shoppers could place us at a competitive disadvantage, result in the loss of e-commerce and other sales, harm our
(6) PRC includes China Mainland, Hong Kong SAR, Taiwan, and Macau SAR.
reputation with customers, have a material adverse impact on the growth of our e-commerce business globally and could have a material adverse impact on our business and results of operations.
Risks related to environmental, social, and governance issues
Climate change, and related legislative and regulatory responses to climate change, may adversely impact our business.
There is increasing concern that a gradual rise in global average temperatures due to increased concentration of carbon dioxide and other greenhouse gases in the atmosphere will cause significant changes in weather patterns around the globe, an increase in the frequency, severity, and duration of extreme weather conditions and natural disasters, and water scarcity and poor water quality. These events could adversely impact the cultivation of cotton, which is a key resource in the production of our products, disrupt the operation of our supply chain and the productivity of our contract manufacturers, increase our production costs, impose capacity restraints and impact the types of apparel products that consumers purchase. These events could also compound adverse economic conditions and impact consumer confidence and discretionary spending. As a result, the effects of climate change could have a long-term adverse impact on our business and results of operations. In many countries, governmental bodies are enacting new or additional legislation and regulations to reduce or mitigate the potential impacts of climate change. If we, our suppliers, or our contract manufacturers are required to comply with these laws and regulations, or if we choose to take voluntary steps to reduce or mitigate our impact on climate change, we may experience increased costs for energy, production, transportation, and raw materials, increased capital expenditures, or increased insurance premiums and deductibles, which could adversely impact our operations. Inconsistency of legislation and regulations among jurisdictions may also affect the costs of compliance with such laws and regulations. Any assessment of the potential impact of future climate change legislation, regulations or industry standards, as well as any international treaties and accords, is uncertain given the wide scope of potential regulatory change in the countries in which we operate.
Increased scrutiny from investors and others regarding our environmental, social, governance, or sustainability, responsibilities could result in additional costs or risks and adversely impact our reputation, employee retention, and willingness of customers and suppliers to do business with us.
Investor and political advocacy groups, certain institutional investors, investment funds, other market participants, stockholders, and customers have focused increasingly on the environmental, social and governance ("ESG") practices of companies, including those associated with climate change and social responsibility. These parties have placed increased importance on the implications of the social cost of their investments. If our ESG practices do not meet customer, investor, employee, or other stakeholder expectations or do not align with their opinions or values, our brand, reputation, employee retention, and business may be negatively impacted. Any sustainability report that we publish or other ESG disclosures we make may include our policies and practices on a variety of social and ethical matters, including corporate governance, environmental compliance, employee health and safety practices, human capital management, product quality, supply chain management, and workforce inclusion and diversity. It is possible that stakeholders may not be satisfied with our ESG policies or practices, including if we overstate the impact of our ESG practices, and this could reduce demand for our products and lead to regulatory enforcement that could restrict our ability to market and sell our products. We could also incur additional costs and require additional resources to monitor, report, and comply with various ESG practices. Also, our failure, or perceived failure, to meet the standards included in any sustainability disclosure could negatively impact our reputation, employee retention, and the willingness of our customers and suppliers to do business with us.
Risks related to global economic, political, and regulatory conditions
An economic recession, depression, downturn, periods of inflation, or economic uncertainty in our key markets may adversely affect consumer discretionary spending and demand for our products.
Many of our products may be considered discretionary items for consumers. Some of the factors that may influence consumer spending on discretionary items include general economic conditions, high levels of unemployment, pandemics, higher consumer debt levels, reductions in net worth based on market declines and uncertainty, home foreclosures and reductions in home values, fluctuating interest and foreign currency exchange rates and credit availability, government austerity measures, fluctuating fuel and other energy costs, fluctuating commodity prices, inflationary pressure, tax rates and general uncertainty regarding the overall future economic environment. Global economic conditions are uncertain and volatile, due in part to the potential impacts of increasing inflation, the potential impacts of geopolitical uncertainties, and any potential sanctions, restrictions or responses to those conditions. For example, the PRC market presents a number of risks, including changes in laws and regulations, currency fluctuations, increased competition, and changes in economic conditions, including the risk of an economic downturn or recession, trade embargoes, restrictions or other barriers, as well as other conditions that may adversely impact consumer spending, any of which could cause us to fail to achieve anticipated growth. As global economic conditions continue to be volatile or economic uncertainty remains, trends in consumer discretionary
spending also remain unpredictable and subject to reductions due to credit constraints and uncertainties about the future. Unfavorable economic conditions may lead consumers to delay or reduce purchases of our products. Consumer demand for our products may not reach our targets, or may decline, when there is an economic downturn or economic uncertainty in our key markets. Our sensitivity to economic cycles and any related fluctuation in consumer demand may have a material adverse effect on our financial condition.
Our financial condition could be adversely affected by global or regional health events such as the COVID-19 pandemic and related government, private sector, and individual consumer responsive actions.
The COVID-19 pandemic negatively impacted the global economy, disrupted consumer spending and global supply chains, and created significant volatility and disruption of financial markets. The COVID-19 pandemic and related government, private sector, and individual consumer responsive actions negatively impacted our business operations, store traffic, employee availability, supply chain, financial condition, liquidity, and cash flows.
The occurrence or resurgence of global or regional health events such as the COVID-19 pandemic, and the related governmental, private sector and individual consumer responses, could contribute to a recession, depression, or global economic downturn, reduce store traffic and consumer spending, result in temporary or permanent closures of retail locations, offices, and factories, and could negatively impact the flow of goods. Such events could cause health officials to impose restrictions and recommend precautions to mitigate the health crisis such as the temporary closure of our stores, limitations on the number of guests allowed in our stores at any single time, minimum physical distancing requirements, and limited operating hours. A health event such as the COVID-19 pandemic could also negatively impact our employees, guests, and brand by reducing consumer willingness to visit stores, malls, and lifestyle centers, and employee willingness to staff our stores. A global or regional health event may also cause long-term changes to consumer shopping behavior, preferences and demand for our products that may have a material adverse effect on our business.
A global or regional health event such as the COVID-19 pandemic could significantly and adversely impact our supply chain if the factories that manufacture our products, the distribution centers where we manage our inventory, or the operations of our logistics and other service providers are disrupted, temporarily closed, or experience worker shortages.
Global economic and political conditions could adversely impact our results of operations.
Uncertain or challenging global economic and political conditions could impact our performance, including our ability to successfully expand internationally. Global economic conditions could impact levels of consumer spending in the markets in which we operate, which could impact our sales and profitability. Political unrest, such as the turmoil related to current geopolitical events and the related sanctions, restrictions, or other responses, could negatively impact our guests and employees, reduce consumer spending, and adversely impact our business and results of operations.
We may be unable to source and sell our merchandise profitably or at all could be hurt if new trade restrictions are imposed or existing trade restrictions become more burdensome.
The United States and the countries in which our products are produced or sold internationally have imposed and may impose additional quotas, duties, tariffs, or other restrictions or regulations, or may adversely adjust prevailing quota, duty, or tariff levels. WeThe results of any audits or related disputes regarding these restrictions or regulations could have expandedan adverse effect on our relationships with suppliers outside of China,financial statements for the period or periods for which among other things has resulted in increased costs and shipping times for some products.the applicable final determinations are made. Countries impose, modify, and remove tariffs and other trade restrictions in response to a diverse array of factors, including global and national economic and political conditions, which make it impossible for us to predict future developments regarding tariffs and other trade restrictions. Trade restrictions, including tariffs, quotas, embargoes, safeguards, and customs restrictions, could increase the cost or reduce the supply of products available to us, could increase shipping times, or may require us to modify our supply chain organization or other current business practices, any of which could harm our business, financial condition, and results of operations.
We are dependent on international trade agreements and regulations. If the United States were to withdraw from or materially modify certain international trade agreements, our business could be adversely affected.
Increasing labor costsThe countries in which we produce and other factors associated with the production ofsell our products in South and South East Asia could impose or increase the costs to produce our products.
A significant portion of our products are produced in South and South East Asia and increases in the costs of labor andtariffs, duties, or other costs of doing business in the countries in this area could significantly increase our costs to produce our products and could have a negative impact on our operations, net revenue, and earnings. Factorssimilar charges that could negatively affect our results of operations, financial position, or cash flows.
Adverse changes in, or withdrawal from, trade agreements or political relationships between the United States and the PRC, Canada, or other countries where we sell or source our products, could negatively impact our results of operations or cash flows. General geopolitical instability and the responses to it, such as the possibility of sanctions, trade restrictions, and changes in tariffs, including sanctions against the PRC, tariffs imposed by the United States and the PRC, and the possibility of additional tariffs or other trade restrictions, could adversely impact our business. It is possible that further tariffs may be introduced, or increased. Such changes could adversely impact our business include a potential significant revaluationand could increase the costs of the currencies used in these countries, which may result in an increase in the cost
sourcing our
of producing products labor shortagefrom the PRC as well as other countries, or could require us to source our products from different countries. The Uyghur Forced Labor Prevention Act and increases in laborother similar legislation may lead to greater supply chain compliance costs and difficultiesdelays to us and to our vendors.
Changes in moving products manufactured out of the countries in which they are manufacturedtax laws or unanticipated tax liabilities could adversely affect our effective income tax rate and through the ports on the western coast of North America, whether due to port congestion, labor disputes, product regulations and/or inspections or other factors, and natural disasters or health pandemics. A labor strike or other transportation disruption affecting these ports could significantly disrupt our business. Also, the imposition of trade sanctions or other regulations against products imported by us from, or the loss of "normal trade relations" status with any country in which our products are manufactured, could significantly increase our cost of products imported into North America and/or Australia and harm our business.profitability.
The operations of many of our suppliersWe are subject to additional risksthe income tax laws of the United States, Canada, and several other international jurisdictions. Our effective income tax rates could be unfavorably impacted by a number of factors, including changes in the mix of earnings amongst countries with differing statutory tax rates, changes in the valuation of deferred tax assets and liabilities, changes in tax laws, new tax interpretations and guidance, the outcome of income tax audits in various jurisdictions around the world, and any repatriation of unremitted earnings for which we have not previously accrued applicable U.S. income taxes and international withholding taxes.
Repatriations from our Canadian subsidiaries are not subject to Canadian withholding taxes if such distributions are made as a return of capital. The extent to which the accumulated earnings of our Canadian subsidiaries can be repatriated as a return of capital is dependent on, among other things, the amount of paid-up-capital in our Canadian subsidiaries and transactions undertaken by our exchangeable shareholders.
Prior to 2022, we had not accrued for Canadian withholding taxes because the accumulated earnings of, or 'net investment' in, our Canadian subsidiaries was either indefinitely reinvested or could be repatriated as a return of capital without the payment of withholding taxes.
Since 2022, the net investment in our Canadian subsidiaries, which was not indefinitely reinvested, exceeded the paid-up capital and therefore we recognized Canadian withholding taxes on the portion of our net investment which we are unable to repatriate free of withholding tax.
In 2024, assuming there are no exchange transactions by our exchangeable shareholders, we will continue to recognize Canadian withholding taxes on the accumulated earnings of our Canadian subsidiaries which are not indefinitely reinvested.
We engage in a number of intercompany transactions across multiple tax jurisdictions. Although we believe that are beyond our controlthese transactions reflect the accurate economic allocation of profit and that could harmproper transfer pricing documentation is in place, the profit allocation and transfer pricing terms and conditions may be scrutinized by local tax authorities during an audit and any resulting changes may impact our business, financial condition,mix of earnings in countries with differing statutory tax rates. At the end of 2020, our Advance Pricing Arrangement ("APA") with the Internal Revenue Service and resultsthe Canada Revenue Agency expired. This APA stipulated the allocation of operations.
Almost all of our supplierscertain profits between the U.S. and Canada. We are located outside of North America. During fiscal 2017, approximately 53% of our products were manufactured in South East Asia, approximately 25% in South Asia, approximately 10% in China, approximately 8%currently in the Americas,process of negotiating the renewal of this arrangement and the remainderfinal agreed upon terms and conditions thereof could impact our effective tax rate.
Current economic and political conditions make tax rules in other regions.
As a result of our international suppliers, we areany jurisdiction, including the United States and Canada, subject to risks associated with doing business abroad, including:
political unrest, terrorism, labor disputes, and economic instability resultingsignificant change. Changes in the disruption of trade from foreign countries in which our products are manufactured;
the imposition of newapplicable U.S., Canadian, or other international tax laws and regulations, or their interpretation and application, including those relating to labor conditions, qualitythe possibility of retroactive effect, could affect our income tax expense and safety standards, imports, duties, taxesprofitability, as they did in fiscal 2017 and other charges on imports,fiscal 2018 upon passage of the U.S. Tax Cuts and Jobs Act, and in 2020 with the passage of the Coronavirus Aid, Relief, and Economic Security Act. Certain provisions of the Inflation Reduction Act passed in 2022, including a 15% corporate alternative minimum tax, as well as trade restrictionsthe similar 15% global minimum tax under the Organization for Economic Cooperation and restrictions on currency exchange or the transfer of funds;
reduced protection for intellectual property rights, including trademark protection, in some countries, particularly China;
disruptions or delays in shipments;Development's Pillar Two Global Anti-Base Erosion Rules, may impact our income tax expense, profitability, and
changes in local economic conditions in countries where our manufacturers, suppliers, or guests are located.
These and other factors beyond our control could interrupt our suppliers' production in offshore facilities, influence the ability of our suppliers to export our products cost-effectively or at all and inhibit our suppliers' ability to procure certain materials, any of which could harm our business, financial condition, and results of operations.
We may not be able to successfully open new store locations in a timely manner, if at all, which could harm our results of operations.
Our growth will largely depend on our ability to successfully open and operate new stores, which depends on many factors, including, among others, our ability to:
identify suitable store locations, the availability of which is outside of our control;
negotiate acceptable lease terms, including desired tenant improvement allowances;
hire, train and retain store personnel and field management;
immerse new store personnel and field management into our corporate culture;
source sufficient inventory levels; and
successfully integrate new stores into our existing operations and information technology systems.
Successful new store openings may also be affected by our ability to initiate our grassroots marketing efforts in advance of opening our first store in a new market. We typically rely on our grassroots marketing efforts to build awareness of our brand and demand for our products. Our grassroots marketing efforts are often lengthy and must be tailored to each new market based on our emerging understanding of the market. We may not be able to successfully implement our grassroots marketing efforts in a particular market in a timely manner, if at all. Additionally, we may be unsuccessful in identifying new markets where our technical athletic apparel and other products and brand image will be accepted or the performance of our stores will be considered successful.
capital allocation decisions.
Our failure to comply with trade and other regulations could lead to investigations or actions by government regulators and negative publicity.
The labeling, distribution, importation, marketing, and sale of our products, as well as components of our products, including chemicals, are subject to extensive regulation by various regulatory bodies. These include federal agencies includingsuch as the Federal Trade Commission, Consumer Product Safety Commission and state attorneys general in the United States, the Competition Bureau and Health Canada in Canada, the State Administration for Market Regulation of the PRC, General Administration of Customs of the PRC, as well as by various other federal, state, provincial, local, and international regulatory authorities in the countries in which our products are distributed or sold. If we fail to comply with any of these regulations, we could become subject to enforcement actions or the imposition of significant penalties or claims, which could harm our results of operations or our ability to conduct our business. In addition, any audits and inspections by governmental agencies related to these matters could result in significant settlement amounts, damages, fines, or other penalties, divert financial and management resources, and result in significant legal fees. An unfavorable outcome of any particular proceeding could have an adverse impact on our business, financial condition, and results of operations. In addition, the adoption of new regulations
or changes in the interpretation of existing regulations may result in significant compliance costs or discontinuation of product sales and could impair the marketing of our products, resulting in significant loss of net revenue.
Our international operations are also subject to compliance with the U.S. Foreign Corrupt Practices Act or FCPA,("FCPA") and other anti-bribery laws applicable to our operations. In many foreign countries, particularly in those with developing economies, it may be a local custom that businesses operating in such countries engage in business practices that are prohibited by the FCPA or other U.S. and foreigninternational laws and regulations applicable to us. As we expand our operations across multiple jurisdictions, we could be subject to conflicting laws, or differing consumer sentiment on application of laws, that could lead to non-compliance which could have an adverse effect on our operations. Although we have implemented procedures designed to ensure compliance with the FCPA and similar laws, some of our employees, agents, or other channel partners, as well as those companies to which we outsource certain of our business operations, could take actions in violation of our policies. Any such violation could have a material and adverse effect on our business.
Our business is affected by seasonality.
Our business is affected by the general seasonal trends commonAs we expand internationally, we are subject to the retail apparel industry. This seasonality may adversely affect our businesscomplex employee regulations, and causeif we fail to comply with these regulations, we could be subject to enforcement actions or negative employee relations which could harm our results of operations to fluctuate, and, as a result, we believe that comparisons of our operating results between different quarters within a single fiscal year are not necessarily meaningful and that results of operations in any period should not be considered indicative of the results to be expected for any future period.operations.
Because a significant portion of our net revenue and expenses are generated in countries other than the United States, fluctuations in foreign currency exchange rates have affected our results of operations and may continue to do so in the future.
The functional currency of our foreigninternational subsidiaries is generally the applicable local currency. Our consolidated financial statements are presented in U.S. dollars. Therefore, the net revenue, expenses, assets, and liabilities of our foreigninternational subsidiaries are translated from their functional currencies into U.S. dollars. Fluctuations in the value of the U.S. dollar affect the reported amounts of net revenue, expenses, assets, and liabilities. Foreign currency exchange differences which arise on translation of our foreigninternational subsidiaries' balance sheets into U.S. dollars are recorded as a foreign currency translation adjustmentother comprehensive income (loss), net of tax in accumulated other comprehensive income or loss within stockholders' equity.
We also have exposure to changes in foreign currency exchange rates associated with transactions which are undertaken by our subsidiaries in currencies other than their functional currency. Such transactions include intercompany transactions and inventory purchases denominated in currencies other than the functional currency of the purchasing entity. As a result, we have been impacted by changes in foreign currency exchange rates and may be impacted for the foreseeable future. The potential impact of currency fluctuation increases as our international expansion increases.
We have, and may continue to, enter into forward currency contracts, or other derivative instruments, in an effort to mitigate the foreign exchange risks which we are exposed to. This may include entering into forward currency contracts to hedge against the foreign exchange gains and losses which arise on translation of our foreign subsidiaries' balance sheets into U.S. dollars, or entering into forward currency contracts in an effort to reduce our exposure to foreign exchange revaluation gains and losses that arise on monetary assets and liabilities held by our subsidiaries in a currency other than their functional currency.
Although we use financial instruments to hedge certain foreign currency risks, these measures may not succeed in fully offsetting the negative impact of foreign currency rate movements.
We are exposed to credit-related losses in the event of nonperformance by the counterparties to the forward currency contracts.contracts used in our hedging strategies.
Risks related to intellectual property
Our fabrics and manufacturing technology generally are not patented and can be imitated by our competitors. If our competitors sell products similar to ours at lower prices, our net revenue and profitability could suffer.
The intellectual property rights in the technology, fabrics, and processes used to manufacture our products generally are owned or controlled by our suppliers and are generally not unique to us. Our ability to obtain intellectual property protection for our products is therefore limited. We hold limited patents and exclusive intellectual property rights in the technology, fabrics or processes underlying our products. As a result, our current and future competitors are able to manufacture and sell products with performance characteristics, fabrics and styling similar to our products. Because many of our competitors have significantly greater financial, distribution, marketing, and other resources than we do, they may be able to manufacture and sell products based on our fabrics and manufacturing technology at lower prices than we can. If our competitors sell products similar to ours at lower prices, our net revenue and profitability could suffer.
Our failure or inability to protect our intellectual property rights could diminish the value of our brand and weaken our competitive position.
We currently rely on a combination of patent, copyright, trademark, trade dress, trade secret, and unfair competition laws, as well as confidentiality procedures and licensing arrangements, to establish and protect our intellectual property rights. The steps we take to protect our intellectual property rights may not be adequate to prevent infringement of these rights by others, including imitation of our products and misappropriation of our brand. In addition, any of our intellectual
property rights may be challenged, which could result in them being narrowed in scope or declared invalid or unenforceable, or our intellectual property protection may be unavailable or limited in some international countries where laws or law enforcement practices may not protect our intellectual property rights as fully as in the United States or Canada, and it may be more difficult for us to successfully challenge the use of our intellectual property rights by other parties in these countries. If we fail to protect and maintain our intellectual property rights, the value of our brand could be diminished, and our competitive position may suffer.
Our trademarks, patents, and other proprietary rights could potentially conflict with the rights of others and we may be prevented from selling some of our products.
Our success depends in large part on our brand image. We believe that our trademarks, patents, and other proprietary rights have significant value and are important to identifying and differentiating our products from those of our competitors and creating
and sustaining demand for our products. We have obtainedapplied for and applied forobtained some United States, Canada, and foreigninternational trademark registrations and patents, and will continue to evaluate the registration of additional trademarks and patents as appropriate. However, some or all of these pending trademark or patent applications may not be approved by the applicable governmental authorities. Moreover, even if the applications are approved, third parties may seek to oppose or otherwise challenge these applications or registrations. Additionally, we may face obstacles as we expand our product line and the geographic scope of our sales and marketing. Third parties may assert intellectual property claims against us, particularly as we expand our business and the number of products we offer. Our defense of any claim, regardless of its merit, could be expensive and time consuming and could divert management resources. Successful infringement claims against us could result in significant monetary liability or prevent us from selling some of our products. In addition, resolution of claims may require us to redesign our products, license rights from third parties, or cease using those rights altogether. Any of these events could harm our business and cause our results of operations, liquidity, and financial condition to suffer.
We have been, and in the future may be, sued by third parties for alleged infringement of their proprietary rights.
There is considerable patent and other intellectual property development activity in our market, and litigation, based on allegations of infringement or other violations of intellectual property, is frequent in the fitness and technology industries. Furthermore, it is common for individuals and groups to purchase patents and other intellectual property assets for the purpose of making claims of infringement to extract settlements from companies like ours. Our use of third-party content, including music content, software, and other intellectual property rights may be subject to claims of infringement or misappropriation. We cannot guarantee that our internally developed or acquired technologies and content do not or will not infringe the intellectual property rights of others. From time to time, our competitors or other third parties may claim that we are infringing upon or misappropriating their intellectual property rights, and we may be found to be infringing upon such rights. Any claims or litigation could cause us to incur significant expenses and, if successfully asserted against us, could require that we pay substantial damages or ongoing royalty payments, prevent us from offering our platform or services or using certain technologies, force us to implement expensive work-arounds, or impose other unfavorable terms. We expect that the occurrence of infringement claims is likely to grow as the market for fitness products and services grows and as we introduce new and updated products and offerings. Accordingly, our exposure to damages resulting from infringement claims could increase and this could further exhaust our financial and management resources. Any of the foregoing could prevent us from competing effectively and could have an adverse effect on our business, financial condition, and operating results.
Risks related to legal and governance matters
We are subject to periodic claims and litigation that could result in unexpected expenses and could ultimately be resolved against us.
From time to time, we are involved in litigation and other proceedings, including matters related to product liability claims, stockholder class action and derivative claims, commercial disputes and intellectual property, as well as trade, regulatory, employment, and other claims related to our business. Any of these proceedings could result in significant settlement amounts, damages, fines, or other penalties, divert financial and management resources, and result in significant legal fees. An unfavorable outcome of any particular proceeding could exceed the limits of our insurance policies or the carriers may decline to fund such final settlements and/or judgments and could have an adverse impact on our business, financial condition, and results of operations. In addition, any proceeding could negatively impact our reputation among our guests and our brand image.
Our business could be negatively affected as a result of actions of activist stockholders and such activism could impactor others.
We may be subject to actions or proposals from stockholders or others that may not align with our business strategies or the trading valueinterests of our securities.
other stockholders. Responding to such actions by activist stockholders can be costly and time-consuming, disruptingdisrupt our business
and operations, and divertingdivert the attention of our board of directors, management, and employees from the pursuit of our employees.business strategies. Such activities could interfere with our ability to execute our strategic plan. Activist stockholders or others may create perceived uncertainties as to the future direction of our business or strategy which may be exploited by our competitors and may make it more difficult to attract and retain qualified personnel and potential guests, and may affect our relationships with current guests, vendors, investors, and other third parties. In addition, a proxy contest for the election of directors at our annual meeting would require us to incur significant legal fees and proxy solicitation expenses and require significant time and attention by management and our board of directors. The perceived uncertainties as to our future direction also could affect the market price and volatility of our securities.
Anti-takeover provisions of Delaware law and our certificate of incorporation and bylaws could delay and discourage takeover attempts that stockholders may consider to be favorable.
Certain provisions of our certificate of incorporation and bylaws and applicable provisions of the Delaware General Corporation Law may make it more difficult or impossible for a third-party to acquire control of us or effect a change in our board of directors and management. These provisions include:
•the classification of our board of directors into three classes, with one class elected each year;
•prohibiting cumulative voting in the election of directors;
•the ability of our board of directors to issue preferred stock without stockholder approval;
•the ability to remove a director only for cause and only with the vote of the holders of at least 66 2/3% of our voting stock;
•a special meeting of stockholders may only be called by our chairman or Chief Executive Officer, or upon a resolution adopted by an affirmative vote of a majority of the board of directors, and not by our stockholders;
•prohibiting stockholder action by written consent; and
•our stockholders must comply with advance notice procedures in order to nominate candidates for election to our board of directors or to place stockholder proposals on the agenda for consideration at any meeting of our stockholders.
In addition, we are governed by Section 203 of the Delaware General Corporation Law which, subject to some specified exceptions, prohibits "business combinations" between a Delaware corporation and an "interested stockholder," which is generally defined as a stockholder who becomes a beneficial owner of 15% or more of a Delaware corporation's voting stock, for a three-year period following the date that the stockholder became an interested stockholder. Section 203 could have the effect of delaying, deferring, or preventing a change in control that our stockholders might consider to be in their best interests.
ITEM 1C. CYBERSECURITY
Risk Management and Strategy
Our business operations and relationships with customers and suppliers are heavily reliant on technology. We operate a cybersecurity program designed to assess our security risks and threats, to manage those risks and protect our technology systems and data, and to detect and respond to cybersecurity incidents.
We manage strategic risks, including cybersecurity risk, through our Enterprise Risk Management program which has direct involvement from the board of directors, the audit committee, and senior management. Through this process, we have identified cybersecurity as a risk management priority.
Governance
Our board of directors provides oversight of cybersecurity risks and has delegated primary responsibility to the audit committee, which is responsible for overseeing our enterprise risk assessments and management policies, procedures, and practices (including regarding those risks related to information security, cybersecurity, and data protection).
The audit committee maintains a cybersecurity sub-committee that is comprised of our Chief Information Officer ("CIO"), our Chief Information Security Officer ("CISO"), and representatives from the audit committee and board of directors that have knowledge and experience in cybersecurity matters. The cybersecurity sub-committee reviews our cybersecurity
risk assessments and the steps being taken to monitor, control, and report on those risks as well as discusses regulatory and market developments. They also review our process for identifying and responding to cybersecurity incidents in a timely manner, and details of cybersecurity attacks or incidents which have occurred.
Management generally meets with, and provides reports to, the cybersecurity sub-committee on a quarterly basis. Our CIO and CISO also meet with and provide reports to the audit committee at least quarterly. The board of directors receives periodic reports regarding the activities of the cybersecurity sub-committee. These reports and meetings are designed to inform the board of directors and committees about the current state of our information security program including cybersecurity risks, the nature, timing, and extent of cybersecurity incidents, if any, and the resolution of such matters.
Cybersecurity Program and Incident Response
Our CISO is responsible for our cybersecurity program, including risk assessments, information security activities, and controls. The CISO is responsible for establishing and maintaining corporate information security policies and overseeing our risk management activities, which prioritize vulnerability management, risk reduction, and prevention. Our CISO also leads our Cyber Defense and Incident Response (“CDIR”) team which identifies, assesses, escalates, and remediates cybersecurity incidents. Our current CISO has over 25 years of experience in information security across different industries in the US, Europe, and South and Central America. Our current CISO is a member of the Information Systems Audit and Control Association and brings extensive experience and knowledge of cybersecurity risk management.
The CDIR team identifies, tracks, reviews, assesses, and takes actions over key cybersecurity risks including but not limited to: (i) third parties/vendors, (ii) cloud security, (iii) malicious code, (iv) our digital e-commerce channels and systems, and (v) our store technology. The CDIR team also undertakes enterprise architecture reviews, considers cyber defense and incident response findings, performs vulnerability scans, and assesses threats and performs landscape intelligence analysis.
As part of our cybersecurity program, we conduct cybersecurity awareness training including phishing simulations and supplemental campaigns as well as mandatory e-learning for all our employees. Our employees have multiple mechanisms for reporting cybersecurity and data privacy concerns. We work with third-party cybersecurity advisors to undertake assessments of our critical systems and to remediate any high-risk vulnerabilities identified. We also engage third parties to perform penetration testing on our key systems to identify potential weaknesses.
As part of our cyber incident response plan, we utilize an established framework to assess the severity of cybersecurity incidents. Under the plan, incidents are escalated to relevant senior management, and the board of directors, as appropriate, based on their severity. Our disclosure committee assesses the materiality of severe incidents including both quantitative and qualitative factors.
Third Parties
We utilize third-party service providers as a normal part of our business operations. To address cybersecurity risks arising from our relationships with third-party service providers, we employ a vendor risk program. We monitor risks relating to potential compromises of sensitive information at our third-party service providers and re-evaluate the risks associated with our partners periodically. Prior to exchanging our data with third-party service providers, they are required to go through a vendor risk assessment. We also conduct third-party security reviews and evaluate their network, processes, and systems. In addition, we obtain annual attestation reports related to data security and privacy from certain third-party service providers to further support compliance with industry-standard cybersecurity protocols.
Impact of Cybersecurity Risks on Strategy and Results
Based on the information available as of the date of this Annual Report, we have not been materially affected by any previous cybersecurity incidents. However, we continue to experience cyber-attacks, including phishing, and other attempts to break or gain unauthorized access to our systems that could materially affect us in the future. For further information, see “Risks related to information security and technology” included in Item 1A. Risk Factors of this Annual Report.
ITEM 2. PROPERTIES
Our principal executive and administrative offices are located at 1818 Cornwall Avenue, Vancouver, British Columbia, Canada, V6J 1C7.
As of January 28, 2018, we operated four distribution centers located in the United States, Canada, and Australia. During fiscal 2017 we completed the relocation of our distribution center facilities in Vancouver, BC to a new 155,000 square foot leased premises in Vancouver, BC. In addition to those distribution centers, we hold inventory at warehouses managed by third-parties in Hong Kong, Rotterdam, and Shanghai. We regularly evaluate our distribution infrastructure and consolidate or expand our distribution capacity as we believe appropriate for our operations and to meet anticipated needs.
The general location, use and approximate size of our principal owned properties as of January 28, 2018,2024, are set forth below:
| | | | | | | | | | | | | | |
| Location | | Use | | | | |
Location | | Use | | Approximate Square Feet |
Columbus,Groveport, OH, United States | | Distribution Center | | 310,000 | | 310,000
|
| Vancouver, BC, Canada | | Executive and Administrative Offices | | 140,000 | | 140,000
|
Vancouver, BC | | Executive and Administrative Offices | | 15,000 |
|
We lease non-retail properties in a number of locations globally. The general location, use, approximate size and lease renewal date of our principal non-retail leased properties as of January 28, 2018,2024, are set forth below:
| | | | | | | | | | | | | | | | | | | | |
| Location | | Use | | | | | | |
Location | | Use | | Approximate Square Feet | | Lease Renewal Date |
| Sumner, WA | | | | | |
| Delta, BC, Canada | | Distribution Center | | 375,000 | | 150,000 |
| May 2020December 2037 |
Vancouver, BCMilton, ON, Canada | | Distribution Center | | 255,000 | | 155,000 |
| JanuaryMay 2031 |
| Mississauga, ON, Canada | | Distribution Center | | 250,000 | | | September 2033 |
| Ravenhall, VIC, Australia | | Distribution Center | | 250,000 | | | September 2033 |
| Delta, BC, Canada | | Distribution Center | | 155,000 | | | January 2031 |
| Sumner, WA, United States | | Distribution Center | | 150,000 | | | July 2025 |
| Vancouver, BC, Canada | | Executive and Administrative Offices | | 120,000 | | 60,000 |
| May 2020 |
Vancouver, BC | | Executive and Administrative Offices | | 25,000 |
| | June 2023 |
Melbourne, VIC | | Distribution Center | | 50,000 |
| | October 2022 |
Melbourne, VIC | | Executive and Administrative Offices | | 25,000 |
| | August 20192032 |
AsDuring 2021, we entered into a new lease for a U.S. distribution center in Ontario, California of January 28, 2018, we leased approximately 1.3 million gross1,255,000 square feet relatingwhich expires in 2039. We expect this distribution center to 402be operational in early fiscal 2024.
During 2022, we entered into a new lease for a Canadian distribution center in Brampton, Ontario of our 404 stores. Our store leases generally have initial terms of between five and 10 years, and generally canapproximately 980,000 square feet which expires in 2041. We expect this distribution center to be extendedoperational in five-year increments, if at all. All of our leases require a fixed annual rent, and the majority require the payment of additional rent if store sales exceed a negotiated amount. Generally, our leases are "net" leases, which require us to pay all of the cost of insurance, taxes, maintenance and utilities. We generally cannot cancel these leases at our option.fiscal 2026.
ITEM 3. LEGAL PROCEEDINGS
In addition toPlease see the legal mattersproceedings described in Note 16 to our audited consolidated financial statements21. Commitments and Contingencies included in Item 8 of Part II of this report, we are, from time to time, involved in routine legal matters incidental to the conduct of our business, including legal matters such as initiation and defense of proceedings to protect intellectual property rights, personal injury claims, product liability claims, employment claims, and similar matters. We believe the ultimate resolution of any such current proceeding will not have a material adverse effect on our continued financial position, results of operations or cash flows.report.
ITEM 4. MINE SAFETY DISCLOSURES
Not applicable.
PART II
ITEM 5. MARKET FOR REGISTRANT'S COMMON EQUITY, RELATED STOCKHOLDER MATTERS AND ISSUER PURCHASES OF EQUITY SECURITIES
Market Information and Dividends
Our common stock is quoted on the Nasdaq Global Select Market under the symbol "LULU." The following table sets forth, for the periods indicated, the high and low closing sale prices of our common stock reported by the Nasdaq Global Select Market for the last two fiscal years:
|
| | | | | | | | |
| |
| Common Stock Price
(Nasdaq Global
Select Market) |
| |
| High |
| Low |
| Fiscal Year Ended January 28, 2018 |
|
|
|
|
| Fourth Quarter |
| $ | 79.85 |
|
| $ | 60.24 |
|
| Third Quarter |
| 63.83 |
|
| 57.39 |
|
| Second Quarter |
| 62.02 |
|
| 47.91 |
|
| First Quarter |
| 67.76 |
|
| 49.43 |
|
| Fiscal Year Ended January 29, 2017 |
| | | |
| Fourth Quarter |
| $ | 69.90 |
|
| $ | 54.61 |
|
| Third Quarter |
| 80.65 |
|
| 54.88 |
|
| Second Quarter |
| 77.80 |
|
| 60.07 |
|
| First Quarter |
| 68.69 |
|
| 56.88 |
|
As of March 21, 2018,15, 2024, there were approximately 8001,300 holders of record of our common stock. This does not include persons whose stock is in nominee or "street name" accounts through brokers.
We have never declared or paid any cash dividends on our common stock and do not anticipate paying any cash dividends on our common stock.stock in the foreseeable future. Any future determination as to the payment of cash dividends will be at the discretion of our board of directors and will depend on our financial condition, operating results, current and anticipated cash needs, plans for expansion, and other factors that our board of directors considers to be relevant. In addition, financial and other covenants in any instruments or agreements that we enter into in the future may restrict our ability to pay cash dividends on our common stock.
Stock Performance Graph
The graph set forth below compares the cumulative total stockholder return on our common stock between February 3, 20132019 (the date of our fiscal year end five years ago) and January 28, 2018,2024, with the cumulative total return of (i) the S&P 500 Index and (ii) S&P 500 Apparel, Accessories & Luxury Goods Index, over the same period. This graph assumes the investment of $100 on February 3, 20132019 at the closing sale price of our common stock, the S&P 500 Index and the S&P Apparel, Accessories & Luxury Goods Index and assumes the reinvestment of dividends, if any.
The comparisons shown in the graph below are based on historical data. We caution that the stock price performance showingshown in the graph below is not necessarily indicative of, nor is it intended to forecast, the potential future performance of our common stock. Information used in the graph was obtained from Bloomberg, a source believed to be reliable, but we are not responsible for any errors or omissions in such information.
| | | | | | | | | | | | | | | | | | | | | | | | | | | | | | | | | | | | | | |
| | 03-Feb-19 | | 02-Feb-20 | | 31-Jan-21 | | 30-Jan-22 | | 29-Jan-23 | | 28-Jan-24 |
| lululemon athletica inc. | | $ | 100.00 | | | $ | 163.83 | | | $ | 224.94 | | | $ | 216.20 | | | $ | 212.74 | | | $ | 327.15 | |
| S&P 500 Index | | $ | 100.00 | | | $ | 119.18 | | | $ | 137.23 | | | $ | 163.75 | | | $ | 150.40 | | | $ | 180.71 | |
| S&P 500 Apparel, Accessories & Luxury Goods Index | | $ | 100.00 | | | $ | 90.30 | | | $ | 86.51 | | | $ | 83.79 | | | $ | 59.05 | | | $ | 47.77 | |
|
| | | | | | | | | | | | | | | | | | | | | | | | |
| | | 03-Feb-13 | | 02-Feb-14 | | 01-Feb-15 | | 31-Jan-16 | | 29-Jan-17 | | 28-Jan-18 |
| lululemon athletica inc. | | $ | 100.00 |
| | $ | 67.33 |
| | $ | 97.61 |
| | $ | 91.47 |
| | $ | 98.47 |
| | $ | 116.53 |
|
| S&P 500 Index | | $ | 100.00 |
| | $ | 117.81 |
| | $ | 131.84 |
| | $ | 128.22 |
| | $ | 151.65 |
| | $ | 189.86 |
|
| S&P 500 Apparel, Accessories & Luxury Goods Index | | $ | 100.00 |
| | $ | 114.44 |
| | $ | 117.40 |
| | $ | 97.15 |
| | $ | 81.50 |
| | $ | 106.09 |
|
Issuer Purchase of Equity Securities
The following table provides information regarding our purchases of shares of our common stock during the thirteen weeks ended January 28, 2018fourth quarter of 2023 related to our stock repurchase program:programs:
|
| | | | | | | | | | | | | | |
Period(1) | | Total Number of Shares Purchased(2) | | Average Price Paid per Share | | Total Number of Shares Purchased as Part of Publicly Announced Plans or Programs(2) | | Maximum Dollar Value of Shares that May Yet Be Purchased Under the Plans or Programs(2) |
| October 30, 2017 - November 26, 2017 | | — |
| | $ | — |
| | — |
| | $ | — |
|
| November 27, 2017 - December 31, 2017 | | 13,317 |
| | 74.56 |
| | 13,317 |
| | 199,007,128 |
|
| January 1, 2018 - January 28, 2018 | | — |
| | — |
| | — |
| | 199,007,128 |
|
| Total | | 13,317 |
| | | | 13,317 |
| | |
| | | | | | | | | | | | | | | | | | | | | | | | | | |
Period(1) | | Total Number of Shares Purchased(2) | | Average Price Paid per Share | | Total Number of Shares Purchased as Part of Publicly Announced Plans or Programs(2) | | Maximum Dollar Value of Shares that May Yet Be Purchased Under the Plans or Programs(2) |
| October 30, 2023 - November 26, 2023 | | 50,619 | | | $ | 400.10 | | | 50,619 | | | $ | 222,941,393 | |
| November 27, 2023 - December 31, 2023 | | 10,040 | | | 507.57 | | | 10,040 | | | 1,217,845,403 | |
| January 1, 2024 - January 28, 2024 | | 59,180 | | | 483.73 | | | 59,180 | | | 1,189,218,138 | |
| Total | | 119,839 | | | | | 119,839 | | | |
__________
| |
(1)
| Monthly information is presented by reference to our fiscal periods during our fourth quarter of fiscal 2017. |
| |
(2)
| Our stock repurchase program was approved by our board of directors in November 2017. Common shares generally are repurchased in the open market at prevailing market prices, including under plans complying with the provisions of Rule 10b5-1 and Rule 10b-18 of the Securities Exchange Act of 1934, with the timing and actual number of common shares repurchased depending upon market conditions, eligibility to trade, and other factors. The repurchases are expected to be completed by November 2019, and the maximum dollar value of shares to be repurchased is $200 million. |
(1)Monthly information is presented by reference to our fiscal periods during our fourth quarter of 2023.
(2)On March 23, 2022 and November 29, 2023, our board of directors approved stock repurchase programs, each for up to $1.0 billion of our common shares on the open market or in privately negotiated transactions. The repurchase plans have no time limit and do not require the repurchase of a minimum number of shares. Common shares repurchased on the open market are at prevailing market prices, including under plans complying with the provisions of Rule 10b5-1 and Rule 10b-18 of the Securities Exchange Act of 1934. The timing and actual number of common shares to be repurchased will depend upon market conditions, eligibility to trade, and other factors. The authorized value of shares available to be repurchased under these programs excludes the cost of commissions and excise taxes.
The following table provides information regarding oursummarizes purchases of shares of our common stock during the thirteen weeks ended January 28, 2018fourth quarter of 2023 related to our Employee Share Purchase Plan:Plan (ESPP):
|
| | | | | | | | | | | | | |
Period(1) | | Total Number of Shares Purchased(2) | | Average Price Paid per Share | | Total Number of Shares Purchased as Part of Publicly Announced Plans or Programs(2) | | Maximum Number of Shares that May Yet Be Purchased Under the Plans or Programs(2) |
| October 30, 2017 - November 26, 2017 | | 10,476 |
| | $ | 63.56 |
| | 10,476 |
| | 4,918,281 |
|
| November 27, 2017 - December 31, 2017 | | 13,974 |
| | 73.70 |
| | 13,974 |
| | 4,904,307 |
|
| January 1, 2018 - January 28, 2018 | | 8,276 |
| | 78.95 |
| | 8,276 |
| | 4,896,031 |
|
| Total | | 32,726 |
| | | | 32,726 |
| | |
| | | | | | | | | | | | | | | | | | | | | | | | | | |
Period(1) | | Total Number of Shares Purchased(2) | | Average Price Paid per Share | | Total Number of Shares Purchased as Part of Publicly Announced Plans or Programs(2) | | Maximum Number of Shares that May Yet Be Purchased Under the Plans or Programs(2) |
| October 30, 2023 - November 26, 2023 | | 7,367 | | | $ | 418.18 | | | 7,367 | | | 4,415,983 | |
| November 27, 2023 - December 31, 2023 | | 7,331 | | | 491.70 | | | 7,331 | | | 4,408,652 | |
| January 1, 2024 - January 28, 2024 | | 5,954 | | | 482.84 | | | 5,954 | | | 4,402,698 | |
| Total | | 20,652 | | | | | 20,652 | | | |
___________
| |
(1)(1)Monthly information is presented by reference to our fiscal periods during our fourth quarter of 2023. (2)The ESPP was approved by our board of directors and stockholders in September 2007. All shares purchased under the ESPP are purchased on the Nasdaq Global Select Market (or such other stock exchange as we may designate). Unless our board terminates the ESPP earlier, it will continue until all shares authorized for purchase have been purchased. The maximum number of shares authorized to be purchased under the ESPP was 6,000,000. | Monthly information is presented by reference to our fiscal periods during our fourth quarter of fiscal 2017. |
| |
(2)
| Our Employee Share Purchase Plan (ESPP) was approved by our board of directors and stockholders in September 2007. All shares purchased under the ESPP are purchased on the Nasdaq Global Select Market (or such other stock exchange as we may designate from time to time). Unless our board of directors terminates the ESPP earlier, the ESPP will continue until all shares authorized for purchase under the ESPP have been purchased. The maximum number of shares authorized to be purchased under the ESPP is 6,000,000. |
Excluded from this disclosure are shares repurchased to settle statutory employee tax withholding related to the vesting of stock-based compensation awards.
ITEM 6. SELECTED CONSOLIDATED FINANCIAL DATA
The selected consolidated financial data set forth below is derived from our consolidated financial statements and should be read in conjunction with our consolidated financial statements for the years ended January 28, 2018, January 29, 2017, January 31, 2016, February 1, 2015 and February 2, 2014. The consolidated statement of operations and comprehensive income data for each of the years ended January 28, 2018, January 29, 2017 and January 31, 2016 and the consolidated balance sheet data as of January 28, 2018 and January 29, 2017 is derived from, and qualified by reference to, our audited consolidated financial statements and related notes appearing elsewhere in this Annual Report.Not applicable.
|
| | | | | | | | | | | | | | | | | | | | |
|
| Fiscal Year Ended |
|
| January 28, 2018 | | January 29, 2017 | | January 31, 2016 | | February 1, 2015 | | February 2, 2014 |
|
| (In thousands, except per share data) |
| Consolidated statement of operations and comprehensive income data: |
|
|
|
|
|
|
|
|
|
|
| Net revenue |
| $ | 2,649,181 |
|
| $ | 2,344,392 |
| | $ | 2,060,523 |
| | $ | 1,797,213 |
| | $ | 1,591,188 |
|
| Cost of goods sold |
| 1,250,391 |
|
| 1,144,775 |
| | 1,063,357 |
| | 883,033 |
| | 751,112 |
|
| Gross profit |
| 1,398,790 |
|
| 1,199,617 |
| | 997,166 |
| | 914,180 |
| | 840,076 |
|
| Selling, general and administrative expenses |
| 904,264 |
|
| 778,465 |
| | 628,090 |
| | 538,147 |
| | 448,718 |
|
| Asset impairment and restructuring costs | | 38,525 |
| | — |
| | — |
| | — |
| | — |
|
| Income from operations |
| 456,001 |
|
| 421,152 |
| | 369,076 |
| | 376,033 |
| | 391,358 |
|
| Other income (expense), net |
| 3,997 |
|
| 1,577 |
| | (581 | ) | | 7,102 |
| | 5,768 |
|
| Income before income tax expense |
| 459,998 |
|
| 422,729 |
| | 368,495 |
| | 383,135 |
| | 397,126 |
|
| Income tax expense |
| 201,336 |
|
| 119,348 |
| | 102,448 |
| | 144,102 |
| | 117,579 |
|
| Net income |
| $ | 258,662 |
|
| $ | 303,381 |
| | $ | 266,047 |
| | $ | 239,033 |
| | $ | 279,547 |
|
| | | | | | | | | | | |
| Other comprehensive income (loss), net of tax: | | | | | | | | | | |
| Foreign currency translation adjustment | | 58,577 |
|
| 36,703 |
| | (64,796 | ) | | (105,339 | ) | | (89,158 | ) |
| Comprehensive income | | $ | 317,239 |
|
| $ | 340,084 |
| | $ | 201,251 |
| | $ | 133,694 |
| | $ | 190,389 |
|
| | | | | | | | | | | |
| Basic earnings per share |
| $ | 1.90 |
| | $ | 2.21 |
| | $ | 1.90 |
| | $ | 1.66 |
| | $ | 1.93 |
|
| Diluted earnings per share |
| $ | 1.90 |
| | $ | 2.21 |
| | $ | 1.89 |
| | $ | 1.66 |
| | $ | 1.91 |
|
| Basic weighted-average number of shares outstanding |
| 135,988 |
|
| 137,086 |
| | 140,365 |
| | 143,935 |
| | 144,913 |
|
| Diluted weighted-average number of shares outstanding |
| 136,198 |
|
| 137,302 |
| | 140,610 |
| | 144,298 |
| | 146,043 |
|
|
| | | | | | | | | | | | | | | | | | | | |
|
| As of |
|
| January 28, 2018 | | January 29, 2017 | | January 31, 2016 | | February 1, 2015 | | February 2, 2014 |
|
| (In thousands) |
| Consolidated balance sheet data: |
|
|
| Cash and cash equivalents |
| $ | 990,501 |
|
| $ | 734,846 |
| | $ | 501,482 |
| | $ | 664,479 |
| | $ | 698,649 |
|
| Inventories | | 329,562 |
| | 298,432 |
| | 284,009 |
| | 208,116 |
| | 188,790 |
|
| Total assets |
| 1,998,483 |
|
| 1,657,541 |
| | 1,314,077 |
| | 1,296,213 |
| | 1,252,388 |
|
| Total stockholders' equity |
| 1,596,960 |
|
| 1,359,973 |
| | 1,027,482 |
| | 1,089,568 |
| | 1,096,682 |
|
ITEM 7. MANAGEMENT'S DISCUSSION AND ANALYSIS OF FINANCIAL CONDITION AND RESULTS OF OPERATIONS
Our fiscal year ends on the Sunday closest to January 31 of the following year, typically resulting in a 52 week year, but occasionally giving rise to an additional week, resulting in a 53 week year.
Fiscal 2017, fiscal 2016, and fiscal 2015 were 52 week years. The followingManagement's discussion and analysis of financial condition and results of operations is provided as a supplement to, and should be read in conjunction with, our consolidated financial statements and the related notes included elsewhere in this Annual Report on Form 10-K. Components of management's discussion and analysis of financial condition and results of operations include:
Our fiscal year ends on the Sunday closest to January 31 of the following year, typically resulting in a 52-week year, but occasionally giving rise to an additional week, resulting in a 53-week year. Fiscal 2023, 2022, and 2021 were each 52-week years. Fiscal 2024 will be a 53-week year.
This discussion and analysis contains forward-looking statements based on current expectations that involve risks, uncertainties and assumptions, such as our plans, objectives, expectations, and intentions set forthincluded in the "Special Note Regarding Forward-Looking Statements." Our actual results and the timing of events may differ materially from those anticipated in these forward lookingforward-looking statements as a result of various factors, including those set forthdescribed in the "Item 1A. Risk Factors" section and elsewhere in this Annual Report on Form 10-K.
Overview
Fiscal 2017 wasWe use comparable sales as a strong year for our company. New stores and new store formats, product innovations, and an enhanced e-commerce offering, combined with successful community and brand initiatives helped drive a 13% increase in net revenue. We had a 7% increase in total comparable sales.
Our product design and development teams launched a number of new category innovations this year. For women, our newest fabric Everlux was created for high intensity, indoor workouts andmetric to evaluate the Enlite bra offers guests proprietary technology for running and high impact training. For men, we expanded our popular ABC pant franchise to include slim and jogger styles, and all of our men's fixed waist bottoms now feature our ABC construction. We look forward to delivering on a strong pipeline of innovation and product rollouts in fiscal 2018.
During the year, we opened 46 net new lululemon branded company-operated stores, including 30 in North America, 14 in Asia Pacific, and two in Europe. Our multiple formats now include standard, co-located, local, and select flagship locations, which allow us to cater to our guests where they live, work, and sweat.
As of January 28, 2018, we had 57 stores in Asia Pacific and 13 stores in Europe, including our European flagship on London's Regent Street which showcases the fullest expression of our brand to both local and travelling guests. We expanded in Germany in fiscal 2017 with a new location in Munich. In Asia, we opened nine new stores in China during fiscal 2017, in addition to growing our local e-commerce presence via Tmall, and opening company-operated stores in Japan.
We relaunched our websites at the end of the third quarter of fiscal 2017, improving the online experience through upgraded visuals, added video content, more intuitive navigation, enhanced storytelling, and the integration of ivivva. The sales performance of our e-commerce business, which accelerated throughout the year, culminated in a 44% increase in direct to consumer net revenue in the fourth quarter of fiscal 2017 compared to the fourth quarter of fiscal 2016. In fiscal 2018 we plan to continue to develop our omni-channel experience to serve guests wherever and however they choose to shop, including launching a WeChat store in China.
Our grassroots approach to brand-building - locally led by stores and store associates, who we call educators - enables us to connect with and uniquely understand our guest. We hosted several events during the year, including our annual SeaWheeze half marathon in Vancouver, The Ghost Race in 15 cities in North America, the Sweatlife Festival in London, and Unroll China across multiple cities. We complemented our local efforts with our first global marketing campaign "This Is Yoga", followed by men's focused "Strength To Be" and finally, for holiday, "Breathe It All In".
We look forward to continuing this strong momentum into fiscal 2018, focusing on our four key strategic growth pillars: Digital, Men's, North America, and International, underpinned by innovations in product, our distinctive brand and community approach, and our vertically-integrated model.
Financial Highlights
The summary below provides both GAAP and non-GAAP financial measures. In connection with the restructuring of our ivivva operations, we recognized pre-tax costs totaling $47.2 million in fiscal 2017, and a related income tax recovery of $12.7 million. We recognized a provisional income tax expense of $59.3 million in fiscal 2017 related to the U.S. Tax Cuts and Jobs Act. The adjusted financial measures exclude these items, and also exclude certain discrete items related to our transfer pricing arrangements and taxes on repatriation of foreign earnings which were recognized during the fiscal 2016.
For the fiscal year ended January 28, 2018, compared to the fiscal year ended January 29, 2017:
Net revenue increased 13% to $2.6 billion. On a constant dollar basis, net revenue increased 12%.
Total comparable sales, which includes comparable store sales and direct to consumer, increased 7%. On a constant dollar basis, total comparable sales increased 7%.
| |
– | Comparable store sales increased 1%, or increased 1% on a constant dollar basis. |
| |
– | Direct to consumer net revenue increased 27%, or increased 27% on a constant dollar basis. |
Gross profit increased 17% to $1.4 billion. Adjusted gross profit increased 17% to $1.4 billion.
Gross margin increased 160 basis points to 52.8%. Adjusted gross margin increased 190 basis points to 53.1%.
Income from operations increased 8% to $456.0 million. Adjusted income from operations increased 19% to $503.2 million.
Operating margin decreased80 basis points to 17.2%. Adjusted operating margin increased100 basis points to 19.0%.
Income tax expense increased 69% to $201.3 million. Our effective tax rate for fiscal 2017 was 43.8% compared to 28.2% for fiscal 2016. The adjusted effective tax rate was 30.5% for fiscal 2017 compared to 30.7% for fiscal 2016.
Diluted earnings per share were $1.90 for fiscal 2017 compared to $2.21 in fiscal 2016. Adjusted diluted earnings per share were $2.59 for fiscal 2017 compared to $2.14 for fiscal 2016.
business. Refer to the non-GAAP reconciliation tables contained in the "Non-GAAP Financial Measures" Comparable Sales and Sales Per Square Footsection of this "Item 7. Management's Discussionmanagement's discussion and Analysisanalysis of financial condition and results of operations for further information.
We provide constant dollar changes and adjusted financial results, which are non-GAAP financial measures, as supplemental information that enable evaluation of the underlying trend in our operating performance, and enable a comparison to our historical financial information. Refer to the Non-GAAP Financial ConditionMeasures section of this management's discussion and Resultsanalysis of Operations"financial condition and results of operations for reconciliations between constant dollar changes in net revenue, total comparable sales, comparable store sales, and direct to consumer net revenue, andthe adjusted gross profit, gross margin, income from operations, operating margin, income tax expense, effective tax rates, and diluted earnings per share,non-GAAP financial measures and the most directly comparable measures calculated in accordance with GAAP.
We disclose material non-public information through one or more of the following channels: our investor relations website (http://corporate.lululemon.com/investors), the social media channels identified on our investor relations website, press releases, SEC filings, public conference calls, and webcasts. Information contained on or accessible through our websites is not incorporated into, and does not form a part of, this Annual Report or any other report or document we file with the SEC, and any references to our websites are intended to be inactive textual references only. General
Net revenueDuring the fourth quarter of 2023, we revised the financial information which is regularly reviewed and used by our CODM to evaluate performance and allocate resources. Historically, our segments were based on selling channel. As we have further executed on our omni-channel retail strategy, and with the continued expansion of our international operations, our resource allocation decisions have evolved to focus on regional markets. We organize our operations into four regional markets: Americas, China Mainland, APAC, and EMEA. We report three segments, Americas, China Mainland, and Rest of World, which is comprised of the APAC and EMEA regions on a combined basis. Our prior year segment results have been recast to reflect our new segment reporting structure.
Overview
In 2023, lululemon celebrated its 25th anniversary and delivered another strong year of financial results. We continued to execute against our Power of Three ×2 growth plan, growing net revenue 19% and diluted earnings per share 83%, or 27% on an adjusted basis, as our teams were able to successfully navigate an uncertain macroeconomic environment.
Our growth continued across regions, merchandise categories, and channels. We delivered strong net revenue growth across our regions including 12% in the Americas, 67% in China Mainland, and 43% in Rest of World. Net revenue from our women's product range increased 17%, men's increased 15%, and net revenue from our other categories increased 36%. We
opened 56 net new company-operated stores, contributing to a 15% increase in square footage, while total company-operated store sales, directnet revenue increased 21% and e-commerce net revenue increased 17%.
We believe this broad-based growth was underpinned by our ability to consumer salesbring new innovations into our product assortment, while also increasing our brand awareness and bringing new guests into our brand.
Product Innovation
By innovating through www.lululemon.com, other countryour Science of Feel approach, we continue to seek to solve the unmet needs of our guests. While continuing to see strength from our key collections including Align, Scuba, Define, and region specific websites,Softstreme for women and mobile apps, including mobile apps on in-store devicesour ABC collection for men, we launched new innovations as well. For women, we launched Wundermost, our new bodywear collection, we expanded our dual gender golf and tennis assortments. On the men’s side, we launched Steady State and Soft Jersey, to expand our lounge offering, while also enhancing our Pace Breaker short. In accessories, we continued to see strength across our bag assortment, and in footwear we updated our Blissfeel and Chargefeel styles, and in early 2024, we launched our first footwear styles for men. We also announced a new textile-to-textile recycling partnership with the goal of enabling circularity in our supply chain by transforming apparel waste into high quality nylon and polyester.
Brand Awareness
We believe that allow demandincreasing our brand awareness and introducing new guests to be fulfilled viathe lululemon brand remains one of our distribution centers,largest opportunities, both in the Americas and to an even greater degree in our international markets.
In order to grow brand awareness we combine our community-based, grass roots model of guest engagement, with larger scale brand activations and global brand campaigns. With connection points across both our physical and digital channels, we aim to bring new guests into our brand, engage with them in ways that are more than just transactional and create deeper connections.
In 2023, we executed several strategies designed to connect with guests, bring new guests into our brand, and grow awareness. Highlights include: hosting our Dupe Swap event in Los Angeles; testing our first men's focused TV campaign featuring our ABC pants; taking over the West Bund in Shanghai for one week to host wellness-centric events and experiences intended to bring awareness to World Mental Health Day; and continuing to grow our Essentials membership program.
In addition, in September 2023 we announced our new partnership with Peloton. Peloton is now the exclusive provider of content for our lululemon Studio members, we have become their primary apparel provider. We plan to jointly engage our global communities through special programming, experiences, and events.
Financial Highlights
The summary below compares 2023 to 2022 and provides both GAAP and non-GAAP financial measures. The adjusted financial measures for 2023 exclude $72.1 million of post-tax asset impairment and other charges recognized in relation to lululemon Studio. The adjusted financial measures for 2022 exclude $442.7 million of post-tax goodwill impairment and other charges recognized in relation to lululemon Studio and the post-tax net gain on the sale of an administrative building of $8.5 million.
•Net revenue increased 19% to $9.6 billion. On a constant dollar basis, net revenue which includes outletincreased 20%.
•Comparable sales increased 13%, or 14% on a constant dollar basis.
–Americas comparable sales increased 8%, or 9% on a constant dollar basis.
–China Mainland comparable sales increased 39%, or 46% on a constant dollar basis.
–Rest of World comparable sales increased 32%, or 33% on a constant dollar basis.
•Gross profit increased 25% to $5.6 billion. Adjusted gross profit increased 24% to $5.6 billion.
•Gross margin increased 290 basis points to 58.3%. Adjusted gross margin increased 240 basis points to 58.6%.
•Income from temporary locations, salesoperations increased 61% to wholesale accounts, showroom sales, warehouse sales,$2.1 billion. Adjusted income from operations increased 25% to $2.2 billion.
•Operating margin increased 580 basis points to 22.2% from 16.4% in 2022. Adjusted operating margin increased 110 basis points to 23.2% from 22.1% in 2022.
•Income tax expense increased 31% to $625.5 million. Our effective tax rate for 2023 was 28.8% compared to 35.9% for 2022. The adjusted effective tax rate was 28.7% and license28.1% for 2023 and 2022, respectively.
•Diluted earnings per share were $12.20 for 2023 compared to $6.68 in 2022. Adjusted diluted earnings per share were $12.77 for 2023 compared to $10.07 in 2022.
Market Conditions and Trends
Macroeconomic conditions, supply arrangementchain disruption, and the COVID-19 pandemic have impacted our business and operating costs. Certain trends are expected to continue throughout 2024, with the impact varying by market.
Macroeconomic Conditions
Macroeconomic conditions, including foreign currency fluctuations, have impacted our financial results. Foreign currency fluctuations reduced the growth of our net revenue by $89.8 million when comparing 2023 to 2022, primarily due to the overall appreciation of the US dollar. We expect future exchange rate volatility to impact our results. We have also experienced increased wage rates which consistsincreased our employee costs when comparing 2023 to 2022.
Consumer purchasing behaviors and their propensity to spend in our sector have been impacted by uncertain economic conditions including inflation, higher interest rates, and other factors. While we experienced traffic and net revenue growth in 2023 in all markets, over the course of royalties2023 we saw moderation in the year over year traffic and net revenue growth in the Americas. We continue to monitor macroeconomic conditions and the trends in consumer demand for our products.
Supply Chain Disruption
In 2021 and 2022 we experienced supply chain disruption, including delays in inbound delivery of our products as well as salesin manufacturing. This supply chain disruption caused us to use higher cost modes of transport, including increasing our use of air freight. We saw an improvement in the supply chain disruption during the second half of 2022 and during 2023, including reductions in freight costs and reductions in our levels of air freight usage.
COVID-19 Pandemic
Most of our productsretail locations were open throughout 2023, 2022, and 2021, with certain locations temporarily closed due to licensees.
CostCOVID-19 resurgences during the first quarter of goods sold includes the cost2022 and at various times in 2021. The effect of purchased merchandise,COVID-19, including freight, duty,store closures, impacted our revenue and nonrefundable taxes incurredoperating margins in delivering the goods to our distribution centers. It also includes occupancy costs and depreciation expense for our company-operated store locations, all costs incurred in operating our distribution centers and production, design, distribution, and merchandise departments, hemming, shrink, and inventory provision expense. The primary drivers of the costs of individual products are the costs of raw materials and labor in the countries where we source our merchandise.
Selling, general and administrative expenses consist of all operating costs not otherwise included in cost of goods sold or asset impairment and restructuring costs. We expect selling, general and administrative expenses to increase in fiscal 2018 as we incur additional operating expenses to support our store and direct to consumer growth, while also making strategic investments to support the long term growth of the business.
Asset impairment and restructuring costs consist of the lease termination, impairment of property and equipment, employee related costs, and other restructuring costs recognized in connection with the restructuring of our ivivva operations.
Income tax expense depends on the statutory tax rates in the countries where we sell our products2021 and the proportionfirst quarter of taxable income earned2022 in those jurisdictions. To the extent the relative proportion of taxable income in the jurisdictions fluctuates, or the tax legislation in the respective jurisdictions changes, so will our effective tax rate. We also anticipate that, in the future, we may start to sell our products through retail locations in countries in which we have not yet operated, in which case, we would become subject to taxation based on the foreign statutory rates in the countries where these sales take place and our effective tax rate could fluctuate accordingly.China Mainland.
Results of Operations
The following tables summarizetable summarizes key components of our results of operations for the periods indicated, both in dollars and as a percentage of net revenue:indicated:
| | | | | | | | | | | | | | | | | | | | | | | | | | | | | | | | | | | | | | |
| | | 2023 | | 2022 | | 2021 | | 2023 | | 2022 | | 2021 |
| | | (In thousands) | | (Percentage of net revenue) |
| Net revenue | | $ | 9,619,278 | | | $ | 8,110,518 | | | $ | 6,256,617 | | | 100.0 | % | | 100.0 | % | | 100.0 | % |
| Cost of goods sold | | 4,009,873 | | | 3,618,178 | | | 2,648,052 | | | 41.7 | | | 44.6 | | | 42.3 | |
| Gross profit | | 5,609,405 | | | 4,492,340 | | | 3,608,565 | | | 58.3 | | | 55.4 | | | 57.7 | |
| Selling, general and administrative expenses | | 3,397,218 | | | 2,757,447 | | | 2,225,034 | | | 35.3 | | | 34.0 | | | 35.6 | |
| Impairment of goodwill and other assets, restructuring costs | | 74,501 | | | 407,913 | | | — | | | 0.8 | | | 5.0 | | | — | |
| Amortization of intangible assets | | 5,010 | | | 8,752 | | | 8,782 | | | 0.1 | | | 0.1 | | | 0.1 | |
| Acquisition-related expenses | | — | | | — | | | 41,394 | | | — | | | — | | | 0.7 | |
| Gain on disposal of assets | | — | | | (10,180) | | | — | | | — | | | (0.1) | | | — | |
| Income from operations | | 2,132,676 | | | 1,328,408 | | | 1,333,355 | | | 22.2 | | | 16.4 | | | 21.3 | |
| Other income (expense), net | | 43,059 | | | 4,163 | | | 514 | | | 0.4 | | | 0.1 | | | — | |
| Income before income tax expense | | 2,175,735 | | | 1,332,571 | | | 1,333,869 | | | 22.6 | | | 16.4 | | | 21.3 | |
| Income tax expense | | 625,545 | | | 477,771 | | | 358,547 | | | 6.5 | | | 5.9 | | | 5.7 | |
| Net income | | $ | 1,550,190 | | | $ | 854,800 | | | $ | 975,322 | | | 16.1 | % | | 10.5 | % | | 15.6 | % |
|
| | | | | | | | | | | | |
| | | Fiscal Year Ended |
| | | January 28, 2018 | | January 29, 2017 | | January 31, 2016 |
| | | (In thousands) |
| Net revenue | | $ | 2,649,181 |
| | $ | 2,344,392 |
| | $ | 2,060,523 |
|
| Cost of goods sold | | 1,250,391 |
| | 1,144,775 |
| | 1,063,357 |
|
| Gross profit | | 1,398,790 |
| | 1,199,617 |
| | 997,166 |
|
| Selling, general and administrative expenses | | 904,264 |
| | 778,465 |
| | 628,090 |
|
| Asset impairment and restructuring costs | | 38,525 |
| | — |
| | — |
|
| Income from operations | | 456,001 |
| | 421,152 |
| | 369,076 |
|
| Other income (expense), net | | 3,997 |
| | 1,577 |
| | (581 | ) |
| Income before income tax expense | | 459,998 |
| | 422,729 |
| | 368,495 |
|
| Income tax expense | | 201,336 |
| | 119,348 |
| | 102,448 |
|
| Net income | | $ | 258,662 |
| | $ | 303,381 |
| | $ | 266,047 |
|
|
| | | | | | | | | |
| | | Fiscal Year Ended |
| | | January 28, 2018 | | January 29, 2017 | | January 31, 2016 |
| | | (Percentages) |
| Net revenue | | 100.0 | % | | 100.0 | % | | 100.0 | % |
| Cost of goods sold | | 47.2 |
| | 48.8 |
| | 51.6 |
|
| Gross profit | | 52.8 |
| | 51.2 |
| | 48.4 |
|
| Selling, general and administrative expenses | | 34.1 |
| | 33.2 |
| | 30.5 |
|
| Asset impairment and restructuring costs | | 1.5 |
| | — |
| | — |
|
| Income from operations | | 17.2 |
| | 18.0 |
| | 17.9 |
|
| Other income (expense), net | | 0.2 |
| | — |
| | — |
|
| Income before income tax expense | | 17.4 |
| | 18.0 |
| | 17.9 |
|
| Income tax expense | | 7.6 |
| | 5.1 |
| | 5.0 |
|
| Net income | | 9.8 | % | | 12.9 | % | | 12.9 | % |
Comparison of Fiscal 20172023 to Fiscal 20162022
Net Revenue
Net revenue increased $304.8 million,$1.5 billion, or 13%19%, to $2.6$9.6 billion in fiscal 20172023 from $2.3$8.1 billion in fiscal 2016.2022. On a constant dollar basis, assuming the average exchange rates in fiscal 2017 remained constant with the average exchange rates in fiscal 2016, net revenue increased $290.6 million, or 12%20%.
The increase in net revenue was primarily due to net revenue generated by new company-operated stores as well as increased direct to consumer net revenue. Total comparable sales, which includes comparable store sales and direct to consumer, increased 7% in fiscal 2017 compared to fiscal 2016. Total comparable Comparable sales increased 7% on a constant dollar basis.
Our net revenue on a segment basis for fiscal 2017 and fiscal 2016 is summarized below. Net revenue is expressed in dollar amounts. The percentages are presented as a percentage of total net revenue.
|
| | | | | | | | | | | | | | |
| | | Fiscal Years Ended January 28, 2018 and January 29, 2017 |
| | | 2017 | | 2016 | | 2017 | | 2016 |
| | | (In thousands) | | (Percentages) |
| Company-operated stores | | $ | 1,837,065 |
| | $ | 1,704,357 |
| | 69.3 | % | | 72.7 | % |
| Direct to consumer | | 577,590 |
| | 453,287 |
| | 21.8 |
| | 19.3 |
|
| Other | | 234,526 |
| | 186,748 |
| | 8.9 |
| | 8.0 |
|
| Net revenue | | $ | 2,649,181 |
| | $ | 2,344,392 |
| | 100.0 | % | | 100.0 | % |
Company-Operated Stores. Net revenue from our company-operated stores segment increased $132.7 million, or 8%, to $1.8 billion in fiscal 2017 from $1.7 billion in fiscal 2016. The following contributed to the increase in net revenue from our company-operated stores segment:
Net revenue from company-operated stores we opened or significantly expanded subsequent to January 29, 2017, and are therefore not included in comparable store sales, increased net revenue by $146.5 million. During fiscal 2017 we opened 46 net new lululemon branded company-operated stores, including 30 stores in North America, 14 stores in Asia Pacific, and two stores in Europe.
A comparable store sales increase of 1% in fiscal 2017 compared to fiscal 2016 resulted in a $12.8 million increase to net revenue. Comparable store sales increased 1%13%, or $5.4 million on a constant dollar basis. The increase in comparable store sales was primarily a result of improved conversion rates and increased dollar value per transaction. This was partially offset by a decrease in store traffic, due in part to shifting retail traffic trends from in-store to online.
These increases in net revenue were partially offset by the closure of 48 of our ivivva branded company-operated stores as part of the restructuring of our ivivva operations. These closures reduced our fiscal 2017 net revenue from company-operated stores by $26.6 million compared to fiscal 2016.
Direct to Consumer. Net revenue from our direct to consumer segment increased $124.3 million, or 27%, to $577.6 million in fiscal 2017 from $453.3 million in fiscal 2016. Direct to consumer net revenue increased 27%14% on a constant dollar basis. The increase in net revenue from our direct to consumer segment was primarily thedue to increased Americas net revenue. China Mainland and Rest of World net revenue also increased.
Net revenue for 2023 and 2022 is summarized below, and reflects our updated segments, including comparatives.
| | | | | | | | | | | | | | | | | | | | | | | | | | | | | | | | | | | | | | | | | | | | |
| | 2023 | | 2022 | | 2023 | | 2022 | | Year over year change |
| | | (In thousands) | | (Percentage of net revenue) | | (In thousands) | | (Percentage) | | (Constant dollar change) |
| Americas | | $ | 7,631,647 | | | $ | 6,817,454 | | | 79.3 | % | | 84.1 | % | | $ | 814,193 | | | 11.9 | % | | 12.0 | % |
| China Mainland | | 963,760 | | | 576,503 | | | 10.0 | | | 7.1 | | | 387,257 | | | 67.2 | | | 75.0 | |
| Rest of World | | 1,023,871 | | | 716,561 | | | 10.6 | | | 8.8 | | | 307,310 | | | 42.9 | | | 44.0 | |
| Net revenue | | $ | 9,619,278 | | | $ | 8,110,518 | | | 100.0 | % | | 100.0 | % | | $ | 1,508,760 | | | 18.6 | % | | 20.0 | % |
Americas. The increase in Americas net revenue was primarily due to an increase in comparable sales, which increased 8%, or 9% on a constant dollar basis. The increase in comparable sales was primarily a result of increased traffic, partially offset by a lower dollar value per transaction and a decrease in conversion rates. The increase in Americas net revenue was also driven by a $327.6 million increase in non-comparable sales, primarily from our company-operated stores that were opened or significantly expanded since 2022 as well as increased outlet, wholesale, and license and supply arrangement net revenue, partially offset by fewer temporary locations and lower lululemon Studio net revenue.
China Mainland. The increase in China Mainland net revenue was primarily due to an increase in comparable sales, which increased 39%, or 46% on our e-commerce websites, improveda constant dollar basis. The increase in comparable sales was primarily a result of increased traffic, partially offset by a decrease in conversion rates and increaseda lower dollar value per transaction. The increase in China Mainland net revenue was also driven by a $180.6 million increase in non-comparable sales, primarily from our company-operated stores that were opened or significantly expanded since 2022 as well as increased net revenue from outlets.
Rest of World. The increase in Rest of World net revenue was primarily due to an increase in comparable sales, which increased 32%, or 33% on a constant dollar basis. The increase in comparable sales was primarily a result of increased traffic, partially offset by a decrease in conversion rates. The increase in Rest of World net revenue was also driven by a $118.9 million increase in non-comparable sales, primarily from our company-operated stores that were opened or significantly expanded since 2022 as well as increased license and supply arrangements and outlets net revenue.
Gross Profit
| | | | | | | | | | | | | | | | | | | | | | | | | | |
| | 2023 | | 2022 | | Year over year change |
| | (In thousands) | | (In thousands) | | (Percentage) |
| Gross profit | | $ | 5,609,405 | | | $ | 4,492,340 | | | $ | 1,117,065 | | | 24.9 | % |
| | | | | | | | |
| Gross margin | | 58.3 | % | | 55.4 | % | | 290 basis points |
During 2022, we decided to shift our lululemon Studio strategy to focus on providing digital app-based services. While we continued to sell at-home hardware in 2023, we reached the seconddecision to cease selling the lululemon Studio Mirror during the third quarter of fiscal 2017, we held online warehouse sales2023. These strategy shifts resulted in the United Statesrecognition of an inventory obsolescence provision of $62.9 million in 2022 and Canada which generated net revenuea further provision of $12.3 million. We did not hold any online warehouse sales during fiscal 2016. Excluding$23.7 million in 2023. These provisions reduced gross margin by 80 basis points and 30 basis points in 2022 and 2023 respectively. Please refer to Note 8. Impairment of Goodwill and Other Assets, Restructuring Costs included in Item 8 of Part II of this report.
Gross margin increased 290 basis points, or excluding the impact of the online warehouse sales, direct to consumerlululemon Studio obsolescence provisions detailed above, increased 240 basis points. This 240 basis point net revenue increased 25%.
Other. Net revenue from our other segment increased $47.8 million, or 26%, to $234.5 million in fiscal 2017 from $186.7 million in fiscal 2016. This increase was primarily thea result of anof:
•a net increase in product margin of 290 basis points, primarily due to lower freight costs from rate reductions and reduced air freight, as well as lower duty costs, modestly offset by higher inventory provisions and shrink in the numbercurrent year;
•an unfavorable impact of outlets, increased net revenue at existing outlets,foreign currency exchange rates of 20 basis points; and
•deleverage on occupancy costs of 20 basis points and an increase in the number of temporary locations. The increase in net revenue fromcosts related to our other segment was partially offset by lower net revenue from showrooms, primarily due a decrease in the number of showrooms open during fiscal 2017 compared to fiscal 2016.
Gross Profit
Gross profit increased $199.2 million, or 17%, to $1.4 billion in fiscal 2017 from $1.2 billion in fiscal 2016.
Gross profitdistribution centers as a percentage of net revenue or gross margin, increased 160 basis points, to 52.8% in fiscal 2017 from 51.2% in fiscal 2016. The increase in gross margin was primarily the result of:
an increase in product margin of 200 basis points which was primarily due to lower product costs and a favorable mix of higher margin product, partially offset by higher markdowns, and higher shrink and damages; and
a favorable impact of foreign exchange rates of 10 basis points.
This was partially offset by an increase in fixed costs related to our product and supply chain departments of 20 basis points, and costs incurred in connection with the restructuring of our ivivva operations of 30 basis points.
During fiscal 2017, as a result of the restructuring of our ivivva operations, we recognized costs totaling $8.7 million within costs of goods sold, as outlined in Note 13 to the audited consolidated financial statements included in Item 8 of Part II
of this report. Excluding these charges, adjusted gross profit increased 17.3% to $1.4 billion and adjusted gross margin increased 190 basis points to 53.1% compared to fiscal 2016.
Selling, General and Administrative Expenses
Selling, general and administrative expenses increased $125.8 million, or 16%, to $904.3 million in fiscal 2017 from $778.5 million in fiscal 2016. | | | | | | | | | | | | | | | | | | | | | | | | | | |
| | 2023 | | 2022 | | Year over year change |
| | (In thousands) | | (In thousands) | | (Percentage) |
| Selling, general and administrative expenses | | $ | 3,397,218 | | | $ | 2,757,447 | | | $ | 639,771 | | | 23.2 | % |
| | | | | | | | |
| Selling, general and administrative expenses as a percentage of net revenue | | 35.3 | % | | 34.0 | % | | 130 basis points |
The increase in selling, general and administrative expenses was primarily due to:
•an increase in head office costs of $327.7 million, comprised of:
–an increase in employee costs of $108.8 million primarily due to increased salaries and wages expense as well as increased stock-based compensation and incentive compensation, primarily as a result of headcount growth and increased wage rates;
–an increase in brand and community costs of $95.4 million primarily due to increased marketing expenses;
–an increase in depreciation of $46.0 million;
–an increase in other head office costs of $40.4 million, primarily due to increased professional fees; and
–an increase in technology costs, including cloud computing amortization, of $37.1 million.
•an increase in costs related to our operating channels of $91.4$319.1 million, comprised of:
| |
– | an increase in employee costs of $32.8 million primarily from a growth in labor hours and benefits, mainly associated with new company-operated stores and other new operating locations; |
| |
– | an increase in variable costs such as distribution costs and credit card fees of $16.4 million primarily as a result of increased net revenue; and |
| |
– | an increase in other costs of $42.2 million primarily due to an increase in digital marketing expenses, website related costs including photography costs, brand and community costs, information technology related costs, and other costs associated with our operating locations; |
–an increase in head officeemployee costs of $50.0$145.1 million comprised of:primarily due to increased salaries and wages expense, incentive compensation, and benefit costs for retail employees, primarily from the growth in our business and increased wage rates;
| |
– | an increase in employee costs of $19.3 million primarily due to additional employees to support the growth in our business; and |
| |
– | an increase in other costs of $30.7 million primarily due to increases in information technology related costs, brand and community costs, and professional fees. |
–an increase in other operating costs of $67.7 million primarily due to increased depreciation costs, technology costs, and repairs and maintenance costs;
–an increase in variable costs of $66.8 million primarily due to increased credit card fees, distribution costs, and packaging costs, primarily as a result of increased net revenue; and
–an increase in brand and community costs of $39.5 million primarily due to increased digital marketing expenses.
The increase in selling, general and administrative expenses was partially offset by an increasea decrease in net foreign currency exchange and derivative gains of $15.6 million. There were net foreign exchange and derivative gains of $7.3 million in fiscal 2017 compared to net foreign exchangerevaluation losses of $8.3 million in fiscal 2016. The net foreign exchange gains$7.0 million.
Impairment of Goodwill and losses primarily relate to the revaluation of U.S. dollar denominated monetary assets and liabilities held by Canadian subsidiaries. During fiscal 2017, we began entering into forward currency contracts designed to economically hedge these foreign exchange revaluation gains and losses. We have not applied hedge accounting to these instruments and the change in fair value of these derivatives is recorded within selling, general and administrative expenses.
As a percentage of net revenue, selling, general and administrative expenses increased 90 basis points, to 34.1% in fiscal 2017 from 33.2% in fiscal 2016.
Asset Impairment andOther Assets, Restructuring Costs
As a result of the restructuring of our ivivva operations, | | | | | | | | | | | | | | | | | | | | | | | | | | |
| | 2023 | | 2022 | | Year over year change |
| | (In thousands) | | (In thousands) | | (Percentage) |
| Impairment of goodwill and other assets, restructuring costs | | $ | 74,501 | | | $ | 407,913 | | | $ | (333,412) | | | (81.7) | % |
During 2023, we recognized certain asset impairmentimpairments and restructuring costs, and during 2022, we recognized impairment of $38.5 million in fiscal 2017. This includes lease termination costs of $21.1 million, long-lived asset impairment charges of $11.6 million, employee related costs of $4.2 million,goodwill and other restructuring costs of $1.6 million. We did not have any asset impairment and restructuring costsassets, each in fiscal 2016.relation to lululemon Studio. Please refer to Note 13 to the audited consolidated financial statements8. Impairment of Goodwill and Other Assets, Restructuring Costs included in Item 8 of Part II of this report for further informationinformation.
Amortization of Intangible Assets
| | | | | | | | | | | | | | | | | | | | | | | | | | |
| | 2023 | | 2022 | | Year over year change |
| | (In thousands) | | (In thousands) | | (Percentage) |
| Amortization of intangible assets | | $ | 5,010 | | | $ | 8,752 | | | $ | (3,742) | | | (42.8) | % |
The amortization of intangible assets was primarily the result of the amortization of intangible assets recognized upon the acquisition of MIRROR, which we rebranded as lululemon Studio.
Gain on these adjustments.Disposal of Assets
| | | | | | | | | | | | | | | | | | | | | | | | | | |
| | 2023 | | 2022 | | Year over year change |
| | (In thousands) | | (In thousands) | | (Percentage) |
| Gain on disposal of assets | | $ | — | | | $ | (10,180) | | | $ | 10,180 | | | (100.0) | % |
During the second quarter of 2022, we completed the sale of an administrative office building, which resulted in a pre-tax gain of $10.2 million.
Income from Operations
Income from operations increased $34.8 million, or 8%, to $456.0 million in fiscal 2017 from $421.2 million in fiscal 2016. Operating margin decreased 80 basis points to 17.2% compared to 18.0% in fiscal 2016.
In connection with the restructuring of our ivivva operations, we recognized pre-tax costs totaling $47.2 million in fiscal 2017. This includes asset impairment and restructuring costs of $38.5 million and costs recognized in cost of goods sold totaling $8.7 million. Excluding these charges, adjusted income from operations increased 19% to $503.2 million and adjusted operating margin increased 100 basis points to 19.0%.
On a segment basis, we determine income from operations without taking into account our general corporate expenses and the costs we incur in connection with the restructuring of our ivivva operations.
Incomecertain other expenses. Segmented income from operations before general corporate expenses and restructuring related costs for fiscal 2017 and fiscal 2016 is summarized below and is expressedbelow. Our prior year segment results have been recast to reflect our new segment reporting structure.
| | | | | | | | | | | | | | | | | | | | | | | | | | | | | | | | | | | | | | |
| | 2023 | | 2022 | | 2023 | | 2022 | | Year over year change |
| | (In thousands) | | (Percentage of net revenue of respective operating segment) | | (In thousands) | | (Percentage) |
| Segmented income from operations: |
| Americas | | $ | 2,937,184 | | | $ | 2,503,740 | | | 38.5 | % | | 36.7 | % | | $ | 433,444 | | | 17.3 | % |
| China Mainland | | 337,316 | | | 196,865 | | | 35.0 | | | 34.1 | | | 140,451 | | | 71.3 | |
| Rest of World | | 201,832 | | | 103,204 | | | 19.7 | | | 14.4 | | | 98,628 | | | 95.6 | |
| | $ | 3,476,332 | | | $ | 2,803,809 | | | | | | | $ | 672,523 | | | 24.0 | % |
| General corporate expenses | | 1,240,436 | | | 1,005,988 | | | | | | | 234,448 | | | 23.3 | |
| lululemon Studio obsolescence provision | | 23,709 | | | 62,928 | | | | | | | (39,219) | | | (62.3) | |
| Impairment of goodwill and other assets, restructuring costs | | 74,501 | | | 407,913 | | | | | | | (333,412) | | | (81.7) | |
| Amortization of intangible assets | | 5,010 | | | 8,752 | | | | | | | (3,742) | | | (42.8) | |
| Gain on disposal of assets | | — | | | (10,180) | | | | | | | 10,180 | | | (100.0) | |
| Income from operations | | $ | 2,132,676 | | | $ | 1,328,408 | | | | | | | $ | 804,268 | | | 60.5 | % |
| Operating margin | | 22.2 | % | | 16.4 | % | | | | | | 580 basis points |
Americas. The increase in dollar amounts. The percentages are presented as a percentage of net revenue of the respective operating segments.
|
| | | | | | | | | | | | | | |
| | | Fiscal Years Ended January 28, 2018 and January 29, 2017 |
| | | 2017 | | 2016 | | 2017 | | 2016 |
| | | (In thousands) | | (Percentages) |
| Company-operated stores | | $ | 464,321 |
| | $ | 415,635 |
| | 25.3 | % | | 24.4 | % |
| Direct to consumer | | 231,295 |
| | 186,178 |
| | 40.0 |
| | 41.1 |
|
| Other | | 35,580 |
| | 22,312 |
| | 15.2 |
| | 11.9 |
|
| Income from operations before general corporate expenses | | 731,196 |
| | 624,125 |
| | | | |
| General corporate expenses | | 227,972 |
| | 202,973 |
| | | | |
| Restructuring and related costs | | 47,223 |
| | — |
| | | | |
| Income from operations | | $ | 456,001 |
| | $ | 421,152 |
| | | | |
Company-Operated Stores. IncomeAmericas income from operations from our company-operated stores segment increased $48.7 million, or 12%, to $464.3 million for fiscal 2017 from $415.6 million for fiscal 2016. The increase was primarily the result of an increase inincreased gross profit of $89.4$691.7 million, which was primarily due todriven by increased net revenue and higher gross margin. The increase in gross margin was primarily due to higher product margin, partially offset by deleverage on distribution center costs. The increase in gross profit was partially offset by an increase in selling, general and administrative expenses, primarily due to higher employee costs, increased digital marketing expenses, increased credit card fees, packaging costs, and distribution costs driven by higher net revenue, and
increased depreciation, and technology costs. Income from operations as a percentage of Americas net revenue increased due to higher gross margin, partially offset by deleverage on selling, general and administrative expenses.
China Mainland. The increase in China Mainland income from operations was primarily the result of increased gross profit of $228.1 million, driven by increased net revenue. Gross margin was consistent year over year, primarily due to leverage on occupancy and other costs, partially offset by unfavorable foreign currency exchange rates and lower product margin. The increase in gross profit was partially offset by an increase in selling, general and administrative expenses including increased storeprimarily due to higher employee costs, as well as increased brand and communitydigital marketing expenses, increased packaging costs, distribution costs, and increased operating expenses associated withcredit card fees driven by higher net revenuesrevenue, and new stores.increased technology costs. Income from operations as a percentage of company-operated storesChina Mainland net revenue increased by 90 basis points primarily due to increased gross margin, partially offset by deleverage ofleverage on selling, general and administrative expenses.
Direct to Consumer. Income
Rest of World. The increase in Rest of World income from operations from our direct to consumer segment increased $45.1 million, or 24%, to $231.3 million in fiscal 2017 from $186.2 million in fiscal 2016. The increase was primarily the result of an increase inincreased gross profit of $88.7$190.2 million, which was primarily due todriven by increased net revenue and higher gross margin. The increase in gross margin was primarily due to higher product margin as well as leverage on occupancy and other costs, partially offset by unfavorable foreign currency exchange rates. The increase in gross profit was partially offset by an increase in selling, general and administrative expenses includingprimarily due to higher employee costs, as well as increased digital marketing expenses, website relatedincreased distribution costs, and higher variable costs such as packaging, distribution and credit card fees, as a result ofand packaging costs driven by higher net revenue.revenue, and increased technology costs. Income from operations as a percentage of direct to consumerRest of World net revenue has decreased by 110 basis points primarilyincreased due to deleverage ofhigher gross margin and leverage on selling, general and administrative expenses.
General Corporate Expenses. The increase in general corporate expenses was primarily due to increased employee costs, as well as increased brand and community costs, depreciation, technology costs, professional fees, and product team costs. The increase in general corporate expenses was partially offset by a decrease in net foreign currency exchange and derivative losses of $7.0 million.
Other Income (Expense), Net
| | | | | | | | | | | | | | | | | | | | | | | | | | |
| | 2023 | | 2022 | | Year over year change |
| | (In thousands) | | (In thousands) | | (Percentage) |
| Other income (expense), net | | $ | 43,059 | | | $ | 4,163 | | | $ | 38,896 | | | 934.3 | % |
The increase in other income, net was primarily due to an increase in interest income as a result of higher cash balances and higher interest rates.
Income Tax Expense
| | | | | | | | | | | | | | | | | | | | | | | | | | |
| | 2023 | | 2022 | | Year over year change |
| | (In thousands) | | (In thousands) | | (Percentage) |
| Income tax expense | | $ | 625,545 | | | $ | 477,771 | | | $ | 147,774 | | | 30.9 | % |
| | | | | | | | |
| Effective tax rate | | 28.8 | % | | 35.9 | % | | (710) basis points |
The decrease in the effective tax rate was primarily due the income tax impact of certain non-deductible impairment and other charges recognized in 2022 and 2023 related to lululemon Studio, partially offset by a lower tax rate on the gain on the sale of an administrative building in 2022. These items increased the effective tax rate by 780 basis points and 10 basis points in 2022 and 2023, respectively.
Excluding the income tax effects of the impairment and other charges recognized in 2022 and 2023 in relation to lululemon Studio, and excluding the tax effect of the gain on the sale of the administrative building in 2022, the adjusted effective tax rate increased to 28.7% in 2023 from 28.1% in 2022.
The increase in the adjusted effective tax rate was primarily due to withholding taxes on unremitted earnings which are not considered to be permanently reinvested, partially offset by adjustments upon the filing of certain income tax returns, and a decrease in U.S. state taxes.
Net Income
| | | | | | | | | | | | | | | | | | | | | | | | | | |
| | 2023 | | 2022 | | Year over year change |
| | (In thousands) | | (In thousands) | | (Percentage) |
| Net income | | $ | 1,550,190 | | | $ | 854,800 | | | $ | 695,390 | | | 81.4 | % |
The increase in net income in 2023 was primarily due to an increase in gross profit of $1.1 billion, an increase in other income (expense), net of $38.9 million, and impairment and restructuring charges recognized in 2023 of $74.5 million compared to impairment charges of $407.9 million recognized in 2022, partially offset by an increase in selling, general and administrative expenses of $639.8 million, an increase in income tax expense of $147.8 million, and a gain on disposal of assets of $10.2 million in the prior year.
Excluding certain inventory provisions, goodwill and other asset impairments, and restructuring costs recognized in relation to lululemon Studio in 2023 and 2022 and the gain on sale of an administrative building in 2022, and their tax effects, adjusted net income increased $333.4 million or 26%.
Comparison of 2022 to 2021
Net Revenue
Net revenue increased $1.9 billion, or 30%, to $8.1 billion in 2022 from $6.3 billion in 2021. On a constant dollar basis, net revenue increased 32%. Comparable sales increased 25%, or 28% on a constant dollar basis. The increase in net revenue was primarily due to increased Americas net revenue. China Mainland and Rest of World net revenue also increased.
Net revenue for 2022 and 2021 is summarized below, and reflects our updated segments, including comparatives.
| | | | | | | | | | | | | | | | | | | | | | | | | | | | | | | | | | | | | | | | | | | | |
| | 2022 | | 2021 | | 2022 | | 2021 | | Year over year change |
| | | (In thousands) | | (Percentage of net revenue) | | (In thousands) | | (Percentage) | | (Constant dollar change) |
| Americas | | $ | 6,817,454 | | | $ | 5,299,906 | | | 84.1 | % | | 84.7 | % | | $ | 1,517,548 | | | 28.6 | % | | 30.0 | % |
| China Mainland | | 576,503 | | | 434,261 | | | 7.1 | | | 6.9 | | | 142,242 | | | 32.8 | | | 40.0 | |
| Rest of World | | 716,561 | | | 522,450 | | | 8.8 | | | 8.4 | | | 194,111 | | | 37.2 | | | 49.0 | |
| Net revenue | | $ | 8,110,518 | | | $ | 6,256,617 | | | 100.0 | % | | 100.0 | % | | $ | 1,853,901 | | | 29.6 | % | | 32.0 | % |
Americas. The increase in Americas net revenue was primarily due to an increase in comparable sales, which increased 28%, or 29% on a constant dollar basis. The increase in comparable sales was primarily a result of increased traffic, partially offset by a decrease in conversion rates. Americas net revenue also increased due to a $296.9 million increase in non-comparable sales, primarily from our company-operated stores that were opened or significantly expanded since 2021 as well as increased outlet, wholesale, and re-commerce net revenue, partially offset by lower license and supply arrangement and lululemon Studio net revenue.
China Mainland. The increase in China Mainland net revenue was primarily due to an increase in comparable sales, which increased 17%, or 23% on a constant dollar basis. The increase in comparable sales was primarily a result of increased traffic, partially offset by a decrease in conversion rates. The increase in China Mainland net revenue was also driven by a $77.5 million increase in non-comparable sales, primarily from our company-operated stores that were opened or significantly expanded since 2021.
Rest of World. The increase in Rest of World net revenue was primarily due to a $151.5 million increase in non-comparable sales, primarily from our company-operated stores that were opened or significantly expanded since 2021 as well as increased license and supply arrangements, outlets, and wholesale net revenue. The increase in Rest of World net revenue was also driven by an increase in comparable sales, which increased 10%, or 19% on a constant dollar basis. The increase in comparable sales was primarily a result of increased traffic, partially offset by a decrease in conversion rates.
Gross Profit
| | | | | | | | | | | | | | | | | | | | | | | | | | |
| | 2022 | | 2021 | | Year over year change |
| | (In thousands) | | (In thousands) | | (Percentage) |
| Gross profit | | $ | 4,492,340 | | | $ | 3,608,565 | | | $ | 883,775 | | | 24.5 | % |
| | | | | | | | |
| Gross margin | | 55.4 | % | | 57.7 | % | | (230) basis points |
During 2022, we updated our lululemon Studio strategy to focus on digital app-based services, which meant we no longer expected to be able to sell all of the in-home hardware inventory above cost. We recognized a provision of $62.9 million against hardware inventory during 2022. This reduced 2022 gross margin.margin by 80 basis points. Please refer to Note 8. Impairment of Goodwill and Other Assets, Restructuring Costs included in Item 8 of Part II of this report.
Other.The remaining 150 basis point decrease in gross margin was primarily the result of:
•a decrease in product margin of 100 basis points primarily due to higher markdowns, sales mix, and increased damages and shrink, partially offset by lower air freight costs;
•an increase in costs related to our product departments and distribution centers as a percentage of net revenue of 60 basis points; and
•an unfavorable impact of foreign currency exchange rates of 40 basis points.
The decrease in gross margin was partially offset by leverage on occupancy and depreciation costs of 50 basis points, driven primarily by the increase in net revenue.
Selling, General and Administrative Expenses
| | | | | | | | | | | | | | | | | | | | | | | | | | |
| | 2022 | | 2021 | | Year over year change |
| | (In thousands) | | (In thousands) | | (Percentage) |
| Selling, general and administrative expenses | | $ | 2,757,447 | | | $ | 2,225,034 | | | $ | 532,413 | | | 23.9 | % |
| | | | | | | | |
| Selling, general and administrative expenses as a percentage of net revenue | | 34.0 | % | | 35.6 | % | | (160) basis points |
The increase in selling, general and administrative expenses was primarily due to:
•an increase in head office costs of $283.7 million, comprised of:
–an increase in costs of $142.2 million primarily due to increased depreciation of $43.5 million and increased technology costs, including cloud computing amortization, of $35.7 million, as well as increased brand and community costs and professional fees; and
–an increase in employee costs of $141.5 million primarily due to an increase in salaries and wages expense of $76.5 million and incentive compensation of $34.8 million, as well as increased stock-based compensation expense and travel costs, primarily as a result of headcount growth and increased wage rates.
•an increase in costs related to our operating channels of $249.5 million, comprised of:
–an increase in variable costs of $127.6 million primarily due to an increase in distribution costs and credit card fees, primarily as a result of increased net revenue;
–an increase in employee costs of $104.2 million primarily due to an increase in salaries and wages expense and incentive compensation in our company-operated store and e-commerce channels, primarily due to growth in our business and increased wage rates;
–an increase in other costs of $15.3 million primarily due to an increase in repairs and maintenance costs, depreciation, and technology costs, partially offset by a decrease in professional fees; and
–an increase in brand and community costs of $2.4 million primarily due to an increase in digital marketing expenses related to our e-commerce channel, partially offset by a decrease in marketing expenses related to lululemon Studio.
The increase in selling, general and administrative expenses was partially offset by a decrease in net foreign exchange and derivative revaluation losses of $0.8 million.
Impairment of Goodwill and Other Assets, Restructuring Costs
| | | | | | | | | | | | | | | | | | | | | | | | | | |
| | 2022 | | 2021 | | Year over year change |
| | (In thousands) | | (In thousands) | | (Percentage) |
| Impairment of goodwill and other assets, restructuring costs | | $ | 407,913 | | | $ | — | | | $ | 407,913 | | | n/a |
During 2022, we recognized an impairment of goodwill and other long-lived assets in relation to our lululemon Studio business unit. Please refer to Note 8. Impairment of Goodwill and Other Assets, Restructuring Costs included in Item 8 of Part II of this report.
Amortization of Intangible Assets
| | | | | | | | | | | | | | | | | | | | | | | | | | |
| | 2022 | | 2021 | | Year over year change |
| | (In thousands) | | (In thousands) | | (Percentage) |
| Amortization of intangible assets | | $ | 8,752 | | | $ | 8,782 | | | $ | (30) | | | (0.3) | % |
The amortization of intangible assets was primarily the result of the amortization of intangible assets recognized upon the acquisition of MIRROR, which we rebranded as lululemon Studio.
Acquisition-Related Expenses
| | | | | | | | | | | | | | | | | | | | | | | | | | |
| | 2022 | | 2021 | | Year over year change |
| | (In thousands) | | (In thousands) | | (Percentage) |
| Acquisition-related expenses | | $ | — | | | $ | 41,394 | | | $ | (41,394) | | | (100.0) | % |
In connection with our acquisition of MIRROR, we recognized acquisition-related compensation expenses of $38.4 million and transaction and integration related costs of $3.0 million in 2021. There were no acquisition-related expenses in 2022. Please refer to Note 9. Acquisition-Related Expenses included in Item 8 of Part II of this report for further information.
Gain on Disposal of Assets
| | | | | | | | | | | | | | | | | | | | | | | | | | |
| | 2022 | | 2021 | | Year over year change |
| | (In thousands) | | (In thousands) | | (Percentage) |
| Gain on disposal of assets | | $ | (10,180) | | | $ | — | | | $ | (10,180) | | | n/a |
During the second quarter of 2022, we completed the sale of an administrative office building, which resulted in a pre-tax gain of $10.2 million.
Income from Operations
On a segment basis, we determine income from operations without taking into account our general corporate expenses and certain other expenses. Segmented income from operations is summarized below. Our prior segment results have been recast to reflect our othernew segment increased $13.3 million, or 59%, to $35.6 million in fiscal 2017 from $22.3 million in fiscal 2016.reporting structure.
| | | | | | | | | | | | | | | | | | | | | | | | | | | | | | | | | | | | | | |
| | 2022 | | 2021 | | 2022 | | 2021 | | Year over year change |
| | (In thousands) | | (Percentage of net revenue of respective operating segment) | | (In thousands) | | (Percentage) |
| Segmented income from operations: |
| Americas | | $ | 2,503,740 | | | $ | 1,867,016 | | | 36.7 | % | | 35.2 | % | | $ | 636,724 | | | 34.1 | % |
| China Mainland | | 196,865 | | | 167,318 | | | 34.1 | | | 38.5 | | | 29,547 | | | 17.7 | |
| Rest of World | | 103,204 | | | 67,674 | | | 14.4 | | | 13.0 | | | 35,530 | | | 52.5 | |
| | $ | 2,803,809 | | | $ | 2,102,008 | | | | | | | $ | 701,801 | | | 33.4 | % |
| General corporate expenses | | 1,005,988 | | | 718,477 | | | | | | | 287,511 | | | 40.0 | |
| lululemon Studio obsolescence provision | | 62,928 | | | — | | | | | | | 62,928 | | | n/a |
| Impairment of goodwill and other assets, restructuring costs | | 407,913 | | | — | | | | | | | 407,913 | | | n/a |
| Amortization of intangible assets | | 8,752 | | | 8,782 | | | | | | | (30) | | | (0.3) | |
| Acquisition-related expenses | | — | | | 41,394 | | | | | | | (41,394) | | | (100.0) | |
| Gain on disposal of assets | | (10,180) | | | — | | | | | | | (10,180) | | | n/a |
| Income from operations | | $ | 1,328,408 | | | $ | 1,333,355 | | | | | | | $ | (4,947) | | | (0.4) | % |
| Operating margin | | 16.4 | % | | 21.3 | % | | | | | | (490) basis points |
Americas. The increase in Americas income from operations was primarily the result of increased gross profit of $29.8$855.2 million, whichdriven by increased net revenue, partially offset by lower gross margin. The decrease in gross margin was primarily due to increased net revenuelower product margin, partially offset by leverage on occupancy and higher gross margin.other costs. The increase in gross profit was partially offset by an increase in selling, general and administrative expenses, including increasedprimarily due to higher employee costs, as well as increased brand and communitydistribution costs and increased operating expenses associated with new locations andcredit card fees driven by higher net revenues.revenue, and increased technology costs. Income from operations as a percentage of otherAmericas net revenue increased 330 basis points primarily due to an increase in gross margin partially offset by deleverage ofleverage on selling, general and administrative expenses as a percentage of other net revenue.expenses.
General Corporate Expenses. General corporate expenses increased $25.0 million, or 12%, to $228.0 million in fiscal 2017 from $203.0 million in fiscal 2016. This increase was primarily due to increased head office employee costs, a global brand campaign, increases in other brand and community costs, professional fees, depreciation, and information technology related costs. These increases were partially offset by an increase in net foreign exchange and derivative gains of $15.6 million. There were net foreign exchange and derivative gains of $7.3 million in fiscal 2017 compared to net foreign exchange losses of $8.3 million in fiscal 2016. We expect general corporate expenses to continue to increase in future years as we grow our overall business and require increased efforts at our head office to support our company-operated stores, direct to consumer and other segments.
Other Income (Expense), Net
There was net other income of $4.0 million in fiscal 2017 compared to $1.6 million in fiscal 2016. The increase was primarily due to increased net interest income in fiscal 2017 compared to fiscal 2016.China Mainland. The increase in net interestChina Mainland income was primarily due to a net interest expense of $1.7 million which was recorded in fiscal 2016 in relation to certain tax adjustments that are outlined in Note 14 to the audited consolidated financial statements included in Item 8 of Part II of this report, as well as interest earned on our increased cash and cash equivalents in fiscal 2017 compared to fiscal 2016.
Income Tax Expense
Income tax expense increased $82.0 million, or 69%, to $201.3 million in fiscal 2017 from $119.3 million in fiscal 2016.
In fiscal 2017 we recorded certain discrete tax adjustments which resulted in a net $46.6 million increase in income tax expense. These adjustments related to the U.S. Tax Cuts and Jobs Act and to the ivivva restructuring. In fiscal 2016 we recorded certain separate tax adjustments related to the Company's transfer pricing arrangements between Canada and the U.S. The adjustments in fiscal 2016 resulted in an income tax recovery of $10.7 million.
On December 22, 2017, legislation commonly referred to as the U.S. Tax Cuts and Jobs Act ("U.S. tax reform") was enacted. The U.S. tax reform made significant changes to corporate income tax in the United States, including reducing the federal income tax rate from 35% to 21% and imposing a mandatory transition tax on accumulated foreign subsidiary earnings which have not previously been subject to U.S. income tax. As a result of these tax legislation changes we have recognized a provisional income tax expense of $58.9 million for the mandatory transition tax and we have remeasured our deferred income assets and liabilities, resulting in a provisional deferred income tax expense of $0.4 million. In fiscal 2017 we also recognized an income tax recovery of $12.7 million related to the tax effect of the costs recognized in connection with the ivivva restructuring.
In fiscal 2016 we recognized an income tax recovery of $10.7 million as a result of the finalization of an Advance Pricing Arrangement with the Internal Revenue Service and the Canada Revenue Agency. This agreement determines the amount of income which is taxable in each respective jurisdiction, and the final terms of the arrangement resulted in an increased amount of income tax recoverable in the United States.
Further information on the adjustments recognized in both fiscal 2017 and fiscal 2016 is outlined in Notes 13 and 14 to the audited consolidated financial statements included in Item 8 of Part II of this report.
Our effective tax rate for fiscal 2017 was 43.8% compared to 28.2% for fiscal 2016. Our effective tax rate excluding the above tax and related interest adjustments was 30.5% for fiscal 2017 compared to 30.7% for fiscal 2016. The decrease in our adjusted effective tax rate was primarily due to the lower U.S. federal income tax rate which was effective January 1, 2018, a decrease in state taxes, and certain other adjustments.
Net Income
Net income decreased $44.7 million, or 15%, to $258.7 million in fiscal 2017 from $303.4 million in fiscal 2016. The decrease in net income in fiscal 2017 was primarily due to an increase of $125.8 million in selling, general and administrative expenses, an increase of $82.0 million in income tax expense, and asset impairment and restructuring costs of $38.5 million recognized in fiscal 2017, partially offset by a $199.2 million increase in gross profit and an increase in other income (expense), net of $2.4 million.
Comparison of Fiscal 2016 to Fiscal 2015
Net Revenue
Net revenue increased $283.9 million, or 14%, to $2.3 billion in fiscal 2016 from $2.1 billion in fiscal 2015. On a constant dollar basis, assuming the average exchange rates in fiscal 2016 remained constant with the average exchange rates in fiscal 2015, net revenue increased $292.9 million, or 14%.
Net revenue increased across all segments. The increase in net revenue was primarily due to the addition of 43 net new company-operated stores during fiscal 2016, as well as increased comparable store sales and the growth of our direct to consumer segment. Total comparable sales, which includes comparable store sales and direct to consumer, increased 6% in fiscal 2016 compared to fiscal 2015. Total comparable sales increased 7% on a constant dollar basis.
Our net revenue on a segment basis for fiscal 2016 and fiscal 2015 is summarized below. Net revenue is expressed in dollar amounts. The percentages are presented as a percentage of total net revenue.
|
| | | | | | | | | | | | | | |
| | | Fiscal Years Ended January 29, 2017 and January 31, 2016 |
| | | 2016 | | 2015 | | 2016 | | 2015 |
| | | (In thousands) | | (Percentages) |
| Company-operated stores | | $ | 1,704,357 |
| | $ | 1,516,323 |
| | 72.7 | % | | 73.6 | % |
| Direct to consumer | | 453,287 |
| | 401,525 |
| | 19.3 |
| | 19.5 |
|
| Other | | 186,748 |
| | 142,675 |
| | 8.0 |
| | 6.9 |
|
| Net revenue | | $ | 2,344,392 |
| | $ | 2,060,523 |
| | 100.0 | % | | 100.0 | % |
Company-Operated Stores. Net revenue from our company-operated stores segment increased $188.0 million, or 12%, to $1.7 billion in fiscal 2016 from $1.5 billion in fiscal 2015. The following contributed to the increase in net revenue from our company-operated stores segment:
Net revenue from company-operated stores we opened or significantly expanded subsequent to January 31, 2016, and therefore not included in comparable store sales, contributed $126.7 million to the increase. During fiscal 2016 we opened 43 net new company-operated stores, including 31 stores in North America, eight stores in Asia Pacific, and four stores in Europe.
A comparable store sales increase of 4% in fiscal 2016 compared to fiscal 2015 resulted in a $61.3 million increase to net revenue. Comparable store sales increased 5%, or $66.4 million on a constant dollar basis. The increase in comparable store sales was primarily as a result of increased dollar value per transaction and improved conversion rates.
Direct to Consumer. Net revenue from our direct to consumer segment increased $51.8 million, or 13%, to $453.3 million in fiscal 2016 from $401.5 million in fiscal 2015. Direct to consumer net revenue increased 13% on a constant dollar basis. The increase in net revenue from our direct to consumer segmentoperations was primarily the result of increased traffic on our e-commerce websites, increased dollar value per transaction and improved conversion rates.
Other. Net revenue from our other segment increased $44.1gross profit of $70.4 million, or 31%, to $186.7 million in fiscal 2016 from $142.7 million in fiscal 2015. This increase was primarily the result of an increased number of outlets which were open for the full year in fiscal 2016,driven by increased net revenue, at other existing outlets, and an increase in the number of temporary locations.
Gross Profit
Gross profit increased $202.5 million, or 20%, to $1.2 billion in fiscal 2016 from $997.2 million in fiscal 2015.
Gross profit as a percentage of net revenue, orpartially offset by lower gross margin, increased 280 basis points, to 51.2% in fiscal 2016 from 48.4% in fiscal 2015.margin. The increasedecrease in gross margin was primarily the result of an increase in product margin of 330 basis points, primarily due to lower product costs, improved average retail prices,unfavorable foreign currency exchange rates as well as deleverage on distribution center and lower costs related to our raw material commitments.
other costs. The increase in gross margin was partially offset by an increase in expenses related to our product and supply chain departments of 20 basis points, an increase in occupancy costs and depreciation of 20 basis points, and an unfavorable impact of foreign exchange rates of 10 basis points.
Selling, General and Administrative Expenses
Selling, general and administrative expenses increased $150.4 million, or 24%, to $778.5 million in fiscal 2016 from $628.1 million in fiscal 2015. The increase in selling, general and administrative expenses was principally comprised of:
an increase in employee costs for our operating locations of $47.0 million, primarily from a growth in labor hours and bonuses, mainly associated with new company-operated stores;
an increase in head office employee costs of $35.4 million to support the growth in our business;
an increase in head office costs other than employee costs of $21.2 million primarily as a result of increased brand and community costs, increased depreciation, and increased information technology costs;
an increase in net foreign exchange losses of $20.3 million, primarily related to the revaluation of U.S. dollar cash and receivables held in Canadian subsidiaries. There were net foreign exchange losses of $8.3 million in fiscal 2016 compared to net foreign exchange gains of $12.0 million in fiscal 2015;
an increase in other costs of $18.5 million for our operating channels such as digital marketing expenses, repairs and maintenance costs, and increased depreciation; and
an increase in variable costs such as credit card fees and distribution costs of $8.1 million primarily as a result of increased sales.
As a percentage of net revenue, selling, general and administrative expenses increased 270 basis points, to 33.2% in fiscal 2016 from 30.5% in fiscal 2015.
Income from Operations
Income from operations increased $52.1 million, or 14%, to $421.2 million in fiscal 2016 from $369.1 million in fiscal 2015. The increase was a result of increased gross profit of $202.5 million, partially offset by increased selling, general and administrative costs of $150.4 million.
On a segment basis, we determine income from operations without taking into account our general corporate expenses.
Income from operations before general corporate expenses for fiscal 2016 and fiscal 2015 is summarized below and is expressed in dollar amounts. The percentages are presented as a percentage of net revenue of the respective operating segments.
|
| | | | | | | | | | | | | | |
| | | Fiscal Years Ended January 29, 2017 and January 31, 2016 |
| | | 2016 | | 2015 | | 2016 | | 2015 |
| | | (In thousands) | | (Percentages) |
| Company-operated stores | | $ | 415,635 |
| | $ | 346,802 |
| | 24.4 | % | | 22.9 | % |
| Direct to consumer | | 186,178 |
| | 166,418 |
| | 41.1 |
| | 41.4 |
|
| Other | | 22,312 |
| | 5,826 |
| | 11.9 |
| | 4.1 |
|
| Income from operations before general corporate expenses | | 624,125 |
| | 519,046 |
| | | | |
| General corporate expenses | | 202,973 |
| | 149,970 |
| | | | |
| Income from operations | | $ | 421,152 |
| | $ | 369,076 |
| | | | |
Company-Operated Stores. Income from operations from our company-operated stores segment increased $68.8 million, or 20%, to $415.6 million for fiscal 2016 from $346.8 million for fiscal 2015. The increase was primarily the result of an increase in gross profit of $132.8 million, which was primarily due to increased net revenue and higher gross margin. Net revenue increased as a result of new stores as well as increased comparable store sales, which was primarily a result of increased dollar value per transaction and improved conversion rates. This was partially offset by an increase in selling, general and administrative expenses including increased storeprimarily due to higher employee costs, as well as increased digital marketing expenses, increased packaging and distribution costs driven by higher net revenue, and increased operating expenses associated with new stores and increased net revenue at existing stores.technology costs. Income from operations as a percentage of company-operated storesChina Mainland net revenue increased by 150 basis pointsdecreased primarily due to increasedlower gross margin, partially offset by deleveragemargin.
Rest of selling, general and administrative expenses.
Direct to Consumer. IncomeWorld. The increase in Rest of World income from operations from our direct to consumer segment increased $19.8 million, or 12%, to $186.2 million in fiscal 2016 from $166.4 million in fiscal 2015. The increase was primarily the result of increased gross profit of $43.2$80.9 million, driven by increased net revenue, partially offset by lower gross margin. The decrease in gross margin was primarily due to increased net revenue resulting from anunfavorable foreign currency exchange rates as well as lower product margin, partially offset by leverage on occupancy and other costs. The increase in traffic on our e-commerce websites, increased dollar value per transaction, and improved conversion rates. Thisgross profit was partially offset by an increase in selling, general and administrative expenses includingprimarily due to higher digital marketing expenses and higher variableemployee costs, such as well as increased distribution costs, and credit card fees, as a result ofand packaging costs driven by higher net revenue, and increased net revenue.digital marketing expenses. Income from operations as a percentage of direct to consumerRest of World net revenue has decreased by 30 basis points primarilyincreased due to deleverage ofleverage on selling, general and administrative expenses.
General Corporate Expenses. The increase in general corporate expenses was primarily due to higher employee costs, as well as increased depreciation, brand and community costs, technology costs, professional fees, and product team costs. The increase in general corporate expenses was partially offset by a decrease in net foreign exchange and derivative losses of $0.8 million.
Other Income (Expense), Net
| | | | | | | | | | | | | | | | | | | | | | | | | | |
| | 2022 | | 2021 | | Year over year change |
| | (In thousands) | | (In thousands) | | (Percentage) |
| Other income (expense), net | | $ | 4,163 | | | $ | 514 | | | $ | 3,649 | | | 709.9 | % |
The increase in other income, net was primarily due to an increase in interest income from higher interest rates, partially offset by an increase in other expenses.
Income Tax Expense
| | | | | | | | | | | | | | | | | | | | | | | | | | |
| | 2022 | | 2021 | | Year over year change |
| | (In thousands) | | (In thousands) | | (Percentage) |
| Income tax expense | | $ | 477,771 | | | $ | 358,547 | | | $ | 119,224 | | | 33.3 | % |
| | | | | | | | |
| Effective tax rate | | 35.9 | % | | 26.9 | % | | 900 basis points |
The increase in the effective tax rate was primarily due to certain non-deductible expenses related to the impairment of goodwill and other assets recognized in relation to our lululemon Studio business unit (formerly MIRROR) partially offset by the gain on sale of an administrative building in 2022 which increased the effective tax rate by 780 basis points. Certain non-deductible expenses related to the MIRROR acquisition increased the effective tax rate by 70 basis points in 2021. The increase in the effective tax rate was also due to the accrual of U.S. state tax and Canadian withholding taxes on unremitted earnings which are not considered to be permanently reinvested, adjustments upon filing of certain income tax returns, and a decrease in deductions for stock-based compensation, partially offset by a decrease in non-deductible expenses in international jurisdictions.
Excluding the impairment of goodwill and other assets recognized in relation to our lululemon Studio business unit (formerly MIRROR) and the gain on sale of an administrative building in 2022, and the MIRROR acquisition-related expenses in 2021, and their tax effects, our adjusted effective tax rates were 28.1% and 26.2% for 2022 and 2021, respectively.
Net Income
| | | | | | | | | | | | | | | | | | | | | | | | | | |
| | 2022 | | 2021 | | Year over year change |
| | (In thousands) | | (In thousands) | | (Percentage) |
| Net income | | $ | 854,800 | | | $ | 975,322 | | | $ | (120,522) | | | (12.4) | % |
The decrease in net income in 2022 was primarily due to an increase in selling, general and administrative expenses of $532.4 million, an impairment charge recognized in 2022 of $407.9 million, an increase in income tax expense of $119.2 million, partially offset by an increase in gross margin.
Other. Income from operations from our other segment increased $16.5 million, or 283%, to $22.3 million in fiscal 2016 from $5.8 million in fiscal 2015. The increase was primarily the result of increased gross profit of $26.4$883.8 million, partially offset by increased selling, general and administrativea decrease in acquisition-related expenses primarily due to increased employee costs. Income from operations asof $41.4 million, a percentagegain on disposal of other net revenue increased by 780 basis points primarily due to an increase in gross margin and decreased selling, general and administrative expenses as a percentageassets of other net revenue.
General Corporate Expenses. General corporate expenses increased $53.0$10.2 million, or 35%, to $203.0 million in fiscal 2016 from $150.0 million in fiscal 2015. This increase was primarily due to increased head office employee costs, brand and community costs, depreciation, and information technology costs. There was also a $20.3 million increase in foreign exchange losses. We expect general corporate expenses to continue to increase in future years as we grow our overall business and require increased efforts at our head office to support our company-operated stores, direct to consumer and other segments.
Other Income (Expense), Net
There was net other income of $1.6 million in fiscal 2016 compared to net other expense of $0.6 million in fiscal 2015. This was primarily the result of a $1.8 million reduction in net interest expense related to certain tax adjustments that are outlined in Note 14 to the audited consolidated financial statements included in Item 8 of Part II of this report, as well as interest earned on our increased cash and cash equivalents in fiscal 2016 compared to fiscal 2015.
Income Tax Expense
Income tax expense increased $16.9 million, or 16%, to $119.3 million in fiscal 2016 from $102.4 million in fiscal 2015. Fiscal 2016 and fiscal 2015 included certain tax adjustments which resulted in net income tax recoveries of $10.7 million and $7.4 million, respectively, as outlined in Note 14 to the audited consolidated financial statements included in Item 8 of Part II of this report.
Our effective tax rate for fiscal 2016 was 28.2% compared to 27.8% for fiscal 2015. Our effective tax rate excluding the above tax and related interest adjustments was 30.7% for fiscal 2016 compared to 29.5% for fiscal 2015.
Net Income
Net income increased $37.4 million, or 14%, to $303.4 million in fiscal 2016 from $266.0 million in fiscal 2015. The increase in net income in fiscal 2016 was primarily due to a $202.5 million increase in gross profit and an increase in other income (expense), net of $2.2$3.6 million. Excluding the impairment of goodwill and other assets recognized in relation to our lululemon Studio business unit (formerly MIRROR) and the gain on sale of an administrative building in 2022, and the MIRROR acquisition-related expenses in 2021, and their tax effects, adjusted net income increased $273.7 million partially offset by an increase of $150.4 million in selling, generalor 27.0%.
Comparable Sales and administrative expenses and an increase of $16.9 million in income tax expense.
Comparable Sales
We separately trackuse comparable sales to evaluate the performance of our company-operated store and e-commerce businesses from an omni-channel perspective. It allows us to monitor the performance of our business without the impact of recently opened or expanded stores. We believe investors would similarly find these metrics useful in assessing the performance of our business.
Comparable sales which reflectincludes comparable company-operated store and all e-commerce net revenue. E-commerce net revenue includes our buy online pick-up in store, back-back room, and ship from store omni-channel retailing capabilities in addition to our websites, other region-specific websites, digital marketplaces, and mobile apps. Comparable company-operated stores that have been open, or open after being significantly expanded, for at least 12 months, or open for at least 12 months after being significantly expanded.full fiscal months. Net revenue from a company-operated store is included in comparable store sales beginning with the first fiscal month for which the store has a full fiscal month of sales in the prior year. Comparable store sales excludeexcludes sales from new stores that have not been open for at least 12 full fiscal months, from stores which have not been in their significantly expanded space for at least 12 full fiscal months, and from stores which have been temporarily relocated for renovations. Comparable store sales also exclude sales from direct to consumer, outlets, temporary locations, wholesale accounts, showrooms, warehouse sales, license and supply arrangements,renovations or temporarily closed, and sales from company-
operated stores that have closed. Comparable sales also excludes sales from our selling channels other than company-operated stores that we have closed.
Total comparable sales combines comparable store sales and direct to consumer sales. We are evolving towards an omni-channel approach to support the shopping behavior of our guests. This involves country and region specific websites, mobile apps, including mobile apps on in-store devices that allow demand to be fulfilled via our distribution centers, social media, product notification emails, and online order fulfillment through stores. We therefore believe that reporting total comparable sales with comparable store sales and direct to consumer sales combined provides a relevant performance metric.
Various factors affect comparable sales, including:
the location of new stores relative to existing stores;
consumer preferences, buying trends, and overall economic trends;
our ability to anticipate and respond effectively to customer preferences for technical athletic apparel;
competition;
changes in our merchandise mix;
pricing;
the timing of our releases of new merchandise and promotional events;
the effectiveness of our marketing efforts;
the design and ease of use of our websites and mobile apps;
the level of customer service that we provide in our stores and on our websites and mobile apps;
our ability to source and distribute products efficiently; and
the number of stores we open, close (including for temporary renovations), and expand in any period.
Opening new stores is an important part of our growth strategy. Accordingly, total comparable sales has limited utility for assessing the success of our growth strategy insofar as comparable sales do not reflect the performance of stores open less than 12 months.e-commerce. The comparable sales measures we report may not be equivalent to similarly titled measures reported by other companies.
In fiscal years with 53 weeks, the 53rd week of net revenue is excluded from the calculation of comparable sales. In the year following a 53-week year, the prior year period is shifted by one week to compare similar calendar weeks.
Non-comparable sales includes all net revenue other than comparable sales. Sales Per Square Foot
TableWe use sales per square foot to assess the performance of Contentsour company-operated stores relative to their square footage. We believe that sales per square foot is useful in evaluating the performance of our company-operated stores. Sales per square foot is calculated using total net revenue from all company-operated stores divided by the average ending square footage of the stores for each period during the year. In fiscal years with 53 weeks, the 53rd week of net revenue is excluded from the calculation of sales per square foot. The square footage of our company-operated stores includes all retail related space, including selling space as well as storage and back-office areas. The sales per square foot metric we report may not be equivalent to similarly titled metrics reported by other companies.
Non-GAAP Financial Measures
Constant dollar changes in net revenue, total comparable sales, comparable store sales, and direct to consumer net revenue, and the adjusted financial results are non-GAAP financial measures.
A constant dollar basis assumes the average foreign currency exchange rates for the period remained constant with the average foreign currency exchange rates for the same period of the prior year. We provide constant dollar changes in net revenue, total comparable sales, comparable store sales, and directour results to consumer net revenue because we use these measures tohelp investors understand the underlying growth rate of net revenue excluding the impact of changes in foreign currency exchange rates. We believe that disclosing these measures on a constant dollar basis is useful to investors because it enables them to better understand the level of growth of our business.
Adjusted gross profit, gross margin, income from operations, operating margin, income tax expense, effective tax rates, net income, and diluted earnings per share exclude thecertain inventory provisions, goodwill and other asset impairments, and restructuring costs recognized in connection withrelation to lululemon Studio, the restructuringgain on disposal of our ivivva operationsassets for the sale of an administrative office building, the MIRROR acquisition-related expenses, and itsthe related income tax effects the amounts recognized in connection with the U.S. tax reform, and certain discrete items related to our transfer pricing arrangements and taxes on repatriation of foreign earnings. these items.
We believe these adjusted financial measures are useful to investors as the adjustments do not directly relate to our ongoing business operations and therefore do not contribute to a meaningfulthey provide supplemental information that enable evaluation of the underlying trend in our operating performance. Furthermore,performance, and enable a comparison to our historical financial information. Further, due to the finite and discrete nature of these items, we do not believeconsider them to be normal operating expenses that are necessary to run our business, or impairments or disposal gains that are expected to arise in the adjustments are reflectivenormal course of our expectations of our future operating performanceoperations. Management uses these adjusted financial measures and believe these non-GAAP measures are useful to investors because of their comparability to our historical information.constant currency metrics internally when reviewing and assessing financial performance.
The presentation of this financial information is not intended to be considered in isolation or as a substitute for, or with greater prominence to, the financial information prepared and presented in accordance with GAAP. A reconciliation of the non-GAAP financial measures follows, which includes more detail on the GAAP financial measure that is most directly comparable to each non-GAAP financial measure, and the related reconciliations between these financial measures. Our non-GAAP financial measures may be calculated differently from, and therefore may not be directly comparable to, similarly titled measures reported by other companies.
Constant Dollar Changes
The below changes in net revenue totaland comparable sales comparable store sales, and direct to consumer net revenue show the change compared to the corresponding period in the prior year.
Constant dollar changes in net revenue, total comparable sales, comparable store sales, and direct to consumer net revenue
|
| | | | | | | | | | | | | | |
| | | Fiscal Year Ended
January 28, 2018 | | Fiscal Year Ended
January 29, 2017 |
| | | (In thousands) | | (Percentages) | | (In thousands) | | (Percentages) |
| Change in net revenue | | $ | 304,789 |
| | 13 | % | | $ | 283,869 |
| | 14 | % |
| Adjustments due to foreign exchange rate changes | | (14,221 | ) | | (1 | ) | | 8,983 |
| | — |
|
| Change in net revenue in constant dollars | | $ | 290,568 |
| | 12 | % | | $ | 292,852 |
| | 14 | % |
|
| | | | | | |
| | | Fiscal Year Ended |
| | | January 28, 2018 | | January 29, 2017 |
Change in total comparable sales(1),(2) | | 7 | % | | 6 | % |
| Adjustments due to foreign exchange rate changes | | — |
| | 1 |
|
Change in total comparable sales in constant dollars(1),(2) | | 7 | % | | 7 | % |
|
| | | | | | | | | | | | | | |
| | | Fiscal Year Ended
January 28, 2018 | | Fiscal Year Ended
January 29, 2017 |
| | | (In thousands) | | (Percentages) | | (In thousands) | | (Percentages) |
Change in comparable store sales(2) | | $ | 12,820 |
| | 1 | % | | $ | 61,341 |
| | 4 | % |
| Adjustments due to foreign exchange rate changes | | (7,395 | ) | | — |
| | 5,036 |
| | 1 |
|
Change in comparable store sales in constant dollars(2) | | $ | 5,425 |
| | 1 | % | | $ | 66,377 |
| | 5 | % |
|
| | | | | | |
| | | Fiscal Year Ended |
| | | January 28, 2018 | | January 29, 2017 |
| Change in direct to consumer net revenue | | 27 | % | | 13 | % |
| Adjustments due to foreign exchange rate changes | | — |
| | — |
|
| Change in direct to consumer net revenue in constant dollars | | 27 | % | | 13 | % |
| | | | | | | | | | | | | | | | | | | | | | | | | | | | | | | | | | | | | | |
| | 2023 Compared to 2022 | | 2022 Compared to 2021 |
| | Change | | Foreign exchange changes | | Change in constant dollars | | Change | | Foreign exchange changes | | Change in constant dollars |
| | |
| Net Revenue | | | | | | | | | | | | |
| Americas | | 12 | % | | — | % | | 12 | % | | 29 | % | | 1 | % | | 30 | % |
| China Mainland | | 67 | | | 8 | | | 75 | | | 33 | | | 7 | | | 40 | |
| Rest of World | | 43 | | | 1 | | | 44 | | | 37 | | | 12 | | | 49 | |
| Total net revenue | | 19 | % | | 1 | % | | 20 | % | | 30 | % | | 2 | % | | 32 | % |
| | | | | | | | | | | | |
Comparable sales(1) | | | | | | | | | | | | |
| Americas | | 8 | % | | 1 | % | | 9 | % | | 28 | % | | 1 | % | | 29 | % |
| China Mainland | | 39 | | | 7 | | | 46 | | | 17 | | | 6 | | | 23 | |
| Rest of World | | 32 | | | 1 | | | 33 | | | 10 | | | 9 | | | 19 | |
| Total comparable sales | | 13 | % | | 1 | % | | 14 | % | | 25 | % | | 3 | % | | 28 | % |
__________
| |
(1)
| Total comparable sales includes comparable store sales and direct to consumer sales. |
| |
(2)
| Comparable store sales reflects net revenue from company-operated stores that have been open for at least 12 months, or open for at least 12 months after being significantly expanded. |
(1)Comparable sales includes comparable company-operated store and e-commerce net revenue.
Adjusted financial measuresFinancial Measures
The following tables reconcile adjusted financial measures with the most directly comparable measures calculated in accordance with GAAP.GAAP with the adjusted financial measures. The 2023 and 2022 adjustments relate to thecertain inventory provisions, goodwill and other asset impairments, and restructuring of our ivivva operationscosts recognized in relation to lululemon Studio, and itstheir related tax effects,effects. The 2022 adjustments also relate to the amounts recognized in connection with the U.S.gain on sale of an administrative office building, and their related tax reform,effects. The 2021 adjustments relate to MIRROR acquisition-related expenses, and certain discrete itemstheir related to our transfer pricing arrangements and taxes on repatriation of foreign earnings.tax effects. Please refer to Notes 13Note 5. Property and 14 to the audited consolidated financial statementsEquipment, Note 8. Impairment of Goodwill and Other Assets, Restructuring Costs, and Note 9. Acquisition-Related Expenses included in Item 8 of Part II of this report for further information on the nature of these adjustments.amounts.
| | | | | | | | | | | | | | | | | | | | | | | | | | | | | | | | | | | | | | | | | | | | | | | | | | |
| | 2023 |
| | Gross Profit | | Gross Margin | | Income from Operations | | Operating Margin | | Income Tax Expense | | Effective Tax Rate | | Net Income | | Diluted Earnings Per Share |
| | (In thousands, except per share amounts) |
| GAAP results | | $ | 5,609,405 | | | 58.3 | % | | $ | 2,132,676 | | | 22.2 | % | | $ | 625,545 | | | 28.8 | % | | $ | 1,550,190 | | | $ | 12.20 | |
| lululemon Studio charges: | | | | | | | | | | | | | | | | |
| lululemon Studio obsolescence provision | | 23,709 | | | 0.3 | | | 23,709 | | | 0.2 | | | | | | | 23,709 | | | 0.19 | |
| Impairment of assets | | | | | | 44,186 | | | 0.5 | | | | | | | 44,186 | | | 0.35 | |
| Restructuring costs | | | | | | 30,315 | | | 0.3 | | | | | | | 30,315 | | | 0.24 | |
| Tax effect of the above | | | | | | | | | | 26,085 | | | (0.1) | | | (26,085) | | | (0.21) | |
| | 23,709 | | | 0.3 | | | 98,210 | | | 1.0 | | | 26,085 | | | (0.1) | | | 72,125 | | | 0.57 | |
| Adjusted results (non-GAAP) | | $ | 5,633,114 | | | 58.6 | % | | $ | 2,230,886 | | | 23.2 | % | | $ | 651,630 | | | 28.7 | % | | $ | 1,622,315 | | | $ | 12.77 | |
|
| | | | | | | | | | | | | | | | |
| | | Fiscal Year Ended January 28, 2018 |
| | | GAAP Results | | Adjustments | | Adjusted Results
(Non-GAAP) |
| | | | Restructuring of ivivva Operations | | U.S. Tax Reform | |
| | | (In thousands, except per share amounts) |
| Gross profit | | $ | 1,398,790 |
| | $ | 8,698 |
| | $ | — |
| | $ | 1,407,488 |
|
| Gross margin | | 52.8 | % | | 0.3 | % | | — | % | | 53.1 | % |
| Income from operations | | 456,001 |
| | 47,223 |
| | — |
| | 503,224 |
|
| Operating margin | | 17.2 | % | | 1.8 | % | | — | % | | 19.0 | % |
| Income before income tax expense | | 459,998 |
| | 47,223 |
| | — |
| | 507,221 |
|
| Income tax expense | | 201,336 |
| | 12,741 |
| | (59,294 | ) | | 154,783 |
|
| Effective tax rate | | 43.8 | % | | (0.4 | )% | | (12.9 | )% | | 30.5 | % |
| Diluted earnings per share | | $ | 1.90 |
| | $ | 0.25 |
| | $ | 0.44 |
| | $ | 2.59 |
|
| | | | | | | | | | | | | | | | | | | | | | | | | | | | | | | | | | | | | | | | | | | | | | | | | | |
| | 2022 |
| | Gross Profit | | Gross Margin | | Income from Operations | | Operating Margin | | Income Tax Expense | | Effective Tax Rate | | Net Income | | Diluted Earnings Per Share |
| | (In thousands, except per share amounts) |
| GAAP results | | $ | 4,492,340 | | | 55.4 | % | | $ | 1,328,408 | | | 16.4 | % | | $ | 477,771 | | | 35.9 | % | | $ | 854,800 | | | $ | 6.68 | |
| lululemon Studio charges: | | | | | | | | | | | | | | | | |
| lululemon Studio obsolescence provision | | 62,928 | | | 0.8 | | | 62,928 | | | 0.8 | | | | | | | 62,928 | | | 0.49 | |
| Impairment of goodwill and other assets | | | | | | 407,913 | | | 5.0 | | | | | | | 407,913 | | | 3.19 | |
| Tax effect of the above | | | | | | | | | | 28,171 | | | (7.8) | | | (28,171) | | | (0.22) | |
| | 62,928 | | | 0.8 | | | 470,841 | | | 5.8 | | | 28,171 | | | (7.8) | | | 442,670 | | | 3.46 | |
| Gain on disposal of assets | | | | | | (10,180) | | | (0.1) | | | | | | | (10,180) | | | (0.08) | |
| Tax effect of the above | | | | | | | | | | (1,661) | | | — | | | 1,661 | | | 0.01 | |
| Adjusted results (non-GAAP) | | $ | 4,555,268 | | | 56.2 | % | | $ | 1,789,069 | | | 22.1 | % | | $ | 504,281 | | | 28.1 | % | | $ | 1,288,951 | | | $ | 10.07 | |
| | | | | | | | | | | | | | | | | | | | | | | | | | | | | | | | | | | | | | |
| | 2021 |
| | Income from Operations | | Operating Margin | | Income Tax Expense | | Effective Tax Rate | | Net Income | | Diluted Earnings Per Share |
| | (In thousands, except per share amounts) |
| GAAP results | | $ | 1,333,355 | | | 21.3 | % | | $ | 358,547 | | | 26.9 | % | | $ | 975,322 | | | $ | 7.49 | |
| Transaction and integration costs | | 2,989 | | | — | | | | | | | 2,989 | | | 0.02 | |
| Acquisition-related compensation | | 38,405 | | | 0.7 | | | | | | | 38,405 | | | 0.29 | |
| Tax effect of the above | | | | | | 1,417 | | | (0.7) | | | (1,417) | | | (0.01) | |
| Adjusted results (non-GAAP) | | $ | 1,374,749 | | | 22.0 | % | | $ | 359,964 | | | 26.2 | % | | $ | 1,015,299 | | | $ | 7.79 | |
|
| | | | | | | | | | | | |
| | | Fiscal Year Ended January 29, 2017 |
| | | GAAP Results | | Transfer Pricing and Repatriation Tax Adjustments | | Adjusted Results (Non-GAAP) |
| | | (In thousands, except per share amounts) |
| Income before income tax expense | | $ | 422,729 |
| | $ | 1,695 |
| | $ | 424,424 |
|
| Income tax expense | | 119,348 |
| | 10,744 |
| | 130,092 |
|
| Effective tax rate | | 28.2 | % | | 2.5 | % | | 30.7 | % |
| Diluted earnings per share | | $ | 2.21 |
| | $ | (0.07 | ) | | $ | 2.14 |
|
|
| | | | | | | | | | | | |
| | | Fiscal Year Ended January 31, 2016 |
| | | GAAP Results | | Transfer Pricing and Repatriation Tax Adjustments | | Adjusted Results (Non-GAAP) |
| | | (In thousands, except per share amounts) |
| Income before income tax expense | | $ | 368,495 |
| | $ | 3,467 |
| | $ | 371,962 |
|
| Income tax expense | | 102,448 |
| | 7,443 |
| | 109,891 |
|
| Effective tax rate | | 27.8 | % | | 1.7 | % | | 29.5 | % |
| Diluted earnings per share | | $ | 1.89 |
| | $ | (0.03 | ) | | $ | 1.86 |
|
Liquidity and Capital Resources
Our primary sources of liquidity are our current balances of cash and cash equivalents, cash flows from operations, and capacity under our committed revolving credit facility.facility, including to fund short-term working capital requirements. Our primary cash needs are capital expenditures for opening new stores and remodeling or relocating existing stores, investing in our distribution centers, investing in technology and making information technology system enhancements, funding working capital requirements, and making other strategic capital investments both in North America and internationally.investments. We may also use cash to repurchase shares of our common stock. Cash and cash equivalents in excess of our needs are held in interest bearing accounts with financial institutions.
As of January 28, 2018, our working capital (excluding cashinstitutions, as well as in money market funds and cash equivalents) was $153.2 million, our cash and cash equivalents were $990.5 million and our capacity under our revolving credit facility was $148.8 million.term deposits.
The following table summarizes our net cash flows provided by and used in operating, investing, and financing activities for the periods indicated:
| | | | | | | | | | | | | | | | | | | | |
| | | 2023 | | 2022 | | Year over year change |
| | | (In thousands) |
| Total cash provided by (used in): | | | | | | |
| Operating activities | | $ | 2,296,164 | | | $ | 966,463 | | | $ | 1,329,701 | |
| Investing activities | | (654,132) | | | (569,937) | | | (84,195) | |
| Financing activities | | (548,828) | | | (467,487) | | | (81,341) | |
| Effect of foreign currency exchange rate changes on cash and cash equivalents | | (4,100) | | | (34,043) | | | 29,943 | |
| Increase (decrease) in cash and cash equivalents | | $ | 1,089,104 | | | $ | (105,004) | | | $ | 1,194,108 | |
|
| | | | | | | | | | | | |
| | | Fiscal Year Ended |
| | | January 28, 2018 | | January 29, 2017 | | January 31, 2016 |
| | | (In thousands) |
| Total cash provided by (used in): | | | | | | |
| Operating activities | | $ | 489,337 |
| | $ | 386,392 |
| | $ | 297,538 |
|
| Investing activities | | (173,392 | ) | | (149,511 | ) | | (143,487 | ) |
| Financing activities | | (97,862 | ) | | (26,611 | ) | | (272,491 | ) |
| Effect of exchange rate changes on cash | | 37,572 |
| | 23,094 |
| | (44,557 | ) |
| Increase (decrease) in cash and cash equivalents | | $ | 255,655 |
| | $ | 233,364 |
| | $ | (162,997 | ) |
Operating Activities
Cash flowsThe increase in cash provided by operating activities consistwas primarily of net income adjusted for certain items including depreciation and amortization, asset impairments costs relating to the restructuring of our ivivva operations, stock-based compensation expense, and the effect ofas a result of:
•an increase in cash flows from changes in operating assets and liabilities.liabilities of $859.1 million, primarily driven by changes in inventories, accounts payable, and prepaid expenses and other current assets, partially offset by changes in income taxes and accrued liabilities; and
Net•increased net income of $695.4 million.
The increase in cash provided by operating activities increased $102.9 million in fiscal 2017 compared to fiscal 2016, primarily as a result of the following:
Changes in operating assets and liabilities
an increase of $104.0 million in the change in operating assets and liabilities, primarily due to the following:
| |
– | $62.5 million related to income taxes, primarily due to income taxes payable in relation to the U.S. tax reform; |
| |
– | $31.8 million related to other accrued and non-current liabilities, primarily due to changes in accrued operating expenses, forward currency contract liabilities, and tenant inducements. |
Net income and non-cash items
a decrease of $44.7 million in net income, partially offset by an increase of $43.6 million in non-cash expenses primarily related to asset impairment costs related to the restructuring of our ivivva operations, and an increase in depreciation.
In fiscal 2016, cash provided by operating activities increased $88.9 million, to $386.4 million compared to cash provided by operating activities of $297.5 million in fiscal 2015. The increase was primarily a result of a decrease in inventory purchases, a decrease in the change in prepaid and receivable income taxes, and an increase in net income. This was partially offset by a decreasechanges in the changeadjusting items of $224.8 million, primarily driven by goodwill and other asset impairments and restructuring costs recognized in income taxes payable, deferred income taxes,relation to lululemon Studio, as well as increased depreciation and accrued inventory liabilities. Inventory purchases decreased during fiscal 2016 primarily as a result of actions takenhigher cash inflows related to align inventory levels with forward sales trends.derivatives.
Investing Activities
Cash flowsThe increase in cash used in investing activities relatewas primarily due to capital expenditures, the settlement of net investment hedges and other investing activities. Cash usedincreased capital expenditures. The increase in investing activities increased $23.9 million, to $173.4 million in fiscal 2017 from $149.5 million in fiscal 2016. Cash used in investing activities increased $6.0 million, to $149.5 million in fiscal 2016 from $143.5 million in fiscal 2015.
Capital expenditures for our company-operated stores segment were $80.2 million, $75.3 million, $85.8 million in fiscal 2017, fiscal 2016, and fiscal 2015, respectively. The capital expenditures forwas primarily due to investment in our company-operated stores segment in each period were primarily for the remodeling or relocation of certain stores, and ongoing store refurbishment. The capital expenditures for our company-operated stores segment also included $29.3 million to open 49 company-operated stores, $30.6 million to open 46 company-operated stores, and $49.2 million to open 62 new company-operated stores, in fiscal 2017, fiscal 2016, and fiscal 2015, respectively.
Capital expenditures for our direct to consumer segment were $19.9 million, $11.5 million, and $8.3 million in fiscal 2017, fiscal 2016, and fiscal 2015, respectively. The capital expenditures for our direct to consumer segment were primarily related to our global and region specific websitesdistribution centers as well as mobile apps.
Capital expenditures related to corporate activities and other were $57.7 million, $62.7 million, and $49.4 million in fiscal 2017, fiscal 2016, and fiscal 2015, respectively. The capital expenditures in each fiscal year were primarily related to investments in information technology and business systems, improvements at our head office and other corporate buildings, and for capital expenditures related to opening retail locations other than company-operated stores.
In fiscal 2017 we redeveloped and relaunched our enhanced website. We also undertook various information technology infrastructure and corporate system initiatives, partially offset by a decrease in company-operated store and continued with the development of our new enterprise resource planning system that will help improve our merchandising, costing, allocation, and inventory platforms.
The increase in corporate capital expenditures in fiscal 2016 compared to fiscal 2015 was primarily related to a parcel of land that we purchased in Vancouver, BC for general corporate purposes for $19.7 million.
Capital expenditures are expected to range between $240 million and $250 million in fiscal 2018.expenditures.
Financing Activities
Cash flows used in or provided by financing activities consist primarily of cash used to repurchase shares of our common stock and certain cash flows related to stock-based compensation.
Cash used in financing activities increased $71.3 million, to $97.9 million in fiscal 2017 from $26.6 million in fiscal 2016. Cash used in financing activities decreased $245.9 million, to $26.6 million in fiscal 2016 from $272.5 million in fiscal 2015. The primary cause of these changesincrease in cash used in financing activities was primarily the result of an increase in our stock repurchase programs.
On June 11, 2014, our board of directors approved a program to repurchase shares of our common stock up to an aggregate value of $450.0 million. This stock repurchase program was completed during the second quarter of fiscal 2016. On December 1, 2016, our board of directors approved a program to repurchase shares of our common stock up to an aggregate value of $100.0 million. This stock repurchase program was completed during the third quarter of fiscal 2017. On November 29, 2017, our board of directors approved a program to repurchase shares of our common stock up to an aggregate value of $200.0 million.
repurchases. During the fiscal years ended January 28, 2018, January 29, 2017, and January 31, 2016, 1.9 million, 0.5 million, and 5.02023, 1.5 million shares respectively, were repurchased under the programs at a total cost including commissions and excise taxes of $100.3$558.7 million. During 2022, 1.4 million $29.3 million,shares were repurchased at a total cost including commissions and $274.2 million, respectively.excise taxes of $444.0 million. The common stock was repurchased in the open market at prevailing market prices, including under plans complying with the provisions of Rule 10b5-1 and Rule 10b-18 of the Securities Exchange Act of 1934, with the timing and actual number of shares repurchased depending upon market conditions, eligibility to trade, and other factors.
Liquidity Outlook
We believe that our cash and cash equivalent balances, cash generated from operations, and borrowings available to us under our committed revolving credit facility will be adequate to meet our liquidity needs and capital expenditure requirements for at least the next 12 months. Our cash from operations may be negatively impacted by a decrease in demand for our products as well as the other factors described in "Item 1A. Risk Factors". In addition, we may make discretionary capital improvements with respect to our stores, distribution facilities, headquarters, or systems, or we may repurchase shares under an approved stock repurchase program, which we would expect to fund through the use of cash, issuance of debt or equity securities or other external financing sources to the extent we were unable to fund such capital expenditures out of our cash and cash equivalents and cash generated from operations.
The following table includes certain measures of our liquidity: Revolving Credit Facility | | | | | | | | |
| | January 28, 2024 |
| | (In thousands) |
| Cash and cash equivalents | | $ | 2,243,971 | |
Working capital excluding cash and cash equivalents(1) | | 185,345 | |
| Capacity under committed revolving credit facility | | 393,661 | |
On December 15, 2016, we entered into__________
(1)Working capital is calculated as current assets of $4.1 billion less current liabilities of $1.6 billion.
Capital expenditures are expected to range between $690.0 million and $710.0 million in 2024.
Our current commitments with respect to inventory purchases are included within our purchase obligations outlined below. The timing and cost of our inventory purchases will vary depending on a variety of factors such as revenue growth, assortment and purchasing decisions, product costs including freight and duty, and the availability of production capacity and speed. Our inventory balance as of January 28, 2024 was $1.3 billion, a decrease of 9% from January 29, 2023. We expect our inventories to decrease during the first half of 2024 compared to the first half of 2023, and then increase in the second half of 2024 compared to the second half of 2023.
Our existing Americas credit agreementfacility provides for $150.0$400.0 million in commitments under an unsecured five-year revolving credit facility. Bank of America, N.A., is administrative agent and HSBC Bank Canada is the syndication agent and letter of credit issuer, and the lenders party thereto. Borrowings under the revolvingThe credit facility may be made, in U.S. Dollars, Euros, Canadian Dollars, and in other currencies,has a maturity date of December 14, 2026, subject to the approval of the administrative agent and the lenders. Up to $35.0 million of the revolving credit facility is available for the issuance of letters of credit and up to $25.0 million is available for the issuance of swing line loans. Commitmentsextension under the revolving credit facility may be increased by up to $200.0 million, subject to certain conditions, including the approval of the lenders. Borrowings under the agreement may be prepaid and commitments may be reduced or terminated without premium or penalty (other than customary breakage costs). The principal amount outstanding under the credit agreement, if any, will be due and payable in full on December 15, 2021, subject to provisions that permit us to request a limited number of one year extensions annually.
Borrowings made under the revolving credit facility bear interest at a rate per annum equal to, at our option, either (a) a rate based on the rates applicable for deposits on the interbank market for U.S. Dollars or the applicable currency in which the borrowings are made ("LIBOR") or (b) an alternate base rate, plus, in each case, an applicable margin. The applicable margin is determined by reference to a pricing grid, based on the ratio of indebtedness to earnings before interest, tax depreciation, amortization and rent ("EBITDAR") and ranges between 1.00%-1.75% for LIBOR loans and 0.00%-0.75% for alternate base
rate loans. Additionally, a commitment fee of between 0.125%-0.200%, also determined by reference to the pricing grid, is payable on the average daily unused amounts under the revolving credit facility.
The credit agreement contains negative covenants that, among other things and subject to certain exceptions, limit the ability of our subsidiaries to incur indebtedness, incur liens, undergo fundamental changes, make dispositions of all or substantially all of their assets, alter their businesses and enter into agreements limiting subsidiary dividends and distributions.
We are also required to maintain a consolidated rent-adjusted leverage ratio of not greater than 3.50:1.00 and we are not permitted to allow the ratio of consolidated EBITDAR to consolidated interest charges (plus rent) to be less than 2.00:1.00. The credit agreement also contains certain customary representations, warranties, affirmative covenants, and events of default (including, among others, an event of default upon the occurrence of a change of control). If an event of default occurs, the credit agreement may be terminated and the maturity of any outstanding amounts may be accelerated.
circumstances. As of January 28, 2018,2024, aside from letters of credit of $1.2$6.3 million, we had no other borrowings outstanding under this credit facility. Further information regarding our credit facilities and associated covenants is outlined in Note 12. Revolving Credit Facilities included in Item 8 of Part II of this report.
Contractual Obligations and Commitments
Leases. We lease certain store and other retail locations, distribution centers, offices, and equipment under non-cancelablenon-cancellable operating leases. Our leases generally have initial terms of between fivetwo and 1015 years, and generally can be extended in five-year increments between two and five years, if at all. A substantial number ofThe following table details our leases include renewal optionsfuture minimum lease payments. Minimum lease commitments exclude variable lease expenses including contingent rent payments, common area maintenance, property taxes, and certain of our leases include rent escalation clauses, rent holidays and leasehold rental incentives, none of which are reflected in the table below. The majority of our leases for store premises also include contingent rental payments based on sales, the impact of which also are not reflected in the table below.landlord's insurance.
Product purchasePurchase obligations. The amounts listed for product purchase obligations in the table below represent agreements (including open purchase orders) to purchase products and for other expenditures in the ordinary course of business that are enforceable and legally binding and that specify all significant terms. In some cases, pricesvalues are subject to change, such as for product purchases throughout the production process. The reported amounts exclude product purchase liabilities included in accounts payable and accrued inventory liabilitiesour consolidated balance sheets as of January 28, 2018.2024.
One-time transition tax payable. As outlined in Note 14 to our audited consolidated financial statements included in Item 8 of Part II of this report, theThe U.S. tax reformreforms enacted in December 2017 imposed a mandatory transition tax on accumulated foreign subsidiary earnings which have not previously been subject to U.S. income tax. The one-time transition tax is payable over eight years. We recognized a provisional income tax expense of $58.9 millionyears beginning in fiscal 2017 for the mandatory transition tax.2018. The one-time transition tax payable is net of foreign tax credits, and the table below outlines the expected payments due by fiscal year.
The following table summarizes our contractual arrangements due by fiscal year as of January 28, 2018,2024, and the timing and effect that such commitments are expected to have on our liquidity and cash flows in future periods:
| | | | | | | | | | | | | | | | | | | | | | | | | | | | | | | | | | | | | | | | | | | | |
| | | Total | | 2024 | | 2025 | | 2026 | | 2027 | | 2028 | | Thereafter |
| | | (In thousands) |
| Operating leases (minimum rent) | | $ | 1,645,318 | | | $ | 300,379 | | | $ | 287,224 | | | $ | 232,510 | | | $ | 214,519 | | | $ | 158,252 | | | $ | 452,434 | |
| Purchase obligations | | 688,934 | | | 656,376 | | | 5,566 | | | 10,506 | | | 2,899 | | | 13,587 | | | — | |
| One-time transition tax payable | | 28,555 | | | 12,691 | | | 15,864 | | | — | | | — | | | — | | | — | |
|
| | | | | | | | | | | | | | | | | | | | | | | | | | | | |
| | | Payments Due by Fiscal Year |
| | | Total | | 2018 | | 2019 | | 2020 | | 2021 | | 2022 | | Thereafter |
| | | (In thousands) |
| Operating leases (minimum rent) | | $ | 611,817 |
| | $ | 143,428 |
| | $ | 127,641 |
| | $ | 105,720 |
| | $ | 81,595 |
| | $ | 59,058 |
| | $ | 94,375 |
|
| Product purchase obligations | | 159,679 |
| | 159,679 |
| | — |
| | — |
| | — |
| | — |
| | — |
|
| One-time transition tax payable | | 56,969 |
| | 8,701 |
| | 4,197 |
| | 4,197 |
| | 4,197 |
| | 4,197 |
| | 31,480 |
|
Off-Balance Sheet ArrangementsAs of January 28, 2024, our operating lease commitments for distribution center operating leases which have been committed to, but not yet commenced, was $299.6 million, which is not reflected in the table above.
We enter into standby letters of credit to secure certain of our obligations, including leases, taxes, and duties. As of January 28, 2018,2024, letters of credit and letters of guarantee totaling $1.2$10.2 million had been issued.issued, including $6.3 million under our committed revolving credit facility.
We have not entered into any transactions, agreements or other contractual arrangements to which an entity unconsolidated with us is a party and under which we have (i) any obligation under a guarantee, (ii) any retained or contingent interest in assets transferred to an unconsolidated entity that serves as credit, liquidity or market risk support to such entity, (iii) any obligation under derivative instruments that are indexed to our shares and classified as equity in our consolidated balance sheets, or (iv) any obligation arising out of a variable interest in any unconsolidated entity that provides financing, liquidity, market risk or credit support to us or engages in leasing, hedging or research and development services with us.
Critical Accounting Policies and Estimates
The preparation of financial statements in conformity with U.S. generally accepted accounting principles requires management to make estimates and assumptions. Predicting future events is inherently an imprecise activity and, as such, requires the use of significant judgment. Actual results may vary from our estimates in amounts that may be material to the financial statements. An accounting policy is deemed to be critical if it requires an accounting estimate to be made based on assumptions about matters that are highly uncertain at the time the estimate is made, and if different estimates that reasonably could have been used or changes in the accounting estimates that are reasonably likely to occur periodically, could materially impact our consolidated financial statements.
We believe that the followingOur critical accounting policies, affect our more significant estimates, and judgments used in the preparationjudgements are as follows, and see Note 2. Summary of our consolidated financial statements:
Revenue Recognition. Net revenue is recognized net of sales taxes, discounts, and an estimated allowance for sales returns. Sales to customers through company-operated stores and other retail locations are recognized at the point of sale, net of an estimated allowance for sales returns. Direct to consumer sales are recognized once delivery has occurred and collection is reasonably assured, net of an estimated allowance for sales returns. Other net revenue includes outlet sales, sales from temporary locations, sales to wholesale accounts, showroom sales, warehouse sales, and license and supply arrangement net revenue, which consists of royalties as well as sales of our product to licensees. Revenue is recognized when these sales occur. Employee discounts are classified as a reduction of net revenue.
Our estimated allowance for sales returns is a subjective critical estimate that has a direct impact on reported net revenue. This allowance is calculated based on a history of actual returns, estimated future returns and any significant future known or anticipated events. Consideration of these factors results in an estimated allowance for sales returns. Our standard terms for retail sales limit returns to approximately 30 days after the sale of the merchandise, however we accept returns after 30 days where the product fails to meet our guests' quality expectations.
Revenue from our gift cards is recognized when tendered for payment. Outstanding customer balances areSignificant Accounting Policies included in "Unredeemed gift card liability" on the consolidated balance sheets. There are no expiration dates on our gift cards, and we do not charge any service fees that cause a decrement to customer balances.Item 8 of Part II for additional information:
While we will continue to honor all gift cards presented for payment, we may determine the likelihood of redemption to be remote for certain card balances due to, among other things, long periods of inactivity. In these circumstances, to the extent we determine there is no requirement for remitting card balances to government agencies under unclaimed property laws, the portion of card balances not expected to be redeemed are recognized in net revenue in proportion to the gift cards which have been redeemed.Inventory provision
Inventory.Inventory is valued at the lower of cost and net realizable value. We periodically review our inventories and make provisions as necessary to appropriately valuea provision for obsolescence and goods that are obsolete, have quality issues or that are damaged. TheWe record a provision at an amount of the provisionthat is equal to the difference between the inventory cost of the inventory and its net realizable value. As of January 28, 2024 the net carrying value of our inventories was $1.3 billion, which included provisions for obsolete and damaged inventory of $139.7 million. The
provision is determined based upon assumptions about product quality, damages, future demand, selling prices, and market conditions. If changes in market conditions, result in reductions in the estimatedand includes a provision of $63.0 million against lululemon Studio Mirror inventory.
Deferred taxes on undistributed net realizable valueinvestment of our inventory below our previous estimate, we would increase our reserve in the period in which we made such a determination. In addition, we provide for inventory shrinkage as a percentage of sales, based on historical trends from actual physical inventories. Inventory shrinkage estimates are made to reduce the inventory value for lost or stolen items. We perform physical inventory counts and cycle counts throughout the year and adjust the shrink provision accordingly.
Property and Equipment. Property and equipment are recorded at cost less accumulated depreciation. Buildings are depreciated on a straight-line basis over the expected useful life of the asset, which is individually assessed, and estimated to be up to 20 years. Leasehold improvements are depreciated on a straight-line basis over the lesser of the length of the lease and the estimated useful life of the assets, up to a maximum of five years. All other property and equipment is depreciated using the declining balance method as follows:
|
| | |
Furniture and fixtures | | 20% |
Computer hardware and software | | 20% - 30% |
Equipment and vehicles | | 30% |
Changes in circumstances, such as technological advances, can result in differences between the actual and estimated useful lives. In those cases where we determine that the useful life of a long-lived asset should be shortened, we increase depreciation expense over the remaining useful life to depreciate the asset's net book value to its estimated salvage value.
Long-Lived Assets. Long-lived assets, including intangible assets with finite useful lives are evaluated for impairment when the occurrence of events or changes in circumstances indicates that the carrying value of the assets may not be recoverable as measured by comparing their net book value to the undiscounted estimated future cash flows generated by their use and eventual disposition. Impaired assets are recorded at fair value, determined principally by the present value of the estimated future cash flows expected from their use and eventual disposition.
Income Taxes. The U.S. tax reform enacted on December 22, 2017 introduces significant changes to the U.S. income tax laws. The accounting for the income tax effects of the U.S. tax reform is complex and requires significant judgement and estimates in the interpretation and calculations of its provisions.foreign subsidiaries.
We have not recognized a provisional amount of $59.3 million in income tax expense in fiscal 2017 in relation to the U.S. tax reform. This includes a provisional current income tax expense of $58.9 million for the mandatory one-time transition tax on the deemed repatriation of accumulated undistributed earnings of foreign subsidiaries, and a provisional deferred income tax expense of $0.4 million to reflect the reduced U.S. tax rate and other effects of the U.S. tax reform.
Further analysis will be required with respect to the method of computation and components of the foreign subsidiaries' earnings and profits, the definition of foreign cash positions, the computation and limitation of the use of foreign tax credits, the conformity of each state to the U.S. federal income tax laws on the mandatory deemed repatriation income inclusion for state income tax purposes, the impact that the U.S. tax reform has, if any, upon our reinvestment plans for the accumulated earnings of the Company's foreign subsidiaries, and the amount of tax that would apply in the event of any change in our reinvestment plans. We may make adjustments to the provisional amounts and those adjustments may materially impact our provision for income taxes and effective income tax rates in the period in which the adjustments are made, and in future periods.
Deferred income tax assets and liabilities are determined based on the temporary differences between the carrying amounts and the tax basis of assets and liabilities, and for tax losses, tax credit carryforwards, and other tax attributes, using the enacted tax rates that are to be in effect when these differences are expected to reverse. Our deferred income tax balances and income tax rates are significantly affected by the tax rates on our global operations and the extent to which the undistributed earnings of our foreign subsidiaries are indefinitely reinvested outside the U.S. Deferred income tax liabilities are recognized for U.S. federal and state income taxes and foreign withholding taxes on the undistributed earningsnet investment in our subsidiaries which we have determined to be indefinitely reinvested. This determination is based on the cash flow projections and operational and fiscal objectives of each of our foreign subsidiaries. Such estimates are inherently imprecise since many assumptions utilized in the projections are subject to revision in the future.
For the portion of our net investment in our Canadian subsidiaries unless those earnings arethat is not indefinitely reinvested, outsidewe have recorded a deferred tax liability for the taxes which would be due upon repatriation. For distributions made by our Canadian subsidiaries, the amount of tax payable is partially dependent on how the U.S. Indefinite reinvestment is determined by management's judgment about,repatriation transactions are made. The deferred tax liability has been recorded on the basis that we would choose to make the repatriation transactions in the most tax efficient manner. Specifically, to the extent that the Canadian subsidiaries have sufficient paid-up-capital, any such distributions would be made as a return of capital, rather than as a dividend, and intentions concerning, the future operations of the Company.therefore would not be subject to Canadian withholding tax.
As of January 28, 2018, we have not changed2024, the net investment in our indefinite reinvestment plans as a resultCanadian subsidiaries was $2.5 billion, of the U.S. tax reform. Accordingly, no deferred income tax liabilities have been recognized on any of the undistributed earnings of the Company's foreign subsidiaries. We are continuing to evaluate the impact that the U.S. tax reform has upon the taxes which may become payable upon repatriation, our reinvestment plans, and the most efficient means of deploying our capital resources globally. As this analysis has not yet been completed, it is possible that amounts$1.6 billion was determined to be indefinitely reinvested outsidereinvested. The paid-up-capital balance of the U.S. may ultimately be repatriated, resulting in additionalCanadian subsidiaries was approximately $140.0 million.
We have recognized a deferred tax liabilities being recognized.
The cumulative undistributed earningsliability of our foreign subsidiaries$41.2 million as of January 28, 2018 were $1.24 billion, including $1.21 billion of accumulated undistributed earnings of a Canadian subsidiary. In2024 which represents the event we determine that all or a portion of such Canadian earnings will no longer be indefinitely reinvested outside of the United States, Canadian withholding taxes payable on the portion of 5%our Canadian earnings that are not indefinitely reinvested and cannot be repatriated as a return of capital, and U.S. state income taxes could apply to some portion of any distribution made. This is in addition to the one-time transition tax that is payable as a result of the U.S. tax reform. The amount of tax that would be payable upon repatriation of the amounts which are not indefinitely reinvested.
In future periods, if the net investment in our Canadian subsidiaries continues to grow, whether due to the accumulation of profits by these subsidiaries or due to a change in the amount that is dependent on the elections available to us underindefinitely reinvested, we will record additional deferred tax liabilities, including both Canadian withholding tax legislation,taxes for the extent to which such withholding tax would be recoverable through U.S. foreign tax credits, and the interaction between state and U.S. federal income tax laws as a result of the U.S. tax reform.
We evaluate our tax filing positions and recognize the largest amount of tax benefit that is considered more likely than not to be sustained upon examination by the relevant taxing authorities based on the technical merits of the position. This determination requires the use of significant judgment. Income tax expense is adjusted in the period in which an uncertain tax position is effectively settled, the statute of limitations expires, facts or circumstances change, tax laws change, or new information becomes available. Our tax positions include intercompany transfer pricing policies and the associated taxable income and deductions arising from intercompany charges between subsidiaries within the consolidated group. Although we believe that our intercompany transfer pricing policies and tax positions are reasonable, the final outcomes of tax audits or potential tax disputes may be materially different from that which is reflected in our income tax provisions and accruals.
Goodwill and Intangible Assets. Intangible assets are recorded at cost. Reacquired franchise rights are amortized on a straight-line basis over their estimated useful lives of 10 years. Goodwill represents the excess of the purchase price over the fair market value of identifiable net assets acquiredpaid-up capital balance and is not amortized. Goodwill is tested for impairment annually or more frequently when an event or circumstance indicates that goodwill might be impaired. Goodwill impairment testing requires usU.S. state income taxes.
Contingencies
to estimate the fair value of our reporting units. We generally base our measurement of the fair value on the present value of future cash flows. Our significant estimates in the discounted cash flows model include the discount rate and long-term rates of growth. We use our best estimates and judgment based on available evidence in conducting the impairment testing.
Stock-Based Compensation. We account for stock-based compensation using the fair value method. The fair value of awards granted is estimated at the date of grant and is recognized as employee compensation expense on a straight-line basis over the requisite service period. For awards with service and/or performance conditions, the amount of compensation expense recognized is based on the number of awards that are expected to vest.
The estimation of the number of stock awards that will ultimately vest requires judgment, and to the extent actual results differ from our estimates, such amounts will be recorded as a cumulative adjustment in the period estimates are revised. We consider several factors when estimating the number of awards which are expected to vest, including, future profit forecasts, types of awards, size of option holder group, and anticipated employee retention and estimated expected forfeitures. Actual results may differ substantially from these estimates.
The calculation of the grant-date fair value of stock options requires us to make certain estimates and assumptions, including, stock price volatility, and the expected life of the options. We evaluate and revise these estimates and assumptions as necessary, to reflect market conditions and our historical experience. The expected term of the options is based upon historical experience of similar awards, giving consideration to expectations of future employee behavior. Expected volatility is based upon the historical volatility of our common stock for the period corresponding with the expected term of the options. In the future, the expected volatility and expected term may change which could substantially change the grant-date fair value of future awards of stock options and, ultimately, the expense we record.
Contingencies. In the ordinary course of business, we are involved in legal proceedings regarding contractual and employment relationships and a variety of other matters. We record contingent liabilities resulting from claims against us, when a loss is assessed to be probable and theits amount of the loss is reasonably estimable. If it is reasonably possible that a material loss could occur through ongoing litigation, we provide disclosure in the footnotes to our financial statements. Assessing probability of loss and estimating the amount of probable losses requires analysis of multiple factors, including in some cases judgments about the potential actions of third-party claimants and courts. Should we experience adverse court judgments or should negotiated outcomes differ to our expectations with respect to such ongoing litigation it could have a material adverse effect on our results of operations, financial position, and cash flows.
ITEM 7A. QUANTITATIVE AND QUALITATIVE DISCLOSURES ABOUT MARKET RISK
Foreign Currency Exchange Risk
Translation Risk. The functional currency of our foreigninternational subsidiaries is generally the applicable local currency. Our consolidated financial statements are presented in U.S. dollars. Therefore, the net revenue, expenses, assets, and liabilities of our foreigninternational subsidiaries are translated from their functional currencies into U.S. dollars. Fluctuations in the value of the U.S. dollar affect the reported amounts of net revenue, expenses, assets, and liabilities. As a result of the fluctuation in exchange rates compared to the U.S. dollar our revenue was $89.8 million lower in 2023 in comparison to 2022.
Foreign currency exchange differences which arise on translation of our foreigninternational subsidiaries' balance sheets into U.S. dollars are recorded as a foreign currency translation adjustmentother comprehensive income (loss), net of tax in accumulated other comprehensive income or loss(loss) within stockholders' equity. A significant portion of our net assets are held by our Canadian dollar subsidiary. We enter into forward currency contracts in order to hedge a portion of the foreign currency exposure associated with the translation of our net investment in our Canadian subsidiary. The impact to other comprehensive loss of translation of our Canadian subsidiaries was an increase in the loss of $9.0 million, inclusive of net investment hedge gains.
Transaction Risk. We also have exposure to changes in foreign currency exchange rates associated with transactions which are undertaken by our subsidiaries in currencies other than their functional currency. Such transactions include intercompany transactions and inventory purchases denominated in currencies other than the functional currency of the
purchasing entity. As a result, we have been impacted by changesWe also hold cash and cash equivalents and other monetary assets in exchange rates and may be impacted forcurrencies that are different to the foreseeable future. The potential impactfunctional currency of currency fluctuation increases as our international expansion increases.
subsidiaries. As of January 28, 2018,2024, we had certain forward currency contracts outstanding in order to economically hedge a portion of the foreign currency exposure that arises on translation of a Canadian subsidiary into U.S. dollars. We also had certain forward currency contracts outstanding in an effort to reduce our exposure to the foreign exchange revaluation gains and losses that are recognized by our foreign subsidiaries, including our Canadian and Chinese subsidiaries, on U.S. dollar denominatedtheir monetary assets and liabilities. Please referliabilities denominated in currencies other than their functional currency.
We perform a sensitivity analysis to Note 12 todetermine the market risk exposure associated with the fair values of our audited consolidated financial statements includedforward currency contracts. The net fair value of outstanding derivatives as of January 28, 2024 was a liability of $2.2 million. As of January 28, 2024, a 10% depreciation in Item 8the U.S. dollar against the hedged currencies would have resulted in the net fair value of Part II of this report for further information, including detailsoutstanding derivatives depreciating by $29.8 million. The hypothetical change in the fair value of the notional amounts outstanding.forward currency contracts would have been substantially offset by a corresponding but directionally opposite change in the underlying hedged items.
In the future, in an effort to reduce foreign currency exchange risks, we may enter into further derivative financial instruments including hedging additional currency pairs. We do not, and do not intend to, engage in the practice of trading derivative securities for profit.
We currently generate a significant portionPart II of our net revenue and incur a significant portion of our expenses in Canada. We also hold a significant portion of our net assets in Canada. The reporting currencythis report for our consolidated financial statements is the U.S. dollar. A weakening of the U.S. dollar against the Canadian dollar results in:
the following impacts to the consolidated statements of operations:
| |
– | an increase in our net revenue upon translation of the sales made by our Canadian subsidiaries into U.S. dollars for the purposes of consolidation; |
| |
– | an increase in our selling, general and administrative expenses incurred by our Canadian subsidiaries upon translation into U.S. dollars for the purposes of consolidation; |
| |
– | foreign exchange revaluation losses by our Canadian subsidiaries on U.S. dollar denominated monetary assets; and |
| |
– | derivative valuation gains on forward currency contracts not designated in a hedging relationship; |
the following impacts to the consolidated balance sheets:
| |
– | an increase in the foreign currency translation adjustment which arisesfurther details on the translation of our Canadian subsidiaries' balance sheets into U.S. dollars; and |
| |
– | a decrease in the foreign currency translation adjustment from derivative valuation losses on forward currency contracts, entered into as net investment hedges of a Canadian subsidiary. |
During fiscal 2017, the change in the relative value of the U.S. dollar against the Canadian dollar resulted in a $44.4 million reduction in accumulated other comprehensive loss within stockholders' equity. During fiscal 2016, the change in the relative value of the U.S. dollar against the Canadian dollar resulted in a $41.7 million reduction in accumulated other comprehensive loss within stockholders' equity.
A 10% depreciation in the relative value of the U.S. dollar against the Canadian dollar compared to the exchange rates in effect for fiscal 2017 would have resulted in additional income from operations of approximately $1.0 million in fiscal 2017. This assumes a consistent 10% depreciation in the U.S. dollar against the Canadian dollar throughout the fiscal year. The timing of changes in the relative value of the U.S. dollar combined with the seasonal nature of our business, can affect the magnitude of the impact that fluctuations in foreign exchange rates have on our income from operations.financial instruments.
Interest Rate Risk.
Our committed revolving credit facility provides us with available borrowings in an amount up to $150.0 million in the aggregate.$400.0 million. Because our revolving credit facility bearsfacilities bear interest at a variable rate, we will be exposed to market risks relating to changes in interest rates, if we have a meaningful outstanding balance. As of January 28, 2018,2024, aside from letters of credit of $1.2$6.3 million, we hadthere were no other borrowings outstanding under thisthese credit facility.facilities. We currently do not engage in any interest rate hedging activity and currently have no intention to do so. However, in the future, if we have a meaningful outstanding balance under our revolving facility, in an effort to mitigate losses associated with these risks, we may at times enter into derivative financial instruments, although we have not historically done so. These may take the form of forward contracts, option contracts, or interest rate swaps. We do not, and do not intend to, engage in the practice of trading derivative securities for profit.
Our cash and cash equivalent balances are held in the form of cash on hand, bank balances, and short-term deposits with original maturities of three months or less. We do not believe theseless, and in money market funds. As of January 28, 2024, we held cash and cash equivalents of $2.2 billion. Interest generated on cash balances areis subject to materialvariability as interest rate risk.rates increase or decrease.
Credit Risk. We have cash and cash equivalents on deposit with various large, reputable financial institutions.institutions and have invested in AAA-rated money market funds. The amount of cash and cash equivalents held with certain financial institutions exceeds government-insured limits. We are also exposed to credit-related losses in the event of nonperformance by the financial institutions that are counterparties to our forward currency contracts. The credit risk amount is our unrealized gains on our derivative instruments, based on foreign currency rates at the time of nonperformance. We have not experienced any losses related to these items, and we believe credit risk to be minimal. We seek to minimize our credit risk by entering into transactions with investment grade credit worthy and reputable financial institutions and by monitoring the credit standing of the financial institutions with whom we transact. We seek to limit the amount of exposure with any one counterparty.
Inflation
Inflationary factors such as increases in the cost of our product, andas well as overhead costs and capital expenditures may adversely affect our operating results. Although we do not believe that inflation has hadDuring 2022 and 2023, our operating margin was impacted by increased wage rates. During 2022, our gross margin was impacted by higher air freight costs as a result of global supply chain disruption.
Sustained increases in transportation costs, wages, and raw material impact on our financial positioncosts, or results of operations to date, a high rate of inflationother inflationary pressures in the future may have an adverse effect on our ability to maintain current levels of grossoperating margin and selling, general and administrative expenses as a percentage of net revenue if the selling prices of our products do not increase with these increased costs.costs, or we cannot identify cost efficiencies.
ITEM 8. FINANCIAL STATEMENTS AND SUPPLEMENTARY DATA
lululemon athletica inc.
INDEX TO CONSOLIDATED FINANCIAL STATEMENTS
REPORT OF INDEPENDENT REGISTERED PUBLIC ACCOUNTING FIRM
To the Stockholders and Board of Directors of lululemon athletica inc.
Opinions on the Financial Statements and Internal Control over Financial Reporting
We have audited the accompanying consolidated balance sheets of lululemon athletica inc. and its subsidiaries (together, the Company) as of January 28, 20182024 and January 29, 2017,2023, and the related consolidated statements of operations and comprehensive income, of stockholders' equity and of cash flows for each of the 52 week periods52-week years ended January 28, 2018,2024, January 29, 20172023, and January 31, 2016,30, 2022, including the related notes and the financial statement schedule listed in the index appearing under Item 15(a)(2) (collectively referred to as the "consolidatedconsolidated financial statements")statements). We also have audited the Company'sCompany’s internal control over financial reporting as of January 28, 2018,2024, based on criteria established in Internal Control -– Integrated Framework (2013) issued by the Committee of Sponsoring Organizations of the Treadway Commission (COSO).
In our opinion, the consolidated financial statements referred to above present fairly, in all material respects, the financial position of the Company as of January 28, 20182024 and January 29, 2017,2023, and theirthe results of its operations and theirits cash flows for each of the 52 week periods52-week years ended January 28, 2018,2024, January 29, 2017,2023, and January 31, 201630, 2022 in conformity with accounting principles generally accepted in the United States of America (US GAAP).America. Also in our opinion, the Company maintained, in all material respects, effective internal control over financial reporting as of January 28, 2018,2024, based on criteria established in Internal Control -– Integrated Framework (2013) issued by the COSO.
Basis for Opinions
The Company'sCompany’s management is responsible for these consolidated financial statements, for maintaining effective internal control over financial reporting, and for its assessment of the effectiveness of internal control over financial reporting, included in Management's Annual Report on Internal Control over Financial Reporting appearing under item 9A.Item 9A of the Company’s 2023 Annual Report on Form 10-K. Our responsibility is to express opinions on the Company'sCompany’s consolidated financial statements and on the Company'sCompany’s internal control over financial reporting based on our audits. We are a public accounting firm registered with the Public Company Accounting Oversight Board (United States) (PCAOB) and are required to be independent with respect to the Company in accordance with the U.S. federal securities laws and the applicable rules and regulations of the Securities and Exchange Commission and the PCAOB.
We conducted our audits in accordance with the standards of the PCAOB. Those standards require that we plan and perform the audits to obtain reasonable assurance about whether the consolidated financial statements are free of material misstatement, whether due to error or fraud, and whether effective internal control over financial reporting was maintained in all material respects.
Our audits of the consolidated financial statements included performing procedures to assess the risks of material misstatement of the consolidated financial statements, whether due to error or fraud, and performing procedures that respond to those risks. Such procedures included examining, on a test basis, evidence regarding the amounts and disclosures in the consolidated financial statements. Our audits also included evaluating the accounting principles used and significant estimates made by management, as well as evaluating the overall presentation of the consolidated financial statements. Our audit of internal control over financial reporting included obtaining an understanding of internal control over financial reporting, assessing the risk that a material weakness exists, and testing and evaluating the design and operating effectiveness of internal control based on the assessed risk. Our audits also included performing such other procedures as we considered necessary in the circumstances. We believe that our audits provide a reasonable basis for our opinions.
Definition and Limitations of Internal Control over Financial Reporting
A company'scompany’s internal control over financial reporting is a process designed to provide reasonable assurance regarding the reliability of financial reporting and the preparation of financial statements for external purposes in accordance with generally accepted accounting principles. A company'scompany’s internal control over financial reporting includes those policies and procedures that (i) pertain to the maintenance of records that, in reasonable detail, accurately and fairly reflect the transactions and dispositions of the assets of the company; (ii) provide reasonable assurance that transactions are recorded as necessary to permit preparation of financial statements in accordance with generally accepted accounting principles, and that receipts and expenditures of the company are being made only in accordance with authorizations of management and directors of the company; and (iii) provide reasonable assurance regarding prevention or timely detection of unauthorized acquisition, use, or disposition of the company'scompany’s assets that could have a material effect on the financial statements.
Because of its inherent limitations, internal control over financial reporting may not prevent or detect misstatements. Also, projections of any evaluation of effectiveness to future periods are subject to the risk that controls may become inadequate because of changes in conditions, or that the degree of compliance with the policies or procedures may deteriorate.
|
|
/s/ PricewaterhouseCoopers LLP |
Chartered Professional Accountants |
Vancouver, Canada |
March 26, 2018 |
The critical audit matter communicated below is a matter arising from the current period audit of the consolidated financial statements that was communicated or required to be communicated to the audit committee and that (i) relates to accounts or disclosures that are material to the consolidated financial statements and (ii) involved our especially challenging, subjective, or complex judgments. The communication of critical audit matters does not alter in any way our opinion on the consolidated financial statements, taken as a whole, and we are not, by communicating the critical audit matter below, providing a separate opinion on the critical audit matter or on the accounts or disclosures to which it relates.
Inventory Provision
As described in Notes 2 and 3 to the consolidated financial statements, inventories are valued at the lower of cost and net realizable value, and management records a provision as necessary to appropriately value inventories that are obsolete, have quality issues, or are damaged. Provision expense is recorded in cost of goods sold. As of January 28, 2024, the Company’s consolidated net inventories balance was $1,323.6 million inclusive of the inventory provision of $141.5 million. The amount of the inventory provision is equal to the difference between the cost of the inventory and its estimated net realizable value based on assumptions about product quality, damages, future demand, selling prices, and market conditions.
The principal considerations for our determination that performing procedures relating to the inventory provision is a critical audit matter are the significant judgment by management in determining the estimated net realizable value of inventories that are obsolete, have quality issues, or are damaged, which in turn led to a high degree of auditor judgment, subjectivity, and effort in performing procedures and evaluating audit evidence relating to the inventory provision.
Addressing the matter involved performing procedures and evaluating audit evidence in connection with forming our overall opinion on the consolidated financial statements. These procedures included testing the effectiveness of controls relating to the review of the inventory provision including the assumptions used. These procedures also included, among others, (i) observing the physical condition of inventories during inventory counts; (ii) evaluating the appropriateness of management’s process for developing the estimates of net realizable value; (iii) testing the reliability of reports used by management by agreeing to underlying records; (iv) testing the reasonableness of the assumptions about quality, damages, future demand, selling prices and market conditions by considering historical trends and consistency with evidence obtained in other areas of the audit; and (v) corroborating the assumptions with individuals within the product team.
/s/ PricewaterhouseCoopers LLP
Chartered Professional Accountants
Vancouver, Canada
March 21, 2024
We have served as the Company's auditor since 2006.
lululemon athletica inc.
CONSOLIDATED BALANCE SHEETS
(Amounts in thousands, except per share amounts)
| | | | | January 28,
2018 | | January 29,
2017 |
| | January 28, 2024 | | | | January 28, 2024 | | January 29, 2023 |
| ASSETS | | | | |
| Current assets | | | | |
| Current assets | |
| Current assets | |
| Cash and cash equivalents | | $ | 990,501 |
| | $ | 734,846 |
|
| Accounts receivable | | 19,173 |
| | 9,200 |
|
| Cash and cash equivalents | |
| Cash and cash equivalents | |
| Accounts receivable, net | |
| Inventories | | 329,562 |
| | 298,432 |
|
| Prepaid and receivable income taxes | | 48,948 |
| | 81,190 |
|
| Other prepaid expenses and other current assets | | 48,098 |
| | 39,069 |
|
| | | 1,436,282 |
| | 1,162,737 |
|
| Prepaid expenses and other current assets | |
| | 4,060,577 | |
| Property and equipment, net | | 473,642 |
| | 423,499 |
|
| Goodwill and intangible assets, net | | 24,679 |
| | 24,557 |
|
| Right-of-use lease assets | |
| Goodwill | |
| Intangible assets, net | |
| Deferred income tax assets | | 32,491 |
| | 26,256 |
|
| Other non-current assets | | 31,389 |
| | 20,492 |
|
| | | $ | 1,998,483 |
| | $ | 1,657,541 |
|
| | $ | |
| LIABILITIES AND STOCKHOLDERS' EQUITY | | | | |
| Current liabilities | | | | |
| Current liabilities | |
| Current liabilities | |
| Accounts payable | | $ | 24,646 |
| | $ | 24,846 |
|
| Accrued inventory liabilities | | 13,027 |
| | 8,601 |
|
| Accounts payable | |
| Accounts payable | |
| Accrued liabilities and other | |
| Accrued compensation and related expenses | | 70,141 |
| | 55,238 |
|
| Current lease liabilities | |
| Current income taxes payable | | 15,700 |
| | 30,290 |
|
| Unredeemed gift card liability | | 82,668 |
| | 70,454 |
|
| Lease termination liabilities | | 6,427 |
| | — |
|
| Other current liabilities | | 79,989 |
| | 52,561 |
|
| | | 292,598 |
| | 241,990 |
|
| | 1,631,261 | |
| Non-current lease liabilities | |
| Non-current income taxes payable | | 48,268 |
| | — |
|
| Deferred income tax liabilities | | 1,336 |
| | 7,262 |
|
| Other non-current liabilities | | 59,321 |
| | 48,316 |
|
| | | 401,523 |
| | 297,568 |
|
| | 2,859,860 | |
| Commitments and contingencies | | Commitments and contingencies | | | | |
| Stockholders' equity | | | | |
| Undesignated preferred stock, $0.01 par value: 5,000 shares authorized; none issued and outstanding | | — |
| | — |
|
| Exchangeable stock, no par value: 60,000 shares authorized; 9,781 and 9,781 issued and outstanding | | — |
| | — |
|
| Special voting stock, $0.000005 par value: 60,000 shares authorized; 9,781 and 9,781 issued and outstanding | | — |
| | — |
|
| Common stock, $0.005 par value: 400,000 shares authorized; 125,650 and 127,304 issued and outstanding | | 628 |
| | 637 |
|
| Undesignated preferred stock, $0.01 par value: 5,000 shares authorized; none issued and outstanding | |
| Undesignated preferred stock, $0.01 par value: 5,000 shares authorized; none issued and outstanding | |
| Exchangeable stock, no par value: 60,000 shares authorized; 5,116 and 5,116 issued and outstanding | |
| Special voting stock, $0.000005 par value: 60,000 shares authorized; 5,116 and 5,116 issued and outstanding | |
| Common stock, $0.005 par value: 400,000 shares authorized; 121,106 and 122,205 issued and outstanding | |
| Additional paid-in capital | | 284,253 |
| | 266,622 |
|
| Retained earnings | | 1,455,002 |
| | 1,294,214 |
|
| Accumulated other comprehensive loss | | (142,923 | ) | | (201,500 | ) |
| | | 1,596,960 |
| | 1,359,973 |
|
| | | $ | 1,998,483 |
| | $ | 1,657,541 |
|
| | 4,232,081 | |
| | $ | |
See accompanying notes to the consolidated financial statements
lululemon athletica inc.
CONSOLIDATED STATEMENTS OF OPERATIONS AND COMPREHENSIVE INCOME
(Amounts in thousands, except per share amounts)
| | | | | | | | | | | Fiscal Year Ended |
| | | Fiscal Year Ended |
| | | January 28,
2018 | | January 29,
2017 | | January 31,
2016 |
| | January 28,
2024 | | | | January 28,
2024 | | January 29,
2023 | | January 30,
2022 |
| Net revenue | | $ | 2,649,181 |
| | $ | 2,344,392 |
| | $ | 2,060,523 |
|
| Cost of goods sold | | 1,250,391 |
| | 1,144,775 |
| | 1,063,357 |
|
| Gross profit | | 1,398,790 |
| | 1,199,617 |
| | 997,166 |
|
| Selling, general and administrative expenses | | 904,264 |
| | 778,465 |
| | 628,090 |
|
| Asset impairment and restructuring costs | | 38,525 |
| | — |
| | — |
|
| Impairment of goodwill and other assets, restructuring costs | |
| Amortization of intangible assets | |
| Acquisition-related expenses | |
| Gain on disposal of assets | |
| Income from operations | | 456,001 |
| | 421,152 |
| | 369,076 |
|
| Other income (expense), net | | 3,997 |
| | 1,577 |
| | (581 | ) |
| Income before income tax expense | | 459,998 |
| | 422,729 |
| | 368,495 |
|
| Income tax expense | | 201,336 |
| | 119,348 |
| | 102,448 |
|
| Net income | | $ | 258,662 |
| | $ | 303,381 |
| | $ | 266,047 |
|
| | | | | | | |
| Other comprehensive income (loss), net of tax: | | | | | | |
| Other comprehensive income (loss), net of tax: | |
| Other comprehensive income (loss), net of tax: | |
| Foreign currency translation adjustment | | 58,577 |
| | 36,703 |
| | (64,796 | ) |
| Foreign currency translation adjustment | |
| Foreign currency translation adjustment | |
| Net investment hedge gains (losses) | |
| Other comprehensive income (loss), net of tax | |
| Comprehensive income | | $ | 317,239 |
| | $ | 340,084 |
| | $ | 201,251 |
|
| | | | | | | |
| Basic earnings per share | |
| Basic earnings per share | |
| Basic earnings per share | | $ | 1.90 |
| | $ | 2.21 |
| | $ | 1.90 |
|
| Diluted earnings per share | | $ | 1.90 |
| | $ | 2.21 |
| | $ | 1.89 |
|
| Basic weighted-average number of shares outstanding | | 135,988 |
| | 137,086 |
| | 140,365 |
|
| Diluted weighted-average number of shares outstanding | | 136,198 |
| | 137,302 |
| | 140,610 |
|
See accompanying notes to the consolidated financial statements
lululemon athletica inc.
CONSOLIDATED STATEMENTS OF STOCKHOLDERS' EQUITY
(Amounts in thousands)
| | | | | | | | | | | | | | | | | | | | | | | Exchangeable Stock | | Special Voting Stock | | Common Stock | | Additional Paid-in Capital | | Retained Earnings | | Accumulated Other Comprehensive Loss | | Total Stockholders' Equity |
| | Shares | |
| Balance as of January 31, 2021 | |
| Balance as of January 31, 2021 | |
| Balance as of January 31, 2021 | |
| Net income | |
| Other comprehensive income (loss), net of tax | |
| | | Exchangeable Stock | | Special Voting Stock | | Common Stock | | Additional Paid-in Capital | | Retained Earnings | | Accumulated Other Comprehensive Income (Loss) | | Total |
| | | Shares | | Shares | | Par Value | | Shares | | Par Value | |
| Balance at February 1, 2015 | | 9,833 |
| | 9,833 |
| | $ | — |
| | 132,112 |
| | $ | 661 |
| | $ | 241,695 |
| | $ | 1,020,619 |
| | $ | (173,407 | ) | | $ | 1,089,568 |
|
| Net income | | | | | | | | | | | | | | 266,047 |
| | | | 266,047 |
|
| Foreign currency translation adjustment | | | | | | | | | | | | | | | | (64,796 | ) | | (64,796 | ) |
| Common stock issued upon exchange of exchangeable shares | | (29 | ) | | (29 | ) | | — |
| | 29 |
| | — |
| | — |
| | | | | | — |
|
| Stock-based compensation expense | | | | | | | | | | | | 10,356 |
| | | | | | 10,356 |
|
| Tax benefits from stock-based compensation | | | | | | | | | | | | (1,202 | ) | | | | | | (1,202 | ) |
| Stock-based compensation expense | |
| Stock-based compensation expense | |
| Common stock issued upon settlement of stock-based compensation | | | | | | | | 350 |
| | 2 |
| | 4,702 |
| | | | | | 4,704 |
|
| Shares withheld related to net share settlement of stock-based compensation | | | | | | | | (50 | ) | | — |
| | (2,857 | ) | | | | | | (2,857 | ) |
| Repurchase of common stock | | | | | | | | (4,959 | ) | | (26 | ) | | (7,016 | ) | | (267,151 | ) | | | | (274,193 | ) |
| Registration fees associated with prospectus supplement | | | | | | | | | | | | (145 | ) | | | | | | (145 | ) |
| Balance at January 31, 2016 | | 9,804 |
| | 9,804 |
| | $ | — |
| | 127,482 |
| | $ | 637 |
| | $ | 245,533 |
| | $ | 1,019,515 |
| | $ | (238,203 | ) | | $ | 1,027,482 |
|
| Balance as of January 30, 2022 | |
| Net income | | | | | | | | | | | | | | 303,381 |
| | | | 303,381 |
|
| Foreign currency translation adjustment | | | | | | | | | | | | | | | | 36,703 |
| | 36,703 |
|
| Other comprehensive income (loss), net of tax | |
| Common stock issued upon exchange of exchangeable shares | | (23 | ) | | (23 | ) | | — |
| | 23 |
| | — |
| | — |
| | | | | | — |
|
| Stock-based compensation expense | | | | | | | | | | | | 16,822 |
| | | | | | 16,822 |
|
| Tax benefits from stock-based compensation | | | | | | | | | | | | 1,273 |
| | | | | | 1,273 |
|
| Common stock issued upon settlement of stock-based compensation | | | | | | | | 304 |
| | 2 |
| | 6,905 |
| | | | | | 6,907 |
|
| Shares withheld related to net share settlement of stock-based compensation | | | | | | | | (50 | ) | | — |
| | (3,268 | ) | | | | | | (3,268 | ) |
| Repurchase of common stock | | | | | | | | (455 | ) | | (2 | ) | | (643 | ) | | (28,682 | ) | | | | (29,327 | ) |
| Balance at January 29, 2017 | | 9,781 |
| | 9,781 |
| | $ | — |
| | 127,304 |
| | $ | 637 |
| | $ | 266,622 |
| | $ | 1,294,214 |
| | $ | (201,500 | ) | | $ | 1,359,973 |
|
| Net income | | | | | | | | | | | | | | 258,662 |
| | | | 258,662 |
|
| Foreign currency translation adjustment | | | | | | | | | | | | | | | | 58,577 |
| | 58,577 |
|
| Stock-based compensation expense | | | | | | | | | | | | 17,610 |
| | | | | | 17,610 |
|
| Common stock issued upon settlement of stock-based compensation | | | | | | | | 267 |
| | 1 |
| | 5,627 |
| | | | | | 5,628 |
|
| Repurchase of common stock, including excise tax | |
| Balance as of January 29, 2023 | |
|
| | | | | | | | | | | | | | | | | | | | | | | | | | | | | | | | | |
| | | Exchangeable Stock | | Special Voting Stock | | Common Stock | | Additional Paid-in Capital | | Retained Earnings | | Accumulated Other Comprehensive Income (Loss) | | Total |
| | | Shares | | Shares | | Par Value | | Shares | | Par Value | | | | |
| Shares withheld related to net share settlement of stock-based compensation | | | | | | | | (60 | ) | | — |
| | (3,229 | ) | | | | | | (3,229 | ) |
| Repurchase of common stock | | | | | | | | (1,861 | ) | | (10 | ) | | (2,377 | ) | | (97,874 | ) | | | | (100,261 | ) |
| Balance at January 28, 2018 | | 9,781 |
| | 9,781 |
| | $ | — |
| | 125,650 |
| | $ | 628 |
| | $ | 284,253 |
| | $ | 1,455,002 |
| | $ | (142,923 | ) | | $ | 1,596,960 |
|
| | | | | | | | | | | | | | | | | | | | | | | | | | | | | | | | | | | | | | | | | | | | | | | | | | | | | | | | |
| | | Exchangeable Stock | | Special Voting Stock | | Common Stock | | Additional Paid-in Capital | | Retained Earnings | | Accumulated Other Comprehensive Loss | | Total Stockholders' Equity |
| | Shares | | Shares | | Par Value | | Shares | | Par Value | | | | |
| Net income | | | | | | | | | | | | | | 1,550,190 | | | | | 1,550,190 | |
| Other comprehensive income (loss), net of tax | | | | | | | | | | | | | | | | (11,672) | | | (11,672) | |
| | | | | | | | | | | | | | | | | | |
| Stock-based compensation expense | | | | | | | | | | | | 93,560 | | | | | | | 93,560 | |
| Common stock issued upon settlement of stock-based compensation | | | | | | | | 479 | | | 2 | | | 42,428 | | | | | | | 42,430 | |
| Shares withheld related to net share settlement of stock-based compensation | | | | | | | | (96) | | | — | | | (32,574) | | | | | | | (32,574) | |
| Repurchase of common stock, including excise tax | | | | | | | | (1,482) | | | (7) | | | (2,690) | | | (555,955) | | | | | (558,652) | |
| Balance as of January 28, 2024 | | 5,116 | | | 5,116 | | | $ | — | | | 121,106 | | | $ | 606 | | | $ | 575,369 | | | $ | 3,920,362 | | | $ | (264,256) | | | $ | 4,232,081 | |
See accompanying notes to the consolidated financial statements
lululemon athletica inc.
CONSOLIDATED STATEMENTS OF CASH FLOWS
|
| | | | | | | | | | | | |
| | | Fiscal Year Ended |
| | | January 28,
2018 | | January 29,
2017 | | January 31,
2016 |
| Cash flows from operating activities | | | | | | |
| Net income | | $ | 258,662 |
| | $ | 303,381 |
| | $ | 266,047 |
|
| Adjustments to reconcile net income to net cash provided by operating activities: | | | | | | |
| Depreciation and amortization | | 108,235 |
| | 87,697 |
| | 73,383 |
|
| Stock-based compensation expense | | 17,610 |
| | 16,822 |
| | 10,356 |
|
| Derecognition of unredeemed gift card liability | | (6,202 | ) | | (4,548 | ) | | (3,647 | ) |
| Asset impairment for ivivva restructuring | | 11,593 |
| | — |
| | — |
|
| Settlement of derivatives not designated in a hedging relationship | | 6,227 |
| | — |
| | — |
|
| Deferred income taxes | | (11,416 | ) | | (17,563 | ) | | 11,142 |
|
| Changes in operating assets and liabilities: | | | | | | |
| Inventories | | (21,178 | ) | | (5,403 | ) | | (83,286 | ) |
| Prepaid and receivable income taxes | | 32,242 |
| | 11,537 |
| | (52,110 | ) |
| Other prepaid expenses and other current assets | | (16,949 | ) | | (6,730 | ) | | (3,816 | ) |
| Other non-current assets | | 9,194 |
| | (8,958 | ) | | (4,835 | ) |
| Accounts payable | | (1,551 | ) | | 14,080 |
| | 1,247 |
|
| Accrued inventory liabilities | | 3,680 |
| | (18,900 | ) | | 5,198 |
|
| Accrued compensation and related expenses | | 12,873 |
| | 9,943 |
| | 14,937 |
|
| Current income taxes payable | | (16,470 | ) | | (10,020 | ) | | 19,470 |
|
| Unredeemed gift card liability | | 17,282 |
| | 16,010 |
| | 16,574 |
|
| Lease termination liabilities | | 6,427 |
| | — |
| | — |
|
| Non-current income taxes payable | | 48,268 |
| | — |
| | — |
|
| Other accrued and non-current liabilities | | 30,810 |
| | (956 | ) | | 26,878 |
|
| Net cash provided by operating activities | | 489,337 |
| | 386,392 |
| | 297,538 |
|
| Cash flows from investing activities | | | | | | |
| Purchase of property and equipment | | (157,864 | ) | | (149,511 | ) | | (143,487 | ) |
| Settlement of net investment hedges | | (7,203 | ) | | — |
| | — |
|
| Other investing activities | | (8,325 | ) | | — |
| | — |
|
| Net cash used in investing activities | | (173,392 | ) | | (149,511 | ) | | (143,487 | ) |
| Cash flows from financing activities | | | | | | |
| Proceeds from settlement of stock-based compensation | | 5,628 |
| | 6,907 |
| | 4,704 |
|
| Taxes paid related to net share settlement of stock-based compensation | | (3,229 | ) | | (3,268 | ) | | (2,857 | ) |
| Repurchase of common stock | | (100,261 | ) | | (29,327 | ) | | (274,193 | ) |
| Registration fees associated with prospectus supplement | | — |
| | — |
| | (145 | ) |
| Deferred debt financing costs | | — |
| | (923 | ) | | — |
|
| Net cash used in financing activities | | (97,862 | ) | | (26,611 | ) | | (272,491 | ) |
| Effect of exchange rate changes on cash | | 37,572 |
| | 23,094 |
| | (44,557 | ) |
| Increase (decrease) in cash and cash equivalents | | 255,655 |
| | 233,364 |
| | (162,997 | ) |
| Cash and cash equivalents, beginning of period | | $ | 734,846 |
| | $ | 501,482 |
| | $ | 664,479 |
|
| Cash and cash equivalents, end of period | | $ | 990,501 |
| | $ | 734,846 |
| | $ | 501,482 |
|
| | | | | | | | | | | | | | | | | | | | |
| | | Fiscal Year Ended |
| | | January 28,
2024 | | January 29,
2023 | | January 30,
2022 |
| Cash flows from operating activities | | | | | | |
| Net income | | $ | 1,550,190 | | | $ | 854,800 | | | $ | 975,322 | |
| Adjustments to reconcile net income to net cash provided by operating activities: | | | | | | |
| Depreciation and amortization | | 379,384 | | | 291,791 | | | 224,206 | |
| lululemon Studio obsolescence provision | | 23,709 | | | 62,928 | | | — | |
| Impairment of goodwill and other assets, restructuring costs | | 74,501 | | | 407,913 | | | — | |
| Gain on disposal of assets | | — | | | (10,180) | | | — | |
| Stock-based compensation expense | | 93,560 | | | 78,075 | | | 69,137 | |
| Derecognition of unredeemed gift card liability | | (28,547) | | | (23,337) | | | (18,699) | |
| Settlement of derivatives not designated in a hedging relationship | | 32,527 | | | (38,649) | | | 15,191 | |
| Deferred income taxes | | (28,383) | | | 3,042 | | | (5,180) | |
| Changes in operating assets and liabilities: | | | | | | |
| Inventories | | 66,584 | | | (573,438) | | | (323,609) | |
| Prepaid and receivable income taxes | | 1,908 | | | (66,714) | | | 20,108 | |
| Prepaid expenses and other current assets | | 47,167 | | | (113,820) | | | (82,404) | |
| Other non-current assets | | (53,280) | | | (36,518) | | | (17,556) | |
| Accounts payable | | 177,367 | | | (107,280) | | | 117,655 | |
| Accrued liabilities and other | | (71,734) | | | 65,364 | | | 103,878 | |
| Accrued compensation and related expenses | | 70,327 | | | 47,254 | | | 75,273 | |
| Current and non-current income taxes payable | | (173,196) | | | 35,986 | | | 120,778 | |
| Unredeemed gift card liability | | 84,315 | | | 68,266 | | | 71,441 | |
| Right-of-use lease assets and current and non-current lease liabilities | | 37,535 | | | 23,905 | | | 13,494 | |
| Other current and non-current liabilities | | 12,230 | | | (2,925) | | | 30,073 | |
| Net cash provided by operating activities | | 2,296,164 | | | 966,463 | | | 1,389,108 | |
| Cash flows from investing activities | | | | | | |
| Purchase of property and equipment | | (651,865) | | | (638,657) | | | (394,502) | |
| Settlement of net investment hedges | | (1,609) | | | 47,804 | | | (23,389) | |
| | | | | | |
| Other investing activities | | (658) | | | 20,916 | | | (10,000) | |
| Net cash used in investing activities | | (654,132) | | | (569,937) | | | (427,891) | |
| Cash flows from financing activities | | | | | | |
| Proceeds from settlement of stock-based compensation | | 42,430 | | | 11,704 | | | 18,194 | |
| Shares withheld related to net share settlement of stock-based compensation | | (32,574) | | | (35,158) | | | (49,809) | |
| Repurchase of common stock | | (558,652) | | | (444,001) | | | (812,602) | |
| Other financing activities | | (32) | | | (32) | | | (770) | |
| Net cash used in financing activities | | (548,828) | | | (467,487) | | | (844,987) | |
| Effect of foreign currency exchange rate changes on cash and cash equivalents | | (4,100) | | | (34,043) | | | (6,876) | |
| Increase (decrease) in cash and cash equivalents | | 1,089,104 | | | (105,004) | | | 109,354 | |
| Cash and cash equivalents, beginning of period | | $ | 1,154,867 | | | $ | 1,259,871 | | | $ | 1,150,517 | |
| Cash and cash equivalents, end of period | | $ | 2,243,971 | | | $ | 1,154,867 | | | $ | 1,259,871 | |
See accompanying notes to the consolidated financial statements
lululemon athletica inc.
INDEX FOR NOTES TO THE CONSOLIDATED FINANCIAL STATEMENTS
|
| | | | | | | |
| Note 1 | | |
| Note 2 | | |
| Note 3 | | |
| Note 4 | | |
| Note 5 | | |
Note 56 | | |
Note 67 | | |
Note 78 | | |
| Note 9 | | |
| Note 10 | | |
Note 811 | | |
| Note 12 | | |
Note 913 | | |
| Note 14 | | |
Note 1015 | | |
Note 1116 | | |
Note 1217 | | |
Note 1318 | | |
Note 1419 | | |
Note 1520 | | |
Note 1621 | | |
Note 1722 | | |
Note 18 | | |
Note 1923 | | |
Note 2024 | | |
Note 21 | | |
lululemon athletica inc.
NOTES TO THE CONSOLIDATED FINANCIAL STATEMENTS
NOTENote 1. NATURE OF OPERATIONS AND BASIS OF PRESENTATIONNature of Operations and Basis of Presentation
Nature of operations
lululemon athletica inc., a Delaware corporation, ("lululemon" and, together with its subsidiaries unless the context otherwise requires, the "Company") is engaged in the design, distribution, and retail of healthy lifestyle inspired athleticperformance apparel, which is soldfootwear, and accessories. The Company organizes its operations into four regional markets: Americas, China Mainland, Asia Pacific ("APAC"), and Europe and the Middle East ("EMEA"). It conducts its business through a chainnumber of different channels in each market, including company-operated stores, direct to consumer through e-commerce, outlets, sales from temporary locations, sales to wholesale, accounts, showrooms, warehouse sales,outlets, a re-commerce program, and through license and supply arrangements. The Company operates stores in the United States, Canada, Australia, China, the United Kingdom, New Zealand, Singapore, South Korea, Germany, Japan, Ireland, and Switzerland. There were 404, 406,711, 655, and 363574 company-operated stores in operation as of January 28, 2018,2024, January 29, 2017,2023, and January 31, 2016,30, 2022, respectively.
On June 1, 2017, the Company announced a plan to restructure its ivivva operations. On August 20, 2017, as part of this plan, the Company closed 48 of its 55 ivivva branded company-operated stores. The seven remaining ivivva branded stores remain in operation and are not expected to close. All of the Company's ivivva branded showrooms and other temporary locations have been closed. The Company continues to offer ivivva branded products on its e-commerce websites. Please refer to Note 13 of these consolidated financial statements for further details regarding the ivivva restructuring.
Basis of presentation
The consolidated financial statements have been presented in U.S. dollars and are prepared in accordance with United States generally accepted accounting principles ("GAAP").
The Company's fiscal year ends on the Sunday closest to January 31 of the following year, typically resulting in a 52 week52-week year, but occasionally giving rise to an additional week, resulting in a 53 week53-week year. Fiscal 2017, 2016,2023, fiscal 2022, and 2015fiscal 2021 were each 52 week52-week years. Fiscal 2017, 2016,2023, 2022, and 20152021 ended on January 28, 2018,2024, January 29, 2017,2023, and January 31, 2016,30, 2022, respectively, and are referred to as "2023," "2022," and "2021," respectively.
The Company's business is affected by the pattern of seasonality common to most retail apparel businesses. Historically, the Company has recognized a significant portion of its operating profit in the fourth fiscal quarter of each year as a result of increased net revenue during the holiday season.
Certain comparative figures have been reclassified to conform to the financial presentation adopted for the current year. This includes retrospectively adjusting the consolidated statements of cash flows for fiscal 2016 and fiscal 2015 to reclassify excess tax benefits (losses) from financing activities to operating activities, as outlined in Note 2 of these consolidated financial statements.
NOTENote 2. SUMMARY OF SIGNIFICANT ACCOUNTING POLICIESSummary of Significant Accounting Policies
Principles of consolidation
The consolidated financial statements include the accounts of lululemon athletica inc. and its wholly-owned subsidiaries. All intercompany balances and transactions have been eliminated.
Cash and cash equivalents
Cash and cash equivalents consist of cash on hand, bank balances, money market funds, and short-term deposits with original maturities of three months or less. The Company has not experienced any losses related to these balances, and management believes the Company's credit risk to be minimal.
Accounts receivable
Accounts receivable primarily arise out of third party gift card sales, sales to wholesale accounts, landlord lease inducements,online marketplaces, duty receivables, and license and supply arrangements. The allowance for doubtful accounts represents management's best estimate of probable credit losses in accounts receivable. Receivables are written off against the allowance when management believes that the amount receivable will not be recovered. As of January 28, 2018,2024 and January 29, 2017, and January 31, 2016,2023, the Company recordedhad an insignificant allowance for doubtful accounts.
Inventories
Inventories, consisting of finished goods, inventories in transit, and raw materials, are stated at the lower of cost and net realizable value. Cost is determined using weighted-average costs, and includes all costs incurred to deliver inventory to the Company's distribution centers including freight, non-refundable taxes, duty, and other landing costs.
The Company periodically reviews its inventories and makes provisionsa provision as necessary to appropriately value goods that are obsolete, have quality issues, or are damaged. The amount of the provision is equal to the difference between the cost of the inventory and its estimated net realizable value based upon assumptions about product quality, damages, future demand, selling prices, and market conditions. TheIf changes in market conditions result in reductions in the estimated net realizable value of its inventory below its previous estimate, the Company wrote-off $16.4 million, $16.1 million, and $14.2 million of inventorywould increase its provision in fiscal 2017, fiscal 2016, and fiscal 2015, respectively. the period in which it made such a determination.
In addition, the Company provides for inventory shrinkage based on historical trends from actual physical inventory counts. Inventory shrinkage estimates are made to reduce the inventory value for lost or stolen items. The Company performs physical inventory counts and cycle counts throughout the year and adjusts the shrink reserveprovision accordingly.
Business combinations
The purchase price of an acquisition is measured as the aggregate of the fair value of the consideration transferred including the acquisition-date fair value of the Company's previously held equity interests. The purchase price is allocated to the fair values of the tangible and intangible assets acquired and liabilities assumed, with any excess recorded as goodwill. These fair value determinations require judgment and may involve the use of significant estimates and assumptions. The purchase price allocation may be provisional during a measurement period of up to one year to provide reasonable time to obtain the information necessary to identify and measure the assets acquired and liabilities assumed. Any such measurement period adjustments are recognized in the period in which the adjustment amount is determined. Transaction costs associated with the acquisition are expensed as incurred.
Goodwill
Goodwill represents the excess of the aggregate of the consideration transferred, the fair value of any non-controlling interest in the acquiree, and the acquisition-date fair value of the Company's previously held equity interest over the net assets acquired and liabilities assumed. Goodwill is allocated to the reporting unit which is expected to receive the benefit from the synergies of the combination.
Goodwill is tested annually for impairment or more frequently when an event or circumstance indicates that goodwill might be impaired. Generally, the Company first performs a qualitative assessment to determine whether it is more likely than not that the fair value of a reporting unit is less than its carrying value. If factors indicate that this is the case, the Company then estimates the fair value of the related reporting unit. If the fair value is less than the carrying value, the goodwill of the reporting unit is determined to be impaired and the Company will record an impairment equal to the excess of the carrying value over its fair value.
Intangible assets
Acquired finite-lived intangible assets are amortized on a straight-line basis over their estimated useful lives, and are reviewed for impairment when events or circumstances indicate that the asset group to which the intangible assets belong might be impaired. The Company revises the estimated remaining useful life of these assets when events or changes in circumstances warrant a revision. If the Company revises the useful life, the unamortized balance is amortized over the remaining useful life on a prospective basis.
Property and equipment
Property and equipment are recorded at cost less accumulated depreciation. Direct internal and external costs related to software used for internal purposes which are incurred during the application development stage or for upgrades that add functionality are capitalized. All other costs related to internal use software are expensed as incurred. Property and equipment carrying values are reviewed for impairment when events or circumstances indicate that the asset group to which the property and equipment belong might be impaired.
Depreciation commences when an asset is ready for its intended use. Buildings are depreciated on a straight-line basis over the expected useful life of the asset, which is individually assessed, and estimated to be up to 2040 years. Leasehold improvements are depreciated on a straight-line basis over the lesser of the length of theexpected lease term and the estimated useful life of the improvement, to a maximum of five years.10 years for stores and 15 years for corporate offices and distribution centers. All other property and equipment are depreciated using the declining balance method as follows:
| | | | | | | | |
| | |
| Furniture and fixtures | | 20% |
| Computer hardware and software | | 20% - 50% |
| Equipment and vehicles | | 20% - 30% |
Equipment and vehicles | | 30% |
Cloud Computing Arrangements
The Company incurs costs to implement cloud computing arrangements hosted by third party vendors. Costs incurred to implement cloud computing service arrangements are capitalized when incurred during the application development phase, and intangible assets
Intangible assetsrecognized as other non-current assets. Implementation costs are recorded at cost. Reacquired franchise rights aresubsequently amortized on a straight-line basis over their estimated useful lives of 10 years.
Goodwill represents the excessexpected term of the aggregate of the consideration transferred, the fairrelated cloud service. The carrying value of any non-controlling interest in the acquiree, and the acquisition-date fair value of the Company's previously held equity interest over the net assets acquired and liabilities assumed. Goodwill and intangible assets with indefinite livescloud computing implementation costs are tested annually for impairment or more frequently when an event or circumstance indicates that goodwill or indefinite life intangible assetsthe asset might be impaired. The Company'sChanges in cloud computing arrangement implementation costs are classified within operating segment for goodwill is its company-operated stores.activities in the consolidated statements of cash flows.
Impairment of long-lived assets
Long-lived assets, including intangible assets with finite lives, held for use are evaluated for impairment when the occurrence of events or a change in circumstances indicates that the carrying value of the assets may not be recoverable as measured by comparing their carrying value to the estimated undiscounted future cash flows generated by their use and eventual disposition. Impaired assets are recorded at fair value, determined principally by discounting the future cash flows expected from their use and eventual disposition. Reductions in asset values resulting from impairment valuations are recognized in income in the period that the impairment is determined.
Leased property and equipment
At lease commencement, which is generally when the Company takes possession of the asset, the Company records a lease liability and corresponding right-of-use asset. Lease liabilities represent the present value of minimum lease payments over the expected lease term, which includes options to extend or terminate the lease when it is reasonably certain those options will be exercised. The Company leases stores, distribution centers, and administrative offices. present value of the lease liability is determined using the Company's incremental collateralized borrowing rate at the lease commencement.
Minimum rentallease payments including anyinclude base rent, fixed escalation of rental payments, and rental payments that are adjusted periodically depending on a rate or index. In determining minimum lease payments, the Company does not separate non-lease components for real estate leases. Non-lease components are generally services that the lessor performs for the Company associated with the leased asset, such as common area maintenance.
Right-of-use assets represent the right to control the use of the leased asset during the lease and are initially recognized in an amount equal to the lease liability. In addition, prepaid rent, premiums,initial direct costs, and adjustments for lease incentives are components of the right-of-use asset. Over the lease term the lease expense is amortized on a straight-line basis beginning on the lease commencement date. Right-of-use assets are assessed for impairment as part of the impairment of long-lived assets, which is performed whenever events or changes in circumstances indicate that the carrying amount of an asset or asset group may not be recoverable.
Variable lease payments, including contingent rental payments based on sales volume, are recognized when the achievement of the specific target is probable. A right-of-use asset and lease liability are not recognized for leases with an initial term of 12 months or less, and the lease expense is recognized on a straight-line basis over the life of the lease beginning on the possession date. Rental costs incurred during a construction period, prior to store opening, are recognized as rental expense.
Lease inducements, which include leasehold improvements paid for by the landlord and rent free periods, are recorded within other non-current liabilities on the consolidated balance sheets and recognized as a reduction of rent expense on a straight-line basis over the term of the lease.
The difference between the recognized rental expense and the total rental payments paid is reflected on the consolidated balance sheets within deferred lease liabilities or prepaid lease assets within other non-current liabilities and other non-current assets, respectively.
Contingent rental payments based on sales are recorded in the period in which the sales occur.term.
The Company recognizes a liability for the fair value of asset retirement obligations ("AROs") when such obligations are incurred. The Company's AROs are primarily associated with leasehold improvements which, at the end of a lease, the Company is contractually obligated to remove in order to comply with the lease agreement. At the inception of a lease with such conditions, the Company records an ARO liability and a corresponding capital asset in an amount equal to the estimated fair value of the obligation. The liability is estimated based on a number of assumptions requiring management's judgment, including store closing costs, cost inflation rates and discount rates, and is accreted to its projected future value over time. The capitalized asset is depreciated using the convention for depreciation of leasehold improvement assets. Upon satisfaction of the ARO conditions, any difference between the recorded ARO liability and the actual retirement costs incurred is recognized as an operating gain or loss in the consolidated statements of operations.
The Company recognizes a liability for a cost associated with a lease exit or disposal activity when such obligation is incurred. A lease exit or disposal liability is measured initially at its fair value in the period in which the liability is incurred. The Company estimates fair value at the cease-use date of its operating leases as the remaining lease rentals, reduced by estimated sublease rentals that could be reasonably obtained for the property, even where the Company does not intend to enter into a sublease. Estimating the cost of certain lease exit costs involves subjective assumptions, including the time it would take to sublease the leased location and the related potential sublease income. The estimated accruals for these costs could be significantly affected if future experience differs from the assumptions used in the initial estimate.
Revenue recognition
Net revenue is comprised of company-operated store net revenue, direct to consumer salese-commerce net revenue through www.lululemon.com, other country and region specific websites and mobile apps, including mobile apps on in-store devices that allow demand to be fulfilled via the Company's distribution centers, and other net revenue, which includes outlet sales, salesrevenue from temporary locations,outlets, sales to wholesale accounts, showroom sales, warehouse sales, and license and supply arrangement net revenue, which consists of royalties as well as sales of the Company's products to licensees.
licensees, re-commerce revenue, revenue from temporary locations, and lululemon Studio revenue. All revenue is reported net of markdowns, discounts, sales taxes collected for various governmental agencies.from customers on behalf of taxing authorities, and returns. lululemon Studio generates gross revenue from digital content subscriptions.
SalesRevenue is recognized when performance obligations are satisfied through the transfer of control of promised goods or services to customers throughthe Company's customers. Control transfers once a customer has the ability to direct the use of, and obtain substantially all of the benefits from, the product. This includes the transfer of legal title, physical possession, the risks and rewards of ownership, and customer acceptance. Revenue from company-operated stores and other retail locations areis recognized at the point of sale, net of discountssale. E-commerce revenue, sales to wholesale accounts and an estimated allowance forin-home fitness hardware sales returns. Sales of apparel to customers through the Company's retail websites and mobile apps are recognized upon receipt by the customer. In certain arrangements the Company receives payment before the customer receives the promised good. These payments are initially recorded as deferred revenue, and recognized as revenue in the period when delivery has occurred, and collectioncontrol is reasonably assured,transferred to the customer.
Revenue is presented net of an estimated allowance for estimated returns. The Company's liability for sales returns. Salesreturn refunds is recognized within accrued liabilities and other, and an asset for the value of apparelinventory which is expected to wholesale accountsbe returned is recognized within other prepaid expenses and other current assets on the consolidated balance sheets. As of January 28, 2024 and January 29, 2023, the sales return allowance was $61.6 million and $55.5 million, respectively.
Shipping fees billed to customers are recorded as revenue, and shipping costs are recognized when delivery has occurredwithin selling, general and collectionadministrative expenses in the same period the related revenue is reasonably assured.recognized.
RevenueProceeds from the Company'ssale of gift cards isare initially deferred and recognized when tendered for payment. Outstanding customer balances are included inwithin unredeemed gift card liability on the consolidated balance sheets. Theresheets, and are no expiration dates on the Company's gift cards, and lululemon does not charge any service fees that cause a decrement to customer balances.
recognized as revenue when tendered for payment. While the Company will continue to honor all gift cards presented for payment, management may determine the likelihood of redemption to be remote for certain card balances due to, among other things, long periods of inactivity. In these circumstances, to the extent management determines there is no requirement for remittingto remit unused card balances to government agencies under unclaimed property laws, the portion of card balances not expected to be redeemed are recognized in net revenue in proportion to the gift cards which have been redeemed, under the redemption recognition method. For the years ended January 28, 2018, January 29, 2017,2023, 2022, and January 31, 2016,2021, net revenue recognized on unredeemed gift card balances was $6.2$28.5 million, $4.5$23.3 million, and $3.6$18.7 million, respectively.
Cost of goods sold
Cost of goods sold includes:
•the cost of purchased merchandise, which includes acquisition and production costs including raw material and labor, as applicable;
•the cost incurred to deliver inventory to the Company's distribution centers including freight, non-refundable taxes, duty, and other landing costs;
•the cost of the Company's distribution centers, such as labor, rent, utilities, and depreciation;
•the cost of the Company's production, design, research and development, distribution, and merchandising departments including salaries, stock-based compensation and benefits, and other expenses;
•occupancy costs such as minimum rent, contingent rent where applicable, property taxes, utilities, and depreciation expense for the Company's company-operated store locations;
hemming; and•hemming costs;
•shrink and inventory provision expense.expense; and
•the cost of digital content subscription services
Selling, general and administrative expenses
Selling, general and administrative expenses consist of all operating costs not otherwise included in cost of goods sold, intangible asset amortization, or asset impairment and restructuring costs.acquisition-related expenses. The Company's selling, general and administrative expenses include the costs of corporate and retail employee wages and benefits, costs to transport the Company's products from the distribution facilities to the Company's salesretail locations and e-commerce guests, professional fees, marketing, information technology, human resources, accounting, legal, corporate facility and occupancy costs, and depreciation and amortization expense other than in cost of goods sold.
For the years ended January 28, 2018, January 29, 2017,2023, 2022, and January 31, 2016,2021, the Company incurred transportation costs to transport its products from its distribution facilities to its retail locations and e-commerce guests of $53.8$374.2 million, $44.9$353.7 million, and $40.6$270.8 million, respectively.
Asset impairmentAdvertising and restructuringMarketing Costs
Advertising costs,
Asset impairment including the costs to produce advertising, are expensed as incurred. Advertising expenses were $429.7 million, $328.6 million, and restructuring costs consist of the lease termination, impairment of property$297.5 million for 2023, 2022, and equipment, employee related costs,2021, respectively, and other restructuring costs recognized in connection with the restructuring of our ivivva operations.are included within selling, general and administrative expenses.
Store pre-opening costs
Operating costs incurred prior to the opening of new stores are expensed as incurred as selling, general and administrative expenses.
Income taxes
The Company follows the liability method with respect to accounting for income taxes. Deferred income tax assets and liabilities are determined based on the temporary differences between the carrying amounts and the tax basis of assets and liabilities, and for tax losses, tax credit carryforwards, and other tax attributes. Deferred income tax assets and liabilities are measured using enacted tax rates, for the appropriate tax jurisdiction, that are expected to be in effect when these differences are anticipated to reverse.
The Company has not recognized U.S. state income taxes and foreign withholding taxes on undistributed earnings of foreign subsidiaries which the Company has determined to be indefinitely reinvested.
Deferred income tax assets are reduced by a valuation allowance, if based on the weight of available evidence, it is more likely than not that some portion or all of the deferred tax assets will not be realized. The evaluation as to the likelihood of realizing the benefit of a deferred income tax asset is based on the timing of scheduled reversals of deferred tax liabilities, taxable income forecasts, and tax-planning strategies. The recognition of a deferred income tax asset is based upon several assumptions and forecasts, including current and anticipated taxable income, the utilization of previously unrealized non-operating loss carryforwards, and regulatory reviews of tax filings. Given the judgments and estimates required and the sensitivity of the results to the significant assumptions used, the Company believes the accounting estimates used in relation to the valuation of deferred income tax assets are subject to measurement uncertainty and are susceptible to change if the underlying assumptions change.
The Company provides for taxes at the enacted rate applicable for the appropriate tax jurisdiction. U.S. income taxes and foreign withholding taxes on undistributed earnings of foreign subsidiaries which the Company has determined to be indefinitely reinvested have not been recognized. Management periodically assesses the need to utilize these undistributed earnings to finance foreign operations. This assessment is based on the cash flow projections and operational and fiscal
objectives of each of the Company's foreign subsidiaries. Such estimates are inherently imprecise since many assumptions utilized in the projections are subject to revision in the future.
The Company evaluates its tax filing positions and recognizes the largest amount of tax benefit that is considered more likely than not to be sustained upon examination by the relevant taxing authorities based on the technical merits of the position. This determination requires the use of significant judgment. Income tax expense is adjusted in the period in which an uncertain tax position is effectively settled, the statute of limitations expires, facts or circumstances change, tax laws change, or new information becomes available. The Company's policy is to recognize interest expense and penalties related to income tax matters as part of other income (expense), net.tax expense. Accrued interest and penalties are included within the related tax liability on the Company's consolidated balance sheets.
The U.S. Tax Cuts and Jobs ActCompany treats the global intangible low-taxed income ("U.S.GILTI") tax reform") was enacted on December 22, 2017 and introduces significant changes to U.S. income tax law. The United States Securities Exchange Commission ("SEC") issued Staff Accounting Bulletin 118 ("SAB 118") which allows companies to record provisional estimates of the impacts of the U.S. tax reform withinas a one year measurement period. The Company has recorded certain provisional amounts in fiscal 2017 and expects the accounting for the income tax effects of the U.S. tax reform to be completed in fiscal 2018. The U.S. tax reform changes and their estimated impact to the Company are outlined in Note 14 of these consolidated financial statements.current period expense.
Fair value of financial instruments
Fair value is defined as the price that would be received to sell an asset or paid to transfer a liability in an orderly transaction between market participants at the measurement date. Fair value measurements are made using a three-tier fair value hierarchy, which prioritizes the inputs used in measuring fair value:
•Level 1 - defined as observable inputs such as quoted prices in active markets;
•Level 2 - defined as inputs other than quoted prices in active markets that are either directly or indirectly observable; and
•Level 3 - defined as unobservable inputs in which little or no market data exists, therefore requiring an entity to develop its own assumptions.
The fair value measurement is categorized in its entirety by reference to its lowest level of significant input.
The Company records cash, and cash equivalents, accounts receivable, accounts payable, and accrued liabilities at cost. The carrying values of these instruments approximate their fair value due to their short-term maturities. Unless otherwise noted, it is management's opinion that the Company is not exposed to significant interest or credit risks arising from these financial instruments.
The Company holds certain assets and liabilities that are required to be measured at fair value on a recurring basis, and performs certain valuations on a non-recurring basis, which are outlined in Note 11 of these consolidated financial statements.16. Fair Value Measurement.
Foreign currency
The functional currency for each entity included in these consolidated financial statements that is domiciled outside of the United States is generally the applicable local currency. Assets and liabilities of each foreign entity are translated into U.S. dollars at the exchange rate in effect on the balance sheet date. Net revenue and expenses are translated at the average rate in effect during the period. Unrealized translation gains and losses are recorded as a foreign currency translation adjustment, which is included in other comprehensive income or loss,(loss), net of tax, which is a component of accumulated other comprehensive income or loss included in stockholders' equity.
Foreign currency transactions denominated in a currency other than an entity's functional currency are remeasured into the functional currency with any resulting gains and losses recognized in selling, general and administrative expenses, except for gains and losses arising on intercompany foreign currency transactions that are of a long-term investment nature, which are recorded as a foreign currency translation adjustmentnet investment hedge gains (losses) in other comprehensive income or loss.(loss), net of tax.
Derivative financial instruments
The Company uses derivative financial instruments to manage its exposure to certain foreign currency exchange rate risks.
Net investment hedges. The Company enters into certain forward currency contracts that are designated as net investment hedges. The effective portions of the hedges are reported in accumulated other comprehensive income or loss, net of tax, and will subsequently be reclassified to net earnings in the period in which the hedged investment is either sold or substantially liquidated. Hedge effectiveness is measured using a method based on changes in forward exchange rates. The Company classifies the cash flows at settlement of its net investment hedges within investing activities in the consolidated statements of cash flows.
Derivatives not designated as hedging instruments. The Company also enters into certain forward currency contracts that are not designated as net investment hedges. They are designed to economically hedge the foreign exchange revaluation gains and losses of certain monetary assets and liabilities. The Company has not applied hedge accounting to these instruments and the change in fair value of these derivatives is recorded within selling, general and administrative expenses. The Company classifies the cash flows at settlement of its forward currency contracts which are not designated in hedging relationships within operating activities in the consolidated statements of cash flows.
The Company presents its derivative assets and derivative liabilities at their gross fair values within other prepaid expenses and other current assets and other current liabilities on the consolidated balance sheets. However, the Company's Master International Swap Dealers Association, Inc., Agreements and other similar arrangements allow net settlements under certain conditions.
The Company does not enter into derivative contracts for speculative or trading purposes. Additional information on the Company's derivative financial instruments is included in Notes 11Note 16. Fair Value Measurement and 12 of these consolidated financial statements.Note 17. Derivative Financial Instruments.
Concentration of credit risk
Accounts receivable are primarily fromarise out of third party gift card sales, sales to wholesale accounts, for landlord lease inducements,online marketplaces, duty receivables, and from license and supply arrangements. The Company generally does not require collateral to support the accounts receivable; however, in certain circumstances, the Company may require parties to provide payment for goods prior to delivery of the goods.goods or to provide letters of credit. The accounts receivable are net of an allowance for doubtful accounts, which is established based on management's assessment of the credit risk of the underlying accounts.
Cash and cash equivalents are held with high quality financial institutions. The amount of cash and cash equivalents held with certain financial institutions exceeds government-insured limits. The Company is also exposed to credit-related losses in the event of nonperformance by the counterparties to the forward currency contracts. The credit risk amount is the Company's unrealized gains on its derivative instruments, based on foreign currency rates at the time of nonperformance. The Company has not experienced any losses related to these items, and it believes credit risk to be minimal. The Company seeks to minimize its credit risk by entering into transactions with investment grade credit worthy and reputable financial institutions and by monitoring the credit standing of the financial institutions with whom it transacts. It seeks to limit the amount of exposure with any one counterparty.
The Company's derivative contracts contain certain credit risk-related contingent features. Under certain circumstances, including an event of default, bankruptcy, termination, and cross default under the Company's Americas revolving credit facility, the Company may be required to make immediate payment for outstanding liabilities under its derivative contracts.
Stock-based compensation
The Company accounts for stock-based compensation using the fair value method. The fair value of awards granted is estimated at the date of grant and is recognized asgrant. Awards settled in cash or common stock at the election of the employee are remeasured to fair value at the end of each reporting period until settlement. The employee compensation expense is recognized on a straight-line basis over the requisite service period with the offsetting credit to additional paid-in capital. capital for awards that are settled in common shares, and with the offsetting credit to accrued compensation and related expenses for awards that are settled in cash or common stock at the election of the employee.
For awards with service and/or performance conditions, the amount of compensation expense recognized is based on the number of awards expected to vest, reflecting estimated expected forfeitures, and is adjusted to reflect those awards that do ultimately vest. The forfeiture rate is based on management's best estimate of expected forfeitures, taking into consideration historical trends and expected future behavior. For awards with performance conditions, the Company recognizes the compensation expense if and when the Company concludes that it is probable that the performance condition will be achieved. The Company reassesses the probability of achieving the performance condition at each reporting date.
The grant date fair value of each stock option granted is estimated on the awardgrant date using the Black-Scholes model, and themodel. The grant date fair value of the restricted shares, performance-based restricted stock units, and restricted stock units is based on the closing price of the Company's common stock on the awardgrant date. Restricted stock units that were settled in cash or common stock at the election of the employee were remeasured to fair value at the end of each reporting period until settlement. This fair value was based on the closing price of the Company's common stock on the last business day before each period end.
Earnings per share
Earnings per share is calculated using the weighted-average number of common and exchangeable shares outstanding during the period. Exchangeable shares are the economic equivalent of common shares in all material respects. All classes of stock have in effect the same economic rights and share equally in undistributed net income. Diluted earnings per share is calculated by dividing net income available to stockholders for the period by the diluted weighted-average number of shares outstanding during the period. Diluted earnings per share reflects the potential dilution from common shares issuable through stock options,
performance-based restricted stock units that have satisfied their performance factor, restricted shares, and restricted stock units using the treasury stock method.
Contingencies
In the ordinary course of business, the Company is involved in legal proceedings regarding contractual and employment relationships and a variety of other matters. The Company records contingent liabilities resulting from claims against us,it, when a loss is assessed to be probable and the amount of the loss is reasonably estimable.
Use of estimates
The preparation of financial statements in conformity with GAAP in the United States requires management to make estimates and assumptions that affect the reported amounts of assets and liabilities and the disclosure of contingent assets and liabilities at the date of the financial statements as well as the reported amounts of net revenue and expenses during the reporting period. Actual results could differ from those estimates.
Recently adopted accounting pronouncements
The Company considers the applicability and impact of all Accounting Standard Updates ("ASUs"). ASUs adopted during 2023 not listed below were assessed, and determined to be either not applicable or are expected to have minimal impact on its consolidated financial position or results of operations.
In July 2015,September 2022, the FASB amended ASC Topic 330, Inventoryissued ASU 2022-04, Liabilities - Supplier Finance Programs (Subtopic 405-50): Disclosure of Supplier Finance Program Obligations, to simplifyrequire annual and interim disclosures about the measurementkey terms of inventory. The amendments require that an entity measure inventorysupplier finance programs used in connection with the purchase of goods and services along with information about the obligations under these programs, including the amount outstanding at the lowerend of costeach reporting period and net realizable value insteada roll-forward of the lower of cost and market. This guidance became effective for thethose obligations. The Company adopted this update during the first quarter of fiscal 20172023 and the adoption did not impact its consolidated financial statements.related disclosures are included in Note 13. Supply Chain Financing Program.
In March 2016, the FASB amended ASC Topic 718, Stock Compensation simplifying the accounting for share-based payment transactions, including the income tax consequences, classification
Recently issued accounting pronouncements
In May 2014, the Financial Accounting Standards Board ("FASB")ASUs recently issued Accounting Standards Update ("ASU") 2014-09, Revenue from Contracts with Customers ("ASC 606"). This ASU supersedes the revenue recognition requirements in ASC Topic 605 Revenue Recognition, including most industry-specific revenue recognition guidance. ASU 2014-09 requires that an entity recognize revenue to depict the transfer of promised goods or services to customers in an amount that reflects the consideration to which the entity expectsnot listed below were assessed and determined to be entitled in exchange for those goodseither not applicable or services, and expands the related disclosure requirements. The FASB has also issued several related updates which are requiredexpected to be adopted concurrently with ASU 2014-09. This guidance will be adopted by the Company beginning in its first quarter of fiscal 2018.
The Company has performed an analysis of thehave minimal impact of ASC 606 and does not believe that the adoption of this new guidance will materially impact the timing, or amount, of its revenue recognition. The Company uses the redemption recognition method for recognizing revenue for gift card breakage, and the methodology to be used under ASC 606 is consistent withon the Company's past practice. The Company expects to recognize its provision for sales returns on a gross basis, rather than a net basis, on the consolidated balance sheets. The Company plans to adopt this guidance on a modified retrospective basis.financial position or results of operations.
In February 2016,November 2023, the FASB issued ASC Topic 842, Leases ("ASC 842")ASU 2023-07, Segment Reporting (Topic 280): Improvements to increase transparency and comparability among organizations by recognizing lease assets and lease liabilities on the balance sheet and disclosing key information about leasing arrangements. Under the new guidance, lessees areReportable Segment Disclosures. Entities will be required to recognize a lease liability, which representsprovide disclosures of significant segmented expenses and other categories used by the discounted obligationChief Operating Decision Maker ("CODM") in order to make future minimum lease payments, and a corresponding right-of-use asset onenhance disclosure at the balance sheet for most leases.segment level. This guidance will beamendment is effective for the Companyannual periods beginning after December 15, 2023, and interim periods beginning after December 15, 2024, and is applied retrospectively for periods presented in its first quarter of fiscal 2019, with early application permitted. The Company will adopt ASC 842 in its first quarter of fiscal 2019. The Company is currently evaluating the impact that this new guidance will have on its consolidated financial statements, processes, and controls. It is expected that the primary financial statement impact upon adoption will be the recognition, on a discounted basis, of the Company's minimum commitments under noncancelable operating leases as right of use assets and obligations on the consolidated balance sheets. It is expected that this will result in a significant increase in assets and liabilities on the consolidated balance sheets.
In May 2017, the FASB amended ASC 718, Stock Compensation, to reduce diversity in practice and to clarify when a change to the terms or conditions of a share-based payment award must be accounted for as a modification. The new guidance will result in fewer changes to the terms of an award being accounted for as modifications. This guidance will be adopted by
the Company beginning in its first quarter of fiscal 2018 and applies prospectively to awards modified on or after adoption. The Company does not expect this guidance to have a material impact on its consolidated financial statements.
In August 2017, the FASB amended ASC 815, Derivatives and Hedging to more closely align hedge accounting with companies' risk management strategies, simplify the application of hedge accounting, and increase transparency as to the scope and results of hedging programs. It will make more financial and nonfinancial hedging strategies eligible for hedge accounting. It also amends the presentation and disclosure requirements and changes how companies assess effectiveness. This guidance will be effective for the Company beginning in its first quarter of fiscal 2019, with early application permitted. The Company is currently evaluating the impact that this new guidance may have on its consolidated financial statements.statement disclosures.
In February 2018,December 2023, the FASB amended ASC 220, Income Statement—Reporting Comprehensive Income. ASC 740, issued ASU 2023-09, Income Taxes, (Topic 740): Improvements to Income Tax Disclosures. This disclosure requires thatexpanded disclosure within the effectrate reconciliation as well as disaggregation of a change in tax laws or rates on deferred tax assets and liabilities be included in income from continuing operations. In situations in which the tax effects of a transaction were initially recognized directly in other comprehensive income, this results in “stranded” amounts in accumulated other comprehensive income related to the income tax rate differential. The amendments to ASC 220 allow a reclassification from accumulated other comprehensive income to retained earnings for stranded tax effects resulting from the enactment of tax bill, H.R.1, commonly known as the Tax Cuts and Jobs Act. The guidance in the ASUannual taxes paid. This amendment is effective for the Companyannual periods beginning in its first quarter of fiscal 2019 with early adoption permitted.after December 15, 2023, and is applied prospectively. The Company is currently evaluating the impact that this new guidance may have on its financial statement disclosures.
Note 3. Inventories
| | | | | | | | | | | | | | |
| | January 28, 2024 | | January 29, 2023 |
| | (In thousands) |
| Inventories, at cost | | $ | 1,465,076 | | | $ | 1,571,981 | |
| Provision to reduce inventories to net realizable value: | | | | |
| lululemon Studio Mirror provision | | (62,956) | | | (65,328) | |
| Obsolescence provision | | (42,903) | | | (18,903) | |
| Damages provision | | (33,836) | | | (38,996) | |
| Shrink provision | | (1,779) | | | (1,387) | |
| | (141,474) | | | (124,614) | |
| Inventories | | $ | 1,323,602 | | | $ | 1,447,367 | |
Please refer to Note 8. Impairment of shareholders' equity,Goodwill and Other Assets, Restructuring Costs for further details on the timing of adoption.lululemon Studio obsolescence provision.
NOTE 3. INVENTORIESNote 4. Prepaid Expenses and Other Current Assets
| | | | | | | | | | | | | | |
| | January 28, 2024 | | January 29, 2023 |
| | (In thousands) |
| Prepaid expenses | | 137,203 | | | 142,003 | |
| Forward currency contract assets | | 647 | | | 16,707 | |
| Other current assets | | 46,652 | | | 79,962 | |
| Prepaid expenses and other current assets | | $ | 184,502 | | | $ | 238,672 | |
|
| | | | | | | | |
| | | January 28, 2018 | | January 29, 2017 |
| | | (In thousands) |
| Finished goods | | $ | 344,695 |
| | $ | 306,087 |
|
| Provision to reduce inventories to net realizable value | | (15,133 | ) | | (7,655 | ) |
| Inventories | | $ | 329,562 |
| | $ | 298,432 |
|
NOTE 4. PROPERTY AND EQUIPMENTNote 5. Property and Equipment
|
| | | | | | | | |
| | | January 28, 2018 | | January 29, 2017 |
| | | (In thousands) |
| Land | | $ | 83,048 |
| | $ | 78,561 |
|
| Buildings | | 39,278 |
| | 32,174 |
|
| Leasehold improvements | | 301,449 |
| | 263,957 |
|
| Furniture and fixtures | | 91,778 |
| | 81,790 |
|
| Computer hardware | | 61,734 |
| | 52,107 |
|
| Computer software | | 173,997 |
| | 135,156 |
|
| Equipment and vehicles | | 14,806 |
| | 11,966 |
|
| Work in progress | | 51,260 |
| | 46,113 |
|
| Property and equipment, gross | | 817,350 |
| | 701,824 |
|
| Accumulated depreciation | | (343,708 | ) | | (278,325 | ) |
| Property and equipment, net | | $ | 473,642 |
| | $ | 423,499 |
|
Included in the cost of computer software are capitalized costs of $12.4 million and $6.3 million as of January 28, 2018 and January 29, 2017, respectively, associated with internally developed software. | | | | | | | | | | | | | | |
| | January 28, 2024 | | January 29, 2023 |
| | (In thousands) |
| Land | | $ | 79,498 | | | $ | 80,692 | |
| Buildings | | 29,032 | | | 28,850 | |
| Leasehold improvements | | 1,006,926 | | | 818,071 | |
| Furniture and fixtures | | 156,656 | | | 144,572 | |
| Computer hardware | | 176,597 | | | 166,768 | |
| Computer software | | 1,032,567 | | | 742,295 | |
| Equipment and vehicles | | 34,017 | | | 30,766 | |
| Work in progress | | 247,943 | | | 244,898 | |
| Property and equipment, gross | | 2,763,236 | | | 2,256,912 | |
| Accumulated depreciation | | (1,217,425) | | | (987,298) | |
| Property and equipment, net | | $ | 1,545,811 | | | $ | 1,269,614 | |
Depreciation expense related to property and equipment was $108.0$374.0 million, $87.0$282.7 million, and $72.6$215.3 million for 2023, 2022, and 2021, respectively.
Gain on Disposal of Assets
During the years endedsecond quarter of 2022, the Company completed the sale of an administrative office building, which resulted in a pre-tax gain of $10.2 million. The income tax effect of the gain on disposal of assets was an expense of $1.7 million.
Note 6. Goodwill
The changes in the carrying amounts of goodwill were as follows:
| | | | | | | | |
| | Goodwill |
| | (In thousands) |
| Balance as of January 30, 2022 | | $ | 386,880 | |
| Impairment of goodwill | | (362,492) | |
| Effect of foreign currency translation | | (244) | |
| Balance as of January 29, 2023 | | $ | 24,144 | |
| | |
| Effect of foreign currency translation | | (61) | |
| Balance as of January 28, 2024 | | $ | 24,083 | |
The Company recognized an impairment charge of $362.5 million related to the lululemon Studio reporting unit as of January 29, 2023 on the goodwill that arose from the acquisition of MIRROR. Please refer to Note 8. Impairment of Goodwill and Other Assets, Restructuring Costs for further information.
Note 7. Intangible Assets
A summary of the balances of the Company's intangible assets as of January 28, 2018,2024, January 29, 2017,2023, is presented below:
| | | | | | | | | | | | | | | | | | | | | | | | | | |
| | January 28, 2024 |
| | Gross Carrying Amount | | Accumulated Amortization | | Accumulated Impairment | | Net Carrying Amount |
| | (In thousands) |
| MIRROR brand | | $ | 26,500 | | | $ | (4,089) | | | $ | (22,411) | | | $ | — | |
| Customer relationships | | 28,000 | | | (7,492) | | | (20,508) | | | — | |
| Technology | | 25,500 | | | (12,632) | | | (12,868) | | | — | |
| Content | | 5,000 | | | (3,250) | | | (1,750) | | | — | |
| Other | | 270 | | | (270) | | | — | | | — | |
| Intangible assets | | $ | 85,270 | | | $ | (27,733) | | | $ | (57,537) | | | $ | — | |
| | | | | | | | | | | | | | | | | | | | | | | | | | | | | | | | |
| | January 29, 2023 |
| | Gross Carrying Amount | | Accumulated Amortization | | Impairment | | Net Carrying Amount | | Remaining Useful Life (Years) |
| | (In thousands, except in years) |
| MIRROR brand | | $ | 26,500 | | | $ | (3,423) | | | $ | (20,077) | | | $ | 3,000 | | | 3.0 |
| Customer relationships | | 28,000 | | | (7,492) | | | (20,508) | | | — | | | n/a |
| Technology | | 25,500 | | | (8,956) | | | — | | | 16,544 | | | 3.0 |
| Content | | 5,000 | | | (2,583) | | | — | | | 2,417 | | | 2.4 |
| Other | | 270 | | | (270) | | | — | | | — | | | n/a |
| Intangible assets | | $ | 85,270 | | | $ | (22,724) | | | $ | (40,585) | | | $ | 21,961 | | | 2.9 |
Amortization of intangible assets was $5.0 million, $8.8 million, and January 31, 2016,$8.8 million in 2023, 2022, and 2021, respectively.
See Note 13During 2022 and 2023, the Company recognized intangible asset impairment charges of these consolidated financial statements for information$40.6 million and $17.0 million, respectively. These impairment charges related to the intangible assets that were recognized on the acquisition of MIRROR. Please refer to Note 8. Impairment of Goodwill and Other Assets, Restructuring Costs for further information.
Note 8. Impairment of Goodwill and Other Assets, Restructuring Costs
During 2022, the Company decided to shift its lululemon Studio strategy to focus on providing digital app-based services. The Company continued to sell the lululemon Studio Mirror hardware in 2023, and reached the decision to cease selling it during the third quarter of 2023. It also contracted with Peloton Interactive, Inc. to be the exclusive digital fitness content provider to existing lululemon Studio subscribers, and stopped producing its own digital fitness content. The Company ceased selling the lululemon Studio Mirror and new digital content subscriptions in December 2023.
These strategy shifts resulted in impairment testing and the recognition of goodwill impairment, inventory provisions, asset impairments, and restructuring costs related to the lululemon Studio reporting unit. The following table summarizes the amounts recognized:
| | | | | | | | | | | | | | | | |
| | 2023 | | 2022 | | |
| | (In thousands) | | |
| Costs recorded in cost of goods sold: | | | | | | |
| lululemon Studio obsolescence provision | | $ | 23,709 | | | $ | 62,928 | | | |
| | | | | | |
| Costs recorded in operating expenses: | | | | | | |
| Impairment of assets: | | | | | | |
| Impairment of goodwill | | $ | — | | | $ | 362,492 | | | |
| Impairment of intangible assets | | 16,951 | | | 40,585 | | | |
| Impairment of cloud computing arrangement implementation costs | | 16,074 | | | — | | | |
| Impairment of property and equipment | | 11,161 | | | 4,836 | | | |
| | $ | 44,186 | | | $ | 407,913 | | | |
| Restructuring costs | | 30,315 | | | — | | | |
| Impairment of goodwill and other assets, restructuring costs | | $ | 74,501 | | | $ | 407,913 | | | |
| | | | | | |
| Total pre-tax charges | | $ | 98,210 | | | $ | 470,841 | | | |
| | | | | | |
| Income tax effects of charges | | $ | (26,085) | | | $ | (28,171) | | | |
| Total after-tax charges | | $ | 72,125 | | | $ | 442,670 | | | |
lululemon Studio obsolescence provision
During 2022, the change in strategy related to lululemon Studio to focus on digital app-based services meant the Company no longer expected to be able to sell all of the lululemon Studio hardware inventory above cost and it recognized an obsolescence provision of $62.9 million. The net realizable value was determined based on hardware sales forecasts and assumptions regarding liquidation value.
As a result of the decision to cease selling the lululemon Studio Mirror in the third quarter of 2023, the Company recognized a further inventory obsolescence provision of $23.7 million during 2023. The net realizable value of the lululemon Studio inventory was based on assumptions regarding liquidation value.
Impairment of goodwill and other assets
As a result of the strategy shift during 2022, it was concluded that the Company should conduct an impairment test for the goodwill, intangible assets, and property and equipment related to lululemon Studio as of January 29, 2023. The Company used a discounted cash flow model to estimate the fair value of the lululemon Studio reporting unit based on the updated strategic plans, supplemented by market comparable analysis, which indicated the fair value of lululemon Studio was lower than its carrying value, and led to a recognition of an impairment of long-livedgoodwill of $362.5 million. The key assumptions used to estimate the fair value of the lululemon Studio reporting unit were the revenue growth rates, operating profit margins, and the discount rate. The fair value of the lululemon Studio reporting unit was a Level 3 fair value measurement.
As of January 29, 2023, the undiscounted cash flows of the lululemon Studio asset group to which the intangible assets belonged were less than their carrying value, and therefore the Company calculated the fair value of the asset group, which was also less than its carrying value. This resulted in impairment of intangible assets of $40.6 million relating to the MIRROR brand, which was associated with in-home hardware, and to the customer relationship intangible assets that were recognized as part of the restructuringacquisition.
During 2023, as a result of the Company's decision to no longer produce digital fitness content and to cease the sale of the lululemon Studio Mirror, the Company performed impairment testing for the lululemon Studio asset group as of October 29, 2023. The undiscounted cash flows of the lululemon Studio asset group were less than their carrying value, and therefore the Company calculated the fair value of the asset group, which was also less than its ivivva operations.
carrying value.
As a result of the impairment test, the Company recognized asset impairments totaling $44.2 million during 2023. The fair value of long-lived assets was based on a discounted cash flow model, and is a Level 3 non-recurring fair value measurement. The key assumptions used to estimate the fair value were subscriber churn rates and operating costs.
NOTE 5. GOODWILL AND INTANGIBLE ASSETSRestructuring costs
During 2023, the Company recognized restructuring costs of $30.3 million for lululemon Studio primarily related to contract termination costs, employee severance costs, and professional fees.
Note 9. Acquisition-Related Expenses
|
| | | | | | | | |
| | | January 28, 2018 | | January 29, 2017 |
| | | (In thousands) |
| Goodwill | | $ | 25,496 |
| | $ | 25,496 |
|
| Changes in foreign currency exchange rates | | (890 | ) | | (1,263 | ) |
| | | 24,606 |
| | 24,233 |
|
| Intangible assets, net | | 73 |
| | 324 |
|
| Goodwill and intangible assets, net | | $ | 24,679 |
| | $ | 24,557 |
|
NOTE 6. OTHER CURRENT LIABILITIESNote 10. Other Non-Current Assets
| | | | | | | | | | | | | | |
| | January 28, 2024 | | January 29, 2023 |
| | (In thousands) |
| Cloud computing arrangement implementation costs | | $ | 133,597 | | | $ | 114,700 | |
| Security deposits | | 31,825 | | | 28,447 | |
| Other | | 21,262 | | | 12,898 | |
| Other non-current assets | | $ | 186,684 | | | $ | 156,045 | |
As of January 28, 2024 and January 29, 2023, cloud computing arrangement implementation costs consisted of deferred costs of $289.3 million and $212.4 million, respectively, and associated accumulated amortization of $155.7 million and $97.7 million, respectively.
Note 11. Accrued Liabilities and Other
| | | | | January 28, 2018 | | January 29, 2017 |
| | | (In thousands) |
| Accrued duty, freight, and other operating expenses | | $ | 33,695 |
| | $ | 23,239 |
|
| | January 28, 2024 | | | | January 28, 2024 | | January 29, 2023 |
| | (In thousands) | | | | (In thousands) |
| Accrued operating expenses | |
| Sales return allowances | |
| Accrued freight | |
| Accrued capital expenditures | |
| Accrued duty | |
| Accrued rent | |
| Accrued inventory liabilities | |
| Sales tax collected | | 11,811 |
| | 10,182 |
|
| Forward currency contract liabilities | | 8,771 |
| | — |
|
| Accrued rent | | 7,074 |
| | 5,562 |
|
| Sales return allowances | | 6,293 |
| | 4,728 |
|
| Accrued capital expenditures | | 5,714 |
| | 4,238 |
|
| Other | | 6,631 |
| | 4,612 |
|
| Other current liabilities | | $ | 79,989 |
| | $ | 52,561 |
|
| Accrued liabilities and other | |
NOTE 7. OTHER NON-CURRENT LIABILITIESNote 12. Revolving Credit Facilities
|
| | | | | | | | |
| | | January 28, 2018 | | January 29, 2017 |
| | | (In thousands) |
| Deferred lease liabilities | | $ | 27,186 |
| | $ | 26,648 |
|
| Tenant inducements | | 26,250 |
| | 21,668 |
|
| Other | | 5,885 |
| | — |
|
| Other non-current liabilities | | $ | 59,321 |
| | $ | 48,316 |
|
NOTE 8. LONG-TERM DEBT AND CREDIT FACILITIES
RevolvingAmericas revolving credit facility
On December 15, 2016,14, 2021, the Company entered into a $150.0an amended and restated credit agreement extending its existing credit facility, which provides for $400.0 million in commitments under an unsecured five-year revolving credit facility. Any amounts outstanding under the revolvingThe credit facility will be due and payable in full onhas a maturity date of December 15, 2021,14, 2026, subject to provisions that permit the Company to request a limited number of one year extensions annually.
Up to $35.0 million of the revolving credit facility is available for the issuance of letters of credit and up to $25.0 million is available for swing line loans. Commitmentsextension under the revolving credit facility may be increased by up to $200.0 million, subject to certain conditions, including the approval of the lenders.
circumstances. Borrowings under the revolving credit facility may be made in U.S. Dollars, Euros, Canadian Dollars, and in other currencies, subject to the approval of the administrative agent and the lenders. Borrowings under the agreement may be prepaid and commitments may be reduced or terminated without premium or penalty (other than customary breakage costs).
As of January 28, 2024, aside from letters of credit of $6.3 million, the Company had no other borrowings outstanding under this credit facility.
Borrowings made under the revolving credit facility bear interest at a variable rate per annum equal to, at the Company's option, either (a) LIBORa rate based on the Secured Overnight Financing Rate as administered by the Federal Reserve Bank of New York ("SOFR"), or (b) an alternate base rate, plus, in each case, an applicable margin. The applicable margin is determined by reference to a pricing grid, based on the ratio of indebtedness to earnings before interest, tax, depreciation, amortization, and rent ("EBITDAR") and ranges between 1.00%-1.75%1.000%-1.375% for LIBORSOFR loans and 0.00%-0.75%0.000%-0.375% for alternate base rate or Canadian prime rate loans. Additionally, a commitment fee of between 0.125%0.100%-0.200%, also determined by reference to the pricing grid, is payable on the average daily unused amounts under the revolving credit facility.
2.50 basis points to its drawn pricing and positive or negative sustainability fee adjustments of 0.50 basis points to its undrawn pricing.
The credit agreement contains negative covenants that, among other things and subject to certain exceptions, limit the ability of the Company's subsidiaries to incur indebtedness, incur liens, undergo fundamental changes, make dispositions of all or substantially all of their assets, alter their businesses and enter into agreements limiting subsidiary dividends and distributions.
The Company is also required to maintain a consolidated rent-adjustedCompany's financial covenants include maintaining an operating lease adjusted leverage ratio of not greater than 3.50:3.25:1.00 and it is not permitted to allow the ratio of consolidated EBITDAR to consolidated interest charges (plus rent) to beof not less than 2.00:1.00. The credit agreement also contains certain customary representations, warranties, affirmative covenants, and events of default (including, among others, an event of default upon the occurrence of a change of control). If an event of default occurs, the credit agreement may be terminated, and the maturity of any outstanding amounts may be accelerated. As of January 28, 2018,2024, the Company was in compliance with all applicablethe covenants of the credit facility.
China Mainland revolving credit facility
In December 2019, the Company entered into an uncommitted and unsecured 130.0 million Chinese Yuan ($18.1 million) revolving credit facility with terms that are reviewed on an annual basis. The credit facility was increased to 230.0 million Chinese Yuan ($32.0 million) during 2020 and increased to 240.0 million Chinese Yuan ($33.4 million) during 2023. It is comprised of a revolving loan of up to 200.0 million Chinese Yuan ($27.9 million) and a financial guarantee facility of up to 40.0 million Chinese Yuan ($5.6 million), or its equivalent in another currency. Loans are available for a period not to exceed 12 months, at an interest rate equal to the loan prime rate plus a spread of 0.5175%. The Company is required to follow certain covenants.
As of January 28, 2018,2024, the Company was in compliance with the covenants and, aside from letters of credit of $1.232.5 million Chinese Yuan ($4.5 million), there were no other borrowings or guarantees outstanding under this credit facility.
Note 13. Supply Chain Financing Program
The Company facilitates a voluntary supply chain financing ("SCF") program that allows its suppliers to elect to sell the receivables owed to them by the Company to a third party financial institution. Participating suppliers negotiate arrangements directly with the financial institution. If a supplier chooses to participate in the SCF program it may request an invoice be paid earlier than it would by the Company, and the financial institution at its sole and absolute discretion, may elect to make an early payment to the supplier at a discount. The Company's obligations to its suppliers, including amounts due and scheduled payment terms, are not impacted by a supplier's participation in the arrangement and the Company provides no guarantees to any third parties under the SCF program.
A roll-forward of the amounts outstanding under the SCF program, which are presented within accounts payable, is presented below:
| | | | | | | | |
| | 2023 |
| | (In thousands) |
| Supply chain financing program balance, beginning of year | | $ | 17,578 | |
| Amounts added during the year | | $ | 533,640 | |
| Amounts settled during the year | | $ | (509,079) | |
| Supply chain financing program balance, end of year | | $ | 42,139 | |
NOTE 9. STOCKHOLDERS' EQUITYNote 14. Stockholders' Equity
Special voting stock and exchangeable shares
The holders of the special voting stock are entitled to one vote for each share held. The special voting shares are not entitled to receive dividends or distributions or receive any consideration in the event of a liquidation, dissolution, or wind-up. To the extent that exchangeable shares as described below are exchanged for common stock, a corresponding number of special voting shares will be cancelled without consideration.
The holders of the exchangeable shares have dividend and liquidation rights equivalent to those of holders of the common shares of the Company. The exchangeable shares can be converted on a one for one basis by the holder at any time into common shares of the Company plus a cash payment for any accrued and unpaid dividends. Holders of exchangeable shares are entitled to the same or economically equivalent dividend as declared on the common stock of the Company. The exchangeable shares are non-voting. The Company has the right to convert the exchangeable shares into common shares of the Company at any time after the earlierearliest of July 26, 2047, the date on which fewer than 4.2 million exchangeable shares are outstanding, or in the event of certain events such as a change in control.
NOTE 10. STOCK-BASED COMPENSATION AND BENEFIT PLANSNote 15. Stock-Based Compensation and Benefit Plans
Stock-based compensation plans
The Company's eligible employees participate in various stock-based compensation plans, which are provided directly by the Company directly.Company.
In June 2014,2023, the Company's stockholders approved the adoption of the lululemon athletica inc. 20142023 Equity Incentive Plan ("2014 Plan").Plan. The 20142023 Equity Incentive Plan provides for awards in the form of stock options, stock appreciation rights, restricted stock purchase rights, restricted sharestock bonuses, restricted stock units, performance shares, performance-based restricted stock units, cash-based awards, other stock-based awards, and deferred compensation awards to employees (including officers and directors who are also employees), consultants, and directors of the Company.
The awards granted under the 20072014 Equity Incentive Plan ("2007 Plan") remain outstanding and continue to vest under their original conditions. No further awards will be granted under the 20072014 Equity Incentive Plan.
The Company has granted stock options, performance-based restricted stock units, restricted stock units, and restricted shares. Stock options granted to date generally have a four-year vesting period and vest at a rate of 25% each year on the anniversary date of the grant. Stock options generally expire on the earlier of seven years from the date of grant, or a specified period of time following termination, in accordance with the 2014 Plan and the related grant agreement.termination. Performance-based restricted stock units issued generally vest three years from the grant date and restricted shares generally vest one year from the grant date. Restricted stock units granted generally have a three-year vesting period and vest at a certain percentage each year on the anniversary date of the grant.
The Company issues previously unissued shares upon the exercise of Company options, vesting of performance-based restricted stock units or restricted stock units that are settled in common stock, and granting of restricted shares.
Stock-based compensation expense charged to income for the plans was $17.6$92.7 million, $16.8$77.2 million, and $10.4$66.4 million for the years ended January 28, 2018, January 29, 2017,2023, 2022, and January 31, 2016,2021, respectively.
Total unrecognized compensation cost for all stock-based compensation plans was $44.6$135.9 million as of January 28, 2018,2024, which is expected to be recognized over a weighted-average period of 2.0 years, and was $35.8$118.0 million as of January 29, 20172023 over a weighted-average period of 2.22.1 years.
Company stock options, performance-based restricted stock units, restricted shares and restricted stock units
A summary of the balances of the Company's stock option, performance-based restricted stock unit, restricted share and restricted stock unit activitystock-based compensation plans as of January 28, 2018,2024, January 29, 2017,2023, and January 31, 2016,30, 2022, and changes during the fiscal years then ended is presented below:
| | | | | Stock Options | | Performance-Based Restricted Stock Units | | Restricted Shares | | Restricted Stock Units |
| | | Number | | Weighted-Average Exercise Price | | Number | | Weighted-Average Grant Date Fair Value | | Number | | Weighted-Average Grant Date Fair Value | | Number | | Weighted-Average Grant Date Fair Value |
| | | (In thousands, except per share amounts) |
| Balance at February 1, 2015 | | 879 |
| | $ | 39.25 |
| | 452 |
| | $ | 59.27 |
| | 62 |
| | $ | 42.86 |
| | 186 |
| | $ | 45.75 |
|
| | Stock Options | | | | Stock Options | | Performance-Based Restricted Stock Units | | Restricted Shares | | Restricted Stock Units | | Restricted Stock Units
(Liability Accounting) |
| | Number | | | | Number | | Weighted-Average Exercise Price | | Number | | Weighted-Average Grant Date Fair Value | | Number | | Weighted-Average Grant Date Fair Value | | Number | | Weighted-Average Grant Date Fair Value | | Number | | Weighted-Average Fair Value |
| | (In thousands, except per share amounts) | | | | (In thousands, except per share amounts) |
| Balance as of January 31, 2021 | |
| Granted | | 399 |
| | 57.43 |
| | 156 |
| | 63.35 |
| | 19 |
| | 66.07 |
| | 238 |
| | 61.60 |
|
| Exercised/vested | | 235 |
| | 20.26 |
| | 58 |
| | 67.50 |
| | 46 |
| | 42.73 |
| | 41 |
| | 46.04 |
|
| Forfeited/expired | | 176 |
| | 55.22 |
| | 155 |
| | 62.06 |
| | 4 |
| | 38.25 |
| | 50 |
| | 53.35 |
|
| Balance at January 31, 2016 | | 867 |
| | $ | 49.54 |
| | 395 |
| | $ | 58.58 |
| | 31 |
| | $ | 57.67 |
| | 333 |
| | $ | 55.91 |
|
| Balance as of January 30, 2022 | |
| Granted | | 428 |
| | 68.63 |
| | 164 |
| | 68.64 |
| | 17 |
| | 69.94 |
| | 216 |
| | 68.15 |
|
| Exercised/vested | | 191 |
| | 36.76 |
| | 7 |
| | 64.36 |
| | 34 |
| | 58.39 |
| | 91 |
| | 56.87 |
|
| Forfeited/expired | | 186 |
| | 58.87 |
| | 162 |
| | 62.54 |
| | — |
| | — |
| | 98 |
| | 55.95 |
|
| Balance at January 29, 2017 | | 918 |
| | $ | 59.20 |
| | 390 |
| | $ | 61.05 |
| | 14 |
| | $ | 70.54 |
| | 360 |
| | $ | 62.99 |
|
| Balance as of January 29, 2023 | |
| Granted | | 619 |
| | 52.34 |
| | 192 |
| | 52.38 |
| | 24 |
| | 52.38 |
| | 336 |
| | 52.83 |
|
| Exercised/vested | | 109 |
| | 51.62 |
| | — |
| | — |
| | 14 |
| | 70.29 |
| | 135 |
| | 60.64 |
|
| Forfeited/expired | | 311 |
| | 58.09 |
| | 253 |
| | 55.30 |
| | 3 |
| | 51.72 |
| | 134 |
| | 57.28 |
|
| Balance at January 28, 2018 | | 1,117 |
| | $ | 56.44 |
| | 329 |
| | $ | 60.42 |
| | 21 |
| | $ | 52.45 |
| | 427 |
| | $ | 57.54 |
|
| Balance as of January 28, 2024 | |
A total of 13.84.0 million shares of the Company's common stock have been authorized for future issuance under the Company's 20142023 Equity Incentive Plan.
The Company's performance-based restricted stock units are awarded to eligible employees and entitle the grantee to receive a maximum of two shares of common stock per performance-based restricted stock unit if the Company achieves specified performance goals and the grantee remains employed during the vesting period. The fair value of performance-based restricted stock units is based on the closing price of the Company's common stock on the awardgrant date. Expense for performance-based restricted stock units is recognized when it is probable that the performance goal will be achieved.
In January 2018, the Company determined that the impact of the ivivva restructuring would be excluded from the measurement of performance for its performance-based restricted stock awards. This resulted in a modification of the awards for accounting purposes, impacting approximately 250 employees, and resulting in a total incremental stock-based compensation expense of $10.1 million. This expense will be recognized over the remaining service period of the affected awards and $0.1 million was recognized during the year ended January 28, 2018.
The grant date fair value of the restricted shares and restricted stock units is based on the closing price of the Company's common stock on the awardgrant date.
the employee were remeasured to fair value at the end of each reporting period until settlement. This fair value was based on the closing price of the Company's common stock on the last business day before each period end.
The grant date fair value of each stock option granted is estimated on the date of grant using the Black-Scholes model. The closing price of the Company's common stock on the grant date is used in the model. The assumptions used to calculate the fair value of the options granted are evaluated and revised, as necessary, to reflect market conditions and the Company's historical experience. The expected term of the options is based upon the historical experience of similar awards, giving consideration to expectations of future employee exercise behavior. Expected volatility is based upon the historical volatility of the Company's common stock for the period corresponding with the expected term of the options. The risk-free interest rate is based on the U.S. Treasury yield curve for the period corresponding with the expected term of the options. The following are weighted averages of the assumptions that were used in calculating the fair value of stock options granted in fiscal 2017, 2016,2023, 2022, and 2015:2021:
| | | | | | | | | | | | | | | | | | | | |
| | | 2023 | | 2022 | | 2021 |
| Expected term | | 3.75 years | | 3.75 years | | 3.75 years |
| Expected volatility | | 42.35 | % | | 40.00 | % | | 39.32 | % |
| Risk-free interest rate | | 3.49 | % | | 2.51 | % | | 0.50 | % |
| Dividend yield | | — | % | | — | % | | — | % |
|
| | | | | | | | | |
| | | Fiscal Year Ended |
| | | January 28, 2018 | | January 29, 2017 | | January 31, 2016 |
| Expected term | | 4.00 years |
| | 4.00 years |
| | 4.00 years |
|
| Expected volatility | | 38.28 | % | | 40.07 | % | | 42.73 | % |
| Risk-free interest rate | | 1.72 | % | | 1.08 | % | | 0.98 | % |
| Dividend yield | | — | % | | — | % | | — | % |
The following table summarizes information about stock options outstanding and exercisable as of January 28, 2018:2024:
|
| | | | | | | | | | | | | | | | | | | | |
| | | Outstanding | | Exercisable |
| Range of Exercise Prices | | Number of Options | | Weighted-Average Exercise Price | | Weighted-Average Remaining Life (Years) | | Number of Options | | Weighted-Average Exercise Price | | Weighted-Average Remaining Life (Years) |
| | | (In thousands, except per share amounts and years) |
| $11.75 - $51.72 | | 151 |
| | $ | 43.32 |
| | 4.0 | | 85 |
| | $ | 39.93 |
| | 3.3 |
| $51.87 - $51.87 | | 431 |
| | 51.87 |
| | 6.2 | | — |
| | — |
| | 0.0 |
| $52.39 - $64.46 | | 175 |
| | 54.69 |
| | 4.3 | | 85 |
| | 53.97 |
| | 3.8 |
| $64.83 - $67.68 | | 80 |
| | 65.13 |
| | 4.3 | | 35 |
| | 65.00 |
| | 4.3 |
| $68.69 - $78.86 | | 280 |
| | 69.15 |
| | 5.0 | | 78 |
| | 69.80 |
| | 4.5 |
| | | 1,117 |
| | $ | 56.44 |
| | 5.2 | | 283 |
| | $ | 55.44 |
| | 3.9 |
| Intrinsic value | | $ | 25,287 |
| | | | | | $ | 6,679 |
| | | | |
| | | | | | | | | | | | | | | | | | | | | | | | | | | | | | | | | | | | | | |
| | | Outstanding | | Exercisable |
| Range of Exercise Prices | | Number of Options | | Weighted-Average Exercise Price | | Weighted-Average Remaining Life (Years) | | Number of Options | | Weighted-Average Exercise Price | | Weighted-Average Remaining Life (Years) |
| | (In thousands, except per share amounts and years) |
| $2.78-$174.52 | | 151 | | | $ | 146.29 | | | 1.8 | | 151 | | | $ | 146.29 | | | 1.8 |
| $188.84-$296.36 | | 121 | | | 189.43 | | | 3.1 | | 79 | | | 189.43 | | | 3.1 |
| $306.71-$356.93 | | 157 | | | 309.16 | | | 4.3 | | 63 | | | 309.07 | | | 4.2 |
| $358.09-$358.09 | | 192 | | | 358.09 | | | 6.1 | | 1 | | | 358.09 | | | 6.2 |
| $368.36-$502.74 | | 162 | | | 378.96 | | | 5.2 | | 33 | | | 378.71 | | | 5.0 |
| | 783 | | | $ | 285.69 | | | 4.3 | | 327 | | | $ | 212.01 | | | 2.9 |
| Intrinsic value | | $ | 150,645 | | | | | | | $ | 86,874 | | | | | |
As of January 28, 2018,2024, the unrecognized compensation cost related to these options was $11.7$35.8 million, which is expected to be recognized over a weighted-average period of 2.6 years. The weighted-average grant date fair value of options granted during the years ended January 28, 2018, January 29, 2017,2023, 2022, and January 31, 20162021 was $16.88, $22.39,$130.75, $124.17, and $19.76,$94.09, respectively.
The following table summarizes the intrinsic value of options exercised and awards that vested during fiscal 2017, 2016,2023, 2022, and 2015:2021: | | | | | Fiscal Year Ended |
| | | January 28, 2018 | | January 29, 2017 | | January 31, 2016 |
| | | (In thousands) |
| | 2023 | | | | 2023 | | 2022 | | 2021 |
| | (In thousands) | | | | (In thousands) |
| Stock options | | $ | 1,856 |
| | $ | 6,072 |
| | $ | 10,554 |
|
| Performance-based restricted stock units | | — |
| | 471 |
| | 3,592 |
|
| Restricted shares | | 743 |
| | 2,283 |
| | 2,739 |
|
| Restricted stock units | | 7,447 |
| | 6,084 |
| | 2,230 |
|
| | | $ | 10,046 |
| | $ | 14,910 |
| | $ | 19,115 |
|
| Restricted stock units (liability accounting) | |
| | $ | |
Employee share purchase plan
The Company's board of directors and stockholders approved the Company's Employee Share Purchase Plan ("ESPP") in September 2007. Contributions are made by eligible employees, subject to certain limits defined in the ESPP, and the Company matches one-third of the contribution. The maximum number of shares authorized to be purchased under the ESPP is 6.0
million shares. All shares purchased under the ESPP are purchased in the open market. During the year ended January 28, 2018,each of 2023, 2022, and 2021, there were 0.1 million shares purchased. As of January 28, 2024, 4.4 million shares remain authorized to be purchased under the ESPP.
Defined contribution pension plans
During fiscal 2016, theThe Company began offeringoffers defined contribution pension plans to its eligible employees in Canada and the United States.employees. Participating employees may elect to defer and contribute a portion of their eligible compensation to a plan up to limits stated in the plan documents, not to exceed the dollar amounts set by applicable laws. The Company matches 50% to 75% of the contribution depending on the participant's length of service, and the contribution is subject to a two yeartwo-year vesting period. The Company's net expense for the defined contribution plans was $5.2$19.8 million, $14.0 million, and $3.2$11.8 million for the years ended January 28, 2018during 2023, 2022, and January 29, 2017,2021, respectively.
NOTE 11. FAIR VALUE MEASUREMENTNote 16. Fair Value Measurement
TheAssets and liabilities measured at fair value on a recurring basis
As of January 28, 2024 and January 29, 2023, the Company held certain assets and liabilities that are required to be measured at fair value on a recurring basis:
| | | | | | | | | | | | | | | | | | | | | | | | | | | | | | | | |
| | January 28, 2024 | | Level 1 | | Level 2 | | Level 3 | | Balance Sheet Classification |
| | (In thousands) | | |
| Money market funds | | $ | 1,102,119 | | | $ | 1,102,119 | | | $ | — | | | $ | — | | | Cash and cash equivalents |
| | | | | | | | | | |
| Term deposits | | 8 | | | — | | | 8 | | | — | | | Cash and cash equivalents |
| Forward currency contract assets | | 647 | | | — | | | 647 | | | — | | | Prepaid expenses and other current assets |
| Forward currency contract liabilities | | 2,872 | | | — | | | 2,872 | | | — | | | Other current liabilities |
| | | January 29, 2023 | | | | January 29, 2023 | | Level 1 | | Level 2 | | Level 3 | | Balance Sheet Classification |
| | (In thousands) | |
| Money market funds | |
| Money market funds | |
| Money market funds | | | $ | 568,000 | | | $ | 568,000 | | | $ | — | | | $ | — | | | Cash and cash equivalents |
| | | | January 28, 2018 | | Level 1 | | Level 2 | | Level 3 | | Balance Sheet Classification |
| | | (In thousands) | |
| Term deposits | |
| Term deposits | |
| Term deposits | | | 8 | | | — | | | 8 | | | — | | | Cash and cash equivalents |
| Forward currency contract assets | | $ | 7,889 |
| | $ | — |
| | $ | 7,889 |
| | $ | — |
| | Other prepaid expenses and other current assets | Forward currency contract assets | | 16,707 | | | — | | — | | | 16,707 | | 16,707 | | | — | | — | | | Prepaid expenses and other current assets | | Prepaid expenses and other current assets |
| Forward currency contract liabilities | | 8,771 |
| | — |
| | 8,771 |
| | — |
| | Other current liabilities | Forward currency contract liabilities | | 25,625 | | | — | | — | | | 25,625 | | 25,625 | | | — | | — | | | Other current liabilities | | Other current liabilities |
The Company has short-term, highly liquid investments classified as cash equivalents, which are invested in money market funds and short-term deposits with original maturities of three months or less. The Company records cash equivalents at their original purchase prices plus interest that has accrued at the stated rate.
The fair values of the forward currency contract assets and liabilities are determined using observable Level 2 inputs, including foreign currency spot exchange rates, forward pricing curves, and interest rates, and considersrates. The fair values consider the credit risk of the Company and its counterparties.
They are presented at their gross fair values. However, the The Company's Master International Swap Dealers Association, Inc., Agreements and other similar arrangements allow net settlements under certain conditions.
In addition to However, the Company records all derivatives on its consolidated balance sheets at fair value and does not offset derivative assets and liabilities.
Assets and liabilities that are recordedmeasured at fair value on a recurringnon-recurring basis the
The Company has impaired certain long-lived assets and recorded them at their estimated fair value on a non-recurring basis. The fair value of these long-lived assets was determined using Level 3 inputs, principally the present value of the estimated future cash flows expected from their use and eventual disposition. Please refer to Note 13 of these consolidated financial statements for further details regarding the impairment of long-lived assets as a result of the ivivva restructuring. Also as a result of the ivivva restructuring, the Companyalso recorded lease termination liabilities at fair value on a non-recurring basis, determined using Level 3 inputs based on remaining lease rentals and reduced by estimated sublease income.
During 2023 and 2022, the Company recorded impairment charges for goodwill, intangible assets, cloud computing arrangement implementation costs, and property and equipment, as disclosed in Note 8. Impairment of Goodwill and Other Assets, Restructuring Costs. That note includes details on the discounted cash flow model used to estimate fair value, which is a Level 3 valuation technique. NOTE 12. DERIVATIVE FINANCIAL INSTRUMENTSNote 17. Derivative Financial Instruments
The Company currently hedges against changes in the Canadian dollar and Chinese Yuan to the U.S. dollar exchange rate and changes in the Euro and Australian dollar to the Canadian dollar exchange rate using forward currency contracts.
Net investment hedges
The Company is exposed to foreign currency exchange gains and losses which arise on translation of its international subsidiaries' balance sheets into U.S. dollars. These gains and losses are recorded as other comprehensive income (loss), net of tax in accumulated other comprehensive income or loss within stockholders' equity.
The Company holds a significant portion of its assets in Canada and during the year ended January 28, 2018, it enteredenters into forward currency contracts designed to hedge a portion of the foreign currency exposure that arises on translation of a Canadian subsidiary into U.S. dollars. These
forward currency contracts are designated as net investment hedges. The Company assesses hedge effectiveness based on changes in forward rates. The Company recorded no ineffectiveness from net investment hedges for the year ended January 28, 2018.during 2023.
Derivatives not designated as hedging instruments
During the year ended January 28, 20182023, the Company entered into certain forward currency contracts designed to economically hedge the foreign currency exchange revaluation gains and losses that are recognized by its Canadian and Chinese subsidiaries on U.S. dollar denominatedspecific monetary assets and liabilities.liabilities denominated in currencies other than the functional currency of the entity. The Company has not applied hedge accounting to these instruments and the change in fair value of these derivatives is recorded within selling, general and administrative expenses.
Quantitative disclosures about derivative financial instruments
OutstandingThe notional amounts and fair values of forward currency contracts were as follows:
The Company had foreign exchange forward contracts outstanding with the following notional amounts: | | | | | | | | | | | | | | | | | | | | | | | | | | | | | | | | | | | | | | |
| | January 28, 2024 | | January 29, 2023 |
| | Gross Notional | | Assets | | Liabilities | | Gross Notional | | Assets | | Liabilities |
| | (In thousands) |
| Derivatives designated as net investment hedges: | | | | | | | | | | | | |
| Forward currency contracts | | $ | 1,242,000 | | | $ | — | | | $ | 258 | | | $ | 1,070,000 | | | $ | — | | | $ | 17,211 | |
| Derivatives not designated in a hedging relationship: | | | | | | | | | | | | |
| Forward currency contracts | | 1,543,351 | | | 647 | | | 2,614 | | | 1,605,284 | | | 16,707 | | | 8,414 | |
| Net derivatives recognized on consolidated balance sheets: | | | | | | | | | | | | |
| Forward currency contracts | | | | $ | 647 | | | $ | 2,872 | | | | | $ | 16,707 | | | $ | 25,625 | |
|
| | | | | | | | |
| | | January 28, 2018 | | January 29, 2017 |
| | | (In thousands) |
| Derivatives designated as net investment hedges | | $ | 262,000 |
| | $ | — |
|
| Derivatives not designated in a hedging relationship | | 240,000 |
| | — |
|
The forward currency contracts designated as net investment hedges outstanding as of January 28, 2024 mature on different dates between June 2018February 2024 and October 2018.September 2024.
The forward currency contracts not designated in a hedging relationship outstanding as of January 28, 2024 mature on different dates between April 2018February 2024 and October 2018.2024.
Quantitative disclosures about derivative financial instruments
The fair values of forward currency contracts were as follows:
|
| | | | | | | | |
| | | January 28, 2018 | | January 29, 2017 |
| | | (In thousands) |
| Derivatives designated as net investment hedges, recognized within: | | | | |
| Other current liabilities | | $ | 8,771 |
| | $ | — |
|
| Derivatives not designated in a hedging relationship, recognized within: | | | | |
| Other prepaid expenses and other current assets | | 7,889 |
| | — |
|
As of January 28, 2018, there were derivative assets of $6.4 million and derivative liabilities of $7.1 million subject to enforceable netting arrangements.
The pre-tax gains and losses on foreign currency exchange forward contracts recorded in accumulated other comprehensive income areor loss were as follows: |
| | | | | | | | | | | | |
| | | Fiscal Year Ended |
| | | January 28, 2018 | | January 29, 2017 | | January 31, 2016 |
| | | (In thousands) |
| (Losses) gains recognized in foreign currency translation adjustment: | | | | | | |
| Derivatives designated as net investment hedges | | $ | (15,974 | ) | | $ | — |
| | $ | — |
|
| | | | | | | | | | | | | | | | | | | | |
| | | 2023 | | 2022 | | 2021 |
| | (In thousands) |
| Gains (losses) recognized in net investment hedge gains (losses): | | | | | | |
| Derivatives designated as net investment hedges | | $ | 15,344 | | | $ | 12,125 | | | $ | 13,177 | |
No gains or losses have been reclassified from accumulated other comprehensive income or loss into net income for derivative financial instruments in a net investment hedging relationship, as the Company has not sold or liquidated (or substantially liquidated) its hedged subsidiary.
The pre-tax net foreign currency exchange and derivative gains and losses recorded in the consolidated statement of operations arewere as follows: | | | | | | | | | | | | | | | | | | | | |
| | | 2023 | | 2022 | | 2021 |
| | (In thousands) |
| Gains (losses) recognized in selling, general and administrative expenses: | | | | | | |
| Foreign exchange gains (losses) | | $ | (23,232) | | | $ | 4,410 | | | $ | 11,511 | |
| Derivatives not designated in a hedging relationship | | 22,765 | | | (11,945) | | | (19,874) | |
| Net foreign exchange and derivative losses | | $ | (467) | | | $ | (7,535) | | | $ | (8,363) | |
|
| | | | | | | | | | | | |
| | | Fiscal Year Ended |
| | | January 28, 2018 | | January 29, 2017 | | January 31, 2016 |
| | | (In thousands) |
| Gains (losses) recognized in selling, general and administrative expenses: | | | | | | |
| Foreign exchange (losses) gains | | $ | (6,798 | ) | | $ | (8,314 | ) | | $ | 11,958 |
|
| Derivatives not designated in a hedging relationship | | 14,115 |
| | — |
| | — |
|
| Net foreign exchange and derivative gains (losses) | | $ | 7,317 |
| | $ | (8,314 | ) | | $ | 11,958 |
|
Note 18. Leases
NOTE 13. ASSET IMPAIRMENT AND RESTRUCTURING
On June 1, 2017, theThe Company announced a plan to restructurehas obligations under operating leases for its ivivva operations. On August 20, 2017, as part of this plan, the Company closed 48 of its 55 ivivva branded company-operated stores. The seven remaining ivivva branded stores remain in operation and are not expected to close. All of the Company's ivivva branded showroomsstore and other temporaryretail locations, have been closed. The restructuring is substantially complete,distribution centers, offices, and the Company continues to offer ivivva branded products on its e-commerce websites and through the remaining ivivva branded stores.
As a result of the closures, the Company recognized aggregate pre-tax charges of $47.2 million during fiscal 2017. A summary of the pre-tax charges recognized during fiscal 2017 in connection with the Company's restructuring of its ivivva operations is as follows:
|
| | | | |
| | | Fiscal Year Ended January 28, 2018 |
| | | (In thousands) |
| Costs recorded in cost of goods sold: | | |
| Provision to reduce inventories to net realizable value | | $ | 4,945 |
|
| Accelerated depreciation | | 3,753 |
|
| | | 8,698 |
|
| Costs recorded in operating expenses: | | |
| Lease termination costs | | 21,069 |
|
| Impairment of property and equipment | | 11,593 |
|
| Employee related costs | | 4,226 |
|
| Other restructuring costs | | 1,637 |
|
| Asset impairment and restructuring costs | | 38,525 |
|
| Restructuring and related costs | | $ | 47,223 |
|
Income tax recoveries of $12.7 million were recorded on the above items in fiscal 2017. These income tax recoveries are based on the annual tax rate of the applicable tax jurisdictions.
Costs recorded in cost of goods sold
During fiscal 2017, the Company recognized expenses of $8.7 million in cost of goods sold as a result of the restructuring of its ivivva operations. This included $4.9 million to reduce inventories to their estimated net realizable value, and $3.8 million in accelerated depreciation primarily related to leasehold improvements and furniture and fixtures for stores that were closed on August 20, 2017.
Costs recorded in operating expenses
The Company recognized asset impairment and restructuring costs of $38.5 million during fiscal 2017 as a result of the restructuring of its ivivva operations.
As a result of the plan to close the majority of the ivivva branded locations, the long-lived assets of each ivivva branded location were tested for impairment as of April 30, 2017. For impaired locations, a loss was recognized representing the difference between the net book value of the long-lived assets and their estimated fair value. Impairment losses totaling $11.6 million were recognized during the first quarter of fiscal 2017. These losses primarily relate to leasehold improvements and furniture and fixtures of the company-operated stores segment. These assets were retired during fiscal 2017 in conjunction with the closures of the company-operated stores.
During fiscal 2017, the Company recognized employee related expenses as a result of the restructuring of $4.2 million.
The Company recognized lease termination costs of $21.1 million during fiscal 2017.equipment. As of January 28, 2018,2024, the Company hadinitial lease termination liabilitiesterms of $6.4 million. Duringthe various leases generally range from two to 15 years. The majority of the Company's leases include renewal options at the sole discretion of the Company. The lease term includes options to extend or terminate the lease when it is reasonably certain those options will be exercised.
The following table details the Company's net lease expense. Certain of the Company's leases include rent escalation clauses, rent holidays, and leasehold rental incentives. The majority of the Company's leases for store premises also include contingent rental payments based on sales volume. The variable lease expenses disclosed below include contingent rent payments and other non-fixed lease related costs, including common area maintenance, property taxes, and landlord's insurance.
| | | | | | | | | | | | | | | | | | | | |
| | 2023 | | 2022 | | 2021 |
| | (In thousands) |
| Net lease expense: | | | | | | |
| Operating lease expense | | $ | 282,888 | | | $ | 245,767 | | | $ | 215,549 | |
| Short-term lease expense | | 15,289 | | | 16,790 | | | 12,366 | |
| Variable lease expense | | 152,791 | | | 114,441 | | | 90,852 | |
| | $ | 450,968 | | | $ | 376,998 | | | $ | 318,767 | |
The following table presents future minimum lease payments by fiscal 2017,year and the Company also recognized other restructuring costsimpact of $1.6 million.discounting.
| | | | | | | | |
| | January 28, 2024 |
| | (In thousands) |
| 2024 | | $ | 300,379 | |
| 2025 | | 287,224 | |
| 2026 | | 232,510 | |
| 2027 | | 214,519 | |
| 2028 | | 158,252 | |
| Thereafter | | 452,434 | |
| Future minimum lease payments | | $ | 1,645,318 | |
| Impact of discounting | | (242,036) | |
| Present value of lease liabilities | | $ | 1,403,282 | |
| | |
| Balance sheet classification: | | |
| Current lease liabilities | | $ | 249,270 | |
| Non-current lease liabilities | | 1,154,012 | |
| | $ | 1,403,282 | |
As of January 28, 2024, the Company's minimum lease commitment for distribution center operating leases which have been committed to, but not yet commenced, was $299.6 million, which is not reflected in the table above.
The weighted-average remaining lease terms and weighted-average discount rates were as follows:
| | | | | | | | | | | | | | |
| | January 28, 2024 | | January 29, 2023 |
| Weighted-average remaining lease term | | 6.95 years | | 5.64 years |
| Weighted-average discount rate | | 4.0 | % | | 3.1 | % |
Note 19. Income Taxes
NOTE 14. INCOME TAXES
The Company's domestic and foreign income before income tax expense and current and deferred income taxes from federal, state, and foreign sources are as follows:
| | | | | Fiscal Year Ended |
| | | January 28, 2018 | | January 29, 2017 | | January 31, 2016 |
| | | (In thousands) |
| | 2023 | | | | 2023 | | 2022 | | 2021 |
| | (In thousands) | | | | (In thousands) |
| Income (loss) before income tax expense | | | | | | |
| Domestic | | $ | 123,942 |
| | $ | (30,955 | ) | | $ | 84,286 |
|
| Domestic | |
| Domestic | |
| Foreign | | 336,056 |
| | 453,684 |
| | 284,209 |
|
| | | $ | 459,998 |
| | $ | 422,729 |
| | $ | 368,495 |
|
| Current income tax expense (recovery) | | | | | | |
| | $ | |
| Current income tax expense | |
| Federal | |
| Federal | |
| Federal | | $ | 79,724 |
| | $ | 36,245 |
| | $ | (18,662 | ) |
| State | | 11,573 |
| | 6,690 |
| | 3,363 |
|
| Foreign | | 109,322 |
| | 94,581 |
| | 110,372 |
|
| | | $ | 200,619 |
| | $ | 137,516 |
| | $ | 95,073 |
|
| | $ | |
| Deferred income tax expense (recovery) | | | | | | |
| Federal | |
| Federal | |
| Federal | | $ | 14,443 |
| | $ | (11,065 | ) | | $ | 8,719 |
|
| State | | 3,988 |
| | (1,840 | ) | | 425 |
|
| Foreign | | (17,714 | ) | | (5,263 | ) | | (1,769 | ) |
| | | 717 |
| | (18,168 | ) | | 7,375 |
|
| | $ | |
| Income tax expense | | $ | 201,336 |
| | $ | 119,348 |
| | $ | 102,448 |
|
The Company's income tax expense for fiscal 2017, fiscal 20162023, 2022, and fiscal 20152021 include certain discrete tax amounts, as follows:
| | | | | | | | | | | | | | | | | | | | |
| | 2023 | | 2022 | | 2021 |
| | (In thousands) |
| Impairment of goodwill and other assets, restructuring costs | | $ | (26,085) | | | $ | (28,171) | | | $ | — | |
| Gain on disposal of assets | | — | | | 1,661 | | | — | |
| Acquisition-related expenses | | — | | | — | | | (1,417) | |
| Total discrete income tax expense (recovery) | | $ | (26,085) | | | $ | (26,510) | | | $ | (1,417) | |
|
| | | | | | | | | | | | |
| | | Fiscal Year Ended |
| | | January 28, 2018 | | January 29, 2017 | | January 31, 2016 |
| | | (In thousands) |
| U.S. tax reform: | | | | | | |
| One-time transition tax | | $ | 58,896 |
| | $ | — |
| | $ | — |
|
| Deferred income tax effects | | 398 |
| | — |
| | — |
|
| Tax recovery on ivivva restructuring costs | | (12,741 | ) | | — |
| | — |
|
| Transfer pricing and repatriation taxes: | | | | | | |
| Transfer pricing adjustments, net | | — |
| | (10,706 | ) | | (4,826 | ) |
| Tax on repatriation of foreign earnings | | — |
| | (38 | ) | | 7,838 |
|
| Tax adjustment on foreign tax credit calculations | | — |
| | — |
| | (10,455 | ) |
| Total tax adjustments | | $ | 46,553 |
| | $ | (10,744 | ) | | $ | (7,443 | ) |
U.S. tax reform
The U.S. tax reform enacted on December 22, 2017Please refer to Note 5. Property and introduces significant changes to the U.S. income tax laws. The U.S. tax reform reduces the U.S. federal income tax rate from 35% to 21%, introduces a shift to a territorial tax systemEquipment, Note 8. Impairment of Goodwill and changes how foreign earnings are subject to U.S. tax,Other Assets, Restructuring Costs, and imposes a mandatory one-time transition tax on the deemed repatriation of accumulated undistributed earnings of foreign subsidiaries. The U.S. tax reform also introduces new taxes on certain foreign-sourced earnings and certain related-party payments, which are referred to as the global intangible low-taxed income tax and the base erosion anti-abuse tax. AccountingNote 9. Acquisition-Related Expenses for the income tax effects of the U.S. tax reform is complex and requires significant judgement and estimates in the interpretation and calculations of its provisions.
The Company has recognized a provisional amount of $59.3 million in income tax expense in fiscal 2017 in relation to the U.S. tax reform. This includes a provisional current income tax expense of $58.9 million for the mandatory one-time
transition tax on the deemed repatriation of accumulated undistributed earnings of foreign subsidiaries, and a provisional deferred income tax expense of $0.4 million to reflect the reduced U.S. tax rate and other effects of the U.S. tax reform.
As the Company completes its analysis of the U.S. tax reform it may make adjustments to the provisional amounts recognized, and will incorporate any additional interpretations or guidance that may be issued. The Company may also identify additional effects not reflected as of January 28, 2018. Any such adjustments may materially impact the provision for income taxes and the effective income tax rate in the period in which the adjustments are made.
The Company expects to complete the accounting for the income tax effects of the U.S. tax reform in fiscal 2018.
One-time transition tax. The U.S. tax reform requires the Company to pay U.S. income taxes on accumulated foreign subsidiary earnings not previously subject to U.S. income tax at a rate of 15.5% on cash and cash equivalents and 8% on the remaining earnings, net of foreign tax credits. The one-time transition tax is payable over eight years. The Company has recognized a provisional amount of $58.9 million in income tax expense. The Company expects to pay the transition tax using its existing cash balances and sources within the U.S.
Further analysis will be required with respect to the method of computation and components of the foreign subsidiaries' earnings and profits, the definition of foreign cash positions, the computation and limitation of the use of foreign tax credits, and the interaction between state and U.S. federal income tax laws on the mandatory deemed repatriation income inclusion for state income tax purposes.
Deferred income tax effects. The U.S. tax reform reduced the U.S. federal income tax rate from 35% to 21%. Accordingly, the Company has remeasured its deferred income tax assets and liabilities to reflect the reduced rate that is expected to apply in future periods when these balances reverse. The Company recognized a provisional deferred income tax expense of $0.4 million to reflect the reduced U.S. tax rate and other effects of the U.S. tax reform.
The U.S. tax reform and the shift to a territorial tax system eliminates U.S. federal income taxes upon any future repatriation of foreign earnings. However, the U.S. tax reform does not eliminate foreign withholding taxes, or certain state income taxes, which may still be payable upon any future repatriation.further information.
As of January 28, 2018, no2024, the Company's net investment in its Canadian subsidiaries was $2.5 billion, of which $1.6 billion was determined to be indefinitely reinvested. A deferred income tax liability of $41.2 million has been recognized in relation to the portion of the Company's net investment in its Canadian subsidiaries that is not indefinitely reinvested, representing the Canadian withholding taxes and U.S. state income taxes which would be due upon repatriation. This deferred tax liability has been recorded on the basis that the Company would choose to make the repatriation transactions in the most tax efficient manner. Specifically, to the extent that the Canadian subsidiaries have paid-up-capital, any such distributions would be structured as a return of capital, and therefore not subject to Canadian withholding tax. The unrecognized deferred tax liability on the indefinitely reinvested amount is approximately $89.7 million. No deferred income tax liabilities have been recognized on any of the undistributed earnings of the Company's other foreign subsidiaries as these earnings were indefinitelyare permanently reinvested outside of the United States. The Company is continuing to evaluate the impact that the U.S. tax reform will have upon the taxes which may become payable upon repatriation,Excluding its reinvestment plans, and the most efficient means of deploying its capital resources globally. As this analysis has not yet been completed, it is possible that amounts determined to be indefinitely reinvested outside of the U.S. may ultimately be repatriated, resulting in additional tax liabilities being recognized.
TheCanadian subsidiaries, cumulative undistributed earnings of the Company's foreign subsidiaries as of January 28, 20182024 were $1.24 billion, including $1.21 billion of accumulated undistributed earnings of a Canadian subsidiary. In the event the Company determines that all or a portion of such foreign earnings will no longer be indefinitely reinvested outside of the United States, Canadian withholding taxes of 5% and U.S. state income taxes could apply to some portion of any distribution made. This is in addition to the one-time transition tax that is payable as a result of the U.S. tax reform. The amount of tax that would be payable upon repatriation is dependent on the elections available to the Company under Canadian withholding tax legislation, the extent to which such withholding tax would be recoverable through U.S. foreign tax credits, and the interaction between state and U.S. federal income tax laws as a result of the U.S. tax reform.$466.5 million.
As of January 28, 2018,2024, the Company had cash and cash equivalents of $796.9$822.5 million outside of the United States.
Tax recovery on ivivva restructuring costs
As outlined in Note 13 of these consolidated financial statements, the Company restructured its ivivva operations during fiscal 2017. Income tax recoveries of $12.7 million were recorded on total restructuring costs of $47.2 million in fiscal 2017. These income tax recoveries are based on the tax rate of the applicable tax jurisdictions.
Transfer pricing adjustments, net
The Company's tax positions include the Company's intercompany transfer pricing policies and the associated taxable income and deductions arising from intercompany charges between subsidiaries within the consolidated group.
During fiscal 2016, the Company finalized an Advance Pricing Arrangement ("APA") with the IRS and the Canada Revenue Agency ("CRA"). This agreement determines the amount of income which is taxable in each respective jurisdiction.
In the year ended January 31, 2016, the Company received communications from the IRS and CRA which led to the determination that it was more likely than not that the outcome of the APA would result in a decrease in taxable income in the United States and an increase in taxable income in Canada for fiscal 2011 through fiscal 2015. The Company recorded a net
income tax recovery of $4.8 million in the year ended January 31, 2016, representing the largest amount of benefit that was considered more likely than not to be realized upon finalization of the APA.
In the year ended January 29, 2017, the APA was finalized and the final terms of the arrangement resulted in an increased amount of income tax recoverable in the United States. This resulted in the recognition of a further net income tax recovery of $10.7 million in the year ended January 29, 2017.
In accordance with the terms of the APA, the adjustments necessary to reflect the reduction in pre-tax income in the United States for fiscal 2011 to fiscal 2015 were recorded by way of a cumulative catchup reduction in pre-tax income in fiscal 2016. This resulted in a decrease in domestic income (loss) before income tax expense of $129.9 million and a corresponding increase in foreign income before income tax expense in the year ended January 29, 2017.
For the years ended January 29, 2017 and January 31, 2016, the Company recorded net interest expenses related to the APA of $1.7 million and $3.5 million, respectively. This represents accrued interest on the Canadian income tax payable related to the APA. The APA resulted in an increase in income tax payable in Canada. These interest costs were recognized in other income (expense), net.
There were no significant adjustments related to the APA in fiscal 2017.
Tax on repatriation of foreign earnings
In the year ended January 31, 2016, as a result of the change in the expected outcome of the APA described above, it was expected that a significant intercompany debt between one of the Company's U.S. subsidiaries and a Canadian subsidiary would arise upon the finalization of the APA. In order to finance the payment of this intercompany debt, it was expected that $156.0 million would be distributed from a Canadian subsidiary to the U.S. parent entity. As a result, these foreign earnings were no longer considered indefinitely reinvested and the Company recorded an incremental income tax expense and deferred income tax liability of $7.8 million to provide for U.S. income and applicable foreign withholding taxes on this expected distribution.
In the year ended January 29, 2017, the APA was finalized and a distribution of $156.0 million was made from a Canadian subsidiary to the U.S. parent entity.
Tax adjustment on foreign tax credit calculations
During the year ended January 31, 2016, the Company finalized the amount of U.S. income tax payable on the dividends of $473.7 million which were distributed in fiscal 2014. The change in the expected outcome of the APA had an impact on the foreign tax credits relating to the dividends paid in fiscal 2014 that had been initially estimated and as a result the Company recognized an income tax recovery of $10.5 million during fiscal 2015.
A summary reconciliation of the effective tax rate is as follows:
|
| | | | | | | | | |
| | | Fiscal Year Ended |
|
| January 28, 2018 | | January 29, 2017 | | January 31, 2016 |
| | | (Percentages) |
| Federal income tax at statutory rate |
| 33.9 | % | | 35.0 | % | | 35.0 | % |
| Foreign tax rate differentials | | (5.9 | ) | | (7.0 | ) | | (6.9 | ) |
| U.S. state taxes | | 1.5 |
| | 1.6 |
| | 0.8 |
|
| Non-deductible compensation expense | | 0.9 |
| | 0.6 |
| | 0.6 |
|
| Permanent and other |
| 0.5 |
| | 0.5 |
| | — |
|
| U.S. tax reform | | 12.9 |
| | — |
| | — |
|
| Transfer pricing adjustments, net | | — |
| | (2.5 | ) | | (1.0 | ) |
| Tax on repatriation of foreign earnings | | — |
| | — |
| | 2.1 |
|
| Tax adjustment on foreign tax credit calculations | | — |
| | — |
| | (2.8 | ) |
| Effective tax rate |
| 43.8 | % | | 28.2 | % | | 27.8 | % |
The Company's U.S. federal income tax rate of 33.9% for the year ended January 28, 2018 is a blended rate that includes the rate decrease which became effective on January 1, 2018. | | | | | | | | | | | | | | | | | | | | |
| | 2023 | | 2022 | | 2021 |
| | (Percentage) |
| Federal income tax at statutory rate | | 21.0 | % | | 21.0 | % | | 21.0 | % |
| Foreign tax rate differentials | | 4.1 | | | 6.8 | | | 5.0 | |
| U.S. state taxes | | 1.0 | | | (0.4) | | | 0.8 | |
| Non-deductible compensation expense | | 0.6 | | | 0.7 | | | 0.7 | |
| Excess tax benefits from stock-based compensation | | (0.4) | | | (0.5) | | | (0.9) | |
| Tax on unremitted foreign earnings | | 2.6 | | | 1.4 | | | — | |
| Impairment of goodwill and other assets, gain on disposal of assets | | — | | | 7.8 | | | — | |
| Permanent and other | | (0.1) | | | (0.9) | | | 0.3 | |
| Effective tax rate | | 28.8 | % | | 35.9 | % | | 26.9 | % |
The tax effects of temporary differences that give rise to significant portions of the deferred income tax assets and deferred income tax liabilities as of January 28, 20182024 and January 29, 20172023 are presented below:
| |
|
| January 28, 2018 | | January 29, 2017 |
| | | (In thousands) |
| | January 28, 2024 | | | | January 28, 2024 | | January 29, 2023 |
| | (In thousands) | | | | (In thousands) |
| Deferred income tax assets: |
| | | |
| Net operating loss carryforwards |
| $ | 37,436 |
| | $ | 16,280 |
|
| Net operating loss carryforwards | |
| Net operating loss carryforwards | |
| Inventories |
| 4,691 |
| | 4,811 |
|
| Deferred lease liabilities |
| 7,956 |
| | 9,373 |
|
| Tenant inducements |
| 7,386 |
| | 8,453 |
|
| Accrued bonuses | |
| Unredeemed gift card liability | |
| Non-current lease liabilities | |
| Research and experimental expenditures | |
| Stock-based compensation |
| 740 |
| | 2,354 |
|
| Foreign tax credits | | 877 |
| | 6,818 |
|
| Other |
| 5,309 |
| | 2,920 |
|
| Deferred income tax assets |
| 64,395 |
| | 51,009 |
|
| Valuation allowance | | (1,843 | ) | | (91 | ) |
| Deferred income tax assets, net of valuation allowance | | $ | 62,552 |
| | $ | 50,918 |
|
| Deferred income tax liabilities: | | | | |
| Property and equipment, net | | $ | (30,429 | ) | | $ | (31,153 | ) |
| Property and equipment, net | |
| Property and equipment, net | |
| Intangible assets, net | |
| Right-of-use lease assets | |
| Other | | (968 | ) | | (771 | ) |
| Deferred income tax liabilities | | (31,397 | ) | | (31,924 | ) |
| Net deferred income tax assets | | $ | 31,155 |
| | $ | 18,994 |
|
| Net deferred income tax liabilities | |
| | | | | |
| Balance sheet classification: | | | | |
| Balance sheet classification: | |
| Balance sheet classification: | |
| Deferred income tax assets | |
| Deferred income tax assets | |
| Deferred income tax assets | | $ | 32,491 |
| | $ | 26,256 |
|
| Deferred income tax liabilities | | (1,336 | ) | | (7,262 | ) |
| Net deferred income tax assets | | $ | 31,155 |
| | $ | 18,994 |
|
| Net deferred income tax liabilities | |
As of January 28, 2018,2024, the Company had foreign net operating loss carryforwards of $121.8$20.0 million. The majority of the net operating loss carryforwards expire, if unused, between fiscal 20312030 and fiscal 2037.2040.
There was a $1.6 million net increase in the valuation allowance in 2023, compared to a $2.1 million net decrease in 2022, and a $3.7 million net decrease in 2021.
The Company files income tax returns in the U.S., Canada, and various foreign state, and provincialstate jurisdictions. The 20122017 to 20162022 tax years remain subject to examination by the U.S. federal and state tax authorities. The 2010 and 20112013 tax years areyear is still open for certain state tax authorities. The 20072017 to 20162022 tax years remain subject to examination by Canadian tax authorities. The 20112016 to 2016 2022
tax years remain subject to examination by tax authorities in certain foreign jurisdictions. The Company does not have any significant unrecognized tax benefits arising from uncertain tax positions taken, or expected to be taken, in the Company's tax returns.
NOTE 15. EARNINGS PER SHARENote 20. Earnings Per Share
The details of the computation of basic and diluted earnings per share are as follows:
|
| | | | | | | | | | | | |
| | | Fiscal Year Ended |
| | | January 28, 2018 | | January 29, 2017 | | January 31, 2016 |
| | | (In thousands, except per share amounts) |
| Net income | | $ | 258,662 |
| | $ | 303,381 |
| | $ | 266,047 |
|
| Basic weighted-average number of shares outstanding | | 135,988 |
| | 137,086 |
| | 140,365 |
|
| Assumed conversion of dilutive stock options and awards | | 210 |
| | 216 |
| | 245 |
|
| Diluted weighted-average number of shares outstanding | | 136,198 |
| | 137,302 |
| | 140,610 |
|
| Basic earnings per share | | $ | 1.90 |
| | $ | 2.21 |
| | $ | 1.90 |
|
| Diluted earnings per share | | $ | 1.90 |
| | $ | 2.21 |
| | $ | 1.89 |
|
| | | | | | | | | | | | | | | | | | | | |
| | | 2023 | | 2022 | | 2021 |
| | (In thousands, except per share amounts) |
| Net income | | $ | 1,550,190 | | | $ | 854,800 | | | $ | 975,322 | |
| Basic weighted-average number of shares outstanding | | 126,726 | | | 127,666 | | | 129,768 | |
| Assumed conversion of dilutive stock options and awards | | 334 | | | 351 | | | 527 | |
| Diluted weighted-average number of shares outstanding | | 127,060 | | | 128,017 | | | 130,295 | |
| Basic earnings per share | | $ | 12.23 | | | $ | 6.70 | | | $ | 7.52 | |
| Diluted earnings per share | | $ | 12.20 | | | $ | 6.68 | | | $ | 7.49 | |
The Company's calculation of weighted-average shares includes the common stock of the Company as well as the exchangeable shares. Exchangeable shares are the economic equivalent of common shares in all material respects. All classes of stock have in effect the same economic rights and share equally in undistributed net income. For the fiscal years ended January 28, 2018, January 29, 2017,2023, 2022, and January 31, 2016, 0.1 million, 0.1 million,2021, 62.7 thousand, 43.5 thousand, and 0.1 million36.0 thousand stock options and awards, respectively, were anti-dilutive to earnings per share and therefore have been excluded from the computation of diluted earnings per share.
On June 11, 2014, the Company's board of directors approved a program to repurchase shares of the Company's common stock up to an aggregate value of $450.0 million. This stock repurchase program was completed during the second quarter of fiscal 2016. On December 1, 2016, the Company's board of directors approved a program to repurchase shares of the Company's common stock up to an aggregate value of $100.0 million. This stock repurchase program was completed during the third quarter of fiscal 2017.
On November 29, 2017,January 31, 2019, the Company's board of directors approved a stock repurchase program for up to $200.0$500.0 million of itsthe Company's common shares. On December 1, 2020, it approved an increase in the remaining authorization from $263.6 million to $500.0 million, and on October 1, 2021, it approved an increase in the remaining authorization from $141.2 million to $641.2 million. During the first quarter of 2022, the Company completed the remaining stock repurchases under this program.
On March 23, 2022 and November 29, 2023, the Company's board of directors approved stock repurchase programs, each for up to $1.0 billion of the Company's common shares inon the open market or in privately negotiated transactions. The repurchase plans have no time limit and do not require the repurchase of a minimum number of shares. Common shares repurchased on the open market are at prevailing market prices, including under plans complying with the provisions of Rule 10b5-1 and Rule 10b-18 of the Securities Exchange Act of 1934. The timing and actual number of common shares to be repurchased will depend upon market conditions, eligibility to trade, and other factors, in accordance with Securities and Exchange Commission requirements, and the repurchase program is expected to be completed in two years. As of January 28, 2018, the remaining aggregaterequirements. The authorized value of shares available to be repurchased under this programthese programs excludes the cost of commissions and excise taxes and as of January 28, 2024, the remaining authorized value was $199.0 million.$1.2 billion.
During the fiscal years ended January 28, 2018, January 29, 2017,2023, 2022, and January 31, 2016, 1.92021, 1.5 million, 0.51.4 million, and 5.02.2 million shares, respectively, were repurchased under the programs at a total cost including commissions and excise taxes of $100.3$558.7 million, $444.0 million, and $29.3 million, and $274.2$812.6 million, respectively.
Subsequent to January 28, 2018,2024, and up to March 21, 2018, 10015, 2024, 0.2 million shares were repurchased at a total cost including commissions and excise taxes of $7.5 thousand.$99.2 million.
NOTE 16. COMMITMENTS AND CONTINGENCIESNote 21. Commitments and Contingencies
Commitments
Leases. The Company has obligations under operating leases for its store and other retail locations, distribution centers, offices, and equipment. AsPlease refer to Note 18. Leases for further details regarding lease commitments and the timing of January 28, 2018, thefuture minimum lease terms of the various leases range from two to 15 years. A substantial number of the Company's leases include renewal options and certain of the Company's leases include rent escalation clauses, rent holidays and leasehold rental incentives. The majority of the Company's leases for store premises also include contingent rental payments based on sales volume. The Company is required to make deposits for rental payments pursuant to certain lease agreements, which have been included in other non-current assets. Minimum annual basic rent payments excluding other executory operating costs, pursuant to lease agreements are approximately as laid out in the table below. These amounts include commitments in respect of company-operated stores that have not yet opened but for which lease agreements have been executed.payments.
Rent expense for the years ended January 28, 2018, January 29, 2017, and January 31, 2016 was $167.3 million, $147.4 million, and $124.5 million, respectively, under operating lease agreements, consisting
License and supply arrangements. The Company has entered into license and supply arrangements with partners in the Middle East and Mexico which grant them the right to operate lululemon branded retail locations in the United Arab Emirates, Kuwait, Qatar, Oman, Bahrain, and Mexico. The Company retains the rights to sell lululemon products through its e-commerceon websites in thesespecific countries. Under these arrangements, the Company supplies the partners with lululemon products, training, and other support. The initial term of the agreement for the Middle East expires in January 2020, and the initial term of the agreement for Mexico expires in November 2026. As of January 28, 2018,2024, there were three39 licensed retail locations, including 15 in Mexico, eight in the United Arab Emirates, onesix in Saudi Arabia, three in Qatar, three in Kuwait, three in Israel, and one in Mexico.Bahrain.
One-time transition tax payable. As outlined in Note 14 of these consolidated financial statements, theThe U.S. tax reformreforms enacted in December 2017 imposed a mandatory transition tax on accumulated foreign subsidiary earnings which have not previously been subject to U.S. income tax.tax at a rate of 15.5% on cash and cash equivalents and 8% on the remaining earnings, net of foreign tax credits. The one-time transition tax is payable over eight years. The Company recognized a provisional income tax expense of $58.9 millionyears beginning in fiscal 2017 for the mandatory transition tax.2018. The one-time transition tax payable is net of foreign tax credits, and the table below outlines the remaining expected payments due by fiscal year.
The following table summarizes the Company's contractual arrangements as of January 28, 2018, and the timing and effect that such commitments are expected to have on its liquidity and cash flows in future periods:
| | | | | | | | | | | | | | | | | | | Payments Due by Fiscal Year |
| | | Payments Due by Fiscal Year | | | Total | | 2024 | | 2025 | | 2026 | | 2027 | | 2028 | | Thereafter |
| | | Total | | 2018 | | 2019 | | 2020 | | 2021 | | 2022 | | Thereafter |
| | | (In thousands) |
| Operating leases (minimum rent) | | $ | 611,817 |
| | $ | 143,428 |
| | $ | 127,641 |
| | $ | 105,720 |
| | $ | 81,595 |
| | $ | 59,058 |
| | $ | 94,375 |
|
| | (In thousands) | | | | (In thousands) |
| One-time transition tax payable | | 56,969 |
| | 8,701 |
| | 4,197 |
| | 4,197 |
| | 4,197 |
| | 4,197 |
| | 31,480 |
|
Contingencies
Legal proceedings. In addition to the legal matters described below, theproceedings. The Company is, from time to time, involved in routine legal matters, and audits and inspections by governmental agencies and other third parties which are incidental to the conduct of its business, includingbusiness. This includes legal matters such as initiation and defense of proceedings to protect intellectual property rights, personal injuryemployment claims, product liability claims, employmentpersonal injury claims, and similar matters. The Company believes the ultimate resolution of any such current proceedinglegal proceedings, audits, and inspections will not have a material adverse effect on its consolidated balance sheets, results of operations or cash flows.
On October 9, 2015, certain current and former hourly employees of the The Company filed a class action lawsuit in the Supreme Court of New York entitled Rebecca Gathmann-Landini et al v. lululemon USA inc. On December 2, 2015, the case was movedhas recognized immaterial provisions related to the United States District Court for the Eastern Districtexpected outcome of New York. The lawsuit alleges that the Company violated various New York labor codes by failing to pay all earned wages, including overtime compensation. The plaintiffs are seeking an unspecified amount of damages. The Company intends to vigorously defend this matter.legal proceedings.
On December 20, 2017, former lululemon employee Shayla Famouri filed a lawsuit in Los Angeles Superior Court against the Company and a former employee of the Company. The plaintiff alleges claims for sexual assault and battery, sexual harassment, retaliation, creating a hostile work environment and related claims. The complaint seeks damages in the amount of $3.0 million, as well as non-monetary relief such as policy change and an apology. The Company intends to vigorously defend this matter.
NOTE 17. RELATED PARTY BALANCES AND TRANSACTIONS
The Company entered into the following transactions with related parties, all of which were approved by the Company's Audit Committee in accordance with the Company's related party transaction policy:
|
| | | | | | | | | | | | |
| | | Fiscal Year Ended |
| | | January 28, 2018 | | January 29, 2017 | | January 31, 2016 |
| | | (In thousands) |
| Payments to related parties: | | | | | | |
| Lease costs for one company-operated store | | $ | 138 |
| | $ | 108 |
| | $ | 112 |
|
| Consulting fees | | $ | — |
| | $ | 167 |
| | $ | 354 |
|
| Employment compensation | | $ | 270 |
| | $ | 274 |
| | $ | 140 |
|
The Company's founder, who is a beneficial owner of more than 10% of the Company's total outstanding shares, and who was a member of the Company's board of directors until February 2, 2015, owns a retail space that the Company leases for one of its company-operated stores. Consulting fees were paid to a relative of the Company's founder; the agreements related to this were not renewed for fiscal 2017.
An immediate family member of one of the Company's former executives commenced employment with the Company during fiscal 2015. The employment of the executive and the immediate family member ceased during fiscal 2017. The above employment compensation consists of salary, bonuses, and the grant date fair value of equity awards.
NOTE 18. SUPPLEMENTAL CASH FLOW INFORMATIONNote 22. Supplemental Cash Flow Information
| | | | | | | | | | | | | | | | | | | | |
| | 2023 | | 2022 | | 2021 |
| | (In thousands) |
| Cash paid for income taxes | | $ | 824,213 | | | $ | 502,136 | | | $ | 245,213 | |
| Cash paid for amounts included in the measurement of lease liabilities | | 288,934 | | | 242,758 | | | 215,157 | |
| Leased assets obtained in exchange for new operating lease liabilities | | 586,926 | | | 450,787 | | | 287,008 | |
| Interest paid | | 234 | | | 116 | | | 12 | |
|
| | | | | | | | | | | | |
| | | Fiscal Year Ended |
|
| January 28, 2018 |
| January 29, 2017 |
| January 31, 2016 |
| | | (In thousands) |
| Cash paid for income taxes |
| $ | 137,826 |
|
| $ | 132,422 |
|
| $ | 113,534 |
|
| Interest paid |
| $ | 8 |
|
| $ | 5,178 |
|
| $ | 52 |
|
Note 23. Segmented Information NOTE 19. SEGMENTED FINANCIAL INFORMATION
The Company applies ASC Topic 280, Segment Reporting ("ASC 280"), in determining reportableCompany's segments for its financial statement disclosure. The Company reports segmentsare based on the financial information itthe CODM, who is the Chief Executive Officer, uses to evaluate performance and allocate resources.
During the fourth quarter of 2023, the financial information the CODM regularly uses to evaluate performance and allocate resources was revised. As the Company has further executed on its omni-channel retail strategy, and with the continued expansion of its international operations, the CODM has shifted resource allocation decisions to be focused by regional market, rather than by selling channel. This resulted in managing its business.a change in the Company's operating segments.
As of January 28, 2024, the Company reports three segments, Americas, China Mainland, and Rest of World, which is APAC and EMEA on a combined basis. The Company does not report capital expenditures and assets by segment as that information is not reviewed by the CODM.
Previously, the Company's reportable segments arewere comprised of company-operated stores, and direct to consumer. Directconsumer (or "e-commerce"), and other. The Company has restated the prior period information to consumer represents sales from the Company's e-commerce websites and mobile apps. Outlets, temporary locations, sales to wholesale accounts, showrooms, warehouse sales, and license and supply arrangements net revenue have been combined into other. Information for these segments is detailed in the table below:reflect its new segments.
| | | | | | | | | | | | | | | | | | | | |
| | | 2023 | | 2022 | | 2021 |
| | (In thousands) |
| Net revenue: | | | | | | |
| Americas | | $ | 7,631,647 | | | $ | 6,817,454 | | | $ | 5,299,906 | |
| China Mainland | | 963,760 | | | 576,503 | | | 434,261 | |
| Rest of World | | 1,023,871 | | | 716,561 | | | 522,450 | |
| | $ | 9,619,278 | | | $ | 8,110,518 | | | $ | 6,256,617 | |
| Segmented income from operations: | | | | | | |
| Americas | | $ | 2,937,184 | | | $ | 2,503,740 | | | $ | 1,867,016 | |
| China Mainland | | 337,316 | | | 196,865 | | | 167,318 | |
| Rest of World | | 201,832 | | | 103,204 | | | 67,674 | |
| | 3,476,332 | | | 2,803,809 | | | 2,102,008 | |
| General corporate expenses | | 1,240,436 | | | 1,005,988 | | | 718,477 | |
| lululemon Studio obsolescence provision | | 23,709 | | | 62,928 | | | — | |
| Impairment of goodwill and other assets, restructuring costs | | 74,501 | | | 407,913 | | | — | |
| Amortization of intangible assets | | 5,010 | | | 8,752 | | | 8,782 | |
| Acquisition-related expenses | | — | | | — | | | 41,394 | |
| Gain on disposal of assets | | — | | | (10,180) | | | — | |
| Income from operations | | 2,132,676 | | | 1,328,408 | | | 1,333,355 | |
| Other income (expense), net | | 43,059 | | | 4,163 | | | 514 | |
| Income before income tax expense | | $ | 2,175,735 | | | $ | 1,332,571 | | | $ | 1,333,869 | |
| | | | | | |
| Depreciation and amortization: | | | | | | |
| Americas | | $ | 170,417 | | | $ | 137,260 | | | $ | 121,278 | |
| China Mainland | | 25,746 | | | 17,842 | | | 12,208 | |
| Rest of World | | 23,644 | | | 19,346 | | | 16,829 | |
| Corporate | | 159,577 | | | 117,343 | | | 73,891 | |
| | $ | 379,384 | | | $ | 291,791 | | | $ | 224,206 | |
|
| | | | | | | | | | | | |
| | | Fiscal Year Ended |
| | | January 28, 2018 | | January 29, 2017 | | January 31, 2016 |
| | | (In thousands) |
| Net revenue | | | | | | |
| Company-operated stores | | $ | 1,837,065 |
| | $ | 1,704,357 |
| | $ | 1,516,323 |
|
| Direct to consumer | | 577,590 |
| | 453,287 |
| | 401,525 |
|
| Other | | 234,526 |
| | 186,748 |
| | 142,675 |
|
| | | $ | 2,649,181 |
| | $ | 2,344,392 |
| | $ | 2,060,523 |
|
| Income from operations before general corporate expenses | | | | | | |
| Company-operated stores | | $ | 464,321 |
| | $ | 415,635 |
| | $ | 346,802 |
|
| Direct to consumer | | 231,295 |
| | 186,178 |
| | 166,418 |
|
| Other | | 35,580 |
| | 22,312 |
| | 5,826 |
|
| | | 731,196 |
| | 624,125 |
| | 519,046 |
|
| General corporate expenses | | 227,972 |
| | 202,973 |
| | 149,970 |
|
| Restructuring and related costs | | 47,223 |
| | — |
| | — |
|
| Income from operations | | 456,001 |
| | 421,152 |
| | 369,076 |
|
| Other income (expense), net | | 3,997 |
| | 1,577 |
| | (581 | ) |
| Income before income tax expense | | $ | 459,998 |
| | $ | 422,729 |
| | $ | 368,495 |
|
| | | | | | | |
| Capital expenditures: | | | | | | |
| Company-operated stores | | $ | 80,240 |
| | $ | 75,304 |
| | $ | 85,756 |
|
| Direct to consumer | | 19,928 |
| | 11,461 |
| | 8,284 |
|
| Corporate and other | | 57,696 |
| | 62,746 |
| | 49,447 |
|
| | | $ | 157,864 |
| | $ | 149,511 |
| | $ | 143,487 |
|
| Depreciation and amortization: | | | | | | |
| Company-operated stores | | $ | 64,870 |
| | $ | 59,585 |
| | $ | 50,951 |
|
| Direct to consumer | | 12,997 |
| | 7,015 |
| | 6,628 |
|
| Corporate and other | | 30,368 |
| | 21,097 |
| | 15,804 |
|
| | | $ | 108,235 |
| | $ | 87,697 |
| | $ | 73,383 |
|
The accelerated depreciation related to the restructuring of the ivivva operations is included in corporate and other in the above breakdown of depreciation and amortization.
Intercompany amounts are excluded from the above table as they are not included in the materials reviewed by the chief operating decision maker.
The Company operates in five geographic areas — the United States, Canada, Asia Pacific, and Europe. Net revenue by region for the years ended January 28, 2018, January 29, 2017, and January 31, 2016 was as follows:
|
| | | | | | | | | | | | |
| | | Fiscal Year Ended |
| | | January 28, 2018 | | January 29, 2017 | | January 31, 2016 |
| | | (In thousands) |
| United States | | $ | 1,911,763 |
| | $ | 1,726,076 |
| | $ | 1,508,841 |
|
| Canada | | 491,779 |
| | 447,167 |
| | 416,520 |
|
| Outside of North America | | 245,639 |
| | 171,149 |
| | 135,162 |
|
| | | $ | 2,649,181 |
| | $ | 2,344,392 |
| | $ | 2,060,523 |
|
PropertyLong-lived assets, including property and equipment, net and right-of-use lease assets, by geographic area as of January 28, 20182024 and January 29, 20172023 were as follows:
| | | | | | | | | | | | | | |
| | January 28, 2024 | | January 29, 2023 |
| | (In thousands) |
| United States | | $ | 1,597,318 | | | $ | 1,175,317 | |
| Canada | | 671,622 | | | 601,756 | |
| People's Republic of China | | 284,575 | | | 233,590 | |
| Other geographic areas | | 257,906 | | | 228,370 | |
| | $ | 2,811,421 | | | $ | 2,239,033 | |
Note 24. Disaggregated Net Revenue
|
| | | | | | | | |
| | | January 28, 2018 | | January 29, 2017 |
| | | (In thousands) |
| United States | | $ | 161,699 |
| | $ | 170,745 |
|
| Canada | | 271,441 |
| | 217,035 |
|
| Outside of North America | | 40,502 |
| | 35,719 |
|
| | | $ | 473,642 |
| | $ | 423,499 |
|
The Company's goodwill and intangible assets relateIn addition to the reportingdisaggregation of net revenue by reportable segment consisting of company-operated stores.in Note 23. Segmented Information, the following table disaggregates the Company's net revenue by geographic area.
NOTE 20. QUARTERLY FINANCIAL INFORMATION (UNAUDITED) | | | | | | | | | | | | | | | | | | | | |
| | 2023 | | 2022 | | 2021 |
| | (In thousands) |
| United States | | $ | 6,346,392 | | | $ | 5,654,343 | | | $ | 4,345,687 | |
| Canada | | 1,285,255 | | | 1,163,111 | | | 954,219 | |
| | | | | | |
| China Mainland | | 963,760 | | | 576,503 | | | 434,261 | |
| Hong Kong SAR, Taiwan, and Macau SAR | | 170,533 | | | 105,130 | | | 86,111 | |
| People's Republic of China | | 1,134,293 | | | 681,633 | | | 520,372 | |
| | | | | | |
| Other geographic areas | | 853,338 | | | 611,431 | | | 436,339 | |
| | $ | 9,619,278 | | | $ | 8,110,518 | | | $ | 6,256,617 | |
The following tables presenttable disaggregates the Company's unaudited quarterly resultsnet revenue by category. Other categories is primarily composed of operationsaccessories, lululemon Studio, and comprehensive income for each of the quarters in the fiscal years ended January 28, 2018 and January 29, 2017. footwear.
| | | | | | | | | | | | | | | | | | | | |
| | 2023 | | 2022 | | 2021 |
| | (In thousands) |
| Women's product | | $ | 6,147,372 | | | $ | 5,259,803 | | | $ | 4,171,762 | |
| Men's product | | 2,252,753 | | | 1,956,602 | | | 1,535,850 | |
| Other categories | | 1,219,153 | | | 894,113 | | | 549,005 | |
| | $ | 9,619,278 | | | $ | 8,110,518 | | | $ | 6,256,617 | |
The following tables should be read in conjunction withtable disaggregates the Company's audited consolidated financial statements and related notes. The Company has prepared the information below on a basis consistent with its audited consolidated financial statements and has included all adjustments, consisting of normal recurring adjustments, which, in the opinion of the Company's management, are necessary to fairly present its operating results for the quarters presented. The Company's historical unaudited quarterly results of operations are not necessarily indicative of results for any future quarter or for a full year.net revenue by channel.
| | | | | | | | | | | | | | | | | | | | |
| | 2023 | | 2022 | | 2021 |
| | (In thousands) |
| Company-operated stores | | $ | 4,410,956 | | | $ | 3,648,127 | | | $ | 2,821,497 | |
| E-commerce | | 4,311,110 | | | 3,699,791 | | | 2,777,944 | |
| Other channels | | 897,212 | | | 762,600 | | | 657,176 | |
| | $ | 9,619,278 | | | $ | 8,110,518 | | | $ | 6,256,617 | |
|
| | | | | | | | | | | | | | | | | | | | | | | | | | | | | | | | |
| |
| Fiscal 2017 |
| Fiscal 2016 |
| |
| Fourth
Quarter | | Third
Quarter | | Second
Quarter |
| First
Quarter |
| Fourth
Quarter | | Third
Quarter | | Second
Quarter | | First
Quarter |
| |
| (Unaudited; Amounts in thousands, except per share amounts) |
| Net revenue |
| $ | 928,802 |
| | $ | 619,018 |
| | $ | 581,054 |
| | $ | 520,307 |
|
| $ | 789,940 |
| | $ | 544,416 |
| | $ | 514,520 |
| | $ | 495,516 |
|
| Cost of goods sold |
| 406,291 |
| | 297,056 |
| | 283,632 |
| | 263,412 |
|
| 362,041 |
| | 265,990 |
| | 260,359 |
| | 256,385 |
|
| Gross profit |
| 522,511 |
| | 321,962 |
| | 297,422 |
| | 256,895 |
|
| 427,899 |
| | 278,426 |
| | 254,161 |
| | 239,131 |
|
| Selling, general and administrative expenses |
| 264,232 |
| | 215,367 |
| | 225,524 |
| | 199,141 |
|
| 231,270 |
| | 185,451 |
| | 180,202 |
| | 181,542 |
|
| Asset impairment and restructuring costs | | 2,001 |
| | 21,007 |
| | 3,186 |
| | 12,331 |
| | — |
| | — |
| | — |
| | — |
|
| Income from operations |
| 256,278 |
| | 85,588 |
| | 68,712 |
| | 45,423 |
|
| 196,629 |
| | 92,975 |
| | 73,959 |
| | 57,589 |
|
| Other income (expense), net |
| 1,226 |
| | 1,052 |
| | 812 |
| | 907 |
|
| 857 |
| | 628 |
| | 578 |
| | (486 | ) |
| Income before income tax expense |
| 257,504 |
| | 86,640 |
| | 69,524 |
| | 46,330 |
|
| 197,486 |
| | 93,603 |
| | 74,537 |
| | 57,103 |
|
| Income tax expense |
| 137,743 |
| | 27,696 |
| | 20,813 |
| | 15,084 |
|
| 61,351 |
| | 25,318 |
| | 20,912 |
| | 11,767 |
|
| Net income |
| $ | 119,761 |
| | $ | 58,944 |
| | $ | 48,711 |
| | $ | 31,246 |
|
| $ | 136,135 |
| | $ | 68,285 |
| | $ | 53,625 |
| | $ | 45,336 |
|
| | | | | | | | | | | | | | | | | |
| Other comprehensive income (loss), net of tax: | | | | | | | | | | | | | | | | |
| Foreign currency translation adjustment |
| 48,516 |
| | (31,018 | ) | | 72,854 |
|
| (31,775 | ) |
| 15,941 |
| | (24,748 | ) | | (28,052 | ) | | 73,562 |
|
| Comprehensive income |
| $ | 168,277 |
| | $ | 27,926 |
| | $ | 121,565 |
| | $ | (529 | ) |
| $ | 152,076 |
| | $ | 43,537 |
| | $ | 25,573 |
| | $ | 118,898 |
|
| | | | | | | | | | | | | | | | | |
| Basic earnings per share |
| $ | 0.88 |
| | $ | 0.44 |
| | $ | 0.36 |
| | $ | 0.23 |
|
| $ | 0.99 |
| | $ | 0.50 |
| | $ | 0.39 |
| | $ | 0.33 |
|
| Diluted earnings per share |
| $ | 0.88 |
| | $ | 0.43 |
| | $ | 0.36 |
| | $ | 0.23 |
|
| $ | 0.99 |
| | $ | 0.50 |
| | $ | 0.39 |
| | $ | 0.33 |
|
The Company's quarterly results of operations have varied in the past and are likely to do so again in the future. As such, the Company believes that comparisons of its quarterly results of operations should not be relied upon as an indication of the Company's future performance.
NOTE 21. SUBSEQUENT EVENT
The Company evaluates events or transactions that occur after the balance sheet date through to the date which the financial statements are issued, for potential recognition or disclosure in its consolidated financial statements in accordance with ASC Topic 855, Subsequent Events.
Effective February 2, 2018, Laurent Potdevin, Chief Executive Officer of the Company, resigned from his position as Chief Executive Officer and as a member of the Company's board of directors. Effective as of that same date, the board of directors appointed Glenn Murphy, currently serving as Chairman of the board of directors, to serve as Executive Chairman of the board of directors. lululemon's senior leaders will report to Mr. Murphy while the board of directors conducts a search for lululemon's next Chief Executive Officer.
In connection with Mr. Potdevin's resignation, the Company entered into a separation agreement and release with Mr. Potdevin. In exchange for certain releases and covenants, the Company agreed to pay Mr. Potdevin a lump sum cash payment of $3.35 million as soon as practicable after the effective date of the separation, and a cash payment of $1.65 million to be paid over a period of 18 months in equal monthly installments beginning 60 days after the separation date. Mr. Potdevin will not receive any continued or accelerated vesting of any outstanding equity awards.
ITEM 9A. CONTROLS AND PROCEDURES
Evaluation of Disclosure Controls and Procedures
Under the supervision and with the participation of our management, including our principal executive officer and principal financial and accounting officer, we conducted an evaluation of the effectiveness of the design and operation of our
disclosure controls and procedures, as defined in Rules 13a-15(e) and 15d-15(e) under the Securities Exchange Act of 1934, as amended, or the Exchange Act, as of the end of the period covered by this report, or the Evaluation Date. Based upon the evaluation, our principal executive officer and principal financial and accounting officer concluded that our disclosure controls and procedures were effective as of the Evaluation Date. Disclosure controls and procedures are controls and procedures designed to reasonably ensure that information required to be disclosed in our reports filed under the Exchange Act, such as this report, is recorded, processed, summarized, and reported within the time periods specified in the SEC's rules and forms. Disclosure controls and procedures include controls and procedures designed to reasonably ensure that such information is accumulated and communicated to our management, including our principal executive officer and principal financial and accounting officer, as appropriate to allow timely decisions regarding required disclosure.
Inherent Limitations over Internal Controls
Our internal control over financial reporting is designed to provide reasonable assurances regarding the reliability of financial reporting and the preparation of financial statements for external purposes in accordance with generally accepted accounting principles. Our internal control over financial reporting includes those policies and procedures that (i) pertain to the maintenance of records that, in reasonable detail, accurately and fairly reflect the transactions and dispositions of our assets; (ii) provide reasonable assurance that transactions are recorded as necessary to permit preparation of financial statements in accordance with generally accepted accounting principles, and that our receipts and expenditures are being made only in accordance with authorizations of our management and directors; and (iii) provide reasonable assurance regarding prevention or timely detection of unauthorized acquisition, use, or disposition of our assets that could have a material effect on the financial statements. Management, including our principal executive officer and principal financial and accounting officer, does not expect that our internal controls will prevent or detect all errors and all fraud. A control system, no matter how well designed and operated, can provide only reasonable, not absolute, assurance that the objectives of the control system are met. Further, the design of a control system must reflect the fact that there are resource limitations on all control systems; no evaluation of internal controls can provide absolute assurance that all control issues and instances of fraud, if any, have been detected. Also, any evaluation of the effectiveness of controls in future periods are subject to the risk that those internal controls may become inadequate because of changes in business conditions, or that the degree of compliance with the policies and procedures may deteriorate.
Management's Annual Report on Internal Control over Financial Reporting
Management is responsible for establishing and maintaining adequate internal control over financial reporting (as defined in Rule 13a-15(f) under the Securities Exchange Act of 1934, as amended). Management conducted an evaluation of the effectiveness of our internal control over financial reporting based on the criteria set forth in Internal Control—Integrated Framework (2013) issued by the Committee of Sponsoring Organizations of the Treadway Commission, or COSO. Based on this evaluation, management concluded that we maintained effective internal control over financial reporting as of January 28, 2024.
2018. The effectiveness of our internal control over financial reporting as of January 28, 20182024 has been audited by PricewaterhouseCoopers LLP, our independent registered public accounting firm, as stated in their report, which appears in Item 8 of Part II of this Form 10-K.
Changes in Internal Control over Financial Reporting
There were no changes in our internal control over financial reporting during the fourth quarter of the fiscal year ended January 28, 20182023 that have materially affected, or are reasonably likely to materially affect, our internal control over financial reporting.
ITEM 9B. OTHER INFORMATION
Trading Arrangements
During the fourth quarter of 2023, no director or officer of lululemon (as defined in Rule 16a-1(f) under the Exchange Act) adopted or terminated a Rule 10b5-1 trading arrangement or non-Rule 10b5-1 trading arrangement (in each case, as defined in Item 408(a) of Regulation S-K).
Appointment of Director
On March 15, 2024, the board of directors of lululemon appointed Teri L. List as a member of the board of directors. Ms. List served as executive vice president and chief financial officer of Gap Inc, a global clothing retailer, from January 2017
until her retirement in June 2020. Prior to joining the Gap, she served as chief financial officer at DICK’s Sporting Goods and Kraft Food Group. Prior to those roles, Ms. List spent nearly 20 years with Procter & Gamble culminating in the role of SVP and Treasurer. She began her career in public accounting at Deloitte LLP, an auditing, consulting, tax and advisory services firm. She currently serves on the Boards of Visa, Microsoft and Danaher Corporation. Ms. List received her Bachelor’s degree in accounting from Northern Michigan University and is a certified public accountant.
The board of directors increased the size of the board from ten to eleven members and appointed Ms. List as a Class I director to fill the newly created vacancy. Although Ms. List will serve as a member of the class of directors whose terms expire at the 2026 annual meeting of stockholders, our stockholders will have the opportunity to vote on her nomination as a continuing Class I director at the next annual meeting of stockholders.
Ms. List will serve on the Audit Committee and will receive compensation for her service as a director consistent with that of our other non-employee directors. A description of our standard compensation arrangements for non-employee directors is included as an exhibit to this annual report on Form 10-K. We expect Ms. List to enter into our standard form indemnification agreement for non-employee directors, the form of which is filed with the SEC as Exhibit 10.16 to our registration statement on Form S-1, dated July 9, 2007.
ITEM 9C. DISCLOSURE REGARDING FOREIGN JURISDICTIONS THAT PREVENT INSPECTIONS
Not applicable.
PART III
ITEM 10. DIRECTORS, EXECUTIVE OFFICERS AND CORPORATE GOVERNANCE
The information required by this item concerning our directors, director nominees and Section 16 beneficial ownership reporting compliance is incorporated by reference to our definitive Proxy Statement for our 20182024 Annual Meeting of Stockholders under the captions "Election of Directors," "Section 16(a) Beneficial Ownership Reporting Compliance," "Executive Officers"Officers," and "Corporate Governance.Governance," and, to the extent necessary, under the caption "Delinquent Section 16(a) Reports."
We have adopted a written code of business conduct and ethics, which applies to all of our directors, officers, and employees, including our principal executive officer and our principal financial and accounting officer. Our Global Code of Business Conduct and Ethics is available on our website, www.lululemon.com, and can be obtained by writing to Investor Relations, lululemon athletica inc., 1818 Cornwall Avenue, Vancouver, British Columbia, Canada V6J 1C7 or by sending an email to investors@lululemon.com. The informationInformation contained on or accessible through our websitewebsites is not incorporated by reference into, and does not form a part of, this Annual Report on Form 10-K.or any other report or document we file with the SEC, and any references to our websites are intended to be inactive textual references only. Any amendments, other than technical, administrative, or other non-substantive amendments, to our Global Code of Business Conduct and Ethics or waivers from the provisions of the Global Code of Business Conduct and Ethics for our principal executive officer and our principal financial and accounting officer will be promptly disclosed on our website following the effective date of such amendment or waiver.
ITEM 11. EXECUTIVE COMPENSATION
The information required by this item is incorporated by reference to our 20182024 Proxy Statement under the captions "Executive Compensation" and "Executive Compensation Tables."
ITEM 12. SECURITY OWNERSHIP OF CERTAIN BENEFICIAL OWNERS AND MANAGEMENT AND RELATED STOCKHOLDER MATTERS
The information required by this item is incorporated by reference to our 20182024 Proxy Statement under the caption "Principal StockholdersShareholders and StockShare Ownership by Management."
Equity Compensation Plan Information (as of January 28, 2018)2024)
| | | Plan Category |
| Number of Securities to be Issued Upon Exercise of Outstanding Options, Warrants and Rights(1) (A) | | Weighted-Average Exercise Price of Outstanding Options, Warrants and Rights(2) (B) | | Number of Securities Remaining Available for Future Issuance Under Equity Compensation Plans (Excluding Securities Reflected in Column (A))(3) (C) | Plan Category | | Number of Securities to be Issued Upon Exercise of Outstanding Options, Warrants and Rights(1) (A) | | Weighted-Average Exercise Price of Outstanding Options, Warrants and Rights(2) (B) | | Number of Securities Remaining Available for Future Issuance Under Equity Compensation Plans (Excluding Securities Reflected in Column (A))(3) (C) |
| Equity compensation plans approved by stockholders |
| 1,872,685 |
|
| $ | 56.44 |
|
| 18,711,699 |
|
| Equity compensation plans not approved by stockholders |
| — |
|
| — |
|
| — |
|
| Total |
| 1,872,685 |
|
| $ | 56.44 |
|
| 18,711,699 |
|
__________
| |
(1)(1)This amount represents the following: (a) 783,036 shares subject to outstanding options, (b) 175,365 shares subject to outstanding performance-based restricted stock units, and (c) 222,630 shares subject to outstanding restricted stock units. The options, performance-based restricted stock units, and restricted stock units are all under our 2023 Equity Incentive Plan. Restricted shares outstanding under our 2023 Equity Incentive Plan have already been reflected in our total outstanding common stock balance. (2)The weighted-average exercise price is calculated solely on the exercise prices of the outstanding options and does not reflect the shares that will be issued upon the vesting of outstanding awards of performance-based restricted stock units and restricted stock units, which have no exercise price. (3)This includes (a) 4,025,805 shares of our common stock available for future issuance under our 2023 Equity Incentive Plan and (b) 4,402,698 shares of our common stock available for future issuance under our Employee Share Purchase Plan. The number of shares remaining available for future issuance under our 2023 Equity Incentive Plan is reduced by 1.7 shares for each award other than stock options granted and by one share for each stock option award granted. Outstanding awards that expire or are canceled without having been exercised or settled in full are available for issuance again under our 2023 Equity Incentive Plan but shares that are withheld in satisfaction of tax withholding obligations for full value awards are not again available for issuance. No further awards may be issued under the predecessor plan, our 2014 Equity Incentive Plan.
| This amount represents the following: (a) 1,117,048 shares subject to outstanding options, (b) 328,660 shares subject to outstanding performance-based restricted stock units, and (c) 426,977 shares subject to outstanding restricted stock units. The options, performance-based restricted stock units and restricted stock units are all under our 2007 Equity Incentive Plan or our 2014 Equity Incentive Plan. Restricted shares outstanding under our 2014 Equity Incentive Plan have already been reflected in our total outstanding common stock balance. |
| |
(2)
| The weighted-average exercise price is calculated solely on the exercise prices of the outstanding options and does not reflect the shares that will be issued upon the vesting of outstanding awards of performance-based restricted stock units and restricted stock units, which have no exercise price. |
| |
(3)
| This includes (a) 13,815,668 shares of our common stock available for future issuance under our 2014 Equity Incentive Plan and (b) 4,896,031 shares of our common stock available for future issuance under our Employee Share Purchase Plan. The number of shares remaining available for future issuance under our 2014 Equity Incentive Plan is reduced by 1.7 shares for each award other than stock options granted and by one share for each stock option award granted. Outstanding awards that expire or are canceled without having been exercised or settled in full are available for issuance again under our 2014 Equity Incentive Plan and shares that are withheld in satisfaction of tax withholding obligations for full value awards are also again available for issuance. No further awards may be issued under the predecessor plan, our 2007 Equity Incentive Plan. |
ITEM 13. CERTAIN RELATIONSHIPS AND RELATED TRANSACTIONS, AND DIRECTOR INDEPENDENCE
The information required by this item is incorporated by reference to our 20182024 Proxy Statement under the captions "Certain Relationships and Related Party Transactions" and "Corporate Governance."
ITEM 14. PRINCIPAL ACCOUNTANT FEES AND SERVICES
The information required by this item is incorporated by reference to our 20182024 Proxy Statement under the caption "Fees for Professional Services."
PART IV
ITEM 15. EXHIBITS AND FINANCIAL STATEMENT SCHEDULE
(a) Documents filed as part of this report:
1. Financial Statements. The financial statements as set forth under Item 8 of this Annual Report on Form 10-K are incorporated herein.
2. Financial Statement Schedule.
Schedule II
Valuation and Qualifying AccountsSeparate financial statement schedules have been omitted either because they are not applicable or because the required information is included in the consolidated financial statements or notes described in Item 15(a)(1) above.
|
| | | | | | | | | | | | | | | | |
| Description |
| Balance at Beginning of Year |
| Charged to Costs and Expenses |
| Write-offs Net of Recoveries |
| Balance at End of Year |
| |
| (In thousands) |
| Shrink Provision on Finished Goods |
|
| | | | | | |
| For the year ended January 31, 2016 |
| $ | (1,324 | ) | | $ | (5,633 | ) | | $ | 6,530 |
| | $ | (427 | ) |
| For the year ended January 29, 2017 |
| (427 | ) | | (5,168 | ) | | 5,260 |
| | (335 | ) |
| For the year ended January 28, 2018 |
| (335 | ) | | (8,656 | ) | | 8,681 |
| | (310 | ) |
| Obsolescence and Quality Provision on Finished Goods and Raw Materials |
| | | | | | | |
| For the year ended January 31, 2016 |
| $ | (3,605 | ) | | $ | (3,139 | ) | | $ | 1,588 |
| | $ | (5,156 | ) |
| For the year ended January 29, 2017 |
| (5,156 | ) | | (3,200 | ) | | 3,343 |
| | (5,013 | ) |
| For the year ended January 28, 2018 |
| (5,013 | ) | | (5,361 | ) | | 1,071 |
| | (9,303 | ) |
| Damage Provision on Finished Goods |
| | | | | | | |
| For the year ended January 31, 2016 |
| $ | (1,068 | ) | | $ | (12,790 | ) | | $ | 12,659 |
| | $ | (1,199 | ) |
| For the year ended January 29, 2017 |
| (1,199 | ) | | (13,915 | ) | | 12,806 |
| | (2,308 | ) |
| For the year ended January 28, 2018 |
| (2,308 | ) | | (18,503 | ) | | 15,291 |
| | (5,520 | ) |
| Sales Return Allowances |
| | | | | | | |
| For the year ended January 31, 2016 |
| $ | (2,327 | ) | | $ | (2,132 | ) | | $ | — |
| | $ | (4,459 | ) |
| For the year ended January 29, 2017 |
| (4,459 | ) | | (269 | ) | | — |
| | (4,728 | ) |
| For the year ended January 28, 2018 |
| (4,728 | ) | | (1,565 | ) | | — |
| | (6,293 | ) |
| Valuation Allowance on Deferred Income Taxes |
| | | | | | | |
| For the year ended January 31, 2016 |
| $ | (91 | ) | | $ | — |
| | $ | — |
| | $ | (91 | ) |
| For the year ended January 29, 2017 |
| (91 | ) | | — |
| | — |
| | (91 | ) |
| For the year ended January 28, 2018 |
| (91 | ) | | (1,752 | ) | | — |
| | (1,843 | ) |
3. Exhibits
Exhibit Index
| | | | | | | | | | | | | | | | | | | | | | | | | | | | | | | | | | | | | | |
| | | | | | Incorporated by Reference |
Exhibit
No. | | Exhibit Title | | Filed
Herewith | | Form | | Exhibit No. | | File No. | | Filing Date |
| | | | | | | | | | | | |
| 3.1 | | | | X | | | | | | | | |
| | | | | | | | | | | | |
| | | | | | | | | | | | |
| | | | | | | | | | | | |
| | | | | | | | | | | | |
| | | | | | | | | | | | |
| | | | | | | | | | | | |
| | | | | | | | | | | | |
| 3.2 | | | | |
| 10-K | | 3.5 | | 001-33608 | | 3/28/2023 |
| | | | | | | | | | | | |
| 4.1 | | | | | | S-3 | | 4.1 | | 333-185899 | | 1/7/2013 |
| | | | | | | | | | | | |
| 4.2 | | | | | | 10-K | | 4.2 | | 001-33608 | | 3/26/2020 |
| | | | | | | | | | | | |
| 10.1* | | | | X | | | | | | | | |
| | | | | | | | | | | | |
| 10.2* | | | | | | 8-K | | 10.2 | | 001-33608 | | 6/13/2023 |
| | | | | | | | | | | | |
| 10.3* | | | | | | 8-K | | 10.3 | | 001-33608 | | 6/13/2023 |
| | | | | | | | | | | | |
| 10.4* | | | | | | 8-K | | 10.4 | | 001-33608 | | 6/13/2023 |
| | | | | | | | | | | | |
| 10.5* | | | | | | 8-K | | 10.5 | | 001-33608 | | 6/13/2023 |
| | | | | | | | | | | | |
| | | | | | | | | | | | |
| | | | | | | | | | | | |
| | | | | | | | | | | | |
| | | | | | | | | | | | |
| | | | | | | | | | | | |
| | | | | | | | | | | | |
| | | | | | | | | | | | |
| | | | | | | | | | | | |
| | | | | | | | | | | | |
| | | | | | | | | | | | |
| 10.6* | | | | | | S-1 | | 10.3 | | 333-142477 | | 5/1/2007 |
| | | | | | | | | | | | |
| 10.7 | | | | | | 10-Q | | 10.5 | | 001-33608 | | 9/10/2007 |
| | | | | | | | | | | | |
| 10.8 | | | | | | 10-Q | | 10.6 | | 001-33608 | | 9/10/2007 |
| | | | | | | | | | | | |
| 10.9 | | | | | | 10-Q | | 10.7 | | 001-33608 | | 9/10/2007 |
| | | | | | | | | | | | |
| 10.10 | | | | | | S-1/A | | 10.14 | | 333-142477 | | 7/9/2007 |
| | | | | | | | | | | | |
| 10.11 | | | | | | S-1/A | | 10.16 | | 333-142477 | | 7/9/2007 |
| | | | | | | | | | | | |
| 10.12* | | | | X | |
| |
| |
| |
|
| | | | | | | | | | | | |
| 10.13* | | | | | | 8-K |
| 10.1 |
| 001-33608 |
| 3/29/2022 |
| | | | | | | | | | | | |
| 10.14* | | | | | | 10-Q | | 10.3 | | 001-33608 | | 11/29/2007 |
| | | | | | | | | | | | |
| 10.15* | | | | | | 10-K | | 10.23 | | 001-33608 | | 3/29/2017 |
| | | | | | | | | | | | |
| 10.16* | | | | | | 10-Q | | 10.1 | | 001-33608 | | 12/10/2020 |
| | | | | | | | | | | | |
| 10.17* | | | | | | 8-K | | 10.1 | | 001-33608 | | 7/24/2018 |
| | | | | | | | | | | | |
| 10.18* | | | | | | 10-Q | | 10.2 | | 001-33608 | | 12/10/2020 |
| | | | | | | | | | | | |
l3. Exhibits
Exhibit Index
|
| | | | | | | | | | | | |
| | | | | | | Incorporated by Reference |
Exhibit No. | | Exhibit Title | | Filed Herewith | | Form | | Exhibit No. | | File No. | | Filing Date |
| | | | | | | | | | | | | |
| 3.1 |
| |
|
|
| 8-K |
| 3.1 |
| 001-33608 |
| 8/8/2007 |
| | | | | | | | | | | | | |
| 3.2 |
| |
|
|
| 8-K |
| 3.1 |
| 001-33608 |
| 7/1/2011 |
| | | | | | | | | | | | | |
| 3.3 |
| |
|
|
| 8-K |
| 3.1 |
| 001-33608 |
| 6/5/2015 |
| | | | | | | | | | | | | |
| 4.1 |
| |
|
|
| S-1/A |
| 4.1 |
| 001-33608 |
| 7/9/2007 |
| | | | | | | | | | | | | |
| 10.1* |
| |
|
|
| 8-K |
| 10.1 |
| 001-33608 |
| 6/13/2014 |
| | | | | | | | | | | | | |
| 10.2* |
| |
|
|
| 10-Q |
| 10.2 |
| 0001-33608 |
| 12/6/2012 |
| | | | | | | | | | | | | |
| 10.3* |
| |
|
|
| 10-Q |
| 10.1 |
| 001-33608 |
| 6/1/2017 |
| | | | | | | | | | | | | |
| 10.4* |
| |
|
|
| 10-Q |
| 10.2 |
| 001-33608 |
| 6/1/2017 |
| | | | | | | | | | | | | |
| 10.5* | | | |
| | 10-Q | | 10.3 | | 001-33608 | | 6/1/2017 |
| | | | | | | | | | | | | |
| 10.6* |
| |
|
|
| 10-Q |
| 10.12 |
| 001-33608 |
| 12/11/2014 |
| | | | | | | | | | | | | |
| 10.7* |
| |
|
|
| S-1 |
| 10.3 |
| 333-142477 |
| 5/1/2007 |
| | | | | | | | | | | | | |
| 10.8 |
| |
|
|
| 10-Q |
| 10.2 |
| 001-33608 |
| 9/10/2015 |
| | | | | | | | | | | | | |
| 10.9 |
| |
|
|
| 10-Q |
| 10.5 |
| 001-33608 |
| 9/10/2007 |
| | | | | | | | | | | | | |
| 10.10 |
| |
|
|
| 10-Q |
| 10.6 |
| 001-33608 |
| 9/10/2007 |
| | | | | | | | | | | | | |
| 10.11 |
| |
|
|
| 10-Q |
| 10.7 |
| 001-33608 |
| 9/10/2007 |
| | | | | | | | | | | | | |
| 10.12 |
| |
|
|
| S-1/A |
| 10.14 |
| 333-142477 |
| 7/9/2007 |
| | | | | | | | | | | | | |
| 10.13 |
| |
|
|
| S-1/A |
| 10.16 |
| 333-142477 |
| 7/9/2007 |
| | | | | | | | | | | | | |
| 10.14 |
| |
|
|
| 10-K |
| 10.12 |
| 001-33608 |
| 3/17/2011 |
| | | | | | | | | | | | | |
| 10.15* |
| |
|
|
| 10-K |
| 10.15 |
| 001-33608 |
| 3/29/2017 |
| | | | | | | | | | | | | |
| | | | | | | | | | | | | | | | | | | | | | | | | | | | | | | | | | | | | | |
| | | | | | Incorporated by Reference |
Exhibit
No. | | Exhibit Title | | Filed
Herewith | | Form | | Exhibit No. | | File No. | | Filing Date |
| 10.19* | | | | | | 10-Q | | 10.1 | | 001-33608 | | 12/06/2018 |
| | | | | | | | | | | | |
| 10.20* | | | | | | 10-Q | | 10.1 | | 001-33608 | | 12/09/2021 |
| | | | | | | | | | | | |
| 10.21* | | | | | | 10-K | | 10.22 | | 001-33608 | | 3/30/2021 |
| | | | | | | | | | | | |
| 10.22 | | Credit Agreement, dated December 14, 2021, among lululemon athletica inc., lululemon athletica canada inc., Lulu Canadian Holding, Inc. and lululemon usa inc., as borrowers, Bank of America, N.A., as administrative agent, swing line lender and letter of credit issuer, HSBC Bank Canada, as syndication agent and letter of credit issuer, BOFA Securities, Inc., as sustainability coordinator, and the other lenders party thereto. | | | | 8-K | | 10.1 | | 001-33608 | | 12/17/2021 |
| | | | | | | | | | | | |
| 21.1 | | | | | | 10-K | | 21.1 | | 001-33608 | | 3/28/2023 |
| | | | | | | | | | | | |
| 23.1 | | | | X | | | | | | | | |
| | | | | | | | | | | | |
| 31.1 | | | | X | | | | | | | | |
| | | | | | | | | | | | |
| 31.2 | | | | X | | | | | | | | |
| | | | | | | | | | | | |
| 32.1** | | | | X | | | | | | | | |
| | | | | | | | | | | | |
| 97 | | | | | | 8-K | | 10.1 | | 001-33608 | | 6/13/2023 |
| | | | | | | | | | | | |
| 101 | | The following financial statements from the Company's 10-K for the fiscal year ended January 28, 2024, formatted in iXBRL: (i) Consolidated Balance Sheets, (ii) Consolidated Statements of Operations and Comprehensive Income, (iii) Consolidated Statements of Stockholders' Equity, (iv) Consolidated Statements of Cash Flows (v) Notes to the Consolidated Financial Statements | | X | | | | | | | | |
| | | | | | | | | | | | |
| 104 | | Cover Page Interactive Data File (formatted in iXBRL and contained in Exhibit 101) | | X | | | | | | | | |
| | | | | | | | | | | | |
| * | | Denotes a compensatory plan, contract or arrangement, in which our directors or executive officers may participate. |
| ** | | Furnished herewith. |
ITEM 16. FORM 10-K SUMMARY
None.
|
| | | | | | | | | | | | |
| | | | | | | Incorporated by Reference |
Exhibit No. | | Exhibit Title | | Filed Herewith | | Form | | Exhibit No. | | File No. | | Filing Date |
| 10.16* |
| |
|
|
| 10-Q |
| 10.3 |
| 001-33608 |
| 11/29/2007 |
| | | | | | | | | | | | | |
| 10.17* |
| |
|
|
| 8-K |
| 10.1 |
| 001-33608
|
| 2/5/2018 |
| | | | | | | | | | | | | |
| 10.18* | | | |
| | 8-K | | 10.1 | | 001-33608
| | 1/7/2015 |
| | | | | | | | | | | | | |
| 10.19* |
| |
| X |
|
|
|
|
|
|
|
|
| | | | | | | | | | | | | |
| 10.20* |
| |
|
|
| 10-Q |
| 10.1 |
| 001-33608
|
| 8/31/2017 |
| | | | | | | | | | | | | |
| 10.21* |
| |
|
|
| 8-K |
| 10.1 |
| 001-33608 |
| 8/31/2017 |
| | | | | | | | | | | | | |
| 10.22* | | | |
| | 10-K | | 10.23 | | 001-33608 | | 3/29/2017 |
| | | | | | | | | | | | | |
| 10.23* | | | | X | |
| |
| |
| |
|
| | | | | | | | | | | | | |
| 10.24 | | Credit Agreement, dated as of December 15, 2016, among lululemon athletica inc., lululemon athletica canada inc., Lulu Canadian Holding, Inc. and lululemon usa inc., as borrowers, Bank of America, N.A., as administrative agent, swing line lender and letter of credit issuer, HSBC Bank Canada, as syndication agent and letter of credit issuer, and each other lender party thereto. | |
| | 8-K | | 10.1 | | 001-33608 | | 12/21/2016 |
| | | | | | | | | | | | | |
| 21.1 |
| |
|
|
| 10-K |
| 21.1 |
| 001-33608 |
| 3/26/2015 |
| | | | | | | | | | | | | |
| 23.1 |
| |
| X |
|
|
|
|
|
|
|
|
| | | | | | | | | | | | | |
| 31.1 |
| |
| X |
|
|
|
|
|
|
|
|
| | | | | | | | | | | | | |
| 31.2 |
| |
| X |
|
|
|
|
|
|
|
|
| | | | | | | | | | | | | |
| 32.1** |
| |
|
|
|
|
|
|
|
|
|
|
| | | | | | | | | | | | | |
|
| | | | | | | | | | | | |
| | | | | | Incorporated by Reference |
Exhibit
No.
| | Exhibit Title | | Filed
Herewith
| | Form | | Exhibit No. | | File No. | | Filing Date |
101 |
| The following financial statements from the Company's 10-K for the fiscal year ended January 28, 2018, formatted in XBRL: (i) Consolidated Balance Sheets, (ii) Consolidated Statements of Operations and Comprehensive Income, (iii) Consolidated Statements of Stockholders' Equity, (iv) Consolidated Statements of Cash Flows (v) Notes to the Consolidated Financial Statements |
| X |
|
|
|
|
|
|
|
|
| | | | | | | | | | | | |
* | | Denotes a compensatory plan, contract or arrangement, in which our directors or executive officers may participate. |
** | | Furnished herewith. |
SIGNATURES
Pursuant to the requirements of Section 13 or 15(d) of the Securities Exchange Act of 1934, as amended, the registrant has duly caused this report to be signed on its behalf by the undersigned, thereunto duly authorized.
| | | | | | | | | | | |
| | | |
| LULULEMON ATHLETICA INC. |
| | |
| By: | | /s/ CALVIN MCDONALD |
| | By: | | /s/ GLENN MURPHYCalvin McDonald |
| | | | | Glenn MurphyChief Executive Officer |
| | | Executive Chairman of the Board |
| | | (principal executive officer) |
| Date: | | Date: | March 26, 201821, 2024 |
KNOW ALL PERSONS BY THESE PRESENTS, that each person whose signature appears below constitutes and appoints Glenn MurphyCalvin McDonald and Stuart C. HaseldenMeghan Frank and each of them, with full power of substitution and resubstitution and full power to act without the other, as his or her true and lawful attorney-in-fact and agent to act in his or her name, place and stead and to execute in the name and on behalf of each person, individually and in each capacity stated below, and to file, any and all documents in connection therewith, with the Securities and Exchange Commission, granting unto said attorneys-in-fact and agents, and each of them, full power and authority to do and perform each and every act and thing, ratifying and confirming all that said attorneys-in-fact and agents or any of them or their and his or her substitute or substitutes, may lawfully do or cause to be done by virtue thereof.
Pursuant to the requirements of the Securities Exchange Act of 1934, as amended, this report has been signed below by the following persons on behalf of the registrant and in the capacities and on the dates indicated:
| | | | | | | | | | | | | | |
| Signature | | Title | | Date |
| | | | |
| /s/ CALVIN MCDONALD | | Chief Executive Officer and Director | | | March 21, 2024 |
SignatureCalvin McDonald | |
(principal executive officer) | | Title |
Date |
|
|
|
|
|
/s/ STUART C. HASELDENMEGHAN FRANK | |
Chief Financial Officer | |
March 26, 201821, 2024 |
Stuart C. HaseldenMeghan Frank | |
(principal financial and accounting officer) | |
|
| | | | |
| /s/ MARTHA A.M. MORFITT | | Director, Board Chair | | March 21, 2024 |
Martha A.M. Morfitt | |
| | |
| | | | |
| /s/ MICHAEL CASEY | |
Director | |
March 21, 2024 |
| Michael Casey | | | | |
| | | | |
/s/ GLENN MURPHYSHANE GRANT | |
Director | | Executive Chairman of the Board
| March 26, 201821, 2024 |
Glenn MurphyShane Grant | |
| | |
| | | | |
| /s/ KATHRYN HENRY | | (principal executive officer)Director | |
March 21, 2024 |
Kathryn Henry | |
| | |
| | | | |
| /s/ TERI LIST | |
Director | |
March 21, 2024 |
| Teri List | | | | |
| | | | |
| /s/ ALISON LOEHNIS | | Director | | March 21, 2024 |
| Alison Loehnis | | | | |
| | | | |
| /s/ ISABEL MAHE | | Director | | March 21, 2024 |
| Isabel Mahe | | | | |
| | | | |
| /s/ JON MCNEILL | | Director | | March 21, 2024 |
| Jon McNeill | | | | |
| | | | |
| /s/ DAVID M. MUSSAFER | | Director | | Lead Director | March 26, 201821, 2024 |
| David M. Mussafer | | | | |
| | | | |
/s/ ROBERT BENSOUSSAN |
| Director |
| March 26, 2018 |
Robert Bensoussan |
|
|
| |
|
|
|
| |
/s/ MICHAEL CASEY | | Director | | March 26, 2018 |
Michael Casey | | | | |
| | | | |
/s/ KATHRYN HENRY | | Director | | March 26, 2018 |
Kathryn Henry | | | | |
|
|
|
| |
/s/ JON MCNEILL | | Director | | March 26, 2018 |
Jon McNeill | | | | |
| | | | |
/s/ MARTHA A.M. MORFITT |
| Director |
| March 26, 2018 |
Martha A.M. Morfitt |
|
|
| |
| | | | |
/s/ TRICIA PATRICK | | Director | | March 26, 2018 |
Tricia Patrick | | | | |
|
|
|
| |
| /s/ EMILY WHITE | |
Director | | Director
| March 26, 201821, 2024 |
| Emily White | |
|
|
|
Exhibit Index
|
| | | | | | | | | | | | |
| | | | | | | Incorporated by Reference |
Exhibit No. | | Exhibit Title | | Filed Herewith | | Form | | Exhibit No. | | File No. | | Filing Date |
| | | | | | | | | | | | | |
| 3.1 | | Amended and Restated Certificate of Incorporation of lululemon athletica inc. | |
| | 8-K | | 3.1 | | 001-33608 | | 8/8/2007 |
| | | | | | | | | | | | | |
| 3.2 | | Certificate of Amendment to Amended and Restated Certificate of Incorporation of lululemon athletica inc. | |
| | 8-K | | 3.1 | | 001-33608 | | 7/1/2011 |
| | | | | | | | | | | | | |
| 3.3 | | Bylaws of lululemon athletica inc. | |
| | 8-K | | 3.1 | | 001-33608 | | 6/5/2015 |
| | | | | | | | | | | | | |
| 4.1 | | Form of Specimen Stock Certificate of lululemon athletica inc. | |
| | S-1/A | | 4.1 | | 001-33608 | | 7/9/2007 |
| | | | | | | | | | | | | |
| 10.1* | | lululemon athletica inc. 2014 Equity Incentive Plan | |
| | 8-K | | 10.1 | | 001-33608 | | 6/13/2014 |
| | | | | | | | | | | | | |
| 10.2* | | Form of Non-Qualified Stock Option Agreement (for outside directors) | |
| | 10-Q | | 10.2 | | 0001-33608 | | 12/6/2012 |
| | | | | | | | | | | | | |
| 10.3* | | Form of Non-Qualified Stock Option Agreement (with clawback provision) | |
| | 10-Q | | 10.1 | | 001-33608 | | 6/1/2017 |
| | | | | | | | | | | | | |
| 10.4* | | Form of Notice of Grant of Performance Shares and Performance Shares Agreement (with clawback provision) | |
| | 10-Q | | 10.2 | | 001-33608 | | 6/1/2017 |
| | | | | | | | | | | | | |
| 10.5* | | Form of Notice of Grant of Restricted Stock Units and Restricted Stock Units Agreement (with clawback provision) | |
| | 10-Q | | 10.3 | | 001-33608 | | 6/1/2017 |
| | | | | | | | | | | | | |
| 10.6* | | Form of Restricted Stock Award Agreement | |
| | 10-Q | | 10.12 | | 001-33608 | | 12/11/2014 |
| | | | | | | | | | | | | |
| 10.7* | | Amended and Restated LIPO Investments (USA), Inc. Option Plan and form of Award Agreement | |
| | S-1 | | 10.3 | | 333-142477 | | 5/1/2007 |
| | | | | | | | | | | | | |
| 10.8 | | Second Amended and Restated Registration Rights Agreement dated June 18, 2015 between lululemon athletica inc. and the parties named therein | |
| | 10-Q | | 10.2 | | 001-33608 | | 9/10/2015 |
| | | | | | | | | | | | | |
| 10.9 | | Exchange Trust Agreement dated July 26, 2007 between lululemon athletica inc., Lulu Canadian Holding, Inc. and Computershare Trust Company of Canada | |
| | 10-Q | | 10.5 | | 001-33608 | | 9/10/2007 |
| | | | | | | | | | | | | |
| 10.10 | | Exchangeable Share Support Agreement dated July 26, 2007 between lululemon athletica inc., Lululemon Callco ULC and Lulu Canadian Holding, Inc. | |
| | 10-Q | | 10.6 | | 001-33608 | | 9/10/2007 |
| | | | | | | | | | | | | |
| 10.11 | | Amended and Restated Declaration of Trust for Forfeitable Exchangeable Shares dated July 26, 2007, by and among the parties named therein | |
| | 10-Q | | 10.7 | | 001-33608 | | 9/10/2007 |
| | | | | | | | | | | | | |
| 10.12 | | Amended and Restated Arrangement Agreement dated as of June 18, 2007, by and among the parties named therein (including Plan of Arrangement and Exchangeable Share Provisions) | |
| | S-1/A | | 10.14 | | 333-142477 | | 7/9/2007 |
| | | | | | | | | | | | | |
| 10.13 | | Form of Indemnification Agreement between lululemon athletica inc. and its directors and certain officers | |
| | S-1/A | | 10.16 | | 333-142477 | | 7/9/2007 |
| | | | | | | | | | | | | |
| 10.14 | | Purchase and Sale Agreement between 2725312 Canada Inc and lululemon athletica inc., dated December 22, 2010 | |
| | 10-K | | 10.12 | | 001-33608 | | 3/17/2011 |
| | | | | | | | | | | | | |
| 10.15* | | Outside Director Compensation Plan | |
| | 10-K | | 10.15 | | 001-33608 | | 3/29/2017 |
| | | | | | | | | | | | | |
| 10.16* | | lululemon athletica inc. Employee Share Purchase Plan | |
| | 10-Q | | 10.3 | | 001-33608 | | 11/29/2007 |
| | | | | | | | | | | | | |
|
| | | | | | | | | | | | |
| | | | | | | Incorporated by Reference |
Exhibit No. | | Exhibit Title | | Filed Herewith | | Form | | Exhibit No. | | File No. | | Filing Date |
| 10.17* | | Separation Agreement and Release, effective as of February 2, 2018, between lululemon athletica inc. and Laurent Potdevin | |
| | 8-K | | 10.1 | | 001-33608
| | 2/5/2018 |
| | | | | | | | | | | | | |
| 10.18* | | Executive Employment Agreement, effective as of January 2, 2015, between lululemon athletica inc. and Stuart C. Haselden | |
| | 8-K | | 10.1 | | 001-33608
| | 1/7/2015 |
| | | | | | | | | | | | | |
| 10.19* | | First Amendment to Executive Employment Agreement, effective as of October 21, 2015, between lululemon athletica inc. and Stuart C. Haselden | | X | |
| |
| |
| |
|
| | | | | | | | | | | | | |
| 10.20* | | Second Amendment to Executive Employment Agreement, effective as of May 12, 2017, between lululemon athletica inc. and Stuart C. Haselden | |
| | 10-Q | | 10.1 | | 001-33608
| | 8/31/2017 |
| | | | | | | | | | | | | |
| 10.21* | | Separation Agreement and Release, dated August 28, 2017, between lululemon athletica inc. and Scott (Duke) Stump | |
| | 8-K | | 10.1 | | 001-33608 | | 8/31/2017 |
| | | | | | | | | | | | | |
| 10.22* | | Executive Employment Agreement, effective as of December 5, 2016, between lululemon athletica canada inc. and Celeste Burgoyne | |
| | 10-K | | 10.23 | | 001-33608 | | 3/29/2017 |
| | | | | | | | | | | | | |
| 10.23* | | Glenn Murphy's Compensation as Executive Chairman, effective as of February 2, 2018 | | X | |
| |
| |
| |
|
| | | | | | | | | | | | | |
| 10.24 | | Credit Agreement, dated as of December 15, 2016, among lululemon athletica inc., lululemon athletica canada inc., Lulu Canadian Holding, Inc. and lululemon usa inc., as borrowers, Bank of America, N.A., as administrative agent, swing line lender and letter of credit issuer, HSBC Bank Canada, as syndication agent and letter of credit issuer, and each other lender party thereto. | |
| | 8-K | | 10.1 | | 001-33608 | | 12/21/2016 |
| | | | | | | | | | | | | |
| 21.1 | | Subsidiaries of lululemon athletica inc. | |
| | 10-K | | 21.1 | | 001-33608 | | 3/26/2015 |
| | | | | | | | | | | | | |
| 23.1 | | Consent of PricewaterhouseCoopers LLP | | X | |
| |
| |
| |
|
| | | | | | | | | | | | | |
| 31.1 | | Certification of principal executive officer pursuant to Exchange Act Rules 13a-14(a) and 15d-14(a), as adopted pursuant to Section 302 of the Sarbanes-Oxley Act of 2002 | | X | |
| |
| |
| |
|
| | | | | | | | | | | | | |
| 31.2 | | Certification of principal financial and accounting officer pursuant to Exchange Act Rules 13a-14(a) and 15d-14(a), as adopted pursuant to Section 302 of the Sarbanes-Oxley Act of 2002 | | X | |
| |
| |
| |
|
| | | | | | | | | | | | | |
| 32.1** | | Certification of principal executive officer and principal financial and accounting officer pursuant to 18 U.S.C. Section 1350, as adopted pursuant to Section 906 of the Sarbanes-Oxley Act of 2002 | |
| |
| |
| |
| |
|
| | | | | | | | | | | | | |
| 101 | | The following financial statements from the Company's 10-K for the fiscal year ended January 28, 2018, formatted in XBRL: (i) Consolidated Balance Sheets, (ii) Consolidated Statements of Operations and Comprehensive Income, (iii) Consolidated Statements of Stockholders' Equity, (iv) Consolidated Statements of Cash Flows (v) Notes to the Consolidated Financial Statements | | X | |
| |
| |
| |
|
| | | | | | | | | | | | | |
| * | | Denotes a compensatory plan, contract or arrangement, in which our directors or executive officers may participate. |
| ** | | Furnished herewith. |