SECURITIES AND EXCHANGE COMMISSION
FORM 10-K
þ ANNUAL REPORT PURSUANT TO SECTION 13 OR 15(d) OF THE SECURITIES EXCHANGE ACT OF 1934
| þ | ANNUAL REPORT PURSUANT TO SECTION 13 OR 15(d) OF THE SECURITIES EXCHANGE ACT OF 1934 |
For the fiscal year ended December 31,
20112012
OR
¨ TRANSITION REPORT PURSUANT TO SECTION 13 OR 15(d) OF THE SECURITIES EXCHANGE ACT OF 1934
| ¨ | TRANSITION REPORT PURSUANT TO SECTION 13 OR 15(d) OF THE SECURITIES EXCHANGE ACT OF 1934 |
For the transition period from __________ to __________
Commission file number1-10899
(Exact name of registrant as specified in its charter)
| | |
Maryland
| Maryland | | 13-2744380 | |
| (State or other jurisdiction of incorporation or organization) | | (I.R.S. Employer Identification No.) | |
3333 New Hyde Park Road, New Hyde Park, NY 11042-0020
(Address of principal executive offices) (Zip Code)
(Registrant’s telephone number, including area code)
Securities registered pursuant to Section 12(b) of the Act:
| | |
Title of each class | | Name of each exchange on
which registered
|
| | |
Common Stock, par value $.01 per share. | | New York Stock Exchange |
| | |
Depositary Shares, each representing one-tenth of a share of 6.65% Class F Cumulative Redeemable
Preferred Stock, par value $1.00 per share.
| | New York Stock Exchange
|
| | |
Depositary Shares, each representing one-hundredth of a share of 7.75% Class G Cumulative Redeemable
Preferred Stock, par value $1.00 per share.
| | New York Stock Exchange
|
| | |
Depositary Shares, each representing one-hundredth of a share of 6.90% Class H Cumulative Redeemable Preferred Stock, par value $1.00 per share. | | New York Stock Exchange |
| |
| Depositary Shares, each representing one-thousandth of a share of 6.00% Class I Cumulative Redeemable Preferred Stock, par value $1.00 per share. | New York Stock Exchange |
| |
| Depositary Shares, each representing one-thousandth of a share of 5.50% Class J Cumulative Redeemable Preferred Stock, par value $1.00 per share. | New York Stock Exchange |
| |
| Depositary Shares, each representing one-thousandth of a share of 5.625% Class K Cumulative Redeemable Preferred Stock, par value $1.00 per share. | New York Stock Exchange |
Securities registered pursuant to section 12(g) of the Act:
None
Indicate by check mark if the registrant is a well-known seasoned issuer, as defined in Rule 405 of the Securities Act. Yesþ No¨ Indicate by check mark if the registrant is not required to file reports pursuant to Section 13 or Section 15(d) of the Act. Yes¨ Noþ Indicate by check mark whether the registrant (1) has filed all reports required to be filed by Section 13 or 15(d) of the Securities Exchange Act of 1934 during the preceding 12 months (or for such shorter period that the registrant was required to file such reports), and (2) has been subject to such filing requirements for the past 90 days. Yesþ No¨ Indicate by check mark whether the registrant has submitted electronically and posted on its corporate Web site, if any, every Interactive Data File required to be submitted and posted pursuant to Rule 405 of Regulation S-T (§ 232.405 of this chapter) during the preceding 12 months (or for such shorter period that the registrant was required to submit and post such files). Yesþ No¨ Indicate by check mark if disclosure of delinquent filers pursuant to Item 405 of Regulation S-K (§ 229.405 of this chapter) is not contained herein, and will not be contained, to the best of registrant's knowledge, in definitive proxy or information statements incorporated by reference in Part III of this Form 10-K or any amendment to this Form 10-K. þ
Indicate by check mark whether the registrant is a large accelerated filer, an accelerated filer, a non-accelerated filer, or a smaller reporting company. See the definitions of "large accelerated filer,” “accelerated filer" and “smaller reporting company” in Rule 12b-2 of the Exchange Act.
| | | |
Large accelerated filer | þ | Accelerated filer | ¨ |
Non-accelerated filer | ¨ | Smaller reporting company | ¨ |
(Do not check if a smaller reporting company.) | |
Indicate by check mark whether the registrant is a shell company (as defined in Rule 12b-2 of the Act). Yes ¨ No þ The aggregate market value of the voting and non-voting common equity held by non-affiliates of the registrant was approximately
$7.3$7.4 billion based upon the closing price on the New York Stock Exchange for such equity on June 30,
2011.2012.
(APPLICABLE ONLY TO CORPORATE REGISTRANTS)
Indicate the number of shares outstanding of each of the registrant's classes of common stock, as of the latest practicable date.
407,883,635 shares as of February
15, 2012.14, 2013.
DOCUMENTS INCORPORATED BY REFERENCE Part III incorporates certain information by reference to the Registrant's definitive proxy statement to be filed with respect to the Annual Meeting of Stockholders expected to be held on
May 1, 2012.April 30, 2013.
Index to Exhibits begins on page
34.
38.
| | |
Item No. | | Form 10-K
Report
Page |
| PART I | |
| | |
1. | Business | 3 |
| | |
1A. | Risk Factors | 5 |
| | |
1B. | Unresolved Staff Comments | 10 |
| | |
2. | Properties | 10 |
| | |
3. | Legal Proceedings | 11 |
| | |
4. | Mine Safety Disclosures | 11 |
| | |
| PART II | |
| | |
5. | Market for Registrant's Common Equity, Related Stockholder Matters and Issuer Purchases of Equity Securities | 12 |
| | |
6. | Selected Financial Data | 14 |
| | |
7. | Management’s Discussion and Analysis of Financial Condition and
Results of Operations | 15 |
| | |
7A. | Quantitative and Qualitative Disclosures About Market Risk | 31 |
| | |
8. | Financial Statements and Supplementary Data | 32 |
| | |
9. | Changes in and Disagreements With Accountants on Accounting and
Financial Disclosure | 32 |
| | |
9A. | Controls and Procedures | 32 |
| | |
9B. | Other Information | 32 |
| | |
| PART III | |
| | |
10. | Directors, Executive Officers and Corporate Governance | 32 |
| | |
11. | Executive Compensation | 32 |
| | |
12. | Security Ownership of Certain Beneficial Owners and Management and Related Stockholder Matters | 32 |
| | |
13. | Certain Relationships and Related Transactions, and Director Independence | 33 |
| | |
14. | Principal Accounting Fees and Services | 33 |
| | |
| PART IV | |
| | |
15. | Exhibits, Financial Statement Schedules | 33 |
Item No. | | Form 10-K Report Page |
| | PART I | |
| | | |
| 1. | Business | 3 |
| | | |
| 1A. | Risk Factors | 5 |
| | | |
| 1B. | Unresolved Staff Comments | 11 |
| | | |
| 2. | Properties | 11 |
| | | |
| 3. | Legal Proceedings | 12 |
| | | |
| 4. | Mine Safety Disclosures | 12 |
| | | |
| | PART II | |
| | | |
| 5. | Market for Registrant's Common Equity, Related Stockholder Matters and Issuer Purchases of Equity Securities | 13 |
| | | |
| 6. | Selected Financial Data | 15 |
| | | |
| 7. | Management’s Discussion and Analysis of Financial Condition and Results of Operations | 16 |
| | | |
| 7A. | Quantitative and Qualitative Disclosures About Market Risk | 35 |
| | | |
| 8. | Financial Statements and Supplementary Data | 36 |
| | | |
| 9. | Changes in and Disagreements With Accountants on Accounting and Financial Disclosure | 36 |
| | | |
| 9A. | Controls and Procedures | 36 |
| | | |
| 9B. | Other Information | 36 |
| | | |
| | PART III | |
| | | |
| 10. | Directors, Executive Officers and Corporate Governance | 36 |
| | | |
| 11. | Executive Compensation | 36 |
| | | |
| 12. | Security Ownership of Certain Beneficial Owners and Management and Related Stockholder Matters | 37 |
| | | |
| 13. | Certain Relationships and Related Transactions, and Director Independence | 37 |
| | | |
| 14. | Principal Accounting Fees and Services | 37 |
| | | |
| | PART IV | |
| | | |
| 15. | Exhibits, Financial Statement Schedules | 37 |
FORWARD-LOOKING STATEMENTS
This annual report on Form 10-K (“Form 10-K”), together with other statements and information publicly disseminated by Kimco Realty Corporation (the “Company”) contains certain forward-looking statements within the meaning of Section 27A of the Securities Act of 1933, as amended, and Section 21E of the Securities Exchange Act of 1934, as amended. The Company intends such forward-looking statements to be covered by the safe harbor provisions for forward-looking statements contained in the Private Securities Litigation Reform Act of 1995 and includes this statement for purposes of complying with the safe harbor provisions. Forward-looking statements, which are based on certain assumptions and describe the Company’s future plans, strategies and expectations, are generally identifiable by use of the words “believe,” “expect,” “intend,” “anticipate,” “estimate,” “project” or similar expressions. You should not rely on forward-looking statements since they involve known and unknown risks, uncertainties and other factors which are, in some cases, beyond the Company’s control and could materially affect actual results, performances or achievements. Factors which may cause actual results to differ materially from current expectations include, but are not limited to (i) general adverse economic and local real estate conditions, (ii) the inability of major tenants to continue paying their rent obligations due to bankruptcy, insolvency or a general downturn in their business, (iii) financing risks, such as the inability to obtain equity, debt or other sources of financing or refinancing on
terms favorable
terms,to the Company, (iv) the Company’s ability to raise capital by selling its assets, (v) changes in governmental laws and regulations, (vi) the level and volatility of interest rates and foreign currency exchange rates, (vii)
risks related to our international operations, (viii) the availability of suitable acquisition and disposition opportunities,
(viii)(ix) valuation
ofand risks related to our joint venture
and preferred equity investments,
(ix)(x) valuation of marketable securities and other investments,
(x)(xi) increases in operating costs,
(xi)(xii) changes in the dividend policy for the Company’s common stock,
(xii)(xiii) the reduction in the Company’s income in the event of multiple lease terminations by tenants or a failure by multiple tenants to occupy their premises in a shopping center,
(xiii)(xiv) impairment charges and
(xiv)(xv) unanticipated changes in the Company’s intention or ability to prepay certain debt prior to maturity and/or hold certain securities until maturity and the risks and uncertainties identified under Item 1A, “Risk Factors” and elsewhere in this Form
10-K.10-K and in the Company’s other filings with the SEC. Accordingly, there is no assurance that the Company’s expectations will be realized.
Kimco Realty Corporation, a Maryland corporation, is one of the nation's largest owners and operators of neighborhood and community shopping centers. The terms "Kimco," the "Company," "we," "our" and "us" each refer to Kimco Realty Corporation and our subsidiaries, unless the context indicates otherwise. The Company is a self-administered real estate investment trust ("REIT") and has owned and operated neighborhood and community shopping centers for more than 50 years. The Company has not engaged, nor does it expect to retain, any REIT advisors in connection with the operation of its properties. As of December 31,
2011,2012, the Company had interests in
946896 shopping center properties (the “Combined Shopping Center Portfolio”), aggregating
138.1131.3 million square feet of gross leasable area (“GLA”), and
845829 other property interests, primarily through the Company’s preferred equity investments, other real estate investments and non-retail properties, totaling
approximately 34.126.6 million square feet of GLA, for a grand total of
1,7911,725 properties aggregating
172.2157.9 million square feet of GLA, located in 44 states, Puerto Rico, Canada, Mexico, Chile, Brazil and Peru. The Company’s ownership interests in real estate consist of its consolidated portfolio and portfolios where the Company owns an economic interest, such as properties in the Company’s investment real estate management programs, where the Company partners with institutional investors and also retains management. The Company believes its portfolio of neighborhood and community shopping center properties is the largest (measured by GLA) currently held by any publicly traded REIT.
The Company's executive offices are located at 3333 New Hyde Park Road, New Hyde Park, New York 11042-0020 and its telephone number is (516) 869-9000. Nearly all operating functions, including leasing, legal, construction, data processing, maintenance, finance and accounting are administered by the Company from its executive offices in New Hyde Park, New York and supported by the Company’s regional offices. As of December 31,
2011,2012, a total of
685635 persons are employed by the Company.
The Company’s Web site is located athttp://www.kimcorealty.com. The information contained on our Web site does not constitute part of this Form 10-K. On the Company’s Web site you can obtain, free of charge, a copy of our Form 10-K, quarterly reports on Form 10-Q, current reports on Form 8-K and amendments to those reports filed or furnished pursuant to Section 13(a) or 15(d) of the Exchange Act of 1934, as amended, as soon as reasonably practicable, after we file such material electronically with, or furnish it to, the Securities and Exchange Commission (the "SEC"). The public may read and copy any materials we file with the SEC at the SEC's Public Reference Room at 100 F Street, NE, Washington, DC 20549. The public may obtain information on the operation of the Public Reference Room by calling the SEC at 1-800-SEC-0330. The SEC also maintains an Internet site that contains reports, proxy and information statements, and other information regarding issuers that file electronically with the SEC at
http://www.sec.gov.www.sec.gov
. The Company began operations through its predecessor, The Kimco Corporation, which was organized in 1966 upon the contribution of several shopping center properties owned by its principal stockholders. In 1973, these principals formed the Company as a Delaware corporation, and, in 1985, the operations of The Kimco Corporation were merged into the Company. The Company completed its initial public stock offering (the "IPO") in November 1991, and, commencing with its taxable year which began January
3
1, 1992, elected to qualify as a REIT in accordance with Sections 856 through 860 of the Internal Revenue Code of 1986, as amended (the "Code"). If, as the Company believes, it is organized and operates in such a manner so as to qualify and remain qualified as a REIT under the Code, the Company generally will not be subject to federal income tax, provided that distributions to its stockholders equal at least the amount of its REIT taxable income, as defined under the Code. In 1994, the Company reorganized as a Maryland corporation. In March 2006, the Company was added to the S & P 500 Index, an index containing the stock of 500 Large Cap companies, most of which are U.S. corporations. The Company's common stock, Class FH Depositary Shares, Class GI Depositary Shares, Class J Depositary Shares and Class HK Depositary Shares are traded on the New York Stock Exchange (“NYSE”) under the trading symbols “KIM”, “KIMprF”, “KIMprG” and “KIMprH”, “KIMprI”, “KIMprJ” and “KIMprK”, respectively.
The Company’s initial growth resulted primarily from ground-up development and the construction of shopping centers. Subsequently, the Company revised its growth strategy to focus on the acquisition of existing shopping centers and continued its expansion across the nation. The Company implemented its investment real estate management format through the establishment of various institutional joint venture programs, in which the Company has noncontrolling interests. The Company earns management fees, acquisition fees, disposition fees and promoted interests based on value creation. The Company continued its geographic expansion with investments in Canada, Mexico, Chile, Brazil and Peru. The Company’s revenues and equity in income from its foreign investments
in U.S. dollar equivalents and their respective local currencies are as follows (in millions):
| | | | | | |
| | 2011 | | 2010 | | 2009 |
Revenues (consolidated): | | | | | | |
Mexico | $ | 46.3 | $ | 35.4 | $ | 23.4 |
South America | $ | 4.5 | $ | 3.8 | $ | 1.5 |
| | | | | | |
Equity in income (unconsolidated joint ventures, including preferred equity investments): | | | | | | |
Canada | $ | 21.3 | $ | 26.5 | $ | 25.1 |
Mexico | $ | 11.9 | $ | 12.0 | $ | 7.0 |
South America | $ | 0.9 | $ | 0.1 | $ | 0.4 |
| | | 2012 | | | 2011 | | | 2010 | |
| Revenues (consolidated in USD): | | | | | | | | | |
| Mexico | | $ | 47.3 | | | $ | 46.3 | | | $ | 35.4 | |
| Brazil | | $ | 3.8 | | | $ | 3.8 | | | $ | 3.3 | |
| Peru | | $ | 0.4 | | | $ | 0.4 | | | $ | 0.4 | |
| Chile | | $ | 7.4 | | | $ | 0.3 | | | $ | 0.1 | |
| Revenues (consolidated): | | | | | | | | | | | | |
| Mexico (Mexican Pesos “MXN”) | | | 626.5 | | | | 570.2 | | | | 455.8 | |
| Brazil (Brazillian Real) | | | 7.2 | | | | 6.3 | | | | 5.9 | |
| Peru (Peruvian Nuevo Sol) | | | 1.1 | | | | 1.1 | | | | 1.0 | |
| Chile (Chilean Pesos “CLP”) | | | 3,648.0 | | | | 144.7 | | | | 62.8 | |
| | | | | | | | | | | | | |
| Equity in income (unconsolidated joint ventures, including preferred equity investments in USD): | | | | | | | | | | | | |
| Canada | | $ | 45.4 | | | $ | 21.3 | | | $ | 26.5 | |
| Mexico | | $ | 15.0 | | | $ | 11.9 | | | $ | 12.0 | |
| Chile | | $ | 0.4 | | | $ | 0.9 | | | $ | 0.1 | |
| | | | | | | | | | | | | |
| Equity in income (unconsolidated joint ventures, including preferred equity investments in local currencies): | | | | | | | | | | | | |
| Canada (Canadian dollars) | | | 44.4 | | | | 19.7 | | | | 27.3 | |
| Mexico (MXN) | | | 152.8 | | | | 123.5 | | | | 99.0 | |
| Chile (CLP) | | | 194.2 | | | | 411.2 | | | | 32.0 | |
The Company, through its taxable REIT subsidiaries (“TRS”), as permitted by the Tax Relief Extension Act of 1999, has been engaged in various retail real estate related opportunities, including (i) ground-up development of neighborhood and community shopping centers and the subsequent sale thereof upon completion, (ii) retail real estate management and disposition services, which primarily focused on leasing and disposition strategies for real estate property interests of both healthy and distressed retailers and (iii) acting as an agent or principal in connection with tax-deferred exchange transactions. The Company may consider other investments through
taxable REIT subsidiariesits TRS should suitable opportunities arise.
In addition, the Company has capitalized on its established expertise in retail real estate by establishing other ventures in which the Company owns a smaller equity interest and provides management, leasing and operational support for those properties. The Company has also provided preferred equity capital in the past to real estate entrepreneurs and, from time to time, provides real estate capital and management services to both healthy and distressed retailers. The Company has also made selective investments in secondary market opportunities where a security or other investment is, in management’s judgment, priced below the value of the underlying assets, however these investments are subject to volatility within the equity and debt markets.
Operating and Investment Strategy
The Company’s vision is to be the premier owner and operator of shopping centers with its core business operations focusing on owning and operating neighborhood and community shopping centers through investments in North America. This vision will entailhas entailed a shift away from non-retail assets that the Company currently holds. These investments include non-retail preferred equity investments, marketable securities, mortgages on non-retail properties and several urban mixed-use properties. The Company’s plan is to sell certainCompany has been actively selling its non-retail assets and investments. As of December 31, 2011,2012, these investments had a book value of approximately $512$398.4 million, which represents less than 5.4%3.5% of the Company’s total assets.assets, before depreciation. In addition, the Company continues to be committed to broadening itshas an active capital recycling program of selling retail assets deemed non-strategic. The Company also has an institutional management business by forming joint ventures with high quality domestic and foreign institutional partners for the purpose of investing in neighborhood and community shopping centers. The Company's investment objective is to increase cash flow, current income and, consequently, the value of its existing portfolio of properties and to seek continued growth through (i) the retail re-tenanting, renovation and expansion of its existing centers and (ii) the selective acquisition of established income-producing real estate properties and properties requiring significant re-tenanting and redevelopment, primarily in neighborhood and community shopping centers in geographic regions in which the Company presently operates. The Company may consider investments in other real estate sectors and in geographic markets where it does not presently operate should suitable opportunities arise.
The Company's neighborhood and community shopping center properties are designed to attract local area customers and
are typically
are anchored by a discount department store, a supermarket or a drugstore tenant offering day-to-day necessities rather than high-priced luxury items. The Company may either purchase or lease income-producing properties in the future and may also participate with other entities in property ownership through partnerships, joint ventures or similar types of co-ownership. Equity
4
investments may be subject to existing mortgage financing and/or other indebtedness. Financing or other indebtedness may be incurred simultaneously or subsequently in connection with such investments. Any such financing or indebtedness would have priority over the Company’s equity interest in such property. The Company may make loans to joint ventures in which it may or may not participate.
The Company seeks to reduce its operating and leasing risks through diversification achieved by the geographic distribution of its properties and a large tenant base. As of December 31,
2011,2012, no single neighborhood and community shopping center accounted for more than
1.6%1.7% of the Company's annualized base rental revenues, including the proportionate share of base rental revenues from properties in which the Company has less than a 100% economic interest, or more than 1.2% of the Company’s total shopping center GLA. At December 31,
2011,2012, the Company’s five largest tenants were The Home Depot, TJX Companies, Wal-Mart, Sears Holdings and
Kohl’s,Bed Bath & Beyond, which represented
approximately 3.0%, 2.9%,
2.5%2.6%,
2.1%2.0% and 1.7%, respectively, of the Company’s annualized base rental revenues, including the proportionate share of base rental revenues from properties in which the Company has less than a 100% economic interest.
As one of the original participants in the growth of the shopping center industry and one of the nation's largest owners and operators of neighborhood and community shopping centers, the Company has established close relationships with a large number of major national and regional retailers and maintains a broad network of industry contacts. Management is associated with and/or actively participates in many shopping center and REIT industry organizations. Notwithstanding these relationships, there are numerous regional and local commercial developers, real estate companies, financial institutions and other investors who compete with the Company for the acquisition of properties and other investment opportunities and in seeking tenants who will lease space in the Company’s properties. We are subject to certain business and legal risks including, but not limited to, the following:
Loss of our tax status as a real estate investment trust could have significant adverse consequences to us and the value of our securities.
We have elected to be taxed as a REIT for federal income tax purposes under the Code. We believe that we have operated so as to qualify as a REIT under the Code and that our current organization and method of operation comply with the rules and regulations promulgated under the Code to enable us to continue to qualify as a REIT. However, there can be no assurance that we have qualified or will continue to qualify as a REIT for federal income tax purposes.
Qualification as a REIT involves the application of highly technical and complex Code provisions, for which there are only limited judicial and administrative interpretations. The determination of various factual matters and circumstances not entirely within our control may affect our ability to qualify as a REIT. New legislation, regulations, administrative interpretations or court decisions could significantly change the tax laws with respect to qualification as a REIT, the federal income tax consequences of such qualification or the desirability of an investment in a REIT relative to other investments.
In order to qualify as a REIT, we must satisfy a number of requirements, including requirements regarding the composition of our assets and a requirement that at least 95% of our gross income in any year be derived from qualifying sources, such as “rents from real property.” Also, we must make distributions to stockholders aggregating annually at least 90% of our REIT taxable income, excluding net capital gains. Furthermore, we own a direct or indirect interest in certain subsidiary REITs which elected to be taxed as REITs for federal income tax purposes under the Code. Provided that each subsidiary REIT qualifies as a REIT, our interest in such subsidiary REIT will be treated as a qualifying real estate asset for purposes of the REIT asset tests. To qualify as a REIT, the subsidiary REIT must independently satisfy all of the REIT qualification requirements. The failure of a subsidiary REIT to qualify as a REIT could have an adverse effect on our ability to comply with the REIT income and asset tests, and thus our ability to qualify as a REIT.
If we lose our REIT status, we will face serious tax consequences that will substantially reduce the funds available to pay dividends to stockholders for each of the years involved because: ·
we would not be allowed a deduction for distributions to stockholders in computing our taxable income and we would be subject to federal income tax at regular corporate rates;
·
we could be subject to the federal alternative minimum tax and possibly increased state and local taxes;
·
unless we were entitled to relief under statutory provisions, we could not elect to be subject to tax as a REIT for four taxable years following the year during which we were disqualified; and
·
we would not be required to make distributions to stockholders.
| · | we would not be allowed a deduction for distributions to stockholders in computing our taxable income and we would be subject to federal income tax at regular corporate rates; |
| · | we could be subject to the federal alternative minimum tax and possibly increased state and local taxes; |
| · | unless we were entitled to relief under statutory provisions, we could not elect to be subject to tax as a REIT for four taxable years following the year during which we were disqualified; and |
| · | we would not be required to make distributions to stockholders. |
As a result of all these factors, our failure to qualify as a REIT could also impair our ability to expand our business or raise capital and materially adversely affect the value of our securities.
To maintain our REIT status, we may be forced to borrow funds on a short-term basis during unfavorable market conditions.
To qualify as a REIT, we generally must distribute to our stockholders at least 90% of our REIT taxable income each year, excluding capital gains, and we will be subject to regular corporate income taxes to the extent that we distribute less than 100% of our net taxable income each year. In addition, we will be subject to a 4% nondeductible excise tax on the amount, if any, by which distributions paid by us in any calendar year are less than the sum of 85% of our ordinary income, 95% of our capital gain net income and 100% of our undistributed income from prior years. While we have historically satisfied these distribution requirements by making cash distributions to our stockholders, a REIT is permitted to satisfy these requirements by making distributions of cash or other property, including, in limited circumstances, its own stock. Assuming we continue to satisfy these distributions requirements with cash, we may need to borrow funds to meet the REIT distribution requirements even if the then prevailing market conditions are not favorable for these borrowings. These borrowing needs could result from differences in timing between the actual receipt of cash and inclusion of income for federal income tax purposes, or the effect of non-deductible capital expenditures, the creation of reserves or required debt or amortization payments.
Adverse global market and economic conditions may impede our ability to generate sufficient income
to pay expenses and maintain our properties.
The economic performance and value of our properties is subject to all of the risks associated with owning and operating real estate, including:
·
changes in the national, regional and local economic climate;
·
local conditions, including an oversupply of, or a reduction in demand for, space in properties like those that we own;
·
trends toward smaller store sizes as retailers reduce inventory and new prototypes;
·
the attractiveness of our properties to tenants;
·
the ability of tenants to pay rent, particularly anchor tenants with leases in multiple locations;
·
tenants who may declare bankruptcy and/or close stores;
·
competition from other available properties to attract and retain tenants;
·
changes in market rental rates;
·
the need to periodically pay for costs to repair, renovate and re-let space;
·
changes in operating costs, including costs for maintenance, insurance and real estate taxes;
·
the fact that the expenses of owning and operating properties are not necessarily reduced when circumstances such as market factors and competition cause a reduction in income from the properties; and
·
changes in laws and governmental regulations, including those governing usage, zoning, the environment and taxes.
| · | changes in the national, regional and local economic climate; |
| · | local conditions, including an oversupply of, or a reduction in demand for, space in properties like those that we own; |
| · | trends toward smaller store sizes as retailers reduce inventory and new prototypes; |
| · | increasing use by customers of e-commerce and online store sites; |
| · | the attractiveness of our properties to tenants; |
| · | the ability of tenants to pay rent, particularly anchor tenants with leases in multiple locations; |
| · | tenants who may declare bankruptcy and/or close stores; |
| · | competition from other available properties to attract and retain tenants; |
| · | changes in market rental rates; |
| · | the need to periodically pay for costs to repair, renovate and re-let space; |
| · | changes in operating costs, including costs for maintenance, insurance and real estate taxes; |
| · | the fact that the expenses of owning and operating properties are not necessarily reduced when circumstances such as market factors and competition cause a reduction in income from the properties; and |
| · | changes in laws and governmental regulations, including those governing usage, zoning, the environment and taxes. |
Competition may limit our ability to purchase new properties or generate sufficient income from tenants and may decrease the occupancy and rental rates for our properties.
Our properties consist primarily of community and neighborhood shopping centers and other retail properties. Our performance therefore, is generally linked to economic conditions in the market for retail space. In the future, the market for retail space could be adversely affected by:
·
weakness in the national, regional and local economies;
·
the adverse financial condition of some large retailing companies;
·
the impact of internet sales on the demand for reatil space;
·
ongoing consolidation in the retail sector; and
·
the excess amount of retail space in a number of markets.
| · | weakness in the national, regional and local economies; |
| · | the adverse financial condition of some large retailing companies; |
| · | the impact of internet sales on the demand for retail space; |
| · | ongoing consolidation in the retail sector; and |
| · | the excess amount of retail space in a number of markets. |
In addition, numerous commercial developers and real estate companies compete with us in seeking tenants for our existing properties and properties for acquisition. New regional malls, open-air lifestyle centers, or other retail shopping centers with more convenient locations or better rents may attract tenants or cause them to seek more favorable lease terms at or prior to renewal. Retailers at our properties may face increasing competition from other retailers, e-commerce, outlet malls, discount shopping clubs, catalog companies, direct mail, telemarketing or home shopping networks, all of which could (i) reduce rents payable to us; (ii) reduce our ability to attract and retain tenants at our properties; or (iii) lead to increased vacancy rates at our properties. We may fail to anticipate the effects of changes in consumer buying practices, particularly of growing online sales and the resulting retailing practices and space needs of our tenants or a general downturn in our tenants’ businesses, which may cause tenants to close stores or default in payment of rent.
Our performance depends on our ability to collect rent from tenants, our tenants’ financial condition and our tenants maintaining leases for our properties.
At any time our
tenants’,tenants, particularly small local stores, may experience a downturn in their business that may significantly weaken their financial condition. As a result, our tenants may delay a number of lease commencements, decline to extend or renew leases upon expiration, fail to make rental payments when due, close stores or declare bankruptcy. Any of these actions could result in the termination of
the tenants’ leases and the loss of rental income attributable to these tenants’ leases. In the event of a default by a tenant, we may experience delays and costs in enforcing our rights as landlord under the terms of
ourthe leases.
In addition, multiple lease terminations by tenants or a failure by multiple tenants to occupy their premises in a shopping center could result in lease terminations or significant reductions in rent by other tenants in the same shopping centers under the terms of some leases. In that event, we may be unable to re-lease the vacated space at attractive rents or at all, and our rental payments from our continuing tenants could significantly decrease. The occurrence of any of the situations described above, particularly if it involves a substantial tenant with leases in multiple locations, could have a material adverse effect on our
performance.financial condition, results of operations and cash flows.
A tenant that files for bankruptcy protection may not continue to pay us rent. A bankruptcy filing by, or relating to, one of our tenants or a lease guarantor would bar all efforts by us to collect pre-bankruptcy debts from the tenant or the lease guarantor, or their property, unless the bankruptcy court permits us to do so. A tenant or lease guarantor bankruptcy could delay our efforts to collect past due balances under the relevant leases and could ultimately preclude collection of these sums. If a lease is rejected by a tenant in bankruptcy, we would have only a general unsecured claim for damages. As a result, it is likely that we would recover substantially less than the full value of any unsecured claims we hold, if at all.
We may be unable to sell our real estate property investments when appropriate or on
terms favorable
terms. to us.
Real estate property investments are illiquid and generally cannot be disposed of quickly. In addition, the federal tax code restricts a REIT’s ability to dispose of properties that are not applicable to other types of real estate companies. Therefore, we may not be able to vary our portfolio in response to economic or other conditions promptly or on
terms favorable
terms.to us within a time frame that we would need.
We may acquire or develop properties or acquire other real estate related companies and this may create risks.
We may acquire or develop properties or acquire other real estate related companies when we believe that an acquisition or development is consistent with our business strategies. We may not succeed in consummating desired acquisitions or in completing developments on time or within budget. When we do pursue a project or acquisition, we may not succeed in leasing newly developed or acquired properties at rents sufficient to cover the costs of acquisition or development and operations. Difficulties in integrating acquisitions may prove costly or time-consuming and could divert management’s
attention.attention from other activities. Acquisitions or developments in new markets or industries where we do not have the same level of market knowledge may result in poorer than anticipated performance. We may also abandon acquisition or development opportunities that management has begun pursuing and consequently fail to recover expenses already incurred and
will have devoted management’s time to a matter not consummated. Furthermore, our acquisitions of new properties or companies will expose us to the liabilities of those properties or companies, some of which we may not be aware of at the time of the acquisition. In addition, development of our existing properties presents similar risks.
Newly acquired or re-developed properties may have characteristics or deficiencies currently unknown to us that affect their value or revenue potential. It is also possible that the operating performance of these properties may decline under our management. As we acquire additional properties, we will be subject to risks associated with managing new properties, including lease-up and tenant retention. In addition, our ability to manage our growth effectively will require us to successfully integrate our new acquisitions into our existing management structure. We may not succeed with this integration or effectively manage additional
properties.properties, particularly in secondary markets. Also, newly acquired properties may not perform as expected.
We face competition in pursuing acquisition or development opportunities that could increase our costs.
We face competition in the acquisition, development, operation and sale of real property from others engaged in real estate investment that could increase our costs associated with purchasing and maintaining assets. Some of these competitors may have greater financial resources than we do. This could result in competition for the acquisition of properties for tenants who lease or consider leasing space in our existing and subsequently acquired properties and for other real estate investment opportunities.
We do not have exclusive control over our joint venture and preferred equity investments, such that we are unable to ensure that our objectives will be pursued.
We have invested in some properties as a co-venturer or partner, instead of owning directly. In these investments, we do not have exclusive control over the development, financing, leasing, management and other aspects of these investments. As a result, the co-venturer or partner might have interests or goals that are inconsistent with ours, take action contrary to our interests or otherwise impede our objectives. These investments involve risks and uncertainties. The co-venturer or partner may fail to provide capital or fulfill its obligations, which may result in certain liabilities to us for guarantees and other commitments, conflicts arising between us and our partners and the difficulty of managing and resolving such conflicts, and the difficulty of managing or otherwise monitoring such business arrangements. The co-venturer or partner also might become insolvent or bankrupt, which may result in significant losses to us.
Although our joint venture arrangements may allow us to share risks with our joint-venture partners, these arrangements may also decrease our ability to manage risk. Joint ventures implicate additional risks, such as:
·
potentially inferior financial capacity, diverging business goals and strategies and the need for our venture partner’s continued cooperation;
·
our inability to take actions with respect to the joint venture activities that we believe are favorable if our joint venture partner does not agree;
·
our inability to control the legal entity that has title to the real estate associated with the joint venture;
·
our lenders may not be easily able to sell our joint venture assets and investments or may view them less favorably as collateral, which could negatively affect our liquidity and capital resources;
·
our joint venture partners can take actions that we may not be able to anticipate or prevent, which could result in negative impacts on our debt and equity; and
·
our joint venture partners’ business decisions or other actions or omissions may result in harm to our reputation or adversely affect the value of our investments.
| · | potentially inferior financial capacity, diverging business goals and strategies and the need for our venture partner’s continued cooperation; |
| · | our inability to take actions with respect to the joint venture activities that we believe are favorable to us if our joint venture partner does not agree; |
| · | our inability to control the legal entity that has title to the real estate associated with the joint venture; |
| · | our lenders may not be easily able to sell our joint venture assets and investments or may view them less favorably as collateral, which could negatively affect our liquidity and capital resources; |
| · | our joint venture partners can take actions that we may not be able to anticipate or prevent, which could result in negative impacts on our debt and equity; and |
| · | our joint venture partners’ business decisions or other actions or omissions may result in harm to our reputation or adversely affect the value of our investments. |
Our joint venture and preferred equity investments generally own real estate properties for which the economic performance and value is subject to all the risks associated with owning and operating real estate as described above.
We intend to sell many of our non-retail
and non-strategic assets over the next several years and may not be able to recover our investments, which may result in significant losses to us.
There can be no assurance that we will be able to recover the current carrying amount of all of our non-retail
and/or non-strategic properties and investments and those of our unconsolidated joint ventures in the future. Our failure to do so would require us to recognize impairment charges for the period in which we reached that conclusion, which could materially and adversely affect
us. our business, financial condition, operating results and cash flows.
We have significant international operations, which may be affected by economic, political and other risks associated with international operations, and this could adversely affect our business.
The risks we face in international business operations include, but are not limited to:
·
currency risks, including currency fluctuations;
·
unexpected changes in legislative and regulatory requirements;
·
potential adverse tax burdens;
·
burdens of complying with different accounting and permitting standards, labor laws and a wide variety of foreign laws;
·
obstacles to the repatriation of earnings and cash;
·
regional, national and local political uncertainty;
·
economic slowdown and/or downturn in foreign markets;
·
difficulties in staffing and managing international operations;
·
difficulty in administering and enforcing corporate policies, which may be different than the normal business practices of local cultures; and
·
reduced protection for intellectual property in some countries.
| · | currency risks, including currency fluctuations; |
| · | unexpected changes in legislative and regulatory requirements; |
| · | potential adverse tax burdens; |
| · | burdens of complying with different accounting and permitting standards, labor laws and a wide variety of foreign laws; |
| · | obstacles to the repatriation of earnings and cash; |
| · | regional, national and local political uncertainty; |
| · | economic slowdown and/or downturn in foreign markets; |
| · | difficulties in staffing and managing international operations; |
| · | difficulty in administering and enforcing corporate policies, which may be different than the normal business practices of local cultures; and |
| · | reduced protection for intellectual property in some countries. |
Each of these risks might impact our cash flow or impair our ability to borrow funds, which ultimately could adversely affect our business, financial condition, operating results and cash flows.
In order to fully develop our international operations, we must overcome cultural and language barriers and assimilate different business practices. In addition, we are required to create compensation programs, employment policies and other administrative programs that comply with laws of multiple countries. We also must communicate and monitor standards and directives in our international locations. Our failure to successfully manage our geographically diverse operations could impair our ability to react quickly to changing business and market conditions and to enforce compliance with standards and procedures. Since a meaningful portion of our revenues are generated internationally, we must devote substantial resources to managing our international operations.
Our future success will be influenced by our ability to anticipate and effectively manage these and other risks associated with our international operations. Any of these factors could, however, materially adversely affect our international operations and, consequently, our financial condition, results of operations and cash flows.
We cannot predict the impact of laws and regulations affecting our international operations nor the potential that we may face regulatory sanctions.
Our international operations
include properties in Canada, Mexico, Chile, Brazil and Peru and are subject to a variety of United States and foreign laws and regulations, including the United States Foreign Corrupt Practices Act (“FCPA”). We
have policies and procedures designed to promote compliance with the FCPA and other anti-corruption laws, but we cannot assure you that we will continue to be found to be operating in compliance with, or be able to detect violations of, any such laws or regulations. In addition, we cannot predict the nature, scope or effect of future regulatory requirements to which our international operations might be subject, the manner in which existing laws might be administered or interpreted, or the potential that we may face regulatory sanctions.
We cannot assure you that our employees will adhere to our Code of Conduct or any other of our policies, applicable anti-corruption laws, including the FCPA, or other legal requirements. Failure to comply
with theseor violations of any applicable policies, anti-corruption laws, or other legal requirements may subject us to legal, regulatory or other sanctions,
including criminal and civil penalties and other remedial measures. We have received a subpoena from the Enforcement Division of the SEC in connection with the SEC’s investigation, In the Matter of Wal-Mart Stores, Inc. (FW-3678), that the SEC Staff is currently conducting with respect to possible violations of the FCPA. See “Item 3. Legal Proceedings,” below. The U.S. Department of Justice and the SEC have a broad range of civil and criminal sanctions under the FCPA and other laws and regulations, which
they may seek to impose against corporations and individuals in appropriate circumstances including, but not limited to, injunctive relief, disgorgement, fines, penalties and modifications to business practices and compliance programs. Any of these remedial measures, if applicable to us, could
adversely affecthave a material adverse impact on our
financial condition,business, results of operations,
financial condition and
cash flows.liquidity.
We face risks relating to cybersecurity attacks, loss of confidential information and other business disruptions.
Our business is at risk from and may be impacted by cybersecurity attacks, including attempts to gain unauthorized access to our confidential data and other electronic security breaches. Such cyber attacks can range from individual attempts to gain unauthorized access to our information technology systems to more sophisticated security threats. While we employ a number of measures to prevent, detect and mitigate these threats including password protection, backup servers and annual penetration testing, there is no guarantee such efforts will be successful in preventing a cyber attack. Cybersecurity incidents could compromise the confidential information of our tenants, employees and third party vendors and disrupt and effect the efficiency of our business operations.
We may be unable to obtain financing through the debt and equities market, which would have a material adverse effect on our growth strategy, our results of operations and our financial condition.
We cannot assure you that we will be able to access the capital and credit markets to obtain additional debt or equity financing or that we will be able to obtain financing on
terms favorable
terms.to us. The inability to obtain financing
on a timely basis could have negative effects on our business, such as:
·
we could have great difficulty acquiring or developing properties, which would materially adversely affect our business strategy;
·
our liquidity could be adversely affected;
·
we may be unable to repay or refinance our indebtedness;
·
we may need to make higher interest and principal payments or sell some of our assets on unfavorable terms to fund our indebtedness; or
·
we may need to issue additional capital stock, which could further dilute the ownership of our existing shareholders.
| · | we could have great difficulty acquiring or developing properties, which would materially adversely affect our business strategy; |
| · | our liquidity could be adversely affected; |
| · | we may be unable to repay or refinance our indebtedness; |
| · | we may need to make higher interest and principal payments or sell some of our assets on terms unfavorable to us to fund our indebtedness; or |
| · | we may need to issue additional capital stock, which could further dilute the ownership of our existing shareholders. |
Adverse changes in our credit ratings could impair our ability to obtain additional debt and equity financing on
terms favorable
terms,to us, if at all, and could significantly reduce the market price of our publicly traded securities.
We are subject to financial covenants that may restrict our operating and acquisition activities.
Our revolving credit facility and the indentures under which our senior unsecured debt is issued contain certain financial and operating covenants, including, among other things, certain coverage ratios and limitations on our ability to incur debt, make dividend payments, sell all or substantially all of our assets and engage in mergers and consolidations and certain acquisitions. These covenants may restrict our ability to pursue certain business initiatives or certain acquisition transactions that might otherwise be advantageous. In addition, failure to meet any of the financial covenants could cause an event of default under
our revolving credit facility and the indentures and/or accelerate some or all of our indebtedness, which would have a material adverse effect on us.
Changes in market conditions could adversely affect the market price of our publicly traded securities.
As with other publicly traded securities, the market price of our publicly traded securities depends on various market conditions, which may change from time-to-time. Among the market conditions that may affect the market price of our publicly traded securities are the following:
·
the extent of institutional investor interest in us;
·
the reputation of REITs generally and the reputation of REITs with portfolios similar to ours;
·
the attractiveness of the securities of REITs in comparison to securities issued by other entities, including securities issued by other real estate companies;
·
our financial condition and performance;
·
the market’s perception of our growth potential and potential future cash dividends;
·
an increase in market interest rates, which may lead prospective investors to demand a higher distribution rate in relation to the price paid for our shares; and
·
general economic and financial market conditions.
| · | the extent of institutional investor interest in us; |
| · | the reputation of REITs generally and the reputation of REITs with portfolios similar to ours; |
| · | the attractiveness of the securities of REITs in comparison to securities issued by other entities, including securities issued by other real estate companies; |
| · | our financial condition and performance; |
| · | the market’s perception of our growth potential and potential future cash dividends; |
| · | an increase in market interest rates, which may lead prospective investors to demand a higher distribution rate in relation to the price paid for our shares; and |
| · | general economic and financial market conditions. |
We may change the dividend policy for our common stock in the future.
The decision to declare and pay dividends on our common stock in the future, as well as the timing, amount and composition of any such future dividends, will be at the sole discretion of our Board of Directors and will depend on our earnings, operating cash flows, liquidity, financial condition, capital requirements, contractual prohibitions or other limitations under our indebtedness including preferred stock, the annual distribution requirements under the REIT provisions of the Code, state law and such other factors as our Board of Directors deems
relevant.relevant or are requirements under the Code or state or federal laws. Any change in our dividend policy could have a material adverse effect on the market price of our common stock.
We may not be able to recover our investments in marketable securities or mortgage receivables, which may result in significant losses to us.
Our investments in marketable securities are subject to specific risks relating to the particular issuer of the securities, including the financial condition and business outlook of the issuer, which may result in significant losses to us. Marketable securities are generally unsecured and may also be subordinated to other obligations of the issuer. As a result, investments in marketable securities are subject to risks of:
·
limited liquidity in the secondary trading market;
·
substantial market price volatility, resulting from changes in prevailing interest rates;
·
subordination to the prior claims of banks and other senior lenders to the issuer;
·
the possibility that earnings of the issuer may be insufficient to meet its debt service and distribution obligations; and
·
the declining creditworthiness and potential for insolvency of the issuer during periods of rising interest rates and economic downturn.
| · | limited liquidity in the secondary trading market; |
| · | substantial market price volatility, resulting from changes in prevailing interest rates; |
| · | subordination to the prior claims of banks and other senior lenders to the issuer; |
| · | the possibility that earnings of the issuer may be insufficient to meet its debt service and distribution obligations; and |
| · | the declining creditworthiness and potential for insolvency of the issuer during periods of rising interest rates and economic downturn. |
These risks may adversely affect the value of outstanding marketable securities and the ability of the issuers to make distribution payments.
In the event of a default by a borrower, it may be necessary for us to foreclose our mortgage or engage in costly negotiations. Delays in liquidating defaulted mortgage loans and repossessing and selling the underlying properties could reduce our investment returns. Furthermore, in the event of default, the actual value of the property securing the mortgage may decrease. A decline in real estate values will adversely affect the value of our loans and the value of the mortgages securing our loans.
Our mortgage receivables may be or become subordinated to mechanics' or materialmen's liens or property tax liens. In these instances we may need to protect a particular investment by making payments to maintain the current status of a prior lien or discharge it entirely. In these cases, the total amount we recover may be less than our total investment, resulting in a loss. In the event of a major loan default or several loan defaults resulting in losses, our investments in mortgage receivables would be materially and adversely affected.
We may be subject to liability under environmental laws, ordinances and regulations.
Under various federal, state, and local laws, ordinances and regulations, we may be considered an owner or operator of real property and may be responsible for paying for the disposal or treatment of hazardous or toxic substances released on or in our property, as well as certain other potential costs relating to hazardous or toxic substances (including governmental fines and injuries to persons and property). This liability may be imposed whether or not we knew about, or were responsible for, the presence of hazardous or toxic substances.
Item 1B. Unresolved Staff Comments
Real Estate Portfolio.As of December 31, 2011,2012, the Company had interests in 946896 shopping center properties (the “Combined Shopping Center Portfolio”) aggregating 138.1131.3 million square feet of gross leasable area (“GLA”) and 845829 other property interests, primarily through the Company’s preferred equity investments, other real estate investments and non-retail properties, totaling approximately 34.126.6 million square feet of GLA, for a grand total of 1,7911,725 properties aggregating 172.2157.9 million square feet of GLA, located in 44 states, Puerto Rico, Canada, Mexico and South America. The Company’s portfolio includes noncontrolling interests. Neighborhood and community shopping centers comprise the primary focus of the Company's current portfolio. As of December 31, 2011,2012, the Company’s Combined Shopping Center Portfolio was approximately 93.3%94.0% leased. The Company's neighborhood and community shopping center properties, which are generally owned and operated through subsidiaries or joint ventures, had an average size of
approximately 138,000138,518 square feet as of December 31,
2011.2012. The Company generally retains its shopping centers for long-term investment and consequently pursues a program of regular physical maintenance together with major renovations and refurbishing to preserve and increase the value of its properties. This includes renovating existing facades, installing uniform signage, resurfacing parking lots and enhancing parking lot lighting. During
2011,2012, the Company capitalized
approximately $11.4$7.8 million in connection with these property improvements and expensed to operations
approximately $25.8$25.4 million.
The Company's management believes its experience in the real estate industry and its relationships with numerous national and regional tenants gives it an advantage in an industry where ownership is fragmented among a large number of property owners. The Company's neighborhood and community shopping centers are usually "anchored" by a national or regional discount department store, supermarket or drugstore. As one of the original participants in the growth of the shopping center industry and one of the nation's largest owners and operators of shopping centers, the Company has established close relationships with a large number of major national and regional retailers. Some of the major national and regional companies that are tenants in the Company's shopping center properties include The Home Depot, TJX Companies, Wal-Mart, Sears Holdings,
Bed Bath & Beyond, Royal Ahold, Kohl’s, Best Buy,
Royal Ahold, CostcoPetsmart and
Bed Bath & Beyond.Costco.
A substantial portion of the Company's income consists of rent received under long-term leases. Most of the leases provide for the payment of fixed-base rentals monthly in advance and for the payment by tenants of an allocable share of the real estate taxes, insurance, utilities and common area maintenance expenses incurred in operating the shopping centers. Although many of the leases require the Company to make roof and structural repairs as needed, a number of tenant leases place that responsibility on the tenant, and the Company's standard small store lease provides for roof repairs to be reimbursed by the tenant as part of common area maintenance. The Company's management places a strong emphasis on sound construction and safety at its properties.
Minimum base rental revenues and operating expense reimbursements accounted for
approximately 97% and other revenues, including percentage rents, accounted for
approximately 3% of the Company's total revenues from rental property for the year ended December 31,
2011.2012. The Company's management believes that the base rent per leased square foot for many of the Company's existing leases is generally lower than the prevailing market-rate base rents in the geographic regions where the Company operates, reflecting the potential for future growth.
Approximately
16.3%15.4% of the Company's leases of consolidated properties also contain provisions requiring the payment of additional rent calculated as a percentage of tenants’ gross sales above predetermined thresholds. Percentage rents accounted for less than 1% of the Company's revenues from rental property for the year ended December 31,
2011.2012. Additionally, a majority of the Company’s leases have provisions requiring contractual rent increases. The Company’s leases may also include escalation clauses, which provide for increases based upon changes in the consumer price index or similar inflation indices.
As of December 31,
2011,2012, the Company’s consolidated
operating portfolio was
approximately 92.5%93.4% leased and was comprised of
approximately 61.558.9 million square feet of GLA, of which
approximately 58.655.1 million related to properties held in the U.S. and
2.73.8 million related to properties located in
Mexico.Latin America. For the period January 1,
20112012 to December 31,
2011,2012, the Company increased the average base rent per leased square foot,
which includes the impact of tenant concessions, in its U.S. consolidated portfolio of neighborhood and community shopping centers from
$11.20$11.48 to
$11.48,$12.18, an increase of
$0.28.$0.70. This increase primarily consists of (i) a
$0.09$0.16 increase relating to acquisitions, as well as development properties placed into service, (ii) a
$0.12$0.24 increase relating to new leases signed net of leases vacated and rent step-ups within the portfolio and (iii) a
$0.07$0.30 increase relating to dispositions or the transfer of properties to various joint venture entities. For the period January 1,
20112012 to December 31,
2011,2012, the Company’s average base rent per leased square foot in its Mexican consolidated portfolio of neighborhood and community shopping centers decreased from
$12.03$9.66 to
$9.66,$9.22, a decrease of
$2.37.$0.44. This decrease is primarily due to
a weaker Mexican Peso during the period (average exchange rate Mexican Pesos to U.S. dollar was 13.62higher vacancy levels at
December 31, 2011 versus 12.40 at January 1, 2011), the placement ofcertain development sites
placed into
service, which were included in occupancy in
2011,2012, and new leases signed net of leases vacated and renewals within the portfolio.
The
Company's management believes its experienceCompany has a total of 5,027 leases in the
real estate industryU.S. consolidated operating portfolio, of which 682 leases, comprising 3.7 million square feet of GLA, are scheduled to expire within the next 12 months, assuming available extension options are not exercised. These expiring leases have an average base rent per square foot of $13.99. The average rent per square foot on new U.S. leases signed during 2012 was $16.41. The Company will seek to obtain rents that are higher than these expiring leases, however, there are many variables and
its relationships with numerous national and regional tenants gives it an advantage in an industry where ownership is fragmented among a large number of property owners.uncertainties which can significantly affect the leasing market at any time; as such, the Company cannot guarantee that future leases will continue to be signed for rents that are equal to or higher than current amounts.
Ground-Leased Properties. The Company has interests in 4847 consolidated shopping center properties and interests in 2120 shopping center properties in unconsolidated joint ventures that are subject to long-term ground leases where a third party owns and has leased the underlying land to the Company (or an affiliated joint venture) to construct and/or operate a shopping center. The Company or the joint venture pays rent for the use of the land and generally is responsible for all costs and expenses associated with the building and improvements. At the end of these long-term leases, unless extended, the land together with all improvements revert to the landowner. More specific information with respect to each of the Company's property interests is set forth in Exhibit 99.1, which is incorporated herein by reference.
Item 3. Legal Proceedings
The Company is not presently involved in any litigation nor, to its knowledge, is any litigation threatened against the Company or its subsidiaries that, in management's opinion, would result in any material adverse effect on the Company's ownership, management or operation of its properties taken as a whole, or which is not covered by the Company's liability insurance.
On January 28, 2013, the Company received a subpoena from the Enforcement Division of the SEC in connection with an investigation, In the Matter of Wal-Mart Stores, Inc. (FW-3678), that the SEC Staff is currently conducting with respect to possible violations of the Foreign Corrupt Practices Act. The Company is responding to the subpoena and intends to cooperate fully with the SEC in this matter. The Company has also been notified that the U.S. Department of Justice (“DOJ”) is conducting a parallel investigation, and the Company expects that it will cooperate with the DOJ investigation. At this point, we are unable to predict the duration, scope or result of the SEC or DOJ investigation.
Item 4. Mine Safety Disclosures
11
Item 5. Market for the Registrant's Common Equity, Related Stockholder Matters and Issuer Purchases of Equity Securities
Market Information The following sets forth the There were no common stock offerings completed by the Company during the three-year period ended December 31, 2011. The Company’s common stock was sold for cash at the following offering price per share:2012.
| | |
Offering Date | | Offering Price |
April 2009 | $ | 7.10 |
December 2009 | $ | 12.50 |
The table below sets forth, for the quarterly periods indicated, the high and low sales prices per share reported on the NYSE Composite Tape and declared dividends per share for the Company’s common stock. The Company’s common stock is traded on the NYSE under the trading symbol "KIM".
| | | |
| Stock Price | |
Period | High | Low | Dividends |
2010: | | | |
First Quarter | $16.44 | $12.40 | $0.16 |
Second Quarter | $16.72 | $13.03 | $0.16 |
Third Quarter | $17.05 | $12.51 | $0.16 |
Fourth Quarter | $18.41 | $15.61 | $0.18 (a) |
| | | |
2011: | | | |
First Quarter | $19.50 | $16.98 | $0.18 |
Second Quarter | $19.80 | $17.01 | $0.18 |
Third Quarter | $20.31 | $14.54 | $0.18 |
Fourth Quarter | $17.93 | $13.55 | $0.19 (b) |
| | | Stock Price | | | | |
| Period | | High | | | Low | | | Dividends | |
| 2011: | | | | | | | | | |
| First Quarter | | $ | 19.50 | | | $ | 16.98 | | | $ | 0.18 | |
| Second Quarter | | $ | 19.80 | | | $ | 17.01 | | | $ | 0.18 | |
| Third Quarter | | $ | 20.31 | | | $ | 14.54 | | | $ | 0.18 | |
| Fourth Quarter | | $ | 17.93 | | | $ | 13.55 | | | $ | 0.19 | (a) |
| | | | | | | | | | | | | |
| 2012: | | | | | | | | | | | | |
| First Quarter | | $ | 19.90 | | | $ | 16.21 | | | $ | 0.19 | |
| Second Quarter | | $ | 19.96 | | | $ | 17.16 | | | $ | 0.19 | |
| Third Quarter | | $ | 21.16 | | | $ | 18.62 | | | $ | 0.19 | |
| Fourth Quarter | | $ | 20.95 | | | $ | 18.11 | | | $ | 0.21 | (b) |
(a)
Paid on January 18, 2011, to stockholders of record on January 3, 2011.
(b)
Paid on January 17, 2012, to stockholders of record on January 4, 2012.
| (a) | Paid on January 17, 2012, to stockholders of record on January 4, 2012. |
| (b) | Paid on January 15, 2013, to stockholders of record on January 2, 2013. |
Holders The number of holders of record of the Company's common stock, par value $0.01 per share, was 2,9812,815 as of January 31, 2012.2013.
Dividends Since the IPO, the Company has paid regular quarterly cash dividends to its stockholders. While the Company intends to continue paying regular quarterly cash dividends, future dividend declarations will be paid at the discretion of the Board of Directors and will depend on the actual cash flows of the Company, its financial condition, capital requirements, the annual distribution requirements under the REIT provisions of the Code and such other factors as the Board of Directors deems relevant. The Company’s Board of Directors will continue to evaluate the Company’s dividend policy on a quarterly basis as they monitor sources of capital and evaluate the impact of the economy on operating fundamentals. The Company is required by the Code to distribute at least 90% of its REIT taxable income. The actual cash flow available to pay dividends will be affected by a number of factors, including the revenues received from rental properties, the operating expenses of the Company, the interest expense on its borrowings, the ability of lessees to meet their obligations to the Company, the ability to refinance near-term debt maturities and any unanticipated capital expenditures. The Company has determined that the
$0.76 dividend per common share paid during 2012 represented 72% ordinary income, a 23% return of capital and 5% capital gain to its stockholders. The $0.72 dividend per common share paid during 2011 represented 71% ordinary income and a 29% return of capital to its stockholders.
The $0.64 dividend per common share paid during 2010 represented 70% ordinary income and a 30% return of capital to its stockholders.In addition to its common stock offerings, the Company has capitalized the growth in its business through the issuance of unsecured fixed and floating-rate medium-term notes, underwritten bonds, mortgage debt and construction loans, convertible preferred stock and perpetual preferred stock. Borrowings under the Company's revolving credit facility have also been an interim source of funds to both finance the purchase of properties and other investments and meet any short-term working capital requirements. The various instruments governing the Company's issuance of its unsecured public debt, bank debt, mortgage debt and preferred stock impose certain restrictions on the Company with regard to dividends, voting, liquidation and other preferential rights available to the holders of such instruments. See "Management's Discussion and Analysis of Financial Condition and Results of Operations" and Footnotes 13, 14
15 and
1917 of the Notes to Consolidated Financial Statements included in this Form 10-K.
The Company does not believe that the preferential rights available to the holders of its Class
FH Preferred Stock, Class
GI Preferred Stock, Class J Preferred Stock and Class
HK Preferred Stock, the financial covenants contained in its public bond indentures, as amended, or its revolving credit agreements will have an adverse impact on the Company's ability to pay dividends in the normal course to its common stockholders or to distribute amounts necessary to maintain its qualification as a REIT.
The Company maintains a dividend reinvestment and direct stock purchase plan (the "Plan") pursuant to which common and preferred stockholders and other interested investors may elect to automatically reinvest their dividends to purchase shares of the Company’s common stock or, through optional cash payments, purchase shares of the Company’s common stock. The Company may, from time-to-time, either (i) purchase shares of its common stock in the open market or (ii) issue new shares of its common stock for the purpose of fulfilling its obligations under the Plan.
Issuer Purchases of Equity Securities During the year ended December 31, 2011,2012, the Company repurchased 333,9981,635,823 shares in open-market transactions to offset new issuances of common shares in connection with the exercise of stock options. The Company expended approximately $6.0$30.9 million to repurchase these shares, of which $4.9$22.6 million was provided to the Company from stock options exercised. | Period | | Total Number of Shares Purchased | | | Average Price Paid per Share ($) | | | Total Number of Shares Purchased as Part of Publicly Announced Plans or Programs | | | Approximate Dollar Value of Shares that May Yet Be Purchased Under the Plans or Programs (in millions) | |
| January 1, 2012 –-January 31, 2012 | | | 20,233 | | | | 18.20 | | | | - | | | | - | |
| February 1, 2012 – February 29, 2012 | | | 358,908 | | | | 18.56 | | | | - | | | | - | |
| March 1, 2012 – March 31, 2012 | | | 1,005,934 | | | | 18.91 | | | | - | | | | - | |
| April 1, 2012 – April 30, 2012 | | | 41,138 | | | | 19.23 | | | | - | | | | - | |
| May 1, 2012 - May 31, 2012 | | | 61,211 | | | | 19.20 | | | | - | | | | - | |
| June 1, 2012 - June 30, 2012 | | | 48,327 | | | | 18.44 | | | | - | | | | - | |
| July 1, 2012 - July 31, 2012 | | | - | | | | - | | | | - | | | | - | |
| August 1, 2012 - August 31, 2012 | | | 100,072 | | | | 19.84 | | | | - | | | | - | |
| September 1, 2012 - December 31, 2012 | | | - | | | | - | | | | - | | | | - | |
| Total | | | 1,635,823 | | | | 18.92 | | | | - | | | $ | - | |
| | | | | | | | | |
Period | | Total Number of Shares Purchased | | Average Price Paid per Share | | Total Number of Shares Purchased as Part of Publicly Announced Plans or Programs | | Approximate Dollar Value of Shares that May Yet Be Purchased Under the Plans or Programs (in millions) |
| May 9, 2011 - May 31, 2011 | | 63,621 | $ | 19.15 | | - | $ | - |
| June 1, 2011 - June 30, 2011 | | 10,312 | $ | 18.85 | | - | | - |
| July 1, 2011 - July 31, 2011 | | 77,392 | $ | 19.60 | | - | | - |
| August 1, 2011 - August 31, 2011 | | 42,051 | $ | 16.92 | | - | | - |
| September 1, 2011 - September 30, 2011 | | 20,225 | $ | 16.50 | | - | | - |
| October 1, 2011 - October 31, 2011 | | 52,420 | $ | 17.21 | | - | | - |
| November 1, 2011 - November 30, 2011 | | 13,252 | $ | 17.02 | | - | | - |
| December 1, 2011 - December 31, 2011 | | 54,725 | $ | 16.28 | | - | | - |
| Total | | 333,998 | $ | 17.94 | | - | $ | - |
Total Stockholder Return Performance The following performance chart compares, over the five years ended December 31, 2011,2012, the cumulative total stockholder return on the Company’s common stock with the cumulative total return of the S&P 500 Index and the cumulative total return of the NAREIT Equity REIT Total Return Index (the "NAREIT Equity Index") prepared and published by the National Association of Real Estate Investment Trusts ("NAREIT"). Equity real estate investment trusts are defined as those which derive more than 75% of their income from equity investments in real estate assets. The NAREIT Equity Index includes all tax qualified equity real estate investment trusts listed on the New York Stock Exchange, American Stock Exchange or the NASDAQ National Market System. Stockholder return performance, presented quarterly for the five years ended December 31, 2011,2012, is not necessarily indicative of future results. All stockholder return performance assumes the reinvestment of dividends. The information in this paragraph and the following performance chart are deemed to be furnished, not filed.
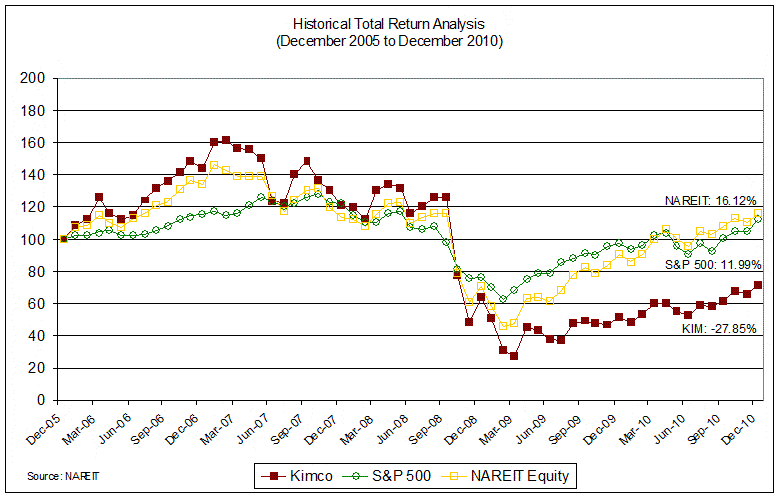
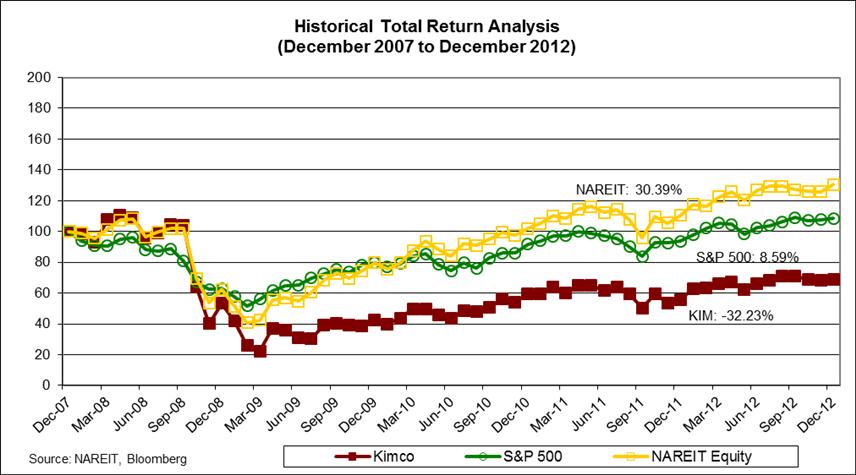
13
Item 6. Selected Financial Data
The following table sets forth selected, historical, consolidated financial data for the Company and should be read in conjunction with the Consolidated Financial Statements of the Company and Notes thereto and Management’s Discussion and Analysis of Financial Condition and Results of Operations included in this Form 10-K.
The Company believes that the book value of its real estate assets, which reflects the historical costs of such real estate assets less accumulated depreciation, is not indicative of the current market value of its properties. Historical operating results are not necessarily indicative of future operating performance.
| | | | | | | | | | | | | | | | | | |
| | Year ended December 31, (2) |
| | 2011 | | 2010 | | 2009 | | 2008 | | 2007 |
| | (in thousands, except per share information) |
Operating Data: | | | | | | | | | | |
Revenues from rental property (1) | $ | 873,694 | $ | 831,207 | $ | 755,446 | $ | 737,117 | $ | 654,658 |
Interest expense (3) | $ | 225,035 | $ | 226,102 | $ | 207,768 | $ | 211,935 | $ | 212,162 |
Early extinguishment of debt charges | $ | - | $ | 10,811 | $ | - | $ | - | $ | - |
Depreciation and amortization (3) | $ | 247,549 | $ | 232,835 | $ | 221,750 | $ | 200,646 | $ | 183,997 |
Gain on sale of development properties | $ | 12,074 | $ | 2,130 | $ | 5,751 | $ | 36,565 | $ | 40,099 |
Total net gain on transfer or sale of operating properties (3) | $ | 108 | $ | 2,377 | $ | 3,867 | $ | 1,782 | $ | 2,708 |
Benefit for income taxes (4) | $ | - | $ | - | $ | 20,061 | $ | 11,645 | $ | 20,242 |
Provision for income taxes (5) | $ | 19,537 | $ | 3,228 | $ | - | $ | - | $ | - |
Impairment charges (6) | $ | 15,877 | $ | 32,661 | $ | 149,088 | $ | 147,529 | $ | 13,796 |
Income/(loss) from continuing operations (7) | $ | 164,956 | $ | 126,025 | $ | (1,926) | $ | 218,218 | $ | 343,830 |
Income/(loss) per common share, from continuing operations: | | | | | | | | | | |
Basic | $ | 0.26 | $ | 0.18 | $ | (0.14) | $ | 0.66 | $ | 1.29 |
Diluted | $ | 0.26 | $ | 0.18 | $ | (0.14) | $ | 0.66 | $ | 1.26 |
Weighted average number of shares of common stock: | | | | | | | | | | |
Basic | | 406,530 | | 405,827 | | 350,077 | | 257,811 | | 252,129 |
Diluted | | 407,669 | | 406,201 | | 350,077 | | 258,843 | | 257,058 |
Cash dividends declared per common share | $ | 0.73 | $ | 0.66 | $ | 0.72 | $ | 1.68 | $ | 1.52 |
| | | Year ended December 31, (2) | |
| | | 2012 | | | 2011 | | | 2010 | | | 2009 | | | 2008 | |
| | | (in thousands, except per share information) | |
| Operating Data: | | | | | | | | | | | | | | | |
| Revenues from rental property (1) | | $ | 884,782 | | | $ | 825,737 | | | $ | 786,940 | | | $ | 703,348 | | | $ | 679,966 | |
| Interest expense (3) | | $ | 227,595 | | | $ | 223,526 | | | $ | 223,032 | | | $ | 205,490 | | | $ | 209,189 | |
| Early extinguishment of debt charges | | $ | - | | | $ | - | | | $ | 10,811 | | | $ | - | | | $ | - | |
| Depreciation and amortization (3) | | $ | 249,493 | | | $ | 231,712 | | | $ | 217,205 | | | $ | 209,055 | | | $ | 187,762 | |
| Gain on sale of development properties | | $ | - | | | $ | 12,074 | | | $ | 2,080 | | | $ | 5,751 | | | $ | 36,565 | |
| Total net gain on transfer or sale of operating properties (3) | | $ | 4,299 | | | $ | 108 | | | $ | 2,377 | | | $ | 3,867 | | | $ | 1,782 | |
| Benefit for income taxes (4) | | $ | - | | | $ | - | | | $ | - | | | $ | 16,400 | | | $ | 9,550 | |
| Provision for income taxes (5) | | $ | 8,116 | | | $ | 21,330 | | | $ | 3,208 | | | $ | - | | | $ | - | |
| Impairment charges (6) | | $ | 37,111 | | | $ | 13,077 | | | $ | 32,661 | | | $ | 135,688 | | | $ | 147,529 | |
| Income from continuing operations (7) | | $ | 203,806 | | | $ | 147,430 | | | $ | 109,004 | | | $ | (12,151 | ) | | $ | 194,237 | |
| Income/(loss) per common share, from continuing operations: | | | | | | | | | | | | | | | | | | | | |
| Basic | | $ | 0.27 | | | $ | 0.22 | | | $ | 0.14 | | | $ | (0.17 | ) | | $ | 0.57 | |
| Diluted | | $ | 0.27 | | | $ | 0.21 | | | $ | 0.14 | | | $ | (0.17 | ) | | $ | 0.57 | |
| Weighted average number of shares of common stock: | | | | | | | | | | | | | | | | | | | | |
| Basic | | | 405,997 | | | | 406,530 | | | | 405,827 | | | | 350,077 | | | | 257,811 | |
| Diluted | | | 406,689 | | | | 407,669 | | | | 406,201 | | | | 350,077 | | | | 258,843 | |
| Cash dividends declared per common share | | $ | 0.78 | | | $ | 0.73 | | | $ | 0.66 | | | $ | 0.72 | | | $ | 1.68 | |
| | | | | | | | | | |
| | December 31, |
| | 2011 | | 2010 | | 2009 | | 2008 | | 2007 |
| | (in thousands) |
Balance Sheet Data: | | | | | | | | | | |
Real estate, before accumulated depreciation | $ | 8,777,985 | $ | 8,592,760 | $ | 8,882,341 | $ | 7,818,916 | $ | 7,325,035 |
Total assets | $ | 9,614,516 | $ | 9,833,875 | $ | 10,183,079 | $ | 9,397,147 | $ | 9,097,816 |
Total debt | $ | 4,114,385 | $ | 4,058,987 | $ | 4,434,383 | $ | 4,556,646 | $ | 4,216,415 |
Total stockholders' equity | $ | 4,686,386 | $ | 4,935,842 | $ | 4,852,973 | $ | 3,983,698 | $ | 3,894,225 |
| | | | | | | | | | |
Cash flow provided by operations | $ | 448,613 | $ | 479,935 | $ | 403,582 | $ | 567,599 | $ | 665,989 |
Cash flow (used for)/provided by investing activities | $ | (20,760) | $ | 37,904 | $ | (343,236) | $ | (781,350) | $ | (1,507,611) |
Cash flow (used for)/provided by financing activities | $ | (440,125) | $ | (514,743) | $ | (74,465) | $ | 262,429 | $ | 584,056 |
| | | December 31, | |
| | | 2012 | | | 2011 | | | 2010 | | | 2009 | | | 2008 | |
| | | (in thousands) | |
| Balance Sheet Data: | | | | | | | | | | | | | | | |
| Real estate, before accumulated depreciation | | $ | 8,947,287 | | | $ | 8,771,257 | | | $ | 8,592,760 | | | $ | 8,882,341 | | | $ | 7,818,916 | |
| Total assets | | $ | 9,740,807 | | | $ | 9,628,762 | | | $ | 9,833,875 | | | $ | 10,183,079 | | | $ | 9,397,147 | |
| Total debt | | $ | 4,195,317 | | | $ | 4,114,385 | | | $ | 4,058,987 | | | $ | 4,434,383 | | | $ | 4,556,646 | |
| Total stockholders' equity | | $ | 4,765,160 | | | $ | 4,686,386 | | | $ | 4,935,842 | | | $ | 4,852,973 | | | $ | 3,983,698 | |
| | | | | | | | | | | | | | | | | | | | | |
| Cash flow provided by operations | | $ | 479,054 | | | $ | 448,613 | | | $ | 479,935 | | | $ | 403,582 | | | $ | 567,599 | |
| Cash flow (used for)/provided by investing activities | | $ | (51,000 | ) | | $ | (20,760 | ) | | $ | 37,904 | | | $ | (343,236 | ) | | $ | (781,350 | ) |
| Cash flow (used for)/provided by financing activities | | $ | (399,061 | ) | | $ | (440,125 | ) | | $ | (514,743 | ) | | $ | (74,465 | ) | | $ | 262,429 | |
(1) Does not include (i) revenues from rental property relating to unconsolidated joint ventures, (ii) revenues relating to the investment in retail store leases and (iii) revenues from properties included in discontinued operations.
(2) All years have been adjusted to reflect the impact of operating properties sold during the years ended December 31, 2011, 2010, 2009, 2008 and 2007 and properties classified as held for sale as of December 31, 2011, which are reflected in discontinued operations in the Consolidated Statements of Operations.
(3) Does not include amounts reflected in discontinued operations.
(4) Does not include amounts reflected in discontinued operations and extraordinary gain. Amounts include income taxes related to gain on transfer/sale of operating properties.
(5) Does not include amounts reflected in discontinued operations. Amounts include income taxes related to gain on transfer/sale of operating properties.
(6) Amounts exclude noncontrolling interests and amounts reflected in discontinued operations.
(7) Amounts include gain on transfer/sale of operating properties, net of tax and net income attributable to noncontrolling interests.
| (1) | Does not include (i) revenues from rental property relating to unconsolidated joint ventures, (ii) revenues relating to the investment in retail store leases and (iii) revenues from properties included in discontinued operations. |
| (2) | All years have been adjusted to reflect the impact of operating properties sold during the years ended December 31, 2012, 2011, 2010, 2009 and 2008 and properties classified as held for sale as of December 31, 2012, which are reflected in discontinued operations in the Consolidated Statements of Income. |
| (3) | Does not include amounts reflected in discontinued operations. |
| (4) | Does not include amounts reflected in discontinued operations and extraordinary gain. Amounts include income taxes related to gain on transfer/sale of operating properties. |
| (5) | Does not include amounts reflected in discontinued operations. Amounts include income taxes related to gain on transfer/sale of operating properties. |
| (6) | Amounts exclude noncontrolling interests and amounts reflected in discontinued operations. |
| (7) | Amounts include gain on transfer/sale of operating properties, net of tax and net income attributable to noncontrolling interests. |
Item 7. Management's Discussion and Analysis of Financial Condition and Results of Operations
The following discussion should be read in conjunction with the Consolidated Financial Statements and Notes thereto included in this Form 10-K. Historical results and percentage relationships set forth in the Consolidated Statements of
OperationsIncome contained in the Consolidated Financial Statements, including trends which might appear, should not be taken as indicative of future operations.
Kimco Realty Corporation is one of the nation’s largest publicly-traded owners and operators of neighborhood and community shopping centers. As of December 31,
2011,2012, the Company had interests in
946896 shopping center properties (the “Combined Shopping Center Portfolio”), aggregating
138.1131.3 million square feet of gross leasable area (“GLA”) and
845829 other property interests, primarily through the Company’s preferred equity investments, other real estate investments and non-retail properties, totaling
approximately 34.126.6 million square feet of GLA, for a grand total of
1,7911,725 properties aggregating
172.2157.9 million square feet of GLA, located in 44 states, Puerto Rico, Canada, Mexico, Chile, Brazil and Peru.
The Company is self-administered and self-managed through present management, which has owned and managed neighborhood and community shopping centers for over 50 years.
The executive officers are engaged in the day-to-day management and operation of real estate exclusively with the Company, with nearly all operating functions, including leasing, asset management, maintenance, construction, legal, finance and accounting, administered by the Company.
The Company’s vision is to be the premier owner and operator of shopping centers with its core business operations focusing on owning and operating neighborhood and community shopping centers through investments in North America. This vision will entailhas entailed a shift away from non-retail assets that the Company currently holds. These investments include non-retail preferred equity investments, marketable securities, mortgages on non-retail properties and several urban mixed-use properties. The Company’s plan is to sellCompany has been actively selling its non-retail assets and investments. As of December 31, 2012, these investments realizing thathad a book value of $398.4 million, which represents less than 3.5% of the saleCompany’s total assets, before depreciation. In addition, the Company has an active capital recycling program of theseselling retail assets will be over a period of time given the current market conditions.deemed non-strategic. If the Company accepts sales prices for these non-retail and/or non-strategic assets that are less than their net carrying values, the Company would be required to take impairment charges. In order to execute the Company’s vision, the Company’s strategy is to continue to strengthen its balance sheet by pursuing deleveraging efforts over time, providing it the necessary flexibility to invest opportunistically and selectively, primarily focusing on neighborhood and community shopping centers. In addition, the Company continues to be committed to broadening itshas an institutional management business by forming joint ventures with high quality domestic and foreign institutional partners for the purpose of investing in neighborhood and community shopping centers. The following highlights the Company’s significant transactions, events and results that occurred during the year ended December 31,
2011:2012:
·
Occupancy rose from 93.0% at December 31, 2010 to 93.3% at December 31, 2011 in the Combined Shopping CenterPortfolio.
·
Occupancy rose from 92.4% at December 31, 2010 to 93.1% at December 31, 2011 for the U.S. combined shopping center.
·
Executed 2,474 leases, renewals and options totaling over 8.0 million square feet in the Combined Shopping Center Portfolio.
| · | Net income available to common shareholders increased by $63.0 million to $172.7 million for the year ended December 31, 2012, as compared to $109.7 million for the corresponding period in 2011. |
| · | Funds from operations (“FFO”) as adjusted increased from $1.20 for the year ended December 31, 2011 to $1.26 for the year ended December 31, 2012 (see additional disclosure on FFO beginning on page 31). |
| · | Same Property net operating income (“NOI”) increased by $18.8 million or 2.3% for the year ended December 31, 2012, as compared to the corresponding period in 2011; excluding the negative impact of foreign currency fluctuation, this increase would have been $23.6 million or 2.9% (see additional disclosure on NOI beginning on page 32). |
| · | Occupancy rose from 93.3% at December 31, 2011 to 94.0% at December 31, 2012 in the Combined Shopping Center Portfolio. |
| · | Occupancy rose from 93.1% at December 31, 2011 to 93.9% at December 31, 2012 for the U.S. combined shopping center portfolio. |
| · | Recognized U.S. cash-basis leasing spreads of 9.8%; new leases increased 27.8% and renewals/options increased 4.5%. |
| · | Executed 2,678 leases, renewals and options totaling over 10.0 million square feet in the Combined Shopping Center Portfolio. |
·
Acquired 19 shopping center properties, an outparcel and one land parcel comprising an aggregate 2.5 million square feet of GLA, for an aggregate purchase price of approximately $374.6 million including the assumption of approximately $117.9 million of non-recourse mortgage debt encumbering 12 of the properties.
| · | Acquired 24 shopping center properties, five outparcels and 69 net leased parcels comprising an aggregate 3.1 million square feet of GLA, for an aggregate purchase price of $634.5 million including the assumption of $179.2 million of non-recourse mortgage debt encumbering seven of the properties. |
·
During 2011, the Company monetized non-retail assets of approximately $295.4 million and reduced its non-retail book values by approximately $286.6 million to approximately $512 million, which represents less than 5.4% of total assets.
·
Included in the monetization above are the disposition of (i) four properties and one land parcel, in separate transactions, for an aggregate sales price of approximately $15.1 million and (ii) one property from a consolidated joint venture in which the Company had a preferred equity investment for a sales price of approximately $6.1 million. These transactions resulted in aggregate impairment charges of $4.4 million and a profit participation of approximately $1.4 million, before income tax benefit of approximately $1.4 million.
·
Also included in the monetization above is (i) the Company’s receipt of approximately $13.9 million in distributions from the Albertson’s joint venture, in which the Company recognized approximately $13.9 million, before income tax, of equity in income, (ii) the Company’s receipt of approximately $49.3 million in distributions from two preferred equity investments, in which the Company recognized in aggregate approximately $10.6 million of equity in income and (iii) the Company’s sale of various marketable securities for an aggregate sales price of approximately $198.2 million.
15
| · | During 2012, the Company monetized non-retail assets of $83.0 million and reduced its non-retail book values by $114.1 million to $398.4 million. |
| · | Included in the monetization above are the disposition of four properties and one land parcel, in separate transactions, for an aggregate sales price of $40.3 million. These transactions resulted in an aggregate net gain of $4.8 million, before income taxes. |
| · | Also included in the monetization above is (i) the receipt of $24.8 million from payment of mortgage receivables, (ii) the Company’s receipt of $14.6 million in distributions from two preferred equity investments and one joint venture investment and (iii) $10.4 million in distributions from two cost method investments. |
| · | Additionally, during 2012, the Company disposed of 59 operating properties, four land parcels and four outparcels, in separate transactions, for an aggregate sales price of $443.0 million. These transactions resulted in an aggregate gain of $91.5 million and impairment charges of $22.5 million, before income taxes and noncontrolling interests. |
16
·
Additionally, during 2011, the Company disposed of, in separate transactions, 23 operating properties, one development property and an outparcel for an aggregate sales price of approximately $113.4 million which resulted in an aggregate gain of approximately $17.3 million and aggregate impairment charges of approximately $13.5 million, before income tax benefit and noncontrolling interest.
·
Also during 2011, the Company transferred an operating property and a merchant building property for an aggregate sales price of approximately $61.5 million to a newly formed unconsolidated joint venture in which the Company has a noncontrolling interest. This transaction resulted in an aggregate gain of approximately $14.6 million, of which the Company deferred approximately $2.2 million due to its continued involvement.
Capital Activity (for additional details see Liquidity and Capital Resources below):
·
Established a new $1.75 billion unsecured revolving credit facility with a group of banks, which is scheduled to expire in October 2015 and has a one-year extension.
| · | During 2012, the Company issued 16,000,000 depositary shares of 6.00% Class I Cumulative Redeemable Preferred Stock, 9,000,000 depositary shares of 5.50% Class J Cumulative Redeemable Preferred Stock and 7,000,000 depositary shares of 5.625% Class K Cumulative Redeemable Preferred Stock resulting in aggregate proceeds after expenses of $774.1 million to the Company. |
| · | Additionally, during 2012, the Company redeemed all of its outstanding 18,400,000 depositary shares of the Company’s 7.75% Class G Cumulative Redeemable Preferred Stock and all of its outstanding 7,000,000 depositary shares of the Company’s 6.65% Class F Cumulative Redeemable Preferred Stock resulting in aggregate payments of $635.0 million. |
| · | Also during 2012, the Company (i) repaid the $17.0 million outstanding on its 5.98% medium-term notes, which matured in July 2012 and (ii) repaid the $198.9 million outstanding on its 6.00% senior unsecured note, which matured in November 2012. |
| · | The Company also obtained a new $400.0 million unsecured term loan with a consortium of banks, which accrues interest at LIBOR plus 105 basis points. The term loan is scheduled to mature in April 2014, with three additional one-year options to extend the maturity date, at the Company’s discretion, to April 17, 2017. |
·
The U.S. economic and market conditions stabilized throughout 2011 and capitalization rates, discount rates and vacancies had improved; however, overall declines in market conditions continued to have a negative effect on certain transactional activity as it related to select real estate assets and certain marketable securities. As such, the Company recognized impairment charges of approximately $32.8 million (including approximately $16.9 million which is classified within discontinued operations), before income taxes and noncontrolling interests, relating to adjustments to property carrying values, investments in other real estate joint ventures, investments in real estate joint ventures and marketable securities and other investments. Potential future adverse market and economic conditions could cause the Company to recognize additional impairments in the future (see Footnote 2 of the Notes to Consolidated Financial Statements included in this annual report on Form 10-K).
·
In addition to the impairment charges above, various unconsolidated joint ventures in which the Company holds noncontrolling interests recognized impairment charges relating to certain properties during 2011. The Company’s share of these charges was approximately $14.1 million, before income taxes (see Footnotes 2, 8 and 9 of the Notes to Consolidated Financial Statements included in this annual report on Form 10-K).
| · | Real estate market conditions, including capitalization rates, discount rates and vacancies had continued to improve throughout 2012; however, declines in certain real estate markets continued to have a negative effect on transactional activity as it related to dispositions of select real estate assets. This factor, in addition to the Company’s efforts to market certain assets and management’s assessment as to the likelihood and timing of such potential transactions caused the Company to recognize impairment charges of $59.6 million (including $22.5 million which is classified within discontinued operations), before income tax benefit and noncontrolling interests. Potential future adverse market and economic conditions could cause the Company to recognize additional impairments in the future (see Footnote 2 of the Notes to Consolidated Financial Statements included in this annual report on Form 10-K). |
| · | In addition to the impairment charges above, various unconsolidated joint ventures in which the Company holds noncontrolling interests recognized impairment charges relating to certain properties during 2012. The Company’s share of these charges was $11.1 million, before income taxes (see Footnotes 2 and 8 of the Notes to Consolidated Financial Statements included in this annual report on Form 10-K). |
Critical Accounting Policies
The Consolidated Financial Statements of the Company include the accounts of the Company, its wholly-owned subsidiaries and all entities in which the Company has a controlling interest, including where the Company has been determined to be a primary beneficiary of a variable interest entity in accordance with the consolidation guidance of the Financial Accounting Standards Board’s (“FASB”) Accounting Standards Codification (“ASC”). The Company applies these provisions to each of its joint venture investments to determine whether the cost, equity or consolidation method of accounting is appropriate. The preparation of financial statements in conformity with accounting principles generally accepted in the United States requires management to make estimates and assumptions in certain circumstances that affect amounts reported in the accompanying Consolidated Financial Statements and related notes. In preparing these financial statements, management has made its best estimates and assumptions that affect the reported amounts of assets and liabilities. These estimates are based on, but not limited to, historical results, industry standards and current economic conditions, giving due consideration to materiality. The most significant assumptions and estimates relate to revenue recognition and the recoverability of trade accounts receivable, depreciable lives, valuation of real estate and intangible assets and liabilities, valuation of joint venture investments
marketable securities and other investments, realizability of deferred tax assets and uncertain tax positions. Application of these assumptions requires the exercise of judgment as to future uncertainties, and, as a result, actual results could materially differ from these estimates.
The Company is required to make subjective assessments as to whether there are impairments in the value of its real estate properties, investments in joint ventures, marketable securities and other investments. The Company’s reported net earnings are directly affected by management’s estimate of impairments and/or valuation allowances.
Revenue Recognition and Accounts Receivable
Base rental revenues from rental property are recognized on a straight-line basis over the terms of the related leases. Certain of these leases also provide for percentage rents based upon the level of sales achieved by the lessee. These percentage rents are recorded once the required sales level is achieved. Operating expense reimbursements are recognized as earned. Rental income may also include payments received in connection with lease termination agreements. In addition, leases typically provide for reimbursement to the Company of common area maintenance, real estate taxes and other operating expenses.
The Company makes estimates of the uncollectability of its accounts receivable related to base rents, straight-line rent, expense reimbursements and other revenues. The Company analyzes accounts receivable and historical bad debt levels, customer credit-worthiness and current economic trends when evaluating the adequacy of the allowance for doubtful accounts. In addition, tenants in bankruptcy are analyzed and estimates are made in connection with the expected recovery of pre-petition and post-petition claims. The Company’s reported net earnings are directly affected by management’s estimate of the collectability of accounts receivable.
The Company’s investments in real estate properties are stated at cost, less accumulated depreciation and amortization. Expenditures for maintenance and repairs are charged to operations as incurred. Significant renovations and replacements, which improve and extend the life of the asset, are capitalized.
Upon acquisition of real estate operating properties, the Company estimates the fair value of acquired tangible assets (consisting of land, building, building improvements and tenant improvements) and identified intangible assets and liabilities (consisting of above and below-market leases, in-place leases and tenant relationships), assumed debt and redeemable units issued at the date of acquisition, based on evaluation of information and estimates available at that date. Based on these estimates, the Company allocates the estimated fair value to the applicable assets and liabilities. Fair value is determined based on an exit price approach, which contemplates the price that would be received to sell an asset or paid to transfer a liability in an orderly transaction between market participants at the measurement date. If, up to one year from the acquisition date, information regarding fair value of the assets acquired and liabilities assumed is received and estimates are refined, appropriate adjustments are made to the purchase price allocation on a retrospective basis. The Company expenses transaction costs associated with business combinations in the period incurred.
Depreciation and amortization are provided on the straight-line method over the estimated useful lives of the assets, as follows:
| | |
Buildings and building improvements | | 15 to 50 years |
Fixtures, leasehold and tenant improvements (including certain identified intangible assets) | | Terms of leases or useful |
(including certain identified intangible assets)
| | lives, whichever is shorter |
The Company is required to make subjective assessments as to the useful lives of its properties for purposes of determining the amount of depreciation to reflect on an annual basis with respect to those properties. These assessments have a direct impact on the Company’s net earnings.
Real estate under development on the Company’s Consolidated Balance Sheets represents ground-up development of neighborhood and community shopping center projects which may be subsequently sold upon completion or which the Company may hold as long-term investments. These assets are carried at cost. The cost of land and buildings under development includes specifically identifiable costs. The capitalized costs include pre-construction costs essential to the development of the property, development costs, construction costs, interest costs, real estate taxes, salaries and related costs of personnel directly involved and other costs incurred during the period of development. The Company ceases cost capitalization when the property is held available for occupancy upon substantial completion of tenant improvements, but no later than one year from the completion of major construction activity. A gain on the sale of these assets is generally recognized using the full accrual method in accordance with the provisions of the FASB’s real estate sales guidance provided that various criteria relating to terms of the sale and subsequent involvement by the Company with the property are met.
On a continuous basis, management assesses whether there are any indicators, including property operating performance and general market conditions, that the value of the real estate properties (including any related amortizable intangible assets or liabilities) may be impaired. A property value is considered impaired only if management’s estimate of current and projected operating cash flows (undiscounted and unleveraged) of the property over its remaining useful life is less than the net carrying value of the property. Such cash flow projections consider factors such as expected future operating income, trends and prospects, as well as the effects of demand, competition and other factors. To the extent impairment has occurred, the carrying value of the property would be adjusted to reflect the estimated fair value of the property.
When a real estate asset is identified by management as held-for-sale, the Company ceases depreciation of the asset and estimates the sales price of such asset net of selling costs. If, in management’s opinion, the net sales price of the asset is less than the net book value of such asset, an adjustment to the carrying value would be recorded to reflect the estimated fair value of the property.
Investments in Unconsolidated Joint Ventures
The Company accounts for its investments in unconsolidated joint ventures under the equity method of accounting as the Company exercises significant influence, but does not control, these entities. These investments are recorded initially at cost and are subsequently adjusted for cash contributions and distributions. Earnings for each investment are recognized in accordance with each respective investment agreement and, where applicable, are based upon an allocation of the investment’s net assets at book value as if the investment was hypothetically liquidated at the end of each reporting period.
The Company’s joint ventures and other real estate investments primarily consist of co-investments with institutional and other joint venture partners in neighborhood and community shopping center properties, consistent with its core business. These joint ventures typically obtain non-recourse third-party financing on their property investments, thus contractually limiting the Company’s exposure to losses to the amount of its equity investment, and, due to the lender’s exposure to losses, a lender typically will require a minimum level of equity in order to mitigate its risk. The Company’s exposure to losses associated with its unconsolidated joint ventures is primarily limited to its carrying value in these investments. The Company, on a limited selective basis, obtained unsecured financing for certain joint ventures. These unsecured financings are guaranteed by the Company with guarantees from the joint venture partners for their proportionate amounts of any guaranty payment the Company is obligated to make.
On a continuous basis, management assesses whether there are any indicators, including property operating performance and general market conditions, that the value of the Company’s investments in unconsolidated joint ventures may be impaired. An investment’s value is impaired only if management’s estimate of the fair value of the investment is less than the carrying value of the investment and such difference is deemed to be other-than-temporary. To the extent impairment has occurred, the loss shall be measured as the excess of the carrying amount of the investment over the estimated fair value of the investment.
The Company’s estimated fair values are based upon a discounted cash flow model for each specific property that includes all estimated cash inflows and outflows over a specified holding period and, where applicable, any estimated debt premiums. Capitalization rates, discount rates and credit spreads utilized in these models are based upon rates that the Company believes to be within a reasonable range of current market rates for each respective property.
Marketable Securities
The Company classifies its marketable equity securities as available-for-sale in accordance with the FASB’s Investments-Debt and Equity Securities guidance. These securities are carried at fair market value with unrealized gains and losses reported in stockholders’ equity as a component of Accumulated other comprehensive income (“OCI”). Gains or losses on securities sold are based on the specific identification method.
All debt securities are generally classified as held-to-maturity because the Company has the positive intent and ability to hold the securities to maturity. Held-to-maturity securities are stated at amortized cost, adjusted for any amortization of premiums and accretion of discounts to maturity. Debt securities which contain conversion features are generally classified as available-for-sale. These securities are carried at fair market value with unrealized gains and losses reported in stockholders’ equity as a component of OCI.
On a continuous basis, management assesses whether there are any indicators that the value of the Company’s marketable securities may be impaired. A marketable security is impaired if the fair value of the security is less than the carrying value of the security and such difference is deemed to be other-than-temporary. To the extent impairment has occurred, the loss shall be measured as the excess of the carrying amount of the security over the estimated fair value in the security.
Realizability of Deferred Tax Assets and Uncertain Tax Positions
The Company is subject to federal, state and local income taxes on the income from its activities relating to its TRS activities and subject to local taxes on certain non-U.S. investments. The Company accounts for income taxes using the asset and liability method, which requires that deferred tax assets and liabilities be recognized based on future tax consequences of temporary differences between the financial statement carrying amounts of existing assets and liabilities and their respective tax bases. Deferred tax assets and liabilities are measured using enacted tax rates expected to apply in the years in which temporary differences are expected to be recovered or settled. The effect on deferred tax assets and liabilities of a change in tax rates is recognized in earnings in the period when the changes are enacted.
A reduction of the carrying amounts of deferred tax assets by a valuation allowance is required, if based on the evidence available, it is more likely than not (a likelihood of more than 50 percent) that some portion or all of the deferred tax assets will not be realized. The valuation allowance should be sufficient to reduce the deferred tax asset to the amount that is more likely than not to be realized.
The Company considers all available evidence, both positive and negative, to determine whether, based on the weight of that evidence, a valuation allowance is needed. Information about an enterprise's current financial position and its results of operations for the current and preceding years is supplemented by all currently available information about future years.
The Company must use judgment in considering the relative impact of negative and positive evidence. The weight given to the potential effect of negative and positive evidence is commensurate with the extent to which it can be objectively verified. The more negative evidence that exists (a) the more positive evidence is necessary and (b) the more difficult it is to support a conclusion that a valuation allowance is not needed for some portion or all of the deferred tax asset.
The Company believes, when evaluating deferred tax assets within its taxable REIT subsidiaries, special consideration should be given to the unique relationship between the Company as a REIT and its taxable REIT subsidiaries. This relationship exists primarily to protect the REIT’s qualification under the Code by permitting, within certain limits, the REIT to engage in certain business activities in which the REIT cannot directly participate. As such, the REIT controls which and when investments are held in, or distributed or sold from, its taxable REIT subsidiaries. This relationship distinguishes a REIT and taxable REIT subsidiary from an enterprise that operates as a single, consolidated corporate taxpayer.
The Company primarily utilizes a twenty year projection of pre-tax book income and taxable income as positive evidence to overcome
its significantany negative
evidence of a three-year cumulative pretax book loss.evidence. Although items of income and expense utilized in the projection are objectively verifiable there is also significant judgment used in determining the duration and timing of events that would impact the projection. Based upon the Company’s analysis of negative and positive evidence the Company will make a determination of the need for a valuation allowance against its deferred tax assets. If future income projections do not occur as forecasted, the Company will reevaluate the need for a valuation allowance. In addition, the Company can employ additional strategies to realize its deferred tax assets, including transferring a greater portion of its property management business to the TRS, sale of certain built-in gain assets, and
further reducing intercompany debt.
The Company recognizes and measures benefits for uncertain tax positions, which requires significant judgment from management. Although the Company believes it has adequately reserved for any uncertain tax positions, no assurance can be given that the final tax outcome of these matters will not be different. The Company adjusts these reserves in light of changing facts and circumstances, such as the closing of a tax audit or the refinement of an estimate. Changes in the recognition or measurement of uncertain tax positions could result in material increases or decreases in the Company’s income tax expense in the period in which a change is made, which could have a material impact on operating results (see Footnote
2422 of the Notes to Consolidated Financial Statements included in this Form 10-K).
Comparison
20112012 to
20102011
| | | | | | | | |
| | 2011 | | 2010 | | Increase | | % change |
| | (all amounts in millions) | | |
| | | | | | | | |
Revenues from rental property (1) | $ | 873.7 | $ | 831.2 | $ | 42.5 | | 5.1% |
Rental property expenses: (2) | | | | | | | | |
Rent | $ | 13.9 | $ | 13.8 | $ | 0.1 | | 0.7% |
Real estate taxes | | 117.2 | | 113.7 | | 3.5 | | 3.1% |
Operating and maintenance | | 124.9 | | 118.6 | | 6.3 | | 5.3% |
| $ | 256.0 | $ | 246.1 | $ | 9.9 | | 4.0% |
Depreciation and amortization (3) | $ | 247.5 | $ | 232.8 | $ | 14.7 | | 6.3% |
| | | 2012 | | | 2011 | | | Increase/ (Decrease) | | | % change | |
| | | (amounts in millions) | | | | |
| | | | | | | | | | | | | |
| Revenues from rental property (1) | | $ | 884.8 | | | $ | 825.7 | | | $ | 59.1 | | | | 7.2 | % |
| Rental property expenses: (2) | | | | | | | | | | | | | | | | |
| Rent | | $ | 12.8 | | | $ | 13.9 | | | $ | (1.1 | ) | | | (7.9 | )% |
| Real estate taxes | | | 115.3 | | | | 108.8 | | | | 6.5 | | | | 6.0 | % |
| Operating and maintenance | | | 118.8 | | | | 114.1 | | | | 4.7 | | | | 4.1 | % |
| | | $ | 246.9 | | | $ | 236.8 | | | $ | 10.1 | | | | 4.3 | % |
| Depreciation and amortization (3) | | $ | 249.5 | | | $ | 231.7 | | | $ | 17.8 | | | | 7.7 | % |
| (1) | Revenues from rental property increased primarily from the combined effect of (i) the acquisition of operating properties during 2012 and 2011, and 2010, providing incremental revenues for the year ended December 31, 2012 of $50.9 million, as compared to the corresponding period in 2011, (ii) an increase in revenues relating to the Company’s Latin American portfolio of $8.0 and (iii) the completion of certain development and redevelopment projects, tenant buyouts and overall growth in the current portfolio, providing incremental revenues of $0.9 million, for the year ended December 31, 2012, as compared to the corresponding period in 2011, partially offset by (iv) a decrease in revenues of $0.7 million for the year ended December 31, 2012, as compared to the corresponding period in 2011, primarily resulting from the partial sale of certain properties during 2012 and 2011. |
| (2) | Rental property expenses include (i) rent expense relating to ground lease payments for which the Company is the lessee; (ii) real estate tax expense for consolidated properties for which the Company has a controlling ownership interest and (iii) operating and maintenance expense, which consists of property related costs including repairs and maintenance costs, roof repair, landscaping, parking lot repair, snow removal, utilities, property insurance costs, security and various other property related expenses. Rental property expenses increased for the year ended December 31, 2012, as compared to the corresponding period in 2011, primarily due to (i) an increase in real estate taxes of $6.5 million, primarily due to acquisitions of properties during 2012 and 2011, (ii) an increase in repairs and maintenance costs of $5.5 million, primarily due to acquisitions of properties during 2012 and 2011 (iii) an increase in insurance premiums and claims of $1.7 million and (iv) an increase in utilities of $1.8 million, partially offset by (v) a decrease in snow removal costs of $5.2 million and (vi) a decrease in rent expense of $1.1 million. |
| (3) | Depreciation and amortization increased for the year ended December 31, 2012, as compared to the corresponding period in 2011, primarily due to (i) operating property acquisitions during 2012 and 2011, (ii) the placement of certain development properties into service and (iii) tenant vacancies, partially offset by (iv) certain operating property dispositions during 2012 and 2011. |
Management and other fee income increased $2.2 million to $37.5 million for the year ended December 31, 2012, as compared to $35.3 million for the corresponding period in 2011. This increase is due to an increase in property management fees of $0.8 million, primarily due to the acquisitions of properties within the Company’s joint venture portfolio during 2012 and 2011, and an increase in transaction related fees of $35.7$1.4 million recognized during 2012, as compared to 2011.
General and administrative costs include employee-related expenses (salaries, bonuses, equity awards, benefits, severance costs and payroll taxes), professional fees, office rent, travel expense, and other company-specific expenses. General and administrative expenses increased $5.6 million to $124.5 million for the year ended December 31, 2012, as compared to $118.9 million for the corresponding period in 2011. This increase is primarily a result of (i) an increase of $2.6 million in severance costs related to the departure of an executive officer in January 2012, (ii) an increase in professional and consulting fees of $2.1 million, primarily due to increased transactional activity, and (iii) an increase in other personnel related costs during 2012, as compared to the corresponding period in 20102011.
During year ended December 31, 2012, the Company recognized impairment charges of $59.6 million ($22.5 million of which is included in discontinued operations) before income tax benefit and (ii)noncontrolling interest. During the completionyear ended December 31, 2011, the Company recognized impairment charges of $32.8 million ($19.7 million of which is included in discontinued operations) before income tax benefit and noncontrolling interest. These impairments were primarily calculated based on the usage of estimated sales prices and comparable sales information as inputs. The Company determined that its valuation in these assets was classified within Level 3 of the FASB’s fair value hierarchy. These impairment charges resulted from the Company’s efforts to market certain developmentassets and redevelopment projects, tenant buyoutsmanagement’s assessment as to the likelihood and overall growth in the current portfolio, providing incremental revenuestiming of approximately $7.9such potential transactions.
Interest, dividends and other investment income decreased $14.4 million to $2.2 million for the year ended December 31, 2012, as compared to $16.6 million for the corresponding period in 2011. This decrease is primarily due to (i) the Company’s sale of its investment in Valad notes during 2011, resulting in a decrease in interest income of $6.2 million, (ii) a decrease in other investment income of $6.4 million relating to the receipt of cash distributions during 2011 in excess of the Company’s carrying value of a cost method investment, (iii) a reduction in interest income of $0.5 million due to repayments of notes in 2012 and 2011 and (iv) a decrease in gains on sales of securities of $0.5 million.
Other expense, net increased $3.3 million to $8.0 million for the year ended December 31, 2012, as compared to $4.7 million for the corresponding period in 2011. This change is primarily due to (i) an increase in acquisition related costs of $3.1 million relating to an increase in transactional activity, (ii) a decrease in gains on foreign currency of $2.4 million relating to changes in foreign currency exchange rates, partially offset by (iii) an increase of $2.5 million in gains on land sales during 2012, as compared to the corresponding period in 2010, which was partially offset by (iii) a decrease in revenues of approximately $1.12011.
Interest expense increased $4.1 million to $227.6 million for the year ended December 31, 2011,2012, as compared to $223.5 million for the corresponding period in 2011. This increase is primarily related to a decrease in capitalization of interest due to the placement of certain development and redevelopment properties into service during 2012, as compared to the corresponding period in 2010, primarily2011.
During 2011, the Company sold a merchant building property to an unconsolidated joint venture in which the Company has a noncontrolling interest for a sales price of $37.6 million resulting
from the partial salein a pretax gain of
certain properties during 2011 and 2010.
(2)
Rental property expenses increased primarily$12.1 million after a deferral of $2.1 million due to (i) operating property acquisitions during 2011 and 2010, and (ii) the placement of certain development properties into service, which resultedCompany’s continued involvement in lower capitalization of carry costs.
(3)
Depreciation and amortization increased primarily due to (i) operating property acquisitions during 2011 and 2010, (ii) the placement of certain development properties into service and (iii) tenant vacancies.
property.
Mortgage and other financing
Provision for income taxes, net decreased $2.1by $17.4 million to $7.3$3.9 million for the year ended December 31, 2011,2012, as compared to $9.4$21.3 million for the corresponding period in 2010.2011. This decrease is primarily due to (i) an increase in income tax benefit of $10.2 million related to impairments taken during the year ended December 31, 2012, as compared to the corresponding period in 2011, (ii) a decrease in the income tax provision expense of $5.7 million in connection with a gain on sale of a development property during 2011, (iii) a decrease in tax provision of $2.8 million resulting from the receipt of a cash distribution during 2011 in excess of the Company’s carrying value of a cost method investment and (iv) a decrease in tax provision of $2.7 million resulting from a decrease in equity in income recognized in connection with the Albertson’s investment during 2012, as compared to 2011, partially offset by (v) an increase in foreign withholding taxes of $5.4 million primarily resulting from an unrealized foreign exchange gains recognized for Mexican tax purposes on U.S. denominated mortgage debt within the Company’s Latin American property portfolio.
Equity in income of joint ventures, net increased $49.4 million to $112.9 million for the year ended December 31, 2012, as compared to $63.5 million for the corresponding period in 2011. This increase is primarily the result of (i) an increase in gains on sale and promote income recognized of $12.6 million, (ii) the recognition of $7.5 million in income on the sale of certain air rights at a property within one of the Company’s joint venture investments in Canada, (iii) an increase in equity in income of $5.9 million from the Company’s InTown Suites investment primarily resulting from increased operating profitability, (iv) the recognition of $2.1 million in income resulting from cash distributions received in excess of the Company’s carrying value of its investment in an unconsolidated joint venture, (v) a decrease in impairment charges of $3.2 million resulting from fewer impairment charges recognized against certain joint venture properties during the year ended December 31, 2012, as compared to the corresponding period in 2011, (vi) a decrease in equity in loss of $4.0 million resulting from the disposition of a portfolio of properties during 2011, (vii) an increase in equity in income of $6.0 million from the Company’s joint venture investments in Canada (viii) an increase in equity in income of $3.7 million from the Company’s joint venture investments in Mexico and (ix) incremental earnings due to increased profitability from properties within the Company’s joint venture program.
During 2012, the Company acquired four properties from joint ventures in which the Company had noncontrolling interests. The Company recorded an aggregate gain on change in control of interests of $15.6 million related to the fair value adjustment associated with its original ownership. During 2011, the Company acquired one property from a joint venture in which the Company had a noncontrolling interest. The Company recorded an aggregate gain on change in control of interests of $0.6 million related to the fair value adjustment associated with its original ownership.
During 2012, the Company disposed of 62 operating properties and two outparcels, in separate transactions, for an aggregate sales price of $418.9 million. These transactions resulted in an aggregate gain of $85.9 million and impairment charges of $22.5 million, before income taxes, which is included in Discontinued operations in the Company’s Consolidated Statements of Income.
During 2011, the Company disposed of 27 operating properties, one development property and one outparcel, in separate transactions, for an aggregate sales price of $124.9 million. These transactions resulted in an aggregate gain of $17.3 million and aggregate impairment charges of $16.9 million, before income taxes, which is included in Discontinued operations in the Company’s Consolidated Statements of Income.
During 2011, a consolidated joint venture in which the Company had a preferred equity investment disposed of a property for a sales price of $6.1 million. As a result of this capital transaction, the Company received $1.4 million of profit participation, before noncontrolling interest of $0.1 million. This profit participation has been recorded as Income from other real estate investments and is reflected in Income from discontinued operating properties in the Company’s Consolidated Statements of Income.
During 2012, the Company sold a previously consolidated operating property to a newly formed unconsolidated joint venture in which the Company has a 20% noncontrolling interest for a sales price of $55.5 million. This transaction resulted in a pre-tax gain of $10.0 million, of which the Company deferred $2.0 million due to its continued involvement. This gain has been recorded as Gain on sale of operating properties, net of tax in the Company’s Consolidated Statements of Income.
Net income attributable to the Company increased $97.0 million to $266.1 million for the year ended December 31, 2012, as compared to $169.1 million for the corresponding period in 2011. On a diluted per share basis, net income attributable to the Company was $0.42 for 2012, as compared to net income of $0.27 for 2011. These increases are primarily attributable to (i) additional incremental earnings due to increased profitability from the Company’s operating properties and the acquisition of operating properties during 2012 and 2011, (ii) an increase in gains on disposition of operating properties and change in control of interests, (iii) an increase in equity in income of joint ventures, net primarily due to gains on sales of operating properties sold within various joint venture portfolios during 2012 and (iv) a decrease in provision for income taxes, partially offset by (v) an increase in impairment charges recognized during the year ended December 31, 2012, as compared to the corresponding period in 2011, (vi) a decrease in interest, dividends and other investment income resulting primarily from the sale of certain marketable securities during 2011 and (vii) a decrease in gain on sale of development properties recognized during 2012, as compared to 2011. The 2012 diluted per share results were decreased by a reduction in net income available to common shareholders of $21.7 million resulting from the repaymentdeduction of certain mortgage receivables duringoriginal issuance costs associated with the redemption of the Company’s 6.65% Class F Cumulative Redeemable Preferred Stock and 7.75% Class G Cumulative Redeemable Preferred Stock.
Comparison 2011
and 2010.to 2010
| | | 2011 | | | 2010 | | | Increase | | | % change | |
| | | (amounts in millions) | | | | |
| | | | | | | | | | | | | |
| Revenues from rental property (1) | | $ | 825.7 | | | $ | 786.9 | | | $ | 38.8 | | | | 4.9 | % |
| Rental property expenses: (2) | | | | | | | | | | | | | | | | |
| Rent | | $ | 13.9 | | | $ | 13.7 | | | $ | 0.2 | | | | 1.5 | % |
| Real estate taxes | | | 108.8 | | | | 105.3 | | | | 3.5 | | | | 3.3 | % |
| Operating and maintenance | | | 114.1 | | | | 108.4 | | | | 5.7 | | | | 5.3 | % |
| | | $ | 236.8 | | | $ | 227.4 | | | $ | 9.4 | | | | 4.1 | % |
| Depreciation and amortization (3) | | $ | 231.7 | | | $ | 217.2 | | | $ | 14.5 | | | | 6.7 | % |
| (1) | Revenues from rental property increased primarily from the combined effect of (i) the acquisition of operating properties during 2011 and 2010, providing incremental revenues for the year ended December 31, 2011 of $35.7 million, as compared to the corresponding period in 2010 and (ii) the completion of certain development and redevelopment projects, tenant buyouts and overall growth in the current portfolio, providing incremental revenues of $4.2 million, for the year ended December 31, 2011, as compared to the corresponding period in 2010, which was partially offset by (iii) a decrease in revenues of $1.1 million for the year ended December 31, 2011, as compared to the corresponding period in 2010, primarily resulting from the partial sale of certain properties during 2011 and 2010. |
| (2) | Rental property expenses include (i) rent expense relating to ground lease payments for which the Company is the lessee; (ii) real estate tax expense for consolidated properties for which the Company has a controlling ownership interest and (iii) operating and maintenance expense, which consists of property related costs including repairs and maintenance costs, roof repair, landscaping, parking lot repair, snow removal, utilities, property insurance costs, security and various other property related expenses. Rental property expenses increased primarily due to (i) operating property acquisitions during 2011 and 2010, and (ii) the placement of certain development properties into service, which resulted in lower capitalization of carrying costs. |
| (3) | Depreciation and amortization increased primarily due to (i) operating property acquisitions during 2011 and 2010, (ii) the placement of certain development properties into service and (iii) tenant vacancies. |
Management and other fee income decreased
approximately $4.6 million to $35.3 million for the year ended December 31, 2011, as compared to $39.9 million for the corresponding period in 2010. This decrease is primarily due to a decrease in property management fees of
approximately $2.4 million recognized during 2011, as compared to 2010, primarily due to the disposition of properties during 2011 and 2010 and a decrease in transaction related fees of
approximately $2.2 million recognized during 2011, as compared to 2010.
General and administrative costs include employee-related expenses (salaries, bonuses, equity awards, benefits, severance costs and payroll taxes), professional fees, office rent, travel expense, and other company-specific expenses. General and administrative expenses increased
approximately $9.7$9.9 million to $118.9 million for the year ended December 31, 2011, as compared to
$109.2$109.0 million for the corresponding period in 2010. This change is primarily a result of an increase in equity awards expense related to grants issued during 2011 and 2010 and an increase in other personnel related costs during 2011, as compared to the corresponding periods in 2010.
Interest, dividends and other investment income decreased approximately $4.6 million to $16.6 million for the year ended December 31, 2011, as compared to $21.2 million for the corresponding period in 2010. This decrease is primarily due to the sale of the Valad notes resulting in a decrease in interest income of approximately $13.5 million, partially offset by (i) an increase in bank interest income of approximately $1.1 million during 2011, as compared to the corresponding period in 2010, primarily resulting from the change in cash balances during 2011 and (ii) an income distribution of approximately $7.4 million from a cost method investment during 2011.
During the year ended December 31, 2010, the Company incurred early extinguishment of debt charges aggregating approximately $10.8 million in connection with the optional make-whole provisions of notes that were repaid prior to maturity and prepayment penalties on five mortgages that the Company paid prior to their maturity.
During 2011, the Company sold a merchant building property to an unconsolidated joint venture in which the Company has a noncontrolling interest for a sales price of approximately $37.6 million resulting in a pretax gain of approximately $12.1 million after a deferral of approximately $2.1 million due to the Company’s continued involvement in the property.
During 2010, the Company disposed of a land parcel for a sales price of approximately $0.8 million resulting in a gain of approximately $0.4 million. Additionally, the Company recognized approximately $1.7 million in income on previously sold development properties during the year ended December 31, 2010.
During 2011, the Company recognized aggregate impairment charges of
approximately $15.3$32.2 million
(not including approximately $16.9($19.7 million
of which is included in discontinued operations), before income taxes and noncontrolling interest, relating to adjustments to property carrying values, investments in other real estate investments, investment in real estate joint ventures and other investments. The Company’s estimated fair values relating to these impairment assessments were based upon their respective estimated sales prices. Based on these inputs, the Company determined that its valuation in these investments was classified within Level 3 of the FASB fair value hierarchy.
These impairment charges resulted from the Company’s efforts to market certain assets and management’s assessment as to the likelihood and timing of such potential transactions. Additionally, during 2011, the Company recorded impairment charges of approximately $0.6 million due to the decline in value of certain marketable securities that were deemed to be other-than-temporary.
During 2010, the Company recognized impairment charges of
approximately $28.0$34.5 million
(not including approximately $6.5($6.5 million
of which is included in discontinued operations), before income taxes and noncontrolling interest, relating to adjustments to property carrying values, real estate under development, investments in other real estate investments and other investments. The Company’s estimated fair values relating to these impairment assessments were based upon estimated sales prices and discounted cash flow models that included all estimated cash inflows and outflows over a specified holding period. These cash flows are comprised of unobservable inputs which include contractual rental revenues and forecasted rental revenues and expenses based upon market conditions and expectations for growth. Capitalization rates and discount rates utilized in these models were based upon observable rates that the Company believes to be within a reasonable range of current market rates for the respective properties. Based on these inputs, the Company determined that its valuation in these investments was classified within Level 3 of the FASB fair value hierarchy.
Additionally, during 2010, the Company recorded impairment charges of approximately $4.6 million due to the decline in value of certain marketable securities that were deemed to be other-than-temporary.
Mortgage financing income taxes changed by approximately $16.3decreased $2.1 million to a provision of approximately $19.5$7.3 million for the year ended December 31, 2011, as compared to $9.4 million for the corresponding period in 2010. This decrease is primarily due to a provisiondecrease in interest income resulting from the repayment of approximatelycertain mortgage receivables during 2011 and 2010.
Interest, dividends and other investment income decreased $4.6 million to $16.6 million for the year ended December 31, 2011, as compared to $21.2 million for the corresponding period in 2010. This decrease is primarily due to the sale of Valad notes resulting in a decrease in interest income of $13.5 million, partially offset by (i) an increase in bank interest income of $1.1 million during 2011, as compared to the corresponding period in 2010, primarily resulting from the change in cash balances during 2011 and (ii) an income distribution of $7.4 million from a cost method investment during 2011.
During the year ended December 31, 2010, the Company incurred early extinguishment of debt charges aggregating $10.8 million in connection with the optional make-whole provisions of notes that were repaid prior to maturity and prepayment penalties on five mortgages that the Company paid prior to their maturity.
During 2011, the Company sold a merchant building property to an unconsolidated joint venture in which the Company has a noncontrolling interest for a sales price of $37.6 million resulting in a pretax gain of $12.1 million after a deferral of $2.1 million due to the Company’s continued involvement in the property.
During 2010, the Company disposed of a land parcel for a sales price of $0.8 million resulting in a gain of $0.4 million. Additionally, the Company recognized $1.7 million in income on previously sold development properties during the year ended December 31, 2010.
Provision for income taxes, net increased by $18.1 million to $21.3 million for the year ended December 31, 2011, as compared to $3.2 million for the corresponding period in 2010. This change is primarily due to (i) a decrease in income tax benefit of approximately $10.3 million related to fewer impairments taken during the year ended December 31, 2011, as compared to the corresponding period in 2010, (ii) an increase in the income tax provision expense of approximately $4.8 million in connection with gains on sale of development properties during 2011, as compared to 2010, (iii) a decrease in tax benefit of approximately $4.9 million as a result of reduced interest expense for the Company’s taxable REIT subsidiaries, (iv) a tax provision of approximately $2.7 million resulting from the receipt of a cash distribution in excess of the Company’s carrying value of a cost method investment during 2011 and (v) a tax provision of approximately $1.4 million resulting from incremental earnings due to increased profitability from properties within the Company’s taxable REIT subsidiaries, partially offset by (vi) a decrease in foreign taxes of approximately $6.8 million primarily resulting from an unrealized foreign exchange loss recognized for Mexican tax purposes on U.S. denominated mortgage debt within the Company’s Latin American property portfolio. Equity in income of joint ventures, net increased approximately $29.4$28.9 million to $64.0$63.5 million for the year ended December 31, 2011, as compared to $34.6 million for the corresponding period in 2010. This increase is primarily the result of (i) a decrease in impairment charges of approximately $10.0 million resulting from fewer impairment charges recognized against certain joint venture properties during the year ended December 31, 2011, as compared to the corresponding period in 2010, (ii) an increase in equity in income of approximately $4.2 million from the Company’s InTown Suites investment primarily resulting from increased operating profitability, (iii) an increase in equity in income of approximately $2.3 million from the Company’s joint venture investments in Canada primarily resulting from the Company increasing its noncontrolling ownership interest in certain Canadian portfolios, (iv) an increase in equity in income of approximately $2.1 million from the Company’s joint venture investments in Latin America primarily resulting from lease-up activities at properties that were placed into service,(v) a decrease of approximately $7.2 million in equity in loss from a joint venture in which the Company no longer has an equity basis and is therefore no longer required to record equity losses, (vi) an increase in gains on sales of approximately $4.9$4.4 million for 2011, as compared to 2010 and (vii) incremental earnings due to increased profitability from properties within the Company’s joint venture program, partially offset by (viii) the recognition of approximately $8.0 million in income resulting from cash distributions received in excess of the Company’s carrying value of its investment in an unconsolidated limited liability partnership during the year ended December 31, 2010. Equity in income from other real estate investments, net decreased
approximately $9.0 million to $51.8 million for the year ended December 31, 2011, as compared to $60.8 million for the corresponding period in 2010. This decrease is primarily due to a decrease of
approximately $7.2 million in equity in income from the Albertson’s joint venture resulting from lower cash distributions received in excess of the Company’s investment during 2011, as compared to the corresponding period during 2010 and a decrease of
approximately $2.7 million in equity in earnings including profit participation earned from the Company’s Preferred Equity Program during 2011, as compared to the corresponding period in 2010.
During 2011, the Company disposed of 27 operating properties, one development property and one outparcel, in separate transactions, for an aggregate sales price of
approximately $124.9 million. These transactions, which are included in Discontinued Operations, resulted in an aggregate gain of
approximately $17.3 million and aggregate impairment charges of
approximately $16.9 million, before income taxes.
Additionally, during 2011, a consolidated joint venture in which the Company had a preferred equity investment disposed of a property for a sales price of
approximately $6.1 million. As a result of this capital transaction, the Company received
approximately $1.4 million of profit participation, before noncontrolling interest of
approximately $0.1 million. This profit participation has been recorded as Income from other real estate investments and is reflected in Income from discontinued operating properties in the Company’s Consolidated Statements of
Operations.Income.
During 2010, the Company (i) sold seven operating properties, which were previously consolidated, to two new joint ventures in which the Company holds noncontrolling equity interests for an aggregate sales price of
approximately $438.1 million including the assignment of $159.9 million of non-recourse mortgage debt encumbering three of the properties and (ii) disposed of, in separate transactions, seven operating properties for an aggregate sales price of
approximately $100.5 million including the assignment of $81.0 million of non-recourse mortgage debt encumbering one of the properties. These transactions resulted in aggregate gains of
approximately $4.4 million and aggregate losses/impairments of
approximately $5.0 million.
Additionally, during 2010, the Company disposed of (i) three properties, in separate transactions, for an aggregate sales price of
approximately $23.8 million and (ii) five properties from a consolidated joint venture in which the Company had a preferred equity investment for a sales price of
approximately $40.8 million. These transactions resulted in an aggregate profit participation of
approximately $20.8 million, before income tax of
approximately $1.0 million and noncontrolling interest of
approximately $4.9 million. This profit participation has been recorded as Income from other real estate investments and is reflected in Income from discontinued operating properties, net of tax in the Company’s Consolidated Statements of
Operations.
Income.
Net income attributable to the Company increased
approximately $26.2 million to $169.1 million for the year ended December 31, 2011, as compared to $142.9 million for the corresponding period in 2010. On a diluted per share basis, net income attributable to the Company was $0.27 for 2011, as compared to net income of $0.22 for 2010. These increases are primarily attributable to (i) additional incremental earnings due to increased profitability from the Company’s operating properties and the acquisition of operating properties during 2011 and 2010, (ii) an increase in gain on sale of development properties recognized during 2011, as compared to 2010, (iii) increased equity in income of joint ventures, net primarily due to incremental earnings from increased profitability within the joint venture portfolios and fewer impairment charges recognized against certain joint venture properties during the year ended December 31, 2011, as compared to the corresponding period in 2010 and (iv) early extinguishment of debt charges recognized during 2010, aggregating
approximately $10.8 million, partially offset by (v) an increase in provision for income taxes.
21
Comparison 2010 to 2009
| | | | | | | | |
| | 2010 | | 2009 | | Increase | | % change |
| | (all amounts in millions) | | |
| | | | | | | | |
Revenues from rental property (1) | $ | 831.2 | $ | 755.4 | $ | 75.8 | | 10.0% |
Rental property expenses: (2) | | | | | | | | |
Rent | $ | 13.8 | $ | 13.6 | $ | 0.2 | | 1.5% |
Real estate taxes | | 113.7 | | 108.4 | | 5.3 | | 4.9% |
Operating and maintenance | | 118.6 | | 105.3 | | 13.3 | | 12.6% |
| $ | 246.1 | $ | 227.3 | $ | 18.8 | | 8.3% |
Depreciation and amortization (3) | $ | 232.8 | $ | 221.8 | $ | 11.0 | | 5.0% |
(1)
Revenues from rental property increased primarily from the combined effect of (i) the acquisition of operating properties during 2010 and 2009, providing incremental revenues for the year ended December 31, 2010 of $70.6 million, as compared to the corresponding period in 2009 and (ii) the completion of certain development and redevelopment projects, tenant buyouts and overall growth in the current portfolio, providing incremental revenues of approximately $9.5 million, for the year ended December 31, 2010, as compared to the corresponding period in 2009, which was partially offset by (iii) a decrease in revenues of approximately $4.3 million for the year ended December 31, 2010, as compared to the corresponding period in 2009, primarily resulting from the sale of certain properties during 2010 and 2009.
(2)
Rental property expenses increased primarily due to (i) operating property acquisitions during 2010 and 2009 and (ii) the placement of certain development properties into service, which resulted in lower capitalization of carry costs, partially offset by (iii) certain operating property dispositions during 2010 and 2009.
(3)
Depreciation and amortization increased primarily due to (i) operating property acquisitions during 2010 and 2009, (ii) the placement of certain development properties into service and (iii) tenant vacancies, partially offset by (iv) certain operating property dispositions during 2010 and 2009.
Mortgage and other financing income decreased $5.6 million to $9.4 million for the year ended December 31, 2010, as compared to $15.0 million for the corresponding period in 2009. This decrease is primarily due to a decrease in interest income as a result of pay-downs and dispositions of mortgage receivables during 2010 and 2009.
Management and other fee income decreased approximately $2.6 million to $39.9 million for the year ended December 31, 2010, as compared to $42.5 million for the corresponding period in 2009. This decrease is primarily due to a decrease in property management fees of approximately $2.6 million from PL Retail, due to the Company’s acquisition of the remaining 85% ownership interest resulting in the Company’s consolidation of PL Retail in 2009, partially offset by an increase in other transaction related fees of approximately $0.1 million recognized during 2010.
Interest, dividends and other investment income decreased approximately $11.9 million to $21.2 million for the year ended December 31, 2010, as compared to $33.1 million for the corresponding period in 2009. This decrease is primarily due to (i) a decrease in realized gains of approximately $5.2 million during 2010 resulting from the sale of certain marketable securities during the corresponding period in 2009 as compared to 2010, (ii) a reduction in interest income of approximately $3.8 million due to repayments of notes in 2010 and 2009and (iii) a decrease in interest and dividend income of approximately $1.9 million during 2010, as compared to the corresponding period in 2009, primarily resulting from the sale of investments in marketable securities during 2010 and 2009.
Other (expense)/income, net changed approximately $10.1 million to an expense of approximately $4.6 million for the year ended December 31, 2010, as compared to income of approximately $5.5 million for the corresponding period in 2009. This change is primarily due to (i) a decrease in the fair value of an embedded derivative instrument of approximately $2.0 million relating to the convertible option of the Company’s investment in Valad notes, (ii) decreased gains from land sales of approximately $3.5 million, (iii) an increase in a legal settlement accrual of approximately $2.0 million relating to a previously sold ground-up development project and (iv) an increase in acquisition related costs of approximately $0.5 million.
Interest expense increased approximately $18.3 million to $226.1 million for the year ended December 31, 2010, as compared to $207.8 million for the corresponding period in 2009. This increase is due to higher average outstanding levels of debt during the year ended December 31, 2010, as compared to 2009.
During the year ended December 31, 2010, the Company incurred early extinguishment of debt charges aggregating approximately $10.8 million in connection with the optional make-whole provisions of notes that were repaid prior to maturity and prepayment penalties on five mortgages that the Company paid prior to their maturity.
During 2010, the Company disposed of a land parcel for a sales price of approximately $0.8 million resulting in a gain of approximately $0.4 million. Additionally, the Company recognized approximately $1.7 million in income on previously sold development properties during the year ended December 31, 2010.
22
During 2009, the Company sold, in separate transactions, five out-parcels, four land parcels and three ground leases for aggregate proceeds of approximately $19.4 million. These transactions resulted in gains on sale of development properties of approximately $5.8 million, before income taxes of $2.3 million.
During 2010, the Company recognized impairment charges of approximately $28.0 million (not including approximately $6.5 million which is included in discontinued operations), before income taxes and noncontrolling interest, relating to adjustments to property carrying values, real estate under development, investments in other real estate investments and other investments. The Company’s estimated fair values relating to these impairment assessments were based upon estimated sales prices and discounted cash flow models that included all estimated cash inflows and outflows over a specified holding period. These cash flows are comprised of unobservable inputs which include contractual rental revenues and forecasted rental revenues and expenses based upon market conditions and expectations for growth. Capitalization rates and discount rates utilized in these models were based upon observable rates that the Company believes to be within a reasonable range of current market rates for the respective properties. Based on these inputs, the Company determined that its valuation in these investments was classified within Level 3 of the FASB fair value hierarchy.
Additionally, during 2010, the Company recorded impairment charges of approximately $4.6 million due to the decline in value of certain marketable securities that were deemed to be other-than-temporary.
During 2009, the Company recognized impairment charges of approximately $119.0 million (not including approximately $26.0 million of which is included in discontinued operations), before income taxes and noncontrolling interest, relating to adjustments to property carrying values, investments in real estate joint ventures, real estate under development and other real estate investments. The Company’s estimated fair values relating to these impairment assessments were based upon discounted cash flow models that included all estimated cash inflows and outflows over a specified holding period and where applicable, any estimated debt premiums. These cash flows are comprised of unobservable inputs which include contractual rental revenues and forecasted rental revenues and expenses based upon market conditions and expectations for growth. Capitalization rates and discount rates utilized in these models were based upon observable rates that the Company believes to be within a reasonable range of current market rates for the respective properties. Based on these inputs the Company determined that its valuation in these investments was classified within Level 3 of the fair value hierarchy.
Additionally, during 2009, the Company recorded impairment charges of approximately $30.1 million due to the decline in value of certain marketable equity securities and other investments that were deemed to be other-than-temporary.
(Provision)/benefit for income taxes changed by approximately $23.3 million to a provision of approximately $3.2 million for the year ended December 31, 2010, as compared to a benefit of approximately $20.1 million for the corresponding period in 2009. This change is primarily due to (i) a decrease in income tax benefit of approximately $12.4 million related to impairments taken during the year ended December 31, 2010 as compared to the corresponding period in 2009, (ii) an increase in foreign taxes of approximately $6.8 million primarily resulting from an overall increase in income from foreign investments and (iii) an increase in the tax provision expense of approximately $6.8 million relating to an increase in equity income recognized in connection with the Albertson’s investment during the year ended December 31, 2010, as compared to the corresponding period in 2009, partially offset by (iv) a decrease in the income tax provision expense of approximately $1.4 million in connection with gains on sale of development properties during 2010, as compared to 2009.
Equity in income of real estate joint ventures, net increased approximately $31.2 million to $34.6 million for the year ended December 31, 2010, as compared to $3.4 million for the corresponding period in 2009. This increase is primarily the result of a (i) an increase in equity in income of approximately $5.9 million from the Company’s joint venture investments in Canada primarily resulting from the amendment and restructuring of two retail property preferred equity investments into two pari passu joint venture investments during 2010, (ii) the recognition of approximately $8.0 million in income resulting from cash distributions received in excess of the Company’s carrying value of its investment in an unconsolidated limited liability partnership for the year ended December 31, 2010 and (iii) decrease in impairment charges of approximately $15.0 million resulting from fewer impairment charges recognized against certain joint venture properties during 2010, as compared to the corresponding period in 2009.
Equity in income of other real estate investments, net increased approximately $26.4 million to $60.8 million for the year ended December 31, 2010, as compared to $34.4 million for the corresponding period in 2009. This increase is primarily due to the recognition of approximately $21.2 million of equity in income from the Albertson’s joint venture during 2010, as compared to $3.0 million of equity in income recognized during 2009, primarily resulting from the sale of properties in the joint venture and an increase of approximately $7.2 million in profit participation earned from capital transactions within the Company’s Preferred Equity Program during 2010 as compared to the corresponding period in 2009.
23
During 2010, the Company (i) sold seven operating properties, which were previously consolidated, to two new joint ventures in which the Company holds noncontrolling equity interests for an aggregate sales price of approximately $438.1 million including the assignment of $159.9 million of non-recourse mortgage debt encumbering three of the properties and (ii) disposed of, in separate transactions, seven operating properties for an aggregate sales price of approximately $100.5 million including the assignment of $81.0 million of non-recourse mortgage debt encumbering one of the properties. These transactions resulted in aggregate gains of approximately $4.4 million and aggregate losses/impairments of approximately $5.0 million.
Additionally, during 2010, the Company disposed of (i) three properties, in separate transactions, for an aggregate sales price of approximately $23.8 million and (ii) five properties from a consolidated joint venture in which the Company had a preferred equity investment for a sales price of approximately $40.8 million. These transactions resulted in an aggregate profit participation of approximately $20.8 million, before income tax of approximately $1.0 million and noncontrolling interest of approximately $4.9 million. This profit participation has been recorded as Income from other real estate investments and is reflected in Income from discontinued operating properties, net of tax in the Company’s Consolidated Statements of Operations.
During 2009, the Company disposed of, in separate transactions, portions of six operating properties and one land parcel for an aggregate sales price of approximately $28.9 million. These transactions resulted in the Company’s recognition of an aggregate net gain of approximately $4.1 million, net of income tax of $0.2 million.
Net income attributable to the Company for 2010 was $142.9 million. Net loss attributable to the Company for 2009 was $3.9 million. On a diluted per share basis, net income attributable to the Company was $0.22 for 2010, as compared to net loss of $0.15 for 2009. These changes are primarily attributable to (i) a decrease in impairment charges of approximately $112.1 million, net of income taxes and noncontrolling interests, (ii) an overall net increase in Equity in income of joint ventures primarily due to a decrease in impairment charges of approximately $15.0 million during 2010, as compared to 2009 and an increase in equity in income from the Albertson’s joint venture, (iii) an increase in Income from other real estate investments primarily due to an increase of approximately $7.2 million from the Company’s Preferred Equity program, (iv) additional incremental earnings due to the acquisitions of operating properties during 2010 and 2009, partially offset by (v) the recognition of approximately $10.8 million in early extinguishment of debt charges.
Liquidity and Capital Resources
The Company’s capital resources include accessing the public debt and equity capital markets, mortgage and construction loan financing and immediate access to an unsecured revolving credit facility with bank commitments of $1.75 billion.
The Company’s cash flow activities are summarized as follows (in millions):
| | | | | | |
| | Year Ended December 31, |
| | 2011 | | 2010 | | 2009 |
Net cash flow provided by operating activities | $ | 448.6 | $ | 479.9 | $ | 403.6 |
Net cash flow (used for)/provided by investing activities | $ | (20.8) | $ | 37.9 | $ | (343.2) |
Net cash flow used for financing activities | $ | (440.1) | $ | (514.7) | $ | (74.5) |
| | | Year Ended December 31, | |
| | | 2012 | | | 2011 | | | 2010 | |
| Net cash flow provided by operating activities | | $ | 479.1 | | | $ | 448.6 | | | $ | 479.9 | |
| Net cash flow (used for)/provided by investing activities | | $ | (51.0 | ) | | $ | (20.8 | ) | | $ | 37.9 | |
| Net cash flow used for financing activities | | $ | (399.1 | ) | | $ | (440.1 | ) | | $ | (514.7 | ) |
The Company anticipates that cash on hand,
operating cash flows, borrowings under its revolving credit facility, issuance of equity and public debt, as well as other debt and equity alternatives, will provide the necessary capital required by the Company. Net cash flow provided by operating activities for the year ended December 31,
2011,2012, was primarily attributable to (i) cash flow from the diverse portfolio of rental properties, (ii) the acquisition of operating properties during
20112012 and
2010,2011, (iii) new leasing, expansion and re-tenanting of core portfolio properties and (iv) distributions from the Company’s joint venture programs.
Cash flow provided by operating activities for the year ended December 31,
2011,2012, was
approximately $448.6$479.1 million, as compared to
approximately $479.9$448.6 million for the comparable period in
2010.2011. The change of
approximately $31.3$30.5 million is primarily attributable to
higher operational income, increased distributions from joint ventures and other real estate investments and changes in accounts
payable and
accrued expensesnotes receivable due to
the timing of
payments.receipts.
Cash flow used for investing activities for the year ended December 31,
2011,2012, was
approximately $20.8$51.0 million, as compared to
cash flows provided by investing activities of approximately $37.9$20.8 million for the comparable period in
2010.2011. This change of
approximately $58.7$30.2 million resulted primarily from (i) an increase in
the acquisition of and improvements to operating real estate
of $209.2 million, (ii)
a decrease in proceeds from the sale/repayments of marketable securities of $187.8 million, (iii) an increase in investments and advances to real estate joint ventures
(iii)of $48.2 million, (iv) a decrease in reimbursements of
investments and advances to
other real estate
joint ventures, (iv) a decreaseinvestments and other investments of $43.7 million and (v) investment in mortgage loans receivable of $16.0 million, partially offset by, (vi) an increase in proceeds from the sale of operating and development properties
during the year ended December 31, 2011, as compared to the corresponding period in 2010, partially offset by, (v) an increase in proceeds from the sale of
marketable securities, (vi)$269.4 million, (vii) an increase in reimbursements of
investments and advances to real estate joint ventures
and (vii)of $124.3 million, (viii) an increase in
reimbursementscollections of
other investments.mortgage receivables of $44.5 million and (ix) a decrease in acquisition of and improvements to real estate under development of $35.4 million.
Acquisitions of and Improvements to Operating Real Estate
During the year ended December 31,
2011,2012, the Company expended
approximately $343.3$552.5 million towards acquisition of and improvements to operating real estate including
$73.7$78.9 million
(inclusive of $2.4 million in capitalized costs) expended in connection with redevelopments and re-tenanting
projects as described below.projects. (See Footnote 4 of the Notes to the Consolidated Financial Statements included in this Form 10-K.)
The Company has an ongoing program to reformat and re-tenant its properties to maintain or enhance its competitive position in the marketplace. The Company anticipates its capital commitment toward these
reformatting and re-tenanting efforts and other redevelopment projects during
20122013 will be approximately
$25.0$90.0 million to
$35.0$100.0 million. The funding of these capital requirements will be provided by cash flow from operating activities and availability under the Company’s revolving line of credit.
Investments and Advances to Real Estate Joint Ventures
During the year ended December 31,
2011,2012, the Company expended
approximately $171.7$219.9 million for investments and advances to real estate joint ventures and received
approximately $63.5$187.9 million from reimbursements of
investments and advances to real estate joint
ventures.ventures, primarily due to the refinance of debt and sales of properties. (See Footnote 8 of the Notes to the Consolidated Financial Statements included in this Form 10-K.)
Acquisitions of and Improvements to Real Estate Under Development
The Company is engaged in
ground-up development projects which consist of (i) U.S. ground-up development projects which will be held as long-term investments by the
Company and (ii) various ground-up development projects located in Latin America for long-term investment.Company. The ground-up development projects generally have significant pre-leasing prior to the commencement of construction. As of December 31,
2011,2012, the Company had
in progress a total of
fourthree ground-up development projects, consisting of
(i) two projects located in the U.S.
, (ii) and one project located in
Chile and (iii) one project located in Peru.
During the year ended December 31, 2011, the Company expended approximately $37.9 million in connection with construction costs related to ground-up development projects.
The Company anticipates its capital commitment during
20122013 toward these and other development projects will be approximately $15.0 million to $25.0 million. The
proceedsfunding of these capital requirements will be provided by cash flow from
construction loansoperating activities and availability under the Company’s revolving
linesline of
credit are expected to be sufficient to fund these anticipated capital requirements.credit.
Dispositions and Transfers
During the year ended December 31,
2011,2012, the Company received net proceeds of
approximately $180.1$449.5 million relating to the sale of various operating
properties and ground-up development projects.properties. (See Footnotes 5 and 7 of the Notes to the Consolidated Financial Statements included in this Form 10-K.)
Cash flow used for financing activities for the year ended December 31,
2011,2012, was
approximately $440.1$399.1 million, as compared to
approximately $514.7$440.1 million for the comparable period in
2010.2011. This change of
approximately $74.6$41.0 million resulted primarily from (i)
the redemption of the Company’s 6.65% Class F Preferred Stock and 7.75% Class G Preferred Stock of $635.0 million, (ii) an
overall decreaseincrease in
aggregate principal payments of
approximately $191.6$221.5 million,
(ii) a net(iii) an increase
of approximately $123.4 million in net borrowings/repayments under the Company’s unsecured revolving credit facility, (iii) a decrease in the repayment of unsecured term loan/notes of
approximately $379.1$123.3 million, (iv) a decrease
of $103.6 million in
the redemption of noncontrolling interests of approximately $54.2 million, partially offset bynet borrowings under unsecured revolving credit facility, (v)
decreases in proceeds from issuance of unsecured term loans/notes of approximately $449.7 million, (vi) a decrease in proceeds from the issuance of stock of approximately $171.3 million and (vii) an increase in dividends paid of
approximately $46.8 million.
$29.0 million due to the issuance of the Company’s 6.00% Class I Preferred Stock and 5.50% Class J Preferred Stock and (vi) an increase in repurchases of common stock of $24.9 million, partially offset by (vii) an increase of $790.2 million from the issuance of stock, primarily relating to the issuance of the Company’s 6.00% Class I Preferred Stock, 5.50% Class J Preferred Stock and 5.625% Class K Preferred Stock and (viii) an increase of $400.0 million in proceeds from the unsecured term loan.
The Company continually evaluates its debt maturities, and, based on management’s current assessment, believes it has viable financing and refinancing alternatives that will not materially adversely impact its expected financial results. The credit environment has improved and the Company continues to pursue borrowing opportunities with large commercial U.S. and global banks, select life insurance companies and certain regional and local banks. The Company has noticed a continuing trend that although pricing
and loan-to-value ratios remainremains dependent on specific deal terms, generally spreads for non-recourse mortgage financing are
compressing and loan-to-values are gradually
increasingcompressing from levels a year ago. The unsecured debt markets are functioning well and credit spreads are at manageable levels. The Company continues to assess
20122013 and beyond to ensure the Company is prepared if the current credit market conditions deteriorate.
Debt maturities for
20122013 consist of:
$352.6$640.5 million of consolidated debt;
$1.1 billion$570.6 million of unconsolidated joint venture debt; and
$151.8$98.2 million of preferred equity debt, assuming the utilization of extension options where available. The
20122013 consolidated debt maturities are anticipated to be extended, refinanced or repaid with operating cash flows
and borrowings from the Company’s credit facility, which at December 31,
2011,2012, the Company had
approximately $1.5 billion
available under its credit facility.available. The
20122013 unconsolidated joint venture and preferred equity debt maturities are anticipated to be extended or repaid through debt refinancing and partner capital contributions, as deemed appropriate.
The Company intends to maintain strong debt service coverage and fixed charge coverage ratios as part of its commitment to maintain its investment-grade debt ratings. The Company plans to continue strengthening its balance sheet by pursuing deleveraging efforts over time. The Company may, from time-to-time, seek to obtain funds through additional common and preferred equity offerings, unsecured debt financings and/or mortgage/construction loan financings and other capital alternatives.
Since the completion of the Company’s IPO in 1991, the Company has utilized the public debt and equity markets as its principal source of capital for its expansion needs. Since the IPO, the Company has completed additional offerings of its public unsecured debt and equity, raising in the aggregate over
$7.9$8.7 billion. Proceeds from public capital market activities have been used for the purposes of, among other things, repaying indebtedness, acquiring interests in neighborhood and community shopping centers, funding ground-up development projects, expanding and improving properties in the portfolio and other investments.
These markets have experienced extreme volatility but have more recently stabilized. As available, theThe Company will continue to access these
markets.markets, as available.
The Company
establishedhas a
new $1.75 billion unsecured revolving credit facility (the “Credit Facility”) with a group of banks, which is scheduled to expire in October 2015 and has a one-year extension option. This
credit facility, which replaced the Company’s $1.5 billion unsecured U.S. credit facility and CAD $250.0 million credit facility, provides funds to finance general corporate purposes, including (i) property acquisitions, (ii) investments in the Company’s institutional management programs, (iii) development and redevelopment costs and (iv) any short-term working capital requirements. Interest on borrowings under the Credit Facility accrues at LIBOR plus 1.05% and fluctuates in accordance with changes in the Company’s senior debt ratings and has a facility fee of 0.20% per annum. As part of this Credit Facility, the Company has a competitive bid option whereby the Company could auction up to $875.0 million of its requested borrowings to the bank group. This competitive bid option provides the Company the opportunity to obtain pricing below the currently stated spread. In addition, as part of the Credit Facility, the Company has a $500.0 million sub-limit which provides it the opportunity to borrow in alternative currencies such as Canadian Dollars,
British Pounds Sterling, Japanese Yen or Euros. Pursuant to the terms of the Credit Facility, the Company, among other things, is subject to covenants requiring the maintenance of (i) maximum leverage ratios on both unsecured and secured debt and (ii) minimum interest and fixed coverage ratios. As of December 31,
2011,2012, the Credit Facility had a balance of
$238.9$249.9 million outstanding and
$26.9$27.3 million appropriated for letters of credit.
Pursuant to the terms of the Credit Facility, the Company, among other things, is subject to maintenance of various covenants. The Company is currently in compliance with these covenants. The financial covenants for the Credit Facility are as follows:
| | | | |
Covenant | | Must Be | | As of 12/31/11 12 |
Total Indebtedness to Gross Asset Value (“GAV”) | | <60% | | 43%
44 | % |
Total Priority Indebtedness to GAV | | <35% | | 11%
9 | % |
Unencumbered Asset Net Operating Income to Total Unsecured Interest Expense | | >1.75x | | 3.07x
3.23 | x |
Fixed Charge Total Adjusted EBITDA to Total Debt Service | | >1.50x | | 2.37x
2.17 | x |
For a full description of the Credit Facility’s covenants refer to the Credit Agreement dated as of October 27, 2011 filed in the Company’s Current Report on Form 8-K dated November 2, 2011.
During April 2012, the Company obtained a $400.0 million unsecured term loan with a consortium of banks, which accrues interest at LIBOR plus 105 basis points. The term loan is scheduled to mature in April 2014, with three additional one-year options to extend the maturity date, at the Company’s discretion, to April 17, 2017. Pursuant to the terms of the Credit Agreement, the Company, among other things is subject to covenants requiring the maintenance of (i) maximum indebtedness ratios and (ii) minimum interest and fixed charge coverage ratios. Proceeds from this term loan were used for general corporate purposes including the repayment of debt. The term loan covenants are similar to the Credit Facility covenants described above.
During March 2008, the Company obtained a Mexican peso (“MXN”) 1.0 billion term loan, which bears interest at a rate of 8.58%, subject to change in accordance with the Company’s senior debt ratings, and is scheduled to mature in March 2013. The Company utilized proceeds from this term loan to fully repay the outstanding balance of a MXN 500.0 million unsecured revolving credit facility, which was terminated by the Company. Remaining proceeds from this term loan were used for funding MXN denominated investments. As of December 31, 2011,2012, the outstanding balance on this term loan was MXN 1.0 billion (approximately USD $71.5(USD $76.9 million). The Mexican term loan covenants are similar to the Credit Facility covenants described above. The Company is currentlyDuring December 2012, the lender agreed to extend this term loan for an additional five years at an interest rate of TIIE (Equilibrium Interbank Interest Rate) plus 1.35%, which will be effective subsequent to the scheduled maturity in compliance with these covenants.
March 2013. The Company has the option to swap this rate to a Medium Term Notes (“MTNs”) programfixed rate at any time during the term of the loan.
During April 2012, the Company filed a shelf registration statement on Form S-3, which is effective for a term of three years, for the future unlimited offerings, from time-to-time, of debt securities, preferred stock, depositary shares, common stock and common stock warrants. The Company, pursuant to
which itthis shelf registration statement may, from time-to-time, offer for sale its senior unsecured debt for any general corporate purposes, including (i) funding specific liquidity requirements in its business, including property acquisitions, development and redevelopment costs and (ii) managing the Company’s debt maturities. (See Footnote 13 of the Notes to Consolidated Financial Statements included in this Form 10-K.)
The Company’s supplemental indenture governing its medium term notes and senior notes contains the following covenants, all of which the Company is compliant with:
| | | | |
Covenant | | Must Be | | As of 12/31/11 12 |
Consolidated Indebtedness to Total Assets | | <60% | | 39%
38 | % |
Consolidated Secured Indebtedness to Total Assets | | <40% | | 10%
9 | % |
Consolidated Income Available for Debt Service to Maximum Annual Service Charge | | >1.50x | | 3.5x
4.2 | x |
Unencumbered Total Asset Value to Consolidated Unsecured Indebtedness | | >1.50x | | 2.9x
2.8 | x |
For a full description of the various indenture covenants refer to the Indenture dated September 1, 1993, First Supplemental Indenture dated August 4, 1994, the Second Supplemental Indenture dated April 7, 1995, the Third Supplemental Indenture dated June 2, 2006, the Fifth Supplemental Indenture dated as of September 24, 2009, the Fifth Supplemental Indenture dated as of October 31, 2006 and First Supplemental Indenture dated October 31, 2006, as filed with the SEC. See Exhibits Index on page 34,38, for specific filing information. During
2011,2012, the Company
(i) repaid the
$88.0$17.0 million outstanding on its
4.82%5.98% medium-term notes, which matured in
August 2011, andJuly 2012, (ii) repaid the $198.9 million outstanding on its 6.00% senior unsecured note, which matured in November 2012, (iii) assumed
approximately $124.8$185.3 million of individual non-recourse mortgage debt relating to the acquisition of
12seven operating properties, including an increase of
approximately $6.9$6.1 million associated with fair value debt adjustments,
and(iv) paid off
approximately $62.5$284.8 million of mortgage debt that encumbered
1019 operating
properties.properties and (v) assigned five mortgages aggregating $17.1 million in connection with property dispositions.
During April 2009,March 2012, the Company filedissued 16,000,000 Depositary Shares (the "Class I Depositary Shares"), each representing a shelf registration statementone-thousandth fractional interest in a share of the Company's 6.00% Class I Cumulative Redeemable Preferred Stock, $1.00 par value per share (the "Class I Preferred Stock"). Dividends on Form S-3ASR, which is effectivethe Class I Depositary Shares are cumulative and payable quarterly in arrears at the rate of 6.00% per annum based on the $25.00 per share initial offering price, or $1.50 per annum. The Class I Depositary Shares are redeemable, in whole or part, for cash on or after March 20, 2017, at the option of the Company, at a termredemption price of three years,$25.00 per depositary share, plus any accrued and unpaid dividends thereon. The Class I Depositary Shares are not convertible or exchangeable for any other property or securities of the Company. The net proceeds received from this offering of $387.2 million were used for general corporate purposes, including the reduction of borrowings outstanding under the Company’s revolving credit facility and the redemption of shares of the Company’s preferred stock.
During July 2012, the Company issued 9,000,000 Depositary Shares (the "Class J Depositary Shares"), each representing a one-thousandth fractional interest in a share of the Company's 5.50% Class J Cumulative Redeemable Preferred Stock, $1.00 par value per share (the "Class J Preferred Stock"). Dividends on the Class J Depositary Shares are cumulative and payable quarterly in arrears at the rate of 5.50% per annum based on the $25.00 per share initial offering price, or $1.375 per annum. The Class J Depositary Shares are redeemable, in whole or part, for cash on or after July 25, 2017, at the option of the Company, at a redemption price of $25.00 per depositary share, plus any accrued and unpaid dividends thereon. The Class J Depositary Shares are not convertible or exchangeable for any other property or securities of the Company. The net proceeds received from this offering of $217.8 million were used for the future unlimited offerings, from time-to-time,redemption of debt securities,all the outstanding depositary shares representing the Company’s Class F preferred stock, which redemption occurred on August 15, 2012, as discussed below, with the remaining proceeds used towards the redemption of outstanding depositary shares representing the Company’s Class G preferred stock, which redemption occurred on October 10, 2012, as discussed below, and general corporate purposes.
On August 15, 2012, the Company redeemed of all of its outstanding 7,000,000 depositary shares of the Company’s 6.65% Class F Cumulative Redeemable Preferred Stock, $1.00 par value per share (the “Class F Preferred Stock”) for $175.0 million, before payment of accrued and unpaid dividends of $1.0 million. In connection with this redemption the Company recorded a charge of $6.2 million resulting from the difference between the redemption amount and the carrying amount of the Class F Preferred Stock on the Company’s Consolidated Balance Sheets in accordance with the FASB’s guidance on Distinguishing Liabilities from Equity. The $6.2 million was subtracted from net income to arrive at net income available to common stockshareholders and is used in the calculation of earnings per share for the year ended December 31, 2012.
On October 10, 2012, the Company redeemed all of its outstanding 18,400,000 depositary shares of the Company’s 7.75% Class G Cumulative Redeemable Preferred Stock, $1.00 par value per share (the “Class G Preferred Stock”) for $460.0 million, before payment of accrued and unpaid dividends of $8.5 million. In connection with this redemption the Company recorded a non-cash charge of $15.5 million resulting from the difference between the redemption amount and the carrying amount of the Class G Preferred Stock on the Company’s Consolidated Balance Sheets in accordance with the FASB’s guidance on Distinguishing Liabilities from Equity. The $15.5 million was subtracted from net income to arrive at net income available to common stock warrants.shareholders and is used in the calculation of earnings per share for the year ended December 31, 2012.
During November 2012, the Company issued 7,000,000 Depositary Shares (the "Class K Depositary Shares"), each representing a one-thousandth fractional interest in a share of the Company's 5.625% Class K Cumulative Redeemable Preferred Stock, $1.00 par value per share (the "Class K Preferred Stock"). Dividends on the Class K Depositary Shares are cumulative and payable quarterly in arrears at the rate of 5.625% per annum based on the $25.00 per share initial offering price, or $1.40625 per annum. The
Class K Depositary Shares are redeemable, in whole or part, for cash on or after December 7, 2017, at the option of the Company,
will renewat a redemption price of $25.00 per depositary share, plus any accrued and unpaid dividends thereon. The Class K Depositary Shares are not convertible or exchangeable for any other property or securities of the Company. The net proceeds received from this
shelf registration statement duringoffering of $169.1 million, after expenses, were used for general corporate purposes, including funding towards the
first halfrepayment of
2012.maturing Senior Unsecured Notes.
The Company, from time to time, repurchases shares of its common stock in amounts that offset new issuances of common shares in connection with the exercise of stock options or the issuance of restricted stock awards. These share repurchases may occur in open market purchases, privately negotiated transactions or otherwise, subject to prevailing market conditions, the Company’s liquidity requirements, contractual restrictions and other factors. During the year ended December 31,
2011,2012, the Company repurchased
333,9981.6 million shares of the Company’s common stock for
approximately $6.0$30.9 million, of which
$4.9$22.6 million was provided to the Company from stock options exercised.
In addition to the public equity and debt markets as capital sources, the Company may, from time-to-time, obtain mortgage financing on selected properties and construction loans to partially fund the capital needs of its ground-up development projects. As of December 31,
2011,2012, the Company had over
415400 unencumbered property interests in its portfolio.
In connection with its intention to continue to qualify as a REIT for federal income tax purposes, the Company expects to continue paying regular dividends to its stockholders. These dividends will be paid from operating cash flows. The Company’s Board of Directors will continue to evaluate the Company’s dividend policy on a quarterly basis as they monitor sources of capital and evaluate the impact of the economy and capital markets availability on operating fundamentals. Since cash used to pay dividends reduces amounts available for capital investment, the Company generally intends to maintain a conservative dividend payout ratio, reserving such amounts as it considers necessary for the expansion and renovation of shopping centers in its portfolio, debt reduction, the acquisition of interests in new properties and other investments as suitable opportunities arise and such other factors as the Board of Directors considers appropriate. Cash dividends paid were
$382.7 million in 2012, $353.8 million in 2011
as compared toand $307.0 million in
2010 and $331.0 million in 2009.2010.
Although the Company receives substantially all of its rental payments on a monthly basis, it generally intends to continue paying dividends quarterly. Amounts accumulated in advance of each quarterly distribution will be invested by the Company in short-term money market or other suitable instruments. The Company’s Board of Directors declared a quarterly cash dividend of
$0.19$0.21 per common share payable to shareholders of record on January
4, 2012,2, 2013, which was paid on January
17, 2012.15, 2013. Additionally, the Company’s Board of Directors declared a quarterly cash dividend of
$0.19$0.21 per common share payable to shareholders of record on April
4, 2012,3, 2013, which is scheduled to be paid on April
16, 2012.15, 2013.
The Company is subject to taxes on its activities in Canada, Mexico, Brazil, Chile, and Peru.
Dividends paid to the Company from its subsidiaries and joint ventures in Canada, Mexico and Brazil are generally not subject to withholding taxes under the applicable tax treaty with the United States. Chile and Peru impose a 10% and 4.1% withholding tax, respectively, on dividend distributions. Brazil levies a 0.38% transaction tax on return of capital distributions. During
2011,2012, less than $0.1 million of withholding and transaction taxes were withheld from distributions related to foreign activities.
In general, under local country law applicable to the structures the Company has in place and applicable treaties, the repatriation of cash to the Company from its subsidiaries and joint ventures in Canada, Mexico and Brazil generally are not subject to withholding tax. The Company does not anticipate the need to repatriate foreign funds from Chile, Peru or Brazil to provide for its cash flow needs in the U.S. and, as such, no significant withholding or transaction taxes are expected in the foreseeable future.
Contractual Obligations and Other Commitments
The Company has debt obligations relating to its revolving credit facility, MTNs, senior notes, mortgages and construction loans with maturities ranging from less than one year to
2423 years. As of December 31,
2011,2012, the Company’s total debt had a weighted average term to maturity of
approximately 4.63.4 years. In addition, the Company has non-cancelable operating leases pertaining to its shopping center portfolio. As of December 31,
2011,2012, the Company has
4847 shopping center properties that are subject to long-term ground leases where a third party owns and has leased the underlying land to the Company to construct and/or operate a shopping center. In addition, the Company has
1310 non-cancelable operating leases pertaining to its retail store lease portfolio. The following table summarizes the Company’s debt maturities (excluding extension options and fair market value of debt adjustments aggregating
approximately $8.9$10.6 million) and obligations under non-cancelable operating leases as of December 31,
20112012 (in millions):
| | | Payments due by period | | | | |
| Contractual Obligations: | | 2013 | | | 2014 | | | 2015 | | | 2016 | | | 2017 | | | Thereafter | | | Total | |
| Long-Term Debt-Principal(1) | | $ | 659.7 | | | $ | 900.7 | | | $ | 731.2 | | | $ | 553.1 | | | $ | 468.9 | | | $ | 871.1 | | | $ | 4,184.7 | |
| Long-Term Debt-Interest(2) | | $ | 197.8 | | | $ | 152.8 | | | $ | 131.6 | | | $ | 96.9 | | | $ | 67.3 | | | $ | 107.2 | | | $ | 753.6 | |
| Operating Leases: | | | | | | | | | | | | | | | | | | | | | | | | | | | | |
| Ground Leases | | $ | 12.6 | | | $ | 12.2 | | | $ | 11.1 | | | $ | 10.3 | | | $ | 9.9 | | | $ | 172.6 | | | $ | 228.7 | |
| Retail Store Leases | | $ | 2.3 | | | $ | 1.7 | | | $ | 1.3 | | | $ | 1.0 | | | $ | 0.5 | | | $ | 0.1 | | | $ | 6.9 | |
27
| | | | | | | | | | | | | | |
| | 2012 | | 2013 | | 2014 | | 2015 | | 2016 | | Thereafter | | Total |
Long-Term Debt-Principal(1) | $ | 423.6 | $ | 671.4 | $ | 521.6 | $ | 699.6 | $ | 478.5 | $ | 1,310.8 | $ | 4,105.5 |
Long-Term Debt-Interest(2) | $ | 222.8 | $ | 190.8 | $ | 148.8 | $ | 128.9 | $ | 92.2 | $ | 164.6 | $ | 948.1 |
Operating Leases | | | | | | | | | | | | | | |
Ground Leases | $ | 12.7 | $ | 12.7 | $ | 12.3 | $ | 11.3 | $ | 10.5 | $ | 171.5 | $ | 231.0 |
Retail Store Leases | $ | 2.6 | $ | 2.3 | $ | 1.7 | $ | 1.3 | $ | 1.0 | $ | 0.6 | $ | 9.5 |
(1) Maturities utilized do not reflect extension options, which range from one to five years.
(2) For loans which have interest at floating rates, future interest expense was calculated using the rate as of December 31,
2011.2012.
The Company has accrued $16.9 million of non-current uncertain tax benefits and related interest under the provisions of the authoritative guidance that addresses accounting for income taxes, which are included in Other liabilities on the Company’s Consolidated Balance Sheets at December 31,
2011.2012. These amounts are not included in the table above because a reasonably reliable estimate regarding the timing of settlements with the relevant tax authorities, if any, cannot be made.
The Company has
$17.0$100.0 million of medium term notes,
$198.9$175.0 million of unsecured notes,
payable$201.3 million of Canadian unsecured notes, a $76.9 million Mexican term loan, $2.2 million of unsecured debt and
$182.4$85.1 million of secured debt scheduled to mature in
2012.2013. The Company anticipates satisfying these maturities with a combination of operating cash flows, its unsecured revolving credit facility,
exercise of extension options, where available, and new debt issuances.
The Company has issued letters of credit in connection with completion and repayment guarantees for loans encumbering certain of the Company’s redevelopment projects and guarantee of payment related to the Company’s insurance program.
TheseAs of December 31, 2012, these letters of credit aggregate
approximately $33.2$33.6 million.
On a select basis, the Company provides guarantees on interest bearing debt held within real estate joint ventures in which the Company has noncontrolling ownership interests. The Company is often provided with a back-stop guarantee from its partners. The Company had the following outstanding guarantees as of December 31,
20112012 (amounts in millions):
| | | | | |
Name of Joint Venture | Amount of Guarantee | Interest rate | Maturity, with extensions | Terms | Type of debt |
InTown Suites Management, Inc. | $147.5 | LIBOR plus 0.375% (1) | 2012 | 25% partner back-stop | Unsecured credit facility |
Factoria Mall | $ 51.8 | LIBOR plus 4.00% | 2012 | Jointly and severally with partner | Mortgage loan |
RioCan | $ 4.7 | Prime plus 2.25% | 2012 | Jointly with 50% partner | Letter of credit facility |
Towson | $ 10.0 | LIBOR plus 3.50% | 2014 | Jointly and severally with partner | Mortgage loan |
Hillsborough | $ 3.0 | LIBOR plus 1.50% | 2012 | Jointly and severally with partner | Promissory note |
Victoriaville | $ 4.6 | Prime plus 0.50% | 2012 | Jointly and severally with partner | Promissory note |
Westside | $ 3.1 | Prime plus 2.00% | 2013 | Full guarantee | Promissory note |
Sequoia | $ 6.0 | LIBOR plus 0.75% | 2012 | Jointly and severally with partner | Promissory note |
| | | | | |
| Name of Joint Venture | | Amount of Guarantee | | Interest rate | | Maturity, with extensions | | Terms | Type of debt |
| InTown Suites Management, Inc. (1) | | $ | 145.2 | | LIBOR plus 1.15% | | | 2015 | | 25% partner back-stop | Unsecured credit facility |
| Hillsborough | | $ | 2.8 | | LIBOR plus 1.05% | | | 2013 | | Jointly and severally with partner | Promissory note |
| Victoriaville | | $ | 5.1 | | 3.92% | | | 2020 | | Jointly and severally with partner | Promissory note |
(1)
The joint venture obtained an interest rate swap at 5.37% on $128.0During October 2012, a purchase and sale agreement was executed to sell the InTown Suites company and related real estate assets for a gross sales price of $735 million, including $617 million of
thisexisting debt. The
swapsale is
designated ascontingent upon satisfactorily completing a
cash flow hedgedue diligence process and
other closing conditions, including lender approvals. The Company expects to complete this transaction in the first half of 2013. If the transaction is
deemed highly effective; as such, adjustmentscompleted, the Company has agreed to
maintain $145.2 million in preexisting guarantees of outstanding debt to be assumed by the
swaps fair value are recorded at the joint venture level in other comprehensive income.buyer.
In connection with the construction of its development projects and related infrastructure, certain public agencies require posting of performance and surety bonds to guarantee that the Company’s obligations are satisfied. These bonds expire upon the completion of the improvements and infrastructure. As of December 31,
2011,2012, the Company had
approximately $22.8$20.7 million in performance and surety bonds outstanding.
Off-Balance Sheet Arrangements
Unconsolidated Real Estate Joint Ventures
The Company has investments in various unconsolidated real estate joint ventures with varying structures. These joint ventures primarily operate shopping center properties or are established for development projects. Such arrangements are generally with third-party institutional investors, local developers and individuals. The properties owned by the joint ventures are primarily financed with individual non-recourse mortgage loans, however, the Company, on a selective basis, obtains unsecured financing for certain joint ventures. These unsecured financings are guaranteed by the Company with guarantees from the joint venture partners for their proportionate amounts of any guaranty payment the Company is obligated to make (see guarantee table above). Non-recourse mortgage debt is generally defined as debt whereby the lenders’ sole recourse with respect to borrower defaults is limited to the value of the property collateralized by the mortgage. The lender generally does not have recourse against any other assets owned by the borrower or any of the constituent members of the borrower, except for certain specified exceptions listed in the particular loan documents (See Footnote 8 of the Notes to Consolidated Financial Statements included in this Form 10-K). These investments include the following joint ventures:
28
| | | | | | | | |
Venture | Kimco Ownership Interest | Number of Properties | Total GLA (in thousands) | Non-Recourse Mortgage Payable (in millions) | Recourse Notes Payable (in millions) | Number of Encumbered Properties | Average Interest Rate | Weighted Average Term (months) |
|
|
| | | | | | | | |
KimPru (c) | 15.00% | 63 | 10,906 | $1,185.2 | $ - | 48 | 5.59% | 52.6 |
| | | | | | | | |
RioCan Venture (k) | 50.00% | 45 | 9,287 | $925.0 | $ - | 43 | 5.66% | 43.3 |
| | | | | | | | |
KIR (d) | 45.00% | 59 | 12,611 | $911.5 | $ - | 44 | 5.89% | 75.6 |
| | | | | | | | |
KUBS (e) | 17.90%(a) | 42 | 5,882 | $718.9 | $ - | 42 | 5.66% | 47.4 |
| | | | | | | | |
InTown Suites (j) | (l) | 138 | N/A | $474.3 | $ 147.5(b) | 135 | 5.09% | 39.6 |
| | | | | | | | |
BIG Shopping Centers (f) | 37.60%(a) | 23 | 3,748 | $444.5 | $ - | 18 | 5.52% | 57.4 |
| | | | | | | | |
SEB Immobilien (h) | 15.00% | 13 | 1,798 | $243.7 | $ - | 13 | 5.34% | 61.9 |
| | | | | | | | |
CPP (g) | 55.00% | 6 | 2,381 | $166.3 | $ - | 3 | 4.45% | 27.0 |
| | | | | | | | |
Kimco Income Fund (i) | 15.20% | 12 | 1,527 | $164.7 | $ - | 12 | 5.45% | 32.7 |
(a)
Ownership % is a blended rate.
(b)
See Contractual Obligations and Other Commitments regarding guarantees by the Company and its joint venture partners.
(c)
Represents the Company’s joint ventures with Prudential Real Estate Investors.
(d)
Represents the Kimco Income Operating Partnership, L.P., formed in 1998.
(e)
Represents the Company’s joint ventures with UBS Wealth Management North American Property Fund Limited.
(f) Represents the Company’s joint ventures with BIG Shopping Centers (TLV:BIG), an Israeli public company.
(g) Represents the Company’s joint ventures with The Canadian Pension Plan Investment Board (CPPIB).
(h)
Represents the Company’s joint ventures with SEB Immobilien Investment GmbH.
(i)
Represents the Kimco Income Fund, formed in 2004.
(j)
Represents the Company’s joint ventures with Westmont Hospitality Group.
(k)
Represents the Company’s joint ventures with RioCan Real Estate Investment Trust.
(l)
The Company’s share of this investment is subject to fluctuation and is dependent upon property cash flows.
| Venture | | Kimco Ownership Interest | | | Number of Properties | | | Total GLA (in thousands) | | | Non-Recourse Mortgage Payable (in millions) | | | Recourse Notes Payable (in millions) | | | Number of Encumbered Properties | | | Average Interest Rate | | | Weighted Average Term (months) | |
| KimPru (c) | | | 15.0 | % | | | 61 | | | | 10,694 | | | $ | 1,010.2 | | | $ | - | | | | 41 | | | | 5.54 | % | | | 44.5 | |
| | | | | | | | | | | | | | | | | | | | | | | | | | | | | | | | | |
| RioCan Venture (k) | | | 50.0 | % | | | 45 | | | | 9,307 | | | $ | 923.2 | | | $ | - | | | | 37 | | | | 5.16 | % | | | 41.2 | |
| | | | | | | | | | | | | | | | | | | | | | | | | | | | | | | | | |
| KIR (d) | | | 45.0 | % | | | 58 | | | | 12,417 | | | $ | 914.6 | | | $ | - | | | | 43 | | | | 5.22 | % | | | 78.6 | |
| | | | | | | | | | | | | | | | | | | | | | | | | | | | | | | | | |
| KUBS (e) | | | 17.9 | %(a) | | | 40 | | | | 5,741 | | | $ | 691.9 | | | $ | - | | | | 40 | | | | 5.40 | % | | | 39.1 | |
| | | | | | | | | | | | | | | | | | | | | | | | | | | | | | | | �� | |
| InTown Suites (j) | | (l) | | | | 138 | | | | N/A | | | $ | 469.2 | | | $ | 145.2 | (b) | | | 138 | | | | 4.46 | % | | | 46.1 | |
| | | | | | | | | | | | | | | | | | | | | | | | | | | | | | | | | |
| BIG Shopping Centers (f) | | | 37.7 | %(a) | | | 22 | | | | 3,627 | | | $ | 443.8 | | | $ | - | | | | 18 | | | | 5.52 | % | | | 45.5 | |
| | | | | | | | | | | | | | | | | | | | | | | | | | | | | | | | | |
| SEB Immobilien (h) | | | 15.0 | % | | | 13 | | | | 1,800 | | | $ | 243.8 | | | $ | - | | | | 13 | | | | 5.11 | % | | | 55.3 | |
| | | | | | | | | | | | | | | | | | | | | | | | | | | | | | | | | |
| CPP (g) | | | 55.0 | % | | | 6 | | | | 2,424 | | | $ | 141.5 | | | $ | - | | | | 3 | | | | 5.19 | % | | | 31.0 | |
| | | | | | | | | | | | | | | | | | | | | | | | | | | | | | | | | |
| Kimco Income Fund (i) | | | 15.2 | % | | | 12 | | | | 1,522 | | | $ | 161.4 | | | $ | - | | | | 12 | | | | 5.45 | % | | | 20.7 | |
| (a) | Ownership % is a blended rate. |
| (b) | See Contractual Obligations and Other Commitments regarding guarantees by the Company and its joint venture partners. |
| (c) | Represents the Company’s joint ventures with Prudential Real Estate Investors. |
| (d) | Represents the Kimco Income Operating Partnership, L.P., formed in 1998. |
| (e) | Represents the Company’s joint ventures with UBS Wealth Management North American Property Fund Limited. |
| (f) | Represents the Company’s joint ventures with BIG Shopping Centers (TLV:BIG), an Israeli public company. |
| (g) | Represents the Company’s joint ventures with The Canadian Pension Plan Investment Board (CPPIB). |
| (h) | Represents the Company’s joint ventures with SEB Immobilien Investment GmbH. |
| (i) | Represents the Kimco Income Fund, formed in 2004. |
| (j) | Represents the Company’s joint ventures with Westmont Hospitality Group. |
| (k) | Represents the Company’s joint ventures with RioCan Real Estate Investment Trust. |
| (l) | The Company’s share of this investment is subject to fluctuation and is dependent upon property cash flows. |
The Company has various other unconsolidated real estate joint ventures with varying structures. As of December 31,
2011,2012, these other unconsolidated joint ventures had individual non-recourse mortgage loans aggregating
approximately $2.3$1.9 billion and unsecured notes payable aggregating
approximately $3.0$2.8 million. The aggregate debt as of December 31,
2011,2012, of all of the Company’s unconsolidated real estate joint ventures is
approximately $7.7$7.1 billion, of which the Company’s proportionate share of this debt
was approximately $2.9is $2.8 billion.
TheseAs of December 31, 2012, these loans
havehad scheduled maturities ranging from one month to
2310 years and bear interest at rates ranging from
0.68%1.21% to 10.50%
at December 31, 2011.. Approximately
$ 1.1 billion$570.6 million of the aggregate outstanding loan balance matures in
2012,2013, of which the Company’s proportionate share is
approximately $503.2$274.1 million. These maturing loans are anticipated to be repaid with operating cash flows, debt refinancing and partner capital contributions, as deemed appropriate. (See Footnote 8 of the Notes to Consolidated Financial Statements included in this Form 10-K).
Other Real Estate Investments
The Company previously provided capital to owners and developers of real estate properties through its Preferred Equity program. The Company accounts for its preferred equity investments under the equity method of accounting. As of December 31,
2011,2012, the Company’s net investment under the Preferred Equity Program was
approximately $193.4$157.2 million relating to
128107 properties. As of December 31,
2011,2012, these preferred equity investment properties had individual non-recourse mortgage loans aggregating
approximately $892.0$694.3 million. Due to the Company’s preferred position in these investments, the Company’s share of each investment is subject to fluctuation and is dependent upon property cash flows. The Company’s maximum exposure to losses associated with its preferred equity investments is primarily limited to its invested capital.
Additionally, during July 2007, the Company invested
approximately $81.7 million of preferred equity capital in a portfolio comprised of 403 net leased properties which are divided into 30 master leased pools with each pool leased to individual corporate operators. These properties consist of a diverse array of free-standing restaurants, fast food restaurants, convenience and auto parts stores. As of December 31,
2011,2012, the remaining 397 properties were encumbered by third party loans aggregating
approximately $376.8$358.9 million, not including
approximately $69.9$63.7 million in net fair market value of debt adjustments, with interest rates ranging from 5.08% to 10.47%, a weighted average interest rate of 9.3% and maturities ranging from
twoone to
1110 years.
At December 31, 2012, the Company
acquiredhad a 90% equity participation interest in an existing leveraged lease of
30 properties.11 properties, which is reported as a net investment in leveraged lease in accordance with the FASB’s Lease guidance. The properties are leased under a long-term bond-type net lease whose primary term expires in 2016, with the lessee having certain renewal option rights.
The Company’s cash equity investment was approximately $4.0 million. This equity investment is reported as a net investment in leveraged lease in accordance with the FASB’s Lease guidance. The net investment in leveraged lease reflects the original cash investment adjusted by remaining net rentals, estimated unguaranteed residual value, unearned and deferred income and deferred taxes relating to the investment.
29
As of December 31, 2011, 19 of these leveraged lease properties were sold, whereby the proceeds from the sales were used to pay down the mortgage debt by approximately $32.3 million. As of December 31, 2011, the remainingThese 11 properties were encumbered by third-party non-recourse debt of approximately $27.9$21.1 million that is scheduled to fully amortize during the primary term of the lease from a portion of the periodic net rents receivable under the net lease. As an equity participant in the leveraged lease, the Company has no recourse obligation for principal or interest payments on the debt, which is collateralized by a first mortgage lien on the properties and collateral assignment of the lease. Accordingly, this debt has been offset against the related net rental receivable under the lease.
Funds from Operations
Funds From Operations (“FFO”) is a supplemental non-GAAP measure utilized to evaluate the operating performance of real estate companies. The National Association of Real Estate Investment Trusts (“NAREIT”) defines FFO as net income/(loss) attributable to common shareholders computed in accordance with generally accepted accounting principles (“GAAP”), excluding (i) gains or losses from sales of operating real estate assets and (ii) extraordinary items, plus (iii) depreciation and amortization of operating properties and (iv) impairment of depreciable real estate and in substance real estate equity investments and (v) after adjustments for unconsolidated partnerships and joint ventures calculated to reflect funds from operations on the same basis.
The Company presents FFO as it considers it an important supplemental measure of our operating performance and believes it is frequently used by securities analysts, investors and other interested parties in the evaluation of REITs, many of which present FFO when reporting results. Comparison of our presentation of FFO to similarly titled measures for other REITs may not necessarily be meaningful due to possible differences in the application of the NAREIT definition used by such REITs.
The Company also presents FFO as adjusted as an additional supplemental measure as it believes it is more reflective of the Company’s core operating performance. The Company believes FFO as adjusted provides investors and analysts an additional measure in comparing the Company’s performance across reporting periods on a consistent basis by excluding items that we do not believe are indicative of our core operating performance. FFO as adjusted is generally calculated by the Company as FFO excluding certain transactional income and expenses and non-operating impairments which management believes are not reflective of the results within the Company’s operating real estate portfolio.
FFO is a supplemental non-GAAP financial measure of real estate companies’ operating performances, which does not represent cash generated from operating activities in accordance with GAAP and therefore should not be considered an alternative for net income as a measure of liquidity. Our method of calculating FFO and FFO as adjusted may be different from methods used by other REITs and, accordingly, may not be comparable to such other REITs.
The Company’s reconciliation of net income available to common shareholders to FFO and FFO as adjusted for the three months and years ended December 31, 2012 and 2011 is as follows (in thousands, except per share data):
| | | Three Months Ended | | | Year Ended | |
| | | December 31, | | | December 31, | |
| | | 2012 | | | 2011 | | | 2012 | | | 2011 | |
| Net income available to common shareholders | | $ | 59,231 | | | $ | 31,556 | | | $ | 172,673 | | | $ | 109,688 | |
| Gain on disposition of operating property, net of noncontrolling interests | | | (49,023 | ) | | | (11,398 | ) | | | (84,828 | ) | | | (19,444 | ) |
| Gain on disposition of joint venture operating properties | | | (4,914 | ) | | | (819 | ) | | | (27,927 | ) | | | (4,050 | ) |
| Depreciation and amortization - real estate related | | | 63,246 | | | | 60,561 | | | | 257,278 | | | | 246,746 | |
| Depreciation and amortization - real estate joint ventures, net of noncontrolling interests | | | 32,228 | | | | 34,529 | | | | 133,734 | | | | 138,482 | |
| Remeasurement of derivative instrument | | | - | | | | - | | | | - | | | | 4,287 | |
| Impairments of operating properties, net of tax and noncontrolling interests | | | 26,440 | | | | 21,014 | | | | 59,510 | | | | 42,043 | |
| FFO | | | 127,208 | | | | 135,443 | | | | 510,440 | | | | 517,752 | |
| Transactional (income)/charges: | | | | | | | | | | | | | | | | |
| Promote income from other real estate investments | | | (10,996 | ) | | | (9,715 | ) | | | (20,746 | ) | | | (9,829 | ) |
| Promote income from real estate joint ventures | | | (1,151 | ) | | | (2,403 | ) | | | (5,072 | ) | | | (2,675 | ) |
| Gains from development/land sales, net of tax | | | (14 | ) | | | (3,699 | ) | | | (8,309 | ) | | | (5,317 | ) |
| Income from other real estate investments | | | - | | | | - | | | | - | | | | (1,311 | ) |
| Foreign currency exchange gains | | | - | | | | - | | | | - | | | | (839 | ) |
| Acquisition costs | | | 701 | | | | 1,143 | | | | 9,160 | | | | 5,466 | |
| Charge off of assets relating to sales | | | 3,785 | | | | 1,032 | | | | 3,785 | | | | 1,032 | |
| Executive severance costs | | | - | | | | - | | | | 2,472 | | | | - | |
| Excess distribution from a cost method investment | | | (398 | ) | | | (287 | ) | | | (398 | ) | | | (13,116 | ) |
| Gain on sale of marketable securities | | | - | | | | (778 | ) | | | - | | | | (4,895 | ) |
| Impairments on other investments, net of tax and noncontrolling interest | | | - | | | | 3,002 | | | | - | | | | 4,463 | |
| Preferred stock redemption costs | | | 15,490 | | | | - | | | | 21,703 | | | | - | |
| Other expense/(income), net | | | 143 | | | | 227 | | | | 1,166 | | | | (951 | ) |
| Total transactional charges/(income), net | | | 7,560 | | | | (11,932 | ) | | | 3,761 | | | | (27,972 | ) |
| FFO as adjusted | | $ | 134,768 | | | $ | 123,511 | | | $ | 514,201 | | | $ | 489,780 | |
| Weighted average shares outstanding for FFO calculations: | | | | | | | | | | | | | | | | |
| Basic | | | 406,345 | | | | 406,554 | | | | 405,997 | | | | 406,530 | |
| Units | | | 1,522 | | | | 1,532 | | | | 1,455 | | | | 1,528 | |
| Dilutive effect of equity awards | | | 1,829 | | | | 787 | | | | 2,106 | | | | 1,140 | |
| Diluted (1) | | | 409,696 | | | | 408,873 | | | | 409,558 | | | | 409,198 | |
| | | | | | | | | | | | | | | | | |
| FFO per common share – basic | | $ | 0.31 | | | $ | 0.33 | | | $ | 1.26 | | | $ | 1.27 | |
FFO per common share – diluted (1) | | $ | 0.31 | | | $ | 0.33 | | | $ | 1.25 | | | $ | 1.27 | |
| FFO as adjusted per common share – basic | | $ | 0.33 | | | $ | 0.30 | | | $ | 1.26 | | | $ | 1.20 | |
FFO as adjusted per common share – diluted (1) | | $ | 0.33 | | | $ | 0.30 | | | $ | 1.26 | | | $ | 1.20 | |
| (1) | For the three and twelve months ended December 31, 2012 and 2011, the effect of certain convertible units would have an anti-dilutive effect upon the calculation of Income from continuing operations per share. Accordingly, the impact of such conversion has not been included in the determination of diluted earnings per share calculations. |
Same Property Net Operating Income
Same Property Net Operating Income (“Same Property NOI”) is a supplemental non-GAAP financial measure of real estate companies’ operating performance. Same Property NOI is considered by management to be an important performance measure of the Company’s operations and management believes that it is helpful to investors as a measure of the Company’s operating performance because it includes only the net operating income of properties that have been owned for the entire current and prior year reporting periods and excludes properties under development and pending stabilization. As such, Same Property NOI assists in eliminating disparities in net income due to the development, acquisition or disposition of properties during the particular period presented, and thus provides a more consistent performance measure for the comparison of the Company's properties.
Same Property NOI is calculated using revenues from rental properties (excluding straight-line rents, lease termination fees and above/below market rents) less operating and maintenance expense, real estate taxes and rent expense, plus the Company’s proportionate share of Same Property NOI from unconsolidated real estate joint ventures, calculated on the same basis. Same Property NOI includes all properties that are owned for the entire current and prior year reporting periods and excludes properties under development and properties pending stabilization. Properties are deemed stabilized at the earlier of (i) reaching 90% leased or (ii) one year following a projects inclusion in operating real estate (two years for Latin American properties).
Same Property NOI is a supplemental non-GAAP financial measure of real estate companies’ operating performance and should not be considered an alternative to net income in accordance with GAAP or as a measure of liquidity. Our method of calculating Same Property NOI may differ from methods used by other REITs and, accordingly, may not be comparable to such other REITs.
The following is a reconciliation of the Company’s Income from continuing operations to Same Property NOI (in thousands):
| | | Three Months Ended December 31, | | | Year Ended December 31, | |
| | | 2012 | | | 2011 | | | 2012 | | | 2011 | |
| Income from continuing operations | | $ | 45,887 | | | $ | 44,961 | | | $ | 211,978 | | | $ | 158,977 | |
| Adjustments: | | | | | | | | | | | | | | | | |
| Management and other fee income | | | (10,469 | ) | | | (8,494 | ) | | | (37,522 | ) | | | (35,320 | ) |
| General and administrative expenses | | | 29,166 | | | | 28,689 | | | | 124,480 | | | | 118,873 | |
| Impairment of property carrying values | | | 18,463 | | | | 5,320 | | | | 37,111 | | | | 13,077 | |
| Depreciation and amortization | | | 64,070 | | | | 58,307 | | | | 249,493 | | | | 231,712 | |
| Other income | | | 54,601 | | | | 42,883 | | | | 223,441 | | | | 188,468 | |
| (Benefit)/provision for income taxes, net | | | (802 | ) | | | 6,968 | | | | 3,939 | | | | 21,330 | |
| Gains on change in control of interests | | | (1,399 | ) | | | - | | | | (15,555 | ) | | | (569 | ) |
| Equity in income of other real estate investments, net | | | (18,057 | ) | | | (16,690 | ) | | | (53,397 | ) | | | (51,813 | ) |
| Non same property net operating income | | | (38,057 | ) | | | (32,434 | ) | | | (171,115 | ) | | | (128,991 | ) |
| Non operational expense from joint ventures | | | 77,357 | | | | 84,797 | | | | 289,234 | | | | 328,804 | |
| Net operating income from noncontrolling interests | | | (2,239 | ) | | | (2,971 | ) | | | (10,255 | ) | | | (11,565 | ) |
| Same Property NOI | | $ | 218,521 | | | $ | 211,336 | | | $ | 851,832 | | | $ | 832,983 | |
Same Property NOI increased by $7.2 million or 3.4% for the three months ended December 31, 2012, as compared to the corresponding period in 2011. This increase is primarily the result of (i) an increase of $4.7 million related to lease-up and rent commencements, (ii) an increase of $2.0 million in other property and ancillary income, and (iii) the impact from changes in foreign currency exchange rates of $0.5 million.
Same Property NOI increased by $18.8 million or 2.3% for the year ended December 31, 2012, as compared to the corresponding period in 2011. This increase is primarily the result of (i) an increase of $15.8 million related to lease-up and rent commencements and (ii) an increase of $7.8 million in other property and ancillary income, partially offset by, (iii) the negative impact from changes in foreign currency exchange rates of $4.8 million.
Many of the Company's leases contain provisions designed to mitigate the adverse impact of inflation. Such provisions include clauses enabling the Company to receive payment of additional rent calculated as a percentage of tenants' gross sales above pre-determined thresholds, which generally increase as prices rise, and/or escalation clauses, which generally increase rental rates during the terms of the leases. Such escalation clauses often include increases based upon changes in the consumer price index or similar inflation indices. In addition, many of the Company's leases are for terms of less than 10 years, which permits the Company to seek to increase rents to market rates upon renewal. Most of the Company's leases require the tenant to pay an allocable share of operating expenses, including common area maintenance costs, real estate taxes and insurance, thereby reducing the Company's exposure to increases in costs and operating expenses resulting from inflation. The Company periodically evaluates its exposure to short-term interest rates and foreign currency exchange rates and will, from time-to-time, enter into interest rate protection agreements and/or foreign currency hedge agreements which mitigate, but do not eliminate, the effect of changes in interest rates on its floating-rate debt and fluctuations in foreign currency exchange rates.
Market and Economic Conditions; Real Estate and Retail Shopping Sector
In the U.S., economic and market conditions have
stabilized.improved. Credit conditions have continued to
improve withallow increased access and availability to secured mortgage debt and the unsecured bond and equity markets. However, there remains concern over high unemployment rates in the U.S. and concerns over
sovereign debt issues and uncertain economic
recoveryconditions in Europe. These conditions have contributed to slow growth in the U.S. and international economies.
Historically, real estate has been subject to a wide range of cyclical economic conditions that affect various real estate markets and geographic regions with differing intensities and at different times. Different regions of the United States have and may continue to experience varying degrees of economic growth or distress. Adverse changes in general or local economic conditions could result in the inability of some tenants of the Company to meet their lease obligations and could otherwise adversely affect the Company’s ability to attract or retain tenants. The Company’s shopping centers are typically anchored by two or more national tenants who generally offer day-to-day necessities, rather than high-priced luxury items. In addition, the Company seeks to reduce its operating and leasing risks through ownership of a portfolio of properties with a diverse geographic
composition and tenant base.
The Company monitors potential credit issues of its tenants, and analyzes the possible effects to the financial statements of the Company and its unconsolidated joint ventures. In addition to the collectability assessment of outstanding accounts receivable, the Company evaluates the related real estate for recoverability as well as any tenant related deferred charges for recoverability, which may include straight-line rents, deferred lease costs, tenant improvements, tenant inducements and intangible assets.
The retail shopping sector
overall has
been negatively affected by recentcontinued to steadily improve during 2012, however select markets, which experienced rapid expansion prior to the economic
conditions, particularly in the Western part of the United States,recession, such as Nevada, Arizona and
the southern portionselect portions of
California. These conditions may resultCalifornia are experiencing slower growth. If growth in the
Company’sretail shopping sector does not continue, the Company may experience tenants delaying lease commencements or declining to extend or renew leases upon expiration. These conditions also have forced some weaker retailers, in some cases, to declare bankruptcy and/or close stores. Certain retailers have announced store closings even though they have not filed for bankruptcy protection. However, any of these particular store closings affecting the Company often represent a small percentage of the Company’s overall gross leasable area and the Company does not currently expect store closings to have a material adverse effect on the Company’s overall performance.
New Accounting Pronouncements
See Footnote 1 of the Company’s Consolidated Financial Statements included in this Form 10-K.
30
Item 7A. Quantitative and Qualitative Disclosures About Market Risk
The Company’s primary market risk exposure is interest rate risk. The following table presents the Company’s aggregate fixed rate and variable rate domestic and foreign debt obligations outstanding as of December 31,
2011,2012, with corresponding weighted-average interest rates sorted by maturity date. The table does not include extension options where available. Amounts include fair value purchase price allocation adjustments for assumed debt. The information is presented in U.S. dollar equivalents, which is the Company’s reporting currency. The instruments’ actual cash flows are denominated in U.S. dollars, Canadian dollars (CAD), Mexican pesos (MXN) and Chilean Pesos (CLP) as indicated by geographic description ($USD equivalent in millions).
| | | | | | | | |
| 2012 | 2013 | 2014 | 2015 | 2016 | Thereafter | Total | Fair Value |
U.S. Dollar Denominated | | | | | | | | |
Secured Debt | | | | | | | | |
Fixed Rate | $94.9 | $ 115.0 | $ 195.0 | $ 113.8 | $ 179.6 | $ 287.2 | $ 985.5 | $1,064.0 |
Average Interest Rate | 5.86% | 5.84% | 6.48% | 5.43% | 7.24% | 6.41% | 6.34% | |
| | | | | | | | |
Variable Rate | $ 87.5 | $ - | $ 20.7 | $ 6.0 | $ - | $ - | $ 114.2 | $ 116.4 |
Average Interest Rate | 3.78% | - | 2.20% | 0.30% | - | - | 3.31% | |
| | | | | | | | |
Unsecured Debt | | | | | | | | |
Fixed Rate | $ 215.9 | $ 275.4 | $ 295.0 | $ 350.0 | $ 300.0 | $ 890.9 | $ 2,327.2 | $ 2,484.2 |
Average Interest Rate | 6.00% | 5.39% | 5.20% | 5.29% | 5.78% | 5.62% | 5.55% | |
| | | | | | | | |
Variable Rate | $ 3.7 | $ - | $ - | $ 204.6 | $ - | $ - | $ 208.3 | $ 197.2 |
Average Interest Rate | 5.50% | - | - | 0.41% | - | - | 0.49% | |
| | | 2013 | | | 2014 | | | 2015 | | | 2016 | | | 2017 | | | Thereafter | | | Total | | | Fair Value | |
| U.S. Dollar Denominated | | | | | | | | | | | | | | | | | | | | | | | | |
| Secured Debt | | | | | | | | | | | | | | | | | | | | | | | | |
| Fixed Rate | | $ | 85.1 | | | $ | 192.0 | | | $ | 128.9 | | | $ | 256.6 | | | $ | 184.4 | | | $ | 88.4 | | | $ | 935.4 | | | $ | 995.7 | |
| Average Interest Rate | | | 5.99 | % | | | 6.47 | % | | | 5.43 | % | | | 6.69 | % | | | 6.15 | % | | | 6.80 | % | | | 6.31 | % | | | | |
| | | | | | | | | | | | | | | | | | | | | | | | | | | | | | | | | |
| Variable Rate | | $ | - | | | $ | - | | | $ | 6.0 | | | $ | - | | | $ | - | | | $ | 21.5 | | | $ | 27.5 | | | $ | 26.9 | |
| Average Interest Rate | | | - | | | | - | | | | 0.17 | % | | | - | | | | - | | | | 3.06 | % | | | 2.43 | % | | | | |
| | | | | | | | | | | | | | | | | | | | | | | | | | | | | | | | | |
| Unsecured Debt | | | | | | | | | | | | | | | | | | | | | | | | | | | | | | | | |
| Fixed Rate | | $ | 275.0 | | | $ | 294.8 | | | $ | 350.0 | | | $ | 300.0 | | | $ | 290.9 | | | $ | 600.0 | | | $ | 2,110.7 | | | $ | 2,346.0 | |
| Average Interest Rate | | | 5.40 | % | | | 5.20 | % | | | 5.29 | % | | | 5.78 | % | | | 5.70 | % | | | 5.59 | % | | | 5.50 | % | | | | |
| | | | | | | | | | | | | | | | | | | | | | | | | | | | | | | | | |
| Variable Rate | | $ | 2.2 | | | $ | 400.0 | | | $ | 250.0 | | | $ | - | | | $ | - | | | $ | - | | | $ | 652.2 | | | $ | 629.8 | |
| Average Interest Rate | | | 5.50 | % | | | 1.26 | % | | | 1.25 | % | | | - | | | | - | | | | - | | | | 1.27 | % | | | | |
| | | | | | | | | | | | | | | | | | | | | | | | | | | | | | | | | |
| CAD Denominated | | | | | | | | | | | | | | | | | | | | | | | | |
| Unsecured Debt | | | | | | | | | | | | | | | | | | | | | | | | |
| Fixed Rate | | $ | 201.3 | | | $ | - | | | $ | - | | | $ | - | | | $ | - | | | $ | 151.0 | | | $ | 352.3 | | | $ | 363.1 | |
| Average Interest Rate | | | 5.18 | % | | | - | | | | - | | | | - | | | | - | | | | 5.99 | % | | | 5.53 | % | | | | |
| | | | | | | | | | | | | | | | | | | | | | | | | | | | | | | | | |
| MXN Denominated | | | | | | | | | | | | | | | | | | | | | | | | | | | | | | | | |
| Unsecured Debt | | | | | | | | | | | | | | | | | | | | | | | | | | | | | | | | |
| Fixed Rate | | $ | 76.9 | | | $ | - | | | $ | - | | | $ | - | | | $ | - | | | $ | - | | | $ | 76.9 | | | $ | 69.6 | |
| Average Interest Rate | | | 8.58 | % | | | - | | | | - | | | | - | | | | - | | | | - | | | | 8.58 | % | | | | |
| | | | | | | | | | | | | | | | | | | | | | | | | | | | | | | | | |
| CLP Denominated | | | | | | | | | | | | | | | | | | | | | | | | | | | | | | | | |
| Secured Debt | | | | | | | | | | | | | | | | | | | | | | | | | | | | | | | | |
| Variable Rate | | $ | - | | | $ | - | | | $ | - | | | $ | - | | | $ | - | | | $ | 40.3 | | | $ | 40.3 | | | $ | 45.9 | |
| Average Interest Rate | | | - | | | | - | | | | - | | | | - | | | | - | | | | 5.72 | % | | | 5.72 | % | | | | |
| | | | | | | | |
CAD Denominated | | | | | | | | |
Unsecured Debt | | | | | | | | |
Fixed Rate | $ - | $ 195.8 | $ - | $ - | $ - | $ 146.8 | $ 342.6 | $362.4 |
Average Interest Rate | - | 5.18% | - | - | - | 5.99% | 5.53% | |
| | | | | | | | |
Variable Rate | $ - | $ - | $ - | $ 34.3 | $ - | $ - | $ 34.3 | $32.7 |
Average Interest Rate | - | - | - | 2.25% | - | - | 2.25% | |
| | | | | | | | |
MXN Denominated | | | | | | | | |
Unsecured Debt | | | | | | | | |
Fixed Rate | $ - | $ 71.5 | $ - | $ - | $ - | $ - | $ 71.5 | $ 60.2 |
Average Interest Rate | - | 8.58% | - | - | - | - | 8.58% | |
| | | | | | | | |
| | | | | | | | |
CLP Denominated | | | | | | | | |
Secured Debt | | | | | | | | |
Variable Rate | $ - | $ - | $ - | $ - | $ - | $ 30.8 | $ 30.8 | $ 35.1 |
Average Interest Rate | - | - | - | - | - | 5.72% | 5.72% | |
Based on the Company’s variable-rate debt balances, interest expense would have increased by
approximately $3.9$7.2 million in
20112012 if short-term interest rates were 1.0% higher.
The Company also faces foreign currency exchange risk. The following table presents the Company’s foreign investments as of December 31,
2011.2012. Investment amounts are shown in their respective local currencies and the U.S. dollar equivalents:
| | | | |
Foreign Investment (in millions) |
Country | | Local Currency | | US Dollars |
Mexican real estate investments (MXN) | | 8,885.7 | $ | 637.1 |
Canadian real estate joint venture and marketable securities investments (CAD) | | 389.6 | $ | 382.7 |
Chilean real estate investments (CLP) | | 32,595.9 | $ | 62.5 |
Brazilian real estate investments (Brazilian Real) | | 45.3 | $ | 24.1 |
Peruvian real estate investments (Peruvian Nuevo Sol) | | 13.8 | $ | 5.1 |
| Foreign Investment (in millions) | |
| Country | | Local Currency | | | US Dollars | |
| Mexican real estate investments (MXN) | | | 8,881.2 | | | $ | 685.0 | |
| Canadian real estate joint venture and marketable securities investments (CAD) | | | 397.8 | | | $ | 400.5 | |
| Chilean real estate investments (CLP) | | | 37,761.2 | | | $ | 78.9 | |
| Brazilian real estate investments (Brazilian Real) | | | 43.5 | | | $ | 21.3 | |
| Peruvian real estate investments (Peruvian Nuevo Sol) | | | 14.7 | | | $ | 5.9 | |
The foreign currency exchange risk has been partially mitigated, but not eliminated, through the use of local currency denominated debt. The Company has not, and does not plan to, enter into any derivative financial instruments for trading or speculative purposes. As of December 31,
2011,2012, the Company has no other material exposure to market risk.
Item 8. Financial Statements and Supplementary Data
The response to this Item 8 is included in our audited Notes to Consolidated Financial Statements, which are contained in Part IV Item 15 of this Form 10-K.
Item 9. Changes in and Disagreements With Accountants on Accounting and Financial Disclosure
Item 9A. Controls and Procedures
Evaluation of Disclosure Controls and Procedures
The Company’s management, with the participation of the Company’s Chief Executive Officer and Chief Financial Officer, has evaluated the effectiveness of the Company’s disclosure controls and procedures (as such term is defined in Rules 13a-15(e) and 15d-15(e) under the Securities Exchange Act of 1934, as amended (the "Exchange Act")) as of the end of the period covered by this report. Based on such evaluation, the Company’s Chief Executive Officer and Chief Financial Officer have concluded that, as of the end of such period, the Company’s disclosure controls and procedures are effective.
Changes in Internal Control Over Financial Reporting
There have not been any changes in the Company’s internal control over financial reporting (as such term is defined in Rules 13a-15(f) and 15d-15(f) under the Exchange Act) during the fourth fiscal quarter ended December 31,
2011,2012, to which this report relates, that have materially affected, or are reasonably likely to materially affect, the Company’s internal control over financial reporting.
Management’s Report on Internal Control Over Financial Reporting
Our management is responsible for establishing and maintaining adequate internal control over financial reporting, as such term is defined in Exchange Act Rule 13a-15(f) and 15d-15(f). Under the supervision and with the participation of our management, including our Chief Executive Officer and Chief Financial Officer, we conducted an evaluation of the effectiveness of our internal control over financial reporting based on the framework inInternal Control - Integrated Framework issued by the Committee of Sponsoring Organizations of the Treadway Commission. Based on our evaluation under the framework in
Internal Control-Integrated Framework, our management concluded that our internal control over financial reporting was effective as of December 31,
2011.2012.
The effectiveness of our internal control over financial reporting as of December 31,
2011,2012, has been audited by PricewaterhouseCoopers LLP, an independent registered public accounting firm, as stated in their report which is included herein.
Item 9B. Other Information
Item 10. Directors, Executive Officers and Corporate Governance
The information required by this item is incorporated by reference to “Proposal 1—Election of Directors,” “Corporate Governance,” “Committees of the Board of Directors” and “Section 16(a) Beneficial Ownership Reporting Compliance” in our Proxy Statement.
We have adopted a Code of Ethics that applies to all employees. The Code of Ethics is available at the Investors/Governance/Governance Documents section of our website at www.kimcorealty.com. A copy of the Code of Ethics is available in print, free of charge, to stockholders upon request to us at the address set forth in Item 1 of this Annual Report on Form 10-K under the section “Business - Background.” We intend to satisfy the disclosure requirements under the Securities and Exchange Act of 1934, as amended, regarding an amendment to or waiver from a provision of our Code of Ethics by posting such information on our web site.
Item 11. Executive Compensation
The information required by this item is incorporated by reference to “Compensation Discussion and Analysis,” “Executive Compensation Committee Report,” “Compensation Tables” and “Compensation of Directors” in our Proxy Statement.
Item 12. Security Ownership of Certain Beneficial Owners and Management and Related Stockholder Matters
The information required by this item is incorporated by reference to “Security Ownership of Certain Beneficial Owners and Management” and “Compensation Tables” in our Proxy Statement.
Item 13. Certain Relationships and Related Transactions, and Director Independence
The information required by this item is incorporated by reference to “Certain Relationships and Related Transactions” and “Corporate Governance” in our Proxy Statement.
Item 14. Principal Accounting Fees and Services
The information required by this item is incorporated by reference to “Independent Registered Public Accountants” in our Proxy Statement.
Item 15. Exhibits and Financial Statement Schedules
| | | |
Item 15.
| Exhibits and Financial Statement Schedules
| |
| | |
(a) 1. | The following consolidated financial information is included as a separate section of this annual report on Form 10-K. | Form10-K
Report
Page |
| | |
| Report of Independent Registered Public Accounting Firm | 38
42 |
| | |
| Consolidated Financial Statements | |
| | |
| Consolidated Balance Sheets as of December 31, 20112012 and 2010 2011 | 39
43 |
| | |
| Consolidated Statements of Operations for the years ended December 31, 2011, 2010 and 2009
| 40
|
| | |
| Consolidated Statements of Comprehensive Income
for the years ended December 31, 2012, 2011 2010 and 2009 2010 | 41
44 |
| | |
| Consolidated Statements of Changes in Equity Comprehensive Income for the years ended December 31, 2012, 2011 2010 and 2009 2010 | 42
45 |
| | |
| Consolidated Statements of Changes in Equity for the years ended December 31, 2012, 2011 and 2010 | 46 |
| | |
| Consolidated Statements of Cash Flows for the years ended December 31, 2012, 2011 2010 and 2009 2010 | 43
47 |
| | |
| Notes to Consolidated Financial Statements | 44
48 |
| | |
2 | . Financial Statement Schedules - | |
| | |
| Schedule II - | Valuation and Qualifying Accounts | 89
94 |
| Schedule III - | Real Estate and Accumulated Depreciation | 90
95 |
| Schedule IV - | Mortgage Loans on Real Estate | 106
102 |
| | |
| All other schedules are omitted since the required information is not present or is not present in amounts sufficient to require submission of the schedule. | |
| | |
3. | Exhibits - | |
| | |
| The exhibits listed on the accompanying Index to Exhibits are filed as part of this report. | 34
38 |
33
| | | | | | | |
| | Incorporated by Reference | | |
Exhibit Number | Exhibit Description | Form | File No. | Date of Filing | Exhibit Number | Filed Herewith | Page Number |
3.1(a) | Articles of Restatement of the Company, dated January 14, 2011 | 10-K | 1-10899 | 02/28/11 | 3.1(a) | | |
3.1(b) | Articles Supplementary of the Company dated November 8, 2010 | 10-K | 1-10899 | 02/28/11 | 3.1(b) | | |
3.2 | Amended and Restated By-laws of the Company, dated February 25, 2009 | 10-K | 1-10899 | 02/27/09 | 3.2 | | |
4.1 | Agreement of the Company pursuant to Item 601(b)(4)(iii)(A) of Regulation S-K | S-11 | 333-42588 | 09/11/91 | 4.1 | | |
4.2 | Form of Certificate of Designations for the Preferred Stock | S-3 | 333-67552 | 09/10/93 | 4(d) | | |
4.3 | Indenture dated September 1, 1993, between Kimco Realty Corporation and Bank of New York (as successor to IBJ Schroder Bank and Trust Company) | S-3 | 333-67552 | 09/10/93 | 4(a) | | |
4.4 | First Supplemental Indenture, dated as of August 4, 1994 | 10-K | 1-10899 | 03/28/96 | 4.6 | | |
4.5 | Second Supplemental Indenture, dated as of April 7, 1995 | 8-K | 1-10899 | 04/07/95 | 4(a) | | |
4.6 | Indenture dated April 1, 2005, between Kimco North Trust III, Kimco Realty Corporation, as guarantor and BNY Trust Company of Canada, as trustee | 8-K | 1-10899 | 04/25/05 | 4.1 | | |
4.7 | Third Supplemental Indenture, dated as of June 2, 2006 | 8-K | 1-10899 | 06/05/06 | 4.1 | | |
4.8 | Fifth Supplemental Indenture, dated as of October 31, 2006, among Kimco Realty Corporation, Pan Pacific Retail Properties, Inc. and Bank of New York Trust Company, N.A., as trustee | 8-K | 1-10899 | 11/03/06 | 4.1 | | |
4.9 | First Supplemental Indenture, dated as of October 31, 2006, among Kimco Realty Corporation, Pan Pacific Retail Properties, Inc. and Bank of New York Trust Company, N.A., as trustee | 8-K | 1-10899 | 11/03/06 | 4.2 | | |
4.10 | First Supplemental Indenture, dated as of June 2, 2006, among Kimco North Trust III, Kimco Realty Corporation, as guarantor and BNY Trust Company of Canada, as trustee | 10-K | 1-10899 | 02/28/07 | 4.12 | | |
4.11 | Second Supplemental Indenture, dated as of August 16, 2006, among Kimco North Trust III, Kimco Realty Corporation, as guarantor and BNY Trust Company of Canada, as trustee | 10-K | 1-10899 | 02/28/07 | 4.13 | | |
4.12 | Fifth Supplemental Indenture, dated September 24, 2009, between Kimco Realty Corporation and The Bank of New York Mellon, as trustee | 8-K | 1-10899 | 09/24/09 | 4.1 | | |
10.1 | Amended and Restated Stock Option Plan | 10-K | 1-10899 | 03/28/95 | 10.3 | | |
10.2 | $1.5 Billion Credit Agreement, dated as of October 25, 2007, among Kimco Realty Corporation and each of the parties named therein | 10-K/A | 1-10899 | 08/17/10 | 10.6 | | |
10.3 | Employment Agreement between Kimco Realty Corporation and David B. Henry, dated March 8, 2007 | 8-K | 1-10899 | 03/21/07 | 10.1 | | |
10.4 | CAD $250,000,000 Amended and Restated Credit Facility, dated January 11, 2008, with Royal Bank of Canada as issuing lender and administrative agent and various lenders | 10-K | 1-10899 | 02/28/08 | 10.25 | | |
10.5 | Second Amended and Restated 1998 Equity Participation Plan of Kimco Realty Corporation (restated February 25, 2009) | 10-K | 1-10899 | 02/27/09 | 10.9 | | |
10.6 | Employment Agreement between Kimco Realty Corporation and Michael V. Pappagallo, dated November 3, 2008 | 8-K | 1-10899 | 11/10/08 | 10.1 | | |
10.7 | Amendment to Employment Agreement between Kimco Realty Corporation and David B. Henry, dated December 17, 2008 | 8-K | 1-10899 | 01/07/09 | 10.1 | | |
10.8 | Amendment to Employment Agreement between Kimco Realty Corporation and Michael V. Pappagallo, dated December 17, 2008 | 8-K | 1-10899 | 01/07/09 | 10.2 | | |
10.9 | Form of Indemnification Agreement | 10-K | 1-10899 | 02/27/09 | 10.16 | | |
10.10 | Employment Agreement between Kimco Realty Corporation and Glenn G. Cohen, dated February 25, 2009 | 10-K | 1-10899 | 02/27/09 | 10.17 | | |
| | | | | Incorporated by Reference | | | | |
Exhibit Number | | Exhibit Description | | Form | | File No. | | Date of Filing | | Exhibit Number | | Filed Herewith | | Page Number |
| 3.1(a) | | Articles of Restatement of the Company, dated January 14, 2011 | | 10-K | | 1-10899 | | 02/28/11 | | 3.1(a) | | | | |
| 3.1(b) | | Articles Supplementary of the Company dated November 8, 2010 | | 10-K | | 1-10899 | | 02/28/11 | | 3.1(b) | | | | |
| 3.2(a) | | Amended and Restated By-laws of the Company, dated February 25, 2009 | | 10-K | | 1-10899 | | 02/27/09 | | 3.2 | | | | |
| 3.2(b) | | Articles Supplementary of Kimco Realty Corporation, dated March 12, 2012 | | 8-A12B | | 1-10899 | | 03/13/12 | | 3.2 | | | | |
| 3.2(c) | | Articles Supplementary of Kimco Realty Corporation, dated July 17, 2012 | | 8-A12B | | 1-10899 | | 07/18/12 | | 3.2 | | | | |
| 3.2(d) | | Articles Supplementary of Kimco Realty Corporation, dated November 30, 2012 | | 8-A12B | | 1-10899 | | 12/03/12 | | 3.2 | | | | |
| 4.1 | | Agreement of the Company pursuant to Item 601(b)(4)(iii)(A) of Regulation S-K | | S-11 | | 333-42588 | | 09/11/91 | | 4.1 | | | | |
| 4.2 | | Form of Certificate of Designations for the Preferred Stock | | S-3 | | 333-67552 | | 09/10/93 | | 4(d) | | | | |
| 4.3 | | Indenture dated September 1, 1993, between Kimco Realty Corporation and Bank of New York (as successor to IBJ Schroder Bank and Trust Company) | | S-3 | | 333-67552 | | 09/10/93 | | 4(a) | | | | |
| 4.4 | | First Supplemental Indenture, dated as of August 4, 1994 | | 10-K | | 1-10899 | | 03/28/96 | | 4.6 | | | | |
| 4.5 | | Second Supplemental Indenture, dated as of April 7, 1995 | | 8-K | | 1-10899 | | 04/07/95 | | 4(a) | | | | |
| 4.6 | | Indenture dated April 1, 2005, between Kimco North Trust III, Kimco Realty Corporation, as guarantor and BNY Trust Company of Canada, as trustee | | 8-K | | 1-10899 | | 04/25/05 | | 4.1 | | | | |
| 4.7 | | Third Supplemental Indenture, dated as of June 2, 2006 | | 8-K | | 1-10899 | | 06/05/06 | | 4.1 | | | | |
| 4.8 | | Fifth Supplemental Indenture, dated as of October 31, 2006, among Kimco Realty Corporation, Pan Pacific Retail Properties, Inc. and Bank of New York Trust Company, N.A., as trustee | | 8-K | | 1-10899 | | 11/03/06 | | 4.1 | | | | |
| 4.9 | | First Supplemental Indenture, dated as of October 31, 2006, among Kimco Realty Corporation, Pan Pacific Retail Properties, Inc. and Bank of New York Trust Company, N.A., as trustee | | 8-K | | 1-10899 | | 11/03/06 | | 4.2 | | | | |
| 4.10 | | First Supplemental Indenture, dated as of June 2, 2006, among Kimco North Trust III, Kimco Realty Corporation, as guarantor and BNY Trust Company of Canada, as trustee | | 10-K | | 1-10899 | | 02/28/07 | | 4.12 | | | | |
| 4.11 | | Second Supplemental Indenture, dated as of August 16, 2006, among Kimco North Trust III, Kimco Realty Corporation, as guarantor and BNY Trust Company of Canada, as trustee | | 10-K | | 1-10899 | | 02/28/07 | | 4.13 | | | | |
| 4.12 | | Fifth Supplemental Indenture, dated September 24, 2009, between Kimco Realty Corporation and The Bank of New York Mellon, as trustee | | 8-K | | 1-10899 | | 09/24/09 | | 4.1 | | | | |
| 10.1 | | Amended and Restated Stock Option Plan | | 10-K | | 1-10899 | | 03/28/95 | | 10.3 | | | | |
| 10.2 | | Second Amended and Restated 1998 Equity Participation Plan of Kimco Realty Corporation (restated February 25, 2009) | | 10-K | | 1-10899 | | 02/27/09 | | 10.9 | | | | |
| 10.3 | | Form of Indemnification Agreement | | 10-K | | 1-10899 | | 02/27/09 | | 10.16 | | | | |
| 10.4 | | Employment Agreement between Kimco Realty Corporation and Glenn G. Cohen, dated February 25, 2009 | | 10-K | | 1-10899 | | 02/27/09 | | 10.17 | | | | |
| | | | | Incorporated by Reference | | | | |
Exhibit Number | | Exhibit Description | | Form | | File No. | | Date of Filing | | Exhibit Number | | Filed Herewith | | Page Number |
| 10.5 | | 1 billion MXN Credit Agreement, dated as of March 3, 2008, among KRC Mexico Acquisition, LLC, as borrower, Kimco Realty Corporation, as guarantor and each of the parties named therein | | 10-K/A | | 1-10899 | | 08/17/10 | | 10.18 | | | | |
| 10.6 | | Amendment to Employment Agreement between Kimco Realty Corporation and Glenn G. Cohen, dated March 15, 2010 | | 8-K | | 1-10899 | | 03/19/10 | | 10.4 | | | | |
| 10.7 | | Kimco Realty Corporation Executive Severance Plan, dated March 15, 2010 | | 8-K | | 1-10899 | | 03/19/10 | | 10.5 | | | | |
| 10.8 | | Kimco Realty Corporation 2010 Equity Participation Plan | | 8-K | | 1-10899 | | 03/19/10 | | 10.7 | | | | |
| 10.9 | | Form of Performance Share Award Grant Notice and Performance Share Award Agreement | | 8-K | | 1-10899 | | 03/19/10 | | 10.8 | | | | |
| 10.10 | | Underwriting Agreement, dated April 6, 2010, by and among Kimco Realty Corporation, Kimco North Trust III, and each of the parties named therein | | 10-Q | | 1-10899 | | 05/07/10 | | 99.1 | | | | |
| 10.11 | | Third Supplemental Indenture, dated as of April 13, 2010, among Kimco Realty Corporation, as guarantor, Kimco North Trust III, as issuer and BNY Trust Company of Canada, as trustee | | 10-Q | | 1-10899 | | 05/07/10 | | 99.2 | | | | |
| 10.12 | | Credit Agreement, dated as of April 17, 2009, among Kimco Realty Corporation and each of the parties named therein | | 10-K/A | | 1-10899 | | 08/17/10 | | 10.19 | | | | |
| 10.13 | | Underwriting Agreement, dated August 23, 2010, by and among Kimco Realty Corporation and each of the parties named therein | | 8-K | | 1-10899 | | 08/24/10 | | 1.1 | | | | |
| 10.14 | | $1.75 Billion Credit Agreement, dated as of October 27, 2011, among Kimco Realty Corporation and each of the parties named therein | | 8-K | | 1-10899 | | 11/2/11 | | 10.1 | | | | |
| 10.15 | | Agreement and General Release between Kimco Realty Corporation and Barbara Pooley, dated January 18, 2012 | | 8-K | | 1-10899 | | 1/19/12 | | 10.1 | | | | |
| 10.16 | | $400 Million Credit Agreement, dated as of April 17, 2012, among Kimco Realty Corporation as borrower and each of the parties named therein | | 8-K | | 1-10899 | | 4/20/12 | | 10.1 | | | | |
| 10.17 | | First Amendment to the Kimco Realty Corporation Executive Severance Plan, dated as of March 20, 2012 | | 10-Q | | 1-10899 | | 5/10/12 | | 10.3 | | | | |
| 10.18 | | $147.5 Million Credit Agreement, dated as of June 28, 2012, by and among InTown Hospitality Corp. as borrower, Kimco Realty Corporation as guarantor, and each of the parties named therein | | 8-K | | 1-10899 | | 7/03/12 | | 10.1 | | | | |
| 10.19 | | Kimco Realty Corporation 2010 Equity Participation Plan | | S-8 | | 333-184776 | | 11/06/12 | | 99.1 | | | | |
| | | | | | | | | | | | | | | |
| 12.1 | | Computation of Ratio of Earnings to Fixed Charges | | — | | — | | — | | — | | X | | 103 |
| 12.2 | | Computation of Ratio of Earnings to Combined Fixed Charges and Preferred Stock Dividends | | — | | — | | — | | — | | X | | 104 |
| 21.1 | | Significant Subsidiaries of the Company | | — | | — | | — | | — | | X | | 105 |
| 23.1 | | Consent of PricewaterhouseCoopers LLP | | — | | — | | — | | — | | X | | 106 |
| 31.1 | | Certification of the Company’s Chief Executive Officer, David B. Henry, pursuant to Section 302 of the Sarbanes-Oxley Act of 2002 | | — | | — | | — | | — | | X | | 107 |
| 31.2 | | Certification of the Company’s Chief Financial Officer, Glenn G. Cohen, pursuant to Section 302 of the Sarbanes-Oxley Act of 2002 | | — | | — | | — | | — | | X | | 108 |
| 32.1 | | Certification of the Company’s Chief Executive Officer, David B. Henry, and the Company’s Chief Financial Officer, Glenn G. Cohen, pursuant to Section 906 of the Sarbanes-Oxley Act of 2002 | | — | | — | | — | | — | | X | | 109 |
| 99.1 | | Property Chart | | — | | — | �� | — | | — | | X | | 110 |
| 101.INS | | XBRL Instance Document | | — | | — | | — | | — | | X | | |
| 101.SCH | | XBRL Taxonomy Extension Schema | | — | | — | | — | | — | | X | | |
| 101.CAL | | XBRL Taxonomy Extension Calculation Linkbase | | — | | — | | — | | — | | X | | |
| 101.DEF | | XBRL Taxonomy Extension Definition Linkbase | | — | | — | | — | | — | | X | | |
| 101.LAB | | XBRL Taxonomy Extension Label Linkbase | | — | | — | | — | | — | | X | | |
| 101.PRE | | XBRL Taxonomy Extension Presentation Linkbase | | — | | — | | — | | — | | X | | |
SIGNATURES
| | | | | | | | |
| | Incorporated by Reference | | |
Exhibit Number | Exhibit Description | Form | File No. | Date of Filing | Exhibit Number | Filed Herewith | Page Number |
10.11 | $650 Million Credit Agreement, dated as of August 26, 2008, among PK Sale LLC, as borrower, PRK Holdings I LLC, PRK Holdings II LLC and PK Holdings III LLC, as guarantors, Kimco Realty Corporation as guarantor and each of the parties named therein | 10-K/A | 1-10899 | 08/17/10 | 10.17 | | |
10.12 | 1 billion MXN Credit Agreement, dated as of March 3, 2008, among KRC Mexico Acquisition, LLC, as borrower, Kimco Realty Corporation, as guarantor and each of the parties named therein | 10-K/A | 1-10899 | 08/17/10 | 10.18 | | |
10.13 | Second Amendment to Employment Agreement between Kimco Realty Corporation and David B. Henry, dated March 15, 2010 | 8-K | 1-10899 | 03/19/10 | 10.1 | | |
10.14 | Second Amendment to Employment Agreement between Kimco Realty Corporation and Michael V. Pappagallo, dated March 15, 2010 | 8-K | 1-10899 | 03/19/10 | 10.3 | | |
10.15 | Amendment to Employment Agreement between Kimco Realty Corporation and Glenn G. Cohen, dated March 15, 2010 | 8-K | 1-10899 | 03/19/10 | 10.4 | | |
10.16 | Kimco Realty Corporation Executive Severance Plan, dated March 15, 2010 | 8-K | 1-10899 | 03/19/10 | 10.5 | | |
10.17 | Letter Agreement between Kimco Realty Corporation and David B. Henry, dated March 15, 2010 | 8-K | 1-10899 | 03/19/10 | 10.6 | | |
10.18 | Kimco Realty Corporation 2010 Equity Participation Plan | 8-K | 1-10899 | 03/19/10 | 10.7 | | |
10.19 | Form of Performance Share Award Grant Notice and Performance Share Award Agreement | 8-K | 1-10899 | 03/19/10 | 10.8 | | |
10.20 | Underwriting Agreement, dated April 6, 2010, by and among Kimco Realty Corporation, Kimco North Trust III, and each of the parties named therein | 10-Q | 1-10899 | 05/07/10 | 99.1 | | |
10.21 | Third Supplemental Indenture, dated as of April 13, 2010, among Kimco Realty Corporation, as guarantor, Kimco North Trust III, as issuer and BNY Trust Company of Canada, as trustee | 10-Q | 1-10899 | 05/07/10 | 99.2 | | |
10.22 | Credit Agreement, dated as of April 17, 2009, among Kimco Realty Corporation and each of the parties named therein | 10-K/A | 1-10899 | 08/17/10 | 10.19 | | |
10.23 | Underwriting Agreement, dated August 23, 2010, by and among Kimco Realty Corporation and each of the parties named therein | 8-K | 1-10899 | 08/24/10 | 1.1 | | |
10.24 | $1.75 Billion Credit Agreement, dated as of October 27, 2011, among Kimco Realty Corporation and each of the parties named therein | 8-K | 1-10899 | 11/2/11 | 10.1 | | |
| | | | | | | |
12.1 | Computation of Ratio of Earnings to Fixed Charges | — | — | — | — | X | 107 |
12.2 | Computation of Ratio of Earnings to Combined Fixed Charges and Preferred Stock Dividends | — | — | — | — | X | 108 |
21.1 | Subsidiaries of the Company | — | — | — | — | X | 109 |
23.1 | Consent of PricewaterhouseCoopers LLP | — | — | — | — | X | 117 |
31.1 | Certification of the Company’s Chief Executive Officer, David B. Henry, pursuant to Section 302 of the Sarbanes-Oxley Act of 2002 | — | — | — | — | X | 118 |
31.2 | Certification of the Company’s Chief Financial Officer, Glenn G. Cohen, pursuant to Section 302 of the Sarbanes-Oxley Act of 2002 | — | — | — | — | X | 119 |
32.1 | Certification of the Company’s Chief Executive Officer, David B. Henry, and the Company’s Chief Financial Officer, Glenn G. Cohen, pursuant to Section 906 of the Sarbanes-Oxley Act of 2002 | — | — | — | — | X | 120 |
99.1 | Property Chart | — | — | — | — | X | 121 |
101.INS | XBRL Instance Document | — | — | — | — | X | |
101.SCH | XBRL Taxonomy Extension Schema | — | — | — | — | X | |
101.CAL | XBRL Taxonomy Extension Calculation Linkbase | — | — | — | — | X | |
101.DEF | XBRL Taxonomy Extension Definition Linkbase | — | — | — | — | X | |
101.LAB | XBRL Taxonomy Extension Label Linkbase | — | — | — | — | X | |
101.PRE | XBRL Taxonomy Extension Presentation Linkbase | — | — | — | — | X | |
35
SIGNATURES
Pursuant to the requirements of Section 13 or 15(d) of the Securities Exchange Act of 1934, the registrant has duly caused this report to be signed on its behalf by the undersigned, thereunto duly authorized.
KIMCO REALTY CORPORATION
By:
/s/ David B. Henry
David B. Henry
Chief Executive Officer
| KIMCO REALTY CORPORATION | |
| | |
| | | |
| By: | /s/ David B. Henry | |
| | David B. Henry | |
Dated: February
24, 201226, 2013
Pursuant to the requirements of the Securities Exchange Act of 1934, this report has been signed below by the following persons on behalf of the registrant and in the capacities and on the dates indicated.
| | | |
Signature | | Title |
| Date |
| | | | |
/s/ Milton Cooper | | Executive Chairman of the Board of Directors | | February 24, 201226, 2013 |
Milton Cooper | | | | |
| | | | |
/s/ David B. Henry | | Chief Executive Officer and Vice Chairman of | | February 24, 201226, 2013 |
David B. Henry | | the Board of Directors | | |
| | | | |
/s/ Richard G. Dooley | | Director | | February 24, 201226, 2013 |
Richard G. Dooley | | | | |
| | | | |
/s/ Joe Grills | | Director | | February 24, 201226, 2013 |
Joe Grills | | | | |
| | | | |
/s/ F. Patrick Hughes | | Director | | February 24, 201226, 2013 |
F. Patrick Hughes | | | | |
| | | | |
/s/ Frank Lourenso | | Director | | February 24, 201226, 2013 |
Frank Lourenso | | | | |
| | | | |
/s/ Richard Saltzman | | Director | | February 24, 201226, 2013 |
Richard Saltzman | | | | |
| | | | |
/s/ Philip Coviello | | Director | | February 24, 201226, 2013 |
Philip Coviello | | | | |
| | | | |
/s/ Colombe Nicholas | | Director | | February 24, 201226, 2013 |
Colombe Nicholas | | | | |
| | | | |
| | | | |
/s/ Michael V. Pappagallo | | Executive Vice President - | | February 24, 201226, 2013 |
Michael V. Pappagallo | | Chief Operating Officer | | |
| | | | |
/s/ Glenn G. Cohen | | Executive Vice President - | | February 24, 201226, 2013 |
Glenn G. Cohen | | Chief Financial Officer and | | |
| | Treasurer | | |
| | | | |
/s/ Paul Westbrook | | Vice President - | | February 24, 201226, 2013 |
Paul Westbrook | | Chief Accounting Officer | | |
ANNUAL REPORT ON FORM 10-K
ITEM 8, ITEM 15 (a) (1) and (2)
INDEX TO FINANCIAL STATEMENTS
FINANCIAL STATEMENT SCHEDULES
| | |
| Form10-K Page |
| Form10-K
Page
|
| |
KIMCO REALTY CORPORATION AND SUBSIDIARIES | |
| |
Report of Independent Registered Public Accounting Firm | 38
42 |
| |
Consolidated Financial Statements and Financial Statement Schedules: | |
| |
Consolidated Balance Sheets as of December 31, 20112012 and 2010 2011 | 39
43 |
| |
Consolidated Statements of OperationsIncome for the years ended December 31, 2012, 2011 2010 and 2009 2010 | 40
44 |
| |
Consolidated Statements of Comprehensive Income for the years ended December 31, 2012, 2011 and 2010 and 2009
| 41
45 |
| |
Consolidated Statements of Changes in Equity for the years ended December 31, 2012, 2011 2010 and 2009 2010 | 42
46 |
| |
Consolidated Statements of Cash Flows for the years ended December 31, 2012, 2011 2010 and 2009 2010 | 43
47 |
| |
Notes to Consolidated Financial Statements | 44
48 |
| |
Financial Statement Schedules: | |
| |
II. | Valuation and Qualifying Accounts | 89
94 |
III. | Real Estate and Accumulated Depreciation | 90
95 |
IV. | Mortgage Loans on Real Estate | 106
102 |
Report of Independent Registered Public Accounting Firm
To the Board of Directors and Stockholders
of Kimco Realty Corporation:
In our opinion, the consolidated financial statements listed in the index appearing under Item 15(a)(1) present fairly, in all material respects, the financial position of Kimco Realty Corporation and its subsidiaries (the "Company") at December 31, 20112012 and 2010,2011, and the results of their operations and their cash flows for each of the three years in the period ended December 31, 20112012 in conformity with accounting principles generally accepted in the United States of America. In addition, in our opinion, the financial statement schedules listed in the index appearing under Item 15(a)(2) present fairly, in all material respects, the information set forth therein when read in conjunction with the related consolidated financial statements. Also in our opinion, the Company maintained, in all material respects, effective internal control over financial reporting as of December 31, 2011,2012, based on criteria established inInternal Control - Integrated Framework issued by the Committee of Sponsoring Organizations of the Treadway Commission (COSO). The Company's management is responsible for these financial statements and financial statement schedules, for maintaining effective internal control over financial reporting and for its assessment of the effectiveness of internal control over financial reporting, included in Management's Report on Internal Control over Financial Reporting appearing under Item 9A. Our responsibility is to express opinions on these financial statements, on the financial statement schedules, and on the Company's internal control over financial reporting based on our integrated audits. We conducted our audits in accordance with the standards of the Public Company Accounting Oversight Board (United States). Those standards require that we plan and perform the audits to obtain reasonable assurance about whether the financial statements are free of material misstatement and whether effective internal control over financial reporting was maintained in all material respects. Our audits of the financial statements included examining, on a test basis, evidence supporting the amounts and disclosures in the financial statements, assessing the accounting principles used and significant estimates made by management, and evaluating the overall financial statement presentation. Our audit of internal control over financial reporting included obtaining an understanding of internal control over financial reporting, assessing the risk that a material weakness exists, and testing and evaluating the design and operating effectiveness of internal control based on the assessed risk. Our audits also included performing such other procedures as we considered necessary in the circumstances. We believe that our audits provide a reasonable basis for our opinions.
A company’s internal control over financial reporting is a process designed to provide reasonable assurance regarding the reliability of financial reporting and the preparation of financial statements for external purposes in accordance with generally accepted accounting principles. A company’s internal control over financial reporting includes those policies and procedures that (i) pertain to the maintenance of records that, in reasonable detail, accurately and fairly reflect the transactions and dispositions of the assets of the company; (ii) provide reasonable assurance that transactions are recorded as necessary to permit preparation of financial statements in accordance with generally accepted accounting principles, and that receipts and expenditures of the company are being made only in accordance with authorizations of management and directors of the company; and (iii) provide reasonable assurance regarding prevention or timely detection of unauthorized acquisition, use, or disposition of the company’s assets that could have a material effect on the financial statements.
Because of its inherent limitations, internal control over financial reporting may not prevent or detect misstatements. Also, projections of any evaluation of effectiveness to future periods are subject to the risk that controls may become inadequate because of changes in conditions, or that the degree of compliance with the policies or procedures may deteriorate.
/s/ PricewaterhouseCoopers LLP
February
27, 201226, 2013
38
KIMCO REALTY CORPORATION AND SUBSIDIARIES
CONSOLIDATED BALANCE SHEETS
(in
(in thousands, except share information)
| | | | | |
| | | December 31, | | December 31, |
| | | 2011 | | 2010 |
Assets: | | | | |
| Real Estate | | | | |
| Rental property | | | | |
| Land | $ | 1,945,045 | $ | 1,837,348 |
| Building and improvements | | 6,652,537 | | 6,420,405 |
| | | 8,597,582 | | 8,257,753 |
| Less: accumulated depreciation and amortization | | (1,693,090) | | (1,549,380) |
| | | 6,904,492 | | 6,708,373 |
| Real estate under development | | 180,403 | | 335,007 |
| Real estate, net | | 7,084,895 | | 7,043,380 |
| | | | | |
| Investments and advances in real estate joint ventures | | 1,404,214 | | 1,382,749 |
| Other real estate investments | | 344,131 | | 418,564 |
| Mortgages and other financing receivables | | 102,972 | | 108,493 |
| Cash and cash equivalents | | 112,882 | | 125,154 |
| Marketable securities | | 33,540 | | 223,991 |
| Accounts and notes receivable | | 149,807 | | 130,536 |
| Deferred charges and prepaid expenses | | 155,246 | | 147,048 |
| Other assets | | 226,829 | | 253,960 |
Total assets | $ | 9,614,516 | $ | 9,833,875 |
| | | | | |
Liabilities: | | | | |
| Notes payable | $ | 2,983,886 | $ | 2,982,421 |
| Mortgages payable | | 1,085,371 | | 1,046,313 |
| Construction loans payable | | 45,128 | | 30,253 |
| Accounts payable and accrued expenses | | 145,172 | | 154,482 |
| Dividends payable | | 92,159 | | 89,037 |
| Other liabilities | | 287,583 | | 275,023 |
Total liabilities | | 4,639,299 | | 4,577,529 |
Redeemable noncontrolling interests | | 95,074 | | 95,060 |
| | | | | |
Stockholders' equity: | | | | |
| Preferred Stock, $1.00 par value, authorized 3,092,000 shares | | | | |
| Class F Preferred Stock, $1.00 par value, authorized 700,000 shares issued and outstanding 700,000 shares Aggregate liquidation preference $175,000 | | 700 | | 700 |
| Class G Preferred Stock, $1.00 par value, authorized 184,000 shares issued and outstanding 184,000 shares Aggregate liquidation preference $460,000 | | 184 | | 184 |
| Class H Preferred Stock, $1.00 par value, authorized 70,000 shares issued and outstanding 70,000 shares Aggregate liquidation preference $175,000 | | 70 | | 70 |
| Common Stock, $.01 par value, authorized 750,000,000 shares issued and outstanding 406,937,830 and 406,423,514 shares, respectively | | 4,069 | | 4,064 |
| Paid-in capital | | 5,492,022 | | 5,469,841 |
| Cumulative distributions in excess of net income | | (702,999) | | (515,164) |
| | | 4,794,046 | | 4,959,695 |
| Accumulated other comprehensive income | | (107,660) | | (23,853) |
Total stockholders' equity | | 4,686,386 | | 4,935,842 |
| Noncontrolling interests | | 193,757 | | 225,444 |
Total equity | | 4,880,143 | | 5,161,286 |
Total liabilities and equity | $ | 9,614,516 | $ | 9,833,875 |
| | | December 31, | | | December 31, | |
| | | 2012 | | | 2011 | |
| Assets: | | | | | | |
| Real Estate | | | | | | |
| Rental property | | | | | | |
| Land | | $ | 2,024,300 | | | $ | 1,945,045 | |
| Building and improvements | | | 6,825,724 | | | | 6,646,490 | |
| | | | 8,850,024 | | | | 8,591,535 | |
| Less: accumulated depreciation and amortization | | | (1,745,462 | ) | | | (1,693,090 | ) |
| | | | 7,104,562 | | | | 6,898,445 | |
| Real estate under development | | | 97,263 | | | | 179,722 | |
| Real estate, net | | | 7,201,825 | | | | 7,078,167 | |
| | | | | | | | | |
| Investments and advances in real estate joint ventures | | | 1,428,155 | | | | 1,404,214 | |
| Other real estate investments | | | 317,557 | | | | 344,131 | |
| Mortgages and other financing receivables | | | 70,704 | | | | 102,972 | |
| Cash and cash equivalents | | | 141,875 | | | | 112,882 | |
| Marketable securities | | | 36,541 | | | | 33,540 | |
| Accounts and notes receivable | | | 161,113 | | | | 164,053 | |
| Deferred charges and prepaid expenses | | | 171,373 | | | | 161,974 | |
| Other assets | | | 211,664 | | | | 226,829 | |
| Total assets | | $ | 9,740,807 | | | $ | 9,628,762 | |
| | | | | | | | | |
| Liabilities: | | | | | | | | |
| Notes payable | | $ | 3,192,127 | | | $ | 2,983,886 | |
| Mortgages payable | | | 1,003,190 | | | | 1,085,371 | |
| Construction loans payable | | | - | | | | 45,128 | |
| Accounts payable and accrued expenses | | | 111,881 | | | | 125,544 | |
| Dividends payable | | | 96,518 | | | | 92,159 | |
| Other liabilities | | | 323,535 | | | | 321,457 | |
| Total liabilities | | | 4,727,251 | | | | 4,653,545 | |
| Redeemable noncontrolling interests | | | 81,076 | | | | 95,074 | |
| | | | | | | | | |
| Stockholders' equity: | | | | | | | | |
Preferred stock, $1.00 par value, authorized 5,961,200 and 5,146,000 shares, respectively, 102,000 and 954,000 shares issued and outstanding (in series), respectively, Aggregate liquidation preference $975,000 and $810,000, respectively | | | 102 | | | | 954 | |
Common stock, $.01 par value, authorized 750,000,000 shares issued and outstanding 407,782,102 and 406,937,830 shares, respectively | | | 4,078 | | | | 4,069 | |
| Paid-in capital | | | 5,651,170 | | | | 5,492,022 | |
| Cumulative distributions in excess of net income | | | (824,008 | ) | | | (702,999 | ) |
| Accumulated other comprehensive income | | | (66,182 | ) | | | (107,660 | ) |
| Total stockholders' equity | | | 4,765,160 | | | | 4,686,386 | |
| Noncontrolling interests | | | 167,320 | | | | 193,757 | |
| Total equity | | | 4,932,480 | | | | 4,880,143 | |
| Total liabilities and equity | | $ | 9,740,807 | | | $ | 9,628,762 | |
The accompanying notes are an integral part of these consolidated financial statements.
39
KIMCO REALTY CORPORATION AND SUBSIDIARIES
CONSOLIDATED STATEMENTS OF
OPERATIONS(inINCOME
(in thousands, except per share data)
| | | | | | | |
| | | Year Ended December 31, |
| | | 2011 | | 2010 | | 2009 |
Revenues from rental property | $ | 873,694 | $ | 831,207 | $ | 755,446 |
Rental property expenses: | | | | | | |
| Rent | | (13,889) | | (13,757) | | (13,555) |
| Real estate taxes | | (117,237) | | (113,723) | | (108,406) |
| Operating and maintenance | | (124,896) | | (118,641) | | (105,345) |
Impairment of property carrying values | | (5,884) | | (2,253) | | (24,000) |
Mortgage and other financing income | | 7,273 | | 9,405 | | 14,956 |
Management and other fee income | | 35,321 | | 39,918 | | 42,452 |
Depreciation and amortization | | (247,549) | | (232,835) | | (221,750) |
General and administrative expenses | | (118,937) | | (109,152) | | (109,960) |
Interest, dividends and other investment income | | 16,566 | | 21,241 | | 33,077 |
Other (expense)/income, net | | (4,891) | | (4,617) | | 5,528 |
Interest expense | | (225,035) | | (226,102) | | (207,768) |
Early extinguishment of debt charges | | - | | (10,811) | | - |
Income from other real estate investments | | 3,824 | | 3,642 | | 4,654 |
Gain on sale of development properties | | 12,074 | | 2,130 | | 5,751 |
Impairments: | | | | | | |
| Real estate under development | | - | | (11,700) | | (2,100) |
| Investments in other real estate investments | | (3,290) | | (13,442) | | (49,279) |
| Marketable securities and other investments | | (1,580) | | (5,266) | | (30,050) |
| Investments in real estate joint ventures | | (5,123) | | - | | (43,659) |
| Income/(loss) from continuing operations before income taxes, equity in income of joint ventures and equity in income of other real estate investments | | 80,441 | | 45,244 | | (54,008) |
(Provision)/benefit for income taxes, net | | (19,537) | | (3,228) | | 20,061 |
Equity in income of joint ventures, net | | 64,036 | | 34,579 | | 3,420 |
Equity in income of other real estate investments, net | | 51,813 | | 60,846 | | 34,424 |
| Income from continuing operations | | 176,753 | | 137,441 | | 3,897 |
Discontinued operations: | | | | | | |
| Income from discontinued operating properties, net of tax | | 3,565 | | 26,076 | | 13,591 |
| Loss/impairments on operating properties held for sale/sold, net of tax | | (15,663) | | (6,175) | | (15,715) |
| Gain on disposition of operating properties, net of tax | | 17,327 | | 1,932 | | 421 |
| Income/(loss) from discontinued operations, net of tax | | 5,229 | | 21,833 | | (1,703) |
(Loss)/gain on transfer of operating properties | | - | | (57) | | 26 |
Gain on sale of operating properties, net | | 108 | | 2,434 | | 3,841 |
| Total net gain on transfer or sale of operating properties | | 108 | | 2,377 | | 3,867 |
| Net income | | 182,090 | | 161,651 | | 6,061 |
| Net income attributable to noncontrolling interests | | (13,039) | | (18,783) | | (10,003) |
| Net income/(loss) attributable to the Company | | 169,051 | | 142,868 | | (3,942) |
| Preferred stock dividends | | (59,363) | | (51,346) | | (47,288) |
| Net income/(loss) available to common shareholders | $ | 109,688 | $ | 91,522 | $ | (51,230) |
Per common share: | | | | | | |
| Income/(loss) from continuing operations: | | | | | | |
| -Basic | $ | 0.26 | $ | 0.18 | $ | (0.14) |
| -Diluted | $ | 0.26 | $ | 0.18 | $ | (0.14) |
| Net income/(loss) attributable to the Company: | | | | | | |
| -Basic | $ | 0.27 | $ | 0.22 | $ | (0.15) |
| -Diluted | $ | 0.27 | $ | 0.22 | $ | (0.15) |
Weighted average shares: | | | | | | |
| -Basic | | 406,530 | | 405,827 | | 350,077 |
| -Diluted | | 407,669 | | 406,201 | | 350,077 |
Amounts attributable to the Company's common shareholders: | | | | | | |
| Income/(loss) from continuing operations, net of tax | $ | 105,593 | $ | 74,679 | $ | (49,214) |
| Income/(loss) from discontinued operations | | 4,095 | | 16,843 | | (2,016) |
| Net income/(loss) | $ | 109,688 | $ | 91,522 | $ | (51,230) |
| | | Year Ended December 31, | |
| | | 2012 | | | 2011 | | | 2010 | |
| Revenues | | | | | | | | | |
| Revenues from rental properties | | $ | 884,782 | | | $ | 825,737 | | | $ | 786,940 | |
| Management and other fee income | | | 37,522 | | | | 35,320 | | | | 39,866 | |
| Total revenues | | | 922,304 | | | | 861,057 | | | | 826,806 | |
| | | | | | | | | | | | | |
| Operating expenses | | | | | | | | | | | | |
| Rent | | | 12,761 | | | | 13,863 | | | | 13,731 | |
| Real estate taxes | | | 115,282 | | | | 108,782 | | | | 105,336 | |
| Operating and maintenance | | | 118,787 | | | | 114,101 | | | | 108,357 | |
| General and administrative expenses | | | 124,480 | | | | 118,873 | | | | 109,034 | |
| Provision for doubtful accounts | | | 6,880 | | | | 7,723 | | | | 10,642 | |
| Impairment charges | | | 37,111 | | | | 13,077 | | | | 32,661 | |
| Depreciation and amortization | | | 249,493 | | | | 231,712 | | | | 217,205 | |
| Total operating expenses | | | 664,794 | | | | 608,131 | | | | 596,966 | |
| | | | | | | | | | | | | |
| Operating income | | | 257,510 | | | | 252,926 | | | | 229,840 | |
| | | | | | | | | | | | | |
| Other income/(expense) | | | | | | | | | | | | |
| Mortgage financing income | | | 7,504 | | | | 7,273 | | | | 9,405 | |
| Interest, dividends and other investment income | | | 2,170 | | | | 16,567 | | | | 21,229 | |
| Other expense, net | | | (7,971 | ) | | | (4,680 | ) | | | (4,459 | ) |
| Interest expense | | | (227,595 | ) | | | (223,526 | ) | | | (223,032 | ) |
| Early extinguishment of debt | | | - | | | | - | | | | (10,811 | ) |
| Income from other real estate investments | | | 2,451 | | | | 3,824 | | | | 3,653 | |
| Gain on sale of development properties | | | - | | | | 12,074 | | | | 2,080 | |
| | | | | | | | | | | | | |
Income from continuing operations before income taxes, equity in income of joint ventures, gains on change in control of interests and equity in income from other real estate investments | | | 34,069 | | | | 64,458 | | | | 27,905 | |
| | | | | | | | | | | | | |
| Provision for income taxes, net | | | (3,939 | ) | | | (21,330 | ) | | | (3,208 | ) |
| Equity in income of joint ventures, net | | | 112,896 | | | | 63,467 | | | | 34,579 | |
| Gains on change in control of interests | | | 15,555 | | | | 569 | | | | - | |
| Equity in income of other real estate investments, net | | | 53,397 | | | | 51,813 | | | | 60,846 | |
| | | | | | | | | | | | | |
| Income from continuing operations | | | 211,978 | | | | 158,977 | | | | 120,122 | |
| | | | | | | | | | | | | |
| Discontinued operations | | | | | | | | | | | | |
| Income from discontinued operating properties, net of tax | | | 3,084 | | | | 23,021 | | | | 43,366 | |
| Impairment/loss on operating properties sold, net of tax | | | (22,339 | ) | | | (17,343 | ) | | | (6,175 | ) |
| Gain on disposition of operating properties, net of tax | | | 83,253 | | | | 17,327 | | | | 1,961 | |
| Income from discontinued operations | | | 63,998 | | | | 23,005 | | | | 39,152 | |
| | | | | | | | | | | | | |
| Loss on transfer of operating properties, net | | | - | | | | - | | | | (57 | ) |
| Gain on sale of operating properties, net of tax | | | 4,299 | | | | 108 | | | | 2,434 | |
| Total net gain on transfer of operating properties, net | | | 4,299 | | | | 108 | | | | 2,377 | |
| | | | | | | | | | | | | |
| Net income | | | 280,275 | | | | 182,090 | | | | 161,651 | |
| | | | | | | | | | | | | |
| Net income attributable to noncontrolling interests | | | (14,202 | ) | | | (13,039 | ) | | | (18,783 | ) |
| | | | | | | | | | | | | |
| Net income attributable to the Company | | | 266,073 | | | | 169,051 | | | | 142,868 | |
| | | | | | | | | | | | | |
| Preferred stock redemption costs | | | (21,703 | ) | | | - | | | | - | |
| Preferred stock dividends | | | (71,697 | ) | | | (59,363 | ) | | | (51,346 | ) |
| | | | | | | | | | | | | |
| Net income available to the Company's common shareholders | | $ | 172,673 | | | $ | 109,688 | | | $ | 91,522 | |
| | | | | | | | | | | | | |
| Per common share: | | | | | | | | | | | | |
| Income from continuing operations: | | | | | | | | | | | | |
| -Basic | | $ | 0.27 | | | $ | 0.22 | | | $ | 0.14 | |
| -Diluted | | $ | 0.27 | | | $ | 0.21 | | | $ | 0.14 | |
| Net income attributable to the Company: | | | | | | | | | | | | |
| -Basic | | $ | 0.42 | | | $ | 0.27 | | | $ | 0.22 | |
| -Diluted | | $ | 0.42 | | | $ | 0.27 | | | $ | 0.22 | |
| | | | | | | | | | | | | |
| Weighted average shares: | | | | | | | | | | | | |
| -Basic | | | 405,997 | | | | 406,530 | | | | 405,827 | |
| -Diluted | | | 406,689 | | | | 407,669 | | | | 406,201 | |
| | | | | | | | | | | | | |
| Amounts attributable to the Company's common shareholders: | | | | | | | | | | | | |
| Income from continuing operations, net of tax | | $ | 110,406 | | | $ | 88,067 | | | $ | 57,658 | |
| Income from discontinued operations | | | 62,267 | | | | 21,621 | | | | 33,864 | |
| Net income | | $ | 172,673 | | | $ | 109,688 | | | $ | 91,522 | |
The accompanying notes are an integral part of these consolidated financial statements.
40
KIMCO REALTY CORPORATION AND SUBSIDIARIES
CONSOLIDATED STATEMENTS OF COMPREHENSIVE INCOME
(in thousands)
| | | | | | |
| | Year Ended December 31, |
�� | | 2011 | | 2010 | | 2009 |
| | | | | | |
Net income | $ | 182,090 | $ | 161,651 | $ | 6,061 |
Other comprehensive income: | | | | | | |
Change in unrealized (loss)/gain on marketable securities | | (4,065) | | 37,006 | | 43,662 |
Change in unrealized gain/(loss) on interest rate swaps | | 549 | | (420) | | (233) |
Change in foreign currency translation adjustment, net | | (82,228) | | 52,849 | | 20,658 |
Other comprehensive (loss)/income | | (85,744) | | 89,435 | | 64,087 |
| | | | | | |
Comprehensive income | | 96,346 | | 251,086 | | 70,148 |
| | | | | | |
Comprehensive (income)/loss attributable to noncontrolling interests | | (11,102) | | (35,639) | | 9,019 |
| | | | | | |
Comprehensive income attributable to the Company | $ | 85,244 | $ | 215,447 | $ | 79,167 |
| | | Year Ended December 31, | |
| | | | | | | | | | |
| | | 2012 | | | 2011 | | | 2010 | |
| | | | | | | | | | |
| Net income | | $ | 280,275 | | | $ | 182,090 | | | $ | 161,651 | |
| Other comprehensive income: | | | | | | | | | | | | |
| Change in unrealized gain/(loss) on marketable securities, net | | | 3,013 | | | | (4,065 | ) | | | 37,006 | |
| Change in unrealized gain/(loss) on interest rate swaps, net | | | 450 | | | | 549 | | | | (420 | ) |
| Change in foreign currency translation adjustment, net | | | 43,515 | | | | (82,228 | ) | | | 52,849 | |
| Other comprehensive income/(loss) | | | 46,978 | | | | (85,744 | ) | | | 89,435 | |
| | | | | | | | | | | | | |
| Comprehensive income | | | 327,253 | | | | 96,346 | | | | 251,086 | |
| | | | | | | | | | | | | |
| Comprehensive income attributable to noncontrolling interests | | | (19,702 | ) | | | (11,102 | ) | | | (35,639 | ) |
| | | | | | | | | | | | | |
| Comprehensive income attributable to the Company | | $ | 307,551 | | | $ | 85,244 | | | $ | 215,447 | |
The accompanying notes are an integral part of these consolidated financial statements.
41
KIMCO REALTY CORPORATION AND SUBSIDIARIES
CONSOLIDATED STATEMENTS OF CHANGES IN EQUITY
For the Years Ended December 31,
2012, 2011
2010 and
20092010
| | | Cumulative Distributions | | | Accumulated | | | | | | | | | | | | | | | | | | | | | | | | | |
| | | in Excess | | | Other | | | | | | | | | | | | | | | | | | Total | | | | | | | |
| | | of Net | | | Comprehensive | | | Preferred Stock | | | Common Stock | | | Paid-in | | | Stockholders' | | | Noncontrolling | | | Total | |
| | | Income | | | Income | | | Issued | | | Amount | | | Issued | | | Amount | | | Capital | | | Equity | | | Interests | | | Equity | |
| Balance, January 1, 2010 | | $ | (338,738 | ) | | $ | (96,432 | ) | | | 884 | | | $ | 884 | | | | 405,533 | | | $ | 4,055 | | | $ | 5,283,204 | | | $ | 4,852,973 | | | $ | 265,005 | | | $ | 5,117,978 | |
| | | | | | | | | | | | | | | | | | | | | | | | | | | | | | | | | | | | | | | | | |
| Contributions from noncontrolling interests | | | - | | | | - | | | | - | | | | - | | | | - | | | | - | | | | - | | | | - | | | | 2,721 | | | | 2,721 | |
| | | | | | | | | | | | | | | | | | | | | | | | | | | | | | | | | | | | | | | | | |
| Comprehensive income: | | | | | | | | | | | | | | | | | | | | | | | | | | | | | | | | | | | | | | | | |
| Net income | | | 142,868 | | | | - | | | | - | | | | - | | | | - | | | | - | | | | - | | | | 142,868 | | | | 18,783 | | | | 161,651 | |
| Other comprehensive income: | | | | | | | | | | | | | | | | | | | | | | | | | | | | | | | | | | | | | | | | |
| Change in unrealized gain on marketable securities | | | - | | | | 37,006 | | | | - | | | | - | | | | - | | | | - | | | | - | | | | 37,006 | | | | - | | | | 37,006 | |
| Change in unrealized loss on interest rate swaps | | | - | | | | (420 | ) | | | - | | | | - | | | | - | | | | - | | | | - | | | | (420 | ) | | | - | | | | (420 | ) |
| Change in foreign currency translation adjustment | | | - | | | | 35,993 | | | | - | | | | - | | | | - | | | | - | | | | - | | | | 35,993 | | | | 16,856 | | | | 52,849 | |
| | | | | | | | | | | | | | | | | | | | | | | | | | | | | | | | | | | | | | | | | |
| Redeemable noncontrolling interests | | | - | | | | - | | | | - | | | | - | | | | - | | | | - | | | | - | | | | - | | | | (6,500 | ) | | | (6,500 | ) |
Dividends ($0.66 per Common Share; $1.6625 per Class F Depositary Share, $1.9375 per Class G Depositary Share and $0.5798 per Class H Depositary Share, respectively) | | | (319,294 | ) | | | - | | | | - | | | | - | | | | - | | | | - | | | | - | | | | (319,294 | ) | | | - | | | | (319,294 | ) |
| Distributions to noncontrolling interests | | | - | | | | - | | | | - | | | | - | | | | - | | | | - | | | | - | | | | - | | | | (64,658 | ) | | | (64,658 | ) |
| Issuance of common stock | | | - | | | | - | | | | - | | | | - | | | | 353 | | | | 4 | | | | 4,426 | | | | 4,430 | | | | - | | | | 4,430 | |
| Surrender of common stock | | | - | | | | - | | | | - | | | | - | | | | (78 | ) | | | (1 | ) | | | - | | | | (1 | ) | | | - | | | | (1 | ) |
| Issuance of preferred stock | | | - | | | | - | | | | 70 | | | | 70 | | | | - | | | | - | | | | 169,114 | | | | 169,184 | | | | - | | | | 169,184 | |
| Exercise of common stock options | | | - | | | | - | | | | - | | | | - | | | | 616 | | | | 6 | | | | 8,561 | | | | 8,567 | | | | - | | | | 8,567 | |
| Acquisition of noncontrolling interests | | | - | | | | - | | | | - | | | | - | | | | - | | | | - | | | | (7,196 | ) | | | (7,196 | ) | | | (6,763 | ) | | | (13,959 | ) |
| Amortization of equity awards | | | - | | | | - | | | | - | | | | - | | | | - | | | | - | | | | 11,732 | | | | 11,732 | | | | - | | | | 11,732 | |
| Balance, December 31, 2010 | | | (515,164 | ) | | | (23,853 | ) | | | 954 | | | | 954 | | | | 406,424 | | | | 4,064 | | | | 5,469,841 | | | | 4,935,842 | | | | 225,444 | | | | 5,161,286 | |
| | | | | | | | | | | | | | | | | | | | | | | | | | | | | | | | | | | | | | | | | |
| Contributions from noncontrolling interests | | | - | | | | - | | | | - | | | | - | | | | - | | | | - | | | | - | | | | - | | | | 1,045 | | | | 1,045 | |
| | | | | | | | | | | | | | | | | | | | | | | | | | | | | | | | | | | | | | | | | |
| Comprehensive income: | | | | | | | | | | | | | | | | | | | | | | | | | | | | | | | | | | | | | | | | |
| Net income | | | 169,051 | | | | - | | | | - | | | | - | | | | - | | | | - | | | | - | | | | 169,051 | | | | 13,039 | | | | 182,090 | |
| Other comprehensive income, net of tax: | | | | | | | | | | | | | | | | | | | | | | | | | | | | | | | | | | | | | | | | |
| Change in unrealized loss on marketable securities | | | - | | | | (4,065 | ) | | | - | | | | - | | | | - | | | | - | | | | - | | | | (4,065 | ) | | | - | | | | (4,065 | ) |
| Change in unrealized gain on interest rate swaps | | | - | | | | 549 | | | | - | | | | - | | | | - | | | | - | | | | - | | | | 549 | | | | - | | | | 549 | |
| Change in foreign currency translation adjustment | | | - | | | | (80,291 | ) | | | - | | | | - | | | | - | | | | - | | | | - | | | | (80,291 | ) | | | (1,937 | ) | | | (82,228 | ) |
| | | | | | | | | | | | | | | | | | | | | | | | | | | | | | | | | | | | | | | | | |
| Redeemable noncontrolling interests | | | - | | | | - | | | | - | | | | - | | | | - | | | | - | | | | - | | | | - | | | | (6,370 | ) | | | (6,370 | ) |
Dividends ($0.73 per Common Share; $1.6625 per Class F Depositary Share, $1.9375 per Class G Depositary Share and $1.7250 per Class H Depositary Share, respectively) | | | (356,886 | ) | | | - | | | | - | | | | - | | | | - | | | | - | | | | - | | | | (356,886 | ) | | | - | | | | (356,886 | ) |
| Distributions to noncontrolling interests | | | - | | | | - | | | | - | | | | - | | | | - | | | | - | | | | - | | | | - | | | | (13,827 | ) | | | (13,827 | ) |
| Issuance of common stock | | | - | | | | - | | | | - | | | | - | | | | 438 | | | | 5 | | | | 4,936 | | | | 4,941 | | | | - | | | | 4,941 | |
| Surrender of common stock | | | - | | | | - | | | | - | | | | - | | | | (34 | ) | | | (2 | ) | | | (579 | ) | | | (581 | ) | | | - | | | | (581 | ) |
| Repurchase of common stock | | | - | | | | - | | | | - | | | | - | | | | (334 | ) | | | (2 | ) | | | (6,001 | ) | | | (6,003 | ) | | | - | | | | (6,003 | ) |
| Exercise of common stock options | | | - | | | | - | | | | - | | | | - | | | | 444 | | | | 4 | | | | 6,533 | | | | 6,537 | | | | - | | | | 6,537 | |
| Acquisition of noncontrolling interests | | | - | | | | - | | | | - | | | | - | | | | - | | | | - | | | | 4,452 | | | | 4,452 | | | | (23,637 | ) | | | (19,185 | ) |
| Amortization of equity awards | | | - | | | | - | | | | - | | | | - | | | | - | | | | - | | | | 12,840 | | | | 12,840 | | | | - | | | | 12,840 | |
| Balance, December 31, 2011 | | | (702,999 | ) | | | (107,660 | ) | | | 954 | | | | 954 | | | | 406,938 | | | | 4,069 | | | | 5,492,022 | | | | 4,686,386 | | | | 193,757 | | | | 4,880,143 | |
| | | | | | | | | | | | | | | | | | | | | | | | | | | | | | | | | | | | | | | | | |
| Contributions from noncontrolling interests | | | - | | | | - | | | | - | | | | - | | | | - | | | | - | | | | - | | | | - | | | | 1,384 | | | | 1,384 | |
| | | | | | | | | | | | | | | | | | | | | | | | | | | | | | | | | | | | | | | | | |
| Comprehensive income: | | | | | | | | | | | | | | | | | | | | | | | | | | | | | | | | | | | | | | | | |
| Net income | | | 266,073 | | | | - | | | | - | | | | - | | | | - | | | | - | | | | - | | | | 266,073 | | | | 14,202 | | | | 280,275 | |
| Other comprehensive income, net of tax: | | | | | | | | | | | | | | | | | | | | | | | | | | | | | | | | | | | | | | | | |
| Change in unrealized gain on marketable securities | | | - | | | | 3,013 | | | | - | | | | - | | | | - | | | | - | | | | - | | | | 3,013 | | | | - | | | | 3,013 | |
| Change in unrealized gain on interest rate swaps | | | - | | | | 450 | | | | - | | | | - | | | | - | | | | - | | | | - | | | | 450 | | | | - | | | | 450 | |
| Change in foreign currency translation adjustment | | | - | | | | 38,015 | | | | - | | | | - | | | | - | | | | - | | | | - | | | | 38,015 | | | | 5,500 | | | | 43,515 | |
| | | | | | | | | | | | | | | | | | | | | | | | | | | | | | | | | | | | | | | | | |
| Redeemable noncontrolling interests | | | - | | | | - | | | | - | | | | - | | | | - | | | | - | | | | - | | | | - | | | | (6,337 | ) | | | (6,337 | ) |
Dividends ($0.78 per common share; $1.0344 per Class F Depositary Share, $1.5016 per Class G Depositary Share, $1.725 per Class H Depositary Share and $1.1708 per Class I Depositary Share, and $0.5958 per Class J Depositary Share, and $0.0938 per Class K Depositary Share, respectively) | | | (387,082 | ) | | | - | | | | - | | | | - | | | | - | | | | - | | | | - | | | | (387,082 | ) | | | - | | | | (387,082 | ) |
| Distributions to noncontrolling interests | | | - | | | | - | | | | - | | | | - | | | | - | | | | - | | | | - | | | | - | | | | (15,328 | ) | | | (15,328 | ) |
| Issuance of common stock | | | - | | | | - | | | | - | | | | - | | | | 1,096 | | | | 11 | | | | 18,104 | | | | 18,115 | | | | - | | | | 18,115 | |
| Issuance of preferred stock | | | - | | | | - | | | | 32 | | | | 32 | | | | - | | | | - | | | | 774,125 | | | | 774,157 | | | | - | | | | 774,157 | |
| Surrender of common stock | | | - | | | | - | | | | - | | | | - | | | | (111 | ) | | | (1 | ) | | | (2,072 | ) | | | (2,073 | ) | | | - | | | | (2,073 | ) |
| Repurchase of common stock | | | - | | | | - | | | | - | | | | - | | | | (1,636 | ) | | | (16 | ) | | | (30,931 | ) | | | (30,947 | ) | | | - | | | | (30,947 | ) |
| Exercise of common stock options | | | - | | | | - | | | | - | | | | - | | | | 1,495 | | | | 15 | | | | 22,576 | | | | 22,591 | | | | - | | | | 22,591 | |
| Acquisition of noncontrolling interests | | | - | | | | - | | | | - | | | | - | | | | - | | | | - | | | | (95 | ) | | | (95 | ) | | | (25,858 | ) | | | (25,953 | ) |
| Amortization of equity awards | | | - | | | | - | | | | - | | | | - | | | | - | | | | - | | | | 11,557 | | | | 11,557 | | | | - | | | | 11,557 | |
| Redemption of preferred stock | | | - | | | | - | | | | (884 | ) | | | (884 | ) | | | - | | | | - | | | | (634,116 | ) | | | (635,000 | ) | | | - | | | | (635,000 | ) |
| Balance, December 31, 2012 | | $ | (824,008 | ) | | $ | (66,182 | ) | | | 102 | | | $ | 102 | | | | 407,782 | | | $ | 4,078 | | | $ | 5,651,170 | | | $ | 4,765,160 | | | $ | 167,320 | | | $ | 4,932,480 | |
| | | | | | | | | | | | | | | | | | | | | | |
| | Retained Earnings/ (Cumulative Distributions in Excess of Net Income) | | Accumulated Other Comprehensive Income | | | | | | | | | | Paid-in Capital | | Total Stockholders' Equity | | Noncontrolling Interest | | Total Equity | | Comprehensive Income |
| | | | | | |
| | | | | | |
| | | | | | |
| | | | | | |
Preferred Stock | | Common Stock |
Issued | | Amount | | Issued | | Amount |
Balance, January 1, 2009 | $ | (58,162) | $ | (179,541) | | 884 | $ | 884 | | 271,081 | $ | 2,711 | $ | 4,217,806 | $ | 3,983,698 | $ | 221,035 | $ | 4,204,733 | | |
Contributions from noncontrolling interests | | - | | - | | - | | - | | - | | - | | - | | - | | 73,601 | | 73,601 | | |
Comprehensive income: | | | | | | | | | | | | | | | | | | | | | | |
Net (loss)/income | | (3,942) | | - | | - | | - | | - | | - | | - | | (3,942) | | 10,003 | | 6,061 | $ | 6,061 |
Other comprehensive income: | | | | | | | | | | | | | | | | | | | | | | |
Change in unrealized gain on marketable securities | | - | | 43,662 | | - | | - | | - | | - | | - | | 43,662 | | - | | 43,662 | | 43,662 |
Change in unrealized loss on interest rate swaps | | - | | (233) | | - | | - | | - | | - | | - | | (233) | | - | | (233) | | (233) |
Change in foreign currency translation adjustment | | - | | 39,680 | | - | | - | | - | | - | | - | | 39,680 | | (19,022) | | 20,658 | | 20,658 |
Comprehensive income | | | | | | | | | | | | | | | | | | | | | $ | 70,148 |
Redeemable noncontrolling interest | | - | | - | | - | | - | | - | | - | | - | | - | | (6,429) | | (6,429) | | |
Dividends ($0.72 per Common Share; $1.6625 per Class F Depositary Share, and $1.9375 per Class G Depositary Share, respectively) | | (276,634) | | - | | - | | - | | - | | - | | - | | (276,634) | | - | | (276,634) | | |
Distributions to noncontrolling interests | | - | | - | | - | | - | | - | | - | | - | | - | | (9,626) | | (9,626) | | |
Issuance of units | | - | | - | | - | | - | | - | | - | | - | | - | | 126 | | 126 | | |
Unit redemptions | | - | | - | | - | | - | | - | | - | | - | | - | | (346) | | (346) | | |
Issuance of common stock | | - | | - | | - | | - | | 134,344 | | 1,344 | | 1,065,206 | | 1,066,550 | | - | | 1,066,550 | | |
Surrender of common stock | | - | | - | | - | | - | | (8) | | (1) | | (287) | | (288) | | - | | (288) | | |
Exercise of common stock options | | - | | - | | - | | - | | 116 | | 1 | | 1,234 | | 1,235 | | - | | 1,235 | | |
Transfers from noncontrolling interests | | - | | - | | - | | - | | - | | - | | (11,126) | | (11,126) | | (4,337) | | (15,463) | | |
Amortization of equity awards | | - | | - | | - | | - | | - | | - | | 10,371 | | 10,371 | | - | | 10,371 | | |
Balance, December 31, 2009 | | (338,738) | | (96,432) | | 884 | | 884 | | 405,533 | | 4,055 | | 5,283,204 | | 4,852,973 | | 265,005 | | 5,117,978 | | |
Contributions from noncontrolling interests | | - | | - | | - | | - | | - | | - | | - | | - | | 2,721 | | 2,721 | | |
Comprehensive income: | | | | | | | | | | - | | | | | | | | | | | | |
Net income | | 142,868 | | - | | - | | - | | - | | - | | - | | 142,868 | | 18,783 | | 161,651 | $ | 161,651 |
Other comprehensive income: | | | | | | | | | | | | | | | | | | | | | | |
Change in unrealized gain on marketable securities | | - | | 37,006 | | - | | - | | - | | - | | - | | 37,006 | | - | | 37,006 | | 37,006 |
Change in unrealized loss on interest rate swaps | | - | | (420) | | - | | - | | - | | - | | - | | (420) | | - | | (420) | | (420) |
Change in foreign currency translation adjustment | | - | | 35,993 | | - | | - | | - | | - | | - | | 35,993 | | 16,856 | | 52,849 | | 52,849 |
Comprehensive income | | | | | | | | | | | | | | | | | | | | | $ | 251,086 |
Redeemable noncontrolling interests | | - | | - | | - | | - | | - | | - | | - | | - | | (6,500) | | (6,500) | | |
Dividends ($0.66 per Common Share; $1.6625 per Class F Depositary Share, $1.9375 per Class G Depositary Share and $0.5798 per Class H Depositary Share, respectively) | | (319,294) | | - | | - | | - | | - | | - | | - | | (319,294) | | - | | (319,294) | | |
Distributions to noncontrolling interests | | - | | - | | - | | - | | - | | - | | - | | - | | (64,658) | | (64,658) | | |
Issuance of common stock | | - | | - | | - | | - | | 353 | | 4 | | 4,426 | | 4,430 | | - | | 4,430 | | |
Surrender of common stock | | | | | | | | | | (78) | | (1) | | - | | (1) | | - | | (1) | | |
Issuance of preferred stock | | - | | - | | 70 | | 70 | | - | | - | | 169,114 | | 169,184 | | - | | 169,184 | | |
Exercise of common stock options | | - | | - | | - | | - | | 616 | | 6 | | 8,561 | | 8,567 | | - | | 8,567 | | |
Acquisition of noncontrolling interests | | - | | - | | - | | - | | - | | - | | (7,196) | | (7,196) | | (6,763) | | (13,959) | | |
Amortization of equity awards | | - | | - | | - | | - | | - | | - | | 11,732 | | 11,732 | | - | | 11,732 | | |
Balance, December 31, 2010 | | (515,164) | | (23,853) | | 954 | | 954 | | 406,424 | | 4,064 | | 5,469,841 | | 4,935,842 | | 225,444 | | 5,161,286 | | |
Contributions from noncontrolling interests | | - | | - | | - | | - | | - | | - | | - | | - | | 1,045 | | 1,045 | | |
Comprehensive income: | | | | | | | | | | | | | | | | | | | | | | |
Net income | | 169,051 | | - | | - | | - | | - | | - | | - | | 169,051 | | 13,039 | | 182,090 | $ | 182,090 |
Other comprehensive income, net of tax: | | | | | | | | | | | | | | | | | | | | | | |
Change in unrealized gain on marketable securities | | - | | (4,065) | | - | | - | | - | | - | | - | | (4,065) | | - | | (4,065) | | (4,065) |
Change in unrealized loss on interest rate swaps | | - | | 549 | | - | | - | | - | | - | | - | | 549 | | - | | 549 | | 549 |
Change in foreign currency translation adjustment | | - | | (80,291) | | - | | - | | - | | - | | - | | (80,291) | | (1,937) | | (82,228) | | (82,228) |
Comprehensive income | | | | | | | | | | | | | | | | | | | | | $ | 96,346 |
Redeemable noncontrolling interests | | - | | - | | - | | - | | - | | - | | - | | - | | (6,370) | | (6,370) | | |
Dividends ($0.73 per Common Share; $1.6625 per Class F Depositary Share, $1.9375 per Class G Depositary Share and $1.7250 per Class H Depositary Share, respectively) | | (356,886) | | - | | - | | - | | - | | - | | - | | (356,886) | | - | | (356,886) | | |
Distributions to noncontrolling interests | | - | | - | | - | | - | | - | | - | | - | | - | | (13,827) | | (13,827) | | |
Issuance of common stock | | - | | - | | - | | - | | 438 | | 5 | | 4,936 | | 4,941 | | - | | 4,941 | | |
Surrender of common stock | | - | | - | | - | | - | | (34) | | (2) | | (579) | | (581) | | - | | (581) | | |
Repurchase of common stock | | - | | - | | - | | - | | (334) | | (2) | | (6,001) | | (6,003) | | - | | (6,003) | | |
Exercise of common stock options | | - | | - | | - | | - | | 444 | | 4 | | 6,533 | | 6,537 | | - | | 6,537 | | |
Acquisition of noncontrolling interests | | - | | - | | - | | - | | - | | - | | 4,452 | | 4,452 | | (23,637) | | (19,185) | | |
Amortization of equity awards | | - | | - | | - | | - | | - | | - | | 12,840 | | 12,840 | | - | | 12,840 | | |
Balance, December 31, 2011 | $ | (702,999) | $ | (107,660) | | 954 | $ | 954 | | 406,938 | $ | 4,069 | $ | 5,492,022 | $ | 4,686,386 | $ | 193,757 | $ | 4,880,143 | | |
The accompanying notes are an integral part of these consolidated financial statements.
42
KIMCO REALTY CORPORATION AND SUBSIDIARIES
CONSOLIDATED STATEMENTS OF CASH FLOWS(in thousands)
| | | | | | |
| | Year Ended December 31, |
| | 2011 | | 2010 | | 2009 |
Cash flow from operating activities: | | | | | | |
Net income | $ | 182,090 | $ | 161,651 | $ | 6,061 |
Adjustments to reconcile net income to net cash provided by operating activities: | | | | | | |
Depreciation and amortization | | 251,139 | | 247,637 | | 227,776 |
Loss on operating/development properties held for sale/sold/transferred | | - | | 57 | | 285 |
Impairment charges | | 32,763 | | 39,121 | | 175,087 |
Gain on sale of development properties | | (12,074) | | (2,130) | | (5,751) |
Gain on sale of operating properties | | (17,435) | | (4,366) | | (4,666) |
Equity in income of joint ventures, net | | (64,036) | | (55,705) | | (6,309) |
Equity in income from other real estate investments, net | | (51,813) | | (39,642) | | (30,039) |
Distributions from joint ventures and other real estate investments | | 163,048 | | 162,860 | | 136,697 |
Cash retained from excess tax benefits | | - | | (103) | | - |
Change in accounts and notes receivable | | (19,271) | | (17,388) | | (19,878) |
Change in accounts payable and accrued expenses | | (8,082) | | 15,811 | | 4,101 |
Change in other operating assets and liabilities | | (7,716) | | (27,868) | | (79,782) |
Net cash flow provided by operating activities | | 448,613 | | 479,935 | | 403,582 |
Cash flow from investing activities: | | | | | | |
Acquisition of and improvements to operating real estate | | (343,299) | | (182,482) | | (374,501) |
Acquisition of and improvements to real estate under development | | (37,896) | | (41,975) | | (143,283) |
Investment in marketable securities | | - | | (9,041) | | - |
Proceeds from sale/repayments of marketable securities | | 188,003 | | 30,455 | | 80,586 |
Investments and advances to real estate joint ventures | | (171,695) | | (138,796) | | (109,941) |
Reimbursements of advances to real estate joint ventures | | 63,529 | | 85,205 | | 99,573 |
Other real estate investments | | (6,958) | | (12,528) | | (12,447) |
Reimbursements of advances to other real estate investments | | 68,881 | | 30,861 | | 18,232 |
Investment in mortgage loans receivable | | - | | (2,745) | | (7,657) |
Collection of mortgage loans receivable | | 19,148 | | 27,587 | | 48,403 |
Other investments | | (730) | | (4,004) | | (4,247) |
Reimbursements of other investments | | 20,116 | | 8,792 | | 4,935 |
Proceeds from sale of operating properties | | 135,646 | | 238,746 | | 34,825 |
Proceeds from sale of development properties | | 44,495 | | 7,829 | | 22,286 |
Net cash flow (used for)/provided by investing activities | | (20,760) | | 37,904 | | (343,236) |
Cash flow from financing activities: | | | | | | |
| | | | | | |
Principal payments on debt, excluding normal amortization of rental property debt | | (62,470) | | (226,155) | | (437,710) |
Principal payments on rental property debt | | (22,720) | | (23,645) | | (16,978) |
Principal payments on construction loan financings | | (3,428) | | (30,383) | | (255,512) |
Proceeds from mortgage/construction loan financings | | 20,346 | | 13,960 | | 433,221 |
Borrowings under revolving unsecured credit facilities | | 291,231 | | 42,390 | | 351,880 |
Repayment of borrowings under unsecured revolving credit facilities | | (179,094) | | (53,699) | | (928,572) |
Proceeds from issuance of unsecured term loan/notes | | - | | 449,720 | | 520,000 |
Repayment of unsecured term loan/notes | | (92,600) | | (471,725) | | (428,701) |
Financing origination costs | | (11,478) | | (5,330) | | (13,730) |
Redemption of noncontrolling interests | | (26,682) | | (80,852) | | (31,783) |
Dividends paid | | (353,764) | | (306,964) | | (331,024) |
Cash retained from excess tax benefits | | - | | 103 | | - |
Proceeds from issuance of stock | | 6,537 | | 177,837 | | 1,064,444 |
Repurchase of common stock | | (6,003) | | - | | - |
Net cash flow used for financing activities | | (440,125) | | (514,743) | | (74,465) |
Change in cash and cash equivalents | | (12,272) | | 3,096 | | (14,119) |
Cash and cash equivalents, beginning of year | | 125,154 | | 122,058 | | 136,177 |
Cash and cash equivalents, end of year | $ | 112,882 | $ | 125,154 | $ | 122,058 |
Interest paid during the year (net of capitalized interest of $7,086, $14,730, and $21,645 respectively) | $ | 220,270 | $ | 242,033 | $ | 204,672 |
Income taxes paid during the year | $ | 2,606 | $ | 3,278 | $ | 5,082 |
| | | Year Ended December 31, | |
| | | 2012 | | | 2011 | | | 2010 | |
| | | | | | | | | | |
| Cash flow from operating activities: | | | | | | | | | |
| Net income | | $ | 280,275 | | | $ | 182,090 | | | $ | 161,651 | |
Adjustments to reconcile net income to net cash provided by operating activities: | | | | | | | | | | | | |
| Depreciation and amortization | | | 262,742 | | | | 251,139 | | | | 247,637 | |
| Loss on operating/development properties held for sale/sold/transferred | | | - | | | | - | | | | 57 | |
| Impairment charges | | | 59,569 | | | | 32,763 | | | | 39,121 | |
| Gain on sale of development properties | | | - | | | | (12,074 | ) | | | (2,130 | ) |
| Gain on sale of operating properties | | | (94,369 | ) | | | (17,435 | ) | | | (4,366 | ) |
| Equity in income of joint ventures, net | | | (112,896 | ) | | | (63,467 | ) | | | (55,705 | ) |
| Gains on change in control of interests | | | (15,555 | ) | | | (569 | ) | | | - | |
| Equity in income from other real estate investments, net | | | (53,397 | ) | | | (51,813 | ) | | | (39,642 | ) |
| Distributions from joint ventures and other real estate investments | | | 194,110 | | | | 163,048 | | | | 162,860 | |
| Cash retained from excess tax benefits | | | - | | | | - | | | | (103 | ) |
| Change in accounts and notes receivable | | | 2,940 | | | | (19,271 | ) | | | (17,388 | ) |
| Change in accounts payable and accrued expenses | | | (11,281 | ) | | | (8,082 | ) | | | 15,811 | |
| Change in other operating assets and liabilities | | | (33,084 | ) | | | (7,716 | ) | | | (27,868 | ) |
| Net cash flow provided by operating activities | | | 479,054 | | | | 448,613 | | | | 479,935 | |
| | | | | | | | | | | | | |
| Cash flow from investing activities: | | | | | | | | | | | | |
| Acquisition of and improvements to operating real estate | | | (552,469 | ) | | | (343,299 | ) | | | (182,482 | ) |
| Acquisition of and improvements to real estate under development | | | (2,487 | ) | | | (37,896 | ) | | | (41,975 | ) |
| Investment in marketable securities | | | - | | | | - | | | | (9,041 | ) |
| Proceeds from sale/repayments of marketable securities | | | 156 | | | | 188,003 | | | | 30,455 | |
| Investments and advances to real estate joint ventures | | | (219,885 | ) | | | (171,695 | ) | | | (138,796 | ) |
| Reimbursements of investments and advances to real estate joint ventures | | | 187,856 | | | | 63,529 | | | | 85,205 | |
| Other real estate investments | | | (5,638 | ) | | | (6,958 | ) | | | (12,528 | ) |
| Reimbursements of investments and advances to other real estate investments | | | 33,720 | | | | 68,881 | | | | 30,861 | |
| Investment in mortgage loans receivable | | | (16,021 | ) | | | - | | | | (2,745 | ) |
| Collection of mortgage loans receivable | | | 63,600 | | | | 19,148 | | | | 27,587 | |
| Other investments | | | (924 | ) | | | (730 | ) | | | (4,004 | ) |
| Reimbursements of other investments | | | 11,553 | | | | 20,116 | | | | 8,792 | |
| Proceeds from sale of operating properties | | | 449,539 | | | | 135,646 | | | | 238,746 | |
| Proceeds from sale of development properties | | | - | | | | 44,495 | | | | 7,829 | |
| Net cash flow (used for)/provided by investing activities | | | (51,000 | ) | | | (20,760 | ) | | | 37,904 | |
| | | | | | | | | | | | | |
| Cash flow from financing activities: | | | | | | | | | | | | |
Principal payments on debt, excluding normal amortization of rental property debt | | | (284,815 | ) | | | (62,470 | ) | | | (226,155 | ) |
| Principal payments on rental property debt | | | (23,130 | ) | | | (22,720 | ) | | | (23,645 | ) |
| Principal payments on construction loan financings | | | (2,177 | ) | | | (3,428 | ) | | | (30,383 | ) |
| Proceeds from mortgage/construction loan financings | | | 14,776 | | | | 20,346 | | | | 13,960 | |
| Proceeds from (repayment of)/borrowings under unsecured revolving credit facilities, net | | | 8,559 | | | | 112,137 | | | | (11,309 | ) |
| Repayment of unsecured term loan/notes | | | (215,900 | ) | | | (92,600 | ) | | | (471,725 | ) |
| Proceeds from issuance of unsecured term loan/notes | | | 400,000 | | | | - | | | | 449,720 | |
| Financing origination costs | | | (2,138 | ) | | | (11,478 | ) | | | (5,330 | ) |
| Redemption of/distribution to noncontrolling interests | | | (42,315 | ) | | | (26,682 | ) | | | (80,852 | ) |
| Dividends paid | | | (382,722 | ) | | | (353,764 | ) | | | (306,964 | ) |
| Cash retained from excess tax benefits | | | - | | | | - | | | | 103 | |
| Proceeds from issuance of stock | | | 796,748 | | | | 6,537 | | | | 177,837 | |
| Redemption of preferred stock | | | (635,000 | ) | | | - | | | | - | |
| Repurchase of common stock | | | (30,947 | ) | | | (6,003 | ) | | | - | |
| Net cash flow used for financing activities | | | (399,061 | ) | | | (440,125 | ) | | | (514,743 | ) |
| | | | | | | | | | | | | |
| Change in cash and cash equivalents | | | 28,993 | | | | (12,272 | ) | | | 3,096 | |
| | | | | | | | | | | | | |
| Cash and cash equivalents, beginning of period | | | 112,882 | | | | 125,154 | | | | 122,058 | |
| Cash and cash equivalents, end of period | | $ | 141,875 | | | $ | 112,882 | | | $ | 125,154 | |
| | | | | | | | | | | | | |
Interest paid during the period (net of capitalized interest of $1,538, $7,086, and $14,730 respectively) | | $ | 226,775 | | | $ | 220,270 | | | $ | 242,033 | |
| | | | | | | | | | | | | |
| Income taxes paid during the period | | $ | 2,122 | | | $ | 2,606 | | | $ | 3,278 | |
The accompanying notes are an integral part of these consolidated financial statements.
43
KIMCO REALTY CORPORATION AND SUBSIDIARIES
NOTES TO CONSOLIDATED FINANCIAL STATEMENTS
Amounts relating to the number of buildings, square footage, tenant and occupancy data, joint venture debt average interest rates and terms and estimated project costs are unaudited.
1. Summary of Significant Accounting Policies: Kimco Realty Corporation and subsidiaries (the "Company" or "Kimco"), affiliates and related real estate joint ventures are engaged principally in the operation of neighborhood and community shopping centers which are anchored generally by discount department stores, supermarkets or drugstores. The Company also provides property management services for shopping centers owned by affiliated entities, various real estate joint ventures and unaffiliated third parties.
Additionally, in connection with the Tax Relief Extension Act of 1999 (the "RMA"), which became effective January 1, 2001, the Company is permitted to participate in activities which it was precluded from previously in order to maintain its qualification as a Real Estate Investment Trust ("REIT"), so long as these activities are conducted in entities which elect to be treated as taxable subsidiaries under the Internal Revenue Code, as amended (the "Code"), subject to certain limitations. As such, the Company, through its wholly-owned taxable REIT subsidiaries (“TRS”), has been engaged in various retail real estate related opportunities including (i) ground-up development of neighborhood and community shopping centers and the subsequent sale thereof upon completion, (ii) retail real estate management and disposition services which primarily focuses on leasing and disposition strategies of retail real estate controlled by both healthy and distressed and/or bankrupt retailers and (iii) acting as an agent or principal in connection with tax deferred exchange transactions.
The Company seeks to reduce its operating and leasing risks through diversification achieved by the geographic distribution of its properties, avoiding dependence on any single property and a large tenant base. At December 31,
2011,2012, the Company's single largest neighborhood and community shopping center accounted for only
1.6%1.7% of the Company's annualized base rental revenues and only 1.2% of the Company’s total shopping center gross leasable area ("GLA"), including the proportionate share of base rental revenues from properties in which the Company has less than a 100% economic interest. At December 31,
2011,2012, the Company’s five largest tenants were The Home Depot, TJX Companies, Wal-Mart, Sears Holdings and
Kohl’s,Bed Bath & Beyond, which represented 3.0%, 2.9%,
2.5%2.6%,
2.1%2.0% and 1.7%, respectively, of the Company’s annualized base rental revenues, including the proportionate share of base rental revenues from properties in which the Company has less than a 100% economic interest.
The principal business of the Company and its consolidated subsidiaries is the ownership, management, development and operation of retail shopping centers, including complementary services that capitalize on the Company’s established retail real estate expertise. The Company
evaluates performance on a property specific or transactional basis and does not distinguish its principal business or group its operations on a geographical basis for purposes of measuring performance. Accordingly, the Company believes it has a single reportable segment for disclosure purposes in accordance with accounting principles generally accepted in the United States of America ("GAAP").
Principles of Consolidation and Estimates
The accompanying Consolidated Financial Statements include the accounts of Kimco Realty Corporation and subsidiaries (the “Company”). The Company’s subsidiaries includes subsidiaries which are wholly-owned and all entities in which the Company has a controlling interest, including where the Company has been determined to be a primary beneficiary of a variable interest entity (“VIE”) or meets certain criteria of a sole general partner or managing member in accordance with the Consolidation guidance of the Financial Accounting Standards Board (“FASB”) Accounting Standards Codification (“ASC”). All inter-company balances and transactions have been eliminated in consolidation.
GAAP requires the Company's management to make estimates and assumptions that affect the reported amounts of assets and liabilities, the disclosure of contingent assets and liabilities and the reported amounts of revenues and expenses during a reporting period. The most significant assumptions and estimates relate to the valuation of real estate and related intangible assets and liabilities, equity method investments, marketable securities and other investments, including the assessment of impairments, as well as, depreciable lives, revenue recognition, the collectability of trade accounts receivable, realizability of deferred tax assets and the assessment of uncertain tax positions. Application of these assumptions requires the exercise of judgment as to future uncertainties, and, as a result, actual results could differ from these estimates.
KIMCO REALTY CORPORATION AND SUBSIDIARIES
NOTES TO CONSOLIDATED FINANCIAL STATEMENTS, continued
The Company has evaluated subsequent events and transactions for potential recognition or disclosure in its consolidated financial statements.
44
KIMCO REALTY CORPORATION AND SUBSIDIARIES
NOTES TO CONSOLIDATED FINANCIAL STATEMENTS, continued
Real estate assets are stated at cost, less accumulated depreciation and amortization. Upon acquisition of real estate operating properties, the Company estimates the fair value of acquired tangible assets (consisting of land, building, building improvements and tenant improvements) and identified intangible assets and liabilities (consisting of above and below-market leases, in-place leases and tenant relationships), assumed debt and redeemable units issued at the date of acquisition, based on evaluation of information and estimates available at that date. Based on these estimates, the Company allocates the estimated fair value to the applicable assets and liabilities. Fair value is determined based on an exit price approach, which contemplates the price that would be received to sell an asset or paid to transfer a liability in an orderly transaction between market participants at the measurement date. If, up to one year from the acquisition date, information regarding fair value of the assets acquired and liabilities assumed is received and estimates are refined, appropriate adjustments are made to the purchase price allocation on a retrospective basis. The Company expenses transaction costs associated with business combinations in the period incurred.
In allocating the purchase price to identified intangible assets and liabilities of an acquired property, the value of above-market and below-market leases is estimated based on the present value of the difference between the contractual amounts, including fixed rate renewal options, to be paid pursuant to the leases and management’s estimate of the market lease rates and other lease provisions (i.e., expense recapture, base rental changes, etc.) measured over a period equal to the estimated remaining term of the lease. The capitalized above-market or below-market intangible is amortized to rental income over the estimated remaining term of the respective leases, which includes the expected renewal option period. Mortgage debt discounts or premiums are amortized into interest expense over the remaining term of the related debt instrument. Unit discounts and premiums are amortized into noncontrolling interest in income, net over the period from the date of issuance to the earliest redemption date of the units.
In determining the value of in-place leases, management considers current market conditions and costs to execute similar leases in arriving at an estimate of the carrying costs during the expected lease-up period from vacant to existing occupancy. In estimating carrying costs, management includes real estate taxes, insurance, other operating expenses, estimates of lost rental revenue during the expected lease-up periods and costs to execute similar leases including leasing commissions, legal and other related costs based on current market demand.
In estimating the value of tenant relationships, management considers the nature and extent of the existing tenant relationship, the expectation of lease renewals, growth prospects and tenant credit quality, among other factors. The value assigned to in-place leases and tenant relationships is amortized over the estimated remaining term of the leases. If a lease were to be terminated prior to its scheduled expiration, all unamortized costs relating to that lease would be written off.
Depreciation and amortization are provided on the straight-line method over the estimated useful lives of the assets, as follows:
| | |
Buildings and building improvements | | 15 to 50 years |
Fixtures, leasehold and tenant improvements (including certain identified intangible assets) | | Terms of leases or useful lives, whichever is shorter |
Expenditures for maintenance and repairs are charged to operations as incurred. Significant renovations and replacements, which improve and extend the life of the asset, are capitalized. The useful lives of amortizable intangible assets are evaluated each reporting period with any changes in estimated useful lives being accounted for over the revised remaining useful life.
When a real estate asset is identified by management as held-for-sale, the Company ceases depreciation of the asset and estimates the sales price, net of selling costs. If, in management’s opinion, the net sales price of the asset is less than the net book value of the asset, an adjustment to the carrying value would be recorded to reflect the estimated fair value of the property.
KIMCO REALTY CORPORATION AND SUBSIDIARIES
NOTES TO CONSOLIDATED FINANCIAL STATEMENTS, continued
On a continuous basis, management assesses whether there are any indicators, including property operating performance and general market conditions, that the value of the real estate properties (including any related amortizable intangible assets or liabilities) may be impaired. A property value is considered impaired only if management’s estimate of current and projected operating cash flows (undiscounted and unleveraged) of the property over its remaining useful life is less than the net carrying value of the property. Such cash flow projections consider factors such as expected future operating income, trends and prospects, as well as the effects of demand, competition and other factors. To the extent impairment has occurred, the carrying value of the property would be adjusted to an amount to reflect the estimated fair value of the property.
Real Estate Under Development
Real estate under development represents both the ground-up development of neighborhood and community shopping center projects which may be subsequently sold upon completion and projects which the Company may hold as long-term investments. These properties are carried at cost. The cost of land and buildings under development includes specifically identifiable costs.
45
KIMCO REALTY CORPORATION AND SUBSIDIARIES
NOTES TO CONSOLIDATED FINANCIAL STATEMENTS, continued
The capitalized costs include pre-construction costs essential to the development of the property, development costs, construction costs, interest costs, real estate taxes, salaries and related costs of personnel directly involved and other costs incurred during the period of development. The Company ceases cost capitalization when the property is held available for occupancy upon substantial completion of tenant improvements, but no later than one year from the completion of major construction activity. If, in management’s opinion, the net sales price of assets held for resale or the current and projected undiscounted cash flows of these assets to be held as long-term investments is less than the net carrying value, the carrying value would be adjusted to an amount to reflectthat reflects the estimated fair value of the property.
Investments in Unconsolidated Joint Ventures
The Company accounts for its investments in unconsolidated joint ventures under the equity method of accounting as the Company exercises significant influence, but does not control these entities. These investments are recorded initially at cost and subsequently adjusted for cash contributions and distributions. Earnings for each investment are recognized in accordance with each respective investment agreement and where applicable, based upon an allocation of the investment’s net assets at book value as if the investment was hypothetically liquidated at the end of each reporting period.
The Company’s joint ventures and other real estate investments primarily consist of co-investments with institutional and other joint venture partners in neighborhood and community shopping center properties, consistent with its core business. These joint ventures typically obtain non-recourse third-party financing on their property investments, thus contractually limiting the Company’s exposure to losses primarily to the amount of its equity investment; and due to the lender’s exposure to losses, a lender typically will require a minimum level of equity in order to mitigate its risk. The Company, on a limited selective basis, obtains unsecured financing for certain joint ventures. These unsecured financings are guaranteed by the Company with guarantees from the joint venture partners for their proportionate amounts of any guaranty payment the Company is obligated to make.
To recognize the character of distributions from equity investees the Company reviews the nature of the cash distribution to determine the proper character of cash flow distributions as either returns on investment, which would be included in operating activities or returns of investment, which would be included in investing activities.
On a continuous basis, management assesses whether there are any indicators, including the underlying investment property operating performance and general market conditions, that the value of the Company’s investments in unconsolidated joint ventures may be impaired. An investment’s value is impaired only if management’s estimate of the fair value of the investment is less than the carrying value of the investment and such difference is deemed to be other-than-temporary. To the extent impairment has occurred, the loss shall be measured as the excess of the carrying amount of the investment over the estimated fair value of the investment.
The Company’s estimated fair values are based upon a discounted cash flow model for each specific property that includes all estimated cash inflows and outflows over a specified holding period and, where applicable, any estimated debt premiums. Capitalization rates, discount rates and credit spreads utilized in these models are based upon rates that the Company believes to be within a reasonable range of current market rates for each respective property.
KIMCO REALTY CORPORATION AND SUBSIDIARIES
NOTES TO CONSOLIDATED FINANCIAL STATEMENTS, continued
Other Real Estate Investments
Other real estate investments primarily consist of preferred equity investments for which the Company provides capital to owners and developers of real estate. The Company typically accounts for its preferred equity investments on the equity method of accounting, whereby earnings for each investment are recognized in accordance with each respective investment agreement and based upon an allocation of the investment’s net assets at book value as if the investment was hypothetically liquidated at the end of each reporting period.
On a continuous basis, management assesses whether there are any indicators, including the underlying investment property operating performance and general market conditions, that the value of the Company’s Other real estate investments may be impaired. An investment’s value is impaired only if management’s estimate of the fair value of the investment is less than the carrying value of the investment and such difference is deemed to be other-than-temporary. To the extent impairment has occurred, the loss shall be measured as the excess of the carrying amount of the investment over the estimated fair value of the investment.
46
KIMCO REALTY CORPORATION AND SUBSIDIARIES
NOTES TO CONSOLIDATED FINANCIAL STATEMENTS, continued
The Company’s estimated fair values are based upon a discounted cash flow model for each specific property that includes all estimated cash inflows and outflows over a specified holding period and, where applicable, any estimated debt premiums. Capitalization rates, discount rates and credit spreads utilized in these models are based upon rates that the Company believes to be within a reasonable range of current market rates for each respective property.
Mortgages and Other Financing Receivables
Mortgages and other financing receivables consist of loans acquired and loans originated by the Company. Borrowers of these loans are primarily experienced owners, operators or developers of commercial real estate. The Company’s loans are primarily mortgage loans that are collateralized by real estate. Loan receivables are recorded at stated principal amounts, net of any discount or premium or deferred loan origination costs or fees. The related discounts or premiums on mortgages and other loans purchased are amortized or accreted over the life of the related loan receivable. The Company defers certain loan origination and commitment fees, net of certain origination costs and amortizes them as an adjustment of the loan’s yield over the term of the related loan. The Company evaluatesreviews on a quarterly basis credit quality indicators such as (i) payment status to identify performing versus non-performing loans, (ii) changes affecting the underlying real estate collateral and (iii) national and regional economic factors.
Interest income on performing loans is accrued as earned. A non-performing loan is placed on non-accrual status when it is probable that the borrower may be unable to meet interest payments as they become due. Generally, loans 90 days or more past due are placed on non-accrual status unless there is sufficient collateral to assure collectability of bothprincipal and interest. Upon the designation of non-accrual status, all unpaid accrued interest and principalis reserved against through current income. Interest income on each loan to determine whethernon-performing loans is generally recognized on a cash basis. Recognition of interest income on non-performing loans on an accrual basis is resumed when it is impaired. Aprobable that the Company will be able to collect amounts due according to the contractual terms.
The Company has determined that it has one portfolio segment, primarily represented by loans collateralized by real estate, whereby it determines, as needed, reserves for loan losses on an asset-specific basis. The reserve for loan losses reflects management's estimate of loan losses as of the balance sheet date. The reserve is consideredincreased through loan loss expense and is decreased by charge-offs when losses are confirmed through the receipt of assets such as cash or via ownership control of the underlying collateral in full satisfaction of the loan upon foreclosure or when significant collection efforts have ceased.
The Company considers a loan to be impaired when, based upon current information and events, it is probable that the Company will be unable to collect all amounts due under the existing contractual terms.
When aA reserve allowance is established for an impaired loan
is considered to be impaired,when the
amount of loss is calculated by comparing the recorded investment to the fair value determined by discounting the expected future cash flows at the loan’s effective interest rate or to theestimated fair value of the underlying collateral
if(for collateralized loans) or the
present value of expected future cash flows is lower than the carrying value of the loan. An internal valuation is performed generally using the income approach to estimate the fair value of the collateral at the time a loan is
collateralized. Interest income on performing loansdetermined to be impaired. The model is
accrued as earned. Interest income on impaired loans is recognized onupdated if circumstances indicate a
cash basis.significant change in value has occurred. The Company does not provide for an additional allowance for loan losses based on the grouping of loans as the Company believes the characteristics of the loans are not sufficiently similar to allow an evaluation of these loans as a group for a possible loan loss allowance. As such, all of the Company’s loans are evaluated individually for impairment purposes.
KIMCO REALTY CORPORATION AND SUBSIDIARIES
NOTES TO CONSOLIDATED FINANCIAL STATEMENTS, continued
Cash and Cash Equivalents
Cash and cash equivalents (demand deposits in banks, commercial paper and certificates of deposit with original maturities of three months or less) includes tenants' security deposits, escrowed funds and other restricted deposits
approximating $5.6of $4.0 million and
$3.9$5.6 million as of December 31,
2012 and 2011,
and 2010, respectively.
Cash and cash equivalent balances may, at a limited number of banks and financial institutions, exceed insurable amounts. The Company believes it mitigates risk by investing in or through major financial institutions and primarily in funds that are currently U.S. federal government insured. Recoverability of investments is dependent upon the performance of the issuers.
The Company classifies its marketable equity securities as available-for-sale in accordance with the FASB’s Investments-Debt and Equity Securities guidance. These securities are carried at fair market value with unrealized gains and losses reported in stockholders’ equity as a component of Accumulated other comprehensive income ("OCI"). Gains or losses on securities sold are based on the specific identification method.
All debt securities are generally classified as held-to-maturity because the Company has the positive intent and ability to hold the securities to maturity. It is more likely than not that the Company will not be required to sell the debt security before its anticipated recovery and the Company expects to recover the security’s entire amortized cost basis even if the entity does not intend to sell. Held-to-maturity securities are stated at amortized cost, adjusted for amortization of premiums and accretion of discounts to maturity. Debt securities which contain conversion features generally are classified as available-for-sale.
On a continuous basis, management assesses whether there are any indicators that the value of the Company’s marketable securities may be
impaired.impaired, which includes reviewing the underlying cause of any decline in value and the estimated recovery period, as well as the severity and duration of the decline. In the Company’s evaluation, the Company considers its ability and intent to hold these investments for a reasonable period of time sufficient for the Company to recover its cost basis. A marketable security is impaired if the fair value of the security is less than the carrying value of the security and such difference is deemed to be other-than-temporary. To the extent impairment has occurred, the loss shall be measured as the excess of the carrying amount of the security over the estimated fair value in the security.
Deferred Leasing and Financing Costs
Costs incurred in obtaining tenant leases and long-term financing, included in deferred charges and prepaid expenses in the accompanying Consolidated Balance Sheets, are amortized on a straight-line basis, which approximates the effective interest method, over the terms of the related leases or debt agreements, as applicable. Such capitalized costs include salaries, lease incentives and related costs of personnel directly involved in successful leasing efforts.
Software Development Costs
47
KIMCO REALTY CORPORATION AND SUBSIDIARIES
NOTES TO CONSOLIDATED FINANCIAL STATEMENTS, continued
Expenditures for major software purchases and software developed for internal use are capitalized and amortized on a straight-line basis generally over a 3 to 5 year period. The Company’s policy provides for the capitalization of external direct costs of materials and services associated with developing or obtaining internal use computer software. In addition, the Company also capitalizes certain payroll and payroll-related costs for employees who are directly associated with internal use computer software projects. The amount of capitalizable payroll costs with respect to these employees is limited to the time directly spent on such projects. Costs associated with preliminary project stage activities, training, maintenance and all other post-implementation stage activities are expensed as incurred. As of December 31, 2012 and 2011, the Company had unamortized software development costs of $26.8 million and $23.8 million, respectively. The Company incurred $5.5 million, $3.1 million and $1.9 million in amortization of software development costs during the years ended December 31, 2012, 2011 and 2010, respectively.
Revenue Recognition and Accounts Receivable
Base rental revenues from rental property are recognized on a straight-line basis over the terms of the related leases. Certain of these leases also provide for percentage rents based upon the level of sales achieved by the lessee. These percentage rents are recognized once the required sales level is achieved. Rental income may also include payments received in connection with lease termination agreements. In addition, leases typically provide for reimbursement to the Company of common area maintenance costs, real estate taxes and other operating expenses. Operating expense reimbursements are recognized as earned.
Management and other fee income consists of property management fees, leasing fees, property acquisition and disposition fees, development fees and asset management fees. These fees arise from contractual agreements with third parties or with entities in which the Company has a noncontrolling interest. Management and other fee income, including acquisition and disposition fees, are recognized as earned under the respective agreements. Management and other fee income related to partially owned entities are recognized to the extent attributable to the unaffiliated interest.
KIMCO REALTY CORPORATION AND SUBSIDIARIES
NOTES TO CONSOLIDATED FINANCIAL STATEMENTS, continued
Gains and losses from the sale of depreciated operating property and ground-up development projects are generally recognized using the full accrual method in accordance with the FASB’s real estate sales guidance, provided that various criteria relating to the terms of sale and subsequent involvement by the Company with the properties are met.
Gains and losses on transfers of operating properties result from the sale of a partial interest in properties to unconsolidated joint ventures and are recognized using the partial sale provisions of the FASB’s real estate sales guidance.
The Company makes estimates of the uncollectability of its accounts receivable related to base rents, straight-line rent, expense reimbursements and other revenues. The Company analyzes accounts receivable and historical bad debt levels, customer credit worthiness and current economic trends when evaluating the adequacy of the allowance for doubtful accounts. In addition, tenants in bankruptcy are analyzed and estimates are made in connection with the expected recovery of pre-petition and post-petition claims. The Company’s reported net earnings are directly affected by management’s estimate of the collectability of accounts receivable.
The Company has made an election to qualify, and believes it is operating so as to qualify, as a REIT for federal income tax purposes. Accordingly, the Company generally will not be subject to federal income tax, provided that distributions to its stockholders equal at least the amount of its REIT taxable income as defined under Section 856 through 860 of the Code.
In connection with the RMA, which became effective January 1, 2001, the Company is permitted to participate in certain activities which it was previously precluded from in order to maintain its qualification as a REIT, so long as these activities are conducted by entities which elect to be treated as taxable REIT subsidiaries under the Code. As such, the Company is subject to federal and state income taxes on the income from these activities. The Company is also subject to local taxes on certain non-U.S. investments.
Income taxes are accounted for under the asset and liability method. Deferred tax assets and liabilities are recognized for the estimated future tax consequences attributable to differences between the financial statement carrying amounts of existing assets and liabilities and their respective tax bases and operating loss and tax credit carry-forwards. Deferred tax assets and liabilities are measured using enacted tax rates in effect for the year in which those temporary differences are expected to be recovered or settled. The Company provides a valuation allowance for deferred tax assets for which it does not consider realization of such assets to be more likely than not.
The Company reviews the need to establish a valuation allowance against deferred tax assets on a quarterly basis. The review includes an analysis of various factors, such as future reversals of existing taxable temporary differences, the capacity for the carryback or carryforward of any losses, the expected occurrence of future income or loss and available tax planning strategies.
The Company applies the FASB’s guidance relating to uncertainty in income taxes recognized in a company’s financial statements. Under this guidance the Company may recognize the tax benefit from an uncertain tax position only if it is more likely than not that the tax position will be sustained on examination by taxing authorities, based on the technical merits of the position. The tax benefits recognized in the financial statements from such a position are measured based on the largest benefit that has a greater than fifty percent likelihood of being realized upon ultimate settlement. The guidance on accounting for uncertainty in income taxes also provides guidance on de-recognition, classification, interest and penalties on income taxes, and accounting in interim periods.
48
KIMCO REALTY CORPORATION AND SUBSIDIARIES
NOTES TO CONSOLIDATED FINANCIAL STATEMENTS, continued
Foreign Currency Translation and Transactions
Assets and liabilities of the Company’s foreign operations are translated using year-end exchange rates, and revenues and expenses are translated using exchange rates as determined throughout the year. Gains or losses resulting from translation are included in OCI, as a separate component of the Company’s stockholders’ equity. Gains or losses resulting from foreign currency transactions are translated to local currency at the rates of exchange prevailing at the dates of the transactions. The effect of the transactions gain or loss is included in the caption Other
(expense)/income,expense, net in the Consolidated Statements of
Operations.Income.
KIMCO REALTY CORPORATION AND SUBSIDIARIES
NOTES TO CONSOLIDATED FINANCIAL STATEMENTS, continued
Derivative/Financial Instruments
The Company is exposed to certain risk arising from both its business operations and economic conditions. The Company principally manages its exposures to a wide variety of business and operational risk through management of its core business activities. The Company manages economic risks, including interest rate, liquidity, and credit risk primarily by managing the amount, sources, and duration of its debt funding and the use of derivative financial instruments. Specifically, the Company may use derivatives to manage exposures that arise from changes in interest rates, foreign currency exchange rate fluctuations and market value fluctuations of equity securities. The Company limits these risks by following established risk management policies and procedures including the use of derivatives.
The Company measures its derivative instruments at fair value and records them in the Consolidated Balance Sheet as an asset or liability, depending on the Company’s rights or obligations under the applicable derivative contract. The accounting for changes in the fair value of the derivatives depends on the intended use of the derivative, whether the Company has elected to designate a derivative in a hedging relationship and apply hedge accounting and whether the hedging relationship has satisfied the criteria necessary to apply hedge accounting. Derivatives designated and qualifying as a hedge of the exposure to changes in the fair value of an asset, liability, or firm commitment attributable to a particular risk, such as interest rate risk, are considered fair value hedges. Derivatives designated and qualifying as a hedge of the exposure to variability in expected future cash flows, or other types of forecasted transactions, are considered cash flow hedges. Derivatives may also be designated as hedges of the foreign currency exposure of a net investment in a foreign operation. Hedge accounting generally provides for the matching of the timing of gain or loss recognition on the hedging instrument with the recognition of the changes in the fair value of the hedged asset or liability that are attributable to the hedged risk in a fair value hedge or the earnings effect of the hedged forecasted transactions in a cash flow hedge. The Company may enter into derivative contracts that are intended to economically hedge certain of its risk, even though hedge accounting does not apply or the Company elects not to apply hedge accounting under the Derivatives and Hedging guidance issued by the FASB.
The effective portion of the changes in fair value of derivatives designated and that qualify as cash flow hedges is recorded in OCI and is subsequently reclassified into earnings in the period that the hedged forecasted transaction affects earnings. Any ineffective portion of the change in fair value of the derivatives is recognized directly in earnings. During 2012, 2011 and 2010, the Company had no hedge ineffectiveness.
The Company accounts for noncontrolling interests in accordance with the Consolidation guidance and the Distinguishing Liabilities from Equity guidance issued by the FASB. Noncontrolling interests represent the portion of equity that the Company does not own in those entities it consolidates. The Company identifies its noncontrolling interests separately within the equity section on the Company’s Consolidated Balance Sheets. The amounts of consolidated net earnings attributable to the Company and to the noncontrolling interests are presented separately on the Company’s Consolidated Statements of
Operations. Income.
Noncontrolling interests also includes amounts related to partnership units issued by consolidated subsidiaries of the Company in connection with certain property acquisitions. These units have a stated redemption value or a defined redemption amount based upon the trading price of the Company’s common stock and provides the unit holders various rates of return during the holding period. The unit holders generally have the right to redeem their units for cash at any time after one year from issuance. For convertible units, the Company typically has the option to settle redemption amounts in cash or common stock.
The Company evaluates the terms of the partnership units issued in accordance with the FASB’s Distinguishing Liabilities from Equity guidance. Units which embody an unconditional obligation requiring the Company to redeem the units for cash at a specified or determinable date (or dates) or upon an event that is certain to occur are determined to be mandatorily redeemable under this guidance and are included as Redeemable noncontrolling interest and classified within the mezzanine section between Total liabilities and
Stockholder’sStockholders’ equity on the Company’s Consolidated Balance Sheets. Convertible units for which the Company has the option to settle redemption amounts in cash or Common Stock are included in the caption Noncontrolling interest within the equity section on the Company’s Consolidated Balance Sheets.
49
KIMCO REALTY CORPORATION AND SUBSIDIARIES
NOTES TO CONSOLIDATED FINANCIAL STATEMENTS, continued
The following table sets forth the reconciliation of earnings and the weighted-average number of shares used in the calculation of basic and diluted
earnings/(loss)earnings per share (amounts presented in thousands, except per share data):
| | | | | | | | |
| | 2011 | | 2010 | | 2009 |
Computation of Basic Earnings/(Loss) Per Share: | | | | | | |
Income from continuing operations | $ | 176,753 | $ | 137,441 | $ | 3,897 |
Total net gain on transfer or sale of operating properties | | 108 | | 2,377 | | 3,867 |
Net income attributable to noncontrolling interests | | (13,039) | | (18,783) | | (10,003) |
Discontinued operations attributable to noncontrolling interests | | 1,134 | | 4,990 | | 313 |
Preferred stock dividends | | (59,363) | | (51,346) | | (47,288) |
Income/(loss) from continuing operations available to the common shareholders | | 105,593 | | 74,679 | | (49,214) |
Earnings attributable to unvested restricted shares | | (608) | | (375) | | (258) |
Income/(loss) from continuing operations attributable to common shareholders | | 104,985 | | 74,304 | | (49,472) |
Income/(loss) from discontinued operations attributable to the Company | | 4,095 | | 16,843 | | (2,016) |
Net income/(loss) attributable to the Company’s common shareholders for basic earnings per share | $ | 109,080 | $ | 91,147 | $ | (51,488) |
| | | | | | |
Weighted average common shares outstanding | | 406,530 | | 405,827 | | 350,077 |
| | | | | | |
Basic Earnings/(Loss) Per Share Attributable to the Company’s Common Shareholders: | | | | | | |
Income/(loss) from continuing operations | $ | 0.26 | $ | 0.18 | $ | (0.14) |
Income/(loss) from discontinued operations | | 0.01 | | 0.04 | | (0.01) |
Net income/(loss) | $ | 0.27 | $ | 0.22 | $ | (0.15) |
| | | For the year ended December 31, | |
| | | 2012 | | | 2011 | | | 2010 | |
| Computation of Basic Earnings Per Share: | | | | | | | | | |
| Income from continuing operations | | $ | 211,978 | | | $ | 158,977 | | | $ | 120,122 | |
| Total net gain on transfer or sale of operating properties, net | | | 4,299 | | | | 108 | | | | 2,377 | |
| Net income attributable to noncontrolling interests | | | (14,202 | ) | | | (13,039 | ) | | | (18,783 | ) |
| Discontinued operations attributable to noncontrolling interests | | | 1,731 | | | | 1,384 | | | | 5,288 | |
| Preferred stock redemption costs | | | (21,703 | ) | | | - | | | | - | |
| Preferred stock dividends | | | (71,697 | ) | | | (59,363 | ) | | | (51,346 | ) |
| Income from continuing operations available to the common shareholders | | | 110,406 | | | | 88,067 | | | | 57,658 | |
| Earnings attributable to unvested restricted shares | | | (1,221 | ) | | | (608 | ) | | | (375 | ) |
| Income from continuing operations attributable to common shareholders | | | 109,185 | | | | 87,459 | | | | 57,283 | |
| Income from discontinued operations attributable to the Company | | | 62,267 | | | | 21,621 | | | | 33,864 | |
| Net income attributable to the Company’s common shareholders for basic earnings per share | | $ | 171,452 | | | $ | 109,080 | | | $ | 91,147 | |
| | | | | | | | | | | | | |
| Weighted average common shares outstanding | | | 405,997 | | | | 406,530 | | | | 405,827 | |
| | | | | | | | | | | | | |
| Basic Earnings Per Share Attributable to the Company’s Common Shareholders: | | | | | | | | | | | | |
| Income from continuing operations | | $ | 0.27 | | | $ | 0.22 | | | $ | 0.14 | |
| Income from discontinued operations | | | 0.15 | | | | 0.05 | | | | 0.08 | |
| Net income | | $ | 0.42 | | | $ | 0.27 | | | $ | 0.22 | |
| | | | | | |
Computation of Diluted Earnings/(Loss) Per Share: | | | | | | |
Income/(loss) from continuing operations attributable to common shareholders | | 104,985 | | 74,304 | | (49,472) |
Income/(loss) from discontinued operations attributable to the Company | | 4,095 | | 16,843 | | (2,016) |
Net income/(loss) attributable to common shareholders for diluted earnings per share | $ | 109,080 | $ | 91,147 | $ | (51,488) |
| | | | | | |
Weighted average common shares outstanding – basic | | 406,530 | | 405,827 | | 350,077 |
Effect of dilutive securities(a): Equity awards | | 1,139 | | 374 | | - |
Shares for diluted earnings per common share | | 407,669 | | 406,201 | | 350,077 |
| | | | | | |
Diluted Earnings/(Loss) Per Share Attributable to the Company’s Common Shareholders: | | | | | | |
Income/(loss) from continuing operations | $ | 0.26 | $ | 0.18 | $ | (0.14) |
Income/(loss) from discontinued operations | | 0.01 | | 0.04 | | (0.01) |
Net income/(loss) | $ | 0.27 | $ | 0.22 | $ | (0.15) |
| Computation of Diluted Earnings Per Share: | | | | | | | | | |
| Income from continuing operations attributable to common shareholders | | $ | 109,185 | | | $ | 87,459 | | | $ | 57,283 | |
| Income from discontinued operations attributable to the Company | | | 62,267 | | | | 21,621 | | | | 33,864 | |
| Net income attributable to common shareholders for diluted earnings per share | | $ | 171,452 | | | $ | 109,080 | | | $ | 91,147 | |
| | | | | | | | | | | | | |
| Weighted average common shares outstanding – basic | | | 405,997 | | | | 406,530 | | | | 405,827 | |
| Effect of dilutive securities(a): | | | | | | | | | | | | |
| Equity awards | | | 692 | | | | 1,139 | | | | 374 | |
| Shares for diluted earnings per common share | | | 406,689 | | | | 407,669 | | | | 406,201 | |
| | | | | | | | | | | | | |
| Diluted Earnings Per Share Attributable to the Company’s Common Shareholders: | | | | | | | | | | | | |
| Income from continuing operations | | $ | 0.27 | | | $ | 0.21 | | | $ | 0.14 | |
| Income from discontinued operations | | | 0.15 | | | | 0.06 | | | | 0.08 | |
| Net income | | $ | 0.42 | | | $ | 0.27 | | | $ | 0.22 | |
(a) The effect of the assumed conversion of certain convertible units had an anti-dilutive effect upon the calculation of
Income/(loss)Income from continuing operations per share. Accordingly, the impact of such conversions has not been included in the determination of diluted earnings per share calculations.
In addition, Additionally, there were 11,159,160, 13,304,016 12,085,874 and 15,870,967,12,085,874, stock options that were not dilutive as of December 31, 2012, 2011 and 2010, and 2009, respectively.
50
KIMCO REALTY CORPORATION AND SUBSIDIARIES
NOTES TO CONSOLIDATED FINANCIAL STATEMENTS, continued
The Company's unvested restricted share awards contain non-forfeitable rights to distributions or distribution equivalents. The impact of the unvested restricted share awards on earnings per share has been calculated using the two-class method whereby earnings are allocated to the unvested restricted share awards based on dividends declared and the unvested restricted shares' participation rights in undistributed earnings.
The Company maintains two equity participation plans, the Second Amended and Restated 1998 Equity Participation Plan (the “Prior Plan”) and the 2010 Equity Participation Plan (the “2010 Plan”) (collectively, the “Plans”). The Prior Plan provides for a maximum of 47,000,000 shares of the Company’s common stock to be issued for qualified and non-qualified options and restricted stock grants. The 2010 Plan provides for a maximum of
5,000,00010,000,000 shares of the Company’s common stock to be issued for qualified and non-qualified options, restricted stock, performance awards and other awards, plus the number of shares of common stock which are or become available for issuance under the Prior Plan and which are not thereafter issued under the Prior Plan, subject to certain conditions. Unless otherwise determined by the Board of Directors at its sole discretion, options granted under the Plans generally vest ratably over a range of three to five years, expire ten years from the date of grant and are exercisable at the market price on the date of grant. Restricted stock grants generally vest (i) 100% on the fourth or fifth anniversary of the grant, (ii) ratably over three or four years,
or (iii) over three years at 50% after two years and 50% after the third
year or (iv) over ten years at 20% per year commencing after the fifth year. Performance share awards may provide a right to receive shares of restricted stock based on the Company’s performance relative to its peers, as defined, or based on other performance criteria as determined by the Board of Directors. In addition, the Plans provide for the granting of certain options and restricted stock to each of the Company’s non-employee directors (the “Independent Directors”) and permits such Independent Directors to elect to receive deferred stock awards in lieu of directors’ fees.
The Company accounts for equity awards in accordance with the FASB’s Stock Compensation guidance which requires that all share based payments to employees, be recognized in the
statementStatement of
operationsIncome over the service period based on their fair values. Fair value is determined, depending on the type of award, using either the Black-Scholes option pricing formula or the Monte Carlo method, both of which are intended to estimate the fair value of the awards at the grant date (see Footnote
2321 for additional disclosure on the assumptions and methodology).
New Accounting Pronouncements
In July 2010, the FASB issuedAccounting Standards Update (“ASU”) 2010-20, Disclosures about the Credit Quality of Financing Receivables and the Allowance for Credit Losses, ("ASU 2010-20"), which outlines specific disclosures that will be required for the allowance for credit losses and all finance receivables. Finance receivables includes loans, lease receivables and other arrangements with a contractual right to receive money on demand or on fixed or determinable dates that is recognized as an asset on an entity's statement of financial position. ASU 2010-20 will require companies to provide disaggregated levels of disclosure by portfolio segment and class to enable users of the financial statement to understand the nature of credit risk, how the risk is analyzed in determining the related allowance for credit losses and changes to the allowance during the reporting period. Required disclosures under ASU 2010-20 as of the end of a reporting period were effective for the Company's December 31, 2010 reporting period and disclosures regarding activities during a reporting period are effective for the Company's March 31, 2011 interim reporting period. The Company has incorporated the required disclosures within this Annual Report on Form 10-K where applicable.
In May 2011, the FASB issued ASU 2011-04 Amendments to Achieve Common Fair Value Measurement and Disclosure Requirements in U.S. GAAP and IFRS (“ASU 2011-04”). ASU 2011-04 is intended to improve comparability of fair value measurements presented and disclosed in financial statements prepared in accordance with U.S. GAAP and International Financial Reporting Standards (“IFRS”). The amendments are of two types: (i) those that clarify the Board’s intent about the application of existing fair value measurement and disclosure requirements and (ii) those that change a particular principle or requirement for measuring fair value or for disclosing information about fair value measurements. The update is effective for annual periods beginning after December 15, 201l. The
Company does not expect theCompany’s adoption of this
update toguidance did not have a material impact on
the Company’sits financial
statements.statement presentation.
In June 2011, the FASB issued ASU No. 2011-05, Comprehensive Income (Topic 220): Presentation of Comprehensive Income (“ASU 2011-05”). The amendments in this ASU require an entity to present the total of comprehensive income, the components of net income, and the components of other comprehensive income either in a single continuous statement of comprehensive income or in two separate but consecutive statements. ASU 2011-05 eliminates the option to present the components of other comprehensive income as part of the statement of equity.
In December 2011, the FASB deferred portions of this update in its issuance of Accounting Standards Update No. 2011-12 (“ASU 2011-12”), Comprehensive Income (Topic 220): Deferral of the Effective Date for Amendments to the Presentation of Reclassifications of Items Out of Accumulated Other Comprehensive Income in ASU 2011-05. The amendment requires that all non-owner changes in stockholders’ equity be presented in either a single continuous statement of comprehensive income or in two separate but consecutive statements. ASU 2011-12 defers only those changes in ASU 2011-05 that relate to the presentation of reclassification adjustments out of accumulated other comprehensive income. ASU 2011-05 is effective for fiscal years, and interim periods within those fiscal years, beginning on or after December 15, 2011, with early adoption permitted, but full retrospective application is required.
In December 2011, the FASB deferred portions of this update in its issuance of ASU 2011-12 (see discussion below). The adoption of ASU 2011-05
willand ASU 2011-12 did not have a material impact on the Company’s financial statement presentation.
KIMCO REALTY CORPORATION AND SUBSIDIARIES
NOTES TO CONSOLIDATED FINANCIAL STATEMENTS, continued
In January 2013, the FASB released ASU 2013-02, Reporting of Amounts Reclassified Out of Accumulated Other Comprehensive Income (“ASU 2013-02”). This guidance is the culmination of the board’s redeliberation on reporting reclassification adjustments from accumulated other comprehensive income. The standard requires that companies present either in a single note or parenthetically on the face of the financial statements, the effect of significant amounts reclassified from each component of accumulated other comprehensive income based on its source (e.g., the release due to cash flow hedges from interest rate contracts) and the income statement line items affected by the reclassification (e.g., interest income or interest expense). If a component is not required to be reclassified to net income in its entirety (e.g., the net periodic pension cost), companies would instead cross reference to the related footnote for additional information (e.g., the pension footnote). The new requirements will take effect for public companies in interim and annual reporting periods beginning after December 15, 2012. The adoption of ASU 2013-02 is not expected to have a material impact on the Company’s financial statement presentation.
In November 2011, the FASB issued ASU 2011-10, Property, Plant and Equipment (Topic 360): Derecognition of in Substance Real Estate - a Scope Clarification (a consensus of the FASB Emerging Issues Task Force) (“ASU 2011-10”). ASU 2011-10 requires a parent company that ceases to have a controlling financial interest in a subsidiary that is in substance real estate because the subsidiary has defaulted on its nonrecourse debt should use the FASB’s Real Estate guidance to determine whether to derecognize the in substance real estate entities. ASU 2011-10 is effective for reporting periods beginning on or after June 15, 2012. The adoption of ASU 2011-10
isdid not
expected to have a material impact on the Company’s financial position or results of operations.
51
KIMCO REALTY CORPORATION AND SUBSIDIARIES
NOTES TO CONSOLIDATED FINANCIAL STATEMENTS, continued
In December 2011, the FASB released ASU 2011-11, Balance Sheet (Topic 210): Disclosures about Offsetting Assets and Liabilities (“ASU 2011-11”). ASU 2011-11 requires companies to provide new disclosures about offsetting and related arrangements for financial instruments and derivatives. The provisions of ASU 2011-11 are effective for annual reporting periods beginning on or after January 1, 2013, and are required to be applied retrospectively. The adoption of ASU 2011-11
iswill not
expected to have a material impact on the Company’s financial statement presentation.
In December 2011, the FASB released Accounting Standards Update No. 2011-12 (“ASU 2011-12”), Comprehensive Income (Topic 220): Deferral of the Effective Date for Amendments
Reclassifications
Certain reclassifications have been made to
the Presentation of Reclassifications of Items Out of Accumulated Other Comprehensive Income in ASU 2011-05. The amendment requires that all non-owner changes in stockholders’ equity be presented in either a single continuous statement of comprehensive income or in two separate but consecutive statements. ASU 2011-12 defers only those changes in ASU 2011-05 that relate to the presentation of reclassification adjustments out of accumulated other comprehensive income. The provisions of ASU 2011-12 are effective for public companies in fiscal years beginning after December 15, 2011.
Reclassifications
The Company made the following reclassifications to the Company’s 2010 Consolidated Statements of Operationspreviously reported amounts to conform to the 2011 presentation: (i)current year presentation. Specifically, the Company reclassified amounts relating to rent security deposits from Accounts payable and accrued expenses to Other liabilities. Additionally, the Company is presenting on its Consolidated Statements of Income its provision for doubtful accounts, which was previously included in Revenues from rental properties, as a reclassification of the income from the Company’s investmentseparate line item included in the Albertson’s joint venture from Equity in income of joint ventures, net to Equity in income ofOperating expenses as well as certain other real estate investments, net and (ii) a reclassification of equity amounts from Income from other real estate investments to Equity in income from other real estate investments, net.
immaterial reclassifications.
Management assesses on a continuous basis
management assesses whether there are any indicators, including property operating performance and general market conditions, that the value of the Company’s assets (including any related amortizable intangible assets or liabilities) may be impaired. To the extent impairment has occurred, the carrying value of the asset would be adjusted to an amount to reflect the estimated fair value of the asset.
During 2009, volatile economic
Real estate market conditions,
resulted in declines in the real estate and equity markets. Increases inincluding capitalization rates, discount rates and vacancies
as well as deterioration ofcontinued to improve throughout 2011 and 2012; however, declines in certain real estate
market fundamentals impacted net operating income and leasing which further contributed to declines in real estate markets
in general. During 2010 and 2011, the U.S. economic and market conditions stabilized and capitalization rates, discount rates and vacancies had improved; however remaining overall declines in market conditions continued to have a negative effect on
certain transactional activity as it related to
dispositions of select real estate
assets. This factor, in addition to the Company’s efforts to market certain assets and
certain marketable securities.
As a resultmanagement’s assessment as to the likelihood and timing of the volatility and declining market conditions described above, as well as the Company’s strategy to dispose of certain of its non-retail assets,such potential transactions caused the Company recognizedto recognize impairment charges for the years ended December 31, 2012, 2011 2010 and 20092010 as follows (in millions):
| | | | | | |
| | 2011 | | 2010 | | 2009 |
Impairment of property carrying values (including amounts within discontinued operations) | $ | 22.8 | $ | 8.7 | $ | 50.0 |
Real estate under development | | - | | 11.7 | | 2.1 |
Investments in other real estate investments | | 3.3 | | 13.4 | | 49.2 |
Marketable securities and other investments | | 1.6 | | 5.3 | | 30.1 |
Investments in real estate joint ventures | | 5.1 | | - | | 43.7 |
Total gross impairment charges | | 32.8 | | 39.1 | | 175.1 |
Noncontrolling interests | | 0.7 | | (0.1) | | (1.2) |
Income tax benefit | | (4.5) | | (7.6) | | (22.5) |
Total net impairment charges | $ | 29.0 | $ | 31.4 | $ | 151.4 |
| | | 2012 | | | 2011 | | | 2010 | |
| Impairment of property carrying values (including amounts within discontinued operations) | | $ | 56.9 | | | $ | 22.8 | | | $ | 8.7 | |
| Real estate under development | | | - | | | | - | | | | 11.7 | |
| Investments in other real estate investments | | | 2.7 | | | | 3.3 | | | | 13.4 | |
| Marketable securities and other investments | | | - | | | | 1.6 | | | | 5.3 | |
| Investments in real estate joint ventures | | | - | | | | 5.1 | | | | - | |
| Total gross impairment charges | | | 59.6 | | | | 32.8 | | | | 39.1 | |
| Noncontrolling interests | | | (0.4 | ) | | | 0.7 | | | | (0.1 | ) |
| Income tax benefit | | | (10.6 | ) | | | (4.5 | ) | | | (7.6 | ) |
| Total net impairment charges | | $ | 48.6 | | | $ | 29.0 | | | $ | 31.4 | |
KIMCO REALTY CORPORATION AND SUBSIDIARIES
NOTES TO CONSOLIDATED FINANCIAL STATEMENTS, continued
In addition to the impairment charges above, the Company recognized pretax impairment charges during
2012, 2011
and 2010
and 2009 of
approximately$11.1 million, $14.1 million,
$28.3 million, and
$38.7$28.3 million, respectively, relating to certain properties held by various unconsolidated joint ventures in which the Company holds noncontrolling interests. These impairment charges are included in Equity in income of joint ventures, net in the Company’s Consolidated Statements of
Operations. Income.
The Company will continue to assess the value of its assets on an on-going basis. Based on these assessments, the Company may determine that one or more of its assets may be impaired due to a decline in value and would therefore write-down its cost basis accordingly (see Footnotes 6, 8, 9, 11, and 12).
52
KIMCO REALTY CORPORATION AND SUBSIDIARIES
NOTES TO CONSOLIDATED FINANCIAL STATEMENTS, continued
The Company’s components of Rental property consist of the following (in thousands):
| | | | |
| | December 31, |
| | 2011 | | 2010 |
Land | $ | 1,847,770 | $ | 1,742,425 |
Undeveloped land | | 97,275 | | 94,923 |
Buildings and improvements: | | | | |
Buildings | | 4,513,339 | | 4,387,144 |
Building improvements | | 1,024,514 | | 972,086 |
Tenant improvements | | 715,951 | | 699,242 |
Fixtures and leasehold improvements | | 62,874 | | 55,611 |
Other rental property (1) | | 335,859 | | 306,322 |
| | 8,597,582 | | 8,257,753 |
Accumulated depreciation and amortization | | (1,693,090) | | (1,549,380) |
Total | $ | 6,904,492 | $ | 6,708,373 |
| | | December 31, | |
| | | 2012 | | | 2011 | |
| Land | | $ | 1,927,800 | | | $ | 1,847,770 | |
| Undeveloped land | | | 96,500 | | | | 97,275 | |
| Buildings and improvements: | | | | | | | | |
| Buildings | | | 4,607,931 | | | | 4,513,339 | |
| Building improvements | | | 1,091,810 | | | | 1,024,514 | |
| Tenant improvements | | | 708,626 | | | | 715,951 | |
| Fixtures and leasehold improvements | | | 59,690 | | | | 56,827 | |
| Other rental property (1) | | | 357,667 | | | | 335,859 | |
| | | | 8,850,024 | | | | 8,591,535 | |
| Accumulated depreciation and amortization | | | (1,745,462 | ) | | | (1,693,090 | ) |
| Total | | $ | 7,104,562 | | | $ | 6,898,445 | |
(1) At December 31,
20112012 and
2010,2011, Other rental property (net of accumulated amortization of
approximately $180.7$212.9 million and
$147.2$180.7 million, respectively), consisted of intangible assets including (i)
$213,915$237,166 and
$196,124,$213,915, respectively, of in-place leases, (ii)
$21,444$21,335 and
$21,704,$21,444, respectively, of tenant relationships, and (iii)
$100,500$99,166 and
$88,494,$100,500, respectively, of above-market leases.
In addition, at December 31,
20112012 and
2010,2011, the Company had intangible liabilities relating to below-market leases from property acquisitions of
approximately $165.0$167.2 million and
$164.9$165.0 million, respectively, net of accumulated amortization of
approximately $120.5$138.3 million and
$101.0$120.5 million, respectively. These amounts are included in the caption Other liabilities in the Company’s Consolidated Balance Sheets. The Company’s amortization expense associated with the above mentioned intangible assets and liabilities for the years ended December 31,
2012, 2011
and 2010
and 2009 was
approximately $16.4$15.4 million,
$13.6$15.2 million and
$8.0$12.6 million, respectively. The estimated net amortization expense associated with the Company’s intangible assets and liabilities for the next five years are as follows (in millions):
2012, $11.7; 2013,
$8.3;$9.6; 2014,
$0.2;$1.7; 2015,
$(2.3)$(0.8); 2016, $(3.4) and
2016, $(4.3)2017, $(3.0).
4. Property Acquisitions, Developments and Other Investments: Operating property acquisitions, ground-up development costs and other investments have been funded principally through the application of proceeds from the Company's public equity and unsecured debt issuances, proceeds from mortgage and construction financings
and availability under the Company’s revolving lines of
credit and issuance of various partnership units.credit.
Acquisition of Operating Properties –
KIMCO REALTY CORPORATION AND SUBSIDIARIES
NOTES TO CONSOLIDATED FINANCIAL STATEMENTS, continued
During the year ended December 31, 2012, the Company acquired 24 operating properties, 69 net leased parcels and five outparcels, in separate transactions as follows (in thousands):
| | | | | | | Purchase Price | | | | |
| Property Name | | Location | | Month Acquired | | Cash | | | Debt Assumed | | | Total | | | GLA* | |
| Woodbridge S.C. | | Sugarland, TX | | Jan-12 | | $ | 9,000 | | | $ | - | | | $ | 9,000 | | | | 97 | |
| Bell Camino Center | | Sun City, AZ | | Jan-12 | | | 4,185 | | | | 4,210 | | | | 8,395 | | | | 63 | |
| 31 parcels (2) | | Various | | Jan-12 | | | 30,753 | | | | - | | | | 30,753 | | | | 83 | |
| 1 parcel (3) | | Duncan, SC | | Jan-12 | | | 1,048 | | | | - | | | | 1,048 | | | | 3 | |
| Olympia West Outparcel | | Olympia, WA | | Feb-12 | | | 1,200 | | | | - | | | | 1,200 | | | | 6 | |
| Frontier Village (1) | | Lake Stevens, WA | | Mar-12 | | | 12,231 | | | | 30,900 | | | | 43,131 | | | | 195 | |
| Silverdale S.C. (1) | | Silverdale, WA | | Mar-12 | | | 8,335 | | | | 24,000 | | | | 32,335 | | | | 170 | |
| 30 parcels (2) | | Various | | Mar-12 | | | 39,493 | | | | - | | | | 39,493 | | | | 107 | |
| 1 parcel (3) | | Peru, IL | | Mar-12 | | | 995 | | | | - | | | | 995 | | | | 4 | |
| Towson Place (4) | | Towson, MD | | Apr-12 | | | 69,375 | | | | 57,625 | | | | 127,000 | | | | 680 | |
| Prien Lake Outparcel | | Lake Charles, LA | | May-12 | | | 1,800 | | | | - | | | | 1,800 | | | | 8 | |
| Devon Village | | Devon, PA | | Jun-12 | | | 28,550 | | | | - | | | | 28,550 | | | | 79 | |
| 4 Properties | | Various, NC | | Jun-12 | | | 63,750 | | | | - | | | | 63,750 | | | | 368 | |
| Lake Jackson (5) | | Lake Jackson, TX | | Jul-12 | | | 5,500 | | | | - | | | | 5,500 | | | | 35 | |
| Woodlawn S.C. | | Charlotte, NC | | Jul-12 | | | 7,050 | | | | - | | | | 7,050 | | | | 137 | |
| Columbia Crossing - 2 Outparcels | | Columbia, MD | | Jul-12 | | | 11,060 | | | | - | | | | 11,060 | | | | 69 | |
| Pompano Beach (6) | | Pompano Beach, FL | | Jul-12 | | | 12,180 | | | | - | | | | 12,180 | | | | 81 | |
| 6 Parcels (2) | | Various | | Jul-12 | | | 8,111 | | | | - | | | | 8,111 | | | | 19 | |
| Wilton S.C. | | Wilton, CT | | Aug-12 | | | 18,800 | | | | 20,900 | | | | 39,700 | | | | 96 | |
| Hawthorne Hills S. C. | | Vernon Hills, IL | | Aug-12 | | | 15,974 | | | | 21,563 | | | | 37,537 | | | | 193 | |
| Greeley Shopping Center (7) | | Greeley, CO | | Oct-12 | | | 23,250 | | | | - | | | | 23,250 | | | | 139 | |
| Savi Ranch Center Phase II | | Yorba Linda, CA | | Oct-12 | | | 34,500 | | | | - | | | | 34,500 | | | �� | 161 | |
| Wild Lake Plaza Outparcel | | Columbia, MD | | Nov-12 | | | 300 | | | | - | | | | 300 | | | | 75 | |
| City Heights Retail Village | | San Francisco, CA | | Nov-12 | | | 15,600 | | | | 20,000 | | | | 35,600 | | | | 109 | |
| Snowden Square (8) | | Columbia, MD | | Dec-12 | | | 6,182 | | | | - | | | | 6,182 | | | | 50 | |
| “Key Food” Portfolio (5 properties) | | Various, NY | | Dec-12 | | | 26,058 | | | | - | | | | 26,058 | | | | 59 | |
| | | | | Total | | $ | 455,280 | | | $ | 179,198 | | | $ | 634,478 | | | | 3,086 | |
* Gross leasable area ("GLA")
(1) These properties were acquired from a joint venture in which the Company has a 15% noncontrolling interest. The Company evaluated these transactions pursuant to the FASB’s Consolidation guidance and as such recognized an aggregate gain of $2.0 million from the fair value adjustment associated with its original ownership due to a change in control.
(2) Acquired an aggregate of 67 parcels net leased to restaurants through a consolidated joint venture, in which the Company has a 99.1% controlling interest. During July 2012, the Company purchased the remaining 0.9% interest for $0.7 million.
(3) Acquired an aggregate of two parcels net leased to restaurants through a consolidated joint venture, in which the Company has a 92.0% controlling interest. During July 2012, the Company sold 4% of its interest for $0.1 million. The Company continues to have a controlling interest in the joint venture and therefore continues to consolidate this investment.
(4) This property was acquired from a joint venture in which the Company had a 30% noncontrolling interest. The Company evaluated this transaction pursuant to the FASB’s Consolidation guidance and as such recognized a gain of $12.1 million from the fair value adjustment associated with its original ownership due to a change in control. In addition, the Company recognized promote income of $1.1 million in connection with this transaction. The promote income is included in Equity in income of joint ventures, net on the Company’s Consolidated Statements of Income. Additionally, the debt assumed in connection with this transaction of $57.6 million was repaid in May 2012.
(5) The Company acquired this property from a preferred equity investment in which the Company held a noncontrolling interest. The Company evaluated this transaction pursuant to the FASB’s Consolidation guidance. This transaction resulted in a change in control with no gain or loss recognized.
(6) This property was acquired from a joint venture in which the Company had a 50% noncontrolling interest. The Company evaluated this transaction pursuant to the FASB’s Consolidation guidance. This transaction resulted in a change in control with no gain or loss recognized.
(7) This property was acquired from a joint venture in which the Company has an 11% noncontrolling interest. The Company evaluated this transaction pursuant to the FASB’s Consolidation guidance and as such recognized a gain of $0.4 million from the fair value adjustment associated with its original ownership due to a change in control.
(8) This property was acquired from a joint venture in which the Company has a 50% noncontrolling interest. The Company evaluated this transaction pursuant to the FASB’s Consolidation guidance and as such recognized a gain of $1.0 million from the fair value adjustment associated with its original ownership due to a change in control.
KIMCO REALTY CORPORATION AND SUBSIDIARIES
NOTES TO CONSOLIDATED FINANCIAL STATEMENTS, continued
During the year ended December 31, 2011, the Company acquired 19 operating properties, a land parcel and an outparcel, in separate transactions as follows (in thousands):
| | | | | | | | | | | | |
| | | | | | Purchase Price |
Property Name | | Location | | Month Acquired | | Cash | | Debt Assumed | | Total | | GLA* |
Columbia Crossing | | Columbia, MD | | Jan-11 | $ | 4,100 | $ | - | $ | 4,100 | | 31 |
Turnpike Plaza | | Huntington Station, NY | | Feb-11 | | 7,920 | | - | | 7,920 | | 53 |
Center Court | | Pikesville, MD | | Mar-11 | | 9,955 | | 15,445 | | 25,400 | | 106 |
Flowery Branch | | Flowery Branch, GA | | April-11 | | 4,427 | | 9,273 | | 13,700 | | 93 |
Garden State Pavilions | | Cherry Hill, NJ | | June-11 | | 18,250 | | - | | 18,250 | | 257 |
Village Crossroads | | Phoenix, AZ | | July-11 | | 29,240 | | - | | 29,240 | | 185 |
University Town Center | (1) | Pensacola, FL | | Aug-11 | | 17,750 | | - | | 17,750 | | 101 |
Gateway Station | (2) | Burleson, TX | | Sept-11 | | 6,625 | | 18,832 | | 25,457 | | 280 |
Park Hill Plaza | | Miami, FL | | Sept-11 | | 17,251 | | 8,199 | | 25,450 | | 112 |
Island Gate | | Corpus Christi, TX | | Oct-11 | | 8,750 | | - | | 8,750 | | 60 |
| | | | | | | | Purchase Price | |
| Property Name | | | Location | | Month Acquired | | Cash | | | Debt Assumed | | | Total | | | GLA* | |
| Columbia Crossing | | | Columbia, MD | | Jan-11 | | $ | 4,100 | | | $ | - | | | $ | 4,100 | | | | 31 | |
| Turnpike Plaza | | | Huntington Station, NY | | Feb-11 | | | 7,920 | | | | - | | | | 7,920 | | | | 53 | |
| Center Court | | | Pikesville, MD | | Mar-11 | | | 9,955 | | | | 15,445 | | | | 25,400 | | | | 106 | |
| Flowery Branch | | | Flowery Branch, GA | | April-11 | | | 4,427 | | | | 9,273 | | | | 13,700 | | | | 93 | |
| Garden State Pavilions | | | Cherry Hill, NJ | | June-11 | | | 18,250 | | | | - | | | | 18,250 | | | | 257 | |
| Village Crossroads | | | Phoenix, AZ | | July-11 | | | 29,240 | | | | - | | | | 29,240 | | | | 185 | |
| University Town Center | (1) | | Pensacola, FL | | Aug-11 | | | 17,750 | | | | - | | | | 17,750 | | | | 101 | |
| Gateway Station | (2) | | Burleson, TX | | Sept-11 | | | 6,625 | | | | 18,832 | | | | 25,457 | | | | 280 | |
| Park Hill Plaza | | | Miami, FL | | Sept-11 | | | 17,251 | | | | 8,199 | | | | 25,450 | | | | 112 | |
| Island Gate | | | Corpus Christi, TX | | Oct-11 | | | 8,750 | | | | - | | | | 8,750 | | | | 60 | |
| Village Center West | | | Highlands Ranch, CO | | Oct-11 | | | 3,995 | | | | 6,105 | | | | 10,100 | | | | 30 | |
| Belleville Road S.C. | (3) | | Fairview Heights, IL | | Oct-11 | | | 1,900 | | | | - | | | | 1,900 | | | | - | |
| Grand Oaks Village | | | Orlando, FL | | Nov-11 | | | 19,051 | | | | 5,949 | | | | 25,000 | | | | 86 | |
| Market at Southpark | | | Littleton, CO | | Nov-11 | | | 30,000 | | | | - | | | | 30,000 | | | | 190 | |
| Jetton Village Shoppes | | | Charlotte, NC | | Nov-11 | | | 5,110 | | | | 8,250 | | | | 13,360 | | | | 81 | |
| Brennan Station | | | Raleigh, NC | | Nov-11 | | | 20,225 | | | | 9,125 | | | | 29,350 | | | | 136 | |
| Woodruff Outparcel | (4) | | Woodruff, SC | | Nov-11 | | | 1,183 | | | | - | | | | 1,183 | | | | 119 | |
| Westridge Square | | | Greensboro, NC | | Nov-11 | | | 26,125 | | | | - | | | | 26,125 | | | | 215 | |
| Highlands Ranch | | | Highland Ranch, CO | | Nov-11 | | | 7,035 | | | | 20,599 | | | | 27,634 | | | | 123 | |
| North Valley Plaza | | | Peoria, AZ | | Dec-11 | | | 7,260 | | | | 16,135 | | | | 23,395 | | | | 168 | |
| College Park S.C. | | | Tempe, AZ | | Dec-11 | | | 10,500 | | | | - | | | | 10,500 | | | | 62 | |
| | | | | | Total | | $ | 256,652 | | | $ | 117,912 | | | $ | 374,564 | | | | 2,488 | |
53
KIMCO REALTY CORPORATION AND SUBSIDIARIES
NOTES TO CONSOLIDATED FINANCIAL STATEMENTS, continued
| | | | | | | | | | | | |
| | | | | | Purchase Price |
Property Name | | Location | | Month Acquired | | Cash | | Debt Assumed | | Total | | GLA* |
Village Center West | | Highlands Ranch, CO | | Oct-11 | | 3,995 | | 6,105 | | 10,100 | | 30 |
Belleville Road S.C. | (3) | Fairview Heights, IL | | Oct-11 | | 1,900 | | - | | 1,900 | | - |
Grand Oaks Village | | Orlando, FL | | Nov-11 | | 19,051 | | 5,949 | | 25,000 | | 86 |
Market at Southpark | | Littleton, CO | | Nov-11 | | 30,000 | | - | | 30,000 | | 190 |
Jetton Village Shoppes | | Charlotte, NC | | Nov-11 | | 5,110 | | 8,250 | | 13,360 | | 81 |
Brennan Station | | Raleigh, NC | | Nov-11 | | 20,225 | | 9,125 | | 29,350 | | 136 |
Woodruff Outparcel | (4) | Woodruff, SC | | Nov-11 | | 1,183 | | - | | 1,183 | | 119 |
Westridge Square | | Greensboro, NC | | Nov-11 | | 26,125 | | - | | 26,125 | | 215 |
Highlands Ranch | | Highland Ranch, CO | | Nov-11 | | 7,035 | | 20,599 | | 27,634 | | 123 |
North Valley Plaza | | Peoria, AZ | | Dec-11 | | 7,260 | | 16,135 | | 23,395 | | 168 |
College Park S.C. | | Tempe, AZ | | Dec-11 | | 10,500 | | - | | 10,500 | | 62 |
| | | | Total | $ | 256,652 | $ | 117,912 | $ | 374,564 | | 2,488 |
* Gross leasable area ("GLA")
(1)This property was acquired from a joint venture in which the Company has a 13.4% noncontrolling interest. The Company evaluated this transaction pursuant to the FASB’s Consolidation guidance and as such recorded a gain of approximately $0.6 million from the fair value adjustment associated with its original 13.4% ownership due to a change in control.
(2)The Company purchased the leasehold improvements at this property for which it previously owned the land.
(3)The Company acquired the land at this site for which it previously held a ground lease. (4)The Company purchased this out parcel next to an existing property that the Company previously owned.
During the year ended December 31, 2010, the Company acquired, in separate transactions, 10 operating properties, an additional joint venture interest and two land parcels as follows (in thousands):
| | | | | | | | | | | | |
| | | | | | Purchase Price |
Property Name | | Location | | Month Acquired | | Cash/Net Assets and Liabilities | | Debt Assumed | | Total | | GLA* |
Foothills Mall | (1) | Tucson, AZ | | Jan-10 | $ | 9,063 | $ | 77,162 | $ | 86,225 | | 515 |
Kenneth Hahn | (2) | Los Angeles, CA | | Mar-10 | | 8,563 | | - | | 8,563 | | 165 |
Wexford | (3) | Pittsburgh, PA | | June-10 | | 1,657 | | 12,500 | | 14,157 | | 142 |
Riverplace S.C. | | Jacksonville, FL | | Aug-10 | | 35,560 | | - | | 35,560 | | 257 |
Cave Springs S.C. – land parcel | (4) | Lemay, MI | | Sept-10 | | 510 | | - | | 510 | | - |
Woodruff Shopping Center | | Greenville, SC | | Nov-10 | | 18,380 | | - | | 18,380 | | 116 |
Haverhill Plaza | (5) | Haverhill, MA | | Nov-10 | | 3,307 | | 7,099 | | 10,406 | | 63 |
Midtown Commons | | Knightdale, NC | | Dec-10 | | 23,840 | | - | | 23,840 | | 137 |
Chevron Parcel | (4) | Miami, FL | | Dec-10 | | 1,700 | | - | | 1,700 | | 2 |
Dunhill - 4 Properties | (6) | Various, LA | | Dec-10 | | 9,957 | | 42,007 | | 51,964 | | 328 |
| | | | Total | $ | 112,537 | $ | 138,768 | $ | 251,305 | | 1,725 |
* Gross leasable area ("GLA")
(1)
The Company acquired this property from a preferred equity investment in which the Company held a noncontrolling interest. There was no gain or loss recognized in connection with this change in control. The $77.2 million of assumed debt includes a decrease of approximately $3.8 million associated with a fair value debt adjustment relating to the property’s purchase price allocation. During August 2010, the Company sold all of its interest in this property, see disposition discussion below.
(2)
The Company acquired this property through the purchase of an additional ownership interest in a joint venture in which the Company had previously held an 11.25% noncontrolling ownership interest. As a result of this transaction the Company now holds a 75% controlling interest and consolidates this entity. There was no gain or loss recognized in connection with this change in control.
(3)
The Company acquired this property from a joint venture in which the Company holds a 15% noncontrolling ownership interest. The debt assumed is a non-recourse mortgage which bears interest at a rate of 5.54% and is scheduled to mature in 2016. The mortgage also provides the lender with 50% of the excess cash flow, if any, up to $8.7 million after the Company receives its invested capital plus a stated return. There was no gain or loss recognized in connection with this change in control.
(4)
The Company purchased these adjacent land parcels next to existing properties that the Company currently owns.
(5)
The Company took over control of this property from a preferred equity investment in which the Company held a noncontrolling interest and therefore now consolidates this entity. There was no gain or loss recognized in connection with this change in control.
(6)
The Company acquired these properties from three preferred equity investments in which the Company held noncontrolling interests. The $42.0 million of assumed debt includes a decrease of approximately $0.6 million associated with a fair value debt adjustment relating to the property’s purchase price allocation. There were no gains or losses recognized in connection with these changes in control.
54
KIMCO REALTY CORPORATION AND SUBSIDIARIES
NOTES TO CONSOLIDATED FINANCIAL STATEMENTS, continued
The aggregate purchase price of the above
20112012 and
20102011 property acquisitions have been allocated as follows (in thousands):
| | | | |
| | 2011 | | 2010 |
Land | $ | 104,824 | $ | 62,475 |
Buildings | | 174,129 | | 134,929 |
Below Market Rents | | (16,958) | | (8,615) |
Above Market Rents | | 12,345 | | 7,613 |
In-Place Leases | | 20,031 | | 15,473 |
Other Intangibles | | - | | 22 |
Building Improvements | | 72,979 | | 36,161 |
Tenant Improvements | | 14,110 | | 9,712 |
Mortgage Fair Value Adjustment | | (6,896) | | (4,446) |
Other Assets | | - | | 2,123 |
Other Liabilities | | - | | (1,287) |
Noncontrolling Interest | | - | | (2,855) |
| $ | 374,564 | $ | 251,305 |
| | | 2012 | | | 2011 | |
| Land | | $ | 196,219 | | | $ | 104,824 | |
| Buildings | | | 319,955 | | | | 174,129 | |
| Below Market Rents | | | (40,375 | ) | | | (16,958 | ) |
| Above Market Rents | | | 14,977 | | | | 12,345 | |
| In-Place Leases | | | 31,248 | | | | 20,031 | |
| Building Improvements | | | 99,092 | | | | 72,979 | |
| Tenant Improvements | | | 19,327 | | | | 14,110 | |
| Mortgage Fair Value Adjustment | | | (5,965 | ) | | | (6,896 | ) |
| | | $ | 634,478 | | | $ | 374,564 | |
Additionally, during the years ended December 31,
20112012 and
2010,2011, the Company acquired the remaining interest in
six and two previously consolidated joint ventures for
approximately$12.0 million and $0.2 million,
and $13.2 million, respectively.
The Company continues to consolidate these entities as there was no change in control from these transactions. The purchase of the additional partnership interests resulted in a decrease of approximately $0.2 million and an increase of approximately $8.2 million to the Company’s Paid-in capital, during 2011 and 2010, respectively.
Also during 2011, the Company acquired additional interests in two separate consolidated joint ventures for an aggregate cost of approximately $9.7 million. The Company continues to consolidate these entities as there was no change in control from these transactions. The purchase of the remaining and additional partnership interestinterests resulted in an aggregate decrease in noncontrolling interest of $10.4 million and $13.0 million for the years ended December 31, 2012 and 2011, respectively, and an aggregate decrease of $0.3 million and an aggregate increase of $3.6 million to the Company’s Paid-in capital, of approximately $3.8 million.
during 2012 and 2011, respectively.
KIMCO REALTY CORPORATION AND SUBSIDIARIES
NOTES TO CONSOLIDATED FINANCIAL STATEMENTS, continued
The Company is engaged in
ground-up development projects which consist of (i) U.S. ground-up development projects, which will be held as long-term investments by the
Company and (ii) various ground-up development projects located in Latin America for long-term investment.Company. As of December 31,
2011,2012, the Company had in progress a total of
fourthree ground-up development projects, consisting of
(i) two located in the U.S.
, (ii) and one located in
Peru and (iii) one located in Chile.Peru.
During 2011, the Company acquired a land parcel located in Lima, Peru through a newly formed joint venture in which the Company has a 95% controlling ownership interest for a purchase price of 6.8 million Peruvian Sols
(approximately USD(USD $2.5 million). This parcel will be developed into a grocery anchored shopping center.
Kimsouth Realty Inc. (“Kimsouth”) is a wholly-owned subsidiary of the
Company. KimsouthCompany that holds a 13.4% noncontrolling interest in a joint venture
with an investment group which owns a portion of Albertson’s Inc. During
2012, the joint venture distributed $50.3 million of which the Company received $6.9 million, which was recognized as income from cash received in excess of the Company’s investment, before income tax. During 2011, the joint venture distributed
approximately $100.0 million of which the Company received
approximately $13.9 million, which was recognized as income from cash received in excess of the Company’s investment, before income tax. The income
for both 2012 and 2011 was included in Equity in income from other real estate investments, net on the Company’s Consolidated Statements of
Operations. Income.
During 2010, the Albertson’s joint venture disposed of 23 operating properties for an aggregate sales price of $126.5 million, resulting in a gain of approximately $91.7 million. Kimsouth’s share was approximately $12.3 million and is included in Equity in income from other real estate investments, net on the Company’s Consolidated Statements of Operations. Additionally, during 2010, the Albertson’s joint venture sold 32 operating properties in a sales leaseback transaction for an aggregate sales price of approximately $266.0 million. The sales leaseback transaction resulted in a deferred gain of approximately $262.4 million which will be recognized over the 20-year lease term. Kimsouth’s share of this deferred gain is approximately $35.2 million. In connection with these transactions, Kimsouth received a total distribution of approximately $34.7 million. As a result of this distribution, the Company recognized additional income of approximately $1.3 million from cash received in excess of the Company’s investment.
55
KIMCO REALTY CORPORATION AND SUBSIDIARIES
NOTES TO CONSOLIDATED FINANCIAL STATEMENTS, continued
Kimco Income Fund II -
During the year ended December 31, 2010, the Company purchased an additional 1.62% partnership interest in Kimco Income Fund II (“KIF II”) from one of its investors for approximately $0.8 million. As a result of this transaction the Company now holds a 75.28% controlling interest in KIF II and continues to consolidate this entity. Since there was no change in control from this transaction, the purchase of the additional interest resulted in an adjustment to the Company’s Paid-in capital of approximately $1.0 million.
During July 2010, the Company acquired an additional 3.6% interest in FNC Realty Corporation (“FNC”) for $3.5 million, which increased the Company’s total controlling ownership interest to approximately 56.6%.
During 2011, the Company acquired an additional 12.48% interest in FNC Realty Corporation (“FNC”) for approximately $12.4 million, which increased the Company’s total controlling ownership interest to approximately 69.08%. During 2012, the Company acquired an additional 13.62% interest in FNC for $15.3 million, which increased the Company’s total ownership interest to 82.70%. The Company had previously and continues to consolidate FNC. Since there was no change in control from this transaction,these transactions, the purchase of the additional interest resulted in an increase to the Company’s Paid-in capital of approximately$0.1 million and $1.0 million.million during 2012 and 2011, respectively.
5. Dispositions of Real Estate: Operating Real Estate –
During 2012, the years ended December 31, 2011, 2010 and 2009, FNCCompany disposed of the following62 operating properties and recordedtwo outparcels, in separate transactions, for an aggregate sales price of $418.9 million. These transactions, which are included in discontinued operations, resulted in an aggregate pre-tax gain of $85.9 million and aggregate impairment charges of $22.5 million, before income taxes. The Company provided seller financing in connection with the related income as Income from othersale of one of the operating properties for $4.2 million, which bears interest at a rate of 6.0% and matures in November 2013. The Company evaluated this transaction pursuant to the FASB’s real estate investmentssales guidance and concluded that the criteria for sale recognition were met.
Additionally, during 2012, the Company disposed of four land parcels and two outparcels for an aggregate sales price of $7.1 million and recognized an aggregate gain of $2.0 million and aggregate impairment charges of $0.3 million related to these transactions. The gains from these transactions are recorded as other income, which is included in Other expense, net, and the impairment charges have been recorded as Impairment charges in the Company’s Consolidated Statements of
Operations (amountsIncome. The Company provided seller financing in
millions):
| | | |
| 2011 | 2010 | 2009 |
Number of Properties | 2 | 4 | 2 |
Aggregate Sales Price | $4.5 | $6.5 | $2.4 |
Income, before noncontrolling interest and income tax expense, net | $2.6 | $0.5 | $0.9 |
5. Dispositionsconnection with the sale of Real Estate:
one of the land parcels for $1.8 million, which bears interest at a rate of 6.5% for the first six months and 7.5% for the remaining term and is scheduled to mature in March 2013. The Company evaluated this transaction pursuant to the FASB’s real estate sales guidance and concluded that the criteria for sale recognition were met.
Also, during 2012, the Company sold a land parcel in San Juan del Rio, Mexico for a sales price of 24.3 million Mexican Pesos (“MXN”) (USD $1.9 million). The Company recognized a gain of MXN 5.7 million (USD $0.4 million) on this transaction. The gain from this transaction is recorded as other income, which is included in Other expense, net, in the Company’s Consolidated Statements of Income.
KIMCO REALTY CORPORATION AND SUBSIDIARIES
NOTES TO CONSOLIDATED FINANCIAL STATEMENTS, continued
During 2012, the Company sold a previously consolidated operating property to a newly formed unconsolidated joint venture in which the Company has a 20% noncontrolling interest for a sales price of $55.5 million. This transaction resulted in a pre-tax gain of $10.0 million, of which the Company deferred $2.0 million due to its continued involvement. This gain has been recorded as Gain on sale of operating properties, net of tax in the Company’s Consolidated Statements of Income.
During 2011, the Company disposed of 27 operating properties, one development property and one outparcel, in separate transactions, for an aggregate sales price of
approximately $124.9 million. These transactions, which are included in
Discontinued Operations,discontinued operations, resulted in an aggregate gain of
approximately $17.3 million and aggregate impairment charges of
approximately $16.9 million, before an income tax benefit and noncontrolling interest. The Company provided seller financing aggregating
approximately $11.9 million on three of these transactions which bear interest at rates ranging from 5.50% to 8.00% per annum and
are scheduledhave maturities ranging from one to
mature in 2012 and 2018.seven years. The Company evaluated these transactions pursuant to the FASB’s real estate sales guidance to determine sale and gain recognition.
Additionally, during 2011 the Company disposed of a portion of an operating property and a land parcel, in separate transactions, for an aggregate sales price of
approximately $5.4 million. These transactions resulted in aggregate impairment charges of
approximately $1.6 million which is included in Impairment
of property carrying values,charges, on the Company’s Consolidated Statements of
Operations.Income.
Also, during 2011, a consolidated joint venture in which the Company had a preferred equity investment disposed of a property for a sales price of
approximately $6.1 million. As a result of this capital transaction, the Company received
approximately $1.4 million of profit participation, before noncontrolling interest of
approximately $0.1 million. This profit participation has been recorded as Income from other real estate investments and is reflected in Income from discontinued operating properties in the Company’s Consolidated Statements of
Operations.Income.
During 2011, the Company transferred an operating property for a sales price of
approximately $23.9 million to a newly formed unconsolidated joint venture in which the Company has a noncontrolling interest. This transaction resulted in a gain of
approximately $0.4 million, of which the Company deferred
approximately $0.1 million due to its continued involvement.
During 2010, the Company (i) sold seven operating properties, which were previously consolidated, to two new joint ventures in which the Company holds noncontrolling equity interests for an aggregate sales price of
approximately $438.1 million including the assignment of $159.9 million of non-recourse mortgage debt encumbering three of the properties and (ii) disposed of, in separate transactions, seven operating properties for an aggregate sales price of
approximately $100.5 million including the assignment of $81.0 million of non-recourse mortgage debt encumbering one of the properties. These transactions resulted in aggregate gains of
approximately $4.4 million and aggregate losses/impairments of
approximately $5.0 million.
56
KIMCO REALTY CORPORATION AND SUBSIDIARIES
NOTES TO CONSOLIDATED FINANCIAL STATEMENTS, continued
Additionally, during 2010, the Company disposed of (i) three properties, in separate transactions, for an aggregate sales price of
approximately $23.8 million and (ii) five properties from a consolidated joint venture in which the Company had a preferred equity investment for a sales price of
approximately $40.8 million. These transactions resulted in an aggregate profit participation of
approximately $20.8 million, before income tax of
approximately $1.0 million and noncontrolling interest of
approximately $4.9 million. This profit participation has been recorded as Income from other real estate investments and is reflected in Income from discontinued operating properties, net of tax in the Company’s Consolidated Statements of
Operations.Income.
During 2010, the Company also disposed of, in separate transactions, nine land parcels for an aggregate sales price of
approximately $25.6 million which resulted in an aggregate gain of
approximately $3.4 million. This gain is included in Other
(expense)/income,expense, net in the Company’s Consolidated Statements of
Operations.Income.
During 2009, the Company disposed of, in separate transactions, portions of six operating properties and one land parcel for an aggregate sales price of approximately $28.9 million. The Company provided seller financing for two of these transactions aggregating approximately $1.4 million, which bear interest at 9% per annum and are scheduled to mature in January and March of 2012. The Company evaluated these transactions pursuant to the FASB’s real estate sales guidance. These seven transactions resulted in the Company’s recognition of an aggregate net gain of approximately $4.1 million, net of income tax of $0.2 million.
Also during 2009, a consolidated joint venture in which the Company has a controlling interest disposed of a parcel of land for approximately $4.8 million and recognized a gain of approximately $4.4 million, before income taxes and noncontrolling interest. This gain has been recorded as Other (expense)/income, net in the Company’s Consolidated Statements of Operations.
During 2011, the Company transferred a merchant building property for a sales price of
approximately $37.6 million to a newly formed unconsolidated joint venture in which the Company has a noncontrolling interest. This transaction resulted in an aggregate gain of
approximately $14.2 million, before income tax expense, of which the Company deferred
approximately $2.1 million due to its continued involvement.
During 2010, the Company disposed of a land parcel for a sales price of
approximately $0.8 million resulting in a gain of
approximately $0.4 million. Additionally, the Company recognized
approximately $1.7 million in income on previously sold development properties during the year ended December 31, 2010.
During 2009, the Company sold, in separate transactions, five out-parcels, four land parcels and three ground leases for aggregate proceeds of approximately $19.4 million. These transactions resulted in gains on sale of development properties of approximately $5.8 million, before income taxes of $2.3 million.
KIMCO REALTY CORPORATION AND SUBSIDIARIES
NOTES TO CONSOLIDATED FINANCIAL STATEMENTS, continued
6. Adjustment of Property Carrying Values and Real Estate Under Development: During 2012, the Company recognized an aggregate impairment charge of $34.1 million, before income tax benefit of $10.7 million, relating to its investment in four operating properties, which are included in Impairment charges in the Company’s Consolidated Statements of Income. The aggregate book value of these properties was $86.6 million. The estimated aggregate fair value of these properties is based upon purchase price offers and comparable sales information aggregating $52.5 million (see footnote 16 for additional disclosure on fair value). These impairment charges resulted from the Company’s efforts to market certain assets and management’s assessment as to the likelihood and timing of such potential transactions.
During 2011, the Company recognized
an aggregate impairment
chargescharge of
approximately $3.9 million, before income tax benefit of
approximately $1.1 million, relating to its investment in two operating properties and one land parcel. The aggregate book value of these properties was
approximately $9.2 million. The estimated aggregate fair value of these properties
iswas based upon purchase prices and
current purchase price offers aggregating
approximately $5.3 million.
These impairment charges resulted from the Company’s efforts to market certain assets and management’s assessment as to the likelihood and timing of such potential transactions.
During 2010, the Company recognized
an aggregate impairment
chargescharge of
approximately $8.7 million, of which
approximately $5.2 million is classified as discontinued operations on the Company’s Consolidated Statement of
Operations,Income, relating to its investment in seven properties. Four of these properties were sold during 2010 and one of these properties was classified as held-for-sale as of December 31, 2010. The estimated individual fair value of these properties was based upon purchase prices and current purchase price offers.
These impairments were primarily due to declines in real estate fundamentals along with adverse changes in local market conditions and the uncertainty of their recovery.
Additionally, during 2010, the Company had determined that one of its unconsolidated joint ventures’ ground-up development projects, located in Miramar, FL, estimated recoverable value will not exceed its estimated cost. As a result, the Company recorded
an aggregatea pre-tax other-than-temporary impairment on its investment of $11.7 million, representing the excess of the investment’s carrying value over its estimated fair value.
57
KIMCO REALTY CORPORATION AND SUBSIDIARIES
NOTES TO CONSOLIDATED FINANCIAL STATEMENTS, continued
During 2009, as part of the Company’s ongoing impairment assessment, the Company determined that there were certain redevelopment mixed-use properties with estimated recoverable values that would not exceed their estimated costs. As a result, the Company recorded an aggregate impairment of property carrying values of approximately $50.0 million, representing the excess of the carrying values of 10 properties, primarily located in Philadelphia, Chicago, New York and Boston, over their estimated fair values.
Additionally, during 2009, the Company determined that there was one ground-up development project with an estimated recoverable value that would not exceed its estimated cost. As a result, the Company recorded an impairment of approximately $2.1 million, representing the excess of the carrying value of the project over its estimated fair value.
These impairments were primarily due to declines in real estate fundamentals along with adverse changes in local market conditions and the uncertainty of their recovery. The Company’s estimated fair values werevalue was based upon estimated sales prices or, where applicable, projected operating cash flows (discounted and unleveraged) of the property over its specified holding period. Such cash flow projections consider factors such as expected future operating income, trends and prospects, as well as the effects of demand, competition and other factors. Capitalization rates and discount rates utilized in these modelsthis model were based upon rates that the Company believes to be within a reasonable range of current market rates for the respective properties.
7. Discontinued Operations and Assets Held-for-Sale: The Company reports as discontinued operations assets held-for-sale as of the end of the current period and assets sold during the period. All results of these discontinued operations are included in a separate component of income on the Consolidated Statements of
OperationsIncome under the caption Discontinued operations. This has resulted in certain reclassifications of
2012, 2011
2010 and
20092010 financial statement amounts.
The components of Income from discontinued operations for each of the three years in the period ended December 31,
2011,2012, are shown below. These include the results of
operationsIncome through the date of each respective sale for properties sold during
2012, 2011
2010 and
2009,2010, and the operations for the applicable periods for those assets classified as held-for-sale as of December 31,
20112012 (in thousands):
| | | | | | |
| | 2011 | | 2010 | | 2009 |
Discontinued operations: | | | | | | |
Revenues from rental property | $ | 10,101 | $ | 41,833 | $ | 31,523 |
Rental property expenses | | (4,868) | | (14,334) | | (9,283) |
Depreciation and amortization | | (3,590) | | (14,801) | | (6,027) |
Interest expense | | (347) | | (6,370) | | (2,110) |
Income from other real estate investments | | 2,001 | | 20,792 | | 1 |
Other income/(expense), net | | 169 | | (472) | | (33) |
Income from discontinued operating properties, before income taxes | | 3,466 | | 26,648 | | 14,071 |
Loss on operating properties held-for-sale/sold, before income taxes | | - | | (35) | | (174) |
Impairment of property carrying value, before income taxes | | (16,898) | | (6,460) | | (26,000) |
Gain on disposition of operating properties, before income taxes | | 17,327 | | 1,932 | | 689 |
Benefit/(provision) for income taxes | | 1,334 | | (252) | | 9,711 |
Income/(loss) from discontinued operating properties | | 5,229 | | 21,833 | | (1,703) |
Net income attributable to noncontrolling interests | | (1,134) | | (4,990) | | (313) |
Income/(loss) from discontinued operations attributable to the Company | $ | 4,095 | $ | 16,843 | $ | (2,016) |
| | | 2012 | | | 2011 | | | 2010 | |
| Discontinued operations: | | | | | | | | | |
| Revenues from rental property | | $ | 27,155 | | | $ | 65,783 | | | $ | 96,794 | |
| Rental property expenses | | | (10,069 | ) | | | (24,144 | ) | | | (33,015 | ) |
| Depreciation and amortization | | | (13,249 | ) | | | (19,427 | ) | | | (30,431 | ) |
| Interest expense | | | (997 | ) | | | (1,848 | ) | | | (9,429 | ) |
| Income from other real estate investments | | | 13 | | | | 2,000 | | | | 20,781 | |
| Other expense, net | | | (212 | ) | | | (114 | ) | | | (760 | ) |
| Income from discontinued operating properties, before income taxes | | | 2,641 | | | | 22,250 | | | | 43,940 | |
| Loss on operating properties sold, before income taxes | | | - | | | | - | | | | (35 | ) |
| Impairment of property carrying value, before income taxes | | | (22,458 | ) | | | (19,698 | ) | | | (6,460 | ) |
| Gain on disposition of operating properties, before income taxes | | | 85,894 | | | | 17,327 | | | | 1,981 | |
| (Provision)/ benefit for income taxes | | | (2,079 | ) | | | 3,126 | | | | (274 | ) |
| Income from discontinued operating properties | | | 63,998 | | | | 23,005 | | | | 39,152 | |
| Net income attributable to noncontrolling interests | | | (1,731 | ) | | | (1,384 | ) | | | (5,288 | ) |
| Income from discontinued operations attributable to the Company | | $ | 62,267 | | | $ | 21,621 | | | $ | 33,864 | |
KIMCO REALTY CORPORATION AND SUBSIDIARIES
NOTES TO CONSOLIDATED FINANCIAL STATEMENTS, continued
During 2012, the Company classified as held-for-sale 18 operating properties, comprising 2.1 million square feet of GLA. The book value of these properties was $73.2 million, net of accumulated depreciation of $57.2 million. The Company recognized impairment charges of $4.2 million on three of these properties. The book value of the other properties did not exceed their estimated fair value, less costs to sell, and as such no impairment charges were recognized. The Company’s determination of the fair value of these properties, aggregating $102.0 million, was based upon executed contracts of sale with third parties (see Footnote 16). In addition, the Company completed the sale of 19 operating properties during the year ended December 31, 2012, of which two were classified as held-for-sale during 2011 (these dispositions are included in Footnote 2 above). At December 31, 2012, the Company had one operating property classified as held-for-sale at a carrying amount of $3.4 million, net of accumulated depreciation of $6.8 million, which is included in Other assets on the Company’s Consolidated Balance Sheets.
During 2011, the Company classified as held-for-sale seven operating properties and one land parcel, comprising
approximately 0.2 million square feet of GLA. The book value of each of these properties aggregated
approximately $10.0 million, net of accumulated depreciation of $7.3 million. The Company recognized impairment charges of
approximately $1.1 million on the land parcel. The individual book values of the seven operating properties did not exceed each of their estimated fair values less costs to sell; as such no impairments were recognized. The Company’s determination of the fair value of these properties and land parcel, aggregating
approximately $19.7 million, was based upon executed contracts of sale with third parties. The Company completed the sale of five of these operating properties during the year ended December 31, 2011.
The remainingAt December 31, 2011 the Company had two properties
classified as held-for-sale
aggregating approximatelyat an aggregate carrying amount of $3.8 million, net of accumulated depreciation of $0.5 million,
which are included in Other assets on the Company’s Consolidated Balance Sheets.
58
KIMCO REALTY CORPORATION AND SUBSIDIARIES
NOTES TO CONSOLIDATED FINANCIAL STATEMENTS, continued
During 2010, the Company classified as held-for-sale 12 operating properties comprising
approximately 0.5 million square feet of GLA. The book value of each of these properties aggregated
approximately $40.5 million, net of accumulated depreciation of $11.9 million. The Company recognized impairment charges of
approximately $5.2 million, before income tax benefit, on seven of these properties. The individual book value of the five remaining properties did not exceed each of their estimated fair values less costs to sell. The Company’s determination of the fair value of the 12 properties, aggregating
approximately $66.1 million, was based upon executed contracts of sale with third parties. The Company completed the sale of eleven of these properties during 2010. During 2011, the Company reclassified one property previously classified as held-for-sale into held-for-use.
The remainingAt December 31, 2010 the Company had one property
classified as held-for-sale
hasat a
bookcarrying value of
approximately $4.4 million,
and iswhich was included in Other
Assetsassets on the Company’s Consolidated Balance Sheets.
8. Investment and Advances in Real Estate Joint Ventures: The Company and its subsidiaries have investments in and advances to various real estate joint ventures. These joint ventures are engaged primarily in the operation of shopping centers which are either owned or held under long-term operating leases. The Company and the joint venture partners have joint approval rights for major decisions, including those regarding property operations. As such, the Company holds noncontrolling interests in these joint ventures and accounts for them under the equity method of accounting. The table below presents joint venture investments for which the Company held an ownership interest at December 31,
20112012 and
20102011 (in millions, except number of properties):
| | | | | | |
As of December 31, 2011 |
Venture | Average Ownership Interest | Number of Properties | Total GLA | Gross Investment In Real Estate | The Company's Investment | The Company's Share of Income/(Loss) |
Prudential Investment Program
(“KimPru” and “KimPru II”) (1) (2) | 15.00% | 63 | 10.9 | $ 2,781.4 | $ 151.9 | $ (1.6) |
Kimco Income Opportunity Portfolio (“KIR”) (2) | 45.00% | 59 | 12.6 | 1,556.6 | 151.4 | 17.3 |
UBS Programs (2)* | 17.90% | 42 | 5.9 | 1,330.5 | 61.3 | (0.8) |
BIG Shopping Centers (2) (5)* | 37.60% | 23 | 3.7 | 557.4 | 41.2 | (2.9) |
The Canada Pension Plan Investment Board (“CPP”) (2) (4) | 55.00% | 6 | 2.4 | 430.0 | 140.6 | 5.2 |
Kimco Income Fund (2) | 15.20% | 12 | 1.5 | 281.1 | 12.1 | 1.0 |
SEB Immobilien (2) (8) | 15.00% | 13 | 1.8 | 360.5 | 2.1 | - |
Other Institutional Programs (2) | Various | 67 | 4.7 | 804.4 | 33.7 | 5.5 |
RioCan | 50.00% | 45 | 9.3 | 1,367.0 | 62.2 | 19.7 |
Intown (3) | | 138 | N/A | 829.9 | 90.8 | (1.9) |
Latin America | Various | 130 | 17.9 | 1,145.8 | 318.0 | 12.5 |
Other Joint Venture Programs (6) (7) | Various | 92 | 13.7 | 2,016.5 | 338.9 | 10.0 |
Total | | 690 | 84.4 | $13,461.1 | $1,404.2 | $64.0 |
| | | | | | |
As of December 31, 2010 |
Venture | Average Ownership Interest | Number of Properties | Total GLA | Gross Investment In Real Estate | The Company's Investment | The Company's Share of Income/(Loss) |
KimPru and KimPru II (1) (2) (9) | 15.00% | 65 | 11.3 | $ 2,915.1 | $ 145.3 | $ (18.4) |
KIR (2) | 45.00% | 59 | 12.6 | 1,546.6 | 156.1 | 19.8 |
UBS Programs (2)* | 17.90% | 43 | 6.3 | 1,366.6 | 68.3 | 1.2 |
BIG Shopping Centers (2) (9)* | 36.50% | 22 | 3.5 | 507.2 | 42.4 | (1.2) |
CPP (2) | 55.00% | 5 | 2.1 | 378.1 | 115.1 | 3.2 |
Kimco Income Fund (2) | 15.20% | 12 | 1.5 | 281.7 | 12.4 | 1.0 |
SEB Immobilien (2) | 15.00% | 11 | 1.5 | 300.1 | 3.4 | 0.8 |
Other Institutional Programs (2) | Various | 68 | 4.9 | 838.1 | 35.1 | - |
RioCan | 50.00% | 45 | 9.3 | 1,380.7 | 61.5 | 18.6 |
Intown (3) | | 138 | N/A | 820.1 | 99.4 | (6.0) |
Latin America | Various | 130 | 17.3 | 1,191.1 | 344.8 | 10.4 |
Other Joint Venture Programs (10) | Various | 91 | 13.1 | 2,029.3 | 298.9 | 5.2 |
Total | | 689 | 83.4 | $13,554.7 | $1,382.7 | $34.6 |
* Ownership % is a blended rate
59
KIMCO REALTY CORPORATION AND SUBSIDIARIES
NOTES TO CONSOLIDATED FINANCIAL STATEMENTS, continued
| | | | | | As of December 31, 2012 | | As of December 31, 2011 | |
| Venture | | Average Ownership Interest | | | Number of Properties | | GLA | | Gross Real Estate | | The Company's Investment | | Number of Properties | | GLA | | Gross Real Estate | | The Company's Investment | |
| Prudential Investment Program (“KimPru” and “KimPru II”) (1) (2) | | 15.00 | % | | 61 | | 10.7 | | $ | 2,744.9 | | $ | 170.1 | | 63 | | 10.9 | | $ | 2,781.4 | | $ | 151.9 | |
| Kimco Income Opportunity Portfolio (“KIR”) (2) | | 45.00 | % | | 58 | | 12.4 | | | 1,543.2 | | | 140.3 | | 59 | | 12.6 | | | 1,556.6 | | | 151.4 | |
| UBS Programs (2)* | | 17.90 | % | | 40 | | 5.7 | | | 1,260.1 | | | 58.4 | | 42 | | 5.9 | | | 1,330.5 | | | 61.3 | |
| BIG Shopping Centers (2)* | | 37.70 | % | | 22 | | 3.6 | | | 547.7 | | | 31.3 | | 23 | | 3.7 | | | 557.4 | | | 41.2 | |
The Canada Pension Plan Investment Board (“CPP”) (2) | | 55.00 | % | | 6 | | 2.4 | | | 436.1 | | | 149.5 | | 6 | | 2.4 | | | 430.0 | | | 140.6 | |
| Kimco Income Fund (2) | | 15.20 | % | | 12 | | 1.5 | | | 287.0 | | | 12.3 | | 12 | | 1.5 | | | 281.1 | | | 12.1 | |
| SEB Immobilien (2) | | 15.00 | % | | 13 | | 1.8 | | | 361.2 | | | 1.5 | | 13 | | 1.8 | | | 360.5 | | | 2.1 | |
| Other Institutional Programs (2) | | Various | | | 58 | | 2.6 | | | 499.2 | | | 21.3 | | 67 | | 4.7 | | | 804.4 | | | 33.7 | |
| RioCan | | 50.00 | % | | 45 | | 9.3 | | | 1,379.3 | | | 111.0 | | 45 | | 9.3 | | | 1,367.0 | | | 62.2 | |
| Intown (3) | | - | | | 138 | | N/A | | | 841.0 | | | 86.9 | | 138 | | N/A | | | 829.9 | | | 90.8 | |
| Latin America | | Various | | | 131 | | 18.0 | | | 1,198.1 | | | 334.2 | | 130 | | 17.9 | | | 1,145.8 | | | 318.0 | |
| Other Joint Venture Programs (4) (5) (7) (8) | | Various | | | 87 | | 13.2 | | | 1,846.7 | | | 311.4 | | 92 | | 13.7 | | | 2,016.5 | | | 338.9 | |
| Total | | | | | 671 | | 81.2 | | $ | 12,944.5 | | $ | 1,428.2 | | 690 | | 84.4 | | $ | 13,461.1 | | $ | 1,404.2 | |
| * | Ownership % is a blended rate |
The table below presents the Company’s share of net income/(loss) for these investments which is included in the Company’s Consolidated Statements of Income under Equity in income of joint ventures, net and Gains on change in control of interests for the years ended December 31, 2012, 2011 and 2010 (in millions):
| | | Year ended December 31, | |
| | | 2012 | | | 2011 | | | 2010 | |
| KimPru and KimPru II (14) (15) (16) | | $ | 7.4 | | | $ | (1.6 | ) | | $ | (18.4 | ) |
| KIR (17) (18) | | | 23.4 | | | | 17.3 | | | | 19.8 | |
| UBS Programs (19) | | | 0.5 | | | | (0.8 | ) | | | 1.2 | |
| BIG Shopping Centers (20) | | | (3.7 | ) | | | (2.9 | ) | | | (1.2 | ) |
| CPP | | | 5.3 | | | | 5.2 | | | | 3.2 | |
| Kimco Income Fund | | | 1.7 | | | | 1.0 | | | | 1.0 | |
| SEB Immobilien | | | 0.7 | | | | - | | | | 0.8 | |
| Other Institutional Programs (6) (10) (13) (21) | | | 19.6 | | | | 5.5 | | | | - | |
| RioCan (9) | | | 30.4 | | | | 19.7 | | | | 18.6 | |
| Intown | | | 4.0 | | | | (1.9 | ) | | | (6.0 | ) |
| Latin America | | | 15.8 | | | | 12.5 | | | | 10.4 | |
| Other Joint Venture Programs (11) (12) (22) (23) (24) | | | 23.4 | | | | 10.0 | | | | 5.2 | |
| Total | | $ | 128.5 | | | $ | 64.0 | | | $ | 34.6 | |
(1) This venture represents four separate joint ventures, with four separate accounts managed by Prudential Real Estate Investors (“PREI”), three of these ventures are collectively referred to as KimPru and the remaining venture is referred to as KimPru II.
(2) The Company manages these joint venture investments and, where applicable, earns acquisition fees, leasing commissions, property management fees, assets management fees and construction management fees.
(3) The Company’s share of this investment is subject to fluctuation and is dependent upon property cash flows.
(4)
CPP acquired an unencumbered operating property in Quakertown, PA for a purchase price of approximately $52.0 million, during 2011.(5) BIG Shopping Centers acquired an operating property in Selden, NY for a purchase price of approximately $43.5 million includingDuring the assumption of approximately $34.1 million in nonrecourse mortgage debt, during 2011.
(6) During 2011,year ended December 31, 2012, the Company in separate transactions, amended threeone of its Canadian preferred equity investment agreements to restructure the investmentsinvestment as a pari passu joint venturesventure in which the Company holds a noncontrolling interests.interest. As a result of these transactions,this transaction, the Company continues to account for its aggregate net investment in thesethis joint venturesventure under the equity method of accounting and includes these investmentsthis investment in Investments and advances to real estate joint ventures within the Company’s Consolidated Balance Sheets (see Footnote 9).
(7)Sheets.
KIMCO REALTY CORPORATION AND SUBSIDIARIES
NOTES TO CONSOLIDATED FINANCIAL STATEMENTS, continued
(5) During 2011,the year ended December 31, 2012, a joint venture in which the Company holds a noncontrolling interest sold an operating property for a sales price of $62.0 million, which resulted in no gain or loss recognized.
(6) During the year ended December 31, 2012, a joint venture in which the Company held a noncontrolling interest sold an operating property to the Company for a sales price of approximately $37.7$127.0 million. The Company received a distribution of $11.2 millionevaluated this transaction pursuant to the FASB’s Consolidation guidance and as such recognized a gain of approximately $2.4$12.1 million beforefrom the fair value adjustment associated with its original ownership due to a change in control. In addition, the Company recognized promote income taxes. Inof $1.1 million in connection with this transaction,transaction.
(7) During the year ended December 31, 2012, the Company
was relieved of its guarantee of $24.5 million relatingsold an operating property to
the entity’s unsecured credit facility.(8) SEB Immobilien acquired two properties froma newly formed unconsolidated joint venture in which the Company has a noncontrolling interest for a sales price of $55.5 million.
(8) During the year ended December 31, 2012, a joint venture in which the Company holds a noncontrolling interest acquired an
aggregateoperating property in Alberta, Canada for a purchase price of
approximately $61.5 million and entered into two new non recourse mortgages on these properties aggregating $36.9 million during 2011.$42.4 million. The Company’s capital contribution was $14.5 million.
(9) During 2010 KimPru and KimPru II sold 24the year ended December 31, 2012, the Company recognized income of $7.5 million, before taxes of $1.5 million, from the sale of certain air rights at one of the properties toin this portfolio.
(10) During the year ended December 31, 2012, the Company acquired four newproperties from joint ventures in which the Company has a noncontrolling interest. The Company evaluated these transactions pursuant to the FASB’s Consolidation guidance and as such recognized an aggregate gain of $14.5 million from the fair value adjustment associated with its original ownership interest, includingdue to a change in control.
(11) During the
BIG Shopping Centers joint venture.(10) During 2010,year ended December 31, 2012, the Company acquired a property from a joint venture in separate transactions, amendedwhich the Company had a noncontrolling interest. The Company evaluated this transaction pursuant to the FASB’s Consolidation guidance and as such recognized an aggregate gain of $1.0 million from the fair value adjustment associated with its original ownership due to a change in control.
(12) During the year ended December 31, 2012, two of its Canadian preferred equity investment agreements to restructure the investments as pari passu joint ventures in which the Company holds noncontrolling interests. Asinterests sold two properties for an aggregate sales price of $118.0 million. The Company received distributions of $18.5 million and recognized an aggregate gain of $8.3 million.(13) During the year ended December 31, 2012, a result of these transactions, the Company continues to account for its aggregate net investment in these joint ventures under the equity method of accounting and includes these investments in Investments and advances to real estate joint ventures within the Company’s Consolidated Balance Sheets (see Footnote 9).
The table below presents debt balances within the Company’s joint venture investments forin which the Company heldholds a noncontrolling ownership interests atinterest sold two encumbered operating properties to the Company for an aggregate sales price of $75.5 million. The Company recognized promote income of $2.6 million.
(14) KimPru recognized impairment charges of $6.5 million related to the sale of two properties; $53.6 million related to the potential foreclosure of two properties and $161.7 million related to the sale of 26 properties, during the years ended December 31, 2012, 2011 and 2010, (in millions, except average remaining term):
| | | | | | | |
| As of December 31, 2011 | | As of December 31, 2010 |
Venture | Mortgages and Notes Payable | Average Interest Rate | Average Remaining Term (months)** | | Mortgages and Notes Payable | Average Interest Rate | Average Remaining Term (months)** |
KimPru and KimPru II | $1,185.2 | 5.59% | 52.6 | | $1,388.0 | 5.56% | 59.8 |
KIR | 911.5 | 5.89% | 75.6 | | 954.7 | 6.54% | 53.1 |
UBS Programs | 718.9 | 5.66% | 47.4 | | 733.6 | 5.70% | 54.8 |
BIG Shopping Centers | 444.5 | 5.52% | 57.4 | | 407.2 | 5.47% | 72.5 |
Canadian Pension Plan | 166.3 | 4.45% | 27.0 | | 168.7 | 4.45% | 39.3 |
Kimco Income Fund | 164.7 | 5.45% | 32.7 | | 167.8 | 5.45% | 44.7 |
SEB Immobilien | 243.7 | 5.34% | 61.9 | | 193.5 | 5.67% | 71.4 |
RioCan | 925.0 | 5.66% | 43.3 | | 968.5 | 5.84% | 52.0 |
Intown | 621.8 | 5.09% | 39.6 | | 628.0 | 5.19% | 46.8 |
Other Institutional Programs | 514.4 | 4.90% | 45.4 | | 550.8 | 5.08% | 56.6 |
Other Joint Venture Programs | 1,804.7 | 5.60% | 56.9 | | 1,801.8 | 5.08% | 50.5 |
Total | $7,700.7 | | | | $7,962.6 | | |
** Average Remaining term includes extensions
Prudential Investment Program –
During 2011, KimPru recognized an aggregate impairment charge of approximately $53.6 million relating to two properties which defaulted on their respective non-recourse mortgages. These properties were unable to generate sufficient cash flows to cover the debt service and negotiations with the lenders had not produced a suitable loan modification. As such, one of these properties was foreclosed on by the third party lender and the other is anticipated to be foreclosed on during 2012.respectively. The Company had previously taken other-than-temporary impairment charges on its investment in KimPru and had allocated these impairment charges to the underlying assets of the KimPru joint ventures including a portion to these operating properties. As such, the Company’s share of these impairment charges for the $53.6years ended December 31, 2012, 2011 and 2010 were $0.8 million, aggregate impairment charge was approximately $6.0 million which is included in Equity in income of joint ventures, net on the Company’s Consolidated Statements of Operations. Additionally, duringand $14.8 million, respectively.
(15) During 2011, a third party mortgage lender foreclosed on an operating property for which KimPru had previously taken an impairment charge during 2010. As a result of the
two property foreclosuresforeclosure during 2011, KimPru recognized an aggregate gain on early extinguishment of debt of
approximately $29.6 million. The Company’s share of this gain was
approximately $4.4 million, before income
taxes, which is included in Equity in income of joint ventures, net on the Company’s Consolidated Statements of Operations.
60
KIMCO REALTY CORPORATION AND SUBSIDIARIES
NOTES TO CONSOLIDATED FINANCIAL STATEMENTS, continued
Additionally, during 2011, taxes.
(16) KimPru II recognized an impairment chargecharges of approximately $7.3 million and $25.6 million, during the years ended December 31, 2011 and 2010, respectively. The impairment charges recognized in 2011 related to athe foreclosure of one operating property which defaulted on its non-recourse mortgage. This property was unableand the impairment charges recognized in 2010 related to generate sufficient cash flows to cover the debt service due to tenant vacancies. Negotiations with the lender had not produced a suitable loan modification and as such, the property was foreclosed on by the third party lender.sale of four operating properties. The Company had previously taken other-than-temporary impairment charges on its investment in KimPru II and had allocated these impairment charges to the underlying assets of the KimPru II joint ventures including a portion to thisthese operating property.properties. As such, the Company’s share of these impairment charges for the $7.3 million impairment charge was approximatelyyears ended December 31, 2011 and 2010 were $1.0 million which is included in Equity in income of joint ventures, net on the Company’s Consolidated Statements of Operations.
During 2010, KimPruand $3.4 million, respectively.
(17) KIR recognized impairment charges of approximately $139.7$4.6 million relating to 17 properties that were classified as held-for-sale where the individual net book value of each of the properties exceeded their individual estimated selling price. The Company had previously taken other-than-temporary impairment charges on its investment in KimPru and had allocated these impairment chargesrelated to the underlying assetssale of the KimPru joint ventures including a portion to theseone operating properties. As a result, the Company’s share of the $139.7property and $6.7 million impairment loss was approximately $11.5 million, which is included in Equity in income of joint ventures, net on the Company’s Consolidated Statements of Operations. All 17 of these properties were sold during 2010.
In additionrelated to the impairment charges above, KimPru recognized impairment chargessale of one operating property and one out-parcel during the years ended December 31, 2011 and 2010, of approximately $22.0 million, based on sales prices for nine properties that were classified as held-for-sale.respectively. The Company’s share of these impairment charges was approximately $3.3 million, excluding an income tax benefit of approximately $1.8 million. The $3.3 million impairment charge is included in Equity in income of joint ventures, net on the Company’s Consolidated Statements of Operations. Eight of these properties were sold during 2010.
During 2010, KimPru II sold an operating property, located in Pittsburgh, PA to the Company through the assumption and modification of the mortgage debt encumbering the property. The property had a net book basis of approximately $32.2 million and non-recourse mortgage debt of approximately $22.7 million which bore interest at 5.54% and was scheduled to mature in 2016. As a result of this transaction, KimPru II recognized an impairment charge of approximately $10.1 million. The Company had previously taken an other-than-temporary impairment charge on its investment in KimPru II and had allocated this impairment charge to the underlying assets of the KimPru II joint venture including a portion to this operating property. As a result, the Company’s share of the $10.1 million impairment charge is approximately $1.3 million, excluding an income tax benefit of approximately $0.5 million and is included in Equity in income of joint ventures, net on the Company’s Consolidated Statements of Operations.
In addition to the impairment charge above, KimPru II recognized impairment charges during 2010, aggregating approximately $15.5 million for three properties that were classified as held-for-sale. KimPru II’s determination of the fair value for each of these properties, aggregating approximately $32.4 million, was based upon executed contracts of sale with third parties. The Company’s share of the $15.5 million impairment loss is approximately $2.1 million, excluding an income tax benefit of approximately $1.3 million and is included in Equity in income of joint ventures, net on the Company’s Consolidated Statements of Operations.
During 2009, the Company recognized impairment charges of $28.5 million, against the carrying value of its investment in KimPru, reflecting an other-than-temporary decline in the fair value of its investment resulting from a decline in the real estate markets.
In addition to the impairment charges above, KimPru recognized impairment charges during 2009 of approximately $223.1 million, relating to (i) certain properties held by an unconsolidated joint venture within the KimPru joint venture based on estimated sales prices and (ii) a write-down against the carrying value of an unconsolidated joint venture, reflecting an other-than-temporary decline in the fair value of its investment resulting from a decline in the real estate markets. The Company’s share of these impairment charges was approximately $33.4 million, before income tax benefits of approximately $11.0 million during 2009, which is included in Equity in income of joint ventures, net on the Company’s Consolidated Statements of Operations.
During June 2009, the Company recognized an impairment charge of $4.0 million, against the carrying value of KimPru II. This impairment reflects an other-than-temporary decline in the fair value of its investment resulting from a decline in the real estate markets.
61
KIMCO REALTY CORPORATION AND SUBSIDIARIES
NOTES TO CONSOLIDATED FINANCIAL STATEMENTS, continued
In addition to the impairment charges above, during 2009, KimPru II recognized impairment charges relating to two properties aggregating approximately $11.4 million based on estimated sales price. The Company’s share of these impairment charges were approximately $1.7 million, which is included in Equity in income of joint ventures, net on the Company’s Consolidated Statements of Operations. These operating properties were sold, in separate transactions, during 2009 for an aggregate sales price of approximately $43.5 million, which resulted in no additional gain or loss.
KimPru’s and KimPru II’s estimated fair values relating to the impairment assessments above were based upon sales prices or, where applicable, discounted cash flow models that include all estimated cash inflows and outflows over a specified holding period and where applicable, any estimated debt premiums. Capitalization rates, discount rates and credit spreads utilized in these models are based upon rates that the Company believed to be within a reasonable range of current market rates for the respective properties.
KIR –
Duringyears ended December 31, 2011 KIR recognized an impairment charge of approximately $4.6 million relating to one property which was classified as held-for-sale. KIR’s determination of the fair value for this property, approximately $14.0 million, was based upon a contract of sale with a third party. The Company’s share of this impairment was approximatelyand 2010 were $2.1 million and is included in Equity in income of joint ventures, net on the Company’s Consolidated Statements of Operations.
During 2010, KIR recognized an impairment charge relating to one operating property and one out-parcel aggregating approximately $6.7 million. The Company’s share of these impairment charges was approximately $3.0 million, which is included in Equity in income of joint ventures, net on the Company’s Consolidated Statements of Operations. respectively.
(18) During 2010, the operating property was foreclosed on by the third party mortgage lender, at which time KIR recognized a gain on early extinguishment of debt of approximately $5.8 million the Company’s share of whichrelated to a property that was $2.6 million, which is included in Equity in income of joint ventures, netforeclosed on the Company’s Consolidated Statements of Operations.
During 2009, KIR recognized an impairment charge relating to one property of approximately $5.0 million.by a third party lender. The Company’s share of this gain was $2.6 million.
(19) The UBS Program recognized impairment charge was approximately $2.3charges of $13.0 million which is included in Equity in incomerelated to the sale of joint ventures, net ontwo properties and $9.7 million related to the Company’s Consolidated Statementssale of Operations. During 2010one property, during the third party mortgage lender foreclosed on this operating property, at which time KIR recognized a gain on early extinguishment of debt of approximately $4.3 million, theyears ended December 31, 2012 and 2011, respectively. The Company’s share of which was $2.0 million, which is included in Equity in income of joint ventures, net on the Company’s Consolidated Statements of Operations.
KIR’s estimated fair value relating to thethese impairment assessments above were based upon discounted cash flow models that included all estimated cash inflows and outflows over a specified holding period. Capitalization rates and discount rates utilized in this model were based upon rates that the Company believed to be within a reasonable range of current market ratescharges for the respective property.
years ended December 31, 2012 and 2011 were $2.2 million and $1.9 million, respectively. Additionally, during the year ended December 31, 2011, the UBS Programs (“KUBS”) –
During 2011, KUBSProgram recognized an impairment charge of approximately $9.7 million relating to a property which was classified as held-for-sale. KUBS’s determination of the fair value for this property, approximately $17.4 million, was based upon a contract of sale with a third party. The Company’s share of this impairment was approximately $1.9 million and was included in Equity in income of joint ventures, net on the Company’s Consolidated Statements of Operations. This property was sold in 2011.
Additionally, during 2011, KUBS recognized an impairment charge of approximately $5.0 million relating to a property which defaulted on its non-recourse mortgage. This propertythat was unable to generate sufficient cash flows to cover the debt service and negotiations with the lender have not produced a suitable loan modification. As such, this property is anticipated to be foreclosed on by the third party lender in 2012. The Company’s share of this impairment charge was approximately $0.8 million. A deed in lieu of foreclosure was given to the third party lender in 2012.
(20) During the year ended December 31, 2012, BIG recognized an impairment charge of $9.0 million whichon a property that is includedexpected to be foreclosed upon in Equity in income2013. The Company’s share of this impairment charge was $0.9 million.
(21) During the year ended December 31, 2012, two joint ventures net onin which the Company has a noncontrolling interest recognized aggregate impairment charges of $6.5 million related to the sale of four operating properties. The Company’s share of these impairment charges was $0.8 million.
KIMCO REALTY CORPORATION AND SUBSIDIARIES
NOTES TO CONSOLIDATED FINANCIAL STATEMENTS, continued
(22) During the year ended December 31, 2012, three joint ventures in which the Company has noncontrolling interests recognized aggregate impairment charges of $12.8 million related to the sale of one operating property, the pending sale of one property and the potential foreclosure of another property. The Company’s share of these impairment charges was $6.4 million.
(23) During the year ended December 31, 2011, the Company sold its interest in a Canadian hotel portfolio to its partner, for Canadian Dollars (“CAD”) $2.5 million (USD $2.4 million). As a result, the Company recorded an impairment charge of USD $5.2 million, before income taxes.
(24) For the year ended December 31, 2010, the Company recognized impairment charges of $7.0 million, against the carrying value of its investments in various unconsolidated joint ventures. These impairment charges resulted from properties, within various unconsolidated joint ventures, being classified as held-for-sale.
The table below presents debt balances within the Company’s
Consolidated Statements of Operations.joint venture investments for which the Company held noncontrolling ownership interests at December 31, 2012 and 2011 (dollars in millions):
| | | As of December 31, 2012 | | | As of December 31, 2011 | |
| Venture | | Mortgages and Notes Payable | | | Average Interest Rate | | | Average Remaining Term (months)** | | | Mortgages and Notes Payable | | | Average Interest Rate | | | Average Remaining Term (months)** | |
| KimPru and KimPru II | | $ | 1,010.2 | | | | 5.54 | % | | | 44.5 | | | $ | 1,185.2 | | | | 5.59 | % | | | 52.6 | |
| KIR | | | 914.6 | | | | 5.22 | % | | | 78.6 | | | | 911.5 | | | | 5.89 | % | | | 75.6 | |
| UBS Programs | | | 691.9 | | | | 5.40 | % | | | 39.1 | | | | 718.9 | | | | 5.66 | % | | | 47.4 | |
| BIG Shopping Centers | | | 443.8 | | | | 5.52 | % | | | 45.5 | | | | 444.5 | | | | 5.52 | % | | | 57.4 | |
| CPP | | | 141.5 | | | | 5.19 | % | | | 31.0 | | | | 166.3 | | | | 4.45 | % | | | 27.0 | |
| Kimco Income Fund | | | 161.4 | | | | 5.45 | % | | | 20.7 | | | | 164.7 | | | | 5.45 | % | | | 32.7 | |
| SEB Immobilien | | | 243.8 | | | | 5.11 | % | | | 55.3 | | | | 243.7 | | | | 5.34 | % | | | 61.9 | |
| RioCan | | | 923.2 | | | | 5.16 | % | | | 41.2 | | | | 925.0 | | | | 5.66 | % | | | 43.3 | |
| Intown | | | 614.4 | | | | 4.46 | % | | | 46.1 | | | | 621.8 | | | | 5.09 | % | | | 39.6 | |
| Other Institutional Programs | | | 310.5 | | | | 5.24 | % | | | 39.0 | | | | 514.4 | | | | 4.90 | % | | | 45.4 | |
| Other Joint Venture Programs | | | 1,612.2 | | | | 5.70 | % | | | 57.8 | | | | 1,804.7 | | | | 5.60 | % | | | 56.9 | |
| Total | | $ | 7,067.5 | | | | | | | | | | | $ | 7,700.7 | | | | | | | | | |
** Average remaining term includes extensions
Other Real Estate Joint Ventures
–-
During 2011, the Company exited its investment in a redevelopment joint venture property in Harlem, NY. As a result, the Company recognized an other-than-temporary impairment charge of
approximtelyapproximately $3.1 million representing the Company’s entire investment balance.
62
KIMCO REALTY CORPORATION AND SUBSIDIARIES
NOTES TO CONSOLIDATED FINANCIAL STATEMENTS, continued
Also, during 2011, the Company sold its interest in a Canadian hotel portfolio to its partner, for Canadian Dollars (“CAD”) $2.5 million (approximately USD $2.4 million). As a result, the Company recorded an impairment charge of approximately USD $5.2 million, before income taxes.
Additionally, during 2011, the Company recorded an other-than-temporary impairment of $2.0 million, before income tax benefit, against the carrying value of an investment in which the Company holds a 13.4% noncontrolling ownership interest. The Company determined the fair value of its investment based on the estimated sales price of the property in the joint venture.
KIR -
The Company holds a 45% noncontrolling limited partnership interest in KIR and has a master management agreement whereby the yearsCompany performs services for fees relating to the management, operation, supervision and maintenance of the joint venture properties.
The Company’s equity in income from KIR for the year ended December 31, 2010 and 2009,2012, exceeded 10% of the Company’s income from continuing operations before income taxes; as such the Company recognized impairment charges of approximately $7.0 million and approximately $12.2 million, respectively, againstis providing summarized financial information for KIR as follows (in millions):
KIMCO REALTY CORPORATION AND SUBSIDIARIES
NOTES TO CONSOLIDATED FINANCIAL STATEMENTS, continued
| | | December 31, | |
| | | 2012 | | | 2011 | |
| Assets: | | | | | | |
| Real estate, net | | $ | 1,134.2 | | | $ | 1,177.6 | |
| Other assets | | | 87.7 | | | | 76.4 | |
| | | $ | 1,221.9 | | | $ | 1,254.0 | |
| Liabilities and Members’ Capital: | | | | | | | | |
| Mortgages payable | | $ | 914.6 | | | $ | 911.5 | |
| Other liabilities | | | 26.8 | | | | 27.4 | |
| Noncontrolling interests | | | - | | | | 10.7 | |
| Members’ capital | | | 280.5 | | | | 304.4 | |
| | | $ | 1,221.9 | | | $ | 1,254.0 | |
| | | Year Ended December 31, | |
| | | 2012 | | | 2011 | | | 2010 | |
| Revenues from rental property | | $ | 197.3 | | | $ | 195.1 | | | $ | 193.9 | |
| Operating expenses | | | (53.0 | ) | | | (54.3 | ) | | | (54.0 | ) |
| Interest expense | | | (54.0 | ) | | | (60.2 | ) | | | (66.6 | ) |
| Depreciation and amortization | | | (40.7 | ) | | | (38.2 | ) | | | (38.6 | ) |
| Impairment charges | | | (0.1 | ) | | | (0.5 | ) | | | (0.5 | ) |
| Other expense, net | | | (1.3 | ) | | | (2.5 | ) | | | (2.6 | ) |
| | | | (149.1 | ) | | | (155.7 | ) | | | (162.3 | ) |
| Income from continuing operations | | | 48.2 | | | | 39.4 | | | | 31.6 | |
| Discontinued Operations: | | | | | | | | | | | | |
| Income/(loss) from discontinued operations | | | 0.1 | | | | (0.7 | ) | | | 8.3 | |
| Impairment on dispositions of properties | | | (0.1 | ) | | | (4.6 | ) | | | (6.3 | ) |
| Gain on dispositions of properties | | | - | | | | - | | | | 5.6 | |
| Net income | | $ | 48.2 | | | $ | 34.1 | | | $ | 39.2 | |
RioCan Investments -
During October 2001, the carrying value of its investments in various unconsolidated joint ventures. The impairment charges recognized in 2010 resulted from properties, within various unconsolidatedCompany formed three joint ventures being classified as held-for-sale. The fair values of these properties were based upon executed contracts of sale(collectively, the "RioCan Ventures") with third parties. The impairment charges recognizedRioCan Real Estate Investment Trust ("RioCan"), in 2009 reflect an other-than-temporary decline in the fair value of various investments resulting from declines in the real estate market. Estimated fair values were based upon discounted cash flow models that include all estimated cash inflows and outflows over a specified holding period and where applicable, any estimated fair value debt premiums. Capitalization rates, discount rates and credit spreads utilized in these models were based upon rates thatwhich the Company believeshas 50% noncontrolling interests, to acquire retail properties and development projects in Canada. The acquisition and development projects are to be withinsourced and managed by RioCan and are subject to review and approval by a reasonable rangejoint oversight committee consisting of current market ratesRioCan management and the Company’s management personnel. Capital contributions will only be required as suitable opportunities arise and are agreed to by the Company and RioCan.
The Company’s equity in income from the Riocan Ventures for the
respective properties.year ended December 31, 2012, exceeded 10% of the Company’s income from continuing operations, as such the Company is providing summarized financial information for the RioCan Ventures as follows (in millions):
| | | December 31, | |
| | | 2012 | | | 2011 | |
| Assets: | | | | | | |
| Real estate, net | | $ | 1,189.9 | | | $ | 1,143.6 | |
| Other assets | | | 43.7 | | | | 26.6 | |
| | | $ | 1,233.6 | | | $ | 1,170.2 | |
| Liabilities and Members' Capital: | | | | | | | | |
| Mortgages payable | | $ | 923.2 | | | $ | 925.0 | |
| Other liabilities | | | 18.1 | | | | 19.7 | |
| Members' capital | | | 292.3 | | | | 225.5 | |
| | | $ | 1,233.6 | | | $ | 1,170.2 | |
| | | December 31, | |
| | | 2012 | | | 2011 | | | 2010 | |
| Revenues from rental properties | | $ | 213.3 | | | $ | 209.2 | | | $ | 197.1 | |
| | | | | | | | | | | | | |
| Operating expenses | | | (78.1 | ) | | | (73.0 | ) | | | (70.9 | ) |
| Interest expense | | | (51.9 | ) | | | (57.5 | ) | | | (52.6 | ) |
| Depreciation and amortization | | | (37.3 | ) | | | (36.8 | ) | | | (34.4 | ) |
| Other income/(expense), net | | | 14.7 | | | | (0.2 | ) | | | (0.3 | ) |
| | | | (152.6 | ) | | | (167.5 | ) | | | (158.2 | ) |
| Net income | | $ | 60.7 | | | $ | 41.7 | | | $ | 38.9 | |
Summarized financial information for the Company’s investment and advances
toin real estate joint ventures
(excluding KIR and the RioCan Ventures, which is presented above) is as follows (in millions):
| | | December 31, | |
| | | 2012 | | | 2011 | |
| Assets: | | | | | | |
| Real estate, net | | $ | 8,523.3 | | | $ | 9,158.5 | |
| Other assets | | | 507.7 | | | | 609.3 | |
| | | $ | 9,031.0 | | | $ | 9,767.8 | |
| Liabilities and Partners’/Members’ Capital: | | | | | | | | |
| Notes payable | | $ | 148.0 | | | $ | 150.5 | |
| Mortgages payable | | | 5,056.5 | | | | 5,604.3 | |
| Construction loans | | | 25.1 | | | | 109.4 | |
| Other liabilities | | | 188.5 | | | | 216.2 | |
| Noncontrolling interests | | | 19.1 | | | | 25.4 | |
| Partners’/Members’ capital | | | 3,593.8 | | | | 3,662.0 | |
| | | $ | 9,031.0 | | | $ | 9,767.8 | |
| | | | |
| | December 31, |
| | 2011 | | 2010 |
Assets: | | | | |
Real estate, net | $ | 11,479.7 | $ | 11,850.4 |
Other assets | | 712.3 | | 825.0 |
| $ | 12,192.0 | $ | 12,675.4 |
Liabilities and Partners’/Members’ Capital: | | | | |
Notes payable | $ | 150.5 | $ | 189.3 |
Mortgages payable | | 7,440.8 | | 7,683.5 |
Construction loans | | 109.4 | | 89.9 |
Other liabilities | | 263.3 | | 390.3 |
Noncontrolling interests | | 36.1 | | 36.1 |
Partners’/Members’ capital | | 4,191.9 | | 4,286.3 |
| $ | 12,192.0 | $ | 12,675.4 |
KIMCO REALTY CORPORATION AND SUBSIDIARIES
| | | | | | |
| Year Ended December 31, |
| | 2011 | | 2010 | | 2009 |
Revenues from rental property | $ | 1,526.6 | $ | 1,421.0 | $ | 1,446.3 |
Operating expenses | | (520.1) | | (493.6) | | (508.8) |
Interest expense | | (453.0) | | (436.9) | | (441.5) |
Depreciation and amortization | | (404.0) | | (386.9) | | (397.7) |
Impairments | | (44.7) | | (3.5) | | (41.7) |
Other income/(expense), net | | 20.1 | | (21.3) | | (20.1) |
| | (1,401.7) | | (1,342.2) | | (1,409.8) |
Income from continuing operations | | 124.9 | | 78.8 | | 36.5 |
Discontinued Operations: | | | | | | |
Income/(loss) from discontinued operations | | 17.7 | | (3.4) | | (15.2) |
Impairment on dispositions of properties | | (49.6) | | (200.6) | | (202.4) |
Gain on dispositions of properties | | - | | 8.8 | | 79.9 |
Net income/(loss) | $ | 93.0 | $ | (116.4) | $ | (101.2) |
NOTES TO CONSOLIDATED FINANCIAL STATEMENTS, continued
| | | Year Ended December 31, | |
| | | 2012 | | | 2011 | | | 2010 | |
| Revenues from rental property | | $ | 1,074.5 | | | $ | 1,115.4 | | | $ | 1,028.6 | |
| Operating expenses | | | (350.2 | ) | | | (390.5 | ) | | | (368.1 | ) |
| Interest expense | | | (311.3 | ) | | | (332.7 | ) | | | (316.6 | ) |
| Depreciation and amortization | | | (283.3 | ) | | | (325.1 | ) | | | (313.3 | ) |
| Impairment charges | | | (15.5 | ) | | | (20.9 | ) | | | (3.1 | ) |
| Other (expense)/income, net | | | (11.2 | ) | | | 22.9 | | | | (18.4 | ) |
| | | | (971.5 | ) | | | (1,046.3 | ) | | | (1,019.5 | ) |
| Income from continuing operations | | | 103.0 | | | | 69.1 | | | | 9.1 | |
| Discontinued Operations: | | | | | | | | | | | | |
| Income/(loss) from discontinued operations | | | 0.3 | | | | 16.6 | | | | (12.4 | ) |
| Impairment on dispositions of properties | | | (31.4 | ) | | | (68.4 | ) | | | (194.3 | ) |
| Gain on dispositions of properties | | | 94.5 | | | | (0.1 | ) | | | 3.1 | |
| Net income/(loss) | | $ | 166.4 | | | $ | 17.2 | | | $ | (194.5 | ) |
Other liabilities included in the Company’s accompanying Consolidated Balance Sheets include accounts with certain real estate joint ventures totaling
approximately $24.2$21.3 million and
$24.7$24.2 million at December 31,
20112012 and
2010,2011, respectively. The Company and its subsidiaries have varying equity interests in these real estate joint ventures, which may differ from their proportionate share of net income or loss recognized in accordance with GAAP.
63
KIMCO REALTY CORPORATION AND SUBSIDIARIES
NOTES TO CONSOLIDATED FINANCIAL STATEMENTS, continued
The Company’s maximum exposure to losses associated with its unconsolidated joint ventures is primarily limited to its carrying value in these investments. Generally, such investments contain operating properties and the Company has determined these entities do not contain the characteristics of a VIE. As of December 31,
20112012 and
2010,2011, the Company’s carrying value in these investments
approximatedis $1.4 billion.
9. Other Real Estate Investments: Preferred Equity Capital –
The Company previously provided capital to owners and developers of real estate properties through its Preferred Equity program. As of December 31, 2011,2012, the Company’s net investment under the Preferred Equity program was approximately $316.0$287.8 million relating to 525504 properties, including 397 net leased properties. For the year ended December 31, 2012, the Company earned $43.1 million from its preferred equity investments, including $17.6 million in profit participation earned from 21 capital transactions. For the year ended December 31, 2011, the Company earned approximately $35.7 million from its preferred equity investments, including $13.7 million in profit participation earned from 13 capital transactions. For the year ended December 31, 2010, the Company earned approximately $37.6 million from its preferred equity investments, including $9.7 million in profit participation earned from nine capital transactions. For
During 2012, the Company amended one of its preferred equity agreements to restructure its investment, into a pari passu joint venture investment in which the Company holds a noncontrolling interest. The Company will continue to account for this investment under the equity method of accounting and from the date of the amendment will include this investment in Investments and advances in real estate joint ventures within the Company’s Consolidated Balance Sheets.
Included in the capital transactions described above for the year ended December 31,
2009,2012, is the sale of three preferred equity investments in which the Company
earned approximately $30.4 million, including $2.5 millionhad a $0 investment and recognized promote income of
profit participation earned from five capital transactions.
During 2007,$10.0 million. In connection with this transaction, the Company invested approximately $81.7provided seller financing for $7.5 million, of preferred equity capital in an entity which was comprised of 403 net leased properties which consist of 30 master leased pools with each pool leased to individual corporate operators. Each master leased pool is accounted for asbears interest at a direct financing lease. These properties consist of a diverse array of free-standing restaurants, fast food restaurants, convenience and auto parts stores. As of December 31, 2011, the remaining 397 properties were encumbered by third party loans aggregating approximately $376.8 million with interest rates ranging from 5.08% to 10.47% with a weighted-average interest rate of 9.3%7.0% and maturities ranging from twomatures in December 2013. The Company evaluated this transaction pursuant to 11 years.
the FASB’s real estate sales guidance and concluded that the criteria for sale recognition was met.
During 2011, the Company, in separate transactions, amended three preferred equity agreements to restructure its investments, which hold investments in seven retail properties, into three pari passu joint venture investments in which the Company holds noncontrolling interests.
As a result of the amendments, theThe Company
continueswill continue to account for these investments under the equity method of accounting and from the dates of the amendments will include these investments in Investments and advances
toin real estate joint ventures within the Company’s Consolidated Balance Sheets (see Footnote 8).
Additionally, during the year ended December 31, 2011, two properties within two of the Company’s preferred equity investments were in default of the their respective mortgages and received foreclosure notices from the respective mortgage lenders. As such, the Company recognized full impairment charges on both of the investments aggregating
approximately $2.2 million.
Included in
KIMCO REALTY CORPORATION AND SUBSIDIARIES
NOTES TO CONSOLIDATED FINANCIAL STATEMENTS, continued
During 2010, the
capital transactions described above for the year ended December 31, 2010, is the sale ofCompany sold 50% of
the Company’sa preferred equity investment in a Canadian retail operating property for
approximately CAD $31.9 million
(approximately USD(USD $31.0 million). In connection with this sale the Company (i) recognized profit participation of
approximately CAD $1.7 million
(approximately USD(USD $1.6 million) and (ii) amended its preferred equity agreement to restructure the Company’s remaining investment as a pari passu joint venture investment. Additionally, during 2010, the Company amended its preferred equity agreement to restructure another Canadian investment that holds investments in 12 retail properties as a pari passu joint venture investment.
As a result of the amendments made to these preferred equity agreements, theThe Company
continueswill continue to account for both of these investments under the equity method of accounting and includes these investments in Investments and advances
toin real estate joint ventures within the Company’s Consolidated Balance Sheets (see Footnote 8).
During the year ended December 31,
Also during 2010, the Company recognized an impairment charge of
approximately $3.8 million against the carrying value of its preferred equity investment in an operating property located in Tucson, AZ based on its estimated sales price. During 2010, the Company acquired the remaining ownership interest in this operating property for a purchase price of
approximately $90.0 million, including the assumption of $81.0 million in non-recourse mortgage debt, which bears interest at a rate of 6.08% and is scheduled to mature in 2016. During August 2010, this property was fully disposed of.
Additionally, during the year ended December 31, 2010, the Company recognized an impairment charge of
approximately $5.0 million against the carrying value of two of its preferred equity investments, based on estimated sales prices. During 2010, the Company sold one of these preferred equity investments for a sales price of
approximately $0.3 million.
During 2009, the Company recognized impairment charges of $49.2 million, primarily against the carrying value of 16 preferred equity investments, which hold 29 properties, reflecting an other-than-temporary decline in the fair value of its investment resulting from a decline in the real estate markets.
64
KIMCO REALTY CORPORATION AND SUBSIDIARIES
NOTES TO CONSOLIDATED FINANCIAL STATEMENTS, continued
The Company’s estimated fair values relating to the impairment assessments above were based upon sales prices, where applicable, or discounted cash flow models that include all estimated cash inflows and outflows over a specified holding period and where applicable, any estimated debt premiums. Capitalization rates, discount rates and credit spreads utilized in these models were based upon rates that the Company believes to be within a reasonable range of current market rates for the respective properties.
Summarized financial information relating to
During 2007, the
Company’sCompany invested $81.7 million of preferred equity
investments is as follows (in millions):
| | | | |
| | December 31, |
| | 2011 | | 2010 |
Assets: | | | | |
Real estate, net | $ | 1,058.1 | $ | 1,406.7 |
Other assets | | 760.5 | | 794.7 |
| $ | 1,818.6 | $ | 2,201.4 |
Liabilities and Partners’/Members’ Capital: | | | | |
Notes and mortgages payable | $ | 1,338.7 | $ | 1,669.5 |
Other liabilities | | 39.9 | | 61.2 |
Partners’/Members’ capital | | 440.0 | | 470.7 |
| $ | 1,818.6 | $ | 2,201.4 |
| | | | | | |
| | Year Ended December 31, |
| | 2011 | | 2010 | | 2009 |
Revenues from rental property | $ | 233.1 | $ | 278.4 | $ | 311.9 |
Operating expenses | | (57.0) | | (73.2) | | (96.7) |
Interest expense | | (89.5) | | (104.0) | | (112.5) |
Depreciation and amortization | | (43.6) | | (52.3) | | (67.7) |
Impairment (a) | | - | | - | | (20.0) |
Other expense, net | | (6.3) | | (6.3) | | (9.7) |
| | 36.7 | | 42.6 | | 5.3 |
Gain on disposition of properties | | 6.2 | | 13.7 | | 1.7 |
Net income | $ | 42.9 | $ | 56.3 | $ | 7.0 |
(a) Represents impairments on twocapital in an entity which was comprised of 403 net leased properties (“Net Leased Portfolio”) which consist of 30 master leased pools duewith each pool leased to individual corporate operators. Each master leased pool is accounted for as a declinedirect financing lease. These properties consist of a diverse array of free-standing restaurants, fast food restaurants, convenience and auto parts stores. As of December 31, 2012, the remaining 397 properties were encumbered by third party loans aggregating $358.9 million with interest rates ranging from 5.08% to 10.47% with a weighted-average interest rate of 9.3% and maturities ranging from one to 10 years. The Company recognized $14.0 million, $12.7 million and $12.1 million in fair market values.
equity in income from this investment during the years ended December 31, 2012, 2011 and 2010, respectively.
The Company’s maximum exposure to losses associated with its preferred equity investments is primarily limited to its invested capital. As of December 31,
20112012 and
2010,2011, the Company’s invested capital in its preferred equity investments approximated
$287.8 million and $316.0 million,
and $387.7 million, respectively.
Summarized financial information relating to the Company’s preferred equity investments is as follows (in millions):
| | | December 31, | |
| | | 2012 | | | 2011 | |
| Assets: | | | | | | |
| Real estate, net | | $ | 824.7 | | | $ | 1,058.1 | |
| Other assets | | | 719.1 | | | | 760.5 | |
| | | $ | 1,543.8 | | | $ | 1,818.6 | |
| Liabilities and Partners’/Members’ Capital: | | | | | | | | |
| Notes and mortgages payable | | $ | 1,116.9 | | | $ | 1,338.7 | |
| Other liabilities | | | 51.8 | | | | 39.9 | |
| Partners’/Members’ capital | | | 375.1 | | | | 440.0 | |
| | | $ | 1,543.8 | | | $ | 1,818.6 | |
KIMCO REALTY CORPORATION AND SUBSIDIARIES
NOTES TO CONSOLIDATED FINANCIAL STATEMENTS, continued
| | | Year Ended December 31, | |
| | | 2012 | | | 2011 | | | 2010 | |
| Revenues from rental property | | $ | 195.0 | | | $ | 233.1 | | | $ | 278.4 | |
| Operating expenses | | | (44.7 | ) | | | (57.0 | ) | | | (73.2 | ) |
| Interest expense | | | (72.0 | ) | | | (89.5 | ) | | | (104.0 | ) |
| Depreciation and amortization | | | (33.7 | ) | | | (43.6 | ) | | | (52.3 | ) |
| Impairment charges (a) | | | (2.7 | ) | | | - | | | | - | |
| Other expense, net | | | (8.3 | ) | | | (6.3 | ) | | | (6.3 | ) |
| Income from continuing operations | | | 33.6 | | | | 36.7 | | | | 42.6 | |
| Discontinued Operations: | | | | | | | | | | | | |
| Gain on disposition of properties | | | 17.5 | | | | 6.2 | | | | 13.7 | |
| Net income | | $ | 51.1 | | | $ | 42.9 | | | $ | 56.3 | |
(a) Represents an impairment charge against one master leased pool due to decline in fair market value.
During 2010, the Company recognized an other-than-temporary impairment charge of
approximately $2.1 million against the carrying value of an investment that owns two operating properties located in Manchester, NH and Nashua, NH. The Company determined the fair value of its investment based on an estimated sales price of the operating properties. During 2011, these two properties were sold and as a result of an adjustment to the purchase price, the Company recognized an additional $0.5 million in impairment charges.
Investment in Retail Store Leases -
The Company has interests in various retail store leases relating to the anchor store premises in neighborhood and community shopping centers. These premises have been sublet to retailers who lease the stores pursuant to net lease agreements. Income from the investment in these retail store leases during the years ended December 31,
2012, 2011
and 2010,
and 2009, was
approximately$0.9 million, $0.8 million
$1.6 million and
$0.8$1.6 million, respectively. These amounts represent sublease revenues during the years ended December 31,
2012, 2011
and 2010,
and 2009, of
approximately$3.9 million, $5.1 million
$5.9 million and
$5.2$5.9 million, respectively, less related expenses of
$4.3$3.0 million, $4.3 million and
$4.4$4.3 million, respectively. The Company's future minimum revenues under the terms of all non-cancelable tenant subleases and future minimum obligations through the remaining terms of its retail store leases, assuming no new or renegotiated leases are executed for such premises, for future years are as follows (in millions):
2012, $4.1 and $2.6; 2013, $3.7 and $2.3; 2014,
$2.8$2.9 and $1.7; 2015,
$1.9$2.0 and $1.3; 2016,
$1.5$1.6 and
$1.0; 2017, $1.0 and
$0.5, and thereafter,
$1.1$0.4 and
$0.6,$0.04, respectively.
65
KIMCO REALTY CORPORATION AND SUBSIDIARIES
NOTES TO CONSOLIDATED FINANCIAL STATEMENTS, continued
During June 2002, the Company acquired a 90% equity participation interest in an existing leveraged lease of 30 properties. The properties are leased under a long-term bond-type net lease whose primary term expires in 2016, with the lessee having certain renewal option rights. The Company’s cash equity investment was
approximately $4.0 million. This equity investment is reported as a net investment in leveraged lease in accordance with the FASB’s lease guidance.
As of December 31,
2011,2012, 19 of these properties were sold, whereby the proceeds from the sales were used to pay down the mortgage debt by
approximately $32.3 million and the remaining 11 properties were encumbered by third-party non-recourse debt of
approximately $27.9$21.1 million that is scheduled to fully amortize during the primary term of the lease from a portion of the periodic net rents receivable under the net lease.
As an equity participant in the leveraged lease, the Company has no recourse obligation for principal or interest payments on the debt, which is collateralized by a first mortgage lien on the properties and collateral assignment of the lease. Accordingly, this obligation has been offset against the related net rental receivable under the lease.
At December 31,
20112012 and
2010,2011, the Company’s net investment in the leveraged lease consisted of the following (in millions):
| | | 2012 | | | 2011 | |
| Remaining net rentals | | $ | 24.0 | | | $ | 30.8 | |
| Estimated unguaranteed residual value | | | 30.3 | | | | 30.3 | |
| Non-recourse mortgage debt | | | (19.0 | ) | | | (25.1 | ) |
| Unearned and deferred income | | | (27.6 | ) | | | (29.9 | ) |
| Net investment in leveraged lease | | $ | 7.7 | | | $ | 6.1 | |
| | | | |
| | 2011 | | 2010 |
Remaining net rentals | $ | 30.8 | $ | 37.6 |
Estimated unguaranteed residual value | | 30.3 | | 31.7 |
Non-recourse mortgage debt | | (25.1) | | (30.1) |
Unearned and deferred income | | (29.9) | | (34.2) |
Net investment in leveraged lease | $ | 6.1 | $ | 5.0 |
KIMCO REALTY CORPORATION AND SUBSIDIARIES
NOTES TO CONSOLIDATED FINANCIAL STATEMENTS, continued
10. Variable Interest Entities: Consolidated Operating Properties
–Included within the Company’s consolidated operating properties at December 31,
20112012, are
threetwo consolidated entities that are VIEs,
and for which the Company is the primary beneficiary.
All of theseThese entities have been established to own and operate real estate property. The Company’s involvement with these entities is through its majority ownership and management of the properties.
TheseThe entities were deemed VIEs primarily based on the fact that the voting rights of the equity investors
areis not proportional to their obligation to absorb expected losses or receive the expected residual returns of the entity and substantially all of the entity's activities are conducted on behalf of the investor which has disproportionately fewer voting rights. The Company determined that it was the primary beneficiary of these VIEs as a result of its controlling financial interest.
At December 31,
2011,2012, total assets of these VIEs were
approximately $83.6$10.8 million and total liabilities were
approximately $0.2$0.1 million. The classification of these assets is primarily within real estate and the
classificationclassifications of liabilities are primarily within accounts payable and accrued
expenses in the Company’s Consolidated Balance Sheets.
expenses.
The majority of the operations of these VIEs are funded with cash flows generated from the properties. The Company has not provided financial support to any of these VIEs that it was not previously contractually required to provide, which consists primarily of funding any capital expenditures, including tenant improvements, which are deemed necessary to continue to operate the entity and any operating cash shortfalls that the entity may experience.
Consolidated Ground-Up Development Projects
–Included within the Company’s ground-up development projects at December 31,
20112012, are two entities that are VIEs, for which the Company is the primary beneficiary. These entities were established to develop real estate property to hold as long-term investments. The Company’s involvement with these entities is through its majority ownership and management of the properties.
TheseThe entities were deemed VIEs primarily based on the fact that the equity investment at risk is not sufficient to permit the entity to finance its activities without additional financial support. The initial equity contributed to these entities was not sufficient to fully finance the real estate construction as development costs are funded by the partners throughout the construction period. The Company determined that it was the primary beneficiary of these VIEs as a result of its controlling financial interest.
66
KIMCO REALTY CORPORATION AND SUBSIDIARIES
NOTES TO CONSOLIDATED FINANCIAL STATEMENTS, continued
At December 31,
2011,2012, total assets of these ground-up development VIEs were
approximately $87.1$87.8 million and total liabilities were
approximately $0.1 million. The classification of these assets is primarily within real estate under development and the
classificationclassifications of liabilities are primarily within accounts payable and accrued
expenses in the Company’s Consolidated Balance Sheets.expenses.
Substantially all of the projected development costs to be funded for these ground-up development VIEs, aggregating
approximately $33.5$33.3 million, will be funded with capital contributions from the Company and by the outside partners, when contractually obligated. The Company has not provided financial support to these VIEs that it was not previously contractually required to provide.
Unconsolidated Ground-Up Development
–Also included within the Company’s ground-up development projects at December 31,
2011, are two2012, is an unconsolidated joint
ventures,venture, which
are VIEsis a VIE for which the Company is not the primary beneficiary.
TheseThis joint
ventures areventure is primarily established to develop real estate property for long-term investment and
werewas deemed
VIEsa VIE primarily based on the fact that the equity investment at risk was not sufficient to permit the
entitiesentity to finance
theirits activities without additional financial support. The initial equity contributed to
these entitiesthis entity was not sufficient to fully finance the real estate construction as development costs are funded by the partners throughout the construction period. The Company determined that it was not the primary beneficiary of
these VIEsthis VIE based on the fact that the Company has shared control of
these entitiesthis entity along with the entity’s partners and therefore does not have
a controlling financial
interests in these VIEs.interest.
The Company’s
aggregate investment in
these VIEsthis VIE was
approximately $38.3$17.9 million as of December 31,
2011,2012, which is included in Real estate under development in the Company’s
Condensed Consolidated Balance Sheets. The Company’s maximum exposure to loss as a result of its involvement with
these VIEsthis VIE is estimated to be
$58.3$36.3 million, which primarily represents the Company’s current investment and estimated future funding commitments of
approximately $20.0$18.4 million. The Company has not provided financial support to
these VIEsthis VIE that it was not previously contractually required to provide. All future costs of development will be funded with capital contributions from the Company and the outside partner in accordance with their respective ownership percentages.
Preferred Equity Investments –
KIMCO REALTY CORPORATION AND SUBSIDIARIES
NOTES TO CONSOLIDATED FINANCIAL STATEMENTS, continued
Unconsolidated Redevelopment Investment
Included in the Company’s
preferred equityjoint venture investments
at December 31, 2012, is one unconsolidated
investment thatjoint venture, which is a VIE for which the Company is not the primary beneficiary. This joint venture was primarily established to develop real estate property for long-term investment and was deemed a VIE primarily based on the fact that the equity investment at risk was not sufficient to permit the entity to finance its activities without additional financial support. The initial equity contributed to this entity was not sufficient to fully finance the real estate construction as development costs are funded by the partners throughout the construction period. The Company determined that it was not the primary beneficiary of this VIE based on the fact that the Company has shared control of
thethis entity along with the entity’s
other partnerpartners and therefore does not have a controlling financial
interest in this VIE.interest.
As of December 31, 2012, the Company’s investment in this
preferred equity VIE was
approximately $3.9a negative $12.1 million,
as of December 31, 2011,due to the fact that the Company had a remaining capital commitment obligation, which is included in Other
real estate investmentsliabilities in the Company’s
Condensed Consolidated Balance Sheets. The Company’s maximum exposure to loss as a result of its involvement with this VIE is estimated to be
$4.6$12.1 million, which
primarily representsis the
Company’s current investment and estimated future funding commitments.remaining capital commitment obligation. The Company has not provided financial support to this VIE that it was not previously contractually required to provide. All future costs of development will be funded with capital contributions from the Company and the outside partner in accordance with their respective ownership percentages.
11. Mortgages and Other Financing Receivables: The Company has various mortgages and other financing receivables which consist of loans acquired and loans originated by the Company. For a complete listing of the Company’s mortgages and other financing receivables at December 31,
2011,2012, see Financial Statement Schedule IV included in this annual report on Form 10-K.
67
KIMCO REALTY CORPORATION AND SUBSIDIARIES
NOTES TO CONSOLIDATED FINANCIAL STATEMENTS, continued
The following table reconciles mortgage loans and other financing receivables from January 1,
20092010 to December 31,
20112012 (in thousands):
| | | | | | |
| | 2011 | | 2010 | | 2009 |
Balance at January 1 | $ | 108,493 | $ | 131,332 | $ | 181,992 |
Additions: | | | | | | |
New mortgage loans | | 14,297 | | 1,411 | | 8,316 |
Additions under existing mortgage loans | | - | | 3,047 | | 707 |
Foreign currency translation | | - | | 3,923 | | 6,324 |
Capitalized loan costs | | - | | - | | 60 |
Amortization of loan discounts | | 247 | | 247 | | 247 |
| | | 2012 | | | 2011 | | | 2010 | |
| Balance at January 1 | | $ | 102,972 | | | $ | 108,493 | | | $ | 131,332 | |
| Additions: | | | | | | | | | | | | |
| New mortgage loans | | | 29,496 | | | | 14,297 | | | | 1,411 | |
| Additions under existing mortgage loans | | | 895 | | | | - | | | | 3,047 | |
| Foreign currency translation | | | 1,181 | | | | - | | | | 3,923 | |
| Amortization of loan discounts | | | 247 | | | | 247 | | | | 247 | |
| Deductions: | | | | | | | | | | | | |
| Loan repayments | | | (60,740 | ) | | | (15,803 | ) | | | (24,860 | ) |
| Loan impairments | | | - | | | | - | | | | (700 | ) |
| Charge off/foreign currency translation | | | (430 | ) | | | (863 | ) | | | (3,101 | ) |
| Collections of principal | | | (2,861 | ) | | | (3,345 | ) | | | (2,726 | ) |
| Amortization of loan costs | | | (56 | ) | | | (54 | ) | | | (80 | ) |
| Balance at December 31 | | $ | 70,704 | | | $ | 102,972 | | | $ | 108,493 | |
| | | | | | |
Deductions: | | | | | | |
Loan repayments | | (15,803) | | (24,860) | | (43,578) |
Loan foreclosures | | - | | - | | (17,312) |
Loan impairments | | - | | (700) | | (3,800) |
Charge off/foreign currency translation | | (863) | | (3,101) | | - |
Collections of principal | | (3,345) | | (2,726) | | (1,024) |
Amortization of loan costs | | (54) | | (80) | | (600) |
Balance at December 31 | $ | 102,972 | $ | 108,493 | $ | 131,332 |
The Company reviews payment status to identify performing versus non-performing loans. Interest income on performing loans is accrued as earned. A non-performing loan is placed on non-accrual status when it is probable that the borrower may be unable to meet interest payments as they become due. Generally, loans 90 days or more past due are placed on non-accrual status unless there is sufficient collateral to assure collectability of principal and interest. Upon the designation of non-accrual status, all unpaid accrued interest is reserved against through current income. Interest income on non-performing loans is generally recognized on a cash basis. The following table presents performing and non-performing loans as of December 31, 2012 (in thousands):
KIMCO REALTY CORPORATION AND SUBSIDIARIES
NOTES TO CONSOLIDATED FINANCIAL STATEMENTS, continued
| | | Number of Loans | | | Amount | |
| Performing Loans | | | 24 | | | $ | 50,802 | |
| Non-Performing Loans | | | 4 | | | | 19,902 | |
| Total | | | 28 | | | $ | 70,704 | |
As of December 31,
2011,2012, the Company had
sixfour loans aggregating
approximately $45.0$19.9 million which were in
default.default for nonpayment of interest only or principal and interest. The Company has placed all of these loans on non-accrual status with respect to the recognition of interest income starting from each loan’s nonperformance date. Nonperformance dates for these loans range from 7 months to 7 years. The Company assessed
each of these
four loans and determined that the estimated fair value of the underlying collateral exceeded the respective carrying values as of December 31,
2011.2012.
During 2010, the Company recognized an impairment charge of
approximately $0.7 million, against the carrying value, including accrued interest of a mortgage receivable that was in default. This impairment charge reflects a decrease in the estimated fair value of the underlying collateral. The remaining balance on this mortgage receivable as of December 31, 2010, was
approximately $1.4 million. This impairment charge is reflected in Impairments
- Marketable equity securities and other investmentscharges on the Company’s Consolidated Statements of
Operations.Income.
During 2009, the Company recognized impairment charges of approximately $3.8 million against the carrying value of two mortgage loans. Approximately $3.5 million of the $3.8 million of impairment charges was related to a mortgage receivable that was in default. As a result, the Company began foreclosure proceedings on the underlying property during June 2009 and the process was completed in the fourth quarter 2009. This impairment charge reflects the decrease in the estimated fair values of the real estate collateral. This impairment charge is reflected in Impairments - Marketable equity securities and other investments on the Company’s Consolidated Statements of Operations.
12. Marketable Securities: The amortized cost and estimated fair values of securities available-for-sale and held-to-maturity at December 31,
20112012 and
2010,2011, are as follows (in thousands):
| | | December 31, 2012 | |
| | | Amortized Cost | | | Gross Unrealized Gains | | | Gross Unrealized Losses | | | Estimated Fair Value | |
| Available-for-sale: | | | | | | | | | | | | |
| Equity securities | | $ | 14,205 | | | $ | 19,223 | | | $ | - | | | $ | 33,428 | |
| Held-to-maturity: | | | | | | | | | | | | | | | | |
| Other debt securities | | | 3,113 | | | | 284 | | | | - | | | | 3,397 | |
Total marketable securities | | $ | 17,318 | | | $ | 19,507 | | | $ | - | | | $ | 36,825 | |
| | | | | | | | |
| | December 31, 2011 |
| | Amortized Cost | | Gross Unrealized Gains | | Gross Unrealized Losses | | Estimated Fair Value |
Available-for-sale: | | | | | | | | |
Equity securities | $ | 14,253 | $ | 16,210 | $ | (1) | $ | 30,462 |
Held-to-maturity: | | | | | | | | |
Other debt securities | | 3,078 | | 378 | | (10) | | 3,446 |
Totalmarketable securities | $ | 17,331 | $ | 16,588 | $ | (11) | $ | 33,908 |
68
KIMCO REALTY CORPORATION AND SUBSIDIARIES
NOTES TO CONSOLIDATED FINANCIAL STATEMENTS, continued
| | | | | | | | |
| | December 31, 2010 |
| | Amortized Cost | | Gross Unrealized Gains | | Gross Unrealized Losses | | Estimated Fair Value |
Available-for-sale: | | | | | | | | |
Equity and debt securities | $ | 182,817 | $ | 20,291 | $ | (17) | $ | 203,091 |
Held-to-maturity: | | | | | | | | |
Other debt securities | | 20,900 | | 548 | | (88) | | 21,360 |
Total marketable securities | $ | 203,717 | $ | 20,839 | $ | (105) | $ | 224,451 |
| | | December 31, 2011 | |
| | | Amortized Cost | | | Gross Unrealized Gains | | | Gross Unrealized Losses | | | Estimated Fair Value | |
| Available-for-sale: | | | | | | | | | | | | |
| Equity securities | | $ | 14,253 | | | $ | 16,210 | | | $ | (1 | ) | | $ | 30,462 | |
| Held-to-maturity: | | | | | | | | | | | | | | | | |
| Other debt securities | | | 3,078 | | | | 378 | | | | (10 | ) | | | 3,446 | |
Total marketable securities | | $ | 17,331 | | | $ | 16,588 | | | $ | (11 | ) | | $ | 33,908 | |
During February 2008, the Company acquired an aggregate $190 million Australian denominated (“AUD”)
(approximately( USD $170.1 million) convertible notes (the “Valad notes”) issued by a subsidiary of Valad Property Group (“Valad”), a publicly traded Australian company listed on the Australian stock exchange that is a diversified, property fund manager, investor, developer and property investment banker with property investments in Australia, Europe and Asia. The notes were guaranteed by Valad and bore interest at 9.5% payable semi-annually in arrears. The notes were repayable after five years with an option for Valad to extend up to 18 months, subject to certain interest rate and conversion price resets. The notes were convertible any time into publicly traded Valad securities at a price of AUD $26.60. During 2010, the Company acquired an additional
AUD $10 million
AUD (approximately USD(USD $9.3 million) of
convertibleValad notes. Additionally, during 2010, Valad made a principal payment of AUD $8.0 million
(approximately USD(USD $7.9 million).
KIMCO REALTY CORPORATION AND SUBSIDIARIES
NOTES TO CONSOLIDATED FINANCIAL STATEMENTS, continued
During 2011, the Company received an additional principal payment of approximately $7.0 million AUD (approximately( USD $6.9 million) and the Company sold its remaining Valad notes for a sales price of approximately AUD $165.0 million (approximately( USD $169.1 million), plus unpaid accrued interest. In connection with the anticipation of this sale, the Company entered into a foreign currency forward contract to sell AUD $165.0 million and buy USD $169.1 million in efforts to mitigate the foreign exchange risk resulting from fluctuations in currency exchange rates (see Footnote 18). rates. The Company designated the AUD-USD foreign exchange risk as the risk being hedged.
The Company recorded an adjustment to the carrying value of the Valad notes, including amounts allocated to the conversion option described below, of
approximately USD $0.9 million based upon the agreed sales price. This adjustment is recorded in Other
(expense)/income,expense, net on the Company’s Consolidated Statements of
Operations. Income. At the completion of the sale, the Company received AUD $170.2 million (USD $174.7 million) representing the principal and unpaid interest and settled its foreign currency forward contract. Upon settling the foreign currency forward contract, the Company recorded a reclass of $10.0 million from Accumulated other comprehensive income to Other expense, net, which was fully offset by a foreign currency gain on sale of the Valad notes. As a result there was no net gain or loss recognized.
In accordance with the FASB’s Derivative and Hedging guidance, the Company bifurcated the conversion option within the Valad notes and separately accounted for this option as an embedded derivative. The original host instrument was classified as an available-for-sale security at fair value and was included in Marketable securities on the Company’s Consolidated Balance Sheets with changes in the fair value recorded through Stockholders’ equity as a component of other comprehensive income. At December 31, 2010, the Company had an unrealized gain, including foreign currency adjustments, associated with these notes of
approximately $6.0 million. The embedded derivative was recorded at fair value and was included in Other assets on the Company’s Consolidated Balance Sheets with changes in fair value recognized in the Company’s Consolidated Statements of
Operations.Income. The value attributed to the embedded convertible option was
approximately AUD $10.0 million,
(approximately( USD $10.2 million). As a result of the fair value remeasurement of this derivative instrument during 2010
and 2009, there was an AUD $0.2 million
(approximately USD(USD $0.2 million) unrealized decrease
and an AUD $1.4 million (approximately USD $1.6 million) unrealized increase, respectively, in the fair value of the convertible option. This unrealized increase/decrease is included in Other
(expense)/income,expense, net on the Company’s Consolidated Statements of
Operations.Income.
During 2011,
2010, and
2009,2010, the Company recorded impairment charges of
approximately $0.6 million,
$4.6 million, and
$26.1$4.6 million, respectively, before income tax benefits of
approximately $0.4
million, $0 million, and $0 million, respectively, due to the decline in value of certain marketable securities and other investments that were deemed to be other-than-temporary. These impairments were a result of the deterioration of the equity markets for these securities during their respective years and the uncertainty of their future recoverability. Market value for the equity securities represents the closing price of each security as it appears on their respective stock exchange at the end of the period.
For each of the equity securities in the Company’s portfolio with unrealized losses, the Company reviews the underlying cause of the decline in value
During 2012, 2011 and
the estimated recovery period, as well as the severity and duration of the decline. In the Company’s evaluation, the Company considers its ability and intent to hold these investments for a reasonable period of time sufficient for the Company to recover its cost basis.
During 2011,2010, the Company received approximately$0.1 million, $22.7 million and $23.2 million in proceeds from the sale/redemption of certain marketable securities. Thesecurities, respectively. In connection with these transactions, during 2012. 2011 and 2010 the Company recognized (i) gross realizable gains of approximately$0.0 million, $0.8 million and $2.6 million, respectively, (ii) foreign currency gains of approximately$0.0 million, $1.6 million and $0.0 million, respectively, and (iii) gross realizable losses of approximately$0.0 million, $0.3 million from sales/redemptions of marketable securities during 2011.
69
KIMCO REALTY CORPORATION AND SUBSIDIARIES
NOTES TO CONSOLIDATED FINANCIAL STATEMENTS, continued
During 2010, the Company received approximately $23.2 million in proceeds from the sale of certain marketable securities. The Company recognized gross realizable gains of approximately $2.6 million and gross realizable losses of approximately $1.9 million, from sales of marketable securities during 2010.
respectively.
During 2009, the Company received approximately $79.8 million in proceeds from the sale of certain marketable securities. The Company recognized gross realizable gains of approximately $8.5 million and gross realizable losses of approximately $2.6 million from sales of marketable securities during 2009.
As of December 31,
2011,2012, the contractual maturities of Other debt securities classified as held-to-maturity are as follows: after one year through five years, $0.1 million; and after five years through 10 years, $3.0 million. Actual maturities may differ from contractual maturities as issuers may have the right to prepay debt obligations with or without prepayment penalties.
KIMCO REALTY CORPORATION AND SUBSIDIARIES
NOTES TO CONSOLIDATED FINANCIAL STATEMENTS, continued
As of December 31,
20112012 and
20102011 the Company’s Notes Payable consisted of the following
(in(dollars in millions):
| | | Balance at 12/31/12 | | | Interest Rate Range (Low) | | | Interest Rate Range (High) | | Maturity Date Range (Low) | | Maturity Date Range (High) |
| Senior Unsecured Notes (c) | | $ | 965.9 | | | | 4.70 | % | | | 6.88 | % | Jan-2013 | | Oct-2019 |
| Medium Term Notes | | | 1,144.6 | | | | 4.30 | % | | | 5.78 | % | Oct-2013 | | Feb-2018 |
| Unsecured Term Loan | | | 400.0 | | | | 1.26 | % | | | 1.26 | % | Apr-2014 | | Apr-2014 |
| Canadian Notes Payable | | | 352.4 | | | | 5.18 | % | | | 5.99 | % | Aug-2013 | | Apr-2018 |
| Credit Facility (a) | | | 249.9 | | | | 1.10 | % | | | 1.26 | % | Oct-2015 | | Oct-2015 |
| Mexican Term Loan | | | 76.9 | | | | 8.58 | % | | | 8.58 | % | Mar-2013 | | Mar-2013 |
| Other Notes Payable (b) | | | 2.4 | | | | 5.50 | % | | | 5.50 | % | Jan-2013 | | Sept-2013 |
| | | $ | 3,192.1 | | | | | | | | | | | | |
| | | | | | | | | | |
| | Balance at 12/31/11 | | Interest Rate Range (Low) | | Interest Rate Range (High) | | Maturity Date Range (Low) | | Maturity Date Range (High) |
Senior Unsecured Notes | $ | 1,164.8 | | 4.70% | | 6.88% | | Nov-2012 | | Oct-2019 |
Medium Term Notes | | 1,161.6 | | 4.30% | | 5.98% | | July-2012 | | Feb-2018 |
Canadian Notes Payable | | 342.6 | | 5.18% | | 5.99% | | Aug-2013 | | Apr-2018 |
Credit Facility (a) | | 238.9 | | 1.35% | | 1.35% | | Oct-2015 | | Oct-2015 |
Mexican Term Loan | | 71.5 | | 8.58% | | 8.58% | | Mar-2013 | | Mar-2013 |
Other Notes Payable (b) | | 4.5 | | 3.80% | | 3.80% | | Sept-2012 | | Sept-2012 |
| $ | 2,983.9 | | | | | | | | |
| | | Balance at 12/31/11 | | | Interest Rate Range (Low) | | | Interest Rate Range (High) | | Maturity Date Range (Low) | | Maturity Date Range (High) |
| Senior Unsecured Notes | | $ | 1,164.8 | | | | 4.70 | % | | | 6.88 | % | Nov-2012 | | Oct-2019 |
| Medium Term Notes | | | 1,161.6 | | | | 4.30 | % | | | 5.98 | % | July-2012 | | Feb-2018 |
| Canadian Notes Payable | | | 342.6 | | | | 5.18 | % | | | 5.99 | % | Aug-2013 | | Apr-2018 |
| Credit Facilities (a) | | | 238.9 | | | | 1.35 | % | | | 1.35 | % | Oct-2015 | | Oct-2015 |
| Mexican Term Loan | | | 71.5 | | | | 8.58 | % | | | 8.58 | % | Mar-2013 | | Mar-2013 |
| Other Notes Payable (b) | | | 4.5 | | | | 3.80 | % | | | 3.80 | % | Sept-2012 | | Sept-2012 |
| | | $ | 2,983.9 | | | | | | | | | | | | |
| | | | | | | | | | |
| | Balance at 12/31/10 | | Interest Rate Range (Low) | | Interest Rate Range (High) | | Maturity Date Range (Low) | | Maturity Date Range (High) |
Senior Unsecured Notes | $ | 1,164.8 | | 4.70% | | 6.88% | | Nov-2012 | | Oct-2019 |
Medium Term Notes | | 1,249.6 | | 4.30% | | 5.98% | | Aug-2011 | | Feb-2018 |
Canadian Notes Payable | | 350.7 | | 5.18% | | 5.99% | | Aug-2013 | | Apr-2018 |
Credit Facilities (c) | | 123.2 | | 1.31% | | 1.31% | | Oct-2011 | | Oct-2011 |
Mexican Term Loan | | 80.9 | | 8.58% | | 8.58% | | Mar-2013 | | Mar-2013 |
Other Notes Payable (b) | | 13.2 | | 3.76% | | 3.76% | | Sept-2012 | | Sept-2012 |
| $ | 2,982.4 | | | | | | | | |
(a)
Interest rate is equal to LIBOR +plus 1.05%
(b)
Interest rate is equal to LIBOR +plus 3.50%
(c)
Interest rate is equal to LIBOR + 0.425%
During January 2013, the Company repaid the $100.0 million outstanding balance on its 6.125% senior unsecured note, which matured in January 2013.
Senior Unsecured
Notes/Medium Term Notes –
During September 2009, the Company entered into a fifth supplemental indenture, under the indenture governing its Medium Term Notes
("MTN") and Senior Notes, which included the financial covenants for future offerings under the indenture that were removed by the fourth supplemental indenture.
In accordance with the terms of the Indenture, as amended, pursuant to which the Company's Senior Unsecured Notes, except for $300.0 million issued during April 2007 under the fourth supplemental indenture, have been issued, the Company is subject to maintaining (a) certain maximum leverage ratios on both unsecured senior corporate and secured debt, minimum debt service coverage ratios and minimum equity levels, (b) certain debt service ratios, (c) certain asset to debt ratios and (d) restricted from paying dividends in amounts that exceed by more than $26.0 million the funds from operations, as defined, generated through the end of the calendar quarter most recently completed prior to the declaration of such dividend; however, this dividend limitation does not apply to any distributions necessary to maintain the Company's qualification as a REIT providing the Company is in compliance with its total leverage limitations.
70
KIMCO REALTY CORPORATION AND SUBSIDIARIES
NOTES TO CONSOLIDATED FINANCIAL STATEMENTS, continued
Medium Term Notes –
The Company
has implementedhad a
medium-term notes ("MTN")MTN program pursuant to which it
may, from time to time, offeroffered for sale its senior unsecured debt for any general corporate purposes, including (i) funding specific liquidity requirements in its business, including property acquisitions, development and redevelopment costs and (ii) managing the Company's debt maturities.
Interest on these fixed-rate senior unsecured notes is payable semi-annually in arrears. Proceeds from these issuances were primarily used for the acquisition of neighborhood and community shopping centers, the expansion and improvement of properties in the Company’s portfolio and the repayment of certain debt obligations of the Company.
During the years ended December 31,
20112012 and
2010,2011, the Company repaid the following
Medium Term Notes (innotes (dollars in millions):
| Type | | Date Issued | | Amount Repaid | | | Interest Rate | | | Maturity Date | | Date Paid |
| MTN | | July-02 | | $ | 17.0 | | | | 5.98 | % | | July-12 | | July-12 |
| Senior Note | | Nov-02 | | $ | 198.9 | | | | 6.00 | % | | Nov-12 | | Nov-12 |
| MTN | | Aug-04 | | $ | 88.0 | | | | 4.82 | % | | Aug-11 | | Aug-11 |
| | | | | | |
| | 2011 |
Date Issued | | Repaid Amount | | Interest Rate | | Maturity Date |
Aug-04 | $ | 88.0 | | 4.82% | | Aug-11 |
KIMCO REALTY CORPORATION AND SUBSIDIARIES
| | | | | | |
| | 2010 |
Date Issued | | Repaid Amount | | Interest Rate | | Maturity Date |
May-03 | $ | 46.5 | | 4.62% | | May-10 |
Nov-05 | $ | 100.0 | | 5.30% | | Feb-11 |
Oct-06 | $ | 25.0 | | 7.30% | | Sep-10 |
Oct-06 | $ | 150.0 | | 7.95% | | Apr-11 |
NOTES TO CONSOLIDATED FINANCIAL STATEMENTS, continued
During 2010, the Company issued $300.0 million of unsecured MTNs which bear interest at a rate of 4.30% and are scheduled to mature on February 1, 2018. Proceeds from these MTNs were used to repay $250.0 million of outstanding MTNs included above. The remaining proceeds were used for general corporate purposes. In connection with the optional make-whole provisions relating to the prepayment of these notes, the Company incurred early extinguishment of debt charges aggregating approximately $6.5 million.
Canadian Notes Payable –
During April 2010, the Company issued $150.0 million CAD unsecured notes to a group of private investors at a rate of 5.99% scheduled to mature in April 2018. Proceeds from these notes were used to repay the Company’s CAD $150.0 million 4.45% Series 1 unsecured notes which matured in April 2010.
The Company
establishedhas a
new $1.75 billion unsecured revolving credit facility (the “Credit Facility”) with a group of banks, which is scheduled to expire in October 2015 and has a one-year extension option. This credit facility,
which replaced the Company’s $1.5 billion unsecured U.S. credit facility (which was scheduled to expire in October 2012) and the Company’s CAD $250.0 million credit facility (which was scheduled to expire in March 2012), provides funds to finance general corporate purposes, including (i) property acquisitions, (ii) investments in the Company’s institutional management programs, (iii) development and redevelopment costs and (iv) any short-term working capital requirements. Interest on borrowings under the Credit Facility accrues at LIBOR plus 1.05% and fluctuates in accordance with changes in the Company’s senior debt ratings and has a facility fee of 0.20% per annum. As part of this Credit Facility, the Company has a competitive bid option whereby the Company could auction up to $875.0 million of its requested borrowings to the bank group. This competitive bid option provides the Company the opportunity to obtain pricing below the currently stated spread. In addition, as part of the Credit Facility, the Company has a $500.0 million sub-limit which provides
it the opportunity to borrow in alternative currencies such as Canadian Dollars,
British Pounds Sterling, Japanese Yen or Euros.
Pursuant to the terms of the Credit Facility, the Company, among other things, is subject to covenants requiring the maintenance of (i) maximum leverage ratios on both unsecured and secured debt and (ii) minimum interest and fixed coverage ratios. As of December 31,
2011,2012, the Credit Facility had a balance of
$238.9$249.9 million outstanding and
$26.9$27.3 million appropriated for letters of credit.
U.S. Term Loan -
KIMCO REALTY CORPORATION AND SUBSIDIARIES
During 2012, the Company obtained a $400.0 million unsecured term loan with a consortium of banks, which accrues interest at LIBOR plus 105 basis points. The term loan is scheduled to mature in April 2014, with three additional one-year options to extend the maturity date, at the Company’s discretion, to April 17, 2017. Proceeds from this term loan were used for general corporate purposes including the repayment of maturing debt amounts. Pursuant to the terms of the Credit Agreement, the Company, among other things is subject to covenants requiring the maintenance of (i) maximum indebtedness ratios and (ii) minimum interest and fixed charge coverage ratios.
NOTES TO CONSOLIDATED FINANCIAL STATEMENTS, continued
During March 2008, the Company obtained a Mexican peso (“MXN”) 1.0 billion term loan, which bears interest at a rate of 8.58%, subject to change in accordance with the Company’s senior debt ratings, and is scheduled to mature in March 2013. The Company utilized proceeds from this term loan to fully repay the outstanding balance of a MXN 500.0 million unsecured revolving credit facility, which was terminated by the Company. Remaining proceeds from this term loan were used for funding MXN denominated investments. As of December 31, 2011,2012, the outstanding balance on this term loan was MXN 1.0 billion (approximately USD $71.5(USD $76.9 million). PursuantThe Mexican term loan covenants are similar to the termsCredit Facility covenants described above. During December 2012, the lender agreed to extend this term loan for an additional five years at an interest rate of TIIE (Equilibrium Interbank Interest Rate) plus 1.35%, which will be effective subsequent to the scheduled maturity in March 2013. The Company has the option to swap this rate to a fixed rate at any time during the term of the term loan, the Company, among other things, is subject to covenants requiring the maintenance of (i) maximum leverage ratios on both unsecured and secured debt and (ii) minimum interest and fixed coverage ratios.loan.
The weighted-average interest rate for all unsecured notes payable is
5.30%4.72% as of December 31,
2011.2012. The scheduled maturities of all unsecured notes payable as of December 31,
2011,2012, were
approximately as follows (in millions):
2012, $219.5; 2013,
$542.8;$555.4; 2014,
$295.0;$694.8; 2015,
$588.9;$600.0; 2016,
$300.0$300.0; 2017, $290.9 and thereafter,
$1,037.7.$751.0.
During 2012, the Company (i) assumed $185.3 million of individual non-recourse mortgage debt relating to the acquisition of seven operating properties, including an increase of $6.1 million associated with fair value debt adjustments, (ii) paid off $284.8 million of mortgage debt that encumbered 19 properties and (iii) assigned five mortgages aggregating $17.1 million in connection with property dispositions.
During 2011, the Company assumed
approximately $124.8 million of individual non-recourse mortgage debt relating to the acquisition of 12 operating properties, including an increase of
approximately $6.9 million associated with fair value debt adjustments and paid off
approximately $62.5 million of mortgage debt that encumbered 10 operating properties.
During 2010, the Company (i) assumed approximately $144.8 million of individual non-recourse mortgage debt relating to the acquisition of eight operating properties, including a decrease of approximately $4.4 million associated with fair value debt adjustments, (ii) assigned approximately $159.9 million in non-recourse mortgage debt encumbering three operating properties that were sold to newly formed joint ventures in which the Company has noncontrolling interests, (iii) assigned approximately $81.0 million of non-recourse mortgage debt encumbering an operating property that was sold to a third party and (iv) paid off approximately $226.0 million of mortgage debt that encumbered 17 operating properties. In connection with the repayment of five of these mortgages, the Company incurred early extinguishment of debt charges aggregating approximately $4.3 million.
KIMCO REALTY CORPORATION AND SUBSIDIARIES
NOTES TO CONSOLIDATED FINANCIAL STATEMENTS, continued
Mortgages payable, collateralized by certain shopping center properties and related tenants' leases, are generally due in monthly installments of principal and/or interest, which mature at various dates through
2031.2035. Interest rates range from LIBOR
(approximately 0.30%(0.17% as of December 31,
2011)2012) to 9.75% (weighted-average interest rate of
6.12%6.18% as of December 31,
2011)2012). The scheduled principal payments (excluding any extension options available to the Company) of all mortgages payable, excluding unamortized fair value debt adjustments of
approximately $8.1$10.3 million, as of December 31,
2011,2012, were
approximately as follows (in millions):
2012, $191.7; 2013,
$129.1;$104.3; 2014,
$225.0;$206.1; 2015,
$110.7;$131.3; 2016,
$178.5$253.1; 2017, $178.0 and thereafter,
$242.3.$120.1.
15. Construction Loans Payable:
As of December 31, 2011, the Company had three construction loans with total loan commitments aggregating approximately $82.5 million, of which approximately $45.1 million has been funded. These loans are scheduled to mature between 2012 through 2035 and bear interest at rates of LIBOR plus 1.90% (2.20% at December 31, 2011) to 5.72%. These construction loans are collateralized by the respective projects and associated tenants’ leases. The scheduled maturities of all construction loans payable as of December 31, 2011, were approximately as follows (in millions): 2012, $12.4; 2013, $0; 2014, $2.0; 2015, $0; 2016, $0 and thereafter, $30.8.
During 2010, the Company fully repaid two construction loans aggregating approximately $30.2 million and obtained a new 25-year construction loan on a development project located in Chile with a total loan commitment of $48.3 million and bears interest at 10 year-BCU, as defined, plus 2.87% with a floor of 5.22%. As of December 31, 2010, total loan commitments on the Company’s three construction loans aggregated approximately $82.5 million of which approximately $30.3 million has been funded. These loans have scheduled maturities ranging from 2012 to 2035 and bear interest at rates ranging from LIBOR plus 1.90% (2.16% at December 31, 2010) to 5.79%. These construction loans are collateralized by the respective projects and associated tenants’ leases.
72
KIMCO REALTY CORPORATION AND SUBSIDIARIES
NOTES TO CONSOLIDATED FINANCIAL STATEMENTS, continued
16. Noncontrolling Interests:
Noncontrolling interests represent the portion of equity that the Company does not own in those entities it consolidates as a result of having a controlling interest or determined that the Company was the primary beneficiary of a VIE in accordance with the provisions of the FASB’s Consolidation guidance.
The Company accounts and reports for noncontrolling interests in accordance with the Consolidation guidance and the Distinguishing Liabilities from Equity guidance issued by the FASB. The Company identifies its noncontrolling interests separately within the equity section on the Company’s Consolidated Balance Sheets. Units that are determined to be mandatorily redeemable are classified as Redeemable noncontrolling interests and presented in the mezzanine section between Total liabilities and Stockholder’s equity on the Company’s Consolidated Balance Sheets. The amounts of consolidated net income attributable to the Company and to the noncontrolling interests are presented separately on the Company’s Consolidated Statements of
Operations. Income.
The Company owns seven shopping center properties located throughout Puerto Rico. These properties were acquired
partially through the issuance of
approximately $158.6 million of non-convertible units
approximatelyand $45.8 million of convertible
units, the assumption of approximately $131.2 million of non-recourse debt and $116.3 million in cash.units. Noncontrolling interests related to these acquisitions
was approximatelytotaled $233.0 million of units, including premiums of
approximately $13.5 million and a fair market value adjustment of
approximately $15.1 million (collectively, the "Units"). The Company is restricted from disposing of these assets, other than through a tax free transaction until November 2015.
The Units and related annual cash distribution rates consisted of (i) approximately 81.8 million Preferred A Units par value $1.00 per unit, which pay the holder a return of 7.0% per annum on the Preferred A Par Value andfollowing:
| Type | | Number of Units Issued | | | Par Value Per Unit | | | Return Per Annum | |
| Preferred A Units (1) | | | 81,800,000 | | | $ | 1.00 | | | | 7.0% | | |
| Class A Preferred Units (1) | | | 2,000 | | | $ | 10,000 | | | LIBOR | plus | 2.0% | |
| Class B-1 Preferred Units (2) | | | 2,627 | | | $ | 10,000 | | | | 7.0% | | |
| Class B-2 Preferred Units (1) | | | 5,673 | | | $ | 10,000 | | | | 7.0% | | |
| Class C DownReit Units (2) | | | 640,001 | | | $ | 30.52 | | | Equal to the Company’s common stock dividend | |
(1) These units are redeemable for cash by the holder at any time after one year or callable by the Company any time after six months and contain a promote feature based upon an increaseare included in net operating income of the properties capped at a 10.0% increase, (ii) 2,000 Class A Preferred Units, par value $10,000 per unit, which pay the holder a return equal to LIBOR plus 2.0% per annumRedeemable noncontrolling interests on the Class A Preferred Par Value andCompany’s Consolidated Balance Sheets.
(2) These units are redeemable for cash by the holder
at any time after November 30, 2010, (iii) 2,627 Class B-1 Preferred Units, par value $10,000 per unit, which pay the holder a return equal to 7.0% per annum on the Class B-1 Preferred Par Value and are redeemable by the holder at any time after November 30, 2010, for cash or at the Company’s option, shares of the Company’s common stock,
equal tobased upon the
Cash Redemption Amount,conversion calculation as defined
(iv) 5,673 Class B-2 Preferred Units, par value $10,000 per unit, which payin the
holder a return equal to 7.0% per annumagreement. These units are included in Noncontrolling interests on the
Class B-2 Preferred Par Value and are redeemable for cash by the holder at any time after November 30, 2010, and (v) 640,001 Class C DownReit Units, valued at an issuance price of $30.52 per unit which pay the holder a return at a rate equal to the Company’s
common stock dividend and are redeemable by the holder at any time after November 30, 2010, for cash or at the Company’s option, shares of the Company’s common stock equal to the Class C Cash Amount, as defined. Consolidated Balance Sheets.
The following
unitsUnits have been redeemed
for cash as of December 31,
2011:2012:
| Type | | Units Redeemed | | | Par Value Redeemed (in millions) | |
| Preferred A Units | | | 2,200,000 | | | $ | 2.2 | |
| Class A Preferred Units | | | 2,000 | | | $ | 20.0 | |
| Class B-1 Preferred Units | | | 2,438 | | | $ | 24.4 | |
| Class B-2 Preferred Units | | | 5,576 | | | $ | 55.8 | |
| Class C DownReit Units | | | 61,804 | | | $ | 1.9 | |
| | | | | | |
Type | | Units Redeemed | | Par Value Redeemed (in millions) | | Redemption Type |
Preferred A Units | | 2,200,000 | | $2.2 | | Cash |
Class A Preferred Units | | 2,000 | | $20.0 | | Cash |
Class B-1 Preferred Units | | 2,438 | | $24.4 | | Cash |
Class B-2 Preferred Units | | 5,576 | | $55.8 | | Cash/Charitable Contribution |
Class C DownReit Units | | 61,804 | | $1.9 | | Cash |
Noncontrolling interest relating to the remaining units was
$110.5$110.8 million and
$110.4$110.5 million as of December 31,
2012 and 2011,
and 2010, respectively.
KIMCO REALTY CORPORATION AND SUBSIDIARIES
NOTES TO CONSOLIDATED FINANCIAL STATEMENTS, continued
The Company owns two shopping center properties located in Bay Shore, NY and Centereach, NY. Included in Noncontrolling interests was approximately $41.6 million, including a discount of $0.3 million and a fair market value adjustment of $3.8 million, in redeemable units, (the "Redeemable Units"), issued by the Company in connection with these transactions. The properties were acquired through the issuance of $24.2 million of Redeemable Units,these units, which are redeemable at the option of the holder; approximately $14.0 million of fixed rate Redeemable Unitsunits and the assumption of approximately $23.4 million of non-recourse debt. The Redeemable UnitsThese units and related annual cash distribution rates consist of (i) 13,963 Class A Units, par value $1,000 per unit, which pay the holder a return of 5% per annum of the Class A par value andfollowing:
Type | | Number of Units Issued | | | Par Value Per Unit | | | Return Per Annum | |
| Class A Units (1) | | | 13,963 | | | $ | 1,000 | | | | 5.0% | |
| Class B Units (2) | | | 647,758 | | | $ | 37.24 | | | Equal to the Company’s common stock dividend | |
(1) These units are redeemable for cash by the holder
at any time after April 3, 2011, or callable by the Company any time after April 3, 2016 and
(ii) 647,758 Class B Units, valued at an issuance price of $37.24 per unit, which
73
KIMCO REALTY CORPORATION AND SUBSIDIARIES
NOTES TO CONSOLIDATED FINANCIAL STATEMENTS, continued
payare included in Redeemable noncontrolling interests on the Company’s Consolidated Balance Sheets.
(2) These units are redeemable for cash by the holder
a returnor at
a rate equal tothe Company’s option, shares of the Company’s common stock
dividend and are redeemable by the holder at any time after April 3, 2007, for cash or at the option of the Company for Common Stock at a ratio of 1:1
orand are callable by the Company any time after April 3, 2026.
The Company is restricted from disposing of these assets, other than through a tax free transaction, until April 2016 and April 2026 forThese units are included in Noncontrolling interests on the
Centereach, NY, and Bay Shore, NY, assets, respectively.Company’s Consolidated Balance Sheets.
During
2012, all 13,963 Class A Units were redeemed by the holder in cash. Additionally, during 2007, 30,000 units, or $1.1 million par value, of the Class B Units were redeemed by the holder in cash at the option of the Company.
NoncontrollingAs of December 31, 2012 and 2011, noncontrolling interest relating to the units was
$26.4 million and $40.4 million,
as of both December 31, 2011 and 2010.respectively.
Noncontrolling interests also includes 138,015 convertible units issued during 2006, by the Company, which were valued at
approximately $5.3 million, including a fair market value adjustment of $0.3 million, related to an interest acquired in an office building located in Albany, NY. These units are redeemable at the option of the holder after one year for cash or at the option of the Company for the Company’s common stock at a ratio of 1:1. The holder is entitled to a distribution equal to the dividend rate of the Company’s common stock. The Company is restricted from disposing of these assets, other than through a tax free transaction, until January 2017.
The following table presents the change in the redemption value of the Redeemable noncontrolling interests for the years ended December 31,
20112012 and December 31,
20102011 (in thousands):
| | | | |
| | 2011 | | 2010 |
Balance at January 1, | $ | 95,060 | $ | 100,304 |
Unit redemptions | | - | | (5,208) |
Fair market value amortization | | 14 | | 18 |
Other | | - | | (54) |
Balance at December 31, | $ | 95,074 | $ | 95,060 |
| | | 2012 | | | 2011 | |
| Balance at January 1, | | $ | 95,074 | | | $ | 95,060 | |
| Unit redemptions | | | (13,998 | ) | | | - | |
| Fair market value amortization | | | - | | | | 14 | |
| Balance at December 31, | | $ | 81,076 | | | $ | 95,074 | |
16. Fair Value Disclosure of Financial Instruments: All financial instruments of the Company are reflected in the accompanying Consolidated Balance Sheets at amounts which, in management’s estimation based upon an interpretation of available market information and valuation methodologies, reasonably approximate their fair values, except those listed below, for which fair values are reflected. The valuation method used to estimate fair value for fixed-rate and variable-rate debt and noncontrolling interests relating to mandatorily redeemable noncontrolling interests associated with finite-lived subsidiaries of the Company is based on discounted cash flow analyses, with assumptions that include credit spreads, loan amounts and debt maturities. The fair values for marketable securities are based on published or securities dealers’ estimated market values. Such fair value estimates are not necessarily indicative of the amounts that would be realized upon disposition.
The following are financial instruments for which the Company’s estimate of fair value differs from the carrying amounts (in thousands): | | | | | | | | |
| | December 31, |
| | 2011 | | 2010 |
| | Carrying Amounts | | Estimated Fair Value | | Carrying Amounts | | Estimated Fair Value |
| | | | | | | | |
Marketable Securities | $ | 33,540 | $ | 33,908 | $ | 223,991 | $ | 224,451 |
Notes Payable | $ | 2,983,886 | $ | 3,136,728 | $ | 2,982,421 | $ | 3,162,183 |
Mortgages Payable | $ | 1,085,371 | $ | 1,166,116 | $ | 1,046,313 | $ | 1,120,797 |
Construction Loans Payable | $ | 45,128 | $ | 49,345 | $ | 30,253 | $ | 32,192 |
Mandatorily Redeemable Noncontrolling Interests (termination dates ranging from 2019 – 2027) | $ | 2,654 | $ | 5,044 | $ | 2,697 | $ | 5,462 |
The Company has certain financial instruments that must be measured under the FASB’s Fair Value Measurements and Disclosures guidance, including: available for sale securities, convertible notes and derivatives. The Company currently does not have non-financial assets and non-financial liabilities that are required to be measured at fair value on a recurring basis.
74
KIMCO REALTY CORPORATION AND SUBSIDIARIES
NOTES TO CONSOLIDATED FINANCIAL STATEMENTS, continued
As a basis for considering market participant assumptions in fair value measurements, the FASB’s Fair Value Measurements and Disclosures guidance establishes a fair value hierarchy that distinguishes between market participant assumptions based on market data obtained from sources independent of the reporting entity (observable inputs that are classified within Levels 1 and 2 of the hierarchy) and the reporting entity’s own assumptions about market participant assumptions (unobservable inputs
that are classified within Level 3 of the hierarchy).
KIMCO REALTY CORPORATION AND SUBSIDIARIES
NOTES TO CONSOLIDATED FINANCIAL STATEMENTS, continued
The following are financial instruments for which the Company’s estimate of fair value differs from the carrying amounts (in thousands):
| | | December 31, | |
| | | 2012 | | | 2011 | |
| | | Carrying Amounts | | | Estimated Fair Value | | | Carrying Amounts | | | Estimated Fair Value | |
| | | | | | | | | | | | | |
| Marketable Securities (1) | | $ | 36,541 | | | $ | 36,825 | | | $ | 33,540 | | | $ | 33,908 | |
| Notes Payable (2) | | $ | 3,192,127 | | | $ | 3,408,632 | | | $ | 2,983,886 | | | $ | 3,136,728 | |
| Mortgages Payable (3) | | $ | 1,003,190 | | | $ | 1,068,616 | | | $ | 1,085,371 | | | $ | 1,166,116 | |
| Construction Loans Payable (3) | | $ | - | | | $ | - | | | $ | 45,128 | | | $ | 49,345 | |
| Mandatorily Redeemable Noncontrolling Interests (termination dates ranging from 2019 – 2027) (4) | | $ | - | | | $ | - | | | $ | 2,654 | | | $ | 5,044 | |
(1) As of December 31, 2012, $33.4 million of these assets’ estimated fair value were classified within Level 1 of the fair value hierarchy and the remaining $3.4 million were classified within Level 3 of the fair value hierarchy.
(2) The Company determined that its valuation of these Notes payable was classified within Level 2 of the fair value hierarchy.
(3) The Company determined that its valuation of these liabilities was classified within Level 3 of the fair value hierarchy.
(4) The Company sold its investment in the consolidated joint ventures that included mandatorily redeemable noncontrolling interests during 2012.
The Company has certain financial instruments that must be measured under the FASB’s Fair Value Measurements and Disclosures guidance, including: available for sale securities, convertible notes and derivatives. The Company currently does not have non-financial assets and non-financial liabilities that are required to be measured at fair value on a recurring basis.
In instances where the determination of the fair value measurement is based on inputs from different levels of the fair value hierarchy, the level in the fair value hierarchy within which the entire fair value measurement falls is based on the lowest level input that is significant to the fair value measurement in its entirety. The Company’s assessment of the significance of a particular input to the fair value measurement in its entirety requires judgment, and considers factors specific to the asset or liability.
Available for sale securities are measured at fair value using quoted market prices and are classified within Level 1 of the valuation hierarchy.
The Company
had an investment in convertible notes for which it separately accounted for the conversion option as an embedded derivative. The convertible notes and conversion option were measured at fair value using widely accepted valuation techniques including pricing models. These models reflected the contractual terms of the convertible notes, including the termfrom time to
maturity, andtime has used
observable market-based inputs, including interest rate curves, implied volatilities, stock price, dividend yields and foreign exchange rates. Based on these inputs, the Company had determined that its convertible notes and conversion option valuations were classified within Level 2 of the fair value hierarchy. These convertible notes were sold during 2011 (see Footnote 12).
The Company uses interest rate swaps to manage its interest rate risk. The fair values of interest rate swaps are determined using the market standard methodology of netting the discounted future fixed cash receipts (or payments) and the discounted expected variable cash payments (or receipts). The variable cash payments (or receipts) are based on an expectation of future interest rates (forward curves) derived from observable market interest rate curves. Based on these inputs, the Company has determined that its interest rate swap valuations are classified within Level 2 of the fair value hierarchy.
The Company did not have any interest rate swaps as of December 31, 2012.
To comply with the FASB’s Fair Value Measurements and Disclosures guidance, the Company incorporates credit valuation adjustments to appropriately reflect both its own nonperformance risk and the respective counterparty’s nonperformance risk in the fair value measurements. The credit valuation adjustments associated with its derivatives utilize Level 3 inputs,
, such as estimates of current credit spreads to evaluate the likelihood of default by itself and its counterparties. However, as of December 31,
2011,2012, the Company has assessed the significance of the impact of the credit valuation adjustments on the overall valuation of its derivative positions and has determined that the credit valuation adjustments are not significant to the overall valuation of its derivatives.
The table below presents the Company’s assets and liabilities measured at fair value on a recurring basis as of December 31,
20112012 and
2010,2011, aggregated by the level in the fair value hierarchy within which those measurements fall.
KIMCO REALTY CORPORATION AND SUBSIDIARIES
NOTES TO CONSOLIDATED FINANCIAL STATEMENTS, continued
Assets
and liabilities measured at fair value on a recurring basis at December 31,
20112012 and
20102011 (in thousands):
| | | Balance at December 31, 2012 | | | Level 1 | | | Level 2 | | | Level 3 | |
| Assets: | | | | | | | | | | | | |
| Marketable equity securities | | $ | 33,428 | | | $ | 33,428 | | | $ | - | | | $ | - | |
| | | Balance at December 31, 2011 | | | Level 1 | | | Level 2 | | | Level 3 | |
| Assets: | | | | | | | | | | | | |
| Marketable equity securities | | $ | 30,462 | | | $ | 30,462 | | | $ | - | | | $ | - | |
| Liabilities: | | | | | | | | | | | | | | | | |
| Interest rate swaps | | $ | 222 | | | $ | - | | | $ | 222 | | | $ | - | |
| | | | | | | | |
| | Balance at December 31, 2010 | | Level 1 | | Level 2 | | Level 3 |
Assets: | | | | | | | | |
Marketable equity securities | $ | 31,016 | $ | 31,016 | $ | - | $ | - |
Convertible notes | $ | 172,075 | $ | - | $ | 172,075 | $ | - |
Conversion option | $ | 10,205 | $ | - | $ | 10,205 | $ | - |
Liabilities: | | | | | | | | |
Interest rate swaps | $ | 506 | $ | - | $ | 506 | $ | - |
75
KIMCO REALTY CORPORATION AND SUBSIDIARIES
NOTES TO CONSOLIDATED FINANCIAL STATEMENTS, continued
Assets and liabilities measured at fair value on a non-recurring basis at December 31,
20112012 and
20102011 are as follows (in thousands):
| | | Balance at December 31, 2012 | | | Level 1 | | | Level 2 | | | Level 3 | |
| Assets: | | | | | | | | | | | | |
| Real estate | | $ | 52,505 | | | $ | - | | | $ | - | | | $ | 52,505 | |
| | | Balance at December 31, 2011 | | | Level 1 | | | Level 2 | | | Level 3 | |
| Assets: | | | | | | | | | | | | |
| Real estate | | $ | 5,289 | | | $ | - | | | $ | - | | | $ | 5,289 | |
| Other investments | | $ | 9,041 | | | $ | - | | | $ | 9,041 | | | $ | - | |
| | | | | | | | |
| | Balance at December 31, 2010 | | Level 1 | | Level 2 | | Level 3 |
Assets: | | | | | | | | |
Real estate | $ | 16,414 | $ | - | $ | - | $ | 16,414 |
Real estate under development | $ | 22,626 | $ | - | $ | - | $ | 22,626 |
Other real estate investments | $ | 3,921 | $ | - | $ | - | $ | 3,921 |
Mortgage and other financing receivables | $ | 1,405 | $ | - | $ | - | $ | 1,405 |
During 2011, the Company recognized impairment charges of approximately $31.2 million relating to adjustments to property carrying values, investments in other real estate investments and investments in real estate joint ventures.
During 2010, the Company recognized impairment charges of approximately $34.5 million relating to adjustments to property carrying values, real estate under development, investments in other real estate investments and other investments.
The Company’s estimated fair values
for the year ended December 31, 2012, relating to the
above impairment assessmentsreal estate assets measured on a non-recurring basis, which were non-retail assets, were based upon
purchase priceestimated sales prices from third party offers
orand comparable sales values ranging from $1.1 million to $42.0 million. The Company does not have access to certain unobservable inputs used by these third parties to determine these estimated fair values (see footnote 6 for additional discussion related to these assets). Certain assets in 2011 were valued through the usage of discounted cash flow models that included all estimated cash inflows and outflows over a specified holding period and where applicable, any estimated debt premiums. These cash flows were comprised of unobservable inputs which included contractual rental revenues and forecasted rental revenues and expenses based upon market conditions and expectations for growth. Capitalization rates and discount rates utilized in these models were based upon observable rates that the Company believed to be within a reasonable range of current market rates for the respective properties. Based on these inputs, the Company determined that its valuation in these investments was classified within Level 3 of the fair value hierarchy.
18. Financial Instruments - Derivatives and Hedging:
The Company is exposed to certain risk arising from both its business operations and economic conditions. The Company principally manages its exposures to a wide variety of business and operational risk through management of its core business activities. The Company manages economic risks, including interest rate, liquidity, and credit risk primarily by managing the amount, sources, and duration of its debt funding and the use of derivative financial instruments. Specifically, the Company may use derivatives to manage exposures that arise from changes in interest rates, foreign currency exchange rate fluctuations and market value fluctuations of equity securities. The Company limits these risks by following established risk management policies and procedures including the use of derivatives.
Cash Flow Hedges of Interest Rate Risk -
The Company, from time to time, hedges the future cash flows of its floating-rate debt instruments to reduce exposure to interest rate risk principally through interest rate swaps and interest rate caps with major financial institutions. The effective portion of the changes in fair value of derivatives designated and that qualify as cash flow hedges is recorded in Accumulated Other Comprehensive Income and is subsequently reclassified into earnings in the period that the hedged forecasted transaction affects earnings. Any ineffective portion of the change in fair value of the derivatives is recognized directly in earnings. During the years ended December 31, 2011 and 2010, the Company had no hedge ineffectiveness.
Amounts reported in accumulated other comprehensive income related to cash flow hedges will be reclassified to interest expense as interest payments are made on the Company’s variable-rate debt. During 2012, the Company estimates that an additional $0.1 million will be reclassified as an increase to interest expense.
76
KIMCO REALTY CORPORATION AND SUBSIDIARIES
NOTES TO CONSOLIDATED FINANCIAL STATEMENTS, continued
As of December 31, 2011, the Company had the following outstanding interest rate derivatives that were designated as cash flow hedges of interest rate risk:
| | | |
Interest Rate Derivatives | Number of Instruments | | Notional (in millions) |
Interest Rate Caps | 2 | $ | 83.5 |
Interest Rate Swaps | 1 | $ | 20.7 |
The fair value of these derivative financial instruments classified as liability derivatives was $0.2 million and $0.5 million as of December 31, 2011 and 2010, respectively.
Credit-risk-related Contingent Features –
The Company has agreements with one of its derivative counterparties that contain a provision where if the Company defaults on any of its indebtedness, including default where repayment of the indebtedness has not been accelerated by the lender, then the Company could also be declared in default on its derivative obligations.
The Company has an agreement with a derivative counterparty that incorporates the loan covenant provisions of the Company's indebtedness with a lender affiliate of the derivative counterparty. Failure to comply with the loan covenant provisions would result in the Company being in default on any derivative instrument obligations covered by the agreement.
Cash Flow Hedges of Foreign Currency Risk -
During 2011, the Company entered into a foreign currency forward contract to sell AUD $165.0 million and buy USD $169.1 million. The Company is a USD functional currency entity and had agreed to sell its AUD-denominated Valad notes. Because of the fluctuations in the AUD-USD exchange rate, the Company was exposed to foreign exchange gains and losses, specifically the risk of incurring a lower USD cash equivalent amount of the anticipated AUD proceeds collected in the future. The Company’s objective and strategy was to mitigate this risk and the associated foreign exchange gains and losses, and lock-in the future exchange rate when AUD proceeds were converted to USD. The Company designated the AUD-USD foreign exchange risk as the risk being hedged.
During April 2011, the Company received AUD $170.2 million (approximately USD $174.7 million) from the sale of the Valad notes representing the principal and unpaid interest and settled its foreign currency forward contract. Upon settling the foreign currency forward contract, the Company recorded a reclass of $10.0 million from Accumulated other comprehensive income to Other (expense)/income, net, which was fully offset by a foreign currency gain on sale of the Valad notes. As a result there was no net gain or loss recognized.
The effective portion of the changes in fair value of derivatives designated and that qualify as cash flow hedges is recorded in Accumulated other comprehensive income and is subsequently reclassified into earnings in the period that the hedged forecasted transaction affects earnings. Any ineffective portion of the change in fair value of the derivatives is recognized directly in earnings. During 2011, the Company had no hedge ineffectiveness.
19.
17. Preferred Stock, Common Stock and Convertible Unit Transactions – The Company’s outstanding Preferred Stock is detailed below (in thousands, except share information and par values):
| As of December 31, 2012 | |
Series of Preferred Stock | | Shares Authorized | | | Shares Issued and Outstanding | | | Liquidation Preference | | | Dividend Rate | | | Annual Dividend per Depositary Share | | | Par Value | |
| Series H | | | 70,000 | | | | 70,000 | | | $ | 175,000 | | | | 6.90 | % | | $ | 1.72500 | | | $ | 1.00 | |
| Series I | | | 18,400 | | | | 16,000 | | | | 400,000 | | | | 6.00 | % | | $ | 1.50000 | | | $ | 1.00 | |
| Series J | | | 9,000 | | | | 9,000 | | | | 225,000 | | | | 5.50 | % | | $ | 1.37500 | | | $ | 1.00 | |
| Series K | | | 8,050 | | | | 7,000 | | | | 175,000 | | | | 5.625 | % | | $ | 1.40625 | | | $ | 1.00 | |
| | | | 105,450 | | | | 102,000 | | | $ | 975,000 | | | | | | | | | | | | | |
KIMCO REALTY CORPORATION AND SUBSIDIARIES
NOTES TO CONSOLIDATED FINANCIAL STATEMENTS, continued
| As of December 31, 2011 | |
Series of Preferred Stock | | Shares Authorized | | | Shares Issued and Outstanding | | | Liquidation Preference | | | Dividend Rate | | | Annual Dividend per Depositary Share | | | Par Value | |
| Series F | | | 700,000 | | | | 700,000 | | | $ | 175,000 | | | | 6.65 | % | | $ | 1.66250 | | | $ | 1.00 | |
| Series G | | | 184,000 | | | | 184,000 | | | | 460,000 | | | | 7.75 | % | | $ | 1.93750 | | | $ | 1.00 | |
| Series H | | | 70,000 | | | | 70,000 | | | | 175,000 | | | | 6.90 | % | | $ | 1.72500 | | | $ | 1.00 | |
| | | | 954,000 | | | | 954,000 | | | $ | 810,000 | | | | | | | | | | | | | |
The following Preferred Stock series were issued during the years ended December 31, 2012 and 2010:
Series of Preferred Stock | | Date Issued | | Depositary Shares Issued | | Fractional Interest per Share | | Net Proceeds, After Expenses (in millions) | | Offering/ Redemption Price | | Optional Redemption Date |
| | | | | | | | | | | | | |
| Series H(1) | | 8/30/2010 | | 7,000,000 | | 1/100 | | $ | 169.2 | | $ | 25.00 | | 8/30/2015 |
| Series I (2) | | 3/20/2012 | | 16,000,000 | | 1/1000 | | $ | 387.2 | | $ | 25.00 | | 3/20/2017 |
| Series J (3) | | 7/25/2012 | | 9,000,000 | | 1/1000 | | $ | 217.8 | | $ | 25.00 | | 7/25/2017 |
| Series K (4) | | 12/7/2012 | | 7,000,000 | | 1/1000 | | $ | 169.1 | | $ | 25.00 | | 12/7/2017 |
(1) The net proceeds received from this offering were used to repay $150.0 million in mortgages payable and for general corporate purposes.
(2) The net proceeds received from this offering were used for general corporate purposes, including the reduction of borrowings outstanding under the Company’s revolving credit facility and the redemption of shares of the Company’s preferred stock.
(3) The net proceeds received from this offering were used for the redemption of all the outstanding depositary shares representing the Company’s Class F preferred stock, which redemption occurred on August 2010,15, 2012, as discussed below, with the remaining proceeds used towards the redemption of outstanding depositary shares representing the Company’s Class G preferred stock, which redemption occurred on October 10, 2012, as discussed below, and general corporate purposes.
(4) The net proceeds received from this offering were used for general corporate purposes, including funding towards the repayment of maturing Senior Unsecured Notes.
The following Preferred Stock series were redeemed during the year ended December 31, 2012:
Series of Preferred Stock | | Date Issued | | Depositary Shares Issued | | Redemption Amount (in millions) | | Offering/ Redemption Price | | Optional Redemption Date | | Actual Redemption Date |
| Series F (1) | | 6/5/2003 | | 7,000,000 | | $ | 175.0 | | $ | 25.00 | | 6/5/2008 | | 8/15/2012 |
| Series G (2) | | 10/10/2007 | | 18,400,000 | | $ | 460.0 | | $ | 25.00 | | 10/10/2012 | | 10/10/2012 |
(1) In connection with this redemption the Company issued 7,000,000recorded a non-cash charge of $6.2 million resulting from the difference between the redemption amount and the carrying amount of the Class F Preferred Stock on the Company’s Consolidated Balance Sheets in accordance with the FASB’s guidance on Distinguishing Liabilities from Equity. The $6.2 million was subtracted from net income to arrive at net income available to common shareholders and is used in the calculation of earnings per share for the year ended December 31, 2012.
(2) In connection with this redemption the Company recorded a non-cash charge of $15.5 million resulting from the difference between the redemption amount and the carrying amount of the Class G Preferred Stock on the Company’s Consolidated Balance Sheets in accordance with the FASB’s guidance on Distinguishing Liabilities from Equity. The $15.5 million was subtracted from net income to arrive at net income available to common shareholders and is used in the calculation of earnings per share for the year ended December 31, 2012.
The Company’s Preferred Stock Depositary Shares
(the "Class H Depositary Shares"), each representing a one-hundredth fractional interest in a share of the Company's 6.90% Class H Cumulative Redeemable Preferred Stock, $1.00 par value per share (the "Class H Preferred Stock"). Dividends on the Class H Depositary Shares are cumulative and payable quarterly in arrears at the rate of 6.90% per annum based on the $25.00 per share initial offering price, or $1.725 per annum. The Class H Depositary Shares are redeemable, in whole or part, for
cash on or after August 30, 2015, at the option of the Company, at a redemption price of $25.00 per depositary share, plus any accrued and unpaid dividends thereon. The Class H Depositary Sharesall series are not convertible or exchangeable for any other property or securities of the Company.
The net proceeds received from this offering of approximately $169.2 million were used primarily to repay mortgage loans in the aggregate principal amount of approximately $150 million and for general corporate purposes. During October 2007, the Company issued 18,400,000 Depositary Shares (the "Class G Depositary Shares"), after the exercise of an over-allotment option, each representing a one-hundredth fractional interest in a share of the Company’s 7.75% Class G Cumulative Redeemable Preferred Stock, par value $1.00 per share (the "Class G Preferred Stock"). Dividends on the Class G Depositary Shares are cumulative and payable quarterly in arrears at the rate of 7.75% per annum based on the $25.00 per share initial offering price, or $1.9375 per annum. The Class G Depositary Shares are redeemable, in whole or part, for cash on or after
77
KIMCO REALTY CORPORATION AND SUBSIDIARIES
NOTES TO CONSOLIDATED FINANCIAL STATEMENTS, continued
October 10, 2012, at the option of the Company, at a redemption price of $25.00 per depositary share, plus any accrued and unpaid dividends thereon. The Class G Depositary Shares are not convertible or exchangeable for any other property or securities of the Company.
During June 2003, the Company issued 7,000,000 Depositary Shares (the "Class F Depositary Shares"), each such Class F Depositary Share representing a one-tenth fractional interest of a share of the Company’s 6.65% Class F Cumulative Redeemable Preferred Stock, par value $1.00 per share (the "Class F Preferred Stock"). Dividends on the Class F Depositary Shares are cumulative and payable quarterly in arrears at the rate of 6.65% per annum based on the $25.00 per share initial offering price, or $1.6625 per annum. The Class F Depositary Shares are redeemable, in whole or part, for cash on or after June 5, 2008, at the option of the Company, at a redemption price of $25.00 per Depositary Share, plus any accrued and unpaid dividends thereon. The Class F Depositary Shares are not convertible or exchangeable for any other property or securities of the Company.
Voting Rights - The Class
HK Preferred Stock, Class
FJ Preferred Stock, Class I Preferred Stock and Class
GH Preferred Stock rank pari passu as to voting rights, priority for receiving dividends and liquidation preference as set forth below.
As to any matter on which the Class F Preferred Stock may vote, including any actions by written consent, each share of the Class F Preferred Stock shall be entitled to 10 votes, each of which 10 votes may be directed separately by the holder thereof. With respect to each share of Class F Preferred Stock, the holder thereof may designate up to 10 proxies, with each such proxy having the right to vote a whole number of votes (totaling 10 votes per share of Class F Preferred Stock). As a result, each Class F Depositary Share is entitled to one vote.
As to any matter on which the Class G Preferred Stock may vote, including any actions by written consent, each share of the Class G Preferred Stock shall be entitled to 100 votes, each of which 100 votes may be directed separately by the holder thereof. With respect to each share of Class G Preferred Stock, the holder thereof may designate up to 100 proxies, with each such proxy having the right to vote a whole number of votes (totaling 100 votes per share of Class G Preferred Stock). As a result, each Class G Depositary Share is entitled to one vote.
As to any matter on which the Class H Preferred Stock may vote, including any actions by written consent, each share of the Class H Preferred Stock shall be entitled to 100 votes, each of which 100 votes may be directed separately by the holder thereof. With respect to each share of Class H Preferred Stock, the holder thereof may designate up to 100 proxies, with each such proxy having the right to vote a whole number of votes (totaling 100 votes per share of Class H Preferred Stock). As a result, each Class H Depositary Share is entitled to one vote.
KIMCO REALTY CORPORATION AND SUBSIDIARIES
NOTES TO CONSOLIDATED FINANCIAL STATEMENTS, continued
As to any matter on which the Class I, J, or K Preferred Stock may vote, including any actions by written consent, each share of the Class I, J or K Preferred Stock shall be entitled to 1,000 votes, each of which 1,000 votes may be directed separately by the holder thereof. With respect to each share of Class I, J or K Preferred Stock, the holder thereof may designate up to 1,000 proxies, with each such proxy having the right to vote a whole number of votes (totaling 1,000 votes per share of Class I, J or K Preferred Stock). As a result, each Class I, J or K Depositary Share is entitled to one vote.
Liquidation Rights - –
In the event of any liquidation, dissolution or winding up of the affairs of the Company,
the Preferred Stockpreferred stock holders are entitled to be paid, out of the assets of the Company legally available for distribution to its stockholders, a liquidation preference of
$250.00$2,500.00 Class
FH Preferred
Stock per share,
$2,500.00$25,000.00 Class
GI Preferred
Stock per share, $25,000.00 Class J Preferred Stock per share and
$2,500.00$25,000.00 Class
HK Preferred
Stock per share ($25.00 per
each Class
F,H, Class
GI, Class J and Class
HK Depositary Share), plus an amount equal to any accrued and unpaid dividends to the date of payment, before any distribution of assets is made to holders of the Company’s common stock or any other capital stock that ranks junior to the
Preferred Stockpreferred stock as to liquidation rights.
The Company, from time to time, repurchases shares of its common stock in amounts that offset new issuances of common shares in connection with the exercise of stock options or the issuance of restricted stock awards. These share repurchases may occur in open market purchases, privately negotiated transactions or otherwise subject to prevailing market conditions, the Company’s liquidity requirements, contractual restrictions and other factors. During the year ended December 31,
2011,2012, the Company repurchased
333,9981,635,823 shares of the Company’s common stock for
approximately $6.0$30.9 million, of which
$4.9$22.6 million was provided to the Company from stock options exercised.
During December 2009, the Company completed a primary public stock offering of 28,750,000 shares of the Company’s common stock. The net proceeds from this sale of common stock, totaling approximately $345.1 million (after related transaction costs of $0.75 million) were used to partially repay the outstanding balance under the Company’s U.S. revolving credit facility.
During April 2009, the Company completed a primary public stock offering of 105,225,000 shares of the Company’s common stock. The net proceeds from this sale of common stock, totaling approximately $717.3 million (after related transaction costs of $0.7 million) were used to partially repay the outstanding balance under the Company’s U.S. revolving credit facility and for general corporate purposes.
The Company
owns interests in seven shopping center properties located throughout Puerto Rico. The properties were acquired through the issuance of approximately $158.6 million of non-convertible units, approximately $45.8 millionhas varies types of convertible units
approximately $131.2 millionthat were issued in connection with the purchase of
non-recourse debt and $116.3 million in cash.
78
KIMCO REALTY CORPORATION AND SUBSIDIARIES
NOTES TO CONSOLIDATED FINANCIAL STATEMENTS, continued
The convertible units consist of 2,627 Class B-1 Preferred Units, par value $10,000 per unit and 640,001 Class C DownREIT Units, valued at an issuance price of $30.52 per unit. Both the Class B-1 Units and the Class C DownREIT Units are redeemable by the holder at any time after November 30, 2010, for cash, or at the Company’s option, shares of the Company’s common stock. As of December 31, 2011, 2,438 units, or $24.4 million, of the Class B-1 Preferred Units were redeemed and 61,804 units, or $1.9 million, of the Class C DownREIT Units were redeemed under the Loan provision of the Agreement. The Company opted to settle these unit redemptions in cash.
The number of shares of Common Stock issued upon conversion of the Class B-1 Preferred Units would be equal to the Class B-1 Cash Redemption Amount, as defined, which ranges from $6,000 to $14,000 per Class B-1 Preferred Unit depending on the Common Stock’s Adjusted Current Trading Price, as defined, divided by the average daily market price for the 20 consecutive trading days immediately preceding the redemption date.
When the Adjusted Current Trading Price is greater than $36.62 then the Class C Cash Amount shall be an amount equal to the Adjusted Current Trading Price per Class C DownREIT Unit. If the Adjusted Current Trading Price is greater than $24.41 but less than $36.62, then the Class C Cash Amount shall be an amount equal to $30.51 per Class C DownREIT Unit, or is less than $24.41, then the Class C Cash Amount shall be an amount per Class C DownREIT Unit equal to the Adjusted Current Trading Price multiplied by 1.25.
The Company owns interests in two shopping centeroperating properties located in Bay Shore, NY and Centereach, NY, valued at an aggregate $61.6 million. The properties were acquired through the issuance of units from a consolidated subsidiary and consist of approximately $24.2 million of Redeemable Units, which are redeemable at the option of the holder, approximately $14.0 million of fixed rate Redeemable Units and the assumption of approximately $23.4 million of non-recourse mortgage debt. The Company has the option to settle the redemption of the $24.2 million redeemable units with Common Stock, at a ratio of 1:1 or in cash. As of December 31, 2011, 30,000 units, or $1.1 million par value, of the Redeemable Units were redeemed by the holder. The Company opted to settle these unit redemptions in cash.
The Company owns an interest in an office property, located in Albany, NY, valued at approximately $39.9 million. The property was acquired through the issuance of approximately $5.0 million of redeemable units from a consolidated subsidiary, which are redeemable at the option of the holder after one year, and the assumption of approximately $34.9 million of non-recourse mortgage debt. The Company has the option to settle the redemption with Common Stock, at a ratio of 1:1 or in cash.
(see footnote 15). The amount of consideration that would be paid to unaffiliated holders of units issued from the Company’s consolidated subsidiaries which are not mandatorily redeemable, as if the termination of these consolidated subsidiaries occurred on December 31, 2011,2012, is approximately $27.1$28.7 million. The Company has the option to settle such redemption in cash or shares of the Company’s common stock. If the Company exercised its right to settle in Common Stock, the unit holders would receive approximately 1.71.5 million shares of Common Stock.
18. Supplemental Schedule of Non-Cash Investing/Financing Activities: The following schedule summarizes the non-cash investing and financing activities of the Company for the years ended December 31,
2012, 2011
2010 and
20092010 (in thousands):
| | | | | | |
| | 2011 | | 2010 | | 2009 |
Acquisition of real estate interests by assumption of mortgage debt | $ | 117,912 | $ | 670 | $ | 577,604 |
Disposition of real estate interest by assignment of mortgage debt | $ | - | $ | 81,000 | $ | - |
Issuance of common stock | $ | 4,940 | $ | 5,070 | $ | 3,415 |
Surrender of common stock | $ | (596) | $ | (840) | $ | (164) |
Disposition of real estate through the issuance of loan receivables | $ | 14,297 | $ | 975 | $ | 1,366 |
Investment in real estate joint venture by contribution of properties and assignment of debt | $ | - | $ | 149,034 | $ | - |
Declaration of dividends paid in succeeding period | $ | 92,159 | $ | 89,037 | $ | 76,707 |
Consolidation of Joint Ventures: | | | | | | |
Increase in real estate and other assets | $ | - | $ | 174,327 | $ | 47,368 |
Increase in mortgage payable | $ | - | $ | 144,803 | $ | 35,104 |
| | | 2012 | | | 2011 | | | 2010 | |
| Acquisition of real estate interests by assumption of mortgage debt | | $ | 179,198 | | | $ | 117,912 | | | $ | 670 | |
| Disposition of real estate interest by assignment of debt | | $ | 17,083 | | | $ | - | | | $ | 81,000 | |
| Issuance of common stock | | $ | 18,115 | | | $ | 4,940 | | | $ | 5,070 | |
| Surrender of common stock | | $ | (2,073 | ) | | $ | (596 | ) | | $ | (840 | ) |
| Disposition of real estate through the issuance of loan receivables | | $ | 13,475 | | | $ | 14,297 | | | $ | 975 | |
| Investment in real estate joint venture by contribution of properties and assignment of debt | | $ | - | | | $ | - | | | $ | 149,034 | |
| Declaration of dividends paid in succeeding period | | $ | 96,518 | | | $ | 92,159 | | | $ | 89,037 | |
| Consolidation of Joint Ventures: | | | | | | | | | | | | |
| Increase in real estate and other assets | | $ | - | | | $ | - | | | $ | 174,327 | |
| Increase in mortgage payable | | $ | - | | | $ | - | | | $ | 144,803 | |
79
KIMCO REALTY CORPORATION AND SUBSIDIARIES
NOTES TO CONSOLIDATED FINANCIAL STATEMENTS, continued
21.
19. Transactions with Related Parties: The Company provides management services for shopping centers owned principally by affiliated entities and various real estate joint ventures in which certain stockholders of the Company have economic interests. Such services are performed pursuant to management agreements which provide for fees based upon a percentage of gross revenues from the properties and other direct costs incurred in connection with management of the centers. Reference is made to Footnotes 4, 5, 8 and
2220 for additional information regarding transactions with related parties.
KIMCO REALTY CORPORATION AND SUBSIDIARIES
NOTES TO CONSOLIDATED FINANCIAL STATEMENTS, continued
Ripco Real Estate Corp.
(“Ripco”) business activities include serving as a leasing agent and representative for national and regional retailers including Target, Best Buy, Kohls and many others, providing real estate brokerage services and principal real estate investing. Mr. Todd Cooper, an officer and 50% shareholder of Ripco, is a son of Mr. Milton Cooper, Executive Chairman of the Board of Directors of the Company. During
2012, 2011
2010 and
2009,2010, the Company paid brokerage commissions of
$0.5$0.8 million,
$0.7$0.5 million and $0.7 million, respectively, to Ripco for services rendered primarily as leasing agent for various national tenants in shopping center properties owned by the Company. The Company believes that the brokerage commissions paid were at or below the customary rates for such leasing services.
Additionally, the Company
holdsheld joint venture investments with Ripco.
During 2005,As of December 31, 2010, the Company
acquired threehad two operating properties and one land parcel, through joint ventures, in which the Company and Ripco each
holdheld 50% noncontrolling interests. The Company accounts for its investment in these joint ventures under the equity method of accounting. During 2011, the joint ventures sold one land parcel and one operating property to third parties, in separate transactions, which were encumbered by loans aggregating
approximately $14.2 million. As a result of these transactions the loans were fully repaid and the Company was relieved of the corresponding debt guarantees on these two loans.
During 2012, the Company acquired the remaining 50% noncontrolling interest held by Ripco in a joint venture investment. As a result of this transaction, the Company now owns a 100% controlling interest and consolidates this investment.
As of December 31,
2011, one of these2012, the remaining joint
ventures heldventure has a
one-year$2.8 million loan
for approximately $3.0 millionpayable which is scheduled to mature in
20122013 and bears interest at rate of LIBOR plus
1.50%1.05%. This loan is jointly and severally guaranteed by the Company and the joint venture partner.
22.
20. Commitments and Contingencies: The Company and its subsidiaries are primarily engaged in the operation of shopping centers that are either owned or held under long-term leases that expire at various dates through 2095. The Company and its subsidiaries, in turn, lease premises in these centers to tenants pursuant to lease agreements which provide for terms ranging generally from 5 to 25 years and for annual minimum rentals plus incremental rents based on operating expense levels and tenants' sales volumes. Annual minimum rentals plus incremental rents based on operating expense levels comprised
approximately 97% of total revenues from rental property for each of the three years ended December 31,
2012, 2011
2010 and
2009.2010.
The future minimum revenues from rental property under the terms of all non-cancelable tenant leases, assuming no new or renegotiated leases are executed for such premises, for future years are
approximately as follows (in millions):
2012, $655.8; 2013,
$595.5;$676.0; 2014,
$517.0;$614.0; 2015,
$451.2;$545.4; 2016,
$374.7$465.4; 2017, $380.3 and thereafter;
$1,680.0.$1,815.1.
Base rental revenues from rental property are recognized on a straight-line basis over the terms of the related leases. The difference between the amount of rental income contracted through leases and rental income recognized on a straight-line basis for the years ended December 31,
2012, 2011
and 2010
and 2009 is
approximately$9.5 million, $9.8 million
and $12.0 million,
and $8.8 million, respectively.
Minimum rental payments under the terms of all non-cancelable operating leases pertaining to the Company’s shopping center portfolio for future years are
approximately as follows (in millions):
2012, $12.7; 2013,
$12.7;$12.6; 2014,
$12.3;$12.2; 2015,
$11.3;$11.1; 2016,
$10.5$10.3; 2017, $9.9 and thereafter,
$171.5.$172.6.
In October 2007, the Company formed a wholly-owned captive insurance company, Kimco Insurance Company, Inc., ("KIC"), which provides general liability insurance coverage for all losses below the deductible under our third-party policy. The Company entered into the Insurance Captive as part of its overall risk management program and to stabilize its insurance costs, manage exposure and recoup expenses through the functions of the captive program. The Company capitalized KIC in accordance with the applicable regulatory requirements. KIC established annual premiums based on projections derived from the past loss experience of the Company’s properties. KIC has engaged an independent third party to perform an actuarial estimate of future projected claims, related deductibles and projected expenses necessary to fund associated risk management programs. Premiums paid to KIC may be adjusted based on this estimate, like premiums paid to third-party insurance companies, premiums paid to KIC may be reimbursed by tenants pursuant to specific lease terms.
80
KIMCO REALTY CORPORATION AND SUBSIDIARIES
NOTES TO CONSOLIDATED FINANCIAL STATEMENTS, continued
On a select basis, the Company provides guarantees on interest bearing debt held within real estate joint ventures in which the Company has noncontrolling ownership interests. The Company is often provided with a back-stop guarantee from its partners. The Company had the following outstanding guarantees as of December 31,
20112012 (amounts in millions):
| | | | | | | | | | | | |
Name of Joint Venture | | Amount of Guarantee | | Interest rate | | Maturity, with extensions | | Terms | | Type of debt |
InTown Suites Management, Inc. | | $ 147.5 | | LIBOR | plus | 0.375% | (1) | 2012 | | 25% partner back-stop | | Unsecured credit facility |
Factoria Mall | | $ 51.8 | | LIBOR | plus | 4.00% | | 2012 | | Jointly and severally with partner | | Mortgage loan |
RioCan | | $ 4.7 | | Prime | plus | 2.25% | | 2012 | | Jointly with 50% partner | | Letter of credit facility |
Towson | | $ 10.0 | | LIBOR | plus | 3.50% | | 2014 | | Jointly and severally with partner | | Mortgage loan |
Hillsborough | | $ 3.0 | | LIBOR | plus | 1.50% | | 2012 | | Jointly and severally with partner | | Promissory note |
Victoriaville | | $4.6 | | Prime | plus | 0.50% | | 2012 | | Jointly and solidarily with partner | | Promissory note |
Westside | | $3.1 | | Prime | plus | 2.00% | | 2013 | | Full guarantee | | Promissory note |
Sequoia | | $ 6.0 | | LIBOR | plus | 0.75% | | 2012 | | Jointly and severally with partner | | Promissory note |
Name of Joint Venture | | Amount of Guarantee | | Interest rate | | Maturity, with extensions | | Terms | | Type of debt |
InTown Suites Management, Inc. (1) | | $ | 145.2 | | LIBOR | plus | 1.15% | | 2015 | | 25% partner back-stop | | Unsecured credit facility |
| Hillsborough | | $ | 2.8 | | LIBOR | plus | 1.05% | | 2013 | | Jointly and severally with partner | | Promissory note |
| Victoriaville | | $ | 5.1 | | | 3.92% | | | 2020 | | Jointly and severally with partner | | Promissory note |
(1)
The joint venture obtained an interest rate swap at 5.37% on $128.0During October 2012, a purchase and sale agreement was executed to sell the InTown Suites company and related real estate assets for a gross sales price of $735 million, including $617 million of
thisexisting debt. The
swapsale is
designated ascontingent upon satisfactorily completing a
cash flow hedgedue diligence process and
other closing conditions, including lender approvals. The Company expects to complete this transaction in the first half of 2013. If the transaction is
deemed highly effective; as such, adjustmentscompleted, the Company has agreed to
maintain $145.2 million in preexisting guarantees of outstanding debt to be assumed by the
swaps fair value are recorded at the joint venture level in other comprehensive income.buyer.
The Company evaluated these guarantees in connection with the provisions of the FASB’s Guarantees guidance and determined that the impact did not have a material effect on the Company’s financial position or results of operations.
The Company has issued letters of credit in connection with the completion and repayment guarantees for loans encumbering certain of the Company’s redevelopment projects and guaranty of payment related to the Company’s insurance program.
TheseAt December 31, 2012, these letters of credit
aggregate approximately $33.2aggregated $33.6 million.
In connection with the construction of its development
and redevelopment projects and related infrastructure, certain public agencies require posting of performance and surety bonds to guarantee that the Company’s obligations are satisfied. These bonds expire upon the completion of the improvements and infrastructure. As of December 31,
2011,2012, there were
approximately $22.8$20.7 million in performance and surety bonds outstanding.
On January 28, 2013, the Company received a subpoena from the Enforcement Division of the SEC in connection with an investigation, In the Matter of Wal-Mart Stores, Inc. (FW-3678), that the SEC Staff is currently conducting with respect to possible violations of the Foreign Corrupt Practices Act. The Company is responding to the subpoena and intends to cooperate fully with the SEC in this matter. The Company has also been notified that the U.S. Department of Justice (“DOJ”) is conducting a parallel investigation, and the Company expects that it will cooperate with the DOJ investigation. At this point, we are unable to predict the duration, scope or result of the SEC or DOJ investigation.
The Company is subject to various other legal proceedings and claims that arise in the ordinary course of business. Management believes that the final outcome of such matters will not have a material adverse effect on the financial position, results of operations or liquidity of the
Company.Company as of December 31, 2012.
The Company maintains two equity participation plans, the Second Amended and Restated 1998 Equity Participation Plan (the “Prior Plan”) and the 2010 Equity Participation Plan (the “2010 Plan”) (collectively, the “Plans”). The Prior Plan provides for a maximum of 47,000,000 shares of the Company’s common stock to be issued for qualified and non-qualified options and restricted stock grants. The 2010 Plan provides for a maximum of
5,000,00010,000,000 shares of the Company’s common stock to be issued for qualified and non-qualified options, restricted stock, performance awards and other awards, plus the number of shares of common stock which are or become available for issuance under the Prior Plan and which are not thereafter issued under the Prior Plan, subject to certain conditions. Unless otherwise determined by the Board of Directors at its sole discretion, options granted under the Plans generally vest ratably over a range of three to five years, expire ten years from the date of grant and are exercisable at the market price on the date of grant. Restricted stock grants generally vest (i) 100% on the fourth or fifth anniversary of the grant, (ii) ratably over three or four years,
or (iii) over three years at 50% after two years and 50% after the third
year or (iv) over ten years at 20% per year commencing after the fifth year. Performance share awards may provide a right to receive shares of restricted stock based on the Company’s performance relative to its peers, as defined, or based on other performance criteria as determined by the Board of Directors. In addition, the Plans provide for the granting of certain options and restricted stock to each of the Company’s non-employee directors (the “Independent Directors”) and permit such Independent Directors to elect to receive deferred stock awards in lieu of directors’ fees.
KIMCO REALTY CORPORATION AND SUBSIDIARIES
NOTES TO CONSOLIDATED FINANCIAL STATEMENTS, continued
The Company accounts for equity awards in accordance with FASB’s Compensation – Stock Compensation guidance which requires that all share based payments to employees, including grants of employee stock options, be recognized in the
statementStatement of
operationsIncome over the service period based on their fair values.
81
KIMCO REALTY CORPORATION AND SUBSIDIARIES
NOTES TO CONSOLIDATED FINANCIAL STATEMENTS, continued
The fair value of each option award is estimated on the date of grant using the Black-Scholes option pricing formula. The assumption for expected volatility has a significant effect on the grant date fair value. Volatility is determined based on the historical equity of common stock for the most recent historical period equal to the expected term of the options plus an implied volatility measure. The expected term is determined using the simplified method due to the lack of exercise and cancelation history for the current vesting terms. The more significant assumptions underlying the determination of fair values for options granted during
2012, 2011
2010 and
20092010 were as follows:
| | | | | | |
| | Year Ended December 31, |
| | 2011 | | 2010 | | 2009 |
Weighted average fair value of options granted | $ | 4.39 | $ | 3.82 | $ | 3.16 |
Weighted average risk-free interest rates | | 2.02% | | 2.40% | | 2.54% |
Weighted average expected option lives (in years) | | 6.25 | | 6.25 | | 6.25 |
Weighted average expected volatility | | 36.82% | | 37.98% | | 45.81% |
Weighted average expected dividend yield | | 3.98% | | 4.21% | | 5.48% |
| | | Year Ended December 31, | |
| | | 2012 | | | 2011 | | | 2010 | |
| Weighted average fair value of options granted | | $ | 4.52 | | | $ | 4.39 | | | $ | 3.82 | |
| Weighted average risk-free interest rates | | | 1.04 | % | | | 2.02 | % | | | 2.40 | % |
| Weighted average expected option lives (in years) | | | 6.25 | | | | 6.25 | | | | 6.25 | |
| Weighted average expected volatility | | | 37.53 | % | | | 36.82 | % | | | 37.98 | % |
| Weighted average expected dividend yield | | | 3.94 | % | | | 3.98 | % | | | 4.21 | % |
Information with respect to stock options under the Plan for the years ended December 31,
2012, 2011,
2010, and
20092010 are as follows:
| | | Shares | | | Weighted- Average Exercise Price Per Share | | | Aggregate Intrinsic Value (in millions) | |
| Options outstanding, January 1, 2010 | | | 17,560,921 | | | $ | 29.69 | | | $ | 3.4 | |
| Exercised | | | (616,245 | ) | | $ | 13.73 | | | | | |
| Granted | | | 1,776,175 | | | $ | 15.63 | | | | | |
| Forfeited | | | (1,605,062 | ) | | $ | 33.68 | | | | | |
| Options outstanding, December 31, 2010 | | | 17,115,789 | | | $ | 28.32 | | | $ | 18.0 | |
| Exercised | | | (444,368 | ) | | $ | 14.71 | | | | | |
| Granted | | | 1,888,017 | | | $ | 18.77 | | | | | |
| Expired | | | (655,748 | ) | | $ | 16.40 | | | | | |
| Forfeited | | | (793,098 | ) | | $ | 23.74 | | | | | |
| Options outstanding, December 31, 2011 | | | 17,110,592 | | | $ | 28.14 | | | $ | 8.0 | |
| Exercised | | | (1,495,432 | ) | | $ | 19.84 | | | | | |
| Granted | | | 1,522,450 | | | $ | 18.78 | | | | | |
| Forfeited | | | (579,613 | ) | | $ | 28.73 | | | | | |
| Options outstanding, December 31, 2012 | | | 16,557,997 | | | $ | 28.42 | | | $ | 14.9 | |
| Options exercisable (fully vested)- | | | | | | | | | | | | |
| December 31, 2010 | | | 11,712,900 | | | $ | 29.74 | | | $ | 5.8 | |
| December 31, 2011 | | | 12,459,598 | | | $ | 30.77 | | | $ | 3.9 | |
| December 31, 2012 | | | 12,830,255 | | | $ | 31.57 | | | $ | 7.7 | |
| | | | | |
| Shares | | Weighted-Average Exercise Price Per Share | | Aggregate Intrinsic value (in millions) |
Options outstanding, January 1, 2009 | 16,263,822 | $ | 31.58 | $ | 7.6 |
Exercised | (116,418) | $ | 12.79 | | |
Granted | 1,746,000 | $ | 11.58 | | |
Forfeited | (332,483) | $ | 33.57 | | |
Options outstanding, December 31, 2009 | 17,560,921 | $ | 29.69 | $ | 3.4 |
Exercised | (616,245) | $ | 13.73 | | |
Granted | 1,776,175 | $ | 15.63 | | |
Forfeited | (1,605,062) | $ | 33.68 | | |
Options outstanding, December 31, 2010 | 17,115,789 | $ | 28.32 | $ | 18.0 |
Exercised | (444,368) | $ | 14.71 | | |
Granted | 1,888,017 | $ | 18.77 | | |
Expired | (655,748) | $ | 16.40 | | |
Forfeited | (793,098) | $ | 23.74 | | |
Options outstanding, December 31, 2011 | 17,110,592 | $ | 28.14 | $ | 8.0 |
Options exercisable (fully vested)- | | | | | |
December 31, 2009 | 10,869,336 | $ | 28.36 | $ | 0.0 |
December 31, 2010 | 11,712,900 | $ | 29.74 | $ | 5.8 |
December 31, 2011 | 12,459,598 | $ | 30.77 | $ | 3.9 |
The exercise prices for options outstanding as of December 31,
2011,2012, range from $11.54 to $53.14 per share. The Company estimates forfeitures based on historical data. The weighted-average remaining contractual life for options outstanding as of December 31,
2011,2012, was
approximately 5.44.9 years. The weighted-average remaining contractual term of options currently exercisable as of December 31,
2011,2012, was
approximately 4.44.9 years. Options to purchase
8,871,495, 5,776,270
5,874,704 and
2,989,805,5,874,704, shares of the Company’s common stock were available for issuance under the Plan at December 31,
2012, 2011
2010 and
2009,2010, respectively. As of December 31,
2011,2012, the Company had
4,650,9943,727,742 options expected to vest, with a weighted-average exercise price per share of
$21.05$17.58 and an aggregate intrinsic value of
$4.2$7.2 million.
Cash received from options exercised under the Plan was approximately$22.6 million, $6.5 million $8.5 million and $1.5$8.5 million, for the years ended December 31, 2012, 2011 2010 and 2009,2010, respectively. The total intrinsic value of options exercised during 2012, 2011 and 2010 and 2009 was approximately$7.0 million, $1.5 million, and $2.1 million, respectively.
KIMCO REALTY CORPORATION AND SUBSIDIARIES
NOTES TO CONSOLIDATED FINANCIAL STATEMENTS, continued
As of December 31, 2012, 2011 and
$0.2 million,2010, the Company had restricted shares outstanding of 1,562,912, 832,726 and 526,728, respectively.
The Company recognized
expensesexpense associated with its equity awards of
approximately$17.9 million, $16.9 million
$14.2 million, and
$13.3$14.2 million, for the years ended December 31,
2012, 2011
2010 and
2009,2010, respectively. As of December 31,
2011,2012, the Company had
approximately $23.9$31.5 million of total unrecognized compensation cost related to unvested stock compensation granted under the
Company’s Plan.Plans. That cost is expected to be recognized over a
weighted-averageweighted average period of
approximately 1.53.8 years.
The Company, from time to time, repurchases shares of its common stock in amounts that offset new issuances of common shares in connection with the exercise of stock options or the issuance of restricted stock awards. These repurchases may occur in open market purchases, privately negotiated transactions or otherwise, subject to prevailing market conditions, the Company’s liquidity requirements, contractual restrictions and other factors. During 2012, the Company repurchased 1.6 million shares of the Company’s common stock for $30.9 million, of which $22.6 million was provided to the Company from options exercised. During 2011, the Company repurchased 333,998 shares of the Company’s common stock for $6.0 million, of which $4.9 million was provided to the Company from options exercised.
KIMCO REALTY CORPORATION AND SUBSIDIARIES
NOTES TO CONSOLIDATED FINANCIAL STATEMENTS, continued
The Company maintains a 401(k) retirement plan covering substantially all officers and employees, which permits participants to defer up to the maximum allowable amount determined by the Internal Revenue Service of their eligible compensation. This deferred compensation, together with Company matching contributions, which generally equal employee deferrals up to a maximum of 5% of their eligible compensation (capped at
$245,000)$250,000), is fully vested and funded as of December 31,
2011.2012. The Company’s contributions to the plan were
approximately$2.1 million, $1.9 million,
$2.1 million, and
$1.8$2.1 million for the years ended December 31,
2012, 2011
and 2010,
and 2009, respectively.
The Company recognized severance costs associated with employee terminations during the years ended December 31,
2012, 2011
and 2010
and 2009 of
approximately$5.4 million, $1.7 million
and $0.4 million,
and $3.6respectively. The 2012 expense includes $2.5 million
respectively.of severance costs related to the departure of an executive officer during January 2012.
The Company elected to qualify as a REIT in accordance with the Code commencing with its taxable year which began January 1, 1992. To qualify as a REIT, the Company must meet
a number ofseveral organizational and operational requirements, including a requirement that it currently distribute at least 90% of its adjusted REIT taxable income to its stockholders.
It is management’s intentionManagement intends to adhere to these requirements and maintain the Company’s REIT status. As a REIT, the Company generally will not be subject to corporate federal income tax, provided that distributions to its stockholders equal at least the amount of its REIT taxable
income as defined under the Code.income. If the Company
failsfailed to qualify as a REIT in any taxable year, it
willwould be subject to federal income taxes at regular corporate rates (including any applicable alternative minimum tax) and may not be
ablepermitted to
qualify as aelect REIT
status for four subsequent taxable years. Even if the Company qualifies for taxation as a REIT, the Company is subject to certain state and local taxes on its income and property, and federal income and excise taxes on its undistributed taxable income. In addition, taxable income from non-REIT activities managed through taxable REIT subsidiaries is subject to federal, state and local income taxes. The Company is also subject to local taxes on certain Non-U.S. investments.
Reconciliation between GAAP Net Income and Federal Taxable Income:
The following table reconciles GAAP net
income/(loss)income to taxable income for the years ended December 31,
2012, 2011
2010 and
20092010 (in thousands):
| | | | | | |
| | 2011 (Estimated) | | 2010 (Actual) | | 2009 (Actual) |
GAAP netincome/(loss) attributable to the Company | $ | 169,051 | $ | 142,868 | $ | (3,942) |
Less: GAAP net (income)/loss of taxable REIT subsidiaries | | (19,572) | | 13,920 | | 67,844 |
GAAP net income from REIT operations (a) | | 149,479 | | 156,788 | | 63,902 |
Net book depreciation in excess of tax depreciation | | 30,441 | | 13,568 | | 25,145 |
Deferred/prepaid/above and below market rents, net | | (18,648) | | (19,978) | | (21,863) |
Book/tax differences from non-qualified stock options | | 9,296 | | 9,103 | | 11,128 |
Book/tax differences from investments in real estate joint ventures | | 56,764 | | 69,581 | | 47,550 |
Book/tax difference on sale of property | | 12,315 | | (39,139) | | (18,666) |
Book adjustment to property carrying values and marketable equity securities | | 8,200 | | 19,065 | | 107,468 |
Taxable currency exchange gains, net | | 27,629 | | 13,134 | | 4,113 |
Book/tax differences on capitalized costs | | (7,483) | | (12,782) | | (6,030) |
Other book/tax differences, net | | (4,684) | | (6,064) | | 1,269 |
Adjusted REIT taxable income | $ | 263,309 | $ | 203,276 | $ | 214,016 |
| | | 2012 (Estimated) | | | 2011 (Actual) | | | 2010 (Actual) | |
GAAP net income attributable to the Company | | $ | 266,073 | | | $ | 169,051 | | | $ | 142,868 | |
| Less: GAAP net (income)/loss of taxable REIT subsidiaries | | | (5,249 | ) | | | (19,572 | ) | | | 13,920 | |
| GAAP net income from REIT operations (a) | | | 260,824 | | | | 149,479 | | | | 156,788 | |
| Net book depreciation in excess of tax depreciation | | | 32,517 | | | | 30,603 | | | | 13,568 | |
| Deferred/prepaid/above and below market rents, net | | | (17,643 | ) | | | (16,463 | ) | | | (19,978 | ) |
| Book/tax differences from non-qualified stock options | | | 1,653 | | | | 9,879 | | | | 9,103 | |
| Book/tax differences from investments in real estate joint ventures | | | 16,837 | | | | 52,564 | | | | 69,581 | |
| Book/tax difference on sale of property | | | (69,961 | ) | | | 1,811 | | | | (39,139 | ) |
| Book adjustment to property carrying values and marketable equity securities | | | 9,956 | | | | 8,721 | | | | 19,065 | |
| Taxable currency exchange (loss)/gain, net | | | (1,611 | ) | | | 6,502 | | | | 13,134 | |
| Book/tax differences on capitalized costs | | | 2,899 | | | | 3,228 | | | | (12,782 | ) |
| Dividends from taxable REIT subsidiaries | | | 1,000 | | | | 15,969 | | | | - | |
| Other book/tax differences, net | | | (845 | ) | | | 1,016 | | | | (6,064 | ) |
| Adjusted REIT taxable income | | $ | 235,626 | | | $ | 263,309 | | | $ | 203,276 | |
KIMCO REALTY CORPORATION AND SUBSIDIARIES
NOTES TO CONSOLIDATED FINANCIAL STATEMENTS, continued
Certain amounts in the prior periods have been reclassified to conform to the current year presentation, in the table above.
(a) All adjustments to "GAAP net income/(loss) from REIT operations" are net of amounts attributable to noncontrolling interest and taxable REIT subsidiaries.
| (a) | All adjustments to "GAAP net income from REIT operations" are net of amounts attributable to noncontrolling interest and taxable REIT subsidiaries. |
Cash Dividends Paid and Dividends Paid Deductions (in thousands):
For the years ended December 31,
2012, 2011
2010 and
20092010 cash dividends paid exceeded the dividends paid deduction and amounted to
$382,722, $353,764,
and $306,964,
and $331,024, respectively.
83
KIMCO REALTY CORPORATION AND SUBSIDIARIES
NOTES TO CONSOLIDATED FINANCIAL STATEMENTS, continued
Characterization of Distributions:
The following characterizes distributions paid for the years ended December 31,
2012, 2011
2010 and
2009,2010, (in thousands):
| | | | | | | | | | | | |
| | 2011 | | | | 2010 | | | | 2009 | | |
Preferred F Dividends | | | | | | | | | | | | |
Ordinary income | $ | 11,638 | | 100% | $ | 11,638 | | 100% | $ | 11,638 | | 100% |
| | | | | | | | | | | | |
Preferred G Dividends | | | | | | | | | | | | |
Ordinary income | $ | 35,650 | | 100% | $ | 35,650 | | 100% | $ | 35,650 | | 100% |
| | | | | | | | | | | | |
Preferred H Dividends | | | | | | | | | | | | |
Ordinary income | $ | 13,584 | | 100% | $ | - | | -% | $ | - | | -% |
| | | | | | | | | | | | |
Common Dividends | | | | | | | | | | | | |
Ordinary income | $ | 208,832 | | 71% | $ | 181,773 | | 70% | $ | 204,291 | | 72% |
Return of capital | | 84,060 | | 29% | | 77,903 | | 30% | | 79,445 | | 28% |
| $ | 292,892 | | 100% | $ | 259,676 | | 100% | $ | 283,736 | | 100% |
Total dividends distributed | $ | 353,764 | | | $ | 306,964 | | | $ | 331,024 | | |
| | | 2012 | | | | | | 2011 | | | | | | 2010 | | | | |
| Preferred F Dividends | | | | | | | | | | | | | | | | | | |
| Ordinary income | | $ | 9,116 | | | | 94 | % | | $ | 11,638 | | | | 100 | % | | $ | 11,638 | | | | 100 | % |
| Capital gain | | | 582 | | | | 6 | % | | | - | | | | - | % | | | - | | | | - | % |
| | | $ | 9,698 | | | | 100 | % | | $ | 11,638 | | | | 100 | % | | $ | 11,638 | | | | 100 | % |
| Preferred G Dividends | | | | | | | | | | | | | | | | | | | | | | | | |
| Ordinary income | | $ | 33,046 | | | | 94 | % | | $ | 35,650 | | | | 100 | % | | $ | 35,650 | | | | 100 | % |
| Capital gain | | | 2,109 | | | | 6 | % | | | - | | | | - | % | | | - | | | | - | % |
| | | $ | 35,155 | | | | 100 | % | | $ | 35,650 | | | | 100 | % | | $ | 35,650 | | | | 100 | % |
| Preferred H Dividends | | | | | | | | | | | | | | | | | | | | | | | | |
| Ordinary income | | $ | 11,351 | | | | 94 | % | | $ | 13,584 | | | | 100 | % | | $ | - | | | | - | % |
| Capital gain | | | 725 | | | | 6 | % | | | - | | | | - | % | | | - | | | | - | % |
| | | $ | 12,076 | | | | 100 | % | | $ | 13,584 | | | | 100 | % | | $ | - | | | | - | % |
| Preferred I Dividends | | | | | | | | | | | | | | | | | | | | | | | | |
| Ordinary income | | $ | 12,847 | | | | 94 | % | | $ | - | | | | - | % | | $ | - | | | | - | % |
| Capital gain | | | 820 | | | | 6 | % | | | - | | | | - | % | | | - | | | | - | % |
| | | $ | 13,667 | | | | 100 | % | | $ | - | | | | - | % | | $ | - | | | | - | % |
| Preferred J Dividends | | | | | | | | | | | | | | | | | | | | | | | | |
| Ordinary income | | $ | 2,585 | | | | 94 | % | | $ | - | | | | - | % | | $ | - | | | | - | % |
| Capital gain | | | 165 | | | | 6 | % | | | - | | | | - | % | | | - | | | | - | % |
| | | $ | 2,750 | | | | 100 | % | | $ | - | | | | - | % | | $ | - | | | | - | % |
| Common Dividends | | | | | | | | | | | | | | | | | | | | | | | | |
| Ordinary income | | $ | 222,751 | | | | 72 | % | | $ | 208,832 | | | | 71 | % | | $ | 181,773 | | | | 70 | % |
| Capital Gain | | | 15,469 | | | | 5 | % | | | - | | | | - | % | | | - | | | | - | % |
| Return of capital | | | 71,156 | | | | 23 | % | | | 84,060 | | | | 29 | % | | | 77,903 | | | | 30 | % |
| | | $ | 309,376 | | | | 100 | % | | $ | 292,892 | | | | 100 | % | | $ | 259,676 | | | | 100 | % |
| Total dividends distributed | | $ | 382,722 | | | | | | | $ | 353,764 | | | | | | | $ | 306,964 | | | | | |
KIMCO REALTY CORPORATION AND SUBSIDIARIES
NOTES TO CONSOLIDATED FINANCIAL STATEMENTS, continued
Taxable REIT Subsidiaries and Taxable Entities:
The Company is subject to federal, state and local income taxes on income earned from activities
inconducted through taxable REIT subsidiaries (“TRS”). TRS activities include Kimco Realty Services ("KRS"), a wholly-owned subsidiary of the Company and its subsidiaries, and the consolidated entities of FNC Corporation (“FNC”), and Blue Ridge Real Estate Company/Big Boulder Corporation. The Company is also subject to taxes on its activities in Canada, Mexico, Brazil, Chile, and Peru. Dividends paid to the Company from its subsidiaries and joint ventures in Canada, Mexico and Brazil are generally not subject to withholding taxes under the applicable tax treaty with the United States. Chile and Peru impose a 10% and 4.1% withholding tax, respectively, on dividend distributions. Brazil levies a 0.38% transaction tax on return of capital distributions. During
2011,2012, less than $0.1 million of withholding and transaction taxes were withheld from distributions related to foreign activities.
Income taxes have been provided for on the asset and liability method as required by the FASB’s Income Tax guidance. Under the asset and liability method, deferred income taxes are recognized for the temporary differences between the financial reporting basis and the tax basis of taxable assets and liabilities.
The Company’s pre-tax book
incomeincome/(loss) and
provision(provision)/benefit for income taxes relating to the Company’s TRS and taxable entities which have been consolidated for accounting reporting purposes, for the years ended December 31,
2012, 2011,
2010, and
2009,2010, are summarized as follows (in thousands):
| | | | | | |
| | 2011 | | 2010 | | 2009 |
Income/(loss) before income taxes – U.S. | $ | 36,077 | $ | (23,658) | $ | (104,231) |
(Provision)/benefit for income taxes, net: | | | | | | |
Federal : | | | | | | |
Current | | (2,463) | | 1,482 | | 24,225 |
Deferred | | (10,635) | | 7,136 | | 11,029 |
Federal tax (provision)/benefit | | (13,098) | | 8,618 | | 35,254 |
State and local: | | | | | | |
Current | | (1,343) | | (265) | | (1,007) |
Deferred | | (2,064) | | 1,385 | | 2,140 |
State tax (provision)/benefit | | (3,407) | | 1,120 | | 1,133 |
Total tax (provision)/benefit – U.S. | | (16,505) | | 9,738 | | 36,387 |
Net income/(loss) from U.S. taxable REIT subsidiaries | $ | 19,572 | $ | (13,920) | $ | (67,844) |
| | | | | | |
Income before taxes – Non-U.S. | $ | 63,154 | $ | 102,426 | $ | 106,269 |
(Provision)/benefit for Non-U.S. income taxes: | | | | | | |
Current | $ | (4,484) | $ | (13,671) | $ | (6,380) |
Deferred | | 2,784 | | 430 | | (95) |
Non-U.S. tax provision | $ | (1,700) | $ | (13,241) | $ | (6,475) |
| | | 2012 | | | 2011 | | | 2010 | |
| Income/(loss) before income taxes – U.S. | | $ | 8,389 | | | $ | 36,077 | | | $ | (23,658 | ) |
| (Provision)/benefit for income taxes, net: | | | | | | | | | | | | |
| Federal : | | | | | | | | | | | | |
| Current | | | (503 | ) | | | (2,463 | ) | | | 1,482 | |
| Deferred | | | (535 | ) | | | (10,635 | ) | | | 7,136 | |
| Federal tax (provision)/benefit | | | (1,038 | ) | | | (13,098 | ) | | | 8,618 | |
| State and local: | | | | | | | | | | | | |
| Current | | | (1,543 | ) | | | (1,343 | ) | | | (265 | ) |
| Deferred | | | (560 | ) | | | (2,064 | ) | | | 1,385 | |
| State tax (provision)/benefit | | | (2,103 | ) | | | (3,407 | ) | | | 1,120 | |
| Total tax (provision)/benefit – U.S. | | | (3,141 | ) | | | (16,505 | ) | | | 9,738 | |
| Net income/(loss) from U.S. taxable REIT subsidiaries | | $ | 5,248 | | | $ | 19,572 | | | $ | (13,920 | ) |
| | | | | | | | | | | | | |
| Income before taxes – Non-U.S. | | $ | 33,842 | | | $ | 63,154 | | | $ | 102,426 | |
| (Provision)/benefit for Non-U.S. income taxes: | | | | | | | | | | | | |
| Current | | $ | 5,790 | | | $ | (4,484 | ) | | $ | (13,671 | ) |
| Deferred | | | 1,239 | | | | 2,784 | | | | 430 | |
| Non-U.S. tax provision | | $ | 7,029 | | | $ | (1,700 | ) | | $ | (13,241 | ) |
84
KIMCO REALTY CORPORATION AND SUBSIDIARIES
NOTES TO CONSOLIDATED FINANCIAL STATEMENTS, continued
The Company’s deferred tax assets and liabilities at December 31,
20112012 and
2010,2011, were as follows (in thousands):
| | | | |
| | 2011 | | 2010 |
Deferred tax assets: | | | | |
Tax/GAAP basis differences | $ | 66,177 | $ | 80,539 |
Net operating losses | | 47,719 | | 43,700 |
Related party deferred loss | | 7,577 | | 7,275 |
Tax credit carryforwards | | 3,537 | | 5,240 |
Capital loss carryforwards | | 364 | | - |
Non-U.S. tax/GAAP basis differences | | 63,610 | | 35,188 |
Valuation allowance – U.S. | | (33,783) | | (33,783) |
Valuation allowance – Non-U.S. | | (32,737) | | (9,813) |
Total deferred tax assets | | 122,464 | | 128,346 |
Deferred tax liabilities – U.S. | | (11,434) | | (10,108) |
Deferred tax liabilities – Non-U.S. | | (16,085) | | (15,619) |
Net deferred tax assets | $ | 94,945 | $ | 102,619 |
| | | 2012 | | | 2011 | |
| Deferred tax assets: | | | | | | |
| Tax/GAAP basis differences | | $ | 68,623 | | | $ | 66,177 | |
| Net operating losses | | | 43,483 | | | | 47,719 | |
| Related party deferred loss | | | 6,214 | | | | 7,577 | |
| Tax credit carryforwards | | | 3,815 | | | | 3,537 | |
| Capital loss carryforwards | | | 647 | | | | 364 | |
| Charitable contribution carryforward | | | 3 | | | | - | |
| Non-U.S. tax/GAAP basis differences | | | 62,548 | | | | 63,610 | |
| Valuation allowance – U.S. | | | (33,783 | ) | | | (33,783 | ) |
| Valuation allowance – Non-U.S. | | | (38,129 | ) | | | (32,737 | ) |
| Total deferred tax assets | | | 113,421 | | | | 122,464 | |
| Deferred tax liabilities – U.S. | | | (9,933 | ) | | | (11,434 | ) |
| Deferred tax liabilities – Non-U.S. | | | (13,263 | ) | | | (16,085 | ) |
| Net deferred tax assets | | $ | 90,225 | | | $ | 94,945 | |
KIMCO REALTY CORPORATION AND SUBSIDIARIES
NOTES TO CONSOLIDATED FINANCIAL STATEMENTS, continued
As of December 31,
2011,2012, the Company had net deferred tax assets of
approximately $94.9$90.2 million comprised of (i)
$54.8$58.7 million relating to the difference between the basis of accounting for federal and state income tax reporting and GAAP reporting for real estate assets, joint ventures, and other investments, net of
$11.4$9.9 million of deferred tax liabilities, (ii)
$6.3$4.0 million and
$7.6$5.7 million for the tax effect of net operating loss carryovers within KRS and FNC, respectively, net of a valuation allowance within FNC of $33.8 million, (iii)
$7.6$6.2 million for losses deferred for federal and state income tax purposes for transactions with related parties, (iv)
$3.5$3.8 million for tax credit carryovers, (v)
$0.3$0.6 million for capital loss carryovers, and (vi)
$14.8$11.2 million of deferred tax assets related to its investments in Canada and Latin America, net of a valuation allowance of
$32.7$38.1 million and deferred tax liabilities of
$16.1$13.3 million. General business tax credit carryovers of $2.2 million within KRS expire during taxable years from 2027 through
2030,2031, and alternative minimum tax credit carryovers of
$1.3$1.6 million do not expire.
The major differences between GAAP basis of accounting and the basis of accounting used for federal and state income tax reporting consist of impairment charges recorded for GAAP, but not recognized for tax purposes, depreciation and amortization, rental revenue recognized on the straight line method for GAAP, reserves for doubtful accounts, and the period in which certain gains were recognized for tax purposes, but not yet recognized under GAAP. The Company had foreign net deferred tax assets of
$14.8$11.2 million, related to its operations in Canada and Latin America, which consists primarily of differences between the GAAP book basis and the basis of accounting applicable to the jurisdictions in which the Company is subject to tax.
Deferred tax assets and deferred tax liabilities are included in the caption Other assets and Other liabilities on the accompanying Consolidated Balance Sheets at December 31,
20112012 and
2010.2011. Operating losses and the valuation allowance are related primarily to the Company’s consolidation of its taxable REIT subsidiaries for accounting and reporting purposes. For the
yearsyear ended December 31, 2011,
KRS generated $12.5 million, of net operating loss carryovers that expire 2031. For the year ended December 31, 2012, KRS produced $12.1 million of taxable income and
2010, KRS incurred approximately $6.3utilized $12.1 million of its $22.1 million net operating loss carryovers. At December 31, 2012 and 2011, FNC had $101.3 million and
$9.6$106.2 million, respectively, of net operating loss carryovers that expire from
20302021 through
2031. At December 31, 2011 and 2010, FNC had approximately $106.2 million and $111.8 million, respectively, of net operating loss carryovers that expire from 2020 through 2025.2026.
The Company maintained a valuation allowance of $33.8 million within FNC to reduce the deferred tax asset of
$41.4$39.5 million related to net operating loss carryovers to the amount the Company determined is more likely than not realizable. The Company analyzed projected taxable income and the expected utilization of FNC’s remaining net operating loss carryovers and determined a partial valuation allowance was appropriate.
The Company’s investments in Latin America are made through individual entities which are subject to local taxes. The Company assesses each entity to determine if deferred tax assets are more likely than not realizable. This assessment primarily includes an analysis of cumulative earnings and the determination of future earnings to the extent necessary to fully realize the individual deferred tax asset. Based on this analysis the Company has determined that a full valuation allowance is required for entities which have a three-year cumulative book loss and for which future earnings are not readily determinable. In addition, the Company has determined that no valuation allowance is needed for entities that have three-years of cumulative book income and future earnings are anticipated to be sufficient to more likely than not realize their deferred tax assets. At December 31,
2011,2012, the Company had total deferred tax assets of
$39.0$43.8 million relating to its Latin American investments with an aggregate valuation allowance of
$32.7$38.1 million.
85
KIMCO REALTY CORPORATION AND SUBSIDIARIES
NOTES TO CONSOLIDATED FINANCIAL STATEMENTS, continued
The Company’s deferred tax assets in Canada result principally from depreciation deducted under
generally accepted accounting principlesGAAP that exceed capital cost allowances claimed under Canadian tax rules. The deferred tax asset will naturally reverse upon disposition as tax basis will be greater than the basis of the assets under generally accepted accounting principles.
As of December 31,
2011,2012, the Company determined that no valuation allowance was needed against a
$71.1$70.2 million net deferred tax asset within KRS. The Company based its determination on an analysis of both positive evidence
which included future projected income for KRS and negative evidence
which consistedusing its judgment as to the relative weight of
a three year cumulative pre-tax book loss for KRS. The cumulative loss was primarily the result of significant impairment charges taken by KRS during 2009. The analysis showed that KRS will more likely than not realize its net deferred tax asset of $71.1 million. If future income projections do not occur as forecasted, or if KRS incurs additional significant impairment losses and does not have sufficient future earnings, the Company will reevaluate the need for a valuation allowance.
each. The Company believes, when evaluating KRS’s deferred tax assets, special consideration should be given to the unique relationship between the Company as a REIT and KRS as a taxable REIT subsidiary. This relationship exists primarily to protect the REIT’s qualification under the Code by permitting, within certain limits, the REIT to engage in certain business activities in which the REIT cannot directly participate. As such, the REIT controls which and when investments are held in, or distributed or sold from, KRS. This relationship distinguishes a REIT and taxable REIT subsidiary from an enterprise that operates as a single, consolidated corporate taxpayer. The Company will continue through this structure to operate certain business activities in KRS. KRS has a strong earnings history exclusive
KIMCO REALTY CORPORATION AND SUBSIDIARIES
NOTES TO CONSOLIDATED FINANCIAL STATEMENTS, continued
The Company’s analysis of
the impairment charges. Since 2001, KRS has produced taxable income in each year through 2008. Over the three year period priorKRS’s ability to
utilize its
firstdeferred tax
loss year (2009), KRS generated approximately $59.4 millionassets includes an estimate of
taxable income cumulatively, before net operating loss carryovers. KRS estimates that it will report net operating loss for its 2011 taxable year from recognizing deductible temporary differences against KRS’s pre-tax GAAP bookfuture projected income.
KRS’s activities historically consisted of a merchant building business for the ground-up development of shopping center properties and subsequent sale upon completion. KRS also made investments which included redevelopment properties and joint venture investments such as KRS’s investment in the Albertson’s joint venture. During 2009, the Company changed its merchant building strategy from a sale upon completion strategy to a long-term hold strategy for its remaining merchant building projects. In addition, KRS still holds its interest in the Albertson’s joint venture.
With the Company’s change in its merchant building strategy, future business operations at KRS do not support the previous capital structure. To that extent, the Company recapitalized and KRS paid down approximately $56.4 million of intercompany loans during 2011. As of December 31, 2011, KRS’s intercompany payable was approximately $138.6 million. KRS committed to maintain this reduced leverage at its current level.
To determine future projected income, the Company scheduled KRS’s pre-tax book income and taxable income over a twenty year period taking into account its continuing operations (“Core Earnings”). Core Earnings consist of estimated net operating income for properties currently in service and generating rental income. Major lease turnover is not expected in these properties as these properties were generally constructed and leased within the past fourfive years. To allow the forecast to remain objective and verifiable, no income growth was forecasted for any other aspect of KRS’s continuing business activities including its investment in the Albertson’s joint venture. The Company also included known future events in its projected income forecast, such as the maturity of certain mortgages and construction loans, reduced levels of intercompany debt, and any future property management income, each of which will increase future book and taxable income.forecast. In addition, the Company can employ additional strategies to realize KRS’s deferred tax assets including transferring its property management business, sale of certain built-in gain assets, and further reducing intercompany debt.
The Company’s projection of KRS’s future taxable income over twenty years, utilizing the assumptions above with respect to Core Earnings, net of related expenses, generates
approximately $158.0$315.2 million after the reversal of
approximately $137.2$87.4 million of deductible temporary differences. Based on this analysis, the Company concluded it is more likely than not that KRS’s net deferred tax asset of
$71.1$70.2 million will be realized and therefore, no valuation allowance is needed at December 31,
2011.2012. If future income projections do not occur as forecasted or the Company incurs additional impairment losses in excess of the amount Core Earnings can absorb, the Company will
reevaluatereconsider the need for a valuation allowance.
86
KIMCO REALTY CORPORATION AND SUBSIDIARIES
NOTES TO CONSOLIDATED FINANCIAL STATEMENTS, continued
(Benefit)/provision differ from the amount computed by applying the statutory federal income tax rate to taxable income before income taxes were as follows (in thousands):
| | | | | | |
| | 2011 | | 2010 | | 2009 |
Federal benefit at statutory tax rate (35%) | $ | 12,627 | $ | (8,280) | $ | (36,481) |
State and local taxes, net of federal benefit | | 1,683 | | (728) | | (6,775) |
Other | | 2,195 | | (730) | | 6,869 |
Total tax provision/(benefit) – U.S. | $ | 16,505 | $ | (9,738) | $ | (36,387) |
| | | 2012 | | | 2011 | | | 2010 | |
| Federal benefit at statutory tax rate (35%) | | $ | 2,936 | | | $ | 12,627 | | | $ | (8,280 | ) |
| State and local taxes, net of federal benefit | | | 230 | | | | 1,683 | | | | (728 | ) |
| Other | | | (25 | ) | | | 2,195 | | | | (730 | ) |
| Total tax provision/(benefit) – U.S. | | $ | 3,141 | | | $ | 16,505 | | | $ | (9,738 | ) |
The Company is subject to income tax in certain jurisdictions outside the U.S., principally Canada and Mexico. The statute of limitations on assessment of tax varies from three to seven years depending on the jurisdiction and tax issue. Tax returns filed in each jurisdiction are subject to examination by local tax authorities. The Company is currently under audit by the Canadian Revenue Agency, Mexican Tax Authority and the U.S. Internal Revenue Service (“IRS”). In October 2011, the IRS issued a notice of proposed adjustment, which proposes pursuant to Section 482 of the Code, to disallow a capital loss claimed by KRS on the disposition of common shares of Valad Property Ltd., an Australian publicly listed company. Because the adjustment is being made pursuant to Section 482 of the Code, the IRS may assert a 100 percent “penalty” tax pursuant to Section 857(b)(7) of the Code in lieu of disallowing the capital loss deduction. The notice of proposed adjustment indicates the IRS’ intention to impose the 100 percent penalty tax on the Company in the amount of
approximately $40.9 million and disallowing the capital loss claimed by KRS. The Company strongly disagrees with the IRS’ position on the application of Section 482 of the Code to the disposition of the shares, the imposition of the 100 percent penalty tax and the simultaneous assertion of the penalty tax and disallowance of the capital loss
deduction. Upon receiptdeduction.The Company received a Notice of
a notice of proposed assessment the Company will have thirty days to fileProposed Assessment and filed a written protest and
requestrequested an IRS Appeals Office conference, which
the Company fully intendshas yet to
file.be scheduled. The Company intends to vigorously defend its position in this matter and believes it will prevail.
Resolutions of these audits are not expected to have a material effect on the Company’s financial statements. The Company does not believe that the total amount of unrecognized tax benefits will significantly increase or decrease within the next 12 months.
The liability for uncertain tax benefits principally consists of estimated foreign, federal and state income tax liabilities for the years ended December 31,
20112012 and
2010. Also included in the year ended 2010 was accrued interest and penalties of less than $0.1 million.2011. The aggregate changes in the balance of unrecognized tax benefits were as follows (in thousands):
| | | | |
| | 2011 | | 2010 |
Balance, beginning of year | $ | 14,908 | $ | 13,090 |
Increases for tax positions related to current year | | 1,993 | | 2,638 |
Decrease for audit settlements | | - | | (93) |
Reductions due to lapsed statute of limitations | | - | | (727) |
Balance, end of year | $ | 16,901 | $ | 14,908 |
KIMCO REALTY CORPORATION AND SUBSIDIARIES
NOTES TO CONSOLIDATED FINANCIAL STATEMENTS, continued
| | | 2012 | | | 2011 | |
| Balance, beginning of year | | $ | 16,901 | | | $ | 14,908 | |
| Increases for tax positions related to current year | | | 3,079 | | | | 1,993 | |
| Reductions due to lapsed statute of limitations | | | (3,090 | ) | | | - | |
| Balance, end of year | | $ | 16,890 | | | $ | 16,901 | |
23. Supplemental Financial Information: The following represents the results of
operations,income, expressed in thousands except per share amounts, for each quarter during the years
20112012 and
2010:2011:
| | | 2012 (Unaudited) | |
| | | Mar. 31 | | | June 30 | | | Sept. 30 | | | Dec. 31 | |
| Revenues from rental property(1) | | $ | 214,851 | | | $ | 220,670 | | | $ | 220,188 | | | $ | 229,073 | |
| Net income attributable to the Company | | $ | 53,638 | | | $ | 69,112 | | | $ | 54,941 | | | $ | 88,382 | |
| | | | | | | | | | | | | | | | | |
| Net income per common share: | | | | | | | | | | | | | | | | |
| Basic | | $ | 0.09 | | | $ | 0.12 | | | $ | 0.07 | | | $ | 0.14 | |
| Diluted | | $ | 0.09 | | | $ | 0.12 | | | $ | 0.07 | | | $ | 0.14 | |
| | | | | | | | |
| | 2011 (Unaudited) |
| | Mar. 31 | | June 30 | | Sept. 30 | | Dec. 31 |
Revenues from rental property(1) | $ | 219,253 | $ | 216,989 | $ | 214,489 | $ | 222,963 |
| | | | | | | | |
Net income attributable to the Company | $ | 28,963 | $ | 38,709 | $ | 54,981 | $ | 46,398 |
| | | | | | | | |
Net income per common share: | | | | | | | | |
Basic | $ | 0.03 | $ | 0.06 | $ | 0.10 | $ | 0.08 |
Diluted | $ | 0.03 | $ | 0.06 | $ | 0.10 | $ | 0.08 |
| | | 2011 (Unaudited) | |
| | | Mar. 31 | | | June 30 | | | Sept. 30 | | | Dec. 31 | |
| Revenues from rental property(1) | | $ | 206,156 | | | $ | 206,034 | | | $ | 201,082 | | | $ | 212,465 | |
| Net income attributable to the Company | | $ | 28,963 | | | $ | 38,709 | | | $ | 54,981 | | | $ | 46,398 | |
| | | | | | | | | | | | | | | | | |
| Net income per common share: | | | | | | | | | | | | | | | | |
| Basic | | $ | 0.03 | | | $ | 0.06 | | | $ | 0.10 | | | $ | 0.08 | |
| Diluted | | $ | 0.03 | | | $ | 0.06 | | | $ | 0.10 | | | $ | 0.08 | |
87
KIMCO REALTY CORPORATION AND SUBSIDIARIES
NOTES TO CONSOLIDATED FINANCIAL STATEMENTS, continued
| | | | | | | | |
| | 2010 (Unaudited) |
| | Mar. 31 | | June 30 | | Sept. 30 | | Dec. 31 |
Revenues from rental property(1) | $ | 209,166 | $ | 206,062 | $ | 205,394 | $ | 210,585 |
| | | | | | | | |
Net income attributable to the Company | $ | 50,836 | $ | 24,611 | $ | 30,333 | $ | 37,088 |
| | | | | | | | |
Net income per common share: | | | | | | | | |
Basic | $ | 0.10 | $ | 0.03 | $ | 0.04 | $ | 0.05 |
Diluted | $ | 0.10 | $ | 0.03 | $ | 0.04 | $ | 0.05 |
(1) All periods have been adjusted to reflect the impact of operating properties sold during
20112012 and
20102011 and properties classified as held-for-sale as of December 31,
2011,2012, which are reflected in the caption Discontinued operations on the accompanying Consolidated Statements of
Operations.Income.
Accounts and notes receivable in the accompanying Consolidated Balance Sheets are net of estimated unrecoverable amounts of approximately $18.1$16.4 million and $15.7$18.1 million of billed accounts receivable and $0.5 million and $4.9 million for accrued unbilled common area maintenance and real estate recoveries at December 31, 2012 and 2011, respectively. Additionally, Accounts and 2010,notes receivable in the accompanying Consolidated Balance Sheets are net of estimated unrecoverable amounts of $22.8 million and $25.4 million of straight-line rent receivable at December 31, 2012 and 2011, respectively. 24. Pro Forma Financial Information (Unaudited): As discussed in Notes 5, 6 and 7, the Company and certain of its subsidiaries acquired and disposed of interests in certain operating properties during
2011.2012. The pro forma financial information set forth below is based upon the Company's historical Consolidated Statements of
OperationsIncome for the years ended December 31,
20112012 and
2010,2011, adjusted to give effect to these transactions at the beginning of
2010.2011.
The pro forma financial information is presented for informational purposes only and may not be indicative of what actual results of
operationsIncome would have been had the transactions occurred at the beginning of
2010,2011, nor does it purport to represent the results of
operationsIncome for future periods. (Amounts presented in millions, except per share figures.)
| | | | |
| | Year ended December 31, |
| | 2011 | | 2010 |
Revenues from rental property | $ | 897.5 | $ | 867.7 |
Net income | $ | 184.0 | $ | 145.6 |
Net income attributable to the Company’s common shareholders | $ | 111.6 | $ | 80.5 |
| | | | |
Net income attributable to the Company’s common shareholders per common share: | | | | |
Basic | $ | 0.27 | $ | 0.20 |
Diluted | $ | 0.27 | $ | 0.20 |
88
KIMCO REALTY CORPORATION AND SUBSIDIARIES
NOTES TO CONSOLIDATED FINANCIAL STATEMENTS, continued
| | | Year ended December 31, | |
| | | 2012 | | | 2011 | |
| Revenues from rental property | | $ | 903.2 | | | $ | 867.5 | |
| Net income | | $ | 228.5 | | | $ | 174.7 | |
| Net income attributable to the Company’s common shareholders | | $ | 120.9 | | | $ | 102.3 | |
| | | | | | | | | |
| Net income attributable to the Company’s common shareholders per common share: | | | | | | | | |
| Basic | | $ | 0.30 | | | $ | 0.25 | |
| Diluted | | $ | 0.30 | | | $ | 0.25 | |
KIMCO REALTY CORPORATION AND SUBSIDIARIES
SCHEDULE II – VALUATION AND QUALIFYING ACCOUNTS
For Years Ended December 31,
2012, 2011
2010 and
20092010
(in thousands)
| | | | | | | | | | |
| | Balance at beginning of period | | Charged to expenses | | Adjustments to valuation accounts | | Deductions | | Balance at end of period |
Year Ended December 31, 2011 | | | | | | | | | | |
Allowance for uncollectable accounts | $ | 15,712 | $ | 7,027 | $ | - | $ | (4,680) | $ | 18,059 |
| | | | | | | | | | |
Allowance for deferred tax asset | $ | 43,596 | $ | - | $ | 22,924 | $ | - | $ | 66,520 |
| | | | | | | | | | |
Year Ended December 31, 2010 | | | | | | | | | | |
Allowance for uncollectable accounts | $ | 12,200 | $ | 10,043 | $ | - | $ | (6,531) | $ | 15,712 |
| | | | | | | | | | |
Allowance for deferred tax asset | $ | 33,783 | $ | - | $ | 9,813 | $ | - | $ | 43,596 |
| | | | | | | | | | |
Year Ended December 31, 2009 | | | | | | | | | | |
Allowance for uncollectable accounts | $ | 9,000 | $ | 4,579 | $ | - | $ | (1,379) | $ | 12,200 |
| | | | | | | | | | |
Allowance for deferred tax asset | $ | 33,783 | $ | 34,800 | $ | (34,800) | $ | - | $ | 33,783 |
89
| | | Balance at beginning of period | | | Charged to expenses | | | Adjustments to valuation accounts | | | Deductions | | | Balance at end of period | |
| Year Ended December 31, 2012 | | | | | | | | | | | | | | | |
| Allowance for uncollectable accounts | | $ | 18,059 | | | $ | 6,309 | | | $ | - | | | $ | (7,966 | ) | | $ | 16,402 | |
| | | | | | | | | | | | | | | | | | | | | |
| Allowance for deferred tax asset | | $ | 66,520 | | | $ | - | | | $ | 5,392 | | | $ | - | | | $ | 71,912 | |
| | | | | | | | | | | | | | | | | | | | | |
| Year Ended December 31, 2011 | | | | | | | | | | | | | | | | | | | | |
| Allowance for uncollectable accounts | | $ | 15,712 | | | $ | 7,027 | | | $ | - | | | $ | (4,680 | ) | | $ | 18,059 | |
| | | | | | | | | | | | | | | | | | | | | |
| Allowance for deferred tax asset | | $ | 43,596 | | | $ | - | | | $ | 22,924 | | | $ | - | | | $ | 66,520 | |
| | | | | | | | | | | | | | | | | | | | | |
| Year Ended December 31, 2010 | | | | | | | | | | | | | | | | | | | | |
| Allowance for uncollectable accounts | | $ | 12,200 | | | $ | 10,043 | | | $ | - | | | $ | (6,531 | ) | | $ | 15,712 | |
| | | | | | | | | | | | | | | | | | | | | |
| Allowance for deferred tax asset | | $ | 33,783 | | | $ | - | | | $ | 9,813 | | | $ | - | | | $ | 43,596 | |
KIMCO REALTY CORPORATION AND SUBSIDIARIES
SCHEDULE III - REAL ESTATE AND ACCUMULATED DEPRECIATION | | | INITIAL COST | | SUBSEQUENT | | | | | | | | | | TOTAL COST, NET OF | | | | | | | |
| | | | | BUILDING & | | TO | | | | BUILDING & | | | | ACCUMULATED | | ACCUMULATED | | | | DATE OF | | DATE OF | |
| PROPERTIES | | LAND | | IMPROVEMENT | | ACQUISITION | | LAND | | IMPROVEMENT | | TOTAL | | DEPRECIATION | | DEPRECIATION | | ENCUMBRANCES | | ACQUISITION | | CONSTRUCTION | |
| GLENN SQUARE | | 3,306,779 | | - | | 44,149,548 | | 3,306,779 | | 44,149,548 | | 47,456,327 | | 3,457,974 | | 43,998,353 | | | | | | 2006 | |
| THE GROVE | | 18,951,763 | | 6,403,809 | | 27,536,024 | | 16,395,647 | | 36,495,949 | | 52,891,596 | | 2,930,399 | | 49,961,197 | | | | | | 2007 | |
| CHANDLER AUTO MALLS | | 9,318,595 | | - | | (4,255,793 | ) | 4,623,497 | | 439,305 | | 5,062,802 | | 8,907 | | 5,053,895 | | | | | | 2004 | |
| EL MIRAGE | | 6,786,441 | | 503,987 | | 130,064 | | 6,786,441 | | 634,051 | | 7,420,492 | | 18,289 | | 7,402,203 | | | | | | 2008 | |
| TALAVI TOWN CENTER | | 8,046,677 | | 17,291,542 | | (24,407 | ) | 8,046,677 | | 17,267,135 | | 25,313,812 | | 8,289,742 | | 17,024,070 | | | | 2007 | | | |
| MESA PAVILLIONS | | 6,060,018 | | 35,955,005 | | (19,054 | ) | 6,060,018 | | 35,935,950 | | 41,995,969 | | 4,207,683 | | 37,788,286 | | | | 2009 | | | |
| MESA RIVERVIEW | | 15,000,000 | | - | | 139,626,899 | | 307,992 | | 154,318,907 | | 154,626,899 | | 28,304,759 | | 126,322,140 | | | | | | 2005 | |
| ANA MARIANA POWER CENTER | | 30,043,645 | | - | | 7,698,708 | | 30,131,356 | | 7,610,996 | | 37,742,352 | | 213,200 | | 37,529,152 | | | | | | 2006 | |
| MESA PAVILLIONS - SOUTH | | - | | 148,508 | | (27,651 | ) | - | | 120,858 | | 120,858 | | 25,871 | | 94,986 | | | | 2011 | | | |
| METRO SQUARE | | 4,101,017 | | 16,410,632 | | 520,771 | | 4,101,017 | | 16,931,403 | | 21,032,420 | | 6,486,711 | | 14,545,708 | | | | 1998 | | | |
| HAYDEN PLAZA NORTH | | 2,015,726 | | 4,126,509 | | 5,013,176 | | 2,015,726 | | 9,139,685 | | 11,155,411 | | 3,053,920 | | 8,101,491 | | | | 1998 | | | |
| PHOENIX, COSTCO | | 5,324,501 | | 21,269,943 | | 1,033,546 | | 4,577,869 | | 23,050,120 | | 27,627,990 | | 6,000,660 | | 21,627,330 | | | | 1998 | | | |
| PHOENIX | | 2,450,341 | | 9,802,046 | | 929,417 | | 2,450,341 | | 10,731,463 | | 13,181,804 | | 4,411,736 | | 8,770,068 | | | | 1997 | | | |
| PINACLE PEAK- N. CANYON RANCH | | 1,228,000 | | 8,774,694 | | 20,500 | | 1,228,000 | | 8,795,194 | | 10,023,194 | | 1,855,367 | | 8,167,828 | | 1,853,110 | | 2009 | | | |
| VILLAGE CROSSROADS | | 5,662,554 | | 24,981,223 | | (171,233 | ) | 5,662,554 | | 24,809,989 | | 30,472,543 | | 1,190,895 | | 29,281,648 | | | | 2011 | | | |
| NORTH VALLEY | | 6,861,564 | | 18,200,901 | | 2,539,809 | | 3,861,272 | | 23,741,002 | | 27,602,274 | | 1,113,619 | | 26,488,655 | | 16,320,882 | | 2011 | | | |
| ASANTE RETAIL CENTER | | 8,702,635 | | 3,405,683 | | 2,865,559 | | 11,039,472 | | 3,934,405 | | 14,973,877 | | 105,624 | | 14,868,253 | | | | | | 2004 | |
| SURPRISE II | | 4,138,760 | | 94,572 | | 1,035 | | 4,138,760 | | 95,607 | | 4,234,367 | | 2,833 | | 4,231,534 | | | | | | 2008 | |
| BELL CAMINO CENTER | | 2,427,465 | | 6,439,065 | | - | | 2,427,465 | | 6,439,065 | | 8,866,530 | | 352,701 | | 8,513,829 | | | | 2012 | | | |
| COLLEGE PARK SHOPPING CENTER | | 3,276,951 | | 7,741,323 | | 37,500 | | 3,276,951 | | 7,778,823 | | 11,055,774 | | 412,115 | | 10,643,659 | | | | 2011 | | | |
| ALHAMBRA, COSTCO | | 4,995,639 | | 19,982,557 | | 333,261 | | 4,995,639 | | 20,315,818 | | 25,311,457 | | 7,654,985 | | 17,656,472 | | | | 1998 | | | |
| ANGEL'S CAMP TOWN CENTER | | 1,000,000 | | 6,463,129 | | - | | 1,000,000 | | 6,463,129 | | 7,463,129 | | 728,463 | | 6,734,666 | | | | 2009 | | | |
| MADISON PLAZA | | 5,874,396 | | 23,476,190 | | 668,915 | | 5,874,396 | | 24,145,105 | | 30,019,501 | | 8,984,338 | | 21,035,163 | | | | 1998 | | | |
| CHULA VISTA, COSTCO | | 6,460,743 | | 25,863,153 | | 11,689,917 | | 6,460,743 | | 37,553,070 | | 44,013,813 | | 12,001,986 | | 32,011,828 | | | | 1998 | | | |
| CORONA HILLS, COSTCO | | 13,360,965 | | 53,373,453 | | 5,955,208 | | 13,360,965 | | 59,328,661 | | 72,689,626 | | 22,144,201 | | 50,545,425 | | | | 1998 | | | |
| LABAND VILLAGE SC | | 5,600,000 | | 13,289,347 | | 9,337 | | 5,607,237 | | 13,291,448 | | 18,898,685 | | 4,736,363 | | 14,162,322 | | 8,500,000 | | 2008 | | | |
| CUPERTINO VILLAGE | | 19,886,099 | | 46,534,919 | | 4,625,122 | | 19,886,099 | | 51,160,041 | | 71,046,140 | | 14,969,322 | | 56,076,818 | | 33,678,588 | | 2006 | | | |
| CHICO CROSSROADS | | 9,975,810 | | 30,534,524 | | 717,076 | | 9,987,652 | | 31,239,758 | | 41,227,410 | | 5,833,271 | | 35,394,139 | | 24,510,565 | | 2008 | | | |
| CORONA HILLS MARKETPLACE | | 9,727,446 | | 24,778,390 | | 184,823 | | 9,727,446 | | 24,963,214 | | 34,690,660 | | 6,349,975 | | 28,340,684 | | | | 2007 | | | |
| RIVER PARK SHOPPING CENTER | | 4,324,000 | | 18,018,653 | | (448,708 | ) | 4,324,000 | | 17,569,945 | | 21,893,945 | | 1,933,015 | | 19,960,930 | | | | 2009 | | | |
| GOLD COUNTRY CENTER | | 3,272,212 | | 7,864,878 | | 37,687 | | 3,278,290 | | 7,896,487 | | 11,174,777 | | 2,178,896 | | 8,995,881 | | 6,901,658 | | 2008 | | | |
| LA MIRADA THEATRE CENTER | | 8,816,741 | | 35,259,965 | | (6,747,916 | ) | 6,888,680 | | 30,440,110 | | 37,328,790 | | 11,068,980 | | 26,259,809 | | | | 1998 | | | |
| KENNETH HAHN PLAZA | | 4,114,863 | | 7,660,855 | | 47,284 | | 4,114,863 | | 7,708,139 | | 11,823,002 | | 2,295,093 | | 9,527,909 | | 6,000,000 | | 2010 | | | |
| NOVATO FAIR S.C. | | 9,259,778 | | 15,599,790 | | 159,789 | | 9,259,778 | | 15,759,579 | | 25,019,357 | | 2,600,473 | | 22,418,884 | | - | | 2009 | | | |
| SOUTH NAPA MARKET PLACE | | 1,100,000 | | 22,159,086 | | 6,838,973 | | 1,100,000 | | 28,998,059 | | 30,098,059 | | 10,512,866 | | 19,585,193 | | | | 2006 | | | |
| PLAZA DI NORTHRIDGE | | 12,900,000 | | 40,574,842 | | (792,333 | ) | 12,900,000 | | 39,782,509 | | 52,682,509 | | 10,809,040 | | 41,873,469 | | | | 2005 | | | |
| POWAY CITY CENTRE | | 5,854,585 | | 13,792,470 | | 7,701,699 | | 7,247,814 | | 20,100,941 | | 27,348,754 | | 5,923,090 | | 21,425,664 | | | | 2005 | | | |
| REDWOOD CITY | | 2,552,000 | | 6,215,168 | | - | | 2,552,000 | | 6,215,168 | | 8,767,168 | | 516,707 | | 8,250,461 | | - | | 2009 | | | |
| TYLER STREET | | 3,020,883 | | 7,811,339 | | 53,109 | | 3,200,516 | | 7,684,814 | | 10,885,331 | | 2,486,959 | | 8,398,372 | | 6,643,654 | | 2008 | | | |
| SANTA ANA, HOME DEPOT | | 4,592,364 | | 18,345,257 | | - | | 4,592,364 | | 18,345,257 | | 22,937,622 | | 6,935,088 | | 16,002,534 | | | | 1998 | | | |
| SAN/DIEGO CARMEL MOUNTAIN | | 5,322,600 | | 8,873,991 | | (11,005 | ) | 5,322,600 | | 8,862,986 | | 14,185,586 | | 1,432,895 | | 12,752,691 | | | | 2009 | | | |
| FULTON MARKET PLACE | | 2,966,018 | | 6,920,710 | | 927,435 | | 2,966,018 | | 7,848,145 | | 10,814,163 | | 2,371,319 | | 8,442,844 | | | | 2005 | | | |
| MARIGOLD SC | | 15,300,000 | | 25,563,978 | | 3,406,662 | | 15,300,000 | | 28,970,640 | | 44,270,640 | | 12,905,960 | | 31,364,680 | | | | 2005 | | | |
| BLACK MOUNTAIN VILLAGE | | 4,678,015 | | 11,913,344 | | 89,992 | | 4,678,015 | | 12,003,336 | | 16,681,350 | | 3,265,898 | | 13,415,452 | | | | 2007 | | | |
| CITY HEIGHTS | | 10,687,472 | | 28,324,896 | | 26,489 | | 10,687,472 | | 28,351,385 | | 39,038,857 | | 85,288 | | 38,953,568 | | 21,808,858 | | 2012 | | | |
| TRUCKEE CROSSROADS | | 2,140,000 | | 8,255,753 | | 611,777 | | 2,140,000 | | 8,867,531 | | 11,007,530 | | 4,803,398 | | 6,204,133 | | 3,264,029 | | 2006 | | | |
| WESTLAKE SHOPPING CENTER | | 16,174,307 | | 64,818,562 | | 94,358,492 | | 16,174,307 | | 159,177,054 | | 175,351,360 | | 30,127,534 | | 145,223,827 | | | | 2002 | | | |
| SAVI RANCH | | 7,295,646 | | 29,752,511 | | - | | 7,295,646 | | 29,752,511 | | 37,048,157 | | 321,298 | | 36,726,859 | | | | 2012 | | | |
| VILLAGE ON THE PARK | | 2,194,463 | | 8,885,987 | | 5,619,852 | | 2,194,463 | | 14,505,839 | | 16,700,302 | | 4,460,720 | | 12,239,582 | | | | 1998 | | | |
| AURORA QUINCY | | 1,148,317 | | 4,608,249 | | 988,825 | | 1,148,317 | | 5,597,074 | | 6,745,391 | | 1,995,723 | | 4,749,668 | | | | 1998 | | | |
| AURORA EAST BANK | | 1,500,568 | | 6,180,103 | | 753,032 | | 1,500,568 | | 6,933,136 | | 8,433,703 | | 2,773,641 | | 5,660,063 | | | | 1998 | | | |
| SPRING CREEK COLORADO | | 1,423,260 | | 5,718,813 | | 798,280 | | 1,423,260 | | 6,517,092 | | 7,940,353 | | 2,438,037 | | 5,502,316 | | | | 1998 | | | |
| DENVER WEST 38TH STREET | | 161,167 | | 646,983 | | - | | 161,167 | | 646,983 | | 808,150 | | 247,437 | | 560,713 | | | | 1998 | | | |
| ENGLEWOOD PHAR MOR | | 805,837 | | 3,232,650 | | 249,867 | | 805,837 | | 3,482,517 | | 4,288,354 | | 1,354,400 | | 2,933,954 | | | | 1998 | | | |
| FORT COLLINS | | 1,253,497 | | 7,625,278 | | 1,599,608 | | 1,253,497 | | 9,224,886 | | 10,478,382 | | 2,706,634 | | 7,771,748 | | | | 2000 | | | |
| GREELEY COMMONS | | 3,313,095 | | 20,069,559 | | 24,300 | | 3,313,095 | | 20,093,859 | | 23,406,954 | | 241,795 | | 23,165,159 | | | | 2012 | | | |
| HIGHLANDS RANCH VILLAGE S.C. | | 8,135,427 | | 21,579,936 | | (879,782 | ) | 5,337,081 | | 23,498,500 | | 28,835,581 | | 833,081 | | 28,002,500 | | 20,870,995 | | 2011 | | | |
| VILLAGE CENTER WEST | | 2,010,519 | | 8,361,084 | | 6,815 | | 2,010,519 | | 8,367,899 | | 10,378,418 | | 377,958 | | 10,000,460 | | 6,205,857 | | 2011 | | | |
| HERITAGE WEST | | 1,526,576 | | 6,124,074 | | 774,090 | | 1,526,576 | | 6,898,164 | | 8,424,740 | | 2,464,339 | | 5,960,401 | | | | 1998 | | | |
| MARKET AT SOUTHPARK | | 9,782,769 | | 20,779,522 | | (32,455 | ) | 9,782,769 | | 20,747,067 | | 30,529,837 | | 1,045,288 | | 29,484,549 | | | | 2011 | | | |
| WEST FARM SHOPPING CENTER | | 5,805,969 | | 23,348,024 | | 4,537,981 | | 5,805,969 | | 27,886,005 | | 33,691,974 | | 8,979,729 | | 24,712,246 | | | | 1998 | | | |
| N.HAVEN, HOME DEPOT | | 7,704,968 | | 30,797,640 | | 1,050,387 | | 7,704,968 | | 31,848,027 | | 39,552,995 | | 11,775,885 | | 27,777,110 | | | | 1998 | | | |
| WATERBURY | | 2,253,078 | | 9,017,012 | | 653,224 | | 2,253,078 | | 9,670,236 | | 11,923,314 | | 4,631,458 | | 7,291,857 | | | | 1993 | | | |
| WILTON RIVER PARK SHOPPING CTR | | 7,154,585 | | 27,509,279 | | 70,777 | | 7,154,585 | | 27,580,056 | | 34,734,641 | | 423,247 | | 34,311,394 | | 19,896,160 | | 2012 | | | |
| BRIGHT HORIZONS | | 1,211,748 | | 4,610,610 | | 9,499 | | 1,211,748 | | 4,620,109 | | 5,831,857 | | 64,596 | | 5,767,262 | | 1,768,215 | | 2012 | | | |
| DOVER | | 122,741 | | 66,738 | | 4,007,816 | | 3,024,375 | | 1,172,921 | | 4,197,296 | | 52,085 | | 4,145,211 | | | | 2003 | | | |
| ELSMERE | | - | | 3,185,642 | | 2,287,586 | | - | | 5,473,228 | | 5,473,228 | | 3,235,258 | | 2,237,969 | | | | | | 1979 | |
| ALTAMONTE SPRINGS | | 770,893 | | 3,083,574 | | (1,322,574 | ) | 538,796 | | 1,993,097 | | 2,531,893 | | 808,903 | | 1,722,990 | | | | 1995 | | | |
| AUBURNDALE | | 751,315 | | - | | - | | 751,315 | | - | | 751,315 | | - | | 751,315 | | | | 2009 | | | |
| BOCA RATON | | 573,875 | | 2,295,501 | | 1,722,099 | | 733,875 | | 3,857,600 | | 4,591,475 | | 2,030,398 | | 2,561,077 | | | | 1992 | | | |
| BAYSHORE GARDENS, BRADENTON FL | | 2,901,000 | | 11,738,955 | | 1,234,179 | | 2,901,000 | | 12,973,134 | | 15,874,134 | | 4,848,241 | | 11,025,893 | | | | 1998 | | | |
| SHOPPES @ MT. CARMEL | | 204,432 | | 937,457 | | 79,652 | | 204,432 | | 1,017,110 | | 1,221,542 | | 72,719 | | 1,148,823 | | | | 2009 | | | |
| CORAL SPRINGS | | 710,000 | | 2,842,907 | | 3,804,755 | | 710,000 | | 6,647,662 | | 7,357,662 | | 2,685,234 | | 4,672,428 | | | | 1994 | | | |
| CORAL SPRINGS | | 1,649,000 | | 6,626,301 | | 443,196 | | 1,649,000 | | 7,069,497 | | 8,718,497 | | 2,795,837 | | 5,922,660 | | | | 1997 | | | |
| CURLEW CROSSING S.C. | | 5,315,955 | | 12,529,467 | | 1,709,383 | | 5,315,955 | | 14,238,851 | | 19,554,805 | | 3,480,389 | | 16,074,416 | | | | 2005 | | | |
| CLEARWATER FL | | 3,627,946 | | 918,466 | | (269,494 | ) | 2,174,938 | | 2,101,980 | | 4,276,918 | | 227,901 | | 4,049,016 | | | | 2007 | | | |
| EAST ORLANDO | | 491,676 | | 1,440,000 | | 2,626,124 | | 1,007,882 | | 3,549,918 | | 4,557,800 | | 2,297,443 | | 2,260,357 | | | | | | 1971 | |
| FT.LAUDERDALE/CYPRESS CREEK | | 14,258,760 | | 28,042,390 | | 1,856,935 | | 14,258,760 | | 29,899,324 | | 44,158,084 | | 4,115,199 | | 40,042,885 | | - | | 2009 | | | |
| OAKWOOD BUSINESS CTR-BLDG 1 | | 6,792,500 | | 18,662,565 | | 773,436 | | 6,792,500 | | 19,436,000 | | 26,228,500 | | 2,661,544 | | 23,566,957 | | - | | 2009 | | | |
| SHOPPES AT AMELIA CONCOURSE | | 7,600,000 | | - | | 8,936,082 | | 1,138,216 | | 15,397,866 | | 16,536,082 | | 1,246,842 | | 15,289,240 | | | | | | 2003 | |
| AVENUES WALKS | | 26,984,546 | | - | | 49,385,331 | | 33,225,306 | | 43,144,571 | | 76,369,877 | | - | | 76,369,877 | | | | | | 2005 | |
| RIVERPLACE SHOPPING CTR. | | 7,503,282 | | 31,011,027 | | (97,137 | ) | 7,503,282 | | 30,913,890 | | 38,417,172 | | 3,406,770 | | 35,010,402 | | | | 2010 | | | |
| MERCHANTS WALK | | 2,580,816 | | 10,366,090 | | 4,929,224 | | 2,580,816 | | 15,295,313 | | 17,876,130 | | 3,872,480 | | 14,003,650 | | | | 2001 | | | |
| LARGO | | 293,686 | | 792,119 | | 1,620,990 | | 293,686 | | 2,413,109 | | 2,706,795 | | 1,979,625 | | 727,169 | | | | | | 1968 | |
| LEESBURG | | - | | 171,636 | | 193,651 | | - | | 365,287 | | 365,287 | | 308,023 | | 57,264 | | | | | | 1969 | |
| LARGO EAST BAY | | 2,832,296 | | 11,329,185 | | 2,144,729 | | 2,832,296 | | 13,473,914 | | 16,306,210 | | 8,224,095 | | 8,082,115 | | | | 1992 | | | |
| | | INITIAL COST | | SUBSEQUENT | | | | | | | | | | TOTAL COST, NET OF | | | | | | | |
| | | | | BUILDING & | | TO | | | | BUILDING & | | | | ACCUMULATED | | ACCUMULATED | | | | DATE OF | | DATE OF | |
| PROPERTIES | | LAND | | IMPROVEMENT | | ACQUISITION | | LAND | | IMPROVEMENT | | TOTAL | | DEPRECIATION | | DEPRECIATION | | ENCUMBRANCES | | ACQUISITION | | CONSTRUCTION | |
| LAUDERHILL | | 1,002,733 | | 2,602,415 | | 12,606,236 | | 1,774,443 | | 14,436,941 | | 16,211,384 | | 9,000,490 | | 7,210,894 | | | | | | 1974 | |
| THE GROVES | | 1,676,082 | | 6,533,681 | | (1,330,869 | ) | 2,606,246 | | 4,272,648 | | 6,878,894 | | 1,239,092 | | 5,639,802 | | | | 2006 | | | |
| LAKE WALES | | 601,052 | | - | | - | | 601,052 | | - | | 601,052 | | - | | 601,052 | | | | 2009 | | | |
| MELBOURNE | | - | | 1,754,000 | | 2,666,332 | | - | | 4,420,332 | | 4,420,332 | | 2,845,961 | | 1,574,372 | | | | | | 1968 | |
| GROVE GATE | | 365,893 | | 1,049,172 | | 1,207,100 | | 365,893 | | 2,256,272 | | 2,622,165 | | 1,869,682 | | 752,483 | | | | | | 1968 | |
| CHEVRON OUTPARCEL | | 530,570 | | 1,253,410 | | - | | 530,570 | | 1,253,410 | | 1,783,980 | | 125,210 | | 1,658,770 | | | | 2010 | | | |
| NORTH MIAMI | | 732,914 | | 4,080,460 | | 10,926,161 | | 732,914 | | 15,006,621 | | 15,739,535 | | 7,875,165 | | 7,864,370 | | 6,178,961 | | 1985 | | | |
| MILLER ROAD | | 1,138,082 | | 4,552,327 | | 2,220,561 | | 1,138,082 | | 6,772,889 | | 7,910,970 | | 5,404,854 | | 2,506,116 | | | | 1986 | | | |
| MARGATE | | 2,948,530 | | 11,754,120 | | 7,919,694 | | 2,948,530 | | 19,673,814 | | 22,622,344 | | 7,798,185 | | 14,824,159 | | | | 1993 | | | |
| MT. DORA | | 1,011,000 | | 4,062,890 | | 436,174 | | 1,011,000 | | 4,499,064 | | 5,510,064 | | 1,698,879 | | 3,811,185 | | | | 1997 | | | |
| KENDALE LAKES PLAZA | | 18,491,461 | | 28,496,001 | | (2,846,737 | ) | 15,362,227 | | 28,778,497 | | 44,140,724 | | 3,093,301 | | 41,047,424 | | - | | 2009 | | | |
| PLANTATION CROSSING | | 7,524,800 | | - | | 11,187,936 | | 7,153,784 | | 11,558,952 | | 18,712,736 | | 1,210,330 | | 17,502,406 | | | | | | 2005 | |
| MILTON, FL | | 1,275,593 | | - | | - | | 1,275,593 | | - | | 1,275,593 | | - | | 1,275,593 | | | | 2007 | | | |
| FLAGLER PARK | | 26,162,980 | | 80,737,041 | | 1,766,686 | | 26,162,980 | | 82,503,727 | | 108,666,707 | | 14,174,502 | | 94,492,205 | | 25,428,794 | | 2007 | | | |
| PARK HILL PLAZA | | 10,763,612 | | 19,264,248 | | 142,579 | | 10,891,930 | | 19,278,508 | | 30,170,439 | | 1,411,534 | | 28,758,905 | | 8,328,658 | | 2011 | | | |
| RENAISSANCE CENTER | | 9,104,379 | | 36,540,873 | | 5,612,056 | | 9,122,758 | | 42,134,550 | | 51,257,308 | | 17,212,832 | | 34,044,475 | | | | 1998 | | | |
| ORLANDO | | 560,800 | | 2,268,112 | | 3,203,429 | | 580,030 | | 5,452,310 | | 6,032,341 | | 2,167,664 | | 3,864,677 | | | | 1996 | | | |
| OCALA | | 1,980,000 | | 7,927,484 | | 8,942,057 | | 1,980,000 | | 16,869,541 | | 18,849,541 | | 6,361,694 | | 12,487,848 | | | | 1997 | | | |
| MILLENIA PLAZA PHASE II | | 7,711,000 | | 20,702,992 | | 300,011 | | 7,711,000 | | 21,003,004 | | 28,714,004 | | 4,905,798 | | 23,808,205 | | | | 2009 | | | |
| GRAND OAKS VILLAGE | | 7,409,319 | | 19,653,869 | | (946,240 | ) | 5,846,339 | | 20,270,609 | | 26,116,948 | | 1,057,056 | | 25,059,892 | | 6,553,929 | | 2011 | | | |
| GONZALEZ | | 1,620,203 | | - | | 40,689 | | 954,876 | | 706,016 | | 1,660,892 | | 62,757 | | 1,598,135 | | | | 2007 | | | |
| POMPANO BEACH | | 10,516,500 | | 1,359,236 | | 530,900 | | 10,516,500 | | 1,890,136 | | 12,406,636 | | 46,452 | | 12,360,184 | | | | 2012 | | | |
| UNIVERSITY TOWN CENTER | | 5,515,265 | | 13,041,400 | | 149,024 | | 5,515,265 | | 13,190,424 | | 18,705,689 | | 585,718 | | 18,119,971 | | | | 2011 | | | |
| PALM BEACH GARDENS | | 2,764,953 | | 11,059,812 | | 278,643 | | 2,764,953 | | 11,338,456 | | 14,103,409 | | 663,589 | | 13,439,820 | | | | 2009 | | | |
| ST. PETERSBURG | | - | | 917,360 | | 1,266,811 | | - | | 2,184,171 | | 2,184,171 | | 1,104,439 | | 1,079,732 | | | | | | 1968 | |
| TUTTLE BEE SARASOTA | | 254,961 | | 828,465 | | 1,806,633 | | 254,961 | | 2,635,098 | | 2,890,059 | | 2,027,155 | | 862,904 | | | | 2008 | | | |
| SOUTH EAST SARASOTA | | 1,283,400 | | 5,133,544 | | 3,400,091 | | 1,399,525 | | 8,417,510 | | 9,817,035 | | 4,875,432 | | 4,941,603 | | | | 1989 | | | |
| SANFORD | | 1,832,732 | | 9,523,261 | | 6,256,188 | | 1,832,732 | | 15,779,449 | | 17,612,181 | | 9,703,986 | | 7,908,195 | | | | 1989 | | | |
| STUART | | 2,109,677 | | 8,415,323 | | 1,694,863 | | 2,109,677 | | 10,110,186 | | 12,219,863 | | 4,480,377 | | 7,739,486 | | | | 1994 | | | |
| SOUTH MIAMI | | 1,280,440 | | 5,133,825 | | 3,087,209 | | 1,280,440 | | 8,221,034 | | 9,501,474 | | 3,418,560 | | 6,082,914 | | | | 1995 | | | |
| TAMPA | | 5,220,445 | | 16,884,228 | | 2,249,431 | | 5,220,445 | | 19,133,659 | | 24,354,104 | | 6,951,838 | | 17,402,267 | | | | 1997 | | | |
| VILLAGE COMMONS S.C. | | 2,192,331 | | 8,774,158 | | 2,715,244 | | 2,192,331 | | 11,489,402 | | 13,681,733 | | 3,772,873 | | 9,908,860 | | | | 1998 | | | |
| MISSION BELL SHOPPING CENTER | | 5,056,426 | | 11,843,119 | | 8,661,955 | | 5,067,033 | | 20,494,467 | | 25,561,501 | | 4,908,884 | | 20,652,617 | | | | 2004 | | | |
| WEST PALM BEACH | | 550,896 | | 2,298,964 | | 1,426,083 | | 550,896 | | 3,725,047 | | 4,275,943 | | 1,526,491 | | 2,749,452 | | | | 1995 | | | |
| CROSS COUNTRY PLAZA | | 16,510,000 | | 18,264,427 | | 465,515 | | 16,510,000 | | 18,729,942 | | 35,239,942 | | 2,278,594 | | 32,961,348 | | | | 2009 | | | |
| AUGUSTA | | 1,482,564 | | 5,928,122 | | 2,439,437 | | 1,482,564 | | 8,367,559 | | 9,850,123 | | 3,508,069 | | 6,342,054 | | | | 1995 | | | |
| MARKET AT HAYNES BRIDGE | | 4,880,659 | | 21,549,424 | | 505,236 | | 4,889,863 | | 22,045,456 | | 26,935,319 | | 4,382,415 | | 22,552,904 | | 15,626,501 | | 2008 | | | |
| EMBRY VILLAGE | | 18,147,054 | | 33,009,514 | | 215,338 | | 18,160,524 | | 33,211,382 | | 51,371,906 | | 6,869,361 | | 44,502,545 | | 30,025,443 | | 2008 | | | |
| VILLAGE SHOPPES-FLOWERY BRANCH | | 4,444,148 | | 10,510,657 | | (17,119 | ) | 4,444,148 | | 10,493,538 | | 14,937,686 | | 692,289 | | 14,245,397 | | 8,992,979 | | 2011 | | | |
| SAVANNAH | | 2,052,270 | | 8,232,978 | | 2,408,812 | | 2,052,270 | | 10,641,790 | | 12,694,060 | | 5,042,393 | | 7,651,667 | | | | 1993 | | | |
| CHATHAM PLAZA | | 13,390,238 | | 35,115,882 | | 848,242 | | 13,403,262 | | 35,951,100 | | 49,354,362 | | 8,985,806 | | 40,368,556 | | 28,767,663 | | 2008 | | | |
| KIHEI CENTER | | 3,406,707 | | 7,663,360 | | 654,468 | | 3,406,707 | | 8,317,828 | | 11,724,535 | | 4,710,325 | | 7,014,210 | | | | 2006 | | | |
| CLIVE | | 500,525 | | 2,002,101 | | - | | 500,525 | | 2,002,101 | | 2,502,626 | | 868,433 | | 1,634,193 | | | | 1996 | | | |
| METRO CROSSING | | 3,013,647 | | - | | 35,426,260 | | 1,514,916 | | 36,924,991 | | 38,439,907 | | 2,167,911 | | 36,271,996 | | | | | | 2006 | |
| SOUTHDALE SHOPPING CENTER | | 1,720,330 | | 6,916,294 | | 3,760,738 | | 1,720,330 | | 10,677,032 | | 12,397,362 | | 3,338,432 | | 9,058,930 | | 635,871 | | 1999 | | | |
| DES MOINES | | 500,525 | | 2,559,019 | | 37,079 | | 500,525 | | 2,596,098 | | 3,096,623 | | 1,101,693 | | 1,994,930 | | | | 1996 | | | |
| DUBUQUE | | - | | 2,152,476 | | 239,217 | | - | | 2,391,693 | | 2,391,693 | | 852,030 | | 1,539,663 | | | | 1997 | | | |
| WATERLOO | | 500,525 | | 2,002,101 | | 2,869,100 | | 500,525 | | 4,871,201 | | 5,371,726 | | 2,930,608 | | 2,441,117 | | | | 1996 | | | |
| NAMPA (HORSHAM) FUTURE DEV. | | 6,501,240 | | - | | 11,902,537 | | 10,567,218 | | 7,836,559 | | 18,403,777 | | 264,671 | | 18,139,106 | | | | | | 2005 | |
| AURORA, N. LAKE | | 2,059,908 | | 9,531,721 | | 308,208 | | 2,059,908 | | 9,839,929 | | 11,899,837 | | 3,618,787 | | 8,281,050 | | | | 1998 | | | |
| BLOOMINGTON | | 805,521 | | 2,222,353 | | 4,246,390 | | 805,521 | | 6,468,743 | | 7,274,264 | | 4,118,981 | | 3,155,283 | | | | | | 1972 | |
| BELLEVILLE S.C. | | - | | 5,372,253 | | 1,255,387 | | 1,161,195 | | 5,466,445 | | 6,627,640 | | 1,996,939 | | 4,630,701 | | | | 1998 | | | |
| BRADLEY | | 500,422 | | 2,001,687 | | 424,877 | | 500,422 | | 2,426,564 | | 2,926,986 | | 1,024,922 | | 1,902,064 | | | | 1996 | | | |
| CALUMET CITY | | 1,479,217 | | 8,815,760 | | 13,905,512 | | 1,479,216 | | 22,721,273 | | 24,200,489 | | 5,850,753 | | 18,349,735 | | | | 1997 | | | |
| COUNTRYSIDE | | - | | 4,770,671 | | (4,531,252 | ) | 95,647 | | 143,772 | | 239,419 | | 77,913 | | 161,506 | | | | 1997 | | | |
| CHICAGO | | - | | 2,687,046 | | 871,802 | | - | | 3,558,848 | | 3,558,848 | | 1,377,935 | | 2,180,912 | | | | 1997 | | | |
| CHAMPAIGN, NEIL ST. | | 230,519 | | 1,285,460 | | 725,493 | | 230,519 | | 2,010,953 | | 2,241,472 | | 771,170 | | 1,470,302 | | | | 1998 | | | |
| ELSTON | | 1,010,374 | | 5,692,212 | | 498,828 | | 1,010,374 | | 6,191,040 | | 7,201,414 | | 2,095,504 | | 5,105,910 | | | | 1997 | | | |
| CRYSTAL LAKE, NW HWY | | 179,964 | | 1,025,811 | | 564,039 | | 180,269 | | 1,589,545 | | 1,769,814 | | 471,852 | | 1,297,962 | | | | 1998 | | | |
| 108 WEST GERMANIA PLACE | | 2,393,894 | | 7,366,681 | | 360 | | 2,393,894 | | 7,367,041 | | 9,760,935 | | 312,936 | | 9,447,998 | | | | 2008 | | | |
| BUTTERFIELD SQUARE | | 1,601,960 | | 6,637,926 | | (3,588,725 | ) | 1,182,677 | | 3,468,484 | | 4,651,161 | | 1,180,384 | | 3,470,777 | | | | 1998 | | | |
| DOWNERS PARK PLAZA | | 2,510,455 | | 10,164,494 | | 968,249 | | 2,510,455 | | 11,132,743 | | 13,643,198 | | 4,071,520 | | 9,571,678 | | | | 1999 | | | |
| DOWNER GROVE | | 811,778 | | 4,322,956 | | 3,221,260 | | 811,778 | | 7,544,216 | | 8,355,994 | | 2,348,423 | | 6,007,571 | | | | 1997 | | | |
| ELGIN | | 842,555 | | 2,108,674 | | 1,728,298 | | 500,927 | | 4,178,600 | | 4,679,527 | | 2,922,303 | | 1,757,224 | | | | | | 1972 | |
| FOREST PARK | | - | | 2,335,884 | | 154,213 | | - | | 2,490,097 | | 2,490,097 | | 915,328 | | 1,574,768 | | | | 1997 | | | |
| FAIRVIEW HTS, BELLVILLE RD. | | - | | 11,866,880 | | 2,049,362 | | - | | 13,916,242 | | 13,916,242 | | 4,916,488 | | 8,999,754 | | | | 1998 | | | |
| BELLEVILLE ROAD S.C..-fee | | 1,900,000 | | - | | - | | 1,900,000 | | - | | 1,900,000 | | - | | 1,900,000 | | | | 2011 | | | |
| GENEVA | | 500,422 | | 12,917,712 | | 33,551 | | 500,422 | | 12,951,263 | | 13,451,685 | | 4,920,006 | | 8,531,679 | | | | 1996 | | | |
| LAKE ZURICH PLAZA | | 1,890,319 | | 2,649,381 | | 63,057 | | 1,890,319 | | 2,712,438 | | 4,602,757 | | 381,569 | | 4,221,189 | | | | 2005 | | | |
| MATTERSON | | 950,515 | | 6,292,319 | | 10,560,785 | | 950,514 | | 16,853,105 | | 17,803,619 | | 6,079,166 | | 11,724,453 | | | | 1997 | | | |
| MT. PROSPECT | | 1,017,345 | | 6,572,176 | | 4,016,735 | | 1,017,345 | | 10,588,911 | | 11,606,256 | | 4,277,134 | | 7,329,122 | | | | 1997 | | | |
| MUNDELEIN, S. LAKE | | 1,127,720 | | 5,826,129 | | 77,350 | | 1,129,634 | | 5,901,565 | | 7,031,199 | | 2,197,292 | | 4,833,907 | | | | 1998 | | | |
| NORRIDGE | | - | | 2,918,315 | | - | | - | | 2,918,315 | | 2,918,315 | | 1,136,649 | | 1,781,666 | | | | 1997 | | | |
| NAPERVILLE | | 669,483 | | 4,464,998 | | 456,947 | | 669,483 | | 4,921,945 | | 5,591,428 | | 1,742,823 | | 3,848,605 | | | | 1997 | | | |
| MARKETPLACE OF OAKLAWN | | - | | 678,668 | | 25,343 | | - | | 704,011 | | 704,011 | | 487,474 | | 216,537 | | | | 1998 | | | |
| ORLAND PARK, S. HARLEM | | 476,972 | | 2,764,775 | | (2,694,903 | ) | 87,998 | | 458,846 | | 546,844 | | 163,240 | | 383,603 | | | | 1998 | | | |
| OAK LAWN | | 1,530,111 | | 8,776,631 | | 588,483 | | 1,530,111 | | 9,365,115 | | 10,895,225 | | 3,596,903 | | 7,298,322 | | | | 1997 | | | |
| OAKBROOK TERRACE | | 1,527,188 | | 8,679,108 | | 3,298,212 | | 1,527,188 | | 11,977,320 | | 13,504,508 | | 4,215,711 | | 9,288,797 | | | | 1997 | | | |
| PEORIA | | - | | 5,081,290 | | 2,403,560 | | - | | 7,484,850 | | 7,484,850 | | 5,368,740 | | 2,116,110 | | | | 1997 | | | |
| FREESTATE BOWL | | 252,723 | | 998,099 | | (485,425 | ) | 252,723 | | 512,674 | | 765,396 | | 123,060 | | 642,336 | | | | 2003 | | | |
| ROCKFORD CROSSING | | 4,575,990 | | 11,654,022 | | (577,091 | ) | 4,583,005 | | 11,069,916 | | 15,652,921 | | 1,881,847 | | 13,771,073 | | 10,226,384 | | 2008 | | | |
| ROUND LAKE BEACH PLAZA | | 790,129 | | 1,634,148 | | 587,575 | | 790,129 | | 2,221,723 | | 3,011,852 | | 298,029 | | 2,713,823 | | | | 2005 | | | |
| SKOKIE | | - | | 2,276,360 | | 9,518,382 | | 2,628,440 | | 9,166,303 | | 11,794,742 | | 2,763,160 | | 9,031,582 | | | | 1997 | | | |
| KRC STREAMWOOD | | 181,962 | | 1,057,740 | | 216,585 | | 181,962 | | 1,274,324 | | 1,456,287 | | 443,639 | | 1,012,648 | | | | 1998 | | | |
| HAWTHORN HILLS SQUARE | | 6,783,928 | | 33,033,624 | | - | | 6,783,928 | | 33,033,624 | | 39,817,551 | | 449,689 | | 39,367,863 | | 21,471,879 | | 2012 | | | |
| WOODGROVE FESTIVAL | | 5,049,149 | | 20,822,993 | | 4,067,683 | | 4,805,866 | | 25,133,960 | | 29,939,825 | | 9,043,249 | | 20,896,576 | | | | 1998 | | | |
| WAUKEGAN PLAZA | | 349,409 | | 883,975 | | 2,276,671 | | 349,409 | | 3,160,646 | | 3,510,055 | | 244,873 | | 3,265,182 | | | | 2005 | | | |
| GREENWOOD | | 423,371 | | 1,883,421 | | 3,259,073 | | 584,445 | | 4,981,420 | | 5,565,865 | | 3,221,547 | | 2,344,318 | | | | | | 1970 | |
| SOUTH BEND, S. HIGH ST. | | 183,463 | | 1,070,401 | | 196,857 | | 183,463 | | 1,267,258 | | 1,450,721 | | 446,936 | | 1,003,786 | | | | 1998 | | | |
| | | INITIAL COST | | SUBSEQUENT | | | | | | | | | | TOTAL COST, NET OF | | | | | | | |
| | | | | BUILDING & | | TO | | | | BUILDING & | | | | ACCUMULATED | | ACCUMULATED | | | | DATE OF | | DATE OF | |
| PROPERTIES | | LAND | | IMPROVEMENT | | ACQUISITION | | LAND | | IMPROVEMENT | | TOTAL | | DEPRECIATION | | DEPRECIATION | | ENCUMBRANCES | | ACQUISITION | | CONSTRUCTION | |
| OVERLAND PARK | | 1,183,911 | | 6,335,308 | | 142,374 | | 1,185,906 | | 6,475,686 | | 7,661,593 | | 2,357,930 | | 5,303,662 | | | | 1998 | | | |
| BELLEVUE | | 405,217 | | 1,743,573 | | 247,204 | | 405,217 | | 1,990,776 | | 2,395,994 | | 1,837,655 | | 558,339 | | | | 1976 | | | |
| LEXINGTON | | 1,675,031 | | 6,848,209 | | 5,773,377 | | 1,551,079 | | 12,745,538 | | 14,296,617 | | 5,987,902 | | 8,308,715 | | | | 1993 | | | |
| HAMMOND AIR PLAZA | | 3,813,873 | | 15,260,609 | | 7,073,544 | | 3,813,873 | | 22,334,153 | | 26,148,025 | | 7,305,037 | | 18,842,988 | | | | 1997 | | | |
| CENTRE AT WESTBANK | | 9,554,230 | | 24,401,082 | | 748,757 | | 9,564,644 | | 25,139,425 | | 34,704,069 | | 5,454,766 | | 29,249,302 | | 18,622,165 | | 2008 | | | |
| LAFAYETTE | | 2,115,000 | | 8,508,218 | | 10,371,406 | | 3,678,274 | | 17,316,349 | | 20,994,624 | | 6,429,882 | | 14,564,742 | | | | 1997 | | | |
| PRIEN LAKE | | 6,426,167 | | 15,181,072 | | (109,020 | ) | 6,341,896 | | 15,156,323 | | 21,498,219 | | 2,265,376 | | 19,232,843 | | 15,696,967 | | 2010 | | | |
| PRIEN LAKE PLAZA OUTPARCEL | | 540,000 | | 1,260,000 | | - | | 540,000 | | 1,260,000 | | 1,800,000 | | 14,700 | | 1,785,300 | | | | 2012 | | | |
| AMBASSADOR PLAZA | | 1,803,672 | | 4,260,966 | | (6,701 | ) | 1,796,972 | | 4,260,966 | | 6,057,938 | | 636,346 | | 5,421,592 | | 4,585,336 | | 2010 | | | |
| BAYOU WALK | | 4,586,895 | | 10,836,007 | | 153,992 | | 4,586,326 | | 10,990,568 | | 15,576,894 | | 2,162,600 | | 13,414,294 | | 12,654,406 | | 2010 | | | |
| EAST SIDE PLAZA | | 3,295,799 | | 7,785,942 | | 216,325 | | 3,295,635 | | 8,002,431 | | 11,298,065 | | 1,155,980 | | 10,142,086 | | 8,786,146 | | 2010 | | | |
| GREAT BARRINGTON | | 642,170 | | 2,547,830 | | 7,315,207 | | 751,124 | | 9,754,083 | | 10,505,207 | | 3,875,356 | | 6,629,851 | | | | 1994 | | | |
| SHREWSBURY SHOPPING CENTER | | 1,284,168 | | 5,284,853 | | 5,000,687 | | 1,284,168 | | 10,285,540 | | 11,569,708 | | 3,049,544 | | 8,520,163 | | | | 2000 | | | |
| SNOWDEN SQUARE S.C. | | 1,929,402 | | 4,557,934 | | - | | 1,929,402 | | 4,557,934 | | 6,487,336 | | - | | 6,487,336 | | | | 2012 | | | |
| WILDE LAKE | | 1,468,038 | | 5,869,862 | | 1,800,813 | | 1,558,038 | | 7,580,675 | | 9,138,712 | | 1,699,357 | | 7,439,355 | | | | 2002 | | | |
| LYNX LANE | | 1,019,035 | | 4,091,894 | | 76,423 | | 1,019,035 | | 4,168,317 | | 5,187,352 | | 1,183,038 | | 4,004,314 | | | | 2002 | | | |
| CLINTON BANK BUILDING | | 82,967 | | 362,371 | | - | | 82,967 | | 362,371 | | 445,338 | | 234,824 | | 210,514 | | | | 2003 | | | |
| CLINTON BOWL | | 39,779 | | 130,716 | | 4,247 | | 38,779 | | 135,963 | | 174,742 | | 73,284 | | 101,459 | | | | 2003 | | | |
| TJMAXX | | 1,279,200 | | 2,870,800 | | 11,810,000 | | 4,597,200 | | 11,362,800 | | 15,960,000 | | 256,207 | | 15,703,793 | | | | 2011 | | | |
| VILLAGES AT URBANA | | 3,190,074 | | 6,067 | | 10,496,574 | | 4,828,774 | | 8,863,942 | | 13,692,715 | | 802,502 | | 12,890,214 | | | | 2003 | | | |
| GAITHERSBURG | | 244,890 | | 6,787,534 | | 230,545 | | 244,890 | | 7,018,079 | | 7,262,969 | | 2,366,356 | | 4,896,613 | | | | 1999 | | | |
| SHAWAN PLAZA | | 4,466,000 | | 20,222,367 | | (857,895 | ) | 4,466,000 | | 19,364,472 | | 23,830,472 | | 7,681,230 | | 16,149,242 | | 8,449,348 | | 2008 | | | |
| LAUREL | | 349,562 | | 1,398,250 | | 1,073,324 | | 349,562 | | 2,471,574 | | 2,821,136 | | 1,300,592 | | 1,520,544 | | | | 1995 | | | |
| LAUREL | | 274,580 | | 1,100,968 | | 283,421 | | 274,580 | | 1,384,389 | | 1,658,969 | | 1,384,389 | | 274,580 | | | | | | 1972 | |
| SOUTHWEST MIXED USE PROPERTY | | 403,034 | | 1,325,126 | | 306,510 | | 361,035 | | 1,673,635 | | 2,034,670 | | 846,473 | | 1,188,197 | | | | 2003 | | | |
| OWINGS MILLS PLAZA | | 303,911 | | 1,370,221 | | (503,247 | ) | 303,911 | | 866,973 | | 1,170,885 | | 88,106 | | 1,082,779 | | | | 2005 | | | |
| PERRY HALL | | 3,339,309 | | 12,377,339 | | 824,994 | | 3,339,309 | | 13,202,333 | | 16,541,642 | | 5,332,593 | | 11,209,049 | | | | 2003 | | | |
| CENTRE COURT-RETAIL/BANK | | 1,035,359 | | 7,785,830 | | - | | 1,035,359 | | 7,785,830 | | 8,821,189 | | 474,591 | | 8,346,598 | | 2,757,103 | | 2011 | | | |
| CENTRE COURT-GIANT | | 3,854,099 | | 12,769,628 | | - | | 3,854,099 | | 12,769,628 | | 16,623,727 | | 642,900 | | 15,980,828 | | 7,622,825 | | 2011 | | | |
| CENTRE COURT-OLD COURT/COURTYD | | 2,279,177 | | 5,284,577 | | - | | 2,279,177 | | 5,284,577 | | 7,563,754 | | 386,602 | | 7,177,152 | | 5,366,536 | | 2011 | | | |
| TIMONIUM SHOPPING CENTER | | 6,000,000 | | 24,282,998 | | 16,354,691 | | 7,331,195 | | 39,306,494 | | 46,637,689 | | 16,208,739 | | 30,428,950 | | | | 2003 | | | |
| TOWSON PLACE | | 43,886,876 | | 101,764,931 | | 533,557 | | 43,886,876 | | 102,298,489 | | 146,185,364 | | 3,523,695 | | 142,661,670 | | | | 2012 | | | |
| WALDORF BOWL | | 225,099 | | 739,362 | | 84,327 | | 235,099 | | 813,688 | | 1,048,787 | | 423,742 | | 625,045 | | | | 2003 | | | |
| WALDORF FIRESTONE | | 57,127 | | 221,621 | | - | | 57,127 | | 221,621 | | 278,749 | | 120,629 | | 158,120 | | | | 2003 | | | |
| BANGOR, ME | | 403,833 | | 1,622,331 | | 93,752 | | 403,833 | | 1,716,083 | | 2,119,916 | | 483,647 | | 1,636,270 | | | | 2001 | | | |
| MALLSIDE PLAZA | | 6,930,996 | | 18,148,727 | | (245,736 | ) | 6,939,589 | | 17,894,397 | | 24,833,987 | | 4,981,362 | | 19,852,624 | | 14,706,340 | | 2008 | | | |
| CLAWSON | | 1,624,771 | | 6,578,142 | | 8,699,369 | | 1,624,771 | | 15,277,511 | | 16,902,282 | | 5,264,478 | | 11,637,804 | | | | 1993 | | | |
| WHITE LAKE | | 2,300,050 | | 9,249,607 | | 1,980,754 | | 2,300,050 | | 11,230,361 | | 13,530,411 | | 4,782,295 | | 8,748,116 | | | | 1996 | | | |
| CANTON TWP PLAZA | | 163,740 | | 926,150 | | 5,249,730 | | 163,740 | | 6,175,879 | | 6,339,620 | | 686,681 | | 5,652,938 | | | | 2005 | | | |
| CLINTON TWP PLAZA | | 175,515 | | 714,279 | | 1,147,275 | | 59,450 | | 1,977,619 | | 2,037,068 | | 499,210 | | 1,537,858 | | | | 2005 | | | |
| FARMINGTON | | 1,098,426 | | 4,525,723 | | 2,563,624 | | 1,098,426 | | 7,089,347 | | 8,187,773 | | 3,427,716 | | 4,760,057 | | | | 1993 | | | |
| FLINT - VACANT LAND | | 101,424 | | - | | - | | 101,424 | | - | | 101,424 | | - | | 101,424 | | | | 2012 | | | |
| LIVONIA | | 178,785 | | 925,818 | | 1,180,992 | | 178,785 | | 2,106,810 | | 2,285,595 | | 1,274,808 | | 1,010,787 | | | | | | 1968 | |
| MUSKEGON | | 391,500 | | 958,500 | | 952,381 | | 391,500 | | 1,910,881 | | 2,302,381 | | 1,628,078 | | 674,303 | | | | 1985 | | | |
| OKEMOS PLAZA | | 166,706 | | 591,193 | | 1,878,684 | | 166,706 | | 2,469,877 | | 2,636,583 | | 175,724 | | 2,460,859 | | - | | 2005 | | | |
| TAYLOR | | 1,451,397 | | 5,806,263 | | 275,289 | | 1,451,397 | | 6,081,552 | | 7,532,949 | | 2,978,032 | | 4,554,917 | | | | 1993 | | | |
| WALKER | | 3,682,478 | | 14,730,060 | | 2,108,718 | | 3,682,478 | | 16,838,778 | | 20,521,256 | | 7,957,641 | | 12,563,616 | | | | 1993 | | | |
| EDEN PRAIRIE PLAZA | | 882,596 | | 911,373 | | 570,450 | | 882,596 | | 1,481,823 | | 2,364,419 | | 186,485 | | 2,177,934 | | | | 2005 | | | |
| FOUNTAINS AT ARBOR LAKES | | 28,585,296 | | 66,699,024 | | 10,230,741 | | 28,585,296 | | 76,929,765 | | 105,515,061 | | 14,214,473 | | 91,300,588 | | | | 2006 | | | |
| ROSEVILLE PLAZA | | 132,842 | | 957,340 | | 4,739,103 | | 132,842 | | 5,696,443 | | 5,829,285 | | 699,739 | | 5,129,546 | | | | 2005 | | | |
| CREVE COEUR, WOODCREST/OLIVE | | 1,044,598 | | 5,475,623 | | 615,905 | | 960,814 | | 6,175,312 | | 7,136,126 | | 2,298,884 | | 4,837,242 | | | | 1998 | | | |
| CRYSTAL CITY, MI | | - | | 234,378 | | - | | - | | 234,378 | | 234,378 | | 85,376 | | 149,003 | | | | 1997 | | | |
| INDEPENDENCE, NOLAND DR. | | 1,728,367 | | 8,951,101 | | 193,000 | | 1,731,300 | | 9,141,168 | | 10,872,468 | | 3,378,067 | | 7,494,401 | | | | 1998 | | | |
| NORTH POINT SHOPPING CENTER | | 1,935,380 | | 7,800,746 | | 679,841 | | 1,935,380 | | 8,480,587 | | 10,415,967 | | 2,982,749 | | 7,433,218 | | | | 1998 | | | |
| KIRKWOOD | | - | | 9,704,005 | | 13,172,627 | | - | | 22,876,632 | | 22,876,632 | | 11,532,591 | | 11,344,042 | | | | 1998 | | | |
| KANSAS CITY | | 574,777 | | 2,971,191 | | 274,976 | | 574,777 | | 3,246,167 | | 3,820,944 | | 1,264,213 | | 2,556,730 | | | | 1997 | | | |
| LEMAY | | 125,879 | | 503,510 | | 3,828,858 | | 451,155 | | 4,007,092 | | 4,458,247 | | 1,306,750 | | 3,151,497 | | | | | | 1974 | |
| GRAVOIS | | 1,032,416 | | 4,455,514 | | 11,032,682 | | 1,032,413 | | 15,488,199 | | 16,520,612 | | 7,923,972 | | 8,596,640 | | | | 2008 | | | |
| ST. CHARLES-UNDERDEVELOPED LAND, MO | | 431,960 | | - | | 758,854 | | 431,960 | | 758,855 | | 1,190,814 | | 229,569 | | 961,246 | | | | 1998 | | | |
| SPRINGFIELD | | 2,745,595 | | 10,985,778 | | 7,221,086 | | 2,904,022 | | 18,048,437 | | 20,952,459 | | 7,377,882 | | 13,574,577 | | | | 1994 | | | |
| KMART PARCEL | | 905,674 | | 3,666,386 | | 4,933,942 | | 905,674 | | 8,600,328 | | 9,506,001 | | 2,258,408 | | 7,247,593 | | 1,418,352 | | 2002 | | | |
| KRC ST. CHARLES | | - | | 550,204 | | - | | - | | 550,204 | | 550,204 | | 197,509 | | 352,695 | | | | 1998 | | | |
| ST. LOUIS, CHRISTY BLVD. | | 809,087 | | 4,430,514 | | 3,160,390 | | 809,087 | | 7,590,904 | | 8,399,991 | | 2,496,596 | | 5,903,395 | | | | 1998 | | | |
| OVERLAND | | - | | 4,928,677 | | 1,136,797 | | - | | 6,065,474 | | 6,065,474 | | 2,369,370 | | 3,696,104 | | | | 1997 | | | |
| ST. LOUIS | | - | | 5,756,736 | | 849,684 | | - | | 6,606,420 | | 6,606,420 | | 2,647,657 | | 3,958,763 | | | | 1997 | | | |
| ST. LOUIS | | - | | 2,766,644 | | 143,298 | | - | | 2,909,942 | | 2,909,942 | | 2,909,942 | | - | | | | 1997 | | | |
| ST. PETERS | | 1,182,194 | | 7,423,459 | | 7,227,838 | | 1,563,694 | | 14,269,797 | | 15,833,491 | | 9,292,852 | | 6,540,639 | | | | 1997 | | | |
| SPRINGFIELD,GLENSTONE AVE. | | - | | 608,793 | | 2,100,419 | | - | | 2,709,212 | | 2,709,212 | | 820,464 | | 1,888,748 | | | | 1998 | | | |
| TURTLE CREEK | | 11,535,281 | | - | | 32,945,553 | | 10,150,881 | | 34,329,953 | | 44,480,834 | | 5,525,086 | | 38,955,748 | | | | | | 2004 | |
| OVERLOOK VILLAGE | | 8,276,500 | | 17,249,587 | | - | | 8,276,500 | | 17,249,587 | | 25,526,087 | | 446,927 | | 25,079,160 | | | | 2012 | | | |
| CHARLOTTE | | 919,251 | | 3,570,981 | | 2,343,716 | | 919,251 | | 5,914,696 | | 6,833,948 | | 2,100,714 | | 4,733,233 | | | | 2008 | | | |
| TYVOLA RD. | | - | | 4,736,345 | | 5,082,086 | | - | | 9,818,431 | | 9,818,431 | | 7,346,453 | | 2,471,979 | | | | 1986 | | | |
| CROSSROADS PLAZA | | 767,864 | | 3,098,881 | | 34,566 | | 767,864 | | 3,133,447 | | 3,901,310 | | 1,029,216 | | 2,872,094 | | | | 2000 | | | |
| KIMCO CARY 696, INC. | | 2,180,000 | | 8,756,865 | | 527,277 | | 2,256,799 | | 9,207,343 | | 11,464,142 | | 3,416,224 | | 8,047,917 | | | | 1998 | | | |
| JETTON VILLAGE SHOPPES | | 3,875,224 | | 10,292,231 | | (535,197 | ) | 2,143,695 | | 11,488,563 | | 13,632,258 | | 410,825 | | 13,221,433 | | 8,174,304 | | 2011 | | | |
| MOUNTAIN ISLAND MARKETPLACE | | 3,318,587 | | 7,331,413 | | - | | 3,318,587 | | 7,331,413 | | 10,650,000 | | 211,794 | | 10,438,206 | | | | 2012 | | | |
| WOODLAWN SHOPPING CENTER | | 2,010,725 | | 5,833,626 | | - | | 2,010,725 | | 5,833,626 | | 7,844,351 | | 93,684 | | 7,750,667 | | | | 2012 | | | |
| DURHAM | | 1,882,800 | | 7,551,576 | | 2,097,270 | | 1,882,800 | | 9,648,846 | | 11,531,646 | | 4,027,430 | | 7,504,216 | | | | 1996 | | | |
| DAVIDSON COMMONS | | 2,978,533 | | 12,859,867 | | 11,600 | | 2,978,533 | | 12,871,467 | | 15,850,000 | | 224,091 | | 15,625,909 | | | | 2012 | | | |
| WESTRIDGE SQUARE S.C. | | 7,456,381 | | 19,778,703 | | (282,578 | ) | 11,977,700 | | 14,974,806 | | 26,952,506 | | 1,441,815 | | 25,510,691 | | | | 2011 | | | |
| HILLSBOROUGH CROSSING | | 519,395 | | - | | - | | 519,395 | | - | | 519,395 | | - | | 519,395 | | | | 2003 | | | |
| PARK PLACE | | 5,461,478 | | 16,163,494 | | 79,783 | | 5,469,809 | | 16,234,946 | | 21,704,755 | | 3,327,202 | | 18,377,553 | | 13,351,804 | | 2008 | | | |
| MOORESVILLE CROSSING | | 12,013,727 | | 30,604,173 | | (520,444 | ) | 11,625,801 | | 30,471,654 | | 42,097,455 | | 5,874,124 | | 36,223,332 | | | | 2007 | | | |
| RALEIGH | | 5,208,885 | | 20,885,792 | | 12,105,168 | | 5,208,885 | | 32,990,960 | | 38,199,845 | | 14,412,743 | | 23,787,102 | | | | 1993 | | | |
| WAKEFIELD COMMONS II | | 6,506,450 | | - | | (2,728,390 | ) | 2,357,636 | | 1,420,424 | | 3,778,060 | | 320,662 | | 3,457,399 | | | | | | 2001 | |
| WAKEFIELD CROSSINGS | | 3,413,932 | | - | | (3,017,960 | ) | 336,236 | | 59,737 | | 395,973 | | 1,650 | | 394,323 | | | | | | 2001 | |
| EDGEWATER PLACE | | 3,150,000 | | - | | 10,087,943 | | 3,062,768 | | 10,175,175 | | 13,237,943 | | 1,744,609 | | 11,493,334 | | | | | | 2003 | |
| BRENNAN STATION | | 7,749,751 | | 20,556,891 | | (970,033 | ) | 6,321,923 | | 21,014,686 | | 27,336,609 | | 1,037,588 | | 26,299,021 | | 9,223,411 | | 2011 | | | |
| BRENNAN STATION OUTPARCEL | | 627,906 | | 1,665,576 | | (93,482 | ) | 450,232 | | 1,749,768 | | 2,200,000 | | 77,396 | | 2,122,604 | | | | 2011 | | | |
| | | INITIAL COST | | SUBSEQUENT | | | | | | | | | | TOTAL COST, NET OF | | | | | | | |
| | | | | BUILDING & | | TO | | | | BUILDING & | | | | ACCUMULATED | | ACCUMULATED | | | | DATE OF | | DATE OF | |
| PROPERTIES | | LAND | | IMPROVEMENT | | ACQUISITION | | LAND | | IMPROVEMENT | | TOTAL | | DEPRECIATION | | DEPRECIATION | | ENCUMBRANCES | | ACQUISITION | | CONSTRUCTION | |
| WINSTON-SALEM | | 540,667 | | 719,655 | | 6,059,518 | | 540,667 | | 6,779,173 | | 7,319,840 | | 3,116,963 | | 4,202,877 | | 4,800,575 | | | | 1969 | |
| SORENSON PARK PLAZA | | 5,104,294 | | - | | 31,258,442 | | 4,017,569 | | 32,345,167 | | 36,362,736 | | 2,732,253 | | 33,630,484 | | | | | | 2005 | |
| LORDEN PLAZA | | 8,872,529 | | 22,548,382 | | 222,227 | | 8,883,003 | | 22,760,134 | | 31,643,138 | | 3,994,273 | | 27,648,865 | | 24,688,250 | | 2008 | | | |
| ROCKINGHAM | | 2,660,915 | | 10,643,660 | | 12,042,678 | | 3,148,715 | | 22,198,538 | | 25,347,253 | | 9,091,824 | | 16,255,430 | | 17,652,812 | | 2008 | | | |
| BRIDGEWATER NJ | | 1,982,481 | | (3,666,959 | ) | 11,229,293 | | 1,982,481 | | 7,562,335 | | 9,544,815 | | 3,502,689 | | 6,042,126 | | | | | | 1998 | |
| BAYONNE BROADWAY | | 1,434,737 | | 3,347,719 | | 2,825,469 | | 1,434,737 | | 6,173,188 | | 7,607,924 | | 1,454,367 | | 6,153,557 | | | | 2004 | | | |
| BRICKTOWN PLAZA | | 344,884 | | 1,008,941 | | (307,857 | ) | 344,884 | | 701,084 | | 1,045,968 | | 50,634 | | 995,334 | | | | 2005 | | | |
| BRIDGEWATER PLAZA | | 350,705 | | 1,361,524 | | 6,068,929 | | 350,705 | | 7,430,453 | | 7,781,158 | | 323,509 | | 7,457,649 | | | | 2005 | | | |
| CHERRY HILL | | 2,417,583 | | 6,364,094 | | 1,583,669 | | 2,417,583 | | 7,947,764 | | 10,365,346 | | 6,178,224 | | 4,187,122 | | | | | | 1985 | |
| MARLTON PIKE | | - | | 4,318,534 | | 9,000 | | - | | 4,327,534 | | 4,327,534 | | 1,814,867 | | 2,512,667 | | | | 1996 | | | |
| CINNAMINSON | | 652,123 | | 2,608,491 | | 3,448,659 | | 652,123 | | 6,057,150 | | 6,709,273 | | 2,570,735 | | 4,138,538 | | | | 1996 | | | |
| GARDEN STATE PAVILIONS | | 7,530,709 | | 10,801,949 | | (249,040 | ) | 7,530,709 | | 10,552,909 | | 18,083,618 | | 1,249,226 | | 16,834,392 | | | | 2011 | | | |
| EASTWINDOR VILLAGE | | 9,335,011 | | 23,777,978 | | 63,800 | | 9,335,011 | | 23,841,778 | | 33,176,789 | | 3,196,805 | | 29,979,984 | | - | | 2008 | | | |
| HILLSBOROUGH | | 11,886,809 | | - | | (6,880,755 | ) | 5,006,054 | | - | | 5,006,054 | | - | | 5,006,054 | | | | | | 2001 | |
| HOLMDEL TOWNE CENTER | | 10,824,624 | | 43,301,494 | | 5,002,494 | | 10,824,624 | | 48,303,988 | | 59,128,612 | | 12,618,170 | | 46,510,442 | | 26,182,239 | | 2002 | | | |
| HOLMDEL COMMONS | | 16,537,556 | | 38,759,952 | | 3,442,519 | | 16,537,556 | | 42,202,471 | | 58,740,027 | | 11,798,091 | | 46,941,936 | | 18,964,653 | | 2004 | | | |
| HOWELL PLAZA | | 311,384 | | 1,143,159 | | 4,694,515 | | 311,384 | | 5,837,674 | | 6,149,058 | | 525,817 | | 5,623,240 | | | | 2005 | | | |
| MAPLE SHADE | | - | | 9,957,611 | | (78,995 | ) | - | | 9,878,615 | | 9,878,615 | | 639,957 | | 9,238,659 | | | | 2009 | | | |
| NORTH BRUNSWICK | | 3,204,978 | | 12,819,912 | | 21,300,476 | | 3,204,978 | | 34,120,388 | | 37,325,366 | | 13,175,516 | | 24,149,850 | | 27,001,490 | | 1994 | | | |
| PISCATAWAY TOWN CENTER | | 3,851,839 | | 15,410,851 | | 692,255 | | 3,851,839 | | 16,103,106 | | 19,954,945 | | 6,075,094 | | 13,879,851 | | 10,741,884 | | 1998 | | | |
| RIDGEWOOD | | 450,000 | | 2,106,566 | | 1,015,675 | | 450,000 | | 3,122,241 | | 3,572,241 | | 1,328,600 | | 2,243,641 | | | | 1993 | | | |
| SEA GIRT PLAZA | | 457,039 | | 1,308,010 | | 1,460,149 | | 457,039 | | 2,768,159 | | 3,225,198 | | 219,802 | | 3,005,396 | | | | 2005 | | | |
| UNION CRESCENT | | 7,895,483 | | 3,010,640 | | 25,415,422 | | 8,696,579 | | 27,624,967 | | 36,321,545 | | 5,896,757 | | 30,424,788 | | | | 2007 | | | |
| WESTMONT | | 601,655 | | 2,404,604 | | 10,689,752 | | 601,655 | | 13,094,356 | | 13,696,011 | | 4,742,968 | | 8,953,043 | | | | 1994 | | | |
| WILLOWBROOK PLAZA | | 15,320,436 | | 40,996,874 | | (969,688 | ) | 15,320,436 | | 40,027,186 | | 55,347,622 | | 7,082,874 | | 48,264,747 | | | | 2009 | | | |
| SYCAMORE PLAZA | | 1,404,443 | | 5,613,270 | | 283,450 | | 1,404,443 | | 5,896,720 | | 7,301,163 | | 2,289,963 | | 5,011,200 | | | | 1998 | | | |
| PLAZA PASEO DEL-NORTE | | 4,653,197 | | 18,633,584 | | 1,334,022 | | 4,653,197 | | 19,967,606 | | 24,620,803 | | 7,484,306 | | 17,136,497 | | | | 1998 | | | |
| JUAN TABO, ALBUQUERQUE | | 1,141,200 | | 4,566,817 | | 264,134 | | 1,141,200 | | 4,830,951 | | 5,972,151 | | 1,795,765 | | 4,176,386 | | | | 1998 | | | |
| WARM SPRINGS PROMENADE | | 7,226,363 | | 19,109,946 | | 2,609,141 | | 7,226,363 | | 21,719,087 | | 28,945,450 | | 4,642,620 | | 24,302,830 | | | | 2009 | | | |
| COMP USA CENTER | | 2,581,908 | | 5,798,092 | | (363,745 | ) | 2,581,908 | | 5,434,347 | | 8,016,255 | | 2,767,691 | | 5,248,564 | | 2,749,590 | | 2006 | | | |
| DEL MONTE PLAZA | | 2,489,429 | | 5,590,415 | | 332,589 | | 2,210,000 | | 6,202,433 | | 8,412,434 | | 1,707,367 | | 6,705,067 | | 3,625,911 | | 2006 | | | |
| D'ANDREA MARKETPLACE | | 11,556,067 | | 29,435,364 | | (56,105 | ) | 11,556,067 | | 29,379,259 | | 40,935,327 | | 4,295,084 | | 36,640,243 | | 14,350,098 | | 2007 | | | |
| KEY BANK BUILDING | | 1,500,000 | | 40,486,755 | | - | | 1,500,000 | | 40,486,755 | | 41,986,755 | | 11,581,670 | | 30,405,086 | | 13,967,886 | | 2006 | | | |
| BRIDGEHAMPTON | | 1,811,752 | | 3,107,232 | | 24,873,129 | | 1,858,188 | | 27,933,925 | | 29,792,113 | | 15,789,825 | | 14,002,288 | | 33,628,529 | | | | 1972 | |
| GENOVESE DRUG STORE | | 564,097 | | 2,268,768 | | - | | 564,097 | | 2,268,768 | | 2,832,865 | | 568,249 | | 2,264,616 | | | | 2003 | | | |
| KINGS HIGHWAY | | 2,743,820 | | 6,811,268 | | 1,338,513 | | 2,743,820 | | 8,149,781 | | 10,893,601 | | 2,423,832 | | 8,469,769 | | | | 2004 | | | |
| HOMEPORT-RALPH AVENUE | | 4,414,466 | | 11,339,857 | | 3,227,468 | | 4,414,467 | | 14,567,325 | | 18,981,792 | | 3,378,307 | | 15,603,485 | | | | 2004 | | | |
| BELLMORE | | 1,272,269 | | 3,183,547 | | 381,803 | | 1,272,269 | | 3,565,350 | | 4,837,619 | | 999,255 | | 3,838,364 | | 78,209 | | 2004 | | | |
| MARKET AT BAY SHORE | | 12,359,621 | | 30,707,802 | | 1,145,127 | | 12,359,621 | | 31,852,929 | | 44,212,550 | | 8,591,642 | | 35,620,908 | | | | 2006 | | | |
| 5959 BROADWAY | | 6,035,726 | | - | | (2,612,192 | ) | 3,405,334 | | 18,200 | | 3,423,534 | | 4,651 | | 3,418,883 | | | | 2008 | | | |
| KEY FOOD OPERATOR ATLANTIC AVE | | 2,272,500 | | 5,624,589 | | - | | 2,272,500 | | 5,624,589 | | 7,897,089 | | - | | 7,897,089 | | | | 2012 | | | |
| KING KULLEN PLAZA | | 5,968,082 | | 23,243,404 | | 4,934,985 | | 5,980,130 | | 28,166,341 | | 34,146,471 | | 9,678,626 | | 24,467,845 | | | | 1998 | | | |
| PATHMARK SC | | 6,714,664 | | 17,359,161 | | 526,939 | | 6,714,664 | | 17,886,100 | | 24,600,764 | | 4,018,260 | | 20,582,504 | | - | | 2006 | | | |
| BIRCHWOOD PLAZA COMMACK | | 3,630,000 | | 4,774,791 | | 274,672 | | 3,630,000 | | 5,049,463 | | 8,679,463 | | 1,299,251 | | 7,380,213 | | | | 2007 | | | |
| ELMONT | | 3,011,658 | | 7,606,066 | | 2,204,704 | | 3,011,658 | | 9,810,769 | | 12,822,428 | | 2,597,309 | | 10,225,118 | | | | 2004 | | | |
| FRANKLIN SQUARE | | 1,078,541 | | 2,516,581 | | 3,835,813 | | 1,078,541 | | 6,352,394 | | 7,430,934 | | 1,296,602 | | 6,134,332 | | | | 2004 | | | |
| KISSENA BOULEVARD SC | | 11,610,000 | | 2,933,487 | | 1,519 | | 11,610,000 | | 2,935,006 | | 14,545,006 | | 807,978 | | 13,737,027 | | | | 2007 | | | |
| HAMPTON BAYS | | 1,495,105 | | 5,979,320 | | 3,304,710 | | 1,495,105 | | 9,284,031 | | 10,779,135 | | 5,186,357 | | 5,592,778 | | | | 1989 | | | |
| HICKSVILLE | | 3,542,739 | | 8,266,375 | | 1,327,458 | | 3,542,739 | | 9,593,833 | | 13,136,572 | | 2,654,197 | | 10,482,376 | | | | 2004 | | | |
| TURNPIKE PLAZA | | 2,471,832 | | 5,839,416 | | 125,480 | | 2,471,832 | | 5,964,896 | | 8,436,728 | | 1,097,876 | | 7,338,852 | | | | 2011 | | | |
| BIRCHWOOD PLAZA (NORTH & SOUTH) | | 12,368,330 | | 33,071,495 | | 224,943 | | 12,368,330 | | 33,296,439 | | 45,664,769 | | 5,969,361 | | 39,695,407 | | 12,364,313 | | 2007 | | | |
| 501 NORTH BROADWAY | | - | | 1,175,543 | | 607 | | - | | 1,176,150 | | 1,176,150 | | 593,997 | | 582,153 | | | | 2007 | | | |
| MERRYLANE (P/L) | | 1,485,531 | | 1,749 | | 539 | | 1,485,531 | | 2,288 | | 1,487,819 | | 208 | | 1,487,611 | | | | 2007 | | | |
| FAMILY DOLLAR UNION TURNPIKE | | 909,000 | | 2,249,775 | | - | | 909,000 | | 2,249,775 | | 3,158,775 | | - | | 3,158,775 | | | | 2012 | | | |
| DOUGLASTON SHOPPING CENTER | | 3,277,254 | | 13,161,218 | | 3,777,781 | | 3,277,253 | | 16,939,000 | | 20,216,253 | | 3,897,231 | | 16,319,023 | | | | 2003 | | | |
| KEY FOOD OPERATOR 21ST STREET | | 1,090,800 | | 2,699,730 | | - | | 1,090,800 | | 2,699,730 | | 3,790,530 | | - | | 3,790,530 | | | | 2012 | | | |
| MANHASSET VENTURE LLC | | 4,567,003 | | 19,165,808 | | 24,661,004 | | 3,471,939 | | 44,921,876 | | 48,393,816 | | 17,724,834 | | 30,668,982 | | | | 1999 | | | |
| MANHASSET CENTER (residential) | | 950,000 | | - | | - | | 950,000 | | - | | 950,000 | | - | | 950,000 | | | | 2012 | | | |
| MASPETH QUEENS-DUANE READE | | 1,872,013 | | 4,827,940 | | 931,187 | | 1,872,013 | | 5,759,126 | | 7,631,139 | | 1,472,344 | | 6,158,795 | | | | 2004 | | | |
| MASSAPEQUA | | 1,880,816 | | 4,388,549 | | 964,761 | | 1,880,816 | | 5,353,310 | | 7,234,126 | | 1,594,788 | | 5,639,337 | | | | 2004 | | | |
| MINEOLA SC | | 4,150,000 | | 7,520,692 | | (413,995 | ) | 4,150,000 | | 7,106,697 | | 11,256,697 | | 1,506,875 | | 9,749,822 | | | | 2007 | | | |
| BIRCHWOOD PARK DRIVE (LAND LOT) | | 3,507,162 | | 4,126 | | 49,191 | | 3,507,406 | | 53,074 | | 3,560,480 | | 466 | | 3,560,014 | | | | 2007 | | | |
| SMITHTOWN PLAZA | | 3,528,000 | | 7,364,098 | | 289,959 | | 3,528,000 | | 7,654,056 | | 11,182,056 | | 885,427 | | 10,296,630 | | - | | 2009 | | | |
| 4452 BROADWAY | | 12,412,724 | | - | | (5,400,000 | ) | 7,012,724 | | - | | 7,012,724 | | - | | 7,012,724 | | | | 2007 | | | |
| PREF. EQUITY-30 WEST 21ST STREET | | 6,250,000 | | 21,974,274 | | 11,441,353 | | 6,250,000 | | 33,415,627 | | 39,665,627 | | 2,291,319 | | 37,374,308 | | - | | 2007 | | | |
| PLAINVIEW | | 263,693 | | 584,031 | | 9,810,734 | | 263,693 | | 10,394,766 | | 10,658,458 | | 5,253,472 | | 5,404,986 | | 13,372,058 | | | | 1969 | |
| POUGHKEEPSIE | | 876,548 | | 4,695,659 | | 13,008,483 | | 876,548 | | 17,704,142 | | 18,580,690 | | 8,630,708 | | 9,949,982 | | 15,055,537 | | | | 1972 | |
| SYOSSET, NY | | 106,655 | | 76,197 | | 1,551,676 | | 106,655 | | 1,627,873 | | 1,734,528 | | 987,021 | | 747,507 | | | | | | 1990 | |
| STATEN ISLAND | | 2,280,000 | | 9,027,951 | | 7,421,413 | | 2,280,000 | | 16,449,364 | | 18,729,364 | | 9,386,052 | | 9,343,312 | | | | 1989 | | | |
| STATEN ISLAND | | 2,940,000 | | 11,811,964 | | 1,191,309 | | 3,148,424 | | 12,794,849 | | 15,943,273 | | 4,920,384 | | 11,022,889 | | | | 1997 | | | |
| STATEN ISLAND PLAZA | | 5,600,744 | | 6,788,460 | | (1,553,829 | ) | 5,600,744 | | 5,234,632 | | 10,835,375 | | 303,161 | | 10,532,215 | | | | 2005 | | | |
| HYLAN PLAZA | | 28,723,536 | | 38,232,267 | | 33,893,096 | | 28,723,536 | | 72,125,364 | | 100,848,899 | | 19,716,591 | | 81,132,308 | | | | 2006 | | | |
| STOP N SHOP STATEN ISLAND | | 4,558,592 | | 10,441,408 | | 155,848 | | 4,558,592 | | 10,597,256 | | 15,155,848 | | 2,977,858 | | 12,177,990 | | | | 2005 | | | |
| KEY FOOD OPERATOR CENTRAL AVE. | | 2,787,600 | | 6,899,310 | | - | | 2,787,600 | | 6,899,310 | | 9,686,910 | | - | | 9,686,910 | | | | 2012 | | | |
| WHITE PLAINS | | 1,777,775 | | 4,453,894 | | 2,010,606 | | 1,777,775 | | 6,464,500 | | 8,242,274 | | 1,783,336 | | 6,458,938 | | 2,956,088 | | 2004 | | | |
| CHAMPION FOOD SUPERMARKET | | 757,500 | | 1,874,813 | | - | | 757,500 | | 1,874,813 | | 2,632,313 | | - | | 2,632,313 | | | | 2012 | | | |
| YONKERS | | 871,977 | | 3,487,909 | | - | | 871,977 | | 3,487,909 | | 4,359,886 | | 1,773,622 | | 2,586,264 | | | | 1998 | | | |
| STRAUSS ROMAINE AVENUE | | 782,459 | | 1,825,737 | | 586,255 | | 782,459 | | 2,411,992 | | 3,194,451 | | 303,737 | | 2,890,714 | | | | 2005 | | | |
| BEAVERCREEK | | 635,228 | | 3,024,722 | | 4,205,673 | | 635,228 | | 7,230,395 | | 7,865,623 | | 4,633,238 | | 3,232,385 | | | | 1986 | | | |
| OLENTANGY RIVER RD. | | 764,517 | | 1,833,600 | | 2,340,830 | | 764,517 | | 4,174,430 | | 4,938,947 | | 3,554,751 | | 1,384,196 | | | | 1988 | | | |
| MONTGOMERY PLAZA | | 530,893 | | 1,302,656 | | 3,226,699 | | 530,893 | | 4,529,354 | | 5,060,248 | | 414,150 | | 4,646,098 | | | | 2005 | | | |
| KENT, OH | | 6,254 | | 3,028,914 | | - | | 6,254 | | 3,028,914 | | 3,035,168 | | 1,967,433 | | 1,067,735 | | | | 1999 | | | |
| KENT | | 2,261,530 | | - | | - | | 2,261,530 | | - | | 2,261,530 | | - | | 2,261,530 | | | | 1995 | | | |
| NORTH OLMSTED | | 626,818 | | 3,712,045 | | 35,000 | | 626,818 | | 3,747,045 | | 4,373,862 | | 2,635,775 | | 1,738,087 | | | | 1999 | | | |
| ORANGE OHIO | | 3,783,875 | | - | | (2,342,306 | ) | 921,704 | | 519,865 | | 1,441,569 | | - | | 1,441,569 | | | | | | 2001 | |
| EDMOND | | 477,036 | | 3,591,493 | | 375,195 | | 477,036 | | 3,966,688 | | 4,443,724 | | 1,401,219 | | 3,042,505 | | | | 1997 | | | |
| CENTENNIAL PLAZA | | 4,650,634 | | 18,604,307 | | 437,071 | | 4,650,634 | | 19,041,378 | | 23,692,012 | | 8,114,100 | | 15,577,912 | | | | 1998 | | | |
| CANBY SQUARE SHOPPING CENTER | | 2,727,000 | | 4,347,500 | | (180,402 | ) | 2,727,000 | | 4,167,098 | | 6,894,098 | | 1,058,383 | | 5,835,714 | | | | 2009 | | | |
| OREGON TRAIL CENTER | | 5,802,422 | | 12,622,879 | | (164,516 | ) | 5,802,422 | | 12,458,362 | | 18,260,784 | | 2,835,919 | | 15,424,866 | | | | 2009 | | | |
| | | INITIAL COST | | SUBSEQUENT | | | | | | | | | | TOTAL COST, NET OF | | | | | | | |
| | | | | BUILDING & | | TO | | | | BUILDING & | | | | ACCUMULATED | | ACCUMULATED | | | | DATE OF | | DATE OF | |
| PROPERTIES | | LAND | | IMPROVEMENT | | ACQUISITION | | LAND | | IMPROVEMENT | | TOTAL | | DEPRECIATION | | DEPRECIATION | | ENCUMBRANCES | | ACQUISITION | | CONSTRUCTION | |
| POWELL VALLEY JUNCTION | | 5,062,500 | | 3,152,982 | | (2,801,856 | ) | 2,035,125 | | 3,378,501 | | 5,413,626 | | 913,731 | | 4,499,895 | | | | 2009 | | | |
| MEDFORD CENTER | | 8,940,798 | | 16,995,113 | | 46,881 | | 8,943,600 | | 17,039,192 | | 25,982,792 | | 3,765,357 | | 22,217,435 | | | | 2009 | | | |
| MCMINNVILLE | | 4,062,327 | | - | | 881,473 | | 4,062,327 | | 881,473 | | 4,943,800 | | 18,895 | | 4,924,906 | | | | | | 2006 | |
| PIONEER PLAZA | | 952,740 | | 6,638,583 | | 3,012,460 | | 3,982,020 | | 6,621,763 | | 10,603,783 | | 2,039,818 | | 8,563,965 | | | | 2009 | | | |
| ALLEGHENY | | - | | 30,061,177 | | 59,094 | | - | | 30,120,271 | | 30,120,271 | | 6,162,210 | | 23,958,061 | | | | 2004 | | | |
| SUBURBAN SQUARE | | 70,679,871 | | 166,351,381 | | 4,358,017 | | 71,279,871 | | 170,109,398 | | 241,389,270 | | 34,626,138 | | 206,763,132 | | | | 2007 | | | |
| CHIPPEWA | | 2,881,525 | | 11,526,101 | | 153,289 | | 2,881,525 | | 11,679,391 | | 14,560,916 | | 3,911,007 | | 10,649,909 | | 5,919,679 | | 2000 | | | |
| BROOKHAVEN PLAZA | | 254,694 | | 973,318 | | (61,414 | ) | 254,694 | | 911,903 | | 1,166,598 | | 72,032 | | 1,094,565 | | | | 2005 | | | |
| CARNEGIE | | - | | 3,298,908 | | 17,747 | | - | | 3,316,655 | | 3,316,655 | | 1,105,552 | | 2,211,103 | | | | 1999 | | | |
| CENTER SQUARE | | 731,888 | | 2,927,551 | | 1,269,064 | | 731,888 | | 4,196,615 | | 4,928,503 | | 2,250,128 | | 2,678,375 | | | | 1996 | | | |
| WAYNE PLAZA | | 6,127,623 | | 15,605,012 | | 210,038 | | 6,135,670 | | 15,807,004 | | 21,942,674 | | 2,118,606 | | 19,824,068 | | 13,803,320 | | 2008 | | | |
| CHAMBERSBURG CROSSING | | 9,090,288 | | - | | 26,037,242 | | 8,790,288 | | 26,337,242 | | 35,127,530 | | 4,038,945 | | 31,088,585 | | | | | | 2006 | |
| DEVON VILLAGE | | 4,856,379 | | 25,846,910 | | - | | 4,856,379 | | 25,846,910 | | 30,703,289 | | 407,493 | | 30,295,795 | | | | 2012 | | | |
| EAST STROUDSBURG | | 1,050,000 | | 2,372,628 | | 1,434,371 | | 1,050,000 | | 3,806,999 | | 4,856,999 | | 2,985,664 | | 1,871,335 | | | | | | 1973 | |
| RIDGE PIKE PLAZA | | 1,525,337 | | 4,251,732 | | 3,016,678 | | 1,525,337 | | 7,268,410 | | 8,793,747 | | 1,152,303 | | 7,641,444 | | | | 2008 | | | |
| EXTON | | 176,666 | | 4,895,360 | | - | | 176,666 | | 4,895,360 | | 5,072,026 | | 1,631,787 | | 3,440,239 | | | | 1999 | | | |
| EXTON | | 731,888 | | 2,927,551 | | - | | 731,888 | | 2,927,551 | | 3,659,439 | | 1,226,069 | | 2,433,370 | | | | 1996 | | | |
| EASTWICK | | 889,001 | | 2,762,888 | | 3,074,728 | | 889,001 | | 5,837,616 | | 6,726,617 | | 2,271,015 | | 4,455,603 | | 4,258,331 | | 1997 | | | |
| EXTON PLAZA | | 294,378 | | 1,404,778 | | 338,373 | | 130,246 | | 1,907,284 | | 2,037,529 | | 175,108 | | 1,862,422 | | | | 2005 | | | |
| FEASTERVILLE | | 520,521 | | 2,082,083 | | 2,593,014 | | 520,521 | | 4,675,097 | | 5,195,618 | | 887,834 | | 4,307,784 | | | | 1996 | | | |
| GETTYSBURG | | 74,626 | | 671,630 | | 101,519 | | 74,626 | | 773,149 | | 847,775 | | 750,878 | | 96,897 | | | | 1986 | | | |
| HARRISBURG, PA | | 452,888 | | 6,665,238 | | 3,969,364 | | 452,888 | | 10,634,601 | | 11,087,489 | | 7,428,586 | | 3,658,903 | | | | 2002 | | | |
| HAMBURG | | 439,232 | | - | | 2,023,428 | | 494,982 | | 1,967,677 | | 2,462,660 | | 543,391 | | 1,919,269 | | 2,062,577 | | | | 2000 | |
| HAVERTOWN | | 731,888 | | 2,927,551 | | - | | 731,888 | | 2,927,551 | | 3,659,439 | | 1,226,069 | | 2,433,370 | | | | 1996 | | | |
| NORRISTOWN | | 686,134 | | 2,664,535 | | 3,751,641 | | 774,084 | | 6,328,226 | | 7,102,310 | | 4,249,355 | | 2,852,956 | | | | 1984 | | | |
| NEW KENSINGTON | | 521,945 | | 2,548,322 | | 705,540 | | 521,945 | | 3,253,862 | | 3,775,807 | | 2,939,109 | | 836,698 | | | | 1986 | | | |
| PHILADELPHIA | | 731,888 | | 2,927,551 | | - | | 731,888 | | 2,927,551 | | 3,659,439 | | 1,226,069 | | 2,433,370 | | | | 1996 | | | |
| PHILADELPHIA PLAZA | | 209,197 | | 1,373,843 | | 16,952 | | 209,197 | | 1,390,795 | | 1,599,992 | | 125,900 | | 1,474,093 | | | | 2005 | | | |
| STRAUSS WASHINGTON AVENUE | | 424,659 | | 990,872 | | 468,821 | | 424,659 | | 1,459,693 | | 1,884,352 | | 363,424 | | 1,520,928 | | | | 2005 | | | |
| WEXFORD PLAZA | | 6,413,635 | | 9,774,600 | | 5,413,946 | | 6,413,635 | | 15,188,547 | | 21,602,182 | | 1,742,241 | | 19,859,940 | | 12,500,000 | | 2010 | | | |
| 242-244 MARKET STREET | | 704,263 | | 2,117,182 | | 290,927 | | 704,263 | | 2,408,109 | | 3,112,372 | | 104,290 | | 3,008,082 | | | | 2007 | | | |
| 1401 WALNUT ST LOWER ESTATE - UNIT A | | - | | 7,001,199 | | 173,928 | | - | | 7,175,127 | | 7,175,127 | | 1,113,355 | | 6,061,771 | | | | 2008 | | | |
| 1401 WALNUT ST LOWER ESTATE | | - | | 32,081,992 | | (256,606 | ) | - | | 31,825,386 | | 31,825,386 | | 3,417,725 | | 28,407,661 | | | | 2008 | | | |
| 1831-33 CHESTNUT STREET | | 1,982,143 | | 5,982,231 | | (601,274 | ) | 1,740,416 | | 5,622,684 | | 7,363,100 | | 258,238 | | 7,104,862 | | | | 2007 | | | |
| 1429 WALNUT STREET-COMMERCIAL | | 5,881,640 | | 17,796,661 | | (17,251,273 | ) | 4,530,789 | | 1,896,240 | | 6,427,029 | | 1,776,743 | | 4,650,286 | | 6,705,528 | | 2008 | | | |
| 1805 WALNUT STREET UNIT A | | - | | 17,311,529 | | 2,929,832 | | - | | 20,241,360 | | 20,241,360 | | 424,388 | | 19,816,972 | | | | 2008 | | | |
| RICHBORO | | 788,761 | | 3,155,044 | | 12,694,159 | | 976,439 | | 15,661,524 | | 16,637,964 | | 8,557,940 | | 8,080,024 | | 9,353,995 | | 1986 | | | |
| SPRINGFIELD | | 919,998 | | 4,981,589 | | 10,121,925 | | 920,000 | | 15,103,512 | | 16,023,512 | | 6,559,055 | | 9,464,457 | | | | 1983 | | | |
| UPPER DARBY | | 231,821 | | 927,286 | | 5,779,270 | | 231,821 | | 6,706,556 | | 6,938,377 | | 2,604,689 | | 4,333,688 | | 3,345,831 | | 1996 | | | |
| WEST MIFFLIN | | 1,468,342 | | - | | - | | 1,468,342 | | - | | 1,468,342 | | - | | 1,468,342 | | | | 1986 | | | |
| WHITEHALL | | - | | 5,195,577 | | - | | - | | 5,195,577 | | 5,195,577 | | 2,175,926 | | 3,019,651 | | | | 1996 | | | |
| W. MARKET ST. | | 188,562 | | 1,158,307 | | - | | 188,562 | | 1,158,307 | | 1,346,869 | | 1,158,307 | | 188,562 | | | | 1986 | | | |
| REXVILLE TOWN CENTER | | 24,872,982 | | 48,688,161 | | 6,073,121 | | 25,678,064 | | 53,956,200 | | 79,634,264 | | 19,860,598 | | 59,773,666 | | 39,022,236 | | 2006 | | | |
| PLAZA CENTRO - COSTCO | | 3,627,973 | | 10,752,213 | | 1,554,239 | | 3,866,206 | | 12,068,219 | | 15,934,425 | | 5,303,539 | | 10,630,885 | | | | 2006 | | | |
| PLAZA CENTRO - MALL | | 19,873,263 | | 58,719,179 | | 7,435,470 | | 19,408,112 | | 66,619,799 | | 86,027,911 | | 28,394,791 | | 57,633,121 | | | | 2006 | | | |
| PLAZA CENTRO - RETAIL | | 5,935,566 | | 16,509,748 | | 2,482,741 | | 6,026,070 | | 18,901,985 | | 24,928,055 | | 8,212,600 | | 16,715,455 | | | | 2006 | | | |
| PLAZA CENTRO - SAM'S CLUB | | 6,643,224 | | 20,224,758 | | 2,356,555 | | 6,520,090 | | 22,704,447 | | 29,224,537 | | 20,944,334 | | 8,280,203 | | | | 2006 | | | |
| LOS COLOBOS - BUILDERS SQUARE | | 4,404,593 | | 9,627,903 | | 1,378,199 | | 4,461,145 | | 10,949,550 | | 15,410,696 | | 6,255,889 | | 9,154,807 | | | | 2006 | | | |
| LOS COLOBOS - KMART | | 4,594,944 | | 10,120,147 | | 743,305 | | 4,402,338 | | 11,056,057 | | 15,458,396 | | 6,510,717 | | 8,947,679 | | | | 2006 | | | |
| LOS COLOBOS I | | 12,890,882 | | 26,046,669 | | 3,340,866 | | 13,613,375 | | 28,665,042 | | 42,278,417 | | 12,145,876 | | 30,132,541 | | | | 2006 | | | |
| LOS COLOBOS II | | 14,893,698 | | 30,680,556 | | 3,367,798 | | 15,142,300 | | 33,799,752 | | 48,942,052 | | 14,422,685 | | 34,519,367 | | | | 2006 | | | |
| WESTERN PLAZA - MAYAQUEZ ONE | | 10,857,773 | | 12,252,522 | | 1,296,644 | | 11,241,993 | | 13,164,945 | | 24,406,939 | | 5,724,931 | | 18,682,007 | | | | 2006 | | | |
| WESTERN PLAZA - MAYAGUEZ TWO | | 16,874,345 | | 19,911,045 | | 1,732,421 | | 16,872,647 | | 21,645,164 | | 38,517,811 | | 9,464,269 | | 29,053,542 | | | | 2006 | | | |
| MANATI VILLA MARIA SC | | 2,781,447 | | 5,673,119 | | 417,977 | | 2,606,588 | | 6,265,955 | | 8,872,543 | | 3,505,919 | | 5,366,624 | | | | 2006 | | | |
| PONCE TOWN CENTER | | 14,432,778 | | 28,448,754 | | 4,972,360 | | 14,903,024 | | 32,950,868 | | 47,853,893 | | 8,985,068 | | 38,868,825 | | 22,728,601 | | 2006 | | | |
| TRUJILLO ALTO PLAZA | | 12,053,673 | | 24,445,858 | | 3,847,438 | | 12,289,288 | | 28,057,682 | | 40,346,970 | | 14,827,153 | | 25,519,817 | | | | 2006 | | | |
| MARSHALL PLAZA, CRANSTON RI | | 1,886,600 | | 7,575,302 | | 1,771,187 | | 1,886,600 | | 9,346,489 | | 11,233,089 | | 3,821,835 | | 7,411,254 | | | | 1998 | | | |
| CHARLESTON | | 730,164 | | 3,132,092 | | 18,725,743 | | 730,164 | | 21,857,835 | | 22,587,999 | | 6,357,742 | | 16,230,257 | | | | | | 1978 | |
| CHARLESTON | | 1,744,430 | | 6,986,094 | | 4,308,629 | | 1,744,430 | | 11,294,723 | | 13,039,153 | | 4,681,114 | | 8,358,040 | | | | 1995 | | | |
| FLORENCE | | 1,465,661 | | 6,011,013 | | 849,832 | | 1,465,661 | | 6,860,845 | | 8,326,506 | | 2,476,193 | | 5,850,313 | | | | 1997 | | | |
| GREENVILLE | | 2,209,812 | | 8,850,864 | | 887,322 | | 2,209,811 | | 9,738,187 | | 11,947,998 | | 3,849,666 | | 8,098,332 | | | | 1997 | | | |
| CHERRYDALE POINT | | 5,801,948 | | 32,055,019 | | 1,165,166 | | 5,801,948 | | 33,220,185 | | 39,022,133 | | 3,676,308 | | 35,345,825 | | - | | 2009 | | | |
| WOODRUFF SHOPPING CENTER | | 3,110,439 | | 15,501,117 | | 1,182,533 | | 3,465,199 | | 16,328,890 | | 19,794,089 | | 980,086 | | 18,814,003 | | | | 2010 | | | |
| FOREST PARK | | 1,920,241 | | 9,544,875 | | - | | 1,920,241 | | 9,544,875 | | 11,465,115 | | 183,040 | | 11,282,075 | | | | 2012 | | | |
| MADISON | | - | | 4,133,904 | | 2,880,678 | | - | | 7,014,582 | | 7,014,582 | | 5,461,380 | | 1,553,202 | | | | | | 1978 | |
| HICKORY RIDGE COMMONS | | 596,347 | | 2,545,033 | | (2,404,809 | ) | 683,820 | | 52,750 | | 736,571 | | 15,667 | | 720,903 | | | | 2000 | | | |
| TROLLEY STATION | | 3,303,682 | | 13,218,740 | | 203,711 | | 3,303,682 | | 13,422,451 | | 16,726,133 | | 4,909,872 | | 11,816,262 | | | | 1998 | | | |
| MARKET PLACE AT RIVERGATE | | 2,574,635 | | 10,339,449 | | 1,544,098 | | 2,574,635 | | 11,883,547 | | 14,458,182 | | 4,616,355 | | 9,841,827 | | | | 1998 | | | |
| RIVERGATE, TN | | 3,038,561 | | 12,157,408 | | 3,914,995 | | 3,038,561 | | 16,072,403 | | 19,110,964 | | 5,793,057 | | 13,317,907 | | | | 1998 | | | |
| CENTER OF THE HILLS, TX | | 2,923,585 | | 11,706,145 | | 1,106,611 | | 2,923,585 | | 12,812,756 | | 15,736,341 | | 5,106,895 | | 10,629,446 | | 9,876,829 | | 2008 | | | |
| ARLINGTON | | 3,160,203 | | 2,285,378 | | 490,738 | | 3,160,203 | | 2,776,116 | | 5,936,320 | | 891,995 | | 5,044,325 | | | | 1997 | | | |
| DOWLEN CENTER | | 2,244,581 | | - | | (722,251 | ) | 484,828 | | 1,037,502 | | 1,522,330 | | 87,738 | | 1,434,592 | | | | | | 2002 | |
| GATEWAY STATION | | 1,373,692 | | 28,145,158 | | 14,389 | | 1,374,880 | | 28,158,358 | | 29,533,238 | | 903,104 | | 28,630,133 | | - | | 2011 | | | |
| BAYTOWN | | 500,422 | | 2,431,651 | | 681,655 | | 500,422 | | 3,113,306 | | 3,613,728 | | 1,201,001 | | 2,412,727 | | | | 1996 | | | |
| LAS TIENDAS PLAZA | | 8,678,107 | | - | | 25,971,206 | | 7,943,925 | | 26,705,388 | | 34,649,313 | | 2,393,126 | | 32,256,187 | | | | | | 2005 | |
| CORPUS CHRISTI, TX | | - | | 944,562 | | 3,526,281 | | - | | 4,470,843 | | 4,470,843 | | 1,216,263 | | 3,254,579 | | | | 1997 | | | |
| ISLAND GATE PLAZA | | 4,343,000 | | 4,723,215 | | 230,224 | | 4,343,000 | | 4,953,438 | | 9,296,438 | | 293,813 | | 9,002,625 | | | | 2011 | | | |
| PRESTON LEBANON CROSSING | | 13,552,180 | | - | | 25,307,090 | | 12,163,694 | | 26,695,576 | | 38,859,270 | | 2,377,064 | | 36,482,206 | | | | | | 2006 | |
| LAKE PRAIRIE TOWN CROSSING | | 7,897,491 | | - | | 24,220,124 | | 6,783,464 | | 25,334,151 | | 32,117,615 | | 2,783,528 | | 29,334,087 | | | | | | 2006 | |
| CENTER AT BAYBROOK | | 6,941,017 | | 27,727,491 | | 9,849,161 | | 7,063,186 | | 37,454,483 | | 44,517,669 | | 11,379,867 | | 33,137,802 | | | | 1998 | | | |
| HARRIS COUNTY | | 1,843,000 | | 7,372,420 | | 2,272,522 | | 2,003,260 | | 9,484,682 | | 11,487,942 | | 3,459,942 | | 8,028,000 | | | | 1997 | | | |
| CYPRESS TOWNE CENTER | | 6,033,932 | | - | | 1,041,845 | | 2,251,666 | | 4,824,111 | | 7,075,777 | | 211,531 | | 6,864,246 | | | | | | 2003 | |
| SHOPS AT VISTA RIDGE | | 3,257,199 | | 13,029,416 | | 332,552 | | 3,257,199 | | 13,361,967 | | 16,619,167 | | 5,201,257 | | 11,417,909 | | | | 1998 | | | |
| VISTA RIDGE PLAZA | | 2,926,495 | | 11,716,483 | | 2,239,786 | | 2,926,495 | | 13,956,270 | | 16,882,764 | | 5,297,941 | | 11,584,823 | | | | 1998 | | | |
| VISTA RIDGE PHASE II | | 2,276,575 | | 9,106,300 | | 1,226,061 | | 2,276,575 | | 10,332,361 | | 12,608,936 | | 3,536,613 | | 9,072,324 | | | | 1998 | | | |
| SOUTH PLAINES PLAZA, TX | | 1,890,000 | | 7,555,099 | | 444,355 | | 1,890,000 | | 7,999,454 | | 9,889,454 | | 2,978,446 | | 6,911,008 | | | | 1998 | | | |
| LAKE JACKSON | | 1,562,328 | | 4,144,212 | | - | | 1,562,328 | | 4,144,212 | | 5,706,540 | | 153,224 | | 5,553,316 | | | | 2012 | | | |
| MESQUITE | | 520,340 | | 2,081,356 | | 1,081,051 | | 520,340 | | 3,162,408 | | 3,682,747 | | 1,360,886 | | 2,321,862 | | | | 1995 | | | |
| MESQUITE TOWN CENTER | | 3,757,324 | | 15,061,644 | | 2,394,853 | | 3,757,324 | | 17,456,497 | | 21,213,821 | | 6,637,964 | | 14,575,857 | | | | 1998 | | | |
| | | INITIAL COST | | SUBSEQUENT | | | | | | | | | | TOTAL COST, NET OF | | | | | | | |
| | | | | BUILDING & | | TO | | | | BUILDING & | | | | ACCUMULATED | | ACCUMULATED | | | | DATE OF | | DATE OF | |
| PROPERTIES | | LAND | | IMPROVEMENT | | ACQUISITION | | LAND | | IMPROVEMENT | | TOTAL | | DEPRECIATION | | DEPRECIATION | | ENCUMBRANCES | | ACQUISITION | | CONSTRUCTION | |
| NEW BRAUNSFELS | | 840,000 | | 3,360,000 | | - | | 840,000 | | 3,360,000 | | 4,200,000 | | 820,144 | | 3,379,856 | | | | 2003 | | | |
| PARKER PLAZA | | 7,846,946 | | - | | - | | 7,846,946 | | - | | 7,846,946 | | - | | 7,846,946 | | | | | | 2005 | |
| PLANO | | 500,414 | | 2,830,835 | | - | | 500,414 | | 2,830,835 | | 3,331,249 | | 1,174,107 | | 2,157,142 | | | | 1996 | | | |
| SOUTHLAKE OAKS | | 3,011,260 | | 7,703,844 | | (62,791 | ) | 3,019,951 | | 7,632,363 | | 10,652,313 | | 2,009,778 | | 8,642,536 | | 6,192,143 | | 2008 | | | |
| WOODBRIDGE SHOPPING CENTER | | 2,568,705 | | 6,813,716 | | - | | 2,568,705 | | 6,813,716 | | 9,382,421 | | 222,553 | | 9,159,869 | | | | 2012 | | | |
| WEST OAKS | | 500,422 | | 2,001,687 | | 325,191 | | 500,422 | | 2,326,878 | | 2,827,300 | | 875,080 | | 1,952,220 | | | | 1996 | | | |
| OGDEN | | 213,818 | | 855,275 | | 4,084,007 | | 850,699 | | 4,302,401 | | 5,153,100 | | 1,960,182 | | 3,192,918 | | | | | | 1967 | |
| COLONIAL HEIGHTS | | 125,376 | | 3,476,073 | | 294,598 | | 125,376 | | 3,770,671 | | 3,896,047 | | 1,241,353 | | 2,654,695 | | | | 1999 | | | |
| OLD TOWN VILLAGE | | 4,500,000 | | 41,569,735 | | (2,194,866 | ) | 4,300,819 | | 39,574,050 | | 43,874,869 | | 2,185,444 | | 41,689,424 | | | | 2007 | | | |
| RICHMOND | | 82,544 | | 2,289,288 | | 280,600 | | 82,544 | | 2,569,889 | | 2,652,432 | | 727,619 | | 1,924,813 | | | | 1999 | | | |
| RICHMOND | | 670,500 | | 2,751,375 | | - | | 670,500 | | 2,751,375 | | 3,421,875 | | 1,241,294 | | 2,180,580 | | | | 1995 | | | |
| VALLEY VIEW SHOPPING CENTER | | 3,440,018 | | 8,054,004 | | 922,790 | | 3,440,018 | | 8,976,794 | | 12,416,812 | | 1,945,689 | | 10,471,123 | | | | 2004 | | | |
| POTOMAC RUN PLAZA | | 27,369,515 | | 48,451,209 | | (639,454 | ) | 27,369,515 | | 47,811,755 | | 75,181,270 | | 10,338,425 | | 64,842,845 | | 40,997,953 | | 2008 | | | |
| MANCHESTER SHOPPING CENTER | | 2,722,461 | | 6,403,866 | | 639,555 | | 2,722,461 | | 7,043,421 | | 9,765,882 | | 2,278,877 | | 7,487,005 | | | | 2004 | | | |
| AUBURN NORTH | | 7,785,841 | | 18,157,625 | | 60,221 | | 7,785,841 | | 18,217,846 | | 26,003,688 | | 5,120,435 | | 20,883,253 | | | | 2007 | | | |
| FRONTIER VILLAGE SHOPPING CTR. | | 10,750,863 | | 34,566,734 | | 96,299 | | 10,750,863 | | 34,663,033 | | 45,413,896 | | 936,452 | | 44,477,445 | | 32,418,427 | | 2012 | | | |
| OLYMPIA WEST OUTPARCEL | | 360,000 | | 799,640 | | 40,360 | | 360,000 | | 840,000 | | 1,200,000 | | 15,400 | | 1,184,600 | | | | 2012 | | | |
| SILVERDALE PLAZA | | 3,875,013 | | 32,083,427 | | 205,450 | | 3,875,013 | | 32,288,878 | | 36,163,890 | | 907,828 | | 35,256,063 | | 25,050,616 | | 2012 | | | |
| CHARLES TOWN | | 602,000 | | 3,725,871 | | 11,269,416 | | 602,000 | | 14,995,287 | | 15,597,287 | | 8,669,491 | | 6,927,796 | | | | 1985 | | | |
| BLUE RIDGE | | 12,346,900 | | 71,529,796 | | (8,432,419 | ) | 17,608,591 | | 57,835,686 | | 75,444,277 | | 16,200,943 | | 59,243,334 | | 14,561,754 | | 2005 | | | |
| MICROPROPERTIES | | 24,206,390 | | 56,481,576 | | - | | 24,206,390 | | 56,481,576 | | 80,687,966 | | 2,096,513 | | 78,591,453 | | | | 2012 | | | |
| BRAZIL-RIO CLARO | | 1,300,000 | | - | | 3,772,616 | | 1,485,574 | | 3,587,042 | | 5,072,616 | | 255,004 | | 4,817,612 | | | | | | 2009 | |
| BRAZIL-VALINHOS | | 5,204,507 | | 14,997,200 | | 7,368,362 | | 1,777,214 | | 25,792,855 | | 27,570,069 | | 1,073,687 | | 26,496,382 | | | | | | 2008 | |
| CHILE-EKONO | | 414,730 | | - | | 782,802 | | 477,858 | | 719,674 | | 1,197,532 | | 93,789 | | 1,103,743 | | | | | | 2008 | |
| CHILE-VICUNA MACKENA | | 362,556 | | 5,205,439 | | (1,083,208 | ) | 2,083,831 | | 2,400,956 | | 4,484,787 | | 218,218 | | 4,266,569 | | 40,336,996 | | | | 2008 | |
| CHILE-VINA DEL MAR | | 11,096,948 | | 720,781 | | 57,366,844 | | 17,095,769 | | 52,088,804 | | 69,184,573 | | 848,759 | | 68,335,814 | | | | | | 2008 | |
| MEXICO-HERMOSILLO | | 11,424,531 | | - | | 32,709,395 | | 11,933,599 | | 32,200,327 | | 44,133,926 | | 1,639,074 | | 42,494,852 | | | | | | 2008 | |
| MEXICO-GIGANTE ACQ. | | 7,568,417 | | 19,878,026 | | (5,696,608 | ) | 5,866,102 | | 15,883,733 | | 21,749,835 | | 3,970,928 | | 17,778,908 | | | | 2007 | | | |
| MEXICO-MOTOROLA | | 47,272,528 | | - | | 57,967,312 | | 39,201,766 | | 66,038,074 | | 105,239,840 | | 2,993,678 | | 102,246,162 | | | | | | 2006 | |
| MEXICO-NON ADM BT-LOS CABOS | | 10,873,070 | | 1,257,517 | | 9,050,975 | | 9,127,801 | | 12,053,761 | | 21,181,563 | | 2,078,591 | | 19,102,972 | | | | 2007 | | | |
| MEXICO-NON ADM-GRAN PLZ CANCUN | | 13,976,402 | | 30,219,719 | | (9,417,640 | ) | 15,782,094 | | 18,996,388 | | 34,778,481 | | 5,092,210 | | 29,686,271 | | | | 2007 | | | |
| MEXICO-NON BUS ADM-MULT.CANCUN | | 4,471,987 | | - | | 12,789,095 | | 4,650,512 | | 12,610,570 | | 17,261,082 | | 450,635 | | 16,810,447 | | | | 2007 | | | |
| MEXICO-PLAZA SORIANA | | 2,639,975 | | 346,945 | | 257,302 | | 2,384,667 | | 859,555 | | 3,244,222 | | - | | 3,244,222 | | | | 2007 | | | |
| MEXICO-PLAZA CENTENARIO | | 3,388,861 | | - | | 3,914,208 | | 2,698,888 | | 4,604,181 | | 7,303,069 | | 566,388 | | 6,736,681 | | | | 2007 | | | |
| MEXICO-NON BUS.ADM -LINDAVISTA | | 19,352,453 | | - | | 24,362,687 | | 16,484,680 | | 27,230,460 | | 43,715,140 | | 2,761,512 | | 40,953,628 | | | | | | 2006 | |
| MEXICO-NONADM BUS-NUEVO LAREDO | | 10,627,540 | | - | | 19,967,340 | | 8,697,111 | | 21,897,768 | | 30,594,879 | | 4,266,135 | | 26,328,744 | | | | | | 2006 | |
| MEXICO-NON ADM-PLAZA LAGO REAL | | 11,336,743 | | - | | 18,051,588 | | 9,521,305 | | 19,867,026 | | 29,388,331 | | 631,171 | | 28,757,159 | | | | 2007 | | | |
| MEXICO-MULTIPLAZA OJO DE AGUA | | 4,089,067 | | - | | 11,247,962 | | 4,244,783 | | 11,092,246 | | 15,337,029 | | 1,072,271 | | 14,264,758 | | | | 2008 | | | |
| MEXICO-PACHUCA (WALMART) | | 3,621,985 | | - | | 5,711,916 | | 3,253,476 | | 6,080,425 | | 9,333,901 | | 1,838,821 | | 7,495,080 | | | | | | 2005 | |
| MEXICO-NON ADM -PLAZA SAN JUAN | | 9,631,035 | | - | | 2,494,078 | | 6,586,692 | | 5,538,421 | | 12,125,113 | | 524,000 | | 11,601,113 | | | | | | 2006 | |
| MEXICO-RHODESIA | | 3,924,464 | | - | | 9,767,648 | | 4,517,829 | | 9,174,283 | | 13,692,112 | | 894,726 | | 12,797,386 | | | | | | 2009 | |
| MEXICO-RIO BRAVO HEB | | 2,970,663 | | - | | 12,816,912 | | 2,860,837 | | 12,926,738 | | 15,787,575 | | 1,864,929 | | 13,922,646 | | | | 2008 | | | |
| MEXICO-SALTILLO 2 | | 11,150,023 | | - | | 16,604,023 | | 9,425,609 | | 18,328,437 | | 27,754,046 | | 4,974,037 | | 22,780,009 | | | | | | 2005 | |
| MEXICO-SAN PEDRO | | 3,309,654 | | 13,238,616 | | (3,098,054 | ) | 3,443,840 | | 10,006,376 | | 13,450,216 | | 5,825,049 | | 7,625,167 | | | | 2006 | | | |
| MEXICO-TAPACHULA | | 13,716,428 | | - | | 19,589,751 | | 11,329,441 | | 21,976,738 | | 33,306,179 | | 1,375,665 | | 31,930,514 | | | | 2007 | | | |
| MEXICO-TIJUANA 2000 LAND PURCHASE | | 1,200,000 | | - | | 62,833 | | 1,262,833 | | - | | 1,262,833 | | - | | 1,262,833 | | | | 2009 | | | |
| MEXICO-WALDO ACQ. | | 8,929,278 | | 16,888,627 | | (6,134,466 | ) | 7,135,228 | | 12,548,212 | | 19,683,439 | | 2,457,726 | | 17,225,713 | | | | 2007 | | | |
| PERU-CAMPOY | | 2,675,461 | | - | | 278,383 | | 2,784,870 | | 168,974 | | 2,953,844 | | 0 | | 2,953,844 | | | | | | 2011 | |
| PERU-LIMA | | 811,916 | | - | | 2,453,532 | | 1,051,179 | | 2,214,269 | | 3,265,448 | | 140,510 | | 3,124,938 | | | | | | 2008 | |
| BALANCE OF PORTFOLIO | | 133,248,688 | | 4,492,127 | | 11,287,272 | | 1,763,183 | | 147,264,903.95 | | 149,028,087 | | 40,346,030 | | 108,682,055 | | | | | | | |
| TOTALS | | 2,239,195,318 | | 4,916,652,429 | | 1,791,438,899 | | 2,045,185,881 | | 6,902,100,765 | | 8,947,286,646 | | 1,745,461,577 | | 7,201,825,069 | | 1,003,189,611 | | | | | |
| | | | | | | | | | | |
| INITIAL COST | | | | | | | | | |
PROPERTIES | LAND | BUILDING
&
IMPROVEMENT | SUBSEQUENT
TO
ACQUISITION | LAND | BUILDING
&
IMPROVEMENT | TOTAL | ACCUMULATED
DEPRECIATION | TOTAL COST,
NET OF ACCUMULATED
DEPRECIATION | ENCUMBRANCES | DATE OF
ACQUISITION | DATE OF
CONSTRUCTION |
| | | | | | | | | | | |
LONG CREEK S.C. | $ 4,475,000 | $ - | $ 8,247,502 | $ 5,104,551 | $ 7,617,950 | $ 12,722,502 | $ 819,032 | $ 11,903,469 | $ 12,398,804 | 2008 | |
PREF. EQUITY 100 VANDAM | 5,125,000 | 16,143,321 | 4,065,884 | 6,468,478 | 18,865,728 | 25,334,206 | 2,308,752 | 23,025,454 | | 2006 | |
PREF. EQUITY-30 WEST 21ST STREET | 6,250,000 | 21,974,274 | 20,181,101 | 6,250,000 | 42,155,375 | 48,405,375 | 1,132,116 | 47,273,259 | 20,713,296 | 2007 | |
KDI-GLENN SQUARE | 3,306,779 | - | 43,758,755 | 3,306,779 | 43,758,755 | 47,065,534 | 2,303,535 | 44,761,999 | | | 2006 |
KDI-THE GROVE | 18,951,763 | 6,403,809 | 28,864,719 | 16,395,647 | 37,824,643 | 54,220,291 | 2,110,565 | 52,109,725 | | | 2007 |
KDI-CHANDLER AUTO MALLS | 9,318,595 | - | (4,309,175) | 4,623,497 | 385,923 | 5,009,420 | 1,326 | 5,008,094 | | | 2004 |
DEV- EL MIRAGE | 6,786,441 | 503,987 | 130,064 | 6,786,441 | 634,051 | 7,420,492 | 4,572 | 7,415,920 | | | 2008 |
TALAVI TOWN CENTER | 8,046,677 | 17,291,542 | (24,407) | 8,046,677 | 17,267,135 | 25,313,812 | 7,641,568 | 17,672,244 | | 2007 | |
KIMCO MESA 679, INC. AZ | 2,915,000 | 11,686,291 | 1,236,161 | 2,915,000 | 12,922,452 | 15,837,452 | 4,553,823 | 11,283,629 | | 1998 | |
MESA PAVILLIONS | 6,060,018 | 35,955,005 | (453,839) | 6,060,018 | 35,501,166 | 41,561,184 | 2,989,032 | 38,572,152 | | 2009 | |
MESA RIVERVIEW | 15,000,000 | - | 136,011,073 | 307,992 | 150,703,080 | 151,011,073 | 23,183,795 | 127,827,277 | | | 2005 |
KDI-ANA MARIANA POWER CENTER | 30,043,645 | - | 7,642,732 | 30,131,356 | 7,555,021 | 37,686,377 | 53,300 | 37,633,077 | | | 2006 |
MESA PAVILLIONS - SOUTH | - | 148,508 | - | - | 148,508 | 148,508 | 2,501 | 146,007 | | 2011 | |
METRO SQUARE | 4,101,017 | 16,410,632 | 532,287 | 4,101,017 | 16,942,919 | 21,043,936 | 6,398,606 | 14,645,330 | | 1998 | |
HAYDEN PLAZA NORTH | 2,015,726 | 4,126,509 | 5,021,425 | 2,015,726 | 9,147,934 | 11,163,660 | 2,810,230 | 8,353,431 | | 1998 | |
PHOENIX, COSTCO | 5,324,501 | 21,269,943 | 1,173,868 | 4,577,869 | 23,190,442 | 27,768,312 | 5,460,275 | 22,308,037 | | 1998 | |
PHOENIX | 2,450,341 | 9,802,046 | 877,136 | 2,450,341 | 10,679,182 | 13,129,523 | 4,110,013 | 9,019,510 | | 1997 | |
PINACLE PEAK- N. CANYON RANCH | 1,228,000 | 8,774,694 | - | 1,228,000 | 8,774,694 | 10,002,694 | 1,269,229 | 8,733,466 | 2,209,187 | 2009 | |
VILLAGE CROSSROADS | 5,662,554 | 24,981,223 | - | 5,662,554 | 24,981,223 | 30,643,777 | 374,113 | 30,269,664 | | 2011 | |
NORTH VALLEY | 6,861,564 | 18,200,901 | - | 6,861,564 | 18,200,901 | 25,062,465 | 54,758 | 25,007,707 | 16,746,245 | 2011 | |
KDI-ASANTE RETAIL CENTER | 8,702,635 | 3,405,683 | 2,878,367 | 11,039,472 | 3,947,213 | 14,986,684 | 26,406 | 14,960,279 | | | 2004 |
DEV-SURPRISE II | 4,138,760 | 94,572 | 1,035 | 4,138,760 | 95,607 | 4,234,367 | 708 | 4,233,659 | | | 2008 |
COLLEGE PARK SHOPPING CENTER | 3,276,951 | 7,741,323 | - | 3,276,951 | 7,741,323 | 11,018,274 | - | 11,018,274 | | 2011 | |
ALHAMBRA, COSTCO | 4,995,639 | 19,982,557 | 226,176 | 4,995,639 | 20,208,733 | 25,204,372 | 7,091,704 | 18,112,668 | | 1998 | |
ANGEL'S CAMP TOWN CENTER | 1,000,000 | 6,463,129 | - | 1,000,000 | 6,463,129 | 7,463,129 | 484,362 | 6,978,767 | | 2009 | |
MADISON PLAZA | 5,874,396 | 23,476,190 | 359,773 | 5,874,396 | 23,835,963 | 29,710,359 | 8,348,192 | 21,362,167 | | 1998 | |
CHULA VISTA, COSTCO | 6,460,743 | 25,863,153 | 11,689,917 | 6,460,743 | 37,553,070 | 44,013,813 | 11,028,213 | 32,985,600 | | 1998 | |
CORONA HILLS, COSTCO | 13,360,965 | 53,373,453 | 5,647,946 | 13,360,965 | 59,021,400 | 72,382,364 | 20,202,311 | 52,180,053 | | 1998 | |
EAST AVENUE MARKET PLACE | 1,360,457 | 3,055,127 | 258,550 | 1,360,457 | 3,313,677 | 4,674,134 | 1,851,779 | 2,822,355 | 1,802,808 | 2006 | |
LABAND VILLAGE SC | 5,600,000 | 13,289,347 | (21,602) | 5,607,237 | 13,260,509 | 18,867,746 | 4,085,536 | 14,782,210 | 8,308,272 | 2008 | |
CUPERTINO VILLAGE | 19,886,099 | 46,534,919 | 4,483,040 | 19,886,099 | 51,017,959 | 70,904,059 | 13,960,107 | 56,943,951 | 34,434,440 | 2006 | |
CHICO CROSSROADS | 9,975,810 | 30,534,524 | 677,665 | 9,987,652 | 31,200,347 | 41,187,999 | 5,132,958 | 36,055,041 | 24,813,584 | 2008 | |
CORONA HILLS MARKETPLACE | 9,727,446 | 24,778,390 | 90,749 | 9,727,446 | 24,869,140 | 34,596,586 | 5,909,028 | 28,687,558 | | 2007 | |
90
100
| | | | | | | | | | | |
| INITIAL COST | | | | | | | | | |
PROPERTIES | LAND | BUILDING
&
IMPROVEMENT | SUBSEQUENT
TO
ACQUISITION | LAND | BUILDING
&
IMPROVEMENT | TOTAL | ACCUMULATED
DEPRECIATION | TOTAL COST,
NET OF ACCUMULATED
DEPRECIATION | ENCUMBRANCES | DATE OF
ACQUISITION | DATE OF
CONSTRUCTION |
| | | | | | | | | | | |
ELK GROVE VILLAGE | 1,770,000 | 7,470,136 | 679,860 | 1,770,000 | 8,149,995 | 9,919,995 | 4,078,062 | 5,841,933 | 1,904,515 | 2006 | - |
WATERMAN PLAZA | 784,851 | 1,762,508 | (110,571) | 784,851 | 1,651,937 | 2,436,788 | 822,056 | 1,614,732 | 1,304,403 | 2006 | |
RIVER PARK SHOPPING CENTER | 4,324,000 | 18,018,653 | - | 4,324,000 | 18,018,653 | 22,342,653 | 1,569,502 | 20,773,151 | | 2009 | |
GOLD COUNTRY CENTER | 3,272,212 | 7,864,878 | 37,687 | 3,278,290 | 7,896,487 | 11,174,777 | 1,867,225 | 9,307,552 | 6,986,982 | 2008 | |
LA MIRADA THEATRE CENTER | 8,816,741 | 35,259,965 | (7,170,913) | 6,888,680 | 30,017,113 | 36,905,793 | 10,234,931 | 26,670,862 | | 1998 | |
KENNETH HAHN PLAZA | 4,114,863 | 7,660,855 | 57,985 | 4,114,863 | 7,718,840 | 11,833,703 | 1,480,498 | 10,353,205 | 6,000,000 | 2010 | |
NOVATO FAIR S.C. | 9,259,778 | 15,599,790 | 5,949 | 9,259,778 | 15,605,738 | 24,865,516 | 1,832,608 | 23,032,908 | 12,792,075 | 2009 | |
SOUTH NAPA MARKET PLACE | 1,100,000 | 22,159,086 | 6,838,973 | 1,100,000 | 28,998,059 | 30,098,059 | 8,983,787 | 21,114,272 | | 2006 | |
PLAZA DI NORTHRIDGE | 12,900,000 | 40,574,842 | 2,806,949 | 12,900,000 | 43,381,791 | 56,281,791 | 12,028,707 | 44,253,084 | | 2005 | |
POWAY CITY CENTRE | 5,854,585 | 13,792,470 | 7,701,699 | 7,247,814 | 20,100,941 | 27,348,754 | 5,221,728 | 22,127,026 | | 2005 | |
REDWOOD CITY | 2,552,000 | 6,215,168 | - | 2,552,000 | 6,215,168 | 8,767,168 | 353,536 | 8,413,632 | 5,601,020 | 2009 | |
TYLER STREET | 3,020,883 | 7,811,339 | 37,443 | 3,200,516 | 7,669,149 | 10,869,665 | 2,353,791 | 8,515,875 | 6,725,788 | 2008 | |
THE CENTRE | 3,403,724 | 13,625,899 | 1,381,417 | 3,403,724 | 15,007,316 | 18,411,040 | 4,401,446 | 14,009,594 | | 1999 | |
SANTA ANA, HOME DEPOT | 4,592,364 | 18,345,257 | - | 4,592,364 | 18,345,257 | 22,937,622 | 6,451,224 | 16,486,397 | | 1998 | |
SAN/DIEGO CARMEL MOUNTAIN | 5,322,600 | 8,873,991 | (58,045) | 5,322,600 | 8,815,946 | 14,138,546 | 1,011,606 | 13,126,940 | | 2009 | |
FULTON MARKET PLACE | 2,966,018 | 6,920,710 | 927,661 | 2,966,018 | 7,848,371 | 10,814,389 | 2,219,041 | 8,595,349 | | 2005 | |
MARIGOLD SC | 15,300,000 | 25,563,978 | 3,396,464 | 15,300,000 | 28,960,442 | 44,260,442 | 11,442,904 | 32,817,538 | | 2005 | |
ELVERTA CROSSING | 3,520,333 | 6,715,076 | (1,120,333) | 2,400,000 | 6,715,076 | 9,115,076 | 3,108,328 | 6,006,748 | | 2009 | |
BLACK MOUNTAIN VILLAGE | 4,678,015 | 11,913,344 | 35,697 | 4,678,015 | 11,949,041 | 16,627,056 | 3,051,879 | 13,575,177 | | 2007 | |
TRUCKEE CROSSROADS | 2,140,000 | 8,255,753 | 476,968 | 2,140,000 | 8,732,721 | 10,872,721 | 4,702,818 | 6,169,903 | 3,463,294 | 2006 | |
PARK PLACE | 7,871,396 | 7,763,171 | (174,508) | 7,871,396 | 7,588,663 | 15,460,059 | 2,815,688 | 12,644,371 | | 2009 | |
WESTLAKE SHOPPING CENTER | 16,174,307 | 64,818,562 | 93,796,491 | 16,174,307 | 158,615,053 | 174,789,360 | 25,659,055 | 149,130,305 | | 2002 | |
VILLAGE ON THE PARK | 2,194,463 | 8,885,987 | 5,582,852 | 2,194,463 | 14,468,839 | 16,663,302 | 4,060,433 | 12,602,869 | | 1998 | |
AURORA QUINCY | 1,148,317 | 4,608,249 | 988,825 | 1,148,317 | 5,597,074 | 6,745,391 | 1,788,501 | 4,956,890 | | 1998 | |
AURORA EAST BANK | 1,500,568 | 6,180,103 | 720,048 | 1,500,568 | 6,900,151 | 8,400,719 | 2,537,455 | 5,863,264 | | 1998 | |
SPRING CREEK COLORADO | 1,423,260 | 5,718,813 | 2,059,194 | 1,423,260 | 7,778,007 | 9,201,267 | 2,377,711 | 6,823,556 | | 1998 | |
DENVER WEST 38TH STREET | 161,167 | 646,983 | - | 161,167 | 646,983 | 808,150 | 230,847 | 577,303 | | 1998 | |
ENGLEWOOD PHAR MOR | 805,837 | 3,232,650 | 249,867 | 805,837 | 3,482,517 | 4,288,354 | 1,240,253 | 3,048,101 | | 1998 | |
FORT COLLINS | 1,253,497 | 7,625,278 | 1,599,608 | 1,253,497 | 9,224,886 | 10,478,382 | 2,471,445 | 8,006,937 | | 2000 | |
HIGHLANDS RANCH VILLAGE S.C. | 8,135,427 | 21,579,936 | - | 8,135,427 | 21,579,936 | 29,715,363 | 64,924 | 29,650,439 | 21,421,962 | 2011 | |
VILLAGE CENTER WEST | 2,010,519 | 8,361,084 | - | 2,010,519 | 8,361,084 | 10,371,603 | 58,046 | 10,313,557 | 6,356,036 | 2011 | |
HERITAGE WEST | 1,526,576 | 6,124,074 | 429,741 | 1,526,576 | 6,553,815 | 8,080,391 | 2,277,731 | 5,802,660 | | 1998 | |
MARKET AT SOUTHPARK | 9,782,769 | 20,779,522 | - | 9,782,769 | 20,779,522 | 30,562,292 | 153,341 | 30,408,951 | | 2011 | |
WEST FARM SHOPPING CENTER | 5,805,969 | 23,348,024 | 2,328,520 | 5,805,969 | 25,676,544 | 31,482,513 | 8,340,669 | 23,141,845 | | 1998 | |
N.HAVEN, HOME DEPOT | 7,704,968 | 30,797,640 | 880,667 | 7,704,968 | 31,678,307 | 39,383,275 | 10,921,094 | 28,462,181 | | 1998 | |
WATERBURY | 2,253,078 | 9,017,012 | 653,224 | 2,253,078 | 9,670,236 | 11,923,314 | 4,376,813 | 7,546,502 | | 1993 | |
91
| | | | | | | | | | | |
| INITIAL COST | | | | | | | | | |
PROPERTIES | LAND | BUILDING
&
IMPROVEMENT | SUBSEQUENT
TO
ACQUISITION | LAND | BUILDING
&
IMPROVEMENT | TOTAL | ACCUMULATED
DEPRECIATION | TOTAL COST,
NET OF ACCUMULATED
DEPRECIATION | ENCUMBRANCES | DATE OF
ACQUISITION | DATE OF
CONSTRUCTION |
| | | | | | | | | | | |
DOVER | 122,741 | 66,738 | 3,999,906 | 3,024,375 | 1,165,010 | 4,189,385 | 26,250 | 4,163,135 | | 2003 | |
ELSMERE | - | 3,185,642 | 2,087,766 | - | 5,273,408 | 5,273,408 | 3,185,642 | 2,087,767 | | | 1979 |
ALTAMONTE SPRINGS | 770,893 | 3,083,574 | (1,206,596) | 538,796 | 2,109,074 | 2,647,871 | 773,730 | 1,874,141 | | 1995 | |
AUBURNDALE | 751,315 | - | - | 751,315 | - | 751,315 | - | 751,315 | | 2009 | |
BOCA RATON | 573,875 | 2,295,501 | 1,710,546 | 733,875 | 3,846,047 | 4,579,922 | 1,918,789 | 2,661,133 | | 1992 | |
BAYSHORE GARDENS, BRADENTON FL | 2,901,000 | 11,738,955 | 804,762 | 2,901,000 | 12,543,717 | 15,444,717 | 4,477,307 | 10,967,410 | | 1998 | |
SHOPPES @ MT. CARMEL | 204,432 | 937,457 | 79,652 | 204,432 | 1,017,110 | 1,221,542 | 36,089 | 1,185,454 | | 2009 | |
CORAL SPRINGS | 710,000 | 2,842,907 | 3,827,435 | 710,000 | 6,670,342 | 7,380,342 | 2,466,104 | 4,914,237 | | 1994 | |
CORAL SPRINGS | 1,649,000 | 6,626,301 | 442,713 | 1,649,000 | 7,069,014 | 8,718,014 | 2,583,640 | 6,134,375 | | 1997 | |
CURLEW CROSSING S.C. | 5,315,955 | 12,529,467 | 1,709,383 | 5,315,955 | 14,238,851 | 19,554,805 | 3,005,713 | 16,549,092 | | 2005 | |
CLEARWATER FL | 3,627,946 | 918,466 | (269,494) | 2,174,938 | 2,101,980 | 4,276,918 | 184,350 | 4,092,568 | | 2007 | |
EAST ORLANDO | 491,676 | 1,440,000 | 2,646,272 | 1,007,882 | 3,570,066 | 4,577,948 | 2,237,651 | 2,340,297 | | | 1971 |
FT.LAUDERDALE/CYPRESS CREEK | 14,258,760 | 28,042,390 | 1,767,227 | 14,258,760 | 29,809,617 | 44,068,377 | 2,678,625 | 41,389,751 | 23,788,801 | 2009 | |
OAKWOOD BUSINESS CTR-BLDG 1 | 6,792,500 | 18,662,565 | 205,829 | 6,792,500 | 18,868,394 | 25,660,894 | 1,760,652 | 23,900,242 | 9,390,736 | 2009 | |
REGENCY PLAZA | 2,410,000 | 9,671,160 | 606,487 | 2,410,000 | 10,277,647 | 12,687,647 | 3,317,537 | 9,370,110 | | 1999 | |
SHOPPES AT AMELIA CONCOURSE | 7,600,000 | - | 8,589,118 | 1,138,216 | 15,050,902 | 16,189,118 | 885,207 | 15,303,911 | | | 2003 |
AVENUES WALKS | 26,984,546 | - | 49,995,495 | 33,225,306 | 43,754,735 | 76,980,041 | - | 76,980,041 | | | 2005 |
RIVERPLACE SHOPPING CTR. | 7,503,282 | 31,011,027 | 315,671 | 7,503,282 | 31,326,698 | 38,829,980 | 1,973,801 | 36,856,180 | | 2010 | |
BEACHES & HODGES | 1,033,058 | - | (390,214) | 642,844 | - | 642,844 | - | 642,844 | | 2009 | |
KISSIMMEE | 1,328,536 | 5,296,652 | (3,892,279) | 1,328,536 | 1,404,373 | 2,732,909 | 403,547 | 2,329,362 | | 1996 | |
LAUDERDALE LAKES | 342,420 | 2,416,645 | 3,336,571 | 342,420 | 5,753,216 | 6,095,636 | 4,114,801 | 1,980,836 | | | 1968 |
MERCHANTS WALK | 2,580,816 | 10,366,090 | 2,602,974 | 2,580,816 | 12,969,064 | 15,549,880 | 3,297,944 | 12,251,937 | | 2001 | |
LARGO | 293,686 | 792,119 | 1,620,990 | 293,686 | 2,413,109 | 2,706,795 | 1,921,815 | 784,979 | | | 1968 |
LEESBURG | - | 171,636 | 193,651 | - | 365,287 | 365,287 | 303,801 | 61,487 | | | 1969 |
LARGO EAST BAY | 2,832,296 | 11,329,185 | 2,136,371 | 2,832,296 | 13,465,556 | 16,297,852 | 7,671,490 | 8,626,362 | | 1992 | |
LAUDERHILL | 1,002,733 | 2,602,415 | 12,547,714 | 1,774,443 | 14,378,419 | 16,152,862 | 8,639,178 | 7,513,684 | | | 1974 |
THE GROVES | 1,676,082 | 6,533,681 | 1,083,014 | 2,606,246 | 6,686,530 | 9,292,777 | 1,796,982 | 7,495,794 | | 2006 | |
LAKE WALES | 601,052 | - | - | 601,052 | - | 601,052 | - | 601,052 | | 2009 | |
MELBOURNE | - | 1,754,000 | 2,681,794 | - | 4,435,794 | 4,435,794 | 2,750,495 | 1,685,299 | | | 1968 |
GROVE GATE | 365,893 | 1,049,172 | 1,207,100 | 365,893 | 2,256,272 | 2,622,165 | 1,847,193 | 774,972 | | | 1968 |
CHEVRON OUTPARCEL | 530,570 | 1,253,410 | - | 530,570 | 1,253,410 | 1,783,980 | 62,605 | 1,721,375 | | 2010 | |
NORTH MIAMI | 732,914 | 4,080,460 | 10,956,161 | 732,914 | 15,036,621 | 15,769,535 | 7,565,017 | 8,204,517 | 6,282,135 | 1985 | |
MILLER ROAD | 1,138,082 | 4,552,327 | 1,952,506 | 1,138,082 | 6,504,833 | 7,642,915 | 5,347,142 | 2,295,773 | | 1986 | |
MARGATE | 2,948,530 | 11,754,120 | 7,856,859 | 2,948,530 | 19,610,979 | 22,559,509 | 7,130,654 | 15,428,855 | | 1993 | |
MT. DORA | 1,011,000 | 4,062,890 | 436,174 | 1,011,000 | 4,499,064 | 5,510,064 | 1,582,799 | 3,927,265 | | 1997 | |
KENDALE LAKES PLAZA | 18,491,461 | 28,496,001 | (3,085,778) | 15,362,227 | 28,539,457 | 43,901,684 | 2,424,710 | 41,476,973 | 16,152,477 | 2009 | |
92
| | | | | | | | | | | |
| INITIAL COST | | | | | | | | | |
PROPERTIES | LAND | BUILDING
&
IMPROVEMENT | SUBSEQUENT
TO
ACQUISITION | LAND | BUILDING
&
IMPROVEMENT | TOTAL | ACCUMULATED
DEPRECIATION | TOTAL COST,
NET OF ACCUMULATED
DEPRECIATION | ENCUMBRANCES | DATE OF
ACQUISITION | DATE OF
CONSTRUCTION |
| | | | | | | | | | | |
PLANTATION CROSSING | 7,524,800 | - | 10,784,051 | 7,153,784 | 11,155,067 | 18,308,851 | 885,263 | 17,423,588 | | | 2005 |
MILTON, FL | 1,275,593 | - | - | 1,275,593 | - | 1,275,593 | - | 1,275,593 | | 2007 | |
FLAGLER PARK | 26,162,980 | 80,737,041 | 1,513,669 | 26,162,980 | 82,250,710 | 108,413,690 | 12,429,340 | 95,984,350 | 25,853,397 | 2007 | |
PARK HILL PLAZA | 10,763,612 | 19,264,248 | 128,319 | 10,891,930 | 19,264,248 | 30,156,179 | 302,987 | 29,853,192 | 8,657,739 | 2011 | |
ORLANDO | 923,956 | 3,646,904 | 3,145,498 | 1,172,119 | 6,544,239 | 7,716,358 | 2,521,128 | 5,195,231 | | 1995 | |
RENAISSANCE CENTER | 9,104,379 | 36,540,873 | 5,440,571 | 9,122,758 | 41,963,065 | 51,085,823 | 16,080,560 | 35,005,262 | | 1998 | |
SAND LAKE | 3,092,706 | 12,370,824 | 2,119,912 | 3,092,706 | 14,490,736 | 17,583,442 | 6,240,952 | 11,342,490 | | 1994 | |
ORLANDO | 560,800 | 2,268,112 | 3,203,429 | 580,030 | 5,452,310 | 6,032,341 | 2,001,343 | 4,030,998 | | 1996 | |
OCALA | 1,980,000 | 7,927,484 | 8,608,917 | 1,980,000 | 16,536,401 | 18,516,401 | 5,592,981 | 12,923,420 | | 1997 | |
MILLENIA PLAZA PHASE II | 7,711,000 | 20,702,992 | 266,695 | 7,711,000 | 20,969,687 | 28,680,687 | 3,346,022 | 25,334,665 | | 2009 | |
GRAND OAKS VILLAGE | 7,409,319 | 19,653,869 | - | 7,409,319 | 19,653,869 | 27,063,188 | 59,131 | 27,004,057 | 6,907,500 | 2011 | |
GONZALEZ | 1,620,203 | - | 40,689 | 954,876 | 706,016 | 1,660,892 | - | 1,660,892 | | 2007 | |
UNIVERSITY TOWN CENTER | 5,515,265 | 13,041,400 | - | 5,515,265 | 13,041,400 | 18,556,665 | 167,718 | 18,388,947 | | 2011 | |
PALM BEACH GARDENS | 2,764,953 | 11,059,812 | 131,387 | 2,764,953 | 11,191,199 | 13,956,152 | 442,393 | 13,513,760 | | 2009 | |
ST. PETERSBURG | - | 917,360 | 1,266,811 | - | 2,184,171 | 2,184,171 | 1,052,376 | 1,131,796 | | | 1968 |
TUTTLE BEE SARASOTA | 254,961 | 828,465 | 1,781,105 | 254,961 | 2,609,570 | 2,864,531 | 1,995,474 | 869,057 | | 2008 | |
SOUTH EAST SARASOTA | 1,283,400 | 5,133,544 | 3,386,562 | 1,399,525 | 8,403,980 | 9,803,506 | 4,614,312 | 5,189,193 | | 1989 | |
SANFORD | 1,832,732 | 9,523,261 | 6,196,391 | 1,832,732 | 15,719,651 | 17,552,384 | 9,161,602 | 8,390,781 | | 1989 | |
STUART | 2,109,677 | 8,415,323 | 1,060,926 | 2,109,677 | 9,476,249 | 11,585,926 | 4,138,796 | 7,447,130 | | 1994 | |
SOUTH MIAMI | 1,280,440 | 5,133,825 | 3,087,209 | 1,280,440 | 8,221,034 | 9,501,474 | 3,175,462 | 6,326,012 | | 1995 | |
TAMPA | 5,220,445 | 16,884,228 | 2,253,668 | 5,220,445 | 19,137,896 | 24,358,341 | 6,450,960 | 17,907,381 | | 1997 | |
VILLAGE COMMONS S.C. | 2,192,331 | 8,774,158 | 1,250,655 | 2,192,331 | 10,024,813 | 12,217,144 | 3,452,204 | 8,764,940 | | 1998 | |
MISSION BELL SHOPPING CENTER | 5,056,426 | 11,843,119 | 8,655,863 | 5,067,033 | 20,488,375 | 25,555,408 | 4,485,832 | 21,069,577 | | 2004 | |
WEST PALM BEACH | 550,896 | 2,298,964 | 1,415,804 | 550,896 | 3,714,768 | 4,265,664 | 1,391,843 | 2,873,821 | | 1995 | |
THE SHOPS AT WEST MELBOURNE | 2,200,000 | 8,829,541 | 5,637,204 | 2,200,000 | 14,466,745 | 16,666,745 | 4,974,574 | 11,692,171 | | 1998 | |
CROSS COUNTRY PLAZA | 16,510,000 | 18,264,427 | 461,151 | 16,510,000 | 18,725,578 | 35,235,578 | 1,520,706 | 33,714,873 | | 2009 | |
AUGUSTA | 1,482,564 | 5,928,122 | 2,439,437 | 1,482,564 | 8,367,559 | 9,850,123 | 3,241,849 | 6,608,274 | | 1995 | |
MARKET AT HAYNES BRIDGE | 4,880,659 | 21,549,424 | 547,112 | 4,889,863 | 22,087,332 | 26,977,195 | 3,964,611 | 23,012,584 | 15,714,702 | 2008 | |
EMBRY VILLAGE | 18,147,054 | 33,009,514 | 160,749 | 18,160,524 | 33,156,793 | 51,317,318 | 5,786,764 | 45,530,553 | 30,396,642 | 2008 | |
VILLAGE SHOPPES-FLOWERY BRANCH | 4,444,148 | 10,510,657 | - | 4,444,148 | 10,510,657 | 14,954,805 | 297,458 | 14,657,347 | 9,475,635 | 2011 | |
SAVANNAH | 2,052,270 | 8,232,978 | 1,552,817 | 2,052,270 | 9,785,795 | 11,838,065 | 4,698,831 | 7,139,234 | | 1993 | |
SAVANNAH | 652,255 | 2,616,522 | 4,912,492 | 652,256 | 7,529,014 | 8,181,269 | 1,555,136 | 6,626,134 | | 1995 | |
CHATHAM PLAZA | 13,390,238 | 35,115,882 | 756,667 | 13,403,262 | 35,859,525 | 49,262,787 | 7,175,896 | 42,086,891 | 29,123,312 | 2008 | |
KIHEI CENTER | 3,406,707 | 7,663,360 | 611,237 | 3,406,707 | 8,274,597 | 11,681,304 | 4,613,096 | 7,068,209 | | 2006 | |
CLIVE | 500,525 | 2,002,101 | - | 500,525 | 2,002,101 | 2,502,626 | 817,097 | 1,685,529 | | 1996 | |
KDI-METRO CROSSING | 3,013,647 | - | 31,391,327 | 1,563,072 | 32,841,902 | 34,404,974 | 1,464,642 | 32,940,332 | | | 2006 |
93
| | | | | | | | | | | |
| INITIAL COST | | | | | | | | | |
PROPERTIES | LAND | BUILDING
&
IMPROVEMENT | SUBSEQUENT
TO
ACQUISITION | LAND | BUILDING
&
IMPROVEMENT | TOTAL | ACCUMULATED
DEPRECIATION | TOTAL COST,
NET OF ACCUMULATED
DEPRECIATION | ENCUMBRANCES | DATE OF
ACQUISITION | DATE OF
CONSTRUCTION |
| | | | | | | | | | | |
SOUTHDALE SHOPPING CENTER | 1,720,330 | 6,916,294 | 3,760,738 | 1,720,330 | 10,677,032 | 12,397,362 | 2,979,464 | 9,417,898 | 1,269,452 | 1999 | |
DES MOINES | 500,525 | 2,559,019 | 37,079 | 500,525 | 2,596,098 | 3,096,623 | 1,035,780 | 2,060,844 | | 1996 | |
DUBUQUE | - | 2,152,476 | 239,217 | - | 2,391,693 | 2,391,693 | 784,861 | 1,606,832 | | 1997 | |
WATERLOO | 500,525 | 2,002,101 | 2,869,100 | 500,525 | 4,871,201 | 5,371,726 | 2,610,295 | 2,761,430 | | 1996 | |
NAMPA (HORSHAM) FUTURE DEV. | 6,501,240 | - | 12,402,280 | 10,729,939 | 8,173,581 | 18,903,520 | 90,726 | 18,812,794 | | | 2005 |
AURORA, N. LAKE | 2,059,908 | 9,531,721 | 308,208 | 2,059,908 | 9,839,929 | 11,899,837 | 3,354,778 | 8,545,059 | | 1998 | |
BLOOMINGTON | 805,521 | 2,222,353 | 4,241,061 | 805,521 | 6,463,414 | 7,268,935 | 3,953,151 | 3,315,784 | | | 1972 |
BELLEVILLE S.C. | - | 5,372,253 | 1,255,387 | 1,161,195 | 5,466,445 | 6,627,640 | 1,856,198 | 4,771,442 | | 1998 | |
BRADLEY | 500,422 | 2,001,687 | 424,877 | 500,422 | 2,426,564 | 2,926,986 | 962,687 | 1,964,299 | | 1996 | |
CALUMET CITY | 1,479,217 | 8,815,760 | 13,534,735 | 1,479,216 | 22,350,496 | 23,829,712 | 5,337,064 | 18,492,648 | | 1997 | |
COUNTRYSIDE | - | 4,770,671 | (4,531,252) | 95,647 | 143,772 | 239,419 | 74,227 | 165,192 | | 1997 | |
CHICAGO | - | 2,687,046 | 871,802 | - | 3,558,848 | 3,558,848 | 1,254,179 | 2,304,669 | | 1997 | |
CHAMPAIGN, NEIL ST. | 230,519 | 1,285,460 | 725,493 | 230,519 | 2,010,953 | 2,241,472 | 673,915 | 1,567,557 | | 1998 | |
ELSTON | 1,010,374 | 5,692,212 | - | 1,010,374 | 5,692,212 | 6,702,586 | 1,946,024 | 4,756,562 | | 1997 | |
CRYSTAL LAKE, NW HWY | 179,964 | 1,025,811 | 564,039 | 180,269 | 1,589,545 | 1,769,814 | 415,856 | 1,353,958 | | 1998 | |
108 WEST GERMANIA PLACE | 2,393,894 | 7,366,681 | 360 | 2,393,894 | 7,367,041 | 9,760,935 | 156,468 | 9,604,467 | | 2008 | |
168 NORTH MICHIGAN AVENUE | 3,373,318 | 10,119,953 | (5,813,893) | 3,373,318 | 4,306,060 | 7,679,377 | 221,145 | 7,458,232 | | 2008 | |
BUTTERFIELD SQUARE | 1,601,960 | 6,637,926 | (3,588,725) | 1,182,677 | 3,468,484 | 4,651,161 | 1,119,098 | 3,532,063 | | 1998 | |
DOWNERS PARK PLAZA | 2,510,455 | 10,164,494 | 1,011,249 | 2,510,455 | 11,175,743 | 13,686,198 | 3,758,940 | 9,927,258 | | 1999 | |
DOWNER GROVE | 811,778 | 4,322,956 | 2,111,290 | 811,778 | 6,434,245 | 7,246,024 | 2,149,141 | 5,096,883 | | 1997 | |
ELGIN | 842,555 | 2,108,674 | 1,545,214 | 527,168 | 3,969,274 | 4,496,443 | 2,857,584 | 1,638,858 | | | 1972 |
FOREST PARK | - | 2,335,884 | - | - | 2,335,884 | 2,335,884 | 854,233 | 1,481,651 | | 1997 | |
FAIRVIEW HTS, BELLVILLE RD. | - | 11,866,880 | 1,954,460 | - | 13,821,340 | 13,821,340 | 4,554,494 | 9,266,846 | | 1998 | |
BELLEVILLE ROAD S.C..-fee | 1,900,000 | - | - | 1,900,000 | - | 1,900,000 | - | 1,900,000 | | 2011 | |
GENEVA | 500,422 | 12,917,712 | 33,551 | 500,422 | 12,951,263 | 13,451,685 | 4,585,867 | 8,865,818 | | 1996 | |
LAKE ZURICH PLAZA | 1,890,319 | 2,649,381 | 63,057 | 1,890,319 | 2,712,438 | 4,602,757 | 254,187 | 4,348,571 | | 2005 | |
MATTERSON | 950,515 | 6,292,319 | 10,598,285 | 950,514 | 16,890,605 | 17,841,119 | 5,517,121 | 12,323,998 | | 1997 | |
MT. PROSPECT | 1,017,345 | 6,572,176 | 4,016,735 | 1,017,345 | 10,588,911 | 11,606,256 | 3,880,629 | 7,725,627 | | 1997 | |
MUNDELEIN, S. LAKE | 1,127,720 | 5,826,129 | 77,350 | 1,129,634 | 5,901,565 | 7,031,199 | 2,046,832 | 4,984,367 | | 1998 | |
NORRIDGE | - | 2,918,315 | - | - | 2,918,315 | 2,918,315 | 1,061,652 | 1,856,663 | | 1997 | |
NAPERVILLE | 669,483 | 4,464,998 | 80,672 | 669,483 | 4,545,670 | 5,215,153 | 1,618,589 | 3,596,564 | | 1997 | |
MARKETPLACE OF OAKLAWN | - | 678,668 | - | - | 678,668 | 678,668 | 309,826 | 368,841 | | 1998 | |
ORLAND PARK, S. HARLEM | 476,972 | 2,764,775 | (2,694,903) | 87,998 | 458,846 | 546,844 | 150,287 | 396,556 | | 1998 | |
OAK LAWN | 1,530,111 | 8,776,631 | 465,920 | 1,530,111 | 9,242,552 | 10,772,662 | 3,329,585 | 7,443,077 | | 1997 | |
OAKBROOK TERRACE | 1,527,188 | 8,679,108 | 3,298,212 | 1,527,188 | 11,977,320 | 13,504,508 | 3,840,892 | 9,663,615 | | 1997 | |
PEORIA | - | 5,081,290 | 2,403,560 | - | 7,484,850 | 7,484,850 | 3,236,065 | 4,248,785 | | 1997 | |
94
| | | | | | | | | | | |
| INITIAL COST | | | | | | | | | |
PROPERTIES | LAND | BUILDING
&
IMPROVEMENT | SUBSEQUENT
TO
ACQUISITION | LAND | BUILDING
&
IMPROVEMENT | TOTAL | ACCUMULATED
DEPRECIATION | TOTAL COST,
NET OF ACCUMULATED
DEPRECIATION | ENCUMBRANCES | DATE OF
ACQUISITION | DATE OF
CONSTRUCTION |
| | | | | | | | | | | |
FREESTATE BOWL | 252,723 | 998,099 | - | 252,723 | 998,099 | 1,250,822 | 597,340 | 653,482 | | 2003 | |
ROCKFORD CROSSING | 4,575,990 | 11,654,022 | (507,684) | 4,583,005 | 11,139,322 | 15,722,328 | 1,532,191 | 14,190,137 | 10,506,564 | 2008 | |
ROUND LAKE BEACH PLAZA | 790,129 | 1,634,148 | 587,575 | 790,129 | 2,221,723 | 3,011,852 | 242,526 | 2,769,326 | | 2005 | |
SKOKIE | - | 2,276,360 | 9,518,382 | 2,628,440 | 9,166,303 | 11,794,742 | 2,523,920 | 9,270,822 | | 1997 | |
KRC STREAMWOOD | 181,962 | 1,057,740 | 216,585 | 181,962 | 1,274,324 | 1,456,287 | 410,564 | 1,045,723 | | 1998 | |
WOODGROVE FESTIVAL | 5,049,149 | 20,822,993 | 3,454,777 | 4,805,866 | 24,521,053 | 29,326,919 | 8,188,884 | 21,138,034 | | 1998 | |
WAUKEGAN PLAZA | 349,409 | 883,975 | 2,276,671 | 349,409 | 3,160,646 | 3,510,055 | 171,272 | 3,338,784 | | 2005 | |
PLAZA EAST | 1,236,149 | 4,944,597 | 3,370,361 | 1,140,849 | 8,410,258 | 9,551,107 | 3,003,658 | 6,547,449 | | 1995 | |
GREENWOOD | 423,371 | 1,883,421 | 3,333,823 | 584,445 | 5,056,170 | 5,640,615 | 3,058,252 | 2,582,363 | | | 1970 |
GRIFFITH | - | 2,495,820 | 981,912 | 1,001,100 | 2,476,632 | 3,477,732 | 912,181 | 2,565,551 | | 1997 | |
LAFAYETTE | 230,402 | 1,305,943 | 169,272 | 230,402 | 1,475,215 | 1,705,617 | 1,382,704 | 322,913 | | | 1971 |
LAFAYETTE | 812,810 | 3,252,269 | 4,559,468 | 2,379,198 | 6,245,349 | 8,624,547 | 2,144,166 | 6,480,381 | | 1997 | |
KRC MISHAWAKA 895 | 378,088 | 1,999,079 | 4,595,648 | 378,730 | 6,594,085 | 6,972,815 | 1,789,180 | 5,183,635 | | 1998 | |
SOUTH BEND, S. HIGH ST. | 183,463 | 1,070,401 | 196,857 | 183,463 | 1,267,258 | 1,450,721 | 413,952 | 1,036,770 | | 1998 | |
OVERLAND PARK | 1,183,911 | 6,335,308 | 142,374 | 1,185,906 | 6,475,686 | 7,661,593 | 2,190,994 | 5,470,599 | | 1998 | |
BELLEVUE | 405,217 | 1,743,573 | 247,204 | 405,217 | 1,990,776 | 2,395,994 | 1,827,423 | 568,571 | | 1976 | |
LEXINGTON | 1,675,031 | 6,848,209 | 5,456,178 | 1,551,079 | 12,428,339 | 13,979,418 | 5,646,808 | 8,332,610 | | 1993 | |
HAMMOND AIR PLAZA | 3,813,873 | 15,260,609 | 6,928,815 | 3,813,873 | 22,189,424 | 26,003,297 | 6,643,427 | 19,359,870 | | 1997 | |
CENTRE AT WESTBANK | 9,554,230 | 24,401,082 | 767,392 | 9,564,644 | 25,158,060 | 34,722,704 | 4,312,682 | 30,410,021 | 19,281,538 | 2008 | |
LAFAYETTE | 2,115,000 | 8,508,218 | 10,089,972 | 3,678,274 | 17,034,915 | 20,713,190 | 5,875,930 | 14,837,260 | | 1997 | |
PRIEN LAKE | 6,426,167 | 15,181,072 | (109,020) | 6,341,896 | 15,156,323 | 21,498,219 | 1,185,376 | 20,312,844 | 15,627,036 | 2010 | |
AMBASSADOR PLAZA | 1,803,672 | 4,260,966 | (6,701) | 1,796,972 | 4,260,966 | 6,057,938 | 330,900 | 5,727,038 | 4,587,549 | 2010 | |
BAYOU WALK | 4,586,895 | 10,836,007 | 76,108 | 4,586,326 | 10,912,684 | 15,499,010 | 1,160,470 | 14,338,540 | 12,802,884 | 2010 | |
EAST SIDE PLAZA | 3,295,799 | 7,785,942 | 128,275 | 3,295,635 | 7,914,381 | 11,210,016 | 600,060 | 10,609,955 | 8,889,411 | 2010 | |
GREAT BARRINGTON | 642,170 | 2,547,830 | 7,263,577 | 751,124 | 9,702,453 | 10,453,577 | 3,615,574 | 6,838,004 | | 1994 | |
HAVERHILL PLAZA | 3,281,768 | 7,752,796 | - | 3,281,768 | 7,752,796 | 11,034,565 | 648,383 | 10,386,182 | | 2010 | |
SHREWSBURY SHOPPING CENTER | 1,284,168 | 5,284,853 | 5,000,687 | 1,284,168 | 10,285,540 | 11,569,708 | 2,749,384 | 8,820,323 | | 2000 | |
WILDE LAKE | 1,468,038 | 5,869,862 | 531,802 | 1,468,038 | 6,401,663 | 7,869,701 | 1,539,705 | 6,329,995 | | 2002 | |
LYNX LANE | 1,019,035 | 4,091,894 | 76,423 | 1,019,035 | 4,168,317 | 5,187,352 | 1,077,280 | 4,110,073 | | 2002 | |
CLINTON BANK BUILDING | 82,967 | 362,371 | - | 82,967 | 362,371 | 445,338 | 231,506 | 213,832 | | 2003 | |
CLINTON BOWL | 39,779 | 130,716 | 4,247 | 38,779 | 135,963 | 174,742 | 71,447 | 103,296 | | 2003 | |
TJMAXX | 1,279,200 | 2,870,800 | - | 1,279,200 | 2,870,800 | 4,150,000 | 58,238 | 4,091,762 | | 2011 | |
VILLAGES AT URBANA | 3,190,074 | 6,067 | 10,496,574 | 4,828,774 | 8,863,942 | 13,692,715 | 619,319 | 13,073,397 | | 2003 | |
GAITHERSBURG | 244,890 | 6,787,534 | 230,545 | 244,890 | 7,018,079 | 7,262,969 | 2,183,015 | 5,079,954 | | 1999 | |
HAGERSTOWN | 541,389 | 2,165,555 | 3,388,641 | 541,389 | 5,554,196 | 6,095,585 | 3,145,187 | 2,950,398 | | | 1973 |
SHAWAN PLAZA | 4,466,000 | 20,222,367 | (857,895) | 4,466,000 | 19,364,472 | 23,830,472 | 6,857,088 | 16,973,384 | 9,307,295 | 2008 | |
95
| | | | | | | | | | | |
| INITIAL COST | | | | | | | | | |
PROPERTIES | LAND | BUILDING
&
IMPROVEMENT | SUBSEQUENT
TO
ACQUISITION | LAND | BUILDING
&
IMPROVEMENT | TOTAL | ACCUMULATED
DEPRECIATION | TOTAL COST,
NET OF ACCUMULATED
DEPRECIATION | ENCUMBRANCES | DATE OF
ACQUISITION | DATE OF
CONSTRUCTION |
| | | | | | | | | | | |
LAUREL | 349,562 | 1,398,250 | 1,053,024 | 349,562 | 2,451,274 | 2,800,836 | 1,233,075 | 1,567,761 | | 1995 | |
LAUREL | 274,580 | 1,100,968 | 283,421 | 274,580 | 1,384,389 | 1,658,969 | 1,384,389 | 274,580 | | | 1972 |
SOUTHWEST MIXED USE PROPERTY | 403,034 | 1,325,126 | 306,510 | 361,035 | 1,673,635 | 2,034,670 | 812,783 | 1,221,887 | | 2003 | |
OWINGS MILLS PLAZA | 303,911 | 1,370,221 | (160,247) | 303,911 | 1,209,973 | 1,513,885 | 62,582 | 1,451,303 | | 2005 | |
PERRY HALL | 3,339,309 | 12,377,339 | 792,309 | 3,339,309 | 13,169,648 | 16,508,957 | 4,754,896 | 11,754,061 | | 2003 | |
CENTRE COURT-RETAIL/BANK | 1,035,359 | 7,785,830 | - | 1,035,359 | 7,785,830 | 8,821,189 | 227,636 | 8,593,553 | 2,918,360 | 2011 | |
CENTRE COURT-GIANT | 3,854,099 | 12,769,628 | - | 3,854,099 | 12,769,628 | 16,623,727 | 292,227 | 16,331,500 | 7,907,472 | 2011 | |
CENTRE COURT-OLD COURT/COURTYD | 2,279,177 | 5,284,577 | - | 2,279,177 | 5,284,577 | 7,563,754 | 186,899 | 7,376,855 | 5,525,980 | 2011 | |
TIMONIUM SHOPPING CENTER | 6,000,000 | 24,282,998 | 16,205,866 | 7,331,195 | 39,157,669 | 46,488,864 | 15,307,893 | 31,180,970 | | 2003 | |
WALDORF BOWL | 225,099 | 739,362 | 84,327 | 235,099 | 813,688 | 1,048,787 | 385,786 | 663,001 | | 2003 | |
WALDORF FIRESTONE | 57,127 | 221,621 | - | 57,127 | 221,621 | 278,749 | 107,684 | 171,065 | | 2003 | |
BANGOR, ME | 403,833 | 1,622,331 | 93,752 | 403,833 | 1,716,083 | 2,119,916 | 439,545 | 1,680,371 | | 2001 | |
MALLSIDE PLAZA | 6,930,996 | 18,148,727 | (245,736) | 6,939,589 | 17,894,397 | 24,833,987 | 4,477,314 | 20,356,672 | 14,888,151 | 2008 | |
CLAWSON | 1,624,771 | 6,578,142 | 8,584,479 | 1,624,771 | 15,162,621 | 16,787,392 | 4,803,475 | 11,983,917 | | 1993 | |
WHITE LAKE | 2,300,050 | 9,249,607 | 1,976,664 | 2,300,050 | 11,226,271 | 13,526,321 | 4,445,839 | 9,080,482 | | 1996 | |
CANTON TWP PLAZA | 163,740 | 926,150 | 5,249,730 | 163,740 | 6,175,879 | 6,339,620 | 544,206 | 5,795,414 | | 2005 | |
CLINTON TWP PLAZA | 175,515 | 714,279 | 1,147,275 | 59,450 | 1,977,619 | 2,037,068 | 400,822 | 1,636,246 | | 2005 | |
FARMINGTON | 1,098,426 | 4,525,723 | 2,563,624 | 1,098,426 | 7,089,347 | 8,187,773 | 3,197,998 | 4,989,775 | | 1993 | |
LIVONIA | 178,785 | 925,818 | 1,160,112 | 178,785 | 2,085,930 | 2,264,715 | 1,187,769 | 1,076,945 | | | 1968 |
MUSKEGON | 391,500 | 958,500 | 884,339 | 391,500 | 1,842,839 | 2,234,339 | 1,612,141 | 622,198 | | 1985 | |
OKEMOS PLAZA | 166,706 | 591,193 | 1,853,616 | 166,706 | 2,444,809 | 2,611,515 | 114,384 | 2,497,131 | 36,377 | 2005 | |
TAYLOR | 1,451,397 | 5,806,263 | 275,289 | 1,451,397 | 6,081,552 | 7,532,949 | 2,817,048 | 4,715,901 | | 1993 | |
WALKER | 3,682,478 | 14,730,060 | 2,108,718 | 3,682,478 | 16,838,778 | 20,521,256 | 7,509,493 | 13,011,763 | | 1993 | |
EDEN PRAIRIE PLAZA | 882,596 | 911,373 | 570,450 | 882,596 | 1,481,823 | 2,364,419 | 149,129 | 2,215,290 | | 2005 | |
FOUNTAINS AT ARBOR LAKES | 28,585,296 | 66,699,024 | 8,636,568 | 28,585,296 | 75,335,591 | 103,920,887 | 11,728,665 | 92,192,222 | | 2006 | |
ROSEVILLE PLAZA | 132,842 | 957,340 | 4,739,103 | 132,842 | 5,696,443 | 5,829,285 | 545,272 | 5,284,013 | | 2005 | |
ST. PAUL PLAZA | 699,916 | 623,966 | 318,525 | 699,916 | 942,491 | 1,642,407 | 73,686 | 1,568,721 | | 2005 | |
CREVE COEUR, WOODCREST/OLIVE | 1,044,598 | 5,475,623 | 615,905 | 960,814 | 6,175,312 | 7,136,126 | 2,133,499 | 5,002,627 | | 1998 | |
CRYSTAL CITY, MI | - | 234,378 | - | - | 234,378 | 234,378 | 79,346 | 155,032 | | 1997 | |
INDEPENDENCE, NOLAND DR. | 1,728,367 | 8,951,101 | 193,000 | 1,731,300 | 9,141,168 | 10,872,468 | 3,138,087 | 7,734,382 | | 1998 | |
NORTH POINT SHOPPING CENTER | 1,935,380 | 7,800,746 | 584,102 | 1,935,380 | 8,384,848 | 10,320,228 | 2,740,330 | 7,579,898 | | 1998 | |
KIRKWOOD | - | 9,704,005 | 11,783,330 | - | 21,487,335 | 21,487,335 | 10,277,288 | 11,210,047 | | 1998 | |
KANSAS CITY | 574,777 | 2,971,191 | 274,976 | 574,777 | 3,246,167 | 3,820,944 | 1,176,149 | 2,644,794 | | 1997 | |
LEMAY | 125,879 | 503,510 | 3,828,858 | 451,155 | 4,007,092 | 4,458,247 | 1,177,288 | 3,280,959 | | | 1974 |
GRAVOIS | 1,032,416 | 4,455,514 | 10,964,529 | 1,032,413 | 15,420,046 | 16,452,459 | 7,605,177 | 8,847,282 | | 2008 | |
ST. CHARLES-UNDERDEVELOPED LAND, MO | 431,960 | - | 758,854 | 431,960 | 758,855 | 1,190,814 | 210,110 | 980,705 | | 1998 | |
96
| | | | | | | | | | | |
| INITIAL COST | | | | | | | | | |
PROPERTIES | LAND | BUILDING
&
IMPROVEMENT | SUBSEQUENT
TO
ACQUISITION | LAND | BUILDING
&
IMPROVEMENT | TOTAL | ACCUMULATED
DEPRECIATION | TOTAL COST,
NET OF ACCUMULATED
DEPRECIATION | ENCUMBRANCES | DATE OF
ACQUISITION | DATE OF
CONSTRUCTION |
| | | | | | | | | | | |
SPRINGFIELD | 2,745,595 | 10,985,778 | 6,694,808 | 2,904,022 | 17,522,159 | 20,426,181 | 6,772,479 | 13,653,703 | | 1994 | |
KMART PARCEL | 905,674 | 3,666,386 | 4,933,942 | 905,674 | 8,600,328 | 9,506,001 | 2,037,412 | 7,468,590 | 1,680,142 | 2002 | |
KRC ST. CHARLES | - | 550,204 | - | - | 550,204 | 550,204 | 183,401 | 366,802 | | 1998 | |
ST. LOUIS, CHRISTY BLVD. | 809,087 | 4,430,514 | 3,160,390 | 809,087 | 7,590,904 | 8,399,991 | 2,192,907 | 6,207,084 | | 1998 | |
OVERLAND | - | 4,928,677 | 1,136,797 | - | 6,065,474 | 6,065,474 | 2,145,195 | 3,920,279 | | 1997 | |
ST. LOUIS | - | 5,756,736 | 849,684 | - | 6,606,420 | 6,606,420 | 2,467,474 | 4,138,946 | | 1997 | |
ST. LOUIS | - | 2,766,644 | 143,298 | - | 2,909,942 | 2,909,942 | 2,909,942 | - | | 1997 | |
ST. PETERS | 1,182,194 | 7,423,459 | 7,227,838 | 1,563,694 | 14,269,797 | 15,833,491 | 8,974,962 | 6,858,529 | | 1997 | |
SPRINGFIELD,GLENSTONE AVE. | - | 608,793 | 2,189,376 | - | 2,798,169 | 2,798,169 | 731,790 | 2,066,379 | | 1998 | |
KDI-TURTLE CREEK | 11,535,281 | - | 32,815,082 | 10,150,881 | 34,199,482 | 44,350,363 | 4,466,225 | 39,884,138 | | | 2004 |
CHARLOTTE | 919,251 | 3,570,981 | 1,481,774 | 919,251 | 5,052,754 | 5,972,006 | 1,945,897 | 4,026,108 | | 2008 | |
TYVOLA RD. | - | 4,736,345 | 5,081,319 | - | 9,817,664 | 9,817,664 | 7,019,552 | 2,798,112 | | 1986 | |
CROSSROADS PLAZA | 767,864 | 3,098,881 | 34,566 | 767,864 | 3,133,447 | 3,901,310 | 949,571 | 2,951,740 | | 2000 | |
KIMCO CARY 696, INC. | 2,180,000 | 8,756,865 | 542,573 | 2,256,799 | 9,222,640 | 11,479,438 | 3,165,275 | 8,314,164 | | 1998 | |
JETTON VILLAGE SHOPPES | 3,875,224 | 10,292,231 | - | 3,875,224 | 10,292,231 | 14,167,455 | 30,926 | 14,136,529 | 8,547,409 | 2011 | |
DURHAM | 1,882,800 | 7,551,576 | 2,124,357 | 1,882,800 | 9,675,933 | 11,558,733 | 3,718,660 | 7,840,073 | | 1996 | |
WESTRIDGE SQUARE S.C. | 7,456,381 | 19,778,703 | - | 7,456,381 | 19,778,703 | 27,235,084 | 59,506 | 27,175,578 | | 2011 | |
HILLSBOROUGH CROSSING | 519,395 | - | - | 519,395 | - | 519,395 | - | 519,395 | | 2003 | |
PARK PLACE | 5,461,478 | 16,163,494 | 129,583 | 5,469,809 | 16,284,746 | 21,754,555 | 2,722,363 | 19,032,192 | 13,516,871 | 2008 | |
MOORESVILLE CROSSING | 12,013,727 | 30,604,173 | (93,195) | 11,625,801 | 30,898,904 | 42,524,705 | 4,790,027 | 37,734,678 | | 2007 | |
RALEIGH | 5,208,885 | 20,885,792 | 11,964,726 | 5,208,885 | 32,850,518 | 38,059,403 | 13,239,674 | 24,819,729 | | 1993 | |
WAKEFIELD COMMONS II | 6,506,450 | - | (2,728,390) | 2,357,636 | 1,420,424 | 3,778,060 | 250,592 | 3,527,468 | | | 2001 |
WAKEFIELD CROSSINGS | 3,413,932 | - | (3,017,960) | 336,236 | 59,737 | 395,973 | 322 | 395,650 | | | 2001 |
EDGEWATER PLACE | 3,150,000 | - | 10,107,777 | 3,062,768 | 10,195,009 | 13,257,777 | 1,355,520 | 11,902,257 | | | 2003 |
BRENNAN STATION | 7,749,751 | 20,556,891 | - | 7,749,751 | 20,556,891 | 28,306,642 | 61,847 | 28,244,795 | 9,632,088 | 2011 | |
BRENNAN STATION OUTPARCEL | 627,906 | 1,665,576 | - | 627,906 | 1,665,576 | 2,293,482 | 5,011 | 2,288,471 | | 2011 | |
WINSTON-SALEM | 540,667 | 719,655 | 6,011,320 | 540,667 | 6,730,975 | 7,271,642 | 2,950,161 | 4,321,480 | 4,880,734 | | 1969 |
SORENSON PARK PLAZA | 5,104,294 | - | 31,649,605 | 4,111,177 | 32,642,722 | 36,753,899 | 1,999,099 | 34,754,801 | | | 2005 |
LORDEN PLAZA | 8,872,529 | 22,548,382 | 44,737 | 8,883,003 | 22,582,645 | 31,465,648 | 3,134,467 | 28,331,181 | 24,442,297 | 2008 | |
ROCKINGHAM | 2,660,915 | 10,643,660 | 12,100,829 | 3,148,715 | 22,256,689 | 25,405,404 | 8,474,593 | 16,930,811 | 17,947,573 | 2008 | |
BRIDGEWATER NJ | 1,982,481 | (3,666,959) | 11,632,601 | 1,982,481 | 7,965,643 | 9,948,123 | 4,028,803 | 5,919,320 | | | 1998 |
BAYONNE BROADWAY | 1,434,737 | 3,347,719 | 2,825,469 | 1,434,737 | 6,173,188 | 7,607,924 | 1,280,241 | 6,327,683 | | 2004 | |
BRICKTOWN PLAZA | 344,884 | 1,008,941 | (307,857) | 344,884 | 701,084 | 1,045,968 | 35,054 | 1,010,914 | | 2005 | |
BRIDGEWATER PLAZA | 350,705 | 1,361,524 | 6,068,929 | 350,705 | 7,430,453 | 7,781,158 | 141,557 | 7,639,601 | | 2005 | |
CHERRY HILL | 2,417,583 | 6,364,094 | 1,581,275 | 2,417,583 | 7,945,370 | 10,362,952 | 5,915,603 | 4,447,350 | | | 1985 |
MARLTON PIKE | - | 4,318,534 | 19,266 | - | 4,337,800 | 4,337,800 | 1,702,635 | 2,635,165 | | 1996 | |
97
| | | | | | | | | | | |
| INITIAL COST | | | | | | | | | |
PROPERTIES | LAND | BUILDING
&
IMPROVEMENT | SUBSEQUENT
TO
ACQUISITION | LAND | BUILDING
&
IMPROVEMENT | TOTAL | ACCUMULATED
DEPRECIATION | TOTAL COST,
NET OF ACCUMULATED
DEPRECIATION | ENCUMBRANCES | DATE OF
ACQUISITION | DATE OF
CONSTRUCTION |
| | | | | | | | | | | |
CINNAMINSON | 652,123 | 2,608,491 | 2,957,213 | 652,123 | 5,565,704 | 6,217,827 | 2,467,786 | 3,750,041 | | 1996 | |
GARDEN STATE PAVILIONS | 7,530,709 | 10,801,949 | - | 7,530,709 | 10,801,949 | 18,332,658 | 516,476 | 17,816,182 | | 2011 | |
EASTWINDOR VILLAGE | 9,335,011 | 23,777,978 | - | 9,335,011 | 23,777,978 | 33,112,989 | 2,507,882 | 30,605,106 | 18,369,861 | 2008 | |
HILLSBOROUGH | 11,886,809 | - | (6,880,755) | 5,006,054 | - | 5,006,054 | - | 5,006,054 | | | 2001 |
HOLMDEL TOWNE CENTER | 10,824,624 | 43,301,494 | 4,618,906 | 10,824,624 | 47,920,400 | 58,745,023 | 11,188,451 | 47,556,573 | 26,462,392 | 2002 | |
HOLMDEL COMMONS | 16,537,556 | 38,759,952 | 3,241,839 | 16,537,556 | 42,001,791 | 58,539,347 | 10,542,560 | 47,996,787 | 19,281,319 | 2004 | |
HOWELL PLAZA | 311,384 | 1,143,159 | 4,694,515 | 311,384 | 5,837,674 | 6,149,058 | 407,776 | 5,741,281 | | 2005 | |
STRAUSS DISCOUNT AUTO | 1,225,294 | 91,203 | 1,552,740 | 1,228,794 | 1,640,443 | 2,869,237 | 384,568 | 2,484,669 | | 2002 | |
MAPLE SHADE | - | 9,957,611 | 0 | - | 9,957,611 | 9,957,611 | 448,081 | 9,509,530 | | 2009 | |
NORTH BRUNSWICK | 3,204,978 | 12,819,912 | 21,173,722 | 3,204,978 | 33,993,634 | 37,198,612 | 11,942,818 | 25,255,794 | 27,308,016 | 1994 | |
PISCATAWAY TOWN CENTER | 3,851,839 | 15,410,851 | 612,255 | 3,851,839 | 16,023,106 | 19,874,945 | 5,624,143 | 14,250,803 | 10,921,249 | 1998 | |
RIDGEWOOD | 450,000 | 2,106,566 | 1,015,675 | 450,000 | 3,122,241 | 3,572,241 | 1,248,162 | 2,324,079 | | 1993 | |
SEA GIRT PLAZA | 457,039 | 1,308,010 | 1,460,149 | 457,039 | 2,768,159 | 3,225,198 | 156,459 | 3,068,739 | | 2005 | |
UNION CRESCENT | 7,895,483 | 3,010,640 | 25,415,422 | 8,696,579 | 27,624,967 | 36,321,545 | 4,446,719 | 31,874,827 | | 2007 | |
WESTMONT | 601,655 | 2,404,604 | 10,653,354 | 601,655 | 13,057,958 | 13,659,613 | 4,378,403 | 9,281,210 | | 1994 | |
WILLOWBROOK PLAZA | 15,320,436 | 40,996,874 | (969,688) | 15,320,436 | 40,027,186 | 55,347,622 | 4,844,265 | 50,503,357 | | 2009 | |
SYCAMORE PLAZA | 1,404,443 | 5,613,270 | 283,450 | 1,404,443 | 5,896,720 | 7,301,163 | 2,141,482 | 5,159,681 | | 1998 | |
PLAZA PASEO DEL-NORTE | 4,653,197 | 18,633,584 | 1,174,395 | 4,653,197 | 19,807,979 | 24,461,176 | 6,902,744 | 17,558,432 | | 1998 | |
JUAN TABO, ALBUQUERQUE | 1,141,200 | 4,566,817 | 231,015 | 1,141,200 | 4,797,832 | 5,939,032 | 1,668,811 | 4,270,221 | | 1998 | |
DEV-WARM SPRINGS PROMENADE | 7,226,363 | 19,109,946 | 2,503,166 | 7,226,363 | 21,613,111 | 28,839,474 | 3,849,575 | 24,989,899 | | 2009 | |
COMP USA CENTER | 2,581,908 | 5,798,092 | (363,745) | 2,581,908 | 5,434,347 | 8,016,255 | 2,704,302 | 5,311,953 | 2,917,449 | 2006 | |
DEL MONTE PLAZA | 2,489,429 | 5,590,415 | 309,754 | 2,210,000 | 6,179,598 | 8,389,599 | 1,386,429 | 7,003,169 | 3,847,268 | 2006 | |
D'ANDREA MARKETPLACE | 11,556,067 | 29,435,364 | - | 11,556,067 | 29,435,364 | 40,991,432 | 3,549,834 | 37,441,598 | 14,894,170 | 2007 | |
KEY BANK BUILDING | 1,500,000 | 40,486,755 | - | 1,500,000 | 40,486,755 | 41,986,755 | 9,799,874 | 32,186,881 | 18,292,829 | 2006 | |
BRIDGEHAMPTON | 1,811,752 | 3,107,232 | 24,850,863 | 1,858,188 | 27,911,658 | 29,769,847 | 14,855,858 | 14,913,988 | 34,039,295 | | 1972 |
GENOVESE DRUG STORE | 564,097 | 2,268,768 | - | 564,097 | 2,268,768 | 2,832,865 | 509,948 | 2,322,917 | | 2003 | |
KINGS HIGHWAY | 2,743,820 | 6,811,268 | 1,338,513 | 2,743,820 | 8,149,781 | 10,893,601 | 2,243,694 | 8,649,907 | | 2004 | |
HOMEPORT-RALPH AVENUE | 4,414,466 | 11,339,857 | 3,136,639 | 4,414,467 | 14,476,497 | 18,890,963 | 2,965,966 | 15,924,997 | | 2004 | |
BELLMORE | 1,272,269 | 3,183,547 | 381,803 | 1,272,269 | 3,565,350 | 4,837,619 | 877,702 | 3,959,917 | 260,095 | 2004 | |
MARKET AT BAY SHORE | 12,359,621 | 30,707,802 | 1,257,369 | 12,359,621 | 31,965,172 | 44,324,792 | 7,951,844 | 36,372,948 | | 2006 | |
5959 BROADWAY | 6,035,726 | - | 1,187,808 | 7,205,334 | 18,200 | 7,223,534 | 3,438 | 7,220,096 | 4,667,728 | 2008 | |
KING KULLEN PLAZA | 5,968,082 | 23,243,404 | 1,628,099 | 5,980,130 | 24,859,455 | 30,839,585 | 8,987,543 | 21,852,042 | | 1998 | |
KDI-CENTRAL ISLIP TOWN CENTER | 13,733,950 | 1,266,050 | 929,178 | 5,088,852 | 10,840,326 | 15,929,178 | 1,169,951 | 14,759,226 | 9,522,612 | | 2004 |
PATHMARK SC | 6,714,664 | 17,359,161 | 526,939 | 6,714,664 | 17,886,100 | 24,600,764 | 3,414,976 | 21,185,788 | 6,623,942 | 2006 | |
BIRCHWOOD PLAZA COMMACK | 3,630,000 | 4,774,791 | 292,333 | 3,630,000 | 5,067,124 | 8,697,124 | 1,174,953 | 7,522,172 | | 2007 | |
ELMONT | 3,011,658 | 7,606,066 | 2,204,704 | 3,011,658 | 9,810,769 | 12,822,428 | 2,335,451 | 10,486,976 | | 2004 | |
98
| | | | | | | | | | | |
| INITIAL COST | | | | | | | | | |
PROPERTIES | LAND | BUILDING
&
IMPROVEMENT | SUBSEQUENT
TO
ACQUISITION | LAND | BUILDING
&
IMPROVEMENT | TOTAL | ACCUMULATED
DEPRECIATION | TOTAL COST,
NET OF ACCUMULATED
DEPRECIATION | ENCUMBRANCES | DATE OF
ACQUISITION | DATE OF
CONSTRUCTION |
| | | | | | | | | | | |
FRANKLIN SQUARE | 1,078,541 | 2,516,581 | 3,949,715 | 1,078,541 | 6,466,296 | 7,544,837 | 1,037,361 | 6,507,476 | | 2004 | |
KISSENA BOULEVARD SC | 11,610,000 | 2,933,487 | 1,519 | 11,610,000 | 2,935,006 | 14,545,006 | 757,354 | 13,787,652 | | 2007 | |
HAMPTON BAYS | 1,495,105 | 5,979,320 | 3,304,710 | 1,495,105 | 9,284,031 | 10,779,135 | 4,747,538 | 6,031,597 | | 1989 | |
HICKSVILLE | 3,542,739 | 8,266,375 | 1,327,458 | 3,542,739 | 9,593,833 | 13,136,572 | 2,323,862 | 10,812,711 | | 2004 | |
100 WALT WHITMAN ROAD | 5,300,000 | 8,167,577 | 41,843 | 5,300,000 | 8,209,420 | 13,509,420 | 1,467,780 | 12,041,640 | | 2007 | |
TURNPIKE PLAZA | 2,471,832 | 5,839,416 | - | 2,471,832 | 5,839,416 | 8,311,248 | 529,156 | 7,782,092 | | 2011 | |
BIRCHWOOD PLAZA (NORTH & SOUTH) | 12,368,330 | 33,071,495 | 192,208 | 12,368,330 | 33,263,704 | 45,632,034 | 5,019,055 | 40,612,979 | 13,030,420 | 2007 | |
501 NORTH BROADWAY | - | 1,175,543 | 607 | - | 1,176,150 | 1,176,150 | 580,149 | 596,001 | | 2007 | |
MERRYLANE (P/L) | 1,485,531 | 1,749 | 539 | 1,485,531 | 2,288 | 1,487,819 | 161 | 1,487,657 | | 2007 | |
DOUGLASTON SHOPPING CENTER | 3,277,254 | 13,161,218 | 3,767,577 | 3,277,253 | 16,928,795 | 20,206,049 | 3,382,206 | 16,823,842 | | 2003 | |
STRAUSS MERRICK BLVD | 450,582 | 1,051,359 | 131,786 | 450,582 | 1,183,145 | 1,633,727 | 150,411 | 1,483,317 | | 2005 | |
MANHASSET VENTURE LLC | 4,567,003 | 19,165,808 | 26,327,150 | 4,421,939 | 45,638,022 | 50,059,961 | 15,953,091 | 34,106,871 | 19,046,838 | 1999 | |
MASPETH QUEENS-DUANE READE | 1,872,013 | 4,827,940 | 931,187 | 1,872,013 | 5,759,126 | 7,631,139 | 1,293,112 | 6,338,027 | | 2004 | |
MASSAPEQUA | 1,880,816 | 4,388,549 | 964,761 | 1,880,816 | 5,353,310 | 7,234,126 | 1,417,208 | 5,816,918 | | 2004 | |
MINEOLA SC | 4,150,000 | 7,520,692 | (405,644) | 4,150,000 | 7,115,049 | 11,265,049 | 1,375,856 | 9,889,193 | | 2007 | |
BIRCHWOOD PARK DRIVE (LAND LOT) | 3,507,162 | 4,126 | 782 | 3,507,406 | 4,665 | 3,512,071 | 371 | 3,511,700 | | 2007 | |
SMITHTOWN PLAZA | 3,528,000 | 7,364,098 | 351,638 | 3,528,000 | 7,715,735 | 11,243,735 | 566,103 | 10,677,633 | 6,660,879 | 2009 | |
4452 BROADWAY | 12,412,724 | - | (1,900,000) | 10,512,724 | - | 10,512,724 | - | 10,512,724 | 8,330,010 | 2007 | |
PLAINVIEW | 263,693 | 584,031 | 9,800,106 | 263,693 | 10,384,138 | 10,647,830 | 5,026,428 | 5,621,403 | 13,607,630 | | 1969 |
POUGHKEEPSIE | 876,548 | 4,695,659 | 12,696,051 | 876,548 | 17,391,710 | 18,268,258 | 8,290,333 | 9,977,924 | 15,354,784 | | 1972 |
SYOSSET, NY | 106,655 | 76,197 | 1,551,676 | 106,655 | 1,627,873 | 1,734,528 | 952,293 | 782,235 | | | 1990 |
STATEN ISLAND | 2,280,000 | 9,027,951 | 5,591,008 | 2,280,000 | 14,618,959 | 16,898,959 | 8,921,384 | 7,977,575 | | 1989 | |
STATEN ISLAND | 2,940,000 | 11,811,964 | 1,182,531 | 3,148,424 | 12,786,070 | 15,934,495 | 4,574,250 | 11,360,244 | | 1997 | |
STATEN ISLAND PLAZA | 5,600,744 | 6,788,460 | (1,865,930) | 5,600,744 | 4,922,530 | 10,523,274 | 207,825 | 10,315,449 | | 2005 | |
HYLAN PLAZA | 28,723,536 | 38,232,267 | 34,312,818 | 28,723,536 | 72,545,085 | 101,268,621 | 18,453,612 | 82,815,009 | | 2006 | |
STOP N SHOP STATEN ISLAND | 4,558,592 | 10,441,408 | 155,848 | 4,558,592 | 10,597,256 | 15,155,848 | 2,792,804 | 12,363,044 | | 2005 | |
WEST GATES | 1,784,718 | 9,721,970 | (1,269,853) | 1,784,718 | 8,452,117 | 10,236,835 | 4,512,511 | 5,724,324 | | 1993 | |
WHITE PLAINS | 1,777,775 | 4,453,894 | 2,010,606 | 1,777,775 | 6,464,500 | 8,242,274 | 1,650,680 | 6,591,595 | 3,064,292 | 2004 | |
YONKERS | 871,977 | 3,487,909 | - | 871,977 | 3,487,909 | 4,359,886 | 1,680,957 | 2,678,929 | | 1998 | |
STRAUSS ROMAINE AVENUE | 782,459 | 1,825,737 | 279,107 | 782,459 | 2,104,845 | 2,887,303 | 261,195 | 2,626,108 | | 2005 | |
AKRON WATERLOO | 437,277 | 1,912,222 | 4,131,997 | 437,277 | 6,044,219 | 6,481,496 | 2,996,146 | 3,485,350 | | | 1975 |
WEST MARKET ST. | 560,255 | 3,909,430 | 379,484 | 560,255 | 4,288,914 | 4,849,169 | 2,968,245 | 1,880,924 | | 1999 | |
BARBERTON | 505,590 | 1,948,135 | 3,749,780 | 505,590 | 5,697,916 | 6,203,505 | 4,173,668 | 2,029,837 | | | 1972 |
BRUNSWICK | 771,765 | 6,058,560 | 2,191,588 | 771,765 | 8,250,148 | 9,021,913 | 6,563,439 | 2,458,474 | | | 1975 |
BEAVERCREEK | 635,228 | 3,024,722 | 4,182,847 | 635,228 | 7,207,569 | 7,842,797 | 4,486,756 | 3,356,041 | | 1986 | |
CANTON | 792,985 | 1,459,031 | 4,876,418 | 792,985 | 6,335,449 | 7,128,434 | 5,033,952 | 2,094,482 | | | 1972 |
99
| | | | | | | | | | | |
| INITIAL COST | | | | | | | | | |
PROPERTIES | LAND | BUILDING
&
IMPROVEMENT | SUBSEQUENT
TO
ACQUISITION | LAND | BUILDING
&
IMPROVEMENT | TOTAL | ACCUMULATED
DEPRECIATION | TOTAL COST,
NET OF ACCUMULATED
DEPRECIATION | ENCUMBRANCES | DATE OF
ACQUISITION | DATE OF
CONSTRUCTION |
| | | | | | | | | | | |
CAMBRIDGE | - | 1,848,195 | 1,251,550 | 473,060 | 2,626,686 | 3,099,745 | 2,107,963 | 991,782 | | | 1973 |
OLENTANGY RIVER RD. | 764,517 | 1,833,600 | 2,340,830 | 764,517 | 4,174,430 | 4,938,947 | 3,396,828 | 1,542,119 | | 1988 | |
RIDGE ROAD | 1,285,213 | 4,712,358 | 10,648,465 | 1,285,213 | 15,360,823 | 16,646,036 | 6,274,917 | 10,371,119 | | 1992 | |
GLENWAY CROSSING | 699,359 | 3,112,047 | 868,198 | 699,359 | 3,980,245 | 4,679,604 | 1,086,280 | 3,593,324 | | 2000 | |
HIGHLAND RIDGE PLAZA | 1,540,000 | 6,178,398 | 918,079 | 1,540,000 | 7,096,477 | 8,636,477 | 2,056,231 | 6,580,245 | | 1999 | |
HIGHLAND PLAZA | 702,074 | 667,463 | 76,380 | 702,074 | 743,843 | 1,445,917 | 73,856 | 1,372,061 | | 2005 | |
MONTGOMERY PLAZA | 530,893 | 1,302,656 | 3,226,699 | 530,893 | 4,529,354 | 5,060,248 | 317,009 | 4,743,238 | | 2005 | |
SHILOH SPRING RD. | - | 1,735,836 | 3,922,454 | 1,105,183 | 4,553,108 | 5,658,290 | 2,961,960 | 2,696,330 | | | 1969 |
OAKCREEK | 1,245,870 | 4,339,637 | 4,259,558 | 1,149,622 | 8,695,443 | 9,845,065 | 6,266,827 | 3,578,238 | | 1984 | |
SALEM AVE. | 665,314 | 347,818 | 5,599,522 | 665,314 | 5,947,341 | 6,612,654 | 3,604,127 | 3,008,527 | | 1988 | |
KENT, OH | 6,254 | 3,028,914 | - | 6,254 | 3,028,914 | 3,035,168 | 1,869,928 | 1,165,240 | | 1999 | |
KENT | 2,261,530 | - | - | 2,261,530 | - | 2,261,530 | - | 2,261,530 | | 1995 | |
MENTOR | 503,981 | 2,455,926 | 2,357,848 | 371,295 | 4,946,459 | 5,317,755 | 3,122,726 | 2,195,029 | | 1987 | |
MIDDLEBURG HEIGHTS | 639,542 | 3,783,096 | 69,419 | 639,542 | 3,852,515 | 4,492,057 | 2,625,200 | 1,866,857 | | 1999 | |
MALLWOODS CENTER | 294,232 | - | 1,184,543 | 294,232 | 1,184,543 | 1,478,775 | 278,955 | 1,199,820 | | | 1999 |
NORTH OLMSTED | 626,818 | 3,712,045 | 35,000 | 626,818 | 3,747,045 | 4,373,862 | 2,520,069 | 1,853,793 | | 1999 | |
ORANGE OHIO | 3,783,875 | - | (2,342,306) | 921,704 | 519,865 | 1,441,569 | - | 1,441,569 | | | 2001 |
UPPER ARLINGTON | 504,256 | 2,198,476 | 9,207,861 | 1,255,544 | 10,655,048 | 11,910,593 | 7,108,954 | 4,801,638 | | 2008 | |
WESTERVILLE | 1,050,431 | 4,201,616 | 8,581,783 | 997,053 | 12,836,777 | 13,833,830 | 6,621,534 | 7,212,295 | | 1988 | |
EDMOND | 477,036 | 3,591,493 | 77,650 | 477,036 | 3,669,143 | 4,146,179 | 1,299,604 | 2,846,576 | | 1997 | |
CENTENNIAL PLAZA | 4,650,634 | 18,604,307 | 1,401,704 | 4,650,634 | 20,006,011 | 24,656,645 | 7,488,966 | 17,167,679 | | 1998 | |
ALBANY PLAZA | 2,654,000 | 4,445,112 | (22,723) | 2,654,000 | 4,422,389 | 7,076,389 | 610,983 | 6,465,407 | | 2009 | |
CANBY SQUARE SHOPPING CENTER | 2,727,000 | 4,347,500 | (180,402) | 2,727,000 | 4,167,098 | 6,894,098 | 735,960 | 6,158,138 | | 2009 | |
OREGON TRAIL CENTER | 5,802,422 | 12,622,879 | (490,206) | 5,802,422 | 12,132,673 | 17,935,095 | 1,909,854 | 16,025,241 | | 2009 | |
POWELL VALLEY JUNCTION | 5,062,500 | 3,152,982 | (3,027,375) | 2,035,125 | 3,152,982 | 5,188,107 | 630,640 | 4,557,467 | | 2009 | |
MEDFORD CENTER | 8,940,798 | 16,995,113 | (14,781) | 8,943,600 | 16,977,531 | 25,921,131 | 2,556,305 | 23,364,826 | | 2009 | |
KDI-MCMINNVILLE | 4,062,327 | - | 721,508 | 4,062,327 | 721,508 | 4,783,835 | 3,431 | 4,780,405 | | | 2006 |
PIONEER PLAZA | 952,740 | 6,638,583 | 3,012,460 | 3,982,020 | 6,621,763 | 10,603,783 | 1,409,332 | 9,194,451 | | 2009 | |
TROUTDALE MARKET | 1,931,559 | 2,940,661 | 62,243 | 1,933,369 | 3,001,095 | 4,934,464 | 508,902 | 4,425,562 | | 2009 | |
ALLEGHENY | - | 30,061,177 | 59,094 | - | 30,120,271 | 30,120,271 | 5,575,303 | 24,544,968 | | 2004 | |
SUBURBAN SQUARE | 70,679,871 | 166,351,381 | 5,428,786 | 71,279,871 | 171,180,167 | 242,460,039 | 29,883,594 | 212,576,445 | | 2007 | |
CHIPPEWA | 2,881,525 | 11,526,101 | 153,289 | 2,881,525 | 11,679,391 | 14,560,916 | 3,605,221 | 10,955,695 | 6,747,701 | 2000 | |
BROOKHAVEN PLAZA | 254,694 | 973,318 | (61,414) | 254,694 | 911,903 | 1,166,598 | 51,768 | 1,114,830 | | 2005 | |
CARNEGIE | - | 3,298,908 | 17,747 | - | 3,316,655 | 3,316,655 | 1,020,510 | 2,296,146 | | 1999 | |
CENTER SQUARE | 731,888 | 2,927,551 | 1,267,176 | 731,888 | 4,194,728 | 4,926,615 | 2,058,485 | 2,868,130 | | 1996 | |
WAYNE PLAZA | 6,127,623 | 15,605,012 | 159,727 | 6,135,670 | 15,756,692 | 21,892,362 | 1,673,648 | 20,218,714 | 13,973,967 | 2008 | |
100
| | | | | | | | | | | |
| INITIAL COST | | | | | | | | | |
PROPERTIES | LAND | BUILDING
&
IMPROVEMENT | SUBSEQUENT
TO
ACQUISITION | LAND | BUILDING
&
IMPROVEMENT | TOTAL | ACCUMULATED
DEPRECIATION | TOTAL COST,
NET OF ACCUMULATED
DEPRECIATION | ENCUMBRANCES | DATE OF
ACQUISITION | DATE OF
CONSTRUCTION |
| | | | | | | | | | | |
CHAMBERSBURG CROSSING | 9,090,288 | - | 26,037,242 | 8,790,288 | 26,337,242 | 35,127,530 | 3,112,073 | 32,015,457 | | | 2006 |
EAST STROUDSBURG | 1,050,000 | 2,372,628 | 1,395,671 | 1,050,000 | 3,768,299 | 4,818,299 | 2,941,555 | 1,876,744 | | | 1973 |
RIDGE PIKE PLAZA | 1,525,337 | 4,251,732 | 3,039,719 | 1,525,337 | 7,291,452 | 8,816,788 | 989,034 | 7,827,754 | | 2008 | |
EXTON | 176,666 | 4,895,360 | - | 176,666 | 4,895,360 | 5,072,026 | 1,506,265 | 3,565,761 | | 1999 | |
EXTON | 731,888 | 2,927,551 | - | 731,888 | 2,927,551 | 3,659,439 | 1,151,004 | 2,508,436 | | 1996 | |
EASTWICK | 889,001 | 2,762,888 | 3,074,728 | 889,001 | 5,837,616 | 6,726,617 | 2,121,332 | 4,605,285 | 4,315,015 | 1997 | |
EXTON PLAZA | 294,378 | 1,404,778 | 868,746 | 294,378 | 2,273,524 | 2,567,902 | 144,826 | 2,423,077 | | 2005 | |
FEASTERVILLE | 520,521 | 2,082,083 | 1,885,309 | 520,521 | 3,967,392 | 4,487,913 | 820,029 | 3,667,884 | | 1996 | |
GETTYSBURG | 74,626 | 671,630 | 101,519 | 74,626 | 773,149 | 847,775 | 749,910 | 97,865 | | 1986 | |
HARRISBURG, PA | 452,888 | 6,665,238 | 3,969,364 | 452,888 | 10,634,601 | 11,087,489 | 7,018,111 | 4,069,379 | | 2002 | |
HAMBURG | 439,232 | - | 2,023,428 | 494,982 | 1,967,677 | 2,462,660 | 492,824 | 1,969,835 | 2,141,305 | | 2000 |
HAVERTOWN | 731,888 | 2,927,551 | - | 731,888 | 2,927,551 | 3,659,439 | 1,151,004 | 2,508,436 | | 1996 | |
NORRISTOWN | 686,134 | 2,664,535 | 3,754,920 | 774,084 | 6,331,505 | 7,105,589 | 4,115,763 | 2,989,825 | | 1984 | |
NEW KENSINGTON | 521,945 | 2,548,322 | 705,540 | 521,945 | 3,253,862 | 3,775,807 | 2,915,682 | 860,125 | | 1986 | |
PHILADELPHIA | 731,888 | 2,927,551 | - | 731,888 | 2,927,551 | 3,659,439 | 1,151,004 | 2,508,436 | | 1996 | |
PHILADELPHIA PLAZA | 209,197 | 1,373,843 | 16,952 | 209,197 | 1,390,795 | 1,599,992 | 88,614 | 1,511,378 | | 2005 | |
STRAUSS WASHINGTON AVENUE | 424,659 | 990,872 | 468,821 | 424,659 | 1,459,693 | 1,884,352 | 312,532 | 1,571,820 | | 2005 | |
WEXFORD PLAZA | 6,413,635 | 9,774,600 | 2,859,872 | 6,413,635 | 12,634,472 | 19,048,107 | 1,015,148 | 18,032,959 | 12,500,000 | 2010 | |
1628 WALNUT STREET | 912,686 | 2,747,260 | (1,983,798) | 912,686 | 763,461 | 1,676,147 | 69,819 | 1,606,328 | | 2007 | |
120-122 MARKET STREET | 752,309 | 2,707,474 | (2,332,017) | 912,076 | 215,690 | 1,127,766 | 21,439 | 1,106,327 | | 2007 | |
242-244 MARKET STREET | 704,263 | 2,117,182 | 290,927 | 704,263 | 2,408,109 | 3,112,372 | 51,985 | 3,060,387 | | 2007 | |
1401 WALNUT ST LOWER ESTATE - UNIT A | - | 7,001,199 | 173,939 | - | 7,175,137 | 7,175,137 | 976,632 | 6,198,505 | | 2008 | |
1401 WALNUT ST LOWER ESTATE | - | 32,081,992 | (256,606) | - | 31,825,386 | 31,825,386 | 2,777,172 | 29,048,214 | | 2008 | |
1831-33 CHESTNUT STREET | 1,982,143 | 5,982,231 | (601,274) | 1,740,416 | 5,622,684 | 7,363,100 | 131,172 | 7,231,928 | | 2007 | |
1429 WALNUT STREET-COMMERCIAL | 5,881,640 | 17,796,661 | 1,070,231 | 5,881,640 | 18,866,893 | 24,748,533 | 1,574,602 | 23,173,931 | 6,787,002 | 2008 | |
1805 WALNUT STREET UNIT A | - | 17,311,529 | 2,788,117 | - | 20,099,645 | 20,099,645 | 134,989 | 19,964,656 | | 2008 | |
RICHBORO | 788,761 | 3,155,044 | 12,757,806 | 976,439 | 15,725,172 | 16,701,611 | 8,269,893 | 8,431,718 | 9,510,185 | 1986 | |
SPRINGFIELD | 919,998 | 4,981,589 | 9,723,629 | 920,000 | 14,705,216 | 15,625,216 | 5,856,290 | 9,768,926 | | 1983 | |
UPPER DARBY | 231,821 | 927,286 | 5,779,270 | 231,821 | 6,706,556 | 6,938,377 | 2,339,092 | 4,599,285 | 3,390,369 | 1996 | |
WEST MIFFLIN | 1,468,342 | - | - | 1,468,342 | - | 1,468,342 | - | 1,468,342 | | 1986 | |
WHITEHALL | - | 5,195,577 | - | - | 5,195,577 | 5,195,577 | 2,042,706 | 3,152,871 | | 1996 | |
W. MARKET ST. | 188,562 | 1,158,307 | - | 188,562 | 1,158,307 | 1,346,869 | 1,158,307 | 188,562 | | 1986 | |
REXVILLE TOWN CENTER | 24,872,982 | 48,688,161 | 6,112,157 | 25,678,064 | 53,995,236 | 79,673,300 | 16,762,202 | 62,911,098 | 39,701,391 | 2006 | |
PLAZA CENTRO - COSTCO | 3,627,973 | 10,752,213 | 1,562,970 | 3,866,206 | 12,076,950 | 15,943,156 | 4,884,094 | 11,059,062 | | 2006 | |
PLAZA CENTRO - MALL | 19,873,263 | 58,719,179 | 6,435,579 | 19,408,112 | 65,619,909 | 85,028,021 | 25,982,025 | 59,045,996 | | 2006 | |
PLAZA CENTRO - RETAIL | 5,935,566 | 16,509,748 | 2,539,620 | 6,026,070 | 18,958,864 | 24,984,934 | 7,558,996 | 17,425,938 | | 2006 | |
101
| | | | | | | | | | | |
| INITIAL COST | | | | | | | | | |
PROPERTIES | LAND | BUILDING
&
IMPROVEMENT | SUBSEQUENT
TO
ACQUISITION | LAND | BUILDING
&
IMPROVEMENT | TOTAL | ACCUMULATED
DEPRECIATION | TOTAL COST,
NET OF ACCUMULATED
DEPRECIATION | ENCUMBRANCES | DATE OF
ACQUISITION | DATE OF
CONSTRUCTION |
| | | | | | | | | | | |
PLAZA CENTRO - SAM'S CLUB | 6,643,224 | 20,224,758 | 2,372,981 | 6,520,090 | 22,720,873 | 29,240,963 | 19,398,568 | 9,842,395 | | 2006 | |
LOS COLOBOS - BUILDERS SQUARE | 4,404,593 | 9,627,903 | 1,386,121 | 4,461,145 | 10,957,472 | 15,418,617 | 5,457,880 | 9,960,737 | | 2006 | |
LOS COLOBOS - KMART | 4,594,944 | 10,120,147 | 751,304 | 4,402,338 | 11,064,056 | 15,466,395 | 5,683,199 | 9,783,196 | | 2006 | |
LOS COLOBOS I | 12,890,882 | 26,046,669 | 3,165,270 | 13,613,375 | 28,489,446 | 42,102,821 | 10,818,110 | 31,284,711 | | 2006 | |
LOS COLOBOS II | 14,893,698 | 30,680,556 | 3,325,357 | 15,142,300 | 33,757,311 | 48,899,611 | 10,787,344 | 38,112,267 | | 2006 | |
WESTERN PLAZA - MAYAGUEZ ONE | 10,857,773 | 12,252,522 | 1,306,168 | 11,241,993 | 13,174,470 | 24,416,463 | 5,018,456 | 19,398,007 | | 2006 | |
WESTERN PLAZA - MAYAGUEZ TWO | 16,874,345 | 19,911,045 | 1,705,151 | 16,872,647 | 21,617,894 | 38,490,541 | 8,273,553 | 30,216,988 | | 2006 | |
MANATI VILLA MARIA SC | 2,781,447 | 5,673,119 | 497,718 | 2,606,588 | 6,345,697 | 8,952,284 | 3,466,351 | 5,485,933 | | 2006 | |
PONCE TOWN CENTER | 14,432,778 | 28,448,754 | 3,581,834 | 14,903,024 | 31,560,342 | 46,463,366 | 7,586,133 | 38,877,232 | 23,129,935 | 2006 | |
TRUJILLO ALTO PLAZA | 12,053,673 | 24,445,858 | 3,250,425 | 12,289,288 | 27,460,669 | 39,749,957 | 14,628,293 | 25,121,665 | | 2006 | |
MARSHALL PLAZA, CRANSTON RI | 1,886,600 | 7,575,302 | 1,690,274 | 1,886,600 | 9,265,576 | 11,152,176 | 3,509,853 | 7,642,323 | | 1998 | |
CHARLESTON | 730,164 | 3,132,092 | 18,673,289 | 730,164 | 21,805,381 | 22,535,545 | 5,470,198 | 17,065,347 | | | 1978 |
CHARLESTON | 1,744,430 | 6,986,094 | 4,383,081 | 1,744,430 | 11,369,175 | 13,113,605 | 4,368,701 | 8,744,904 | | 1995 | |
FLORENCE | 1,465,661 | 6,011,013 | 279,832 | 1,465,661 | 6,290,845 | 7,756,506 | 2,279,485 | 5,477,021 | | 1997 | |
GREENVILLE | 2,209,812 | 8,850,864 | 874,783 | 2,209,811 | 9,725,648 | 11,935,459 | 3,555,204 | 8,380,256 | | 1997 | |
CHERRYDALE POINT | 5,801,948 | 32,055,019 | 891,511 | 5,801,948 | 32,946,529 | 38,748,478 | 2,478,900 | 36,269,578 | 36,863,545 | 2009 | |
WOODRUFF SHOPPING CENTER | 3,110,439 | 15,501,117 | 1,182,533 | 3,465,199 | 16,328,890 | 19,794,089 | 501,698 | 19,292,390 | | 2010 | |
NORTH CHARLESTON | 744,093 | 2,974,990 | 257,733 | 744,093 | 3,232,723 | 3,976,815 | 1,026,882 | 2,949,933 | 1,242,399 | 2000 | |
N. CHARLESTON | 2,965,748 | 11,895,294 | 1,867,495 | 2,965,748 | 13,762,789 | 16,728,537 | 5,010,142 | 11,718,395 | | 1997 | |
MADISON | - | 4,133,904 | 2,754,378 | - | 6,888,282 | 6,888,282 | 5,342,642 | 1,545,641 | | | 1978 |
HICKORY RIDGE COMMONS | 596,347 | 2,545,033 | (2,404,809) | 683,820 | 52,750 | 736,571 | 14,315 | 722,256 | | 2000 | |
TROLLEY STATION | 3,303,682 | 13,218,740 | 203,711 | 3,303,682 | 13,422,451 | 16,726,133 | 4,542,762 | 12,183,371 | | 1998 | |
RIVERGATE STATION | 7,135,070 | 19,091,078 | 1,911,961 | 7,135,070 | 21,003,039 | 28,138,109 | 6,002,612 | 22,135,497 | | 2004 | |
MARKET PLACE AT RIVERGATE | 2,574,635 | 10,339,449 | 1,413,393 | 2,574,635 | 11,752,842 | 14,327,477 | 4,207,092 | 10,120,385 | | 1998 | |
RIVERGATE, TN | 3,038,561 | 12,157,408 | 4,380,200 | 3,038,561 | 16,537,608 | 19,576,169 | 5,378,476 | 14,197,693 | | 1998 | |
CENTER OF THE HILLS, TX | 2,923,585 | 11,706,145 | 1,186,351 | 2,923,585 | 12,892,496 | 15,816,081 | 4,675,256 | 11,140,825 | 10,041,749 | 2008 | |
ARLINGTON | 3,160,203 | 2,285,378 | - | 3,160,203 | 2,285,378 | 5,445,582 | 829,832 | 4,615,750 | | 1997 | |
DOWLEN CENTER | 2,244,581 | - | (722,251) | 484,828 | 1,037,502 | 1,522,330 | 66,726 | 1,455,604 | | | 2002 |
GATEWAY STATION | 1,373,692 | 28,145,158 | 1,189 | 1,374,880 | 28,145,158 | 29,520,038 | 222,921 | 29,297,117 | 19,588,199 | 2011 | |
BAYTOWN | 500,422 | 2,431,651 | 681,655 | 500,422 | 3,113,306 | 3,613,728 | 1,113,470 | 2,500,258 | | 1996 | |
LAS TIENDAS PLAZA | 8,678,107 | - | 24,966,592 | 7,943,925 | 25,700,774 | 33,644,699 | 1,715,687 | 31,929,012 | | | 2005 |
CORPUS CHRISTI, TX | - | 944,562 | 3,208,000 | - | 4,152,562 | 4,152,562 | 1,107,471 | 3,045,091 | | 1997 | |
ISLAND GATE PLAZA | 4,343,000 | 4,723,215 | - | 4,343,000 | 4,723,215 | 9,066,215 | 58,763 | 9,007,452 | | 2011 | |
DALLAS | 1,299,632 | 5,168,727 | (2,326,320) | 1,299,632 | 2,842,407 | 4,142,039 | 189,494 | 3,952,545 | | | 1969 |
MONTGOMERY PLAZA | 6,203,205 | - | 45,583,288 | 6,203,205 | 45,583,289 | 51,786,493 | 7,692,711 | 44,093,782 | | | 2003 |
PRESTON LEBANON CROSSING | 13,552,180 | - | 25,211,875 | 12,163,694 | 26,600,361 | 38,764,055 | 1,557,649 | 37,206,406 | | | 2006 |
102
| | | | | | | | | | | |
| INITIAL COST | | | | | | | | | |
PROPERTIES | LAND | BUILDING
&
IMPROVEMENT | SUBSEQUENT
TO
ACQUISITION | LAND | BUILDING
&
IMPROVEMENT | TOTAL | ACCUMULATED
DEPRECIATION | TOTAL COST,
NET OF ACCUMULATED
DEPRECIATION | ENCUMBRANCES | DATE OF
ACQUISITION | DATE OF
CONSTRUCTION |
| | | | | | | | | | | |
KDI-LAKE PRAIRIE TOWN CROSSING | 7,897,491 | - | 24,234,368 | 6,783,464 | 25,348,395 | 32,131,859 | 2,001,904 | 30,129,954 | | | 2006 |
CENTER AT BAYBROOK | 6,941,017 | 27,727,491 | 5,242,529 | 7,063,186 | 32,847,851 | 39,911,037 | 10,490,734 | 29,420,304 | | 1998 | |
HARRIS COUNTY | 1,843,000 | 7,372,420 | 2,075,406 | 2,003,260 | 9,287,566 | 11,290,826 | 3,147,077 | 8,143,750 | | 1997 | |
CYPRESS TOWNE CENTER | 6,033,932 | - | (1,511,521) | 2,251,666 | 2,270,745 | 4,522,411 | 147,042 | 4,375,369 | | | 2003 |
SHOPS AT VISTA RIDGE | 3,257,199 | 13,029,416 | 373,296 | 3,257,199 | 13,402,711 | 16,659,911 | 4,831,520 | 11,828,391 | | 1998 | |
VISTA RIDGE PLAZA | 2,926,495 | 11,716,483 | 2,259,961 | 2,926,495 | 13,976,445 | 16,902,939 | 4,894,803 | 12,008,136 | | 1998 | |
VISTA RIDGE PHASE II | 2,276,575 | 9,106,300 | 938,692 | 2,276,575 | 10,044,992 | 12,321,567 | 3,234,787 | 9,086,781 | | 1998 | |
SOUTH PLAINES PLAZA, TX | 1,890,000 | 7,555,099 | 284,355 | 1,890,000 | 7,839,454 | 9,729,454 | 2,767,199 | 6,962,255 | | 1998 | |
MESQUITE | 520,340 | 2,081,356 | 1,029,104 | 520,340 | 3,110,460 | 3,630,800 | 1,256,341 | 2,374,459 | | 1995 | |
MESQUITE TOWN CENTER | 3,757,324 | 15,061,644 | 2,461,177 | 3,757,324 | 17,522,821 | 21,280,145 | 6,126,027 | 15,154,117 | | 1998 | |
NEW BRAUNSFELS | 840,000 | 3,360,000 | - | 840,000 | 3,360,000 | 4,200,000 | 733,803 | 3,466,197 | | 2003 | |
PARKER PLAZA | 7,846,946 | - | - | 7,846,946 | - | 7,846,946 | - | 7,846,946 | | | 2005 |
PLANO | 500,414 | 2,830,835 | - | 500,414 | 2,830,835 | 3,331,249 | 1,101,495 | 2,229,754 | | 1996 | |
SOUTHLAKE OAKS | 3,011,260 | 7,703,844 | (102,882) | 3,019,951 | 7,592,272 | 10,612,223 | 1,857,076 | 8,755,147 | 6,268,695 | 2008 | |
WEST OAKS | 500,422 | 2,001,687 | 26,291 | 500,422 | 2,027,978 | 2,528,400 | 822,440 | 1,705,960 | | 1996 | |
OGDEN | 213,818 | 855,275 | 4,084,007 | 850,699 | 4,302,401 | 5,153,100 | 1,873,825 | 3,279,275 | | | 1967 |
COLONIAL HEIGHTS | 125,376 | 3,476,073 | 209,168 | 125,376 | 3,685,242 | 3,810,618 | 1,133,741 | 2,676,876 | | 1999 | |
OLD TOWN VILLAGE | 4,500,000 | 41,569,735 | (2,876,649) | 4,300,819 | 38,892,267 | 43,193,086 | 1,165,198 | 42,027,888 | | 2007 | |
MANASSAS | 1,788,750 | 7,162,661 | 596,648 | 1,788,750 | 7,759,309 | 9,548,059 | 2,791,668 | 6,756,391 | | 1997 | |
RICHMOND | 82,544 | 2,289,288 | 280,600 | 82,544 | 2,569,889 | 2,652,432 | 656,534 | 1,995,898 | | 1999 | |
RICHMOND | 670,500 | 2,751,375 | - | 670,500 | 2,751,375 | 3,421,875 | 1,170,746 | 2,251,129 | | 1995 | |
VALLEY VIEW SHOPPING CENTER | 3,440,018 | 8,054,004 | 922,790 | 3,440,018 | 8,976,794 | 12,416,812 | 1,626,500 | 10,790,312 | | 2004 | |
POTOMAC RUN PLAZA | 27,369,515 | 48,451,209 | (847,229) | 27,369,515 | 47,603,980 | 74,973,495 | 8,586,961 | 66,386,533 | 42,205,944 | 2008 | |
MANCHESTER SHOPPING CENTER | 2,722,461 | 6,403,866 | 639,555 | 2,722,461 | 7,043,421 | 9,765,882 | 2,150,334 | 7,615,549 | | 2004 | |
AUBURN NORTH | 7,785,841 | 18,157,625 | 60,221 | 7,785,841 | 18,217,846 | 26,003,688 | 4,796,004 | 21,207,684 | | 2007 | |
CHARLES TOWN | 602,000 | 3,725,871 | 11,159,243 | 602,000 | 14,885,114 | 15,487,114 | 8,303,873 | 7,183,240 | | 1985 | |
RIVERWALK PLAZA | 2,708,290 | 10,841,674 | 336,303 | 2,708,290 | 11,177,977 | 13,886,267 | 3,729,937 | 10,156,330 | | 1999 | |
BLUE RIDGE | 12,346,900 | 71,529,796 | (5,592,155) | 17,758,808 | 60,525,733 | 78,284,541 | 15,316,136 | 62,968,406 | 14,901,760 | 2005 | |
BRAZIL-RIO CLARO | 1,300,000 | - | 4,204,231 | 1,618,516 | 3,885,715 | 5,504,231 | 182,342 | 5,321,889 | | | 2009 |
BRAZIL-VALINHOS | 5,204,507 | 14,997,200 | 13,811,978 | 1,936,104 | 32,077,582 | 34,013,685 | 2,065,098 | 31,948,588 | | | 2008 |
CHILE-EKONO | 414,730 | - | 665,306 | 438,582 | 641,454 | 1,080,036 | 31,314 | 1,048,722 | | | 2008 |
CHILE-VICUNA MACKENA | 362,556 | 5,205,439 | (1,049,788) | 1,912,556 | 2,605,651 | 4,518,207 | 161,252 | 4,356,955 | | | 2008 |
CHILE-VINA DEL MAR | 11,096,948 | 720,781 | 39,717,945 | 15,696,927 | 35,838,747 | 51,535,674 | - | 51,535,674 | 30,765,982 | | 2008 |
MEXICO-HERMOSILLO | 11,424,531 | - | 29,393,719 | 11,106,677 | 29,711,574 | 40,818,250 | 563,309 | 40,254,941 | | | 2008 |
MEXICO-GIGANTE ACQ. | 7,568,417 | 19,878,026 | (5,140,018) | 5,459,634 | 16,846,791 | 22,306,425 | 4,961,417 | 17,345,008 | | 2007 | |
MEXICO-MOTOROLA | 47,272,528 | - | 49,867,668 | 36,485,431 | 60,654,765 | 97,140,196 | 1,323,628 | 95,816,568 | | | 2006 |
103
| | | | | | | | | | | |
| INITIAL COST | | | | | | | | | |
PROPERTIES | LAND | BUILDING
&
IMPROVEMENT | SUBSEQUENT
TO
ACQUISITION | LAND | BUILDING
&
IMPROVEMENT | TOTAL | ACCUMULATED
DEPRECIATION | TOTAL COST,
NET OF ACCUMULATED
DEPRECIATION | ENCUMBRANCES | DATE OF
ACQUISITION | DATE OF
CONSTRUCTION |
| | | | | | | | | | | |
MEXICO-NON ADM BT-LOS CABOS | 10,873,070 | 1,257,517 | 7,594,297 | 8,495,326 | 11,229,558 | 19,724,884 | 1,429,504 | 18,295,380 | | 2007 | |
MEXICO-NON ADM-GRAN PLZ CANCUN | 13,976,402 | 30,219,719 | (6,025,705) | 14,688,535 | 23,481,882 | 38,170,416 | 4,837,967 | 33,332,449 | | 2007 | |
MEXICO-NON BUS ADM-MULT.CANCUN | 4,471,987 | - | 10,892,951 | 4,328,273 | 11,036,665 | 15,364,938 | 190,241 | 15,174,696 | | 2007 | |
MEXICO-PLAZA SORIANA | 2,639,975 | 346,945 | 33,405 | 2,219,431 | 800,894 | 3,020,325 | - | 3,020,325 | | 2007 | |
MEXICO-PLAZA CENTENARIO | 3,388,861 | - | 3,397,250 | 2,511,879 | 4,274,232 | 6,786,111 | 315,892 | 6,470,219 | | 2007 | |
MEXICO-NON BUS.ADM -LINDAVISTA | 19,352,453 | - | 21,318,824 | 15,342,438 | 25,328,839 | 40,671,277 | 1,966,555 | 38,704,722 | | | 2006 |
MEXICO-NONADM BUS-NUEVO LAREDO | 10,627,540 | - | 17,739,338 | 8,094,478 | 20,272,400 | 28,366,878 | 3,026,874 | 25,340,004 | | | 2006 |
MEXICO-NON ADM-PLAZA LAGO REAL | 11,336,743 | - | 13,747,581 | 8,861,568 | 16,222,756 | 25,084,324 | - | 25,084,324 | | 2007 | |
MEXICO-MULTIPLAZA OJO DE AGUA | 4,089,067 | - | 10,187,968 | 3,950,657 | 10,326,377 | 14,277,035 | 659,472 | 13,617,562 | | 2008 | |
MEXICO-PACHUCA (WALMART) | 3,621,985 | - | 5,094,060 | 3,052,022 | 5,664,023 | 8,716,045 | 1,443,016 | 7,273,029 | | | 2005 |
MEXICO-NON ADM -PLAZA SAN JUAN | 9,631,035 | - | (181,013) | 7,459,371 | 1,990,651 | 9,450,022 | 350,826 | 9,099,196 | | | 2006 |
MEXICO-RHODESIA | 3,924,464 | - | 8,805,011 | 4,201,190 | 8,528,285 | 12,729,475 | 429,805 | 12,299,670 | | | 2009 |
MEXICO-RIO BRAVO HEB | 2,970,663 | - | 11,573,061 | 2,600,058 | 11,943,665 | 14,543,724 | 1,166,315 | 13,377,409 | | 2008 | |
MEXICO-SALTILLO 2 | 11,150,023 | - | 14,445,052 | 8,772,498 | 16,822,577 | 25,595,075 | 3,831,200 | 21,763,875 | | | 2005 |
MEXICO-SAN PEDRO | 3,309,654 | 13,238,616 | (4,101,429) | 3,205,213 | 9,241,628 | 12,446,841 | 4,491,668 | 7,955,173 | | 2006 | |
MEXICO-TAPACHULA | 13,716,428 | - | 17,123,489 | 10,544,411 | 20,295,505 | 30,839,916 | 638,335 | 30,201,581 | | 2007 | |
MEXICO-TIJUANA 2000 LAND PURCHASE | 1,200,000 | - | (24,670) | 1,175,330 | - | 1,175,330 | - | 1,175,330 | | 2009 | |
MEXICO-WALDO ACQ. | 8,929,278 | 16,888,627 | (5,583,091) | 6,640,820 | 13,593,994 | 20,234,814 | 2,441,049 | 17,793,765 | | 2007 | |
PERU-CAMPOY | 2,675,461 | - | - | 2,675,461 | - | 2,675,461 | - | 2,675,461 | | 2011 | |
PERU-LIMA | 811,916 | - | 2,052,530 | 964,559 | 1,899,886 | 2,864,446 | 94,283 | 2,770,162 | | | 2008 |
BALANCE OF PORTFOLIO | 133,248,688 | 4,492,127 | 10,056,992 | 3,011,080 | 144,786,727 | 147,797,808 | 34,553,719 | 113,244,089 | - | | |
TOTALS | $ 2,185,446,075 | $ 4,713,938,073 | $ 1,878,600,806 | $ 1,989,723,018 | $ 6,788,261,936 | $ 8,777,984,954 | $ 1,693,089,989 | $ 7,084,894,965 | $ 1,130,499,193 | | |
Depreciation and amortization are provided on the straight-line method over the estimated useful lives of the assets as follows:
| | |
Buildings | | 15 to 50 years |
Fixtures, building and leasehold and tenant improvements (including certain identified intangible assets) | | Terms of leases or useful lives, whichever is shorter |
(including certain identified intangible assets)
| | |
The aggregate cost for Federal income tax purposes was approximately
$7.6$7.9 billion at December 31,
2011.
2012.
The changes in total real estate assets for the years ended December 31,
2012, 2011
2010 and
2009,2010, are as follows:
| | | | |
| | 2011 | 2010 | 2009 |
| Balance, beginning of period | $ 8,592,760,219 | $ 8,882,341,499 | $ 7,818,916,120 |
| Acquisitions | 406,431,259 | 83,833,304 | 7,136,240 |
| Improvements | 119,418,839 | 115,646,379 | 224,554,670 |
| Transfers from (to) unconsolidated joint ventures | (49,812,485) | 115,482,953 | 933,714,955 |
| Sales | (186,887,870) | (603,652,663) | (48,893,544) |
| Assets held for sale | (4,503,823) | (4,445,309) | - |
| Adjustment of fully depreciated asset | (27,412,282) | (15,047,644) | (19,779,509) |
| Adjustment of property carrying values | (4,616,890) | (17,601,053) | (52,100,000) |
| Change in exchange rate | (67,392,013) | 36,202,753 | 18,792,567 |
| Balance, end of period | $ 8,777,984,954 | $ 8,592,760,219 | $ 8,882,341,499 |
| | | 2012 | | | 2011 | | | 2010 | |
| Balance, beginning of period | | | 8,771,256,852 | | | | 8,587,378,001 | | | | 8,877,013,625 | |
| Acquisitions | | | 411,166,315 | | | | 406,431,259 | | | | 83,833,304 | |
| Improvements | | | 85,801,777 | | | | 118,072,955 | | | | 115,592,035 | |
| Transfers from (to) unconsolidated joint ventures | | | 212,231,319 | | | | (49,812,485 | ) | | | 115,482,953 | |
| Sales | | | (503,767,086 | ) | | | (186,887,870 | ) | | | (603,652,663 | ) |
| Assets held for sale | | | (9,845,065 | ) | | | (4,503,823 | ) | | | (4,445,309 | ) |
| Adjustment of fully depreciated assets | | | (21,711,782 | ) | | | (27,412,282 | ) | | | (15,047,644 | ) |
| Adjustment of property carrying values | | | (34,121,504 | ) | | | (4,616,890 | ) | | | (17,601,053 | ) |
| Change in exchange rate | | | 36,275,820 | | | | (67,392,013 | ) | | | 36,202,753 | |
| Balance, end of period | | | 8,947,286,646 | | | | 8,771,256,852 | | | | 8,587,378,001 | |
The changes in accumulated depreciation for the years ended December 31,
2012, 2011
2010 and
20092010 are as follows:
| | | | |
| | 2011 | 2010 | 2009 |
| Balance, beginning of period | $ 1,549,380,256 | $ 1,343,148,498 | $ 1,159,664,489 |
| Depreciation for year | 237,782,626 | 244,903,628 | 209,999,870 |
| Transfers from (to) unconsolidated joint ventures | (2,725,794) | - | 1,727,895 |
| Sales | (59,086,170) | (23,610,893) | (8,464,247) |
| Adjustment of fully depreciated asset | (27,412,282) | (15,047,644) | (19,779,509) |
| Assets held for sale | (633,676) | (13,333) | - |
| Change in exchange rate | (4,214,971) | - | - |
| Balance, end of period | $ 1,693,089,989 | $ 1,549,380,256 | $ 1,343,148,498 |
| | | 2012 | | | 2011 | | | 2010 | |
| Balance, beginning of period | | | 1,693,089,989 | | | | 1,549,380,256 | | | | 1,343,148,498 | |
| Depreciation for year | | | 248,426,786 | | | | 237,782,626 | | | | 244,903,628 | |
| Transfers (to) unconsolidated joint ventures | | | (8,390,550 | ) | | | (2,725,794 | ) | | | - | |
| Sales | | | (161,515,292 | ) | | | (59,086,170 | ) | | | (23,610,893 | ) |
| Adjustment of fully depreciated assets | | | (21,711,782 | ) | | | (27,412,282 | ) | | | (15,047,644 | ) |
| Assets held for sale | | | (6,582,611 | ) | | | (633,676 | ) | | | (13,333 | ) |
| Change in exchange rate | | | 2,145,037 | | | | (4,214,971 | ) | | | | |
| Balance, end of period | | | 1,745,461,577 | | | | 1,693,089,989 | | | | 1,549,380,256 | |
Certain Amounts in the Prior Period Have Been Reclassified in Order to Conform with the Current Period's Presentation.
105
KIMCO REALTY CORPORATION AND SUBSIDIARIES
Schedule IV - Mortgage Loans on Real Estate
As of December 31,
20112012
(in thousands)
| | | | | | | | | |
Type of Loan/Borrower | Description | Location (c) | Interest Accrual Rates | Interest Payment Rates | Final Maturity Date | Periodic
Payment
Terms (a) | Prior Liens | Face Amount
of Mortgages
or Maximum
Available
Credit (c) | Carrying Amount of Mortgages (c)(d) |
| | | | | | | | | |
Mortgage Loans: | | | | | | | | | |
Borrower A | Apartments | Montreal, Quebec | 8.50% | 8.50% | 6/27/2013 | P & I | - | $ 23,800 | $ 22,507 |
Borrower B | Retail Development | Ontario, Canada | 8.50% | 8.50% | 4/13/2012 | I | - | 16,906 | 16,415 |
Borrower C (b) | Medical Center | New York, NY | | | 10/19/2012 | I | - | 18,000 | 9,400 |
Borrower D | Retail | Fern Park , FL | 7.00% | 7.00% | 6/15/2012 | P & I | - | 5,400 | 5,400 |
Borrower E | Retail | Guadalajara, Mexico | 12.00% | 12.00% | 9/1/2016 | P & I | - | 8,026 | 5,324 |
Borrower F | Retail | Cincinnati , OH | 7.00% | 7.00% | 12/31/2012 | P & I | - | 5,000 | 5,000 |
Borrower G | Retail | Arboledas, Mexico | 8.10% | 8.10% | 12/31/2012 | P & I | - | 13,000 | 4,663 |
Borrower H | Retail | Guadalajara, Mexico | 12.00% | 12.00% | 9/1/2016 | P & I | - | 5,307 | 4,014 |
Borrower I | Retail | Miami, FL | 7.57% | 7.57% | 6/1/2019 | P & I | - | 6,509 | 4,007 |
Individually < 3% | (e) | | (f) | (f) | (g) | | - | 31,253 | 23,266 |
| | | | | | | | 133,201 | 99,996 |
Lines of Credit: | | | | | | | | | |
| | | | | | | | | |
Individually < 3% | | | 8.00% | 8.00% | 12/31/2012 | | - | 2,400 | 1,405 |
| | | | | | | | | |
Other: | | | 5.50% | 5.50% | 12/21/2018 | | - | 1,450 | 1,450 |
| | | | | | | | | |
Capitalized loan costs | | | | | | | | | 121 |
| | | | | | | | | |
Total | | | | | | | | $ 137,051 | $ 102,972 |
| Type of Loan/Borrower | | Description | | Location (c) | | Interest Accrual Rates | | Interest Payment Rates | | Final Maturity Date | | Periodic Payment Terms (a) | | Prior Liens | | | Face Amount of Mortgages or Maximum Available Credit (b) | | Carrying Amount of Mortgages (b) (c) |
| | | | | | | | | | | | | | | | | | | | | |
| Mortgage Loans: | | | | | | | | | | | | | | | | | | | | |
| Borrower A | | Retail Development | | Ontario, Canada | | 8.50% | | 8.50% | | 4/13/2013 | | I | | - | | $ | 16,906 | | $ | 16,897 |
| Borrower B | | Apartments | | Montreal, Canada | | 8.50% | | 8.50% | | 6/27/2013 | | P& I | | - | | | 23,800 | | | 7,016 |
| Borrower C | | Senior Living Center | | Parker, CO | | 7.00% | | 7.00% | | 12/31/2013 | | P& I | | - | | | 4,358 | | | 4,358 |
| Borrower D | | Retail | | Jacksonville, FL | | 6.00% | | 6.00% | | 11/2/2013 | | P&I | | - | | | 4,221 | | | 4,221 |
| Borrower E | | Retail | | Arboledas, Mexico | | 8.10% | | 8.10% | | 12/16/2013 | | P&I | | - | | | 13,000 | | | 3,835 |
| Borrower F | | Retail | | Miami, FL | | 7.57% | | 7.57% | | 6/1/2019 | | P&I | | - | | | 6,509 | | | 3,792 |
| Borrower G | | Retail | | Las Vegas, NV | | 10.00% | | 10.00% | | 5/14/2033 | | I | | - | | | 3,075 | | | 3,075 |
| Borrower H | | Retail | | Guadalajara, Mexico | | 12.00% | | 12.00% | | 9/1/2016 | | P&I | | - | | | 5,307 | | | 2,706 |
| Borrower I | | Retail | | Miami, FL | | 7.57% | | | | 6/1/2019 | | P&I | | - | | | 4,201 | | | 2,633 |
| Borrower J | | Retail | | Miami, FL | | | | | | | | P&I | | - | | | 3,966 | | | 2,584 |
| Borrower K | | Retail | | Miami, FL | | | | | | | | P&I | | - | | | 3,678 | | | 2,394 |
| Individually < 3% | | (d) | | | | (e) | | (e) | | (f) | | | | - | | | 15,779 | | | 13,800 |
| | | | | | | | | | | | | | | | | | 104,800 | | | 67,311 |
| Lines of Credit: | | | | | | | | | | | | | | | | | | | | |
| | | | | | | | | | | | | | | | | | | | | |
| Individually < 3% | | | | | | 8.00% | | 8.00% | | 12/31/2013 | | | | | | | 2,400 | | | 1,405 |
| | | | | | | | | | | | | | | | | | | | | |
| Other: | | | | | | | | | | | | | | | | | | | | |
| | | | | | | | | | | | | | | | | | | | | |
| Individually < 3% | | | | | | (g) | | (g) | | (h) | | | | | | | 2,050 | | | 1,952 |
| | | | | | | | | | | | | | | | | | | | | |
| Capitalized loan costs | | | | | | | | | | | | | | | | | | | | 36 |
| | | | | | | | | | | | | | | | | | | | | |
| Total | | | | | | | | | | | | | | | | $ | 109,250 | | $ | 70,704 |
(a)
P & I = Principal and Interest and I = Interest
onlyonly; P&I = Principal & Interest
(b) Interest is at either LIBOR + 3.25% or Prime + 1.75%(c)
The instruments actual cash flows are denominated in U.S. dollars, Canadian dollars and Mexican pesos as indicated by the geographic location above
(d)
(c) The aggregate cost for Federal income tax purposes is
$102,972(e)$70.7 million
(d) Comprised of
1514 separate loans with original loan amounts ranging between $0.4 million and
$4.2$3.3 million
(f)
(e) Interest rates range from 6.00% to 12.00%
(f) Maturity dates range from one to 18 years
(g) MaturityInterest rates range from one year2.28% to 225.50%
(h) Maturity dates range from six to 15 years For a
reconciliationreconcilition of mortgage and other financing receivables from January 1,
20092010 to December 31,
20112012 see
FootnoteNote 11 of the Notes to Consolidated Financial Statements included in this annual report of Form
10-K.
106
10K.The Company feels it is not practicable to estimate the fair value of each receivable as quoted market prices are not available.
The cost of obtaining an independent valuation on these assets is deemed excessive considering the materiality of the total receivables.
102