UNITED STATES
SECURITIES AND EXCHANGE COMMISSION
Washington, D.C. 20549
Form 10-K
| | | | | |
| ☒ | Annual Report Pursuant to Section 13 or 15(d) of the Securities Exchange Act of 1934 for the fiscal year ended December 31, 2021.2023. |
| | | | | |
| ☐ | Transition Report Pursuant to Section 13 or 15(d) of the Securities Exchange Act of 1934 for the transition period from to . |
Commission file number: 001-33626
GENPACT LIMITED
(Exact name of registrant as specified in its charter)
| | | | | |
| Bermuda | 98-0533350 |
| (State or other jurisdiction of incorporation or organization) | (I.R.S. Employer Identification No.) |
Canon's Court
22 Victoria Street
Hamilton HM 12
Bermuda
(441) 298-3300
(Address, including zip code, and telephone number, including area code, of registrant’s principal executive office)
Securities registered pursuant to Section 12(b) of the Act:
| | | | | | | | |
| Title of each class | Trading Symbol(s) | Name of each exchange on which registered |
| Common shares, par value $0.01 per share | G | New York Stock Exchange |
Securities registered pursuant to Section 12(g) of the Act: None
Indicate by check mark if the registrant is a well-known seasoned issuer, as defined in Rule 405 of the Securities Act. Yes ☒ No ☐
Indicate by check mark if the registrant is not required to file reports pursuant to Section 13 or 15(d) of the Act. Yes ☐ No ☒
Indicate by check mark whether the registrant (1) has filed all reports required to be filed by Section 13 or 15(d) of the Securities Exchange Act of 1934 during the preceding 12 months (or for such shorter period that the registrant was required to file such reports), and (2) has been subject to such filing requirements for the past 90 days. Yes ☒ No ☐
Indicate by check mark whether the registrant has submitted electronically every Interactive Data File required to be submitted pursuant to Rule 405 of Regulation S-T (§232.405 of this chapter) during the preceding 12 months (or for such shorter period that the registrant was required to submit such files). Yes ☒ No ☐
Indicate by check mark whether the registrant is a large accelerated filer, an accelerated filer, a non-accelerated filer, a smaller reporting company, or an emerging growth company. See the definitions of “large accelerated filer,” “accelerated filer,” “smaller reporting company,” and “emerging growth company” in Rule 12b-2 of the Exchange Act.
| | | | | | | | | | | | | | | | | | | | | | | | | | | | | |
| Large Accelerated Filer | ☒ | Accelerated Filer | ☐ | Non-accelerated Filer | ☐ | Smaller Reporting Company | ☐ | Emerging Growth Company | ☐ |
If an emerging growth company, indicate by check mark if the registrant has elected not to use the extended transition period for complying with any new or revised financial accounting standards provided pursuant to Section 13(a) of the Exchange Act. ☐
Indicate by check mark whether the registrant has filed a report on and attestation to its management’s assessment of the effectiveness of its internal control over financial reporting under Section 404(b) of the Sarbanes-Oxley Act (15 U.S.C. 7262(b)) by the registered public accounting firm that prepared or issued its audit report. ☒
If securities are registered pursuant to Section 12(b) of the Act, indicate by check mark whether the financial statements of the registrant included in the filing reflect the correction of an error to previously issued financial statements. ☐
Indicate by check mark whether any of those error corrections are restatements that required a recovery analysis of incentive-based compensation received by any of the registrant's executive officers during the relevant recovery period pursuant to §240.10D-1(b). ☐
Indicate by check mark whether the registrant is a shell company (as defined in Rule 12b-2 of the Act). Yes ☐ No ☒
As of June 30, 2021,2023, the aggregate market value of the common stock of the registrant held by non-affiliates of the registrant was $8,472,136,029,$6,775,501,200, based on the closing price of the registrant’s common shares, par value $0.01 per share, reported on the New York Stock Exchange on such date of $45.43$37.57 per share. Directors, executive officers and significant shareholders of Genpact Limited are considered affiliates for purposes of this calculation, but should not necessarily be deemed affiliates for any other purpose.
As of February 24, 2022,16, 2024, there were 185,174,846180,732,575 common shares of the registrant outstanding.
Documents incorporated by reference:
The registrant intends to file a definitive proxy statement pursuant to Regulation 14A within 120 days of the end of the fiscal year ended December 31, 2021.2023. Portions of the proxy statement are incorporated herein by reference to the following parts of this Annual Report on Form 10-K:
Part III, Item 10, Directors, Executive Officers and Corporate Governance;
Part III, Item 11, Executive Compensation;
Part III, Item 12, Security Ownership of Certain Beneficial Owners and Management and Related Stockholder Matters;
Part III, Item 13, Certain Relationships and Related Transactions, and Director Independence; and
Part III, Item 14, Principal Accountant Fees and Services.
| | | | | | | | | | | |
| Auditor name: KPMG Assurance and Consulting Services LLP | Auditor Location: Mumbai, Maharashtra, India | Auditor Firm ID: 2115 |
TABLE OF CONTENTS
| | Page No. | |
| | | | | | Page No. | |
| PART I | PART I | | Item No. | | | |
| 1. | | | | | |
| 1A. | | | | | |
| 1B. | | | | | |
| 2. | | | | | |
| 3. | | | | | |
| 4. | | | | | |
| PART I | |
| PART I | |
| | 1. | |
| | 1. | |
| | 1. | |
| | 1A. | |
| | 1A. | |
| | 1A. | |
| | 1B. | |
| | 1B. | |
| | 1B. | |
| | 1C. | |
| | 1C. | |
| | 1C. | |
| | 2. | |
| | 2. | |
| | 2. | |
| | 3. | |
| | 3. | |
| | 3. | |
| | 4. | |
| | 4. | |
| | 4. | |
| PART II | PART II | |
| 5. | | | | | |
| 6. | | | | | |
| 7. | | | | | |
| 7A. | | | | | |
| 8. | | | | | |
| 9. | | | | | |
| 9A. | | | | | |
| 9B. | | | | | |
| 9C. | | | | | |
| PART II | |
| PART II | |
| | 5. | |
| | 5. | |
| | 5. | |
| | 6. | |
| | 6. | |
| | 6. | |
| | 7. | |
| | 7. | |
| | 7. | |
| | 7A. | |
| | 7A. | |
| | 7A. | |
| | 8. | |
| | 8. | |
| | 8. | |
| | 9. | |
| | 9. | |
| | 9. | |
| | 9A. | |
| | 9A. | |
| | 9A. | |
| | 9B. | |
| | 9B. | |
| | 9B. | |
| | 9C. | |
| | 9C. | |
| | 9C. | |
| PART III | PART III | |
| 10. | | | | | |
| 11. | | | | | |
| 12. | | | | | |
| 13. | | | | | |
| 14. | | | | | |
| PART III | |
| PART III | |
| | 10. | |
| | 10. | |
| | 10. | |
| | 11. | |
| | 11. | |
| | 11. | |
| | 12. | |
| | 12. | |
| | 12. | |
| | 13. | |
| | 13. | |
| | 13. | |
| | 14. | |
| | 14. | |
| | 14. | |
| PART IV | PART IV | |
| 15. | | | | | |
| 16. | | | | | |
| PART IV | |
| PART IV | |
| | 15. | |
| | 15. | |
| | 15. | |
| | 16. | |
| | 16. | |
| | 16. | |
| |
| |
| | | | |
| | CONSOLIDATED FINANCIAL STATEMENTS | CONSOLIDATED FINANCIAL STATEMENTS | |
| | CONSOLIDATED FINANCIAL STATEMENTS | |
| | CONSOLIDATED FINANCIAL STATEMENTS | |
| |
| |
| | | | |
| | | | |
| |
| |
| |
| |
| | | | |
| | | | |
| |
| |
| |
| |
| | | | |
| | | | |
| |
| |
| |
| |
| | | | |
| |
Special Note Regarding Forward-Looking Statements
We have made statements in this Annual Report on Form 10-K (the “Annual Report”) in, among other sections, Item 1—“Business,” Item 1A—“Risk Factors,” and Item 7—“Management’s Discussion and Analysis of Financial Condition and Results of Operations” that are forward-looking statements. In some cases, you can identify these statements by forward-looking terms such as “expect,” “anticipate,” “intend,” “plan,” “believe,” “seek,” “estimate,” “could,” “may,” “shall,” “will,” “would” and variations of such words and similar expressions, or the negative of such words or similar expressions. These forward-looking statements, which are subject to risks, uncertainties and assumptions about us, may include projections of our future financial performance, which in some cases may be based on our growth strategies and anticipated trends in our business. These statements are only predictions based on our current expectations and projections about future events. There are important factors that could cause our actual results, level of activity, performance or achievements to differ materially from those expressed or implied by the forward-looking statements. In particular, you should consider the numerous risks outlined under the heading “Summary of Risk Factors” and Item 1A—“Risk Factors” in this Annual Report. These forward-looking statements include, but are not limited to, statements relating to:
•our ability to retain existing clients and contracts;
•our ability to win new clients and engagements;
•the expected value of the statements of work under our master service agreements;
•our beliefs about future trends in our market;
•political, economic or business conditions in countries where we have operations or where our clients operate, including the withdrawal of the United Kingdom (the "U.K.") from the European Union (the "EU"), commonly known as Brexit, and uncertainty about the future relationship between the U.K. and the EU, and heightened economic uncertainty and political uncertainty within and among other EU member states;geopolitical tensions;
•expected spending by existing and prospective clients on business process outsourcing, information technology and digital transformationthe types of services by clients;we provide;
•foreign currency exchange rates;
•our ability to convert bookings to revenue;
•our rate of employee attrition;
•our effective tax rate; and
•competition in our industry.
Factors that may cause actual results to differ from expected results include, among others:
•our ability to compete in the rapidly evolving technological environment and successfully implement and generate revenue from new services, including AI-enabled services;
•our ability to manage the transition of our new Chief Executive Officer and to retain senior management;
•our ability to safeguard our systems and protect client, Genpact or employee data from security incidents or cyberattacks;
•our ability to effectively price our services and maintain our pricing and employee and asset utilization rates;
•increases in wages in locations in which we have operations;
•our ability to hire and retain enough qualified employees to support our operations;
•general inflationary pressures and our ability to share increased costs with our clients;
•our ability to effectively price our services and maintain pricing and employee utilization rates;
•the impact of the COVID-19 pandemic on our business, results of operations and financial condition;
•our ability to develop and successfully execute our business strategies;
•increasing competition in our industry;
•our ability to comply with data protection laws and regulations and to maintain the security and confidentiality of personal and other sensitive data of our clients, employees or others;
•telecommunications or technology disruptions or breaches, natural or other disasters, or medical epidemics or pandemics,pandemics;
•deterioration in the global economic environment and its impact on our clients, including the COVID-19 pandemic;bankruptcy of our clients;
•our dependence on favorable policies and tax laws that may be changed or amended in a manner adverse to us or be unavailable to us in the future, including as a result of tax policy changes in India, and our ability to effectively execute our tax planning strategies;
•regulatory, legislative and judicial developments, including the withdrawal of governmental fiscal incentives, particularly in India;
•our dependence on revenues derived from clients in the United States and Europe and clients that operate in certain industries, such as the financial services industry;and high tech industries;
•geopolitical tensions, such as the developing conflictongoing conflicts between Russia and Ukraine and Israel and Hamas, including any restrictiveescalation of either conflict, and future actions that may be taken by the United States and other countries in response, such as sanctions or export controls;response;
•our ability to successfully consummate or integrate strategic acquisitions;
•our ability to attract and retain clients and our ability to develop and maintain client relationships on attractive terms;
•our ability to service our defined contribution and benefit plan payment obligations;
•clarification as to the possible retrospective application of a judicial pronouncement in India regarding our defined contribution and benefit plans payment obligations;
•our relationship with the General Electric Company or GE,("GE") and our ability to maintain relationships with former GE businesses;
•financing terms, including but not limited to, changes in the London Interbank Offered rate, or LIBOR, including the pending global phase-out of LIBOR, the development of alternative rates, including the Secured Overnight Financing Rate ("SOFR") and changes to our credit ratings;
•our ability to meet our corporate funding needs, pay dividends and service debt, including our ability to comply with the restrictions that apply to our indebtedness that may limit our business activities and investment opportunities;
•our ability to successfully implement our new enterprise resource planning system;
•our ability to grow our business and effectively manage growth and international operations while maintaining effective internal controls;
•restrictions on visas for our employees traveling to North America and Europe;
•fluctuations in currency exchange rates between the currencies in which we transact business;
•our ability to retain senior management;
•the selling cycle for our client relationships;
•legislation in the United States or elsewhere that restricts or adversely affects demand for business process outsourcing, information technology and digital transformationour services offshore;
•increasing competition in our industry;
•our ability to protect our intellectual property and the intellectual property of others;
•deterioration in the global economic environment and its impact on our clients, including the bankruptcy of our clients;
•regulatory, legislative and judicial developments, including the withdrawal of governmental fiscal incentives;
•the international nature of our business;
•technological innovation;
•our ability to derive revenues from new service offerings; and
•unionization of any of our employees.
Although we believe the expectations reflected in the forward-looking statements are reasonable at the time they are made, we cannot guarantee future results, level of activity, performance or achievements. Achievement of future results is subject to risks, uncertainties, and potentially inaccurate assumptions. Should known or unknown risks or uncertainties materialize, or should underlying assumptions prove inaccurate, actual results could differ materially from past results and those anticipated, estimated or projected. You should bear this in mind as you consider forward-looking statements. We undertake no obligation to update any of these forward-looking statements after the date of this filing to conform our prior statements to actual results or revised expectations. You are advised, however, to consult any further disclosures we make on related subjects in our Forms 10-Q and Form 8-K reports to the SEC.
In this Annual Report on Form 10-K, we use the terms “Genpact,” “Company,” “we” and “us” to refer to Genpact Limited and its subsidiaries. Our registered office is located at Canon's Court, 22 Victoria Street, Hamilton HM 12, Bermuda.
SUMMARY OF RISK FACTORS
Below is a summary of the principal risk factors that make an investment in our common shares risky or speculative. Additional risks and uncertainties not known to us or that we deem less significant may also impair our business. Additional discussion of the risks that we face can be found in Item 1A—“Risk Factors” of this Annual Report on Form 10-K, and should be carefully considered, together with the other information in this Annual Report on Form 10-K and our other filings with the Securities and Exchange Commission, before making an investment decision regarding our common shares.
Risks Related to our Business and Operations
•We expect AI technology to have a significant impact on our industry and the markets in which we compete. The development and use of AI technologies presents competitive, reputational and legal risks, and our use of AI technologies may not be successful.
•Our business depends on generating and maintaining ongoing, profitable client demand for our services and solutions, and a significant reduction in such demand or an inability to respond to or compete in the rapidly evolving technological environment could materially affect our results of operations.
•Our success depends in part on our retention of key members of our senior leadership team and our ability to manage the transition of our new Chief Executive Officer.
•We face legal, reputational and financial risks from any failure to safeguard our systems and protect client, Genpact or employee data from security incidents or cyberattacks.
•A substantial portion of our assets, employees and operations are located in India and we are subject to regulatory, economic, social and political uncertainties in India.
•Changes in our tax rates or tax provisions, adverse tax audits and other proceedings, or changes in tax laws or their interpretation or enforcement could have an adverse effect on our business, results of operations, effective tax rate and financial condition.
•Our profitability will suffer if we are not able to price appropriately, effectively utilize new technologies, maintain employee and asset utilization levels and control our costs.
•Wage increases in the countries where we operate may reduce our profit margin.
•We may fail to attract and retain enough qualified employees to support our operations.
•Our profitability will suffer if we are not able to price appropriately, maintain employee and asset utilization levels and control our costs.
•We enter into long-term contracts and fixed pricefixed-price contracts with our clients. Our failure to price these contracts correctly may negatively affect our profitability.
•Our partnerships, alliances and relationships with third-party suppliers and contractors and other third parties with whom we do business expose us to a variety of risks that could have a material adverse effect on our business.
•We face legal, reputational and financial risks from any failure to protect client, Genpact or employee data from security incidents or cyberattacks.
•Our business and results of operations have been adversely impacted and may in the future be adversely impacted by the COVID-19 pandemic.
•Our success largely depends on our ability to achieve our business strategies, and our results of operations and financial condition may suffer if we are unable to continually develop and successfully execute our strategies.
•Business disruptions could seriously harm our future revenue and financial condition and increase our costs and expenses.
•Our results of operations could be adversely affected by economic and political conditions and the effects of these conditions on our and our clients’ businesses and levels of business activity.
•Our business depends on generating and maintaining ongoing, profitable client demand for our services and solutions, and a significant reduction in such demand or an inability to respond to the evolving technological environment could materially affect our results of operations.
•Tax matters may have an adverse effect on our business, results of operations, effective tax rate and financial condition.
•We may be subject to claims and lawsuits for substantial damages, including by our clients arising out of disruptions to their businesses or our inadequate performance of services.
•FutureRecent and future legislation orand executive action in the United States and other jurisdictions could significantly affect the ability or willingness of our clients and prospective clients to utilize our services.
•Our global operations expose us to numerous and sometimes conflicting legal and regulatory requirements, and violations of these laws and regulations could harm our business.
•GE has historically accounted for a significant portion of our revenues and any material loss of business from, or our failure to maintain relationships with, GE and former GE businesses could have a material adverse effect on our business, results of operations and financial condition.
•Our revenues are highly dependent on clients located in the United States and Europe, as well as on clients that operate in certain industries.
•We are implementing a new enterprise resource planning system, and challenges with the planning or implementation of the system may impact our internal controls over financial reporting, business and operations.
•Our results of operations and share price could be adversely affected if we are unable to maintain effective internal controls.
•Our industry is highly competitive, and we may not be able to compete effectively.
•We may face difficulties in providing end-to-end business solutions or delivering complex, large or unique projects for our clients that could cause clients to discontinue their work with us, which in turn could harm our business and our reputation.
•Currency exchange rate fluctuations in various currencies in which we do business, especially the Indian rupee, the euro and the U.S. dollar, could have a material adverse effect on our business, results of operations and financial condition.
•Restrictions on entry or work visas may affect our ability to compete for and provide services to clients, which could have a material adverse effect on our business and financial results.
•Our senior leadership team is critical to our continued success and the loss of such personnel could harm our business.
•We may be unable to service our debt or obtain additional financing on competitive terms.terms or at all.
•We often face a long selling cycle to secure a new Digital Operations contract as well as long implementation periods that require significant resource commitments, which result in a long lead time before we receive revenues from new relationships.
•Our results of operations and share price could be adversely affected if we are unable to maintain effective internal controls.
•We make estimates and assumptions in connection with the preparation of our consolidated financial statements, and any changes to those estimates and assumptions could adversely affect our financial results.
•Our operating results may experience significant fluctuations.
•If we are unable to collect our receivables, our results of operations, financial condition and cash flows could be adversely affected.
•Some of our contracts contain provisions which, if triggered, could result in lower future revenues and have a material adverse effect on our business, results of operationoperations and financial condition.
•Our industry is highly competitive, and we may not be able to compete effectively.
•Our business could be materially and adversely affected if we do not protect our intellectual property or if our services are found to infringe on the intellectual property of others.
•A substantial portion of our assets, employees and operations are located in India and we are subject to regulatory, economic, social and political uncertainties in India.
•We may face difficulties as we expand our operations into countries in which we have no prior operating experience.
•Terrorist attacks and other acts of violence involving any of the countries in which we or our clients have operations could adversely affect our operations and client confidence.
•If more stringent labor laws become applicable to us or if a significant number of our employees unionize, our profitability may be adversely affected.
•We may engage in strategic transactions that could create risks.
•We may become subject to taxation asBermuda recently enacted new tax legislation that will impose a result ofcorporate income tax on certain Bermuda companies. Any new tax liability in Bermuda or another jurisdiction based on our incorporation in Bermuda or place of management, which could have a material adverse effect on our business, results of operations and financial condition.
•Economic substance requirements in Bermuda could adversely affect us.
•We may not be able to realize the entire book value of goodwill and other intangible assets from acquisitions.
Risks Related to our Shares
•The issuance of additional common shares by us or the sale of our common shares by our employees could dilute our shareholders’ ownership interest in the Company and could significantly reduce the market price of our common shares.
•There can be no assurance that we will continue to declare and pay dividends on our common shares, and future determinations to pay dividends will be at the discretion of our board of directors.
•We are organized under the laws of Bermuda, and Bermuda law differs from the laws in effect in the United States and may afford less protection to shareholders.
•The market price for our common shares has been and may continue to be volatile.
•You may be unable to effect service of process or enforce judgments obtained in the United States or Bermuda against us or our assets in the jurisdictions in which we or our executive officers operate.
USE OF TRADEMARKS
The trademarks, trade names and service marks appearing in this Annual Report on Form 10-K are the property of their respective owners. We have omitted the ® and ™ designations, as applicable, for the trademarks named in this Annual Report on Form 10-K after their first reference herein.
PART I
Item 1. Business
Genpact is a global professional services and solutions firm that makes business transformation real. We drive digital-led innovation and run digitally-enabled intelligent operations for our clients, guided by our experience over time running thousands of processes for hundreds of Fortune Global 500global companies. We have over 109,600129,100 employees serving clients in key industry verticals from more than 30 countries. 35 countries. Our 20212023 total net revenues were $4.0$4.5 billion.
In 2021,2023, we made progress on key strategic initiatives to help drive long-term profitable growth. These efforts included making continued investments in a portfolio of clients who are on significant digital transformation journeys and for whom we believe we can drive meaningful business outcomes. We continued to strategically invest for long-term growth following a strategy focused on delivering differentiated, domain-led solutionsdevelop and refine our artificial intelligence ("AI") capabilities, prioritizing our investments in a focused set of geographies, industry verticals and service lines. During the year, we continued to invest in our newer service lines and our experience business as well as to enhance our data management capabilities and develop cloud-based analyticsnew generative AI solutions. We also continued to invest infocus on the learning and development of our employees to provide them with the critical skills needed for the future and to build their careers. Over the past several years,
We believe our services have evolvedapproach to digital-led business transformation, enabled through combining our domain expertise with our skills in AI, digital and analytics, differentiates us from focusing mainlyour competitors.
Our approach to digital-led transformation
Industry disruption is pervasive, driven by an explosion in digital technologies, increased use of AI, data and analytics, new competitors, and shifting market dynamics. In this environment, companies need industry-tailored solutions to reimagine their business models end-to-end and adapt to rapid change. These organizations seek partners that can improve productivity while creating competitive advantages and driving business outcomes, such as expanded market share, seamless customer experiences, increased revenue, working capital improvement, increased profitability, and minimized risk and loss.
We partner with clients to show them how new digital solutions can drive business outcomes. We apply user and customer experience principles to our domain expertise and innovative technology to create solutions designed to quickly and aptly meet client objectives. The results can include quick-turnaround proof of concept prototypes that clients can install and test in their own environments.
Many of our client solutions are based on Genpact Cora, our AI-based platform, which integrates our proprietary automation, analytics and AI technologies with those of our strategic partners into a unified offering. It draws insights from our deep domain and operations expertise in our target industries and service lines to create analytics-based solutions that are focused on improving costcustomer and efficienciesuser experience to driving meaningful business outcomes for our clients, including growth and better decision-making using our strategic insights.
Our approach
ManyAdditionally, many of our client solutions are embedded with our Digital Smart Enterprise ProcessesSM (Digital SEPs), a patented and highly granular approach to recognize the critical factors that dramatically improve business performance to help drive client outcomes. Our Digital SEPs combine Lean Six Sigma methodologies – which reduce inefficiency and improve process quality – with advanced domain-specific digital technologies, drawing on our industry acumen, our expertise in Artificial Intelligence (AI)AI and experience-centric principles, and our deep understanding of how businesses run. Digital SEPs test the effectiveness of client processes using best-in-class benchmarks developed by mapping and analyzing millions of client transactions across thousands of end-to-end business processes. In this way, we identify opportunities for improving clients’ operations by applying our deep process knowledge and process-centric technologies to transform them.
Genpact Cora, our AI-based platform, integrates our proprietary automation, analytics and AI technologies with those of our strategic partners into a unified offering. It draws insights from our deep domain and operations expertise in our target industries and service lines to create analytics-based solutions that are focused on improving customer and user experience to accelerate clients’ digital transformations.
Domain-led digital transformation
Industry disruption is pervasive, driven by an explosion in digital technologies, increased use of data and analytics, new competitors, and shifting market dynamics. In this environment, companies need industry-tailored solutions to reimagine their business models end-to-end and adapt to rapid change.
These organizations seek partners that can improve productivity while creating competitive advantages and driving business outcomes, such as expanded market share, seamless customer experiences, increased revenue, working capital improvement, increased profitability, and minimized risk and loss. We believe our approach to business transformation, enabled through combining our deep industry and process expertise with our advanced skills in digital and analytics, differentiates us from our competitors.
We partner with clients to show them how new digital solutions can drive business outcomes. We apply user and customer experience principles to our domain expertise and innovative technology to create solutions designed to quickly and aptly meet client objectives. The results can include quick-turnaround proof of concept prototypes that clients can install and test in their own environments.
We enable domain-led digital transformation for our clients primarily in two ways: designing and runningthrough our IntelligentDigital OperationsSM Services and providing digital-led, standalone TransformationData-Tech-AI Services.
IntelligentDigital Operations Services
Our IntelligentDigital Operations services embed digital, advanced analytics, AI and cloud-based offerings into our business process outsourcing solutions to automatewhere we transform and transformrun our clients’ operations. This allowsoperations with an aim to achieve higher levels of end-to-end performance. These services allow enterprises to be more flexible and helpshelp them focus on high-value work to better compete in their industries. Our Digital Operations solutions also include ourcertain IT services which includefunctions, including end-user computing support and infrastructure management (including cloud, service integration and management and cybersecurity), application production support and database management.
The ability to organize complex data sets and use analytics to derive actionable insights is increasingly critical to drive business outcomes for our clients. Our Enterprise360 intelligence platform enables our clients to harness the power of data and insights derived from running our clients' operations leveraging proprietary metrics and benchmarks from our Digital SEPs. This platform also uses AI for prescriptive actions to pinpoint transformation opportunities in an effort tothat can unlock operational excellence and growth.
Transformation ServicesRevenues from our Digital Operations services in 2023 were $2.48 billion, representing 55% of our total 2023 revenue.
Data-Tech-AI Services
Our transformationData-Tech-AI services include our digital solutions, consulting services,focus on designing and analytics offerings. We are also building and driving solutions that involve experience-led transformation.harness the power of digital technologies, data and advanced analytics, AI, and cloud-based software-as-a-service (SaaS) offerings to help transform our clients’ businesses and operations. Using human-centric design, we help clients build new products and services, create digital workspaces, and drive customer, client, employee and partner engagement.
Digital: We helpRevenues from our clients harness the powerData-Tech-AI services in 2023 were $1.99 billion, representing 45% of digital technologies. Our Genpact Cora platform helps us design and implement digital solutions, making use of advanced technologies, AI, cloud-based software-as-a-service (SaaS) offerings, robotic process automation and dynamic workflow.
Consulting: Our consulting practice, which includes digital, AI and cloud experts, helps clients:
•Get a complete picture of how they run their operations across their organization in our areas of focus;
•Measure how their operating processes compare to industry best practices;
• Create custom roadmaps to help them deliver business outcomes; and
• Train client teams to execute on our recommendations.
Analytics: We use data and advanced analytics to drive value for our clients by providing predictive insights that are actionable and can lead to improved business outcomes. We offer analytics services and solutions in areas where we have domain and functional expertise, both on a standalone basis and embedded in our other service offerings. We help our clients manage data through appropriate governance and process engineering principles and leverage quantitative and qualitative methods to analyze a client’s data to help them assess new business opportunities, manage risk, and make better business decisions.total 2023 revenue.
Our service offerings
We offer the following professional services to our clients:
•Core industry operations specific to our chosen industry verticals; and
•Enterprise Servicesservices: Finance and accounting, CFO advisory, finance and accounting, supply chain, sourcing and procurement, sales and commercial, marketing and experience, and environmental, social and governance services.services; and
Core industry operations
We help our clients design, transform and run core enterprise operations services that are specific to their industries. On the foundation of domain expertise embedded in our Digital SEP frameworks, we use our Lean Digital approach to leverage digital technologies and specialized analytics to power Intelligent Operations. We provide core operations support in all of our chosen industry verticals.
Enterprise services
CFO advisoryOur enterprise services aim to deliver value for our clients through innovation and by leveraging our extensive experience optimizing processes for our clients. We partner with our clients to design target operating models, implement data, tech and AI-enabled solutions, improve process execution, and provide data and analytics-driven insights.
Our CFO advisory services include CFO organization design and set-up, such as CFO target operating model design and working capital improvement solutions; operational finance transformation, such as procure-to-pay optimization and period close optimization; financial planning and analysis transformation, such as planning, budgeting and forecasting transformation, business intelligence systems and advanced visualization tool design and implementation; digital transformation, including design, configuration and implementation of finance IT architecture, intelligent automation, including intelligent workflow orchestration and cloud migrations; analytics solutions, such as data strategy and governance, operational reporting and financial data lake design and implementation; and carve-outs and post-merger integration services, including transactional due diligence.
Finance and accounting services
We believe we are one of the world’s premier providers of finance and accounting services. Our focus is on delivering fast and high-quality results, minimizing exceptions, providing a seamless user experience, and making a working capital impact for our clients. We offer a comprehensive range of services in this area, include:including:
Accounts payable: Our accounts payable services include document management, vendor master data management, invoice receipt and processing, approval and resolutionaccuracy audits, reconciliations, aging analyses, help desk management, payments processing and travel and expense processing;
Invoice-to-cash: Our invoice-to-cash services include customer master data management, credit and contract management, fulfillment,data validation and credit worthiness assessments, billing, collections, accounts receivable maintenance and reporting, credit review support, bad debts research, accounts receivable reconciliation, and dispute and deduction management services;
Record to report: accounting, treasury, taxOur record to report services product cost accounting, andinclude closing and reporting process management, general accounting and industry-specific accounting services, treasury services, tax services, and external reporting, including SECstatutory accounting and regulatory reporting;
Financial planning and analysis: Our financial planning and analysis services include budgeting, planning and forecasting support, management reporting, business, financial and business performance reporting;operational analytics, transformation design, digital-infused process enhancement, enterprise data and advisory services, master data management and data quality services and data lake implementation; and
Enterprise risk and compliance: Our enterprise risk and compliance services include operational risk and controls across a wide range of regulatory environments.environments, including SOX and controls monitoring, controls transformation, ERP and digital controls, third party risk management, internal audit and audit analytics.
CFO advisory services
Our CFO advisory services aim to enable CFOs to optimize the impact the finance organization can have on a company's performance and shareholder value creation. These services cover the entire finance value stream, including target operating model design, working capital optimization, operational finance transformation, as well as corporate development and event-driven initiatives, such as carve-outs and post-merger integration services, including transactional due diligence.
Supply chain, sourcing and procurement and sales and commercial services
Supply chain: We offer advisory services, adoption of digitalhelp our clients transform process-led and analytics tools and technology, and services to achieve supply chain resiliency and sustainabilitytechnology-enabled operating models across the value chain (plan, source, make, deliver, and after-sales)aftersales). We cover the complete supply chain operations reference model and provide services in critical areas such as supply chain resiliency, sustainable/circular supply chain and orchestrated enterprise.
Sourcing and procurement: We offer advisory and othermanaged services across the direct and indirect procurement value chain, including direct and indirect strategic sourcing, responsible sourcing, category management, spend analytics, procurement operations and master data management.digital platform transformation.
Sales and commercial, marketing and experience services
Sales and commercial: We drive growth and experience for our clients by transforming and running the end-to-end sales lifecycle for our clients through services such as campaign management, lead generation, qualification and deductions. We also provide services in the areas of partner management and commercial operations, such as pricing and promotion optimization, and B2B customer experience, including order management, deductions and dispute management.
Marketing and experience: We enable our clients to drive growth by delivering transformational experiences that leverage our deep understanding of data, technology and process design. Our focus is to differentiate through operational transformation, generative AI enablement and improved experience across customers, employees and products, with data led insights. Our services in this area are supported by strategic partnerships with leading ecosystem providers in marketing and experience.
Environmental, social and governance services
We offer a range of solutions to help our clients meet their sustainability objectives, environmental, social and governance (ESG) regulatory requirements, or voluntary commitments.commitments and operational improvements. Our services in this area include advisory, data management &and analytics, carbon accounting, responsible sourcing, sustainable supply chain, human rights assessment, sustainability diligence, sustainable technology, ESG reporting and limited assurance for ESG reporting.
Core industry operations
We help our clients design, transform and run processes that are specific to their industries. Using our industry and domain expertise embedded in our Digital SEP frameworks, we collaborate with our clients to power their operations in areas such as claims, underwriting, commercial leasing and lending, regulatory affairs, insurance actuarial, and trust and safety. We provide industry-specific operations services across all of our chosen industry verticals.
Industries we serve
We work with clients across our chosen industry verticals, which arerepresent areas in which we believe we have deep industry acumen. Our chosen industry verticals, whichdescribed in more detail below, are alsogrouped within our three reportable segments, are:namely: (1) Banking, Capital Markets and Insurance (BCMI),Financial Services, (2) Consumer Goods, Retail, Life Sciences and Healthcare, (CGRLH), and (3) High Tech Manufacturing and Services (HMS).Manufacturing.
Organizing our business by industry verticals allows us to leverage our deep domain knowledge specific to our chosen industries and create, replicate and standardize innovative solutions for clients in the same industries. In addition to our professional services, such as CFO advisory, finance and accounting, andCFO advisory, supply chain, sourcing and procurement, and sales and commercial, that are available to clients across our verticals, we offer core industry-specific services to clients in select verticals. These services are embedded where possible with industry-relevant digital and analytics tools that useleverage AI and automation modules designed to drive enhanced benefits and customer experience.
Banking, Capital MarketsFinancial Services
Our Financial Services segment covers services we provide to clients in the banking, capital markets and Insurance
insurance sectors. Our banking and capital markets clients include retail, investment and commercial banks, mortgage lenders, equipment and lease financing providers, fintech companies, payment providers, wealth and asset management firms, broker/dealers, exchanges, auto finance providers, clearing and settlement organizations, renewable energy lenders and other financial services companies. Our core operations services for these clients include application processing,retail customer onboarding, customer service, collections, card servicing operations, loan and customer services, loanpayment operations, customer onboarding, commercial loan servicing, equipment and auto loan servicing, mortgage origination and servicing, compliance services, risk management and compliance services, reporting and monitoring services and wealth management operations support. We also provide end-to-end information technologyfinancial crime and risk management services application developmentin areas such as fraud and maintenance, cloud hosting, post-trade support, managed services, financial crimes supportdispute management, anti-money laundering, transaction monitoring, KYC and consulting.
due diligence, sanctions screening, negative media monitoring and platform implementation.Our insurance clients include globalinsurers, brokers, agents, reinsurers and insurtech companies operating across property and casualty, insurers,specialty, life, annuity, disability and employee benefits providers, and reinsurers and insurance brokers.lines of business. Our core operations services for these clients span the lifecycle of insurance processes, includinginclude underwriting support, new business processing, policy administration, customer service, claims management, catastrophe modeling and actuarial services. We also provide end-to-end third party administration for property and casualty claims.
Revenues from our Financial Services segment in 2023 were $1.23 billion, representing 27% of our total 2023 revenue.
Consumer Goods, Retail, Life Sciences and Healthcare
Our Consumer and Healthcare segment covers services we provide to clients in the consumer goods, retail, life sciences and healthcare sectors. Our consumer goods and retail clients include companies in the food and beverage, household goods, consumer health and beauty and apparel industries, as well as grocery chains and general and specialty retailers. The core operations services we provide to these clients include demand generation, sensing and planning, supply chain planning and management, pricing and trade promotion management, deduction recovery management, order management, digital commerce and customer experience and risk management.experience.
Our life sciences and healthcare clients include pharmaceutical, medical technology, medical device and biotechnology companies as well as retail pharmacies, distributors, diagnostic labs, and healthcare payers (health insurers) and providers, and pharmacy benefit managers.providers. Our core operations services for life sciences clients include regulatory affairs services, such as lifecycle management, regulatory operations, Chemistry Manufacturing Controls compliance safety and pharmacovigilance, and regulatory information management. Our services for healthcare clients include managing the end-to-end claim lifecycle of a claim,management, from claims processing and adjudication to claims recovery and payment integrity.integrity, revenue cycle management, health equity analytics, care services and customer experience.
Revenues from our Consumer and Healthcare segment in 2023 were $1.57 billion, representing 35% of our total 2023 revenue.
High Tech and Manufacturing
Our High Tech and Manufacturing segment covers services we provide to clients in the high tech hardware, high tech software and Services
manufacturing sectors. Our clients in the high tech industry vertical include companies in the information and digital technology, software, digital platform, provider, electronics, software, fintech,semiconductor, enterprise technology, media, services and e-commercehospitality sectors. The core operations services we provide to these clients include industry-specific solutions for trust and safety, advertising sales support, the Industrial Internet of Things (IIoT),customer and user experience, AI/machine learning/robotic process automation, ordercustomer care support and supply chain management, data engineering, digital content management and risk management.
Our manufacturing and services clients include companies in the aerospace, automotive and mobility, chemicals, energy, manufacturing,electric vehicles and batteries, industrial machinery, materials transportation and logistics, oil and gas and utilities sectors. Our core operations solutions for these clients include industry-specific solutions for the IIoT, supply chain management, direct and indirect procurement, logistics, services,field, aftermarket services support industrial asset optimization and engineering services.
Revenues from our High Tech and Manufacturing segment in 2023 were $1.68 billion, representing 38% of our total 2023 revenue.
Our clients
We serve more than 700approximately 800 clients across many industries and geographies. Our clients include some of the biggest brands in the world, many of which are leaders in their industries.industries, including about a quarter of the Fortune Global 500.
GE
General Electric Company (GE) has been our largest client since our inception and accountedOur contracts with clients for $376.2 million, or 9%Digital Operations services often take the form of a master services agreement ("MSA"), of our total net revenues in 2021. We serve several of GE’s business units, including Aviation, Corporate, Healthcare, Industrial Finance, Power and Renewables. In November 2021, GE announced its intention to divide into three public companies by 2024. See "GE has historically accounted forwhich is a significant portion of our revenues and any material loss of business from, or our failure to maintain relationshipsframework agreement that we then supplement with GE and former GE businesses could have a material adverse effect on our business, results of operations and financial condition" under Item 1A—"Risk Factors" in this Annual Report on Form 10-K.
We provide broad services to GE across all of our service offerings. Commitments with respect to services we may perform for GE are set forth in statements of work (SOWs),("SOWs") or other service level agreements, such as supplements, work orders, purchase orders andor business services agreements (BSAs), that we may enter into with individual GE business units from time to time.agreements. These SOWs purchase orders and BSAsother service level agreements cover in more detail the type of work to be performed and the associated amounts to be billed. In general, each GE business unit decides whether to enter into a SOW, purchase order or BSA with us and on what terms it will do so. Therefore, although some decisions may be made centrally at GE,For our revenues from GE come from many different businesses, each with its own leader who makes decisions about our services.
Global clients
We serve about one fifth of the Fortune Global 500. Our net revenues from our clients other than GE, which we refer to as our Global Clients, were $3.6 billion in 2021, or 91% of our 2021 total net revenues. See Item 7—“Management’s Discussion and Analysis of Financial Condition and Results of Operations—Overview—Net Revenues—Classification of certain net revenues.”
Our contracts with clients for Intelligent Operations services often take the form of a master services agreement (MSA), which is a framework agreement that we then supplement with SOWs. For transformationData-Tech-AI services, we typically enter into software-as-a-service and/or consulting agreements with our clients depending on the scope of the services to be performed. For more about our contracting frameworks, see Item 7—“Management’s Discussion and Analysis of Financial Condition and Results of Operations—Overview—Net Revenues.”
Partnerships and alliances
We continue to invest in and expand our strategic alliances with companies whose services and solutions complement ours. Together, we work to enhance our existing solutions or create new offerings to meet market needs.
Our alliances generally fall into one of the following categories:
• Strategic, go-to-market partnerships
• Deal-specific relationships to jointly solve a specific issue for a client
• Reseller arrangements to provide third party partner software and cloud solutions
• Digital and other “white label” embedded technology-based relationships
We have three primary types of partners: consulting partners, digital partners, and solution partners. Our digital and solution partnerships aim to nurture relationships with established and emerging players in technology and AI. These potential partners specialize in leading-edge disruptive digital technologies and solutions that we can embed into our offerings or jointly bring to market.
Our people
As of December 31, 2021,2023, we had approximately 109,600129,100 employees working in more than 3035 countries. As a talent-led organization, our people are critical to the success of our business. We have created, and constantly reinforce, a culture that emphasizes collaboration, innovation, process improvement, and dedication to our clients. We seek to foster a culture that wins clients, develops leaders and attracts and retains talent who exhibit our core values – curiosity, incisiveness and courage – who embody and enable our purpose — the relentless pursuit of a world that works better for people — and who uphold our dedication to integrity consistent with our Code of Conduct, Integrity@Genpact.
Rewarding and recognizing our talent
We aim to create a work environment where every person is inspired to achieve, driven to perform and rewarded for their contributions. We strive to engage and competitively compensate our high-performing talent by providing performance-based promotions and merit-based compensation increases. In 2021,2023, we promoted more than 19,00013,000 of our employees and encouraged employee career growth through our Destination Growth program. We also regularlyclosely monitor employee retention levels and continue to enhanceregularly evaluate our pay-for-performance approach in an effort to retain our top talent.
Diversity, equity and inclusion
We believe that a culture of diversity, equity and inclusion is critical to our business. We believe in equal opportunity for each individual, irrespective of their gender, age, ethnicity, cultural background, race or sexual orientation. Understanding each other’s uniqueness, recognizing our differences, respecting varied opinions and accepting various points of view is at the heart of our organization’s culture. We promote these values by seeking to maintain inclusive hiring and management practices and ensure that opportunities are equally open to all.
We are committed to:
•Increasing diversity, including gender, racial and ethnic diversity, across all levels of the organization;
•Recruiting, retaining and advancing talent, including from diverse ethnic and racial backgrounds; and
•Creating and fostering an inclusive culture where everybody, including our LGBTQ+ employees, feels safe and empowered.
Employee development and engagement
We are committed to the career development of our employees and making them future-ready, and we strive to engage them with challenging and rewarding career opportunities. Our performance management approach supports our career philosophy by encouraging employees to reflect on their performance, set challenging goals, receive feedback, identify their development needs and find relevant learning and training opportunities. We have also developed a number of leadership development and mentoring programs, including our Global Operations Leadership Development and our Leadership Direct programs for high potential talent and our programs designed to increase gender diversity in our leadership ranks, such as our Pay it Forward and Women’s Leadership initiatives.
We have also developed a learning framework called Genome that enables our employees to acquire new skills and evolve quickly as industries and technologies change, equipping them with skills that are relevant to their current roles and future aspirations. Genome was designed to shape an adaptive workforce, and its learning strategy was formulated to “reskill at scale” and be integrated throughout the enterprise.
TalentMatch is our talent transformation initiative to match the skills and job aspirations of our employees with existing and future job opportunities we have available. By enabling employees to prepare for their future career aspirations by upskilling and reskilling through Genome, TalentMatch has allowed us to identify talent available for redeployment from one part of our business to another as the needs of our clients change. It improves our employee utilization globally by providing the right talent at the right time for our client engagements. TalentMatch also gives our employees the opportunity to take their careers in their desired directions, thus increasing employee satisfaction, and bolstering our ability to scale the “work from anywhere”our flexible working model.
Amber, our engagement AI chatbot and employee experience platform, enables transformation of our employee engagement strategy. Amber provides an outlet for unbiased and judgment free conversations for our employees and live predictive people analytics for business and HR leaders.
By digitizing how we engage with our employees through Amber, we have increased the scope and frequency of employee feedback and have gained the ability to assess employee engagement and identify trends in employee engagement and satisfaction across the company.
In 2021, 2023, we also investedcontinued to invest in technologies and programs designed to create a betterimprove employee experience, with a particular focus on employee well being, and launched applications that promote individual wellness and enable socializing and collaboration between employees.being.
Corporate social responsibility
Genpact’sOur approach to corporate social responsibility focuses on four pillars:
•two pillars tied to our purpose: EducationBetter Access, which reflects our aim to provide the communities in which we operate with better access to healthcare, education and employability;opportunities, and Better Planet, which reflects our aim to inform, educate, and catalyze action on the different facets of the environment and climate change and help make the planet work better for all.
•Women's empowerment;
•Sustainable social impact; and
•Environmental sustainability.
We foster a culture of giving and volunteering through several global platforms, projects, and social initiatives. More than 50,00062,000 of our employees have volunteered their time to among other things, helpsupport a range of causes, such as mentoring underprivileged children get better accessand young adults, providing meals to education, assist unemployed womenfood-insecure communities, planting saplings, and engaging in developing job skills, and work on projects to help improve infrastructure and education in the communities in which we work and live. For example, in 2021, in a continued effort to combat pandemic-induced hunger and following on the success of our Feed 20 Million initiative in 2020, we launched our Feed 30 Million initiative, setting a goal to serve 30 million meals in 2021 to people in need. Our volunteers enabled us to surpass this goal with more than 30 million meals served during the year.
Additionally, in 20212023 more than 5,000 of our employees participated in our payroll-based charitable donation programs, and many of our employee volunteers participated in virtual volunteering initiatives such as composting, planting saplings, or eliminating single-use plastic. We are also passionate about working collectivelycreating learning aids for students, awareness posters for non-profits, holiday cards for veterans, and completing at-home sustainability challenges to reduce our carbon footprint and have set targets to reduce our environmental impact at the regional and global levels.
Partnerships and alliances
We continue to invest in and expand our strategic alliances with companies whose services and solutions complement ours. Together, we work to enhance our existing solutions or create new offerings to meet market needs.
Our alliances generally fall into one of the following categories:
• Strategic, go-to-market partnerships
• Deal-specific relationships to jointly solvebuild a specific issue for a client
• Reseller arrangements to provide third party partner software and cloud solutions
• Digital and other “white label” embedded technology-based relationships
We have three primary types of partners: consulting partners, digital partners, and solution partners. Our digital and solution partnerships aim to nurture relationships with established and emerging players. These potential partners specialize in leading-edge disruptive digital technologies and solutions that we can embed into our offerings or jointly bring to market.better planet.
Sales and marketing
We market our services and solutions to both existing and potential clients through our business development team andteam. Like our lead client partners and global relationship managers. Membersportfolio, members of this team are based around the globe, including in the United States, United Kingdom, Europe, Australiaglobe. Our business development team focuses both on supporting our strategic client accounts and Asia, and dedicate their time to expanding the services we provide to our existing clients as well as acquiring new clients.
We have designated lead client partners and global relationship managers for each of our strategic client relationships. The client partners and global relationship managersThese business development personnel are supported by transformation partners, industry/productindustry and capability subject matter experts and teams from digital and analytics, process improvement, quality, transition, finance, human resources and information technology to ensure we canour services and solutions best understand and address the needs of our clients. We constantlycontinuously monitor our client satisfaction levels to ensure that we maintain high service levels for each client, using measuresmetrics such as the Net Promoter Score. Our sales force is primarily organized by industry vertical teams that are supported by vertical-specific and horizontal service offerings.
The length of our selling cycle varies depending on the type of engagement. The sales cycle for our advisory and project work is typically much shorter than the sales cycle for a large business process engagement. Our efforts may begin through an existing engagement with a client or in response to our lead generation program, a perceived opportunity, a reference by an existing client, a request for proposal or otherwise. Our teams seek to understand the needs and priorities of our clients as well as the business outcomes our clients desire, and we leverage our combination of digitalcapability and industry expertise to devisecreate differentiated client solutions. We may expend substantial time and resources in engaging with prospective clients to secure new business. See Item 7—“Management’s Discussion and Analysis of Financial Condition and Results of Operations—Overview—Net Revenues.”
As our relationship with a client deepens, the time required to win an engagement for additional services often graduallygenerally declines. In addition, during an engagement, as we better understand and experience a client’s business and processes, our abilitywe are able to identify incremental opportunities andto deliver greater value for the client, including by leveraging Genpact Cora and our expanding portfolio of digital capabilities to transform our clients’ operations, typically increases.operations.
We also strive to foster relationships between our senior leadership team and our clients’ senior management.management teams. These “C-level” relationships ensure that both parties are focused on establishing priorities, aligning objectives and driving client value from the top down.value. High-level executive relationships present significant opportunities to increase business from our existing clients. These relationships also provide a forum for gathering feedback on service delivery performance and addressing client concerns. Our governance methodology is designed to ensure that we are well connected at all levels of our clients’ organizations (executive, management, technology and operations).
Significant new business opportunities are reviewed by business leaders, lead client partners and global relationship managers from the applicable industry vertical along with operations personnel and members of our finance department. If they determine that the new business is aligned with our strategic objectives and a good use of our resources, then our business development team is authorized to pursue the opportunity.
Global delivery
We serve our clients using our global network of 82more than 90 delivery centers in 22more than 25 countries. We have delivery centers in Argentina, Australia, Brazil, Bulgaria, Canada, China, Costa Rica, Egypt, Germany, Guatemala, Hungary, India, Israel, Italy, Japan, Malaysia, Mexico, the Netherlands, the Philippines, Poland, Portugal, Romania, South Africa,Thailand, Turkey, the United Kingdom and the United States. We also have many employees in these and additional countries, such as Canada, Ireland, Portugal, Singapore Spain and Turkey,South Africa, who work with our clients either onsite or virtually, which offers flexibility for both clients and employees.
With this global network, we are able to manage complex processes around the world. We use different locations for different types of services depending on client needs and the mix of skills and cost of employees at each location.
Our global delivery model gives us:
•multilingual capabilities;
•access to a larger talent pool;
•“near-shoring” as well as off-shoring capabilities to take advantage of time zones; and
•proximity to our clients through a significant onshore presence.
We also regularly look for new places to open delivery centers and offices, both in new countries or new cities in countries where we already have a presence. Before we choose a new location, we consider several factors, such as the talent pool, infrastructure, government support, operating costs, and client demand.
Service delivery model
We seek to be a seamless extension of our clients’ operations. To that end, we developed the Genpact Virtual CaptiveSM service delivery model, in which we create a virtual extension of our clients’ teams and environments. Our clients get dedicated employees and management, as well as dedicated infrastructure at our delivery centers. We also train our teams in our clients’ cultures, processes, and business environments.
Intellectual Property
The solutions we offer our clients often include a range of proprietary methodologies, software, and reusable knowledge capital. We also develop intellectual property in the course of our business and our agreements with our clients regulate the ownership of such intellectual property. We seek to protect our intellectual property and our brand through various means, including by agreement and applications for patents, trademarks, service marks, copyrights and domain names. Some of our intellectual property rights are trade secrets and relate to proprietary business process enhancements.
As of December 31, 2021,2023, we had a portfolio of more than 5060 patents and pending patent applications globally. Additionally, we have approximatelyover 200 trademarks registered in various jurisdictions.
We often use third-party and client software platforms and systems to provide our services. Our agreements with our clients normally include a license to use the client’s proprietary systems to provide our services. Clients authorize us to access and use third party software licenses held by the client so that we may provide our services.
It is our practice to enter into agreements with our employees and independent contractors that:
•ensure that all new intellectual property developed by our employees or independent contractors in the course of their employment or engagement is assigned to us;
•provide for employees’ and independent contractors’ cooperation in intellectual property protection matters even if they no longer work for us; and
•include a confidentiality undertaking by our employees and independent contractors.
Competition
We operate in a highly competitive and rapidly evolving global market. We have a number of competitors offering services that are the same as or similar to ours. Our competitors include:
•large multinational service providers, primarily accounting and consulting firms, that provide consulting and other professional services;
•companies that are primarily business process service providers operating from low-cost countries, most commonly India;
•companies that are primarily information technology service providers with some business process service capabilities; and
•smaller, niche service providers that provide services or products in a specific geographic market, industry or service area, including digital.new AI and digital technologies.
We may also face losses or potential losses of business when in-house departments of companies use their own resources rather than engage an outside firm for the types of services and solutions we provide.
Our business model is also subject to competitive forces from the advent of novel technology or applications of these technological capabilities made readily available in open-market environments.
Our revenues are derived primarily from Fortune Global 500 and Fortune 1000 companies. We believe that the principal competitive factors in our industry include:
• deep expertise in industry-specific domains and processes;
• ability to advise clients on how to transform their processes and deliver transformation that drives business value;
• ability to provide innovative services and products, including digital offerings;
• ability to consistently add value through digital transformation and continuous process improvement;
• reputation and client references;
• contractual terms, including competitive pricing and innovative commercial models;
• scope of services;
• quality of products, services and solutions;
• ability to sustain long-term client relationships; and
• global reach and scale.
Our clients typically retain us on a non-exclusive basis.
Regulation
We are subject to regulation in many jurisdictions around the world as a result of the complexity of our operations and services, particularly in the countries where we have operations and where we deliver services. We are also subject to regulation by regional bodies such as the European Union or EU.("EU").
In addition, the terms of our service contracts typically require that we comply with applicable laws and regulations. In some of our service contracts, we are contractually required to comply even if such laws and regulations apply to our clients, but not to us, and sometimes our clients require us to take specific steps intended to make it easier for them to
comply with applicable requirements. In some of our service contracts, our clients undertake the responsibility to inform us about laws and regulations that may apply to us in jurisdictions in which they are located.
If we fail to comply with any applicable laws and regulations, we may face restrictions on our ability to provide services, and may also be the subject of civil or criminal actions involving penalties, any of which could have a material adverse effect on our operations. Our clients generally have the right to terminate our contracts for cause in the event of regulatory failures, subject in some cases to notice periods. See Item 1A—“Risk Factors—Risks Related to our Business and Operations—Our global operations expose us to numerous and sometimes conflicting legal and regulatory requirements, and violations of these laws and regulations could harm our business.” If we fail to comply with contractual commitments to facilitate our clients’ compliance, we may be liable for contractual damages, and clients in regulated industries may be less willing to use our services.
We are affected by laws and regulations in the United States, the United Kingdom, the EU and its member states, and other countries in which we do business that are intended to limit the impact of outsourcing on employees in those jurisdictions, and occasional changes to laws and regulations in such jurisdictions may impose changes that further restrict or discourage offshore outsourcing or otherwise harm our business. See Item 1A—“Risk Factors—Risks Related to our Business and Operations—FutureRecent and future legislation orand executive action in the United States and other jurisdictions could significantly affect the ability or willingness of our clients and prospective clients to utilize our services.”
Our collection, use, disclosure and retention of personal health-related and other information is subject to an array of privacy, data security, and data breach notification laws and regulations that change frequently, are inconsistent across the jurisdictions in which we do business, and impose significant compliance costs. In the United States, personal information is subject to numerous federal and state laws and regulations relating to privacy, data security, and breach notification, including, for example, the Financial Modernization Act (sometimes referred to as the Gramm-Leach-Bliley Act), Health Insurance Portability and Accountability Act, Federal Trade Commission Act, Family Educational Rights and Privacy Act, Communications Act, Electronic Communications Privacy Act, and state-level comprehensive privacy laws, including the California Consumer Privacy Act. There are also various state-level privacy laws that specifically regulate consumer health data, including recently enacted laws in Connecticut, Nevada and Washington.
All fifty U.S. states and the District of Columbia have implemented separate data security and breach notification laws with which we must comply; in addition,comply, and some states have strengthenedadded specific data security standards to their existing laws.
Some courts have become more willing to allow individuals to pursue claims in data breach cases, indicating that it may become easier for consumers to sue companies for data breaches. Related laws and regulations govern our direct marketing activities and our use of personal information for direct marketing, including the Telemarketing and Consumer Fraud and Abuse Prevention Act, Telemarketing Sales Rule, Telephone Consumer Protection Act and rules promulgated by the Federal Communications Commission, and CAN-SPAM Act. In 2018, the Clarifying Lawful Overseas Use of Data (CLOUD) Act established new required processes and procedures for handling U.S. law enforcement requests for data that we may store outside of the U.S.
In the EU, the General Data Protection Regulation (GDPR) went into effect in May 2018. The GDPR imposes privacy and data security compliance obligations and increased penalties for noncompliance. In particular, the GDPR has introduced numerous privacy-related changes for companies operating in the EU, including greater control for data subjects, increased data portability for EU consumers, data breach notification requirements and increased fines for violations. The GDPR also prohibits the transfer of personal data from the European Economic Area (“EEA”) to countries outside of the EEA unless made to a country deemed to have adequate data privacy laws by the European Commission or an appropriate data transfer mechanism has been put in place. The EU-US Privacy Shield (“Privacy Shield”) was such a transfer mechanism put in place between the EU and the United States, but the Privacy Shield was invalidated in July 2020 by the Court of Justice of the European Union (the “CJEU”). The EU-U.S. Privacy Shield has now been replaced with the EU-U.S. Data Privacy Framework (“DPF”), which is intended to address the issues cited in the 2020 CJEU decision. Although the European Commission issued an adequacy decision for the DPF on July 10, 2023, and it is now a valid mechanism for transferring personal data from the EU to the U.S. for entities that have elected to participate, the validity of the DPF may also be challenged in court, which could create additional uncertainty relating to the regulation of international data transfers. The CJEU’s decision also led to revisions to the standard contractual clauses (“SCCs”) that may also be used as a mechanism for transferring personal data outside of the EU. If the DPF is challenged, there may be new uncertainty regarding the validity of the updated SCCs.
Following the withdrawal of the UK from the EU, the United Kingdom has amended the UK Data Protection Act 2018 to retain the GDPR in UK national law. The penalties prescribed in the UK GDPR are the same as under the EU GDPR. However, the United Kingdom has implemented its own guidance for handling outbound data transfers to jurisdictions such as the U.S. whose privacy laws are not covered by an existing adequacy decision, has adopted an International Data Transfer Agreement as a framework for companies to transfer personal data outside of the United Kingdom, and has implemented its own version of DPF, called the UK-U.S. Data Bridge, to allow participating companies to transfer personal data from the UK to the U.S.
Additionally, foreign governments outside of the EU and UK are also taking steps to fortify their data privacy laws and regulations. For example, India as well as somerecently enacted a data protection law that may affect how we handle vendor and employee data in India. Other countries in Africa, Asia and Latin America have either passed data privacy legislation or are considering data protection laws that affect or may affect us. Evolving laws and regulations in India protecting the use of personal information could also impact our engagements with clients, vendors and employees in India. As privacy laws and regulations around the world continue to evolve, these changes could adversely affect our business operations, websites and mobile applications that are accessed by residents in the applicable countries.
In the United States, we are either directly subject to, or contractually required to comply or facilitate our clients’ compliance with, laws and regulations arising out of our work for clients operating there, especially in the area of banking, financial services and insurance, such as the Gramm-Leach-Bliley Act, the Fair Credit Reporting Act, the Fair and Accurate Credit Transactions Act, the Right to Financial Privacy Act, the Bank Secrecy Act, the USA PATRIOT Act, the Bank Service Company Act, the Home Owners Loan Act, the Electronic Funds Transfer Act, the Equal Credit Opportunity Act, and regulation by U.S. agencies such as the SEC, the Federal Reserve, the Federal Deposit Insurance Corporation, the National Credit Union Administration, the Commodity Futures Trading Commission, the Federal Financial Institutions Examination Council, the Office of the Comptroller of the Currency, and the Consumer Financial Protection Bureau.
Because of our debt collections work in the United States, we are also regulated by laws such as the Truth in Lending Act, the Fair Credit Billing Act, the Fair Debt Collection Practices Act, the Telephone Consumer Protection Act and related regulations. We are currently licensed to engage in debt collection activities in all jurisdictions in the United States where licensing is required. U.S. banking and debt collection laws and their implementing regulations are occasionally amended, and these changes may impose new obligations on us or may change existing obligations.
Because of our insurance processing activities in the United States, we are currently licensed as a third-party administrator in 4243 states and are regulated by the department of insurance in each such state. In two other states, we qualify for regulatory exemption from licensing based on the insurance processing activities we provide. We also hold entity adjuster licenses in 2224 states that require licensing.
Certain laws may apply to our content moderation activity, such as laws regulating hate speech on the internet. In the United States, Section 230 of the Communications Decency Act shields “interactive computer services” (e.g., websites, social media platforms) from liability for the speech of their users, with certain exceptions.
The law also shields interactive computer services from civil liability for a good faith action voluntarily taken to restrict access to or availability of content that the provider or user considers to be obscene, lewd, lascivious, filthy, excessively violent, harassing, or otherwise objectionable, whether or not such material is constitutionally protected. The future of Section 230 and the scope of the protections it provides to online publishers and other laws related to bullying, harassing, offensive materials and hate speech on the internet are currently the topic of significant debate. We expect that these laws will continue to evolve and change. Changes to the laws and regulations governing liability for speech on the internet may affect the business strategies and offerings of our clients, which may significantly change their approach to content moderation, and which, in turn, could reduce the market for our trust and safety related services.
In the United States, we are subject to laws and regulations governing foreign trade, such as export control, customs and sanctions regulations maintained by government bodies such as the Commerce Department’s Bureau of Industry and Security, the Treasury Department’s Office of Foreign Assets Control, and the Homeland Security Department’s Bureau of Customs and Border Protection. Other jurisdictions, such as the EU, also maintain similar laws and regulations that apply to some of our operations.
Several of our service delivery centers, primarily located in China, Costa Rica, India, Israel, Malaysia and the Philippines, benefit from tax incentives or concessional rates provided by local laws and regulations. The Indian Special Economic Zones Act of 2005 introduced a tax holiday in certain situations for operations established in designated “special economic zones” (SEZs). The SEZ tax benefits are available only for new business operations that are conducted at qualifying SEZ locations. The Indian government recently enacted a law that allows companies to elect to pay a reduced tax rate on all of their income provided they do not take advantage of any tax holidays or other exemptions. In response to this law, we have elected to cease taking advantage of the SEZ tax holidays and are subject to the reduced tax rate effective April 1, 2021. See Item 7—“Management’s Discussion and Analysis of Financial Condition and Results of Operations—Overview—Net Revenues—Income Taxes.” In addition, to the tax holidays described above, certain benefits are also available to us in India as an information technology enabled service (ITES) company under certain Indian state and central laws. These benefits include rebates and waivers in relation to payments for the transfer or registration of property (including for the purchase or lease of premises), waivers of conversion fees for land, exemption from state pollution control requirements, entry tax exemptions, labor law exemptions, preferential rates for the commercial usage of electricity and incentives related to the export of qualified services.
Our hedging activities and currency transfers are restricted by regulations in certain countries, including China, India, Malaysia, the Philippines and Romania.
Certain Bermuda Law Considerations
As a Bermuda company, we are also subject to regulation in Bermuda. Among other things, we must comply with the provisions of the Companies Act 1981 of Bermuda, as amended, regulating the declaration and payment of dividends and the making of distributions from contributed surplus.
We are classified as a non-resident of Bermuda for exchange control purposes by the Bermuda Monetary Authority. PursuantRisks Related to our non-resident status,Shares
•The issuance of additional common shares by us or the sale of our common shares by our employees could dilute our shareholders’ ownership interest in the Company and could significantly reduce the market price of our common shares.
•There can be no assurance that we may engage in transactions in currencies other than Bermuda dollars. There are no restrictionswill continue to declare and pay dividends on our ability to transfer funds incommon shares, and out of Bermuda orfuture determinations to pay dividends towill be at the discretion of our board of directors.
•We are organized under the laws of Bermuda, and Bermuda law differs from the laws in effect in the United States residents that are holders ofand may afford less protection to shareholders.
•The market price for our common shares.shares has been and may continue to be volatile.
Under•You may be unable to effect service of process or enforce judgments obtained in the United States or Bermuda law, “exempted” companies are companies formed foragainst us or our assets in the purpose of conducting business outside Bermuda. As an exempted company, we may not, without a license granted by the Minister of Finance, participatejurisdictions in certain business transactions, including transactions involving Bermuda landholding rights and the carrying on of business of any kind, for which we are not licensed in Bermuda.
Bermuda has economic substance requirements pursuant to the Economic Substance Act 2018, as amended, and the regulations proffered thereunder, which require us to have adequate economic substance in Bermuda in relation to certain ofor our activities.
Available Information
We file current and periodic reports, proxy statements, and other information with the SEC. The SEC maintains an Internet site that contains reports, proxy and information statements, and other information regarding issuers that file electronically with the SEC, at www.sec.gov. We make available free of charge on our website, www.genpact.com, our Annual Report on Form 10-K, Quarterly Reports on Form 10-Q, Current Reports on Form 8-K and amendments to those reports filed or furnished pursuant to Section 13(a) or 15(d) of the Securities Exchange Act of 1934, as amended, as soon as reasonably practicable after we electronically file such material with, or furnish it to, the SEC. The contents of our website are not incorporated by reference into this Annual Report.executive officers operate.
Information about our executive officersUSE OF TRADEMARKS
The following table sets forth information concerning our executive officerstrademarks, trade names and service marks appearing in this Annual Report on Form 10-K are the property of their respective owners. We have omitted the ® and ™ designations, as of March 1, 2022:
| | | | | | | | | | | | | | |
Name | | Age | | Position(s) |
N.V. Tyagarajan | | 60 | | President, Chief Executive Officer and Director |
Michael Weiner | | 50 | | Senior Vice President, Chief Financial Officer |
Patrick Cogny | | 55 | | Senior Vice President, High Tech, Manufacturing and Services |
Balkrishan Kalra | | 52 | | Senior Vice President, Banking, Capital Markets, Consumer Goods, Retail, Life Sciences and Healthcare |
Piyush Mehta | | 53 | | Senior Vice President, Chief Human Resources Officer |
Darren Saumur | | 54 | | Senior Vice President, Global Operating Officer |
Kathryn Stein | | 44 | | Senior Vice President, Chief Strategy Officer and Global Business Leader, Enterprise Services |
Heather White | | 49 | | Senior Vice President, Chief Legal Officer and Corporate Secretary |
N.V. Tyagarajan has served as our President and Chief Executive Officer since June 2011. From February 2009 to June 2011, he was our Chief Operating Officer. From February 2005 to February 2009, he was our Executive Vice President and Head of Sales, Marketing and Business Development. From October 2002 to January 2005, he was Senior Vice President, Quality and Global Operations, for GE’s Commercial Equipment Finance division.
Michael Weiner has served as our Senior Vice President, Chief Financial Officer since August 2021. Before joining Genpact, he was the executive vice president, chief financial officer and treasurer of National General Holdings Corp. from 2010 to 2021. Prior to that, he worked with Ally Financial's GMAC Insurance unit, Cerberus Operations and Advisory Company, Citigroup, KPMG LLP and Bankers Trust Company.
Patrick Cogny has served as our Senior Vice President, Manufacturing and Services since September 2011 and has also been responsible for our High Tech business since January 2017. From 2005 to August 2011, he was the Chief Executive Officer of Genpact Europe. Prior to this, he spent 15 years working for GE in the Healthcare business and in the GE Europe corporate headquarters, in France, the United States and Belgium.
Balkrishan Kalra has served as our Senior Vice President, Consumer Goods, Retail and Life Sciences since 2008, has led our Healthcare business since 2016 and in 2020 assumed responsibility for our Banking and Capital Markets business. Prior to his current role, he held various roles at Genpact since joining us in 1999.
Piyush Mehta has served as our Senior Vice President, Chief Human Resources Officer since March 2005. He has worked for us since 2001, initially as Vice President of Human Resources.
Darren Saumur has served as our Senior Vice President, Global Operating Officer since April 2018. Prior to joining Genpact, he was an executive vice president responsibleapplicable, for the services business at Infor from 2014 to 2018. From 2005 to 2014, he worked at SAP where he ran SAP’s global consulting businesses. Mr. Saumur began his career at Ernst & Young, where he worked from 1991 to 2005.
Kathryn Stein has served as our Senior Vice President, Chief Strategy Officer since December 2016 and has also been responsible for our Enterprise Services business since February 2019. Prior to joining Genpact, Ms. Stein was at Mercer for six years, most recently as a Partner and Market Business Leader. Before Mercer, she worked with Boston Consulting Group, the Center for Strategic and International Studies and MarketBridge Consulting. Ms. Stein also currently serves as a director of Computer Task Group, Incorporated.
Heather White has served as our Senior Vice President, Chief Legal Officer and Corporate Secretary since April 2018. Ms. White has been with Genpact since 2005, and served most recently as our Senior Vice President and Deputy General Counsel. Prior to joining Genpact, she was a corporate attorneytrademarks named in the New York and London offices of Paul, Weiss, Rifkind, Wharton & Garrison LLP.this Annual Report on Form 10-K after their first reference herein.
PART I
Item 1A. Risk Factors1. Business
Risks RelatedGenpact is a global professional services and solutions firm that makes business transformation real. We drive digital-led innovation and run digitally-enabled operations for our clients, guided by our experience running thousands of processes for hundreds of global companies. We have over 129,100 employees serving clients in key industry verticals from more than 35 countries. Our 2023 total net revenues were $4.5 billion.
In 2023, we made progress on key strategic initiatives to help drive long-term profitable growth. These efforts included making continued investments in a portfolio of clients who are on significant digital transformation journeys and for whom we believe we can drive meaningful business outcomes. We continued to develop and refine our Businessartificial intelligence ("AI") capabilities, prioritizing our investments in new generative AI solutions. We also continued to focus on the learning and Operations
Wage increases in the countries where we operate may reduce our profit margin.
Salaries and related benefitsdevelopment of our employees are our most significant costs. Demand and competition for skilled employees, especially employeesto provide them with the mixcritical skills needed for the future and to build their careers.
We believe our approach to digital-led business transformation, enabled through combining our domain expertise with our skills in AI, digital and analytics, differentiates us from our competitors.
Our approach to digital-led transformation
Industry disruption is pervasive, driven by an explosion in digital technologies, increased use of skillsAI, data and analytics, new competitors, and shifting market dynamics. In this environment, companies need industry-tailored solutions to reimagine their business models end-to-end and adapt to rapid change. These organizations seek partners that can improve productivity while creating competitive advantages and driving business outcomes, such as expanded market share, seamless customer experiences, increased revenue, working capital improvement, increased profitability, and minimized risk and loss.
We partner with clients to show them how new digital solutions can drive business outcomes. We apply user and customer experience principles to our domain expertise and innovative technology to create solutions designed to quickly and aptly meet client objectives. The results can include quick-turnaround proof of concept prototypes that we need to provide certainclients can install and test in their own environments.
Many of our client solutions are based on Genpact Cora, our AI-based platform, which integrates our proprietary automation, analytics and AI technologies with those of our strategic partners into a unified offering. It draws insights from our deep domain and operations expertise in our target industries and service lines to create analytics-based solutions that are focused on improving customer and user experience to accelerate clients’ digital transformations.
Additionally, many of our client solutions are embedded with our Digital Smart Enterprise ProcessesSM (DigitalSEPs), a patented and highly granular approach to recognize the critical factors that dramatically improve business performance to help drive client outcomes. Our Digital SEPs combine Lean Six Sigma methodologies – which reduce inefficiency and improve process quality – with advanced domain-specific digital technologies, drawing on our industry acumen, our expertise in AI and experience-centric principles, and our deep understanding of how businesses run. Digital SEPs test the effectiveness of client processes using best-in-class benchmarks developed by mapping and analyzing millions of client transactions across thousands of end-to-end business processes. In this way, we identify opportunities for improving clients’ operations by applying our deep process knowledge and process-centric technologies to transform them.
We enable domain-led digital transformation for our clients through our Digital Operations Services and Data-Tech-AI Services.
Digital Operations Services
Our Digital Operations services have increased significantly from historical levels over the past year. The increased level of demandembed digital, advanced analytics, AI and competition has resulted in a tight labor market and significant increases in compensation for certain employees, particularly in highly developed markets. As wage levels for skilled employees increase in most of the countries in which we operate because of, among other reasons, the tightening of the labor market and related competition for skilled employees in certain areas, faster economic growth, and increased demand forcloud-based offerings into our business process outsourcing solutions where we transform and run our clients’ operations with an aim to achieve higher levels of end-to-end performance. These services wage increases have begunallow enterprises to adversely affect our profitabilitybe more flexible and may continuehelp them focus on high-value work to adversely affect our profitabilitybetter compete in the futuretheir industries. Our Digital Operations solutions also include certain IT services functions, including end-user computing support and infrastructure production support.
The ability to the extent that we are not ableorganize complex data sets and use analytics to control or share wage increases withderive actionable insights is increasingly critical to drive business outcomes for our clients. Sharing wage increases may causeOur Enterprise360 intelligence platform enables our clients to be less willingharness the power of data and insights derived from running our clients' operations leveraging proprietary metrics and benchmarks from our Digital SEPs. This platform also uses AI for prescriptive actions to utilizepinpoint transformation opportunities that can unlock operational excellence and growth.
Revenues from our services. We will attempt to control such costs by seeking to add capacityDigital Operations services in locations where we consider wage levels of skilled personnel to be satisfactory, but we may not be successful in doing so. We have recently had to increase our wage levels for certain roles significantly in a short period of time, and we may in the future need to increase our wage levels significantly and rapidly in order to attract the quantity and quality of employees that are necessary for us to remain competitive, which may have a material adverse effect on our business, results of operations and financial condition.
In recent years we have increased, and we expect to continue to increase, the number of employees we have in the United States from historical levels, and this increase in the relative share2023 were $2.48 billion, representing 55% of our employees who are based in the United States could have a negative effect on our profitability. In addition, we engage independent contractors in various U.S. states in the ordinary course of business. A handful of U.S. states have enacted legislation that requires businesses to consider individuals to be employees who, under current law in most other U.S. states, would be considered independent contractors. The U.S. Congress may seek to pass similar legislation at a national level across all 50 U.S. states. If additional states or the U.S. federal government pass similar legislation, we may be required to modify our hiring plans and associated business model, which may increase our cost of doing business.
In addition, in early 2019, the Supreme Court of India clarified that certain allowances paid by an employer to an employee should be included for purposes of calculating provident fund contributions in addition to contributions based on basic wages alone. If this decision is implemented with retrospective application, the amount of the payments that we are required to make at that time to or for the benefit of our employees could be substantial and could have a material adverse effect on our business, results of operations and financial condition.
In 2022, the Government of India is expected to make effective new labor codes, which, among other things, change the definition of wages for purposes of determining employer contributions under the provident fund and other statutory benefit schemes, including the Indian gratuity plan. As a result of this new legislation, our compensation cost in India may increase, which could adversely affect our profitability, results of operations and financial condition.
We may fail to attract and retain enough qualified employees to support our operations.
Our industry relies on large numbers of skilled employees, and our success and profitability depend on our ability to attract, train and retain a sufficient number of employees with the right mix of skills and experience to perform services for our clients. Historically, high employee attrition has been common in our industry. In 2021, our attrition rate for all employees who were employed for a day or more was 30%, an increase from our normalized historical attrition rate in the range of 26% to 28% (excluding 2020, which was an outlier due to the initial impact of the COVID-19 pandemic on the labor market). We cannot assure you that we will be able to reduce our level of attrition in the future or even maintain our attrition rate at the 2021 level. If our attrition rate increases beyond the 2021 level, our operating efficiency and productivity may decrease.
Competition for qualified employees, particularly in India and the United States, remains high and we expect such competition to continue. We compete for employees not only with other companies in our industry but also with companies in other industries, such as software services, engineering services and financial services companies. In many locations in which we operate, there is a limited pool of employees who have the mix of skills and experience we need to perform services for our clients. We must hire or reskill, retain and motivate appropriate numbers of skilled employees with diverse experience in order to serve clients across the globe, respond quickly to rapid and ongoing changes in demand for our services and new technologies, and continuously innovate to grow our business. If we are unable to hire or retrain our employees to keep pace with the rapid and continuous changes in technology and the industries we serve, we may not be able to innovate quickly enough and fulfill client demand. If our business continues to grow, the number of people we will need to hire will increase. We will also need to increase our hiring if we are not able to maintain our attrition rate through innovative recruiting and retention policies.total 2023 revenue.
In 2021,Data-Tech-AI Services
Our Data-Tech-AI services focus on designing and building solutions that harness the power of digital technologies, data and advanced analytics, AI, and cloud-based software-as-a-service (SaaS) offerings to help transform our clients’ businesses and operations. Using human-centric design, we faced increased competition for talent with scarce skillshelp clients build new products and capabilitiesservices, create digital workspaces, and drive customer, client, employee and partner engagement.
Revenues from our Data-Tech-AI services in new technologies,2023 were $1.99 billion, representing 45% of our total 2023 revenue.
Our service offerings
We offer the following professional services to our clients:
•Enterprise services: Finance and accounting, CFO advisory, supply chain, sourcing and procurement, sales and commercial, marketing and experience, and environmental, social and governance services; and
•Core industry operations services that are specific to our competitors have directly targeted our employees with these highly sought-after skills and will likely continuechosen industry verticals.
Enterprise services
Our enterprise services aim to do so. As a result, we may be unable to cost-effectively hire and retain employees with these market-leading skills, which may cause us to incur increased costs or be unable to fulfill client demanddeliver value for our clients through innovation and by leveraging our extensive experience optimizing processes for our clients. We partner with our clients to design target operating models, implement data, tech and AI-enabled solutions, improve process execution, and provide data and analytics-driven insights.
Finance and accounting services
We believe we are one of the world’s premier providers of finance and accounting services. Our focus is on delivering fast and high-quality results, minimizing exceptions, providing a seamless user experience, and making a working capital impact for our clients. We offer a comprehensive range of services in this area, including:
Accounts payable: Our accounts payable services include document management, vendor master data management, invoice receipt and processing, accuracy audits, reconciliations, aging analyses, help desk management, payments processing and travel and expense processing;
Invoice-to-cash: Our invoice-to-cash services include customer master data management, credit and contract management, data validation and credit worthiness assessments, billing, collections, accounts receivable maintenance and reporting, credit review support, bad debts research, accounts receivable reconciliation, and dispute and deduction management services;
Record to report: Our record to report services include closing and reporting process management, general accounting and industry-specific accounting services, treasury services, tax services, and solutions. Sustained competition for employees, or an increase in competition fromexternal reporting, including statutory accounting and reporting;
Financial planning and analysis: Our financial planning and analysis services include budgeting, planning and forecasting support, management reporting, business, financial and operational analytics, transformation design, digital-infused process enhancement, enterprise data and advisory services, master data management and data quality services and data lake implementation; and
Enterprise risk and compliance: Our enterprise risk and compliance services include operational risk and controls across a wide range of regulatory environments, including SOX and controls monitoring, controls transformation, ERP and digital controls, third party risk management, internal audit and audit analytics.
CFO advisory services
Our CFO advisory services aim to enable CFOs to optimize the heightened levels seen in 2021, couldimpact the finance organization can have an adverse effect on our ability to expand our businessa company's performance and service our clients,shareholder value creation. These services cover the entire finance value stream, including target operating model design, working capital optimization, operational finance transformation, as well as cause us to incur greater personnel expenses and training costs.
Our profitability will suffer if we are not able to price appropriately, maintain employee and asset utilization levels and control our costs.
Our profitability is largely a function of the efficiency with which we utilize our assets, and in particular our people and delivery centers, and the pricing that we are able to obtain for our services. Our utilization rates are affected by a number of factors, including our ability to transition employees from completed projects to new assignments, hire and assimilate new employees, forecast demand for our services and thereby maintain an appropriate headcount in each of our geographies and workforce and manage attrition, and our need to devote time and resources to training, professionalcorporate development and other typically non-chargeable activities. The prices we are able to charge for our services are affected by a number of factors, including our clients’ perceptions of our ability to add value through our services, competition, introduction of new services or products by us or our competitors, our ability to accurately estimate, attain and sustain revenues from client engagements, margins and cash flows over increasingly longer contract periods and general economic and political conditions. Therefore, if we are unable to price appropriately or manage our asset utilization levels, there could be a material adverse effect on our business, results of operations and financial condition. Our profitability is also a function of our ability to control our costs and improve our efficiency. As we increase the number of our employees and grow our business, we may not be able to manage the significantly larger and more geographically diverse workforce that may result and our profitability may not improve. New taxes may also be imposed on our servicesevent-driven initiatives, such as sales taxes or service taxes which could affect our competitiveness as well as our profitability. Additionally, we may fail to appropriately estimate our costs in agreeing to provide new or novelcarve-outs and post-merger integration services, with unique pricing arrangements or service delivery requirements.including transactional due diligence.
Supply chain, sourcing and procurement services
Supply chain:We enter into long-term contracts and fixed price contracts with our clients. Our failure to price these contracts correctly may negatively affect our profitability.
The pricing of our services is usually included in SOWs entered into withhelp our clients many of which are for terms of two to five years. In certain cases, we have committed to pricing over this period with only limited sharing of risk regarding inflationtransform process-led and currency exchange rates. In addition, we are obligated under some of our contracts totechnology-enabled operating models across the value chain (plan, source, make, deliver, productivity benefits to our clients. If we fail to estimate accurately future wage inflation rates, currency exchange rates or our costs, or if we fail to accurately estimateand aftersales). We cover the productivity benefits we can achieve under a contract, it could have a material adverse effect on our business, results ofcomplete supply chain operations reference model and financial condition.
A portion of our SOWs are currently billed on a fixed price basis rather than on a timeprovide services in critical areas such as supply chain resiliency, sustainable/circular supply chain and materials basis. We may also increase the number of fixed price contracts we perform in the future. Any failure to accurately estimate the resources or time required to complete a fixed price engagement or to maintain the required quality levels or any unexpected increase in the cost to us of employees, office space or technology could expose us to risks associated with cost overruns and could have a material adverse effect on our business, results of operations and financial conditions.
Our partnerships, alliances and relationships with third-party suppliers and contractors and other third parties with whom we do business expose us to a variety of risks that could have a material adverse effect on our business.
Our partnerships and alliances and our relationships with a variety of third parties, including suppliers, contractors and others, expose us to a variety of risks that could have a material adverse effect on our business, and we may not be successful in mitigating such risks. Our operations depend on our ability to anticipate our and our clients' needs for products and services, as well as our suppliers’ ability to deliver sufficient quantities and quality of products and services at reasonable prices and in time for us to meet commitments for the delivery of our own services. In addition, we must adequately address quality issues associated with our services, including with respect to any third-party components to our services. Any performance failure on the part of our partners or the third parties with whom we do business, or the discontinuance by such third parties or partners of services that we have relied on them to perform for our clients, could delay our performance or require us to engage alternative third parties to perform the services at our cost or to perform them ourselves, any of which could deprive us of potential revenue or adversely impact our profitability. Additionally, our partners, third-party suppliers and contractors and other third parties with whom we do business may not be able to comply with current good business practices or applicable laws or regulatory requirements.Our failure, or the failure of such third parties, to comply with applicable laws and regulations could result in sanctions being imposed on us, includingorchestrated enterprise.
fines, injunctions, civil penalties
Sourcing and criminal prosecutions, anyprocurement: We offer advisory and managed services across the direct and indirect procurement value chain, including strategic sourcing, responsible sourcing, category management, spend analytics, procurement operations and digital platform transformation.
Sales and commercial, marketing and experience services
Sales and commercial: We drive growth and experience for our clients by transforming and running the end-to-end sales lifecycle for our clients through services such as campaign management, lead generation, qualification and deductions. We also provide services in the areas of partner management and commercial operations, such as pricing and promotion optimization, and B2B customer experience, including order management, deductions and dispute management.
Marketing and experience: We enable our clients to drive growth by delivering transformational experiences that leverage our deep understanding of data, technology and process design. Our focus is to differentiate through operational transformation, generative AI enablement and improved experience across customers, employees and products, with data led insights. Our services in this area are supported by strategic partnerships with leading ecosystem providers in marketing and experience.
Environmental, social and governance services
We help our clients meet their sustainability objectives, environmental, social and governance (ESG) regulatory requirements, voluntary commitments and operational improvements. Our services in this area include advisory, data management and analytics, carbon accounting, responsible sourcing, sustainable supply chain, human rights assessment, sustainability diligence, sustainable technology, ESG reporting and limited assurance for ESG reporting.
Core industry operations
We help our clients design, transform and run processes that are specific to their industries. Using our industry and domain expertise embedded in our Digital SEP frameworks, we collaborate with our clients to power their operations in areas such as claims, underwriting, commercial leasing and lending, regulatory affairs, insurance actuarial, and trust and safety. We provide industry-specific operations services across all of our chosen industry verticals.
Industries we serve
We work with clients across our chosen industry verticals, which represent areas in which we believe we have deep industry acumen. Our chosen industry verticals, described in more detail below, are grouped within our three reportable segments, namely: (1) Financial Services, (2) Consumer and Healthcare, and (3) High Tech and Manufacturing.
Organizing our business by industry verticals allows us to leverage our deep domain knowledge specific to our chosen industries and create, replicate and standardize innovative solutions for clients in the same industries. In addition to our professional services, such as finance and accounting, CFO advisory, supply chain, sourcing and procurement, and sales and commercial, that are available to clients across our verticals, we offer core industry-specific services to clients in select verticals. These services are embedded where possible with industry-relevant digital and analytics tools that leverage AI and automation to drive enhanced benefits and customer experience.
Financial Services
Our Financial Services segment covers services we provide to clients in the banking, capital markets and insurance sectors. Our banking and capital markets clients include retail, investment and commercial banks, mortgage lenders, equipment and lease financing providers, fintech companies, payment providers, wealth and asset management firms, broker/dealers, exchanges, auto finance providers, clearing and settlement organizations, renewable energy lenders and other financial services companies. Our core operations services for these clients include retail customer onboarding, customer service, collections, card servicing operations, loan and payment operations, commercial loan servicing, equipment and auto loan servicing, mortgage origination and servicing, compliance services, risk management services, reporting and monitoring services and wealth management operations support. We provide financial crime and risk management services in areas such as fraud and dispute management, anti-money laundering, transaction monitoring, KYC and due diligence, sanctions screening, negative media monitoring and platform implementation.
Our insurance clients include insurers, brokers, agents, reinsurers and insurtech companies operating across property and casualty, specialty, life, annuity, disability and employee benefits lines of business. Our core operations services for these clients include underwriting support, new business processing, policy administration, customer service, claims management, catastrophe modeling and actuarial services. We also provide end-to-end third party administration for property and casualty claims.
Revenues from our Financial Services segment in 2023 were $1.23 billion, representing 27% of our total 2023 revenue.
Consumer and Healthcare
Our Consumer and Healthcare segment covers services we provide to clients in the consumer goods, retail, life sciences and healthcare sectors. Our consumer goods and retail clients include companies in the food and beverage, household goods, consumer health and beauty and apparel industries, as well as grocery chains and general and specialty retailers. The core operations services we provide to these clients include demand generation, sensing and planning, supply chain planning and management, pricing and trade promotion management, deduction recovery management, order management, digital commerce and customer experience.
Our life sciences and healthcare clients include pharmaceutical, medical technology, medical device and biotechnology companies as well as retail pharmacies, distributors, diagnostic labs, and healthcare payers (health insurers) and providers. Our core operations services for life sciences clients include regulatory affairs services, such as lifecycle management, regulatory operations, Chemistry Manufacturing Controls compliance and regulatory information management. Our services for healthcare clients include end-to-end claim lifecycle management, from claims processing and adjudication to claims recovery and payment integrity, revenue cycle management, health equity analytics, care services and customer experience.
Revenues from our Consumer and Healthcare segment in 2023 were $1.57 billion, representing 35% of our total 2023 revenue.
High Tech and Manufacturing
Our High Tech and Manufacturing segment covers services we provide to clients in the high tech hardware, high tech software and manufacturing sectors. Our clients in the high tech industry include companies in the information and digital technology, software, digital platform, electronics, semiconductor, enterprise technology, media, services and hospitality sectors. The core operations services we provide to these clients include industry-specific solutions for trust and safety, advertising sales support, customer and user experience, customer care support and supply chain management.
Our manufacturing clients include companies in the aerospace, automotive and mobility, chemicals, energy, electric vehicles and batteries, industrial machinery, materials transportation and logistics, oil and gas and utilities sectors. Our core operations solutions for these clients include industry-specific solutions for supply chain management, direct and indirect procurement, logistics, field, aftermarket support and engineering services.
Revenues from our High Tech and Manufacturing segment in 2023 were $1.68 billion, representing 38% of our total 2023 revenue.
Our clients
We serve approximately 800 clients across many industries and geographies. Our clients include some of the biggest brands in the world, many of which could significantlyare leaders in their industries, including about a quarter of the Fortune Global 500.
Our contracts with clients for Digital Operations services often take the form of a master services agreement ("MSA"), which is a framework agreement that we then supplement with statements of work ("SOWs") or other service level agreements, such as supplements, work orders, purchase orders or business services agreements. These SOWs and adversely affectother service level agreements cover in more detail the type of work to be performed and the associated amounts to be billed. For our business.Data-Tech-AI services, we typically enter into software-as-a-service and/or consulting agreements with our clients depending on the scope of the services to be performed. For more about our contracting frameworks, see Item 7—“Management’s Discussion and Analysis of Financial Condition and Results of Operations—Overview—Net Revenues.”
Partnerships and alliances
We may have limited control over the amountcontinue to invest in and timing of resources thatexpand our partners and third partiesstrategic alliances with whom we do business dedicate to their arrangements with us. Our ability to generate revenue from these arrangements will depend on our partners’ or other third parties’ desire and ability to successfully perform the functions assigned to them in these arrangements. Further, certain of our suppliers, partners and other contractors may decide to discontinue conducting business with us.
In addition, we are a party to a number of license agreements with third parties and expect to enter into additional licenses in the future. Our existing licenses impose, and we expect that future licenses will impose, various obligations and restrictions on us. If we fail to comply with these obligations and restrictions, the licensor may have the right to terminate the license, in which event we might not be able to market any product or service that is covered by these agreements, which could materially adversely affect our business. Termination of these license agreements or reduction or elimination of our licensed rights may result in our having to negotiate new or reinstated licenses with less favorable terms, or cause us to lose rights in important intellectual property or technology.
Any of the foregoing may prevent us from working with our partners or third parties with whom we do business and could subject us to losses, affect our ability to bring products and services to market, cause us to fail to satisfy our client obligations and harm our reputation.
We face legal, reputational and financial risks from any failure to protect client, Genpact or employee data from security incidents or cyberattacks.
In providing ourcompanies whose services and solutions complement ours. Together, we work to clients, we often collect, process and store proprietary, personally identifyingenhance our existing solutions or other sensitive or confidential client data. In addition, we collect, process and store data regarding our employees and contractors. As a result, we are subjectcreate new offerings to numerous data protection and privacy laws and regulations designed to protect this information in the countries in which we operate as well as the countries of residencemeet market needs.
Our alliances generally fall into one of the persons whose data we process. If any person, including any of our current or former employees or contractors, negligently disregards or intentionally breaches our or our clients’ established controls with respectfollowing categories:
• Strategic, go-to-market partnerships
• Deal-specific relationships to jointly solve a specific issue for a client third-party or Genpact data or if we do not adapt to changes in data protection legislation, we could be subject to significant litigation, monetary damages, regulatory enforcement actions, fines and/or criminal prosecution in one or more jurisdictions.
In addition, the products, services and software that we provide to our clients, or the third-party components we use• Reseller arrangements to provide such products, servicesthird party partner software and software, may contain or introduce cybersecurity threats or vulnerabilities to our clients’ information technology networks, intentionally or unintentionally. Our clients may maintain their own proprietary, sensitive, or confidential information that could be compromised in a cybersecurity attack, or their systems may be disabled or disrupted as a result of such an attack. Our clients, regulators, or other third parties may attempt to hold us liable, through contractual indemnification clauses or directly, for any such losses or damages resulting from such an attack.cloud solutions
The threat of incursion into our information systems and technology infrastructure has increased and evolved in recent years with the increasing number and sophistication of third parties who have hacked, attacked, held for ransom or otherwise disrupted or invaded information systems of other companies and misappropriated or disclosed data. We could also be impacted by cyberattacks by nation states or other organizations arising out of geopolitical tensions or conflicts, including, for instance, by Russia or Russian-based actors in connection with the evolving Russia/Ukraine conflict. We may be unable to anticipate the techniques used by threat actors to invade our systems and may not detect when an incursion has occurred or implement adequate preventative and responsive measures. The steps we have taken to protect our information systems and data security may be inadequate. If an actual or perceived breach of our security occurs, whether through breach of our computer systems, systems failure (including due to aged IT systems or infrastructure) or otherwise, the market perception of the effectiveness of our security measures and our reputation could be harmed and we could lose existing or potential clients. Media or other reports of perceived breaches or weaknesses in our systems, products or networks, even if nothing has actually been attempted or occurred, could also adversely impact our brand and reputation and materially affect our business.
Our clients, suppliers, subcontractors,• Digital and other third parties with whom we do business, including in particular cloud service providers and software vendors, generally face similar cybersecurity threats, and we must rely on the safeguards adopted by these parties. If these third parties do not have adequate safeguards or their safeguards fail, it might result in breaches of our systems or applications and unauthorized access to or disclosure of our and our clients’ confidential data. In addition, we are regularly alerted to vulnerabilities in third-party technology components we use in our business that create vulnerabilities in our environments. We typically are not aware of such vulnerabilities until we receive notice from the third parties who have created the exposure, and our responses to such vulnerabilities may not be adequate or prompt enough to prevent their exploitation.“white label” embedded technology-based relationships
We may also be liablehave three primary types of partners: consulting partners, digital partners, and solution partners. Our digital and solution partnerships aim to nurture relationships with established and emerging players in technology and AI. These potential partners specialize in leading-edge disruptive digital technologies and solutions that we can embed into our offerings or jointly bring to market.
Our people
As of December 31, 2023, we had approximately 129,100 employees working in more than 35 countries. As a talent-led organization, our people are critical to the success of our business. We have created, and constantly reinforce, a culture that emphasizes collaboration, innovation, process improvement, and dedication to our clients. We seek to foster a culture that wins clients, or othersdevelops leaders and attracts and retains talent who exhibit our core values – curiosity, incisiveness and courage – who embody and enable our purpose — the relentless pursuit of a world that works better for damages causedpeople — and who uphold our dedication to integrity consistent with our Code of Conduct, Integrity@Genpact.
Rewarding and recognizing our talent
We aim to create a work environment where every person is inspired to achieve, driven to perform and rewarded for their contributions. We strive to engage and competitively compensate our high-performing talent by disclosure of confidential information or system failures. Manyproviding performance-based promotions and merit-based compensation increases. In 2023, we promoted more than 13,000 of our contracts do not limitemployees and encouraged employee career growth through our potential liabilityDestination Growth program. We also closely monitor employee retention levels and regularly evaluate our pay-for-performance approach in an effort to retain our top talent.
Diversity, equity and inclusion
We believe that a culture of diversity, equity and inclusion is critical to our business. We believe in equal opportunity for breacheseach individual, irrespective of confidentiality.their gender, age, ethnicity, cultural background, race or sexual orientation. Understanding each other’s uniqueness, recognizing our differences, respecting varied opinions and accepting various points of view is at the heart of our organization’s culture. We maypromote these values by seeking to maintain inclusive hiring and management practices and ensure that opportunities are equally open to all.
We are committed to:
•Increasing diversity, including gender, racial and ethnic diversity, across all levels of the organization;
•Recruiting, retaining and advancing talent, including from diverse ethnic and racial backgrounds; and
•Creating and fostering an inclusive culture where everybody, including our LGBTQ+ employees, feels safe and empowered.
Employee development and engagement
We are committed to the career development of our employees and making them future-ready, and we strive to engage them with challenging and rewarding career opportunities. Our performance management approach supports our career philosophy by encouraging employees to reflect on their performance, set challenging goals, receive feedback, identify their development needs and find relevant learning and training opportunities. We have also be subject to civil actionsdeveloped a number of leadership development and criminal prosecution by governments or government agencies for breaches relating to such data. Our insurance coverage or indemnification protections for breaches or mismanagement of such data may not be adequate to cover all costs related to data loss, cybersecurity attacks, or disruptions resulting from such events, or they may not continue to be available on reasonable terms or in sufficient amounts to cover one or more large claims against usmentoring programs, including our Global Operations Leadership Development and our insurers may disclaim coverageLeadership Direct programs for high potential talent and our programs designed to increase gender diversity in our leadership ranks, such as our Pay it Forward and Women’s Leadership initiatives.
We have also developed a learning framework called Genome that enables our employees to anyacquire new skills and evolve quickly as industries and technologies change, equipping them with skills that are relevant to their current roles and future claims. The impactaspirations. Genome was designed to shape an adaptive workforce, and its learning strategy was formulated to “reskill at scale” and be integrated throughout the enterprise.
TalentMatch is our talent transformation initiative to match the skills and job aspirations of these cybersecurity attacks, data losses,our employees with existing and other security breaches cannot be predicted, but any such attack, loss or breach could disruptfuture job opportunities we have available. By enabling employees to prepare for their future career aspirations by upskilling and reskilling through Genome, TalentMatch has allowed us to identify talent available for redeployment from one part of our operations, orbusiness to another as the operationsneeds of our clients suppliers, subcontractors, or other third parties. Incidentschange. It improves our employee utilization globally by providing the right talent at the right time for our client engagements. TalentMatch also gives our employees the opportunity to take their careers in their desired directions, thus increasing employee satisfaction, and bolstering our ability to scale our flexible working model.In 2023, we filled more than 40% of this type could require significant management attentionour open positions with internal hires.
Amber, our engagement AI chatbot and resources, could result in the lossemployee experience platform, enables transformation of our employee engagement strategy. Amber provides an outlet for unbiased and judgment free conversations for our employees and live predictive people analytics for business regulatory enforcement and financial liability, and could harmHR leaders.
By digitizing how we engage with our reputation among our clients and the public, any of which could have a material adverse impact on our financial condition, results of operations, or liquidity.
Whileemployees through Amber, we have developedincreased the scope and implemented security measuresfrequency of employee feedback and internal controlshave gained the ability to assess employee engagement and identify trends in employee engagement and satisfaction across the company.
In 2023, we continued to invest in technologies and programs designed to prevent, detect and respondimprove employee experience, with a particular focus on employee well being.
Corporate social responsibility
Our approach to cyber and other security threats and incidents, such measures cannot guarantee security and may not be successfulcorporate social responsibility focuses on two pillars tied to our purpose: Better Access, which reflects our aim to provide the communities in preventing security breaches or in their timely detection or effective response. In the ordinary course of business,which we are subject to regular incursion attempts from a variety of sources, and we have experienced data security incidents such as inadvertent or unauthorized disclosures of data, including as a result of phishing or malware, and other unauthorizedoperate with better access to or usehealthcare, education and opportunities, and Better Planet, which reflects our aim to inform, educate, and catalyze action on the different facets of our systems or thosethe environment and climate change and help make the planet work better for all.
We foster a culture of third parties. To date such incidents have not had a material impact on our operations or financial results; however, there is no assurance that such impacts will not be material in the future.
Additionally, due to the COVID-19 pandemic, the majoritygiving and volunteering through several global platforms, projects, and social initiatives. More than 62,000 of our employees are now working from homehave volunteered their time to support a range of causes, such as mentoring underprivileged children and young adults, providing meals to food-insecure communities, planting saplings, and engaging in environments that are not subject to the same physical controls designed to prevent data breaches or losses as are presente-waste collection drives.
Additionally, in 2023 more than 5,000 of our employees participated in our officespayroll-based charitable donation programs, and delivery centers, which increases the risk of data breaches. Measures we have taken during the pandemic to implement suitable additional controls and educate our employees on the importance of cybersecurity, data loss prevention and related best practices may not prevent data breaches, the occurrence of which could have a material adverse impact on our business, reputation, financial condition, and results of operations.
Our business and results of operations have been adversely impacted and may in the future be adversely impacted by the COVID-19 pandemic.
The COVID-19 pandemic has had a widespread and detrimental effect on the global economy and has adversely impacted our business and results of operations. Because the severity, magnitude and duration of the COVID-19 pandemic and its economic consequences remain uncertain, rapidly changing and difficult to predict, the ultimate impact of the pandemic on our business, financial condition and results of operations is currently unknown.
The extent to which the COVID-19 pandemic will continue to adversely impact our business and results of operations will depend on future developments that are currently difficult to predict and outsidemany of our control, including: future variants of the COVID-19 virus and the severity of such variants; the availability and effectiveness of vaccines, including booster shots, and treatments for COVID-19 globally; the ultimate duration and scope of the pandemic; actions taken by governments and other parties,employee volunteers participated in virtual volunteering initiatives such as our clients, in responsecreating learning aids for students, awareness posters for non-profits, holiday cards for veterans, and completing at-home sustainability challenges to the pandemic, including any future actions to contain, treat or prevent the virus; the impact of the pandemic on economic activitybuild a better planet.
Sales and actions taken in response; the effect of the pandemic on our clients and client demand for our services and solutions; the ability of our clients to pay for our services and solutions on time or at all; our ability to sell and providemarketing
We market our services and solutions to both existing and potential clients through our business development team. Like our client portfolio, members of this team are based around the globe. Our business development team focuses both on supporting our strategic client accounts and prospects; and the ability of our employees to continue to be productive and maintain morale while working remotely.acquiring new clients.
We have enabled mostdesignated lead client partners and global relationship managers for each of our employeesstrategic client relationships. These business development personnel are supported by industry and capability subject matter experts to ensure our services and solutions best address the needs of our clients. We continuously monitor our client satisfaction levels to ensure that we maintain high service levels using metrics such as the Net Promoter Score.
The length of our selling cycle varies depending on the type of engagement. The sales cycle for our advisory and project work remotely duringis typically much shorter than the pandemic. This effort has posed, and continues to pose, numerous operational risks and logistical challenges, and has created new costs, diverted management attention and corporate resources, and amplified certain riskssales cycle for a large business process engagement. Our efforts may begin through an existing engagement with a client or in response to our lead generation program, a perceived opportunity, a reference by an existing client, a request for proposal or otherwise. Our teams seek to understand the needs and priorities of our clients as well as the business outcomes our clients desire, and we leverage our combination of capability and industry expertise to create differentiated client solutions. We may expend substantial time and resources in engaging with prospective clients to secure new business. See Item 7—“Management’s Discussion and Analysis of Financial Condition and Results of Operations—Overview—Net Revenues.”
As our relationship with a client deepens, the time required to win an engagement for additional services generally declines. In addition, during an engagement, as we better understand and experience a client’s business and processes, we are able to identify incremental opportunities to deliver greater value for the client, including increased: (a) demandby leveraging our expanding portfolio of digital capabilities to transform our clients’ operations.
We strive to foster relationships between our senior leadership team and our clients’ senior management teams. These “C-level” relationships ensure that both parties are focused on establishing priorities, aligning objectives and driving client value. High-level executive relationships present significant opportunities to increase business from our existing clients. These relationships also provide a forum for gathering feedback on service delivery performance and addressing client concerns. Our governance methodology is designed to ensure that we are well connected at all levels of our clients’ organizations (executive, management, technology and operations).
Significant new business opportunities are reviewed by business leaders, lead client partners and global relationship managers from the applicable industry vertical along with operations personnel and members of our finance department. If they determine that the new business is aligned with our strategic objectives and a good use of our resources, then our business development team is authorized to pursue the opportunity.
Global delivery
We serve our clients using our global network of more than 90 delivery centers in more than 25 countries. We have delivery centers in Argentina, Australia, Brazil, Bulgaria, Canada, China, Costa Rica, Egypt, Germany, Guatemala, Hungary, India, Israel, Italy, Japan, Malaysia, Mexico, the Netherlands, the Philippines, Poland, Portugal, Romania, Thailand, Turkey, the United Kingdom and the United States. We also have employees in these and additional countries, such as Ireland, Singapore and South Africa, who work with our clients either onsite or virtually, which offers flexibility for both clients and employees.
With this global network, we are able to manage complex processes around the world. We use different locations for different types of services depending on client needs and the mix of skills and cost of employees at each location.
Our global delivery model gives us:
•multilingual capabilities;
•access to a larger talent pool;
•“near-shoring” as well as off-shoring capabilities to take advantage of time zones; and
•proximity to our clients through a significant onshore presence.
We also regularly look for new places to open delivery centers and offices, both in new countries or new cities in countries where we already have a presence. Before we choose a new location, we consider several factors, such as the talent pool, infrastructure, government support, operating costs, and client demand.
Service delivery model
We seek to be a seamless extension of our clients’ operations. To that end, we developed the Genpact Virtual CaptiveSM service delivery model, in which we create a virtual extension of our clients’ teams and environments. Our clients get dedicated employees and management, as well as dedicated infrastructure at our delivery centers. We also train our teams in our clients’ cultures, processes, and business environments.
Intellectual Property
The solutions we offer our clients often include a range of proprietary methodologies, software, and reusable knowledge capital. We also develop intellectual property in the course of our business and our agreements with our clients regulate the ownership of such intellectual property. We seek to protect our intellectual property and our brand through various means, including by agreement and applications for patents, trademarks, service marks, copyrights and domain names. Some of our intellectual property rights are trade secrets and relate to proprietary business process enhancements.
As of December 31, 2023, we had a portfolio of more than 60 patents and pending patent applications globally. Additionally, we have over 200 trademarks registered in various jurisdictions.
We often use third-party and client software platforms and systems to provide our services. Our agreements with our clients normally include a license to use the client’s proprietary systems to provide our services. Clients authorize us to access and use third party software licenses held by the client so that we may provide our services.
It is our practice to enter into agreements with our employees and independent contractors that:
•ensure that all new intellectual property developed by our employees or independent contractors in the course of their employment or engagement is assigned to us;
•provide for employees’ and independent contractors’ cooperation in intellectual property protection matters even if they no longer work for us; and
•include a confidentiality undertaking by our employees and independent contractors.
Competition
We operate in a highly competitive and rapidly evolving global market. We have a number of competitors offering services that are the same as or similar to ours. Our competitors include:
•large multinational service providers, primarily accounting and consulting firms, that provide consulting and other professional services;
•companies that are primarily business process service providers operating from low-cost countries, most commonly India;
•companies that are primarily information technology service providers with some business process service capabilities; and
•smaller, niche service providers that provide services or products in a specific geographic market, industry or service area, including new AI and digital technologies.
We may also face losses or potential losses of business when in-house departments of companies use their own resources rather than engage an outside firm for the types of services and systemssolutions we provide.
Our business model is also subject to competitive forces from the advent of novel technology or applications of these technological capabilities made readily available in open-market environments.
Our revenues are derived primarily from Fortune Global 500 and Fortune 1000 companies. We believe that were initially designed for usethe principal competitive factors in our delivery centers only, (b) phishing, ransomwareindustry include:
• deep expertise in industry-specific domains and other cybersecurity attacks,processes;
• ability to advise clients on how to transform their processes and (c) data privacydeliver transformation that drives business value;
• ability to provide innovative services and security risksproducts, including digital offerings;
• ability to consistently add value through digital transformation and continuous process improvement;
• reputation and client references;
• contractual terms, including competitive pricing and innovative commercial models;
• scope of services;
• quality of products, services and solutions;
• ability to sustain long-term client relationships; and
• global reach and scale.
Our clients typically retain us on a non-exclusive basis.
Regulation
We are subject to regulation in many jurisdictions around the world as a result of the complexity of our employeesoperations and services, particularly in the countries where we have operations and where we deliver services. We are working from environments that lackalso subject to regulation by regional bodies such as the physical security controls in place in our offices and delivery centers. Any failure to effectively manage these risks, including to timely identify and appropriately respond to any cyberattacks, may adversely affect our business.European Union ("EU").
In addition, the first halfterms of 2021,our service contracts typically require that we comply with applicable laws and regulations. In some of our service contracts, we are contractually required to comply even if such laws and regulations apply to our clients, but not to us, and sometimes our clients require us to take specific steps intended to make it easier for them to comply with applicable requirements. In some of our service contracts, our clients undertake the Delta variant caused a devastating second wave of COVID-19responsibility to inform us about laws and regulations that may apply to us in Indiajurisdictions in which they are located.
If we fail to comply with any applicable laws and other jurisdictions whereregulations, we operate, and we experienced higher than normal levels of employee absenteeism due to illness or employees caring for family members who were sick. Although employee absenteeism related to COVID-19 has not yet had a material impactmay face restrictions on our ability to deliverprovide services, to our clients, future variants could lead to a higher rate,and may also be the subject of civil or more extended periods,criminal actions involving penalties, any of employee absenteeism, which could have a material adverse effect on our business, financial condition, resultsoperations. Our clients generally have the right to terminate our contracts for cause in the event of regulatory failures, subject in some cases to notice periods. See Item 1A—“Risk Factors—Risks Related to our Business and Operations—Our global operations and/or share price. In addition, manyexpose us to numerous and sometimes conflicting legal and regulatory requirements, and violations of these laws and regulations could harm our employees have experienced new or additional financial, family and health burdens because of the prolonged nature of the COVID-19 pandemic, and if these
burdens persist,business.” If we fail to comply with contractual commitments to facilitate our employees’ mental and physical health and engagement levels may be impacted. Our efforts to mitigate the negative impact of the COVID-19 pandemic on our business may not be effective, andclients’ compliance, we may be requiredliable for contractual damages, and clients in regulated industries may be less willing to take additional actions to protect the long-term health ofuse our business. services.
We may also beare affected by a protracted economic downturn.
Even after the COVID-19 pandemic has subsided, we may continue to experience negative impacts to our business as a result of the pandemic’s global economic impact. Further, as this pandemic is unprecedentedlaws and continuously evolving, it may also affect our operating and financial results in a manner that is not presently known to us or in a manner that we currently do not consider will present significant risks to us or our operations.
The COVID-19 pandemic has also led to significant volatility in financial markets, and has at times impacted, and may again impact, our share price and trading in our common shares. The overall uncertainty regarding the future economic impact of the COVID-19 pandemic and the impact on our revenue growth could also impact our cash flows from operations and liquidity. Material changes to our cash flows, liquidity and the volatility of the stock market and our share price could impact our capital allocation strategy, including our quarterly dividend and our share repurchase program. Asset impairment charges, extreme currency exchange-rate fluctuations and an inability to recover costs or lost revenues or profits from insurance carriers could all adversely affect us, our financial condition and our results of operations. Additionally, future disruptions and volatility in global and domestic capital markets could increase the cost of capital and limit our ability to access capital.
Any of the foregoing could also amplify the other risks and uncertainties outlined in this Annual Report on Form 10-K and could have a material adverse effect on our business, financial condition, results of operations and/or share price.
Our success largely depends on our ability to achieve our business strategies, and our results of operations and financial condition may suffer if we are unable to continually develop and successfully execute our strategies.
Our future growth, profitability and cash flows largely depend upon our ability to continually develop and successfully execute our business strategies. While we have confidence that our strategic plans reflect opportunities that are appropriate and achievable, the execution of our strategy may not result in long-term growth in revenue or profitability due to a number of factors, including incorrect assumptions, global or local economic conditions, competition, changesregulations in the industries in which we operate, sub-optimal resource allocation or any of the other risks described in this “Risk Factors” section. In pursuit of our growth strategy, we may also invest significant time and resources into new product or service offerings, and these offerings may fail to yield sufficient return to cover our investments in them. The failure to continually develop and execute optimally on our business strategies could have a material adverse effect on our business, financial condition and results of operations.
Business disruptions could seriously harm our future revenue and financial condition and increase our costs and expenses.
We have employees in more than 30 countries and significant operations in 22 countries, and these global operations could be disrupted at any time by natural or other disasters, telecommunications failures, power or water shortages, extreme weather conditions (whether as a result of climate change or otherwise), medical epidemics or pandemics (such as the COVID-19 pandemic) and other natural or manmade disasters or catastrophic events. The occurrence of any of these business disruptions could result in significant losses, seriously harm our revenue, profitability and financial condition, adversely affect our competitive position, increase our costs and expenses, and require substantial expenditures and recovery time in order to fully resume operations. In addition, global climate change may result in certain natural disasters occurring more frequently or with greater intensity, such as earthquakes, tsunamis, cyclones, drought, wildfires, sea-level rise, heavy rains and flooding, and any such disaster or series of disasters in areas where we have a concentration of employees, such as India, could significantly disrupt our operations and have a material adverse effect on our business, results of operations and financial condition.
Our operations could also be disrupted as a result of technological failures, such as electricity or infrastructure breakdowns, including damage to telecommunications cables, computer glitches and electronic viruses, or human-caused events such as protests, riots, labor unrest and cyberattacks. Such events, or any natural or weather-related disaster, could lead to the disruption of information systems and telecommunication services for sustained periods. Damage or destruction that interrupts our provision of services could adversely affect our reputation, our relationships with our clients, our leadership team’s ability to administer and supervise our business or it may cause us to incur substantial additional expenditure to repair or replace damaged equipment or delivery centers. Our operations and those of our significant suppliers and distributors could be adversely affected if manufacturing, logistics or other operations in these locations are disrupted for any reason, such as those listed above. Even if our operations are unaffected or recover quickly from any such events, if our clients cannot timely resume their own operations due to a catastrophic event, they may
reduce or terminate our services, which may adversely affect our results of operations. We may also be liable to our clients for disruption in service resulting from such damage or destruction.
Our business continuity and disaster recovery plans may not be effective at preventing or mitigating the effects of any of the foregoing business disruptions, particularly in the case of a catastrophic event. Prolonged disruption of our services would also entitle our clients to terminate their contracts with us. While we currently have commercial liability insurance, our insurance coverage may not be sufficient. Furthermore, we may be unable to secure such insurance coverage at premiums acceptable to us in the future or at all. Any of the above factors may have a material adverse effect on our business, results of operations and financial condition.
Our results of operations could be adversely affected by economic and political conditions and the effects of these conditions on our and our clients’ businesses and levels of business activity.
Global macroeconomic conditions affect our clients’ businesses and the markets they serve. Volatile, negative or uncertain economic conditions in our significant markets have in the past undermined and could in the future undermine business confidence in our significant markets or in other markets, which are increasingly interdependent, and cause our clients to reduce or defer their spending on new initiatives, or may result in clients reducing, delaying or eliminating spending under existing contracts with us, which would negatively affect our business. Growth in the markets we serve could be at a slow rate, or could stagnate or contract, in each case, for an extended period of time. Differing economic conditions and patterns of economic growth and contraction in the geographical regions in which we operate and the industries we serve have affected and may in the future affect demand for our services.
A material portion of our revenues and profitability is derived from our clients in North America and Europe. Weak demand in these markets could have a material adverse effect on our results of operations. Additionally, major political events, including the United Kingdom’s withdrawal from the European Union, or Brexit, create uncertainty for businesses such as ours that operate in these markets. We continue to examine the various possible impacts Brexit may have on our business and operating model. Any of the impacts of Brexit, or the final terms of the trade agreement betweenStates, the United Kingdom, the EU and the European Union, could adversely affect global economic conditions and the stability of global financial markets, which, in turn, could have a material adverse effect on our business, financial condition and results of operations. Additionally, broader global geopolitical tensions and actions that governments take in response may adversely impact us. For instance, in response to the rapidly developing conflict between Russia and Ukraine, the United Statesits member states, and other countries in which we operate have imposed and may further impose broad sanctions or other restrictive actions against governmental and other entities in Russia. We do not have employees or operations in Russia or Ukraine, but we have operations in surrounding countries, and we have clients that do business in Russia and Ukraine. Such clients may be adversely affected bythat are intended to limit the growing conflict and related sanctions and other governmental actions, which in turn could have an adverse impact on our revenues from such clients. Additionally, given the global nature of our operations, any protracted conflict or the broader macroeconomic impact of sanctions imposedoutsourcing on Russia could have an adverse impact on our business, profitability, results of operationsemployees in those jurisdictions, and financial condition.
Ongoing economic volatility and uncertainty and changing demand patterns, including as a result of the COVID-19 pandemic, affect our business in a number of other ways, including making it more difficultoccasional changes to accurately forecast client demand and effectively build our revenue and resource plans. Economic volatility and uncertainty are particularly challenging because it may take some time for the effects and changes in demand patterns resulting from these and other factors to manifest themselves in our business and results of operations. Changing demand patterns from economic volatility and uncertainty could have a significant negative impact on our results of operations.
Additionally, increased operating costs resulting from recent inflationary pressures, including increases in compensation, wage pressure, and other expenses for our employees, have adversely affected our profitability and could continue to do so. Broad-based inflation will also continue to increase the costs of operating our delivery centers, including, in particular, due to rising energy prices, which have been and may continue to be amplified by the developing conflict between Russia and Ukraine. We have not been able to, and may in the future be unable to, fully offset these cost increases by raising prices for our services, particularly because our client agreements generally fix our pricing for periods of time. This has resulted in and is expected to continue to result in downward pressure on our gross margins and operating income. Further, our clients may choose to reduce their business with us or cancel, defer or delay projects if we increase our pricing. If we are unable to successfully adjust pricing, reduce costs or implement other countermeasures, our profitability could be materially adversely affected.
Our business depends on generating and maintaining ongoing, profitable client demand for our services and solutions, and a significant reduction in such demand or an inability to respond to the evolving technological environment could materially affect our results of operations.
Our revenue and profitability depend on the demand for our services and solutions with favorable margins, which could be negatively affected by numerous factors, many of which are beyond our control and unrelated to our work product. Our success depends, in part, on our ability to continue to develop and implement services and solutions that anticipate and respond to rapid and continuing changes in technology and offerings to serve the evolving needs of our clients. Examples of areas of significant change include digital- and cloud-related offerings, which are continually evolving as developments such as AI, automation, Internet of Things and as-a-service solutions are commercialized. Technological developments such as these may materially affect the cost and use of technology by our clients and, in the case of as-a-service solutions, could affect the nature of how we generate revenue. Some of these technologies, such as cloud-based services, AI and automation, and others that may emerge, have reduced and replaced some of our historical services and solutions and may continue to do so in the future. This has caused, and may in the future cause, clients to delay spending under existing contracts and engagements and to delay entering into new contracts while they evaluate new technologies. Such delays can negatively impact our results of operations if the pace and level of spending on new technologies is not sufficient to make up any shortfall.
Developments in the industries we serve, which may be rapid, also could shift demand to new services and solutions. If, as a result of new technologies or changes in the industries we serve, our clients demand new services and solutions, we may be less competitive in these new areas or need to make significant investment to meet that demand. Our growth strategy focuses on responding to these types of developments by driving innovation that will enable us to expand our business into new growth areas. If we do not sufficiently invest in new technology and adapt to industry developments, or evolve and expand our business at sufficient speed and scale, or if we do not make the right strategic investments to respond to these developments and successfully drive innovation, our services and solutions, our results of operations, and our ability to develop and maintain a competitive advantage and to execute on our growth strategy could be negatively affected.
Companies in the industries we serve sometimes seek to achieve economies of scale and other synergies by combining with or acquiring other companies. If one of our current clients merges or consolidates with a company that relies on another provider for the services and solutions we offer, we may lose work from that client or lose the opportunity to gain additional work if we are not successful in generating new opportunities from the merger or consolidation.
Tax matters may have an adverse effect on our business, results of operations, effective tax rate and financial condition.
We are subject to income taxes in the United States and in numerous foreign jurisdictions, notably in India where we have substantial operations. Our provision for income taxes, actual tax expense and tax liability could be adversely affected by a variety of factors including, but not limited to, lower income before taxes generated in countries with lower tax rates; higher income generated in countries with higher tax rates; changes in tax laws and regulations in such jurisdictions may impose changes that further restrict or interpretations thereof; changes in applicable income tax treaties; changes in accounting principlesdiscourage offshore outsourcing or interpretations thereof or in the valuation of deferred tax assets and liabilities; the elimination or expiration of certain tax concessions, exemptions or holidays that had reducedotherwise harm our tax liability; and adverse outcomes of tax examinations or tax-related litigation, including a determination by any tax authority that our transfer prices are not appropriate. Additionally, changes in tax laws proposed by the Biden administration, if enacted, could negatively impact our effective tax rate. Any of these factors could have a material adverse effect on our business, results of operations, effective tax rate and financial condition.
We are subject to examination of our income tax returns by the U.S. Internal Revenue Service and tax authorities around the world, notably in India where we have substantial operations. Negative outcomes from those examinations or any appeals therefrom may adversely affect our provision for income taxes and tax liability, which in turn could have a material adverse effect on our business, results of operations, effective tax rate and financial condition. For example, the Government of India has appealed a 2011 ruling by the Delhi High Court that Genpact India Private Limited (one of our subsidiaries) cannot be held to be a representative assessee of GE in connection with an assertion that GE has tax liability in India by reason of a 2004 transfer of shares of our predecessor company. We believe that, if the Government of India is successful in its appeal, GE would be obligated to indemnify us for any resulting tax, though there can be no assurance as to the outcome of this matter.
In addition, the Government of India issued assessment orders to us in 2014, 2016 and 2019 seeking to assess tax on certain transactions that occurred in 2009, 2013 and 2015. We have received demands for potential tax claims related to these orders in an aggregate amount of $147 million, including interest through the date of the orders. We do not believe that the transactions should be subject to tax in India under applicable law and have accordingly not provided a reserve for
such exposure and have filed the necessary appeals. We have received favorable orders from appellate authorities relating to demands of $133 million and refunds of amounts that we previously paid toward these demands, including refunds of interest paid toward such demands. The tax authorities may appeal these orders in a higher court. In the event we do not prevail in these matters, the total amounts owed in connection with these demands would be subject to additional interest accrued over the period since the demands were made, and the amount of this additional interest could be material. There is no assurance that we will prevail in these matters or similar transactions, and a final determination of tax in the amounts claimed could have a material adverse effect on our business, results of operations, effective tax rate and financial condition.business. See Note 27—Item 1A—“Commitments and contingencies”Risk Factors—Risks Related to our consolidated financial statements under Part IV, Item 15—“ExhibitsBusiness and Financial Statement Schedules” for additional information relating to these matters.
Effective July 1, 2017, a GoodsOperations—Recent and Services Tax (“GST”) was introduced in India, replacing an existing service tax regimefuture legislation and multiple similar indirect taxes. The implementation of the GST continues to evolve, with the Government of India introducing regular amendments and issuing clarifications. In the second quarter of 2020, Indian tax authorities began challenging certain of our GST and service tax refunds in certain Indian states. We had requested these refunds pursuant to the tax exemption available for exports under service tax and GST regimes in respect of services performed by us in India for affiliates and clients outside of India. The Indian tax authorities have also initiated proceedings to examine the availability of the tax exemption claimed in respect of export of services under the service tax regime that preceded the current GST regime. In denying the refunds and initiating these proceedings, the taxing authorities have taken the position that the services we provided are local services, which interpretation, if correct, would make the service tax and GST exemptions we have claimed on exports unavailable to us in respect of such services. We believe that the denial of the service tax and GST exemptions is incorrect, and we are pursuing appeals before relevant appellate authorities. The Government of India has issued a clarification which supports our position and we believe that the appellate authorities will reverse the earlier orders. If it is finally determined that we do not qualify for the service tax and GST exemptions on the services we provide in India for clients located outside of India, we could be subject to additional tax on all of such services at a rate of 18%. The imposition of this additional tax on a significant percentage of the services we perform or have performed in India would likely have a material adverse effect on our profitability and cash flows and could also have a material adverse effect on our business, financial condition and results of operations.
Furthermore, there is growing pressure in many jurisdictions, including the United States, and from multinational organizations such as the Organization for Economic Cooperation and Development, or the OECD, and the EU to amend existing international tax rules in order to render them more responsive to current global business practices. For example, the OECD has published a package of measures for reform of the international tax rules as a product of its Base Erosion and Profit Shifting, or the BEPS, initiative, which was endorsed by the G20 finance ministers. The new global tax framework is a two-pillar plan. The plan proposes the reallocation of global profits of large multinational companies to market jurisdictions, as well as the introduction of a global minimum tax. Many of the package’s proposed measures require amendments to the domestic tax legislation of various jurisdictions. Separately, the EU is asserting that a number of country-specific favorable tax regimes and rulings in certain member states may violate, or have violated, EU law, and may require rebates of some or all of the associated tax benefits to be paid by benefitted taxpayers in particular cases. The EU recently proposed and adopted Anti-Tax Avoidance Directives which require EU member states to implement measures to prohibit tax avoidance practices.
In addition, in December 2017, the Tax Cuts and Jobs Act (the “Tax Act”) became law in the U.S., bringing about far-ranging changes to the existing corporate tax system. The Tax Act requires complex computations not previously required. As regulations and guidance evolve with respect to the Tax Act, our results may differ from previous estimates and our tax liabilities may materially increase. See “Future legislation or executive action in the United States and other jurisdictions could significantly affect the ability or willingness of our clients and prospective clients to utilize our services” below in this “Risk Factors” section.
The global tax environment is increasingly complex and uncertain. Although we monitor these developments, it is very difficult to assess to what extent changes and other proposals, if enacted, may be implemented in the United States and other jurisdictions in which we conduct our business or may impact the way in which we conduct our business or our effective tax rate due to their unpredictability and interdependency. As these and other tax laws and related regulations and practices change, those changes could have a material adverse effect on our business, results of operations, effective tax rate and financial condition.
We may be subject to claims and lawsuits for substantial damages, including by our clients arising out of disruptions to their businesses or our inadequate performance of services.
We depend in large part on our relationships with clients and our reputation for high-quality services to generate revenue and secure future engagements. Most of our service contracts with clients contain service level and performance requirements, including requirements relating to the quality of our services. Failure to consistently meet service requirements of a client, whether due to: (a) natural or other disasters, telecommunications failures, power or water shortages, extreme weather conditions (whether as a result of climate change or otherwise), medical epidemics, pandemics”
or other contagious diseases (such as COVID-19) or other natural or manmade disasters or catastrophic events; (b) breach of or incursion into our computer systems (for example, through a ransomware attack); (c) other systems failure, including due to aged IT systems or infrastructure; or (d) errors made by our employees in the course of delivering services to our clients could disrupt the client’s business and result in a reduction in our revenues, clients terminating their business relationships with us and/or a claim for damages against us. Additionally, we could incur liability if a process we manage for a client were to result in internal control failures or impair our client’s ability to comply with its own internal control requirements.
We are also subject to actual and potential claims, lawsuits, investigations and proceedings outside of errors and omissions claims. For example, we engage in trust and safety services on behalf of clients, including content moderation, which could have a negative impact on our employees performing such services due to the nature of the materials they review. These types of services have been the subject of negative media coverage as well as litigation, and we may face adverse judgments or settlements or damage to our brand or reputation as a result of our provision of these services.
Under our MSAs with our clients, our liability for breach of our obligations is generally limited to actual damages suffered by the client and is typically capped at an agreed amount. These limitations and caps on liability may be unenforceable or otherwise may not protect us from liability for damages. In addition, certain liabilities, such as claims of third parties for which we may be required to indemnify our clients or liability for breaches of confidentiality, are generally not limited under those agreements. Our MSAs are governed by laws of multiple jurisdictions, therefore the interpretation of such provisions, and the availability of defenses to us, may vary, which may contribute to the uncertainty as to the scope of our potential liability. Although we have commercial general liability insurance coverage, the coverage may not continue to be available on acceptable terms or in sufficient amounts to cover one or more large claims and our insurers may disclaim coverage as to any future claims.
The successful assertion of one or more large claims against us that exceed available insurance coverage, or changes in our insurance policies (including premium increases or the imposition of large deductible or co-insurance requirements), could have a material adverse effect on our reputation, business, results of operations and financial condition. It is also possible that future results of operations or cash flows for any particular quarterly or annual period could be materially adversely affected by an unfavorable resolution of these matters. In addition, these matters divert management and personnel resources away from operating our business. Even if we do not experience significant monetary costs, there may be adverse publicity or social media attention associated with these matters that could result in reputational harm, either to us directly or to the industries or geographies we operate in, that may materially adversely affect our business, client or employee relationships. Further, defending against these claims can involve potentially significant costs, including legal defense costs.
Future legislation or executive action in the United States and other jurisdictions could significantly affect the ability or willingness of our clients and prospective clients to utilize our services.
In the United States, federal and state measures aimed at limiting or restricting, or requiring disclosure of offshore outsourcing have been occasionally proposed and enacted. In addition, public figures in the United States have from time to time suggested that U.S. businesses be subjected to tax or other adverse consequences for outsourcing, with incentives for returning outsourced operations to the United States, although it is not known what specific measures might be proposed or how they would be implemented and enforced, or whether emerging or enacted tax reform or other near-term Congressional action will affect companies’ outsourcing practices. There can be no assurance that pending or future legislation or executive action in the United States that would significantly adversely affect our business, results of operations, and financial condition will not be enacted.
Legislation enacted in certain European jurisdictions and any future legislation in Europe, Japan or any other region or country in which we have clients restricting the performance of business process services from an offshore location or imposing burdens on companies that outsource data processing functions could also have a material adverse effect on our business, results of operations and financial condition. For example, there are unresolved questions about the legal mechanisms for transferring personal data from the EU to other countries. The Court of Justice of the European Union, or the CJEU, has invalidated the EU-U.S. Privacy Shield framework, one of the mechanisms that had been used to legitimize the transfer of personal data from the European Economic Area, or EEA, to the United States, and has also generated doubt about the legal viability of the standard contractual clauses that have provided an alternative means for such data transfers from the EEA to the United States. These developments could lead to increased scrutiny on data transfers from the EU to the U.S. generally and could increase our data privacy compliance costs and our costs for implementing privacy and data security arrangements with our vendors and business partners.
With the withdrawal of the United Kingdom, or UK, from the EU, known as Brexit, the UK’s Data Protection Act 2018 governs the processing of personal data in the UK and imposes obligations comparable to those imposed by the EU’s General Data Protection Regulation, or GDPR. It remains unclear whether transfers of data from the EEA to the UK will remain lawful under GDPR.
Moreover, legislation enacted in the UK and by many EU countries provides that if a company outsources all or part of its business to a service provider or changes its current service provider, the affected employees of the company or of the previous service provider are entitled to become employees of the new service provider, generally on the same terms and conditions as their original employment. In addition, dismissals of employees who were employed by the company or the previous service provider immediately prior to that outsourcing, if the dismissals resulted solely or principally from the outsourcing, are automatically considered unfair dismissals that entitle such employees to compensation. As a result, to avoid unfair dismissal claims we may have to offer, and become liable for, voluntary redundancy payments to the employees of our clients in the UK and other EU countries who have adopted similar laws who transfer business to us. Additionally, the UK’s exit from the EU and the associated changes in trade relations could result in increased costs, delays, and regulatory complexity in our business involving the UK.
Our global operations expose us to numerous and sometimes conflicting legal and regulatory requirements, and violations of these laws and regulations could harm our business.
We are subject to, or subject to contractual requirements to comply with or facilitate our clients’ compliance with, numerous, and sometimes conflicting, legal regimes on matters such as anticorruption, import/export controls, trade restrictions, taxation, immigration, internal and disclosure control obligations, securities regulation, anti-competition, data privacy and protection, wage-and-hour standards, and employment and labor relations. Our clients’ business operations are also subject to numerous regulations, and our clients may require that we perform our services in compliance with regulations applicable to them or in a manner that will enable them to comply with such regulations.
The global nature of our operations increases the difficulty of compliance. Compliance with diverse legal requirements is costly, time-consuming and requires significant resources. Violations of one or more of these regulations in the conduct of our business could result in significant fines, criminal sanctions against us and/or our employees, prohibitions on doing business, breach of contract damages and harm to our reputation. Due to the varying degrees of development of the legal systems of the countries in which we operate, local laws may not be well developed or provide sufficiently clear guidance and may be insufficient to protect our rights.
In particular, our collection, use, disclosure and retention of personal health-related and other information is subject to an array of privacy, data security, and data breach notification laws and regulations that change frequently, are inconsistent across the jurisdictions in which we do business, and impose significant compliance costs. Changes in these laws and regulations and inconsistencies in the standards that apply to our business in different jurisdictions may impose significant compliance costs, reduce the efficiency of our operations, and expose us to enforcement risks.
In the United States, all 50 states, the District of Columbia, Guam, Puerto Ricopersonal information is subject to numerous federal and the Virgin Islands have enacted legislation requiring noticestate laws and regulations relating to individuals of security breaches of information involving personally identifiable information. In addition, several U.S. states have enacted data privacy, laws that impose varying privacy and data security obligations on companies and grant individuals residing in those states certain rights as data subjects, and legislation has been proposed in several more states. In addition, some states have passed laws imposing increased data security, and breach notification, obligations onincluding, for example, the Financial Modernization Act (sometimes referred to as the Gramm-Leach-Bliley Act), Health Insurance Portability and Accountability Act, Federal Trade Commission Act, Family Educational Rights and Privacy Act, Communications Act, Electronic Communications Privacy Act, and state-level comprehensive privacy laws, including the California Consumer Privacy Act. There are also various state-level privacy laws that specifically regulate consumer health data, including recently enacted laws in Connecticut, Nevada and Washington.
All fifty U.S. states and the District of Columbia have implemented separate data security breach notification laws with which we must comply, and some states have added specific data security standards to their existing laws.
Some courts have become more willing to allow individuals to pursue claims in data breach cases, indicating that it may become easier for consumers to sue companies operating infor data breaches. Related laws and regulations govern our direct marketing activities and our use of personal information for direct marketing, including the Telemarketing and Consumer Fraud and Abuse Prevention Act, Telemarketing Sales Rule, Telephone Consumer Protection Act and rules promulgated by the Federal Communications Commission, and CAN-SPAM Act. In 2018, the Clarifying Lawful Overseas Use of Data (CLOUD) Act established new required processes and procedures for handling U.S. law enforcement requests for data that we may store outside of the U.S.
In the EU, the General Data Protection Regulation (GDPR) went into effect in May 2018. The GDPR imposes privacy and data security compliance obligations and significantincreased penalties for noncompliance. TheIn particular, the GDPR presentshas introduced numerous privacy-related changes for companies operating in the EU, including rights guaranteed togreater control for data subjects, requirements forincreased data portability for EU consumers, data breach notification requirements and significantincreased fines for noncompliance. Inviolations. The GDPR enforcement matters,also prohibits the transfer of personal data from the European Economic Area (“EEA”) to countries outside of the EEA unless made to a country deemed to have adequate data privacy laws by the European Commission or an appropriate data transfer mechanism has been put in place. The EU-US Privacy Shield (“Privacy Shield”) was such a transfer mechanism put in place between the EU and the United States, but the Privacy Shield was invalidated in July 2020 by the Court of Justice of the European Union (the “CJEU”). The EU-U.S. Privacy Shield has now been replaced with the EU-U.S. Data Privacy Framework (“DPF”), which is intended to address the issues cited in the 2020 CJEU decision. Although the European Commission issued an adequacy decision for the DPF on July 10, 2023, and it is now a valid mechanism for transferring personal data from the EU to the U.S. for entities that have elected to participate, the validity of the DPF may also be challenged in court, which could create additional uncertainty relating to the regulation of international data transfers. The CJEU’s decision also led to revisions to the standard contractual clauses (“SCCs”) that may also be used as a mechanism for transferring personal data outside of the EU. If the DPF is challenged, there may be new uncertainty regarding the validity of the updated SCCs.
Following the withdrawal of the UK from the EU, the United Kingdom has amended the UK Data Protection Act 2018 to retain the GDPR in UK national law. The penalties prescribed in the UK GDPR are the same as under the EU GDPR. However, the United Kingdom has implemented its own guidance for handling outbound data transfers to jurisdictions such as the U.S. whose privacy laws are not covered by an existing adequacy decision, has adopted an International Data Transfer Agreement as a framework for companies have faced fines for violationsto transfer personal data outside of certain provisions. Fines can reach as high as 4%the United Kingdom, and has implemented its own version of a company’s annual total revenue, potentially includingDPF, called the revenue of a company’s international affiliates. UK-U.S. Data Bridge, to allow participating companies to transfer personal data from the UK to the U.S.
Additionally, foreign governments outside of the EU and UK are also taking steps to fortify their data privacy laws and regulations. For example, someIndia recently enacted a data protection law that may affect how we handle vendor and employee data in India. Other countries in Africa, Asia and Latin America including Brazil and Egypt, where we have operations, have implementedeither passed data privacy legislation or are considering GDPR-like data protection laws. Evolving laws and regulations in India protecting the use of personal information could also impact our engagements with clients, vendors and employees in India. The legislation currently being considered in India relates to the regulation of cross-border transfers of sensitive personal information and has potentially broad-reaching implications in the backdrop of cloud computing. Given the size and scope of our operations in India, the costs of compliance with Indian data privacy laws, and any finesthat affect or penalties for breaches thereof, could be significant and could have a material adverse effect on our business, financial condition and results of operations.may affect us. As privacy laws and regulations around the world continue to evolve, these changes and others could adversely affect our business operations, websites and mobile applications that are accessed by residents in the applicable countries.
In the United States, we are either directly subject to, or contractually required to comply or facilitate our clients’ compliance with, laws and regulations arising out of our work for clients operating there, especially in the area of banking, financial services and insurance, such as the Gramm-Leach-Bliley Act, the Fair Credit Reporting Act, the Fair and Accurate Credit Transactions Act, the Right to Financial Privacy Act, the Bank Secrecy Act, the USA PATRIOT Act, the Bank Service Company Act, the Home Owners Loan Act, the Electronic Funds Transfer Act, the Equal Credit Opportunity Act, and regulation by U.S. agencies such as the SEC, the Federal Reserve, the Federal Deposit Insurance Corporation, the National Credit Union Administration, the Commodity Futures Trading Commission, the Federal Financial Institutions Examination Council, the Office of the Comptroller of the Currency, and the Consumer Financial Protection Bureau.
In addition, in many parts of the world, including countries in which we operate and/or seek to expand, common practices in the local business community might not conform to international business standards and could violate anticorruption laws or regulations, including the U.S. Foreign Corrupt Practices Act and the UK Bribery Act 2010. Our employees, subcontractors, agents, joint venture partners, the companies we acquire and their employees, subcontractors and agents, and other third parties with which we associate, could take actions that violate policies or procedures designed to promote legal and regulatory compliance or applicable anticorruption laws or regulations. Violations of these laws or regulations by us, our employees or any of these third parties could subject us to criminal or civil enforcement actions (whether or not we participated or knew about the actions leading to the violations), including fines or penalties, disgorgement of profits and suspension or disqualification from work, any of which could materially adversely affect our business, including our results of operations and our reputation.
GE has historically accounted for a significant portionBecause of our revenues and any material loss of business from, or our failure to maintain relationships with, GE and former GE businesses could have a material adverse effect on our business, results of operations and financial condition.
Historically, we have derived a significant portion of our revenues from GE. In 2019, 2020 and 2021, GE accounted for 14%, 12% and 9% of our revenues, respectively. In November 2021, GE announced its intention to divide into three independent public companies. This restructuring is expected to be achieved through a series of transactions that include GE spinning off its GE Healthcare business in 2023, combining its GE Renewable Energy, GE Power and GE Digital businesses into a single business and then spinning off that business in 2024, and GE continuing as an aviation-focused company following the completion of the spin-offs. In the past, GE has divested businesses we served, including a significant portion of its GE Capital business, and we have entered into contracts with several divested GE businesses. We intend to continue to make efforts to procure contracts with GE and the former GE businesses; however, there can be no assurance that we will be able to continue to procure any such contracts following GE’s completion of its restructuring or that such contracts would be on favorable terms. GE is not obligated to provide us with any exclusivity or opportunity todebt collections work on GE projects and GE is not required to purchase a minimum amount of services from us. In addition, GE has the right to terminate our services in whole or in part for any reason by providing us with a short period of advance notice. Any material loss of business from, or failure to maintain relationships with, GE or any former GE business following completion of the GE restructuring could have a material adverse effect on our business, results of operations and financial condition. See Item 7—“Management’s Discussion and Analysis of Financial Condition and Results of Operations—Overview—Net Revenues” for further information regarding our relationship with GE.
Our revenues are highly dependent on clients located in the United States, we are also regulated by laws such as the Truth in Lending Act, the Fair Credit Billing Act, the Fair Debt Collection Practices Act, the Telephone Consumer Protection Act and Europe, as well as on clients that operaterelated regulations. We are currently licensed to engage in certain industries.
In 2021, more than 70% of our revenues were derived from clients baseddebt collection activities in North America and more than 15% of our revenues were derived from clients based in Europe. Additionally, in 2021, more than 25% of our revenues were derived from clients in the financial services and insurance industries.
The COVID-19 pandemic has adversely affected economic activityall jurisdictions in the United States where licensing is required. U.S. banking and Europedebt collection laws and activity in certain industries in whichtheir implementing regulations are occasionally amended, and these changes may impose new obligations on us or may change existing obligations.
Because of our clients operate. In addition, a number of other factors could adversely affect our ability to do businessinsurance processing activities in the United States, or Europe, which could in turn have a material adverse effect on our business, results of operations and financial condition. For example, Brexit has created, and continues to create, political and economic uncertainty about the future relationship between the UK and the EU and as to whether any other European countries may similarly seek to exit the EU. We have operations in the UK and a number of countries in the EU and our global operations serve clients with operations in these regions, andwe are currently licensed as a result our business, financial conditionthird-party administrator in 43 states and results of operations may be impacted by such uncertainty andare regulated by the termsdepartment of insurance in each such state. In two other states, we qualify for regulatory exemption from licensing based on the UK’s withdrawal frominsurance processing activities we provide. We also hold entity adjuster licenses in 24 states that require licensing.
Certain laws may apply to our content moderation activity, such as laws regulating hate speech on the EU.
Any further deterioration in economic activity ininternet. In the United States, Section 230 of the Communications Decency Act shields “interactive computer services” (e.g., websites, social media platforms) from liability for the speech of their users, with certain exceptions.
The law also shields interactive computer services from civil liability for a good faith action voluntarily taken to restrict access to or Europe,availability of content that the provider or in industries in whichuser considers to be obscene, lewd, lascivious, filthy, excessively violent, harassing, or otherwise objectionable, whether or not such material is constitutionally protected. The future of Section 230 and the scope of the protections it provides to online publishers and other laws related to bullying, harassing, offensive materials and hate speech on the internet are currently the topic of significant debate. We expect that these laws will continue to evolve and change. Changes to the laws and regulations governing liability for speech on the internet may affect the business strategies and offerings of our clients, operate, could adversely affect demand for our services, thus reducing our revenue. Increased regulation, changes in existing regulation or increased government intervention in the industries in which our clients operate may adversely affect growth in such industriessignificantly change their approach to content moderation, and therefore have an adverse impact on our revenues. Any of the foregoing factors could have a material adverse effect on our business, results of operations and financial condition.
We may face difficulties in providing end-to-end business solutions or delivering complex, large or unique projects for our clients that could cause clients to discontinue their work with us, which, in turn, could harm our business and our reputation.
We continue to expand the nature and scope of our engagements, including by incorporating digital solutions that use social, mobility, big data and cloud-based technologies. Our ability to effectively offer a wide range of business solutions depends on our ability to attract existing or new clients to new service offerings, andreduce the market for our solutions is highly competitive. We cannot be certain that our new service offerings will effectively meet client needs or that we will be able to attract clients to these service offerings. The complexity of our new service offerings, our inexperience in developing or implementing them,trust and significant competition in the markets for these services may affect our ability to market these services successfully.safety related services.
In addition, the breadth of our existing service offerings continues to result in larger and more complex projects with our clients, which have risks associated with their scope and complexities, including our reliance on alliance partners and other third-party service providers in implementing and delivering these projects. Our failure to deliver services that meet the requirements specified by our clients could result in termination of client contracts, and we could be liable to our clients for significant penalties or damages or suffer reputational harm. Larger projects may involve multiple engagements or stages, and there is a risk that a client may choose not to retain us for additional stages or may cancel or delay additional planned engagements. These terminations, cancellations or delays may result from factors that have little or nothing to do with the quality of our services, such as the business or financial condition of our clients or the economy generally. Such cancellations or delays make it difficult to plan for project resource requirements and inaccuracies in such resource planning and allocation may have a negative impact on our profitability.
From time to time we also enter into agreements that include unique service level delivery requirements or novel pricing arrangements with which we have no experience and that may be unique in the industry. These projects can include performance targets that become more rigorous over the term of the contracts and service delivery components that are partially subjective by design, and we may be unable achieve such targets or to satisfy our clients’ expectations in delivering such services. Our failure to deliver such engagements to our clients’ expectations could result in termination of client contracts, and we could be liable to our clients for penalties or damages or suffer reputational harm. We may also discover that we have not priced such engagements appropriately, which could adversely affect our profitability and results of operations.
Currency exchange rate fluctuations in various currencies in which we do business, especially the Indian rupee, the euro and the U.S. dollar, could have a material adverse effect on our business, results of operations and financial condition.
Most of our revenues are denominated in U.S. dollars, with the remaining amounts largely in euros, UK pounds sterling, the Australian dollar, the Japanese yen and the Indian rupee. Most of our expenses are incurred and paid in Indian rupees, with the remaining amounts largely in U.S. dollars, Chinese renminbi, Romanian lei, euros, UK pounds sterling, Philippine pesos, Japanese yen, Polish zloty, Mexican pesos, Guatemalan quetzals, Hungarian forint, Canadian dollars and Australian dollars. As we expand our operations to new countries, we will incur expenses in other currencies. We report our financial results in U.S. dollars. The exchange rates between the Indian rupee, the euro and other currencies in which we incur costs or receive revenues, on the one hand, and the U.S. dollar, on the other hand, have changed substantially in recent years and may fluctuate substantially in the future. See Item 7A—“Quantitative and Qualitative Disclosures about Market Risk.”
Our results of operations could be adversely affected over time by certain movements in exchange rates, particularly if the Indian rupee or other currencies in which we incur expenses appreciate against the U.S. dollar or if the currencies in which we receive revenues, such as the euro, depreciate against the U.S. dollar. Although we take steps to hedge a substantial portion of our foreign currency exposures, there is no assurance that our hedging strategy will be successful or that the hedging markets will have sufficient liquidity or depth for us to implement our strategy in a cost-effective manner. In addition, in some countries, such as India, China, Romania and the Philippines,United States, we are subject to legal restrictions on hedging activities,laws and regulations governing foreign trade, such as wellexport control, customs and sanctions regulations maintained by government bodies such as convertibilitythe Commerce Department’s Bureau of currencies, which could limit our abilityIndustry and Security, the Treasury Department’s Office of Foreign Assets Control, and the Homeland Security Department’s Bureau of Customs and Border Protection. Other jurisdictions, such as the EU, also maintain similar laws and regulations that apply to use cash generated in one country in another country and could limit our ability to hedge our exposures. Finally, our hedging policies only provide near term protection from exchange rate fluctuations. If the Indian rupee or other currencies in which we incur expenses appreciate against the U.S. dollar, we may have to consider additional means of maintaining profitability, including by increasing pricing, which may or may not be achievable. See also Item 7—“Management’s Discussion and Analysis of Financial Condition and Results of Operations—Overview—Net Revenues—Foreign exchange gains (losses), net.”
Restrictions on entry or work visas may affect our ability to compete for and provide services to clients, which could have a material adverse effect on our business and financial results.
A portion of our business depends on the ability of our employees to obtain the necessary visas and work permits to provide services in the countries where our clients and, in some cases, our delivery centers, are located. In recent years, in
response to terrorist attacks, the COVID-19 pandemic and related border controls, global unrest and political rhetoric, immigration authorities generally, and those in the United States in particular, have increased the level of scrutiny in granting visas. If the COVID-19 pandemic persists for an extended period, further terrorist attacks occur, global unrest intensifies, or nationalistic political trends continue, then obtaining visas for our personnel may become even more difficult. For instance, some of our employees have faced extensive delaysoperations.
Several of our service delivery centers, primarily located in obtaining work visas,China, Costa Rica, India, Israel, Malaysia and the Philippines, benefit from tax incentives or have been unable to obtain such visas, due to the suspension of regular visa services at U.S. consulates globally during the ongoing COVID-19 pandemic.
Local immigrationconcessional rates provided by local laws may also require us to meet certain other legal requirements as a condition to obtaining or maintaining entry or work visas. Countries where our clients may be located, including the United States, may through legislation or regulation restrict the number of visas or entry permits available. In general, immigration laws are subject to legislative change and varying standards of application and enforcement due to political forces, economic conditions, terrorist attacks or other events.regulations. In addition, there is uncertainty with respect to immigration laws and standards in the United States as the administration of the current U.S. President has pursued legislation and policy changes to reform U.S. immigration laws and to reverse some immigration policies of the prior administration. In recent years, the United States has broadly prohibited immigrant visas of applicants from, or imposed travel bans on travelers from, several designated countries, and it is not currently known what, if any, visa or travel restrictions might be proposed in the future or how they would be implemented or enforced.
Our senior leadership team is critical to our continued success and the loss of such personnel could harm our business.
Our future success substantially depends on the continued service and performance of the members of our senior leadership team. These personnel possess business and technical capabilities thatcertain benefits are difficult to replace. Our employment agreements with our Chief Executive Officer and other members of our executive management team do not obligate them to work for us for any specified period. In the past, members of our leadership team have left the Company to pursue other opportunities. If we lose key members of our senior leadership team, we may not be able to effectively manage our current operations or meet ongoing and future business challenges, and this may have a material adverse effect on our business, results of operations and financial condition.
We may be unable to service our debt or obtain additional financing on competitive terms.
On August 9, 2018, we entered into an amended and restated five-year credit agreement with certain financial institutions as lenders which replaced our prior credit facility. The amended and restated credit agreement provides for a $680 million term credit facility and a $500 million revolving credit facility, each of which may be increased subject to certain conditions. The credit agreement obligations are unsecured, and guaranteed by certain subsidiaries. As of December 31, 2021, the total amount due under the credit facility, including the amount utilized under the revolving facility, was $562 million. The credit agreement contains covenants that require maintenance of certain financial ratios, including consolidated leverage and interest coverage ratios, and also under certain conditions, restrict our ability to incur additional indebtedness, create liens, make certain investments, pay dividends or make certain other restricted payments, repurchase common shares, undertake certain liquidations, mergers, consolidations and acquisitions and dispose of certain assets or subsidiaries, among other things. If we breach any of these restrictions and do not obtain a waiver from the lenders, subject to applicable cure periods the outstanding indebtedness (and any other indebtedness with cross-default provisions) could be declared immediately due and payable, which could adversely affect our liquidity and financial condition.
On March 27, 2017, we issued $350 million aggregate principal amount of 3.70% senior notes, or the 2022 notes, in a private offering. On July 24, 2018, an exchange offer was completed and all outstanding unregistered 2022 notes were exchanged for freely tradable 2022 notes registered under the Securities Act of 1933, as amended. As of December 31, 2021, the amount outstanding under the registered 2022 notes, net of debt expense of $0.1 million, was $349.9 million, which is payable on April 1, 2022 when the 2022 notes mature. We are required to pay interest on the 2022 notes semi-annually in arrears on April 1 and October 1 of each year, ending on the maturity date.
On November 18, 2019, we issued $400 million aggregate principal amount of 3.375% senior notes, or the 2024 notes, in an underwritten public offering. As of December 31, 2021, the amount outstanding under the 2024 notes, net of debt amortization expense of $1.7 million, was $398.3 million, which is payable on December 1, 2024 when the notes mature. We are required to pay interest on the 2024 notes semi-annually in arrears on June 1 and December 1 of each year, ending on the maturity date.
On March 26, 2021, we issued $350 million aggregate principal amount of 1.75% senior notes, or the 2026 notes, in an underwritten public offering. As of December 31, 2021, the amount outstanding under the 2026 notes, net of debt amortization expense of $2.6 million, was $347.4 million, which is payable on April 10, 2026 when the notes mature. We are required to pay interest on the 2026 notes semi-annually in arrears on April 10 and October 10 of each year, ending on the maturity date.
The 2022 notes and 2024 notes were issued by, and are senior unsecured indebtedness of, Genpact Luxembourg S.à r.l., our indirect wholly owned subsidiary, and are guaranteed on a senior unsecured basis by Genpact Limited and our indirect wholly owned subsidiary, Genpact USA, Inc. The 2026 notes were issued by, and are senior unsecured indebtedness of, Genpact Luxembourg S.à r.l. and Genpact USA, Inc., and are guaranteed on a senior unsecured basis by Genpact Limited. The 2022 notes, 2024 notes and 2026 notes are subject to certain customary covenants set forth in their respective governing indentures, including limitations on our ability to incur debt secured by liens, engage in certain sale and leaseback transactions and consolidate, merge, convey or transfer our assets. Upon certain change of control transactions, we would be required to make an offer to repurchase the 2022 notes, the 2024 notes and the 2026 notes, as applicable, at a price equal to 101% of the aggregate principal amount of such notes, plus accrued and unpaid interest. The interest rates payable on the 2022 notes, the 2024 notes and the 2026 notes are subject to adjustment if the credit ratings of the 2022 notes, 2024 notes or 2026 notes, as applicable, are downgraded, up to a maximum increase of 2.0%. We may redeem the 2022 notes, 2024 notes and 2026 notes at any time in whole or in part, at a redemption price equal to 100% of the principal amount of the notes redeemed, together with accrued and unpaid interest or, if redemption occurs prior to, in the case of the 2022 notes, March 1, 2022, in the case of the 2024 notes, November 1, 2024 and, in the case of the 2026 notes, March 10, 2026, a specified “make-whole” premium. The 2022 notes, 2024 notes and 2026 notes are our senior unsecured obligations and rank equally with all our other senior unsecured indebtedness outstanding from time to time.
Our indebtedness and related debt service obligations can have negative consequences, requiring us to dedicate significant cash flow from operations to the payment of principal and interest on our debt, which reduces the funds we have available for other purposes such as acquisitions and capital investment; limiting our ability to obtain additional financing and limiting our ability to undertake strategic acquisitions; increasing our vulnerability to adverse economic and industry conditions, including by reducing our flexibility in planning for or reacting to changes in our business and market conditions; and exposing us to interest rate risk since a portion of our debt obligations are at variable rates. We manage only a portion of our interest rate risk related to floating rate indebtedness by entering into interest rate swaps. Accordingly, any adverse change in interest rates due to market conditions or otherwise could increase our cost of funding substantially.
A portion of our indebtedness, including borrowings under our credit facility, bears interest at variable interest rates primarily based on LIBOR. The U.K. Financial Conduct Authority, which regulates LIBOR, announced in July 2017 that it will no longer compel banks to submit rates for the calculation of LIBOR after 2021. On March 5, 2021, the administrator for LIBOR announced that it will permanently cease publishing most LIBOR settings beginning on January 1, 2022 and will cease to publish the overnight, one-month, three-month, six-month and 12-month U.S.-dollar LIBOR settings on July 1, 2023. Accordingly, the U.K. Financial Conduct Authority has stated that it does not intend to persuade or compel banks to submit to LIBOR after such dates. The full impact of such reforms and actions remains unclear, and the effects of the discontinuance of LIBOR as a reference rate cannot be entirely predicted but may include an increase in the cost of our borrowings, since we have LIBOR-based debt obligations, or exposure under our interest rate derivative transactions.
We often face a long selling cycle to secure a new contract as well as long implementation periods that require significant resource commitments, which result in a long lead time before we receive revenues from new relationships.
We often face a long selling cycle to secure a new contract. If we are successful in obtaining an engagement, that is generally followed by a long implementation period in which the services are planned in detail and we demonstrate to a client that we can successfully integrate our processes and resources with their operations. During this time a contract is also negotiated and agreed. There is then a long ramping up period in order to commence providing the services. We typically incur significant business development expenses during the selling cycle. We may not succeed in winning a new client’s business, in which case we receive no revenues and may receive no reimbursement for such expenses. Even if we succeed in developing a relationship with a potential new client and begin to plan the services in detail, a potential client may choose a competitor or decide to retain the work in-house prior to the time a final contract is signed. If we enter into a contract with a client, we will typically receive no revenues until implementation actually begins. Our clients may also experience delays in obtaining internal approvals or delays associated with technology or system implementations, thereby further lengthening the implementation cycle. We generally hire new employees to provide services to a new client once a contract is signed. We may face significant difficulties in hiring such employees and incur significant costs associated with these hires before we receive corresponding revenues. If we are not successful in obtaining contractual commitments after the selling cycle, in maintaining contractual commitments after the implementation cycle or in maintaining or reducing the duration of unprofitable initial periods in our contracts, it may have a material adverse effect on our business, results of operations and financial condition.
Our results of operations and share price could be adversely affected if we are unable to maintain effective internal controls.
The accuracy of our financial reporting is dependent on the effectiveness of our internal controls. We are required to provide a report from management to our shareholders on our internal control over financial reporting that includes an assessment of the effectiveness of these controls. Internal control over financial reporting has inherent limitations, including human error, sample-based testing, the possibility that controls could be circumvented or become inadequate because of changed conditions, and fraud. Because of these inherent limitations, internal control over financial reporting might not prevent or detect all misstatements or fraud. If we cannot maintain and execute adequate internal control over financial reporting or implement required new or improved controls that provide reasonable assurance of the reliability of the financial reporting and preparation of our financial statements for external use, we could suffer harm to our reputation, fail to meet our public reporting requirements on a timely basis, be unable to properly report on our business and our results of operations, or be required to restate our financial statements, and our results of operations, the market price of our common shares and our ability to obtain new business could be materially adversely affected.
We make estimates and assumptions in connection with the preparation of our consolidated financial statements, and any changes to those estimates and assumptions could adversely affect our financial results.
Our financial statements have been prepared in accordance with U.S. generally accepted accounting principles. The application of generally accepted accounting principles requires us to make estimates and assumptions about certain items and future events that affect our reported financial condition, and our accompanying disclosure with respect to, among other things, revenue recognition and income taxes. We base our estimates on historical experience, contractual commitments and on various other assumptions that we believe to be reasonable under the circumstances and at the time they are made. These estimates and assumptions involve the use of judgment and are subject to significant uncertainties, some of which are beyond our control. If our estimates, or the assumptions underlying such estimates, are not correct, actual results may differ materially from our estimates, and we may need to, among other things, adjust revenues or accrue additional charges that could adversely affect our results of operations.
Our operating results may experience significant fluctuations.
Our operating results may fluctuate significantly from period to period. The long selling cycle for many of our services as well as the time required to complete the implementation phases of new contracts makes it difficult to accurately predict the timing of revenues from new clients or new SOWs as well as our costs. In addition, our future revenues, operating margins and profitability may fluctuate as a result of: lower demand for our services; lower win rates versus our competition; changes in pricing in response to client demands and competitive pressures; changes to the financial condition of our clients; employee wage levels and utilization rates; changes in foreign exchange rates, including the Indian rupee versus the U.S. dollar and the euro versus the U.S. dollar; the timing of collection of accounts receivable; enactment of new taxes; changes in domestic and international income tax rates and regulations; and changes to levels and types of share-based compensation awards and assumptions used to determine the fair value of such awards. As a result of these factors, it is possible that in some future periods, our revenues and operating results may be significantly below the expectations of public market analysts and investors. In such an event, the price of our common shares would likely be materially and adversely affected.
If we are unable to collect our receivables, our results of operations, financial condition and cash flows could be adversely affected.
Our business depends on our ability to successfully obtain payment from our clients of the amounts they owe us for work performed. We evaluate the financial condition of our clients and usually bill and collect on relatively short cycles. We have established allowances for losses of receivables and unbilled services. Actual losses on client balances could differ from those that we currently anticipate, and, as a result, we might need to adjust our allowances. We might not accurately assess the creditworthiness of our clients. Macroeconomic conditions, including the impact of the COVID-19 pandemic, could also result in financial difficulties for our clients, including bankruptcy and insolvency. Additionally, cyberattacks on any of our clients could disrupt their internal systems and capability to make payments. The occurrence of such events could cause clients to delay payments to us, request modifications to their payment arrangements that could increase our receivables balance, or default on their payment obligations to us. If we experience an increase in the time to bill and collect for our services, our cash flows could be adversely affected.
Some of our contracts contain provisions which, if triggered, could result in lower future revenues and have a material adverse effect on our business, results of operation and financial condition.
Some of our contracts allow a client, in certain limited circumstances, to request a benchmark study comparing our pricing and performance with that of an agreed list of other service providers for comparable services. Based on the results of the study and depending on the reasons for any unfavorable variance, we may be required to make improvements in the services we provide or to reduce the pricing for services on a prospective basis to be performed under the remaining term of the contract, which could have an adverse effect on our business, results of operations and financial condition.
Some of our contracts contain provisions that would require us to pay penalties to our clients and/or provide our clients with the right to terminate the contract if we do not meet pre-agreed service level requirements. Failure to meet these requirements could result in the payment of significant penalties by us to our clients which in turn could have a material adverse effect on our business, results of operations and financial condition.
A few of our MSAs provide that during the term of the MSA and under specified circumstances, we may not provide similar services to the competitors of our client. Some of our contracts also provide that, during the term of the contract and for a certain period thereafter ranging from six to 12 months, we may not provide similar services to certain or any of our client’s competitors using the same personnel. These restrictions may hamper our ability to compete for and provide services to other clients in the same industry, which may inhibit growth and result in lower future revenues and profitability.
Some of our contracts with clients specify that if a change of control of our company occurs during the term of the contract, the client has the right to terminate the contract. These provisions may result in our contracts being terminated if there is such a change in control, resulting in a potential loss of revenues. In addition, these provisions may act as a deterrent to any attempt by a third party to acquire our company. Some of our contracts with clients require that we bear the cost of any sales or withholding taxes or unreimbursed value-added taxes imposed on payments made under those contracts. While the imposition of these taxes is generally minimized under our contracts, changes in law or the interpretation thereof and changes in our internal structure may result in the imposition of these taxes and a reduction in our net revenues.
Our industry is highly competitive, and we may not be able to compete effectively.
Our industry is highly competitive, highly fragmented and subject to rapid change. We believe that the principal competitive factors in our markets are breadth and depth of process, technology and domain expertise, service quality, the ability to attract, train and retain qualified people, compliance rigor, global delivery capabilities, price and marketing and sales capabilities. We compete for business with a variety of companies, including large multinational firms that provide consulting, technology and/or business process services, off-shore business process service providers in low-cost locations like India, in-house captives of potential clients, software services companies that also provide business process services and accounting firms that also provide consulting or outsourcing services.
Some of our competitors have greater financial, marketing, technological or other resources and larger client bases than we do, and may expand their service offerings and compete more effectively for clients and employees than we do. Some of our competitors have more established reputations and client relationships in our markets than we do. In addition, some of our competitors who do not have global delivery capabilities may expand their delivery centers to the countries in which we are located which could result in increased competition for employees and could reduce our competitive advantage. There could also be new competitors that are more powerful as a result of strategic consolidation of smaller competitors or of companies that each provide different services or service different industries.
Increased competition may result in lower prices and volumes, higher costs for resources, especially people, and lower profitability. We may not be able to supply clients with services that they deem superior and at competitive prices and we may lose business to our competitors. Any inability to compete effectively would adversely affect our business, results of operations and financial condition.
Our business could be materially and adversely affected if we do not protect our intellectual property or if our services are found to infringe on the intellectual property of others.
Our success depends in part on certain methodologies, practices, tools and technical expertise we utilize in designing, developing, implementing and maintaining applications and other proprietary intellectual property rights. In order to protect our rights in these various intellectual properties, we rely upon a combination of nondisclosure and other contractual arrangements as well as patent, trade secret, copyright and trademark laws. We also generally enter into confidentiality agreements with our employees, consultants, clients and potential clients and limit access to and distribution of our proprietary information. India is a member of the Berne Convention, an international intellectual property treaty, and has agreed to recognize protections on intellectual property rights conferred under the laws of other foreign countries, including the laws of the United States. There can be no assurance that the laws, rules, regulations and treaties in effect in the United States, India and the other jurisdictions in which we operate and the contractual and other
protective measures we take, are adequate to protect us from misappropriation or unauthorized use of our intellectual property, or that such laws will not change. We may not be able to detect unauthorized use and take appropriate steps to enforce our rights, and any such steps may not be successful. Infringement by others of our intellectual property, including the costs of enforcing our intellectual property rights, may have a material adverse effect on our business, results of operations and financial condition.
In addition, we may not be able to prevent others from using our data and proprietary information to compete with us. Existing trade secret, copyright and trademark laws offer only limited protection. Further, the laws of some foreign countries may not protect our data and proprietary information at all. If we have to resort to legal proceedings to enforce our rights, the proceedings could be burdensome, protracted, distracting to management and expensive and could involve a high degree of risk and be unsuccessful.
Although we believe that we are not infringing on the intellectual property rights of others, claims may nonetheless be successfully asserted against us in the future. The costs of defending any such claims could be significant, and any successful claim may require us to modify, discontinue or rename any of our services. Any such changes may have a material adverse effect on our business, results of operations and financial condition.
A substantial portion of our assets, employees and operations are located in India and we are subject to regulatory, economic, social and political uncertainties in India.
We are subject to several risks associated with having a substantial portion of our assets, employees and operations located in India.
We have benefited from many policies of the Government of India and the Indian state governments in the states in which we operate which are designed to promote foreign investment generally and the business process services industry in particular, including significant fiscal incentives, relaxation of regulatory restrictions, liberalized import and export duties and preferential rules on foreign investment and repatriation. In the past, policies we have benefited from have lapsed or are no longer available to us, and there is no assurance that policies from which we benefit will be available to us in India as an information technology enabled service (ITES) company under certain Indian state and central laws. These benefits include labor law exemptions, preferential rates for the future. Various factors, such as changescommercial usage of electricity and incentives related to the export of qualified services.
Our hedging activities and currency transfers are restricted by regulations in the central or state governments, could trigger significant changes in India’s economic liberalization and deregulation policies and disrupt business and economic conditions in India generally and our business in particular.
In addition, our financial performance and the market price of our common shares may be adversely affected by general economic conditions and economic and fiscal policy in India, including changes in exchange rates and controls, interest rates and taxation policies, as well as social stability and political, economic or diplomatic developments affecting India in the future. In particular, India has experienced significant economic growth over the last several years, but faces major challenges in sustaining that growth in the years ahead. These challenges include the need for substantial infrastructure development and improving access to healthcare and education. Recent economic reform efforts have been disruptive and may increase the level of economic uncertainty in India. Our ability to recruit, train and retain qualified employees, develop and operate our delivery centers, and attract and retain clients could be adversely affected if India does not successfully meet these challenges.
We may face difficulties as we expand our operations into countries in which we have no prior operating experience.
We intend to continue to expand our global footprint in order to maintain an appropriate cost structure and meet our clients’ delivery needs. This may involve expanding into countries other than those in which we currently operate. It may involve expanding into less developed countries, which may have less political, social or economic stability and less developed infrastructure and legal systems. As we expand our business into new countries we may encounter regulatory, personnel, technological and other difficulties that increase our expenses or delay our ability to start up our operations or become profitable in such countries. This may affect our relationships with our clients and could have an adverse effect on our business, results of operations and financial condition.
Terrorist attacks and other acts of violence involving any of the countries in which we or our clients have operations could adversely affect our operations and client confidence.
Terrorist attacks and other acts of violence or war may adversely affect worldwide financial markets and could potentially lead to economic recession, which could adversely affect our business, results of operations, financial condition and cash flows. These events could adversely affect our clients’ levels of business activity and precipitate sudden significant changes in regional and global economic conditions and cycles. For instance, the rapidly developing conflict between Russia and Ukraine is creating volatility and uncertainty in the financial markets. These events also pose significant risks to our people and to our delivery centers and operations around the world.
Southern Asia has from time to time experienced instances of civil unrest and hostilities among neighboringcertain countries, including China, India, Malaysia, the Philippines and Pakistan. In recent years, military confrontations between India and Pakistan have occurred in the region of Kashmir and along the India/Pakistan border. There have also been incidents in and near India, such as continued terrorist activity around the northern border of India, troop mobilizations along the India/Pakistan border and an aggravated geopolitical situation in the region. In addition, in 2020 and 2021, there was a series of conflicts between India and China along their shared border, and although both countries are making efforts to de-escalate these conflicts, there can be no assurance that tensions in the area will diminish in the near future. Such military activity or terrorist attacks in the future could influence the Indian economy by disrupting communications and making travel more difficult. Resulting political tensions could create a greater perception that investments in companies with Indian operations involve a high degree of risk, and that there is a risk of disruption of services provided by companies with Indian operations, which could have a material adverse effect on our share price and/or the market for our services. Furthermore, if India or bordering countries were to become engaged in armed hostilities, particularly hostilities that were protracted or involved the threat or use of nuclear weapons, we might not be able to continue our operations. We generally do not have insurance for losses and interruptions caused by terrorist attacks, military conflicts and wars.Romania.
If more stringent labor laws become applicable to us or if our employees unionize, our profitability may be adversely affected.
India has stringent labor legislation that protects employee interests, including legislation that sets forth detailed procedures for dispute resolution and employee removal and legislation that imposes financial obligations on employers upon retrenchment. Though we are exempt from some of these labor laws at present under exceptions in some states for providers of IT-enabled services, there can be no assurance that such laws will not become applicable to us in the future. If these labor laws become applicable to our employees, it may become difficult for us to maintain flexible human resource policies and attract and employ the numbers of sufficiently qualified candidates that we need or discharge employees, and our compensation expenses may increase significantly.
In addition, our employees may in the future form unions. If employees at any of our delivery centers become eligible for union membership, we may be required to raise wage levels or grant other benefits that could result in an increase in our compensation expenses, in which case our profitability may be adversely affected.
We may engage in strategic transactions that could create risks.
As part of our business strategy, we regularly review potential strategic transactions, including potential acquisitions, dispositions, consolidations, joint ventures or similar transactions, some of which may be material. Through the acquisitions we pursue, we may seek opportunities to add to or enhance the services we provide, to enter new industries or expand our client base, or to strengthen our global presence and scale of operations. We have completed numerous acquisitions since our inception. There can be no assurance that we will find suitable candidates in the future for strategic transactions at acceptable prices, have sufficient capital resources to accomplish our strategy, or be successful in entering into agreements for desired transactions.
Acquisitions, including completed acquisitions, also pose the risk that any business we acquire may lose clients or employees or could under-perform relative to expectations. We could also experience financial or other setbacks if transactions encounter unanticipated problems, including problems related to execution, integration or unknown liabilities. Although we conduct due diligence in connection with our acquisitions, there could be liabilities that we fail to discover, that we inadequately assess or that are not properly disclosed to us. Any material liabilities associated with our acquisitions could harm our business, results of operations and financial condition. Following the completion of an acquisition, we may have to rely on the seller to provide administrative and other support, including financial reporting and internal controls, to the acquired business for a period of time. There can be no assurance that the seller will do so in a manner that is acceptable to us.
We may become subject to taxation as a result of our incorporation in Bermuda or place of management, which could have a material adverse effect on our business, results of operations and financial condition.
We have received a written assurance from the Bermuda Minister of Finance under The Exempted Undertaking Tax Protection Act 1966 of Bermuda to the effect that if there is enacted in Bermuda any legislation imposing tax computed on profits or income, or computed on any capital asset, gain or appreciation, or any tax in the nature of estate duty or inheritance tax, then the imposition of any such tax shall not be applicable to us or to any of our operations or common shares, debentures or other obligations or securities until March 31, 2035, except insofar as such tax applies to persons ordinarily resident in Bermuda or is payable by us in respect of real property owned or leased by us in Bermuda. We cannot assure you that after such date we would not be subject to any such tax. If we were to become subject to taxation in Bermuda or any other jurisdiction as a result of our incorporation in Bermuda, it could have a material adverse effect on our business, results of operations and financial condition.
Economic substance requirements in Bermuda could adversely affect us.
Harmful tax practices have become the focus of increased scrutiny from the EU. Following a 2017 assessment by the Code of Conduct Group (Business Taxation), or the COCG, which included Bermuda in a list of jurisdictions required by the EU to address the COCG’s concerns relating to the demonstration of economic substance, the Bermuda Government implemented legislation which brought certain substance requirements into force in 2019 for Bermuda entities. Pursuant to the economic substance requirements, core income generating activities carried out by Bermuda companies must be undertaken in Bermuda. To satisfy these requirements, we may be required to conduct additional activities in Bermuda. The substance requirements could be difficult to manage or implement, and compliance with the requirements could be difficult or costly and could have a material adverse effect on us or our operations.
We may not be able to realize the entire book value of goodwill and other intangible assets from acquisitions.
As of December 31, 2021, we had $1,731 million of goodwill and $170 million of intangible assets. We periodically assess these assets to determine if they are impaired and we monitor for impairment of goodwill relating to all acquisitions and our formation in 2004. Goodwill is not amortized but is tested for impairment at least on an annual basis as of December 31 of each year, based on a number of factors including macro-economic conditions, industry and market considerations, overall financial performance, business plans and expected future cash flows. Impairment testing of goodwill may also be performed between annual tests if an event occurs or circumstances change that would more likely than not reduce the fair value of goodwill below its carrying amount. We perform an assessment of qualitative factors to determine whether the existence of events or circumstances leads to a determination that it is more likely than not that the fair value of a reporting unit is less than its carrying amount. Based on the results of the qualitative assessment, the Company performs the quantitative assessment of goodwill impairment if it determines that it is more likely than not that the fair value of a reporting unit is less than its carrying amount. If the book value of our goodwill and other intangible assets is impaired, any such impairment would be charged to earnings in the period of impairment. We cannot assure you that any future impairment of goodwill and other intangible assets will not have a material adverse effect on our business, financial condition or results of operations.
Risks Related to our Shares
•The issuance of additional common shares by us or the sale of our common shares by our employees could dilute our shareholders’ ownership interest in the Company and could significantly reduce the market price of our common shares.
•There can be no assurance that we will continue to declare and pay dividends on our common shares, and future determinations to pay dividends will be at the discretion of our board of directors.
•We are organized under the laws of Bermuda, and Bermuda law differs from the laws in effect in the United States and may afford less protection to shareholders.
•The market price for our common shares has been and may continue to be volatile.
•You may be unable to effect service of process or enforce judgments obtained in the United States or Bermuda against us or our assets in the jurisdictions in which we or our executive officers operate.
USE OF TRADEMARKS
The trademarks, trade names and service marks appearing in this Annual Report on Form 10-K are the property of their respective owners. We have omitted the ® and ™ designations, as applicable, for the trademarks named in this Annual Report on Form 10-K after their first reference herein.
PART I
Item 1. Business
Genpact is a global professional services and solutions firm that makes business transformation real. We drive digital-led innovation and run digitally-enabled operations for our clients, guided by our experience running thousands of processes for hundreds of global companies. We have over 129,100 employees serving clients in key industry verticals from more than 35 countries. Our 2023 total net revenues were $4.5 billion.
In 2023, we made progress on key strategic initiatives to help drive long-term profitable growth. These efforts included making continued investments in a portfolio of clients who are on significant digital transformation journeys and for whom we believe we can drive meaningful business outcomes. We continued to develop and refine our artificial intelligence ("AI") capabilities, prioritizing our investments in new generative AI solutions. We also continued to focus on the learning and development of our employees to provide them with the critical skills needed for the future and to build their careers.
We believe our approach to digital-led business transformation, enabled through combining our domain expertise with our skills in AI, digital and analytics, differentiates us from our competitors.
Our approach to digital-led transformation
Industry disruption is pervasive, driven by an explosion in digital technologies, increased use of AI, data and analytics, new competitors, and shifting market dynamics. In this environment, companies need industry-tailored solutions to reimagine their business models end-to-end and adapt to rapid change. These organizations seek partners that can improve productivity while creating competitive advantages and driving business outcomes, such as expanded market share, seamless customer experiences, increased revenue, working capital improvement, increased profitability, and minimized risk and loss.
We partner with clients to show them how new digital solutions can drive business outcomes. We apply user and customer experience principles to our domain expertise and innovative technology to create solutions designed to quickly and aptly meet client objectives. The results can include quick-turnaround proof of concept prototypes that clients can install and test in their own environments.
Many of our client solutions are based on Genpact Cora, our AI-based platform, which integrates our proprietary automation, analytics and AI technologies with those of our strategic partners into a unified offering. It draws insights from our deep domain and operations expertise in our target industries and service lines to create analytics-based solutions that are focused on improving customer and user experience to accelerate clients’ digital transformations.
Additionally, many of our client solutions are embedded with our Digital Smart Enterprise ProcessesSM (DigitalSEPs), a patented and highly granular approach to recognize the critical factors that dramatically improve business performance to help drive client outcomes. Our Digital SEPs combine Lean Six Sigma methodologies – which reduce inefficiency and improve process quality – with advanced domain-specific digital technologies, drawing on our industry acumen, our expertise in AI and experience-centric principles, and our deep understanding of how businesses run. Digital SEPs test the effectiveness of client processes using best-in-class benchmarks developed by mapping and analyzing millions of client transactions across thousands of end-to-end business processes. In this way, we identify opportunities for improving clients’ operations by applying our deep process knowledge and process-centric technologies to transform them.
We enable domain-led digital transformation for our clients through our Digital Operations Services and Data-Tech-AI Services.
Digital Operations Services
Our Digital Operations services embed digital, advanced analytics, AI and cloud-based offerings into our business process outsourcing solutions where we transform and run our clients’ operations with an aim to achieve higher levels of end-to-end performance. These services allow enterprises to be more flexible and help them focus on high-value work to better compete in their industries. Our Digital Operations solutions also include certain IT services functions, including end-user computing support and infrastructure production support.
The ability to organize complex data sets and use analytics to derive actionable insights is increasingly critical to drive business outcomes for our clients. Our Enterprise360 intelligence platform enables our clients to harness the power of data and insights derived from running our clients' operations leveraging proprietary metrics and benchmarks from our Digital SEPs. This platform also uses AI for prescriptive actions to pinpoint transformation opportunities that can unlock operational excellence and growth.
Revenues from our Digital Operations services in 2023 were $2.48 billion, representing 55% of our total 2023 revenue.
Data-Tech-AI Services
Our Data-Tech-AI services focus on designing and building solutions that harness the power of digital technologies, data and advanced analytics, AI, and cloud-based software-as-a-service (SaaS) offerings to help transform our clients’ businesses and operations. Using human-centric design, we help clients build new products and services, create digital workspaces, and drive customer, client, employee and partner engagement.
Revenues from our Data-Tech-AI services in 2023 were $1.99 billion, representing 45% of our total 2023 revenue.
Our service offerings
We offer the following professional services to our clients:
•Enterprise services: Finance and accounting, CFO advisory, supply chain, sourcing and procurement, sales and commercial, marketing and experience, and environmental, social and governance services; and
•Core industry operations services that are specific to our chosen industry verticals.
Enterprise services
Our enterprise services aim to deliver value for our clients through innovation and by leveraging our extensive experience optimizing processes for our clients. We partner with our clients to design target operating models, implement data, tech and AI-enabled solutions, improve process execution, and provide data and analytics-driven insights.
Finance and accounting services
We believe we are one of the world’s premier providers of finance and accounting services. Our focus is on delivering fast and high-quality results, minimizing exceptions, providing a seamless user experience, and making a working capital impact for our clients. We offer a comprehensive range of services in this area, including:
Accounts payable: Our accounts payable services include document management, vendor master data management, invoice receipt and processing, accuracy audits, reconciliations, aging analyses, help desk management, payments processing and travel and expense processing;
Invoice-to-cash: Our invoice-to-cash services include customer master data management, credit and contract management, data validation and credit worthiness assessments, billing, collections, accounts receivable maintenance and reporting, credit review support, bad debts research, accounts receivable reconciliation, and dispute and deduction management services;
Record to report: Our record to report services include closing and reporting process management, general accounting and industry-specific accounting services, treasury services, tax services, and external reporting, including statutory accounting and reporting;
Financial planning and analysis: Our financial planning and analysis services include budgeting, planning and forecasting support, management reporting, business, financial and operational analytics, transformation design, digital-infused process enhancement, enterprise data and advisory services, master data management and data quality services and data lake implementation; and
Enterprise risk and compliance: Our enterprise risk and compliance services include operational risk and controls across a wide range of regulatory environments, including SOX and controls monitoring, controls transformation, ERP and digital controls, third party risk management, internal audit and audit analytics.
CFO advisory services
Our CFO advisory services aim to enable CFOs to optimize the impact the finance organization can have on a company's performance and shareholder value creation. These services cover the entire finance value stream, including target operating model design, working capital optimization, operational finance transformation, as well as corporate development and event-driven initiatives, such as carve-outs and post-merger integration services, including transactional due diligence.
Supply chain, sourcing and procurement services
Supply chain: We help our clients transform process-led and technology-enabled operating models across the value chain (plan, source, make, deliver, and aftersales). We cover the complete supply chain operations reference model and provide services in critical areas such as supply chain resiliency, sustainable/circular supply chain and orchestrated enterprise.
Sourcing and procurement: We offer advisory and managed services across the direct and indirect procurement value chain, including strategic sourcing, responsible sourcing, category management, spend analytics, procurement operations and digital platform transformation.
Sales and commercial, marketing and experience services
Sales and commercial: We drive growth and experience for our clients by transforming and running the end-to-end sales lifecycle for our clients through services such as campaign management, lead generation, qualification and deductions. We also provide services in the areas of partner management and commercial operations, such as pricing and promotion optimization, and B2B customer experience, including order management, deductions and dispute management.
Marketing and experience: We enable our clients to drive growth by delivering transformational experiences that leverage our deep understanding of data, technology and process design. Our focus is to differentiate through operational transformation, generative AI enablement and improved experience across customers, employees and products, with data led insights. Our services in this area are supported by strategic partnerships with leading ecosystem providers in marketing and experience.
Environmental, social and governance services
We help our clients meet their sustainability objectives, environmental, social and governance (ESG) regulatory requirements, voluntary commitments and operational improvements. Our services in this area include advisory, data management and analytics, carbon accounting, responsible sourcing, sustainable supply chain, human rights assessment, sustainability diligence, sustainable technology, ESG reporting and limited assurance for ESG reporting.
Core industry operations
We help our clients design, transform and run processes that are specific to their industries. Using our industry and domain expertise embedded in our Digital SEP frameworks, we collaborate with our clients to power their operations in areas such as claims, underwriting, commercial leasing and lending, regulatory affairs, insurance actuarial, and trust and safety. We provide industry-specific operations services across all of our chosen industry verticals.
Industries we serve
We work with clients across our chosen industry verticals, which represent areas in which we believe we have deep industry acumen. Our chosen industry verticals, described in more detail below, are grouped within our three reportable segments, namely: (1) Financial Services, (2) Consumer and Healthcare, and (3) High Tech and Manufacturing.
Organizing our business by industry verticals allows us to leverage our deep domain knowledge specific to our chosen industries and create, replicate and standardize innovative solutions for clients in the same industries. In addition to our professional services, such as finance and accounting, CFO advisory, supply chain, sourcing and procurement, and sales and commercial, that are available to clients across our verticals, we offer core industry-specific services to clients in select verticals. These services are embedded where possible with industry-relevant digital and analytics tools that leverage AI and automation to drive enhanced benefits and customer experience.
Financial Services
Our Financial Services segment covers services we provide to clients in the banking, capital markets and insurance sectors. Our banking and capital markets clients include retail, investment and commercial banks, mortgage lenders, equipment and lease financing providers, fintech companies, payment providers, wealth and asset management firms, broker/dealers, exchanges, auto finance providers, clearing and settlement organizations, renewable energy lenders and other financial services companies. Our core operations services for these clients include retail customer onboarding, customer service, collections, card servicing operations, loan and payment operations, commercial loan servicing, equipment and auto loan servicing, mortgage origination and servicing, compliance services, risk management services, reporting and monitoring services and wealth management operations support. We provide financial crime and risk management services in areas such as fraud and dispute management, anti-money laundering, transaction monitoring, KYC and due diligence, sanctions screening, negative media monitoring and platform implementation.
Our insurance clients include insurers, brokers, agents, reinsurers and insurtech companies operating across property and casualty, specialty, life, annuity, disability and employee benefits lines of business. Our core operations services for these clients include underwriting support, new business processing, policy administration, customer service, claims management, catastrophe modeling and actuarial services. We also provide end-to-end third party administration for property and casualty claims.
Revenues from our Financial Services segment in 2023 were $1.23 billion, representing 27% of our total 2023 revenue.
Consumer and Healthcare
Our Consumer and Healthcare segment covers services we provide to clients in the consumer goods, retail, life sciences and healthcare sectors. Our consumer goods and retail clients include companies in the food and beverage, household goods, consumer health and beauty and apparel industries, as well as grocery chains and general and specialty retailers. The core operations services we provide to these clients include demand generation, sensing and planning, supply chain planning and management, pricing and trade promotion management, deduction recovery management, order management, digital commerce and customer experience.
Our life sciences and healthcare clients include pharmaceutical, medical technology, medical device and biotechnology companies as well as retail pharmacies, distributors, diagnostic labs, and healthcare payers (health insurers) and providers. Our core operations services for life sciences clients include regulatory affairs services, such as lifecycle management, regulatory operations, Chemistry Manufacturing Controls compliance and regulatory information management. Our services for healthcare clients include end-to-end claim lifecycle management, from claims processing and adjudication to claims recovery and payment integrity, revenue cycle management, health equity analytics, care services and customer experience.
Revenues from our Consumer and Healthcare segment in 2023 were $1.57 billion, representing 35% of our total 2023 revenue.
High Tech and Manufacturing
Our High Tech and Manufacturing segment covers services we provide to clients in the high tech hardware, high tech software and manufacturing sectors. Our clients in the high tech industry include companies in the information and digital technology, software, digital platform, electronics, semiconductor, enterprise technology, media, services and hospitality sectors. The core operations services we provide to these clients include industry-specific solutions for trust and safety, advertising sales support, customer and user experience, customer care support and supply chain management.
Our manufacturing clients include companies in the aerospace, automotive and mobility, chemicals, energy, electric vehicles and batteries, industrial machinery, materials transportation and logistics, oil and gas and utilities sectors. Our core operations solutions for these clients include industry-specific solutions for supply chain management, direct and indirect procurement, logistics, field, aftermarket support and engineering services.
Revenues from our High Tech and Manufacturing segment in 2023 were $1.68 billion, representing 38% of our total 2023 revenue.
Our clients
We serve approximately 800 clients across many industries and geographies. Our clients include some of the biggest brands in the world, many of which are leaders in their industries, including about a quarter of the Fortune Global 500.
Our contracts with clients for Digital Operations services often take the form of a master services agreement ("MSA"), which is a framework agreement that we then supplement with statements of work ("SOWs") or other service level agreements, such as supplements, work orders, purchase orders or business services agreements. These SOWs and other service level agreements cover in more detail the type of work to be performed and the associated amounts to be billed. For our Data-Tech-AI services, we typically enter into software-as-a-service and/or consulting agreements with our clients depending on the scope of the services to be performed. For more about our contracting frameworks, see Item 7—“Management’s Discussion and Analysis of Financial Condition and Results of Operations—Overview—Net Revenues.”
Partnerships and alliances
We continue to invest in and expand our strategic alliances with companies whose services and solutions complement ours. Together, we work to enhance our existing solutions or create new offerings to meet market needs.
Our alliances generally fall into one of the following categories:
• Strategic, go-to-market partnerships
• Deal-specific relationships to jointly solve a specific issue for a client
• Reseller arrangements to provide third party partner software and cloud solutions
• Digital and other “white label” embedded technology-based relationships
We have three primary types of partners: consulting partners, digital partners, and solution partners. Our digital and solution partnerships aim to nurture relationships with established and emerging players in technology and AI. These potential partners specialize in leading-edge disruptive digital technologies and solutions that we can embed into our offerings or jointly bring to market.
Our people
As of December 31, 2023, we had approximately 129,100 employees working in more than 35 countries. As a talent-led organization, our people are critical to the success of our business. We have created, and constantly reinforce, a culture that emphasizes collaboration, innovation, process improvement, and dedication to our clients. We seek to foster a culture that wins clients, develops leaders and attracts and retains talent who exhibit our core values – curiosity, incisiveness and courage – who embody and enable our purpose — the relentless pursuit of a world that works better for people — and who uphold our dedication to integrity consistent with our Code of Conduct, Integrity@Genpact.
Rewarding and recognizing our talent
We aim to create a work environment where every person is inspired to achieve, driven to perform and rewarded for their contributions. We strive to engage and competitively compensate our high-performing talent by providing performance-based promotions and merit-based compensation increases. In 2023, we promoted more than 13,000 of our employees and encouraged employee career growth through our Destination Growth program. We also closely monitor employee retention levels and regularly evaluate our pay-for-performance approach in an effort to retain our top talent.
Diversity, equity and inclusion
We believe that a culture of diversity, equity and inclusion is critical to our business. We believe in equal opportunity for each individual, irrespective of their gender, age, ethnicity, cultural background, race or sexual orientation. Understanding each other’s uniqueness, recognizing our differences, respecting varied opinions and accepting various points of view is at the heart of our organization’s culture. We promote these values by seeking to maintain inclusive hiring and management practices and ensure that opportunities are equally open to all.
We are committed to:
•Increasing diversity, including gender, racial and ethnic diversity, across all levels of the organization;
•Recruiting, retaining and advancing talent, including from diverse ethnic and racial backgrounds; and
•Creating and fostering an inclusive culture where everybody, including our LGBTQ+ employees, feels safe and empowered.
Employee development and engagement
We are committed to the career development of our employees and making them future-ready, and we strive to engage them with challenging and rewarding career opportunities. Our performance management approach supports our career philosophy by encouraging employees to reflect on their performance, set challenging goals, receive feedback, identify their development needs and find relevant learning and training opportunities. We have also developed a number of leadership development and mentoring programs, including our Global Operations Leadership Development and our Leadership Direct programs for high potential talent and our programs designed to increase gender diversity in our leadership ranks, such as our Pay it Forward and Women’s Leadership initiatives.
We have also developed a learning framework called Genome that enables our employees to acquire new skills and evolve quickly as industries and technologies change, equipping them with skills that are relevant to their current roles and future aspirations. Genome was designed to shape an adaptive workforce, and its learning strategy was formulated to “reskill at scale” and be integrated throughout the enterprise.
TalentMatch is our talent transformation initiative to match the skills and job aspirations of our employees with existing and future job opportunities we have available. By enabling employees to prepare for their future career aspirations by upskilling and reskilling through Genome, TalentMatch has allowed us to identify talent available for redeployment from one part of our business to another as the needs of our clients change. It improves our employee utilization globally by providing the right talent at the right time for our client engagements. TalentMatch also gives our employees the opportunity to take their careers in their desired directions, thus increasing employee satisfaction, and bolstering our ability to scale our flexible working model.In 2023, we filled more than 40% of our open positions with internal hires.
Amber, our engagement AI chatbot and employee experience platform, enables transformation of our employee engagement strategy. Amber provides an outlet for unbiased and judgment free conversations for our employees and live predictive people analytics for business and HR leaders.
By digitizing how we engage with our employees through Amber, we have increased the scope and frequency of employee feedback and have gained the ability to assess employee engagement and identify trends in employee engagement and satisfaction across the company.
In 2023, we continued to invest in technologies and programs designed to improve employee experience, with a particular focus on employee well being.
Corporate social responsibility
Our approach to corporate social responsibility focuses on two pillars tied to our purpose: Better Access, which reflects our aim to provide the communities in which we operate with better access to healthcare, education and opportunities, and Better Planet, which reflects our aim to inform, educate, and catalyze action on the different facets of the environment and climate change and help make the planet work better for all.
We foster a culture of giving and volunteering through several global platforms, projects, and social initiatives. More than 62,000 of our employees have volunteered their time to support a range of causes, such as mentoring underprivileged children and young adults, providing meals to food-insecure communities, planting saplings, and engaging in e-waste collection drives.
Additionally, in 2023 more than 5,000 of our employees participated in our payroll-based charitable donation programs, and many of our employee volunteers participated in virtual volunteering initiatives such as creating learning aids for students, awareness posters for non-profits, holiday cards for veterans, and completing at-home sustainability challenges to build a better planet.
Sales and marketing
We market our services and solutions to both existing and potential clients through our business development team. Like our client portfolio, members of this team are based around the globe. Our business development team focuses both on supporting our strategic client accounts and acquiring new clients.
We have designated lead client partners and global relationship managers for each of our strategic client relationships. These business development personnel are supported by industry and capability subject matter experts to ensure our services and solutions best address the needs of our clients. We continuously monitor our client satisfaction levels to ensure that we maintain high service levels using metrics such as the Net Promoter Score.
The length of our selling cycle varies depending on the type of engagement. The sales cycle for our advisory and project work is typically much shorter than the sales cycle for a large business process engagement. Our efforts may begin through an existing engagement with a client or in response to our lead generation program, a perceived opportunity, a reference by an existing client, a request for proposal or otherwise. Our teams seek to understand the needs and priorities of our clients as well as the business outcomes our clients desire, and we leverage our combination of capability and industry expertise to create differentiated client solutions. We may expend substantial time and resources in engaging with prospective clients to secure new business. See Item 7—“Management’s Discussion and Analysis of Financial Condition and Results of Operations—Overview—Net Revenues.”
As our relationship with a client deepens, the time required to win an engagement for additional services generally declines. In addition, during an engagement, as we better understand and experience a client’s business and processes, we are able to identify incremental opportunities to deliver greater value for the client, including by leveraging our expanding portfolio of digital capabilities to transform our clients’ operations.
We strive to foster relationships between our senior leadership team and our clients’ senior management teams. These “C-level” relationships ensure that both parties are focused on establishing priorities, aligning objectives and driving client value. High-level executive relationships present significant opportunities to increase business from our existing clients. These relationships also provide a forum for gathering feedback on service delivery performance and addressing client concerns. Our governance methodology is designed to ensure that we are well connected at all levels of our clients’ organizations (executive, management, technology and operations).
Significant new business opportunities are reviewed by business leaders, lead client partners and global relationship managers from the applicable industry vertical along with operations personnel and members of our finance department. If they determine that the new business is aligned with our strategic objectives and a good use of our resources, then our business development team is authorized to pursue the opportunity.
Global delivery
We serve our clients using our global network of more than 90 delivery centers in more than 25 countries. We have delivery centers in Argentina, Australia, Brazil, Bulgaria, Canada, China, Costa Rica, Egypt, Germany, Guatemala, Hungary, India, Israel, Italy, Japan, Malaysia, Mexico, the Netherlands, the Philippines, Poland, Portugal, Romania, Thailand, Turkey, the United Kingdom and the United States. We also have employees in these and additional countries, such as Ireland, Singapore and South Africa, who work with our clients either onsite or virtually, which offers flexibility for both clients and employees.
With this global network, we are able to manage complex processes around the world. We use different locations for different types of services depending on client needs and the mix of skills and cost of employees at each location.
Our global delivery model gives us:
•multilingual capabilities;
•access to a larger talent pool;
•“near-shoring” as well as off-shoring capabilities to take advantage of time zones; and
•proximity to our clients through a significant onshore presence.
We also regularly look for new places to open delivery centers and offices, both in new countries or new cities in countries where we already have a presence. Before we choose a new location, we consider several factors, such as the talent pool, infrastructure, government support, operating costs, and client demand.
Service delivery model
We seek to be a seamless extension of our clients’ operations. To that end, we developed the Genpact Virtual CaptiveSM service delivery model, in which we create a virtual extension of our clients’ teams and environments. Our clients get dedicated employees and management, as well as dedicated infrastructure at our delivery centers. We also train our teams in our clients’ cultures, processes, and business environments.
Intellectual Property
The solutions we offer our clients often include a range of proprietary methodologies, software, and reusable knowledge capital. We also develop intellectual property in the course of our business and our agreements with our clients regulate the ownership of such intellectual property. We seek to protect our intellectual property and our brand through various means, including by agreement and applications for patents, trademarks, service marks, copyrights and domain names. Some of our intellectual property rights are trade secrets and relate to proprietary business process enhancements.
As of December 31, 2023, we had a portfolio of more than 60 patents and pending patent applications globally. Additionally, we have over 200 trademarks registered in various jurisdictions.
We often use third-party and client software platforms and systems to provide our services. Our agreements with our clients normally include a license to use the client’s proprietary systems to provide our services. Clients authorize us to access and use third party software licenses held by the client so that we may provide our services.
It is our practice to enter into agreements with our employees and independent contractors that:
•ensure that all new intellectual property developed by our employees or independent contractors in the course of their employment or engagement is assigned to us;
•provide for employees’ and independent contractors’ cooperation in intellectual property protection matters even if they no longer work for us; and
•include a confidentiality undertaking by our employees and independent contractors.
Competition
We operate in a highly competitive and rapidly evolving global market. We have a number of competitors offering services that are the same as or similar to ours. Our competitors include:
•large multinational service providers, primarily accounting and consulting firms, that provide consulting and other professional services;
•companies that are primarily business process service providers operating from low-cost countries, most commonly India;
•companies that are primarily information technology service providers with some business process service capabilities; and
•smaller, niche service providers that provide services or products in a specific geographic market, industry or service area, including new AI and digital technologies.
We may also face losses or potential losses of business when in-house departments of companies use their own resources rather than engage an outside firm for the types of services and solutions we provide.
Our business model is also subject to competitive forces from the advent of novel technology or applications of these technological capabilities made readily available in open-market environments.
Our revenues are derived primarily from Fortune Global 500 and Fortune 1000 companies. We believe that the principal competitive factors in our industry include:
• deep expertise in industry-specific domains and processes;
• ability to advise clients on how to transform their processes and deliver transformation that drives business value;
• ability to provide innovative services and products, including digital offerings;
• ability to consistently add value through digital transformation and continuous process improvement;
• reputation and client references;
• contractual terms, including competitive pricing and innovative commercial models;
• scope of services;
• quality of products, services and solutions;
• ability to sustain long-term client relationships; and
• global reach and scale.
Our clients typically retain us on a non-exclusive basis.
Regulation
We are subject to regulation in many jurisdictions around the world as a result of the complexity of our operations and services, particularly in the countries where we have operations and where we deliver services. We are also subject to regulation by regional bodies such as the European Union ("EU").
In addition, the terms of our service contracts typically require that we comply with applicable laws and regulations. In some of our service contracts, we are contractually required to comply even if such laws and regulations apply to our clients, but not to us, and sometimes our clients require us to take specific steps intended to make it easier for them to comply with applicable requirements. In some of our service contracts, our clients undertake the responsibility to inform us about laws and regulations that may apply to us in jurisdictions in which they are located.
If we fail to comply with any applicable laws and regulations, we may face restrictions on our ability to provide services, and may also be the subject of civil or criminal actions involving penalties, any of which could have a material adverse effect on our operations. Our clients generally have the right to terminate our contracts for cause in the event of regulatory failures, subject in some cases to notice periods. See Item 1A—“Risk Factors—Risks Related to our Business and Operations—Our global operations expose us to numerous and sometimes conflicting legal and regulatory requirements, and violations of these laws and regulations could harm our business.” If we fail to comply with contractual commitments to facilitate our clients’ compliance, we may be liable for contractual damages, and clients in regulated industries may be less willing to use our services.
We are affected by laws and regulations in the United States, the United Kingdom, the EU and its member states, and other countries in which we do business that are intended to limit the impact of outsourcing on employees in those jurisdictions, and occasional changes to laws and regulations in such jurisdictions may impose changes that further restrict or discourage offshore outsourcing or otherwise harm our business. See Item 1A—“Risk Factors—Risks Related to our Business and Operations—Recent and future legislation and executive action in the United States and other jurisdictions could significantly affect the ability or willingness of our clients and prospective clients to utilize our services.”
Our collection, use, disclosure and retention of personal health-related and other information is subject to an array of privacy, data security, and data breach notification laws and regulations that change frequently, are inconsistent across the jurisdictions in which we do business, and impose significant compliance costs. In the United States, personal information is subject to numerous federal and state laws and regulations relating to privacy, data security, and breach notification, including, for example, the Financial Modernization Act (sometimes referred to as the Gramm-Leach-Bliley Act), Health Insurance Portability and Accountability Act, Federal Trade Commission Act, Family Educational Rights and Privacy Act, Communications Act, Electronic Communications Privacy Act, and state-level comprehensive privacy laws, including the California Consumer Privacy Act. There are also various state-level privacy laws that specifically regulate consumer health data, including recently enacted laws in Connecticut, Nevada and Washington.
All fifty U.S. states and the District of Columbia have implemented separate data security breach notification laws with which we must comply, and some states have added specific data security standards to their existing laws.
Some courts have become more willing to allow individuals to pursue claims in data breach cases, indicating that it may become easier for consumers to sue companies for data breaches. Related laws and regulations govern our direct marketing activities and our use of personal information for direct marketing, including the Telemarketing and Consumer Fraud and Abuse Prevention Act, Telemarketing Sales Rule, Telephone Consumer Protection Act and rules promulgated by the Federal Communications Commission, and CAN-SPAM Act. In 2018, the Clarifying Lawful Overseas Use of Data (CLOUD) Act established new required processes and procedures for handling U.S. law enforcement requests for data that we may store outside of the U.S.
In the EU, the General Data Protection Regulation (GDPR) went into effect in May 2018. The GDPR imposes privacy and data security compliance obligations and increased penalties for noncompliance. In particular, the GDPR has introduced numerous privacy-related changes for companies operating in the EU, including greater control for data subjects, increased data portability for EU consumers, data breach notification requirements and increased fines for violations. The GDPR also prohibits the transfer of personal data from the European Economic Area (“EEA”) to countries outside of the EEA unless made to a country deemed to have adequate data privacy laws by the European Commission or an appropriate data transfer mechanism has been put in place. The EU-US Privacy Shield (“Privacy Shield”) was such a transfer mechanism put in place between the EU and the United States, but the Privacy Shield was invalidated in July 2020 by the Court of Justice of the European Union (the “CJEU”). The EU-U.S. Privacy Shield has now been replaced with the EU-U.S. Data Privacy Framework (“DPF”), which is intended to address the issues cited in the 2020 CJEU decision. Although the European Commission issued an adequacy decision for the DPF on July 10, 2023, and it is now a valid mechanism for transferring personal data from the EU to the U.S. for entities that have elected to participate, the validity of the DPF may also be challenged in court, which could create additional uncertainty relating to the regulation of international data transfers. The CJEU’s decision also led to revisions to the standard contractual clauses (“SCCs”) that may also be used as a mechanism for transferring personal data outside of the EU. If the DPF is challenged, there may be new uncertainty regarding the validity of the updated SCCs.
Following the withdrawal of the UK from the EU, the United Kingdom has amended the UK Data Protection Act 2018 to retain the GDPR in UK national law. The penalties prescribed in the UK GDPR are the same as under the EU GDPR. However, the United Kingdom has implemented its own guidance for handling outbound data transfers to jurisdictions such as the U.S. whose privacy laws are not covered by an existing adequacy decision, has adopted an International Data Transfer Agreement as a framework for companies to transfer personal data outside of the United Kingdom, and has implemented its own version of DPF, called the UK-U.S. Data Bridge, to allow participating companies to transfer personal data from the UK to the U.S.
Additionally, foreign governments outside of the EU and UK are also taking steps to fortify their data privacy laws and regulations. For example, India recently enacted a data protection law that may affect how we handle vendor and employee data in India. Other countries in Africa, Asia and Latin America have either passed data privacy legislation or are considering data protection laws that affect or may affect us. As privacy laws and regulations around the world continue to evolve, these changes could adversely affect our business operations, websites and mobile applications that are accessed by residents in the applicable countries.
In the United States, we are either directly subject to, or contractually required to comply or facilitate our clients’ compliance with, laws and regulations arising out of our work for clients operating there, especially in the area of banking, financial services and insurance, such as the Gramm-Leach-Bliley Act, the Fair Credit Reporting Act, the Fair and Accurate Credit Transactions Act, the Right to Financial Privacy Act, the Bank Secrecy Act, the USA PATRIOT Act, the Bank Service Company Act, the Home Owners Loan Act, the Electronic Funds Transfer Act, the Equal Credit Opportunity Act, and regulation by U.S. agencies such as the SEC, the Federal Reserve, the Federal Deposit Insurance Corporation, the National Credit Union Administration, the Commodity Futures Trading Commission, the Federal Financial Institutions Examination Council, the Office of the Comptroller of the Currency, and the Consumer Financial Protection Bureau.
Because of our debt collections work in the United States, we are also regulated by laws such as the Truth in Lending Act, the Fair Credit Billing Act, the Fair Debt Collection Practices Act, the Telephone Consumer Protection Act and related regulations. We are currently licensed to engage in debt collection activities in all jurisdictions in the United States where licensing is required. U.S. banking and debt collection laws and their implementing regulations are occasionally amended, and these changes may impose new obligations on us or may change existing obligations.
Because of our insurance processing activities in the United States, we are currently licensed as a third-party administrator in 43 states and are regulated by the department of insurance in each such state. In two other states, we qualify for regulatory exemption from licensing based on the insurance processing activities we provide. We also hold entity adjuster licenses in 24 states that require licensing.
Certain laws may apply to our content moderation activity, such as laws regulating hate speech on the internet. In the United States, Section 230 of the Communications Decency Act shields “interactive computer services” (e.g., websites, social media platforms) from liability for the speech of their users, with certain exceptions.
The law also shields interactive computer services from civil liability for a good faith action voluntarily taken to restrict access to or availability of content that the provider or user considers to be obscene, lewd, lascivious, filthy, excessively violent, harassing, or otherwise objectionable, whether or not such material is constitutionally protected. The future of Section 230 and the scope of the protections it provides to online publishers and other laws related to bullying, harassing, offensive materials and hate speech on the internet are currently the topic of significant debate. We expect that these laws will continue to evolve and change. Changes to the laws and regulations governing liability for speech on the internet may affect the business strategies and offerings of our clients, which may significantly change their approach to content moderation, and which, in turn, could reduce the market for our trust and safety related services.
In the United States, we are subject to laws and regulations governing foreign trade, such as export control, customs and sanctions regulations maintained by government bodies such as the Commerce Department’s Bureau of Industry and Security, the Treasury Department’s Office of Foreign Assets Control, and the Homeland Security Department’s Bureau of Customs and Border Protection. Other jurisdictions, such as the EU, also maintain similar laws and regulations that apply to some of our operations.
Several of our service delivery centers, primarily located in China, Costa Rica, India, Israel, Malaysia and the Philippines, benefit from tax incentives or concessional rates provided by local laws and regulations. In addition, certain benefits are also available to us in India as an information technology enabled service (ITES) company under certain Indian state and central laws. These benefits include labor law exemptions, preferential rates for the commercial usage of electricity and incentives related to the export of qualified services.
Our hedging activities and currency transfers are restricted by regulations in certain countries, including China, India, Malaysia, the Philippines and Romania.
Certain Bermuda Law Considerations
As a Bermuda company, we are also subject to regulation in Bermuda. Among other things, we must comply with the provisions of the Companies Act 1981 of Bermuda, as amended, regulating the declaration and payment of dividends and the making of distributions from contributed surplus. We are classified as a non-resident of Bermuda for exchange control purposes by the Bermuda Monetary Authority. Pursuant to our non-resident status, we may engage in transactions in currencies other than Bermuda dollars. There are no restrictions on our ability to transfer funds in and out of Bermuda or to pay dividends to United States residents that are holders of our common shares.
Under Bermuda law, “exempted” companies are companies formed for the purpose of conducting business outside Bermuda. As an exempted company, we may not, without a license granted by the Minister of Finance, participate in certain business transactions, including transactions involving Bermuda landholding rights and the carrying on of business of any kind, for which we are not licensed in Bermuda.
Bermuda has economic substance requirements pursuant to the Economic Substance Act 2018, as amended, and the regulations proffered thereunder, which require us to have adequate economic substance in Bermuda in relation to certain of our activities.
Available Information
We file current and periodic reports, proxy statements, and other information with the SEC. The SEC maintains an Internet site that contains reports, proxy and information statements, and other information regarding issuers that file electronically with the SEC, at www.sec.gov. We make available free of charge on our website, www.genpact.com, our Annual Report on Form 10-K, Quarterly Reports on Form 10-Q, Current Reports on Form 8-K and amendments to those reports filed or furnished pursuant to Section 13(a) or 15(d) of the Securities Exchange Act of 1934, as amended, as soon as
reasonably practicable after we electronically file such material with, or furnish it to, the SEC. The contents of our website are not incorporated by reference into this Annual Report.
Information about our executive officers
The following table sets forth information concerning our executive officers as of February 29, 2024:
| | | | | | | | | | | | | | |
| Name | | Age | | Position(s) |
| Balkrishan Kalra | | 54 | | President, Chief Executive Officer and Director |
| Michael Weiner | | 52 | | Senior Vice President, Chief Financial Officer |
| Sameer Dewan | | 53 | | Senior Vice President, Global Business Leader, Financial Services |
| Piyush Mehta | | 55 | | Senior Vice President, Chief Human Resources Officer |
| Anil Nanduru | | 49 | | Senior Vice President, Global Business Leader, High Tech & Manufacturing and Consumer & Healthcare |
| Riju Vashisht | | 56 | | Senior Vice President, Chief Growth Officer and Global Business Leader, Enterprise Services and Partnerships & Alliances |
| Heather White | | 51 | | Senior Vice President, Chief Legal Officer and Corporate Secretary |
Balkrishan Kalra became our President and Chief Executive Officer in February 2024. Prior to his appointment as our Chief Executive Officer, he served as the Senior Vice President and Business Leader for our Consumer Goods, Retail and Life Sciences business since 2008, our Healthcare business since 2016 and our Financial Services business since 2020. Before he led our Consumer Goods, Retail and Life Sciences business, he held various roles at Genpact since joining us in 1999.
Michael Weiner has served as our Senior Vice President, Chief Financial Officer since August 2021. Before joining Genpact, he was the executive vice president, chief financial officer and treasurer of National General Holdings Corp. from 2010 to 2021. Prior to that, he worked with Ally Financial's GMAC Insurance unit, Cerberus Operations and Advisory Company, Citigroup, KPMG LLP and Bankers Trust Company.
Sameer Dewan has served as Senior Vice President and Global Business Leader for our Financial Services business since November 2023. Prior to that, he served as our Global Operating Officer from February to November 2023 and as the Global Business Leader for our Insurance and Capital Markets businesses from March 2021 to February 2023. Before joining Genpact in 2006, he served as a Master Black Belt in General Electric’s insurance operations.
Piyush Mehta has served as our Senior Vice President, Chief Human Resources Officer since March 2005. He has worked for us since 2001, initially as Vice President of Human Resources.
Anil Nanduru has served as our Senior Vice President and Global Business Leader for our High Tech and Manufacturing business since 2022 and our Consumer and Healthcare business since November 2023. Prior to these roles, Mr. Nanduru served as our Senior Vice President and Chief Commercial Officer. Before serving as our Chief Commercial Officer, he held various roles at Genpact since joining us in 2005.
Riju Vashisht has served as our Senior Vice President and Chief Growth Officer since 2022 and as the Global Business Leader for Enterprise Services, Partnerships and Alliances since December 2023. Prior to that, she served as our Senior Vice President and Chief Transformation Officer since 2020. She previously served as our Head of Digital Solutions and Transformation and as the Chief Operating Officer for our Consumer Goods, Retail, Life Sciences and Healthcare businesses. She previously was at Walmart India and Unilever India.
Heather White has served as our Senior Vice President, Chief Legal Officer and Corporate Secretary since April 2018. Ms. White has been with Genpact since 2005, and prior to her current role she served as our Senior Vice President and Deputy General Counsel. Before joining Genpact, she was a corporate attorney in the New York and London offices of Paul, Weiss, Rifkind, Wharton & Garrison LLP.
Item 1A. Risk Factors
Risks Related to our Business and Operations
We expect AI technology to have a significant impact on our industry and the markets in which we compete. The development and use of AI technologies presents competitive, reputational and legal risks, and our use of AI technologies may not be successful.
We believe that AI technology will have a significant impact on client preferences and market dynamics in our industry, and our ability to effectively compete in this space will be critical to our financial performance. We are working to expand the use of AI in the services we provide to our clients and also apply AI technologies in our own internal operations, and we expect to incur significant development and operational costs to support these efforts.
The market for AI technology and services is highly competitive and rapidly evolving. We face significant competition from our traditional competitors as well as other third parties, including those that are new to the market or our industry, and our clients may develop their own AI-related capabilities. We may also be unable to bring AI-enabled products and solutions to market as effectively, or with the same speed or in the same volumes, as our competitors, which may harm our competitive position. In addition, as these technologies evolve, we expect that some services that we currently perform for our clients will be replaced, in whole or in part, by AI or forms of automation. Each of the foregoing may lead to reduced demand for our services or harm our ability to obtain favorable pricing or other terms for our services, which could have a material adverse effect on our business, results of operations and financial condition.
The development, adoption, and use of AI technologies are still in their early stages. AI algorithms may be flawed, and datasets may be insufficient or contain biased information, which could result in unexpected, low quality or otherwise inadequate outputs. Ineffective or inadequate AI development or deployment practices by us, our clients, or third parties with whom we do business could result in unintended consequences, such as disclosure of sensitive information, infringement of third-party intellectual property rights or other incidents that impair the acceptance of AI solutions or cause harm to individuals or society. These deficiencies and other failures of AI systems could subject us to competitive harm, regulatory action, legal liability, and brand or reputational harm. Some AI capabilities present ethical issues, and we may be unsuccessful in identifying or resolving issues before they arise. If we enable or offer AI products or solutions or implement AI capabilities in our internal operations that are controversial because of their impact on human rights, privacy, employment, or other social, economic, or political issues, we may experience brand or reputational harm or greater employee attrition.
In addition, the legal and regulatory landscape surrounding AI technologies is rapidly evolving and uncertain including in the areas of intellectual property, cybersecurity, and privacy and data protection. Compliance with new or changing laws, regulations, industry standards or ethical requirements and expectations relating to AI may impose significant operational costs requiring us to change our service offerings or business practices, or may limit or prevent our ability to develop, deploy, or use AI technologies. Failure to keep pace with this evolving landscape may result in legal liability, regulatory action, or brand and reputational harm.
Our business depends on generating and maintaining ongoing, profitable client demand for our services and solutions, and a significant reduction in such demand or an inability to respond to or compete in the rapidly evolving technological environment could materially affect our results of operations.
Our revenue and profitability depend on the demand for our services and solutions with favorable margins, which could be negatively affected by numerous factors, many of which are beyond our control and unrelated to our work product. Our success depends, in part, on our ability to continue to develop and implement services and solutions that anticipate and respond to rapid and continuing changes in technology and offerings to serve the evolving needs of our clients. Examples of areas of significant change include digital- and cloud-related offerings, which are continually evolving as developments such as AI, automation, Internet of Things and as-a-service solutions are commercialized. Technological developments such as these may materially affect the cost and use of technology by our clients and, in the case of as-a-service solutions, could affect the nature of how we generate revenue. Some of these technologies, such as cloud-based services, AI, automation, and others that may emerge, have reduced and replaced some of our historical services and solutions and may continue to do so in the future. This has caused, and may in the future cause, clients to delay spending under existing contracts and engagements and to delay entering into new contracts while they evaluate new technologies. Such delays can negatively impact our results of operations if the pace and level of spending on new technologies is not sufficient to make up any shortfall.
Additionally, in recent years, as a result of a number of factors, including changing client preferences, an increase in Data-Tech-AI services and economic pressures that can cause delays or reductions in client purchasing decisions, the percentage of our revenues from consulting and other short-cycle engagements has increased.
When an increased share of our revenues is derived from these engagements, business forecasting becomes more complex given the more discretionary and non-recurring nature of these services compared to our traditional managed services. Our contracts for consulting and other short-cycle engagements typically permit our clients to terminate the agreement with less notice than is required under our longer-term contracts for our Digital Operations services and without paying termination fees. Our failure to effectively manage, develop and sell these shorter-cycle engagements, as well as our inability to accurately forecast revenues from these engagements (as has occurred in the past), could adversely affect our business, growth strategy and results of operations.
Developments in the industries we serve, which are increasingly rapid, have shifted and may continue to shift demand to new services and solutions. If we fail to keep pace with the development or integration of new technologies, including generative AI, or to adapt to other changes in the industries we serve or our clients' demand for new services and solutions, we may be less competitive in these new areas or need to make significant investment to meet that demand. Our growth strategy focuses on responding to these types of developments by driving innovation that will enable us to expand our business into new growth areas. If we do not sufficiently invest in new technology and adapt to industry developments, or evolve and expand our business at sufficient speed and scale, or if we do not make the right strategic investments to respond to these developments and successfully drive innovation, our services and solutions, results of operations, and ability to develop and maintain a competitive advantage and to execute on our growth strategy could be negatively affected.
Companies in the industries we serve sometimes seek to achieve economies of scale and other synergies by combining with or acquiring other companies. If one of our current clients merges or consolidates with a company that relies on another provider for the services and solutions we offer, we may lose work from that client or lose the opportunity to gain additional work if we are not successful in generating new opportunities from the merger or consolidation.
Our success depends in part on our retention of key members of our senior leadership team and our ability to manage the transition of our new Chief Executive Officer.
Our future success depends in part on our ability to attract and retain key employees, including our executive officers and other members of our senior leadership team. These executives possess business and technical capabilities and institutional knowledge that are difficult to replace. Our employment agreements with our Chief Executive Officer and other members of our executive management team do not obligate them to work for us for any specified period. If we lose key members of our senior leadership team, we may not be able to effectively manage our current operations or meet ongoing and future business challenges, and this may have a material adverse effect on our business, results of operations and financial condition.
On February 9, 2024, Balkrishan Kalra became our Chief Executive Officer, replacing N.V. Tyagarajan, who had served in that role since 2011. Any significant leadership change or executive management transition, such as our transition to a new Chief Executive Officer, involves inherent risk and can be difficult to manage. We have made, and may continue to make, significant accompanying strategic changes, such as changing the composition of our leadership team. Initially, such changes could be disruptive to our daily operations or relationships with clients, suppliers, and employees, make it more difficult to hire and retain key employees or impact our public or market perception, any of which could have a negative impact on our business or share price. In addition, management transitions inherently cause some loss of institutional knowledge, which could negatively affect strategy and operation execution during the transitional phase. Management transitions may also create uncertainty and involve a diversion of resources and management attention, which could negatively impact our ability to operate effectively or execute our strategies.
We face legal, reputational and financial risks from any failure to safeguard our systems and protect client, Genpact or employee data from security incidents or cyberattacks.
In providing our services and solutions to clients, we often collect, process and store proprietary, personally identifying or other sensitive or confidential client and other third-party data. In addition, we collect, process and store data regarding our employees and contractors. As a result, we are subject to numerous data protection and privacy laws and regulations designed to protect this information in the countries in which we operate as well as the countries of residence of the persons whose data we process. We have established security measures and internal controls designed to prevent the inadvertent or intentional exposure or loss of personally identifiable information and other sensitive or confidential data. We regularly assess the adequacy of and make improvements to such security measures and controls. However, if any person, including any of our current or former employees or contractors, negligently disregards or intentionally breaches our or our clients’ established security policies, measures and controls with respect to client, third-party or Genpact protected data or if we do not adapt to changes in data protection legislation, we could be subject to significant litigation, monetary damages, regulatory enforcement actions, fines and/or criminal prosecution in one or more jurisdictions.
Our employees and contractors have in the past engaged, and may in the future engage, in fraudulent conduct or other conduct that violates our client contracts or our internal controls or policies, whether intentionally or inadvertently. We have experienced security incidents due to the actions of our employees or contractors, though none of these incidents has had a material impact on our operations or financial results or resulted in any regulatory fines or penalties.
The threat of incursions into our information systems and technology infrastructure has increased in recent years as the sophistication of threat actors who have hacked, attacked, held for ransom or otherwise disrupted information systems of other companies and misappropriated or disclosed data has increased. Threat actors are also increasingly taking advantage of the proliferation of technology platform vulnerabilities disclosed by software companies to exploit the weaknesses before patches are applied. Additionally, threat actors are increasingly using AI and generative AI capabilities to enhance their attack techniques, including by creating deepfakes or exploitation code. We could also be impacted by cyberattacks by nation states or other organizations arising out of geopolitical tensions or conflicts, including, for instance, by Russia or Russian-based actors in connection with the Russia/Ukraine conflict. We may be unable to anticipate the techniques used by threat actors to infiltrate our systems and may fail to detect or timely detect when an incursion has occurred or to implement adequate preventative and responsive measures. Additionally, in the event of a ransomware or other attack involving data theft and encryption, we could face delays in the recovery of data, or a total loss of data, in the event of a lack of adequate backups or recovery processes. The steps we have taken to protect our information systems and data security may be inadequate. Actual or perceived breaches of our security, whether through breach of our computer systems, systems failure (including due to aged IT systems or infrastructure) or otherwise, could influence the market perception of the effectiveness of our security measures and, as a result, our reputation could be harmed and we could lose existing or potential clients. Media or other reports of perceived breaches or weaknesses in our systems, products or networks could also adversely impact our brand and reputation and materially affect our business.
Our clients, suppliers, subcontractors, and other third parties with whom we do business, including in particular cloud service providers and software vendors, generally face similar cybersecurity threats, and we must rely on the safeguards adopted by these third parties. If these third parties do not have adequate safeguards or their safeguards fail, it might result in breaches of our systems or applications and unauthorized access to or disclosure of our and our clients’ confidential data. In addition, the products, services and software that we use and provide to our clients, or the third-party components of such products, services and software, sometimes contain or introduce cybersecurity threats or vulnerabilities to our and our clients’ information technology networks, intentionally or unintentionally. We are regularly alerted to vulnerabilities in third-party technology components we use in our business that create risks in our environments. We typically are not aware of such vulnerabilities until we receive notice from the third parties who have discovered the exposure, and our responses to such vulnerabilities may not be adequate or prompt enough to prevent their exploitation.
Our clients’ proprietary, sensitive, or confidential information could also be compromised by a cybersecurity attack affecting us, or their systems could be disabled or disrupted as a result of such an attack. Our clients, regulators, or other third parties may attempt to hold us liable, through contractual indemnification clauses or directly, for any such losses or damages resulting from such an attack. We may also be liable to our clients or others for damages caused by disclosure of confidential information or system failures. Many of our contracts do not limit our potential liability for breaches of confidentiality. We may also be subject to civil actions and criminal prosecution by governments or government agencies for breaches relating to such data. Our insurance coverage or indemnification protections for breaches or mismanagement of such data may not be adequate to cover all costs related to data loss, cybersecurity attacks, or disruptions resulting from such events, or they may not continue to be available on reasonable terms or in sufficient amounts to cover one or more large claims against us and our insurers may disclaim coverage as to any future claims. The impact of these cybersecurity attacks, data losses, and other security breaches cannot be predicted, but any such attack, loss or breach could disrupt our operations, or the operations of our clients, suppliers, subcontractors, or other third parties. Incidents of this type have in the past and may in the future require significant management attention and resources and have in the past and may in the future result in the loss of revenues from clients. These incidents could also result in regulatory fines and penalties, financial liability, and reputational harm among our clients and the public, any of which could have a material adverse impact on our financial condition, results of operations, or liquidity.
While we have developed and implemented security measures and internal controls designed to prevent, detect and respond to cyber and other security threats and incidents, such measures cannot guarantee security and may not be successful in preventing security breaches or in their timely detection or effective response. In the ordinary course of business, we are subject to regular incursion attempts from a variety of sources, and we have experienced security incidents, including from cyber threat actors, as a result of attack techniques such as phishing, social engineering, vulnerability exploitation and malware. To date such incidents have not had a material impact on our operations or financial results. However, there is no assurance that such impacts will not be material in the future.
Additionally, our hybrid working model, which includes a high number of employees working remotely, has reduced our ability to enforce physical security controls and monitor employee conduct and has increased the risk that our employees will engage in impermissible or careless conduct, which could give rise to reputational harm and legal liability. Our inability to enforce physical security controls and monitor our employees working remotely also increases the risk of security incidents. Measures we have taken in the remote work environment to implement suitable additional controls and educate our employees on the importance of cybersecurity, data loss prevention and related best practices may not prevent data breaches, the occurrence of which could have a material adverse impact on our business, reputation, financial condition, and results of operations.
A substantial portion of our assets, employees and operations are located in India and we are subject to regulatory, economic, social and political uncertainties in India.
We are subject to several risks associated with having a substantial portion of our assets, employees and operations located in India. A majority of our employees are based in India and a majority of our services are performed in India, which makes our business particularly sensitive to general economic conditions and economic and fiscal policy changes in India. Various factors, such as changes in the central or state Indian governments, could trigger changes in India’s economic liberalization and deregulation policies and disrupt business and economic conditions in India generally and our business in particular. Our ability to continue to leverage the skills and experience of our workforce in India to provide our services at competitive prices depends in part on the stability of the business environment in India, and if the Indian government pursues economic policies that are unfavorable to us or that otherwise significantly increase the cost of doing business in India, our competitive advantage may be diminished and our business, financial condition and results of operations could be materially adversely impacted.
We have historically benefited from many policies of the Government of India and the Indian state governments in the states in which we operate which are designed to promote foreign investment generally and in our industry in particular, including significant fiscal incentives, relaxation of regulatory restrictions, liberalized import and export duties and preferential rules on foreign investment and repatriation. However, many of the fiscal policies we have benefited from in the past have lapsed or are no longer available to us, and there is no assurance that fiscal policies from which we continue to benefit will be available to us in the future.
Additionally, the Indian government has also challenged our entitlement to certain benefits we have claimed in the past. During the period from 2017 to 2020, we received benefits totaling $59 million from the Director General of Foreign Trade (“DGFT”) of India pursuant to the Services Export from India Scheme (“SEIS"). These benefits were available to us in respect of our export of certain services eligible under the SEIS scheme. However, in the fourth quarter of 2023, the DGFT issued us a show cause notice challenging our entitlement to such benefits. In the event that it is ultimately determined that we were not eligible for these benefits, we could be liable for recovery of the amount received along with penalties and interest, which could be material.
Changes in our tax rates or tax provisions, adverse tax audits and other proceedings, or changes in tax laws or their interpretation or enforcement could have an adverse effect on our business, results of operations, effective tax rate and financial condition.
We are subject to income taxes in the United States and in numerous foreign jurisdictions, notably in India where we have substantial operations. Our provision for income taxes, actual tax expense and tax liability could be adversely affected by a variety of factors, including lower income before taxes generated in countries with lower tax rates, higher income generated in countries with higher tax rates, changes in tax laws and regulations or in the interpretation or enforcement of such laws and regulations, changes in applicable income tax treaties, changes in accounting principles or interpretations thereof or in the valuation of deferred tax assets and liabilities, the elimination or expiration of certain tax concessions, exemptions or holidays that had reduced our tax liability, and adverse outcomes of tax examinations or tax-related litigation, including a determination by any tax authority that our transfer prices are not appropriate or that our intercompany transactions should be characterized differently than we have characterized them. Changes in tax laws, treaties or regulations impacting our business, and their interpretation and enforcement, have become more unpredictable in recent years and could result in unexpected and unfavorable outcomes. Additionally, changes in tax laws proposed by the Biden administration, if enacted, could negatively impact our effective tax rate. Any of these factors could have a material adverse effect on our business, results of operations, effective tax rate and financial condition.
We are subject to examination of our income tax returns by the U.S. Internal Revenue Service and tax authorities around the world, notably in India where we have substantial operations. Tax authorities have disagreed in the past, and may in the future disagree, with our tax positions, and particularly in India are increasingly taking aggressive stances opposing the tax positions we take, including with respect to our intercompany transactions. Negative outcomes from those examinations or any appeals therefrom may adversely affect our provision for income taxes and tax liability, and the amounts we are ultimately required to pay could be materially different from the amounts we anticipated, which in turn could have a material adverse effect on our business, results of operations, effective tax rate and financial condition.
We are currently subject to several tax audits by the Indian tax authorities (“ITA”) related to intercompany transactions that occurred in 2009, 2013 and 2015. In each of 2014, 2016, 2019, 2022 and 2023, the ITA issued assessment orders seeking to impose tax on us in relation to such transactions. We have received demands for potential tax claims related to these orders in an aggregate amount of $230 million (converted from Indian rupees and including interest through the date of the orders). We do not believe that any of the transactions giving rise to these demands were subject to tax in India under applicable law. To date, we have received favorable orders from appellate judicial authorities in India relating to $119 million of the $230 million demanded in the assessment orders, and we continue to defend against the remaining $111 million in demands. Additionally, in the first quarter of 2023, the ITA issued an assessment order seeking to impose tax on us of $856 million (converted from Indian rupees and including interest through the date of the order) in relation to a 2015 internal restructuring transaction involving our Indian subsidiaries. In March 2023, the tax appellate authority in India struck down this order. The ITA have since appealed this ruling.
We have appealed all of the outstanding orders from the ITA and have not provided a reserve for the related exposures, which would be material. Although we have received favorable orders as to certain of the ITA’s demands, and have appealed others, we may ultimately not prevail in some or all of these matters. In the event we do not prevail in these matters, the total amounts owed in connection with these demands would be material and subject to additional interest accrued over the period since the demands were made, and the amount of this additional interest also would be material. A final determination of tax in the amounts claimed by the ITA would likely have a material adverse effect on our business, results of operations, effective tax rate and financial condition. See Note 26—“Commitments and contingencies” to our consolidated financial statements under Part IV, Item 15—“Exhibits and Financial Statement Schedules” for additional information relating to these matters.
Additionally, in 2012, the Government of India appealed a 2011 ruling by the Delhi High Court that Genpact India Private Limited (one of our subsidiaries) cannot be held to be a representative assessee of GE in connection with an assertion that GE has tax liability in India by reason of a 2004 transfer of shares of our predecessor company. We believe that, if the Government of India is successful in its appeal, GE would be obligated to indemnify us for any resulting tax, though there can be no assurance as to the outcome of this matter.
Furthermore, many jurisdictions, including the United States and the EU, as well as multinational organizations, such as the Organization for Economic Cooperation and Development (the "OECD") have sought to amend existing international tax rules in order to render them more responsive to current global business practices. In December 2021, the OECD announced an agreed framework for “Pillar Two” of its previously published package of measures that included a two-pillar plan for a global tax framework to reform the international tax rules as a product of its Base Erosion and Profit Shifting (the "BEPS") initiative, which was endorsed by the G20 finance ministers. As part of the announced framework, the OECD released Global Anti-Base Erosion (“GloBE”) rules with the purpose of ensuring multinational companies pay a minimum corporate tax rate of 15% on the income generated in each of the jurisdictions in which they operate. In December 2022, the European Council adopted the directive implementing the minimum tax rate (Pillar Two) at the EU level, and several countries have indicated they plan to adhere to the OECD guidelines. The OECD continues to release additional guidance, and many jurisdictions are implementing legislation with widespread adoption of the Model GloBE Rules for Pillar Two. A few jurisdictions have implemented legislation with effective dates beginning from 2024 through 2026. The new legislation did not impact our 2023 annual effective tax rate. However, there can be no assurance that our effective tax rate will be unaffected in the future, and the new legislation implementing the GloBE rules may have an adverse impact on our financial condition, effective tax rate or results of operations in future periods.
The global tax environment is increasingly complex and uncertain. Although we monitor these developments, it is very difficult to assess to what extent changes and other proposals, if enacted, may be implemented in India, the United States and other jurisdictions in which we conduct our business or may impact the way in which we conduct our business or our effective tax rate due to their unpredictability and interdependency. As these and other tax laws and related regulations and practices change, those changes could have a material adverse effect on our business, results of operations, effective tax rate and financial condition.
Our profitability will suffer if we are not able to price appropriately, effectively utilize new technologies, maintain employee and asset utilization levels and control our costs.
Our profitability is largely a function of the efficiency with which we utilize our assets, and in particular our people and delivery centers, and the pricing that we are able to obtain for our services. Our utilization rates are affected by a number of factors, including our ability to transition employees from completed projects to new assignments, hire and assimilate new employees, forecast demand for our services and thereby maintain an appropriate headcount in each of our geographies and manage attrition, and our need to devote time and resources to training, professional development and other typically non-chargeable activities.
The prices we are able to charge for our services are affected by a number of factors, including our clients’ perceptions of our ability to add value through our services, competition, introduction of new services, technologies (including generative AI) or products by us or our competitors, our ability to accurately estimate, attain and sustain revenues from client engagements, margins and cash flows over long contract periods and general economic and political conditions. Therefore, if we are unable to price appropriately or manage our asset utilization levels, there could be a material adverse effect on our business, results of operations and financial condition. Our profitability is also a function of our ability to control our costs and improve our efficiency. As we increase the number of our employees and grow our business, we may not be able to manage the significantly larger and more geographically diverse workforce that may result and our profitability may decrease or may not improve. New taxes may also be imposed on our services such as sales taxes or service taxes which could affect our competitiveness as well as our profitability. Additionally, we may fail to appropriately estimate our costs in agreeing to provide new or novel services with unique pricing arrangements or service delivery requirements.
Wage increases in the countries where we operate may reduce our profit margin.
Salaries and related benefits of our employees are our most significant costs. Demand and competition for skilled employees, especially employees with the mix of skills and experience that we need to provide certain of our services, continue to be high. As wage levels for skilled employees increase in most of the countries in which we operate because of, among other reasons, tight labor markets and inflation, wage increases continue to adversely affect our profitability and may continue to adversely affect our profitability in the future to the extent that we are not able to control or share wage increases with our clients. Sharing wage increases may also cause our clients to be less willing to utilize our services. We will attempt to control such costs by seeking to add capacity in locations where we consider wage levels of skilled personnel to be satisfactory, but we may not be successful in doing so. In recent years we have had to increase our wage levels for certain roles significantly in a short period of time, and we may in the future need to increase our wage levels significantly and rapidly in order to attract the quantity and quality of employees that are necessary for us to remain competitive, which may have a material adverse effect on our business, results of operations and financial condition.
We engage independent contractors in various U.S. states in the ordinary course of business. Several U.S. states have enacted legislation that requires businesses to consider individuals to be employees who, under current law in most other U.S. states, would be considered independent contractors. If additional states or the U.S. federal government pass similar legislation, we may be required to modify our hiring plans and associated business model, which may increase our cost of doing business.
In addition, in early 2019, the Supreme Court of India clarified that certain allowances paid by an employer to an employee should be included for purposes of calculating provident fund contributions in addition to contributions based on basic wages alone. If this decision is implemented with retrospective application, the amount of the payments that we are required to make at that time to or for the benefit of our employees could be substantial and could have a material adverse effect on our business, results of operations and financial condition.
Additionally, new labor codes enacted by the Government of India in 2019 will, once made effective, change the definition of wages for purposes of determining employer contributions under the provident fund and other statutory benefit schemes, including the Indian gratuity plan. As a result of this new legislation, our compensation cost in India may increase, which could adversely affect our profitability, results of operations and financial condition.
We may fail to attract and retain enough qualified employees to support our operations.
Our industry relies on large numbers of skilled employees, and our success and profitability depend on our ability to attract, train and retain a sufficient number of employees with the right mix of skills and experience to perform services for our clients. High employee attrition is common in our industry. In 2023, our attrition rate for all employees who were employed for a day or more was 24%, which is lower than our normalized historical attrition rate in the range of 26% to 28%. We cannot assure you that we will be able to maintain our attrition rate at the 2023 level. If our attrition rate increases beyond the 2023 level or rises above our historical average attrition rate for an extended period, our operating efficiency and productivity may decrease.
Competition for qualified employees, particularly in India and the United States, remains high and we expect such competition to continue. We compete for employees not only with other companies in our industry but also with companies in other industries, such as software services, engineering services and financial services companies. In many locations in which we operate, there is a limited pool of employees who have the mix of skills and experience we need to perform services for our clients. We must hire or reskill, retain and motivate appropriate numbers of skilled employees with diverse experience in order to serve clients across the globe, respond quickly to rapid and ongoing changes in demand for our services and new technologies, and continuously innovate to grow our business. If we are unable to hire or retrain our employees to keep pace with the rapid and continuous changes in technology and the industries we serve, we may not be able to innovate quickly enough and fulfill client demand. If our business continues to grow, the number of people we will need to hire will increase.
We will also need to increase our hiring if we are not able to maintain our attrition rate through innovative recruiting and retention policies. Additionally, if we are unable to offer our employees a value proposition that is competitive and appealing, our employee engagement and retention rate may suffer, which could materially adversely affect our business.
In 2023, we continued to face increased competition for talent with scarce skills and capabilities in new technologies, and our competitors have directly targeted our employees with these highly sought-after skills and may continue to do so. As a result, we may be unable to cost-effectively hire and retain employees with these market-leading skills, which may cause us to continue to incur increased costs or be unable to fulfill client demand for our services and solutions. Sustained competition for employees, or an increase in competition from the current heightened levels, could have an adverse effect on our ability to expand our business and service our clients, as well as cause us to incur greater personnel expenses and training costs.
We enter into long-term contracts and fixed-price contracts with our clients. Our failure to price these contracts correctly may negatively affect our profitability.
The pricing of our services is usually included in SOWs entered into with our clients, many of which are for terms of two to five years. In certain cases, we have committed to pricing over this period with only limited sharing of risk regarding inflation and currency exchange rates. In addition, we are obligated under some of our contracts to deliver productivity benefits to our clients. If we fail to estimate accurately future wage inflation rates, currency exchange rates or our costs, or if we fail to accurately estimate the productivity benefits we can achieve under a contract, it could have a material adverse effect on our business, results of operations and financial condition.
A portion of our SOWs are currently billed on a fixed-price basis rather than on a time-and-materials basis. We may also increase the number of fixed-price contracts we perform in the future. Any failure to accurately estimate the resources or time required to complete a fixed-price engagement or to maintain the required quality levels or any unexpected increase in the cost to us of employees, office space or technology could expose us to risks associated with cost overruns and could have a material adverse effect on our business, results of operations and financial condition.
Our partnerships, alliances and relationships with third-party suppliers and contractors and other third parties with whom we do business expose us to a variety of risks that could have a material adverse effect on our business.
Our partnerships and alliances and our relationships with a variety of third parties, including suppliers, contractors and others, expose us to a variety of risks that could have a material adverse effect on our business, and we may not be successful in mitigating such risks. Our operations depend on our ability to anticipate our and our clients' needs for products and services, as well as our suppliers’ ability to deliver sufficient quantities and quality of products and services at reasonable prices and in time for us to meet commitments for the delivery of our own services. In addition, we must adequately address quality issues associated with our services, including with respect to any third-party components to our services. Any performance failure on the part of our partners or the third parties with whom we do business, or the discontinuance by such third parties or partners of services that we have relied on them to perform for our clients, could delay our performance or require us to engage alternative third parties to perform the services at our cost or to perform them ourselves, any of which could deprive us of potential revenue or adversely impact our profitability. Additionally, our partners, third-party suppliers and contractors and other third parties with whom we do business may not be able to comply with current good business practices or applicable laws or regulatory requirements. Our failure, or the failure of such third parties, to comply with applicable laws and regulations could result in sanctions being imposed on us, including fines, injunctions, civil penalties and criminal prosecutions, any of which could significantly and adversely affect our business.
We may have limited control over the amount and timing of resources that our partners and third parties with whom we do business dedicate to their arrangements with us. Our ability to generate revenue from these arrangements will depend on our partners’ or other third parties’ desire and ability to successfully perform the functions assigned to them in these arrangements. Further, certain of our suppliers, partners and other contractors may decide to discontinue conducting business with us.
In addition, we are a party to a number of license agreements with third parties and expect to enter into additional licenses in the future. Our existing licenses impose, and we expect that future licenses will impose, various obligations and restrictions on us. If we fail to comply with these obligations and restrictions, the licensor may have the right to terminate the license, in which event we might not be able to market any product or service that is covered by these agreements, which could materially adversely affect our business. Termination of these license agreements or reduction or elimination of our licensed rights may result in our having to negotiate new or reinstated licenses with less favorable terms, or cause us to lose rights in important intellectual property or technology.
Any of the foregoing may prevent us from working with our partners or third parties with whom we do business and could subject us to losses, affect our ability to bring products and services to market, cause us to fail to satisfy our client obligations and harm our reputation.
Our success largely depends on our ability to achieve our business strategies, and our results of operations and financial condition may suffer if we are unable to continually develop and successfully execute our strategies.
Our future growth, profitability and cash flows largely depend upon our ability to continually develop and successfully execute our business strategies. While we have confidence that our strategic plans reflect opportunities that are appropriate and achievable, the execution of our strategy may not result in long-term growth in revenue or profitability due to a number of factors, including incorrect assumptions, global or local economic conditions, competition, changes in the industries in which we operate, suboptimal resource allocation or any of the other risks described in this “Risk Factors” section. In pursuit of our growth strategy, we have invested and will continue to invest significant time and resources into developing new product or service offerings, including through the use of AI and generative AI, and transforming, adapting and upskilling our workforce, and these undertakings may fail to yield sufficient return to cover our investments in them. The failure to continually develop and execute optimally on our business strategies could have a material adverse effect on our business, financial condition and results of operations.
Business disruptions could seriously harm our future revenue and financial condition and increase our costs and expenses.
We have employees in more than 35 countries and significant operations in more than 20 countries, and these global operations could be disrupted at any time by natural or other disasters, telecommunications failures, power or water shortages, extreme weather conditions (whether as a result of climate change or otherwise), medical epidemics or pandemics and other natural or manmade disasters or catastrophic events. The occurrence of any of these business disruptions could result in significant losses, seriously harm our revenue, profitability and financial condition, adversely affect our competitive position, increase our costs and expenses, and require substantial expenditures and recovery time in order to fully resume operations. In addition, global climate change may result in certain natural disasters occurring more frequently or with greater intensity, such as earthquakes, tsunamis, cyclones, drought, wildfires, sea-level rise, heavy rains and flooding, and any such disaster or series of disasters in areas where we have a high concentration of employees, such as India, could significantly disrupt our operations and have a material adverse effect on our business, results of operations and financial condition.
Our operations could also be disrupted as a result of technological failures, such as electricity or infrastructure breakdowns, including damage to telecommunications cables, computer glitches and electronic viruses, or human-caused events such as protests, riots, labor unrest and cyberattacks. Such events, or any natural or weather-related disaster, could lead to the disruption of information systems and telecommunication services for sustained periods. Damage or destruction that interrupts our provision of services could adversely affect our reputation, our relationships with our clients, our leadership team’s ability to administer and supervise our business or it may cause us to incur substantial additional expenditure to repair or replace damaged equipment or delivery centers. Our operations and those of our significant suppliers and distributors could be adversely affected if manufacturing, logistics or other operations in these locations are disrupted for any reason, such as those listed above. Even if our operations are unaffected or recover quickly from any such events, if our clients cannot timely resume their own operations due to a catastrophic event, they may reduce or terminate our services, which may adversely affect our results of operations. We may also be liable to our clients for disruption in service resulting from such damage or destruction.
Our business continuity and disaster recovery plans may not be effective at preventing or mitigating the effects of any of the foregoing business disruptions, particularly in the case of a catastrophic event. Prolonged disruption of our services would also entitle our clients to terminate their contracts with us. While we currently have commercial liability insurance, our insurance coverage may not be sufficient. Furthermore, we may be unable to secure such insurance coverage at premiums acceptable to us in the future or at all. Any of the above factors may have a material adverse effect on our business, results of operations and financial condition.
Our results of operations could be adversely affected by economic and political conditions and the effects of these conditions on our and our clients’ businesses and levels of business activity.
Global macroeconomic conditions affect our business, our clients’ businesses and the markets we serve. Volatile, negative or uncertain economic conditions in our significant markets have in the past and could in the future undermine business confidence and cause our clients to reduce, postpone or cancel their spending on projects with us, which has negatively affected our business and may continue to do so in the future, including by making it more difficult for us to accurately forecast client demand and effectively build revenue and resource plans.
For example, in 2023 some of our clients reduced their discretionary spending in response to economic uncertainty, which negatively impacted our revenues. Clients may reduce demand for services suddenly or with limited warning, which may cause us to incur extra costs where we have employed more personnel than client demand supports.
Our business is particularly susceptible to economic and political conditions in the markets where our clients or operations are concentrated. A material portion of our revenues is derived from our clients in North America and Europe, and weak demand, or any other adverse economic, political or legal uncertainties or developments, in these markets could have a material adverse effect on our results of operations. Differing economic conditions and patterns of economic growth and contraction in the geographical regions in which we operate and the industries we serve have affected and may in the future affect demand for our services. Changing demand patterns from economic volatility and uncertainty could also have a significant negative impact on our results of operations.
In addition, broader global geopolitical tensions, including actual or anticipated military or political conflicts (such as the ongoing conflict between Russia and Ukraine, tensions across the Taiwan Strait, the Israel-Hamas conflict and other actions in the Middle East), and actions that governments take in response may adversely impact us. For instance, in response to the ongoing conflict between Russia and Ukraine, the United States and other countries in which we operate have imposed broad sanctions and may impose additional sanctions or other restrictive actions against governmental and other entities in Russia. We do not have employees or operations in Russia or Ukraine, but we have operations in surrounding countries, and we have clients that do business in Russia and Ukraine. Such clients may be adversely affected by the ongoing conflict and related sanctions and other governmental actions, which in turn could have an adverse impact on our revenues from such clients. Additionally, given the global nature of our operations, the broader macroeconomic impact of sanctions imposed on Russia and other macroeconomic impacts of the protracted conflict could have an adverse impact on our business, profitability, results of operations and financial condition. We also have limited employees and operations in Israel, and while we have not experienced any material impacts to our operations in Israel to date, there can be no assurance that our operations there will not be materially adversely affected if the conflict escalates or persists for an extended period. The impact of geopolitical conflicts, including those identified above, any further escalation or expansion and the broader geopolitical, economic, and other effects of such conflicts could also heighten the other risks identified in this Annual Report on Form 10-K.
Additionally, increased operating costs resulting from ongoing inflationary pressures, including increases in compensation and other expenses for our employees, have adversely affected our profitability and could continue to do so. Broad-based inflation will also continue to increase the costs of operating our delivery centers. We have not been able to, and may in the future be unable to, fully offset these cost increases by raising prices for our services, particularly because our client agreements generally fix our pricing for periods of time. This has resulted in and is expected to continue to result in downward pressure on our gross margins and operating income. Further, our clients may choose to reduce their business with us or cancel, defer or delay projects if we increase our pricing. If we are unable to successfully adjust pricing, reduce costs or implement other countermeasures, our profitability could be materially adversely affected.
We may be subject to claims and lawsuits for substantial damages, including by our clients arising out of disruptions to their businesses or our inadequate performance of services.
We depend in large part on our relationships with clients and our reputation for high-quality services to generate revenue and secure future engagements. Most of our service contracts with clients contain service level and performance requirements, including requirements relating to the quality of our services. Failure to consistently meet service requirements of a client, whether due to: (a) natural or other disasters, telecommunications failures, power or water shortages, extreme weather conditions (whether as a result of climate change or otherwise), medical epidemics, pandemics or other contagious diseases, or other natural or manmade disasters or catastrophic events; (b) breach of or incursion into our computer systems (for example, through a ransomware attack); (c) other systems failure, including due to aged IT systems or infrastructure; or (d) errors made by our employees in the course of delivering services to our clients could disrupt the client’s business and result in a reduction in our revenues, clients terminating their business relationships with us and/or a claim for damages against us. Additionally, we could incur liability if a process we manage for a client were to result in internal control failures or impair our client’s ability to comply with its own internal control requirements.
We are also subject to actual and potential claims, lawsuits, investigations and proceedings outside of errors and omissions claims. For example, we engage in trust and safety services on behalf of clients, including content moderation, which could have a negative impact on our employees performing such services due to the nature of the materials they review. These types of services have been the subject of negative media coverage as well as litigation, and we may face adverse judgments or settlements or damage to our brand or reputation as a result of our provision of these services.
Under our MSAs with our clients, our liability for breach of our obligations is generally limited to actual damages suffered by the client and is typically capped at an agreed amount. These limitations and caps on liability may be unenforceable or otherwise may not protect us from liability for damages.
In addition, certain liabilities, such as claims of third parties for which we may be required to indemnify our clients or liability for breaches of confidentiality, are generally not limited under those agreements. Our MSAs are governed by laws of multiple jurisdictions, therefore the interpretation of such provisions, and the availability of defenses to us, may vary, which may contribute to the uncertainty as to the scope of our potential liability. Although we have commercial general liability insurance coverage, the coverage may not continue to be available on acceptable terms or in sufficient amounts to cover one or more large claims and our insurers may disclaim coverage as to any future claims.
The successful assertion of one or more large claims against us that exceed available insurance coverage, or changes in our insurance policies (including premium increases or the imposition of large deductible or co-insurance requirements), could have a material adverse effect on our reputation, business, results of operations and financial condition. It is also possible that future results of operations or cash flows for any particular quarterly or annual period could be materially adversely affected by an unfavorable resolution of these matters. In addition, these matters divert management and personnel resources away from operating our business. Even if we do not experience significant monetary costs, there may be adverse publicity or social media attention associated with these matters that could result in reputational harm, either to us directly or to the industries or geographies we operate in, that may materially adversely affect our business, client or employee relationships. Further, defending against these claims can involve potentially significant costs, including legal defense costs.
Recent and future legislation and executive action in the United States and other jurisdictions could significantly affect the ability or willingness of our clients and prospective clients to utilize our services.
In the United States, federal and state measures aimed at limiting or restricting, or requiring disclosure of offshore outsourcing have been occasionally proposed and enacted. In addition, public figures in the United States have from time to time suggested that U.S. businesses be subjected to tax or other adverse consequences for outsourcing, with incentives for returning outsourced operations to the United States, although it is not known what specific measures might be proposed or how they would be implemented and enforced, or whether emerging or enacted tax reform or other near-term Congressional action will affect companies’ outsourcing practices. There can be no assurance that pending or future legislation or executive action in the United States that would significantly adversely affect our business, results of operations, and financial condition will not be enacted.
To date, fourteen U.S. states have enacted comprehensive privacy laws, and some other states have enacted privacy laws that specifically regulate consumer health data. These state privacy laws generally require that the use, retention, and sharing of personal information of residents be reasonably necessary and proportionate to the purposes of collection or processing, that businesses provide notice to data subjects regarding the information collected about them and how such information is used and shared, and provide data subjects the right to opt out of sales of their personal information and, in some cases, request the erasure of their personal information. In addition, a comprehensive federal privacy law has been proposed in the U.S. Congress. Such laws, whether currently in effect or becoming effective in the future, carry substantial penalties for non-compliance, and any potential enforcement actions brought under these laws could lead to both business and reputational harm.
Legislation enacted in certain European jurisdictions, and any future legislation in Europe, Japan or any other region or country in which we have clients restricting the performance of business process services from an offshore location or imposing burdens on companies that outsource data processing functions, could also have a material adverse effect on our business, results of operations and financial condition. For example, the legal mechanisms for transferring personal data from the EU to other countries continue to evolve in response to legislation, rulemaking, and litigation. In 2020, the Court of European Justice (the "CJEU") invalidated the EU-U.S. Privacy Shield framework, which was previously one of the mechanisms that had been used to legitimize the transfer of personal data from the EEA to the United States. In 2022, the EU-U.S. Data Privacy Framework ("DPF") was agreed to replace the Privacy Shield framework. The CJEU decision in 2020 also restricted the use of standard contractual clauses ("SCCs"), an alternative mechanism for transferring personal data outside of the EU, leading to the issuance of new SCCs intended to address issues raised in the CJEU decision. A potential challenge to the DPF may also affect the validity of the revised SCCs as basis for transferring EU personal data.
With the withdrawal of the United Kingdom (the “UK”) from the EU, the UK amended its Data Protection Act 2018 to retain UK national data protection law comparable to the EU’s GDPR. We must also navigate cross-border data transfer restrictions in the UK. The European Commission and UK regulators have authorized continued personal data transfers between the EEA and the UK, but the UK has its own rules for regulating personal data transfers to other jurisdictions, such as the U.S. The UK recently approved an International Data Transfer Agreement that companies can use as a basis for transferring UK personal data. The UK also has its own data privacy framework that allows participating companies to transfer personal data from the UK to the U.S. These measures and the potential divergence between EU and UK requirements and practices may impose additional expense, administrative burdens, regulatory uncertainty, and enforcement risk associated with transferring personal data from the UK and EU to the U.S.
Additionally, legislation enacted in the UK and by many EU countries provides that if a company outsources all or part of its business to a service provider or changes its current service provider, the affected employees of the company or of the previous service provider are entitled to become employees of the new service provider, generally on the same terms and conditions as their original employment. In addition, dismissals of employees who were employed by the company or the previous service provider immediately prior to that outsourcing, if the dismissals resulted solely or principally from the outsourcing, are automatically considered unfair dismissals that entitle such employees to compensation. As a result, to avoid unfair dismissal claims we may have to offer, and become liable for, voluntary redundancy payments to the employees of our clients in the UK and other EU countries who have adopted similar laws who transfer business to us. Additionally, the UK’s exit from the EU and the associated changes in trade relations could result in increased costs, delays, and regulatory complexity in our business involving the UK.
Our global operations expose us to numerous and sometimes conflicting legal and regulatory requirements, and violations of these laws and regulations could harm our business.
We are subject to, or subject to contractual requirements to comply with or facilitate our clients’ compliance with, numerous, and sometimes conflicting, legal regimes on matters such as anticorruption, import/export controls, trade restrictions, taxation, immigration, internal and disclosure control obligations, securities regulation, anti-competition, data privacy and protection, wage-and-hour standards, and employment and labor relations. Our clients’ business operations are also subject to numerous regulations, and our clients may require that we perform our services in compliance with regulations applicable to them or in a manner that will enable them to comply with such regulations.
The global nature of our operations increases the difficulty of compliance. Compliance with diverse legal requirements is costly, time-consuming and requires significant resources. Violations of one or more of these regulations in the conduct of our business could result in significant fines, criminal sanctions against us and/or our employees, prohibitions on doing business, breach of contract damages and harm to our reputation. Due to the varying degrees of development of the legal systems of the countries in which we operate, local laws may not be well developed or provide sufficiently clear guidance and may be insufficient to protect our rights.
In particular, our collection, use, disclosure, and retention of personal health-related and other information is subject to an array of privacy, data security, and data breach notification laws and regulations that change frequently, are inconsistent across the jurisdictions in which we do business, and impose significant compliance costs. Changes in these laws and regulations and inconsistencies in the standards that apply to our business in different jurisdictions may impose significant compliance costs, reduce the efficiency of our operations, and expose us to enforcement risks.
In the United States, all 50 states, the District of Columbia, Guam, Puerto Rico and the Virgin Islands have enacted legislation requiring notice to individuals of security breaches of information involving personally identifiable information. In addition, several U.S. states have enacted data privacy laws that impose varying privacy and data security obligations on companies and grant individuals residing in those states certain rights as data subjects, and legislation has been proposed in several more states. In addition, some states have passed laws imposing increased data security and breach notification obligations on companies operating in the U.S.
In the EU, the General Data Protection Regulation (GDPR) imposes privacy and data security compliance obligations and significant penalties for noncompliance. The GDPR presents numerous privacy-related changes for companies operating in the EU, including rights guaranteed to data subjects, requirements for data portability for EU consumers, data breach notification requirements and significant fines for noncompliance. In GDPR enforcement matters, companies have faced fines for violations of certain provisions. Fines can reach as high as 4% of a company’s annual total revenue, potentially including the revenue of a company’s international affiliates. Additionally, governments outside of the EU are also taking steps to fortify their data privacy laws and regulations. For example, some countries in Africa, Asia and Latin America, including Brazil and South Africa, where we have operations, have implemented or are considering data protection laws. India recently enacted a data protection law, the Digital Personal Data Protection Act (the "DPDP Act"), that is expected to impact how we handle vendor and employee data in India and may require us to develop new controls governing our processing of employee data. Given the size and scope of our operations in India, the costs of compliance with the DPDP Act, and any fines or penalties for breaches thereof, could be significant and could have a material adverse effect on our business, financial condition and results of operations. As privacy laws and regulations around the world continue to evolve, these changes and others could adversely affect our business operations, websites and mobile applications that are accessed by residents in the applicable countries.
In many parts of the world, including countries in which we operate and/or seek to expand, common practices in the local business community might not conform to international business standards and could violate anticorruption laws or regulations, including the U.S. Foreign Corrupt Practices Act and the UK Bribery Act 2010. Our employees, subcontractors, agents, joint venture partners, the companies we acquire and their employees, subcontractors and agents, and other third parties with which we associate, could take actions that violate policies or procedures designed to promote legal and regulatory compliance or applicable anticorruption laws or regulations.
Violations of these laws or regulations by us, our employees or any of these third parties could subject us to criminal or civil enforcement actions (whether or not we participated or knew about the actions leading to the violations), including fines or penalties, disgorgement of profits and suspension or disqualification from work, any of which could materially adversely affect our business, including our results of operations and our reputation.
Additionally, governmental bodies, investors, clients and other stakeholders are increasingly focused on environmental, social and governance ("ESG") issues, which has resulted and may in the future continue to result in the adoption of new laws and regulations and changing buying practices. If we fail to keep pace with ESG trends and developments or fail to meet the expectations of our clients and investors, our reputation and business could be adversely impacted. We have made public commitments on certain ESG matters, and our disclosures on these matters and any failure or perceived failure to achieve or accurately report on our commitments could harm our reputation and adversely affect our client relationships or our recruitment and retention efforts, as well as expose us to potential legal liability.
Our revenues are highly dependent on clients located in the United States and Europe, as well as on clients that operate in certain industries.
In 2023, more than 70% of our revenues were derived from clients based in North America and more than 15% of our revenues were derived from clients based in Europe. Additionally, more than 25% of our revenues were derived from clients in the financial services and insurance industries.
The inflationary economic environment in recent years has adversely affected economic activity in the United States and Europe and activity in certain industries in which our clients operate. For example, a number of our largest clients in the United States operate in the high-tech and other industries in which companies have been in the process of undertaking broad layoffs or other cost cutting measures. If our services are viewed as non-essential or are targeted for consolidation, in-sourcing or replacement as part of cost cutting measures by clients in the high tech or other industries facing macroeconomic pressures, we could be adversely affected.
In addition, any deterioration in economic activity in the United States or Europe, or in industries in which our clients operate, could adversely affect demand for our services, thus reducing our revenue. Increased regulation, monetary policy actions, changes in existing regulation or increased government intervention in the industries in which our clients operate may adversely affect growth in such industries and therefore have an adverse impact on our revenues. Any of the foregoing factors could have a material adverse effect on our business, results of operations and financial condition.
In addition, we have historically derived a significant portion of our revenues from GE. In the past, GE has divested businesses we served, including a significant portion of its GE Capital business, and we have entered into contracts with several divested GE businesses. GE is in the final stages of dividing into three independent public companies, and its spin-off of GE Healthcare was completed in January 2023. Any material loss of business from, or failure to maintain relationships with, former GE businesses following the completion of the GE restructuring in 2024 could have a material adverse effect on our business, results of operations and financial condition.
We are implementing a new enterprise resource planning system, and challenges with the planning or implementation of the system may impact our internal controls over financial reporting, business and operations.
We are in the midst of a multi-year process of implementing a complex new enterprise resource planning system (“ERP”), which is a major undertaking that will replace most of our existing operating and financial systems. An ERP system is used to maintain financial records, enhance data security and operational functionality and resiliency, and provide timely information to management related to the operation of a business. The ERP implementation will require the integration of the new ERP with existing information systems and business processes. Our ERP planning has required, and the ongoing planning and future implementation of the new ERP will continue to require, investment of significant capital and human resources, requiring the attention of members of our management team. Any deficiencies in the design, or delays or issues encountered in the implementation, of the new ERP could result in significantly greater capital expenditures and employee time and attention than currently contemplated, and could adversely affect our ability to operate our business, file timely reports with the SEC or otherwise affect the proper and efficient operation of our controls. If the system as implemented, or after necessary investments, does not result in our ability to maintain accurate books and records, our financial condition, results of operations, and cash flows could be materially adversely impacted. Additionally, conversion from our old system to the new ERP may also cause inefficiencies until the ERP is stabilized and mature. The implementation of our new ERP will require new procedures and many new controls over financial reporting. If we are unable to adequately plan, implement and maintain procedures and controls relating to our ERP, our ability to produce timely and accurate financial statements or comply with applicable regulations could be impaired and impact the effectiveness of our internal controls over financial reporting. All of the above could result in harm to our reputation or our clients, as well as expose us to regulatory actions or claims, any of which could materially impact our business, results of operations, financial condition and stock price.
Our results of operations and share price could be adversely affected if we are unable to maintain effective internal controls.
The accuracy of our financial reporting is dependent on the effectiveness of our internal controls. We are required to provide a report from management to our shareholders on our internal control over financial reporting that includes an assessment of the effectiveness of these controls. Internal control over financial reporting has inherent limitations, including human error, sample-based testing, the possibility that controls could be circumvented or become inadequate because of changed conditions, and fraud. Because of these inherent limitations, internal control over financial reporting might not prevent or detect all misstatements or fraud. If we cannot maintain and execute adequate internal control over financial reporting or implement required new or improved controls that provide reasonable assurance of the reliability of the financial reporting and preparation of our financial statements for external use, we could suffer harm to our reputation, fail to meet our public reporting requirements on a timely basis, be unable to properly report on our business and our results of operations, or be required to restate our financial statements, and our results of operations, the market price of our common shares and our ability to obtain new business could be materially adversely affected.
Our industry is highly competitive, and we may not be able to compete effectively.
Our industry is increasingly competitive, highly fragmented and subject to rapid change. We compete for business with a variety of companies, including large multinational firms that provide consulting, technology and/or business process services, offshore business process service providers in low-cost locations like India, in-house captives of potential clients, software services companies that also provide business process services, smaller, niche companies that compete with us in a specific geographic market, industry or service area, and accounting firms that also provide consulting or other business process services.
Some of our competitors have greater financial, marketing, technological or other resources and larger client bases than we do, and may expand their service offerings more quickly or at a lower cost and compete more effectively for clients and employees than we do. Some of our competitors have more established reputations and client relationships in our markets than we do. In addition, some of our competitors who do not have global delivery capabilities may expand their delivery centers to the countries in which we are located, which could result in increased competition for employees and could reduce our competitive advantage. There could also be new competitors that are more powerful as a result of strategic consolidation of smaller competitors or of companies whose services and expertise complement each other. In addition, we may also face competition from technology start-ups and other companies that can scale rapidly to focus on or disrupt certain markets and provide new or alternative products, services or delivery models.
New services or technologies offered by our competitors and partners or new market participants may make our offerings less differentiated or less competitive when compared to alternatives, which may adversely affect our results of operations. Certain technology companies, including some of our partners, are increasingly able to offer services related to their software, platform, cloud migration and other solutions, or are developing software, platform, cloud migration and other solutions that require integration services to a lesser extent or replace them in their entirety. These more integrated services and solutions may represent more attractive alternatives to clients than some of our services and solutions, which may materially adversely affect our competitive position and our results of operations.
Increased competition may result in lower prices and volumes, higher costs, and lower profitability. We may not be able to supply clients with services that they deem superior and at competitive prices and we may lose business to our competitors. Any inability to compete effectively would adversely affect our business, results of operations and financial condition.
We may face difficulties in providing end-to-end business solutions or delivering complex, large or unique projects for our clients that could cause clients to discontinue their work with us, which in turn could harm our business and our reputation.
We continue to expand the nature and scope of our engagements, including by incorporating digital solutions that use social, mobility, big data and cloud-based technologies. Our ability to effectively offer a wide range of business solutions depends on our ability to attract existing or new clients to new service offerings, and the market for our solutions is highly competitive. We cannot be certain that our new services or solutions will effectively meet client needs or that we will be able to attract clients to these offerings. The complexity of our new service offerings, our inexperience in developing or implementing them, and significant competition in the markets for these services may affect our ability to market these services successfully.
In addition, the breadth of our existing service offerings continues to result in larger and more complex projects with our clients, which have risks associated with their scope and complexities, including our reliance on alliance partners and other third-party service providers in implementing and delivering these projects. Our failure to deliver services that meet the requirements specified by our clients could result in termination of client contracts, and we could be liable to our clients for significant penalties or damages or suffer reputational harm.
Larger projects may involve multiple engagements or stages, and there is a risk that a client may choose not to retain us for additional stages or may cancel or delay additional planned engagements. These terminations, cancellations or delays may result from factors that have little or nothing to do with the quality of our services, such as the business or financial condition of our clients or the economy generally. Such cancellations or delays make it difficult to plan for project resource requirements and inaccuracies in such resource planning and allocation may have a negative impact on our profitability.
From time to time we also enter into agreements that include unique service level delivery requirements or novel pricing arrangements with which we have no experience and that may be unique in the industry. These projects can include performance targets that become more rigorous over the term of the contracts and service delivery components that are partially subjective by design, and we may be unable to achieve such targets or to satisfy our clients’ expectations in delivering such services. Our failure to deliver such engagements to our clients’ expectations could result in termination of client contracts, and we could be liable to our clients for penalties or damages or suffer reputational harm. We may also discover that we have not priced such engagements appropriately, which could adversely affect our profitability and results of operations.
Currency exchange rate fluctuations in various currencies in which we do business, especially the Indian rupee, the euro and the U.S. dollar, could have a material adverse effect on our business, results of operations and financial condition.
Most of our revenues are denominated in U.S. dollars, with the remaining amounts largely in euros, UK pounds sterling, the Australian dollar, the Japanese yen and the Indian rupee. Most of our expenses are incurred and paid in U.S. dollars, with the remaining amounts largely in Indian rupees, Chinese renminbi, Romanian lei, euros, UK pounds sterling, Philippine pesos, Japanese yen, Polish zloty, Mexican pesos, Guatemalan quetzals, Hungarian forint, Canadian dollars, South African rand, Costa Rican Colón, Malaysian ringgit and Australian dollars. As we expand our operations to new countries, we will incur expenses in other currencies. We report our financial results in U.S. dollars. The exchange rates between the Indian rupee, the euro and other currencies in which we incur costs or receive revenues, on the one hand, and the U.S. dollar, on the other hand, have changed substantially in recent years and may fluctuate substantially in the future. See Item 7A—“Quantitative and Qualitative Disclosures about Market Risk.”
Our results of operations have been adversely affected and could be further adversely affected by certain movements in exchange rates, particularly if the Indian rupee or other currencies in which we incur expenses appreciate against the U.S. dollar or if, as has occurred over the past year, the currencies in which we receive revenues, such as the euro, depreciate against the U.S. dollar. Although we take steps to hedge a substantial portion of our foreign currency exposures, there is no assurance that our hedging strategy will be successful or that the hedging markets will have sufficient liquidity or depth for us to implement our strategy in a cost-effective manner. In addition, in some countries, such as China, India, Malaysia, the Philippines and Romania, we are subject to legal restrictions on hedging activities, as well as convertibility of currencies, which limits our ability to use cash generated in one country in another country and could limit our ability to hedge our exposures. Finally, our hedging policies only provide near term protection from exchange rate fluctuations. If the Indian rupee or other currencies in which we incur expenses appreciate against the U.S. dollar, we may have to consider additional means of maintaining profitability, including by increasing pricing, which may or may not be achievable. See also Item 7—“Management’s Discussion and Analysis of Financial Condition and Results of Operations—Overview—Net Revenues—Foreign exchange gains (losses), net.”
Restrictions on entry or work visas may affect our ability to compete for and provide services to clients, which could have a material adverse effect on our business and financial results.
A portion of our business depends on the ability of our employees to obtain the necessary visas and work or entry permits to travel to and do business in the countries where our clients and, in some cases, our delivery centers, are located. In recent years, in response to terrorist attacks, the COVID-19 pandemic and related border controls, global unrest and political rhetoric, immigration authorities generally, and those in the United States in particular, have increased the level of scrutiny in granting visas. If pandemic-related restrictions are reimposed, further terrorist attacks occur, global unrest intensifies, or nationalistic political trends continue, then obtaining visas for our personnel may become even more difficult.
Local immigration laws may also require us to meet certain other legal requirements as a condition to obtaining or maintaining entry or work visas. Countries where our clients may be located, including the United States, may through legislation or regulation restrict the number of visas or entry permits available. In general, immigration laws are subject to legislative change and varying standards of application and enforcement due to political forces, economic conditions, terrorist attacks or other events. In addition, there is uncertainty with respect to immigration laws and regulations in the United States as the current U.S. President pursues legislation and policy changes to reform U.S. immigration laws and to reverse some immigration policies of the prior administration. Our employment of international personnel in the United
States and elsewhere may also be limited by immigration restrictions targeting specific countries. It is not currently known what, if any, visa or travel restrictions might be proposed in the future or how they would be implemented or enforced.
We may be unable to service our debt or obtain additional financing on competitive terms or at all.
In December 2022, we entered into an amended and restated five-year credit agreement with certain financial institutions as lenders which replaced our prior credit facility. The amended and restated credit agreement provides for a $530 million term loan and a $650 million revolving credit facility. The credit agreement obligations are unsecured, and guaranteed by certain subsidiaries. As of December 31, 2023, the total amount due under the credit facility net of debt amortization expenses, including the amount utilized under the revolving facility, was $520 million. The amended and restated credit agreement contains covenants that require maintenance of certain financial ratios, including consolidated leverage and interest coverage ratios, and also, under certain conditions, restrict our ability to incur additional indebtedness, create liens, make certain investments, pay dividends or make certain other restricted payments, repurchase common shares, undertake certain liquidations, mergers, consolidations and acquisitions and dispose of certain assets or subsidiaries, among other things. If we breach any of these restrictions and do not obtain a waiver from the lenders, subject to applicable cure periods the outstanding indebtedness (and any other indebtedness with cross-default provisions) could be declared immediately due and payable, which could adversely affect our liquidity and financial condition.
On November 18, 2019, we issued $400 million aggregate principal amount of 3.375% senior notes (the "2024 Notes") in an underwritten public offering. As of December 31, 2023, the amount outstanding under the 2024 Notes, net of debt amortization expense of $0.5 million, was $399.5 million, which is payable on December 1, 2024 when the notes mature. We are required to pay interest on the 2024 Notes semi-annually in arrears on June 1 and December 1 of each year, ending on the maturity date. We may seek to repay or refinance the 2024 Notes at or prior to the scheduled maturity date. This will depend on the condition of the capital markets and our financial condition at such time. If we refinance the 2024 Notes, the interest rate we pay on the refinanced notes is likely to be higher than the rate we pay on the 2024 Notes, which would likely adversely affect our net interest expense. It is also possible that, due to the market conditions or our financial condition at such time, we may not seek to, or may be unable to, refinance the 2024 Notes when they mature, which could have an adverse impact on our cash flows, working capital or liquidity and in turn have an adverse impact on our financial condition or results of operations.
On March 26, 2021, we issued $350 million aggregate principal amount of 1.75% senior notes (the "2026 Notes") in an underwritten public offering. As of December 31, 2023, the amount outstanding under the 2026 Notes, net of debt amortization expense of $1.4 million, was $348.6 million, which is payable on April 10, 2026 when the notes mature. We are required to pay interest on the 2026 Notes semi-annually in arrears on April 10 and October 10 of each year, ending on the maturity date.
The 2024 Notes were issued by, and are senior unsecured indebtedness of, Genpact Luxembourg S.à r.l., our indirect wholly-owned subsidiary, and are guaranteed on a senior unsecured basis by Genpact Limited and our indirect wholly-owned subsidiary, Genpact USA, Inc. The 2026 Notes were issued by, and are senior unsecured indebtedness of, Genpact Luxembourg S.à r.l. and Genpact USA, Inc., and are guaranteed on a senior unsecured basis by Genpact Limited. The 2024 Notes and 2026 Notes are subject to certain customary covenants set forth in their respective governing indentures, including limitations on our ability to incur debt secured by liens, engage in certain sale and leaseback transactions and consolidate, merge, convey or transfer our assets. Upon certain change of control transactions, we would be required to make an offer to repurchase the 2024 Notes and the 2026 Notes, as applicable, at a price equal to 101% of the aggregate principal amount of such notes, plus accrued and unpaid interest. The interest rates payable on the 2024 Notes and the 2026 Notes are subject to adjustment if the credit ratings of the 2024 Notes or 2026 Notes, as applicable, are downgraded, up to a maximum increase of 2.0%. We may redeem the 2024 Notes and 2026 Notes at any time in whole or in part, at a redemption price equal to 100% of the principal amount of the notes redeemed, together with accrued and unpaid interest or, if redemption occurs prior to, in the case of the 2024 Notes, November 1, 2024 and, in the case of the 2026 Notes, March 10, 2026, a specified “make-whole” premium. The 2024 Notes and 2026 Notes are our senior unsecured obligations and rank equally with all our other senior unsecured indebtedness outstanding from time to time.
Our indebtedness and related debt service obligations can have negative consequences, requiring us to dedicate significant cash flow from operations to the payment of principal and interest on our debt, which reduces the funds we have available for other purposes such as acquisitions and capital investment, limiting our ability to obtain additional financing and limiting our ability to undertake strategic acquisitions, increasing our vulnerability to adverse economic and industry conditions, including by reducing our flexibility in planning for or reacting to changes in our business and market conditions, and exposing us to interest rate risk since a portion of our debt obligations are at variable rates. We manage only a portion of our interest rate risk related to floating rate indebtedness by entering into interest rate swaps. A portion of our indebtedness, including borrowings under our credit facility, bears interest at variable interest rates primarily based
on the Secured Overnight Financing Rate. Accordingly, any adverse change in interest rates due to market conditions or otherwise could increase our cost of funding substantially.
We often face a long selling cycle to secure a new Digital Operations contract as well as long implementation periods that require significant resource commitments, which result in a long lead time before we receive revenues from new relationships.
We often face a long selling cycle to secure a new Digital Operations contract. If we are successful in obtaining an engagement, that is generally followed by a long implementation period in which the services are planned in detail and we demonstrate to a client that we can successfully integrate our processes and resources with their operations. During this time a contract is also negotiated and agreed. There is then a long ramping up period in order to commence providing the services. We typically incur significant business development expenses during the selling cycle. We may not succeed in winning a new client’s business, in which case we receive no revenues and may receive no reimbursement for such expenses. Even if we succeed in developing a relationship with a potential new client and begin to plan the services in detail, a potential client may choose a competitor or decide to retain the work in-house prior to the time a final contract is signed. If we enter into a Digital Operations contract with a client, we will typically receive no revenues until implementation actually begins. Our clients may also experience delays in obtaining internal approvals or delays associated with technology or system implementations, thereby further lengthening the implementation cycle. We generally hire new employees to provide services to a new client once a contract is signed. We may face significant difficulties in hiring such employees and incur significant costs associated with these hires before we receive corresponding revenues. If we are not successful in obtaining contractual commitments after the selling cycle, in maintaining contractual commitments after the implementation cycle or in maintaining or reducing the duration of unprofitable initial periods in our contracts, it may have a material adverse effect on our business, results of operations and financial condition.
We make estimates and assumptions in connection with the preparation of our consolidated financial statements, and any changes to those estimates and assumptions could adversely affect our financial results.
Our financial statements have been prepared in accordance with U.S. generally accepted accounting principles. The application of generally accepted accounting principles requires us to make estimates and assumptions about certain items and future events that affect our reported financial condition, and our accompanying disclosure with respect to, among other things, revenue recognition and income taxes. We base our estimates on historical experience, contractual commitments and on various other assumptions that we believe to be reasonable under the circumstances and at the time they are made. These estimates and assumptions involve the use of judgment and are subject to significant uncertainties, some of which are beyond our control. If our estimates, or the assumptions underlying such estimates, are not correct, actual results may differ materially from our estimates, and we may need to, among other things, adjust revenues or accrue additional charges that could adversely affect our results of operations.
Our operating results may experience significant fluctuations.
Our operating results may fluctuate significantly from period to period. The long selling cycle for many of our services as well as the time required to complete the implementation phases of new contracts makes it difficult to accurately predict the timing of revenues from new clients or new SOWs as well as our costs. In recent years, the increased share of our revenue from consulting and other short-cycle engagements has also made it more difficult to accurately forecast our revenues. In addition, our future revenues, operating margins and profitability may fluctuate as a result of lower demand for our services, lower win rates versus our competition, changes in pricing in response to client demands and competitive pressures, changes to the financial condition of our clients, employee wage levels and utilization rates, changes in foreign exchange rates, including the Indian rupee versus the U.S. dollar and the euro versus the U.S. dollar, the timing of collection of accounts receivable, enactment of new taxes, changes in income tax rates and regulations in the countries where we do business, and changes to levels and types of share-based compensation awards and assumptions used to determine the fair value of such awards. As a result of these factors, it is possible that, as has occurred in the past, our revenues and operating results may be below, in some cases significantly, the expectations of public market analysts and investors. The price of our common shares has been adversely affected by lower-than-expected operating results in the past, including in 2023, and would likely be materially and adversely affected if we report significantly lower-than-expected operating results in the future.
If we are unable to collect our receivables, our results of operations, financial condition and cash flows could be adversely affected.
Our business depends on our ability to successfully obtain payment from our clients of the amounts they owe us for work performed. We evaluate the financial condition of our clients and usually bill and collect on relatively short cycles. We have established allowances for losses of receivables and unbilled services. Actual losses on client balances could differ from those that we currently anticipate, and, as a result, we might need to adjust our allowances.
We might not accurately assess the creditworthiness of our clients. More recently, some of our clients have begun to delay their payments to us in order to take advantage of increased interest rates to earn additional interest income, which has had an adverse impact on our days sales outstanding. Delayed client payments and extended payment terms in some contracts have in some cases had an adverse impact on our cash flows, and we expect that our working capital balances and cash management practices will be further adversely affected if more clients delay payments or if payments are delayed further or for an extended period.
Macroeconomic conditions, including persistent inflation in the countries in which we do business and have operations, increasing geopolitical tensions, the possibility of an economic downturn globally or regionally and changes in global trade policies, could also result in financial difficulties for our clients, including bankruptcy and insolvency. Additionally, cyberattacks on any of our clients could disrupt their internal systems and capability to make payments. The occurrence of any of these events could cause clients to delay payments to us, request modifications to their payment arrangements that could increase our receivables balance, or default on their payment obligations to us. If we experience an increase in the time to bill and collect for our services due to these additional factors, our cash flows could be adversely affected.
Some of our contracts contain provisions which, if triggered, could result in lower future revenues and have a material adverse effect on our business, results of operations and financial condition.
Some of our contracts allow a client, in certain limited circumstances, to request a benchmark study comparing our pricing and performance with that of an agreed list of other service providers for comparable services. Based on the results of the study and depending on the reasons for any unfavorable variance, we may be required to make improvements in the services we provide or to reduce the pricing for services on a prospective basis to be performed under the remaining term of the contract, which could have an adverse effect on our business, results of operations and financial condition. Some of our contracts contain provisions that would require us to pay penalties to our clients and/or provide our clients with the right to terminate the contract if we do not meet agreed service level requirements. Failure to meet these requirements could result in the payment of significant penalties by us to our clients which in turn could have a material adverse effect on our business, results of operations and financial condition.
A few of our MSAs provide that during the term of the MSA and under specified circumstances, we may not provide similar services to the competitors of our client. Some of our contracts also provide that, during the term of the contract and for a certain period thereafter ranging from six to 12 months, we may not provide similar services to certain or any of our client’s competitors using the same personnel. These restrictions may hamper our ability to compete for and provide services to other clients in the same industry, which may inhibit growth and result in lower future revenues and profitability.
Some of our contracts with clients specify that if a change of control of our company occurs during the term of the contract, the client has the right to terminate the contract. These provisions may result in our contracts being terminated if there is such a change in control, resulting in a potential loss of revenues. In addition, these provisions may act as a deterrent to any attempt by a third party to acquire our company. Some of our contracts with clients require that we bear the cost of any sales or withholding taxes or unreimbursed value-added taxes imposed on payments made under those contracts. While the imposition of these taxes is generally minimized under our contracts, changes in law or the interpretation thereof and changes in our internal structure may result in the imposition of these taxes and a reduction in our net revenues.
Our business could be materially and adversely affected if we do not protect our intellectual property or if our services are found to infringe on the intellectual property of others.
Our success depends in part on certain methodologies, practices, tools and technical expertise we utilize in designing, developing, implementing and maintaining applications and other proprietary intellectual property rights. In order to protect our rights in these various intellectual properties, we rely upon a combination of nondisclosure and other contractual arrangements as well as patent, trade secret, copyright and trademark laws. We also generally enter into confidentiality agreements with our employees, consultants, clients and potential clients and limit access to and distribution of our proprietary information. India is a member of the Berne Convention, an international intellectual property treaty, and has agreed to recognize protections on intellectual property rights conferred under the laws of other foreign countries, including the laws of the United States. There can be no assurance that the laws, rules, regulations and treaties in effect in the United States, India and the other jurisdictions in which we operate and the contractual and other protective measures we take, are adequate to protect us from misappropriation or unauthorized use of our intellectual property, or that such laws will not change. We may not be able to detect unauthorized use and take appropriate steps to enforce our rights, and any such steps may not be successful.
Infringement by others of our intellectual property, including the costs of enforcing our intellectual property rights, may have a material adverse effect on our business, results of operations and financial condition.
In addition, we may not be able to prevent others from using our data and proprietary information to compete with us. Existing trade secret, copyright and trademark laws offer only limited protection. Further, the laws of some foreign countries may not protect our data and proprietary information at all. If we have to resort to legal proceedings to enforce our rights, the proceedings could be burdensome, protracted, distracting to management and expensive and could involve a high degree of risk and be unsuccessful.
Although we believe that we are not infringing on the intellectual property rights of others, claims may nonetheless be successfully asserted against us in the future. The costs of defending any such claims could be significant, and any successful claim may require us to modify, discontinue or rename any of our services. Any such changes may have a material adverse effect on our business, results of operations and financial condition.
We may face difficulties as we expand our operations into countries in which we have no prior operating experience.
We intend to continue to expand our global footprint in order to maintain an appropriate cost structure and meet our clients’ delivery needs. This has in the past any may in the future involve expanding into countries other than those in which we currently operate. It may involve expanding into less developed countries, which may have less political, social or economic stability and less developed infrastructure and legal systems. As we expand our business into new countries, we may encounter regulatory, employment, technological, logistical and other difficulties that increase our expenses or delay our ability to start up our operations or become profitable in such countries. This may affect our relationships with our clients and could have an adverse effect on our business, results of operations and financial condition.
Terrorist attacks and other acts of violence involving any of the countries in which we or our clients have operations could adversely affect our operations and client confidence.
Terrorist attacks and other acts of violence or war may adversely affect worldwide financial markets and could potentially lead to economic recession, which could adversely affect our business, results of operations, financial condition and cash flows. These events could adversely affect our clients’ levels of business activity and precipitate sudden significant changes in regional and global economic conditions and cycles. For instance, the ongoing conflicts between Russia and Ukraine and Israel and Hamas have created volatility and uncertainty in the financial markets. These events also pose significant risks to our people and to our delivery centers and operations around the world.
Southern Asia has from time to time experienced instances of civil unrest and hostilities among neighboring countries, including India and Pakistan. In recent years, military confrontations between India and Pakistan have occurred in the region of Kashmir and along the India/Pakistan border. There have also been incidents in and near India, such as continued terrorist activity around the northern border of India, troop mobilizations along the India/Pakistan border and an aggravated geopolitical situation in the region. In addition, there has been a series of conflicts between India and China along their shared border in recent years. Although both countries have taken actions to control and de-escalate these conflicts, there can be no assurance that tensions in the area will diminish in the near future. Such military activity or terrorist attacks in the future could influence the Indian economy by disrupting communications and making travel more difficult. Resulting political tensions could create a greater perception that investments in companies with Indian operations involve a high degree of risk, and that there is a risk of disruption of services provided by companies with Indian operations, which could have a material adverse effect on our share price and/or the market for our services. Furthermore, if India or bordering countries were to become engaged in armed hostilities, particularly hostilities that were protracted or involved the threat or use of nuclear weapons, we might not be able to continue our operations. We generally do not have insurance for losses and interruptions caused by terrorist attacks, military conflicts and wars.
If more stringent labor laws become applicable to us or if a significant number of our employees unionize, our profitability may be adversely affected.
India has stringent labor legislation that protects employee interests, including legislation that sets forth detailed procedures for dispute resolution and that imposes financial obligations on employers upon termination of employees without cause. Though companies in our industry have certain exemptions from some of these labor laws, there can be no assurance that such laws will not become applicable to us in the future. If these labor laws become applicable to us or if more stringent labor laws apply to us in the future, it may become difficult for us to maintain flexible human resource policies, to attract and employ the numbers of sufficiently qualified candidates we require or to terminate employees, and our compensation expenses may increase significantly.
In addition, a small percentage of our global employee population is currently unionized. If a significant number of our employees form or join unions, we may be required to raise wage levels or provide additional benefits, which could result in operational impediments and an increase in our compensation expenses, in which case our operations and profitability may be adversely affected.
We may engage in strategic transactions that could create risks.
As part of our business strategy, we regularly review potential strategic transactions, including potential acquisitions, dispositions, consolidations, joint ventures or similar transactions, some of which may be material. Through the acquisitions we pursue, we may seek opportunities to add to or enhance the services we provide, to enter new industries or expand our client base, or to strengthen our global presence and scale of operations. We have completed numerous acquisitions since our inception. There can be no assurance that we will find suitable candidates in the future for strategic transactions at acceptable prices, have sufficient capital resources to accomplish our strategy, or be successful in entering into agreements for desired transactions.
Acquisitions, including completed acquisitions, also pose the risk that any business we acquire may lose clients or employees or could under-perform relative to expectations. We could also experience financial or other setbacks if transactions encounter unanticipated problems, including problems related to execution, integration or unknown liabilities. Although we conduct due diligence in connection with our acquisitions, there could be liabilities that we fail to discover, that we inadequately assess or that are not properly disclosed to us. Any material liabilities associated with our acquisitions could harm our business, results of operations and financial condition. Following the completion of an acquisition, we may have to rely on the seller to provide administrative and other support, including financial reporting and internal controls, to the acquired business for a period of time. There can be no assurance that the seller will do so in a manner that is acceptable to us.
Bermuda recently enacted new tax legislation that will impose a corporate income tax on certain Bermuda companies. Any new tax liability in Bermuda or another jurisdiction based on our incorporation in Bermuda could have a material adverse effect on our business, results of operations and financial condition.
We previously received a written assurance from the Bermuda Minister of Finance under The Exempted Undertaking Tax Protection Act 1966 of Bermuda (the "EUTP") to the effect that if there is enacted in Bermuda any legislation imposing tax computed on profits or income, or computed on any capital asset, gain or appreciation, or any tax in the nature of estate duty or inheritance tax, then the imposition of any such tax shall not be applicable to us or to any of our operations or common shares, debentures or other obligations or securities until March 31, 2035, except insofar as such tax applies to persons ordinarily resident in Bermuda or is payable by us in respect of real property owned or leased by us in Bermuda. While we are not subject to tax on income, profits, withholding, capital gains or capital transfers under current law, the Bermuda Government recently passed a new law titled the Corporate Income Tax Act, 2023 (the "CIT Act"), which imposes a 15% minimum corporate income tax rate and expressly supersedes the written assurance we received under the EUTP.
Under the CIT Act, Bermuda corporate income tax will be chargeable with respect to fiscal years beginning on or after January 1, 2025 and will apply to Bermuda entities that are part of a multinational group with annual revenue above 750 million euros in at least two of the prior four fiscal years. We currently do not expect this corporate income tax to have an impact on us given that we have no profits in Bermuda and we do not expect to have profits in Bermuda in the foreseeable future. However, if we incur tax liability in Bermuda as a result of the CIT Act or in any other jurisdiction as a result of our incorporation in Bermuda, it could have a material adverse effect on our business, results of operations and financial condition.
Economic substance requirements in Bermuda could adversely affect us.
Harmful tax practices have become the focus of increased scrutiny from the EU. Following a 2017 assessment by the Code of Conduct Group (Business Taxation), or the COCG, which included Bermuda in a list of jurisdictions required by the EU to address the COCG’s concerns relating to the demonstration of economic substance, the Bermuda Government implemented legislation which brought certain substance requirements into force in 2019 for Bermuda entities. Pursuant to the economic substance requirements, core income generating activities carried out by Bermuda companies must be undertaken in Bermuda. To satisfy these requirements, we may be required to conduct additional activities in Bermuda. The substance requirements could be difficult to manage or implement, and compliance with the requirements could be difficult or costly and could have a material adverse effect on us or our operations.
We may not be able to realize the entire book value of goodwill and other intangible assets from acquisitions.
As of December 31, 2023, we had $1,684 million of goodwill and $53 million of intangible assets. We periodically assess these assets to determine if they are impaired and we monitor for impairment of goodwill relating to all acquisitions and our formation in 2004. Goodwill is not amortized but is tested for impairment at least on an annual basis as of December 31 of each year, based on a number of factors including macro-economic conditions, industry and market considerations, overall financial performance, business plans and expected future cash flows. Impairment testing of goodwill may also be performed between annual tests if an event occurs or circumstances change that would more likely than not reduce the fair value of goodwill below its carrying amount.
We perform an assessment of qualitative factors to determine whether the existence of events or circumstances leads to a determination that it is more likely than not that the fair value of a reporting unit is less than its carrying amount. Based on the results of the qualitative assessment, we perform the quantitative assessment of goodwill impairment if we determine that it is more likely than not that the fair value of a reporting unit is less than its carrying amount. If the book value of our goodwill and other intangible assets is impaired, any such impairment would be charged to earnings in the period of impairment. We cannot assure you that any future impairment of goodwill and other intangible assets will not have a material adverse effect on our business, financial condition or results of operations.
Risks Related to our Shares
The issuance of additional common shares by us or the sale of our common shares by our employees could dilute our shareholders’ ownership interest in the Company and could significantly reduce the market price of our common shares.
Sales of a substantial number of our common shares in the public market could occur at any time. These sales, or the perception in the market that the holders of a large number of shares intend to sell shares, could reduce the market price of our common shares.
We have issued a significant number of equity awards under our equity compensation plans. The shares underlying these awards are or, with respect to certain option grants, will be registered on a Form S-8 registration statement. As a result, upon vesting these shares can be freely exercised and sold in the public market upon issuance, subject to volume limitations applicable to affiliates. The exercise of options and the subsequent sale of the underlying common shares or the sale of common shares upon vesting of other equity awards could cause a decline in our share price. These sales also might make it difficult for us to sell equity securities in the future at a time and at a price that we deem appropriate.
Certain of our employees, executive officers and directors have entered or may enter into Rule 10b5-1 plans providing for sales of our common shares from time to time. Under a Rule 10b5-1 plan, a broker executes trades pursuant to parameters established by the employee, director or officer when entering into the plan, without further direction from the employee, officer or director. A Rule 10b5-1 plan may be amended or terminated in some circumstances. Our employees, executive officers and directors may also buy or sell additional shares outside of a Rule 10b5-1 plan when they are not in possession of material, nonpublic information.
In addition, we may in the future engage in strategic transactions that could dilute our shareholders’ ownership and cause our share price to decline. Sales of substantial amounts of our common shares or other securities by us could also dilute our shareholders’ interests, lower the market price of our common shares and impair our ability to raise capital through the sale of equity securities.
There can be no assurance that we will continue to declare and pay dividends on our common shares, and future determinations to pay dividends will be at the discretion of our board of directors.
Prior to 2017, we did not declare regular dividends. In February 2017, we announced the declaration of the first quarterly cash dividend on our common shares and have paid a quarterly cash dividend each quarter since that date. Any determination to pay dividends to holders of our common shares in the future, including future payment of a regular quarterly cash dividend, will be at the discretion of our board of directors and will depend on many factors, including our financial condition, results of operations, general business conditions, statutory requirements under Bermuda law and any other factors our board of directors deems relevant. Our ability to pay dividends will also continue to be subject to restrictive covenants contained in credit facility agreements governing indebtedness we and our subsidiaries have incurred or may incur in the future. In addition, statutory requirements under Bermuda law could require us to defer making a dividend payment on a declared dividend date until such time as we can meet statutory requirements under Bermuda law. A reduction in, delay of, or elimination of our dividend payments could have a negative effect on our share price.
We are organized under the laws of Bermuda, and Bermuda law differs from the laws in effect in the United States and may afford less protection to shareholders.
Our shareholders may have more difficulty protecting their interests than would shareholders of a corporation incorporated in a state of the United States. As a Bermuda company, we are governed by, in particular, the Companies Act. The Companies Act differs in some material respects from laws generally applicable to U.S. corporations and shareholders, including the provisions relating to interested directors, mergers, amalgamations, takeovers and indemnification of directors.
Generally, the duties of directors and officers of a Bermuda company are owed to the company only. Shareholders of Bermuda companies generally do not have the right to take action against directors or officers of the company except in limited circumstances. Directors of a Bermuda company must, in exercising their powers and performing their duties, act honestly and in good faith with a view to the best interests of the company, exercising the care and skill that a reasonably prudent person would exercise in comparable circumstances. Directors have a duty not to put themselves in a position in which their duties to the company and their personal interests may conflict and also are under a duty to disclose any personal interest in any material contract or arrangement with the company or any of its subsidiaries. If a director of a Bermuda company is found to have breached his or her duties to that company, he may be held personally liable to the company in respect of that breach of duty. A director may be liable jointly and severally with other directors if it is shown that the director knowingly engaged in fraud or dishonesty (with such unlimited liability as the courts shall direct). In cases not involving fraud or dishonesty, the liability of the director will be determined by the Supreme Court of Bermuda or other Bermuda court (with such liability as the Bermuda court thinks just) who may take into account the percentage of
responsibility of the director for the matter in question, in light of the nature of the conduct of the director and the extent of the causal relationship between his or her conduct and the loss suffered.
In addition, our bye-laws contain a broad waiver by our shareholders of any claim or right of action, both individually and on our behalf, against any of our officers or directors. The waiver applies to any action taken by an officer or director, or the failure of an officer or director to take any action, in the performance of his or her duties, except with respect to any matter involving or arising out of any fraud or dishonesty on the part of the officer or director or to matters which would render it void pursuant to the Companies Act. This waiver limits the rights of shareholders to assert claims against our officers and directors unless the act or failure to act involves fraud or dishonesty. Therefore, our shareholders may have more difficulty protecting their interests than would shareholders of a corporation incorporated in a state within the United States.
The market price for our common shares has been and may continue to be volatile.
The market price for our common shares has been and may continue to be volatile and subject to price and volume fluctuations in response to market and other factors, some of which are beyond our control. Among the factors that could affect our share price are:
•technological developments that have an actual or perceived impact on us or our industry, such as generative AI;
•terrorist attacks, other acts of violence or war, such as the conflicts between Russia and Ukraine and Israel and Hamas, natural disasters, epidemics or pandemics, (including the COVID-19 pandemic), or other such events impacting countries where we or our clients have operations;
•actual or anticipated fluctuations in our quarterly and annual operating results;
•changes in or our inability to meet our financial estimates byor the estimates of securities research analysts;
•changes in the economic performance or market valuations of our competitors and other companies engaged in providing business process and information technologysimilar or competitive services;
•the loss of one or more significant clients;
•the addition or loss of executive officers or key employees;
•regulatory developments in our target markets affecting us, our clients or our competitors;
•announcements of technological developments;general economic, industry and market conditions, such as geopolitical events, inflation and sustained high interest rates;
•limited liquidity in our trading market;
•sales or expected sales of additional common shares, either by us, our employees, or any of our shareholders, or purchases or expected purchases of common shares, including by us under existing or future share repurchase programs, which purchases are at the discretion of our board of directors and may not continue in the future; and
•actions or announcements by activist shareholders or others.
In addition, securities markets generally and from time to time experience significant price and volume fluctuations that are not related to the operating performance of particular companies. These market fluctuations may have a material adverse effect on the market price of our common shares.
You may be unable to effect service of process or enforce judgments obtained in the United States or Bermuda against us or our assets in the jurisdictions in which we or our executive officers operate.
We are incorporated and organized under the laws of Bermuda, and a significant portion of our assets are located outside the United States. It may not be possible to enforce court judgments obtained in the United States against us in Bermuda or in countries, other than the United States, where we have assets based on the civil liability or penal provisions of the federal or state securities laws of the United States. In addition, there is some doubt as to whether the courts of Bermuda and other countries would recognize or enforce judgments of United States courts obtained against us or our directors or officers based on the civil liability or penal provisions of the federal or state securities laws of the United States or would hear actions against us or those persons based on those laws. We have been advised by Appleby (Bermuda) Limited, our Bermuda counsel, that the United States and Bermuda do not currently have a treaty providing for the reciprocal recognition and enforcement of judgments in civil and commercial matters. Therefore, a final judgment for the payment of money rendered by any federal or state court in the United States based on civil liability, whether or not based solely on United States federal or state securities laws, would not automatically be enforceable in Bermuda. Similarly, those judgments may not be enforceable in countries, other than the United States, where we have assets.
Item 1B. Unresolved Staff Comments
None.
Item 1C. Cybersecurity
Cybersecurity risk management is an essential part of our enterprise risk management program. We are committed to maintaining governance and oversight of these risks and to implementing controls, technologies, and processes designed to help us identify, assess, and manage these risks.
Our cybersecurity program aims to incorporate industry best practices, including standards such as ISO 27001 and the NIST Cybersecurity Framework, and focuses on implementing effective and efficient controls, technologies, and other processes to assess, identify, manage and address cybersecurity risks, threats and incidents. Our practices include, among other things, security awareness training and simulations, technologies and processes to monitor our systems, assessments of controls, and incident response processes. We engage with industry groups and forums to stay informed of industry practices and developments. We monitor developments in the threat landscape that may affect our systems or services and assess their potential impacts on and risks to our cybersecurity posture. We engage external service providers, where appropriate and from time to time, to assist us with aspects of our program, such as assessing and testing controls, providing threat intelligence information and incident response. We also have processes in place to manage cybersecurity risks associated with third-party service providers. Certain key security controls are tested annually by independent third-party auditors. We regularly refine our cybersecurity processes as we determine necessary to address developments in the threat landscape, advance our control and technology capabilities, respond to regulatory requirements and standards, and implement improvements based on the results of internal and external assessments.
Our cybersecurity incident response process involves a multi-functional approach for investigating, containing, and mitigating incidents, including reporting findings to senior management and other key stakeholders, including if appropriate the audit committee and the board, and keeping them informed and involved as appropriate. While we have not, as of the date of this Form 10-K, experienced a cybersecurity threat or incident that has had a material impact on our business or operations, we have experienced incidents that did not have a material impact on our business or operations, and there can be no guarantee that we will not experience an incident that results in a material impact to our business or operations in the future. In addition, cybersecurity threats are constantly evolving and increasing in sophistication, which increases the difficulty of successfully defending against them or implementing adequate preventative measures. See "Risk Factors" above for more information about the cybersecurity risks we face.
Our board of directors has ultimate responsibility for oversight of our risk management, and delegates cybersecurity risk management oversight to the audit committee. The audit committee, which is responsible for ensuring that management has processes in place designed to identify, evaluate and manage cybersecurity risks and incidents, regularly reviews our cybersecurity program with management and reports to the board of directors. Cybersecurity reviews by the audit committee generally occur at least quarterly. A number of our directors have experience in assessing and managing cybersecurity risk, including by serving on other public company audit committees having responsibility for cybersecurity oversight. One of our directors has also served as a Chief Technology Officer for multiple companies.
Our cybersecurity program is run by our Chief Information Security Officer (CISO), who reports to our Head of Enterprise Risk Management and receives input and support from our Head of Enterprise Risk Management and our Chief Technology and Transformation Officer. Our CISO has extensive experience leading and managing cybersecurity programs and in cybersecurity risk management. Our CISO has served in this position since 2014 and, before Genpact, was previously CISO at another US-listed public company. Our CISO is supported by our information security team, many of whom hold cybersecurity certifications and who collectively possess relevant experience in different areas of cybersecurity.
Our CISO is informed about and monitors prevention, detection, mitigation, and remediation efforts through regular communication and reporting from our information security team, internal governance processes, and by reviewing the results of internal and third-party assessments and audits. Our CISO regularly reports directly to the audit committee on our cybersecurity program and our efforts to prevent, detect, mitigate, and remediate cybersecurity risks. In addition, we have a Security Governance Council, made up of members of our senior management team as well as relevant security personnel, that meets periodically to discuss and address relevant cybersecurity matters.
Item 2. Properties
We have delivery centers in 2226 countries. We have a mixture of owned and leased properties and substantially all of our leased properties are leased under long-term leases with varying expiration dates. We believe that our properties and facilities are suitable and adequate for our present purposes and are well-maintained.
Item 3. Legal Proceedings
There are no legal proceedings pending against us that we believe are likely to have a material adverse effect on our business, results of operations and financial condition.
Item 4. Mine Safety Disclosures
Not applicable.
PART II
Item 5. Market for Registrant’s Common Equity, Related Stockholder Matters and Issuer Purchases of Equity Securities
Stock Price Information and Stockholders
The principal market on which the Company’s common shares are traded is the New York Stock Exchange under the symbol “G.” As of January 31, 2022,2024, there were 3735 holders of record of our common shares.
The following graph and table compare the performance of an investment in our common shares (measured as the cumulative total shareholder return) with investments in the S&P 500 Index (market capitalization weighted) and a peer group of companies for the period from January 1, 20172019 to December 31, 2021.2023. The selected peer group for the period presented is comprised of six companies that we believe are our closest reporting issuer competitors: Accenture plc, Cognizant Technology Solutions Corp., ExlService Holdings, Inc., Infosys Technologies Limited, Wipro Technologies Limited, and WNS (Holdings) Limited. The returns of the component entities of our peer group index are weighted according to the market capitalization of each company as of the end of each period for which a return is presented. The returns assume that $100 was invested on December 31, 20162018 and that all dividends were reinvested. The performance shown in the graph and table below is historical and should not be considered indicative of future price performance.
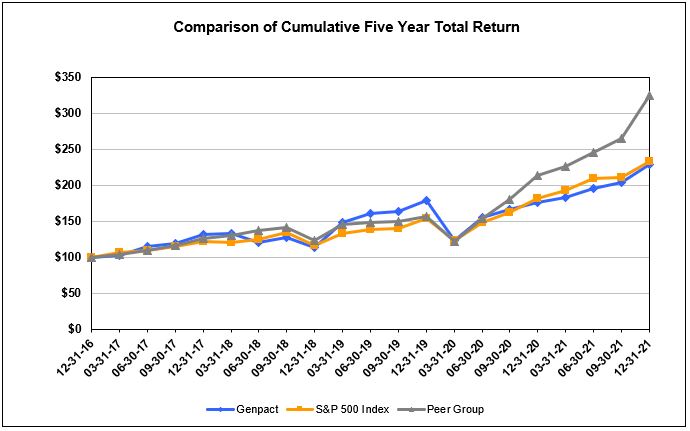

| | | 3/31/17 | 6/30/17 | 9/30/17 | 12/31/17 | 3/31/18 |
| 3/31/19 | |
| 3/31/19 | |
| 3/31/19 | | 6/30/19 | 9/30/19 | 12/31/19 | 3/31/20 |
| Genpact | Genpact | 101.98 | 114.88 | 118.93 | 131.54 | 132.90 | Genpact | 130.68 | 141.81 | 144.57 | 157.66 | 109.44 |
| Peer Group | Peer Group | 104.37 | 108.70 | 116.16 | 125.50 | 130.75 | Peer Group | 118.45 | 120.30 | 121.44 | 126.90 | 98.96 |
| S&P 500 | S&P 500 | 106.07 | 109.34 | 114.24 | 121.83 | 120.91 | S&P 500 | 113.65 | 118.54 | 120.55 | 131.49 | 105.72 |
| | 6/30/18 | 9/30/18 | 12/31/18 | 3/31/19 | 6/30/19 |
| 6/30/20 | |
| 6/30/20 | |
| 6/30/20 | | 9/30/20 | 12/31/20 | 3/31/21 | 6/30/21 |
| Genpact | Genpact | 120.48 | 127.79 | 112.97 | 147.63 | 160.21 | Genpact | 137.24 | 146.74 | 156.20 | 162.13 | 172.42 |
| Peer Group | Peer Group | 137.02 | 141.49 | 122.83 | 145.50 | 147.77 | Peer Group | 124.75 | 146.37 | 173.43 | 184.18 | 199.14 |
| S&P 500 | S&P 500 | 125.06 | 134.70 | 116.49 | 132.39 | 138.09 | S&P 500 | 127.44 | 138.81 | 155.68 | 165.29 | 179.42 |
| | 9/30/19 | 12/31/19 | 3/31/20 | 6/30/20 | 9/30/20 |
| 9/30/21 | |
| 9/30/21 | |
| 9/30/21 | | 12/31/21 | 3/31/22 | 6/30/22 | 9/30/22 |
| Genpact | Genpact | 163.32 | 178.11 | 123.64 | 155.04 | 165.78 | Genpact | 180.69 | 202.30 | 166.34 | 162.39 | 168.25 |
| Peer Group | Peer Group | 149.17 | 155.87 | 121.56 | 153.24 | 179.79 | Peer Group | 215.49 | 264.11 | 230.61 | 181.76 | 166.82 |
| S&P 500 | S&P 500 | 140.43 | 153.17 | 123.15 | 148.45 | 161.71 | S&P 500 | 180.47 | 200.37 | 191.15 | 160.37 | 152.54 |
| | 12/31/20 | 03/31/21 | 06/30/21 | 09/30/21 | 12/31/21 |
| 12/31/22 | |
| 12/31/22 | |
| 12/31/22 | | 03/31/23 | 06/30/23 | 09/30/23 | 12/31/23 |
| Genpact | Genpact | 176.46 | 183.16 | 194.78 | 204.13 | 228.54 | Genpact | 178.55 | 178.69 | 145.79 | 140.99 | 135.73 |
| Peer Group | Peer Group | 213.04 | 226.24 | 244.62 | 264.69 | 324.41 | Peer Group | 173.66 | 180.31 | 187.48 | 190.64 | 215.19 |
| S&P 500 | S&P 500 | 181.35 | 192.55 | 209.01 | 210.23 | 233.41 | S&P 500 | 164.08 | 176.38 | 191.80 | 185.52 | 207.21 |
This graph is not deemed to be “filed” with the SEC or subject to the liabilities of Section 18 of the Securities Exchange Act of 1934, and should not be deemed to be incorporated by reference into any of our prior or subsequent filings under the Securities Act of 1933 or the Securities Exchange Act of 1934.
Dividends
In February 2021,2023, our board of directors approved a 10% increase in our quarterly cash dividend to $0.1075$0.1375 per common share, representing an annual dividend of $0.43$0.55 per common share. In 2021,2023, dividends were declared in February, May, July and October and paid in March, June, September and December. In February 2022,2024, our board of directors approved a 16%an 11% increase in our quarterly cash dividend to $0.125$0.1525 per common share, representing a planned annual dividend of $0.50$0.61 per common share for 2022.2024. Any future dividends will be at the discretion of the board of directors and subject to Bermuda and other applicable laws.
Unregistered Sales of Equity Securities
None.
Purchase of Equity Securities by the Issuer and Affiliated Purchasers
Share repurchase activity during the three months ended December 31, 20212023 was as follows:
| | | | | | | | | | | | | | | | | | | | | | | | | | |
| Period | | Total Number of Shares
Purchased | | Weighted Average Price Paid per
Share ($) | | Total Number of Shares
Purchased as
Part of Publicly
Announced Plan or Program | | Approximate Dollar Value of Shares that May Yet Be
Purchased Under the
Plan or Program ($) |
| October 1-October 31, 2021 | | — | | | — | | | — | | | 489,846,383 | |
| November 1-November 30, 2021 | | 1,083,646 | | 50.76 | | 1,083,646 | | 434,844,870 |
| December 1-December 31, 2021 | | 1,901,507 | | 50.45 | | 1,901,507 | | 338,910,814 |
| Total | | 2,985,153 | | | 50.56 | | 2,985,153 | | | |
| | | | | | | | | | | | | | | | | | | | | | | | | | |
| Period | | Total Number of Shares
Purchased | | Weighted Average Price Paid per
Share ($) | | Total Number of Shares
Purchased as
Part of Publicly
Announced Plan or Program | | Approximate Dollar Value of Shares that May Yet Be
Purchased Under the
Plan or Program ($) |
| October 1-October 31, 2023 | | — | | | — | | | — | | | 474,453,005 | |
| November 1-November 30, 2023 | | 710,947 | | | 33.70 | | | 710,947 | | | 450,491,112 | |
| December 1-December 31, 2023 | | 1,474,762 | | | 34.55 | | | 1,474,762 | | | 399,544,868 | |
| Total | | 2,185,709 | | | 34.27 | | 2,185,709 | | | |
In February 2021,2023, our board of directors authorized a $500 million increase to our existing $1.25$1.75 billion share repurchase program, first announced in February 2015, bringing the total authorization under our existing program to $1.75$2.25 billion. This repurchase program does not obligate us to acquire any specific number of shares and does not specify an expiration date. All shares repurchased under the plan have been cancelled. See Note 19—“Capital stock” to our consolidated financial statements under Part IV, Item 15—“Exhibits and Financial Statement Schedules” for additional information.
Item 6. [Reserved]
Item 6. [Reserved]
Item 7. Management’s Discussion and Analysis of Financial Condition and Results of Operations
The following discussion and analysis is meant to provide material information relevant to an assessment of the financial condition and results of operations of our company, including an evaluation of the amounts and uncertainties of cash flows from operations and from outside sources, so as to allow investors to better view our company from management’s perspective. The following discussion should be read in conjunction with our audited consolidated financial statements and the related notes that appear elsewhere in this Annual Report on Form 10-K. In addition to historical information, this discussion includes forward-looking information that involves risks and assumptions, which could cause actual results to differ materially from management’s expectations. See “Special Note Regarding Forward-Looking Statements” included elsewhere in this Annual Report on Form 10-K.
Macroeconomic environment
Continued impact of COVID-19 on our business and
Our results of operations are affected by various economic and macroeconomic conditions, including the inflationary environment, high interest rates, numerous geopolitical risks and levels of overall business confidence. Throughout 2023, continued economic and geopolitical uncertainty in many markets around the world, including with respect to slowing global economic growth, monetary policy and continued volatility in foreign currency exchange rates, impacted and may continue to impact our business.
The COVID-19 pandemic continuesongoing conflict between Russia and Ukraine and actions taken by the United States and other countries in response, including the imposition of sanctions, as well as the ongoing conflict between Hamas and Israel, have contributed to impact the global economy and the markets in which we operate. For the year ended December 31, 2021, the pandemic had a modest negative impact on our results and may continue to exacerbate supply chain disruption and inflation, regional instability and geopolitical tensions. While we do not have an impact on usoperations in future periods. This section provides a brief overview of how we are respondingRussia or Ukraine, it is difficult to known and anticipatedanticipate the future impacts of the COVID-19 pandemicRussia-Ukraine conflict on our business or our clients’ businesses. We have limited operations in Israel and are closely monitoring the situation. To date, we do not believe the conflicts between Russia and Ukraine and Hamas and Israel, or the economic or political impacts of these conflicts, have had a material impact on our business, financial condition, and results of operations.
While many of our employees globallyposition or operations, but we continue to work from home, we have reopened our offices, in some instances on a limited and voluntary basis, where circumstances have enabled us to do so. In these circumstances we have implemented additional health and safety measures consistent with government recommendations and/or requirements to help ensure employee safety. These measures include health screening, social distancing, contact tracing, enhanced cleaning procedures, and testing and vaccination requirements.
Duringmonitor the year, governments began easing COVID-19 restrictions, which contributed to a resurgence of COVID-19 cases and the spread of COVID-19 variants. The availability of vaccines (and vaccine boosters) continues to increase around the world, albeit with slower than anticipated rollouts and challenges in certain countries.
Our Global Leadership Council continues to coordinate and oversee our actions in response to the COVID-19 pandemic, including business continuity planning, monitoring our revenue and profitability, developing transformation service offerings to address new and developing client needs, and evaluating and adapting our human resource policies. We believe this coordinated effort will maximize our flexibility and allow us to quickly implement any necessary protocols for devising solutions to the problems we and our clients are facing or may face in the future in relation to the pandemic.
As the COVID-19 pandemic evolves, we will continue to assess its impact on the Company and respond accordingly. The ultimate impact of COVID-19 on our business and the industry in which we operate remains unknown and unpredictable. Our past results may not be indicative of our future performance, and our financial results in future periods, including but not limited to net revenues, income from operations, income from operations margin, net income and earnings per share, may differ materially from historical trends. The extent of the impact of the COVID-19 pandemic on our business will depend on a number of factors, including but not limited to the duration and severity of the pandemic; future variants of the COVID-19 virus and the severity of such variants; rates of vaccination and the availability and effectiveness of vaccines, including booster shots, and treatments for COVID-19 globally; the macroeconomic impact of the spread of the virus; and related government stimulus measures. We are currently unable to predict the full impact that the COVID-19 pandemic will have on our results from operations, financial condition, liquidity and cash flows due to numerous uncertainties, including the duration and severity of the pandemic and containment measures and the related macroeconomic impacts. For example, to the extent the pandemic continues to disrupt economic activity globally, we, like other businesses, will not be immune from its effects, and our business, results of operations and financial condition may be adversely affected, possibly materially, by prolonged decreases in spending on the types of services we provide, deterioration of our clients’ credit, or reduced economic activities. In addition, some of our expenses are less variable in nature and do not closely correlate with revenues, which may lead to a decrease in our profitability.situation.
For additional information about the risks we face, in relation to the COVID-19 pandemic, see Part I, Item 1A—“Risk Factors.”
Overview
Our 20212023 revenues were $4.0$4.5 billion, an increase of 8.4%2.4% year-over-year, or 7.2%3.1% on a constant currency1 basis.
Net Revenues
Revenue by top clients. The table below sets forth the percentage of our total net revenues derived from our largest clients, including the General Electric Company, or GE, in the years ended December 31, 20202022 and 2021:2023:
| | | | | | | | | | | |
| Percentage of Total Net Revenues |
| Year ended December 31, |
| 2020 | | 2021 |
| Top five clients | 29.0 | % | | 24.3 | % |
| Top ten clients | 38.5 | % | | 33.6 | % |
| Top fifteen clients | 45.1 | % | | 39.8 | % |
| Top twenty clients | 49.9 | % | | 44.3 | % |
| | | | | | | | | | | |
| Percentage of Total Net Revenues |
| Year ended December 31, |
| 2022 | | 2023 |
| Top five clients | 22.1 | % | | 17.5 | % |
| Top ten clients | 31.2 | % | | 26.3 | % |
| Top fifteen clients | 37.3 | % | | 32.7 | % |
| Top twenty clients | 42.2 | % | | 37.2 | % |
We earn revenues pursuant to contracts that generally take the form of a master service agreement or MSA,("MSA"), which is a framework agreement that is then supplemented by statements of work or SOWs.("SOWs"). Our MSAs specify the general terms applicable to the services we will provide. Our MSAs are generally for terms of three to seven years, although they may also have an indefinite term or be for terms of less than three years. In most cases they do not specify pricing terms or obligate the client to purchase a particular amount of services. We then enter into SOWs under an MSA, which specify particular services to be provided and the pricing terms. Most of our revenues are from SOWs with terms of two to five years. We typically have multiple SOWs under any given MSA, and the terms of our SOWs vary depending on the nature of the services to be provided. We seek to develop long-term relationships with our clients. We believe that these relationships best serve our clients as they create opportunities for us to provide a variety of services using the full range of our capabilities and to deliver continuous process improvement.
New business proposals are reviewed in line with our strategy to target specific industry verticals and geographical markets. We begin each year with a set of named accounts, including prospective clients with operations in our target areas, and all opportunities during the year are reviewed by business leaders from the applicable industry vertical, operations, personnel, and members of our finance team.teams. In this way, we try to ensure that contract terms meet our pricing, cash and service objectives. See Item 1—“Business—Sales and marketing” for additional information.
Many factors affect how we price our contracts. Under some of our MSAs, we are able to share a limited amount of inflation and currency exchange risk for engagements lasting longer than 12 months. Many of our MSAs also provide that, under transaction-based and fixed-price SOWs, we are entitled to retain a portion of certain productivity benefits we achieve. However, some of our MSAs and SOWs require certain minimum productivity benefits to be passed on to our clients. Once an MSA and the related SOWs are signed and production of services commences, our revenues and expenses increase as services are ramped up to the agreed upon level. In many cases, we may have opportunities to increase our profit margins over the life of an MSA or SOW, driven by a number of factors. Our revenues include gains or losses arising upon the maturity of qualified cash flow hedges.
Under our services agreements with GE, GE has the right to terminate the MSA or any SOW in whole or in part for any reason by providing us with a short period of advance notice, subject to early termination charges where applicable. GE is not obligated to provide us with any exclusivity or opportunity to work on GE projects and GE is not required to purchase a minimum amount of services from us.
Although some decisions about our services may be made centrally at GE, the total level of business we receive from GE generally depends on the decisions of the various operating managers of the GE businesses we serve. Because our business from GE is derived from a variety of businesses within GE, our exposure to GE is diversified in terms of industry risk. See Item 1A—“Risk Factors—GE has historically accounted for a significant portion of our revenues and any material loss of business from, or our failure to maintain relationships with, GE and former GE businesses could have a material adverse effect on our business, results of operations and financial condition.”
Classification of certain net revenues. We classify our net revenues in two categories: net revenues from Global Clientscategories based on the nature of services rendered: Data-Tech-AI services and net revenues from GE. Net revenues from Global Clients consist of revenues from services provided to allDigital Operations services.
1Revenue growth on a constant currency basis is a non-GAAP measure and is calculated by restating current-period activity using the prior fiscal period’s foreign currency exchange rates adjusted for hedging gains/losses in such period.
clients other than GE and the companies in which GE owns 20% or more of the outstanding equity interest. If GE ceases to own at least 20% of a business we serve and that business enters into a new agreement with us, we reclassify the revenues from such business as Global Client revenues from the date of divestiture. The impact of the reclassification of revenue from divested GE businesses to Global Client revenue was immaterial in 2020, while the impact of such reclassifications in 2021 was $38.7 million.
In many cases, we have continued to perform services for GE-divested businesses following their divestiture by GE even though they were not obligated by the GE MSA to continue to use our services. In such cases, we have either entered into new MSAs with respect to such businesses following their divestiture by GE or agreed with such businesses to continue to work pursuant to the terms agreed to by GE. We are currently undertaking efforts, and plan to continue efforts, to procure engagements with the businesses that GE divests as part of its GE Capital divestitures.
Expenses. Personnel expenses are a major component of both our cost of revenue and our selling, general and administrative expenses. Personnel expenses include salaries and benefits (including stock-based compensation) as well as costs related to recruitment and training. Personnel expenses are allocated between cost of revenue and selling, general and administrative expenses based on the classification of the employee. Stock-based compensation and depreciation and amortization expense are allocated between cost of revenue and selling, general and administrative expenses using an appropriate allocation basis.
Our industry is labor-intensive. Wage levels in the countries in which our delivery centers are located have historically increased on a year-over-year basis. We attempt to address the impact of wage increases, and pressures to increase wages, in a number of ways, which include seeking to control entry-level wages, managing our attrition, rate, delivering productivity and “right-skilling,” which refers to ensuring that positions are not filled by overqualified employees.
1Revenue growth on a constant currency basis is a non-GAAP measure and is calculated by restating current-period activity using the prior fiscal period’s foreign currency exchange rates adjusted for hedging gains/losses in such period.
We try to control increases in entry-level wages by implementing innovative recruitment policies, utilizing continuous training techniques, emphasizing promotion opportunities and maintaining an attractive work atmosphere and culture.
In planning capacity expansion, we look for locations that help us ensure global delivery capability while helping us control average salary levels. In India and in other countries where we may open multiple offices or delivery centers, we try to expand into cities where competition for personnel and wage levels may be lower than in more developed cities. In addition, under some of our contracts we can share with our clients a portion of any increase in costs due to inflation. Nevertheless, despite these steps, we expect general increases in wage levels in the future, which could adversely affect our margins. A significant increase in attrition rates would also increase our recruitment and training costs and decrease our operating efficiency, productivity and profit margins. Increased attrition rates or increased pricing may also cause some clients to be less willing to use our services. See Item 1A—“Risk Factors—Wage increases in the countries where we operate may reduce our profit margin.”
Our operational expenses include facilities maintenance expenses, travel and living expenses, IT expenses, and consulting and certain other expenses. Consulting charges, consisting of the cost of consultants and contract employees with specialized skills who are directly responsible for the performance of services for clients, are included in cost of revenue. Facilities maintenance expenses and certain other expenses are allocated between cost of revenue and selling, general and administrative expenses based on the employee’s function.
Cost of revenue. The principal component of cost of revenue is personnel expenses. We include in cost of revenue all personnel expenses for employees who are directly responsible for the performance of services for clients, their supervisors and certain support personnel who may be dedicated to a particular client or a set of processes. Travel and living expenses are included in cost of revenue if the personnel expense for the employee incurring such expense is included in cost of revenue.
The ratio of cost of revenue to revenues for any particular SOW or for all SOWs under an MSA is typically higher in the early periods of the contract or client relationship than in later periods. This is because the number of supervisory and direct support personnel relative to the number of employees who are performing services typically declines in later periods of the contract. It is also because we may retain a portion of the benefit of productivity increases realized over time.
Selling, general and administrative expenses. Our selling, general and administrative or ("SG&A,&A") expenses are primarily comprised of personnel expenses for senior management and other support personnel in enabling functions, such as human resources, finance, legal, marketing, sales and sales support, and other non-billable support personnel. The operational costs component of SG&A expenses also includes travel and living costs for such personnel. Additionally, the operational costs component of SG&A expenses includes acquisition related costs, legal and professional fees (which represent the costs of third-party legal, tax, accounting and other advisors), investments in research and development, digital technology, advanced automation and robotics, and an allowance for credit losses.
Amortization of acquired intangible assets. Amortization of acquired intangible assets consists of amortization expenses relating to intangible assets acquired through acquisitions.
Other operating (income) expense, net. Other operating (income) expense, net primarily consists of the impact of the change in the fair value of earn-out consideration and deferred consideration relating to business acquisitions, as well as certain operating losses resulting from the write-down of operating lease right-of-use assets, other assets, property, plant and equipment and intangible assets.assets, impairment charges and losses on the sale of assets classified as held for sale and gains on termination of leases.
Foreign exchange gains (losses), net. Foreign exchange gains (losses), net primarily consists of gains or losses on the re-measurement of non-functional currency assets and liabilities. In addition, it includes gains or losses from derivative contracts entered into to offset the impact of the re-measurement of non-functional currency assets and liabilities. It also includes the realized and unrealized gains or losses on derivative contracts that do not qualify for hedge accounting.
We also enter into derivative contracts to offset the impact of the re-measurement of non-functional currency expenditures and income. The gains or losses on derivative contracts that qualify for hedge accounting, which are cash flow hedges, are deferred and included under other comprehensive income (loss) until the derivative contracts mature, at which time the gains or losses on such cash flow hedges are classified as net revenues, cost of revenue or selling, general and administrative expenses based on the underlying risk being hedged. See Note 2—“Summary of significant accounting policies” to our Consolidated Financial Statements under Part IV, Item 15—“Exhibits and Financial Statement Schedules’’ and Item 7A—“Quantitative and Qualitative Disclosures about Market Risk—Foreign Currency Risk.”
76%
77% of our fiscal 20212023 revenues were earned in U.S. dollars. We also received payments in euros, U.K. pounds sterling, Australian dollars, Japanese yen andand Indian rupees. Our costs are primarily incurred in Indian rupees,U.S. dollars, as well as in U.S. dollars,Indian rupees, U.K. pounds sterling, Romanian lei,leu, Chinese renminbi, euros and the currencies of the other countries in which we have operations. While some of our contracts provide for limited sharing of the risk of inflation and fluctuations in currency exchange rates, we bear a substantial portion of this risk, and therefore our operating results could be negatively affected by adverse changes in wage inflation rates and foreign currency exchange rates. See our discussion of wage inflation under “Expenses” above. We enter into forward currency contracts, which are generally designed to qualify for hedge accounting, in order to hedge most of our net cost currency exposure between the U.S. dollar and the Indian rupee and Mexican peso, between the Australian dollar and the Indian rupee, and between the euro and the Romanian leu, and our revenue currency exposure between the U.S. dollar and the U.K. pound sterling, Philippine peso, Hungarian forint, Chinese renminbi, Polish zloty and the euro, and between the Chinese renminbi and the Japanese yen. However, our ability to hedge such risks is limited by local law, the liquidity of the market for such hedges and other practical considerations. Thus, our results of operations may be adversely affected if we are not able to enter into the desired hedging arrangements or if our hedging strategies are not successful. See Note 2—“Summary of significant accounting policies” to our consolidated financial statements under Part IV, Item 15—“Exhibits and Financial Statement Schedules” for additional information.
Interest income (expense), net. Interest income (expense), net consists primarily of interest expense on indebtedness, including resulting from interest rate swaps and a treasury rate lock agreement, finance lease obligations,obligations, interest adjustments relating to earn-out consideration in connection with certain acquisitions, certain items related to debt restructuring, and interest income on certain deposits. We manage a portion of our interest rate risk related to floating rate indebtedness by entering into interest rate swaps under which we receive floating rate payments based on the greater of LIBORLondon Interbank Offered Rate ("LIBOR") or Term Secured Overnight Financing Rate (“SOFR”), as applicable, and the floor rate under our term loan and make payments based on a fixed rate.
Other income (expense), net. Other income (expense), net primarily includes certain government incentives received by our subsidiaries and changes in the fair value of assets in our deferred compensation plan, and settlement of certain pre-GE divestiture related tax liabilities for which we were indemnified by GE.plan.
Income taxes. We are incorporated in Bermuda and have operations in many countries. Our effective tax rate has historically varied and will continue to vary from year to year based on the tax rate in the jurisdiction of our organization, the geographical sources of our earnings and the tax rates in those countries, the tax relief and incentives available to us, the financing and tax planning strategies employed by us, changes in tax laws or the interpretation thereof, and movements in our tax reserves, if any.
Bermuda taxes. We are organized in Bermuda. Bermuda does not currently impose any income tax on us.
Indian taxes On December 27, 2023, the government of Bermuda passed legislation introducing a corporate income tax of 15%, which will become effective on January 1, 2025. As a result of this new legislation, we recorded a deferred tax asset on net operating losses, which was fully offset b. Indian SEZ legislation provides fory a 15-year tax holiday scheme for operations established in designated special economic zones, or SEZs. Under the SEZ legislation, qualifying operations are eligible for a deduction from taxable income equal to (i) 100% of their profits or gains derived from the export of services for a period of five years from the commencement of operations; (ii) 50% of such profits or gains for the next five years; and (iii) 50% of such profits or gains for an additional period of five years, subject to the creation of a “Special Economic Zone Re-investment Reserve Account,” to be utilized only for acquiring new plant or machinery or for other business purposes, not including the distribution of dividends.valuation allowance.
The Indian government enacted a law in 2019 that allows companies to elect to pay reduced tax rate on all of their income provided they do not take advantage of any tax holidays or other exemptions. In response to this law, we have ceased taking advantage of tax holidays in order to benefit from the reduced tax rate after March 31, 2021.
Additionally, the governments of foreign jurisdictions where we deliver services may assert that certain of our clients have a “permanent establishment” in such jurisdictions by reason of the activities we perform on their behalf, particularly those clients that exercise control over or have substantial dependency on our services. Such an assertion could affect the size and scope of the services requested by such clients in the future.
Transfer pricing. We have transfer pricing arrangements among our subsidiaries involved in various aspects of our business, including operations, marketing, sales and delivery functions. U.S., U.K., and Indian transfer pricing regulations, as well as the regulations applicable in the other countries in which we operate, require that any international transaction involving affiliated enterprises be made on arm’s-length terms. We consider the transactions among our subsidiaries to be substantially on arm’s-length pricing terms. If, however, a tax authority in any jurisdiction reviews any of our tax returns and determines that the transfer prices we have applied are not appropriate, or that other income of our affiliates should be taxed in that jurisdiction, we may incur increased tax liability, including accrued interest and penalties, which would cause our tax expense to increase, possibly materially, thereby reducing our profitability and cash flows.
Other taxes. We have operating subsidiaries or branches in otherseveral countries, including Argentina, Australia, Brazil, Bulgaria, Canada, China, Costa Rica, the Czech Republic, Egypt, Germany, Guatemala, Hungary, India, Ireland, Israel, Japan, Malaysia, Mexico, the Netherlands, the Philippines, Poland, Portugal, Romania, Singapore, South Africa, Thailand, Turkey, the United Kingdom and the United States, as well as sales and marketing subsidiaries in certain jurisdictions, including the United States and the United Kingdom, which are subject to tax in such jurisdictions.
One of our subsidiaries in China obtained a ruling from the Government of China certifying it to be a Technologically Advanced Service Enterprise. As a result, that subsidiary was subject to a lower corporate income tax rate of 15%, initially for a three-year period that began in 2009, which has been extended through December 31, 2023, subject to the fulfillment of certain conditions. Our delivery centers also enjoy corporate tax holidays or concessional tax rates in certain other jurisdictions, including Costa Rica, Israel Malaysia and the Philippines. These tax concessions will expire over the next few years, possibly increasing our overall tax rate.
The governments of foreign jurisdictions where we deliver services may assert that certain of our clients have a “permanent establishment” in such jurisdictions by reason of the activities we perform on their behalf, particularly those clients that exercise control over or have substantial dependency on our services. Such an assertion could affect the size and scope of the services requested by such clients in the future.
Our ability to repatriate surplus earnings from our foreign subsidiaries in a tax-efficient manner is dependent upon interpretations of local laws, possible changes in such laws and the renegotiation of existing double tax avoidance treaties. Changes to any of these may adversely affect our overall tax rate.
Tax audits. Our tax liabilities may also increase, including due to accrued interest and penalties, if the applicable income tax authorities in any jurisdiction, during the course of any audits, were to disagree with any of our tax return positions. We have an indemnity from GE for any additional taxes attributable to periods prior to December 30, 2004.
Tax losses and other deferred tax assets. Our ability to utilize our tax loss carry forwards and other deferred tax assets and credits may be affected if our profitability deteriorates or if new legislation is introduced that changes carry-forward or crediting rules. Additionally, reductions in enacted tax rates may affect the value of our deferred tax assets and our tax expense.
Certain Acquisitions
From time to time we may make acquisitions or engage in other strategic transactions if suitable opportunities arise, and we may use cash, securities, other assets or a combination thereof as consideration.
On December 31, 2021, we acquired 100% of the outstanding equity/limited liability company interests in Hoodoo Digital, LLC, a Utah limited liability company, for total purchase consideration of $66.6$66.7 million. This amount represents cash consideration of $64.3$64.4 million, net of cash acquired of $2.3 million. This acquisition furthersfurthered our strategy to fuse experience and process innovation to help clients drive end-to-end digital transformation. Hoodoo’s expertise with Adobe Experience Manager and other Adobe applications complements our existing end-to-end client solution that seamlessly integrates digital content, ecommerce,e-commerce, data analytics, and marketing operations. Goodwill arising from the acquisition amounting to $44.2$46.0 million has been allocated among our three reporting units as follows: Banking, Capital Markets and Insurance ("BCMI")Financial Services in the amount of $4.2$4.3 million, Consumer Goods, Retail, Life Sciences and Healthcare ("CGRLH") in the amount of $7.0$7.3 million and High Tech Manufacturing and Services ("HMS")Manufacturing in the amount of $33.0$34.4 million, using a relative fair value allocation method. Goodwill arising from this acquisition is deductible for income tax purposes and represents primarily the acquired capabilities and other benefits expected to result from combining the acquired operations with our existing operations.
On December 31, 2020, we acquired 100% of the outstanding equity interests in Enquero Inc, a California corporation, and certain affiliated entities in India, the Netherlands and Canada (collectively referred to as “Enquero”) for total purchase consideration of $148.8 million. This amount represents cash consideration of $137.2 million, net of cash acquired of $11.6 million. This acquisition increased the scale and depth of our data and analytics capabilities and enhanced our ability to accelerate our clients' digital transformation journeys through cloud technologies and advanced data analytics. Goodwill arising from the acquisition amounting to acq$87.9 million has been allocated among our three reporting units as follows: BCMI in the amount of $2.6 million, CGRLH in the amount of $22.5 million and HMS in the amount of $62.7 million, using a relative fair value allocation method. The goodwill arising from this acquisition is not deductible for income tax purposes. The goodwill represents primarily the acquireduired capabilities and other benefits expected to result from combining the acquired operations with our existing operations.
On October 5, 2020, we acquired 100% of the outstanding equity/limited liability company interests in SomethingDigital.Com LLC, a New York limited liability company, for total purchase consideration of $57.5 million. This amount represents cash consideration of $56.1 million, net of cash acquired of $1.4 million. This acquisition supported our strategy to integrate experience and process innovation to help clients on their digital transformation journeys and expanded on our existing experience capabilities to support end-to-end digital commerce solutions, both business-to-business and business-to-consumer. Additionally, this acquisition expanded our capabilities into Magento Commerce, which powers Adobe Commerce Cloud, and Shopify Plus, a cloud-based-ecommerce platform for high-volume merchants. Goodwill arising from the acquisition amounting to $36.9 million has been allocated among two of our reporting units as follows: CGRLH in the amount of $30.4 million and HMS in the amount of $6.5 million, using a relative fair value allocation method. Of the total goodwill arising from this acquisition, $35.1 million is deductible for income tax purposes. The goodwill represents primarily the acquired capabilities and other benefits expected to result from combining the acquired operations with our existing operations.
On November 12, 2019, we acquired 100% of the outstanding equity/limited liability company interests in Rightpoint Consulting, LLC, an Illinois limited liability company, and certain affiliated entities in the United States and India (collectively referred to as “Rightpoint”) for total purchase consideration of $270.7 million. This amount includes cash consideration of $268.2 million, net of cash acquired of $2.5 million. This acquisition expanded our capabilities in improving customer experience and strengthened our reputation as a thought leader in this space. The securities purchase agreement provided certain of the selling equity holders the option to elect to either (a) receive 100% consideration in cash at the closing date for their limited liability company interests and vested options or (b) “roll over” and retain 25% of their Rightpoint limited liability company interests and vested options and receive consideration in cash at closing for the remaining 75% of their Rightpoint limited liability company interests and vested options. Certain selling equity holders elected to receive deferred, variable earnout consideration with an estimated value of $21.5 million over the three-year rollover period, which is included in the purchase consideration. The amount of deferred consideration ultimately payable to the rollover sellers will be based on the future revenue multiple of the acquired business. Goodwill arising from the acquisition amounting to $177.2 million has been allocated among our three reporting units as follows: BCMI in the amount of $17.0 million, CGRLH in the amount of $43.0 million and HMS in the amount of $117.2 million, using a relative fair value allocation method. Of the total goodwill arising from this acquisition, $91.9 million is deductible for income tax purposes. The goodwill primarily represents the acquired capabilities and other benefits expected to result from combining the acquired operations with our existing operations.
New Bookings
New bookings is an operating or other statistical measure. We define new bookings as the total contract value of new client contracts and certain changes to existing client contracts to the extent that such contracts represent incremental future revenue. In determining total contract value for this purpose, we assume the minimum volume to which the client has committed or make a conservative projection where the client has not made a minimum volume commitment. New bookings attributable to large deals may exclude a portion of the total contract value above certain thresholds if the services are subject to certain contingencies, such as the establishment of new delivery centers or regulatory or other approvals. Regular renewals of contracts with no change in scope, which we consider business as usual, are not included as new bookings. We provide information regarding our new bookings because we believe doing so provides useful trend information regarding changes in the volume of our new business and may be a useful metric as an indicator of future revenue growth potential. NewOur management also uses new bookings is also used by management to measure our sales force productivity.
New bookings in 20212023 were $3.7$4.9 billion, compared to $3.1up 25.6% from $3.9 billion in 2020. Bookings increased both in our Transformation Services and Intelligent Operations services. GE bookings declined in 2021 compared to 2020 primarily due to a reduction in bookings related to mid-size Intelligent Operations engagements.2022.
New bookings can vary significantly year to year depending in part on the timing of signing of large contracts. The types of services clients are demanding, the duration of the contract and the pace and level of client spending may impact the conversion of new bookings to revenues. For example, Intelligentbookings for our Digital Operations bookings,services, which are typically provided under multi-year contracts, generally convert to revenue over a longer period of time compared to transformationthan do bookings for our Data-Tech-AI services, which mayoften include shorter cycle, project-based work.
Information regarding our new bookings is not comparable to, nor should it be substituted for, an analysis of our revenues over time. The calculation of new bookings involves estimates and judgments. There are no third-party standards or requirements governing the calculation of new bookings. We do not update our new bookings for material subsequent terminations or reductions related to new bookings originally recorded in prior fiscal years. New bookings are recorded using then-existing foreign currency exchange rates and are not subsequently adjusted for foreign currency exchange rate fluctuations. Our revenues recognized each year will vary from the new bookings value since new bookings is a snapshot measurement of a portion of the total client contract value at a given time.
Critical Accounting Policies and Estimates
A summary of our significant accounting policies is included in Note 2—“Summary of significant accounting policies” to our consolidated financial statements under Part IV, Item 15—“Exhibits and Financial Statement Schedules.” An accounting policy is deemed to be critical if it requires an accounting estimate to be made based on assumptions about matters that are highly uncertain at the time the estimate is made and if changes in the estimate that are reasonably possible could materially impact the financial statements or require a higher degree of judgment than others in their application. We base our estimates on historical experience, contractual commitments and on various other assumptions that we believe to be reasonable under the circumstances and at the time they are made. We believe the following critical accounting policies require a higher level of management judgment and estimates than others in preparing the consolidated financial statements. Management believes that the estimates used in the preparation of the consolidated financial statements are reasonable. Although these estimates are based upon management’s best knowledge of current events and actions, actual results could differ from these estimates.
Revenue recognition. We typically face a long selling cycle in securing a new customer. It is not unusual for us to spend twelve to eighteen months or more from the time we begin actively soliciting a new customer until we begin to recognize revenues.
All costs we incur prior to signing a contract with a customer are expensed as incurred, except for any incremental and direct costs incurred for acquiring the contracts, such as certain sales commissions to employees or third parties, which are classified as contract cost assets and are amortized over the expected period of benefit. Contract acquisition fees or other upfront fees paid to a customer are classified as contract assets which are amortized over the expected period of benefit and recorded as an adjustment to the transaction price and deducted from revenue.
Once a contract is signed, we defer revenues from the transition of services to our delivery centers, as well as the related cost of revenue where such activities do not represent separate performance obligations. Revenues relating to such transition activities are classified under contract liabilities and subsequently recognized ratably over the period in which the related services are performed. Costs relating to such transition activities are fulfillment costs which are directly related to the contract and result in the generation or enhancement of resources. Such costs are expected to be recoverable under the contract and are therefore classified as contract cost assets and recognized ratably over the estimated expected period of benefit under cost of revenue.
Our customer contracts sometimes also include incentive payments received for discrete benefits delivered or promised to be delivered to customers or service level agreements that could result in credits or refunds to the customer. Revenues relating to such arrangements are accounted for as variable consideration when the amount of revenue to be recognized can be estimated to the extent that it is probable that a significant reversal of any incremental revenue will not occur.
We include offerings such as sale of licenses in certain contracts, which may be perpetual or subscription-based. Revenue from distinct perpetual licenses is recognized at the point in time when the license is made available to the customer. Revenue from distinct, non-cancellable, subscription-based licenses is recognized at the point in time when the license is transferred to the customer. Revenue from any associated maintenance or ongoing support services is recognized ratably over the term of the contract. For a combined software license/services performance obligation, revenue is recognized over the period that the services are performed.
We price our services under a variety of arrangements, including time and materials, transaction-based and fixed-price contracts. When services are priced on a time-and-materials basis, we charge the customer based on full-time equivalent, or FTE, rates for the personnel who will directly perform the services. The FTE rates are determined on a periodic basis, vary by category of service delivery personnel and are set at levels to reflect all of our costs, including the cost of supervisory personnel, the allocable portion of other costs, and a margin. In some cases, time-and-materials contracts are based on hourly rates of the personnel providing the services. We recognize revenues when the promised services are delivered to customers for an amount that reflects the consideration to which we expect to be entitled in exchange for those services. We accrue for revenue and unbilled receivables for services rendered between the last billing date and the balance sheet date.
In transaction-based pricing, customers are charged a fixed fee per transaction, with the fee per transaction sometimes linked to the total number of transactions processed. Some of our contracts give the customer the option to prospectively change from a time-and-materials model to a transaction-based pricing model. Revenues from services rendered under time-and-material and transaction-based contracts are recognized as the services are provided.
In the case of fixed-price contracts, including those for application development, maintenance and support services, revenues are recognized ratably over the terms of the contracts.
We sometimes enter into multiple-element revenue arrangements in which a customer may purchase a combination of our products and services. Revenue from multiple-element arrangements is recognized, for each element, based on an allocation of the transaction price to each performance obligation on a relative standalone basis.
Revenue for performance obligations that are satisfied over time is recognized in accordance with the methods prescribed for measuring progress. The input (cost expended) method has been used to measure progress towards completion as there is a direct relationship between input and the satisfaction of a performance obligation. Provisions for estimated losses, if any, on uncompleted contracts are recorded in the period in which such losses become probable based on the current contract estimates.
Timing of revenue recognition may differ from the timing of invoicing. If we receive payment in respect of services prior to the delivery of services, we recognize the payment as an advance from the customer, and it is classified as contract liability. When the related services are performed, the advance is transferred to revenue to the extent the services are rendered.
Significant judgements involved include (a) determining whether services are considered distinct performance obligations that should be accounted for separately rather than together where we enter into contracts with customers that include promises to transfer multiple products and services, (b) determining the standalone selling price for each distinct performance obligation and (c) estimating credits or refunds to our customers resulting from incentive payments received for discrete benefits delivered to customers or under service level agreements. In instances where a standalone selling price for a performance obligation is not directly observable, we use information that may include market conditions and other observable inputs. We estimate credit or refund amounts at contract inception and adjust them at the end of each reporting period as additional information becomes available only to the extent that it is probable that a significant reversal of any incremental revenue will not occur. Changes in these estimates may impact revenue for any given period.
Business combinations. The application of business combination accounting requires the use of significant estimates and assumptions. We account for business combinations using the acquisition method of accounting, by recognizing the identifiable tangible and intangible assets acquired and liabilities assumed, and any non-controlling interest in the acquired business, measured at their acquisition date fair values. Contingent consideration is included within the acquisition cost and is recognized at its fair value on the acquisition date. The measurement of purchase price, including future contingent consideration, if any, and its allocation, requires significant estimates in determining the fair values of assets acquired and liabilities assumed, including with respect to intangible assets and deferred and contingent consideration. Significant estimates and assumptions we may make include, but are not limited to, the timing and amount of future revenue and cash flows based on, among other things, anticipated growth rates, customer attrition rates, and the discount rate reflecting the risk inherent in future cash flows.
In addition, uncertain tax positions and tax-related valuation allowances assumed in connection with business combinations are initially estimated as of the acquisition date, and we reevaluate these items quarterly with any adjustments to our preliminary estimates being recorded to goodwill within the measurement period (up to one year from the acquisition date).
Goodwill and other intangible assets. Goodwill represents the cost of acquired businesses in excess of the fair value of the identifiable tangible and intangible net assets purchased. Goodwill is tested for impairment at least on an annual basis on December 31, or as circumstances warrant based on a number of factors, including operating results, business plans and future cash flows. We perform an assessment of qualitative factors to determine whether the existence of events or circumstances leads to a determination that it is more likely than not that the fair value of a reportingreporting unit is less than its carrying amount. Based on our assessment of events or circumstances, we perform a quantitative assessment of goodwill impairment if it is determined that it is more likely than not that the fair value of a reporting unit is less than its carrying amount. Based on the results of our assessments of qualitative factors, we determined that the fair values of all of our reporting units are likely to be higher than their respective carrying amounts as of December 31, 20202022 and 2021.2023.
During the year ended December 31, 2022, we took actions to realign our portfolio to focus on services we believe have the greatest opportunities for growth, and deprioritized assets that no longer fit with our long-term strategy. As such, during 2022, we identified and divested a business that was part of our Consumer and Healthcare segment and classified certain technology-related intangible assets and goodwill as held for sale. We tested these assets for impairment and determined that the carrying values were not recoverable and accordingly recorded an impairment charge to adjust the carrying amount of these assets to their fair value. The impairment charge was recorded in “other operating (income) expense, net.” During 2023, the sale of these assets was completed and we recorded a loss on the sale in "other operating (income) expense, net." See Note 8—“Assets and liabilities held for sale” to our consolidated financial statements under Part IV, Item 15—“Exhibits and Financial Statement Schedules” for additional information.
We capitalize certain software and technology development costs incurred in connection with developing or obtaining software or technology for sale/leasesale to customers when the initial design phase is completed and commercial and technological feasibility has been established. Any development cost incurred before technological feasibility is established is expensed as incurred as research and development costs. Technological feasibility is established upon completion of a detailed design program or, in its absence, completion of a working model. Capitalized software and technology costs include only (i) the external direct costs of materials and services utilized in developing or obtaining software and technology and (ii) compensation and related benefits for employees who are directly associated with the project.
We test our intangible assets for impairment whenever events occur or changes in circumstances indicate that the related carrying amounts may not be recoverable. Determining whether we have incurred an impairment loss requires comparing the carrying amounts of the assets to the sum of future undiscounted cash flows expected to be generated by the assets. When determining the fair value of our intangible assets, we utilize various assumptions, including discount
rates, estimated growth rates, economic trends and projections of future cash flows. These projections also take into account factors such as the expected impact of new client contracts, expanded or new business from existing clients, efficiency initiatives, and the maturity of the markets in which each of our businesses operates. We generally categorize intangible assets acquired individually or with a group of other assets or in a business combination as customer-related, marketing-related, technology-related, and other intangible assets. See Note 2—“Summary of significant accounting policies—Business combinations, goodwill and other intangible assets” and Note 10—“Goodwill and intangible assets” to our consolidated financial statements under Part IV, Item 15—“Exhibits and Financial Statement Schedules’’ for more information about how we value our intangible assets. Actual results may vary, and may cause significant adjustments to the valuation of our assets in the future.
Income taxes. We calculate and provide for income taxes in each of the tax jurisdictions in which we operate. We account for income taxes using the asset and liability method. Under this method, income tax expense is recognized for the amount of taxes payable or refundable for the current year. In addition, deferred tax assets and liabilities are recognized for future tax consequences attributable to differences between the financial statement carrying amounts of existing assets and liabilities and their tax bases and for all operating losses and tax credits carried forward, if any. Deferred tax assets and liabilities are measured using enacted tax rates expected to apply to taxable income in the years in which the temporary differences are expected to be recovered or settled. The effect on deferred tax assets and liabilities of a change in tax rates or tax status is recognized in the statement of income in the period that includes the enactment date or the filing or approval date of the tax status change. Deferred tax assets are recognized in full, subject to a valuation allowance that reduces the amount recognized to that which is more likely than not to be realized. In assessing the likelihood of realization, we consider estimates of future taxable income.
In the case of an entity that benefits from a corporate tax holiday, deferred tax assets or liabilities for existing temporary differences are recorded only to the extent such temporary differences are expected to reverse after the expiration of the tax holiday.
We also evaluate potential exposures related to tax contingencies or claims made by tax authorities in various jurisdictions and determine if a reserve is required. A reserve is recorded if we believe that a loss is more likely than not to occur and the amount can be reasonably estimated. Any such reserves are based on estimates and are subject to changing facts and circumstances considering the progress of ongoing audits, case law and new legislation. We believe that the reserves we have established are adequate.
We apply a two-step approach for recognizing and measuring uncertain tax positions. The first step is to evaluate the tax position for recognition by determining, based on the technical merits, that the position is more likely than not to be sustained upon examination. The second step is to measure the tax benefit as the largest amount of the tax benefit that is greater than 50% likely of being realized upon settlement. We also include interest and penalties related to unrecognized tax benefits within our provision for income tax expense.
We generally plan to indefinitely reinvest the undistributed earnings of foreign subsidiaries, except for those earnings that can be repatriated in a tax-free manner. Accordingly, we do not currently accrue any material income, distribution or withholding taxes that would arise if such earnings were repatriated.
Due to rounding, the numbers presented in the tables included in this Item 7—“Management’s Discussion and Analysis of Financial Condition and Results of Operations” may not add up precisely to the totals provided.
Results of Operations
For a discussion of our results of operations for the year ended December 31, 2019,2021, including a year-to-year comparison between 20202022 and 2019,2021, refer to Part II, Item 7, "Management's Discussion and Analysis of Financial Condition and Results of Operations" in our Annual Report on Form 10-K for the year ended December 31, 2020.2022.
The following table sets forth certain data from our income statement for the years ended December 31, 20202022 and 2021:2023:
| | Year ended December 31, | | Percentage change increase/ (decrease) 2021 vs. 2020 |
| 2020 | | 2021 | |
| Net revenues—Global Clients | $ | 3,250.5 | | | $ | 3,646.0 | | | 12.2 | % |
| Net revenues—GE | $ | 458.9 | | | $ | 376.2 | | | (18.0) | % |
| Year ended December 31, | | | Year ended December 31, | | Percentage change increase/ (decrease) 2023 vs. 2022 |
| 2022 | |
| Data-Tech-AI services | |
| Data-Tech-AI services | |
| Data-Tech-AI services | | $ | 1,959.9 | | | $ | 1,993.1 | | | 1.7 | % |
| Digital Operations services | | Digital Operations services | $ | 2,411.3 | | | $ | 2,483.8 | | | 3.0 | % |
| Total net revenues | Total net revenues | $ | 3,709.4 | | | $ | 4,022.2 | | | 8.4 | % | Total net revenues | $ | 4,371.2 | | | $ | | $ | 4,476.9 | | | 2.4 | | 2.4 | % |
| Cost of revenue | Cost of revenue | 2,418.1 | | | 2,590.3 | | | 7.1 | % | Cost of revenue | 2,834.8 | | | 2,906.2 | | 2,906.2 | | | 2.5 | | 2.5 | % |
| Gross profit | Gross profit | $ | 1,291.2 | | $ | 1,432.0 | | | 10.9 | % | Gross profit | $ | 1,536.4 | | | $ | | $ | 1,570.7 | | | 2.2 | | 2.2 | % |
| Gross profit margin | Gross profit margin | 34.8% | | 35.6% | |
| Operating expenses | Operating expenses | |
| Operating expenses | |
| Operating expenses | |
| Selling, general and administrative expenses | |
| Selling, general and administrative expenses | |
| Selling, general and administrative expenses | Selling, general and administrative expenses | 789.8 | | | 865.7 | | | 9.6 | % | 938.4 | | | 913.1 | | 913.1 | | | (2.7) | | (2.7) | % |
| Amortization of acquired intangible assets | Amortization of acquired intangible assets | 43.3 | | | 58.4 | | | 34.8 | % | Amortization of acquired intangible assets | 42.7 | | | 31.5 | | 31.5 | | | (26.3) | | (26.3) | % |
| Other operating (income) expense, net | Other operating (income) expense, net | 19.3 | | | (1.2) | | | (106.2) | % | Other operating (income) expense, net | 53.2 | | | (4.7) | | (4.7) | | | (108.9) | | (108.9) | % |
| Income from operations | Income from operations | $ | 438.7 | | $ | 509.0 | | | 16.0 | % | Income from operations | $ | 502.2 | | | $ | | $ | 630.9 | | | 25.6 | | 25.6 | % |
| Income from operations as a percentage of net revenues | Income from operations as a percentage of net revenues | 11.8% | | 12.7% | |
| Foreign exchange gains (losses), net | Foreign exchange gains (losses), net | 7.5 | | | 12.7 | | | 69.3 | % |
| Foreign exchange gains (losses), net | |
| Foreign exchange gains (losses), net | | 15.4 | | | 4.3 | | | (72.2) | % |
| Interest income (expense), net | Interest income (expense), net | (49.0) | | | (51.4) | | | 5.1 | % | Interest income (expense), net | (52.2) | | | (47.9) | | (47.9) | | | (8.2) | | (8.2) | % |
| Other income (expense), net | Other income (expense), net | 3.2 | | | 12.9 | | | 298.2 | % | Other income (expense), net | (0.1) | | | 15.0 | | 15.0 | | | NM* | | NM* |
| Income before income tax expense | Income before income tax expense | $ | 400.5 | | $ | 483.1 | | 20.6 | % | Income before income tax expense | $ | 465.2 | | | $ | | $ | 602.2 | | | 29.4 | | 29.4 | % |
| Income tax expense | 92.2 | | | 113.7 | | | 23.3 | % |
| Income tax expense (benefit) | | Income tax expense (benefit) | 111.8 | | | (29.0) | | | (126.0) | % |
| Net income | Net income | $ | 308.3 | | $ | 369.4 | | 19.8 | % | Net income | $ | 353.4 | | | $ | | $ | 631.3 | | | 78.6 | | 78.6 | % |
| Net income as a percentage of net revenues | Net income as a percentage of net revenues | 8.3% | | 9.2% | |
Fiscal Year Ended December 31, 20212023 Compared to the Fiscal Year Ended December 31, 20202022
Net revenues. Our net revenues were $4,022.2$4,476.9 million in 2021,2023, up $312.8$105.7 million, or 8.4%2.4%, from $3,709.4$4,371.2 million in 2020. The growth2022. Growth in our net revenues was primarily driven by Global Clients, led by both transformation servicesData-Tech-AI and intelligent operations engagements, with double-digital growth across most of our verticals.Our net revenues from GE declined in 2021 compared to 2020, largely due to committed productivity and a reduction in GE’s discretionary expenditures resulting from the macroeconomic environment, as well as GE’s divestitures of certain businesses that as of January 1, 2021 are included in our Global Client portfolio.Digital Operations services.
Adjusted for foreign exchange, primarily the impact of changes in the values of the euro,Japanese yen, Australian dollar, Indian Rupee and U.K. pound sterlingSouth African rand against the U.S. dollar, our net revenues grew 7.2%3.1% in 20212023 compared to 20202022 on a constant currency2 basis. Revenue growth on a constant currency2 basis is a non-GAAP measure. We provide information about our revenue growth on a constant currency2 basis so that our revenue may be viewed without the impact of foreign currency exchange rate fluctuations compared to prior fiscal periods, thereby facilitating period-to-period comparisons of our business performance. Total net revenues on a constant currency2 basis are calculated by restating current-period activity using the prior fiscal period’s foreign currency exchange rates and adjusted for hedging gains/losses.
Our average headcount increased to approximately 103,100123,400 in 20212023 from approximately 96,700115,800 in 2020.2022.
| | | | | | | | | | | | | | | | | |
| Year ended December 31, | | Percentage change increase/ (decrease) 2021 vs. 2020 |
| 2020 | | 2021 | |
| (dollars in millions) | | |
| Net revenues—Global Clients | $ | 3,250.5 | | | $ | 3,646.0 | | | 12.2 | % |
| Net revenues—GE | $ | 458.9 | | | $ | 376.2 | | | (18.0) | % |
| Total net revenues | $ | 3,709.4 | | | $ | 4,022.2 | | | 8.4 | % |
| | | | | | | | | | | | | | | | | |
| Year ended December 31, | | Percentage change increase/ (decrease) 2023 vs. 2022 |
| 2022 | | 2023 | |
| (dollars in millions) | | |
| Data-Tech-AI services | $ | 1,959.9 | | | $ | 1,993.1 | | | 1.7 | % |
| Digital Operations services | $ | 2,411.3 | | | $ | 2,483.8 | | | 3.0 | % |
| Total net revenues | $ | 4,371.2 | | | $ | 4,476.9 | | | 2.4 | % |
Net revenues from Data-Tech-AI services in 2023 were $1,993.1 million, up $33.2 million, or 1.7%, from $1,959.9 million in 2022. This increase was largely driven by continued growth in our supply chain management services as well as an increase in revenue from automating core client finance and accounting processes in 2023 compared to 2022.
Net revenues from Global ClientsDigital Operations services in 20212023 were $3,646.0$2,483.8 million, up $395.5$72.5 million, or 12.2%3.0%, from $3,250.5$2,411.3 million in 2020. This increase was2022, primarily due to ramp-ups from certain new large deals and existing contracts.
Revenues by segment were as follows: | | | | | | | | | | | | | | | | | |
| Year ended December 31, | | Percentage change increase/ (decrease) 2023 vs. 2022 |
| 2022 | | 2023 | |
| (dollars in millions) | | |
| Financial Services | $ | 1,159.7 | | | $ | 1,225.4 | | | 5.7 | % |
| Consumer and Healthcare | 1,593.5 | | | 1,570.7 | | | (1.4) | % |
| High Tech and Manufacturing | 1,617.9 | | | 1,680.8 | | | 3.9 | % |
| Net revenues | 4,371.2 | | | 4,476.9 | | | 2.4 | % |
| Business held for sale | (12.0) | | | (0.5) | | | (95.9) | % |
| Net revenues (excluding business held for sale) | $ | 4,359.2 | | | $ | 4,476.4 | | | 2.7 | % |
Net revenues from our Financial Services segment increased by 5.7% in 2023 compared to 2022, largely due to continued demand for our underwriting and risk management services in our insurance vertical, which leverage data and analytics, as well as our digital solutions involving automation of back-office processes, partially offset by a decline in client spending on short-cycle discretionary technology projects. Net revenues from our Consumer and Healthcare segment decreased by 1.4% in 2023 compared to 2022, largely driven by double-digital growth across mostlower Data-Tech-AI services revenue in 2023 compared to 2022, and the impact of the recent divestiture of the business that we had previously classified as held for sale, which was completed in February 2023. Net revenues from our verticals withinHigh Tech and Manufacturing segment increased by 3.9% in 2023 compared to 2022, largely driven by revenues from recently signed large deals, continued ramp-ups of existing client relationships and client demand for our CGRLHsupply chain management and HMS segments, led by both transformation servicessales and intelligent operationscommercial engagements, partially offset by a change in the impact ofdeal scope for a restructured relationship with one of our banking and capital markets clients. Global Client revenue also included the impact of GE's divestitures of certain businesses that as of January 1, 2021 are includedlarge client in our Global Client portfolio. As a percentage of total net revenues, net revenues from Global Clients increased from 87.6% in 2020 to 90.6% in 2021.
early 2023. Net revenues from GE were $376.2 million"Business held for sale" in 2021, down $82.7 million, or 18.0%,the table above represent revenues from 2020, largely duea business we had previously classified as held for sale with effect from April 1, 2022 as part of a series of actions we took in 2022 to committed productivityfocus our business on emerging solutions where we see the greatest opportunities for growth and a reductionto deprioritize assets that no longer fit with our long-term strategy. The sale of the business we had previously classified as held for sale was completed in GE’s discretionary expenditures resulting from the macroeconomic environment, as well as the impactfirst quarter of $38.7 million in revenues in 2021 from certain GE-divested businesses that as of January 1, 2021 are included in Global Client revenue.
Revenues by segment were as follows:
| | | | | | | | | | | | | | | | | |
| Year ended December 31, | | Percentage change increase/ (decrease) 2021 vs. 2020 |
| 2020 | | 2021 | |
| (dollars in millions) | | |
| BCMI | $ | 1,079.2 | | | $ | 1,016.8 | | | (5.8) | % |
| CGRLH | 1,264.7 | | | 1,509.5 | | | 19.4 | % |
| HMS | 1,388.8 | | | 1,479.2 | | | 6.5 | % |
| Others | (23.3) | | | 16.7 | | | 171.8 | % |
| Total net revenues | $ | 3,709.4 | | | $ | 4,022.2 | | | 8.4 | % |
2 Revenue growth on a constant currency basis is a non-GAAP measure and is calculated by restating current-period activity using the prior fiscal period’s foreign currency exchange rates adjusted for hedging gains/losses in such period.
For additional information, see Note 8—“Assets and liabilities held for sale” and Note 24—“Segment reporting” to our consolidated financial statements under Part IV, Item 15—“Exhibits and Financial Statement Schedules.”
Net revenuesWith effect from our BCMI segment decreased 5.8% in 2021 compared to 2020, largely due toJanuary 1, 2023, we have modified the impact of the restructuring of a contract with a large client in our banking and capital markets vertical during the fourth quarter of 2020, partially offset by higher revenues from clients in our insurance vertical. Revenues from our BCMI segment increased sequentially in the last three quarters of 2021. Net revenues in our CGRLH segment increased 19.4% in 2021 compared to 2020, primarily driven by an increase in both our transformation services and intelligent operations engagements, including the ramp-up of several large relationships as well as revenue from Enquero and SomethingDigital.Com LLC, which we acquired in the fourth quarter of 2020. Net revenues from our HMS segment increased 6.5% in 2021 compared to 2020, primarily driven by an increase in revenues from Global Clients largely related to transformation services and ramp-ups of new deals, as well as incremental revenue from Enquero, partially offset by lower revenues from GE in our manufacturing and services vertical due to committed productivity and a reduction in GE’s discretionary expenditures resulting from the macroeconomic environment. Net revenues from "Others" in the table above primarily represents the impact of foreign exchange fluctuations, which is notitems that are allocated to our reportable segments for management’s internal reporting purposes. the purpose of evaluating segment performance, and we now allocate by segment certain foreign exchange gains/(losses) (to the extent included in income from operations) and unallocated resource costs. Segment results after such allocation are reviewed by the Chief Operating Decision Maker ("CODM") to evaluate segment performance. Prior to January 1, 2023, the CODM evaluated the performance of reportable segment revenue after excluding these items, which were previously included under "Others." Accordingly, we have recast the segment revenue of our reportable segments for 2022 to present comparable segment information. For additional information, see Note 24—“Segment reporting” to our consolidated financial statements under Part IV, Item 15—“Exhibits and Financial Statement Schedules.”
Cost of revenue. Cost of revenue was $2,590.3$2,906.2 million in 2021,2023, up $172.2$71.4 million, or 7.1%2.5%, from $2,418.1$2,834.8 million in 2020.2022. The increase in our cost of revenue in 20212023 compared to 20202022 was primarily due to (i) an increase in our operational headcount supportingto support revenue growth, including in the number of onshore personnel related to large deals and transformation services delivery as well as from the acquisition of SomethingDigital.Com LLC and Enquero in the fourth quarter of 2020, (ii) wage inflation, and (iii) increased hiring costshigher travel related to new deals and other growth initiatives, and (iv) higher expenses associated with increased medical costs.expenses. This increase was partially offset by (i) improved utilization of resources,lower depreciation and amortization expense, (ii) a decrease in travel costs due to the ongoing COVID-19 pandemic,lower contractor expenses, and (iii) a decrease in depreciation expense in 2021 compared to 2020. We also recorded a non-recurring charge related to retirement fund assets in India and a restructuring charge related toan employee severance charge of $8.4 million as part of the restructuring we undertook in 2020,2022, while no corresponding charge was recorded in 2021. 2023. For additional information, see Note 28—27—“Restructuring” to our consolidated financial statements under Part IV, Item 15—“Exhibits and Financial Statement Schedules.”
Gross margin. Our gross margin increasedremained flat at 35.1% from 34.8% in 20202022 to 35.6% in 2021,2023, primarily driven bydue to higher wage inflation, an increase in the share of our revenue derived from our transformation servicesoperational headcount and reflecting digitization-led productivity as well ashigher travel-related expenses in 2023 compared to 2022, which were largely offset by lower depreciation costand amortization expense and lower travel costs due to the ongoing COVID-19 pandemicthird party consultant expenses in 20212023 compared to 2020, partially offset by higher expenses associated with medical costs, and an increase in hiring costs related to new deals and other growth opportunities.2022. We also recorded a non-recurring charge related to retirement fund assets in India and a restructuring charge related toincurred an employee severance charge of $8.4 million in 2020,2022 as part of a restructuring, while no corresponding charges werecharge was recorded in 2021.2023. For additional information, see Note 27—“Restructuring” to our consolidated financial statements under Part IV, Item 15—“Exhibits and Financial Statement Schedules.”
Selling, general and administrative (SG&A) expenses. SG&A expenses as a percentage of total net revenues increased from 21.3%were 20.4% in 2020 to2023 and 21.5% in 2021.2022. SG&A expenses were $865.7$913.1 million in 2021, up $75.92023, down $25.3 million, or 9.6%2.7%, from $789.8$938.4 million in 2020. This increase2022. The decrease in SG&A expenses was primarily due to higher staffing tothe impact of the divestiture of the business we had previously classified as held for sale, controlled spending on support increased revenues, higher medical costs, higher planned researchfunctions and development investments in cloud-based offerings and other prioritized service lines, higher marketing expenses, and wage inflation in 2021 compared to 2020, partially offset by lower depreciation expense. We also recorded a non-recurringan employee severance charge as part of oura restructuring in 2020,2022, while no corresponding charge was recorded in 2021.2023. For additional information, see Note 8—“Assets and liabilities held for sale” and Note 27—“Restructuring” to our consolidated financial statements under Part IV, Item 15—“Exhibits and Financial Statement Schedules.”
Amortization of acquired intangibles. Amortization of acquired intangibles was $58.4$31.5 million in 2021, up $15.12023, down $11.2 million, or 34.8%26.3%, from $43.3$42.7 million in 2020.2022. This increase isdecrease was primarily due to higher amortization expense related to the acquisitionscompletion of Enquero and SomethingDigital.Com LLCuseful lives of intangibles acquired in the fourth quarter of 2020.prior periods.
Other operating (income) expense, net. Other operating income (net of expense) was $1.2$4.7 million in 2021,2023, compared to other operating expense (net of income) of $19.3$53.2 million in 2020.2022. This reductionchange was primarily due to (i) a non-recurring impairment chargegain of $31.2$4.9 million on the termination of an abandoned lease in 2023 with no corresponding gain recorded in 2022, (ii) a $20.3 million write-down related to the abandonment of certain leasedvarious office premises and a $1.4 million write-down related to tangible assets, both of which were taken as part of a restructuring we undertook in 2022, and intangible(iii) an impairment charge of $32.6 million in 2022 related to assets primarily technology-and customer-related, partially offset by a $7.8 million decrease in the fair value of earn-out liabilitiespreviously classified as held for sale, while no corresponding charge was recorded in 2020, while no similar significant charges or earn-out adjustments were recorded in 2021.2023. For additional information, see Note 28—8—“Assets and liabilities held for sale” and Note 27—“Restructuring” to our consolidated financial statements under Part IV, Item 15—“Exhibits and Financial Statement Schedules.”
Income from operations. As a result of the foregoing factors, income from operations as a percentage of total net revenues increased from 11.8%11.5% in 20202022 to 12.7%14.1% in 2021.2023. Income from operations was $509.0increased by $128.7 million from $502.2 million in 2021, up 16.0%, or $70.3 million, from $438.72022 to $630.9 million in 2020.2023, primarily due to an increase in gross margin and lower selling, general and administrative expenses in 2023, an impairment charge on assets previously classified as held for sale and the restructuring undertaken in 2022, as discussed above.
Foreign exchange gains (losses), net. We recorded a net foreign exchange gain of $12.7$4.3 million in 2021,2023, compared to $7.5$15.4 million in 2020.2022. The gains in 2021 resulted primarily fromboth the depreciation of the Indian rupee against the U.S. dollar and gains from fair value hedges. The gains in 2020years resulted primarily from the depreciation of the Indian rupee against the U.S. dollar.
Interest income (expense), net. Our interest expense (net of interest income) was $51.4$47.9 million in 2021, up $2.42023, down $4.3 million from $49.0$52.2 million in 2020,2022, primarily due to a $2.0$12.5 million increase in interest income in 2023 compared to 2022, offset by a $8.2 million increase in interest expense relatedin 2023 compared to our $3502022.
Our interest income increased from $5.9 million aggregate principal amount of 1.750% senior notes issued in March 2021. This2022 to $18.4 million in 2023 due to higher interest rates on deposits in 2023 compared to 2022. The increase in interest expense was partially offset bylargely due to (i) a lower outstanding amount on our term loan, lower drawdown of our revolving credit facility and a lowerhigher average London Interbank Offered Rate ("LIBOR")-basedbenchmark-based rate on our revolving credit facility and term loan, partially offset by lower volume and higher lossesgains on interest rate swaps taken to hedge interest rate exposure under our term loan in 20212023 compared to 2020,2022, which we discuss in the section titled “Liquidity and Capital Resources—Financial Condition” below. Ourbelow, and (ii) higher interest income decreased by $0.4 millionexpense related to receivables sold under our revolving accounts receivable-based facilities in 20212023 compared to 2020, primarily2022. This increase was partially offset by lower interest expense in 2023 compared to 2022 due to lower interest incomethe repayment in IndiaApril 2022 of our $350 million aggregate principal amount of 3.70% senior notes issued in 2021 compared to 2020. March 2017. The weighted average rate of interest on our debt, including the net impact of interest rate swaps, decreasedincreased from 3.0% in 20202022 to 2.9%3.7% in 2021.2023.
Other income (expense), net. Our other income (net of expense) was $12.9$15.0 million in 2021, up $9.7 million from $3.22023, compared to other expense (net of income) of $0.1 million in 2020. The increase in other income2022. This change was primarily attributabledue to export subsidies receiveda gain on changes in India, settlement of certain pre-GE divestiture related tax liabilities for which we were indemnified by GE, and higher gains on the fair value of assets in our deferred compensation plan in 20212023 compared to 2020.a loss on changes in the fair value of assets in our deferred compensation plan in 2022.
Income tax expenseexpense/(benefit). Our income tax expense increased from $92.2was $111.8 million in 20202022, compared to $113.7an income tax benefit of $29.0 million in 2021.2023. Our effective tax rate or ETR,("ETR") was 23.5%(4.8%) in 2021, up from 23.0%2023 and 24.0% in 2020.2022. The increasechange in our ETR isin 2023 was primarily due to the recording of a non-recurring tax benefit of $169.9 million on an intra-entity transfer of certain discrete items recordedintellectual property rights from certain non-US subsidiaries to certain wholly-owned US subsidiaries in 2021, partially offset by interest received on income tax refunds during 2021.an effort to better align with our business operations.
Net income. As a result of the foregoing factors, net income as a percentage of net revenues was 9.2%14.1% in 2021,2023, up from 8.3%8.1% in 2020.2022. Net income increased by $61.1$277.9.0 million from $308.3$353.4 million in 20202022 to $369.4$631.3 million in 2021.2023, primarily due to a decrease in income tax expense due to a non-recurring tax benefit in 2023 and a change in other operating income during 2023.
Adjusted income from operations. Adjusted income from operations or AOI,("AOI"), increased by $73.9$44.7 million from $588.8$718.2 million in 20202022 to $662.7$762.9 million in 2021.2023. Our AOI margin increased from 15.9% in 2020 to 16.5% in 2021. This increase was2022 to 17.0% in 2023, primarily due to higher revenues, gross margin,driven by cost efficiencies and operating leverage in 20212023 compared to 2020, partially offset by wage inflation, higher planned research2022. In calculating our AOI margin for 2023 and development investments2022, we adjusted total net revenues to exclude net revenues of $0.5 million in cloud-based offerings2023 and other prioritized service lines, and higher medical costs$12.0 million in 2021 compared to 2020.2022 from the business previously classified as held for sale.
AOI is a non-GAAP measure and is not based on any comprehensive set of accounting rules or principles and should not be considered a substitute for, or superior to, financial measures calculated in accordance with GAAP, and may be different from non-GAAP financial measures used by other companies. We believe that presenting AOI together with our reported results can provide useful supplemental information to our investors and management regarding financial and business trends relating to our financial condition and results of operations. A limitation of using AOI versus net income calculated in accordance with GAAP is that AOI excludes certain recurring costs and certain other charges, namely stock-based compensation and amortization of acquired intangibles. We compensate for this limitation by providing specific information on the GAAP amounts excluded from AOI.
We calculate AOI as net income, excluding (i) stock-based compensation, (ii) amortization and impairment of acquired intangible assets, (iii) acquisition-related expenses excluded in the period in which an acquisition is consummated, (iv) foreign exchange (gain)(gains)/loss,losses (other than those included in income from operations), (v) restructuring expenses,(income) expense, (vi) any loss or gain on businesses held for sale, including impairment charges, (vii) interest (income) expense, and (vii)(viii) income tax expense,expense/(benefit), as we believe that our results after taking into account these adjustments more accurately reflect our ongoing operations. For additional information, see Note 24—“Segment reporting” to our consolidated financial statements under Part IV, Item 15—“Exhibits and Financial Statement Schedules.”
During the year ended December 31, 20202022, duewe carried out certain restructuring activities in line with our long-term strategy to the impactimplement a flexible, hybrid global delivery model that incorporates a mix of the COVID-19 pandemic on our then currentoffshore, onshore, near-shore, and expected revenues,remote working. As a result, we recordeddetermined that certain leases and employee roles were unnecessary. Accordingly, we took a $26.5 million restructuring charge primarily related to the abandonment of leased office premises and employee severance charges. This restructuring charge$38.8 million, which was excluded from AOI during the year ended December 31, 2020, and no2022. No corresponding charge was recorded during the year ended December 31, 2021.2023. For additional information, see Note 28—27—“Restructuring” to our consolidated financial statements under Part IV, Item 15—“Exhibits and Financial Statement Schedules.”
For additional information, see Note 8—“Assets and liabilities held for sale” and Note 24—“Segment reporting” to our consolidated financial statements under Part IV, Item 15—“Exhibits and Financial Statement Schedules.”
The following table shows the reconciliation of AOI to the most directly comparable GAAP measure for the years ended December 31, 20202022 and 2021:2023:
| | | | | | | | | | | |
| Year ended December 31, |
| 2020 | | 2021 |
| (dollars in millions) |
| Net income | $ | 308.3 | | | $ | 369.4 | |
| Foreign exchange (gains) losses, net | (7.5) | | | (12.7) | |
| Interest (income) expense, net | 49.0 | | | 51.4 | |
| Income tax expense | 92.2 | | | 113.7 | |
| Stock-based compensation | 74.0 | | | 82.0 | |
| Amortization and impairment of acquired intangible assets | 43.6 | | | 57.6 | |
| Acquisition-related expenses | 2.7 | | | 1.2 | |
| Restructuring expenses | 26.5 | | | — | |
| Adjusted income from operations | $ | 588.8 | | | $ | 662.7 | |
| | | | | | | | | | | |
| Year ended December 31, |
| 2022 | | 2023 |
| (dollars in millions) |
| Net income | $ | 353.4 | | | $ | 631.3 | |
| Foreign exchange (gains) losses, net | $ | (15.4) | | | $ | (4.3) | |
| Interest (income) expense, net | $ | 52.2 | | | $ | 47.9 | |
| Income Tax Expense/ (Benefit) | $ | 111.8 | | | $ | (29.0) | |
| Stock-based compensation | $ | 77.4 | | | $ | 88.6 | |
| Amortization and impairment of acquired intangible assets | $ | 42.6 | | | $ | 31.3 | |
| Loss on the sale of business classified as held for sale | $ | — | | | $ | 0.8 | |
| Restructuring expense (income) | $ | 38.8 | | | $ | (4.9) | |
| Loss relating to business held for sale | $ | 24.8 | | | $ | 1.2 | |
| Impairment charge on assets classified as held for sale | $ | 32.6 | | | $ | — | |
| Adjusted income from operations | $ | 718.2 | | | $ | 762.9 | |
The following table sets forth our AOI by reportable business segment for the years ended December 31, 20202022 and 2021:2023:
| | | | | | | | | | | | | | | | | |
| Year ended December 31, | | Percentage change increase/ (decrease) 2021 vs. 2020 |
| 2020 | | 2021 | |
| (dollars in millions) | | |
| BCMI | $ | 132.9 | | | $ | 126.9 | | | (4.5) | % |
| CGRLH | 197.2 | | 250.8 | | 27.2 | % |
| HMS | 244.2 | | 272.8 | | 11.7 | % |
| Others | 14.5 | | 12.2 | | (15.9) | % |
| | | | | | | | | | | | | | | | | |
| Year ended December 31, | | Percentage change increase/ (decrease) 2023 vs. 2022 |
| 2022 | | 2023 | |
| (dollars in millions) | | |
| Financial Services | $ | 172.3 | | | $ | 193.4 | | | 12.2 | % |
| Consumer and Healthcare | $ | 233.0 | | | $ | 242.5 | | | 4.0 | % |
| High Tech and Manufacturing | $ | 303.6 | | | $ | 297.9 | | | (1.9) | % |
| Total reportable segment | $ | 708.9 | | | $ | 733.7 | | | 3.5 | % |
| Others | $ | (15.5) | | | $ | 28.0 | | | 281.0 | % |
| Total | $ | 693.4 | | | $ | 761.7 | | | 9.9 | % |
| Loss relating to business held for sale | $ | 24.8 | | | $ | 1.2 | | | NM* |
| Adjusted income from operations | $ | 718.2 | | | $ | 762.9 | | | 6.2 | % |
*Not Meaningful
AOI of our BCMIFinancial Services segment decreasedincreased to $126.9$193.4 million in 20212023 from $132.9$172.3 million in 2020, largely as a result2022, primarily due to higher revenues, improved efficiency and the net favorable impact of allocating foreign exchange gains/(losses) and resource costs in 2023 compared to 2022, partially offset by the impact of restructuringwage inflation. AOI of our Consumer and Healthcare segment increased to $242.5 million in 2023 from $233.0 million in 2022, primarily due to improved efficiencies, the net favorable impact of allocating foreign exchange gains/(losses) and resource costs, and the absence of a contract with a large clientloss in our banking and capital markets vertical during2023 from the fourth quarter of 2020,business we had previously classified as held for sale, partially offset by higher revenuesthe impact of wage inflation in our insurance vertical. AOI of our CGRLH segment increased2023 compared to $250.8 million in 2021 from $197.2 million in 2020, primarily driven by higher revenues in both our transformation services and intelligent operations, including revenue from Enquero and SomethingDigital.Com LLC acquired in the fourth quarter of 2020, partially offset by increased hiring costs related to new deals and higher medical costs.2022. AOI of our HMSHigh Tech and Manufacturing segment increaseddecreased to $272.8$297.9 million in 20212023 from $244.2$303.6 million in 2020,2022, primarily due to increased leverage driven by revenue growth from Global Clients in our HMS segment, which also included revenue from Enquero acquired in the fourth quarter of 2020,wage inflation and higher utilization of resources,investments made in certain new large client deals in 2023 compared to 2022, partially offset by higher medicalrevenue and the net favorable impact of allocating foreign exchange gains/(losses) and resource costs in 2023 compared to 2022. With effect from January 1, 2023, we modified the items that are allocated to our reportable segments for the purpose of evaluating segment performance, and lower revenueswe now allocate by segment certain foreign exchange gains/(losses) (to the extent included in income from GE inoperations) and unallocated resource costs. Segment results after such allocation are reviewed by the CODM to evaluate segment performance. Prior to January 1, 2023, the CODM evaluated the performance of reportable segment adjusted income from operations after excluding these items, which were previously included under "Others." Accordingly, we have recast the segment adjusted income from operations of our manufacturing and services vertical duereportable segments for 2022 to committed productivity and a reduction in GE’s discretionary expenditures resulting from the macroeconomic environment.present comparable segment information. AOI for “Others” in the table above primarily represents the impact of foreign exchange fluctuations, adjustment of allowances for credit losses and over- or under-absorption of overheads, none of which is allocated to any individual segment for management's internal reporting purposes.
AOI for "Business held for sale" in the table above primarily represents the loss attributable to a business previously classified as held for sale. See Note 8—"Assets and liabilities held for sale" and Note 24—“Segment reporting” to our consolidated financial statements under Part IV, Item 15—“Exhibits and Financial Statement Schedules.”
Seasonality
Our financial results may vary from period to period. Our revenues are typically higher in the third and fourth quarters than in other quarters, as a result of several factors. We generally find that demand for short-term transformationData-Tech-AI services, including analytics and IT projects, increases in the fourth quarter as our clients utilize the balance of their budgets for the year. In addition, contracts for long-term intelligent operationsDigital Operations engagements are often signed in the first and second quarters as clients begin new budget cycles. Volumes under such contracts then increase in the latter part of the year as engagements ramp up. Additionally, demand for certain services, such as collections and transaction processing, is often greater in the second half of the year as our clients’ volumes in such areas increase.
Statement of financial position
Key changes in our financial position during 20212023
Following are the significant changes in our financial position as of December 31, 20212023 compared to December 31, 2020:2022:
•Short-term borrowings decreased by $250.0$141.0 million
The decrease in our short-term debt is primarily due to the repayment of $250.0 millionpayments made on our term loan in short-term borrowings using the proceeds2023 and lower utilization of the issuancefunded drawdown of the credit facility under our 1.750% senior notesamended and restated credit agreement entered into in December 2022, which consists of a registered offering in 2021. See$530.0 million term loan and a $650.0 million revolving credit facility. For additional information, see Note 15—“Short-term borrowings” to our consolidated financial statements under Part IV, Item 15—“Exhibits and Financial Statement Schedules” for additional information.
•Prepaid expenses, other current assets, contract cost assets and other assets decreasedincreased by $41.7$35.3 million
The decreaseincrease in prepaid expenses, other current assets, contract cost assets and other assets is primarily due to lowerhigher tax payments (net of refunds), higher contract assets (net of amortization) and higher tax refunds received, recovery ofdeferred billings. The increase was partially offset by a deal bonus and severance costs as a result of the impact of restructuring a clientdecrease in prepaid expenses, contract cost assets and a reduction in finance lease right-of-use assets. The decrease was partially offset by higher deferred billings, and an increase in contract cost assets. SeeFor additional information, see Note 25—“Net revenues—Contract balances” to our consolidated financial statements under Part IV, Item 15—“Exhibits and Financial Statement Schedules” for additional information.
•Net accountsAccounts receivable, net increased by $6.7$122.0 million
The increase in our accounts receivable is primarily due to increased revenues in 2021, offset by improvedhigher days sales outstanding.
•Goodwill and intangible assets decreased by $31.8$37.1 million
Goodwill increaseddecreased by $35.3$0.4 million, primarily due to the acquisitioneffect of Hoodoo Digital, LLC in the fourth quarter of 2021, partially offset by exchange rate fluctuations. Our intangible assets decreased by $67.1$36.7 million due to the amortization and impairment expenses, offset by the acquisition of Hoodoo Digital, LLC. Seeintangible assets. For additional information, see Note 10—“Goodwill and intangible assets” to our consolidated financial statements under Part IV, Item 15—“Exhibits and Financial Statement Schedules.”
•Operating lease right-of-use assets decreased by $34.1$12.2 million
The decrease in operating lease right-of-use assets is due to the amortization, of right-of-use assets, partially offset by additionsassets recognized due to leases entered into in 2023. For additional information, see Note 12—“Leases” to our consolidated financial statements under Part IV, Item 15—“Exhibits and modifications in 2021.Financial Statement Schedules.”
•Operating lease liability decreased by $36.5$26.1 million
The decrease in operating lease liability is due to lease payments, partially offset by additions and modifications in 2021.2023.
•Accounts payable, accrued expenses, other current liabilities and other liabilities increaseddecreased by $2.5$20.6 million
The increasedecrease in accounts payable, accrued expenses, other current liabilities and other liabilities is primarily due to an increasea reduction in expense and employee related accruals, partially offset by the payment ofaccounts payable, contract liabilities, finance lease liabilities, statutory liabilities (payroll taxes) that were deferred in 2020 as permitted by the Coronavirus Aid, Relief and Economic Security Act, and lower mark-to-market losses on derivative financial instruments.instruments in 2023 compared to 2022. This decrease was partially offset by an increase in expense related accruals and employee related accruals in 2023.
•Long-term debt increaseddecreased by $315.0$18.3 million
The increasedecrease in long-term debt is primarily due to the issuance of $350 million aggregate principal amount of 1.750% senior notes in a registered offering in 2021, offset by principal repayments of $34.0 millioninstallment payments made on our term loan.
loan in 2023. For additional information, see Note 14—“Long-term debt” to our consolidated financial statements under Part IV, Item 15—“Exhibits and Financial Statement Schedules.”
•Net deferred tax assets decreasedincreased by $2.8$155.9 million
Our net deferred tax assets decreasedincreased by $2.8 million. See$155.9 million, primarily due to the recording of a non-recurring tax benefit of $169.9 million on an intra-entity transfer of certain intellectual property rights from certain non-US subsidiaries to certain wholly-owned US subsidiaries in an effort to better align with our business operations. For additional information, see Note 23—“Income taxes” to our consolidated financial statements under Part IV, Item 15—“Exhibits and Financial Statement Schedules.”
Liquidity and Capital Resources
Overview
Information about our financial position as of December 31, 20202022 and 20212023 is presented below:
| | | | | | | | | | | | | | | | | |
| As of December 31, | | As of December 31, | | Percentage Change
increase/(decrease) |
| 2020 | | 2021 | | 2021 vs. 2020 |
| (dollars in millions) | | |
| Cash and cash equivalents | $ | 680.4 | | | $ | 899.5 | | | 32.2 | % |
| Short-term borrowings | 250.0 | | | — | | | (100.0) | % |
| Long-term debt due within one year | 33.5 | | | 383.4 | | | NM* |
| Long-term debt other than the current portion | 1,307.4 | | | 1,272.5 | | | (2.7) | % |
| Genpact Limited total shareholders’ equity | $ | 1,834.2 | | | $ | 1,897.1 | | | 3.4 | % |
*Not Meaningful | | | | | | | | | | | | | | | | | |
| As of December 31, | | As of December 31, | | Percentage Change
increase/(decrease) |
| 2022 | | 2023 | | 2023 vs. 2022 |
| (dollars in millions) | | |
| Cash and cash equivalents | $ | 646.8 | | | $ | 583.7 | | | (9.8) | % |
| Short-term borrowings | 151.0 | | | 10.0 | | | (93.4) | % |
| Long-term debt due within one year | 26.1 | | | 432.2 | | | 1,553.8 | % |
| Long-term debt other than the current portion | 1,249.2 | | | 824.7 | | | (34.0) | % |
| Genpact Limited total shareholders’ equity | $ | 1,826.2 | | | $ | 2,248.4 | | | 23.1 | % |
Financial Condition
We have historically financed our operations and our expansion, including acquisitions, with cash from operations and borrowing facilities.
As of December 31, 2021, $875.92023, $581.4 million of our $899.5$583.7 million in cash and cash equivalents was held by our foreign (non-Bermuda) subsidiaries. $3.5$208.0 million of this cash is held by foreign subsidiaries for which we expect to incur and have accrued a deferred tax liability on the repatriation of $9.6$92.3 million of retained earnings. $872.4$277.7 million of the cash and cash equivalents is either held as retained earnings by foreign subsidiaries in jurisdictions where no tax is expected to be imposed upon repatriation orrepatriation. The remaining $95.7 million in cash and cash equivalents held by foreign subsidiaries is being indefinitely reinvested.
InOn February 2020, our board of directors approved a 15% increase in our quarterly cash dividend from $0.085 per common share to $0.0975 per common share, representing an annual dividend of $0.39 per common share for 2020, up from $0.34 per share in 2019. On each of March 18, 2020, June 26, 2020, September 23, 2020 and December 23, 2020, we paid dividends of $0.0975 per share, amounting to $18.5 million, $18.6 million, $18.6 million and $18.4 million in the aggregate, to shareholders of record as of March 9, 2020, June 11, 2020, September 11, 2020 and December 9, 2020, respectively.
In February 2021, our board of directors approved a 10% increase in our quarterly cash dividend from $0.0975 per common share to $0.1075 per common share, representing an annual dividend of $0.43 per common share for 2021, up from $0.39 per share in 2020. On each of March 19, 2021, June 23, 2021, September 24, 2021 and December 22, 2021, we paid dividends of $0.1075 per share, amounting to $20.1 million, $20.1 million, $20.2 million, and $20.0 million in the aggregate, to shareholders of record as of March 10, 2021, June 11, 2021, September 10, 2021, and December 10, 2021, respectively.
In February 2022, our board of directors approved a 16% increase in our quarterly cash dividend from $0.1075 per common share to $0.125 per common share, representing a plannedan annual dividend of $0.50 per common share for 2022, up from $0.43 per common share in 2021. On March 23, 2022, June 24, 2022, September 23, 2022 and December 23, 2022, we paid dividends of $0.125 per share, amounting to $23.1 million, $22.9 million, $22.9 million and $22.9 million in the aggregate, to shareholders of record as of March 10, 2022, June 10, 2022, September 9, 2022 and December 9, 2022, respectively.
On February 9, 2023, our board of directors approved a 10% increase in our quarterly cash dividend from $0.125 per common share to $0.1375 per common share, representing an annual dividend of $0.55 per common share for 2023, up from $0.50 per common share in 2022. On March 24, 2023, June 26, 2023, September 26, 2023 and December 22, 2023, we paid dividends of $0.1375 per share, amounting to $25.3 million, $25.0 million, $24.9 million and $24.8 million in the aggregate, to shareholders of record as of March 10, 2023, June 9, 2023, September 8, 2023 and December 8, 2023, respectively.
On February 8, 2024, our board of directors approved an 11% increase in our quarterly cash dividend from $0.1375 per common share to $0.1525 per common share, representing a planned annual dividend of $0.61 per common share for 2024, up from $0.55 per common share in 2023. Any future dividends will be at the discretion of our board of directors and subject to Bermuda and other applicable laws.
As of December 31, 2023, the total authorization under our existing share repurchase program is $1,750.0was $2,250.0 million, of which $338.9$399.5 million remained available as of December 31, 2021.2023. Since our share repurchase program was initially authorized in 2015, we have repurchased 47,387,07758,178,075 of our common shares at a weighted average price of $29.78$31.81 per share, for an aggregate purchase price of $1,411.1$1,850.5 million. This amount includes shares repurchased under our 2017 accelerated share repurchase program.
During the years ended December 31, 20202022 and 2021,2023, we repurchased 3,412,2934,777,205 and 6,577,5626,013,793 of our common shares, respectively, on the open market at a weighted average price of $40.16$44.79 and$45.32 $37.48 per share, respectively, for an aggregate purchase price of $137.0$214.0 million and $298.1$225.4 million, respectively. All repurchased shares have been retired.
For additional information, see Note 19—“Capital stock” to our consolidated financial statements under Part IV, Item 15—“Exhibits and Financial Statement Schedules.”
We expect that for the next twelve months and for the foreseeable future our cash from operations, cash reserves and debt capacity will be sufficient to finance our operations, our growth and expansion plans, dividend payments and additional share repurchases we may make under our share repurchase program. However, there is no assurance that the impacts we have experienced to date, and any future impact we may experience, from the COVID-19 pandemic will not have an adverse effect on our cash flows. In addition, we may raise additional funds through public or private debt or equity financings. Our working capital needs are primarily to finance our payroll and other administrative and information technology expenses in advance of the receipt of accounts receivable. Our primary capital requirements include opening new delivery centers, expanding existing operations to support our growth, financing acquisitions and enhancing existing capabilities, including building certain digital solutions.
Cash flows from operating, investing and financing activities, as reflected in our consolidated statements of cash flows, are summarized in the following table:
| | Year ended December 31, | | Percentage change increase/ (decrease) 2021 vs. 2020 |
| 2020 | | 2021 | |
| (dollars in millions) | | |
| Year ended December 31, | | | Year ended December 31, | | Percentage change increase/ (decrease) 2023 vs. 2022 |
| 2022 | |
| (dollars in millions) | |
| (dollars in millions) | |
| (dollars in millions) | |
| Net cash provided by (used for) | Net cash provided by (used for) | |
| Net cash provided by (used for) | |
| Net cash provided by (used for) | |
| Operating activities | |
| Operating activities | |
| Operating activities | Operating activities | $ | 584.3 | | | $ | 694.3 | | | 18.8 | % | $ | 443.7 | | | $ | | $ | 490.8 | | | 10.6 | | 10.6 | % |
| Investing activities | Investing activities | (266.4) | | | (122.7) | | | (53.9) | % | Investing activities | (36.6) | | | (78.9) | | (78.9) | | | 115.7 | | 115.7 | % |
| Financing activities | Financing activities | (92.0) | | | (332.9) | | | 261.8 | % | Financing activities | (571.4) | | | (483.0) | | (483.0) | | | (15.5) | | (15.5) | % |
| Net increase in cash and cash equivalents | $ | 225.9 | | | $ | 238.7 | | | 5.7 | % |
| Net decrease in cash and cash equivalents | | Net decrease in cash and cash equivalents | $ | (164.3) | | | $ | (71.1) | | | (56.7) | % |
Cash flows from operatingoperating activities. Net cash provided by operating activities was $694.3$490.8 million in 2021, compared to $584.32023, up from $443.7 million in 2020.2022. This increase was primarily due to a (i) $61.2$277.9 million increase in net income in 20212023 compared to 2020, and2022, (ii) a $70.8 million benefit due to a decrease in net operating assets driven by lower tax payments and higher tax refunds received in 2021 compared to 2020, higher expense accruals, and a reduction in customer acquisition costs in 2021 compared to 2020, partially offset by higher payments toward statutory liabilities (payroll taxes) that were deferred in 2020 as permitted by the Coronavirus Aid, Relief and Economic Security Act, and higher investments in accounts receivable in 2021 compared to 2020. The increase was offset by a $22.0$195.5 million decrease in non-cash expenses in 2023 compared to 2022, primarily due to a deferred income tax asset recorded in connection with a non-recurring deferred tax benefit of $169.9 million in 2023 on an intra-entity transfer of certain intellectual property rights from certain non-US subsidiaries to certain wholly-owned US subsidiaries in an effort to better align with our business operations, lower write-downs of operating lease right-of-use assets, intangible assets and property, plant and equipment, and a lower unrealized loss on the revaluation of foreign currency assets and liabilities in 2021 compared to 2020, partially offset byincluding those previously classified as held for sale, lower depreciation and amortization expense, partially offset by an increase in stock-based compensation expense in 2023 compared to 2022, and (iii) a $35.2 million increase in net operating assets driven by higher investments in accounts receivable, higher tax payments (net of refunds) and higher payments for statutory liabilities, partially offset by higher Goods and Service Tax ("GST") refunds in India and lower deferred tax benefits in 2021 compared to 2020.vendor related payments.
Cash flows fromused for investing activities. Our net cash used for investing activities was $122.7$78.9 million in 2021,2023, compared to $266.4$36.6 million in 2020.2022. This change isincrease was primarily due to cash used for the divestiture of a business of $19.5 million in 2023 compared to proceeds of $17.8 million from the sale of a portion of the business previously classified as held for sale in 2022. Cash used for payments related to acquisitions that were $114.6 million lower in 2021 than in 2020, and payments(net of sales proceeds) for the purchase of property, plant and equipment (net of sale proceeds) and acquired/internally generated intangible assets that were $28.9increased by $4.4 million lower in 2021 than in 2020.2023 compared to 2022. For additional information, see Note 8—“Assets and liabilities held for sale” to our consolidated financial statements under Part IV, Item 15—“Exhibits and Financial Statement Schedules.”
Cash flows fromused for financing activities. Our net cash used for financing activities was $332.9$483.0 million in 2021,2023, compared to $92.0$571.4 million in 2020.2022. This changedecrease was primarily due to (i) higher payments for share repurchases (including expenses related to repurchases) amounting to $298.2 million in 2021 compared to $137.1 million in 2020, (ii) higher dividend payments in 2021, amounting to $80.5 million compared to $74.2 million in 2020, and (iii) an $80.0 million reduction in proceeds fromlower repayments of borrowings (net of repayment)proceeds), amounting to $160.9 million in 20212023 compared to 2020, partially offset by$230.0 million in 2022, (ii) higher proceeds from the issuance of common shares under our stock-based compensation plans, amounting to $35.1$39.5 million in 20212023 compared to $25.1$27.8 million in 2020.
This decrease was partially offset by (i) higher payments for stock purchased and retired (including payments of expenses and taxes related to stock repurchase activity), amounting to $225.5 million in 2023 compared to $214.1 million in 2022, and (ii) higher dividend payments, amounting to $100.0 million in 2023 compared to $91.8 million in 2022.
Financing Arrangements (Credit facility)
The overall borrowing capacity under our revolving facility is $500.0 million, whichIn December 2022, we obtained throughentered into an amendment of our existingamended and restated credit agreement on August 9, 2018. The unamortized costs(the "2022 Credit Agreement") with Genpact USA, Inc. (“Genpact USA”), Genpact Global Holdings (Bermuda) Limited (“GGH”) and anGenpact Luxembourg S.à r.l. (“Genpact Luxembourg”, and together with Genpact USA and GGH, the “Borrowers”), as borrowers, Wells Fargo Bank, National Association (“Wells Fargo”), as administrative agent, swingline lender and issuing bank, and the lenders and other parties thereto, which consists of a $530.0 million term loan and a $650.0 million revolving credit facility. An additional third partythird-party fee paid in connection with the amendment2022 Credit Agreement is being amortized over the term of the amendedterm loan and revolving credit facility, which expiresexpire on December 13, 2027. In connection with our entry into the 2022 Credit Agreement, we terminated our existing credit facility under our amended and restated credit agreement entered into August 8, 2023.2018 (the “2018 Credit Agreement”) with the Borrowers, as borrowers, Wells Fargo, as administrative agent, and the lenders and other financial institutions party thereto, which was comprised of a $680.0 million term loan and a $500.0 million revolving credit facility. The 2022 Credit Agreement replaced the 2018 Credit Agreement.
The outstanding balance of the term loan under the 2018 Credit Agreement as of the date of 2022 Credit Agreement was $527.0 million. The term loan and the revolving credit facility under the 2022 Credit Agreement have a term of five years and expire on December 13, 2027. The 2022 Credit Agreement did not result in a substantial modification of $290.9 million of the outstanding term loan under the 2018 Credit Agreement. As a result of the 2022 Credit Agreement, we extinguished $236.1 million of funding arrangements for the outstanding term loan under the 2018 Credit Agreement and obtained funding from new lenders of $239.1 million, resulting in outstanding principal of $530.0 million of the term loan under the 2022 Credit Agreement. In connection with the 2022 Credit Agreement, we expensed $0.1 million, representing partial acceleration of the amortization of the existing unamortized debt issuance costs and an additional fee paid to our lenders related to the term loan under the 2022 Credit Agreement. The overall borrowing capacity under the revolving credit facility under the 2022 Credit Agreement is $650.0 million, an increase from $500.0 million under the 2018 Credit Agreement. In connection with the 2022 Credit Agreement, we expensed $0.1 million relating to existing unamortized debt issuance cost. The remaining unamortized costs and an additional third-party fee paid in connection with the 2022 Credit Agreement will be amortized over the term of the facility, which will expire on December 13, 2027.
Borrowings under the amended facility2022 Credit Agreement bear interest at a rate equal to, at our election, either LIBORAdjusted Term SOFR (which is the rate per annum equal to (a) Term SOFR (the forward-looking secured overnight financing rate) plus (b) a Term SOFR Adjustment of 0.10% per annum, but in no case lower than 0.00%) plus an applicable margin equal to 1.375% per annum or a base rate plus an applicable margin equal to 0.375% per annum, in each case subject to adjustment based on ourthe Borrowers' debt ratings provided by Standard & Poor’s Rating Services and Moody’s Investors Service, Inc. Based on our election and currentfrom time to time (the "Debt Ratings"). The revolving credit rating,commitments under the applicable interest rate is equal2022 Credit Agreement are subject to LIBOR plus 1.375% per annum. The unutilized amount on the revolving facility bore a commitment fee ofequal to 0.20% per annum.annum, subject to adjustment based on the Debt Ratings. The amendedcommitment fee accrues on the actual daily amount by which the aggregate revolving commitments exceed the sum of outstanding revolving loans and letter of credit agreementobligations.
The 2022 Credit Agreement restricts certain payments, including dividend payments, if there is an event of default under the credit agreement2022 Credit Agreement or if we are not, or after making the payment would not be, in compliance with certain financial covenants contained in the amended credit agreement.2022 Credit Agreement. These covenants require us to maintain a net debt to EBITDA leverage ratio of below 3x and an interest coverage ratio of more than 3x. During the year ended December 31, 2021,2023, we arewere in compliance with the terms of the credit agreement,2022 Credit Agreement, including all of the financial covenants therein. Our retained earnings are not subject to any restrictions on availability to make dividend payments to shareholders, subject to compliance with the financial covenants described above that are contained in the amended credit agreement.2022 Credit Agreement.
As of December 31, 20202022 and 2021,2023, our outstanding term loan, net of debt amortization expense of $1.2$1.6 million and $0.7$1.3 million, respectively, was $593.9$528.4 million and $560.3$508.9 million, respectively.
We also have fund-based and non-fund based credit facilities with banks, which are available for operational requirements in the form of overdrafts, letters of credit, guarantees and short-term loans. As of December 31, 20202022 and 2021,2023, the limit available under such facilities was $14.3$22.9 million and $24.7$23.3 million, respectively, of which $7.8$5.4 million and $5.8$9.3 million, respectively, was utilized, constituting non-funded drawdown. As of December 31, 20202022 and 2021,2023, a total of $252.3$153.7 million and $2.0$11.6 million, respectively, of our revolving credit facility was utilized, of which $250.0$151.0 million and $0$10.0 million, respectively, constituted funded drawdown, and $2.3$2.7 million and $2.0$1.6 million, respectively, constituted non-funded drawdown.
We have enteredmanage a portion of our interest rate risk related to floating rate indebtedness by entering into interest rate swaps under which we receive floating rate payments based on the greater of LIBORTerm SOFR and the floor rate under our term loan and make payments based on a fixed rate. As of December 31, 2021,2023, we were party to interest rate swaps covering a total notional amount of $460.1$148.1 million. Under ourthese swap agreements, the rate that we pay to banks in exchange for LIBORTerm SOFR ranges between 0.38%0.15% and 2.65%4.72%.
Genpact Luxembourg S.à r.l. (“Genpact Luxembourg”), a wholly-owned subsidiary of the Company, issued $350 million aggregate principal amount of 3.70% senior notes in March 2017 (the “2017 Senior Notes”) and $400 million aggregate principal amount of 3.375% senior notes in November 2019 (the “2019 Senior Notes”). The 2017 Senior Notes and the 2019 Senior Notes are fully guaranteed by the Company and Genpact USA, Inc. ("Genpact USA"), a wholly-owned subsidiary of the Company. The total debt issuance cost of $2.6 million and $2.9 million incurred in connection with the 2017 Senior Notes and the 2019 Senior Notes offerings, respectively, areoffering is being amortized over the respective liveslife of the notes as additional interest expense. As of December 31, 20202022 and 2021, the amount outstanding under the 2017 Senior Notes, net of debt amortization expense of $0.7 million and $0.1 million, respectively, was $349.3 million and $349.9 million, respectively, which is payable on April 1, 2022. As of December 31, 2020 and 2021,2023, the amount outstanding under the 2019 Senior Notes, net of debt amortization expense of $2.3$1.1 million and $1.7$0.5 million, was $397.7$398.9 million and $398.3$399.5 million, respectively, which is payable on December 1, 2024.
In March 2021, Genpact Luxembourg and Genpact USA co-issued $350 million aggregate principal amount of 1.750% senior notes in March 2021 (the "2021 Senior Notes"), resulting in cash proceeds of approximately $348.1 million, net of an underwriting commission of $1.4 million and a discount of $0.5 million. Other debt issuance costs incurred in connection with the offering of the 2021 Senior Notes amounted to $1.1 million.. The 2021 Senior Notes are fully guaranteed by the Company. The total debt issuance cost of $3.0 million incurred in connection with the 2021 Senior Notes offeringsoffering is being amortized over the liveslife of the notes as additional interest expense. As of December 31, 2021,2022 and 2023, the amount outstanding under the 2021 Senior Notes, net of debt amortization expense of $2.6$2.0 million and $1.4 million, respectively, was $347.4$348.0 million and $348.6 million, respectively, which is payable on April 10, 2026.
For additional information, see Notes 14—“Long-term debt” and 15—“Short-term borrowings” to our consolidated financial statements under Part IV, Item 15—“Exhibits and Financial Statement Schedules.”
We use a revolving accounts receivable-based facility for managing our cash flows. As part of this arrangement, accounts receivable sold under this facility are de-recognized upon sale along with the related allowances, if any. As of December 31, 2022 and 2023, we have a revolving accounts receivable-based facility of $100.0 million and $75.0 million, respectively, permitting us to sell accounts receivable to banks on a non-recourse basis in the ordinary course of business. The aggregate maximum capacity utilized at any time during the period ended December 31, 2022 and 2023 was $33.0 million and $51.4 million, respectively. The principal amount outstanding against this facility as of December 31, 2022 and 2023 was $33.0 million and $51.3 million, respectively. The cost of factoring accounts receivable sold under this facility during the years ended December 31, 2022 and 2023 was $0.6 million and $2.0 million, respectively.
We also have arrangements with financial institutions that manage the accounts payable program for certain of our large clients. We sell certain accounts receivable pertaining to such clients to these financial institutions on a non-recourse basis. There is no cap on the value of accounts receivable that can be sold under these arrangements. We used these arrangements to sell accounts receivable amounting to $299.9 million and $324.4 million during the years ended December 31, 2022 and December 31, 2023, respectively, which also represents the maximum utilization under these arrangements in each such year. The cost of factoring such accounts receivable during the years ended December 31, 2022 and 2023 was $4.2 million and $7.9 million, respectively.
For additional information, see Note 4—“Accounts receivable, net of allowance for credit losses” to our consolidated financial statements under Part IV, Item 15—“Exhibits and Financial Statement Schedules.”
Goodwill Impairment Testing
Goodwill of a reporting unit is tested for impairment at least annually and between annual tests if an event occurs or circumstances change that would more likely than not reduce the fair value of the reporting unit below its carrying amount. In accordance with ASC 350, Intangibles-Goodwill and Other, we have an option to perform an assessment of qualitative factors, including but not limited to macro-economic conditions, industry and market considerations, overall financial performance, business plans and expected future cash flows, to determine whether events or circumstances exist which lead to a determination that it is more likely than not that the fair value of a reporting unit is less than its carrying amount.
Based on our assessment of such qualitative factors, in accordance with ASC 350, we concluded that as of December 31, 20202022 and 2021,2023, the fair values of all of our reporting units are likely to be higher than their respective carrying values.
Off-Balance Sheet Arrangements
Our off-balance sheet arrangements consist of foreign exchange contracts. For additional information, see Item 1A—“Risk Factors—Currency exchange rate fluctuations in various currencies in which we do business, especially the Indian rupee, the euro and the U.S. dollar, could have a material adverse effect on our business, results of operations and financial condition" and Note 7—6—“Derivative financial instruments” to our consolidated financial statements under Part IV, Item 15—“Exhibits and Financial Statement Schedules.”
Other Liquidity and Capital Resources Information
WeAs of December 31, 2022 and 2023, we have purchase commitments, net of capital advances paid in respect of such purchases, of $13.3$18.0 million which willand $16.0 million, respectively, to be paid in respect of such purchases over the next year. For additional information, see Note 27—26—“Commitments and contingencies” to our consolidated financial statements under Part IV, Item 15—“Exhibits and Financial Statement Schedules.”
WeAs of December 31, 2022 and 2023, we also have operating and finance lease commitments of $420.6$330.1 million and $287.5 million, respectively, to be paid over the remaining lease term.terms. For additional information, see Note 12—“Leases” to our consolidated financial statements under Part IV, Item 15—“Exhibits and Financial Statement Schedules.”
Supplemental Guarantor Financial InformationInformation
As discussed in Note 14, “Long-term debt,” to our consolidated financial statements under Part IV, Item 15- "Exhibit"Exhibits and Financial Statement Schedules," Genpact Luxembourg issued the 2017 Senior Notes and the 2019 Senior Notes, and Genpact Luxembourg and Genpact USA co-issued the 2021 Senior Notes. As of December 31, 2021,2023, the outstanding balance for each of the 2017 Senior Notes, the 2019 Senior Notes and the 2021 Senior Notes (collectively, the "Senior Notes") was $349.9 million, $398.3$399.5 million and $347.4$348.6 million, respectively. Each series of Senior Notes is fully and unconditionally guaranteed by the Company. The 2017 Senior Notes and the 2019 Senior Notes are also fully and unconditionally guaranteed by Genpact USA. Our other subsidiaries do not guarantee the Senior Notes (such subsidiaries are referred to as the “non-Guarantors”).
The Company (with respect to allboth series of Senior Notes) and Genpact USA (with respect to the 2017 Senior Notes and the 2019 Senior Notes) have fully and unconditionally guaranteed (i) that the payment of the principal, premium, if any, and interest on the Senior Notes shall be promptly paid in full when due, whether at stated maturity of the Senior Notes, by acceleration, redemption or otherwise, and that the payment of interest on the overdue principal and interest on the Senior Notes, if any, if lawful, and all other obligations of the applicable issuer or issuers of the Senior Notes, respectively, to the holders of the Senior Notes or the trustee under the Senior Notes shall be promptly paid in full or performed, and (ii) in case of any extension of time of payment or renewal of any Senior Notes or any of such other obligations, that the same shall be promptly paid in full when due or performed in accordance with the terms of the extension or renewal, whether at stated maturity, by acceleration or otherwise. With respect to the 2017 Senior Notes and the 2019 Senior Notes, failing payment by Genpact Luxembourg when due of any amount so guaranteed or any performance so guaranteed for whatever reason, the Company and Genpact USA shall be obligated to pay the same immediately. With respect to the 2021 Senior Notes, failing payment by Genpact Luxembourg or Genpact USA when due of any amount so guaranteed or any performance so guaranteed for whatever reason, the Company shall be obligated to pay the same immediately. The Company and Genpact USA have agreed that the guarantees described above are guarantees of payment of the Senior Notes and not guarantees of collection.
The following tables present summarized financial information for Genpact Luxembourg, Genpact USA and the Company (collectively, the “Debt Issuers and Guarantors”) on a combined basis after elimination of (i) intercompany transactions and balances among the Debt Issuers and Guarantors and (ii) equity in earnings from and investments in the non-Guarantors.
| | Summarized Statements of Income | Summarized Statements of Income | | Year ended
December 31, 2020 | | Year ended
December 31, 2021 | Summarized Statements of Income | | Year ended December 31, 2022 | | Year ended December 31, 2023 |
| (dollars in millions) |
| | (dollars in millions) | | | | (dollars in millions) |
| Net revenues | Net revenues | | $ | 206.5 | | | $ | 214.2 | |
| Gross profit | Gross profit | | 206.5 | | 214.2 | Gross profit | | 141.3 | | 298.1 |
| Net income | Net income | | 762.7 | | 102.7 | Net income | | 72.3 | | 382.4 |
Below is a summary of transactions with non-Guarantors included in the summarized statement of income above: | | | | | | | | | | | | | | |
| | Year ended
December 31, 2020 | | Year ended
December 31, 2021 |
| | (dollars in millions) |
| Royalty income | | $ | 69.5 | | | $ | 4.4 | |
| Revenue from services | | 137.0 | | 209.8 |
| Interest income (expense), net | | 46.7 | | 33.0 |
| Other cost, net | | 11.2 | | 17.7 |
| Gain on sale of intellectual property | | 650.0 | | — | |
| | | | | | | | | | | | | | |
| | Year ended December 31, 2022 | | Year ended December 31, 2023 |
| | (dollars in millions) |
| Royalty income | | $ | — | | | $ | 0.7 | |
| Revenue from services | | 141.3 | | 297.4 |
| Interest income /(expense), net | | 36.9 | | 52.1 |
| Other income /(expense), net | | 25.2 | | (4.5) |
| | Summarized Balance Sheets | Summarized Balance Sheets | | As of
December 31, 2020 | | As of
December 31, 2021 | Summarized Balance Sheets | | As of December 31, 2022 | | As of December 31, 2023 |
| (dollars in millions) |
| | (dollars in millions) | | | | (dollars in millions) |
| Assets | Assets | |
| Current assets | |
| Current assets | |
| Current assets | Current assets | | $ | 2,073.7 | | | $ | 2,257.8 | |
| Non-current assets | Non-current assets | | 711.7 | | 457.5 | Non-current assets | | 178.3 | | 1,045.4 |
| | Liabilities | Liabilities | |
| Liabilities | |
| Liabilities | |
| Current liabilities | |
| Current liabilities | |
| Current liabilities | Current liabilities | | $ | 3,491.9 | | | $ | 3,758.5 | |
| Non-current liabilities | Non-current liabilities | | 1,825.3 | | 1,777.6 | Non-current liabilities | | 1,749.2 | | 904.7 |
Below is a summary of the balances with non-Guarantors included in the summarized balance sheets above:
| | | | | | | | | | | | | | |
| | As of
December 31, 2020 | | As of
December 31, 2021 |
| | (dollars in millions) |
| Assets | | | | |
| Current assets | | | | |
| Accounts receivable, net | | $ | 280.8 | | | $ | 211.3 | |
| Loans receivable | | 1,324.5 | | 1,535.5 |
| Others | | 396.5 | | 410.1 |
| | | | |
| Non-current assets | | | | |
| Investment in debentures/bonds | | $ | 501.2 | | | $ | 296.1 | |
| Loans receivable | | — | | — |
| Others | | 64.2 | | 31.5 |
| | | | |
| Liabilities | | | | |
| Current liabilities | | | | |
| Loans payable | | $ | 2,357.9 | | | $ | 2,431.2 | |
| Others | | 823.4 | | 914.0 |
| | | | |
| Non-Current liabilities | | | | |
| Loans payable | | $ | 500.0 | | | $ | 500.0 | |
| | | | | | | | | | | | | | |
| | As of December 31, 2022 | | As of December 31, 2023 |
| | (dollars in millions) |
| Assets | | | | |
| Current assets | | | | |
| Accounts receivable, net | | $ | 62.1 | | | $ | 114.4 | |
| Loans receivable | | 1,420.3 | | 1,433.1 |
| Others | | 453.1 | | 594.8 |
| Investment in debentures/bonds | | 193.3 | | — |
| | | | |
| Non-current assets | | | | |
| Others | | $ | 79.5 | | | $ | 69.5 | |
| | | | |
| Liabilities | | | | |
| Current liabilities | | | | |
| Loans payable | | $ | 2,805.8 | | | $ | 3,559.7 | |
| Others | | 620.2 | | 1,117.8 |
| | | | |
| Non-Current liabilities | | | | |
| Loans payable | | $ | 500.0 | | | $ | 75.0 | |
The Senior Notes and the related guarantees rank pari passu in right of payment with all senior and unsecured debt of the IssuerDebt Issuers and the GuarantorGuarantors and rank senior in right of payment to all of the Debt Issuer’s and the Guarantor’s future subordinated debt. The Senior Notes are effectively subordinated to all of the Debt Issuer’s and the Guarantor’s existing and future secured debt to the extent of the value of the assets securing such debt. The Senior Notes are structurally subordinated to all of the existing and future debt and other liabilities of the Guarantor’s subsidiaries (other than the Issuer), including the liabilities of certain subsidiaries pursuant to our senior credit facility. The non-Guarantors are separate and distinct legal entities and have no obligation, contingent or otherwise, to pay any amounts due under the Senior Notes or to make the funds available to pay those amounts, whether by dividend, distribution, loan or other payment. If the IssuerDebt Issuers or the GuarantorGuarantors have any right to receive any assets of any of the non-Guarantors upon the insolvency, liquidation, reorganization, dissolution or other winding-up of any non-Guarantor, all of that non-Guarantor’s creditors (including trade creditors) would be entitled to payment in full out of that non-Guarantor’s assets before the holders of the Senior Notes would be entitled to any payment. Claims of holders of the Senior Notes are structurally subordinated to the liabilities of certain non-Guarantors pursuant to their liabilities under our senior credit facility.
Recent Accounting Pronouncements
Recently adopted accounting pronouncements
For a description of recently adopted accounting pronouncements, see Note 2—“Summary of significant accounting policies—Recently issued accounting pronouncements” to our consolidated financial statements under Part IV, Item 15—“Exhibits and Financial Statement Schedules” and Part II, Item 7—“Management’s Discussion and Analysis of Financial Condition and Results of Operations—Critical Accounting Policies and Estimates.”
For a description of recently issued accounting pronouncements, see Note 2—“Summary of significant accounting policies—Recently issued accounting pronouncements” to our consolidated financial statements under Part IV, Item 15—“Exhibits and Financial Statement Schedules.”
Item 7A. Quantitative and Qualitative Disclosures about Market Risk
Foreign currency risk
Our exposure to market risk arises principally from exchange rate risk. A substantial portion of our revenues (76%(77% in fiscal 2021)2023) is received in U.S. dollars. We also receive revenues in Japanese yen, euros, U.K. pounds sterling, Australian dollars, Japanese yen and Indian rupees. Our expenses are primarily in Indian rupeesU.S. dollars and we also incur expenses in U.S. dollars,Indian rupees, U.K. pounds sterling, Romanian lei, Chinese renminbi, euros and the currencies of the other countries in which we have operations. Our exchange rate risk arises from our foreign currency revenues, expenses, receivables and payables. Based on the results of our European operations for fiscal 2021,2023, and excluding any hedging arrangements that we had in place during that period, a 10.0% appreciation or depreciation of the euro against the U.S. dollar would have increased or decreased, as applicable, our revenues in fiscal 20212023 by $12.0$14.0 million. Similarly, excluding any hedging arrangements that we had in place during that period, a 10.0% depreciation of the Indian rupee against the U.S. dollar would have decreased our expenses incurred and paid in Indian rupees in fiscal 20212023 by $111.0$109.0 million. Conversely, a 10.0% appreciation of the Indian rupee against the U.S. dollar would have increased our expenses incurred and paid in rupees in fiscal 20212023 by $91.0$133.0 million.
We have sought to reduce the effect of any Indian rupee-U.S. dollar, Indian rupee-Australian dollar, Philippine Peso-U.S. dollar, Chinese renminbi-Japanese yen, Chinese renminbi-U.S dollar, euro-Romanian leu, Mexican peso-U.S. dollar, Polish zloty-U.S. dollar, Hungarian forint-U.S. dollar, Malaysian ringgit-U.S. dollar and certain other local currency exchange rate fluctuations on our results of operations by purchasing forward foreign exchange contracts to cover a portion of our expected cash flows and accounts receivable. These instruments typically have maturities of zero to sixty months. We use these instruments as economic hedges and not for speculative purposes, and most of them qualify for hedge accounting under the FASB guidance on derivatives and hedging. Our ability to enter into derivatives that meet our planning objectives is subject to the depth and liquidity of the market for such derivatives. In addition, the laws of China, India, Malaysia, the Philippines and Romania limit the duration and amount of such arrangements. We may not be able to purchase contracts adequate to insulate us from Indian rupee-U.S. dollar, Chinese renminbi-Japanese yen, Chinese renminbi-U.S dollar, Philippine peso-U.S. dollar, Malaysian ringgit-U.S. dollar and Romanian leu-euro foreign exchange currency risks. In addition, any such contracts may not perform adequately as hedging mechanisms. See Item 7 —“Management’s Discussion and Analysis of Financial Condition and Results of Operations—Foreign exchange gains (losses), net.”
Interest rate risk
Our exposure to interest rate risk arises principally from interest on our indebtedness. As of December 31, 2021,2023, we had $1,655.9$1,257.0 million of indebtedness, comprised of (a) $560.3$508.9 million of indebtednessindebtedness under our credit facility, comprised2022 Credit Agreement consisting of a long-term loan of $561.0$508.9 million, net of $0.7$1.3 million in unamortized debt issuance expenses, (b) $349.9 million in indebtedness under our 2017 Senior Notes, net of $0.1 million in unamortized bond issuance expenses, (c) $398.3$399.5 million in indebtedness under our 2019 Senior Notes, net of $1.7$0.5 million in unamortized bond issuance expenses, and (d) $347.4(c) $348.6 million in indebtedness under our 2021 Senior Notes, net of $2.6$1.4 million in unamortized bond issuance expenses. Interest on indebtedness under our credit facilitythe 2022 Credit Agreement is variable based on LIBOR,Term SOFR, and we are subject to market risk from changes in interest rates. Borrowings under our credit facility2022 Credit Agreement bear interest at floating rates based on LIBOR,Term SOFR, but in no event less than the floor rate of 0.0% plus an applicable margin. See Item 1A—"Risk Factors"—"We may be unable to service our debt or obtain additional financing on competitive terms.terms or at all.” Based on our indebtedness, a 2% change in interest rates, including the impact on the cost of our interest rate swaps, would have had a $3.4$6.5 million impact on our net interest expense in fiscal 2021.2023. Additionally, the interest rates on our Senior Notes are subject to adjustment based on the ratings assigned by Moody’s and S&P to the notes from time to time. A decline in such ratings could result in an increase of up to 2% in the rate of interest on the Senior Notes. For fiscal 2021,2023, such an increase would have had an impact of up to $20.4$15.0 million on our net interest expense.
We manage a portion of our interest rate risk related to floating rate indebtedness by entering into interest rate swaps under which we receive floating rate payments based on the greater of LIBORTerm SOFR and the floor rate under our term loan and make payments based on a fixed rate. As of December 31, 2021,2023, we were party to interest rate swaps covering a total notional amount of $460.1$148.1 million. Under our swap agreements outstanding as of December 31, 2023, the rate that we pay to banks in exchange for LIBORTerm SOFR ranges between 0.38%4.25% and 2.65%4.72%.
We executed a treasury rate lock agreement for $350 million in connection with future interest payments to be made on the 2021 Senior Notes, and the treasury rate lock agreement was designated as a cash flow hedge. The treasury rate lock agreement was terminated on March 23, 2021, and a deferred gain was recorded in accumulated other comprehensive income and is being amortized to interest expense over the life of the 2021 Senior Notes. The remaining gain to be amortized related to the treasury rate lock agreement as of December 31, 20212023 was $0.7$0.4 million.
Credit risk
As of December 31, 2021,2023, we had accounts receivable, including deferred billings, net of allowance for credit losses, of $932.1$1,202.3 million. $74.2 million of this amount was owed by GE, and the balance, or $857.9 million, was owed by Global Clients. No single Global Clientclient owed more than 10% of our accounts receivable balance as of December 31, 2021.2023.
Item 8. Financial Statements and Supplementary Data
The financial statements and supplementary data required by this item are listed in Part IV, Item 15—“Exhibits and Financial Statement Schedules.”
Item 9. Changes in and Disagreements with Accountants on Accounting and Financial Disclosure
None.
Item 9A. Controls and Procedures
Evaluation of disclosure controls and procedures
Disclosure controls and procedures are the Company’s controls and other procedures which are designed to ensure that information required to be disclosed by us in the reports that we file or submit under the Securities Exchange Act of 1934 or the Exchange Act,(the "Exchange Act"), is recorded, processed, summarized and reported, within the time periods specified in the SEC’s rules and forms. Disclosure controls and procedures include, without limitation, controls and procedures designed to ensure that information required to be disclosed by us in the reports that we file or submit under the Exchange Act is accumulated and communicated to our management, including our Chief Executive Officer and Chief Financial Officer, as appropriate, to allow timely decisions regarding required disclosure.
As of the end of the period covered by this report, the Company carried out an evaluation, under the supervision and with the participation of the Company’s management, including the Company’s Chief Executive Officer along with the Company’s Chief Financial Officer, of the effectiveness of the design and operation of the Company’s disclosure controls and procedures pursuant to Exchange Act Rule 13a-15(b). Based upon that evaluation, the Company’s Chief Executive Officer along with the Company’s Chief Financial Officer concluded that the Company’s disclosure controls and procedures are effective in timely alerting them to material information relating to the Company (including its consolidated subsidiaries) required to be included in the Company’s periodic SEC filings.
Management’s Report on Internal Control Over Financial Reporting
Genpact’s management is responsible for establishing and maintaining adequate internal control over financial reporting to provide reasonable assurance regarding the reliability of our financial reporting and the preparation of financial statements for external purposes in accordance with generally accepted accounting principles. Internal control over financial reporting includes those policies and procedures that:
(i) pertain to the maintenance of records that, in reasonable detail, accurately and fairly reflect the transactions and dispositions of our assets;
(ii) provide reasonable assurance that the transactions are recorded as necessary to permit preparation of financial statements in accordance with generally accepted accounting principles, and that our receipts and expenditures are being made only in accordance with the authorization of management and/or our Board of Directors; and
(iii) provide reasonable assurance regarding the prevention or timely detection of any unauthorized acquisition, use or disposition of our assets that could have a material effect on our financial statements.
Due to its inherent limitations, including that it relies on sample-based testing, internal control over financial reporting may not prevent or detect misstatements. Additionally, projections of any evaluation of effectiveness to future
periods are subject to the risk that controls may become inadequate due to changes in conditions, or that the degree of compliance with the policies or procedures may deteriorate.
Under the supervision and with the participation of our management, including our Chief Executive Officer and Chief Financial Officer, we conducted an evaluation of the effectiveness of our internal control over financial reporting using the criteria set forth by the Committee of Sponsoring Organizations of the Treadway Commission (COSO) in Internal Control—Integrated Framework (2013). Based on its evaluation, our management concluded that our internal control over financial reporting was effective as of December 31, 2021.
During the year 2021, we acquired Hoodoo Digital, LLC, and management excluded from its assessment of the effectiveness of the Company’s internal control over financial reporting as of December 31, 2021, Hoodoo Digital, LLC's internal control over financial reporting associated with total assets of $68,445 thousand (of which $62,816 thousand represents goodwill and intangible assets included within the scope of the assessment) included in the consolidated financial statements of the Company as of and for the year ended December 31, 2021.2023.
KPMG Assurance and Consulting Services LLP, an independent registered public accounting firm, has audited the consolidated financial statements included in this Annual Report on Form 10-K and, as part of its audit, has issued an attestation report, included herein, on the effectiveness of our internal control over financial reporting. See “Report of Independent Registered Public Accounting Firm” on page F-4.
Changes in internal control over financial reporting
There were no changes in the Company’s internal control over financial reporting (as defined in Rules 13a-15(f) and 15d-15(f) under the Exchange Act) during the quarterly period ended December 31, 20212023 that have materially affected, or are reasonably likely to materially affect, the Company’s internal control over financial reporting.
Item 9B. Other Information
None.Director and Officer Trading Arrangements
None of our directors or officers (as defined in Rule 16a-1(f) under the Securities Exchange Act of 1934) adopted or terminated a Rule 10b5-1 trading arrangement or a non-Rule 10b5-1 trading arrangement (as defined in Item 408(c) of Regulation S-K) during the three months ended December 31, 2023.
Item 9C. Disclosure Regarding Foreign Jurisdictions that Prevent Inspections
Not applicable.
PART III
Item 10. Directors, Executive Officers and Corporate Governance
Information about our executive officers is contained in the section titled “Information about our executive officers” in Part I of this Annual Report on Form 10-K. The other information required by this Item will be included in our Proxy Statement for the 20222024 Annual General Meeting of Shareholders under the captions “Director Nominees,” “Corporate Governance,” and “Delinquent Section 16(a) Reports,” which will be filed with the SEC no later than 120 days after the close of the fiscal year ended December 31, 20212023 and is incorporated by reference in this report.
Item 11. Executive Compensation
The information required by this Item will be included in our Proxy Statement for the 20222024 Annual General Meeting of Shareholders under the caption “Executive Officer Compensation,” which will be filed with the SEC no later than 120 days after the close of the fiscal year ended December 31, 20212023 and is, other than the information required by Item 402(v) of Regulation S-K, incorporated by reference in this report.
Item 12. Security Ownership of Certain Beneficial Owners and Management and Related Stockholder Matters
The information required by this Item will be included in our Proxy Statement for the 20222024 Annual General Meeting of Shareholders under the captions “Security Ownership of Certain Beneficial Owners and Management” and “Securities Authorized for Issuance under Equity Compensation Plans,” which will be filed with the SEC no later than 120 days after the close of the fiscal year ended December 31, 20212023 and is incorporated by reference in this report.
Item 13. Certain Relationships and Related Transactions, and Director Independence
The information required by this Item will be included in our Proxy Statement for the 20222024 Annual General Meeting of Shareholders under the captions “Certain Relationships and Related Party Transactions” and “Director Independence,” which will be filed with the SEC no later than 120 days after the close of the fiscal year ended December 31, 20212023 and is incorporated by reference in this report.
Item 14. Principal Accountant Fees and Services
The information required by this Item will be included in our Proxy Statement for the 20222024 Annual General Meeting of Shareholders under the caption “Independent Registered Public Accounting Firm Fees and Other Matters,” which will be filed with the SEC no later than 120 days after the close of the fiscal year ended December 31, 20212023 and is incorporated by reference in this report.
PART IV
Item 15. Exhibits and Financial Statement Schedules
(a)Documents filed as part of this Annual Report on Form 10-K:
1.ConsolidatedConsolidated Financial Statements
The consolidated financial statements required to be filed in the Annual Report on Form 10-K are listed on page F-1 hereof. The required financial statements appear on pages F-6pages F-5 through F-67 hereof.F-68 hereof.
2.Financial Statement Schedules
Separate financial statement schedules have been omitted either because they are not applicable or because the required information is includedincluded in the consolidated financial statements.
3.Exhibit Index:
| | | | | | | | |
Exhibit
Number | | Description |
| | |
| 3.1 | | |
| | |
| 3.2 | | |
| | |
| 4.1 | | |
| | |
| 4.2 | | |
| | |
| 4.3 | | |
| | |
4.4 | | |
| | |
4.54.4 | | Third Supplemental Indenture, dated as of March 26, 2021, by and among the Registrant, Genpact Luxembourg S.à r.l., Genpact USA, Inc. and Wells Fargo Bank, National Association, as trustee, to the Base Indenture dated as of March 27, 2017 (incorporated by reference to Exhibit 4.4 to the Registrant’s Current Report on Form 8-K (File No. 001-33626) filed with the SEC on March 26, 2021). |
| | | | | | | | |
Exhibit
Number | | Description |
| | |
4.74.6 | | First Supplemental Indenture, dated as of March 26, 2021, by and among the Registrant, Genpact Luxembourg S.àr.l., Genpact USA, Inc. and Wells Fargo Bank, National Association, as trustee, to the Base Indenture dated as of March 26, 2021 (incorporated by reference to Exhibit 4.2 to the Registrant’s Current Report on Form 8-K (File No. 001-33626) filed with the SEC on March 26, 2021). |
| | | | | | | | |
Exhibit
Number | | Description |
| | |
4.84.7 | | |
| | |
4.9 | | |
| | |
4.104.8 | | |
| | |
4.114.9 | | |
| | |
| 10.1† | | |
| | |
| 10.2† | | |
| | |
| 10.3† | | |
| | |
| 10.4† | | |
| | |
| 10.5† | | |
| | |
| 10.6† | | |
| | |
| 10.7† | | |
| | |
| 10.8† | | |
| | |
| 10.9† | | |
| | |
| 10.10† | | |
| | |
| | | | | | | | |
Exhibit
Number | | Description |
| | |
| 10.11† | | |
| | |
| 10.12† | | |
| | | | | | | | |
Exhibit
Number | | Description |
| | |
| 10.13† | | |
| | |
| 10.14† | | |
| | |
10.14†10.15† | | |
| | |
| 10.16† | | |
| | |
10.15†10.17† | | |
| | |
10.16†10.18† | | |
| | |
10.17†10.19† | | |
| | |
10.18†10.20† | | |
| | |
10.19† | | |
| | |
10.20† | | |
| | |
| 10.21† | | |
| | |
| 10.22† | | |
| 10.22 | |
| 10.23†* | | |
| | |
| 10.24† | | |
| | |
| 10.25 | | Second Amended & Restated Credit Agreement, dated as of August 9, 2018,December 13, 2022, among Genpact International,USA, Inc., Genpact Global Holdings (Bermuda) Limited, Genpact Luxembourg S.à r.l., the Registrant, the lenders party thereto, Wells Fargo Bank, National Association, as administrative agent, swingline lender, term lender, an issuing bank and a revolving lender, and the other parties thereto (incorporated by reference to Exhibit 10.210.1 to the Registrant’s QuarterlyCurrent Report on Form 10-Q8-K (File No. 001-33626) filed with the SEC on August 9, 2018)December 16, 2022). |
| | |
10.23^ | | |
| | |
10.24 | | Borrower Assignment & Assumption and Amendment Agreement, dated as of January 17, 2019, by and among Genpact International, LLC (formerly Genpact International, Inc.), as the assignor, Genpact USA,Inc., as the assignee, Genpact Global Holdings (Bermuda) Limited, Genpact Luxembourg S.à r.l., the Company, the lenders party thereto and Wells Fargo Bank, National Association, as administrative agent (incorporated by reference to Exhibit 10.26 to the Registrant’s Annual Report on Form 10-K (File No. 001-33626) filed with the SEC on March 1, 2019). |
| | | | | | | | |
Exhibit
Number | | Description |
| | |
| 21.1* | | |
| | |
| 22.1 | | |
| | |
| 23.1* | | |
| | |
| 24.1* | | |
| | |
| 31.1* | | |
| | |
| 31.2* | | |
| | |
| 32.1* | | |
| | |
| 32.2* | | |
| | |
| 97.1†* | | |
| | | | | | | | |
| 101.INS* | | Inline XBRL Instance Document – the instance document does not appear in the Interactive Data File because its XBRL tags are embedded within the Inline XBRL document. |
| | |
| 101.SCH* | | Inline XBRL Taxonomy Extension Schema Document. |
| | |
| 101.CAL* | | Inline XBRL Taxonomy Extension Calculation Linkbase Document. |
| | |
| 101.DEF* | | Inline XBRL Taxonomy Extension Definition Linkbase Document. |
| | |
| 101.LAB* | | Inline XBRL Taxonomy Extension Label Linkbase Document. |
| | |
| 101.PRE* | | Inline XBRL Taxonomy Extension Presentation Linkbase Document. |
| | |
| 104* | | Cover Page Interactive Data File (formatted as Inline XBRL and contained in Exhibit 101). |
* Filed with this Annual Report on Form 10-K.
^ Portions of this exhibit have been omitted pursuant to Item 601(b)(10)(iv) of Regulation S-K.
† Indicates a management contract or compensatory plan, contract or arrangement in which any director or executive officer participates.
Item 16. Form 10-K Summary
None.
SIGNATURES
Pursuant to the requirements of Section 13 or 15(d) of the Securities Exchange Act of 1934, the Registrant has duly caused this report to be signed on its behalf by the undersigned, thereunto duly authorized.
| | | | | |
| GENPACT LIMITED |
| |
| By: | /s/ N.V. TYAGARAJANBALKRISHAN KALRA |
| N.V. TyagarajanBalkrishan Kalra |
| President and Chief Executive Officer |
Date: March 1, 2022February 29, 2024
POWER OF ATTORNEY
Each person whose signature appears below hereby constitutes and appoints each of Heather D. White and Thomas D. Scholtes, as his or her true and lawful attorney-in-fact and agent, with full powers of substitution and resubstitution, for him or her and in his or her name, place and stead, in any and all capacities, to sign any and all amendments to this Annual Report on Form 10-K, and to file the same, with all exhibits thereto, and other documents in connection therewith, with the Securities and Exchange Commission granting to said attorneys-in-fact and agents, and each of them, full power and authority to perform any other act on behalf of the undersigned required to be done in connection therewith.
Pursuant to the requirements of the Securities Exchange Act of 1934, this report has been signed below on March 1, 2022February 29, 2024 by the following persons on behalf of the registrant and in the capacities indicated.
| | | | | | | | | | | |
| Signature | | Title | |
| | | |
/s/ N.V. TYAGARAJANBALKRISHAN KALRA | | President, Chief Executive Officer and Director (Principal Executive Officer) | |
N.V. TyagarajanBalkrishan Kalra | | |
| | | |
| /s/ MICHAEL WEINER | | Chief Financial Officer (Principal Financial and Accounting Officer) | |
| Michael Weiner | | |
| | | |
| /s/ DONALD KLUNK | | Chief Accounting Officer (Principal Accounting Officer) | |
| Donald Klunk | | |
| | | |
| /s/ AJAY AGRAWAL | | Director | |
| Ajay Agrawal | | | |
| | | |
| /s/ STACEY CARTWRIGHT | | Director | |
| Stacey Cartwright | | | |
| | | |
| /s/ LAURA CONIGLIARO | | Director | |
| Laura Conigliaro | | | |
| | | |
| /s/ TAMARA FRANKLIN | | Director | |
| Tamara Franklin | | | |
| | | |
| /s/ CAROL LINDSTROM | | Director | |
| Carol Lindstrom | | | |
| | | |
| /s/ JAMES MADDEN | | Director | |
| James Madden | | | |
| | | |
| /s/ CECELIA MORKEN | | Director | |
| CeCelia Morken | | | |
| | | |
/s/ MARK NUNNELLY | | Director | |
Mark Nunnelly | | | |
| | | |
| /s/ BRIAN STEVENS | | Director | |
| Brian Stevens | | | |
| | | |
| /s/ N.V. TYAGARAJAN | | Director | |
| N.V. Tyagarajan | | | |
| | | |
| /s/ MARK VERDI | | Director | |
| Mark Verdi | | | |
GENPACT LIMITED AND ITS SUBSIDIARIES
Index to Consolidated Financial Statements
| | | | | |
| Page No. |
| F-2 |
| F-6F-5 |
| F-7F-6 |
| F-8F-7 |
| F-9F-8 |
| F-12F-11 |
| F-13F-12 |
Report of Independent Registered Public Accounting Firm
To the Shareholders and Board of Directors
Genpact Limited:
Opinion on the Consolidated Financial Statements
We have audited the accompanying consolidated balance sheets of Genpact Limited and its subsidiaries (the Company) as of December 31, 20212023 and 2020,2022, the related consolidated statements of income, comprehensive income (loss), equity, and cash flows for each of the years in the three‑year period ended December 31, 2021,2023, and the related notes (collectively, the consolidated financial statements). In our opinion, the consolidated financial statements present fairly, in all material respects, the financial position of the Company as of December 31, 20212023 and 2020,2022, and the results of its operations and its cash flows for each of the years in the three‑year period ended December 31, 2021,2023, in conformity with U.S. generally accepted accounting principles.
We also have audited, in accordance with the standards of the Public Company Accounting Oversight Board (United States) (PCAOB), the Company’s internal control over financial reporting as of December 31, 2021,2023, based on criteria established in Internal Control – Integrated Framework (2013) issued by the Committee of Sponsoring Organizations of the Treadway Commission, and our report dated March 01, 2022February 29, 2024 expressed an unqualified opinion on the effectiveness of the Company’s internal control over financial reporting.
Basis for Opinion
These consolidatedfinancial statements are the responsibility of the Company’s management. Our responsibility is to express an opinion on these consolidatedfinancial statements based on our audits. We are a public accounting firm registered with the PCAOB and are required to be independent with respect to the Company in accordance with the U.S. federal securities laws and the applicable rules and regulations of the Securities and Exchange Commission and the PCAOB.
We conducted our audits in accordance with the standards of the PCAOB. Those standards require that we plan and perform the audit to obtain reasonable assurance about whether the consolidated financial statements are free of material misstatement, whether due to error or fraud. Our audits included performing procedures to assess the risks of material misstatement of the consolidated financial statements, whether due to error or fraud, and performing procedures that respond to those risks. Such procedures included examining, on a test basis, evidence regarding the amounts and disclosures in the consolidated financial statements. Our audits also included evaluating the accounting principles used and significant estimates made by management, as well as evaluating the overall presentation of the consolidated financial statements. We believe that our audits provide a reasonable basis for our opinion.
Critical Audit MattersMatter
The critical audit mattersmatter communicated below are mattersis a matter arising from the current period audit of the consolidated financial statements that werewas communicated or required to be communicated to the audit committee and that: (1) relaterelates to accounts or disclosures that are material to the consolidated financial statements and (2) involved our especially challenging, subjective, or complex judgments. The communication of critical audit mattersmatter does not alter in any way our opinion on the consolidated financial statements, taken as a whole, and we are not, by communicating the critical audit mattersmatter below, providing a separate opinionsopinion on the critical audit mattersmatter or on the accounts or disclosures to which they relate.
Realizability of deferred tax assets of Genpact Luxembourg entities
As discussed in Note 23 to the consolidated financial statements as of December 31, 2021, the Company has recorded deferred tax assets of $415,183 thousand, a portion of which pertains to Genpact Luxembourg entities, and a corresponding valuation allowance of $212,192 thousand, a portion of which pertains to Genpact Luxembourg entities. The Company records a valuation allowance for the portion of the deferred tax assets that are not expected to be realized. Changes in assumptions regarding estimates of future taxable income could have a significant impact on the realizability of deferred tax assets and the amount of valuation allowance.
Report of Independent Registered Public Accounting Firm
We identified the evaluation of the realizability of deferred tax assets of Genpact Luxembourg entities as a critical audit matter. Subjective and complex auditor judgment was required to assess the estimated revenue growth and interest expense used to forecast taxable income, and to evaluate the application of the relevant tax regulations. The audit effort also involved use of tax professionals with specialized skills and knowledge to assist in evaluating the audit evidence obtained.
The following are the primary procedures we performed to address this critical audit matter. We evaluated the design and tested the operating effectiveness of certain internal controls over the Company’s deferred tax asset valuation allowance process. This included controls related to the determination of estimated revenue growth and interest expense used to forecast taxable income, and the application of relevant tax regulations. We performed a sensitivity analysis over the expected future taxable income for Genpact Luxembourg entities to assess the effect on the realizability of deferred tax assets. To assess the Company’s evaluation of the realizability of deferred tax assets of Genpact Luxembourg entities and its ability to forecast revenue growth, interest expense, and taxable income, we compared Genpact Luxembourg entities’ previous forecasts to actual results and other projected financial information prepared by the Company. We involved income tax professionals with specialized skills and knowledge, who assisted in assessing the Company’s evaluation of the realizability of deferred tax assets of Genpact Luxembourg entities and application of the relevant tax regulations.it relates.
Unrecognized tax benefits pertaining to operations in India
As discussed in Note 23 to the consolidated financial statements, the Company had unrecognized tax benefits, excluding associated interest and penalties, of $25,651$19,236 thousand as of December 31, 2021,2023, which included unrecognized tax benefits relating to operations in India.
We identified the assessment of unrecognized tax benefits pertaining to operations in India as a critical audit matter. The Company operates in multiple jurisdictions across the world with a significant portion of the operations being in India. Complex auditor judgment was required in evaluating the Company’s interpretation of tax law in respect of matters relating to operations in India, and its estimate of the resolution of the related tax positions. The audit effort also involved use of tax professionals with specialized skills and knowledge to assist in evaluating the audit evidence obtained.
Report of Independent Registered Public Accounting Firm
The following are the primary procedures we performed to address this critical audit matter. We evaluated the design and tested the operating effectiveness of certain internal controls over the Company’s unrecognized tax benefit process. This included controls related to the interpretation of tax law and its application in the liability estimation process.
We involved tax professionals with specialized skills and knowledge, who assisted in:
• evaluating the Company’s interpretation of tax law and its potential impact on the unrecognized tax benefits
• inspecting correspondence, assessments, and settlement documents with applicable taxing authorities
• assessing the expiration of statutes of limitations
• performing an assessment of the completeness and measurement of the Company’s tax positions and comparing the results to the Company’s assessment.
We evaluated the Company’s ability to accurately estimate its unrecognized tax benefits by comparing historical unrecognized tax benefits to actual results upon conclusion of tax examinations.
/s/KPMG Assurance and Consulting Services LLP
We have served as the Company’s auditor since 2004.
Mumbai, Maharashtra, India
March 01, 2022
Report of Independent Registered Public Accounting Firm
To the Shareholders and Board of Directors
Genpact Limited:
Opinion on Internal Control Over Financial Reporting
We have audited Genpact Limited and subsidiaries'its subsidiaries’ (the Company) internal control over financial reporting as of December 31, 2021,2023, based on criteria established in Internal Control – Integrated Framework (2013) issued by the Committee of Sponsoring Organizations of the Treadway Commission.Commission. In our opinion, the Company maintained, in all material respects, effective internal control over financial reporting as of December 31, 2021,2023, based on criteria established in Internal Control – Integrated Framework (2013) issued by the Committee of Sponsoring Organizations of the Treadway Commission.
We also have audited, in accordance with the standards of the Public Company Accounting Oversight Board (United States) (PCAOB), the consolidated balance sheets of the Company as of December 31, 20212023 and 2020,2022, the related consolidated statements of income, comprehensive income (loss), equity, and cash flows for each of the years in the three-year period ended December 31, 2021,2023, and the related notes (collectively, the consolidated financial statements), and our report dated March 01, 2022 expressedFebruary 29, 2024 expressed an unqualified opinion on those consolidated financial statements.
The Company acquired Hoodoo Digital, LLC during December 31, 2021, and management excluded from its assessment of the effectiveness of the Company’s internal control over financial reporting as of December 31, 2021, Hoodoo Digital, LLC’s internal control over financial reporting associated with total assets of $68,445 thousand (of which $62,816 thousand represents goodwill and intangible assets within the scope of the assessment) included in the consolidated financial statements of the Company as of andBasis for the year ended December 31, 2021. Our audit of internal control over financial reporting of the Company also excluded an evaluation of the internal control over financial reporting of Hoodoo Digital, LLC.Opinion
Basis for Opinion
The Company’s management is responsible for maintaining effective internal control over financial reporting and for its assessment of the effectiveness of internal control over financial reporting, included in the accompanying Management’s Report on Internal Control Overover Financial Reporting.Reporting. Our responsibility is to express an opinion on the Company’s internal control over financial reporting based on our audit. We are a public accounting firm registered with the PCAOB and are required to be independent with respect to the Company in accordance with the U.S. federal securities laws and the applicable rules and regulations of the Securities and Exchange Commission and the PCAOB.
We conducted our audit in accordance with the standards of the PCAOB. Those standards require that we plan and perform the audit to obtain reasonable assurance about whether effective internal control over financial reporting was maintained in all material respects. Our audit of internal control over financial reporting included obtaining an understanding of internal control over financial reporting, assessing the risk that a material weakness exists, and testing and evaluating the design and operating effectiveness of internal control based on the assessed risk. Our audit also included performing such other procedures as we considered necessary in the circumstances. We believe that our audit provides a reasonable basis for our opinion.
Definition and Limitations of Internal Control Over Financial Reporting
A company’s internal control over financial reporting is a process designed to provide reasonable assurance regarding the reliability of financial reporting and the preparation of financial statements for external purposes in accordance with generally accepted accounting principles. A company’s internal control over financial reporting includes those policies and procedures that (1) pertain to the maintenance of records that, in reasonable detail, accurately and fairly reflect the transactions and dispositions of the assets of the company; (2) provide reasonable assurance that transactions are recorded as necessary to permit preparation of financial statements in accordance with generally accepted accounting principles, and that receipts and expenditures of the company are being made only in accordance with authorizations of management and directors of the company; and (3) provide reasonable assurance regarding prevention or timely detection of unauthorized acquisition, use, or disposition of the company’s assets that could have a material effect on the financial statements.
Report of Independent Registered Public Accounting Firm
Because of its inherent limitations, internal control over financial reporting may not prevent or detect misstatements. Also, projections of any evaluation of effectiveness to future periods are subject to the risk that controls may become inadequate because of changes in conditions, or that the degree of compliance with the policies or procedures may deteriorate.
/s/KPMG Assurance and Consulting Services LLP
Mumbai, Maharashtra, India
March 01, 2022February 29, 2024
GENPACT LIMITED AND ITS SUBSIDIARIES
Consolidated Balance Sheets
(In thousands, except per share data and share count)
| | Notes | | As of December 31, 2020 | | As of December 31, 2021 |
| Notes | | | Notes | | As of December 31, 2022 | | As of December 31, 2023 |
| Assets | Assets | | | | | |
| Current assets | Current assets | |
| Current assets | |
| Current assets | |
| Cash and cash equivalents | Cash and cash equivalents | 4 | | $ | 680,440 | | | $ | 899,458 | |
| Accounts receivable, net of allowance for credit losses of $27,707 and $24,329 as of December 31, 2020 and 2021, respectively | 5 | | 881,020 | | | 887,742 | |
| Cash and cash equivalents | |
| Cash and cash equivalents | |
| Accounts receivable, net of allowance for credit losses of $20,442 and $18,278 as of December 31, 2022 and 2023, respectively | |
| Prepaid expenses and other current assets | Prepaid expenses and other current assets | 8 | | 187,408 | | | 134,441 | |
| Total current assets | Total current assets | | $ | 1,748,868 | | | $ | 1,921,641 | |
| | Property, plant and equipment, net | |
| Property, plant and equipment, net | |
| Property, plant and equipment, net | Property, plant and equipment, net | 9 | | 231,122 | | | 215,089 | |
| Operating lease right-of-use assets | Operating lease right-of-use assets | | 304,714 | | | 270,603 | |
| Deferred tax assets | Deferred tax assets | 23 | | 106,674 | | | 106,322 | |
| Intangible assets, net | Intangible assets, net | 10 | | 236,732 | | | 169,635 | |
| Goodwill | Goodwill | 10 | | 1,695,688 | | | 1,731,027 | |
| Contract cost assets | Contract cost assets | 25 | | 225,897 | | | 238,794 | |
| Other assets, net of allowance for credit losses of $3,134 and $3,711 as of December 31, 2020 and 2021, respectively | 11 | | 323,818 | | | 322,158 | |
| Other assets, net of allowance for credit losses of $3,198 and $4,096 as of December 31, 2022 and 2023, respectively | |
| Total assets | Total assets | | $ | 4,873,513 | | | $ | 4,975,269 | |
| | Liabilities and equity | Liabilities and equity | |
| Liabilities and equity | |
| Liabilities and equity | |
| Current liabilities | Current liabilities | |
| Current liabilities | |
| Current liabilities | |
| Short-term borrowings | |
| Short-term borrowings | |
| Short-term borrowings | Short-term borrowings | 15 | | $ | 250,000 | | | $ | — | |
| Current portion of long-term debt | Current portion of long-term debt | 14 | | 33,537 | | | 383,433 | |
| Accounts payable | Accounts payable | | 13,910 | | | 24,984 | |
| Income taxes payable | Income taxes payable | 23 | | 41,941 | | | 47,353 | |
| Accrued expenses and other current liabilities | Accrued expenses and other current liabilities | 13 | | 806,769 | | | 791,440 | |
| Operating leases liability | Operating leases liability | | 56,479 | | | 61,591 | |
| Total current liabilities | Total current liabilities | | $ | 1,202,636 | | | $ | 1,308,801 | |
| | Long-term debt, less current portion | Long-term debt, less current portion | 14 | | 1,307,371 | | | 1,272,476 | |
| Long-term debt, less current portion | |
| Long-term debt, less current portion | |
| Operating leases liability | Operating leases liability | | 289,363 | | | 247,707 | |
| Deferred tax liabilities | Deferred tax liabilities | 23 | | 1,516 | | | 3,942 | |
| Other liabilities | Other liabilities | 16 | | 238,398 | | | 245,210 | |
| Total liabilities | Total liabilities | | $ | 3,039,284 | | | $ | 3,078,136 | |
| | Shareholders' equity | Shareholders' equity | |
| Shareholders' equity | |
| Shareholders' equity | |
| Preferred shares, $0.01 par value, 250,000,000 authorized, none issued | Preferred shares, $0.01 par value, 250,000,000 authorized, none issued | | — | | | — | |
| Common shares, $0.01 par value, 500,000,000 authorized, 189,045,661 and 185,336,357 issued and outstanding as of December 31, 2020 and 2021, respectively | | 1,885 | | | 1,847 | |
| Preferred shares, $0.01 par value, 250,000,000 authorized, none issued | |
| Preferred shares, $0.01 par value, 250,000,000 authorized, none issued | |
| Common shares, $0.01 par value, 500,000,000 authorized, 182,924,416 and 179,494,132 issued and outstanding as of December 31, 2022 and 2023, respectively | |
| Additional paid-in capital | Additional paid-in capital | | 1,636,026 | | | 1,717,165 | |
| Retained earnings | Retained earnings | | 741,658 | | | 732,474 | |
| Accumulated other comprehensive income (loss) | Accumulated other comprehensive income (loss) | | (545,340) | | | (554,353) | |
| Total equity | Total equity | | $ | 1,834,229 | | | $ | 1,897,133 | |
| Commitments and contingencies | Commitments and contingencies | 27 | | 0 | | 0 | Commitments and contingencies | 26 | | |
| Total liabilities and equity | Total liabilities and equity | | $ | 4,873,513 | | | $ | 4,975,269 | |
See accompanying notes to the Consolidated Financial Statements.
GENPACT LIMITED AND ITS SUBSIDIARIES
Consolidated Statements of Income
(In thousands, except per share data and share count)
| | Year ended December 31, |
| Notes | | 2019 | | 2020 | | 2021 |
| | | Year ended December 31, | | | | | Year ended December 31, |
| Notes | | | Notes | | 2021 | | 2022 | | 2023 |
| Net revenues | Net revenues | 24, 25 | | 3,520,543 | | | 3,709,377 | | | 4,022,211 | |
| Cost of revenue | Cost of revenue | | 2,294,688 | | | 2,418,137 | | | 2,590,252 | |
| Gross profit | Gross profit | | $ | 1,225,855 | | | $ | 1,291,240 | | | $ | 1,431,959 | |
| Operating expenses: | Operating expenses: | |
| Selling, general and administrative expenses | |
| Selling, general and administrative expenses | |
| Selling, general and administrative expenses | Selling, general and administrative expenses | | 794,901 | | | 789,849 | | | 865,715 | |
| Amortization of acquired intangible assets | Amortization of acquired intangible assets | 10 | | 32,612 | | | 43,343 | | | 58,448 | |
| Other operating (income) expense, net | Other operating (income) expense, net | 21 | | (31,034) | | | 19,331 | | | (1,203) | |
| Income from operations | Income from operations | | $ | 429,376 | | | $ | 438,717 | | | $ | 508,999 | |
| Foreign exchange gains (losses), net | Foreign exchange gains (losses), net | | 7,729 | | | 7,482 | | | 12,669 | |
| Interest income (expense), net | Interest income (expense), net | 22 | | (43,458) | | | (48,960) | | | (51,434) | |
| Other income (expense), net | Other income (expense), net | 26 | | 5,786 | | | 3,238 | | | 12,895 | |
| Income before equity-method investment activity, net and income tax expense | | $ | 399,433 | | | $ | 400,477 | | | $ | 483,129 | |
| Equity-method investment activity, net | | (16) | | | — | | | — | |
| Income before income tax expense | | $ | 399,417 | | | $ | 400,477 | | | $ | 483,129 | |
| Income tax expense | 23 | | 94,536 | | | 92,201 | | | 113,681 | |
| Income before income tax expense (benefit) | |
| Income tax expense (benefit) | |
| Net income | Net income | | $ | 304,881 | | | $ | 308,276 | | | $ | 369,448 | |
| Earnings per common share | Earnings per common share | 20 | | | | | | |
| Basic | |
| Basic | |
| Basic | Basic | | $ | 1.60 | | | $ | 1.62 | | | $ | 1.97 | |
| Diluted | Diluted | | $ | 1.56 | | | $ | 1.57 | | | $ | 1.91 | |
| Weighted average number of common shares used in computing earnings per common share | Weighted average number of common shares used in computing earnings per common share | 20 | |
| Basic | Basic | | 190,074,475 | | | 190,396,780 | | | 187,802,219 | |
| Basic | |
| Basic | |
| Diluted | Diluted | | 195,160,855 | | | 195,780,971 | | | 192,961,841 | |
See accompanying notes to the Consolidated Financial Statements.
GENPACT LIMITED AND ITS SUBSIDIARIES
Consolidated Statements of Comprehensive Income (Loss)
(In thousands)
| | | | | | | | | | | | | | | | | |
| Year ended December 31, |
| 2019 | | 2020 | | 2021 |
| Net income (loss) | $ | 304,881 | | | $ | 308,276 | | | $ | 369,448 | |
| Other comprehensive income: | | | | | |
| Currency translation adjustments | (20,297) | | | (7,871) | | | (39,725) | |
| Net income (loss) on cash flow hedging derivatives, net of taxes (Note 7) | 2,343 | | | (3,468) | | | 23,124 | |
| Retirement benefits, net of taxes | (6,542) | | | (2,045) | | | 7,588 | |
| Other comprehensive income (loss) | (24,496) | | | (13,384) | | | (9,013) | |
| Comprehensive income (loss) | $ | 280,385 | | | $ | 294,892 | | | $ | 360,435 | |
| | | | | | | | | | | | | | | | | |
| Year ended December 31, |
| 2021 | | 2022 | | 2023 |
| Net income | $ | 369,448 | | | $ | 353,404 | | | $ | 631,255 | |
| Other comprehensive income (loss): | | | | | |
| Currency translation adjustments | (39,725) | | | (161,428) | | | 2,340 | |
| Net income (loss) on cash flow hedging derivatives, net of taxes (Note 6) | 23,124 | | | (19,776) | | | 6,663 | |
| Retirement benefits, net of taxes | 7,588 | | | 2,432 | | | 1,572 | |
| Other comprehensive income (loss) | (9,013) | | | (178,772) | | | 10,575 | |
| Comprehensive income | $ | 360,435 | | | $ | 174,632 | | | $ | 641,830 | |
See accompanying notes to the Consolidated Financial Statements.
GENPACT LIMITED AND ITS SUBSIDIARIES
Consolidated Statements of Equity
For the year ended December 31, 2019
(In thousands, except share count)
| | | | | | | | | | | | | | | | | | | | | | | | | | | | | | | | | | | |
| Common shares | | | | | | | | |
| No. of Shares | | Amount | | Additional
Paid-in Capital | | Retained
Earnings | | Accumulated Other
Comprehensive
Income (Loss) | | Total
Equity |
| Balance as of January 1, 2019 | 189,346,101 | | | $ | 1,888 | | | $ | 1,471,301 | | | $ | 438,453 | | | $ | (507,460) | | | $ | 1,404,182 | |
| Issuance of common shares on exercise of options (Note 18) | 697,531 | | | 7 | | | 10,683 | | | — | | | — | | | 10,690 | |
| Issuance of common shares under the employee stock purchase plan (Note 18) | 264,440 | | | 3 | | | 8,977 | | | — | | | — | | | 8,980 | |
| Net settlement on vesting of restricted share units (Note 18) | 574,112 | | | 6 | | | (4,271) | | | — | | | — | | | (4,265) | |
| Net settlement on vesting of performance units (Note 18) | 2,151 | | | — | | | — | | | — | | | — | | | — | |
| Stock repurchased and retired (Note 19) | (766,154) | | | (8) | | | — | | | (29,992) | | | — | | | (30,000) | |
| Expenses related to stock repurchase (Note 19) | — | | | — | | | — | | | (15) | | | — | | | (15) | |
| Stock-based compensation expense (Note 18) | — | | | — | | | 83,885 | | | — | | | — | | | 83,885 | |
| Comprehensive income (loss): | | | | | | | | | | | |
| Net income (loss) | — | | | — | | | — | | | 304,881 | | | — | | | 304,881 | |
| Other comprehensive income (loss) | — | | | — | | | — | | | — | | | (24,496) | | | (24,496) | |
| Dividend ($0.34 per common share, Note 19) | — | | | — | | | — | | | (64,671) | | | — | | | (64,671) | |
| Balance as of December 31, 2019 | 190,118,181 | | | $ | 1,896 | | | $ | 1,570,575 | | | $ | 648,656 | | | $ | (531,956) | | | $ | 1,689,171 | |
See accompanying notes to the Consolidated Financial Statements.
GENPACT LIMITED AND ITS SUBSIDIARIES
Consolidated Statements of Equity
For the year ended December 31, 2020
(In thousands, except share count)
| | | | | | | | | | | | | | | | | | | | | | | | | | | | | | | | | | | |
| Common shares | | | | | | | | |
| No. of
Shares | | Amount | | Additional
Paid-in Capital | | Retained
Earnings | | Accumulated Other
Comprehensive
Income (Loss) | | Total
Equity |
| Balance as of January 1, 2020 | 190,118,181 | | | $ | 1,896 | | | $ | 1,570,575 | | | $ | 648,656 | | | $ | (531,956) | | | $ | 1,689,171 | |
| Transition period adjustment pursuant to ASC 326,net of tax | — | | | — | | | — | | | (3,984) | | | — | | | (3,984) | |
| Adjusted Balance as of January 1, 2020 | 190,118,181 | | | $ | 1,896 | | | $ | 1,570,575 | | | $ | 644,672 | | | $ | (531,956) | | | $ | 1,685,187 | |
| Issuance of common shares on exercise of options (Note 18) | 692,634 | | | 7 | | | 14,055 | | | — | | | — | | | 14,062 | |
| Issuance of common shares under the employee stock purchase plan (Note 18) | 315,245 | | | 3 | | | 11,070 | | | — | | | — | | | 11,073 | |
| Net settlement on vesting of restricted share units (Note 18) | 429,362 | | | 4 | | | (7,846) | | | — | | | — | | | (7,842) | |
| Net settlement on vesting of performance units (Note 18) | 902,532 | | | 9 | | | (25,836) | | | — | | | — | | | (25,827) | |
| Stock repurchased and retired (Note 19) | (3,412,293) | | | (34) | | | — | | | (137,010) | | | — | | | (137,044) | |
| Expenses related to stock repurchase (Note 19) | — | | | — | | | — | | | (68) | | | — | | | (68) | |
| Stock-based compensation expense (Note 18) | — | | | — | | | 74,008 | | | — | | | — | | | 74,008 | |
| Comprehensive income (loss): | | | | | | | | | | | |
| Net income (loss) | — | | | — | | | — | | | 308,276 | | | — | | | 308,276 | |
| Other comprehensive income (loss) | — | | | — | | | — | | | — | | | (13,384) | | | (13,384) | |
| Dividend ($0.39 per common share, Note 19) | — | | | — | | | — | | | (74,212) | | | — | | | (74,212) | |
| Balance as of December 31, 2020 | 189,045,661 | | | $ | 1,885 | | | $ | 1,636,026 | | | $ | 741,658 | | | $ | (545,340) | | | $ | 1,834,229 | |
See accompanying notes to the Consolidated Financial Statements.
GENPACT LIMITED AND ITS SUBSIDIARIES
Consolidated Statements of Equity
For the year ended December 31, 2021
(In thousands, except share count)
| | Common shares | |
| No. of
Shares | | Amount | | Additional Paid-
in Capital | | Retained
Earnings | | Accumulated Other Comprehensive
Income (Loss) | | Total
Equity |
| Common shares | |
| No. of Shares | |
| No. of Shares | |
| No. of Shares | | | Amount | | Additional
Paid-in Capital | | Retained
Earnings | | Accumulated Other
Comprehensive
Income (Loss) | | Total
Equity |
| Balance as of January 1, 2021 | Balance as of January 1, 2021 | 189,045,661 | | | 1,885 | | | 1,636,026 | | | 741,658 | | | (545,340) | | | 1,834,229 | |
| Issuance of common shares on exercise of options (Note 18) | Issuance of common shares on exercise of options (Note 18) | 1,145,125 | | | 11 | | | 23,157 | | | — | | | — | | | 23,168 | |
| Issuance of common shares under the employee stock purchase plan (Note 18) | Issuance of common shares under the employee stock purchase plan (Note 18) | 285,657 | | | 3 | | | 11,880 | | | — | | | — | | | 11,883 | |
| Net settlement on vesting of restricted share units (Note 18) | Net settlement on vesting of restricted share units (Note 18) | 335,036 | | | 3 | | | (7,559) | | | — | | | — | | | (7,556) | |
| Net settlement on vesting of performance units (Note 18) | Net settlement on vesting of performance units (Note 18) | 1,102,440 | | | 11 | | | (28,301) | | | — | | | — | | | (28,290) | |
| Stock repurchased and retired (Note 19) | Stock repurchased and retired (Note 19) | (6,577,562) | | | (66) | | | — | | | (298,021) | | | — | | | (298,087) | |
| Expense related to stock repurchase (Note 19) | — | | | — | | | — | | | (132) | | | — | | | (132) | |
| Expenses related to stock repurchased (Note 19) | |
| Stock-based compensation expense (Note 18) | Stock-based compensation expense (Note 18) | — | | | — | | | 81,968 | | | — | | | — | | | 81,968 | |
| Others | Others | — | | | — | | | (6) | | | — | | | — | | | (6) | |
| Comprehensive income (loss): | Comprehensive income (loss): | |
| Net income (loss) | Net income (loss) | — | | | — | | | — | | | 369,448 | | | — | | | 369,448 | |
| Net income (loss) | |
| Net income (loss) | |
| Other comprehensive income (loss) | Other comprehensive income (loss) | — | | | — | | | — | | | — | | | (9,013) | | | (9,013) | |
| Dividend ($0.43 per common share, Note 19) | Dividend ($0.43 per common share, Note 19) | — | | | — | | | — | | | (80,479) | | | — | | | (80,479) | |
| Balance as of December 31, 2021 | Balance as of December 31, 2021 | 185,336,357 | | | 1,847 | | | 1,717,165 | | | 732,474 | | | (554,353) | | | 1,897,133 | |
See accompanying notes to the Consolidated Financial Statements.
GENPACT LIMITED AND ITS SUBSIDIARIES
Consolidated Statements of Equity
For the year ended December 31, 2022
(In thousands, except share count)
| | | | | | | | | | | | | | | | | | | | | | | | | | | | | | | | | | | |
| Common shares | | | | | | | | |
| No. of
Shares | | Amount | | Additional
Paid-in Capital | | Retained
Earnings | | Accumulated Other
Comprehensive
Income (Loss) | | Total
Equity |
| Balance as of January 1, 2022 | 185,336,357 | | | $ | 1,847 | | | $ | 1,717,165 | | | $ | 732,474 | | | $ | (554,353) | | | $ | 1,897,133 | |
| Issuance of common shares on exercise of options (Note 18) | 665,036 | | | 7 | | | 14,694 | | | — | | | — | | | 14,701 | |
| Issuance of common shares under the employee stock purchase plan (Note 18) | 324,783 | | | 3 | | | 13,047 | | | — | | | — | | | 13,050 | |
| Net settlement on vesting of restricted share units (Note 18) | 74,934 | | | 1 | | | (422) | | | — | | | — | | | (421) | |
| Net settlement on vesting of performance units (Note 18) | 1,300,511 | | | 13 | | | (44,404) | | | — | | | — | | | (44,391) | |
| Stock repurchased and retired (Note 19) | (4,777,205) | | | (48) | | | — | | | (213,938) | | | — | | | (213,986) | |
| Expenses related to stock repurchased (Note 19) | — | | | — | | | — | | | (96) | | | — | | | (96) | |
| Stock-based compensation expense (Note 18) | — | | | — | | | 77,373 | | | — | | | — | | | 77,373 | |
| Comprehensive income (loss): | | | | | | | | | | | |
| Net income (loss) | — | | | — | | | — | | | 353,404 | | | — | | | 353,404 | |
| Other comprehensive income (loss) | — | | | — | | | — | | | — | | | (178,772) | | | (178,772) | |
| Dividend ($0.50 per common share, Note 19) | — | | | — | | | — | | | (91,837) | | | — | | | (91,837) | |
| Balance as of December 31, 2022 | 182,924,416 | | | $ | 1,823 | | | $ | 1,777,453 | | | $ | 780,007 | | | $ | (733,125) | | | $ | 1,826,158 | |
See accompanying notes to the Consolidated Financial Statements.
GENPACT LIMITED AND ITS SUBSIDIARIES
Consolidated Statements of Equity
For the year ended December 31, 2023
(In thousands, except share count)
| | | | | | | | | | | | | | | | | | | | | | | | | | | | | | | | | | | |
| Common shares | | | | | | | | |
| No. of
Shares | | Amount | | Additional Paid-
in Capital | | Retained
Earnings | | Accumulated Other Comprehensive
Income (Loss) | | Total
Equity |
| Balance as of January 1, 2023 | 182,924,416 | | | 1,823 | | | 1,777,453 | | | 780,007 | | | (733,125) | | | 1,826,158 | |
| Issuance of common shares on exercise of options (Note 18) | 1,376,330 | | | 14 | | | 27,741 | | | — | | | — | | | 27,755 | |
| Issuance of common shares under the employee stock purchase plan (Note 18) | 337,875 | | | 3 | | | 11,727 | | | — | | | — | | | 11,730 | |
| Net settlement on vesting of restricted share units (Note 18) | 457,029 | | | 5 | | | (10,506) | | | — | | | — | | | (10,501) | |
| Net settlement on vesting of performance units (Note 18) | 412,275 | | | 4 | | | (11,047) | | | — | | | — | | | (11,043) | |
| Stock repurchased and retired (Note 19) | (6,013,793) | | | (60) | | | — | | | (225,319) | | | — | | | (225,379) | |
| Expenses related to stock repurchased, including taxes (Note 19) | — | | | — | | | — | | | (720) | | | — | | | (720) | |
| Stock-based compensation expense (Note 18) | — | | | — | | | 88,576 | | | — | | | — | | | 88,576 | |
| Comprehensive income (loss): | | | | | | | | | | | |
| Net income (loss) | — | | | — | | | — | | | 631,255 | | | — | | | 631,255 | |
| Other comprehensive income (loss) | — | | | — | | | — | | | — | | | 10,575 | | | 10,575 | |
| Dividend ($0.55 per common share, Note 19) | — | | | — | | | — | | | (100,014) | | | — | | | (100,014) | |
| Balance as of December 31, 2023 | 179,494,132 | | | 1,789 | | | 1,883,944 | | | 1,085,209 | | | (722,550) | | | 2,248,392 | |
See accompanying notes to the Consolidated Financial Statements.
GENPACT LIMITED AND ITS SUBSIDIARIES
Consolidated Statements of Cash Flows
(In thousands)
| | Year ended December 31, |
| 2019 | | 2020 | | 2021 |
| Year ended December 31, | | | Year ended December 31, |
| 2021 | | | 2021 | | 2022 | | 2023 |
| Operating activities | Operating activities | | | | | |
| Net income | Net income | $ | 304,881 | | | $ | 308,276 | | | $ | 369,448 | |
| Net income | |
| Net income | |
| Adjustments to reconcile net income to net cash provided by operating activities: | Adjustments to reconcile net income to net cash provided by operating activities: | |
| Depreciation and amortization | |
| Depreciation and amortization | |
| Depreciation and amortization | Depreciation and amortization | 96,101 | | | 116,499 | | | 109,124 | |
| Amortization of debt issuance costs (including loss on extinguishment of debt) | Amortization of debt issuance costs (including loss on extinguishment of debt) | 1,779 | | | 2,248 | | | 2,678 | |
| Amortization of acquired intangible assets | Amortization of acquired intangible assets | 32,612 | | | 43,343 | | | 58,448 | |
| Write-down of intangible assets and property, plant and equipment | Write-down of intangible assets and property, plant and equipment | 3,511 | | | 14,083 | | | 915 | |
| Reserve for doubtful receivables/allowance for credit losses | 7,443 | | | 5,707 | | | 1,487 | |
| Unrealized loss (gain) on revaluation of foreign currency asset/liability | (5,171) | | | 9,578 | | | (8,304) | |
| Impairment charge on assets classified as held for sale | |
| Loss on sale of business classified as held for sale (refer to Note 8) | |
| Write-down of operating lease right-of-use assets and other assets | |
| Allowance for credit losses | |
| Unrealized loss/(gain) on revaluation of foreign currency asset/liability | |
| Stock-based compensation expense | Stock-based compensation expense | 83,885 | | | 74,008 | | | 81,968 | |
| Deferred tax benefit | Deferred tax benefit | (16,315) | | | (22,587) | | | (9,263) | |
| Write-down of operating lease right-of-use assets and other assets | — | | | 18,084 | | | — | |
| Gain on exchange of non-monetary asset | (31,380) | | | — | | | — | |
| Others, net | Others, net | (2,213) | | | (1,291) | | | 623 | |
| Change in operating assets and liabilities: | Change in operating assets and liabilities: | |
| (Increase) decrease in accounts receivable | (121,983) | | | 42,505 | | | (11,803) | |
| (Increase) in accounts receivable | |
| (Increase) in accounts receivable | |
| (Increase) in accounts receivable | |
| (Increase) decrease in prepaid expenses, other current assets, contract cost assets, operating lease right-of-use assets and other assets | (Increase) decrease in prepaid expenses, other current assets, contract cost assets, operating lease right-of-use assets and other assets | (69,813) | | | (99,852) | | | 83,432 | |
| Increase (decrease) in accounts payable | Increase (decrease) in accounts payable | (21,375) | | | (12,480) | | | 11,740 | |
| Increase (decrease) in accrued expenses, other current liabilities, operating lease liabilities and other liability | Increase (decrease) in accrued expenses, other current liabilities, operating lease liabilities and other liability | 157,580 | | | 87,180 | | | (2,057) | |
| Increase (decrease) in income taxes payable | Increase (decrease) in income taxes payable | 8,346 | | | (993) | | | 5,845 | |
| Net cash provided by operating activities | Net cash provided by operating activities | $ | 427,888 | | | $ | 584,308 | | | $ | 694,281 | |
| Investing activities | Investing activities | | | | | |
| Purchase of property, plant and equipment | Purchase of property, plant and equipment | (74,927) | | | (70,170) | | | (53,341) | |
| Purchase of property, plant and equipment | |
| Purchase of property, plant and equipment | |
| Payment for internally generated intangible assets (including intangibles under development) | Payment for internally generated intangible assets (including intangibles under development) | (33,834) | | | (10,201) | | | (3,907) | |
| Proceeds from sale of property, plant and equipment and intangibles assets | Proceeds from sale of property, plant and equipment and intangibles assets | 1,750 | | | 607 | | | 6,384 | |
| Proceeds from sale of equity affiliates | 2,168 | | | — | | | — | |
| Payment for business acquisitions, net of cash acquired | Payment for business acquisitions, net of cash acquired | (252,276) | | | (186,633) | | | (72,025) | |
| Proceed from sale of investment | — | | | — | | | $ | 142 | |
| Proceeds from/(payment) for divestiture of business | |
| Proceeds from sale of investment | |
| Net cash used for investing activities | Net cash used for investing activities | $ | (357,119) | | | $ | (266,397) | | | $ | (122,747) | |
| Financing activities | Financing activities | | | | | |
| Repayment of finance lease obligations | |
| Repayment of finance lease obligations | |
| Repayment of finance lease obligations | Repayment of finance lease obligations | (7,380) | | | (10,567) | | | (13,926) | |
| Payment of debt issuance costs | Payment of debt issuance costs | (2,317) | | | (620) | | | (3,029) | |
| Proceeds from long-term debt | Proceeds from long-term debt | 400,000 | | | — | | | 350,000 | |
| Repayment of long-term debt | Repayment of long-term debt | (34,000) | | | (34,000) | | | (34,002) | |
| Proceeds from short-term borrowings | Proceeds from short-term borrowings | 400,000 | | | 610,000 | | | — | |
| Repayment of short-term borrowings | Repayment of short-term borrowings | (625,000) | | | (430,000) | | | (250,000) | |
| Proceeds from issuance of common shares under stock-based compensation plans | Proceeds from issuance of common shares under stock-based compensation plans | 19,670 | | | 25,135 | | | 35,051 | |
| Payment for net settlement of stock-based awards | Payment for net settlement of stock-based awards | (3,850) | | | (34,083) | | | (35,717) | |
| Payment of earn-out consideration | Payment of earn-out consideration | (12,790) | | | (6,552) | | | (2,556) | |
| Dividend paid | Dividend paid | (64,671) | | | (74,212) | | | (80,479) | |
| Payment for stock repurchased and retired (including expenses related to stock repurchase) | Payment for stock repurchased and retired (including expenses related to stock repurchase) | (30,015) | | | (137,112) | | | (298,219) | |
| Others | Others | — | | | — | | | (6) | |
| Net cash provided by/ (used for) financing activities | $ | 39,647 | | | $ | (92,011) | | | $ | (332,883) | |
| Net cash used for financing activities | |
| Effect of exchange rate changes | Effect of exchange rate changes | (11,716) | | | (12,556) | | | (19,633) | |
| Net increase in cash and cash equivalents | 110,416 | | | 225,900 | | | 238,651 | |
| Net increase (decrease) in cash and cash equivalents | |
| Cash and cash equivalents at the beginning of the period | Cash and cash equivalents at the beginning of the period | 368,396 | | | 467,096 | | | 680,440 | |
| Cash and cash equivalents at the end of the period | Cash and cash equivalents at the end of the period | $ | 467,096 | | | $ | 680,440 | | | $ | 899,458 | |
| Supplementary information | Supplementary information | | | | | |
| Cash paid during the period for interest (including interest rate swaps) | Cash paid during the period for interest (including interest rate swaps) | $ | 45,084 | | | $ | 49,101 | | | $ | 46,348 | |
| Cash paid during the period for interest (including interest rate swaps) | |
| Cash paid during the period for interest (including interest rate swaps) | |
| Cash paid during the period for income taxes, net of refunds | Cash paid during the period for income taxes, net of refunds | $ | 104,217 | | | $ | 193,946 | | | $ | 31,761 | |
| Property, plant and equipment acquired under finance lease obligations | Property, plant and equipment acquired under finance lease obligations | $ | 5,008 | | | $ | 29,526 | | | $ | 286 | |
| Non-cash transaction: Gain on exchange of non-monetary asset | $ | (31,380) | | | $ | — | | | $ | — | |
See accompanying notes to the Consolidated Financial Statements.
GENPACT LIMITED AND ITS SUBSIDIARIES
Notes to the Consolidated Financial Statements
(In thousands, except per share data and share count)
1. Organization
The Company is a global professional services firm that drives digitally-led innovation and runs digitally-enabled intelligent operations for its clients, guided by its experience over time running thousands of processes for hundreds of Fortune Global 500 clients.global companies. The Company has over 109,600129,100 employees serving clients in key industry verticals from more than 3035 countries.
2. Summary of significant accounting policies
(a) Basis of preparation and principles of consolidation
The accompanying consolidated financial statements have been prepared in accordance with U.S. generally accepted accounting principles (U.S. GAAP) and the rules and regulations of the Securities and Exchange Commission (the “SEC”) for reporting on Form 10-K. The accompanying consolidated financial statements reflect all adjustments that management considers necessary for a fair presentation of the results of operations for these periods.
The accompanying financial statements have been prepared on a consolidated basis and reflect the financial statements of Genpact Limited, a Bermuda company, and all of its subsidiaries that are more than 50% owned and controlled. When the Company does not have a controlling interest in an entity but exerts significant influence over the entity, the Company applies the equity method of accounting. All intercompany transactions and balances are eliminated on consolidation.
(b) Use of estimates
The preparation of consolidated financial statements in accordance with U.S. GAAP requires management to make estimates and assumptions that affect the amounts reported in the consolidated financial statements. Significant items subject to such estimates and assumptions include the useful lives of property, plant and equipment, intangible assets and goodwill, revenue recognition, allowance for credit losses, valuation allowances for deferred tax assets, the valuation of derivative financial instruments, the measurement of lease liabilities and right-of-use ("ROU") assets, measurements of stock-based compensation, assets and obligations related to employee benefits, the nature and timing of the satisfaction of performance obligations, the standalone selling price of performance obligations, variable consideration, other obligations for revenue recognition, incomeunrecognized tax uncertaintiesbenefits and other contingencies. Management believes that the estimates used in the preparation of the consolidated financial statements are reasonable, and management has made assumptions about the possible effects of the ongoing COVID-19 pandemic on critical and significant accounting estimates.reasonable. Although these estimates and assumptions are based upon management’s best knowledge of current events and actions, actual results could differ from these estimates. Any changes in estimates are adjusted prospectively in the Company’s consolidated financial statements.
(c) Business combinations, goodwill and other intangible assets
The Company accounts for its business combinations using the acquisition method of accounting in accordance with Accounting Standard Codification ("ASC") Topic 805, Business Combinations, by recognizing the identifiable tangible and intangible assets acquired and liabilities assumed, and any non-controlling interest in the acquired business, measured at their acquisition date fair values. Contingent consideration is included within the acquisition cost and is recognized at its fair value on the acquisition date. A liability resulting from contingent consideration is re-measured to fair value as of each reporting date until the contingency is resolved. Changes in fair value are recognized in earnings. All assets and liabilities of the acquired businesses, including goodwill, are assigned to reporting units. Acquisition-related costs are expensed as incurred under selling, general and administrative expenses.
GENPACT LIMITED AND ITS SUBSIDIARIES
Notes to the Consolidated Financial Statements
(In thousands, except per share data and share count)
2. Summary of significant accounting policies (Continued)
Goodwill represents the cost of acquired businesses in excess of the fair value of identifiable tangible and intangible net assets purchased. Goodwill is not amortized but is tested for impairment at least on an annual basis on December 31, based on a number of factors, including operating results, business plans and future cash flows. The Company performs an assessment of qualitative factors to determine whether the existence of events or circumstances leads to a determination that it is more likely than not that the fair value of a reporting unit is less than its carrying amount. Based on the assessment of events or circumstances, the Company performs a quantitative assessment of goodwill impairment if it determines that it is more likely than not that the fair value of a reporting unit is less than its carrying amount. If, based on the quantitative impairment analysis, the carrying value of the goodwill of a reporting unit exceeds the fair value of such goodwill, an impairment loss is recognized in an amount equal to the excess. In addition, the Company performs a qualitative assessment of goodwill impairment between annual tests if an event occurs or circumstances change that would more likely than not reduce the fair value of a reporting unit below its carrying amount. See Note 10 for information and related disclosures.
GENPACT LIMITED AND ITS SUBSIDIARIES
Notes to the Consolidated Financial Statements
(In thousands, except per share data and share count)
2. Summary of significant accounting policies (Continued)
Intangible assets acquired individually or with a group of other assets or in a business combination and developed internally are carried at cost less accumulated amortization and accumulated impairment loss based on their estimated useful lives as follows:
| | | | | | | | | | | |
| Customer-related intangible assets | 1 | - | 9 years |
| Marketing-related intangible assets | 1 | - | 8 years |
| Technology-related intangible assets | 2 | - | 10 years |
Intangible assets are amortized over their estimated useful lives using a method of amortization that reflects the pattern in which the economic benefits of the intangible assets are consumed or otherwise realized.
In business combinations where the fair value of identifiable tangible and intangible net assets purchased exceeds the cost of the acquired business, the Company recognizes the resulting gain under “Other operating (income) expense, net” in the consolidated statements of income.
The Company also capitalizes certain software and technology-related development costs incurred in connection with developing or obtaining software or technology for sale/leasesale to customers when the initial design phase is completed and commercial and technological feasibility has been established. Any development cost incurred before technological feasibility is established is expensed as incurred as research and development costs. Technological feasibility is established upon completion of a detailed design program or, in its absence, completion of a working model. Capitalized software and technology costs include only (i) external direct costs of materials and services utilized in developing or obtaining software and technology and (ii) compensation and related benefits for employees who are directly associated with the project.
Costs incurred in connection with developing or obtaining software or technology for sale/leasesale to customers which are under development and not put to use are disclosed under “intangible assets under development.” Advances paid towards the acquisition of intangible assets outstanding as of each balance sheet date are disclosed under “intangible assets under development.”
Capitalized software and technology costs are included in intangible assets under technology-related intangible assets on the Company’s consolidated balance sheetsheets and are amortized on a straight-line basis when placed into service over the estimated useful lives of the software and technology.
The Company evaluates the remaining useful life of intangible assets that are being amortized at each reporting period wherever events and circumstances warrant a revision to the remaining period of amortization, and the remaining carrying amount of the intangible asset is amortized prospectively over that revised remaining useful life.
(d) Financial instruments and concentration of credit risk
Financial instruments that potentially subject the Company to concentration of credit risk are reflected principally in cash and cash equivalents, derivative financial instruments and accounts receivable. The Company places its cash and cash equivalents and derivative financial instruments with corporations and banks with high investment grade ratings, limits the amount of credit exposure with any one corporation or bank and conducts ongoing evaluations of the creditworthiness of the corporations and banks with which it does business. To reduce its credit risk on accounts receivable, the Company conducts ongoing credit evaluations of its customers.
GENPACT LIMITED AND ITS SUBSIDIARIES
Notes to the Consolidated Financial Statements
(In thousands, except per share data and share count)
2. Summary of significant accounting policies (Continued)
The General Electric Company (“GE”) accounted for 16% and 8% of the Company’s receivables as of December 31, 2020 and 2021, respectively. GE accounted for 14%, 12% and 9% of the Company’s revenues in the years ended December 31, 2019, 2020 and 2021, respectively.
(e) Accounts receivable
Accounts receivable are recorded at the invoiced or to be invoiced amount and do not bear interest. Amounts collected on trade accounts receivable are included in net cash provided by operating activities in the consolidated statements of cash flows. The Company maintains an allowance for current expected credit losses inherent in its accounts receivable portfolio. In establishing the required allowance, management considers historical losses which are adjusted to current market conditions and a reasonable and supportable forecast. Account balances are charged off against the allowance after all means of collection have been exhausted and the potential for recovery is considered remote. The Company does not have any off-balance-sheet credit exposure related to its customers.
GENPACT LIMITED AND ITS SUBSIDIARIES
Notes to the Consolidated Financial Statements
(In thousands, except per share data and share count)
2. Summary of significant accounting policies (Continued)
The Company uses revolving accounts receivable-based facilities in the normal course of business as part of managing its cash flows. The Company accounts for receivables sold under these facilities as a sale of financial assets pursuant to ASC 860 “Transfers and Servicing” and de-recognizes these receivables, as well as the related allowances, from its balance sheets. Generally, the fair value of accounts receivable sold approximates their book value due to their short-term nature, and any gains or losses on the sale of these receivables are recorded at the time of transfer and included under "interest income (expense), net" in the Company’s consolidated statements of income.
(f) Revenue Recognition
The Company derives its revenue primarily from business process management services, including analytics, consulting and related digital solutions and information technology services, which are provided primarily on a time-and-material, transaction or fixed-price basis. The Company recognizes revenue upon the transfer of control of promised services to its customers in an amount that reflects the consideration the Company expects to receive in exchange for those services. Revenues from services rendered under time-and-materials and transaction-based contracts are recognized as the services are provided. The Company’s fixed-price contracts include contracts for customization of applications, maintenance and support services. Revenues from these contracts are recognized ratably over the term of the agreement. The Company accrues for revenue and unbilled receivables for services rendered between the last billing date and the balance sheet date.
The Company’s contracts with its customers also include incentive payments received for discrete benefits delivered or promised to be delivered to the customer or service level agreements that could result in credits or refunds to the customer. Revenues relating to such arrangements are accounted for as variable consideration when the amount of revenue to be recognized can be estimated to the extent that it is probable that a significant reversal of any incremental revenue will not occur.
The Company records deferred revenue attributable to certain process transition activities where such activities do not represent separate performance obligations. Revenues relating to such transition activities are classified under contract liabilities and subsequently recognized ratably over the period in which the related services are performed. Costs relating to such transition activities are fulfillment costs which are directly related to the contract and result in the generation or enhancement of resources. Such costs are expected to be recoverable under the contract and are therefore classified as contract cost assets and recognized ratably over the estimated expected period of benefit under cost of revenue.
Revenues are reported net of value-added tax, business tax and applicable discounts and allowances. Reimbursements of out-of-pocket expenses received from customers have been included as part of revenues.
Revenue for performance obligations that are satisfied over time is recognized in accordance with the methods prescribed for measuring progress. The input (cost expended) method has been used to measure progress towards completion as there is a direct relationship between input and the satisfaction of a performance obligation. Provisions for estimated losses, if any, on uncompleted contracts are recorded in the period in which such losses become probable based on the current contract estimates.
The Company enters into multiple-element revenue arrangements in which a customer may purchase a combination of products or services. The Company determines whether each product or service promised to a customer is capable of being distinct, and is distinct in the context of the contract. If not, the promised products or services are combined and accounted for as a single performance obligation. In the event of a multiple-element revenue arrangement, the Company allocates the arrangement consideration to separately identifiable performance obligations based on their relative stand-alone selling prices.
GENPACT LIMITED AND ITS SUBSIDIARIES
Notes to the Consolidated Financial Statements
(In thousands, except per share data and share count)
2. Summary of significant accounting policies (Continued)
Certain contracts may include offerings such as sale of licenses, which may be perpetual or subscription-based. Revenue from distinct perpetual licenses is recognized upfront at the point in time when the software is made available to the customer. Revenue from distinct, non-cancellable, subscription-based licenses is recognized at the point in time when the license is transferred to the customer. Revenue from any associated maintenance or ongoing support services is recognized ratably over the term of the contract. For a combined software license/services performance obligation, revenue is recognized over the period that the services are performed.
All incremental and direct costs incurred for acquiring contracts, such as certain sales commissions, are classified as contract cost assets. Such costs are amortized over the expected period of benefit and recorded under selling, general and administrative expenses.
Other upfront fees paid to customers are classified as contract assets. Such fees are amortized over the expected period of benefit and recorded as an adjustment to the transaction price and deducted from revenue.
Timing of revenue recognition may differ from the timing of invoicing. If a payment is received in respect of services prior to the delivery of services, the payment is recognized as an advance from the customer and classified as a contract liability. Contract assets and contract liabilities relating to the same customer contract are offset against each other and presented on a net basis in the consolidated financial statements.
Significant judgements
The Company often enters into contracts with its customers that include promises to transfer multiple products and services to the customer. Determining whether products and services are considered distinct performance obligations that should be accounted for separately rather than together may require significant judgement.
Judgement is also required to determine the standalone selling price for each distinct performance obligation. In instances where the standalone selling price is not directly observable, it is determined using information that may include market conditions and other observable inputs.
Customer contracts sometimes include incentive payments received for discrete benefits delivered to the customer or service level agreements that could result in credits or refunds to the customer. Such amounts are estimated at contract inception and are adjusted at the end of each reporting period as additional information becomes available only to the extent that it is probable that a significant reversal of any incremental revenue will not occur.
(g) Leases
At the inception of a contract, the Company assesses whether the contract is, or contains, a lease. The Company’s assessment is based on whether: (1) the contract involves the use of a distinct identified asset, (2) the Company obtains the right to substantially all the economic benefitbenefits from the use of the asset throughout the term of the contract, and (3) the Company has the right to direct the use of the asset. At the inception of a lease, the consideration in the contract is allocated to each lease component based on its relative standalone price to determine the lease payments.
Leases are classified as either finance leases or operating leases. A lease is classified as a finance lease if any one of the following criteria are met: (1) the lease transfers ownership of the asset by the end of the lease term, (2) the lease contains an option to purchase the asset that is reasonably certain to be exercised, (3) the lease term is for a major part of the remaining useful life of the asset or (4) the present value of the lease payments equals or exceeds substantially all of the fair value of the asset. A lease is classified as an operating lease if it does not meet any one of the above criteria.
For all leases at the lease commencement date, a right-of-use (ROU) asset and a lease liability are recognized. The lease liability represents the present value of the lease payments under the lease. Lease liabilities are initially measured at the present value of the lease payments not yet paid, discounted using the discount rate for the lease at the lease commencement. The lease liabilities are subsequently measured on an amortized cost basis. The lease liability is adjusted to reflect interest on the liability and the lease payments made during the period. Interest on the lease liability is determined as the amount that results in a constant periodic discount rate on the remaining balance of the liability.
GENPACT LIMITED AND ITS SUBSIDIARIES
Notes to the Consolidated Financial Statements
(In thousands, except per share data and share count)
2. Summary of significant accounting policies (Continued)
The ROU asset represents the right to use the leased asset for the lease term. The ROU asset for each lease initially includes the amount of the initial measurement of the lease liability adjusted for any lease payments made to the lessor at or before the commencement date, accrued lease liabilities and any lease incentives received or any initial direct costs incurred by the Company.
The ROU asset of finance leases is subsequently measured at cost, less accumulated amortization. The ROU asset of operating leases is subsequently measured from the carrying amount of the lease liability at the end of each reporting period, and is equal to the carrying amount of lease liabilities adjusted for (1) unamortized initial direct costs, (2) prepaid/(accrued) lease payments and (3) the unamortized balance of lease incentives received.
The carrying value of ROU assets is reviewed for impairment, similar to long-lived assets, whenever events or changes in circumstances indicate that the carrying amounts may not be recoverable.
The Company has elected to not separate lease and non-lease components for all of its leases and to use the recognition exemptions for lease contracts that, at commencement date, have a lease term of 12 months or less and do not contain a purchase option (“short-term leases”).
GENPACT LIMITED AND ITS SUBSIDIARIES
Notes to the Consolidated Financial Statements
(In thousands, except per share data and share count)
2. Summary of significant accounting policies (Continued)
Significant judgements
The Company determines the lease term as the non-cancellable term of the lease, together with any periods covered by an option to extend the lease if it is reasonably certain to be exercised, or any periods covered by an option to terminate the lease, if it is reasonably certain not to be exercised. Under certain of its leases, the Company has a renewal and termination option to lease assets for additional terms between one and ten years. The Company applies judgement in evaluating whether it is reasonably certain to exercise the option to renew or terminate the lease. The Company considers all relevant factors that create an economic incentive for it to exercise the renewal or termination option. After the commencement date, the Company reassesses the lease term if there is a significant event or change in circumstances that is within the Company’s control and affects its ability to exercise (or not to exercise) the option to renew or terminate.terminate the lease.
The Company has applied an incremental borrowing rate for the purpose of computing lease liabilities based on the remaining lease term and the rates prevailing in the jurisdictions where leases were executed.
For the year ended December 31, 2020, due to the impact of the COVID-19 pandemic on the Company’s current and future revenues and operations, the Company recorded restructuring charges related to the abandonment of leased office premises and related assets. See Note 28 for additional information.
(h) Cost of revenue
Cost of revenue primarily consists of salaries and benefits (including stock-based compensation), recruitment, training and related costs of employees who are directly responsible for the performance of services for customers, their supervisors and certain support personnel who may be dedicated to a particular customer or a set of processes. It also includes operational expenses, which consist of facilities maintenance expenses, travel and living expenses, rent, IT expenses, and consulting and certain other expenses. Consulting charges represent the cost of consultants and contract resources with specialized skills who are directly responsible for the performance of services for clients and travel and other billable costs related to the Company’s clients. It also includes depreciation of property, plant and equipment, and amortization of intangible and ROU assets which are directly related to providing services that generate revenue.
(i) Selling, general and administrative expenses
Selling, general and administrative (SG&A)("SG&A") expenses consist of expenses relating to salaries and benefits (including stock-based compensation) as well as costs related to recruitment, training and retention of senior management and other support personnel in enabling functions such as human resources, finance, legal, marketing, sales and sales support, and other support personnel. The operational costs component of SG&A expenses also includes travel and living costs for such personnel. SG&A expenses also include acquisition-related costs, legal and professional fees (which represent the costs of third party legal, tax, accounting and other advisors), investment in research and development, digital technology, advanced automation and robotics, and an allowance for credit losses. It also includes depreciation of property, plant and equipment, and amortization of intangibles and ROU assets other than those included in cost of revenue.
GENPACT LIMITED AND ITS SUBSIDIARIES
Notes to the Consolidated Financial Statements
(In thousands, except per share data and share count)
2. Summary of significant accounting policies (Continued)
(j) Credit losses
An allowance for credit losses is recognized for all debt instruments other than those held at fair value through profit or loss. The Company pools its accounts receivable (other than deferred billings) based on similar risk characteristics in estimating expected credit losses. Credit losses for accounts receivable are based on the roll-rate method, and the Company recognizes a loss allowance based on lifetime expected credit losses at each reporting date. The Company has established a provision matrix based on historical credit loss experience, adjusted for forward-looking factors and the economic environment. The Company believes the most relevant forward-looking factors are economic environment, gross domestic product, inflation rates and unemployment rates for each of the countries in which the Company or its customers operate, and accordingly the Company adjusts historical loss rates based on expected changes in these factors. At every reporting date, observed historical default rates are updated to reflect changes in the Company’s forward-looking estimates.
Credit losses for other financial assets and deferred billings are based on the discounted cash flow (“DCF”) method. Under the DCF method, the allowance for credit losses reflects the difference between the contractual cash flows due in accordance with the contract and the present value of the cash flows expected to be collected. The expected cash flows are discounted at the effective interest rate of the financial asset. Such allowances are based on the credit losses expected to arise over the life of the asset which includes consideration of prepayments based on the Company’s expectation as of the balance sheet date.
GENPACT LIMITED AND ITS SUBSIDIARIES
Notes to the Consolidated Financial Statements
(In thousands, except per share data and share count)
2. Summary of significant accounting policies (Continued)
A financial asset is written off when it is deemed uncollectible and there is no reasonable expectation of recovering the contractual cash flows. Expected recoveries of amounts previously written off, not to exceed the aggregate amounts previously written off, are included in determining the allowance at each reporting period.
Credit losses are presented as a credit loss expense within “Selling, general and administrative expenses.” Subsequent recoveries of amounts previously written off are credited against the same line item.
(k) Reclassification
Certain reclassifications have been made in the consolidated financial statements of prior periods to conform to the classification used in the current period. The impact of such reclassifications on the consolidated financial statements is not material.
(l) Cash and cash equivalents
Cash and cash equivalents consist of cash and bank balances and all highly liquid investments purchased with an original maturity of three months or less.
(m)(l) Short-term investments
All liquid investments with an original maturity greater than three months but less than one year are considered to be short-term investments. Marketable short-term investments are classified and accounted for as available-for-sale investments. Available-for-sale investments are reported at fair value with changes in unrealized gains and losses recorded as a separate component of other comprehensive income (loss) until realized. Realized gains and losses on investments are determined based on the specific identification method and are included in “Other income (expense), net.” The Company does not hold these investments for speculative purposes.
(n)(m) Property, plant and equipment, net
Property, plant and equipment are stated at cost less accumulated depreciation and amortization and accumulated impairment loss. Expenditures for replacements and improvements are capitalized, whereas the costs of maintenance and repairs are charged to earnings as incurred.
GENPACT LIMITED AND ITS SUBSIDIARIES
Notes to the Consolidated Financial Statements
(In thousands, except per share data and share count)
2. Summary of significant accounting policies (Continued)
The Company depreciates and amortizes all property, plant and equipment using the straight-line method over the following estimated economic useful lives of the assets:
| | Years |
| Years | | | Years |
| Buildings | Buildings | 40 | Buildings | 40 |
| Furniture and fixtures | Furniture and fixtures | 4 | Furniture and fixtures | 4 |
| Computer equipment and servers | Computer equipment and servers | 4 | Computer equipment and servers | 4 |
| Plant, machinery and equipment | Plant, machinery and equipment | 4 | Plant, machinery and equipment | 4 |
| Computer software | Computer software | 4 | - | 7 | Computer software | 4 | - | 7 |
| Leasehold improvements | Leasehold improvements | Lease period or 10 years, whichever is less | Leasehold improvements | Lease period or 10 years, whichever is less |
| Vehicles | Vehicles | 3 | - | 4 | Vehicles | 3 | - | 4 |
The Company capitalizes certain computer software and software development costs incurred in connection with developing or obtaining computer software for internal use when both the preliminary project stage is completed and it is probable that the software will be used as intended. Capitalized software costs include only (i) external direct costs of materials and services utilized in developing or obtaining computer software, (ii) compensation and related benefits for employees who are directly associated with the software project, and (iii) interest costs incurred while developing internal-use computer software.
Capitalized computer software costs are included in property, plant and equipment on the Company’s consolidated balance sheetsheets and amortized on a straight-line basis when placed into service over the estimated useful lives of the software.
Advances paid towards acquisition of property, plant and equipment outstanding as of each balance sheet date and the cost of property, plant and equipment not put to use before such date are disclosed under “Capital work in progress.”
(o)
GENPACT LIMITED AND ITS SUBSIDIARIES
Notes to the Consolidated Financial Statements
(In thousands, except per share data and share count)
2. Summary of significant accounting policies (Continued)
(n) Impairment of long-lived assets
Long-lived assets, including certain intangible assets, to be held and used are reviewed for impairment whenever events or changes in circumstances indicate that the carrying amount of such assets may not be recoverable. Such assets are required to be tested for impairment if the carrying amount of the assets is higher than the future undiscounted net cash flows expected to be generated from the assets. The impairment amount to be recognized is measured as the amount by which the carrying value of the assets exceeds their fair value. The Company determines fair value by using a discounted cash flow approach.
(p)(o) Foreign currency
The Company’s consolidated financial statements are reported in U.S. dollars, the Company’s functional currency. The functional currency for the Company’s subsidiaries organized in Europe, other than the United Kingdom, the Czech Republic, Luxembourg and one subsidiary in Poland, is the euro, and the functional currencies of the Company’s subsidiaries organized in Brazil, China, Colombia, Guatemala, Argentina, India, Israel, Japan, Morocco, South Africa, the Philippines, Poland, the Czech Republic, Hong Kong, Singapore, Australia and Canada are their respective local currencies. The functional currency of all other Company subsidiaries is the U.S. dollar. The translation of the functional currencies of the Company’s subsidiaries into U.S. dollars is performed for balance sheet accounts using the exchange rates in effect as of the balance sheet date and for revenues and expense accounts using a monthly average exchange rate prevailing during the respective period. The gains or losses resulting from such translation are reported as currency translation adjustments under other comprehensive income (loss), net, under accumulated other comprehensive income (loss) as a separate component of equity.
Monetary assets and liabilities of each subsidiary denominated in currencies other than the subsidiary’s functional currency are translated into their respective functional currency at the rates of exchange prevailing on the balance sheet date.
GENPACT LIMITED AND ITS SUBSIDIARIES
Notes to the Consolidated Financial Statements
(In thousands, except per share data and share count)
2. Summary of significant accounting policies (Continued)
Transactions of each subsidiary in currencies other than the subsidiary’s functional currency are translated into the respective functional currencies at the average monthly exchange rate prevailing during the period of the transaction. The gains or losses resulting from foreign currency transactions are included in the consolidated statements of income.
(q)(p) Derivative instruments and hedging activities
In the normal course of business, the Company uses derivative financial instruments to manage fluctuations in foreign currency exchange rates and interest rate fluctuation. The Company enters into forward foreign exchange contracts to mitigate the risk of changes in foreign exchange rates on intercompany transactions and forecasted transactions denominated in foreign currencies and interest rate swaps to mitigate interest rate fluctuation risk on its indebtedness.
The Company recognizes derivative instruments and hedging activities as either assets or liabilities in its consolidated balance sheets and measures them at fair value. Gains and losses resulting from changes in fair value are accounted for depending on the use of the derivative and whether it is designated and qualifies for hedge accounting. Changes in the fair values of derivatives designated as cash flow hedges are deferred and recorded as a component of other comprehensive income (loss) reported under accumulated other comprehensive income (loss) until the hedged transactions occur and are then recognized in the consolidated statements of income along with the underlying hedged item and disclosed as part of “Total net revenues,” “Cost of revenue,” “Selling, general and administrative expenses,” and “Interest expense,” as applicable. Changes in the fair value of derivatives not designated as hedging instruments and the ineffective portion of derivatives designated as cash flow hedges are recognized in the consolidated statements of income and are included in foreign exchange gains (losses), net, and other income (expense), net, respectively.
With respect to derivatives designated as cash flow hedges, the Company formally documents all relationships between hedging instruments and hedged items, as well as its risk management objectives and strategy for undertaking various hedge transactions. The Company also formally assesses, both at the inception of the hedge and on a quarterly basis, whether each derivative is highly effective in offsetting changes in fair values or cash flows of the hedged item. If it is determined that a derivative or portion thereof is not highly effective as a hedge, or if a derivative ceases to be a highly effective hedge, the Company will prospectively discontinue hedge accounting with respect to that derivative instrument.
GENPACT LIMITED AND ITS SUBSIDIARIES
Notes to the Consolidated Financial Statements
(In thousands, except per share data and share count)
2. Summary of significant accounting policies (Continued)
In all situations in which hedge accounting is discontinued and the derivative is retained, the Company continues to carry the derivative at its fair value on the balance sheet and recognizes any subsequent change in its fair value in the consolidated statements of income. When it is probable that a forecasted transaction will not occur, the Company discontinues hedge accounting and recognizes immediately, in foreign exchange gains (losses), net in the consolidated statements of income, the gains and losses attributable to such derivative that were accumulated in other comprehensive income (loss).
(r)(q) Income taxes
The Company calculates and provides for income taxes in each of the tax jurisdictions in which it operates. The Company accounts for income taxes using the asset and liability method of accounting for income taxes. Under this method, income tax expense is recognized for the amount of income taxes payable or refundable for the current year. In addition, deferred tax assets and liabilities are recognized for future tax consequences attributable to differences between the financial statement carrying amounts of existing assets and liabilities and their tax bases and for all operating loss and tax credit carry forwards, if any. Deferred tax assets and liabilities are measured using the enacted tax rates of the respective jurisdictions which are expected to apply to taxable income in the years in which thosethe related temporary differences are expected to be recovered or settled.reverse. The effect on deferred tax assets and liabilities of a change in tax laws or rates is recognized in the consolidated statementstatements of income in the period that includes the enactment date. Deferred tax assets are reduced by a valuation allowance if,to the amount, based on the weight of available evidence, itthat is more likely than not that some portion or all of the deferred tax assets will notto be realized.
The Company applies a two-step approach for recognizing and measuring the benefit of tax positions. The first step is to evaluate the tax position for recognition by determining, based on the technical merits, that the position will more likely than not be sustained upon examination. The second step is to measure the tax benefit as the largest amount of the tax benefit that ishas a greater than 50 percent likelylikelihood of being realized upon settlement. The Company includes interest and penalties related to an underpayment of income taxes within income tax expense.
The Company follows the specific identification approach for releasing stranded tax effects from accumulated other comprehensive income (“AOCI”) upon recognition of these AOCI items in the consolidated statementstatements of income.
GENPACT LIMITED AND ITS SUBSIDIARIES
Notes to the Consolidated Financial Statements
(In thousands, except per share data and share count)
2. Summary of significant accounting policies (Continued)
(s)(r) Employee benefit plans
Contributions to defined contribution plans are charged to consolidated statements of income in the period in which services are rendered by the covered employees. Current service costs for defined benefit plans are accrued in the period to which they relate. The liability in respect of defined benefit plans is calculated annually by the Company using the projected unit credit method. Prior service cost, if any, resulting from an amendment to a plan is recognized and amortized over the remaining period of service of the covered employees. The Company recognizes its liabilities for compensated absences dependent on whether the obligation is attributable to employee services already rendered, relates to rights that vest or accumulate and payment is probable and estimable.
The service cost is recognized under “cost of revenue” and “selling, general and administrative expenses,” depending on the functional area of the underlying employees included in the plans, and the non-operating components of net benefit plan costs are included within “other income (expense), net” in the consolidated statements of income.
The Company records annual amounts relating to its defined benefit plans based on calculations that incorporate various actuarial and other assumptions, including discount rates, mortality, assumed rates of return on plan assets, future compensation increases and attrition rates. The Company reviews its assumptions on an annual basis and makes modifications to the assumptions based on current rates and trends when it is appropriate to do so. The effect of modifications to those assumptions is recorded in other comprehensive income (loss) and amortized to net periodic cost over future periods using the corridor method. The Company believes that the assumptions utilized in recording its obligations under its plans are reasonable based on its experience and market conditions.
(t)
GENPACT LIMITED AND ITS SUBSIDIARIES
Notes to the Consolidated Financial Statements
(In thousands, except per share data and share count)
2. Summary of significant accounting policies (Continued)
(s) Deferred Compensation Plans
The Company maintains a non-qualified deferred compensation plan for certain employees. The plan is accounted for using the fair value measurement approach. Plan earnings are calculated by reference to actual earnings of the funds chosen by individual participants. In connection with the administration of this plan, the Company has purchased Company-owned life insurance policies insuring the lives of certain employees, held under a Rabbi Trust. The Company consolidates the invested assets of the trust. The cash surrender value of these insurance policies is included in “other assets” in the consolidated balance sheets at fair value. Gains or losses on the plan’s assets and changes in the fair value of deferred compensation liabilities are included in “other income (expense), net,” and “selling, general and administrative expenses,” respectively, in the consolidated statements of income.
(u)(t) Stock-based compensation
The Company recognizes and measures compensation expense for all stock-based awards based on the grant date fair value. For option awards, grant date fair value is determined under the option-pricing model (Black-Scholes-Merton model) and for stock based. For stock-based awards other than option awards and the performance units ("PUs") granted in 2023, grant date fair value is determined on the basis of the fair market value of a Company common share on the date of grant of such awards.
In 2023, the Company granted performance units ("PUs") to certain employees. Vesting of these PUs is contingent upon Genpact's financial performance over the three-year performance period. For PUs granted in 2023, the performance period increased to three years from one year for PUs granted prior to 2023. The number of PUs granted in 2023 that will ultimately vest will be determined, subject to certain conditions and limitations, based on the Company’s total shareholder return (“TSR”) relative to the TSR of the companies included as of January 1, 2023 in the S&P 400 Midcap Index (the “Peer Group”) over the three-year performance period. Accordingly, the grant date fair value for PUs granted in 2023 is determined using a Monte Carlo simulation model.
The fair value determined at the grant date is expensed over the vesting period of the stock-based awards. The Company recognizes compensation expense for stock-based awards net of estimated forfeitures. Stock-based compensation recognized in the consolidated statements of income is based on awards ultimately expected to vest. As a result, the expense has been reduced for estimated forfeitures.
Forfeitures are estimated at the time of grant and revised, if necessary, in subsequent periods if actual forfeitures differ from such estimates.
(v) Government incentives
The Company recognizes incentives in the consolidated statements of income under “other income (expense), net.” Incentives are recognized in the consolidated statements of income when there is probable assurance that the Company will comply with the conditions for their receipt and a reasonable expectation that the funds will be received. In certain circumstances, the receipt of an incentive may not be subject to any condition or requirement to incur further costs, in which case the incentive is recognized in the consolidated statement of income for the period in which it becomes receivable. In the event that it becomes likely that the Company will be required to repay an incentive that has already been recognized, the Company makes a provision for the estimated liability.
GENPACT LIMITED AND ITS SUBSIDIARIES
Notes to the Consolidated Financial Statements
(In thousands, except per share data and share count)
2. Summary of significant accounting policies (Continued)
(w)(u) Earnings (loss) per share
Basic earnings per share is computed using the weighted average number of common shares outstanding during the period. Diluted earnings per share is computed using the weighted average number of common and dilutive common equivalent shares outstanding during the period. For the purposes of calculating diluted earnings per share, the treasury stock method is used for stock-based awards except where the results would be anti-dilutive.
(x)(v) Commitments and contingencies
Liabilities for loss contingencies arising from claims, assessments, litigation, fines and penalties, and other sources are recorded when it is probable that a liability has been incurred and the amount of the assessment and/or remediation can be reasonably estimated. Legal costs incurred in connection with such liabilities are expensed as incurred.
(y)
GENPACT LIMITED AND ITS SUBSIDIARIES
Notes to the Consolidated Financial Statements
(In thousands, except per share data and share count)
2. Summary of significant accounting policies (Continued)
(w) Debt restructuring
The Company accounts for any restructuring of its credit facility using the ten percent cash flow test in accordance with ASC 470, Debt. If the cash flow effect of the change in terms on a present-value basis is less than ten percent, the debt instruments are not considered to be substantially different, and are accounted for as a modification. If the change is more than ten percent, it is treated as an extinguishment. In performing the cash flow test, the Company includes all amounts paid to its lenders in connection with the restructuring but excludes third party expenses. In the case of a modification, all new fees paid to lenders are capitalized and amortized as part of the existing effective yield and any new fees paid to third parties are expensed as incurred under selling, general and administrative expenses.incurred. No gain or loss is recorded in the case of a modification. In the case of an extinguishment, all new fees paid to lenders are expensed as incurred under selling, general and administrative expenses and any new fees paid to third parties are capitalized and amortized as a debt issuance cost. The old debt is derecognized and the new debt is recorded at fair value and a gain or loss is recorded for the difference between the net carrying value of the original debt and the fair value of the new debt.
(z)(x) Assets held for sale
A long-lived asset (or a disposal group for a long-lived asset comprising a group of assets and related liabilities) is classified as held for sale if it is highly probable that the asset will be recovered through sale rather than continuing use.
The Company records assets held for sale at the lower of their carrying value or fair value less costs to sell. The following criteria are used to determine if a business is held for sale: (i) management, having the authority to approve a sale, commits to a plan to sell; (ii) the business is available for immediate sale in its present condition; (iii) an active program to locate a buyer and a plan to sell the business have been initiated; (iv) the sale of the business is probable within one year; (v) the business is being actively marketed for sale at a reasonable price relative to its fair value; and (vi) it is unlikely that the plan to sell will be withdrawn or that significant changes to the plan will be made.
In determining the fair value of the assets less costs to sell, the Company considers factors including current sales prices for comparable assets, discounted cash flow projections, third party valuation and any indicative offers. The Company’s assumptions about fair value require significant judgment because the current market is highly sensitive to changes in economic conditions. The Company estimates the fair values of assets held for sale based on current market conditions and assumptions made by management, which may differ from actual results and may result in impairments if market conditions deteriorate.
Any impairment loss on the initial classification and subsequent measurement is recognized as an expense. Any subsequent increase in fair value less costs to sell (not exceeding the accumulated impairment loss that has been previously recognized) is recognized in the income statement.
When assets are classified as held for sale, the Company does not record any depreciation and amortization for the respective property, plant and equipment and intangibles.
(y) Recently issued accounting pronouncements
The authoritative bodies release standards and guidance which are assessed by management for impact on the Company’s consolidated financial statements.
The Company has adopted the following recently released accounting standards:standards have not yet been adopted by the Company:
In June 2016,March 2023, the FASB issued ASU No. 2016-13, “Measurement of credit losses on financial instruments.2023-01, “Leases (Topic 842).” TheThis ASU requires measurement and recognition of expected credit losses for financial assets held bya lessee in a common control lease arrangement to amortize leasehold improvements that it owns over the Company. The ASU requires entitiesimprovements’ useful lives to estimate an expected lifetime credit loss on financial assets ranging from short-term trade accounts receivable to long-term financings. The ASU became effective for the Company beginning January 1, 2020, including interim periods in fiscal year 2020.
In May 2019, the FASB issued ASU No. 2019-05, “Financial Instruments—Credit Losses (Topic 326).” The ASU provides final guidance that allows entities to make an irrevocable one-time election upon adoptioncommon control group, regardless of the new credit losses standardlease term, if the lessee continues to measure financial assets at amortized cost (except held-to-maturity securities) usingcontrol the fair value option.use of the underlying asset through a lease. The ASU is effective for the Company beginning January 1, 2020, including interim periods in fiscal year 2020.
In November 2019, the FASB issued ASU No. 2019-11, “Codification Improvements to Topic 326, Financial Instruments—Credit Losses.” This ASU clarifies that the scope of the guidance related to expected recoveries extends to purchased financial assets with credit deterioration. For entities that have not yet adopted ASU 2016-13, the amendments in ASU 2019-11 are effective on the same date as those in ASU 2016-13. For entities that have adopted ASU 2016-13, the amendments in ASU 2019-11 are effective for fiscal years, beginning January 1, 2020 and interim periods therein.
within those fiscal years, beginning after December 15, 2023. Early adoption is permitted. The Company adopted ASU 2016-13, ASU 2019-05 and ASU 2019-11 beginning January 1, 2020, including interim periodsis in fiscal year 2020. The Company assessedthe process of assessing the impact of these ASUs and concluded that they do not have a material impactthis ASU on its consolidated results of operations, cash flows, financial position orand disclosures.
GENPACT LIMITED AND ITS SUBSIDIARIES
Notes to the Consolidated Financial Statements
(In thousands, except per share data and share count)
2. Summary of significant accounting policies (Continued)
In April 2019,November 2023, the FASB issued ASU No. 2019-04, “Codification Improvements to Topic 326, Financial Instruments—Credit Losses, Topic 815, Derivatives and Hedging, and Topic 825, Financial Instruments.” The ASU provides additional guidance on the recognition of credit losses and addresses partial-term fair value hedges, fair value hedge basis adjustments and certain transition requirements, among other things. The ASU also addresses the scope of the guidance on the requirement for re-measurement under ASC 820 when using the measurement alternative, certain disclosure requirements and which foreign currency-denominated equity securities must be re-measured at historical exchange rates. The ASU is effective for the Company beginning January 1, 2020, including interim periods in fiscal year 2020. The Company assessed the impact of this ASU and concluded that it does not have any material impact on its consolidated results of operations, cash flows, financial position or disclosures.
In October 2020, the FASB issued ASU No. 2020-09, “Codification Improvements to Topic 470, Debt— Amendments to SEC Paragraphs Pursuant to SEC Release No. 33-10762.” The SEC in its Release No. 33-10762 in March 2020 has adopted new rules on financial disclosure requirements for guarantors and issuers of guaranteed securities and affiliates whose securities collateralize issuers’ securities. This ASU revises certain SEC paragraphs of the FASB’s Accounting Standards Codification (ASC) to reflect, as appropriate, the amended financial statement disclosure requirements in SEC Release 33-10762. The amended rules are effective January 4, 2021 but early compliance is permitted. The Company adopted the amended rules issued by the SEC in its Release No. 33-10762 in the first quarter of 2020. Accordingly, the Company has already adopted the amendments under this ASU and the disclosures related to guarantor financial information has been omitted from the Notes to the Consolidated Financial Statements and included as part of Part II, Item 7 “Management’s Discussion and Analysis of Financial Condition and Results of Operations.”
The following recently released accounting standards have not yet been adopted by the Company:
In November 2021, the FASB issued ASU No. 2021-10, “Government Assistance.”2023-07, "Segment Reporting (Topic 280)." This ASU improves financial reportingreportable segment disclosure requirements by requiringenhancing disclosures that increase the transparencyabout significant segment expenses. It requires public entities to disclose significant segment expenses, other segment items, and additional measures of transactions with governments.segment profit or loss, providing more comprehensive information for investors and stakeholders. The amendments in this ASU isare effective for the Company for annual periods,fiscal years beginning after December 15, 2021.2023, and interim periods within fiscal years beginning after December 15, 2024. Early adoption is permitted. The Company is in the process of assessing the impact of this ASU on its consolidated results of operations, cash flows, financial position and disclosures.
In October 2021,December 2023, the FASB issued ASU No. 2021-08, “Business Combination.”2023-09, "Income Taxes (Topic 740)." This ASU enhances income tax disclosures by requiring public business entities on an annual basis (1) to disclose specific categories in the rate reconciliation, and (2) to provide additional information for reconciling items that meet a quantitative threshold, i.e., if the effect of those reconciling items is equal to or greater than 5% of the amount computed by multiplying pretax income or loss by the applicable statutory income tax rate. It also requires acquiring entities to apply Topic 606disclose the income taxes paid (net of refunds received), broken out between federal (national), state/local and foreign, as well as the amounts paid to recognize and measure contract assets and contract liabilitiesan individual jurisdiction when 5% or more of the total income taxes were paid to such jurisdiction. The amendments in a business combination and improve comparability for both the recognition and measurement of acquired revenue contracts at the date of and after a business combination and revenue contracts not acquired in a business combination. Thethis ASU isare effective for the Company for fiscal years and interim periods within those fiscal years, beginning after December 15, 2022.2024. Early adoption is permitted. The Company is in the process of assessing the impact of this ASU on its consolidated results of operations, cash flows, financial position and disclosures.
3. Business acquisitions
(a) Hoodoo Digital, LLC
On December 31, 2021, the Company acquired 100% of the outstanding equity/limited liability company interests in Hoodoo Digital, LLC, a Utah limited liability company, for total purchase consideration of $66,592.$66,721. This amount represents cash consideration of $64,310,$64,439, net of cash acquired of $2,283. The total purchase consideration paid by the Company to the sellers on the closing date was $67,695, resulting in a recoverable of $1,102$973 as of the closing date, which was subsequently received. The Company has made measurement period adjustments of $1,688 related to taxes during the year ended December 31, 2022. The Company paid $682 to the sellers in 2023 and no portion of the purchase consideration is outstanding as of December 31, 2021. The Company is evaluating adjustments related to certain income and other taxes, which, when determined, may result in the recognition of additional assets or liabilities as of the acquisition date. The measurement period will not exceed one year from the acquisition date.2023. This acquisition furthersfurthered the Company's strategy to fuse experience and process innovation to help clients drive end-to-end digital transformation. Hoodoo Digital’s expertise with Adobe Experience Manager and other Adobe applications expands the Company's existing capabilities to provide clients with an end-to-end solution that integrates digital content, e-commerce, data analytics, and marketing operations.
GENPACT LIMITED AND ITS SUBSIDIARIES
Notes to the Consolidated Financial Statements
(In thousands, except per share data and share count)
3. Business acquisitions (Continued)
In connection with this acquisition, the Company recorded $16,200 in customer-related intangibles and $2,400 in marketing-related intangibles which have a weighted average amortization period of five years. Goodwill arising from the acquisition amounting to $44,216$46,033 has been allocated using a relative fair value allocation method to each of the Company’s reporting segments as follows: to the Banking, Capital Markets and Insurance ("BCMI")Financial Services segment in the amount of $4,167,$4,338, to the Consumer Goods, Retail, Life Sciences and Healthcare ("CGRLH") segment in the amount of $7,032$7,321 and to the High Tech Manufacturing and Services ("HMS")Manufacturing segment in the amount of $33,017.$34,374. Goodwill arising from this acquisition is deductible for income tax purposes. The goodwill represents primarily the acquired capabilities and other benefits expected to result from combining the acquired operations with the Company’s existing operations.
Acquisition-related costs of $1,177 have been included in selling, general and administrative expenses as incurred. In connection with the acquisition, the Company also acquired certain assets with a value of $5,629 and assumed certain liabilities amounting to $1,852. The agreement with the sellers provides a full indemnity to the Company for all pre-closing income and non-income tax liabilities up to a maximum of the purchase consideration, including interest and penalties thereon. The Company would not be financially or materially affected by any liabilities that may arise from such exposures.
Accordingly, the Company recognized an indemnification asset of $278 based on the information that was available at the date of the acquisition, which is included in the assets taken over by the Company. The results of operations of the acquired business and the fair value of the acquired assets and assumed liabilities are included in the Company’s consolidated financial statements with effect from the date of the acquisition.
No proforma revenue or earning information for 2021 and 2020 has been presented as the impact is not material.
(b) Enquero, Inc.
On December 31, 2020, the Company acquired 100% of the outstanding equity interests in Enquero, Inc., a California corporation, and certain affiliated entities in India, the Netherlands and Canada (collectively referred to as “Enquero”) for total purchase consideration of $148,797. This amount represents cash consideration of $137,166, net of cash acquired of $11,631. The total purchase consideration paid by the Company to the sellers on the closing date was $141,938. No portion of the purchase consideration is outstanding as of December 31, 2021. This acquisition increased the scale and depth of the Company’s data and analytics capabilities and enhanced the Company’s ability to accelerate the digital transformation journeys of its clients through cloud technologies and advanced data analytics.
In connection with this acquisition, the Company recorded $49,000 in customer-related intangibles, $9,500 in marketing-related intangibles and $1,400 in technology-related intangibles, which have a weighted average amortization period of four years. Goodwill arising from the acquisition amounting to $87,874 has been allocated using a relative fair value allocation method to each of the Company’s reporting segments as follows: to the BCMI segment in the amount of $2,594, to the CGRLH segment in the amount of $22,548 and to the HMS segment in the amount of $62,732. The goodwill arising from this acquisition is not deductible for income tax purposes. The goodwill represents primarily the acquired capabilities and other benefits expected to result from combining the acquired operations with the Company’s existing operations.
Acquisition-related costs of $1,590 have been included in selling, general and administrative expenses as incurred. In connection with the acquisition, the Company also acquired certain assets with a value of $32,879, assumed certain liabilities amounting to $17,232 and recognized a net deferred tax liability of $14,343. The agreement with the sellers provides a full indemnity to the Company for all pre-closing income and non-income tax liabilities up to a maximum of the purchase consideration, including interest and penalties thereon. The Company would not be financially or materially affected by any liabilities that may arise from such exposures.
Accordingly, the Company recognized an indemnification asset of $5,968 based on the information that was available at the date of the acquisition, which is included in the assets taken over by the Company. The results of operations of the acquired business and the fair value of the acquired assets and assumed liabilities are included in the Company’s consolidated financial statements with effect from the date of the acquisition.
GENPACT LIMITED AND ITS SUBSIDIARIES
Notes to the Consolidated Financial Statements
(In thousands, except per share data and share count)
3. Business acquisitions (Continued)
(c) SomethingDigital.Com LLC
On October 5, 2020, the Company acquired 100% of the outstanding equity/limited liability company interests in SomethingDigital.Com LLC, a New York limited liability company, for total purchase consideration of $57,451. This amount represents cash consideration of $56,073, net of cash acquired of $1,378. The total purchase consideration paid by the Company to the sellers on the closing date was $57,704, resulting in a recoverable of $253, which was received in the three months ended March 31, 2021.
This acquisition supported the Company’s strategy to integrate experience and process innovation to help clients on their digital transformation journeys and expanded on the Company’s existing experience capabilities to support end-to-end digital commerce solutions, both business-to-business and business-to-consumer. Additionally, this acquisition expanded the Company’s capabilities into Magento Commerce, which powers Adobe Commerce Cloud, and Shopify Plus, a cloud-based e-commerce platform for high volume merchants.
In connection with this acquisition, the Company recorded $11,900 in customer-related intangibles and $3,500 in marketing-related intangibles which have a weighted average amortization period of four years. Goodwill arising from the acquisition amounting to $36,926 has been allocated using a relative fair value allocation method to 2 of the Company’s reporting segments as follows: to the CGRLH segment in the amount of $30,373 and to the HMS segment in the amount of $6,553. Of the total goodwill arising from this acquisition, $35,084 is deductible for income tax purposes.
The goodwill represents primarily the acquired capabilities and other benefits expected to result from combining the acquired operations with those of the Company’s existing operations.
Acquisition-related costs of $1,060 have been included in selling, general and administrative expenses as incurred. In connection with the acquisition, the Company also acquired certain assets with a value of $9,538, assumed certain liabilities amounting to $4,494 and recognized a net deferred tax asset of $81. The results of operations of the acquired business and the fair value of the acquired assets and assumed liabilities are included in the Company’s consolidated financial statements with effect from the date of the acquisition.
(d) Rightpoint Consulting, LLC
On November 12, 2019, the Company acquired 100% of the outstanding equity/limited liability company interests in Rightpoint Consulting, LLC, an Illinois limited liability company, and certain affiliated entities in the United States and India (collectively referred to as “Rightpoint”) for total purchase consideration of $270,669. This amount includes cash consideration of $268,170, net of cash acquired of $2,499. The total purchase consideration paid by the Company to the sellers on the closing date was $248,470, resulting in a payable of $22,199. $5,406 of the total purchase consideration remains payable as of December 31, 2021. This acquisition expanded the Company’s capabilities in improving customer experience.
The securities purchase agreement between the Company and the selling equity holders of Rightpoint provided certain of the selling equity holders the option to elect to either (a) receive 100% consideration in cash at the closing date for their limited liability company interests and vested options or (b) “roll over” and retain 25% of their Rightpoint limited liability company interests and vested options for a three-year rollover period and receive cash consideration at closing for the remaining 75% of their Rightpoint limited liability company interests and vested options. Certain selling equity holders elected to receive deferred, variable earn-out consideration with an estimated value of $21,500 over the rollover period of three years.
The amount of deferred earn-out consideration ultimately payable by the Company to the selling equity holders of Rightpoint will be based on the future revenue multiple of the acquired business. Additionally, under the purchase agreement the selling equity holders are obligated to sell their rollover interests to the Company. Accordingly, the Company has obtained control over 100% of the outstanding equity/limited liability company interests of Rightpoint as of as of November 12, 2019. See Note 6, “Fair value measurements,” for additional details.
GENPACT LIMITED AND ITS SUBSIDIARIES
Notes to the Consolidated Financial Statements
(In thousands, except per share data and share count)
3. Business acquisitions (Continued)
In connection with this acquisition, the Company recorded $46,000 in customer-related intangibles and $29,000 in marketing-related intangibles which have a weighted average amortization period of five years. Goodwill arising from the acquisition amounting to $177,181 has been allocated using a relative fair value allocation method to each of the Company’s reporting segments as follows: to the BCMI segment in the amount of $16,983, to the CGRLH segment in the amount of $42,993 and to the HMS segment in the amount of $117,205. Of the total goodwill arising from this acquisition, $91,929 is deductible for income tax purposes. The goodwill represents primarily the acquired capabilities and other benefits expected to result from combining the acquired operations with those of the Company.
Acquisition-related costs of $7,385 have been included in selling, general and administrative expenses as incurred. In connection with the acquisition, the Company also acquired certain assets with a value of $39,140, assumed certain liabilities amounting to $22,295 and recognized a net deferred tax liability of $1,643. The results of operations of the acquired business and the fair value of the acquired assets and assumed liabilities are included in the Company’s consolidated financial statements with effect from the date of the acquisition.
4. Cash and cash equivalents
| | | | | | | | | | | |
| As of December 31, |
| 2020 | | 2021 |
| Cash and other bank balances | $ | 680,440 | | | $ | 899,458 | |
| Total | $ | 680,440 | | | $ | 899,458 | |
5. Accounts receivable, net of allowance for credit losses
The following table provides details of the Company’s allowance for credit losses:
| | | | | | | | | | | | | | | | | |
| Year ended December 31, |
| 2019 | | 2020 | | 2021 |
| Opening balance as of January 1 | $ | 23,960 | | | $ | 29,969 | | | $ | 27,707 | |
| Transition period adjustment on accounts receivables (through retained earnings) pursuant to adoption of ASC 326 | — | | | 4,185 | | | — | |
| Adjusted balance as of January 1 | 23,960 | | | 34,154 | | | 27,707 | |
| Additions due to acquisitions | 1,004 | | | 200 | | | — | |
| Additions charged/reversal released to cost and expense, net | 7,443 | | | 3,307 | | | 910 | |
| Deductions/effect of exchange rate fluctuations | (2,438) | | | (9,954) | | | (4,288) | |
| Closing balance | $ | 29,969 | | | $ | 27,707 | | | $ | 24,329 | |
| | | | | | | | | | | | | | | | | |
| Year ended December 31, |
| 2021 | | 2022 | | 2023 |
| Opening balance as of January 1 | $ | 27,707 | | | $ | 24,329 | | | $ | 20,442 | |
| Additions (net), charged to income statement | 910 | | | 2,096 | | | 3,081 | |
| Deductions/effect of exchange rate fluctuations | (4,288) | | | (5,983) | | | (5,245) | |
| Closing balance | $ | 24,329 | | | $ | 20,442 | | | $ | 18,278 | |
Accounts receivable were $908,727$1,015,197 and $912,071,$1,134,551, and allowances for credit losses were $27,707$20,442 and $24,329,$18,278, resulting in net accounts receivable balances of $881,020$994,755 and $887,742$1,116,273 as of December 31, 20202022 and 2021,2023, respectively.
During the year ended December 31, 2022, the Company sold certain accounts receivable amounting to $2,180 and classified $2,341 as assets held for sale relating to a business previously classified as held for sale, the sale of which was completed in the first quarter of 2023. See Note 8 for additional information.
GENPACT LIMITED AND ITS SUBSIDIARIESThe Company also has arrangements with financial institutions that manage the accounts payable program for certain of the Company's large clients. The Company sells certain accounts receivable pertaining to such clients to these financial institutions on a non-recourse basis. There is no cap on the value of accounts receivable that can be sold under these arrangements. The Company used these arrangements to sell accounts receivable amounting to $299,875 and $324,401 during the years ended December 31, 2022 and December 31, 2023, respectively, which also represents the maximum capacity utilized under these arrangements in each such year. The cost of factoring such accounts receivable during the years ended December 31, 2021, 2022 and 2023 was $1,295, $4,154 and $7,921, respectively.
Notes to the Consolidated Financial Statements
(In thousands, except per share data and share count)
6.5. Fair value measurements
The Company measures certain financial assets and liabilities, including derivative instruments, at fair value on a recurring basis. The fair value measurements of these financial assets and liabilities were determined using the following inputs as of December 31, 20202022 and 2021:2023:
| | As of December 31, 2020 |
| Fair Value Measurements at Reporting Date Using |
| | Quoted Prices in
Active Markets for
Identical Assets | | Significant Other
Observable
Inputs | | Significant Other
Unobservable
Inputs |
| Total | | (Level 1) | | (Level 2) | | (Level 3) |
| As of December 31, 2022 | | | As of December 31, 2022 |
| Fair Value Measurements at Reporting Date Using | | | Fair Value Measurements at Reporting Date Using |
| | | Quoted Prices in
Active Markets for
Identical Assets | | | | | Quoted Prices in
Active Markets for
Identical Assets | | Significant Other
Observable
Inputs | | Significant Other
Unobservable
Inputs |
| Total | | | Total | | (Level 1) | | (Level 2) | | (Level 3) |
| Assets | Assets | | | | | | | |
| Derivative instruments (Note a, c) | |
| Derivative instruments (Note a, c) | |
| Derivative instruments (Note a, c) | Derivative instruments (Note a, c) | $ | 27,709 | | | $ | — | | | $ | 27,709 | | | $ | — | |
| Deferred compensation plan assets (Note a, e) | Deferred compensation plan assets (Note a, e) | 26,832 | | | — | | | — | | | 26,832 | |
| Total | Total | $ | 54,541 | | | $ | — | | | $ | 27,709 | | | $ | 26,832 | |
| Liabilities | Liabilities | | | | | | | |
| Earn-out consideration (Note b, d) | Earn-out consideration (Note b, d) | $ | 8,272 | | | $ | — | | | $ | — | | | $ | 8,272 | |
| Earn-out consideration (Note b, d) | |
| Earn-out consideration (Note b, d) | |
| Derivative instruments (Note b, c) | Derivative instruments (Note b, c) | 40,981 | | | — | | | 40,981 | | | — | |
| Deferred compensation plan liability (Note b, f) | Deferred compensation plan liability (Note b, f) | 26,390 | | | — | | | — | | | 26,390 | |
| Total | Total | $ | 75,643 | | | $ | — | | | $ | 40,981 | | | $ | 34,662 | |
| | | | | | | | | | | | | | | | | | | | | | | |
| As of December 31, 2021 |
| Fair Value Measurements at Reporting Date Using |
| | | Quoted Prices in
Active Markets for
Identical Assets | | Significant Other
Observable
Inputs | | Significant Other
Unobservable
Inputs |
| Total | | (Level 1) | | (Level 2) | | (Level 3) |
| Assets | | | | | | | |
| Derivative instruments (Note a, c) | $ | 34,070 | | | $ | — | | | $ | 34,070 | | | $ | — | |
| Deferred compensation plan assets (a, e) | 38,584 | | — | | | — | | | 38,584 |
| Total | $ | 72,654 | | | $ | — | | | $ | 34,070 | | | $ | 38,584 | |
| Liabilities | | | | | | | |
| Earn-out consideration (Note b, d) | $ | 5,406 | | | $ | — | | | $ | — | | | $ | 5,406 | |
| Derivative instruments (Note b, c) | 15,254 | | — | | | 15,254 | | — | |
| Deferred compensation plan liability (b, f) | 38,007 | | — | | | — | | | 38,007 |
| Total | $ | 58,667 | | | $ | — | | | $ | 15,254 | | | $ | 43,413 | |
GENPACT LIMITED AND ITS SUBSIDIARIES
Notes to the Consolidated Financial Statements
(In thousands, except per share data and share count)
5. Fair value measurements (Continued)
| | | | | | | | | | | | | | | | | | | | | | | |
| As of December 31, 2023 |
| Fair Value Measurements at Reporting Date Using |
| | | Quoted Prices in
Active Markets for
Identical Assets | | Significant Other
Observable
Inputs | | Significant Other
Unobservable
Inputs |
| Total | | (Level 1) | | (Level 2) | | (Level 3) |
| Assets | | | | | | | |
| Derivative instruments (Note a, c) | $ | 22,307 | | | $ | — | | | $ | 22,307 | | | $ | — | |
| Deferred compensation plan assets (Note a, e) | 51,983 | | — | | | — | | | 51,983 |
| Total | $ | 74,290 | | | $ | — | | | $ | 22,307 | | | $ | 51,983 | |
| Liabilities | | | | | | | |
| Derivative instruments (Note b, c) | 17,363 | | — | | | 17,363 | | — | |
| Deferred compensation plan liability (Note b, f) | 51,354 | | — | | | — | | | 51,354 |
| Total | $ | 68,717 | | | $ | — | | | $ | 17,363 | | | $ | 51,354 | |
(a)Derivative assets are included in “prepaid expenses and other current assets” and “other assets;” deferredassets” in the consolidated balance sheets. Deferred compensation plan assets are included in “other assets” in the consolidated balance sheets.
(b)Included in “accrued expenses and other current liabilities” and “other liabilities” in the consolidated balance sheets.
(c)The Company values its derivative instruments based on market observable inputs, including both forward and spot prices for the relevant currencies and interest rate indices for relevant interest rates. The quotes are taken from an independent market database.
(d)The fair value of earn-out consideration, calculated as the present value of expected future payments to be made to the sellers of acquired businesses, was derived by estimating the future financial performance of the acquired businesses using the earn-out formula and performance targets specified in each purchase agreement and adjusting the result to reflect the Company’s estimate of the likelihood of achievement of such targets. Given the significance of the unobservable inputs, the valuations are classified in level 3 of the fair value hierarchy.
GENPACT LIMITED AND ITS SUBSIDIARIES
Notes to the Consolidated Financial Statements
(In thousands, except per share data and share count)
6. Fair value measurements (Continued)
(e)Deferred compensation plan assets consist of life insurance policies held under a Rabbi Trust. Assets held in the Rabbi Trust are valued based on the cash surrender value of the insurance contract, which is determined based on the fair value of the underlying assets included in the insurance portfolio and are therefore classified within level 3 of the fair value hierarchy.
(f)The fair value of the deferred compensation plan liability is derived based on the fair value of the underlying assets in the insurance policies and is therefore classified within level 3 of the fair value hierarchy.
The following table provides a roll-forward of the fair value of earn-out consideration categorized as level 3 in the fair value hierarchy for the years ended December 31, 20202022 and 2021:2023:
| | | | | | | | | | | |
| Year ended December 31, |
| 2020 | | 2021 |
| Opening balance | $ | 22,184 | | | $ | 8,272 | |
| Payments made on earn-out consideration (Note a) | (6,552) | | | (2,556) | |
| Change in fair value of earn-out consideration (Note b) | (7,790) | | | (750) | |
| Others (Note c) | 430 | | | 440 | |
| Closing balance | $ | 8,272 | | | $ | 5,406 | |
| | | | | | | | | | | |
| Year ended December 31, |
| 2022 | | 2023 |
| Opening balance | $ | 5,406 | | | $ | 2,517 | |
| Payments made on earn-out consideration | (2,437) | | | (2,399) | |
| Change in fair value of earn-out consideration (Note a) | (452) | | | (118) | |
| Closing balance | $ | 2,517 | | | $ | — | |
(a)Includes the interest payment on earn-out consideration in excess of the acquisition date fair value, which is included in “cash flows from operating activities” amounting to $0 and $440 for the year ended December 31, 2020 and 2021, respectively.
(b)Changes in the fair value of earn-out consideration are reported in “other operating (income) expense, net” in the consolidated statements of income.
(c)“Others” is comprised of interest expense included in “interest income (expense), net” and the impact of changes in foreign exchange reported in “foreign exchange gains (losses), net” in the consolidated statements of income. This also includes a cumulative translation adjustment reported as a component of other comprehensive income (loss).
The following table provides a roll-forward of the fair value of deferred compensation plan assets categorized as level 3 in the fair value hierarchy for the year ended December 31, 2020 and 2021:
| | | | | | | | | | | |
| Year ended December 31, |
| 2020 | | 2021 |
| Opening balance | $ | 11,208 | | | $ | 26,832 | |
| Additions (net of redemption) | 11,460 | | 7,523 |
| Change in fair value of deferred compensation plan assets (Note a) | 4,164 | | | 4,229 |
| Closing balance | $ | 26,832 | | | $ | 38,584 | |
(a)Changes in the fair value of plan assets are reported in “other income (expense), net” in the consolidated statements of income.
GENPACT LIMITED AND ITS SUBSIDIARIES
Notes to the Consolidated Financial Statements
(In thousands, except per share data and share count)
6.5. Fair value measurements (Continued)
The following table provides a roll-forward of the fair value of deferred compensation plan assets categorized as level 3 in the fair value hierarchy for the years ended December 31, 2022 and 2023:
| | | | | | | | | | | |
| Year ended December 31, |
| 2022 | | 2023 |
| Opening balance | $ | 38,584 | | | $ | 40,261 | |
| Additions (net of redemption) | 9,257 | | 4,216 |
| Change in fair value of deferred compensation plan assets (Note a) | (7,580) | | | 7,506 |
| Closing balance | $ | 40,261 | | | $ | 51,983 | |
(a)Changes in the fair value of plan assets are reported in “other income (expense), net” in the consolidated statements of income.
The following table provides a roll-forward of the fair value of deferred compensation liabilities categorized as level 3 in the fair value hierarchy for the yearyears ended December 31, 20202022 and 2021:2023:
| | Year ended December 31, |
| 2020 | | 2021 |
| Year ended December 31, | | | Year ended December 31, |
| 2022 | | | 2022 | | 2023 |
| Opening balance | Opening balance | $ | 10,943 | | | $ | 26,390 | |
| Additions (net of redemption) | Additions (net of redemption) | 11,327 | | 7,523 | Additions (net of redemption) | 9,257 | | 4,216 |
| Change in fair value of deferred compensation plan liabilities (Note a) | Change in fair value of deferred compensation plan liabilities (Note a) | 4,120 | | | 4,094 | Change in fair value of deferred compensation plan liabilities (Note a) | (7,610) | | | 7,484 | | 7,484 |
| Closing balance | Closing balance | $ | 26,390 | | | $ | 38,007 | |
(a)Changes in the fair value of deferred compensation liabilities are reported in “selling, general and administrative expenses” in the consolidated statements of income.
7.
6. Derivative financial instruments
The Company is exposed to the risk of rate fluctuations on its foreign currency assets and liabilities and on foreign currency denominated forecasted cash flows and interest rates. The Company has established risk management policies, including the use of derivative financial instruments to hedge foreign currency assets and liabilities, foreign currency denominated forecasted cash flows and interest rate risk. These derivative financial instruments are largelyconsist of deliverable and non-deliverable forward foreign exchange contracts, treasury rate locks and interest rate swaps. The Company enters into these contracts with counterparties that are banks or other financial institutions, and the Company considers the risk of non-performance by such counterparties not to be material. The forward foreign exchange contracts and interest rate swaps mature during a period of up to 4860 months and the forecasted transactions are expected to occur during the same periods.period.
The following table presents the aggregate notional principal amounts of outstanding derivative financial instruments together with the related balance sheet exposure:
| | | | | | | | | | | | | | | | | | | | | | | |
| Notional principal amounts
(note a) | | Balance sheet exposure asset
(liability) (note b) |
| As of December 31, 2020 | | As of December 31, 2021 | | As of December 31, 2020 | | As of December 31, 2021 |
| Foreign exchange forward contracts denominated in: | | | | | | | |
| United States Dollars (sell) Indian Rupees (buy) | $ | 1,150,000 | | | $ | 1,348,600 | | | $ | 15,207 | | | $ | 26,247 | |
| United States Dollars (sell) Mexican Peso (buy) | 17,500 | | | 23,750 | | 716 | | | 140 | |
| United States Dollars (sell) Philippines Peso (buy) | 67,200 | | | 75,600 | | 1,332 | | | (2,215) | |
| Euro (sell) United States Dollars (buy) | 96,651 | | | 120,994 | | | (5,659) | | | 2,634 | |
| Singapore Dollars (buy) United States Dollars (sell) | 10,153 | | | 3,655 | | 66 | | | 65 | |
| Euro (sell) Romanian Leu (buy) | 29,489 | | | 47,506 | | (22) | | | (233) | |
| Japanese Yen (sell) Chinese Renminbi (buy) | 19,230 | | | 10,440 | | 473 | | | 202 | |
| United States Dollars (sell) Chinese Renminbi (buy) | — | | | 45,000 | | — | | 120 | |
| Pound Sterling (sell) United States Dollars (buy) | — | | | 49,031 | | — | | 545 | |
| United States Dollars (sell) Hungarian Font (buy) | 30,000 | | | 39,000 | | 904 | | | (2,174) | |
| Hungarian Font (Sell) Euro (buy) | 10,444 | | | 2,828 | | 61 | | | (17) | |
| Australian Dollars (sell) Indian Rupees (buy) | 140,525 | | | 97,053 | | (7,670) | | | 1,234 | |
| Interest rate swaps (floating to fixed) | 488,022 | | | 460,135 | | | (18,680) | | | (7,732) | |
| | | | | $ | (13,272) | | | $ | 18,816 | |
GENPACT LIMITED AND ITS SUBSIDIARIES
Notes to the Consolidated Financial Statements
(In thousands, except per share data and share count)
7.6. Derivative financial instruments (Continued)
The following table presents the aggregate notional principal amounts of outstanding derivative financial instruments together with the related balance sheet exposure:
| | | | | | | | | | | | | | | | | | | | | | | |
| Notional principal amounts (Note a) | | Balance sheet exposure asset (liability) (Note b) |
| As of December 31, 2022 | | As of December 31, 2023 | | As of December 31, 2022 | | As of December 31, 2023 |
| Foreign exchange forward contracts denominated in: | | | | | | | |
| United States Dollars (sell) Indian Rupees (buy) | $ | 1,587,500 | | | $ | 1,892,800 | | | $ | (25,581) | | | $ | 5,278 | |
| United States Dollars (sell) Mexican Peso (buy) | 24,000 | | | 66,000 | | 1,079 | | | 2,129 | |
| United States Dollars (sell) Philippines Peso (buy) | 79,200 | | | 118,500 | | (828) | | | 637 | |
| Euro (sell) United States Dollars (buy) | 182,163 | | | 222,363 | | | 480 | | | (3,499) | |
| Singapore Dollars (buy) United States Dollars (sell) | 50,956 | | | — | | 166 | | | — | |
| Euro (sell) Romanian Leu (buy) | 51,115 | | | 66,384 | | 848 | | | 90 | |
| Japanese Yen (sell) Chinese Renminbi (buy) | 8,185 | | | 52,562 | | (327) | | | 803 | |
| United States Dollars (sell) Chinese Renminbi (buy) | 41,000 | | | 40,800 | | 605 | | (638) | |
| Pound Sterling (sell) United States Dollars (buy) | 32,594 | | | 14,915 | | 1,113 | | (398) | |
| United States Dollars (sell) Hungarian Font (buy) | 12,000 | | | 32,000 | | 828 | | | 809 | |
| Australian Dollars (sell) Indian Rupees (buy) | 87,513 | | | 90,077 | | (452) | | | (1,914) | |
| United States Dollars (Sell) Polish Zloty (buy) | 24,000 | | | 51,000 | | | 1,372 | | | 3,046 | |
| Japanese Yen (sell) United States Dollars (buy) | 10,000 | | | 7,000 | | | (1,134) | | | 323 | |
| Israeli Shekel (sell) United States Dollars (buy) | 3,000 | | | 15,000 | | | 3 | | | 1,175 | |
| South African Rand (sell) United States Dollars (buy) | 21,000 | | | 27,000 | | | (1,652) | | | 216 | |
| United States Dollars (sell) Brazilian Real (buy) | — | | | 4,000 | | | — | | | 55 | |
| United States Dollars (sell) Costa Rica Colon (buy) | — | | | 13,000 | | | — | | | 555 | |
| Pound Sterling (buy) United States Dollar (sell) | — | | | 22,300 | | | — | | | 669 | |
| United States Dollars (sell) Malaysian Ringgit (buy) | — | | | 18,000 | | | — | | | 161 | |
| Interest rate swaps (floating to fixed) | 432,248 | | | 148,125 | | | 6,350 | | | (4,553) | |
| | | | | $ | (17,130) | | | $ | 4,944 | |
(a)Notional amounts are key elements of derivative financial instrument agreements but do not represent the amount exchanged by counterparties and do not measure the Company’s exposure to credit, foreign exchange, interest rate or other market risks. However, the amounts exchanged are based on the notional amounts and other provisions of the underlying derivative financial instrument agreements. Notional amounts are denominated in U.S. dollars.
(b)Balance sheet exposure is denominated in U.S. dollars and denotes the mark-to-market impact of the derivative financial instruments on the reporting date.
FASB guidance on derivatives and hedging requires companies to recognize all derivative instruments as either assets or liabilities at fair value in the balance sheet. In accordance with the FASB guidance on derivatives and hedging, the Company designates foreign exchange forward contracts, interest rate swaps and treasury rate locks as cash flow hedges. Foreign exchange forward contracts are entered into to cover the effects of future exchange rate variability on forecasted revenuerevenues and purchases of services, and interest rate swaps and treasury rate locks are entered into to cover interest rate fluctuation risk. In addition to this program, the Company uses derivative instruments that are not accounted for as hedges under the FASB guidance in order to hedge foreign exchange risks related to balance sheet items, such as receivables and intercompany borrowings, that are denominated in currencies other than the Company’s underlying functional currency.
GENPACT LIMITED AND ITS SUBSIDIARIES
Notes to the Consolidated Financial Statements
(In thousands, except per share data and share count)
6. Derivative financial instruments (Continued)
The fair valuesvalue of the Company’s derivative instruments and their location in the Company’s financial statements are summarized in the table below:
| | Cash flow hedges | | Non-designated |
| As of December 31, 2020 | | As of December 31, 2021 | | As of December 31, 2020 | | As of December 31, 2021 |
| Cash flow hedges | | | Cash flow hedges | | Non-designated |
| As of December 31, 2022 | | | As of December 31, 2022 | | As of December 31, 2023 | | As of December 31, 2022 | | As of December 31, 2023 |
| Assets | Assets | | | | | | | |
| Prepaid expenses and other current assets | |
| Prepaid expenses and other current assets | |
| Prepaid expenses and other current assets | Prepaid expenses and other current assets | $ | 16,188 | | | $ | 16,064 | | | $ | 5,357 | | | $ | 3,130 | |
| Other assets | Other assets | $ | 6,164 | | | $ | 14,876 | | | $ | — | | | $ | — | |
| Liabilities | Liabilities | |
| Accrued expenses and other current liabilities | Accrued expenses and other current liabilities | $ | 16,387 | | | $ | 11,408 | | | $ | 3,785 | | | $ | 1,090 | |
| Accrued expenses and other current liabilities | |
| Accrued expenses and other current liabilities | |
| Other liabilities | Other liabilities | $ | 16,886 | | | $ | 2,756 | | | $ | 3,923 | | | $ | — | |
Cash flow hedges
For derivative instruments that are designated and qualify as cash flow hedges, the effective portion of the gain (loss) on the derivative instrument is reported as a component of other comprehensive income (loss) and reclassified into earnings in the same period or periods during which the hedged transaction is recognized in the consolidated statements of income. Gains (losses) on the derivatives, representing either hedge ineffectiveness or hedge components excluded from the assessment of effectiveness, are recognized in earnings as incurred.
The Company executed a treasury rate lock agreement for $350,000 in connection with future interest payments to be made on its senior notes issued by Genpact Luxembourg S.à r.l. (“Genpact Luxembourg”) and Genpact USA, Inc. (“Genpact USA”), both wholly-owned subsidiaries of the Company, in March 2021 (the “2021 Senior Notes”), and the treasury rate lock was designated as a cash flow hedge. The treasury rate lock agreement was terminated on March 23, 2021 and a deferred gain was recorded in accumulated other comprehensive income and is being amortized to interest expense over the life of the 2021 Senior Notes. The remaining gain to be amortized related to the treasury rate lock agreement as of December 31, 20212022 and 2023 was $692.$530 and $368, respectively.
In connection with cash flow hedges, the gains (losses) recorded as a component of other comprehensive income (loss) ("OCI"), and the related tax effects are summarized below:
| | | | | | | | | | | | | | | | | | | | | | | | | | | | | | | | | | | | | | | | | | | | | | | | | | | | | |
| Year ended December 31, |
| 2021 | | 2022 | | 2023 |
| Before-Tax amount | | Tax (Expense) or Benefit | | Net of tax Amount | | Before-Tax
amount | | Tax (Expense) or Benefit | | Net of tax Amount | | Before-Tax
amount | | Tax (Expense) or Benefit | | Net of tax Amount |
| Opening balance | $ | (10,921) | | | $ | 1,861 | | | $ | (9,060) | | | $ | 17,468 | | | $ | (3,404) | | | $ | 14,064 | | | $ | (7,255) | | | $ | 1,543 | | | $ | (5,712) | |
| Net gains (losses) reclassified into statement of income on completion of hedged transactions | 7,628 | | | (1,836) | | | 5,792 | | | (6,815) | | | (413) | | | (7,228) | | | 13,871 | | | (3,644) | | | 10,227 | |
| Changes in fair value of effective portion of outstanding derivatives, net | 36,017 | | | (7,101) | | | 28,916 | | | (31,538) | | | 4,534 | | | (27,004) | | | 21,931 | | | (5,041) | | | 16,890 | |
| Gain (loss) on cash flow hedging derivatives, net | 28,389 | | | (5,265) | | | 23,124 | | | (24,723) | | | 4,947 | | | (19,776) | | | 8,060 | | | (1,397) | | | 6,663 | |
| Closing balance | $ | 17,468 | | | $ | (3,404) | | | $ | 14,064 | | | $ | (7,255) | | | $ | 1,543 | | | $ | (5,712) | | | $ | 805 | | | $ | 146 | | | $ | 951 | |
GENPACT LIMITED AND ITS SUBSIDIARIES
Notes to the Consolidated Financial Statements
(In thousands, except per share data and share count)
7.6. Derivative financial instruments (Continued)
In connection with cash flow hedges, the gains (losses) recorded as a component of other comprehensive income (loss), or OCI, and the related tax effects are summarized below:
| | | | | | | | | | | | | | | | | | | | | | | | | | | | | | | | | | | | | | | | | | | | | | | | | | | | | |
| Year ended December 31, |
| 2019 | | 2020 | | 2021 |
| Before-Tax amount | | Tax (Expense) or Benefit | | Net of tax Amount | | Before-Tax
amount | | Tax (Expense) or Benefit | | Net of tax Amount | | Before-Tax
amount | | Tax (Expense) or Benefit | | Net of tax Amount |
| Opening balance | $ | (2,411) | | | $ | (5,524) | | | $ | (7,935) | | | $ | (4,126) | | | $ | (1,466) | | | $ | (5,592) | | | $ | (10,921) | | | $ | 1,861 | | | $ | (9,060) | |
| Net gains (losses) reclassified into statement of income on completion of hedged transactions | 19,401 | | | (7,212) | | | 12,189 | | | (6,171) | | | 605 | | | (5,566) | | | 7,628 | | | (1,836) | | | 5,792 | |
| Changes in fair value of effective portion of outstanding derivatives, net | 17,686 | | | (3,154) | | | 14,532 | | | (12,966) | | | 3,932 | | | (9,034) | | | 36,017 | | | (7,101) | | | 28,916 | |
| Gain (loss) on cash flow hedging derivatives, net | (1,715) | | | 4,058 | | | 2,343 | | | (6,795) | | | 3,327 | | | (3,468) | | | 28,389 | | | (5,265) | | | 23,124 | |
| Closing balance | $ | (4,126) | | | $ | (1,466) | | | $ | (5,592) | | | $ | (10,921) | | | $ | 1,861 | | | $ | (9,060) | | | $ | 17,468 | | | $ | (3,404) | | | $ | 14,064 | |
The gains or losses recognized in other comprehensive income (loss) and their effects on financial performance are summarized below:
| Derivatives in
Cash Flow
Hedging
Relationships | Derivatives in
Cash Flow
Hedging
Relationships | Amount of Gain (Loss)
recognized in OCI on
Derivatives (Effective Portion) | | Location of Gain (Loss)
reclassified
from OCI into
Statement of Income
(Effective Portion) | | Amount of Gain (Loss) reclassified
from OCI into Statement of Income
(Effective Portion) | Derivatives in
Cash Flow
Hedging
Relationships | Amount of Gain (Loss)
recognized in OCI on
Derivatives (Effective Portion) | | Location of Gain (Loss)
reclassified
from OCI into
Statement of Income
(Effective Portion) | | Amount of Gain (Loss) reclassified
from OCI into Statement of Income
(Effective Portion) |
| Year ended December 31, | | Year ended December 31, | Year ended December 31, | | | Year ended December 31, |
| 2019 | | 2020 | | 2021 | | 2019 | | 2020 | | 2021 | 2021 | | 2022 | | 2023 | | | 2021 | | 2022 | | 2023 |
Forward foreign
exchange contracts | Forward foreign
exchange contracts | $ | 24,581 | | | $ | 6,933 | | | $ | 32,270 | | | Revenue | | $ | 6,782 | | | $ | 4,432 | | | $ | 1,354 | |
| Interest rate swaps | Interest rate swaps | (6,895) | | | (19,899) | | | 2,931 | | | Cost of revenue | | 6,435 | | | (4,553) | | | 11,155 | |
| Treasury rate lock | Treasury rate lock | — | | | — | | | 816 | | | Selling, general and administrative expenses | | 1,732 | | | (1,266) | | | 3,012 | |
| Interest expense | | 4,452 | | | (4,784) | | | (7,893) | |
| $ | 17,686 | | | $ | (12,966) | | | $ | 36,017 | | | $ | 19,401 | | | $ | (6,171) | | | $ | 7,628 | |
| | | | | | | Interest expense | |
| $ | |
There were no gains (losses) recognized in the statement of income on the ineffective portion of derivatives and excluded from effectiveness testing for the years ended December 31, 2019, 20202021, 2022 and 2021,2023, respectively.
Non-designatedNon-designated Hedges
| | | | | | | | | | | | | | | | | | | | | | | | | | |
| Derivatives not designated as hedging instruments | | Location of Gain (Loss) recognized in Statement of Income on Derivatives | | Amount of Gain (Loss) recognized in Statement of Income on Derivatives |
| | Year ended December 31, |
| | 2019 | | 2020 | | 2021 |
| Forward foreign exchange contracts (Note a) | | Foreign exchange gains (losses), net | | $ | 4,299 | | | $ | (8,055) | | | $ | 12,116 | |
| Forward foreign exchange contracts (Note b) | | Foreign exchange gains (losses), net | | — | | | 3,963 | | | — | |
| | | | $ | 4,299 | | | $ | (4,092) | | | $ | 12,116 | |
GENPACT LIMITED AND ITS SUBSIDIARIES
Notes to the Consolidated Financial Statements
(In thousands, except per share data and share count)
7. Derivative financial instruments (Continued) | | | | | | | | | | | | | | | | | | | | | | | | | | |
| Derivatives not designated as hedging instruments | | Location of Gain (Loss) recognized in Statement of Income on Derivatives | | Amount of Gain (Loss) recognized in Statement of Income on Derivatives |
| | Year ended December 31, |
| | 2021 | | 2022 | | 2023 |
| Forward foreign exchange contracts (Note a) | | Foreign exchange gains (losses), net | | $ | 12,116 | | | $ | (29,499) | | | $ | 13,462 | |
a)These forward foreign exchange contracts were entered into to hedge fluctuations in foreign exchange rates for recognized balance sheet items, such as receivables and intercompany borrowings, and were not originally designated as hedges under FASB guidance on derivatives and hedging. Realized gains (losses) and changes in the fair value of these derivatives are recorded in foreign exchange gains (losses), net in the consolidated statements of income.
b)These forward foreign exchange contracts were initially designated as cash flow hedges under ASC guidance on derivatives and hedging. These contracts were terminated because certain forecasted transactions were no longer expected to occur and therefore hedge accounting was no longer applied. Subsequently, the realized gains (losses) are recorded in foreign exchange gains (losses) net in the consolidated statements of income.
In connection with the COVID-19 pandemic, the Company has reevaluated its hedging arrangements. The Company has considered the effect of changes, if any, in both counterparty credit risk and the Company’s own non-performance risk while assessing hedge effectiveness and measuring hedge ineffectiveness. The Company believes that its hedges continue to be effective after taking into account the expected impact of the COVID-19 pandemic on the Company’s hedged transactions.
8.7. Prepaid expenses and other current assets
Prepaid expenses and other current assets consist of the following:
| | As of December 31, |
| 2020 | | 2021 |
| As of December 31, | | | As of December 31, |
| 2022 | | | 2022 | | 2023 |
| Advance income and non-income taxes | Advance income and non-income taxes | $ | 73,008 | | | $ | 28,075 | |
| Contract asset (Note 25) | Contract asset (Note 25) | 9,035 | | | 8,506 | |
| Prepaid expenses | Prepaid expenses | 32,375 | | | 38,528 | |
| Derivative instruments | Derivative instruments | 21,545 | | | 19,194 | |
| Employee advances | Employee advances | 2,636 | | | 2,797 | |
| Deposits | Deposits | 8,774 | | | 5,839 | |
| Advances to suppliers | Advances to suppliers | 2,716 | | | 804 | |
| Others | Others | 37,319 | | | 30,698 | |
| Total | Total | $ | 187,408 | | | $ | 134,441 | |
During the year ended December 31, 2022, the Company sold certain prepaid expenses and other current assets amounting to $445 and classified $901 as assets held for sale relating to a business previously classified as held for sale, the sale of which was completed in the first quarter of 2023. See Note 8 for additional information.
GENPACT LIMITED AND ITS SUBSIDIARIES
Notes to the Consolidated Financial Statements
(In thousands, except per share data and share count)
8. Assets and liabilities held for sale
During the year ended December 31, 2022, the Company took actions to realign its portfolio to focus on services it believes have the greatest opportunities for growth, and deprioritized assets that no longer fit with its long-term strategy. Pursuant to a plan approved by management in the second quarter of 2022, the Company identified and divested a business (the “Business”) that was part of the Company's Consumer and Healthcare segment.
The transaction to divest the Business included the sale of 100% of the issued and outstanding shares of capital stock of an entity pursuant to a stock purchase agreement, which was completed in the fourth quarter of 2022. It also included the sale of certain assets and liabilities pursuant to an asset purchase agreement signed during the fourth quarter of 2022. The sale of such assets was completed in the first quarter of 2023.
Pursuant to the stock purchase agreement related to the sale of the Business, the Company was entitled to a potential earn-out of up to $10,600, contingent upon the Business signing contracts with certain clients and invoicing them during 2023. The Company previously determined that the likelihood of achieving these events was uncertain, and accordingly, the Company opted to record the earn-out if and when the consideration was determined to be realizable. During the year ended December 31 2023, the Company did not receive any earn-out consideration under the stock purchase agreement as the earn-out events were not achieved. Accordingly, the Company did not record any income from earn-out consideration.
Pursuant to the asset purchase agreement signed in 2022 related to the sale of the Business, the Company now holds a 1.5% fixed rate unsecured loan note amounting to $18,001 issued by the purchasers. The Company's obligation to transfer $18,001 to the purchasers in exchange for the note was satisfied in February 2023 upon the closing of the transaction. The note and interest thereon become receivable by the Company upon a future share sale, disposal or listing by the buyer group or early voluntary repayment of the note at the discretion of the buyer group. In November 2023, the Company and the purchaser signed a supplemental deed amending the loan note. Under the supplemental deed, the redemption period was shortened to six months from the execution of the supplemental deed, and the redemption sum was reduced to $1,500. However, if the Company does not receive the payment of the redemption sum within the revised six month redemption period, the loan note will remain in full force and effect under its original terms and value without modification or amendment under the supplemental deed. The Company deems the likelihood of recovery of principal and interest on the note to be remote and not in the control of the Company. Accordingly, the Company has not recorded a value for the note.
The Company completed the sale of the Business in the first quarter of 2023, resulting in a net payout of $2,091 and a loss of $802 on the sale of the Business recorded in the year ended December 31, 2023 in addition to an impairment charge of $32,575 recorded in the year ended December 31, 2022. The loss on the sale of the Business previously classified as held for sale has been recorded in "other operating (income) expense, net" in the Company's consolidated statements of income. See Note 21 for additional information.
GENPACT LIMITED AND ITS SUBSIDIARIES
Notes to the Consolidated Financial Statements
(In thousands, except per share data and share count)
9. Property, plant and equipment, net
Property, plant and equipment, net consist of the following:
| | As of December 31, |
| 2020 | | 2021 |
| As of December 31, | | | As of December 31, |
| 2022 | | | 2022 | | 2023 |
| Land | Land | $ | 5,792 | | | $ | 7,292 | |
| Buildings | Buildings | 41,622 | | | 41,282 | |
| Furniture and fixtures | Furniture and fixtures | 52,610 | | | 52,901 | |
| Computer equipment and servers | Computer equipment and servers | 270,376 | | | 309,551 | |
| Plant, machinery and equipment | Plant, machinery and equipment | 109,722 | | | 108,527 | |
| Computer software | Computer software | 141,417 | | | 138,343 | |
| Leasehold improvements | Leasehold improvements | 126,761 | | | 114,747 | |
| Vehicles | Vehicles | 152 | | | 162 | |
| Capital work in progress | Capital work in progress | 44,011 | | | 45,647 | |
| Property, plant and equipment, gross | Property, plant and equipment, gross | $ | 792,463 | | | $ | 818,452 | |
| Less: Accumulated depreciation, amortization and impairment | Less: Accumulated depreciation, amortization and impairment | (561,341) | | | (603,363) | |
| Property, plant and equipment, net | Property, plant and equipment, net | $ | 231,122 | | | $ | 215,089 | |
Depreciation expense on property, plant and equipment for the years ended December 31, 2019, 20202021, 2022 and 20212023 was $53,332, $67,662$62,159, $54,603 and $62,159,$50,445, respectively. Computer software amortization for the years ended December 31, 2019, 20202021, 2022 and 20212023 was $14,167, $9,421$5,842, $4,703 and 5,842,$2,429, respectively.
The depreciation and amortization expenses set forth above include the effect of the reclassification of foreign exchange (gains) losses related to the effective portion of foreign currency derivative contracts, amounting to $(267)$(430), $213$306 and $(430)$(24) for the years ended December 31, 2019, 20202021, 2022 and 2021,2023, respectively.
The Company recorded a write-down to property, plant and equipment & computer software during the years ended December 31, 20202021, 2022 and 20212023 as described in Note 10.
During the year ended December 31, 2022, the Company sold certain property plant and equipment with a gross carrying value and accumulated depreciation amounting to $377 and $355, respectively. See Note 8 for additional information.
10. Goodwill and intangible assets
The following table presents the changes in goodwill for the years ended December 31, 2020 and 2021:
| | | | | | | | | | | |
| As of December 31, |
| 2020 | | 2021 |
| Opening balance | $ | 1,574,466 | | | $ | 1,695,688 | |
| Goodwill relating to acquisitions consummated during the period | 123,595 | | | 44,216 | |
| Impact of measurement period adjustments | (5,653) | | | 1,205 | |
| Effect of exchange rate fluctuations | 3,280 | | | (10,082) | |
| Closing balance | $ | 1,695,688 | | | $ | 1,731,027 | |
The following table presents the changes in goodwill by reporting unit for the year ended December 31, 2020:2022 and 2023:
| | BCMI | | CGRLH | | HMS | | Total |
| As of December 31, | | | As of December 31, |
| 2022 | | | 2022 | | 2023 |
| Opening balance | Opening balance | $ | 417,213 | | | $ | 555,130 | | | $ | 602,123 | | | $ | 1,574,466 | |
| Goodwill relating to acquisitions consummated during the period | 2,559 | | | 52,612 | | | 68,424 | | | 123,595 | |
| Impact of measurement period adjustments | Impact of measurement period adjustments | (542) | | | (1,372) | | | (3,739) | | | (5,653) | |
| Classified as held for sale | |
| Effect of exchange rate fluctuations | Effect of exchange rate fluctuations | 942 | | | 1,204 | | | 1,134 | | | 3,280 | |
| Closing balance | Closing balance | $ | 420,172 | | | $ | 607,574 | | | $ | 667,942 | | | $ | 1,695,688 | |
GENPACT LIMITED AND ITS SUBSIDIARIES
Notes to the Consolidated Financial Statements
(In thousands, except per share data and share count)
10. Goodwill and intangible assets (Continued)
The following table presents the changes in goodwill by reporting unit for the year ended December 31, 2021:2022:
| | BCMI | | CGRLH | | HMS | | Total |
| Financial Services | | | Financial Services | | Consumer and Healthcare | | High Tech and Manufacturing | | Total |
| Opening balance | Opening balance | $ | 420,172 | | | $ | 607,574 | | | $ | 667,942 | | | $ | 1,695,688 | |
| Goodwill relating to acquisitions consummated during the period | 4,167 | | | 7,032 | | | 33,017 | | | 44,216 | |
| Impact of measurement period adjustments | Impact of measurement period adjustments | 35 | | | 309 | | | 861 | | | 1,205 | |
| Classified as held for sale | |
| Effect of exchange rate fluctuations | Effect of exchange rate fluctuations | (3,117) | | | (3,795) | | | (3,170) | | | (10,082) | |
| Closing balance | Closing balance | $ | 421,257 | | | $ | 611,120 | | | $ | 698,650 | | | $ | 1,731,027 | |
The following table presents the changes in goodwill by reporting unit for the year ended December 31, 2023:
| | | | | | | | | | | | | | | | | | | | | | | |
| Financial Services | | Consumer and Healthcare | | High Tech and Manufacturing | | Total |
| Opening balance | $ | 408,736 | | | $ | 592,907 | | | $ | 682,553 | | | $ | 1,684,196 | |
| Effect of exchange rate fluctuations | (62) | | | (127) | | | (225) | | | (414) | |
| Closing balance | $ | 408,674 | | | $ | 592,780 | | | $ | 682,328 | | | $ | 1,683,782 | |
During the years ended December 31, 20202021, 2022 and 2021,2023, in accordance with ASC 350, Intangibles-Goodwill and Other, the Company performed an assessmentassessments to determine whether events or circumstances exist that may lead to a determination that it is more likely than not that the fair value of a reporting unit is less than its carrying amount. Based on such assessment, as ofassessments for the years ended December 31, 20202021, 2022 and 2021,2023, the Company concluded that it is not more likely than not that the fair values of any of the Company’s reporting units are less than their carrying amounts.
As of December 31, 2022, the Company classified goodwill (before impairment) amounting to $1,625 attributable to its Consumer and Healthcare segment as assets held for sale, and this amount was written off in the year ended December 31, 2022. See Note 8 for additional information.
The total amount of the Company’s goodwill deductible for income tax purposes was $296,046$291,377 and $326,795$263,910 as of December 31, 20202022 and 2021,2023, respectively.
The Company’s intangible assets are as follows:
| | As of December 31, 2020 | | As of December 31, 2021 |
| Gross carrying amount | | Accumulated amortization & Impairment | | Net | | Gross carrying amount | | Accumulated amortization & Impairment | | Net |
| As of December 31, 2022 | | | As of December 31, 2022 | | As of December 31, 2023 |
| Gross carrying amount | | | Gross carrying amount | | Accumulated amortization & Impairment | | Net | | Gross carrying amount | | Accumulated amortization & Impairment | | Net |
| Customer-related intangible assets | Customer-related intangible assets | $ | 478,189 | | | $ | 359,652 | | | $ | 118,537 | | | $ | 489,974 | | | $ | 394,688 | | | $ | 95,286 | |
| Marketing-related intangible assets | Marketing-related intangible assets | 96,561 | | | 61,154 | | | 35,407 | | | 98,870 | | | 76,663 | | | 22,207 | |
| Technology-related intangible assets | Technology-related intangible assets | 152,293 | | | 90,866 | | | 61,427 | | | 171,772 | | | 119,630 | | | 52,142 | |
| Intangible assets under development | 23,864 | | | 2,503 | | | 21,361 | | | — | | | — | | | — | |
| Total | Total | $ | 750,907 | | | $ | 514,175 | | | $ | 236,732 | | | $ | 760,616 | | | $ | 590,981 | | | $ | 169,635 | |
Amortization expenses for intangible assets acquired as part of a business combination and disclosed in the consolidated statements of income under amortization of acquired intangible assets for the years ended December 31, 2019, 20202021, 2022 and 20212023 were $32,612, $43,343$58,448, $42,667 and $58,448,$31,463, respectively.
GENPACT LIMITED AND ITS SUBSIDIARIES
Notes to the Consolidated Financial Statements
(In thousands, except per share data and share count)
10. Goodwill and intangible assets (Continued)
During the year ended December 31, 2022, the Company sold certain intangible assets with a gross carrying value and accumulated amortization amounting to $9,894 and $7,272, respectively, and classified certain intangible assets with a gross carrying value and accumulated amortization amounting to $40,538 and $16,989, respectively, as assets held for sale relating to the Business, the sale of which was completed in the first quarter of 2023. See Note 8 for additional information.
Amortization expenses for internally-developed and other intangible assets disclosed in the consolidated statements of income under cost of revenue and selling, general and administrative expenses for the years ended December 31, 2019, 20202021, 2022 and 20212023 were $18,957, $27,290$24,987, $14,768 and $24,987,$8,571, respectively.
Amortization expenses for the technology-related, internally-developed intangible assets set forth above include the effect of the reclassification of foreign exchange (gains) losses related to the effective portion of foreign currency derivative contracts, amounting to $(76)$(157), $74$51 and $(157)$(4) for the years ended December 31, 2019, 20202021, 2022 and 2021,2023, respectively.
During the years ended December 31, 2019, 20202021, 2022 and 2021,2023, the Company tested for recoverability certain customer-related and technology-related intangible assets, including those under development, goodwill and certain property, plant and equipment, including those held for sale as a result of changes in market trends and the Company’s investment strategy, and market trends which led to aincluding the Company's decision to cease certain service offerings. Also see Note 8 for additional information. Based on the results of itsthis testing, the Company determined that the carrying valuevalues of certainthe assets tested were not recoverable, and the Company recorded complete write-downs of the carrying values of these assets amounting to $3,511, $14,083$915, $29,173 and $915$0 for the years ended December 31, 2019, 20202021, 2022 and 2021,2023, respectively. These write-downs have been recorded in “other“other operating (income) expense, net”net” in the consolidated statements of income.
The summary below presents the impairment charges (on intangibles and goodwill) and write-downs (on property, plant and equipment) recorded for various categories of assets during the years ended December 31, 2021, 2022 and 2023:
| | | | | | | | | | | | | | | | | | | | |
| | Year ended December 31, |
| | 2021 | | 2022 | | 2023 |
| Technology related intangible assets | | $ | 205 | | | $ | 25,266 | | | $ | — | |
| Customer related intangible assets | | $ | — | | | $ | 905 | | | $ | — | |
| Goodwill | | $ | — | | | $ | 1,625 | | | $ | — | |
| Total intangible assets and goodwill | | $ | 205 | | | $ | 27,796 | | | $ | — | |
| Property, plant and equipment | | $ | 710 | | | $ | 1,377 | | | $ | — | |
| Total property, plant and equipment | | $ | 710 | | | $ | 1,377 | | | $ | — | |
| Total impairment and write-down | | $ | 915 | | | $ | 29,173 | | | $ | — | |
The estimated amortization schedule for the Company’s intangible assets for future periods as of December 31, 2023 is set out below:
| | | | | |
| For the year ending December 31: | |
| 2024 | 28,276 | |
| 2025 | 18,152 | |
| 2026 | 3,895 | |
| 2027 | 2,705 | |
| Total | $ | 53,028 | |
GENPACT LIMITED AND ITS SUBSIDIARIES
Notes to the Consolidated Financial Statements
(In thousands, except per share data and share count)
10. Goodwill and intangible assets (Continued)
The summary below represents the impairment charges recorded for various categories of assets during the years ended December 31, 2019, 2020 and 2021:
| | | | | | | | | | | | | | | | | | | | |
| | Year ended December 31, |
| | 2019 | | 2020 | | 2021 |
| Technology related intangibles | | $ | 3,511 | | | $ | 5,179 | | | $ | 205 | |
| Customer related intangibles | | — | | | 938 | | | — | |
| Total Intangibles | | $ | 3,511 | | | $ | 6,117 | | | $ | 205 | |
| Property, plant and equipment | | $ | — | | | $ | 7,966 | | | $ | 710 | |
| Total Property, plant and equipment | | $ | — | | | $ | 7,966 | | | $ | 710 | |
| Grand Total | | $ | 3,511 | | | $ | 14,083 | | | $ | 915 | |
The estimated amortization schedule for the Company’s intangible assets for future periods is set out below:
| | | | | |
| For the year ending December 31: | |
| 2022 | $ | 63,620 | |
| 2023 | 48,718 | |
| 2024 | 32,938 | |
| 2025 | 19,527 | |
| 2026 and beyond | 4,832 | |
| Total | $ | 169,635 | |
11. Other Assets
Other assets consist of the following:
| | | | | | | | | | | |
| As of December 31, |
| 2020 | | 2021 |
| Contract asset (Note 25) | $ | 6,770 | | | $ | 5,235 | |
| Advance income and non-income taxes | 155,035 | | | 124,219 | |
| Deposits | 32,058 | | | 28,463 | |
| Derivative instruments | 6,164 | | | 14,876 | |
| Prepaid expenses | 5,176 | | | 5,979 | |
| Deferred billings, net* | 25,357 | | | 44,360 | |
| Right of use (ROU) assets finance lease | 50,083 | | | 34,284 | |
| Others | 43,175 | | | 64,742 | |
| Total | $ | 323,818 | | | $ | 322,158 | |
| | | | | | | | | | | |
| As of December 31, |
| 2022 | | 2023 |
| Contract asset (Note 25) | $ | 6,734 | | | $ | 15,916 | |
| Advance income and non-income taxes | 126,172 | | | 94,651 | |
| Deposits | 22,524 | | | 22,755 | |
| Derivative instruments | 2,005 | | | 3,251 | |
| Prepaid expenses | 6,354 | | | 3,775 | |
| Deferred billings, net* | 61,537 | | | 85,998 | |
| Right of use (ROU) assets finance lease | 26,358 | | | 17,766 | |
| Others | 52,450 | | | 55,848 | |
| Total | $ | 304,134 | | | $ | 299,960 | |
*Deferred billings were $28,491$64,735 and $48,071$90,094 and allowances for credit losses on deferred billings were $3,134$3,198 and $3,711,$4,096, resulting in net deferred billings balances of $25,357$61,537 and $44,360$85,998 as of December 31, 20202022 and 2021,2023, respectively.
Total credit losses on deferred billings of $3,134 as ofDuring the years ended December 31, 2020 includes $734 as2021 and 2023, the Company recorded additional charges of $577 and $898, respectively, and a transition date adjustment through retained earnings pursuant to the adoptionrelease of ASC 326 and $2,400 as a charge for$513 during the year ended December 31, 2020. During2022 in the year ended December 31, 2021, the Company recorded an additional charge of $577 to cost and expenseincome statement on account of credit losses on deferred billings.
GENPACT LIMITED AND ITS SUBSIDIARIES
NotesDuring the year ended December 31, 2022, the Company sold certain other assets amounting to $0 and classified $1,765 as assets held for sale relating to the Consolidated Financial StatementsBusiness, the sale of which was completed in the first quarter of 2023. See Note 8 for additional information.
(In thousands, except per share data and share count)
12. Leases
The Company has leased buildings, vehicles, furniture and fixtures, leased lines, computer equipment and servers from various lessors. Certain lease agreements include options to terminate or extendextend the leases for up to 10 years. The lease agreements do not contain any material residual value guarantees or material restrictive covenants.
The components of lease cost for operating and finance leases for the years ended December 31, 2019, 20202021, 2022 and 20212023 are summarized below:
| | Year ended December 31, 2019 | Year ended December 31, 2020 | Year ended December 31, 2021 |
| Year ended December 31, 2021 | | | Year ended December 31, 2021 | Year ended December 31, 2022 | Year ended December 31, 2023 |
| Finance lease cost: | Finance lease cost: | | |
| Amortization of ROU assets (Note a) | |
| Amortization of ROU assets (Note a) | |
| Amortization of ROU assets (Note a) | Amortization of ROU assets (Note a) | 9,302 | | 12,483 | | 15,549 | |
| Interest on lease liabilities (Note b) | Interest on lease liabilities (Note b) | 2,997 | | 2,454 | | 2,538 | |
| Operating lease cost (Note c) | Operating lease cost (Note c) | 74,436 | | 88,596 | | 81,637 | |
| Short-term lease cost (Note c) | Short-term lease cost (Note c) | 438 | | 1,643 | | 1,057 | |
| Variable lease cost (Note c) | Variable lease cost (Note c) | 4,052 | | 5,347 | | 5,307 | |
| Total lease cost | Total lease cost | $ | 91,225 | | $ | 110,523 | | $ | 106,088 | |
a)Included in “depreciation and amortization” in the consolidated statements of income.
b)Included in “interest income (expense), net” in the consolidated statements of income.
c)Included in “cost of revenue” and “selling, general and administrative expenses” in the consolidated statements of income.
ROU assets relating to finance leases of $50,083$26,358 and $34,284$17,766 as of December 31, 20202022 and December 31, 2021,2023, respectively, are included in “other assets.” in the consolidated balance sheets.
GENPACT LIMITED AND ITS SUBSIDIARIES
Notes to the Consolidated Financial Statements
(In thousands, except per share data and share count)
12. Leases (Continued)
Amortization of ROU assets as set out above includes the effect of the reclassification of foreign exchange (gains) losses related to the effective portion of foreign currency derivative contracts amounting to $(99), $71 and $(3) for the years ended December 31, 2021, 2022 and 2023, respectively.
The operating lease cost set out above includes the effect of the reclassification of foreign exchange (gains) losses related to the effective portion of foreign currency derivative contracts amounting to $(105)$(333), $161$187 and $(333)$(74) for the years ended December 31, 2019, 20202021, 2022 and 2021,2023, respectively.
Other information
| | Year ended December 31, 2019 | Year ended December 31, 2020 | Year ended December 31, 2021 |
| Year ended December 31, 2021 | | | Year ended December 31, 2021 | Year ended December 31, 2022 | Year ended December 31, 2023 |
| Weighted-average remaining lease term—finance leases | Weighted-average remaining lease term—finance leases | 3.9 years | 3.1 years | 2.34 years | Weighted-average remaining lease term—finance leases | 2.3 years | 2.02 years | 1.91 years |
| Weighted-average remaining lease term—operating leases | Weighted-average remaining lease term—operating leases | 6.77 years | 6.42 years | 5.76 years | Weighted-average remaining lease term—operating leases | 5.76 years | 5.41 years | 5.06 years |
| Weighted-average discount rate—finance leases | Weighted-average discount rate—finance leases | 9.20 | % | 6.61 | % | 5.70 | % | Weighted-average discount rate—finance leases | 5.70 | % | 5.72 | % | 6.54 | % |
| Weighted-average discount rate—operating leases | Weighted-average discount rate—operating leases | 6.87 | % | 7.28 | % | 6.98 | % | Weighted-average discount rate—operating leases | 6.98 | % | 7.80 | % | 8.33 | % |
| | | | | | | | | | | |
| Year ended December 31, 2021 | Year ended December 31, 2022 | Year ended December 31, 2023 |
| Cash paid for amounts included in the measurement of lease liabilities | | | |
| Operating cash outflows for finance leases | $ | 2,592 | | $ | 1,532 | | $ | 1,332 | |
| Operating cash outflows for operating leases | $ | 80,159 | | $ | 79,037 | | $ | 70,176 | |
| Financing cash outflows for finance leases | $ | 13,926 | | $ | 12,810 | | $ | 12,165 | |
The following table reconciles the undiscounted cash flows for the Company’s operating and finance leases as of December 31, 2022 to the finance and operating lease liabilities recorded on the Company’s consolidated balance sheets:
| | | | | | | | | | | |
| Period range | Finance lease | | Operating lease |
| 2023 | $ | 16,382 | | | $ | 69,902 | |
| 2024 | 8,681 | | | 61,017 | |
| 2025 | 3,000 | | | 46,979 | |
| 2026 | 830 | | | 40,638 | |
| 2027 | 119 | | | 30,100 | |
| Thereafter | — | | | 52,466 | |
| Total lease payments | $ | 29,012 | | | $ | 301,102 | |
| Less: Imputed interest | 1,625 | | | 56,641 | |
| Total lease liabilities | $ | 27,387 | | | $ | 244,461 | |
| | | | | | | | | | | |
| Year ended December 31, 2019 | Year ended December 31, 2020 | Year ended December 31, 2021 |
| Cash paid for amounts included in the measurement of lease liabilities | | | |
| Operating cash flows from finance leases | $ | 2,859 | | $ | 2,898 | | $ | 2,592 | |
| Operating cash flows from operating leases | $ | 72,645 | | $ | 92,010 | | $ | 80,159 | |
| Financing cash flows from finance leases | $ | 7,380 | | $ | 10,567 | | $ | 13,926 | |
GENPACT LIMITED AND ITS SUBSIDIARIES
Notes to the Consolidated Financial Statements
(In thousands, except per share data and share count)
12. Leases (Continued)
The following table reconciles the undiscounted cash flows for the Company’s operating and finance leases as of December 31, 20212023 to the operating and finance lease liabilities recorded on the Company’s consolidated balance sheet:sheets:
| | Period range | Period range | Finance lease | | Operating lease | Period range | Finance lease | | Operating lease |
| 2022 | $ | 20,008 | | | $ | 80,226 | |
| 2023 | 10,178 | | | 73,374 | |
| 2024 | 2024 | 5,105 | | | 62,132 | |
| 2025 | 2025 | 2,062 | | | 64,383 | |
| 2026 | 2026 | 34 | | | 37,131 | |
| 2027 | |
| 2028 | |
| Thereafter | Thereafter | — | | | 66,004 | |
| Total lease payments | Total lease payments | $ | 37,387 | | | $ | 383,250 | |
| Less: Imputed interest | Less: Imputed interest | 2,541 | | | 73,952 | |
| Total lease liabilities | Total lease liabilities | $ | 34,846 | | | $ | 309,298 | |
The following table reconciles the undiscounted cash flows for the Company’s operating and finance leases as of December 31, 2020 to the operating and finance lease liabilities recorded on the Company’s consolidated balance sheet:
| | | | | | | | | | | |
| Period range | Finance lease | | Operating lease |
| 2021 | $ | 19,584 | | | $ | 78,148 | |
| 2022 | 17,165 | | | 75,288 | |
| 2023 | 10,081 | | | 66,790 | |
| 2024 | 3,876 | | | 56,013 | |
| 2025 | 1,000 | | | 43,696 | |
| Thereafter | — | | | 117,580 | |
| Total lease payments | $ | 51,706 | | | $ | 437,515 | |
| Less: Imputed interest | 2,682 | | | 91,673 | |
| Total lease liabilities | $ | 49,024 | | | $ | 345,842 | |
During the yearyears ended December 31, 2020,2021, 2022 and 2023, the Company recorded an impairment chargecharges of $16,322$0, $20,307 and $0, respectively, relating to operating lease right-of-use assets due to the Company’s shift to a virtual operating environment. There were no corresponding impairment charges during the years ended December 31, 2019 and 2021. Of the totalThe impairment charge recorded in 2022 was classified as restructuring charges during the year ended December 31, 2020, $8,482 pertains to restructuring charges.2022. See Note 2827 for additional details.
13. Accrued expenses and other current liabilities
Accrued expenses and other current liabilities consist of the following:
| | | | | | | | | | | |
| As of December 31, |
| 2022 | | 2023 |
| Accrued expenses | $ | 126,680 | | | $ | 165,378 | |
| Accrued employee cost | 293,934 | | | 322,601 | |
| Earn-out consideration | 2,517 | | | — | |
| Statutory liabilities | 82,912 | | | 76,022 | |
| Retirement benefits | 1,725 | | | 2,386 | |
| Compensated absences | 25,101 | | | 29,779 | |
| Derivative instruments | 35,157 | | | 8,109 | |
| Contract liabilities (Note 25) | 160,625 | | | 112,435 | |
| Finance lease liability | 15,585 | | | 10,837 | |
| Others | 46,771 | | | 31,633 | |
| Total | $ | 791,007 | | | $ | 759,180 | |
During the year ended December 31, 2022, the Company sold certain accrued expense and other current liabilities amounting to $4,853 and classified $1,147 as liabilities held for sale relating to the Business, the sale of which was completed in the first quarter of 2023. See Note 8 for additional information.
GENPACT LIMITED AND ITS SUBSIDIARIES
Notes to the Consolidated Financial Statements
(In thousands, except per share data and share count)
13. Accrued expenses14. Long-term debt
In December 2022, the Company amended its existing credit facility under its amended and restated credit agreement entered into in August 2018 (the "2018 Credit Agreement”), which was comprised of a $680,000 term loan and a $500,000 revolving credit facility, and entered into an amended and restated credit agreement (the "2022 Credit Agreement") with Genpact USA, Inc. (“Genpact USA”), Genpact Global Holdings (Bermuda) Limited (“GGH”) and Genpact Luxembourg S.à r.l. (“Genpact Luxembourg”, and together with Genpact USA and GGH, the “Borrowers”), as borrowers, Wells Fargo Bank, National Association (“Wells Fargo”), as administrative agent, swingline lender and issuing bank, and the lenders and other current liabilitiesparties thereto, which is comprised of a $530,000 term loan and a $650,000 revolving credit facility. The 2022 Credit Agreement, which is guaranteed by the Company and certain of its subsidiaries, replaced the 2018 Credit Agreement. The obligations under the 2022 Credit Agreement are unsecured.
Accrued expenses and other current liabilities consistThe outstanding balance of the following:term loan under the 2018 Credit Agreement as of the date of the 2022 Credit Agreement was $527,000. The revolving credit facility and the term loan have a term of five years and expire on December 13, 2027. The 2022 Credit Agreement did not result in a substantial modification of $290,870 of the outstanding term loan under the 2018 Credit Agreement. Further, as a result of the 2022 Credit Agreement, the Company extinguished $236,130 of funding arrangements for the outstanding term loan under the 2018 Credit Agreement and obtained funding from new lenders of $239,130, resulting in outstanding principal of $530,000 of the term loan under the 2022 Credit Agreement.
| | | | | | | | | | | |
| As of December 31, |
| 2020 | | 2021 |
| Accrued expenses | $ | 150,390 | | | $ | 162,054 | |
| Accrued employee cost | 286,399 | | | 307,777 | |
| Earn-out consideration | 2,651 | | | 2,501 | |
| Statutory liabilities | 104,768 | | | 67,948 | |
| Retirement benefits | 1,967 | | | 1,746 | |
| Compensated absences | 28,635 | | | 26,596 | |
| Derivative instruments | 20,172 | | | 12,498 | |
| Contract liabilities (Note 25) | 154,717 | | | 160,602 | |
| Finance lease liability | 18,066 | | | 18,549 | |
| Others | 39,004 | | | 31,169 | |
| Total | $ | 806,769 | | | $ | 791,440 | |
14. Long-termIn connection with the 2022 Credit Agreement, the Company expensed $126, representing partial acceleration of the amortization of the existing unamortized debt issuance costs and an additional fee paid to the Company’s lenders related to the term loan. The overall borrowing capacity under the revolving credit facility increased from $500,000 under the 2018 Credit Agreement to $650,000 under the 2022 Credit Agreement. In connection with the 2022 Credit Agreement, the Company expensed $93 relating to existing unamortized debt issuance cost. The remaining unamortized costs and an additional third-party fee paid in connection with the 2022 Credit Agreement will be amortized over the term of the amended facility.
Borrowings under the Company's credit facility, which was amended in August 2018,2022 Credit Agreement bear interest at a rate equal to, at the election of the Company, either LIBORAdjusted Term SOFR (which is the rate per annum equal to (a) Term SOFR (the forward-looking secured overnight financing rate) plus (b) a Term SOFR Adjustment of 0.10% per annum, but in no case lower than 0.00%) plus an applicable margin equal to 1.375% per annum or a base rate plus an applicable margin equal to 0.375% per annum, in each case subject to adjustment based on the Company’sBorrowers' debt ratings provided by Standard & Poor’s Rating Services and Moody’s Investors Service, Inc. Based(the "Debt Ratings"). The revolving credit commitments under the 2022 Credit Agreement are subject to a commitment fee equal to 0.20% per annum, subject to adjustment based on the Company’s electionDebt Ratings. The commitment fee accrues on the actual daily amount by which the aggregate revolving commitments exceed the sum of outstanding revolving loans and currentletter of credit rating, the applicable interest rate is equal to LIBOR plus 1.375% per annum. obligations.
The amended credit agreement2022 Credit Agreement restricts certain payments, including dividend payments, if there is an event of default under the credit agreement2022 Credit Agreement or if the Company is not, or after making the payment would not be, in compliance with certain financial covenants contained in the amended credit agreement.2022 Credit Agreement. These covenants require the Company to maintain a net debt to EBITDA leverage ratio of belowless than 3x and an interest coverage ratio of more than 3x. During the year ended December 31, 2021,2023, the Company was in compliance with the terms of the credit agreement,2022 Credit Agreement, including all of the financial covenants therein. The Company’s retained earnings are not subject to any restrictions on availability to make dividend payments to shareholders, subject to compliance with the financial covenants described above that are contained in the amended credit agreement.2022 Credit Agreement.
As of December 31, 20202022 and 2021,2023, the amount outstanding under the Company's term loan, net of debt amortization expense of $1,150$1,622 and $687, respectively,$1,258, was $593,850$528,378 and $560,313,$508,867, respectively.
As of December 31, 2020 and 2021, the term loan bore interest at a rate equal to LIBOR plus a margin of 1.375% per annum. Indebtedness under the amended facility2022 Credit Agreement is unsecured. The amount outstanding on the term loan as of December 31, 20212023 requires quarterly payments of $8,500,$6,625, and the balance of the loan is due and payable upon the maturity of the term loan on August 8, 2023.
The maturity profile of the term loan outstanding as of December 31, 2021, net of debt amortization expense, is as follows:
| | | | | | | | |
| Year ended | | Amount |
| 2022 | | 33,564 | |
| 2023 | | 526,749 | |
| Total | | $ | 560,313 | |
GENPACT LIMITED AND ITS SUBSIDIARIES
Notes to the Consolidated Financial Statements
(In thousands, except per share data and share count)
14. Long-term debt (Continued)
The maturity profile of the term loan outstanding as of December 31, 2023, net of debt amortization expense, is as follows:
| | | | | | | | |
| Year ended | | Amount |
| 2024 | | 32,778 | |
| 2025 | | 26,173 | |
| 2026 | | 26,192 | |
| 2027 | | 423,724 | |
| Total | | $ | 508,867 | |
Genpact Luxembourg, S.à r.l., a wholly-owned subsidiary of the Company, issued $350,000 aggregate principal amount of 3.70% senior notes in March 2017 (the “2017 Senior Notes”) and $400,000 aggregate principal amount of 3.375% senior notes in November 2019 (the “2019 Senior Notes” and together with the 2021 Senior Notes, the “Senior Notes”). The 2017 Senior Notes and 2019 Senior Notes are fully guaranteed by the Company. The total debt issuance costscost of $2,642 and $2,937 incurred in connection with the 2017 Senior Notes and 2019 Senior Notes offerings, respectively, areoffering is being amortized over the liveslife of the respective notes2019 Senior Notes as an
additional interest expense.
As of December 31, 20202022 and 2021, the amount outstanding under the 2017 Senior Notes, net of debt amortization expense of $658 and $131, respectively, was $349,342 and $349,869, respectively, which is payable on April 1, 2022. As of December 31, 2020 and 2021,2023, the amount outstanding under the 2019 Senior Notes, net of debt amortization expense of $2,284$1,119 and $1,702, respectively,$536, was $397,716$398,881 and $398,298,$399,464, respectively, which is payable on December 1, 2024.
In March 2021, Genpact Luxembourg S.à r.l. and Genpact USA, Inc., both wholly-owned subsidiaries of the Company, co-issued $350,000 aggregate principal amount of 1.750% senior notes (the “2021 Senior Notes,” and together with the 2017 Senior Notes and the 2019 Senior Notes, the “Senior Notes”).notes. The 2021 Senior Notes are fully guaranteed by the Company. The total debt issuance cost of $3,032 incurred in connection with the 2021 Senior Notes is being amortized over the life of the 2021 Senior Notes as additional interest expense. As of December 31, 2021,2022 and 2023, the amount outstanding under the 2021 Senior Notes, net of debt amortization expense of $2,571,$1,970 and $1,369, respectively, was $347,429,$348,030 and $348,631, respectively, which is payable on April 10, 2026.
The Company pays interest on (i) the 2017 Senior Notes semi-annually in arrears on April 1 and October 1 of each year, (ii) the 2019 Senior Notes semi-annually in arrears on June 1 and December 1 of each year, and (iii)(ii) the 2021 Senior Notes semi-annually in arrears on April 10 and October 10 of each year, ending on the maturity dates of April 1, 2022, December 1, 2024 and April 10, 2026, respectively. The Company, at its option, may redeem the Senior Notes at any time in whole or in part, at a redemption price equal to (i) 100% of the principal amount of the notes redeemed, together with accrued and unpaid interest on the redeemed amount, and (ii) if the notes are redeemed prior to, in the case of the 2017 Senior Notes, March 1, 2022, in the case of the 2019 Senior Notes, November 1, 2024, and in the case of the 2021 Senior Notes, March 10, 2026, a specified “make-whole” premium. The Senior Notes are subject to certain customary covenants, including limitations on the ability of the Company and certain of its subsidiaries to incur debt secured by liens, engage in certain sale and leaseback transactions and consolidate, merge, convey or transfer their assets substantially as an entirety. During the year ended December 31, 2021,2022, the Company and its applicable subsidiaries were in compliance with the covenants. Upon certain change of control transactions, the applicable issuer or issuers will be required to make an offer to repurchase the Senior Notes at a price equal to 101% of the aggregate principal amount of the Senior Notes, plus accrued and unpaid interest. The interest rate payable on the Senior Notes is subject to adjustment if the credit rating of the Senior Notes is downgraded, up to a maximum increase of 2.0%.
A summary of the Company’s long-term debt is as follows:
| | | | | | | | | | | |
| As of December 31, |
| 2020 | | 2021 |
| Credit facility, net of debt amortization expenses | $ | 593,850 | | | $ | 560,313 | |
| 3.70% 2017 Senior Notes, net of debt amortization expenses | 349,342 | | | 349,869 | |
| 3.375% 2019 Senior Notes, net of debt amortization expenses | 397,716 | | | 398,298 | |
| 1.750% 2021 Senior Notes, net of debt amortization expenses | $ | — | | | $ | 347,429 | |
| Total | $ | 1,340,908 | | | $ | 1,655,909 | |
| Current portion | 33,537 | | | 383,433 | |
| Non-current portion | 1,307,371 | | | 1,272,476 | |
| Total | $ | 1,340,908 | | | $ | 1,655,909 | |
GENPACT LIMITED AND ITS SUBSIDIARIES
Notes to the Consolidated Financial Statements
(In thousands, except per share data and share count)
14. Long-term debt (Continued)
A summary of the Company’s long-term debt is as follows:
| | | | | | | | | | | |
| As of December 31, |
| 2022 | | 2023 |
| Credit facility, net of debt amortization expenses | $ | 528,378 | | | $ | 508,867 | |
| 3.375% 2019 Senior Notes, net of debt amortization expenses | 398,881 | | | 399,464 | |
| 1.750% 2021 Senior Notes, net of debt amortization expenses | $ | 348,030 | | | $ | 348,631 | |
| Total | $ | 1,275,289 | | | $ | 1,256,962 | |
| Current portion | 26,136 | | | 432,242 | |
| Non-current portion | 1,249,153 | | | 824,720 | |
| Total | $ | 1,275,289 | | | $ | 1,256,962 | |
15. Short-term borrowings
The Company has the following borrowing facilities:
(a)Fund-based and non-fund-based credit facilities with banks, which are available for operational requirements in the form of overdrafts, letters of credit, guarantees and short-term loans. As of December 31, 20202022 and 2021,2023, the limits available were $14,311$22,882 and $24,727,$23,302, respectively, of which $7,809$5,392 and $5,848,$9,336, respectively, was utilized, constituting non-funded drawdown.
(b)A fund-based and non-fund based revolving credit facility of $500,000,$650,000, which the Company obtained through an amendment of its existing credit agreementby entering into the 2022 Credit Agreement on August 9, 2018, as described in note 14. Prior to the amendment, the Company’sDecember 13, 2022. The term loan and revolving credit facility was $350,000. The amended credit facility expires on August 8, 2023. The funded drawdown amount under the Company’s revolving facilities bore2022 Credit Agreement expire on December 13, 2027.
(c)Borrowings under the 2022 Credit Agreement bear interest at a rate equal to, LIBORat the election of the Company, either Adjusted Term SOFR (which is the rate per annum equal to (a) Term SOFR (the forward-looking secured overnight financing rate) plus (b) a Term SOFR Adjustment of 0.10% per annum, but in no case lower than 0.0%) plus an applicable margin ofequal to 1.375% as of December 31, 2020 and 2021.per annum or a base rate plus an applicable margin equal to 0.375% per annum. The unutilized amount on the revolving credit facilities under the 2018 Credit Agreement and the 2022 Credit Agreement bore a commitment fee of 0.20% as of December 31, 20202022 and 2021.2023. As of December 31, 20202022 and 2021,2023, a total of $252,347$153,658 and $2,017,$11,627, respectively, was utilized, of which $250,000$151,000 and $0,$10,000, respectively, constituted funded drawdown and $2,347$2,658 and $2,017,$1,627, respectively, constituted non-funded drawdown. The Company’s amended credit agreement2022 Credit Agreement contains certain customary covenants, including a maximum leverage covenant and a minimum interest coverage ratio. During the year ended December 31, 2021,2023, the Company was in compliance with the financial covenants of the credit agreement. 2022 Credit Agreement.
16. Other liabilities
Other liabilities consist of the following: | | As of December 31, |
| 2020 | | 2021 |
| As of December 31, | | | As of December 31, |
| 2022 | | | 2022 | | 2023 |
| Accrued employee cost | Accrued employee cost | 19,797 | | | 15,790 | |
| Earn-out consideration | 5,621 | | | 2,905 | |
| Retirement benefits | Retirement benefits | 11,947 | | | 11,993 | |
| Compensated absences | Compensated absences | 47,656 | | | 52,023 | |
| Derivative instruments | Derivative instruments | 20,809 | | | 2,756 | |
| Contract liabilities (Note 25) | Contract liabilities (Note 25) | 68,760 | | | 80,222 | |
| Finance lease liability | Finance lease liability | 30,958 | | | 16,297 | |
| Others | Others | 32,850 | | | 63,224 | |
| Total | Total | $ | 238,398 | | | $ | 245,210 | |
During the year ended December 31, 2022, the Company sold certain other liabilities amounting to $0 and classified $141 as liabilities held for sale relating to the Business, the sale of which was completed in the first quarter of 2023. See Note 8 for additional information.
GENPACT LIMITED AND ITS SUBSIDIARIES
Notes to the Consolidated Financial Statements
(In thousands, except per share data and share count)
17. Employee benefit plans
The Company has employee benefit plans in the form of certain statutory and other programs covering its employees.
Defined benefit plans
In accordance with Indian law, the Company provides a defined benefit retirement plan (the “Gratuity Plan”) covering substantially all of its Indian employees. The Gratuity Plan provides a lump-sum payment to vested employees upon retirement or termination of employment in an amount based on each employee’s salary and duration of employment with the Company. The Gratuity Plan benefit cost for the year is calculated on an actuarial basis. The Company contributes the required funding for all ascertained liabilities to the Gratuity Plan. Trustees administer contributions made to the trust, and contributions are invested in specific designated instruments as permitted by Indian law. The Company’s overall investment strategy is to invest predominantly in fixed income funds managed by asset management companies and a small portion in equity funds. These funds further invest in debt securities such as money market instruments, government securities and public and private bonds. During the years ended December 31, 2019, 20202022 and 2021,2023, all of the plan assets were primarily invested in debt securities.
In addition, in accordance with Mexican law, the Company provides certain termination benefits (the “Mexican Plan”) to all of its Mexican employees based on the age, duration of service and salary of each eligible employee. The full-year benefit cost of the Mexican Plan is calculated on an actuarial basis.
GENPACT LIMITED AND ITS SUBSIDIARIES
Notes to the Consolidated Financial Statements
(In thousands, except per share data and share count)
17. Employee benefit plans (Continued)
In addition, certain of the Company’s subsidiaries organized or operating in the Philippines and Japan have sponsored defined benefit retirement programs (respectively, the “Philippines Plan” and the “Japan Plan”). The full-year benefit costs of the Philippines Plan and the Japan Plan are calculated on an actuarial basis. Company contributions in respect of these plans are made to insurer-managed funds or to a trust. The trust contributions are further invested in government bonds.
In addition, in accordance with Israeli law, the Company provides certain termination benefits (the “Israeli Plan”) to all of its Israeli employees based on the age, duration of service and salary of each eligible employee. The full-year benefit cost of the Israeli Plan is calculated on an actuarial basis. The plan contributions are further invested into insurer managed funds.
Current service costs for defined benefit plans are accrued in the year to which they relate on a monthly basis. Actuarial gains or losses, or prior service costs, if any, resulting from amendments to the plans are recognized and amortized over the remaining period of service of the employees or over the average remaining life expectancies for inactive employees if most of the plan obligations are payable to inactive employees.
GENPACT LIMITED AND ITS SUBSIDIARIES
Notes to the Consolidated Financial Statements
(In thousands, except per share data and share count)
17. Employee benefit plans (Continued)
The following table sets forth the funded status of the Company’s defined benefit plans and the amounts recognized in the Company’s financial statements based on actuarial valuations carried out as of December 31, 20202022 and 2021.2023.
| | As of December 31, |
| 2020 | | 2021 |
| As of December 31, | | | As of December 31, |
| 2022 | | | 2022 | | 2023 |
| Change in benefit obligation | Change in benefit obligation | | | |
| Projected benefit obligation at the beginning of the year | Projected benefit obligation at the beginning of the year | $ | 80,561 | | | $ | 97,660 | |
| Projected benefit obligation at the beginning of the year | |
| Projected benefit obligation at the beginning of the year | |
| Service cost | Service cost | 11,897 | | | 14,546 | |
| Actuarial loss (Gain) | 6,843 | | | (10,436) | |
| Actuarial loss/(Gain) | |
| Interest cost | Interest cost | 5,297 | | | 5,497 | |
| Liabilities assumed on acquisition/ transfer of employees | 180 | | | — | |
| Benefits paid | Benefits paid | (6,388) | | | (9,162) | |
| Settlements | Settlements | — | | | (4,328) | |
| Curtailments | Curtailments | — | | | (181) | |
| Effect of exchange rate changes | (730) | | | (1,814) | |
| Loss/(Gain) on exchange rate changes | |
| Projected benefit obligation at the end of the year | Projected benefit obligation at the end of the year | $ | 97,660 | | | $ | 91,782 | |
| Change in fair value of plan assets | Change in fair value of plan assets | | | |
| Fair value of plan assets at the beginning of the year | |
| Fair value of plan assets at the beginning of the year | |
| Fair value of plan assets at the beginning of the year | Fair value of plan assets at the beginning of the year | $ | 70,900 | | | $ | 93,809 | |
| Employer contributions | Employer contributions | 24,523 | | | 12,907 | |
| Actual gain on plan assets | Actual gain on plan assets | 5,370 | | | 4,831 | |
| Benefits paid | Benefits paid | (6,287) | | | (9,162) | |
| Settlements | Settlements | — | | | (3,495) | |
| Effect of exchange rate changes | (697) | | | (1,915) | |
| (Loss)/Gain on exchange rate changes | |
| Fair value of plan assets at the end of the year | Fair value of plan assets at the end of the year | $ | 93,809 | | | $ | 96,975 | |
| Funded status, end of year | Funded status, end of year | $ | (3,851) | | | $ | 5,193 | |
| Amounts recognized in the consolidated balance sheets | Amounts recognized in the consolidated balance sheets | | | |
| Non-current assets (recorded under other assets-others) | Non-current assets (recorded under other assets-others) | $ | 10,063 | | | $ | 18,932 | |
| Non-current assets (recorded under other assets-others) | |
| Non-current assets (recorded under other assets-others) | |
| Current liabilities (recorded under accrued expenses and other current liabilities-retirement benefits) | Current liabilities (recorded under accrued expenses and other current liabilities-retirement benefits) | (1,967) | | | (1,746) | |
| Non-current liabilities (recorded under other liabilities- retirement benefits) | Non-current liabilities (recorded under other liabilities- retirement benefits) | (11,947) | | | (11,993) | |
| Funded status, end of year | Funded status, end of year | $ | (3,851) | | | $ | 5,193 | |
The change in defined benefit obligation for the years ended December 31, 20202022 and 20212023 is largely due to changes in actuarial assumptions pertaining to discount rates.rates and exchange rate fluctuations.
Amounts included in accumulated other comprehensive income (loss) as of December 31, 2021, 2022 and 2023 were as follows:
| | | | | | | | | | | | | | | | | |
| As of December 31, |
| 2021 | | 2022 | | 2023 |
| Net actuarial loss | $ | (13,399) | | | $ | (10,453) | | | $ | (8,747) | |
| Net prior service credit / (cost) | (300) | | | (124) | | | 446 | |
| Deferred tax benefits | 3,206 | | | 2,516 | | | 1,812 | |
| Other comprehensive income (loss), net | $ | (10,493) | | | $ | (8,061) | | | $ | (6,489) | |
GENPACT LIMITED AND ITS SUBSIDIARIES
Notes to the Consolidated Financial Statements
(In thousands, except per share data and share count)
17. Employee benefit plans (Continued)
Changes in other comprehensive income (loss) during the year ended December 31, 2022 and 2023 were as follows:
| | | | | | | | | | | |
| Year ended December 31, |
| 2022 | | 2023 |
| Net Actuarial (Loss) Gain | $ | 891 | | | $ | 1,425 | |
| Amortization of net actuarial loss | 662 | | | 673 | |
| Deferred tax (expense) benefits | (690) | | | (704) | |
| Net prior service credit / (cost) | 154 | | | 104 | |
| Curtailment | 6 | | | 6 | |
| Settlements | 49 | | | 2 | |
| Effect of exchange rate changes | 1,360 | | | 66 | |
| Other comprehensive income (loss), net | $ | 2,432 | | | $ | 1,572 | |
Funded status for defined benefit plans
The accumulated benefit obligation for defined benefit plans in excess of plan assets as of December 31, 2022 and 2023 was as follows:
| | | | | | | | | | | |
| As of December 31, |
| 2022 | | 2023 |
| Accumulated benefit obligation | $ | 12,328 | | $ | 14,756 |
| Fair value of plan assets at the end of the year | $ | 3,822 | | $ | 3,295 |
The projected benefit obligation for defined benefit plans in excess of plan assets as of December 31, 2022 and 2023 was as follows:
| | | | | | | | | | | |
| As of December 31, |
| 2022 | | 2023 |
| Projected benefit obligation | $ | 16,207 | | | $ | 101,561 | |
| Fair value of plan assets at the end of the year | $ | 3,822 | | $ | 85,228 |
The amount of net projected benefit obligation and plan assets for all underfunded (including unfunded) defined benefit obligation plans was $12,386 and $16,333 as of December 31, 2022 and 2023, respectively, and was classified as liabilities in the consolidated balance sheets.
Net defined benefit plan costs for the years ended December 31, 2021, 2022 and 2023 include the following components:
| | | | | | | | | | | | | | | | | |
| Year ended December 31, |
| 2021 | | 2022 | | 2023 |
| Service costs | $ | 14,546 | | | $ | 14,248 | | | $ | 15,099 | |
| Interest costs | 5,497 | | | 5,790 | | | 6,930 | |
| Amortization of actuarial loss | 1,549 | | | 859 | | | 660 | |
| Expected return on plan assets | (6,239) | | | (5,949) | | | (5,008) | |
| Settlements | 519 | | | 127 | | | 140 | |
| Net defined benefit plan costs | $ | 15,872 | | | $ | 15,075 | | | $ | 17,821 | |
Expected Contributions
The Company estimates that it will pay approximately $8,438 in fiscal 2024 related to contributions to defined benefit plans.
GENPACT LIMITED AND ITS SUBSIDIARIES
Notes to the Consolidated Financial Statements
(In thousands, except per share data and share count)
17. Employee benefit plans (Continued)
Amounts included in accumulated other comprehensive income (loss) as of December 31, 2019, 2020 and 2021 were as follows:
| | | | | | | | | | | | | | | | | |
| As of December 31, |
| 2019 | | 2020 | | 2021 |
| Net actuarial loss | $ | (21,490) | | | $ | (24,669) | | | $ | (13,399) | |
| Net prior service credit / (cost) | (717) | | | (477) | | | (300) | |
| Deferred tax benefits | 6,171 | | | 7,065 | | | 3,206 | |
| Other comprehensive income (loss), net | $ | (16,036) | | | $ | (18,081) | | | $ | (10,493) | |
Changes in other comprehensive income (loss) during the year ended December 31, 2020 and 2021 were as follows:
| | | | | | | | | | | |
| As of December 31, |
| 2020 | | 2021 |
| Net Actuarial (Loss) Gain | $ | (5,891) | | | $ | 9,019 | |
| Amortization of net actuarial loss | 2,242 | | | 1,379 | |
| Deferred tax (expense) benefits | 894 | | | (3,859) | |
| Net prior service credit / (cost) | 219 | | | 170 | |
| Curtailment | — | | | 181 | |
| Settlements | — | | | 519 | |
| Effect of exchange rate changes | 491 | | | 179 | |
| Other comprehensive income (loss), net | $ | (2,045) | | | $ | 7,588 | |
Funded status for defined benefit plans
The accumulated benefit obligation for defined benefit plans in excess of plan assets as of December 31, 2020 and 2021 was as follows:
| | | | | | | | | | | |
| As of December 31, |
| 2020 | | 2021 |
| Accumulated benefit obligation | $ | 15,441 | | $ | 12,496 |
| Fair value of plan assets at the end of the year | $ | 5,446 | | $ | 3,161 |
The projected benefit obligation for defined benefit plans in excess of plan assets as of December 31, 2020 and 2021 was as follows:
| | | | | | | | | | | |
| As of December 31, |
| 2020 | | 2021 |
| Projected benefit obligation | $ | 23,090 | | | $ | 18,806 | |
| Fair value of plan assets at the end of the year | $ | 9,176 | | $ | 5,067 |
The amount of net projected benefit obligation and plan assets for all underfunded (including unfunded) defined benefit obligation plans was $13,914 and $13,739 as of December 31, 2020 and 2021, respectively, and was classified as liabilities in the consolidated balance sheets.
GENPACT LIMITED AND ITS SUBSIDIARIES
Notes to the Consolidated Financial Statements
(In thousands, except per share data and share count)
17. Employee benefit plans (Continued)
Net defined benefit plan costs for the years ended December 31, 2019, 2020 and 2021 include the following components:
| | | | | | | | | | | | | | | | | |
| Year ended December 31, |
| 2019 | | 2020 | | 2021 |
| Service costs | $ | 8,915 | | | $ | 11,897 | | | $ | 14,546 | |
| Interest costs | 4,667 | | | 5,297 | | | 5,497 | |
| Amortization of actuarial loss | 1,384 | | | 2,461 | | | 1,549 | |
| Expected return on plan assets | (2,605) | | | (4,589) | | | (6,239) | |
| One-time cost | 202 | | | — | | | — | |
| Settlements | — | | | — | | | 519 | |
| Net defined benefit plan costs | $ | 12,563 | | | $ | 15,066 | | | $ | 15,872 | |
Expected Contributions
The Company estimates that it will pay approximately $9,733 in fiscal 2022 related to contributions to defined benefit plans.
The weighted average assumptions used to determine the benefit obligations of the Indian Gratuity Plan as of December 31, 20202022 and 20212023 are presented below:
| | As of December 31, |
| 2020 | | 2021 |
| As of December 31, | | | As of December 31, |
| 2022 | | | 2022 | | 2023 |
| Discount rate | Discount rate | 4.45 | % | - | 5.90% | | 5.25 | % | - | 6.45% | Discount rate | 7.45 | % | - | 7.70% | | 7.65% | - | 7.90% |
| Rate of increase in compensation per annum | Rate of increase in compensation per annum | 5.20 | % | - | 9.00% | | 4.60 | % | - | 8.00% | Rate of increase in compensation per annum | 5.20 | % | - | 9.00% | | 5.20 | % | - | 9.00% |
The weighted average assumptions used to determine the Indian Gratuity Plan costs for the years ended December 31, 2019, 20202021, 2022 and 20212023 are presented below:
| | Year ended December 31, |
| 2019 | | 2020 | | 2021 |
| Year ended December 31, | | | Year ended December 31, |
| 2021 | | | 2021 | | 2022 | | 2023 |
| Discount rate | Discount rate | 8.30 % | - | 8.40 % | | 6.80 % | - | 7.35 % | | 4.45% | - | 5.90% | Discount rate | 4.45 % | - | 5.90 % | | 5.25 % | - | 6.45 % | | 7.45% | _ | 7.70% |
| Rate of increase in compensation per annum | Rate of increase in compensation per annum | 5.20 % | - | 11.00 % | | 5.20 % | - | 11.50 % | | 5.20% | - | 9.00% | Rate of increase in compensation per annum | 5.20 % | - | 9.00 % | | 4.60 % | - | 8.00 % | | 5.20% | - | 9.00% |
| Expected long term rate of return on plan assets per annum | Expected long term rate of return on plan assets per annum | 7.50% | | 7.50% | | 7.00% | - | 7.50% | Expected long term rate of return on plan assets per annum | 7.00% | | 7.50% | | 7.00% | - | 7.20% | | 7.00% |
The weighted average assumptions used to determine the benefit obligations of the Mexican Plan as of December 31, 20202022 and 20212023 are presented below:
| | As of December 31, |
| 2020 | | 2021 |
| As of December 31, | | | As of December 31, |
| 2022 | | | 2022 | | 2023 |
| Discount rate | Discount rate | 7.20 | % | | 8.20 | % | Discount rate | 9.30 | % | | 9.40 | % |
| Rate of increase in compensation per annum | Rate of increase in compensation per annum | 5.50 | % | | 5.50 | % | Rate of increase in compensation per annum | 5.50 | % | | 5.50 | % |
The weighted average assumptions used to determine the costs of the Mexican Plan for the years ended December 31, 2019, 20202021, 2022 and 20212023 are presented below:
| | Year ended December 31, |
| 2019 | | 2020 | | 2021 |
| Year ended December 31, | | | Year ended December 31, |
| 2021 | | | 2021 | | 2022 | | 2023 |
| Discount rate | Discount rate | 9.40 | % | | 7.60 | % | | 7.20 | % | Discount rate | 7.20 | % | | 8.20 | % | | 9.30 | % |
| Rate of increase in compensation per annum | Rate of increase in compensation per annum | 5.50 | % | | 5.50 | % | | 5.50 | % | Rate of increase in compensation per annum | 5.50 | % | | 5.50 | % | | 5.50 | % |
The weighted average assumptions used to determine the benefit obligations of the Philippines Plan as of December 31, 2022 and 2023 are presented below:
| | | | | | | | | | | | | | | | | | | | | | | |
| As of December 31, |
| 2022 | | 2023 |
| Discount rate | 9.80% | | 8.54% |
| Rate of increase in compensation per annum | 5.30% | | 5.80% |
The weighted average assumptions used to determine the costs of the Philippines Plan for the years ended December 31, 2021, 2022 and 2023 are presented below:
| | | | | | | | | | | | | | | | | |
| Year ended December 31, |
| 2021 | | 2022 | | 2023 |
| Discount rate | 5.26 | % | | 7.67 | % | | 9.80 | % |
| Rate of increase in compensation per annum | 5.00 | % | | 6.00 | % | | 5.30 | % |
| Expected long-term rate of return on plan assets per annum | 2.00 | % | | 2.00 | % | | 2.00 | % |
GENPACT LIMITED AND ITS SUBSIDIARIES
Notes to the Consolidated Financial Statements
(In thousands, except per share data and share count)
17. Employee benefit plans (Continued)
The weighted average assumptions used to determine the benefit obligations of the Philippines Plan as of December 31, 2020 and 2021 are presented below:
| | | | | | | | | | | | | | | | | |
| As of December 31, |
| 2020 | | 2021 |
| Discount rate | 5.26 | % | | 7.67% |
| Rate of increase in compensation per annum | 5.00 | % | | 3.00% | - | 6.00% |
The weighted average assumptions used to determine the costs of the Philippines Plan for the years ended December 31, 2019, 2020 and 2021 are presented below:
| | | | | | | | | | | | | | | | | |
| Year ended December 31, |
| 2019 | | 2020 | | 2021 |
| Discount rate | 7.53 | % | | 5.22 | % | | 5.26 | % |
| Rate of increase in compensation per annum | 6.00 | % | | 6.00 | % | | 5.00 | % |
| Expected long-term rate of return on plan assets per annum | 1.00 | % | | 2.40 | % | | 2.00 | % |
The weighted average assumptions used to determine the benefit obligation of the Japan Plan as of December 31, 20202022 and 20212023 are presented below:
| | As of December 31, |
| 2020 | | 2021 |
| As of December 31, | | | As of December 31, |
| 2022 | | | 2022 | | 2023 |
| Discount rate | Discount rate | 0.17% | — | 0.41% | | 0.14% | — | 0.81% | Discount rate | 0.14% | — | 0.94% | | 0.28% | — | 0.94% |
| Rate of increase in compensation per annum | Rate of increase in compensation per annum | 0.00% | | 0.00% | Rate of increase in compensation per annum | 0.00% | | 0.00% |
The weighted average assumptions used to determine the costs of the Japan Plan for the years ended December 31, 2019, 20202021, 2022 and 20212023 are presented below:
| | Year ended December 31, |
| 2019 | | 2020 | | 2021 |
| Year ended December 31, | | | Year ended December 31, |
| 2021 | | | 2021 | | 2022 | | 2023 |
| Discount rate | Discount rate | 0.076 % | - | 0.269 % | | 0.094% | - | 0.271% | | 0.17 | % | - | 0.41% | Discount rate | 0.170 % | - | 0.410 % | | 0.14% | - | 0.81% | | 0.14 | % | - | 0.94% |
| Rate of increase in compensation per annum | Rate of increase in compensation per annum | 0.00 % | | 0.00 % | | 0.00% | Rate of increase in compensation per annum | 0.00 % | | 0.00 % | | 0.00% |
| Expected long term rate of return on plan assets per annum | Expected long term rate of return on plan assets per annum | 0.00 % | - | 1.77 % | | 0.00% | - | 1.77% | | 1.77 | % | - | 3.12% | Expected long term rate of return on plan assets per annum | 1.77 % | - | 3.12 % | | 1.77% | - | 3.12% | | 1.77% |
The expected returns on plan assets set forth above are based on the Company’s expectation of the average long-term rate of return expected to prevail over the next 15 to 20 years on the types of investments prescribed by applicable statute.
The Company evaluates these assumptions based on projections of the Company’s long-term growth and prevalent industry standards. Unrecognized actuarial loss is amortized over the average remaining service period of the active employees expected to receive benefits under the plan.
Investment and risk management strategy
The overall investment objective of the Company’s defined benefit plans is to match the duration of the plans’ assets to the plans’ liabilities while managing risk in order to meet defined benefit obligations. The plans’ future prospects, their current financial conditions, our current funding levels and other relevant factors suggest that the plans can tolerate some interim fluctuations in market value and rates of return in order to achieve long-term objectives without undue risk to the plans’ ability to meet their current benefit obligations.
Plan investments are exposed to risks including market, interest rate and operating risk. In order to mitigate significant concentrations of these risks, the assets are invested in a diversified portfolio primarily consisting of fixed income instruments, liquid assets, equities and debt.
| | | | | | | | | | | | | | | | | | | | | | | |
| As of December 31, 2022 |
| Fair Value Measurements at Reporting Date Using |
| | | Quoted Prices in
Active Markets for
Identical Assets | | Significant Other
Observable
Inputs | | Significant Other
Unobservable
Inputs |
| Total | | (Level 1) | | (Level 2) | | (Level 3) |
| Asset Category | | | | | | | |
| Cash | 2,423 | | | 2,423 | | | — | | | — | |
| Fixed income securities (Note a) | 77,722 | | | — | | | 77,722 | | | — | |
| Other securities (Note b) | 295 | | | — | | | 295 | | | — | |
| Total | $ | 80,440 | | | $ | 2,423 | | | $ | 78,017 | | | $ | — | |
GENPACT LIMITED AND ITS SUBSIDIARIES
Notes to the Consolidated Financial Statements
(In thousands, except per share data and share count)
17. Employee benefit plans (Continued)
The fair values of the Company’s plan assets as of December 31, 2020 and 2021 by asset category are as follows:
| | | | | | | | | | | | | | | | | | | | | | | |
| As of December 31, 2020 |
| Fair Value Measurements at Reporting Date Using |
| | | Quoted Prices in
Active Markets for
Identical Assets | | Significant Other
Observable
Inputs | | Significant Other
Unobservable
Inputs |
| Total | | (Level 1) | | (Level 2) | | (Level 3) |
| Asset Category | | | | | | | |
| Cash | 21,707 | | | 21,707 | | | — | | | — | |
| Fixed income securities (Note a) | 63,444 | | | — | | | 63,444 | | | — | |
| Other securities (Note b) | 8,658 | | | — | | | 8,658 | | | — | |
| Total | $ | 93,809 | | | $ | 21,707 | | | $ | 72,102 | | | $ | — | |
| | | | | | | | | | | | | | | | | | | | | | | |
| As of December 31, 2021 |
| Fair Value Measurements at Reporting Date Using |
| | | Quoted Prices in
Active Markets for
Identical Assets | | Significant Other
Observable
Inputs | | Significant Other
Unobservable
Inputs |
| Total | | (Level 1) | | (Level 2) | | (Level 3) |
| Asset Category | | | | | | | |
| Cash | 14,059 | | | 14,059 | | | — | | | — | |
| Fixed income securities (Note a) | 80,612 | | | — | | | 80,612 | | | — | |
| Other securities (Note b) | 2,304 | | | — | | | 2,304 | | | — | |
| Total | $ | 96,975 | | | $ | 14,059 | | | $ | 82,916 | | | $ | — | |
| | | | | | | | | | | | | | | | | | | | | | | |
| As of December 31, 2023 |
| Fair Value Measurements at Reporting Date Using |
| | | Quoted Prices in
Active Markets for
Identical Assets | | Significant Other
Observable
Inputs | | Significant Other
Unobservable
Inputs |
| Total | | (Level 1) | | (Level 2) | | (Level 3) |
| Asset Category | | | | | | | |
| Cash | 825 | | | 825 | | | — | | | — | |
| Fixed income securities (Note a) | 85,569 | | | — | | | 85,569 | | | — | |
| Other securities (Note b) | 291 | | | — | | | 291 | | | — | |
| Total | $ | 86,685 | | | $ | 825 | | | $ | 85,860 | | | $ | — | |
(a)Includes investments in funds that invest 100% of their assets in fixed income securities such as money market instruments, government securities and public and private bonds.
(b)Includes investments in funds that invest primarily in fixed income securities and the remaining portion in equity securities.
The expected benefit plan payments set forth below reflect expected future service:
| | | | | |
| Year ending December 31, | |
| 2022 | $ | 12,938 | |
| 2023 | 13,353 | |
| 2024 | 14,310 | |
| 2025 | 15,182 | |
| 2026 | 16,250 | |
| 2027 - 2031 | 83,964 | |
| $ | 155,997 | |
| | | | | |
| Year ending December 31, | |
| 2024 | $ | 18,145 | |
| 2025 | 17,424 | |
| 2026 | 20,268 | |
| 2027 | 22,448 | |
| 2028 | 23,057 | |
| 2029 - 2033 | 108,672 | |
| $ | 210,014 | |
The Company’s expected benefit plan payments are based on the same assumptions that were used to measure the Company’s benefit obligations as of December 31, 2021.2023.
Defined contribution plans
During the years ended December 31, 2021, 2022 and 2023, the Company contributed the following amounts to defined contribution plans in various jurisdictions:
| | | | | | | | | | | | | | | | | |
| Year ended December 31, |
| 2021 | | 2022 | | 2023 |
| India | $ | 37,508 | | | $ | 43,805 | | | $ | 47,979 | |
| U.S. | 21,496 | | | 23,084 | | | 20,820 | |
| U.K. | 19,874 | | | 20,763 | | | 19,197 | |
| China | 24,988 | | | 26,514 | | | 27,077 | |
| Other regions | 15,516 | | | 18,062 | | | 19,737 | |
| Total | $ | 119,382 | | | $ | 132,228 | | | $ | 134,810 | |
GENPACT LIMITED AND ITS SUBSIDIARIES
Notes to the Consolidated Financial Statements
(In thousands, except per share data and share count)
17. Employee benefit plans (Continued)
Defined contribution plans
During the years ended December 31, 2019, 2020 and 2021, the Company contributed the following amounts to defined contribution plans in various jurisdictions:
| | | | | | | | | | | | | | | | | |
| Year ended December 31, |
| 2019 | | 2020 | | 2021 |
| India | $ | 29,729 | | | $ | 30,396 | | | $ | 37,508 | |
| U.S. | 19,401 | | | 19,491 | | | 21,496 | |
| U.K. | 19,260 | | | 18,643 | | | 19,874 | |
| China | 18,816 | | | 16,436 | | | 24,988 | |
| Other regions | 8,538 | | | 11,481 | | | 15,516 | |
| Total | $ | 95,744 | | | $ | 96,447 | | | $ | 119,382 | |
Deferred compensation plan
On July 1, 2018, Genpact LLC, a wholly-owned subsidiary of the Company, adopted an executive deferred compensation plan (the “Plan”). The Plan provides a select group of U.S.-based members of Company management with the opportunity to defer from 1% to 80% of their base salary and from 1% to 100% of their qualifying bonus compensation (or such other minimums or maximums as determined by the Plan administrator from time to time) pursuant to the terms of the Plan. Participant deferrals are 100% vested at all times. The Plan also allows for discretionary supplemental employer contributions by the Company, in its sole discretion, which will be subject to a two-year vesting schedule (50% vesting on the one-year anniversary of approval of the contribution and 50% vesting on the second year anniversary of approval of the contribution) or such other vesting schedule as determined by the Company. However, no such contributions have been made by the Company to date.
The Plan also provides an option for participants to elect to receive deferred compensation and earnings thereon on either fixed date(s) no earlier than two years following the applicable Plan year (or end of the applicable performance period for performance-based bonus compensation) or following a separation from service, in each case either in a lump sum or in annual installments over a term of up to 15 years. Participants can elect to change or re-defer their rights to receive the deferred compensation until the 10th anniversary following their separation from service, subject to fulfillment of certain conditions. Each Plan participant’s compensation deferrals and discretionary supplemental employer contributions (if any) are credited or debited with notional investment gains and losses equal to the performance of selected hypothetical investment funds offered under the Plan and elected by the participant.
The Company has investments in funds held in Company-owned life insurance policies which are held in a Rabbi Trust that are classified as trading securities. Management determines the appropriate classification of the securities at the time they are acquired and evaluates the appropriateness of such classifications at each balance sheet date.
The liability for the deferred compensation plan was $26,390$39,654 and $38,007$51,354 as of December 31, 20202022 and December 31, 2021,2023, respectively, and is included in “accrued expenses and other current liabilities” and “other liabilities” in the consolidated balance sheets. In connection with the administration of the Plan, the Company has purchased company-ownedCompany-owned life insurance policies insuring the lives of certain employees. The cash surrender value of these policies was $26,832$40,261 and $38,584$51,983 as of December 31, 20202022 and December 31, 2021,2023, respectively. The cash surrender value of these insurance policies is included in “other assets” in the consolidated balance sheets. During the years ended December 31, 2019, 20202021, 2022 and 2021,2023, the change in the fair value of Plan assets was $1,296, $4,164$4,229, $(7,580) and $4,229,$7,506, respectively, which is included in “other income (expense), net,” in the consolidated statements of income. During the years ended December 31, 2019, 20202021, 2022 and 2021,2023, the change in the fair value of deferred compensation liabilities was $1,062, $4,120$4,094, $(7,610) and $4,094,$7,484, respectively, which is included in “selling, general and administrative expenses.”
GENPACT LIMITED AND ITS SUBSIDIARIES
Notes to the Consolidated Financial Statements
(In thousands, except per share data and share count)
18. Stock-based compensation
The Company has granted stock-based awards under the Genpact Limited 2007 Omnibus Incentive Compensation Plan (the “2007 Omnibus Plan”) and the Genpact Limited 2017 Omnibus Incentive Compensation Plan (the “2017 Omnibus Plan”) to eligible persons, including employees, directors and certain other persons associated with the Company.
A brief summary of each plan is provided below:
2007 Omnibus Plan
The Company adopted the 2007 Omnibus Plan on July 13, 2007 and amended and restated it on April 11, 2012. The 2007 Omnibus Plan provided for the grant of awards intended to qualify as incentive stock options, non-qualified stock options, share appreciation rights, restricted share awards, restricted share units, performance units, cash incentive awards and other equity-based or equity-related awards. Under the 2007 Omnibus Plan, the Company was authorized to grant awards for the issuance of up to a total of 23,858,823 common shares.
2017 Omnibus Plan
On May 9, 2017, the Company’s shareholders approved the adoption of the 2017 Omnibus Plan, pursuant to which 15,000,000 Company common shares are available for issuance. The 2017 Omnibus Plan was amended and restated on April 5, 2019 and April 5, 2022 to increase the number of common shares authorized for issuance by 8,000,000 shares to 23,000,000 shares.shares and by 3,500,000 shares to 26,500,000 shares, respectively. No grants may be made under the 2007 Omnibus Plan after the date of adoption of the 2017 Omnibus Plan. Grants that were outstanding under the 2007 Omnibus Plan as of the date of the Company’s adoption of the 2017 Omnibus Plan, remain subject to the terms of the 2007 Omnibus Plan.
Stock-based compensation costs relating to the foregoing plans during the years ended December 31, 2019, 20202021, 2022 and 2021,2023 were $82,802, $72,709$80,548, $75,836 and $80,548,$87,108, respectively, and have been allocated to cost of revenue and selling, general, and administrative expenses.
Income tax benefits recognized in relation to stock-based compensation costs, including options, RSUsrestricted share units ("RSUs") and PUs,performance units ("PUs"), including excess tax benefits, during the years ended December 31, 2019, 20202021, 2022 and 20212023 were $18,921, $21,832$21,857, $21,863 and $21,857,$19,312, respectively.
Stock options
All options granted under the 2007 and 2017 Omnibus Plans are exercisable into common shares of the Company, have a contractual period of ten years and vest over three to five years unless otherwise specified in the applicable award agreement. The Company recognizes such compensation cost over the vesting period of the option.
The compensation cost is determined at the date of grant by estimating the fair value of an option using the Black-Scholes option-pricing model.
The following table shows the significant assumptions used in connection with the determination of the fair value of options granted in 2019, 20202021 and 2021:2022. No options were granted in 2023.
| | 2019 | | 2020 | | 2021 |
| 2021 | | | 2021 | | 2022 |
| Dividend yield | Dividend yield | 0.82% | — | 1.08% | | 0.89% | | 0.84% | — | 1.08% | Dividend yield | 0.84% | — | 1.08% | | 0.96% |
| Expected life (in months) | Expected life (in months) | 84 | | 84 | | 84 | Expected life (in months) | 84 | | 84 |
| Risk-free rate of interest for expected life | Risk-free rate of interest for expected life | 1.56% | — | 2.63% | | 1.50% | | 1.12% | — | 1.37% | Risk-free rate of interest for expected life | 1.12% | — | 1.37% | | 1.71% |
| Volatility | Volatility | 21.00% | — | 21.38% | | 20.96% | | 26.05% | — | 26.18% | Volatility | 26.05% | — | 26.18% | | 26.29% |
Volatility was calculated based on the historical volatility of the Company’s share price during a period equivalent to the estimated term of the option. The Company estimates the expected term of an option using the “simplified method,” which is based on the average of its contractual vesting term. The risk-free interest rate that the Company uses in the option valuation model is based on U.S. Treasury bonds with a term similar to the expected term of the options. The Company paid cash dividends of $0.0975$0.1075 and $0.1075$0.125 per share in each quarter of fiscal 20202021 and 2021,2022, respectively.
The Company has issued, and intends to continue to issue, new common shares upon stock option exercises and the vesting of share awards under its equity-based incentive compensation plans.
GENPACT LIMITED AND ITS SUBSIDIARIES
Notes to the Consolidated Financial Statements
(In thousands, except per share data and share count)
18. Stock-based compensation (Continued)
A summary of stock option activity during the years ended December 31, 2019, 20202021, 2022 and 20212023 is set out below:
| | Year ended December 31, 2019 |
| Shares arising
out of options | | Weighted
average
exercise price | | Weighted average
remaining
contractual life (years) | | Aggregate
intrinsic
value |
| Outstanding as of January 1, 2019 | 7,261,675 | | | 23.61 | | | 6.4 | | — |
| Year ended December 31, 2021 | | | Year ended December 31, 2021 |
| Shares arising
out of options | | | Shares arising
out of options | | Weighted
average
exercise price | | Weighted average
remaining
contractual life (years) | | Aggregate
intrinsic
value |
| Outstanding as of January 1, 2021 | | Outstanding as of January 1, 2021 | 7,347,241 | | | 26.41 | | | 5.7 | | — |
| Granted | Granted | 1,881,068 | | | 28.50 | | | — | | | — | Granted | 1,831,180 | | | 43.98 | | 43.98 | | | — | | — | | | — | | — |
| Forfeited | Forfeited | (85,000) | | | 29.91 | | | — | | | — | Forfeited | (25,000) | | | 31.50 | | 31.50 | | | — | | — | | | — | | — |
| Expired | Expired | — | | | — | | — | | | — | Expired | — | | | — | | — | | — | | | — | | — |
| Exercised | Exercised | (697,531) | | | 15.33 | | | — | | | 18,724 | |
| Outstanding as of December 31, 2019 | 8,360,212 | | | 25.33 | | | 6.5 | | $ | 140,760 | |
Vested as of December 31, 2019 and expected to vest
thereafter (Note a) | 8,006,985 | | | 25.18 | | | 6.5 | | $ | 136,017 | |
| Vested and exercisable as of December 31, 2019 | 3,111,039 | | | 19.16 | | | 3.4 | | $ | 71,584 | |
| Outstanding as of December 31, 2021 | |
| Vested as of December 31, 2021 and expected to vest thereafter (Note a) | |
| Vested and exercisable as of December 31, 2021 | |
| Weighted average grant-date fair value of options granted during the period | Weighted average grant-date fair value of options granted during the period | $ | 6.98 | | |
| | | | | | | | | | | | | | | | | | | | | | | |
| Year ended December 31, 2020 |
| Shares arising
out of options | | Weighted
average
exercise price | | Weighted average
remaining
contractual life (years) | | Aggregate
intrinsic
value |
| Outstanding as of January 1, 2020 | 8,360,212 | | | $ | 25.33 | | | 6.5 | | — |
| Granted | 431,924 | | | 43.94 | | | — | | — |
| Forfeited | (752,261) | | | 30.09 | | | — | | — |
| Expired | — | | | — | | — | | — |
| Exercised | (692,634) | | | 20.30 | | | — | | 11,813 | |
| Outstanding as of December 31, 2020 | 7,347,241 | | | $ | 26.41 | | | 5.7 | | $ | 110,925 | |
| Vested as of December 31, 2020 and expected to vest thereafter (Note a) | 7,132,162 | | | $ | 26.26 | | | 5.7 | | $ | 108,671 | |
| Vested and exercisable as of December 31, 2020 | 2,713,405 | | | $ | 19.40 | | | 2.6 | | $ | 59,593 | |
| Weighted average grant-date fair value of options granted during the period | $ | 9.72 | | | | | | | |
| | | | | | | | | | | | | | | | | | | | | | | |
| Year Ended December 31, 2021 |
| Shares arising
out of options | | Weighted
average
exercise price | | Weighted average
remaining
contractual life (years) | | Aggregate
intrinsic
value |
| Outstanding as of January 1, 2021 | 7,347,241 | | | $ | 26.41 | | | 5.7 | | — |
| Granted | 1,831,180 | | | 43.98 | | | — | | — |
| Forfeited | (25,000) | | | 31.50 | | | — | | — |
| Expired | — | | | — | | | — | | — |
| Exercised | (1,145,125) | | | 20.23 | | | — | | 30,463 | |
| Outstanding as of December 31, 2021 | 8,008,296 | | | $ | 31.30 | | | 6.1 | | $ | 174,428 | |
| Vested as of December 31, 2021 and expected to vest thereafter (Note a) | 7,422,919 | | | $ | 30.51 | | | 6.1 | | $ | 167,551 | |
| Vested and exercisable as of December 31, 2021 | 3,117,333 | | | $ | 24.17 | | | 3.4 | | $ | 90,117 | |
| Weighted average grant-date fair value of options granted during the period | $ | 11.35 | | | | | | | |
| | | | | | | | | | | | | | | | | | | | | | | |
| Year ended December 31, 2022 |
| Shares arising
out of options | | Weighted
average
exercise price | | Weighted average
remaining
contractual life (years) | | Aggregate
intrinsic
value |
| Outstanding as of January 1, 2022 | 8,008,296 | | | $ | 31.30 | | | 6.1 | | — |
| Granted | 475,695 | | | 52.12 | | | — | | — |
| Forfeited | (70,841) | | | 41.46 | | | — | | — |
| Expired | — | | | — | | — | | — |
| Exercised | (665,036) | | | 22.11 | | | — | | 15,752 | |
| Outstanding as of December 31, 2022 | 7,748,114 | | | $ | 33.27 | | | 5.6 | | $ | 105,261 | |
| Vested as of December 31, 2022 and expected to vest thereafter (Note a) | 7,287,127 | | | $ | 32.59 | | | 5.6 | | $ | 103,474 | |
| Vested and exercisable as of December 31, 2022 | 3,211,699 | | | $ | 25.35 | | | 3.3 | | $ | 67,347 | |
| Weighted average grant-date fair value of options granted during the period | $ | 14.19 | | | | | | | |
| | | | | | | | | | | | | | | | | | | | | | | |
| Year Ended December 31, 2023 |
| Shares arising
out of options | | Weighted
average
exercise price | | Weighted average
remaining
contractual life (years) | | Aggregate
intrinsic
value |
| Outstanding as of January 1, 2023 | 7,748,114 | | | $ | 33.27 | | | 5.6 | | — |
| Granted | — | | | — | | | — | | — |
| Forfeited | (319,646) | | | 41.06 | | | — | | — |
| Expired | (53,990) | | | 43.94 | | | — | | — |
| Exercised | (1,376,330) | | | 20.17 | | | — | | 29,255 | |
| Outstanding as of December 31, 2023 | 5,998,148 | | | $ | 35.77 | | | 5.5 | | $ | 19,341 | |
| Vested as of December 31, 2023 and expected to vest thereafter (Note a) | 5,784,672 | | | $ | 35.38 | | | 5.5 | | $ | 19,332 | |
| Vested and exercisable as of December 31, 2023 | 3,161,392 | | | $ | 30.42 | | | 4.3 | | $ | 15,069 | |
| Weighted average grant-date fair value of options granted during the period | — | | | | | | | |
(a) Options expected to vest after considering an estimated forfeiture rate.
GENPACT LIMITED AND ITS SUBSIDIARIES
Notes to the Consolidated Financial Statements
(In thousands, except per share data and share count)
18. Stock-based compensation (Continued)
Cash received by the Company upon the exercise of stock options during the years ended December 31, 2019, 20202021, 2022 and 20212023 amounted to $10,690, $14,062$23,168, $14,701 and $23,168,$27,755, respectively. TaxIncome tax benefits from the exercise of stock options during the years ended December 31, 2019, 20202021, 2022 and 20212023 were $2,966, $7,381$6,927, $2,398 and $6,927$6,631 (including excess tax benefits of $2,743, $7,310$4,191, $1,543 and $4,191)$3,453), respectively.
As of December 31, 2021,2023, the total remaining unrecognized stock-based compensation cost for options expected to vest amounted to $24,199$8,690, which will be recognized over the weighted average remaining requisite vesting period of 3.22.4 years.
Restricted Share Units
The Company has granted restricted share units, or RSUs, under the 2007 and 2017 Omnibus Plans. Each RSU represents the right to receive 1one common share. The fair value of each RSU is the market price of 1one common share of the Company on the date of grant. The RSUs granted to date have graded vesting schedules of three months to four years. The compensation expense is recognized on a straight-line basis over the vesting term.
A summary of RSU activity during the years ended December 31, 2019, 20202021, 2022 and 20212023 is set out below:
| | Year ended December 31, 2019 |
| Number of
Restricted Share Units | | Weighted
Average Grant Date Fair Value |
| Outstanding as of January 1, 2019 | 1,528,999 | | | $ | 27.45 | |
| Year ended December 31, 2021 | | | Year ended December 31, 2021 |
| Number of
Restricted Share Units | | | Number of
Restricted Share Units | | Weighted
Average Grant Date Fair Value |
| Outstanding as of January 1, 2021 | |
| Granted | Granted | 470,939 | | | 37.58 | |
| Vested (Note b) | Vested (Note b) | (672,025) | | | 26.84 | |
| Forfeited | Forfeited | (66,207) | | | 30.43 | |
| Outstanding as of December 31, 2019 | 1,261,706 | | | $ | 31.41 | |
| Outstanding as of December 31, 2021 | |
| Expected to vest (Note a) | Expected to vest (Note a) | 1,149,286 | | | |
| | | | | | | | | | | |
| Year ended December 31, 2022 |
| Number of
Restricted
Share Units | | Weighted
Average
Grant Date Fair Value |
| Outstanding as of January 1, 2022 | 759,507 | | | $ | 42.29 | |
| Granted | 206,280 | | | 45.66 | |
| Vested (Note c) | (274,521) | | | 43.23 | |
| Forfeited | (111,644) | | | 42.69 | |
| Outstanding as of December 31, 2022 | 579,622 | | | $ | 42.97 | |
| Expected to vest (Note a) | 527,621 | | | |
| | | Year ended December 31, 2020 | | Year ended December 31, 2023 |
| Number of
Restricted
Share Units | | Weighted
Average
Grant Date Fair Value |
| Outstanding as of January 1, 2020 | 1,261,706 | | | $ | 31.41 | |
| Number of
Restricted
Share Units | | | Number of
Restricted
Share Units | | Weighted
Average
Grant Date Fair Value |
| Outstanding as of January 1, 2023 | |
| Granted | Granted | 296,332 | | | 40.40 | |
| Vested (Note c) | (640,212) | | | 28.28 | |
| Vested (Note d) | |
| Forfeited | Forfeited | (57,518) | | | 37.35 | |
| Outstanding as of December 31, 2020 | 860,308 | | | $ | 36.44 | |
| Outstanding as of December 31, 2023 | |
| Expected to vest (Note a) | Expected to vest (Note a) | 762,877 | | | |
GENPACT LIMITED AND ITS SUBSIDIARIES
Notes to the Consolidated Financial Statements
(In thousands, except per share data and share count)
18. Stock-based compensation (Continued)
| | | | | | | | | | | |
| Year ended December 31, 2021 |
| Number of
Restricted
Share Units | | Weighted
Average
Grant Date Fair Value |
| Outstanding as of January 1, 2021 | 860,308 | | | $ | 36.44 | |
| Granted | 466,702 | | | 44.00 | |
| Vested (Note d) | (501,273) | | | 34.41 | |
| Forfeited | (66,230) | | | 38.02 | |
| Outstanding as of December 31, 2021 | 759,507 | | | $ | 42.29 | |
| Expected to vest (Note a) | 654,594 | | | |
(a)RSUs expected to vest after considering an estimated forfeiture rate.
(b)637,933 RSUs that vested during the period were net settled upon vesting by issuing 521,707 shares (net of minimum statutory tax withholding). 34,092 RSUs that vested in the year ended December 31, 2019 were issued during the period ended December 31, 2021.
(c)590,699 RSUs that vested during the period were net settled upon vesting by issuing 385,197 shares (net of minimum statutory tax withholding). 49,513 RSUs vested in the year ended December 31, 2020, shares in respect of which will be issued in 2022 after withholding shares to the extent of minimum statutory withholding taxes.
(d)461,640 RSUs that vested during the period were net settled upon vesting by issuing 300,944 shares (net of minimum statutory tax withholding). 39,633 RSUs vested in the year ended December 31, 2021, shares in respect of which will be39,515 shares were issued in 2022during the period ended December 31, 2023 after withholding shares to the extent of minimum statutory withholding taxes. 7,863 RSUs vested in the year ended December 31, 2021, in respect of which 5,496 shares were issued during the period ended December 31, 2022 after withholding shares to the extent required to satisfy minimum statutory withholding obligations.
(c)28,866 RSUs that vested during the period were net settled upon vesting by issuing 19,992 shares (net of minimum statutory tax withholding). 199,297 RSUs vested in the year ended December 31, 2022, in respect of which 120,858 shares were issued during the period ended December 31, 2023 after withholding shares to the extent of minimum statutory withholding taxes. 46,358 RSUs vested in the year ended December 31, 2022, shares in respect of which will be issued in 2024 after withholding shares to the extent of minimum statutory withholding taxes.
(d)453,761 RSUs vested during the period were net settled upon vesting by issuing 296,656 shares (net of minimum statutory tax withholding). 56,296 RSUs vested in the year ended December 31, 2023, shares in respect of which will be issued in 2024 after withholding shares to the extent of minimum statutory withholding taxes.
As of December 31, 2021,2023, the total remaining unrecognized stock-based compensation cost related to RSUs amounted to $18,045,$26,685, which will be recognized over the weighted average remaining requisite vesting period of 2.31.9 years.
Performance Units
The Company also grants stock awards in the form of performance units, or PUs, and has granted PUs under both the 2007 and 2017 Omnibus Plans.
Each PU represents the right to receive 1one common share at a future date based on the Company’s performance against specified targets. PUs granted to date have vesting schedules of approximately six months to three years. The fair value of each PU is the market price of 1 common share of the Company on the date of grant and assumes that performance targets will be achieved. PUs granted under the planplans are subject to cliff vesting. The compensation expense for such awards is recognized on a straight-line basis over the vesting term. During
For PUs granted prior to 2023, the fair value of each PU was the market price of one common share of the Company on the date of grant and the performance period for such grants was one year. For PUs that have a performance period of one year, the Company’s estimate of the number of shares to be issued is adjusted upward or downward based upon the probability of achievement of the performance targets. The ultimate number of shares issued and the related compensation cost recognized is based on a comparison of the final performance metrics to the specified targets.
For PUs granted in 2023, the performance period increased to three years from one year for PUs granted prior to 2023. The number of PUs granted in 2023 that will ultimately vest will be determined, subject to certain conditions and limitations, based on the Company’s achievement of the performance targets set forth in the awards as well as its TSR relative to the TSR of the companies included as of January 1, 2023 in the S&P 400 Midcap Index (the “Peer Group”) over the three-year performance period.
The grant date fair value for PUs granted in 2023 is determined using a Monte Carlo simulation model. This model simulates a range of possible future stock prices and estimates the probabilities of the potential payouts. This model also incorporates the following assumptions:
•The historical volatility for the companies in the Peer Group was measured using the most recent three-year period.
•The risk-free interest rate is based on the U.S. Treasury rate assumption commensurate with the three-year performance period.
•For determining the TSR of the Company and the companies in the Peer Group, dividends are assumed to have been reinvested in the stock of the issuing entities on a continuous basis.
•The correlation coefficients used to model the way in which each entity tends to move in relation to each other are based upon the price data used to calculate historical volatility.
GENPACT LIMITED AND ITS SUBSIDIARIES
Notes to the Consolidated Financial Statements
(In thousands, except per share data and share count)
18. Stock-based compensation (Continued)
The fair value of each PU granted in 2023 to employees was estimated on the date of grant using the following valuation assumptions:
| | | | | | | | | | | |
| Year ended December 31, 2023 |
| Dividend yield | 1.22 | % | — | 1.52 | % |
| Expected life (years) | 2.54 | — | 2.80 |
| Risk-free rate of interest for expected life | 3.80 | % | — | 4.44 | % |
| Volatility | 24.03 | % | — | 24.71 | % |
A summary of PU activity during the years ended December 31, 2021, 2022 and 2023 is set out below:
| | | | | | | | | | | | | | | | | |
| Year ended December 31, 2021 |
| Number of
Performance Units | | Weighted Average
Grant Date
Fair Value | | Maximum Shares
Eligible to Receive |
| Outstanding as of January 1, 2021 | 4,876,196 | | | $ | 34.56 | | | 4,876,196 | |
| Granted | 1,340,877 | | | 44.06 | | | 2,681,754 | |
| Vested (Note b) | (1,784,140) | | | 30.66 | | | (1,784,140) | |
| Forfeited | (258,258) | | | 39.97 | | | (320,098) | |
| Adjustment upon final determination of level of performance goal achievement (Note c) | 408,480 | | | 43.99 | | | |
| Adjustment upon final determination of level of performance goal achievement (Note d) | | | | | (870,557) | |
| Outstanding as of December 31, 2021 | 4,583,155 | | | $ | 39.40 | | | 4,583,155 | |
| Expected to vest (Note a) | 4,263,803 | | | | | |
| | | | | | | | | | | | | | | | | |
| Year ended December 31, 2022 |
| Number of
Performance Units | | Weighted Average
Grant Date
Fair Value | | Maximum Shares
Eligible to Receive |
| Outstanding as of January 1, 2022 | 4,583,155 | | | $ | 39.40 | | | 4,583,155 | |
| Granted | 1,590,794 | | | 44.50 | | | 3,181,588 | |
| Vested (Note e) | (2,161,789) | | | 34.61 | | | (2,161,789) | |
| Forfeited | (487,909) | | | 43.52 | | | (642,512) | |
| Adjustment upon final determination of level of performance goal achievement (Note f) | 46,700 | | | 44.20 | | | |
| Adjustment upon final determination of level of performance goal achievement (Note g) | | | | | (1,389,491) | |
| Outstanding as of December 31, 2022 | 3,570,951 | | | $ | 44.07 | | | 3,570,951 | |
| Expected to vest (Note a) | 3,224,941 | | | | | |
GENPACT LIMITED AND ITS SUBSIDIARIES
Notes to the Consolidated Financial Statements
(In thousands, except per share data and share count)
18. Stock-based compensation (Continued)
A summary of PU activity during the years ended December 31, 2019, 2020 and 2021 is set out below:
| | | | | | | | | | | | | | | | | |
| Year ended December 31, 2019 |
| Number of
Performance Units | | Weighted Average
Grant Date
Fair Value | | Maximum Shares
Eligible to Receive |
| Outstanding as of January 1, 2019 | 3,712,402 | | | $ | 28.40 | | | 3,712,402 | |
| Granted | 1,579,109 | | | 34.68 | | | 3,158,218 | |
| Vested (Note b) | (3,276) | | | 27.47 | | | (3,276) | |
| Forfeited | (248,031) | | | 29.04 | | | (278,755) | |
| Adjustment upon final determination of level of performance goal achievement (Note c) | 1,018,260 | | | 34.72 | | | |
| Adjustment upon final determination of level of performance goal achievement (Note d) | | | | | (530,125) | |
| Outstanding as of December 31, 2019 | 6,058,464 | | | $ | 31.07 | | | 6,058,464 | |
| Expected to vest (Note a) | 5,507,640 | | | | | |
| | | | | | | | | | | | | | | | | |
| Year ended December 31, 2020 |
| Number of
Performance Units | | Weighted Average
Grant Date
Fair Value | | Maximum Shares
Eligible to Receive |
| Outstanding as of January 1, 2020 | 6,058,464 | | | $ | 31.07 | | | 6,058,464 | |
| Granted | 1,253,766 | | | 42.49 | | | 2,507,532 | |
| Vested (Note e) | (1,496,377) | | | 25.21 | | | (1,496,377) | |
| Forfeited | (539,670) | | | 33.77 | | | (560,867) | |
| Adjustment upon final determination of level of performance goal achievement (Note f) | (399,987) | | | 42.60 | | | |
| Adjustment upon final determination of level of performance goal achievement (Note g) | | | | | (1,632,556) | |
| Outstanding as of December 31, 2020 | 4,876,196 | | | $ | 34.56 | | | 4,876,196 | |
| Expected to vest (Note a) | 4,573,356 | | | | | |
| | Year ended December 31, 2021 |
| Number of
Performance Units | | Weighted Average
Grant Date
Fair Value | | Maximum Shares
Eligible to Receive |
| Outstanding as of January 1, 2021 | 4,876,196 | | | $ | 34.56 | | | 4,876,196 | |
| Year ended December 31, 2023 | | | Year ended December 31, 2023 |
| Number of
Performance Units | | | Number of
Performance Units | | Weighted Average
Grant Date
Fair Value | | Maximum Shares
Eligible to Receive |
| Outstanding as of January 1, 2023 | |
| Granted | Granted | 1,340,877 | | | 44.06 | | | 2,681,754 | |
| Vested (Note h) | Vested (Note h) | (1,784,140) | | | 30.66 | | | (1,784,140) | |
| Forfeited | Forfeited | (258,258) | | | 39.97 | | | (320,098) | |
| Adjustment upon final determination of level of performance goal achievement (Note i) | Adjustment upon final determination of level of performance goal achievement (Note i) | 408,480 | | | 43.99 | | |
| Adjustment upon final determination of level of performance goal achievement (Note j) | | (870,557) | |
| Outstanding as of December 31, 2021 | 4,583,155 | | | $ | 39.40 | | | 4,583,155 | |
| Outstanding as of December 31, 2023 | |
| Expected to vest (Note a) | Expected to vest (Note a) | 4,263,803 | | | | | |
(a)PUs expected to vest are based on the probable achievement of the performance targets after considering an estimated forfeiture rate.
GENPACT LIMITED AND ITS SUBSIDIARIES
Notes to the Consolidated Financial Statements
(In thousands, except per share data and share count)
18. Stock-based compensation (Continued)
(b)PUs that vested in 2019 were net settled upon vesting by issuing 2,151 shares (net of minimum statutory tax withholding).
(c)Represents a 66.67% increase in the number of target shares expected to vest as a result of achievement of higher-than-target performance for PUs granted in 2019 partially offset by an adjustment made in March 2019 to the number of shares subject to the PUs granted in 2018 upon certification of the level of achievement of the performance targets underlying such awards.
(d)Represents the difference between the maximum number of shares achievable and the number of shares expected to vest under the PU awards granted in 2019 based on the level of achievement of the performance goals. Also includes an adjustment made in March 2019 to the number of shares subject to the PUs granted in 2018 upon certification of the level of achievement of the performance targets underlying such awards.
(e)Vested PUs in the year 2020 were net settled upon vesting by issuing 902,532 shares (net of minimum statutory tax withholding).
(f)Represents a 32.98% decrease in the number of target shares expected to vest as a result of achievement of lower-than-target performance for PUs granted in 2020, partially offset by an adjustment made in March 2020 to the number of shares subject to the PUs granted in 2019 upon certification of the level of achievement of the performance targets underlying such awards.
(g)Represents the difference between the maximum number of shares achievable and the number of shares expected to vest under the PU awards granted in 2020 based on the level of achievement of the performance goals. Also includes an adjustment made in March 2020 to the number of shares subject to the PUs granted in 2019 upon certification of the level of achievement of the performance targets underlying such awards.
(h)1,784,140 PSUs that vested during the year 2021 were net settled upon vesting by issuing 1,102,440 shares (net of minimum statutory tax withholding).
(i)(c)Represents a 31.20% increase in the number of target shares expected to vest as a result of achievement of higher-than-target performance for PUs granted in 2021, partially offset by an adjustment made in March 2021 to the number of shares subject to the PUs granted in 2020 upon certification of the level of achievement of the performance targets underlying such awards.
(j)(d)Represents the difference between the maximum number of shares achievable and the number of shares expected to vest under the PU awards granted in 2021 based on the level of achievement of the performance goals. Also includes an adjustment made in March 2021 to the number of shares subject to the PUs granted in 2020 upon certification of the level of achievement of the performance targets underlying such awards.
(e)2,161,789 PSUs that vested during the year 2022 were net settled upon vesting by issuing 1,300,511 shares (net of minimum statutory tax withholding).
(f)Represents a 1.31% increase in the number of target shares expected to vest as a result of achievement of higher-than-target performance for PUs granted in 2022, partially offset by an adjustment made in March 2022 to the number of shares subject to the PUs granted in 2021 upon certification of the level of achievement of the performance targets underlying such awards.
(g)Represents the difference between the maximum number of shares achievable and the number of shares expected to vest under the PU awards granted in 2022 based on the level of achievement of the performance goals. Also includes an adjustment made in March 2022 to the number of shares subject to the PUs granted in 2021 upon certification of the level of achievement of the performance targets underlying such awards.
(h)647,549 PSUs that vested during the year 2023 were net settled upon vesting by issuing 412,275 shares (net of minimum statutory tax withholding).
(i)Represents an adjustment made in March 2023 to the number of shares subject to the PUs granted in 2022 upon certification of the level of achievement of the performance targets underlying such awards.
As of December 31, 2021,2023, the total remaining unrecognized stock-based compensation cost related to PUs amounted to $58,752,$42,615, which will be recognized over the weighed average remaining requisite vesting period of 1.81.6 years.
GENPACT LIMITED AND ITS SUBSIDIARIES
Notes to the Consolidated Financial Statements
(In thousands, except per share data and share count)
18. Stock-based compensation (Continued)
Employee Stock Purchase Plan (ESPP)
On May 1, 2008, the Company adopted the Genpact Limited U.S. Employee Stock Purchase Plan and the Genpact Limited International Employee Stock Purchase Plan (together, the “ESPP”). In April 2018, these plans were amended and restated, and their terms were extended to August 31, 2028.
The ESPP allows eligible employees to purchase the Company’s common shares through payroll deductions at 90% of the closing price of the Company’s common shares on the last business day of each purchase interval. The dollar amount of common shares purchased under the ESPP must not exceed 15% of the participating employee’s base salary, subject to a cap of $25 per employee per calendar year. With effect from September 1, 2009, the offering periods commence on the first business day in March, June, September and December of each year and end on the last business day of the subsequent May, August, November and February. 4,200,000 common shares have been reserved for issuance in the aggregate over the term of the ESPP.
During the years ended December 31, 2019, 20202021, 2022 and 2021, 264,440, 315,2452023, 285,657, 324,783 and 285,657337,875 common shares, respectively, were issued under the ESPP.
The ESPP is considered compensatory under FASB guidance on Compensation-Stock Compensation.
GENPACT LIMITED AND ITS SUBSIDIARIES
Notes to the Consolidated Financial Statements
(In thousands, except per share data and share count)
18. Stock-based compensation (Continued)
The compensation expense for the ESPP is recognized in accordance with the FASB guidance on Compensation—Stock Compensation. The compensation expense for the ESPP during the years ended December 31, 2019, 20202021, 2022 and 20212023 was $1,083, $1,299$1,420, $1,537 and $1,420,$1,468, respectively, and has been allocated to cost of revenue and selling, general, and administrative expenses.
19. Capital stock
The Company’s authorized capital stock as of December 31, 20202022 and 20212023 consisted of 500 million common shares with a par value of $0.01 per share, and 250 million preferred shares with a par value of $0.01 per share. There were 189,045,661182,924,416 and 185,336,357179,494,132 common shares, and no preferred shares, issued and outstanding as of December 31, 20202022 and 2021,2023, respectively.
Holders of common shares are entitled to 1one vote per share. Upon the liquidation, dissolution or winding up of the Company, common shareholders are entitled to receive a ratable share of the available net assets of the Company after payment of all debts and other liabilities. The common shares have no preemptive, subscription, redemption or conversion rights.
The Company’s board of directors by resolution can establish one or more series of preferred shares having such par value, designations, dividend rates, relative voting rights, conversion or exchange rights, redemption rights, liquidation rights and other relative participation, optional or other rights, qualifications, limitations or restrictions as may be fixed by the board of directors without shareholder approval. Such rights, preferences, powers and limitations as may be established could also have the effect of discouraging an attempt to obtain control of the Company. These preferred shares are of the type commonly known as “blank-check” preferred shares.
Under Bermuda law, the Company may declare and pay dividends from time to time unless there are reasonable grounds for believing that the Company is or would, after the payment, be unable to pay its liabilities as they become due or that the realizable value of its assets would thereby be less than the aggregate of its liabilities, its issued share capital, and its share premium accounts. Under the Company’s bye-laws, each common share is entitled to dividends if, as and when dividends are declared by the Company’s board of directors. There are no restrictions in Bermuda on the Company’s ability to transfer funds (other than funds denominated in Bermuda dollars) in or out of Bermuda or to pay dividends to U.S. residents who are holders of common shares. The Company’s ability to declare and pay cash dividends is restricted by its debt covenants.
Share Repurchases
The Board of Directors of the Company (the “Board”) has authorized repurchases of up to $1,750,000$2,250,000 under the Company’s existing share repurchase program.program, including $500,000 approved during the first quarter of 2023. The Company’s share repurchase program does not obligate it to acquire any specific number of shares. Under the program, shares may be purchased in privately negotiated and/or open market transactions, including under plans complying with Rule 10b5-1 under the Securities Exchange Act of 1934, as amended.
GENPACT LIMITED AND ITS SUBSIDIARIES
Notes to the Consolidated Financial Statements
(In thousands, except per share data and share count)
19. Capital stock (Continued)
During the years ended December 31, 2019, 20202021, 2022 and 2021,2023, the Company repurchased 766,154, 3,412,2936,577,562, 4,777,205 and 6,577,5626,013,793 of its common shares, respectively, on the open market at a weighted average price of $39.16, $40.16$45.32, $44.79 and $45.32$37.48 per share, respectively, for an aggregate cash amount of $30,000, $137,044$298,087, $213,986 and $298,087,$225,379, respectively. All repurchased shares have been retired.
The Company records repurchases of its common shares on the settlement date of each transaction. Shares purchased and retired are deducted to the extent of their par value from common stock and from retained earnings for the excess over par value. Direct costs incurred to acquire the shares are included in the total cost of the shares purchased. For the years ended December 31, 2019, December 31, 20202021, 2022 and December 31, 2021, $15, $68 and $132, respectively, was deducted from2023, retained earnings inwere reduced by direct costs, including taxes, related to share repurchases.repurchases of $132, $96 and $720, respectively.
$338,911399,545 remained available for share repurchases under ourthe Company's existing share repurchase program as of December 31, 2021.2023. This repurchase program does not obligate us to acquire any specific number of shares and does not specify an expiration date.
GENPACT LIMITED AND ITS SUBSIDIARIES
Notes to the Consolidated Financial Statements
(In thousands, except per share data and share count)
19. Capital stock (Continued)
Dividend
On February 7, 2019, the Company announced that its Board of Directors had approved a 13% increase in its quarterly cash dividend to $0.085 per share, up from $0.075 per share in 2018, representing an annual dividend of $0.34 per common share, up from $0.30 per share in 2018, payable to holders of the Company’s common shares. On March 20, 2019, June 21, 2019, September 20, 2019 and December 18, 2019, the Company paid dividends of $0.085 per share, amounting to $16,119, $16,188, $16,208 and $16,156 in the aggregate, to shareholders of record as of March 8, 2019, June 12, 2019, September 11, 2019 and December 9, 2019, respectively.
On February 6, 2020, the Company announced that its Board of Directors had approved a 15% increase in its quarterly cash dividend to $0.0975 per share, up from $0.085 per share in 2019, representing an annual dividend of $0.39 per common share, up from $0.34 per share in 2019, payable to holders of the Company’s common shares. On March 18, 2020, June 26, 2020, September 23, 2020 and December 23, 2020, the Company paid dividends of $0.0975 per share, amounting to $18,543, $18,595, $18,637 and $18,437 in the aggregate, to shareholders of record as of March 9, 2020, June 11, 2020, September 11, 2020 and December 9, 2020, respectively.
On February 9, 2021, the Company announced that its Board of Directors had approved a 10% increase in its quarterly cash dividend to $0.1075 per share, up from $0.0975 per share in 2020, representing an annual dividend of $0.43 per common share, up from $0.39 per share in 2020, payable to holders of the Company’s common shares. On March 19, 2021, June 23, 2021, September 24, 2021 and December 22, 2021, the Company paid a dividenddividends of $0.1075 per share, amounting to $20,115, $20,133, $20,213 and $20,018 in the aggregate, to shareholders of record as of March 10, 2021, June 11, 2021, September 10, 2021 and December 10, 2021, respectively.
On February 10, 2022, the Company announced that its Board had approved a 16% increase in its quarterly cash dividend to $0.125 per share, up from $0.1075 per share in 2021, representing an annual dividend of $0.50 per common share, up from $0.43 per share in 2021, payable to holders of the Company’s common shares. On March 23, 2022, June 24, 2022, September 23, 2022 and December 23, 2022, the Company paid a dividend of $0.125 per share, amounting to $23,134, $22,935, $22,873 and $22,895 in the aggregate, to shareholders of record as of March 10, 2022, June 10, 2022, September 9, 2022 and December 9, 2022, respectively.
On February 9, 2023, the Company announced that its Board had approved a 10% increase in its quarterly cash dividend to $0.1375 per share, up from $0.125 per share in 2022, representing an annual dividend of $0.55 per common share, up from $0.50 per share in 2022, payable to holders of the Company’s common shares. On March 24, 2023, June 26, 2023, September 26, 2023 and December 22, 2023, the Company paid a dividend of $0.1375 per share, amounting to
$25,255, $25,031, $24,944 and $24,784 in the aggregate, to shareholders of record as of March 10, 2023, June 9, 2023, September 8, 2023 and December 8, 2023, respectively.
20. Earnings per share
The Company calculates earnings per share in accordance with FASB guidance on earnings per share. Basic and diluted earnings per common share give effect to the change in the number of Company common shares outstanding. The calculation of basic earnings per common share is determined by dividing net income available to common shareholders by the weighted average number of common shares outstanding during the respective periods. The potentially dilutive shares, consisting of outstanding options on common shares, restricted share units, common shares to be issued under the ESPP and performance units, have been included in the computation of diluted net earnings per share and the number of weighted average shares outstanding, except where the result would be anti-dilutive.
GENPACT LIMITED AND ITS SUBSIDIARIES
Notes to the Consolidated Financial Statements
(In thousands, except per share data and share count)
20. Earnings per share (Continued)
The number of shares subject to stock awards outstanding but not included in the computation of diluted earnings per common share because their effect was anti-dilutive is 1,809,069, 1,182,572was 1,663,219, 2,734,825 and 1,663,2192,289,623 for the years ended December 31, 2019, 20202021, 2022 and 2021,2023, respectively.
| | Year ended December 31, |
| 2019 | | 2020 | | 2021 |
| Year ended December 31, | | | Year ended December 31, |
| 2021 | | | 2021 | | 2022 | | 2023 |
| Net income | Net income | $ | 304,881 | | | $ | 308,276 | | | $ | 369,448 | |
| Weighted average number of common shares used in computing basic earnings per common share | Weighted average number of common shares used in computing basic earnings per common share | 190,074,475 | | | 190,396,780 | | | 187,802,219 | |
| Dilutive effect of stock-based awards | Dilutive effect of stock-based awards | 5,086,380 | | | 5,384,191 | | | 5,159,622 | |
| Weighted average number of common shares used in computing dilutive earnings per common share | Weighted average number of common shares used in computing dilutive earnings per common share | 195,160,855 | | | 195,780,971 | | | 192,961,841 | |
| Earnings per common share | Earnings per common share | | | | | |
| Basic | Basic | $ | 1.60 | | | $ | 1.62 | | | $ | 1.97 | |
| Basic | |
| Basic | |
| Diluted | Diluted | $ | 1.56 | | | $ | 1.57 | | | $ | 1.91 | |
21. Other operating (income) expense, net
| | | | | | | | | | | | | | | | | |
| Year ended December 31, |
| 2021 | | 2022 | | 2023 |
| Write-down of intangible assets and property, plant and equipment^ | $ | 915 | | | $ | 1,377 | | | $ | — | |
| Write-down of operating lease right-of-use assets and other assets^* | — | | | 20,307 | | | — | |
| Impairment charge on assets classified as held for sale^ | — | | | 32,575 | | | — | |
| Change in fair value of earn out consideration and deferred consideration (relating to business acquisitions) | (750) | | | (452) | | | (118) | |
| Loss on the sale of business classified as held for sale^ | — | | | — | | | 802 | |
| Gain on termination of lease^* | — | | | — | | | (4,874) | |
| Other operating (income) expense | (1,368) | | | (612) | | | (526) | |
| Other operating (income) expense, net | $ | (1,203) | | | $ | 53,195 | | | $ | (4,716) | |
^ Refer toNotes 8, 10 and 27 for additional information about other operating (income) expense, net for the years ended December 31, 2021, 2022 and 2023.
* Of the total write-down, $20,307 and $(4,874) pertains to restructuring charges for the years ended December 31, 2022 and 2023, respectively. No such charges were recorded in the year ended December 31, 2021. Refer to Notes 12 and 27 for additional information.
22. Interest income (expense), net
Interest income (expense), net consists of the following:
| | | | | | | | | | | | | | | | | |
| Year ended December 31, |
| 2021 | | 2022 | | 2023 |
| Interest income | $ | 6,878 | | | $ | 5,899 | | | $ | 18,373 | |
| Interest expense | (58,312) | | | (58,103) | | | (66,308) | |
| Interest income (expense), net | $ | (51,434) | | | $ | (52,204) | | | $ | (47,935) | |
GENPACT LIMITED AND ITS SUBSIDIARIES
Notes to the Consolidated Financial Statements
(In thousands, except per share data and share count)
21. Other operating (income) expense, net
| | | | | | | | | | | | | | | | | |
| Year ended December 31, |
| 2019 | | 2020 | | 2021 |
| Write-down of intangible assets and property, plant and equipment* | $ | 3,511 | | | $ | 14,083 | | | $ | 915 | |
| Write-down of operating lease right-of-use assets and other assets** | — | | | 18,084 | | | — | |
| Change in fair value of earn out consideration and deferred consideration (relating to business acquisitions) | — | | | (7,790) | | | (750) | |
| Other operating (income) expense# | (34,545) | | | (5,046) | | | (1,368) | |
| Other operating (income) expense, net | $ | (31,034) | | | $ | 19,331 | | | $ | (1,203) | |
* Refer toNotes 10 and 28 for additional information about other operating (income) expense, net for the year ended December 31, 2020.
** Of the total write-down, $10,244 pertains to restructuring charges for the year ended December 31, 2020. No such charges were recorded for the years ended December 31, 2019 and 2021. Refer to Notes 12 and 28 for additional details.
#Includes a gain of $31,380 for the year ended December 31, 2019 on land rights transferred to a third-party real estate developer in exchange for an interest in commercial property being developed on the land. No corresponding charges were recorded in the years ended December 31, 2020 and 2021.
22. Interest income (expense), net
Interest income (expense), net consists of the following:
| | | | | | | | | | | | | | | | | |
| Year ended December 31, |
| 2019 | | 2020 | | 2021 |
| Interest income | $ | 7,321 | | | $ | 7,284 | | | $ | 6,878 | |
| Interest expense | (50,779) | | | (56,244) | | | (58,312) | |
| Interest income (expense), net | $ | (43,458) | | | $ | (48,960) | | | $ | (51,434) | |
23. Income taxes
Income tax expense (benefit) for the years ended December 31, 2019, 20202021, 2022 and 20212023 is allocated as follows:
| | Year ended December 31, |
| 2019 | | 2020 | | 2021 |
| Year ended December 31, | | | Year ended December 31, |
| 2021 | | | 2021 | | 2022 | | 2023 |
| Income from continuing operations | Income from continuing operations | $ | 94,536 | | | $ | 92,201 | | | $ | 113,681 | |
| Other comprehensive income: | Other comprehensive income: | |
| Unrealized gains (losses) on cash flow hedges | (4,058) | | | (3,327) | | | 5,265 | |
| Cash flow hedges | |
| Cash flow hedges | |
| Cash flow hedges | |
| Retirement benefits | Retirement benefits | (2,720) | | | (894) | | | 3,859 | |
| Retained earnings: | |
| Deferred tax benefit recognized on adoption of ASU 2016-13 | — | | | (935) | | | — | |
The components of income before income tax expense (benefit) from continuing operations are as follows:
| | Year ended December 31, |
| 2019 | | 2020 | | 2021 |
| Year ended December 31, | | | Year ended December 31, |
| 2021 | | | 2021 | | 2022 | | 2023 |
| Domestic (U.S.) | Domestic (U.S.) | $ | 27,783 | | | $ | 122,497 | | | $ | 126,107 | |
| Foreign (other than U.S.) | Foreign (other than U.S.) | 371,634 | | | 277,980 | | | 357,022 | |
| Income before income tax expense | $ | 399,417 | | | $ | 400,477 | | | $ | 483,129 | |
| Income before income tax expense (benefit) | |
Income tax expense (benefit) attributable to income from continuing operations consists of:
| | | | | | | | | | | | | | | | | |
| Year ended December 31, |
| 2021 | | 2022 | | 2023 |
| Current tax expense: | | | | | |
| Domestic (U.S. federal) | $ | 34,538 | | | $ | 17,525 | | | $ | 20,222 | |
| Domestic (U.S. state) | 5,605 | | | 4,582 | | | 7,558 | |
| Foreign (other than U.S.) | 82,801 | | | 118,876 | | | 101,121 | |
| $ | 122,944 | | | $ | 140,983 | | | $ | 128,901 | |
| Deferred tax expense (benefit): | | | | | |
| Domestic (U.S. federal) (Note a) | $ | (6,039) | | | $ | (10,481) | | | $ | (122,166) | |
| Domestic (U.S. state) (Note b) | 232 | | | (1,910) | | | (32,112) | |
| Foreign (other than U.S.) | (3,456) | | | (16,760) | | | (3,654) | |
| $ | (9,263) | | | $ | (29,151) | | | $ | (157,932) | |
| Total income tax expense (benefit) | $ | 113,681 | | | $ | 111,832 | | | $ | (29,031) | |
(a)For the year ended December 31, 2023, the amount includes a U.S. federal tax benefit on the transfer of intellectual property rights amounting to $138,390.
(b)For the year ended December 31, 2023, the amount includes a state tax benefit on the transfer of intellectual property rights amounting to $33,800.
GENPACT LIMITED AND ITS SUBSIDIARIES
Notes to the Consolidated Financial Statements
(In thousands, except per share data and share count)
23. Income taxes (Continued)
Income tax expense (benefit) attributable to income from continuing operations consists of:
| | | | | | | | | | | | | | | | | |
| Year ended December 31, |
| 2019 | | 2020 | | 2021 |
| Current tax expense: | | | | | |
| Domestic (U.S. federal) | $ | 2,854 | | | $ | 23,668 | | | $ | 34,538 | |
| Domestic (U.S. state) | 3,908 | | | 10,765 | | | 5,605 | |
| Foreign (other than U.S.) | 104,089 | | | 80,355 | | | 82,801 | |
| $ | 110,851 | | | $ | 114,788 | | | $ | 122,944 | |
| Deferred tax expense (benefit): | | | | | |
| Domestic (U.S. federal) | $ | 2,669 | | | $ | (7,329) | | | $ | (6,039) | |
| Domestic (U.S. state) | (1,679) | | | (3,770) | | | 232 | |
| Foreign (other than U.S.) | (17,305) | | | (11,488) | | | (3,456) | |
| $ | (16,315) | | | $ | (22,587) | | | $ | (9,263) | |
| Total income tax expense (benefit) | $ | 94,536 | | | $ | 92,201 | | | $ | 113,681 | |
Income tax expense (benefit) attributable to income from continuing operations differed from the amounts computed by applying the U.S. federal statutory income tax rate of 21% to income before income taxestax expense (benefit) as a result of the following:
| | Year ended December 31, |
| 2019 | | 2020 | | 2021 |
| Income before income tax expense | $ | 399,417 | | | $ | 400,477 | | | $ | 483,129 | |
| Statutory tax rates | 21 | % | | 21 | % | | 21 | % |
| Year ended December 31, | | | Year ended December 31, |
| 2021 | | | 2021 | | 2022 | | 2023 |
| Income before income tax expense (benefit) | |
| Statutory income tax rates | | Statutory income tax rates | 21 | % | | 21 | % | | 21 | % |
| Computed expected income tax expense | Computed expected income tax expense | 83,878 | | | 84,100 | | | 101,457 | |
| Increase (decrease) in income taxes resulting from: | Increase (decrease) in income taxes resulting from: | |
| Foreign tax rate differential | |
| Foreign tax rate differential | |
| Foreign tax rate differential | Foreign tax rate differential | 31,121 | | | 15,456 | | | 10,747 | |
| Tax benefit from tax holiday | Tax benefit from tax holiday | (21,393) | | | (16,063) | | | (3,159) | |
| True-up of prior years tax liability | True-up of prior years tax liability | (3,568) | | | (3,420) | | | 7,590 | |
| Interest income on income tax refund | Interest income on income tax refund | — | | | — | | | (7,780) | |
| Non-deductible expenses | Non-deductible expenses | 2,152 | | | 372 | | | 1,755 | |
| Effect of change in tax rates | 6,497 | | | 453 | | | 1,740 | |
| Change in valuation allowance | 10,515 | | | 142,733 | | | 6,244 | |
| Impact of change in tax rates (Note c) | |
| Change in valuation allowance (Note d) | |
| Unrecognized tax benefits | Unrecognized tax benefits | 5,502 | | | 3,228 | | | (327) | |
| Employment related tax incentive | Employment related tax incentive | (5,239) | | | — | | | (3,930) | |
| Internal restructuring | — | | | (129,688) | | | — | |
| State income taxes | 2,229 | | | 6,995 | | | 5,837 | |
| Internal transfer of intellectual property rights (Note d) | |
| State income taxes (Note e) | |
| Excess tax benefit on share-based compensation | Excess tax benefit on share-based compensation | (2,743) | | | (7,310) | | | (7,773) | |
| Others* | (14,415) | | | (4,655) | | | 1,280 | |
| Others (Note f) | |
| Reported income tax expense (benefit) | Reported income tax expense (benefit) | $ | 94,536 | | | $ | 92,201 | | | $ | 113,681 | |
*Following the transfer/closure of certain affiliated entities, deferred tax liabilities recorded against the outside basis difference were reversed amounting to $3,782 during(c)For the year ended December 31, 2019. Additionally, during2023, the yearsamount includes a benefit of $35,771 resulting from a new income tax enacted in Bermuda on December 27, 2023, the impact of which has been fully offset by a valuation allowance.
(d)For the year ended December 31, 2019 and 2020,2023, the Company createdrecorded an income tax benefit of $169,945 in connection with an intra-entity transfer of certain intellectual property rights from certain non-U.S. subsidiaries to certain wholly-owned US subsidiaries in an effort to better align with the Company’s business operations, which is reflected in the rows titled “change in valuation allowance” and “internal transfer of intellectual property rights” in the above reconciliation table.
(e)For the year ended December 31, 2023, the amount does not include a deferredstate tax assetbenefit on the impairmenttransfer of one of its intercompany investments for income tax purposesintellectual property rights amounting to $8,069 and $8,384, respectively. It was not more likely than not that$33,800.
(f)During the resulting net deferredyear ended December 31, 2022, the Company recorded a tax asset would be realized. Therefore,benefit on the outside basis difference on the stock of a full valuation allowance was established.subsidiary amounting to $6,881.
GENPACT LIMITED AND ITS SUBSIDIARIES
Notes to the Consolidated Financial Statements
(In thousands, except per share data and share count)
23. Income taxes (Continued)
A portion of the profits of the Company’s operations is exempt from income tax in India. One of the Company’s Indian subsidiaries has certain units eligible for a tax holiday as a special economic zone ("SEZ") unit in respect of 100% of the export profits it generates for a period of 5 years from commencement, 50% of such profits for the next 5 years (year 6 to year 10 from commencement) and 50% of the profits for an additional period of 5 years (year 11 to year 15 from commencement), subject to the satisfaction of certain capital investment requirements.
During the year ended December 31, 2019, the Indian taxing authorities introduced a new tax regime under which a company can elect to pay taxes at a lower tax rate by foregoing certain deductions and exemptions, including SEZ exemptions. The Company has elected to forego applicable Indian tax holidays in order to benefit from the reduced tax rate under the new tax regime after March 31, 2021.
The effect of the Indian tax holiday on both basic and diluted earnings per share was $0.11, $0.08$0.02, $0.00 and $0.02, respectively, for the years ended December 31, 2019, 20202021, 2022 and 2021.2023.
The components of the Company’s deferred tax balances as of December 31, 20202022 and 20212023 are as follows:
| | As of December 31, |
| 2020 | | 2021 |
| As of December 31, | | | As of December 31, |
| 2022 | | | 2022 | | 2023 |
| Deferred tax assets | Deferred tax assets | | | |
| Net operating loss carry forwards | $ | 37,278 | | | $ | 37,593 | |
| Net operating loss carryforwards | |
| Net operating loss carryforwards | |
| Net operating loss carryforwards | |
| Accrued expenses and other liabilities | Accrued expenses and other liabilities | 70,634 | | | 70,802 | |
| Allowance for credit losses | Allowance for credit losses | 9,930 | | | 9,000 | |
| Property, plant & equipment, net | 3,387 | | | 4,079 | |
| Property, plant and equipment, net | |
| Lease liabilities | Lease liabilities | 59,823 | | | 50,091 | |
| Share-based compensation | Share-based compensation | 35,424 | | | 31,147 | |
| Intangible assets, net | Intangible assets, net | 165,347 | | | 168,737 | |
| Retirement benefits | Retirement benefits | 14,761 | | | 9,721 | |
| Contract liabilities | Contract liabilities | 6,080 | | | 8,012 | |
| Tax credit carry forwards | 8,692 | | | 15,724 | |
| Tax credit carryforwards | |
| Others | Others | 14,619 | | | 10,277 | |
| Total deferred tax assets | Total deferred tax assets | $ | 425,975 | | | $ | 415,183 | |
| Less: Valuation allowance | Less: Valuation allowance | (206,011) | | | (212,192) | |
| Total deferred tax assets, net of valuation allowance | Total deferred tax assets, net of valuation allowance | $ | 219,964 | | | $ | 202,991 | |
| Deferred tax liabilities | Deferred tax liabilities | | | |
| Intangible assets, net | Intangible assets, net | $ | 21,884 | | | $ | 6,598 | |
| Intangible assets, net | |
| Intangible assets, net | |
| Property, plant and equipment, net | Property, plant and equipment, net | 3,700 | | | 1,907 | |
| Right-of use lease assets | 48,816 | | | 40,733 | |
| Earn-out liabilities | 6,189 | | | 5,368 | |
| Right-of use assets | |
| Retirement benefits | Retirement benefits | 6,579 | | | 3,404 | |
| Investments in foreign subsidiaries not indefinitely reinvested | Investments in foreign subsidiaries not indefinitely reinvested | 2,726 | | | 1,708 | |
| Derivative instruments | Derivative instruments | 2,810 | | | 6,153 | |
| Goodwill | Goodwill | 18,649 | | | 29,229 | |
| Others | Others | 3,453 | | | 5,511 | |
| Total deferred tax liabilities | Total deferred tax liabilities | $ | 114,806 | | | $ | 100,611 | |
| Net of deferred tax assets and liabilities | Net of deferred tax assets and liabilities | $ | 105,158 | | | $ | 102,380 | |
| | | | | | | | | | | |
| As of December 31, |
| Classified as | 2022 | | 2023 |
| Deferred tax assets non-current | $ | 135,483 | | | $ | 298,921 | |
| Deferred tax liabilities non-current | 4,176 | | | 11,706 | |
| $ | 131,307 | | | $ | 287,215 | |
GENPACT LIMITED AND ITS SUBSIDIARIES
Notes to the Consolidated Financial Statements
(In thousands, except per share data and share count)
23. Income taxes (Continued)
| | | | | | | | | | | |
| As of December 31, |
| Classified as | 2020 | | 2021 |
| Deferred tax assets non-current | $ | 106,674 | | | $ | 106,322 | |
| Deferred tax liabilities non-current | 1,516 | | | 3,942 | |
| $ | 105,158 | | | $ | 102,380 | |
The change in the Company’s total valuation allowance for deferred tax assets as of December 31, 2019, 20202021, 2022 and 20212023 is as follows:
| | Year ended December 31, |
| 2019 | | 2020 | | 2021 |
| Year ended December 31, | | | Year ended December 31, |
| 2021 | | | 2021 | | 2022 | | 2023 |
| Opening valuation allowance | Opening valuation allowance | $ | 51,986 | | | $ | 62,628 | | | $ | 206,011 | |
| Reduction during the year | (4,240) | | | (35,662) | | | (1,206) | |
| Addition during the year | 14,882 | | | 179,045 | | | 7,387 | |
| Reduction during the year through continuing operations | |
| Addition during the year through continuing operations | |
| Closing valuation allowance | Closing valuation allowance | $ | 62,628 | | | $ | 206,011 | | | $ | 212,192 | |
During the year ended December 31, 2020,2023 the Company undertookcompleted an internal restructuring that involved theintra-entity transfer of certain marketing intangibles between its Luxembourg subsidiaries forintellectual property rights from certain non-US subsidiaries to certain wholly-owned US subsidiaries in an effort to better align with the Company's business operations. As a totalresult of $650,000. Thethis transfer, the Company had net operating loss carry forwards withreceived a full valuation allowance from prior years that were used to offset the Luxembourg taxable income arising from such transfer. The tax benefits resulting from the step-up of thein tax basis of the intangibles transferred are not expectedintellectual property assets to their current fair market value under applicable tax law. The determination of fair value involves judgments with respect to future revenue growth, operating margins and discount rates. The step-up in basis will be realizedamortizable against future taxable income and, accordingly, the Company recognized a full valuation allowance has been recordedone-time tax benefit of $169,945. The Company expects to reducerealize the deferred tax balances. Accordingly, this internal restructuring did not have any impact onasset recorded as a result of the Company’s income tax expense.intellectual property transfer and will periodically assess such realizability. The tax-deductible amortization related to the transferred intellectual property rights will be recognized over a 15-year period.
In assessing the realizability of deferred tax assets, management considers whether it is more likely than not that some or all of the deferred tax assets will not be realized. The ultimate realization of deferred tax assets depends on the generation of future taxable income during the periods in which temporary differences are deductible.
Management considers the scheduled reversal of deferred tax liabilities and projected taxable income in making this assessment. In order to fully realize a deferred tax asset, the Company must generate future taxable income prior to the expiration of the deferred tax asset under applicable law.
Management considers the scheduled reversal of deferred tax liabilities, carryback availability and projected taxable income in making this assessment. Based on the level of historical taxable income and projections for future taxable income over the periods during which the Company’s deferred tax assets are deductible, management believes that it is more likely than not that the Company will realize the benefits of its deductible temporarydifferences and carry forwards, net of the existing valuation allowances as of December 31, 2021.2023. The amount of the Company’s deferred tax assets considered realizable, however, could be reduced in the near term if estimates of future taxable income during the carry forwardcarryforward period are reduced.
For the years ended December 31, 2019, 20202021, 2022 and 2021,2023, the Company recognized net excess tax benefits on share-based compensation of $2,743, $7,310$7,773, $10,418 and $7,773,$5,274, respectively, in income tax expense attributable to continuing operations.
As of December 31, 2021,2023, the Company’s deferred tax assets related to net operating loss carry forwardscarryforwards of $145,525$426,761 amounted to $34,459$73,218 (excluding state netand local operating losses)loss carryforwards). NetFederal net operating losses of subsidiaries in Bermuda, Brazil, Germany, the United Kingdom, Brazil, Israel, Hong Kong, Germany, Austria, the United States and Luxembourg (for 2016 and prior years) amounted to $47,025 $331,451 and can be carried forward for an indefinite period.
GENPACT LIMITED AND ITS SUBSIDIARIES
Notes to the Consolidated Financial Statements
(In thousands, except per share data and share count)
23. Income taxes (Continued)
The Company’s remaining federal operating loss carry forwardscarryforwards expire as set forth in the table below:
| | Europe | | Others |
| | Europe | | | | Europe | | Others |
| Year ending December 31, | Year ending December 31, | | | | |
| 2022 | | $ | 57 | | | $ | — | |
| 2023 | | 310 | | | 1,039 | |
| 2024 | |
| 2024 | |
| 2024 | 2024 | | 567 | | | 2,225 | |
| 2025 | 2025 | | 1,772 | | | 2 | |
| 2026 | 2026 | | 38 | | | 19 | |
| 2027 | |
| 2028 | 2028 | | — | | | 94 | |
| 2029 | 2029 | | — | | | 185 | |
| 2032 | |
| 2034 | 2034 | | 18,820 | | | — | |
| 2035 | 2035 | | 7,357 | | | — | |
| 2036 | 2036 | | 63,374 | | | — | |
| 2041 | | — | | | 2,641 | |
| $ | 92,295 | | | $ | 6,205 | |
| | $ | |
In the table above, “Europe” includes federal net operating losses of subsidiaries in the Czech Republic, the Netherlands, Slovakia, Latvia Luxembourg and Portugal,Luxembourg, while “Others” includes net operating losses of subsidiaries in Argentina, Japan and the Philippines, China and Canada.Philippines.
As of December 31, 2021,2023, the Company had additional deferred tax assets of $13,338 for U.S. state and local tax loss carry forwards amounting tocarryforwards of $3,134 with varying expiration periods, most194,666, of which are between$154,336 will expire in various years from 2024 through 2042. The remaining 2022state and 2040. local net operating losses can be carried forward for an indefinite period.
As of December 31, 2021,2023, the Company had a total United States foreign tax credit carry forwardcarryforward of $15,724 for subsidiaries in the United States and India$22,449 which will expire as set forth in the table below:
| | Year ending December 31, | Year ending December 31, | Amount | Year ending December 31, | Amount |
| 2027 | |
| 2028 | 2028 | 6,378 | |
| 2029 | 2029 | 2,554 | |
| 2030 | 2030 | 2,665 | |
| 2031 | 2031 | 3,803 | |
| 2035 | 121 | |
| 2041 | 203 | |
| $ | 15,724 | |
| 2033 | |
| $ | |
GENPACT LIMITED AND ITS SUBSIDIARIES
Notes to the Consolidated Financial Statements
(In thousands, except per share data and share count)
23. Income taxes (Continued)
Undistributed earnings of the Company’s foreign (non-Bermuda) subsidiaries for which a deferred tax liability has not been recognized due to being indefinitely reinvested amounted to approximately $622,521$1,073,210 as of December 31, 2021.2023. The Company plans to indefinitely reinvest itsthe subsidiaries’ undistributed earnings, except for those earnings for which a deferred tax liability has already been accrued or which can be repatriated in a tax-free manner. Accordingly, with limited exceptions, the Company does not accrue any income, distribution or withholding taxes that would arise if such earnings were repatriated. Due to the Company’s changing corporate structure, the various methods that are available to repatriate earnings and uncertainty relative to the applicable taxes at the time of repatriation, it is not practicable to determine the amount of tax that would be imposed upon repatriation. If undistributed earnings are repatriated in the future, or are no longer deemed to be indefinitely reinvested, the Company will accrue the applicable amount of taxes associated with such earnings at that time.
GENPACT LIMITED AND ITS SUBSIDIARIES
Notes to the Consolidated Financial Statements
(In thousands, except per share data and share count)
23. Income taxes (Continued)
As of December 31, 2021, $875,9242023, $581,396 of the Company’s $899,458$583,670 in cash and cash equivalents was held by the Company’s foreign (non-Bermuda) subsidiaries. $3,481$207,953 of this cash is held by foreign subsidiaries for which the Company expects to incur and has accrued a deferred tax liability on the repatriation of $9,628$92,252 of retained earnings. $872,443$277,742 of the Company’s cash and cash equivalents is either held as retained earnings by foreign subsidiaries in jurisdictions where no tax is expected to be imposed upon repatriation orrepatriation. The remaining $95,701 in cash and cash equivalents held by foreign subsidiaries is being indefinitely reinvested.
The Company reports its gain/loss on derivatives designated as cash flow hedges, actuarial gain/loss on retirement benefits and currency translation adjustment, net of income taxes to the extent applicable, in OCI.
In June 2016, the FASB issued ASU No. 2016-13, requiring measurement and recognition of expected credit losses for financial assets held by the Company. In the quarter ended March 31, 2020, the Company adopted this ASU, effective January 1, 2020, and accordingly recorded deferred tax assets of $935 through retained earnings.
The following table summarizes activities related to our unrecognized tax benefits from January 1 to December 31 for each of 20202021, 2022 and 2021:2023:
| | 2020 | | 2021 |
| 2021 | | | 2021 | | 2022 | | 2023 |
| Opening Balance at January 1 | Opening Balance at January 1 | $ | 31,029 | | | $ | 34,300 | |
| Increase related to prior year tax positions, including recorded in acquisition accounting | Increase related to prior year tax positions, including recorded in acquisition accounting | 2,875 | | | 2,992 | |
| Decrease related to prior year tax positions | (1,309) | | | (455) | |
| Decrease related to prior year tax positions due to lapse of applicable statute of limitation | Decrease related to prior year tax positions due to lapse of applicable statute of limitation | (287) | | | (455) | |
| Increase related to current year tax positions, including recorded in acquisition accounting | 2,454 | | | 1,385 | |
| Increase related to current year tax positions | |
| Decrease related to settlements with taxing authorities | Decrease related to settlements with taxing authorities | (317) | | | (11,170) | |
| Decrease related to prior year tax positions for other reasons | |
| Effect of exchange rate changes | Effect of exchange rate changes | (145) | | | (946) | |
| Closing Balance at December 31 | Closing Balance at December 31 | $ | 34,300 | | | $ | 25,651 | |
As of December 31, 20202022 and 2021,2023, the Company had unrecognized tax benefits amounting to $34,30025,430 and $25,651,$19,236, respectively, which, if recognized, would impactaffect the Company's effective tax rate.
As of December 31, 20202022 and 2021,2023, the Company had accrued $6,3692,871 and $2,842,$3,312, respectively, in interest and $900$374 and $628,$499, respectively, for penalties relating to unrecognized tax benefits.income taxes.
During the years ended December 31, 2019, 20202021, 2022 and 2021,2023, the Company recognized $826, $662(13,851), $(2,583) and $(13,851),$220, respectively, in interest expense (income) related to income taxes.
In the next twelve months and forFor all tax years that remain open to examinations by U.S. federal and various state, local, and other U.S. taxing authorities, the Company estimates that it is reasonably possible that the total amount of its unrecognized tax benefits for existing tax positions will vary. However, the Company does not expect significant changes within the next twelve months other than adjustments depending on the progress of tax matters or examinations with various taxing authorities, which are difficult to predict.
With certain immaterial exceptions, the Company is no longer subject to U.S. federal, state and local or other U.S. income tax examinations by taxing authorities for years prior to 2017.2018. The Company’s subsidiaries in India and China are open to examination by relevant taxing authorities for tax years beginning on or after April 1, 20122016 and January 1, 2011,2014, respectively. The Company regularly reviews the likelihood of additional tax assessments and adjusts its unrecognized tax benefits as additional information or events require.
GENPACT LIMITED AND ITS SUBSIDIARIES
Notes to the Consolidated Financial Statements
(In thousands, except per share data and share count)
24. Segment reporting
The Company manages various types of business process and information technology services in an integrated manner for clients in various industries and geographic locations. The Company's operating segments are significant strategic business units that align its products and services with how it manages its business, approaches key markets and interacts with its clients.
The Company’sDuring the second quarter of 2022, the Company renamed its three reportable segments are as follows: (1) the Banking, Capital Markets and Insurance (BCMI);segment was renamed the Financial Services segment; (2) the Consumer Goods, Retail, Life Sciences and Healthcare (CGRLH);segment was renamed the Consumer and Healthcare segment; and (3) the High Tech, Manufacturing and Services (HMS).
GENPACT LIMITED AND ITS SUBSIDIARIES
Notes tosegment was renamed the Consolidated Financial Statements
(In thousands, except per share dataHigh Tech and share count)
24. Segment reporting (Continued)Manufacturing segment.
The Company’s Chief Executive Officer, who has been identified as the CODM,Chief Operating Decision Maker ("CODM"), reviews operating segment revenue, which is a GAAP measure, and operating segment adjusted income from operations ("AOI"), which is a non-GAAP measure. The Company does not allocate, and therefore the CODM does not evaluate, stock-based compensation expenses, amortization and impairment of acquired intangible assets, foreign exchange gain/(losses) (other than those included in income from operations), interest income/(expense), restructuring expenses/income, acquisition related expenses, acquisition-related expenses, stock-based compensation, amortization andany losses or gains from businesses held for sale, including impairment of intangible assets andcharges, other income/(expense), or income taxes by segment. The Company’s operating assets and liabilities pertain to multiple segments. The Company manages assets and liabilities on a total Companycompany basis, not by operating segment, and therefore asset and liability information about assets, liabilities and capital expenditures by operating segment are not presented to the CODM and are not reviewed by the CODM.
RevenuesWith effect from January 1, 2023, the Company has modified the items that are allocated to the Company's reportable segments for the purpose of evaluating segment performance, and the Company now allocates by segment certain foreign exchange gains/(losses) (to the extent included in income from operations) and unallocated resource costs. Segment results after such allocation are reviewed by the CODM to evaluate segment performance. Prior to January 1, 2023, the CODM evaluated the performance of reportable segment revenue and adjusted income from operations for eachafter excluding these items, which were previously included under "Others." Accordingly, the Company has recast the segment revenue and adjusted income from operations of the Company’sits reportable segments for the yearyears ended December 31, 2019 were as follows:
| | | | | | | | | | | | | | | | | | | | | | | | | | | | | | | | | | | |
| Reportable segments | | | | | | |
| BCMI | | CGRLH | | HMS | | Total Reportable segments | | Others*** | | Total |
| Revenues, net | 1,078,844 | | | 1,107,534 | | | 1,348,635 | | | 3,535,013 | | | (14,470) | | | 3,520,543 | |
| Adjusted income from operations | 115,998 | | | 161,515 | | | 238,129 | | | 515,642 | | | 43,199 | | | 558,841 | |
| Stock-based compensation | | | | | | | | | | | (83,885) | |
| Amortization and impairment of acquired intangible assets (other than included above) | | | | | | | | | | | (31,458) | |
| Acquisition-related expenses | | | | | | | | | | | (8,352) | |
| Foreign exchange gains (losses), net | | | | | | | | | | | 7,729 | |
| Interest income (expense), net | | | | | | | | | | | (43,458) | |
| Income tax expense | | | | | | | | | | | (94,536) | |
| Net income | | | | | | | | | | | 304,881 | |
***Revenues, net for “Others” primarily represents the impact of foreign exchange fluctuations, which is not allocated2021 and 2022 to the Company’s segments for management’s internal reporting purposes.present comparable segment information. Adjusted income from operations for “Others” primarily represents gains related to a transfer of land, government incentives and the impact of foreign exchange fluctuations,certain under or over-absorption of overhead, and allowance for credit losses, which are not allocated to the Company’s segments for management’s internal reporting purposes.
#Includes $10,524 toward the accelerated chargeRevenues and adjusted income from operations for each of a contract cost asset relating to a wealth management platform used in the Company’s BCMI segment that the Company no longer plans to leverage beyond its current scope. If this charge had been recorded in the BCMI segmentsegments in the year ended December 31, 2019, AOI for the Company’s BCMI segment in 2019 would have been $105,474, with a corresponding increase in AOI of “Others” to $53,723.2021 were as follows:
| | | | | | | | | | | | | | | | | | | | | | | |
| Net revenues | | |
| Data-Tech-AI | | Digital Operations | | Total | | AOI |
| Financial Services | $ | 403,609 | | | $ | 617,511 | | | $ | 1,021,120 | | | $ | 131,287 | |
| Consumer and Healthcare | 668,621 | | | 847,082 | | | 1,515,703 | | | 256,870 | |
| High Tech and Manufacturing | 620,051 | | | 865,337 | | | 1,485,388 | | | 278,868 | |
| Net revenues | $ | 1,692,281 | | | $ | 2,329,930 | | | $ | 4,022,211 | | | |
| Others | | | | | | | (4,345) | |
| Total AOI | | | | | | | $ | 662,680 | |
| Stock-based compensation | | | | | | | (81,968) | |
| Amortization and impairment of acquired intangible assets (other than included above) | | | | | | | (57,641) | |
| Acquisition-related expenses | | | | | | | (1,177) | |
| Foreign exchange gains (losses), net | | | | | | | 12,669 | |
| Interest income (expense), net | | | | | | | (51,434) | |
| Income tax expense | | | | | | | (113,681) | |
| Net income | | | | | | | $ | 369,448 | |
GENPACT LIMITED AND ITS SUBSIDIARIES
Notes to the Consolidated Financial Statements
(In thousands, except per share data and share count)
24. Segment reporting (Continued)
Revenues and adjusted income from operations for each of the Company’s segments forin the year ended December 31, 20202022 were as follows:
| | | | | | | | | | | | | | | | | | | | | | | | | | | | | | | | | | | |
| Reportable segments | | | | | | |
| BCMI | | CGRLH | | HMS | | Total Reportable segments | | Others** | | Total |
| Revenues, net | 1,079,193 | | | 1,264,654 | | | 1,388,826 | | | 3,732,673 | | | (23,296) | | | 3,709,377 | |
| Adjusted income from 0perations | 132,939 | | | 197,197 | | | 244,166 | | | 574,302 | | | 14,506 | | | 588,808 | |
| Stock-based compensation | | | | | | | | | | | (74,008) | |
| Amortization and impairment of acquired intangible assets (other than included above) | | | | | | | | | | | (43,648) | |
| Acquisition-related expenses | | | | | | | | | | | (2,650) | |
| Foreign exchange gains (losses), net | | | | | | | | | | | 7,482 | |
| Interest income (expense), net | | | | | | | | | | | (48,960) | |
| Restructuring expenses (refer (a) below and Note 28) | | | | | | | | | | | (26,547) | |
| Income tax expense | | | | | | | | | | | (92,201) | |
| Net income | | | | | | | | | | | 308,276 | |
(a) We do not allocate these charges to individual segments in internal management reports used by the chief operating decision maker. Accordingly, such expenses are included in our segment reporting as “unallocated costs.” | | | | | | | | | | | | | | | | | | | | | | | |
| Net revenues | | |
| Data-Tech-AI | | Digital Operations | | Total | | AOI |
| Financial Services | $ | 524,488 | | | $ | 635,220 | | | $ | 1,159,708 | | | $ | 172,292 | |
| Consumer and Healthcare | 730,030 | | | 863,519 | | | 1,593,549 | | | 233,028 | |
| High Tech and Manufacturing | 705,371 | | | 912,544 | | | 1,617,915 | | | 303,555 | |
| Net revenues | $ | 1,959,889 | | | $ | 2,411,283 | | | $ | 4,371,172 | | | |
| Business held for sale (refer to Note (a) below and Note 8) | | | | | (11,973) | | | 24,842 | |
| Net revenues (excluding business held for sale - refer to Note (a) below and Note 8) | | | | | $ | 4,359,199 | | | |
| Others | | | | | | | (15,498) | |
| Total AOI | | | | | | | $ | 718,219 | |
| Stock-based compensation | | | | | | | (77,373) | |
| Amortization and impairment of acquired intangible assets (other than included above) | | | | | | | (42,566) | |
| Foreign exchange gains (losses), net | | | | | | | 15,392 | |
| Interest income (expense), net | | | | | | | (52,204) | |
| Business held for sale (refer to Note (a) below and Note 8) | | | | | | | (24,842) | |
| Impairment charge on assets classified as held for sale (refer to Note (a) below and Note 8) | | | | | | | (32,575) | |
| Restructuring expense (refer to Note (b) below and Note 27) | | | | | | | (38,815) | |
| Income tax expense | | | | | | | (111,832) | |
| Net income | | | | | | | $ | 353,404 | |
**Revenues, net for “Others” primarily represents the impact of foreign exchange fluctuations, which is not allocated to the Company’s segments for management’s internal reporting purposes. Adjusted income from operations for “Others” primarily represents the impact of over-absorption of overhead, unallocated allowances for credit losses, impairments related to operating ROU assets and property, plant and equipment, and foreign exchange fluctuations, which are not allocated to the Company’s segments for management’s internal reporting purposes.
Revenues and adjusted income from operations for each of the Company’s segments for the year ended December 31, 2021 were as follows:
| | | | | | | | | | | | | | | | | | | | | | | | | | | | | | | | | | | |
| Reportable segments | | | | | | |
| BCMI | | CGRLH | | HMS | | Total Reportable segments | | Others* | | Total |
| Revenues, net | 1,016,786 | | | 1,509,534 | | | 1,479,153 | | | 4,005,473 | | | 16,738 | | | 4,022,211 | |
| Adjusted income from operations | 126,972 | | | 250,765 | | | 272,754 | | | 650,491 | | | 12,189 | | | 662,680 | |
| Stock-based compensation | | | | | | | | | | | (81,968) | |
| Amortization and impairment of acquired intangible assets (other than included above) | | | | | | | | | | | (57,641) | |
| Acquisition-related expenses | | | | | | | | | | | (1,177) | |
| Foreign exchange gains (losses), net | | | | | | | | | | | 12,669 | |
| Interest income (expense), net | | | | | | | | | | | (51,434) | |
| Income tax expense | | | | | | | | | | | (113,681) | |
| Net income | | | | | | | | | | | 369,448 | |
*Revenues, net for “Others” primarily represents the impact of foreign exchange fluctuations, which is not allocated to the Company’s segments for management’s internal reporting purposes. Adjusted income from operations for “Others” primarily represents the impact of over-absorption of overhead, unallocated allowances for credit losses, and foreign exchange fluctuations, which are not allocated to the Company’s segments for management’s internal reporting purposes.
GENPACT LIMITED AND ITS SUBSIDIARIES
Notes to the Consolidated Financial Statements
(In thousands, except per share data and share count)
24. Segment reporting (Continued)
Revenues and adjusted income from a single customer in the Company’s HMS segment comprised 14.0%, 12.0% and 9.4% operations for each of the Company’s segments in the year ended December 31, 2023 were as follows:
| | | | | | | | | | | | | | | | | | | | | | | |
| Net revenues | | |
| Data-Tech-AI | | Digital Operations | | Total | | AOI |
| Financial Services | $ | 511,691 | | | $ | 713,683 | | | $ | 1,225,374 | | | 193,355 | |
| Consumer and Healthcare | 717,546 | | | 853,173 | | | 1,570,719 | | | 242,457 | |
| High Tech and Manufacturing | 763,822 | | | 916,973 | | | 1,680,795 | | | 297,909 | |
| Net revenues | $ | 1,993,059 | | | $ | 2,483,829 | | | $ | 4,476,888 | | | |
| Business held for sale (refer to Note (a) below and Note 8) | | | | | (490) | | | 1,201 | |
| Net revenues (excluding business held for sale - refer to Note (a) below and Note 8) | | | | | $ | 4,476,398 | | | |
| Others | | | | | | | 28,016 | |
| Total AOI | | | | | | | $ | 762,938 | |
| Stock-based compensation | | | | | | | (88,576) | |
| Amortization and impairment of acquired intangible assets (other than included above) | | | | | | | (31,348) | |
| Foreign exchange gains (losses), net | | | | | | | 4,274 | |
| Interest income (expense), net | | | | | | | (47,935) | |
| Restructuring (expense)/income (refer to Note (b) below and Note 27) | | | | | | | 4,874 | |
| Operating loss from the business classified as held for sale (refer to Note (a) below and Note 8) | | | | | | | (1,201) | |
| Loss on the sale of business classified as held for sale (refer to Note (a) below and Note 8) | | | | | | | (802) | |
| Income tax benefit | | | | | | | 29,031 | |
| Net income | | | | | | | $ | 631,255 | |
(a) During the second quarter of 2022, the Company's management approved a plan to divest a business that comprised part of the Company's Consumer and Healthcare segment. The revenues and associated losses, including an impairment charge recorded for the year ended December 31, 2022, attributable to this business have been excluded from the computation of adjusted income from operations margin with effect from April 1, 2022, as management believes that excluding these items provides useful information about the Company's financial performance and underlying business trends.
(b) The Company does not allocate these charges to individual segments in internal management reports used by the CODM. Accordingly, such expenses are included in the Company's segment reporting as “unallocated costs.”
GENPACT LIMITED AND ITS SUBSIDIARIES
Notes to the Consolidated Financial Statements
(In thousands, except per share data and share count)
24. Segment reporting (Continued)
No single customer accounted for more than 10% of the Company's consolidated total net revenuesrevenue in 2019, 2020 and 2021, respectively.2022 or 2023.
Net revenues from geographic areas based on the location of the Company’s service delivery centers are as follows. A portion of net revenues attributable to India consists of net revenues for services performed by delivery centers in India or at clients’ premises outside of India by business units or personnel normally based in India.
| | Year ended December 31, |
| 2019 | | 2020 | | 2021 |
| Year ended December 31, | | | Year ended December 31, |
| 2021 | | | 2021 | | 2022 | | 2023 |
| India | India | $ | 1,890,897 | | | $ | 1,851,347 | | | $ | 2,022,123 | |
| Asia, other than India | Asia, other than India | 356,726 | | | 461,839 | | | 536,595 | |
| North and Latin America | North and Latin America | 863,748 | | | 1,007,635 | | | 1,011,759 | |
| Europe | Europe | 409,172 | | | 388,556 | | | 451,734 | |
| Total net revenues | Total net revenues | $ | 3,520,543 | | | $ | 3,709,377 | | | $ | 4,022,211 | |
Property, plant and equipment, net by geographic region are as follows:
| | As of December 31, |
| 2020 | | 2021 |
| As of December 31, | | | As of December 31, |
| 2022 | | | 2022 | | 2023 |
| India | India | $ | 157,129 | | | $ | 142,237 | |
| Asia, other than India | Asia, other than India | 16,790 | | | 16,315 | |
| North and Latin America | North and Latin America | 44,934 | | | 36,973 | |
| Europe | Europe | 12,269 | | | 19,564 | |
| Total | Total | $ | 231,122 | | | $ | 215,089 | |
25. Net revenues
Disaggregation of revenue
In the following tables,table, the Company’s revenue is disaggregated by customer classification.the nature of services provided:
| | | | | | | | | | | | | | | | | |
| Year ended December 31, |
| 2019 | | 2020 | | 2021 |
| Global Clients | $ | 3,042,452 | | | $ | 3,250,527 | | | $ | 3,646,007 | |
| GE | 478,091 | | | 458,850 | | | 376,204 | |
| Total net revenues | $ | 3,520,543 | | | $ | 3,709,377 | | | $ | 4,022,211 | |
| | | | | | | | | | | | | | | | | |
| Year ended December 31, |
| 2021 | | 2022 | | 2023 |
| Data-Tech-AI | $ | 1,692,281 | | | $ | 1,959,889 | | | $ | 1,993,059 | |
| Digital Operations | 2,329,930 | | | 2,411,283 | | | 2,483,829 | |
| Total net revenues | $ | 4,022,211 | | | $ | 4,371,172 | | | $ | 4,476,888 | |
All three of the Company's segments include revenue from GE is includedboth Data-Tech-AI and Digital Operations services. See Note 24 for additional information.
During the second quarter of 2022, the Company's management modified the manner in which it disaggregates revenue for reporting and internal tracking purposes, and the Company now reports revenue disaggregated by the nature of services provided to the client, namely either Data-Tech-AI or Digital Operations services. Prior to the second quarter of 2022, the Company disaggregated its revenue as either revenue from the HMS segment, and the remainder of revenue from the HMS segment consists ofGeneral Electric Company (GE) or revenue from Global Clients. All of the segment revenue from both the BCMI and CGRLH segments consists of revenue from Global Clients. Refer to Note 24 for details on net revenues attributable to each of the Company’s segments.
The Company has evaluated the impact of the COVID-19 pandemic on the Company’s net revenues for the years ended December 31, 2020 and 2021 to ensure that revenue is recognized after considering all impacts to the extent currently known. Impacts observed include constraints on the Company’s ability to render services, whether due to full or partial shutdowns of the Company’s facilities or travel restrictions, penalties relating to breaches of service level agreements, and contract terminations or contract performance delays initiated by clients. The Company’s net revenues for the year ended December 31, 2020 were lowerClients (other than expected before the onset of the pandemic, primarily due to delays in obtaining client approvals to shift to a virtual, work-from-home operating environment, whether as a result of regulatory constraints or due to privacy or security concerns. The COVID-19 pandemic did not have a significant impact on the Company’s net revenues for the year ended December 31, 2021. Due to the nature of the pandemic, the Company will continue to monitor developments to identify significant uncertainties relating to revenue in future periods.
GENPACT LIMITED AND ITS SUBSIDIARIES
Notes to the Consolidated Financial Statements
(In thousands, except per share data and share count)
25. Net revenues (Continued)GE).
Contract balances
Accounts receivable include amounts for services that the Company has performed but for which payment has not been received. The Company typically follows a 30-day billing cycle and, as such, at any point in time may have accrued up to 30 days of revenues that have not been billed. The Company has determined that in instances where the timing of revenue recognition differs from the timing of invoicing, the related contracts generally do not include a significant financing component. SeeRefer to Note 54 for details on the Company’s accounts receivable and allowance for credit losses and Note 11 for deferred billings.
GENPACT LIMITED AND ITS SUBSIDIARIES
Notes to the Consolidated Financial Statements
(In thousands, except per share data and share count)
25. Net revenues (Continued)
The following table provides details of the Company’s contract balances:
| | As of December 31, |
| 2020 | | 2021 |
| As of December 31, | | | As of December 31, |
| 2022 | | | 2022 | | 2023 |
| Contract assets (Note a) | Contract assets (Note a) | $ | 15,805 | | | $ | 13,741 | |
| Contract liabilities (Note b) | Contract liabilities (Note b) | 0 | | 0 | Contract liabilities (Note b) | | | |
| Deferred transition revenue | Deferred transition revenue | $ | 130,804 | | | $ | 155,077 | |
| Advance from customers | Advance from customers | $ | 92,673 | | | $ | 85,747 | |
(a) Included in "prepaid expenses and other current assets" and "other assets" in the consolidated balance sheet.sheets.
(b) Included in "accrued expenses and other current liabilities" and "other liabilities" in the consolidated balance sheet.sheets.
Contract assets represent the contract acquisition fees or other upfront fees paid to a customer. Such costs are amortized over the expected period of benefit and recorded as an adjustment to the transaction price and deducted from revenue. The Company’s assessment did not indicate any significant impairment losses on its contract assets for the periods presented.
Contract liabilities include that portion of revenue for which payments have been received in advance from customers. The Company also defers revenues attributable to certain process transition activities for which costs have been capitalized by the Company as contract fulfillment costs. Consideration received from customers, if any, relating to such transition activities is also included as part of contract liabilities. The contract liabilities are included within “Accrued expenses and other current liabilities” and “Other liabilities” in the consolidated balance sheets. The revenues are recognized as (or when) the performance obligation is fulfilled pursuant to the contract with the customer.
Changes in the Company’s contract asset and liability balances during the years ended December 31, 20202022 and 20212023 were a result of normal business activity and not materially impacted by any other factors.
Revenue recognized during the year ended December 31, 20202022 and 20212023 that was included in the contract liabilities balance at the beginning of the period was $102,893$152,570 and $141,774,$160,024, respectively.
The following table includes estimated revenue expected to be recognized in the future related to remaining performance obligations as of December 31, 2021:2023:
| | | | | | | | | | | | | | | | | | | | | | | | | | | | | |
| Particulars | Total | | Less than 1 year | | 1-3 years | | 3-5 years | | After 5 years |
| Transaction price allocated to remaining performance obligations | $ | 240,824 | | | $ | 160,606 | | | $ | 64,184 | | | $ | 13,924 | | | $ | 2,110 | |
| | | | | | | | | | | | | | | | | | | | | | | | | | | | | |
| Particulars | Total | | Less than 1 year | | 1-3 years | | 3-5 years | | After 5 years |
| Transaction price allocated to remaining performance obligations | $ | 171,828 | | | $ | 112,435 | | | $ | 47,246 | | | $ | 11,864 | | | $ | 283 | |
GENPACT LIMITED AND ITS SUBSIDIARIES
Notes to the Consolidated Financial Statements
(In thousands, except per share data and share count)
25. Net revenues (Continued)
The following table provides details of the Company’s contract cost assets:
| | As of December 31, 2020 | | As of December 31, 2021 |
| As of December 31, 2022 | | | As of December 31, 2022 | | As of December 31, 2023 |
| Particulars | Particulars | Sales incentive programs | | Transition activities | | Sales incentive programs | | Transition activities | Particulars | Sales incentive programs | | Transition activities | | Sales incentive programs | | Transition activities |
| Opening balance | Opening balance | $ | 35,366 | | | $ | 170,132 | | | $ | 33,390 | | | $ | 192,507 | |
| Closing balance | Closing balance | 33,390 | | | 192,507 | | | 32,296 | | | 206,498 | |
| Amortization | Amortization | 19,960 | | | 68,770 | | | 22,227 | | | 79,779 | |
26. Other income (expense), net
| | | | | | | | | | | | | | | | | |
| Year ended December 31, |
| 2019 | | 2020 | | 2021 |
| Government incentives | $ | 3,976 | | | $ | — | | | $ | — | |
| Other income (expense) | 1,810 | | | 3,238 | | | 12,895 | |
| Other Income (expense), net | $ | 5,786 | | | $ | 3,238 | | | $ | 12,895 | |
27. Commitments and contingencies
Capital commitments
As of December 31, 20202022 and 2021,2023, the Company has committed to spend $5,128$17,972 and $13,317,$15,982, respectively, under agreements to purchase property, plant and equipment. This amount is net of capital advances paid in respect of such purchases.
Bank guarantees
The Company has outstanding bank guarantees and letters of credit amounting to $10,156$8,050 and $7,865$10,963 as of December 31, 20202022 and 2021,2023, respectively. Bank guarantees are generally provided to government agencies and excise and customs authorities for the purposes of maintaining a bonded warehouse. These guarantees may be revoked by the government agencies if they suffer any losses or damages through the breach of any of the covenants contained in the agreements governing such guarantees.
Other commitments
Certain units of the Company’s Indian subsidiaries are established as Software Technology Parks of India units or Special Economic Zone (“SEZ”) units under the relevant regulations issued by the Government of India. These units are exempt from customs and other duties on imported and indigenous capital goods, stores and spares. SEZ units are also exempt from the Indian Goods and Services Tax (“GST”) that was introduced in India in 2017. The Company has undertaken to pay taxes and duties, if any, in respect of capital goods, stores, spares and services consumed duty-free, in the event that certain terms and conditions are not fulfilled.
Contingency
(a) In February 2019, there was a judicial pronouncement in India with respect to defined contribution benefit payments interpreting certain statutory defined contribution obligations of employees and employers. It is not currently clear whether the interpretation set out in the pronouncement has retrospective application. If applied retrospectively, the interpretation would result in an increase in contributions payable by the Company for past periods for certain of its India-based employees. There are numerous interpretative challenges concerning the retrospective application of the judgment. Due to such challenges and a lack of interpretive guidance and based on legal advice the Company has obtained on the matter, it is currently impracticable to reliably estimate the timing and amount of any payments the Company may be required to make. Accordingly, the Company plans to obtain further clarity and will evaluate the amount of a potential provision, if any.
GENPACT LIMITED AND ITS SUBSIDIARIES
Notes to the Consolidated Financial Statements
(In thousands, except per share data and share count)
27. Commitments and contingencies (Continued)
The Indian taxing authorities (“ITA”) have initiated proceedings to examine the availability of a tax exemption claimed by the Company in respect of exports of services and related refunds under the Indian Goods and Services (“GST”) tax regime and the previous service tax regime. In the second quarter of 2020, ITA began to challenge or reject the Company’s Indian GST and service tax refunds in certain states. In total, refunds of$25,069 have been denied or challenged by the ITA and additional refunds may be denied. The Company is pursuing appeals before relevant appellate authorities.
The Company had requested these refunds pursuant to the tax exemption available for exports under the previous service tax regime as well as the current GST regime in respect of services performed by the Company in India for affiliates and clients outside of India. In denying the refunds, the ITA have taken the position that the services provided are local services, which interpretation, if correct, would make the service tax and GST exemption on exports unavailable to the Company in respect of such services. Additional potentially material challenges and assessments may result from ongoing proceedings related to service tax recovery.
The Company believes that the denial of the refunds claimed pursuant to the service tax and GST exemption is incorrect and that the risk that the liability will materialize is remote. The Government of India has recently issued an administrative circular which supports the Company’s position, and the Company believes that the appellate authorities will reverse the previous orders denying refunds owed to the Company. Accordingly, no reserve has been provided as of December 31, 2021.
An affiliate of the Company in India received an assessment order in 2016 seeking to assess tax amounting to $110,142 (including interest to the date of the order) on certain transactions that occurred in 2013. This amount excludes penalty or interest accrued since the date of the order. The Income Tax Appellate Tribunal of India (the “Tribunal”) has accepted the legal arguments raised by the Company in appeal and the assessment order has been cancelled. Taxes paid under protest have been refunded along with interest to the Company. The Indian tax authorities may appeal the order of the Tribunal before higher court. Based on its evaluation of the facts underlying the transaction and legal advice received, the Company believes that it is more likely than not that this transaction would not be subject to tax liability in India. Accordingly, no reserve has been provided as of December 31, 2021.
In September 2020, the Indian Parliament approved the Code on Social Security, 2020 (the “Code”), which will impact the Company’s contributions to its defined contribution and defined benefit plans for employees based in India. The date the changes will take effect is not yet known and the rules for quantifying the financial impact have not yet been published. The Company will evaluate the impact of the Code on the Company in its financial statements for the period in which the Code becomes effective and the related rules are published.
28. Restructuring
In the second quarter of 2020, due to the impact of the COVID-19 pandemic on the Company’s current and expected future revenues, the Company recorded a $21,658 restructuring charge primarily relating to the abandonment of leased office premises and employee severance charges. In the third quarter of 2020, the Company recorded an additional charge of $4,889 relating to employee severance charges.
Of the total recorded restructuring charges of $26,547, $11,152 was a non-cash charge (including $908 related to writing down certain property, plant and equipment) recorded as other operating expense, which pertains to the abandonment of various leased office premises as a result of the Company’s consolidation of underutilized office premises due to lower demand or shifting to a work-from-home model. The Company made efforts to sublease certain office premises instead of abandoning them, but due to the COVID-19 pandemic and the related widespread adoption of work-from-home practices by many businesses worldwide, the Company has been unable to sublease such premises to date and the Company believes it is unlikely that it will be able to sublease such premises in the foreseeable future.
The Company also recorded a severance charge of $15,395 in personnel expense as a result of a focused reduction in its workforce, which has been subsequently settled. No further restructuring costs have been incurred related to this restructuring plan since the third quarter of 2020.
GENPACT LIMITED AND ITS SUBSIDIARIES
Notes to the Consolidated Financial Statements
(In thousands, except per share data and share count)
29.26. Commitments and contingencies (Continued)
(b) The Indian taxing authorities ("ITA") have issued assessment orders to certain subsidiaries of the Company seeking to assess income tax on certain transactions that occurred in 2015. The Company has received demands for potential tax claims related to these orders in an aggregate amount of $111,288, including interest through the date of the orders. This amount excludes penalties or interest accrued since the date of the orders. The Company is pursuing appeals before the relevant appellate authorities in respect of these orders. Further, in respect of a 2015 transaction, the ITA has attempted to revise a previously closed assessment. During 2022, the Income Tax Appellate Tribunal of India (the "Tribunal") ruled in favor of the Company denying the ITA's ability to revise the assessment, and the ITA have appealed this ruling before the Delhi High Court. In January 2023, notwithstanding the Tribunal’s decision in the Company's favor, the ITA issued a revised assessment order to the Company, and in March 2023, this assessment order was struck down by the Tribunal. The ITA have filed an appeal challenging this most recent decision of the Tribunal before the Delhi High Court. The Company believes that it is more likely than not that the Company’s position will ultimately prevail in respect of these transactions. Accordingly, no unrecognized tax benefit has been provided with respect to this matter as of December 31, 2023.
(c) In September 2020, the Indian Parliament approved new labor codes, including the Code on Social Security, 2020 (the “Code”), which will impact the Company’s contributions to its defined benefit plans for employees based in India. The Code has not yet been made effective, and the rules for different states are in the process of being framed. The Company has carried out a preliminary evaluation of the impact the Code will have on the Company. The final impact will be assessed after the Code becomes effective and the related rules are published.
27. Restructuring
In 2022, the Company implemented a flexible, hybrid global delivery model in line with the Company's long-term strategy that incorporates a mix of offshore, onshore, near-shore, and remote working. As a result, the Company determined that certain leases and employee roles were no longer needed.
Accordingly, the Company recorded a $38,815 restructuring charge relating to the abandonment of leased office premises and an employee severance charge. Of the total charge of $38,815, $21,684 was a non-cash charge (including $1,377 related to writing down certain property, plant and equipment) recorded as other operating expense, which pertains to the abandonment of various leased office premises. The Company has sought out one or more third parties to sublease certain office premises from the Company, wherever applicable, instead of abandoning them. However, the Company has not been successful in such attempts, and the Company believes it is unlikely that it will be able to sublease such premises in the foreseeable future. The Company also recorded a severance charge of $17,131, which was paid during the year ended December 31, 2022 related to a focused reduction in the Company's workforce.
In 2023, the Company successfully terminated a lease agreement involving leased premises that were abandoned as part of the 2022 restructuring described above. Accordingly, effective upon the lease termination date, the Company recorded a gain in other operating (income) expense of $4,874.
28. Subsequent Events
Share Repurchase
Pursuant to its share repurchase program, the Company repurchased 1,444,014221,569 of its common shares on the open market between January 1, 20222024 and February 24, 202228, 2024 at a weighted average price of $47.09$36.14 per share for an aggregate cash amount of $68,000.
Dividend
In February 2022,2024, the Company announced that its Board of Directors approved a 16%an 11% increase in its quarterly cash dividend, representing a planned annual dividend of $0.50 per common share, increased from $0.43$0.61 per common share in 2021.2024, increased from $0.55 per common share in 2023. The Board of Directors also declared a dividend for the first quarter of 20222024 of $0.125$0.1525 per common share, which will be paid on March 23, 202226, 2024 to shareholders of record as of the close of business on March 10, 2022.11, 2024. The declaration of any future dividends will be at the discretion of the Board of Directors and subject to Bermuda and other applicable laws.