UNITED STATES
SECURITIES AND EXCHANGE COMMISSION
Washington, D.C. 20549
| | | | | |
| ☒ | ANNUAL REPORT PURSUANT TO SECTION 13 OR 15(d) OF THE SECURITIES EXCHANGE ACT OF 1934 |
or
| | | | | |
| ☐ | TRANSITION REPORT PURSUANT TO SECTION 13 OR 15(d) OF THE SECURITIES AND EXCHANGE ACT OF 1934 |
For the fiscal year ended December 31, 20202023
Commission File Number: 001-36771
| | |
| LendingClub Corporation |
| (Exact name of registrant as specified in its charter) |
| | | | | | | | | | | |
| Delaware | | | 51-0605731 |
(State or other jurisdiction of
incorporation or organization) | | | (I.R.S. Employer
Identification No.) |
| | | | | | | | | | | | | | |
| 595 Market Street, Suite 200, | |
| San Francisco, | CA | 94105 | |
| (Address of principal executive offices and zip code) |
(415) 632-5600
(Registrant’s telephone number, including area code)
Securities registered pursuant to Section 12(b) of the Act:
| | | | | | | | |
| Title of each class: | Trading Symbol | Name of each exchange on which registered: |
| Common Stock, par value $0.01 per share | LC | New York Stock Exchange |
Securities registered pursuant to Section 12(g) of the Act: None
Indicate by check mark if the registrant is a well-known seasoned issuer, as defined in Rule 405 of the Securities Act. Yes ý No ¨
Indicate by check mark if the registrant is not required to file reports pursuant to Section 13 or Section 15(d) of the Act. Yes ¨ No ý
Indicate by check mark whether the registrant (1) has filed all reports required to be filed by Section 13 or 15(d) of the Securities Exchange Act of 1934 during the preceding 12 months (or for such shorter period that the registrant was required to file such reports), and (2) has been subject to such filing requirements for the past 90 days. Yes ý No ¨
Indicate by check mark whether the registrant has submitted electronically every Interactive Data File required to be submitted pursuant to Rule 405 of Regulation S-T (§232.405 of this chapter) during the preceding 12 months (or for such shorter period that the registrant was required to submit such files). Yes ý No ¨
Indicate by check mark whether the registrant is a large accelerated filer, an accelerated filer, a non-accelerated filer, smaller reporting company, or an emerging growth company. See the definitions of “large accelerated filer,” “accelerated filer,” “smaller reporting company,” and “emerging growth company” in Rule 12b-2 of the Exchange Act.
| | | | | | | | | | | | | | | | | |
| Large accelerated filer | | ☒ | | ☐ | Accelerated filer | ☒☐ |
| Non-accelerated filer | | ☐ | | Smaller reporting company | ☐ |
| | | | Emerging growth company | ☐ |
If an emerging growth company, indicate by check mark if the registrant has elected not to use the extended transition period for complying with any new or revised financial accounting standards provided pursuant to Section 13(a) of the Exchange Act. o
Indicate by check mark whether the registrant has filed a report on and attestation to its management’s assessment of the effectiveness of its internal control over financial reporting under Section 404(b) of the Sarbanes-Oxley Act (15 U.S.C. 7262(b)) by the registered public accounting firm that prepared or issued its audit report. ☒
If securities are registered pursuant to Section 12(b) of the Act, indicate by check mark whether the financial statements of the registrant included in the filing reflect the correction of an error to previously issued financial statements. o
Indicate by check mark whether any of those error corrections are restatements that required a recovery analysis of incentive-based compensation received by any of the registrant’s executive officers during the relevant recovery period pursuant to §240.10D-1(b). o
Indicate by check mark whether the registrant is a shell company (as defined in Rule 12b-2 of the Act). Yes ☐ No ☒
The aggregate market value of the voting and non-voting common equity held by non-affiliates of the registrant as of June 30, 2020,2023, the last business day of the registrant’s most recently completed second fiscal quarter, was $278,428,673$894,810,579 based on the closing price reported for such date on the New York Stock Exchange. Shares of the registrant’s common stock held by each executive officer, director and holder of 10% or more of the outstanding common stock have been excluded in that such persons may be deemed to be affiliates. This calculation does not reflect a determination that certain persons are affiliates of the registrant for any other purpose.
As of February 26, 2021,January 31, 2024, there were 93,550,219110,410,602 shares of the registrant’s common stock outstanding.
Documents Incorporated by Reference
Portions of the registrant’s Definitive Proxy Statement for the Registrant’s 20212024 Annual Meeting of Stockholders are incorporated by reference into Part III of this Annual Report on Form 10-K to the extent stated herein. Such Definitive Proxy Statement will be filed with the Securities and Exchange Commission within 120 days after the end of the registrant’s fiscal year ended December 31, 2020.
Annual Report On Form 10-K
For Fiscal Year Ended December 31, 20202023
TABLE OF CONTENTS
Glossary
The following is a list of common acronyms and terms LendingClub Corporation regularly uses in its financial reporting:
| | | | | |
| |
| ACL | Allowance for Credit Losses (includes both the allowance for loan and lease losses and the reserve for unfunded lending commitments) |
| Acquisition | Acquisition of Radius Bancorp, Inc. |
| AFS | Available for Sale |
| ALLL | Allowance for Loan and Lease Losses |
| Annual Report | Annual Report on Form 10-K for the year ended December 31, 2023 |
| ASU | Accounting Standards Update |
| AUM | Assets Under Management (outstanding balances of Loan Originations serviced by the Company including loans sold to investors as well as loans held for investment and held for sale by the Company) |
| Balance Sheet | Consolidated Balance Sheets |
| CECL | Current Expected Credit Losses (Accounting Standards Update 2016-13, Financial Instruments—Credit Losses (Topic 326): Measurement of Credit Losses on Financial Instruments) |
| CET1 | Common Equity Tier 1 |
| CET1 Capital Ratio | Common Equity Tier 1 capital divided by total risk-weighted assets as defined under the Basel III capital framework |
| DCF | Discounted Cash Flow |
| |
| EPS | Earnings Per Share |
| Exchange Act | Securities Exchange Act of 1934, as amended |
| FRB or Federal Reserve | Board of Governors of the Federal Reserve System and, as applicable, Federal Reserve Bank(s) |
| GAAP | Accounting Principles Generally Accepted in the United States of America |
| HFI | Loans which are retained by the Company and held for investment |
| HFS | Held for sale loans expected to be sold to investors, including Marketplace Loans |
| Income Statement | Consolidated Statements of Income |
| LC Bank or LendingClub Bank | LendingClub Bank, National Association |
| LendingClub, LC, the Company, we, us, or our | LendingClub Corporation and its subsidiaries |
| Loan Originations | Unsecured personal loans and auto refinance loans originated by the Company or facilitated by third-party issuing banks |
| Marketplace Loans | Loan Originations designated as HFS and subsequently sold to investors |
| |
| N/M | Not meaningful |
| Parent | LendingClub Corporation (the Parent Company of LendingClub Bank, National Association and other subsidiaries) |
| PPNR or Pre-Provision Net Revenue | PPNR, or Pre-Provision Net Revenue, is a non-GAAP financial measure calculated by subtracting the provision for credit losses and income tax benefit/expense from net income. |
| |
| PPP loans | Loans originated pursuant to the U.S. Small Business Administration’s Paycheck Protection Program |
| |
| Radius | Radius Bancorp, Inc. |
| |
| |
| |
| |
| |
| SEC | United States Securities and Exchange Commission |
| Securities Act | Securities Act of 1933, as amended |
| |
| Structured Certificates | Asset-backed securitization transaction where the Company retains the senior note security and sells the residual certificate on a pool of loans to a marketplace investor at a predetermined price. |
| | | | | |
| Structured Program transactions | Asset-backed securitization transactions, including Structured Certificate transactions, where certain accredited investors and qualified institutional buyers have the opportunity to invest in securities backed by a pool of unsecured personal whole loans. |
| |
| Tier 1 Capital Ratio | Tier 1 capital, which includes Common Equity Tier 1 capital plus non-cumulative perpetual preferred equity that qualifies as additional tier 1 capital, divided by total risk-weighted assets as defined under the Basel III capital framework. |
| Tier 1 Leverage Ratio | Tier 1 capital, which includes Common Equity Tier 1 capital plus non-cumulative perpetual preferred equity that qualifies as additional tier 1 capital, divided by quarterly adjusted average assets as defined under the Basel III capital framework. |
| Total Capital Ratio | Total capital, which includes Common Equity Tier 1 capital, Tier 1 capital and allowance for credit losses and qualifying subordinated debt that qualifies as Tier 2 capital, divided by total risk-weighted assets as defined under the Basel III capital framework. |
| Unsecured personal loans | Unsecured personal loans originated on the Company’s platforms, including an online direct to consumer platform and a platform connected with a network of education and patient finance providers. |
| VIE | Variable Interest Entity |
Except as the context requires otherwise, as used herein, “LendingClub,” “Company,” “we,” “us,” and “our,” refer to LendingClub Corporation, a Delaware corporation, and, where appropriate, its consolidated subsidiaries and consolidated variable interest entities (VIEs), including:
•including LendingClub Bank, National Association (the(LC Bank)
•Various, and various entities established to facilitate loan sale transactions under LendingClub’s Structured Program, including sponsoring asset-backed securities transactions and Certificate Program transactions, where certain accredited investors and qualified institutional buyers have the opportunity to invest in senior and subordinated securities backed by a pool of unsecured personal whole loans.
•LC Trust I (the LC Trust), an independent Delaware business trust that acquires loans from LendingClub and holds them for the sole benefit of certain investors that have purchased trust certificates issued by the LC Trust and that are related to specific underlying loans for the benefit of the investor.Program.
Forward-LookingForward-looking Statements
This Annual Report on Form 10-K (Report)for the year ended December 31, 2023 (Annual Report) contains forward-looking statements within the meaning of Section 27A of the Securities Act of 1933, as amended (Securities Act), and Section 21E of the Securities Exchange Act of 1934.1934, as amended (Exchange Act). Forward-looking statements in this Annual Report include, without limitation, statements regarding borrowers, credit scoring, our strategy, future operations, expected losses, future financial position, future revenue, projected costs, prospects, plans, objectives of management, expected market growth and the impact on our business. You can identify these forward-looking statements by words such as “anticipate,” “appear,” “believe,” “continue,” “could,” “estimate,” “expect,” “forecast,” “future,” “intend,” “may,” “opportunity,” “plan,” “predict,” “project,” “should,” “strategy,” “target,” “will,” “would,” or similar expressions.
These forward-looking statements include, among other things, statements about:
•The impact of, and our ability to integratesuccessfully navigate, the Bankcurrent interest rate and economic climate, a potential recession and the timing and ability to realize the expected financial and strategic benefitsresumption of the acquisition;Federal student loan payments;
•our ability following to sustain the business under adverse circumstances;
•our acquisition of the Bank,ability to attract and retain new members, to expand our product offerings and services, to improve revenue and generate recurring earnings, to capture expense benefits, to increase resiliency, and to enhance regulatory clarity;
•our ability to address strictercompliance, and that of third-party partners or heightened regulatory or supervisory requirements and expectations;
•our complianceproviders, with applicable local, state and Federalfederal laws, regulations and regulatory developments or court decisions affecting our business;
•the impact of COVID-19 and our ability to effectuate and the effectiveness of certain operational and strategy initiatives in light of COVID-19;
•our ability to successfully navigate the current economic climate;
•our ability to sustain the business under adverse circumstances;
•the effects of natural disasters, public health crises,crisis, acts of war or terrorism and other external events on our customers and business;business, including the Ukrainian-Russian and Gaza Strip conflicts;
•the impact of changes in laws or the regulatory or supervisory environment, including as a result of legislation, regulation, policies or changes in government officials or other personnel;
•the impact of changes in monetary, fiscal, or trade laws or policies, including as a result of actions by governmental agencies, central banks, or supranational authorities;policies;
•the impact of new accounting standards or policies, including the Current Expected Credit LossLosses (CECL) standard;
•the results of examinations of us by regulatory authorities and the possibility that any such regulatory authority may, among other things, require us to limit our business activities, increase our allowance for loan losses, increase our capital levels, or affect our ability to borrow funds or maintain or increase deposits;
•our ability, and that of third-party partners or providers, to maintain an enterprise risk management framework that is effective in mitigating risk;
•our ability to effectively manage capital or liquidity to support our evolving business or operational needs, while remaining compliant with regulatory or supervisory requirements and appropriate risk-management standards;
•our ability to attract and retain loan borrowers;
•our ability to develop and maintain a strong core deposit base or other low cost funding sources necessary to fund our activities;
•the impact of changes in consumer spending, borrowing and saving habits;
•the impact of the continuation of or changes in the short-term and long-term interest rate environment;
•our expectations on the interplay among origination volume, underwriting standards and interest rates;
•the ability and willingness of borrowers to repay loans;
•our belief that certain loans and leases in our commercial loan portfolio will be fully repaid in accordance with the plans of borrowers;contractual loan terms;
•our ability to maintain investor confidence in the operation of our platform;
•our ability to retain existing sources and secure new or additional sources of investor commitments for our platform;
•our expectation that marketplace investor demand for our loans will remain depressed until interest rates and the macro environment stabilize;
•our expectation of pressure on net interest margin;
•the performance of our loan products and expected rates of return for investors;
•platform volume, pricing and balance;
•the effectiveness of our platform’s credit scoring models;
•our ability to innovate and the adoption and success of new products and services;
•the adequacy of our corporate governance, risk-management framework and compliance programs;
•the impact of, and our ability to resolve, pending litigation and governmental inquiries and investigations;
•the use of our own capital to purchase loans and the impact of holding loans on and our ability to sell loans off our balance sheet;
•our intention not to sell our available for sale (AFS) investment portfolio;
•our financial condition and performance, including the impact that management’s estimates have on our financial performance and the relationship between the interim period and full year results;
•our ability, and that of third-party vendors,partners and providers, to maintain service and quality expectations;
•the fair value estimates used in the valuation of our financial instruments;
•our estimate of our interest rate sensitivity;
•our calculation of expected credit losses for our collateral-dependent loans;
•our estimated maximum exposure to losses;
•our expectation of loan servicing fee revenue based on forecasted prepayments and estimated market rate of servicing at the time of loan sale;
•capital expenditures;
•our compliance with contractual obligations or restrictions;
•the potential impact of macro-economic developments, including recessions, inflation or other adverse circumstances;
•our ability to develop and maintain effective internal controls;
•our ability to recruit and retain quality employees to support current operations and future growth;
•our ability to continue to realize the financial and strategic benefits of our digital marketplace bank business model;
•changes in the effectiveness and reliability of our information technology and computer systems, including the impact of any security or privacy breach;
•the impact of expense initiatives and our ability to control our cost structure;
•our ability to manage and repay our indebtedness; and
•other risk factors listed from time to time in reports we file with the SEC.
We caution you that the foregoing list may not contain all of the forward-looking statements in this Annual Report. We may not actually achieve the plans, intentions or expectations disclosed in forward-looking statements, and you should not place undue reliance on forward-looking statements. We have included important factors in the “Risk Factors” section of this Annual Report, as well as in our consolidated financial statements, related notes, and other information appearing elsewhere in this Annual Report and our other filings with the Securities and Exchange Commission,SEC that could, among other things, cause actual results or events to differ materially from forward-looking statements contained in this Annual Report. Forward-looking statements do not reflect the potential impact of any future acquisitions, mergers, dispositions, joint ventures or investments we may make.
You should read this Annual Report carefully and completely and with the understanding that actual future results may be materially different from what we expect. We do not assume any obligation to update or revise any forward-looking statements, whether as a result of new information, actual results, future events or otherwise, other than as required by law.
PART I
Item 1. Business
Introduction
LendingClub was founded in 2006 to transformand brought a traditional credit product – the banking industryinstallment loan – into the digital age by leveraging technology, data science, and a unique marketplace model. LendingClub now operates a leading digital marketplace bank and is one of a small number of fintech companies with a national bank charter. We startedare building a new of kind of bank, one that aims to advantage our members with the information, tools, and guidance they need to achieve their own version of financial success. We do this by bringing a traditional credit product, the installment loan, into the digital ageleveraging data and became the largest provider of unsecured personal loans in the United States. On February 1, 2021, LendingClub completed the acquisition of Radius Bancorp, Inc. (Radius), whereby LendingClub became a bank holding company and formed LendingClub Bank, National Association (the Bank) as its wholly-owned subsidiary, through which we will now operate the vast majority of our business. With the acquisition, we combined the complementary strengths of the Company’s digital lending capabilities with an award-winning digital bank. LendingClub’s customers, or our “members”, can gaintechnology to increase access to credit, lower borrowing costs, and improve the return on savings – all through a broader range of financial productssmart, simple, and services designed to help them digitally manage their lending, spending and savings.rewarding digital experience. Since 2007, more than 34.8 million individuals have become members and thereby joined the Club, to help reach their financial goals. With the capabilities Radius possesses, the Company intends to enhance consumer engagement by offering a broader range of products and services aimed at supporting our members and further improving their financial health. In addition to serving our members, the acquisition of Radius enables us to offer products and services to commercial customers, as well as to continue to serve the broad range of institutional investors for our unsecured personal loans and auto loans (Consumer Loans), and for our patient and education finance loans.
We anticipate that additional strategic and financial benefits of the Radius acquisition will include:
•Increased resiliency with access to stable, low-cost deposit funding replacing higher-cost and more volatile third-party warehouse funding;
•Increased and more stable revenue driven by increased net interest income from Consumer Loans held for investment;
•Expense benefits by capturing the fees that were historically paid to our third-party issuing banks; and
•Ability to attract new members and deepen relationships with existing members through the addition of banking services that leverage LendingClub’s marketing and brand strengths.Club.
Our business model and competitive advantages
LendingClub Bank offersAs a digital marketplace bank, we offer key business model and competitive advantages over both traditional banks and fintech marketplaces, whichmarketplaces. These include:
•DataFinancially attractive and resilient business model. As a bank, we save on fees from third-party issuing banks, which compares favorably to nonbank fintechs. We benefit from two distinct revenue streams: (i) marketplace revenue in the form of origination fees from borrowers and servicing fees on loans sold to investors, which provides attractive in-period income, and (ii) net interest income earned from retaining a portion of our prime loan originations or other loans acquired for investment and from retaining senior securities related to Structured Program transactions, which provide a recurring and resilient revenue source. We are able to adjust the relative percentage of loans held for investment and loans sold through the marketplace depending on market conditions. In addition to improving our loan-level economics, our banking capabilities also substantially increase the long-term resiliency of our business by providing access to deposit funding, instead of higher-cost and more volatile third-party warehouse funding. Finally, as a digital-first marketplace bank without the legacy branches and related infrastructure of traditional banks, we are better able to leverage technology to meet customers where they are and provide them with efficient and effective solutions.
•Unmatched data and analytics, that drive a superiorwhich power our customer experience and underwriting results. We believe that lending is essentially a data problem and that we have the technology and expertise to solve it. We serve members across a wide band of the credit spectrum and have facilitated more than $60$90 billion of loans to over 3more than 4.8 million members since the Company was founded. OurThrough our interactions with applicants and members, we have allowed us to capture billions ofcollected more than 150 billion cells of performance and behavioral data across thousands of attributes which we useand various economic cycles. That data informs our activities across the customer lifecycle in both lending and savings – from marketing to continually refine ourunderwriting, pricing, and underwriting algorithms. By leveraging vast amountsservicing – and informs our proprietary credit decisioning and machine learning models to rapidly adapt and adjust to changing environments. As a result of our data advantage and continually refining our underwriting models, we believeiterative credit modeling, third-party data shows that we are able to assess credit risk more effectively compared tothan traditional scoring models allowingand our peer set, which allows us to expand access to credit and generate savings for members andwhile also enabling us to approve more members for loans. In addition, wegenerating competitive risk-adjusted returns. We also believe our access to data and robust marketing analyticsthose advantages promote efficiency when we generate and convert demand, driving lower customer acquisition costs.costs and give us a deep understanding of our members, which helps us anticipate their needs, informs future product offerings, and enables us to effectively customize offers.
•Strong, growing, and engaged customer loyalty and engagement.base. Our efficient marketplace model enables us to generate savings for a broad range of borrowers across the credit spectrum by matching them with the lowest available cost of funding provided by our platform investors. Our scalable technology platform, customer servicemarketplace, customer-focused culture, and effective use of data and analytics enableshas enabled us to efficiently originate loans.provide loans and savings to our millions of members. Our typical member is among the industry’s most sought-after consumers: borrowers who have relatively high incomes ($100,000+ annual income on average), high FICO scores (above 700 on average) and between mid-30s to mid-50s in age. Many of them have accumulated higher-cost debt as a result of relying on a limited set of available credit options to bridge cash flow gaps or disruptions and they want better, lower-cost solutions. We are able to help members refinance their higher-cost, adjustable rate debt
into a lower-cost, fixed rate product, thereby providing our members both savings and a pathway toward an improved financial position. Our high net promoter score reflects the strong affinity our members have for our brand. Withbrand and the acquisition of Radius,value we are able to offer additional banking services designed to deliver even more savings, driving increased customer loyalty and engagement.
•Operating and funding efficiency. With LendingClub as the originating bank, we save on fees that we historically paid third-party issuing banks. With access to low-cost deposits and by retaining a portionprovide. In fact many of our members return to us for a subsequent personal loan originationsand/or to increase their savings through other loan products, like auto refinance, and/or checking and deposit products. These “repeat members” have very low acquisition costs, demonstrate better loan performance, and are avid proponents of LendingClub, which serves as a powerful foundation for investment, we expect to generate an attractive stream of recurring revenue. In addition to improving our loan-level economics, we expect our banking capabilities will also substantially increase the resiliency of our business with access to more stable deposit funding.extension into future products.
With respectOur marketplace not only allows us to investors, weserve a broad spectrum of members, it also enables a broad range of institutions ranging from banks to institutional funds and asset managers to invest in our asset class. Our marketplace products primarily compete with other investment vehicles and asset classes, such as equities, bonds, and short-term fixed income securities. LendingClub’s key competitive advantages for marketplace investors include:
•Competitive risk-adjusted returns and short duration. We have over a decade-and-a-half track record of generating competitive risk-adjusted returns for marketplace investors. Our loans compare favorably to other alternative investment options due to their higher yield and shorter duration. We dynamically price loans based on a variety of inputs, such as competitive insights, supply and demand, and prevailing interest rates.
•Portfolio diversification. Unsecured personal and auto loansLoans we sell through our marketplace can offer duration, geographic, and/or asset diversification to investors.
•Generating competitive risk-adjusted returns.Innovative and easy-to-use technology platform. The data analyticsinvestor marketplace brings the traditional loan trading model into the digital age with faster, more efficient transactions that enable borrowers and underwriting resultsinvestors alike to achieve better outcomes. The marketplace supports same-day automated settlements, flexible real-time market-based pricing, the ability to customize investor portfolios and trading activity and passive or active loan selection strategies.
•Regulated and resilient counterparty. As a national bank subject to regulatory oversight and an investor in our own loans, LendingClub is a trusted partner, which is especially important for banks participating on our marketplace.
LendingClub’s key competitive advantages also extend to our members, including:
•Easy access to affordable credit. We allow members to easily apply for a loan from a desktop or mobile device, presenting a variety of our marketplace platform enable usrate and term options with no impact to generate competitive risk-adjusted returns for investors. We believetheir credit score. Once an offer is selected, we run credit and identity verifications, relying on automation when possible to reduce friction, and typically deposit funds (less any fees due to us) to approved applicants within a matter of days.
•Improvements in their financial position. Members who use a LendingClub personal loan to pay off their existing debt not only reduce their cost of debt but also may increase their credit score.
•Access to other LendingClub products and services. Members have access to a growing set of financial products and services that the risk-adjusted returns generated by our loans compare favorablyare designed to alternative investment options.work well together to deliver value in new and rewarding ways.
Our loan origination and deposit gathering model
Our sales and marketing efforts are designed to efficiently attract and retain customersmembers and build brand awareness. We use an array of marketing channels and constantly seek to improve and optimize the borrowermember experience, both on-online and offline, to achieve efficiency and high levels of customermember satisfaction.
We attract and retain members directly through our website and through targeted online advertising, online aggregation partners, direct mail, and other channels, (includingincluding search engines, online display advertising, email, social media and strategic relationship referrals) and this continues to drive growth in our customer base.referrals. Our growing member base often returns directly to LendingClub if they need another loan or deposit product – at very low acquisition cost for us – which increases the lifetime value of our members while helpingproviding them additional avenues to improve their financial health.position.
Our primary loan products include unsecured personal loans, secured auto refinance loans, and patient and education finance loans (Consumer Loans). Once a loan application is received, our efficientmultivariable and automated processes enable us to assess risk and present the applicantapproved applicants with various loan options, including the term, rate, and amount for which the applicant qualifies. AfterAlthough approval of the applicant selects their personalized financing option and completes the application process,vast majority of our loans is automated, we may perform additional verifications on the applicant.applicant verifications. Once any verifications are completed, and athe loan has been funded, the Bank originatesis originated and issues proceeds of the loan are issued to the borrower, net of theany origination or transaction fee charged and retained by us.
ThroughWe currently offer borrowers multiple features to lower their cost of debt and enhance their financial position, including balance transfers (where a borrower’s existing credit card debt is directly paid down and the acquisitionloan is consolidated into a fixed-rate term loan) and joint applications (where borrowers may receive a better rate when they jointly apply for a personal loan). These loan products are underpinned by a scalable technology platform and capabilities targeted directly at our members’ core needs to either lower the cost of Radius, we obtained commercial and consumer lending and deposit relationships as well as Banking-as-a-Service (BaaS) capabilities, through which we can offer certain of our products and services to third-parties. For depositors, we offer an award-winning digital experience, customer friendly features such as ATM fee rebates, rewards and competitive interest rates. their debt and/or improve the returns on their savings.
Our commercial lending business includes commercialis primarily focused on small businesses, and industrial loans, commercial real estate loans, small business loans and equipment loans and leases.we participate in the U.S. Small Business Administration (SBA) lending programs. Commercial loans are originatedsourced through relationship managers who maintain and build relationships with businesses across the country. We underwrite loans based on the credit worthinesscreditworthiness of commercial clients,businesses, including an assessment of cash flows, orand on the underlying value of collateral such as equipment orany collateral. In the first quarter of 2023, we ceased originating commercial real estate. Consumer loans acquired from Radius included residential mortgageestate loans and yacht loans.equipment leases and currently intend to retain the existing loan portfolios to maturity.
Prior to acquiring RadiusOur deposit business includes sourcing deposits directly from consumer and establishing the Bank,commercial customers and from third-party marketing channels and deposit brokers. For consumer depositors, we offer high-yield savings accounts, checking accounts and certificates of deposit (CDs). With our issuing bank for Consumer Loans was WebBank, a Utah-chartered industrial bank, member Federal Deposit Insurance Corporation (FDIC).FDIC-insured high-yield savings account, members can enhance their savings by earning competitive interest on their entire balance. Our issuing banks for educationchecking accounts deliver an award-winning digital experience and patient finance loans will remain NBT Bankmember-friendly features, such as ATM fee rebates, no overdraft fees and Comenity Capital Bank, which originate and service such loans. For our role in facilitating loan originations, we recognize transaction fees paid by the issuing banks and education and patient service providers once the loan is issued and the proceeds are delivered to the borrower.
Our marketplace and our members
Borrowersearly direct deposits.
Our marketplace originates unsecured personal loans that are primarily used to refinance credit card balances, make major purchases (including home improvement, education and healthcare costs) or for other purposes. We also originate secured loans that are primarily used to refinance auto loans.
Borrowers applying for loans through our programs must meet certain minimum credit requirements, including a minimum FICO score, satisfactory debt-to-income ratios, satisfactory credit history and a limited number of credit inquiries in the previous six months. After an automated credit scoring and decisioning process, we offer loans to approved applicants. Our personal loans generally have loan amounts between $1,000 to $40,000, with maturities of three or five years, fixed interest rates, monthly amortizing payments, and no prepayment penalties. For auto loans, loan amounts are between $4,000 to $55,000, with maturities ranging between two to seven years, monthly amortizing payments, and no prepayment penalties. Loans originated through our platform do not have interest rates or annual percentage rates in excess of 36%, which is often regarded as a benchmark for responsible lending.
We offer borrowers multiple features to lower their cost of debt and enhance their financial health, including balance transfers where a borrower’s existing credit card debt is paid down and the loan is consolidated into a fixed-rate term loan, and joint applications where borrowers may receive a better rate when they jointly apply for a personal loan.
Loan Investors
Our Consumer Loans are either: (i) sold to marketplace investors or (ii) retained by theLC Bank. Our commercial loans are generally retained by theLC Bank.
Loan Sales (Marketplace Activity): CertainWe sell whole loans to institutional investors, such as banks, asset managers, insurance companies, hedgeinvestment funds, credit unions and other large non-bank investors, seekthrough our innovative and proprietary marketplace. Our marketplace loan sales are executed as either: (i) whole loan sales to invest in our Consumer Loans. To meet this need,investors or (ii) Structured Program transactions.
In the second quarter of 2023, we launched Structured Certificates – a new type of Structured Program transaction where we retain the senior security and sell the residual certificate on a pool of loans to thesea marketplace investor at a predetermined price. This structure, developed by LendingClub and enabled by our marketplace bank model, delivers a transaction that benefits both marketplace investors throughand LendingClub. Marketplace investors earn compelling levered returns on the residual certificate without the need for the financing typically required for a whole loan purchase and sale agreements.LendingClub earns an attractive yield with remote credit risk. We sold over $1.5 billion of loans under this program during its first year in 2023.
We also facilitate loans through LCX, our real-time electronic platform and settlement technology. This proprietary investor platform can easily be customized to meet the needs of individual investors, making transactions on our marketplace fast, easy, and repeatable. This platform has a variety of benefits derived from its unique features:
•A diverse, multifaceted investor market, which enables LendingClub to offer loans to a greater number of customers across a wider credit spectrum than what LC Bank retains on its balance sheet.
•A competitive, dynamically priced market that allows a broad array of investors to instantly buy loans at variable prices (at, below, or above par). It also provides us with real-time information on current market prices and demand for certain types of loans, which helps inform our credit models.
•A flexible and adaptable platform that enables LendingClub to test and launch new products, including structured products, or potential underwriting expansions with limited credit or market risk to LC Bank.
•Quick and efficient trading at scale, that allows investors to quickly deploy their strategies and change their approaches as conditions warrant.
LendingClub Bank: TheLC Bank holds high-quality prime loans and funds those loans directly with its own capital and deposits, which are typically stable and retains thelow cost. We retain these loans for investment.investment on LC Bank’s balance sheet and recognize this source of recurring revenue over the life of the loans.
PriorLoan Purchases: From time to time, we may opportunistically purchase loans. For example, in the acquisitionfourth quarter of Radius,2022, we acquired a $1.05 billion outstanding principal personal loan portfolio we previously facilitated and have since held those loans on our loan investors also purchased loans through:balance sheet to earn net interest income.
Retail Notes. Investors werehad historically been able to purchase LendingClub Member Payment Dependent Notes (Retail Notes), which wereare securities for which cash flows to investors were dependent upon principal and interest payments made by borrowers of certain unsecured personal loans. As of December 31, 2020, and in anticipation of the closing of the Acquisition, LendingClub ceased offering and selling Retail Notes. The total balance of outstanding Retail Notes and related loans will continue to decline as underlying borrower payments are made. The Company does not share in any interest rate or credit risk on the related loans.
Structured Program Transactions. Prior to the first quarter of 2020, we also sold loans through Structured Programs, which included asset-backed securitization transactions and Certificate Program transactions. The Company continues to be required to retain a portion of the securities from these transactions.
Seasonality
Historically, personal loan volume on our platformmarketplace is generally lower in the first quarterand fourth quarters of the year, primarily due to seasonality of borrower behavior. Additionally, in the fourth quarter of the year, we typically observe fluctuations in marketing effectiveness and borrower behavior, due to the holidays, which can impact volume. These seasonal
trends contribute to fluctuations in our operating results. Additionally, the current market environment could result in continued reduction in loan origination volume, which may impact our operating results and operating cash flow. However, we may not observe such trends due toin the impact of COVID-19.near term.
Revenue
Prior to the acquisition, we facilitated loan originations by connecting borrowers with investors through our online lending marketplace platform. However, we relied on third-party issuing banks toWe originate and fund loans initiated by borrowers, which were then sold to investors. Following the acquisition, the Bank became the originator and lender for our Consumer Loans. As discussed above, we fund our Consumer Loan originationsLoans through the Company’s marketplace by either selling loansthem directly to third-party purchasersinvestors, which generates a majority of related revenue immediately, or investingby using our own capital in originated loans and holding thoseto hold the loans for investment.investment, which generates revenue over the life of the loan.
As the originator of Consumer Loans, origination feesRevenue from loans held for sale (HFS) will beis recorded in “Marketplace revenue” and “Interest income” on our Consolidated Statements of Income (Income Statement). Marketplace revenue includes origination fees recorded at the time of loan origination and is monetized as a componentcash from loan investor sale proceeds. Marketplace revenue also includes the gain on sales of marketplace lending revenue. Marketplace lending revenue willloans (recognition of servicing asset), servicing fees received from investors over the life of the loan, and net fair value adjustments (gains or losses from sale prices in excess of or less than the loan principal amount). We also include servicing revenue associated withearn interest income on loans HFS between the time of origination and the settlement date of the loan sales. Origination fees and costssales to investors.
Revenue from loans held for investment (HFI) will beat amortized cost is recorded in “Interest income” on our Income Statement. Origination fees and applicable costs on loans HFI are deferred and are accreted through interest income, over the life of the loans and are accelerated when loans are paid in full before their maturity date. The CECL allowance for HFI loans at amortized cost is calculated using a discounted cash flow (DCF) approach and is an estimate of the net present value of lifetime expected credit losses, reflected as a charge through earnings. The lifetime estimated credit losses on HFI loans will bewhich is initially recognized through earnings when such loans are originated or otherwise acquired,(as “Provision for credit losses”) at the time of origination, while the loan interest received will beand the accretion of deferred fees and costs are recognized according to the loan’s contractual payment terms. Due to thisthe timing difference betweencaused by origination fee deferrals and upfront credit losses taken throughloss provisioning, earnings and actual charge-offs, we expect earnings to beare disproportionately impacted in
from the near term from thestrong expected organic growth in our HFI loan portfolio at amortized cost before benefiting from higher levels of interest income in later periods.
Prior toHFI loans are measured at fair value if the acquisition of Radius, our primary sources of revenue consisted of transaction fees that were paid to us by issuing banks to facilitate loan originations, netCompany elects the fair value option. We may elect the fair value option for certain HFI loans. Interest income is recorded under the effective interest income andmethod, which considers any purchase premium or discounts. In addition, purchase-related discounts absorb credit losses. We record fair value adjustments on loans investedthat are recorded at fair value in by the Company, investor fees that compensated us for the costs we incurred in servicing loans, and a gain or loss“Marketplace revenue” on sales of loans.
See “Part II – Item 7. Management’s Discussion and Analysis of Financial Condition and Results of Operations” for further discussion of our revenue streams prior to the acquisition of Radius.Income Statement.
Competition
The financial services industry is highly competitive, rapidly changing, highly innovative, and subject to regulatory scrutiny and oversight. We compete with financial services providers such as banks, savings and loan associations, credit unions, finance companies, mortgage banking companies, insurance companies, investment banks and mutual fundfinance companies. We also face increased competition from non-bank institutions such as online and marketplace lending companies, as well as from financial services subsidiaries of commercial and manufacturing companies. Many of these competitors enjoyhave fewer regulatory constraints and some may have lower cost structures. The financial services industry is also likely to become more competitive as further technological advances enable more companies to provide financial services.
See “Item 1A. Risk Factors – Substantial and increasing competition in our industry may harm our business” for further discussion of the potential impact of competition on our business.
Regulation and Supervision
General
The U.S. financial services and banking industry is highly regulated. The bank regulatory regime is intended primarily for the protection of customers, the public, the financial system and the Deposit Insurance Fund (DIF) of the Federal Deposit Insurance Corporation (FDIC), rather than our shareholdersstockholders or creditors.
The legal and regulatory regime affects virtually all aspects of our operations. Statutes, regulations and regulatory and supervisory policies govern, among other things, the scope of activities that we may conduct and the manner in which we may conduct them; our business plan and growth; our board, management, and risk management infrastructure; the type, terms, and pricing of our products and services; our loan and investment portfolio; our capital and liquidity levels; our reserves against deposits; our ability to pay dividends, buy-back stock or distribute capital; and our ability to engage in mergers, acquisitions, strategic initiatives and other strategic initiatives.transactions between LC Bank and its affiliates. The legal and regulatory regime is continually under review by legislatures, regulators and other governmental bodies, and changes regularly occur through the enactment or amendment of laws and regulations or through shifts in policy, implementation or enforcement. Changes are difficult to predict and could have significant effects on our business.
The material regulatory requirements that are applicable to us and our subsidiaries are summarized below. The description below, as well as other descriptions of laws and regulations in this Annual Report, isare not intended to summarize all laws and regulations applicable to us and our subsidiaries, and isare based upon the statutes, regulations, policies, interpretive letters and other written guidance that are in effect as of the date of this Annual Report.
Regulatory Framework
We are subject to regulation and supervision by multiple regulatory bodies. As a bank holding company, the Company is subject to the Bank Holding Company Act of 1956 (BHCA) and is subject to ongoing and comprehensive supervision, regulation, examination and enforcement by the Board of Governors of the Federal Reserve System (FRB). The FRB’s jurisdiction also extends to any company that is directly or indirectly controlled by aFRB acts as the supervisor of the consolidated operations of bank holding company.companies.
As a national bank, theLC Bank is subject to ongoing and comprehensive supervision, regulation, examination and enforcement by the Office of the Comptroller of the Currency (OCC). The OCC charges fees to national banks, including theLC Bank, in connection with its supervisory activities.
TheLC Bank’s deposits are insured by the Deposit Insurance Fund (DIF)DIF of the FDIC up to applicable legal limits. As an FDIC-insured depository institution, theLC Bank is subject under certain circumstances to supervision, regulation and examination by the FDIC. The FDIC charges deposit insurance assessments to FDIC-insured institutions, including theLC Bank, to fund and support the DIF. The rate of these deposit insurance assessments is based on, among other things, the risk characteristics of theLC Bank. The FDIC has the power to terminate theLC Bank’s deposit insurance if it determines theLC Bank is engaging in unsafe or unsound practices. Federal banking laws provide for the appointment of the FDIC as receiver in the event theLC Bank were to fail, such as in connection with undercapitalization, insolvency, unsafe or unsound condition or other financial distress. In a receivership, the claims of the receiver for administrative expenses and the claims of LC Bank’s depositors (and those of the FDIC as subrogee of theLC Bank) would have priority over other general unsecured claims against theLC Bank.
The Company isWe are subject to the disclosure and regulatory requirements of the Securities Act of 1933, as amended, and the Securities Exchange Act, of 1934, as amended, both as administered by the SEC. The Company’sOur common stock is listed on the New York Stock Exchange (NYSE) under the trading symbol “LC” and therefore the Company iswe are also subject to the rules of the NYSE for listed companies.
Broad Powers to Ensure Safety and Soundness
A principal objective of the U.S. bank regulatory system is to ensure the safety and soundness of banking organizations. Safety and soundness is a broad concept that includes financial, operational, compliance and reputational considerations, including matters such as capital, asset quality, quality of board and management oversight, earnings, liquidity, and sensitivity to market and interest rate risk. As part of its commitment to maintain safety and soundness, at the time the Company acquired theLC Bank, theLC Bank entered into an Operating Agreement with the OCC (the Operating Agreement). The Operating Agreement setsset forth key parameters within which the
LC Bank mustwas required to operate within, such as with respect to its business plan, minimum capital, directors and senior executive officers, risk management and compliance. Per its original terms, the Operating Agreement expired on February 2, 2024.
The banking and financial regulators have broad examination and enforcement authority. The regulators require banking organizations to file detailed periodic reports and regularly examine the operations of banking organizations. Banking organizations that do not meet the regulators’ supervisory expectations can be subjected to increased scrutiny and supervisory criticism. The regulators have various remedies available, which may be public or of a confidential supervisory nature, if they determine that an institution’s condition, management, operations or risk profile is unsatisfactory. The regulators may also take action if they determine that the banking organization or its management is violating or has violated any law or regulation. The regulators have the power to, among other things:
•require affirmative actions to correct any violation or practice;
•issue administrative orders that can be judicially enforced;
•direct increases in capital;
•direct the sale of subsidiaries or other assets;
•limit dividends and distributions;
•restrict growth and activities;
•set forth parameters, obligations and/or limitations with respect to the operation of our business;
•assess civil monetary penalties;
•remove officers and directors; and
•terminate deposit insurance.
Engaging in unsafe or unsound practices or failing to comply with applicable laws, regulations and supervisory agreements could subject us and our subsidiaries or their officers, directors and institution-affiliated parties to thea broad variety of sanctions or remedies, including those described above and other sanctions.above.
Limits on Activities and Approval Requirements
The BHCA generally restricts the Company’s ability, directly or indirectly, to engage in, or acquire more than 5% of any class of voting securities of a company engaged in, activities other than those determined by the FRB to be so closely related to banking as to be a proper incident thereto. The Gramm-Leach-Bliley Act expanded the scope of permissible activities to include those that are financial in nature or incidental or complementary to a financial activity for a bank holding company that elects to be a financial holding company, which requires the satisfaction of certain conditions. We have not elected financial holding company status.
The bank regulatory regime including through the Operating Agreement, requires that we obtain prior approval of one or more regulators for various initiatives or corporate actions, including acquisitions or minority investments, the establishment, relocation or closure of branches, certain changes to our board or senior management, certain dividends or capital distributions, and significant deviations from the Bank’s previously approved business plan.distributions. Regulators take into account a range of factors in determining whether to grant a requested approval, including the supervisory status of the applicant and its affiliates. Thus, there is no guarantee that a particular proposal by us would receive the required regulatory approvals.
The Community Reinvestment Act (CRA) requires federal banking regulators, in their review of certain applications by banking organizations, to take into account the applicant’s record in helping meet the credit needs of its community, including low- and moderate-income neighborhoods. TheLC Bank is subject to periodic examination under the CRA by the OCC, which will assign ratings based on the methodologies set forth in its regulations and guidance. Less favorable CRA ratings, or concerns raised under the CRA, may adversely affectresult in negative regulatory consequences for LC Bank. The federal banking regulators have recently finalized reforms to the Bank’s abilityregulations implementing the CRA that, subject to obtain approval forthe outcome of related litigation, may impact how certain types of applications.activities may be considered, and how regulators may assess performance, under the CRA.
Company as Source of Strength for theLC Bank
Federal law and FRB policy require that a bank holding company serve as a source of financial and managerial strength for any FDIC-insured depository institution that it controls. Thus, if theLC Bank were to be in financial distress or to otherwise be viewed by the regulators as in an unsatisfactory condition, then the regulators couldFederal Reserve has the authority to require the Company to provideact as a source of strength for LC Bank, which could include providing additional capital or liquidity support, or take other action, in support of theLC Bank, even if doing so is not otherwise in the best interest of the Company.
Regulatory Capital and Liquidity Requirements and Prompt Corrective Action
The Company and LC Bank are expected to have established policies and practices for identifying, measuring, monitoring and controlling their funding and liquidity risks. The banking regulators view capital levels as important indicators of an institution’s financial soundness. As a general matter, FDIC-insured depository institutions and their holding companies are required to maintain a specified level of capital relative to the amount and types of assets they hold. While capital can serve as an important cushion against losses, higher capital requirements can also adversely affect an institution’s ability to grow and/or increase leverage through deposit-gathering or other sources of funding.
The Company and theLC Bank are each subject to generally similar capital requirements adopted by the FRB and the OCC, respectively. These requirements establish required minimum ratios for common equity Tiertier 1 (CET1) risk-based capital, Tier 1 risk-based capital, total risk-based capital and a Tier 1 leverage ratio; set risk-weighting for
assets and certain other items for purposes of the risk-based capital ratios; require an additional capital conservation buffer over the minimum required capital ratios in order to avoid certain limitations on paying dividends, engaging in share repurchases, and paying discretionary bonuses; and define what qualifies as capital for purposes of meeting the capital requirements. The U.S. capital requirements generally are modeled off the Capital Accords of the Basel Committee on Banking Supervision (BCBS). Specifically, the capital thresholds in order to be regarded as a well-capitalized institution under the Basel Committee on Banking SupervisionBCBS standardized approach for U.S. banking organizations are as follows: a CET1 risk-based capital ratio of 6.5%, a Tier 1 risk-based capital ratio of 8.0%, a total risk-based capital ratio of 10.0% and a Tier 1 leverage ratio of 5.0%.
The regulators assess any particular institution’s capital adequacy based on numerous factors and may require a particular banking organization to maintain capital at levels higher than the generally applicable minimums. In this regard, and unless otherwise directed by the OCC, we have made commitments for the Bank to maintain a common equity Tier 1 risk-based capital ratio of 11%, a Tier 1 risk-based capital ratio above 11%, a total risk-based capital ratio above 13% and a Tier 1 leverage ratio of 11% for a minimum of three years following its formation.
The Federal Deposit Insurance Act provides for a system of “prompt corrective action” (PCA). The PCA regime provides for capitalization categories ranging from “well-capitalized” to “critically undercapitalized.” An institution’s PCA category is determined primarily by its regulatory capital ratios. The PCA requires remedial actions and imposes limitations that become increasingly stringent as an institution’s condition deteriorates and its PCA capitalization category declines. Among other things, institutions that are less than well-capitalized become subject to increasingly stringent restrictions on their ability to accept and/or rollover brokered deposits.
In addition to capital requirements, depository institutions are required to maintain non-interest bearing reserves at specified levels against their transaction accounts and certain non-personal time deposits.
Regulatory Limits on Dividends and Distributions
The ability of the Company or theLC Bank to pay dividends, buy backrepurchase stock and make other capital distributions is limited by regulatory capital rules and other aspects of the regulatory regime. For example, a policy statement of the FRB provides that, among other things, a bank holding company generally should not pay dividends if its net income for the past year is not sufficient to cover both the cash dividends and a rate of earnings retention that is consistent with the company’s capital needs, asset quality, and overall financial condition.
Dividends and capital distributions by theLC Bank are also limited by the regulatory regimes. For example, the Operating Agreement requires the Bank to obtain a prior written determination of non-objection from the OCC
before declaring any dividend. Taking into account a wide range of factors, the OCC may object and therefore prevent the Bank from paying dividends to the Company. Other laws and regulations generally applicable to national banks also limit the amount of dividends and capital distributions that may be made by a national bank and/or require prior approval of the OCC. Because substantially all of our business activities, income and cash flow are expected to be generated by theLC Bank, an inability of theLC Bank to pay dividends or distribute capital to the Company would adversely affect the Company’s liquidity.
See“Part II – Item 8. Financial Statements and Supplementary Data– Notes to Consolidated Financial Statements – Note 21. Regulatory Requirements” and “Item 1A. Risk Factors – Risks Related to Regulation, Supervision and Compliance” for additional information.
Consumer Protection
We are subject to a broad array of federal, state and local laws and regulations that govern almost every aspect of our business relationships with consumers. These laws relate to, among other things, the content and adequacy of disclosures, pricing and fees, fair lending, anti-discrimination, privacy, cybersecurity, usury, mortgages and housing finance, lending to service members, escheatment, debt collection, loan servicing, collateral secured lending, availability of funds and unfair, deceptive or abusive acts or practices.
The Consumer Financial Protection Bureau (CFPB) is generally responsible for rulemaking with respect to certain federal laws related to the provision of financial products and services to consumers. In addition, the CFPB has examination and primary enforcement authority with respect to federal consumer financial protection laws with respect to banking organizations with assets of $10 billion or more. TheLC Bank has assets less than $10 billion; therefore, we are not currently subject to the examination and primary enforcement jurisdiction of the CFPB. However, many consumer protection rules adopted or amended by the CFPB do apply to us and are the subject of examination and enforcement with respect to us by the FRB and OCC.
If we fail to comply with these laws and regulations, we may be subject to significant penalties, judgments, other monetary or injunctive remedies, lawsuits (including putative class action lawsuits and actions by state and local attorneys general or other officials), customer rescission rights, supervisory or enforcement actions, and civil or criminal liability.
Anti-Money Laundering, Sanctions and Financial Crime
We are subject to a wide range of laws related to anti-money laundering (AML), anti-corruption, anti-bribery, economic sanctions and prevention of financial crime, including the Bank Secrecy Act, the USA PATRIOT Act and economic sanctions programs. We are required to, among other things, maintain an effective anti-money laundering and counter-terrorist compliance program, identify and file suspicious activity and currency transaction reports, and block or reject transactions with sanctioned persons or jurisdictions. Compliance with these laws requires significant investment of management attention and resources. These laws are enforced by a number of federal and state regulatory and enforcement authorities, including the FRB, OCC, Office of Foreign Assets Control, the Financial Crimes Enforcement Network, the U.S. Department of Justice, Drug Enforcement Administration, and Internal Revenue Service. Failure to comply with these laws, or to meet our regulators’ supervisory expectations in connection with these laws, could subject us to supervisory or enforcement action, significant financial penalties, criminal liability and/or reputational harm.
Third-Party Relationship Risk Management
We utilize third-party service providers to perform a wide range of operations and other functions, which may present various risks. Our regulators will expect us to maintain an effective program for managing risk arising from third-party relationships, which should be commensurate with the level of risk and complexity of our business and our third-party relationships. If not managed effectively, the use of third-party service providers may expose us to risks that could result in regulatory action, financial loss, litigation, and reputational harm.
Privacy, Information Technology and Cybersecurity
We are subject to various laws related to the privacy of consumer information. For example, the Company and its subsidiaries are required under federal law periodically to disclose to their retail clients the Company’s policies and
practices with respect to the sharing of nonpublic client information with their affiliates and others, and the confidentiality and security of that information. In some cases, theLC Bank must obtain a consumer’s consent before sharing information with an unaffiliated third party, and theLC Bank must allow a consumer to opt out of theLC Bank’s sharing of information with its affiliates for marketing and certain other purposes. We are also subject to laws and regulatory requirements related to information technology and cybersecurity. For example, the Federal Financial Institutions Examination Council (FFIEC), which is a council comprised of the primary federal banking regulators, has issued guidance and supervisory expectations for banking organizations with respect to information technology and cybersecurity. Our regulators regularly examine us for compliance with applicable laws and adherence to industry best practices with respect to these topics. For example, they will evaluate our security of user and customer credentials, business continuity planning, and the ability to identify and thwart cyber-attacks. The federal banking regulators have also implemented rules to require banks and their service providers to provide certain notification when certain cybersecurity incidents occur.
State regulators have also been increasingly active in implementing privacy and cybersecurity standards and regulations. Recently, several states have adopted regulations requiring certain financial institutions to implement cybersecurity programs and providing detailed requirements with respect to these programs, including data encryption requirements. Many states have also recently implemented or modified their data breach notification and data privacy requirements. For example, the California Consumer Privacy Rights Act of 2020 became effectivefully operative on January 1, 2020.2023. We expect this trend of state-level activity in those areas to continue, and are continually monitoring developments in the states in which our clients are located.
Limitations on Transactions with Affiliates and Loans to Insiders
Banks areLC Bank is subject to restrictions on theirits ability to conduct transactions with affiliates and other related parties under federal banking laws.parties. For example, federal banking laws impose quantitative limits, qualitative requirements, and collateral standards on certain extensions of credit and other transactions by an insured depository institution with, or for the benefit of, its affiliates. In addition, most types of transactions by an insured depository institution with, or for the benefit of, an affiliate must be on terms substantially the same or at least as favorable to the insured depository institution as if the transaction were conducted with an unaffiliated third party. Federal banking laws also impose restrictions and procedural requirements in connection with the extension of credit by an insured depository institution to directors, executive officers, principal shareholdersstockholders (including the Company) and their related interests. In addition, purchases and salesextensions of assetscredit between an insured depository institution and its executive officers, directors, principal stockholders, and principal shareholders maytheir related interests are also be limited under such laws.by federal law. The Sarbanes-Oxley Act generally prohibits loans by public companies to their executive officers and directors. However, there is a specific exception for loans by financial institutions, such as theLC Bank, to its executive officers and directors that are made in compliance with federal banking laws.
Acquisition of a Significant Interest in the Company
Banking laws impose various regulatory requirements on parties that may seek to acquire a significant interest in the Company. For example, the Change in Bank Control Act of 1978 would generally require that any party file a formal notice with, and obtain non-objection of, the FRB prior to acquiring (directly or indirectly, whether alone or acting in concert with any other party) 10% or more of any class of voting securities of the Company. Further approval requirements and significant ongoing regulatory consequences would apply to any company that (directly or indirectly, whether alone or as part of an association with another company) seeks to acquire “control” of the Company or theLC Bank for purposes of the BHCA. The determination whether a party “controls” a depository institution or its holding company for purposes of these laws is based on applicable regulations and all of the facts and circumstances surrounding the investment.
Certain Regulatory Developments Relating to the COVID-19 Pandemic CARES Act
On March 27, 2020, the Coronavirus Aid, Relief and Economic Security Act (CARES Act) was passed by Congress and signed into law by the President. Below is a brief overview of some of the provisions of the CARES Act and other regulations and supervisory guidance related to the COVID-19 pandemic that are applicable to the operations and activities of the Company and the Bank.
Paycheck Protection Program (PPP). A principal provision of the CARES Act amended the Small Business Administration’s (SBA) loan program to create a guaranteed, unsecured loan program, the PPP, to fund operational costs of eligible businesses, organizations, and self-employed persons during the COVID-19 pandemic. On June 5, 2020, the Paycheck Protection Program Flexibility Act (PPPFA) was signed into law, which among other things, gave borrowers additional time and flexibility to use PPP loan proceeds. Shortly thereafter, and due to the evolving impact of the COVID-19 pandemic, additional legislation authorizing the SBA to resume accepting PPP applications on July 6, 2020 and extending the PPP application deadline to August 8, 2020 was signed. It is anticipated that additional revisions to the SBA’s interim final rules on forgiveness and loan review procedures will be forthcoming to address these and related changes. As a participating lender in the PPP, the Bank continues to monitor legislative, regulatory, and supervisory developments related thereto.
Temporary Regulatory Capital Relief related to Impact of Current Expected Credit Loss (CECL). Concurrent with enactment of the CARES Act, federal bank regulatory authorities issued an interim final rule that delays the estimated impact on regulatory capital resulting from the adoption of CECL. The interim final rule provides banking organizations that implement CECL before the end of 2020 the option to delay for two years the estimated impact of CECL on regulatory capital relative to regulatory capital determined under the prior incurred loss methodology, followed by a three-year transition period to phase out the aggregate amount of capital benefit provided during the initial two-year delay.
Effect on Economic Environment
The policies of regulatory authorities, including the monetary policy of the FRB, have a significant effect on the operating results of bank holding companies and their subsidiaries. Among the means available to the FRB to affect the money supply are open market operations in U.S. government securities, changes in the discount rate on borrowings and changes in reserve requirements with respect to deposits. These means are used in varying combinations to influence overall growth and distribution of bank loans, investments and deposits, and their use may affect interest rates charged on loans or paid for deposits. The FRB monetary policies have materially affected the operating results of commercial banks in the past and are expected to continue to do so in the future. WeAlthough we conduct stress tests to measure and prepare for the impact of potential changes in monetary policy, we cannot predict with certainty the nature of future monetary policies and the effect of such policies on itsour business and earnings.
Issuing Bank Model
As disclosed above, priorPrior to acquiring Radius and establishing theLC Bank, our issuing bank for unsecured personal and auto refinance loans was WebBank, a Utah-chartered industrial bank. Our issuingpartner banks for education and patient finance loans will remainwere NBT Bank and Comenity Capital Bank, which originate and service such loans. NBT Bank is subject to oversight by the OCC and was phased out as a partner in 2021. Comenity Capital Bank is subject to oversight by the FDIC and the Utah Department of Financial Institutions.Institutions, and continues to be a partner. These authorities impose obligations and restrictions on our activities and the loans facilitated through our lending marketplace through issuing banks, and there haspartner banks.
There have been challenges to the ability of an FDIC-insured depository institutiona bank to "export"“export” interest rates permitted by the laws of the state where the bank is located, regardless oflocated. For example, the usury limitations imposed by the laws of the state of the borrower’s residence.
The Second Circuit’s 2015 decision in Madden v. Midland Funding, LLC has led to an
increase in inquiries, regulatory proceedings and litigation challenging or raising issues relating to the application of state usury restrictions and limitations and lending arrangements where a bank or other third party has made a loan and then sells and assigns it. In May 2020, the OCC issued a final rule clarifying that interest on a loan that is lawful under federal law for national banks and federal savings associations remains lawful upon the sale, assignment or other transfer of the loan.loan (the OCC Rule). The FDIC issued a similar final rule in June 2020 applicable to FDIC insured state-chartered banks. Additionally,banks (the FDIC Rule). Since these final rules, several federal district courts have declined to follow the Madden decision, including in October 2020,Colorado, Massachusetts and New York. On February 8, 2022, a federal district court granted summary judgment in favor of the OCC issuedand FDIC in lawsuits brought by multiple states seeking to invalidate the OCC Rule and FDIC Rule (California, et al. v. The Office of the Comptroller of the Currency, et al., No. 4:20-cv-05200-JSW (N.D. Cal.); California, et al. v. Federal Deposit Insurance Corporation, No. 4:20-cv-05860-JSW (N.D. Cal.)).
Regulatory Examinations and Actions Relating to the Company’s Pre-Acquisition Business
The Company is routinely subject to examination for compliance with applicable laws and regulations in the states in which it is licensed. Prior to the Acquisition, the Company conducted its business through nonbank entities, some of which maintain or maintained various financial services licenses in numerous jurisdictions. Since the Acquisition, the vast majority of the Company’s business is conducted through LC Bank pursuant to the laws applicable to national banks. Accordingly, many state level regulations and licensing requirements no longer apply to the Company post-Acquisition in part because: (i) it is a rule clarifying that whenbank holding company operating a national bank or federal savings association makes a loan it isand therefore subject to the “true lender” in the context of a partnership between the bank and a third party if, aspurview of the datefederal banking regulations and regulators, and (ii) post-Acquisition, the Company has ceased certain types of origination, it is namedoperations that were unique to its pre-Acquisition business model, such as the lender inRetail Notes program.
Therefore the loan agreementCompany’s nonbank entities have returned, and may continue to return, certain state financial services licenses that were used for pre-Acquisition business activities that have since been discontinued. Nevertheless, even after state financial services licenses are returned, the Company may continue to be subject to the regulation, supervision and enforcement of various state regulatory authorities with respect to legacy or fundsresidual activities. Furthermore, the loan. It is unclear what impactCompany’s nonbank entities continue to maintain certain state licenses, which continue to subject the positionCompany to the regulation, supervision and enforcement of the OCC or FDIC, or the rules they have promulgated, will have on existing or future litigation orsome state regulatory proceedings involving arguments of federal preemption of state usury laws.
LENDINGCLUB CORPORATION
authorities.
For more information on how the regulatory environment, enforcement actions, findings and ratings could also have an impact on our strategies, the value of our assets, or otherwise adversely affect our business see “Item 1A. Risk Factors – Risks Related to Regulation, Supervision and Compliance.”
Intellectual Property
To establish and protect our technology and intellectual property rights, we rely on a combination of copyright, trade secret and other rights, as well as confidentiality procedures, non-disclosure agreements with third parties, employee disclosure and invention assignment agreements, and other contractual rights. We are not dependent on any one patent, or related group of patents, or any other single right to use intellectual property. Despite our efforts to protect our proprietary rights, third parties may, in an authorized or unauthorized manner, attempt to use, copy, or otherwise obtain and market or distribute our intellectual property rights or technology, or otherwise develop a product with the same functionality as our solution. In addition, our competitors may develop products that are similar to our technology. Policing all unauthorized use of our intellectual property rights is nearly impossible, and we cannot be certain that the steps we have taken or will take in the future will prevent misappropriations of our technology or intellectual property rights.
Human Capital
The Company and its consolidated subsidiaries had 1,030 employees and contract1,025 employees as of December 31, 2020,2023, all of whom were located in the United States. Our workforce is reduced from 1,538 employees and contract employees as of December 31, 2019, with muchOn October 12, 2023, we announced a cost reduction plan to align our cost structure to our financial profile given the continued adverse impact of the reduction coming from a restructuringevolving macroeconomic environment on our
business. The plan in April 2020 to addressreduced our workforce by 172 employees (the Workforce Reduction). For employees impacted by the impact of COVID-19 on the Company’s business by repositioning the Company’s expense base to better reflect the reduction in loan volumeWorkforce Reduction, we offered severance, extended benefits coverage and better position the Company for profitability and achieving its strategic goals. The restructuring plan included workforce reductions affecting approximately 460 employees. More recently, on February 1, 2021, we added 195 employees through our acquisition of Radius.outplacement assistance.
Our success depends, in large part, on our ability to recruit, develop, motivate, and retain employees with the skills to execute our long-term strategy. We competeparticipate in a competitive market for talent and aim to distinguish ourselves by offering our employees the opportunity to make a meaningful positive impact on the financesfinancial health of Americans in an innovative technology oriented environment, while offeringtechnology-oriented environment. We also offer competitive compensation and benefits. Our compensation programs consist primarily of base salary, annual corporate bonus opportunity, and long-term equity and cash awards. We periodically conduct pay equity surveys to ensure our compensation programs are applied equitably across our workforce. Our benefits programs consist of comprehensive health, dental, and welfare benefits, including a 401(k) matching program and onlinestandalone mental health tools. In connection with our COVID-19 restructuring plan, we temporarily reduced the base salaries of many of our employees (including our entire executive team). This reduction in base salaries was reverted on January 1, 2021, as our business stabilized and began to recover.coverage.
We strive to create a welcoming and empowering environment where our employees feel that they are committedreaching their full potential, are highly engaged and are doing what they do best every day to advancingaccomplish our mission and vision. We support our employees professionally through onboarding programs, on-the-job training, career development sessions and performance check-ins. We monitor employee satisfaction and engagement through semi-annual engagement surveys. Our employee experience has earned a safe work environment for our employees. number of external recognitions, including being named to Newsweek’s list of the top 100 most loved workplaces.
We adhere, and expect all of our employees to adhere, to our Code of Business Conduct and Ethics, which, among other things, sets forth numerous policies designed to provide for a safe, ethical, respectful and compliant work environment. During the COVID-19 pandemic, our commitment to our employees has been put into action. One of the principles that haswas guided and continues to guide our decision-making during the COVID-19 pandemic isby a core principle: keeping our employees safe. With that principle in mind, in March 2020, we rapidly and effectively implemented a work from home program and nearly our entire workforce continues to work exclusively from home. We have continued to keepprogram. In 2022, we reopened our physical offices closed as we monitor national and local conditions and guidelines.have since adopted a hybrid work model for our employees.
Diversity and inclusion are core to our corporate culture and we continue to make efforts and stridesstrive to improve the diversity of talent within the financial services industry. We treat diversityDiversity and inclusion asis an important consideration when makingin hiring decisions and appointmentswe strive for a 50% diverse candidate slate and interview panel for open roles. In addition to our Board of Directors. We offer anti-racism, inclusive hiring, and breaking bias trainings.trainings for all of our employees, we have executive-sponsored programs designed to provide women and under-represented individuals with leadership training and growth opportunities. Further, we have a program specificallyemployee resource groups and allyship programs designed to provide femaleempower our employees leadership toolsto advocate for the growth of minorities and opportunitiesbuild a more diverse and development program for under-represented individuals that
focuses on both professional and personal growth. We continue to undertake measures to enhance our efforts with respect to diversity and inclusion.inclusive workplace. As of December 31, 2020,2023, our full-time workforce was 42%44% female and 49%50% non-white.
Available Information
Our website address is www.lendingclub.com. At our investor relations website, ir.lendingclub.com, we make available free of charge the following information and capabilities:
•Our Annual Report on Form 10-K, Quarterly Reports on Form 10-Q, Current Reports on Form 8-K and any amendments to these reports as soon as reasonably practicable after they are electronically filed with, or furnished to, the SEC;
•Press releases, including with respect to our quarterly earnings;
•Announcements of public conference calls and webcasts;
•Corporate governance information, including our certificate of incorporation, bylaws, governance guidelines, committee charters, business conduct and ethics policy, and other governance-related policies;
•Other news and market data that we may post from time to time that investors might find useful or interesting; and
•Opportunity to sign up for email notifications.
In addition to announcing material financial information through our investor relations website, press releases, SEC filings, and public conference calls and webcasts, we also intend to use other online and social media channels, including our Blog (http://blog.lendingclub.com)blog.lendingclub.com, Twitter) and X (formerly Twitter) handles (@LendingClub and @LendingClubIR) and Facebook page (https://www.facebook.com/LendingClubTeam) to disclose material non-public information and to comply with our disclosure obligations under Regulation FD.
The contents of the websites referred to above are not incorporated into this filing or in any other report or document on file with the SEC. Further, our references to the URLs for these websites are intended to be inactive textual references only.
The SEC maintains a website that contains reports, proxy and information statements, and other information regarding issuers that file electronically with the SEC at www.sec.gov.
Item 1A. Risk Factors
You should carefully consider the risks and uncertainties described below, together with all of the other information in this Annual Report, on Form 10-K (Report), including the section titled “Part II – Item 7. Management’s Discussion and Analysis of Financial Condition and Results of Operations” and the consolidated financial statements and related notes. While we believe the risks and uncertainties described below include all material risks currently known by us, it is possible that these may not be the only ones we face. If any of the risks actually occur, our business, financial condition, operating results and prospects could be materially and adversely affected.
Risk Factors Summary
Our business is subject to a number of risks that may adversely affect our business, financial condition and results of operations. These risks are discussed more fully below and include, but are not limited to:
Risks Related to Regulation, Supervision and Compliance
•operating within the bank regulatory regime and to the satisfaction of the banking regulators;
•our compliance with applicable laws and regulations (including foreign laws);
•the adequacy of our allowance for loan losses;
•operating within capital and liquidity regulations and requirements;
•the adequacy and effectiveness of our risk management framework; and
•the impact of any changes to the legal and regulatory regime;
•our participation in the Federal Paycheck Protection Program; and
•the adequacy and effectiveness of our risk management framework.regime.
Risks Related to Operating Our Business
•M&A activity, including our recent acquisition of Radius Bancorp;
•the impact of litigation and regulatory investigations;
•holding loans on our balance sheet and associated credit, default and liquidity risks;
•selling loans through our marketplace bank platform;
•maintaining and interest rate risk;increasing loan originations;
•maintaining our deposit base;
•our ability to develop and commercialize products and services;
•maintaining our deposit base;
•maintaining adequate liquidity;
•offering a breadththe impact of litigation and volume of investment opportunities for platform investors;government and regulatory investigations, inquiries and requests;
•disruptions in our technology systems or failures in our technology initiatives;
•maintaining, protecting and promoting our brand;
•managing, and the impact of, fraudulent activity;
•forecasting demand for loans;
•maintainingM&A and increasing loan originations;related integration activity;
•the abilityoffering a breadth and volume of platform investors to exert influence over us;
•disruptions to the technology that powers our marketplace;
•maintaining, protectingloan purchase and promoting our brand;investment opportunities for marketplace investors;
•our use of the issuing bank partnership model;model (where it is still used in our business);
•breaches of certain representations and warranties made to others; and
•our ability to manage indebtedness.
Risks Related to Macroeconomic Conditions or Other External Factors
•the impact of COVID-19 and our ability to navigate the current economic environment;environment, including a potential recession;
•fluctuations in interest rates;
•the political environment and fiscal/monetary policies;
•a decline in overall social and economic conditions;
•the political environment and governmental fiscal/monetary policies;
•negative publicity and media coverage; and
•the impact of geopolitical events, natural disasters, infrastructure failures and other business interruptions; and
•negative publicity and media coverage.interruptions.
Risks Related to Credit and Collections
•the accuracy and effectiveness of our credit decisioning models; and
•the effectiveness of our collections efforts.collection efforts; and
•the accuracy of credit and other information received from borrowers or third parties.
Risks Related to Our Industry
•our ability to compete; and
•the soundness of other financial institutions.
Risks Related to Personnel and Third-PartiesThird Parties
•attracting and retaining employees;
•the impact of any misconduct or errors; and
•our reliance on, and relationship with, third-parties.third parties; and
•the failure or circumvention of our controls and procedures.
Risks Related to Data, Intellectual Property and Privacy
•security incidents, failures and bugs in our systems;
•the impact of cyber-attacks suffered by third parties;
•the collection, storage and use of personal data;
•protecting our intellectual property rights; and
•our use of open source software.
Risks Related to Tax and Accounting
•changes in tax laws and our ability to use our deferred tax asset; and
•our net loss position.gain (loss) position; and
•changes in accounting standards and incorrect estimates and assumptions.
Risks Related to the Ownership of Our Common Stock
•the volatility of our stock price and fluctuations in quarterly results;
•the availability and content of research and reports by analysts;
•future equity dilution;
•our anti-takeover provisions and restrictions in accumulating a position in the Company;
•the availability and content of research and reports by analysis; and
•our intention to not pay dividends in the foreseeable future.
RISKS RELATED TO REGULATION, SUPERVISION AND COMPLIANCE
We operate in a highly regulated environment that affects virtually all aspects of our operations, and the need to comply with applicable laws, regulations and supervisory expectations can materially impact our business, financial condition and results of operationsoperations.
We are subject to extensive regulation, supervision and legal requirements that affect virtually all aspects of our operations. The regulatory regime governing banking organizations is generally intended to protect customers, depositors, the DIF,Deposit Insurance Fund and the overall financial stability of the United States, not our shareholdersstockholders or creditors. See “Item 1. Business – Regulation and Supervision”Supervision” for information on the regulation and supervision framework which governs our Company and its activities.
We are regularly examined and inspected by our regulators, including the FRB and OCC. Our regulators have extensive authority and discretion in their interpretation, implementation, supervision and enforcement of the regulatory regime, including on matters related to:
•dividends or capital distributions by theLC Bank or the Company;
•capital and liquidity requirements applicable to us, including the imposition of requirements more stringent than those required under generally applicable laws;
•the types and terms of products we offer, activities we may conduct or investments we may make;
•the composition, risk characteristics, potential adverse classification, allowance and risk reserves in connection with our loans or other assets;
•our deposit-gathering and other funding sources;
•the quality of our board and management oversight;
•the effectiveness of our risk management and compliance programs, including with respect to consumer protection, information technology, cybersecurity, third-party risk management, anti-money laundering and sanctions;
•the Bank'sLC Bank’s commitment to helping meet the credit needs of low- and moderate-income neighborhoods under the Community Reinvestment Act of 1967;1977;
•their willingness to approve applications, such as for changes in our business plan, the establishment, relocation or closure of new branches, the commencement of new activities, or the conduct of mergers and acquisitions; and
•our rate of growth and other expansionary or strategic initiatives.
The Company became a bank holding company on February 1, 2021, with its acquisition of the Bank, and therefore has only recently become subjectWe continue to the bank regulatory regime. We must devote substantial time and resources to compliance and meeting our regulators'regulators’ supervisory expectations, which will adversely affect our profitably and may adversely affect our ability to operate profitably or to pursue advantageous business opportunities.
Failure to comply with applicable laws, regulations or commitments, or to satisfy our regulators'regulators’ supervisory expectations, could subject us to, among other things, supervisory or enforcement action, which could adversely affect our business, financial condition and results of operations.
If we do not comply with applicable laws, regulations or commitments, if we are deemed to have engaged in unsafe or unsound conduct, or if we do not satisfy our regulators'regulators’ supervisory expectations, then we may be subject to increased scrutiny, supervisory criticism, governmental or private litigation and/or a wide range of potential monetary penalties or consequences, enforcement actions, criminal liability and/or reputational harm. Such actions could be public or of a confidential nature, and arise even if we are acting in good faith or operating under a reasonable interpretation of the law and could include, for example, monetary penalties, payment of damages or other monetary relief, restitution or disgorgement of profits, directives to take remedial action or to cease or modify practices, restrictions on growth or expansionary proposals, denial or refusal to accept applications, removal of officers or directors, prohibition on dividends or capital distributions, increases in capital or liquidity requirements and/or termination of the Bank'sLC Bank’s deposit insurance. Additionally, compliance with applicable laws, regulations and commitments requires significant investment of management attention and resources. Any failure to comply with applicable laws, regulations or commitments could have an adverse effect on our business, financial condition and results of operations.
Our allowance for loan losses may not be adequate to cover actual losses.
We maintain an allowance for loan losses to provide for loan defaults and non-performance. We reserve for loan losses by establishing an allowance that is based on our assessment of loan losses in our loan portfolio. Further, through its adoption of the Current Expected Credit Loss (CECL)CECL model, the FASB hasFinancial Accounting Standards Board (FASB) implemented a newan accounting model to measure credit losses for financial assets measured at amortized cost, which includes the vast majority of our loan portfolio. Under this new model, the allowance is established to reserve for management’s best estimate of expected lifetime losses inherent in our finance receivables and loan portfolio.
The process for determining the amount of the allowance requires subjective and complex judgments about the future, including forecasts of economic or market conditions that might impair the ability of our borrowers to repay their loans. Changes in economic conditions affecting borrowers, revisions to accounting rules and related guidance, the implementation of CECL, new qualitative or quantitative information about existing loans, identification of additional problem loans, changes in the size or composition of our finance receivables and loan portfolio, changes to our loss estimation techniques including consideration of forecasted economic assumptions, and other factors, both within and outside of our control, may require an increase in the allowance for loan losses. We may also underestimate expected lifetime losses and therefore take additional allowance to account for such losses and/or fail to hold a sufficient allowance for such losses.
A decline in the national economy andor the local economies of theany areas in which the loans are concentrated could result in an increase in loan delinquencies, foreclosures or repossessions resulting in increased charge-off amounts and the need for additional loan loss allowances in future periods. In addition, our regulators may require us to make a provision for loan losses or otherwise recognize further loan charge-offs following their periodic review of our loan portfolio, our underwriting procedures, and our loan loss allowance.
We are subject to stringent capital and liquidity regulations and requirements.
LendingClub Corporation is the parent company of and a separate and distinct legal entity from theLC Bank. Legal entity liquidity is an important consideration as there are legal, regulatory contractual and other limitations on our ability to utilize liquidity from one legal entity to satisfy the liquidity requirements of another, which could result in adverse liquidity events at either LendingClub Corporation and/or theLC Bank. In particular, theLC Bank is subject to laws that restrict dividend payments or authorize regulatory bodies to block or reduce the flow of funds from those subsidiaries to the parent company or other subsidiaries.affiliates. Applicable laws and regulations, including capital and liquidity requirements, could restrict our ability to transfer funds between theLC Bank and LendingClub Corporation, which could adversely affect our cash flow and financial condition. Additionally, applicable laws and regulations may restrict what LendingClub Corporation is able to do with the liquidity it does possess, which may adversely affect our business and results of operations.
Bank holding companies, including the Company, are subject to capital and liquidity standards. Further, we have made certain commitments to the banking regulators which require us to hold capital incremental to the minimum required under the applicable standards, which could thereby impact the Company’s ability to invest in assets. From time to time, regulators may implement changes to these capital adequacy and liquidity requirements. If the Company fails to meet these minimum capital adequacy and liquidity guidelines and other regulatory requirements, its business activities, including lending, and its ability to expand could be limited. It could also result in the Company being required to take steps to increase its regulatory capital that may be dilutive or adverse to stockholders, including limiting the Company’s ability to pay dividends to stockholders or limiting the Company’s ability to invest in assets even if deemed more desirable from a financial and business perspective.
Our business may be adversely affected if our risk management framework does not effectively identify, assess and mitigate risk.
Our risk management framework seeks to appropriately balance risk and return and mitigate our risks, including risks attributable to third parties. We have established policies intended to regularly identify and assess our risk profile, including credit risk, pricing risk, liquidity risk, strategic risk and operational risk, and then implement appropriate processes and controls to mitigate risk.
If our risk management framework does not effectively identify, assess and/or mitigate our risk profile, we could suffer unexpected losses or be adversely affected, which could have a material adverse effect on our business. For example, assessment of our risk profile depends, in part, upon the use of forecasting models. If these models are ineffective at predicting future losses or are otherwise inadequate, we may incur unexpected losses or otherwise be adversely affected. In addition, the information we use may be inaccurate or incomplete, both of which may be difficult to detect and avoid. Additionally, there may be risks that exist, or that develop in the future, that we have not appropriately anticipated, identified or mitigated.
Finally, our risk management framework may be deemed insufficient or inadequate by our regulators, which has in the past required, and may in the future require, that we invest additional resources into remediating any deficiencies and adversely impacted our ability to operate our business until the revised framework is deemed sufficient and adequate by our regulators.
Changes in the legal and regulatory regime could adversely affect our business, financial condition, and results of operations.
Laws, regulations and supervisory expectations, and the manner in which they are interpreted and enforced, are constantly changing. For example, governments could pass legislation or adopt policies based on changes in leadership, shifting priorities, the stability of the banking system or in response to current financial conditions. We cannot predict what changes, if any, will be made to the legal and regulatory regime or the effect that such changes may have on our future business and earnings prospects. Changes to the legal and regulatory regime may require material modifications to our products, services and operations, require significant investments of management attention and resources, or expose us to potential liability for past practices. Changes to the legal and regulatory regime, such as through amendments to laws and regulations, imposition of supervisory action, or shifts in governmental or regulatory policies, practices or priorities may have a material adverse impact on our operations, including the cost to conduct business, our results of operations and what products and services we can offer.
We have participated as a lender in the Federal Paycheck Protection Program (PPP) and have certain risks attributable to lenders under PPP.
The PPP loans made by the Bank (which in this risk factor includes its predecessor entity Radius Bank) under the federal CARES Act are guaranteed by the Small Business Administration (SBA). If PPP loan funds are used by the borrower for specific purposes as provided under the PPP, the loan may be fully or partially forgiven by the SBA and the Bank will receive funds directly from the SBA. If, however, the PPP borrower fails to qualify for loan forgiveness then we may end up holding these loans at unfavorable interest rates as compared to the interest rate that we otherwise would have applied.
There was and continues to be uncertainty regarding some of the laws, rules and guidance relating to the PPP. If the SBA or other regulators determine that the Bank has not complied with all PPP laws, rules and guidance, we could be required to refund some or all of the fees related to PPP loans that we have earned or be subject to other regulatory enforcement action. Furthermore, in the event of a loss resulting from a default on a PPP loan and a determination by the SBA that there was a deficiency in the manner in which the PPP loan was originated, funded or serviced by the Bank, the SBA may deny its liability under the guaranty, reduce the amount of the guaranty or, if it has already made payment under the guaranty, seek recovery of any loss related to the deficiency from the Bank. PPP lenders, including the Bank, may also be subject to the risk of litigation in connection with other aspects of the PPP, including but not limited to borrowers seeking forgiveness of their loans. Any financial liability or litigation related to the Bank’s participation in PPP could adversely impact our business, financial condition, and results of operations.
Our business may be adversely affected if our risk management framework does not effectively identify, assess and mitigate risk.
Our risk management framework seeks to appropriately balance risk and return and mitigate our risks. We have established policies intended to regularly identify and assess our risk profile, including credit risk, pricing risk, liquidity risk, strategic risk and operational risk, and then implement appropriate processes and controls to mitigate the risk.
If our risk management framework does not effectively identify, assess and/or mitigate our risk profile, we could suffer unexpected losses or be adversely affected, which could have a material adverse effect on our business. For example, assessment of our risk profile depends, in part, upon the use of forecasting models. If these models are ineffective at predicting future losses or are otherwise inadequate, we may incur unexpected losses or otherwise be adversely affected. In addition, the information we use may be inaccurate or incomplete, both of which may be difficult to detect and avoid. Additionally, there may be risks that exist, or that develop in the future, that we have not appropriately anticipated, identified or mitigated.
Finally, our risk management framework may be deemed insufficient or inadequate by our regulators, which may require that we invest additional resources into remediating any deficiencies and adversely impact our ability to operate our business until such time as the revised framework is deemed sufficient and adequate by our regulators.
Participation by non-U.S. residents on our marketplace bank platform may result in non-compliance with foreign laws.
From time to time, non-U.S. residents invest in loans directly through our marketplace bank.bank platform. We are not experts with respect to all applicable laws in the various foreign jurisdictions from which an investor may be located, and we cannot be sure that we are complying with all applicable foreign laws. Failure to comply with such laws could result in fines and penalties payable by us, which could reduce our profitability or cause us to modify or delay planned expansions and expenditures, including investments in our growth. In addition, any such fines and penalties could create negative publicity, result in additional regulatory oversight that could limit our operations and ability to succeed, or otherwise hinder our plans to expand our business internationally.
RISKS RELATED TO OPERATING OUR BUSINESS
Our acquisitions and other strategic transactions, including our recent acquisition of Radius Bancorp, may not yield the intended benefits.
We have historically and may continue to evaluate and consider strategic transactions, combinations, acquisitions, dispositions or alliances. These transactions could be material to our financial condition and results of operations if consummated. If we are able to identify an appropriate business opportunity, we may not be successful in negotiating favorable terms and/or consummating the transaction and, even if we do consummate such a transaction, we may be unable to obtain the benefits or avoid the difficulties and risks of such transaction.
In particular, on February 1, 2021, we acquired Radius Bancorp, Inc. (Radius) and thereby its wholly-owned subsidiary, Radius Bank. The Company anticipates that this acquisition may be transformational for the Company from both a financial and strategic perspective. However, any acquisition (including our acquisition of Radius), disposition or other strategic transactions involves risks, including:
•difficulties in assimilating and integrating the operations, personnel, systems, data, technologies, products and services of the acquired business, which may require ongoing investment in development and enhancement of additional operational and reporting processes and controls;
•inability of the acquired technologies, products or businesses to achieve expected levels of revenue, profitability, productivity or other benefits;
•difficulties in retaining, training, motivating and integrating key personnel;
•diversion of management’s time and resources from our normal daily operations;
•difficulties in successfully incorporating licensed or acquired technology and rights into our platform;
•difficulties in maintaining uniform standards, controls, procedures and policies within the combined organizations;
•difficulties in retaining relationships with customers, employees and suppliers of the acquired business;
•risks of entering markets in which we have no or limited direct prior experience;
•regulatory risks, including remaining in good standing with existing regulatory bodies or receiving any necessary pre-closing or post-closing approvals, as well as being subject to new regulators with oversight over an acquired business;
•assumption of contractual obligations that contain terms that are not beneficial to us, require us to license or waive intellectual property rights or increase our risk for liability;
•failure to successfully further develop the acquired technology;
•liability for activities of the acquired or disposed of business before the acquisition or disposition, including patent and trademark infringement claims, violations of laws, regulatory actions, commercial disputes, tax liabilities and other known and unknown liabilities;
•difficulty in separating assets and replacing shared services;
•assumption of exposure to performance of any acquired loan portfolios;
•potential disruptions to our ongoing businesses; and
•unexpected costs and unknown risks and liabilities associated with the acquisition.
Accordingly, any acquisition, disposition or other strategic transaction may not be successful, may not benefit our business strategy, may not generate sufficient revenue to offset the associated costs or may not otherwise result in the intended benefits. Additionally, it may take us longer than expected to fully realize the anticipated benefits and synergies of these transactions (including the acquisition of Radius), and those benefits and synergies may ultimately be smaller than anticipated or may not be realized at all, which could adversely affect our business and operating results.
The acquisition of Radius represents a significant transformation for the Company. While the Company is optimistic in its ability to integrate the Radius business and the strategic and financial opportunities the acquisition will enable, there is significant risk in the execution of the transformation and integration. For example, the Company is now subject to extensive regulation by the federal banking regulators and accordingly the Company needs to rapidly
evolve its compliance programs and ensure it has adequate processes and staffing to satisfy the applicable regulations and our regulators. Similarly in connection with the acquisition, the Company now offers a broader suite of products and services and there is a risk that there will be interruptions in the operation and support of these products and services while the Company completes the integration of the Radius business and personnel. Any failure, delay or interruptions related to this transformation and integration could adversely impact our business, financial condition, and results of operations. Finally, while the Company is undergoing this transformation and integration, certain of the other risks described in “Item 1A. Risk Factors” and elsewhere in our Report, such as our attrition risk, compliance with the bank regulatory regime, and resolution of regulatory and compliance matters associated with our prior regulatory regime, may be heightened during this inflection point for the Company. Further, the Company is transitioning from an issuing bank partnership model to one in which it directly originates the vast majority of its loans.
Any transactions, combinations, acquisitions, dispositions or alliances may also require us to issue additional equity securities, spend our cash, or incur debt (and increased interest expense), liabilities, and amortization expenses related to intangible assets or write-offs of goodwill, which could adversely affect our results of operations and dilute the economic and voting rights of our stockholders and the interests of holders of our indebtedness.
In addition, we cannot assure you that any acquisition of new businesses or technology will lead to the successful development of new or enhanced products and services or that any new or enhanced products and services, if developed, will achieve market acceptance or prove to be profitable.
Finally, we may also choose to divest certain businesses or product lines that no longer fit with our strategic objectives. If we decide to sell assets or a business, we may have difficulty obtaining terms acceptable to us in a timely manner, or at all. Additionally, the terms of such potential transactions may expose the Company to ongoing obligations and liabilities.
We are regularly subject to litigation, and government and regulatory investigations, inquiries and requests.
We are regularly subject to claims, individual and class action lawsuits, lawsuits alleging regulatory violations such as the Telephone Consumer Protection Act (TCPA), Fair Credit Reporting Act (FCRA), Unfair and Deceptive Acts and Practices (UDAP) or Unfair, Deceptive or Abusive Acts or Practices (UDAAP) violations, government and regulatory exams, investigations, inquiries or requests, and other proceedings involving consumer protection, privacy, labor and employment, intellectual property, privacy, data protection, cyber security, securities, tax, commercial disputes, record retention and other matters. The number and significance of these claims, lawsuits, exams, investigations, inquiries and requests have increased as our business has expanded in scope and geographic reach, and our products and services have increased in complexity. We are also subject to significant litigation and regulatory inquiries, as discussed more fully in “Part II – Item 8. Financial Statements and Supplementary Data – Notes to Consolidated Financial Statements – Note 19. Commitments and Contingencies,” below. In particular, note that on April 25, 2018, the Federal Trade Commission (FTC) filed a complaint in the Northern District of California (FTC v. LendingClub Corporation, No. 3:18-cv-02454) alleging causes of action for violations of the Federal Trade Commission Act of 1914, as amended, including claims of deception in connection with disclosures related to the origination fee associated with loans available through the Company’s platform, and in connection with communications relating to the likelihood of loan approval during the application process, and a claim of unfairness relating to certain unauthorized charges to borrowers’ bank accounts. The FTC’s complaint also alleged a violation of the Gramm-Leach-Bliley Act regarding the Company’s practices in delivering its privacy notice.
The scope, timing, outcome, consequences and impact of claims, lawsuits, proceedings, investigations, inquiries and requests that we are subject to cannot be predicted with certainty. Determining reserves for our pending litigation is a complex, fact-intensive process that requires significant judgment. Furthermore, resolution of such claims, lawsuits, proceedings, investigations, inquiries and requests could result in substantial fines, penalties or other monetary, injunctive or declaratory relief, which may materially and adversely affect our business. These claims, lawsuits, proceedings, exams, investigations, inquiries and requests could also: (i) result in reputational harm, criminal sanctions, consent decrees, orders preventing us from offering certain features, functionalities, products or
services, (ii) limit the Company’s access to credit, (iii) result in a modification or suspension of our business practices, (iv) require us to develop non-infringing or otherwise altered products or technologies, (v) prompt ancillary claims, lawsuits, proceedings, investigations, inquiries and requests, (vi) consume financial and other resources which may otherwise be utilized for other purposes, such as advancing the Company’s products and services, (vii) cause a breach or cancellation of certain contracts, or (viii) result in a loss of customers, investors and/or ecosystem partners, any of which may adversely affect our business and operations. Furthermore, even following the resolution of any claims, lawsuits, proceedings, exams, investigations, inquiries and requests against the Company, a regulatory enforcement agency could take action against one or more individuals or entities, which may require us to continue to incur significant expense for indemnification for any such individual or entity until such matters may be resolved. Any of these consequences could materially and adversely affect our business.
Holding loans on our balance sheet exposes us to credit, default and liquidity and interest rate risk,risks, which may adversely affect our financial performance.
We may hold loans purchased and/or issued by the Company or issued by the Bank for a short period or for a longer term.LC Bank. While these loans are on our balance sheet we earn interest on the loans, but we have exposure to the credit risk of the borrowers. In the event of a decline or volatility in the credit profile and/or delinquency rates of these borrowers, the value of these held loans may decline. ThisFor example, increasing inflation and interest rates may cause borrowers to allocate more of their income to necessities such as housing and food, thereby potentially increasing their risk of default by reducing their ability to make loan payments.
From time to time, we also sponsor the sale of loans through Structured Program transactions, and we may be required to and/or otherwise decide to retain a portion of the interests in these securitization transactions (Securitization Interests).
Volatility or a decline in the value of the loans and/or Securitization Interests held on our balance sheet may adversely impact the liquidity of these loans,loans/interests, which could produce losses if the Company iswe are unable to realize their fair value or manage declines in their value, each of which may adversely affect our financial performance. Further, utilizingincreases in delinquency rates may require that we take additional allowances for losses, which may adversely affect our balance sheet to purchase loans at greater than forecasted amounts may impairfinancial performance and our ability to allocate sufficient financial resources for other purposes, such as advancing the Company’sour products and services, which could impact our results of operations.
In addition to the discussion in this section, see the risk factor “The current economic environment, including a potential recession and the resumption of Federal student loan payments, could negatively affect our business and operating results.”
If investors on our marketplace bank platform pause or cease their participation or exert influence over us, our business, financial condition and results of operations may be harmed.
Our success depends in significant part on third party investors purchasing loans through our marketplace bank platform. Investors may have financial conditions or limitations that adversely impact their ability to continue to participate on our platform. Further, investors may choose to deploy their capital elsewhere for any reason, including if financial returns on loans we offer prove to be unsatisfactory. For example, elevated inflation and interest rates may cause borrowers to allocate their income to necessities, such as housing and food, thereby potentially increasing their risk of default by reducing their ability to make loan payments. This may increase default rates, which could adversely affect marketplace investor returns. Additionally, in an elevated interest rate environment the return expectations of our marketplace investors will likely be elevated, and we may be unable to meet those expectations, which could prompt certain marketplace investors to reduce or cease their loan purchases or investments. The occurrence of one or more of these events with a significant number of investors could, alone or in combination, have a material and adverse effect on our business, financial condition and results of operation. For example, following the historic increases in interest rates by the FRB in 2022 and 2023, a number of our largest marketplace investors ceased or significantly reduced their purchases of our products, which resulted in a material reduction in our marketplace origination volume and revenue.
From time to time, we may provide incentives to investors to purchase such loans from the Companyus or we may sell the loans at a price that is less than par. Anypar, which typically adversely impacts the economics of our business. Even in the event that an incentive or difference to par may beis partially or wholly offset by other factors, such as interest earned on the loan prior to its sale. However,sale, selling loans with incentives or at prices less than par maymay: (i) discourage investors from purchasing loans on our platform without incentives or at par value, (ii) cause the Companyus to realize less revenue than expected with respect to such loans or (iii) prompt dissatisfaction and complaints from investors unable to purchase incentivized or discounted loans.
Additionally, investors may exert significant influence over us, our management and operations. For example, if investors pause or discontinue their investment activity, we may need to provide incentives or discounts and/or enter into alternative structures or terms to attract investor capital to the platform, such as our recently launched Structured Certificates. Any new arrangements or programs may: (i) increase the complexity of our business, (ii) require allocation of personnel and other resources to create and operate, and/or (iii) have new and/or different structures and terms, including alternative fee arrangements, purchase price rebates or other incentives. There is also no assurance that we will be able to enter into any of these arrangements or programs with interest parties, or if we do, what the final terms will be. Failure to attract investor capital on reasonable terms may result in a reduction in origination volume.
We may also experience significant concentration on our marketplace bank platform, where a limited number of investors purchase a large volume of loans eachfrom our platform. Such concentration exposes us disproportionately to any of whichthose investors choosing to cease participation on our platform or choosing to deploy their capital elsewhere, to the economic performance of those investors or to any events, circumstances or risks affecting such investors.
Any material reduction in loan purchases or investments by marketplace investors, or the economics of those purchases or investments for the Company, may adverselyhave a material adverse impact on our business, financial condition and results of operations. In addition to the discussion in this section, see the risk factor “The current economic environment, including a potential recession and the resumption of Federal student loan payments, could negatively affect our business and operating results.”
If we do not maintain or continue to increase loan originations, or expand our marketplace bank to new markets, we may not succeed in maintaining and/or growing our business, and as a result our business and results of operations could be adversely affected.
The vast majority of our revenue currently comes from origination fees, servicing fees on loans sold to marketplace investors and net interest income earned from retaining loans on our balance sheet for investment. Growing these revenue streams may require that we increase loan originations over time. Doing so requires that we attract a large number of new borrowers who meet our platform’s lending standards and those of new and existing marketplace investors, including investors in any securitizations of our loans. Our ability to attract qualified borrowers depends in large part on the success of our marketing efforts, the visibility, placement and customer reviews on third-party platforms and the quality and competitive advantage of our products and services. For example, if any of our marketing channels become less effective, or the cost of these channels were to significantly increase, we may not be able to attract new and retain existing customers in a cost-effective manner or convert potential customers into active customers in our marketplace bank. Additionally, changes in the way third-party platforms operate, including changes in our participation on such platforms, could make the maintenance and promotion of our products and services, and thereby maintaining and growing loan originations, more expensive or more difficult.
Further, every loan we originate is either held on our balance sheet or sold to marketplace investors. Our ability to hold or sell loans is dependent on a number of factors, including the economic and interest rate environment, the performance of our loans and the conditions of capital markets. If any of these factors is volatile or adverse, then we may be unable to hold or sell as many loans as we could potentially originate and therefore would need to reduce our origination volume.
If loan originations through our platform stagnate or decrease, for any reason, our business and financial results may be adversely affected. For example, following the historic increases in interest rates by the FRB in 2022 and 2023, a number of our largest marketplace investors ceased or significantly reduced their purchases of our loans, which resulted in a material reduction in our marketplace origination volume and revenue.
In addition to the discussion in this section, see the risk factor “The current economic environment, including a potential recession and the resumption of Federal student loan payments, could negatively affect our business and operating results.”
We may not be able to maintain our deposit base.
We rely on deposits as a principal source of funding for our lending activities. As of December 31, 2023, we had approximately $7.3 billion in deposits. Our future growth and strategy will largely depend on our ability to maintain deposits to provide a less costly and stable source of funding. The deposit markets are competitive, and therefore it may prove difficult and/or costly to grow our deposit base. For example, as the FRB has increased interest rates, we have made corresponding increases to the rates we offer depositors, which increases our cost of capital and may reduce the net interest margin on loans held for investment.
Changes we make to the rates offered on our deposit products may affect our finances and liquidity. We have brokered deposits, which may be more price sensitive than other types of deposits and may become less available if alternative investments offer higher returns. Further, a significant portion of our deposits is sourced from depositors referred to the Company through third party platforms, and any change in the way such third-party platforms operate, including our participation or the placement of our products on such third-party platforms, may have a materially adverse impact on our ability to maintain and/or grow our deposit base. In addition, our ability to maintain existing or obtain additional deposits may be impacted by factors, including factors beyond our control, including perceptions about the stability of the banking industry, our reputation or financial strength, or branchless banking generally, which could reduce the number of consumers choosing to place deposits with us. In particular, sudden and substantial withdrawals could cause the banking regulators to close our institution and seize our assets. For example, in 2023, Silicon Valley Bank, Signature Bank, and First Republic Bank each failed shortly after substantial reductions in their deposit bases over the course of a few days/weeks.
Our ability to obtain deposit funding and offer competitive interest rates on deposits is also dependent on capital levels of LC Bank and being considered “well-capitalized” by the banking regulators. Our regulators can adjust the requirements to be “well-capitalized” at any time and have authority to place limitations on our deposit businesses, including the interest rate we pay on deposits and the amount of brokered deposits we can accept. An inability to develop and maintain a strong deposit base could have a material adverse impact on our business, financial condition and results of operations.
In addition to the discussion in this section, see the risk factor “The current economic environment, including a potential recession and the resumption of Federal student loan payments, could negatively affect our business and operating results.”
If we are unable to develop and commercialize new products and services and enhancements to existing products and services, our business may suffer.
The financial services and banking industry is evolving rapidly and changing with disruptive technologies and the introduction of new products and services. We derive a significant portion of our revenue from transaction-based fees we collect in connection with facilitating the origination of unsecured personal loans. To enhance customer engagement and diversify our revenue streams, we are undertaking a strategy to broaden the scope of our products and services we offer. Failure to broaden the scope of our products and services leaves us dependent on a single revenue stream and vulnerable to competitors offering a suite of products and services. Accordingly, a key part of our success depends on our ability to develop and commercialize new products and services and enhancements to existing products and services.
We incur expenses and expend resources to develop and commercialize new products and services and enhancements to existing products and services. However, we may not assign the appropriate level of resources, priority or expertise to the development and commercialization of these new products, services or enhancements. We also could utilize and invest in technologies, products and services that ultimately do not achieve widespread adoption and, therefore, are not as attractive or useful to our customers as we anticipate. Moreover, we may not realize the benefit of new technologies, products, services or enhancements for many years, and competitors may introduce more compelling products, services or enhancements in the meantime. Competitors also may develop or adopt technologies or introduce innovations that make our marketplace bank platform less attractive to our borrowers and/or investors.
If we are unable to develop and commercialize timely and attractive products and services, our growth may be limited and our business may be materially and adversely affected.
We may not be able to maintain our deposit base.
Following the acquisition of Radius, we intend to rely on deposits as a principal source of funding for our lending activities. Upon the closing of the acquisition, we had approximately $2.0 billion in deposits. Our future growth and strategy will largely depend on our ability to maintain core deposits to provide a less costly and stable source of funding. The deposit markets are competitive, and therefore it may prove difficult to grow our core deposit base. Changes we make to the rates offered on our deposit products may affect our finances and liquidity. In addition, our ability to maintain existing or obtain additional deposits may be impacted by factors, including factors beyond our control, including perceptions about our reputation, financial strength or branchless banking generally, which could reduce the number of consumers choosing to place deposits with us.
Our ability to obtain deposit funding and offer competitive interest rates on deposits is also dependent on capital levels of our bank subsidiary and being considered “well-capitalized” by the banking regulators. Our regulators can adjust the requirements to be “well-capitalized” at any time and have authority to place limitations on our deposit businesses, including the interest rate we pay on deposits. An inability to develop and maintain a strong deposit base could have a material adverse impact on our business, financial condition and results of operations.
An inability to maintain adequate liquidity could jeopardize our business and financial condition.
Liquidity is essential to our business. Although we believe that we currently have an adequate amount of liquidity to support our business, there are a number of factors that could reduce and/or deplete our existing liquidity position, including results of operations that are reduced relative to our projections, costs related to existing or future litigation or regulatory matters, the pursuit of strategic business opportunities (whether through acquisition or organic) and unanticipated liabilities. Additionally, as noted above, we are subject to stringent capital and liquidity regulations and requirements and need to manage our liquidity position at both LendingClub Corporation and theLC Bank within the parameters and terms set forth by applicable regulations and regulators. LC Bank is subject to various legal, regulatory and other restrictions on its ability to make distributions and payments to the Company. Any inability to maintain an adequate liquidity position could adversely affect our operations, our compliance with applicable regulations and the performance of our business.
Further, our ability to raise additional capital, should that be deemed beneficial and/or necessary, depends on conditions in the capital markets, economic conditions and a number of other factors, including investor perceptions regarding the financial services and banking industry, market conditions, and governmental activities, and on our financial condition and performance. Accordingly, we may be unable to raise additional capital if needed or on acceptable terms, which may adversely affect our liquidity, business, financial condition and results of operations.
If we are unable to offer platform investors a satisfactory breadth and volume of investment opportunities, our business and results of operations may be materially harmed.
We invest in our marketplace bank platform and regularly iterate our processes to provide improved and more efficient investment opportunities, which includes efforts to provide platform investors the opportunity to invest in a broad selection of loans. However, various factors may contribute to certain loans being available only in a limited quantity or being entirely unavailable.
Some of our agreements with platform investors contain provisions regarding the manner in which our marketplace bank platform product operates that could constrain the manner in which our marketplace bank platform product can develop, particularly with respect to how loans are selected for investment. These agreements could constrain the development of our marketplace bank, including efforts to offer a breadth of investment opportunities for and among a variety of investors, and/or result in significant damages that could impact our results in a given period.
If platform investorsWe are unableregularly subject to litigation, and government and regulatory investigations, inquiries and requests.
We are regularly subject to claims, individual and class action lawsuits, lawsuits alleging regulatory violations such as the Telephone Consumer Protection Act (TCPA), Fair Credit Reporting Act (FCRA), Unfair and Deceptive Acts and Practices (UDAP) or Unfair, Deceptive or Abusive Acts or Practices (UDAAP) violations, government and regulatory exams, investigations, inquiries or requests, and other proceedings involving consumer protection, privacy, labor and employment, intellectual property, privacy, data protection, cybersecurity, anti-money laundering, securities, tax, commercial disputes, record retention and other matters. The number and/or significance of these claims, lawsuits, exams, investigations, inquiries and requests have increased as our business has expanded in scope and geographic reach, and our products and services have increased in complexity. For example, since our acquisition of Radius, we are subject to supervision, regulation, examination and enforcement by multiple federal banking regulatory bodies. Specifically, as a bank holding company, the Company is subject to ongoing and comprehensive supervision, regulation, examination and enforcement by the FRB. Further, as a national bank, LC Bank is subject to ongoing and comprehensive supervision, regulation, examination and enforcement by the OCC. Accordingly, we have been and continue to invest in regulatory compliance and to be subject to certain categoriesparameters, obligations and/or limitations set forth by the banking regulations and regulators with respect to the operation of loans,our business. We are unablealso subject to invest atsignificant litigation and regulatory inquiries, as discussed more fully in “Part II – Item 8. Financial Statements and Supplementary Data – Notes to Consolidated Financial Statements – Note 20. Commitments and Contingencies,” below.
The scope, timing, outcome, consequences and impact of claims, lawsuits, proceedings, investigations, inquiries and requests that we are subject to cannot be predicted with certainty. Determining reserves for our pending litigation is a complex, fact-intensive process that requires significant judgment. Furthermore, resolution of such claims, lawsuits, proceedings, investigations, inquiries and requests could result in substantial fines, penalties or other monetary, injunctive or declaratory relief, which may materially and adversely affect our business. These claims, lawsuits, proceedings, exams, investigations, and requests could also: (i) result in reputational harm, criminal sanctions, consent decrees, orders preventing us from offering certain features, functionalities, products or services, (ii) limit our access to credit, (iii) result in a modification or suspension of our business practices, (iv) require certain parameters, obligations and/or limitations with respect to the volume they desire, perceive that they are not offered the same investment opportunitiesoperation of our business, (v) require us to develop non-infringing or otherwise altered products or technologies, (vi) prompt ancillary claims, lawsuits, proceedings, investigations, inquiries and requests, (vii) consume financial and other resources which may otherwise be utilized for other purposes, such as otheradvancing our products and services, (viii) cause a breach or cancellation of certain contracts, or (ix) result in a loss of customers, investors and/or are dissatisfied withecosystem partners, any of which may adversely affect our business and operations. Furthermore, even following the risk-adjusted return they receive from investingresolution of any claims, lawsuits, proceedings, exams, investigations, inquiries and requests against us, a regulatory enforcement agency could take action against one or more individuals or entities, which may require us to continue to incur significant expense for indemnification for any such individual or entity until such matters may be resolved. Any of these consequences could materially and adversely affect our business.
Any significant disruption in our technology systems, including events beyond our control, or failure in our technology initiatives could have a material adverse effect on our operations.
We believe the technology platform theythat powers our marketplace bank enables us to deliver solutions to customers and marketplace investors, and provides a significant time and cost advantage over traditional banks. The satisfactory performance, reliability and availability of our technology and our underlying network infrastructure are critical to our operations, customer service and reputation. Our failure to maintain satisfactory performance, reliability and availability of our technology and underlying network infrastructure may seek alternative investments from oursimpair our ability to attract new and retain existing customers or marketplace investors, which may materiallycould have a material adverse effect on our operations.
Any interruptions or delays in our technology systems or service, whether as a result of third-party error, our error, natural disasters, terrorism, other man-made problems, or security breaches, whether accidental or willful, could harm our reputation and relationships with our customers and marketplace investors. Additionally, in the event of
damage or interruption, our insurance policies may not adequately compensate us for any losses that we may incur. Our disaster recovery plan has not been tested under actual disaster conditions, and we may not have sufficient capacity to recover all data and services in the event of an outage. These factors could prevent us from processing or posting payments on loans, processing loan purchases or investments, damage our brand and reputation, divert our employees’ attention, reduce our revenue, subject us to liability, and cause customers to abandon our marketplace bank platform, any of which could adversely affect our business, financial condition and results of operations.
We depend on our technology infrastructure to conduct and grow our business and operations and accordingly we invest in system upgrades, new solutions and other technology initiatives. Many of these initiatives take a significant amount of time to develop and implement, are tied to critical systems and require significant human and financial resources. While we take steps to mitigate the risks and uncertainties associated with these initiatives, these initiatives may not be implemented on time (or at all), within budget or without negative financial, operational or customer impact. Further if and when implemented, these initiatives may not perform as we or our customers, marketplace investors and other stakeholders expect. We also may not succeed in anticipating or keeping pace with future technology needs, technology demands of our customers or the competitive landscape for technology. The failure to implement new and maintain existing technologies could adversely affect our business, financial condition and results of operations.
Failure to maintain, protect and promote our brand may harm our business.
Maintaining, protecting and promoting our brand is critical to achieving widespread acceptance of our products and services and expanding our base of customers. Maintaining, protecting and promoting our brand depends on many factors, including our ability to continue to provide useful, reliable, secure and innovative products and services, as well as our ability to maintain trust.
Our brand can be harmed in many ways, including failure by us or our partners to satisfy expectations of service and quality, inadequate protection of sensitive information, failure to maintain or provide adequate or accurate documentation and/or disclosures, compliance failures, failure to comply with contractual obligations, regulatory requests, inquiries or proceedings, litigation and other claims, employee misconduct and misconduct by our partners. We have also been, and may in the future be, the target of incomplete, inaccurate and/or misleading statements about our company, our business, and/or our products and services. Furthermore, our ability to maintain, protect and promote our brand is partially dependent on visibility and customer reviews on third-party platforms. Changes in the way these platforms operate could make the maintenance, protection and promotion of our products and services and our brand more expensive or more difficult.
Many of our stakeholders are becoming increasingly interested in our environmental, social, governance and other sustainability responsibilities, strategy and related disclosures. For example, certain of our marketplace investors and equity investors have inquired about our progress and disclosures on this topic. Further, this area of disclosure is subject to state legislation and proposed rules from the SEC, which the Company continues to monitor and will comply with as applicable. For example, in October 2023, California adopted the Climate Corporate Data Accountability Act and the Climate-Related Financial Risk Act, which, among other things, will require certain companies doing business in California to disclose their direct and indirect greenhouse gas emissions and their climate-related financial risks and measures being taken to reduce such risks. As regulations regarding these reporting obligations are still in development, we cannot yet predict the full impact of these laws and their corresponding regulations and future enforcement activity on our business, financial condition, results of operations, brand or reputation. Our absolute and relative progress and disclosures, or lack thereof, on environmental, social, governance and other sustainability matters could impact our reputation, brand and the willingness of certain platform and equity investors to hold our loans or common stock, respectively. If we do not successfully maintain, protect and promote our brand we may be unable to maintain and/or expand our base of customers and investors, which may materially harm our business.
Fraudulent activity associated with our marketplace bank could negatively impact our operating results, brand and reputation and cause the use of our products and services to decrease and our fraud losses to increase.
We are subject to the risk of fraudulent activity associated with our marketplace bank, borrowers, depositors, investors and third parties handling borrower and investor information. We have taken measures to detect and reduce the risk of fraud, but these measures need to be continually improved and may not be effective against new and continually evolving forms of fraud or in connection with new product offerings. Under our agreements with investors, we are obligated to repurchase loans in cases of confirmed identity theft. The level of our fraud charge-offs and our results of operations could be materially and adversely affected if fraudulent activity were to significantly increase. High profile fraudulent activity or significant increases in fraudulent activity could lead to regulatory intervention, negatively impact our operating results, brand and reputation and lead us to take steps to reduce fraud risk, which could increase our costs.
In addition, in the past, third parties have attempted to defraud individuals, some of whom may be potential customers of ours, by misappropriating our logos and representedrepresenting themselves as LendingClub in e-mail campaigns to e-mail addresses that have been obtained outside of LendingClub. In one particular scheme, third parties represented to individuals that they might obtain a loan if they paid an “advance fee.” Individuals who believe that the campaigns are genuine may make payments to these unaffiliated third parties. Although we take commercially reasonable steps to prevent third-party fraud, we cannot always be successful in preventing individuals from suffering losses as a result of these schemes. Individuals who suffer damages due to the actions of these unaffiliated third parties may negatively view LendingClub, causing damage to our brand and reputation and reducing our business.
If we are unable to accurately forecast demand for loans, our business could be harmed.
We operate a marketplace bank platform for consumer credit, balancing borrower demand for loans against investor demand for risk-adjusted returns. We offer credit to borrowers across a range of credit profiles and rates, and we offer loan purchase and investment opportunities across a range of risk-adjusted returns. Investor demand on our platform is sensitive to a variety of factors including loan performance, alternative investment opportunities and macroeconomic conditions. To aid our ability to forecast investor demand, from time to time, we may enter into agreements with marketplace investors that outline expected purchases. However, these order agreements are generally non-binding or contain provisions that allow for modification and/or cancellation of the order. Therefore, it is challenging to precisely forecast investor demand. In the event that borrower demand at a given credit rate exceeds investor demand for that product for a given period, we may fund the loans and hold them on our balance sheet, which carries certain risks. The vast majority of investor funding on our platform is non-committed and therefore it is challenging to precisely forecast investor demand. In addition toSee the discussion in this section, seerisk factor “Holding loans on our balance sheet exposes us to credit, default and liquidity and interest rate risk,risks, which may adversely affect our financial performance.”
Alternatively, in the event that investor demand at a given return exceeds borrower demand for that product for a given period, there may be insufficient inventory to satisfy investor demand. If investors do not believe their demand can be met on our platform, they may seek alternative investments from ours and our business may suffer.
Our acquisitions and other strategic transactions may not yield the intended benefits.
We have historically and may continue to evaluate and consider strategic transactions, combinations, acquisitions, dispositions or alliances. These transactions could be material to our financial condition and results of operations if consummated. If we do not maintain or continueare able to increase loan originations through our marketplace bank, or expand our marketplace bank to new markets,identify an appropriate business opportunity, we may not succeedbe successful in negotiating favorable terms and/or consummating the transaction and, even if we do consummate such a transaction, we may be unable to obtain the benefits or avoid the difficulties and risks of such transaction.
However, any acquisition, disposition or other strategic transactions involves risks, including:
•difficulties in assimilating and integrating the operations, personnel, systems, data, technologies, products and services of the acquired business, which may require ongoing investment in development and enhancement of additional operational and reporting processes and controls;
•inability of the acquired technologies, products or businesses to achieve expected levels of revenue, profitability, productivity or other benefits;
•difficulties in retaining, training, motivating and integrating key personnel;
•diversion of management’s time and resources from our normal daily operations;
•difficulties in successfully incorporating licensed or acquired technology and rights into our platform;
•difficulties in maintaining and/uniform standards, controls, procedures and policies within the combined organization;
•difficulties in retaining relationships with customers, employees and suppliers of the acquired business;
•risks of entering markets in which we have no or growinglimited direct prior experience;
•regulatory risks, including remaining in good standing with existing regulatory bodies or receiving any necessary pre-closing or post-closing approvals, as well as being subject to new regulators with oversight over an acquired business;
•assumption of contractual obligations that contain terms that are not beneficial to us, require us to license or waive intellectual property rights or increase our risk for liability;
•failure to successfully further develop any acquired technology;
•liability for activities of the acquired or disposed of business before the acquisition or disposition, including patent and trademark infringement claims, violations of laws, regulatory actions, commercial disputes, tax liabilities and other known and unknown liabilities;
•difficulty in separating assets and replacing shared services;
•assumption of exposure to performance of any acquired loan portfolios;
•potential disruptions to our ongoing businesses; and
•unexpected costs and unknown risks and liabilities associated with the acquisition.
Accordingly, any acquisition, disposition or other strategic transaction may not be successful, may not benefit our business strategy, may not generate sufficient revenue to offset the associated costs or may not otherwise result in the intended benefits. Additionally, it may take us longer than expected to fully realize the anticipated benefits and synergies of these transactions, and those benefits and synergies may ultimately be smaller than anticipated or may not be realized at all, which could adversely affect our business and asoperating results.
Any transactions, combinations, acquisitions, dispositions or alliances may also require us to issue additional equity securities, spend our cash, or incur debt (and increased interest expense), liabilities and amortization expenses related to intangible assets or write-offs of goodwill, which could adversely affect our results of operations and dilute the economic and voting rights of our stockholders and the interests of holders of our indebtedness.
In addition, we cannot assure you that any acquisition of new businesses or technology will lead to the successful development of new or enhanced products and services or that any new or enhanced products and services, if developed, will achieve market acceptance or prove to be profitable.
Finally, we may also choose to divest certain businesses or product lines that no longer fit with our strategic objectives. If we decide to sell assets or a resultbusiness, we may have difficulty obtaining terms acceptable to us in a timely manner, or at all. Additionally, the terms of such potential transactions may expose us to ongoing obligations and liabilities.
If we are unable to offer marketplace investors a satisfactory breadth and volume of investment opportunities, our business and results of operations couldmay be adversely affected.materially harmed.
To maintain and continue to grow our business, we must continue to increase loan originations throughWe invest in our marketplace bank by attracting a large number of new borrowers who meetplatform and regularly iterate our platform’s lending standardsprocesses to provide improved and new and existingmore efficient investment opportunities, which includes efforts to provide marketplace investors the opportunity to invest in thesea broad selection of loans. Our abilityHowever, various factors may contribute to attract qualified borrowers and attract new and retain existing investors each depends in large part on the success of our marketing efforts, our visibility, placement and customer reviews on third-party platforms, and the competitive advantage of our products, particularly as we continue to grow our marketplace bank and introduce new products. If any of our marketing channels become less
effective, or the cost of these channels were to significantly increase, we may not be able to attract new and retain existing customerscertain loans being available only in a cost-effective mannerlimited quantity or convert potential customers into active customers in our marketplace bank. Additionally, changes in the way third-party platforms operate, including changes in our participation on such platforms, could make the maintenance and promotion of our products and services, and thereby maintaining and growing loan originations, more expensive or more difficult. If loan originations through our platform stagnate or decrease, for any reason, our business and financial results may be adversely affected.being entirely unavailable.
If marketplace investors on our marketplace bank pause are unable to invest in certain categories of loans, are unable to invest at the volume they desire, perceive that they are not offered the same investment opportunities as other investors and/or cease their participation or exert influence over us, our business, financial condition and results of operations may be harmed.
Our success depends in significant part onare dissatisfied with the financial strength of investors participating on our marketplace bank. Investors could, for any reason, experience financial difficulties and cease participating on our marketplace bank or fail to pay fees when due. Further, the financial returns on loans we offerrisk-adjusted return they receive from investing on our platform, they may prove to be unsatisfactory to certain platform investors and, therefore, such investors may choose to deploy their capital elsewhere. The occurrence of one or more of these events with a significant number of investors could, alone or in combination, have a material and adverse effect on our business, financial condition and results of operation.
Additionally, investors may exert significant influence over us, our management and operations. For example, if investors pause or discontinue their investment activity, we may need to provide incentives or discounts and/or enter into unique structures or terms to attract investor capital to the platform. These arrangements may have a number of different structures and terms, includingseek alternative fee arrangements or other incentives. There is also no assurance that we will be able to enter into any of these transactions if necessary, or if we do, what the final terms will be. Failure to attract investor capital on reasonable terms may result in a reduction in origination volume. For example, a number of our largest platform investors ceased or significantly reduced their purchases of our products in the Spring of 2020, which resulted in a material reduction in our origination volume and revenue. Such actions may have a material impact on our business, financial condition and results of operations.
Any significant disruption in service on our platform or in our technology systems, including events beyond our control, could have a material adverse effect on our operations.
We believe the technology platform that powers our marketplace bank enables us to deliver solutions to customers and provides a significant time and cost advantage over traditional banks. The satisfactory performance, reliability and availability of our technology and our underlying network infrastructure are critical to our operations, customer service and reputation. Our failure to maintain satisfactory performance, reliability and availability of our technology and our underlying network infrastructure may impair our ability to attract new and retain existing customers, which could have a material adverse effect on our operations.
Any interruptions or delays in our technology systems or service, whether as a result of third-party error, our error, natural disasters, terrorism, other man-made problems, or security breaches, whether accidental or willful, could harm our relationships with our customers and our reputation. Additionally, in the event of damage or interruption, our insurance policies may not adequately compensate us for any losses that we may incur. Our disaster recovery plan has not been tested under actual disaster conditions, and we may not have sufficient capacity to recover all data and services in the event of an outage. These factors could prevent usinvestments from processing or posting payments on the loans, damage our brand and reputation, divert our employees’ attention, reduce our revenue, subject us to liability and cause customers to abandon our marketplace bank, any of which could adversely affect our business, financial condition and results of operations.
Failure to maintain, protect and promote our brand may harm our business.
Maintaining, protecting and promoting our brand is critical to achieving widespread acceptance of our products and services and expanding our base of customers. Maintaining, protecting and promoting our brand depends on many factors, including our ability to continue to provide useful, reliable, secure and innovative products and services, as well as our ability to maintain trust.
Our brand can be harmed in many ways, including failure by us or our partners to satisfy expectations of service and quality, inadequate protection of sensitive information, failure to maintain or provide adequate or accurate documentation and/or disclosures, compliance failures, failure to comply with contractual obligations, regulatory requests, inquiries or proceedings, litigation and other claims, employee misconduct and misconduct by our partners. We have also been, and may in the future be, the target of incomplete, inaccurate and/or misleading statements about our company, our business, and/or our products and services. Furthermore, our ability to maintain, protect and promote our brand is partially dependent on visibility and customer reviews on third-party platforms. Changes in the way these platforms operate could make the maintenance, protection and promotion of our products and services and our brand more expensive or more difficult. If we do not successfully maintain, protect and promote our brand we may be unable to maintain and/or expand our base of customers,ours which may materially harm our business.business and results of operations.
Any challenge to or adverse consequence from our use of the issuing bank partnership model (or litigation or legislation aimed at thwarting certain transactions based on this model) may harm our business.
Prior to acquiring Radius, we utilized an issuing bank model. Since acquiring Radius, we have transitioned from an issuing bank partnership model to one in which we directly originate the vast majority of our loans. We believe that our historical use and current limited use of the issuing bank partnership model iswas and remains appropriate for all the jurisdictions in which we operate and we have worked with federal, state and local regulatory agencies to help them understand the model. However, we operate in a complex and evolving regulatory environment at the federal and state level and some enforcement authorities and private parties have challenged the ability to rely on legislative and judicial authority that permits an FDIC-insured depository institutiona bank to "export"“export” interest rates permitted by the laws of the state where the bank is located, regardless of the usury limitations imposed by the laws of the state of the borrower’s residence.located.
Specifically,For example, in May 2015, the U.S. Court of Appeals for the Second Circuit issued its decision in Madden v. Midland Funding, LLC that interpreted the scope of federal preemption under the National Bank Act (NBA) and held that a nonbank assignee of a loan originated by a national bank wasmay not be entitled to the benefits of federal preemption of claims of usury. The Second Circuit’s decision is binding on federal courts located in Connecticut, New York, and Vermont, but the decision could also be adopted by other courts. While we believeHowever, in 2020, the OCC issued a final rule clarifying that our useinterest on a loan that is lawful under federal law for national banks and federal savings associations remains lawful upon the sale, assignment or other transfer of the issuing bank model is factually distinguishable from such case,loan (the OCC Rule). The FDIC issued a similar final rule in 2020 applicable to FDIC-insured state-chartered banks (the FDIC Rule). Since these final rules, several federal district courts have declined to follow the decision of the U.S. Court of Appeals for the Second Circuit in Madden v. Midland Funding, LLC, including in Colorado, Massachusetts and New York. On February 8, 2022, a federal district court granted summary judgment in favor of the OCC and FDIC in lawsuits brought by multiple states seeking to invalidate the OCC Rule and FDIC Rule (California, et al. v. The Office of the Comptroller of the Currency, et al., No. 4:20-cv-05200-JSW (N.D. Cal.); California, et al. v. Federal Deposit Insurance Corporation, No. 4:20-cv-05860-JSW (N.D. Cal.)).While we believe that our use of the issuing bank model is appropriate and factually distinguishable from the decision of the U.S. Court of Appeals for the Second Circuit in Madden v. Midland Funding, LLC, the case could create potential liability under state statutes such as usury and consumer protection statutes. Further, state legislatures may enact new laws or amend existing laws aimed at undermining the ability of non-bank purchasers of loans to realize the outcome of a bank’s ability to export interest rates.
Any challenge to or adverse consequence of our use of the issuing bank partnership model could adversely affect ourthat business (including requiring that we alter our business model for certain of ourimpacted products), financial condition and results of operations.
If we breach representations or warranties that we made in connection with our securitization,marketplace investor transactions, including whole loan sales, structured products or CLUB Certificatesecuritization transactions, or if either we suffer a direct or indirect loss in our retained interests in these transactions, our financial condition could be harmed.
We make customary representations, warranties and covenants to marketplace investors about the loans we sell and service. We have sponsored, a number of salesand expect to sponsor in the future, the sale of unsecured personal whole loans through
asset-backed securitizations. In connection with these securitizations, as well as our whole loan and CLUBother structured products or Structured Certificate transactions, we make certain customary representations, warranties and covenants. If there is a breach of those representations, warranties and warrantiescovenants that materially and adversely affects the value of the subject loans, then we will be required to either cure the breach, repurchase the affected loans from the purchasing entity replaceor investor or reimburse the affected loans with other loanspurchasing entity or make a loss of value payment,investor for incurred losses and expenses, as the case may be. Any losses that resultThese repurchase or reimbursement obligations could be material and have an adverse effect on our financial condition.
In the event that we suffer losses on all or a portion of the interests in any securitization transaction that we have retained (whether to comply with applicable risk retention rules or otherwise), our financial condition could be harmed. We may enter into similar transactions in the future and those transactions are likely to entail similar and other substantial risks.
Indebtedness could adversely affect our business and financial results.
In the past, we have had a significant amount of indebtedness. While our indebtedness has recently materially decreased, if our debt service obligations increase, whether due to the increased cost of existing indebtedness or the incurrence of additional indebtedness, more of our cash flow from operations would need to be allocated to the payment of principal of, and interest on, our indebtedness, which would reduce the funds available for other purposes. Our indebtedness also could limit our ability to execute our strategic plan and withstand competitive pressures and could reduce our flexibility in responding to changing business and economic conditions.
Should we desire to obtain additional indebtedness we may require a guarantee by theLC Bank, where substantially all of our operations are being conducted. Any such guarantee wouldmay require approval of the banking regulators and there can be no assurance that we would be able to obtain such a guarantee. To the extent that we are not able to obtain a guarantee from theLC Bank, it may be more difficult or expensive for us to borrow money.
Our ability to make payments on our debt, to repay our existing indebtedness when due, and to fund our business, and operations and significant planned capital expenditures will depend on our ability to pay with available cash or generate cash in the future. This, to a certain extent, is subject to financial, competitive, legislative, regulatory and other factors that are beyond our control. In addition, if we cannot service our indebtedness, we may have to take actions such as utilizing available capital, limiting the facilitation of additional loans, selling assets, selling equity or reducing or delaying capital expenditures, strategic acquisitions, investments and alliances, any of which could impede the implementation of our business strategy, prevent us from entering into transactions that would otherwise benefit our business and/or adversely affect our business and financial results. We also may not be able to refinance our indebtedness or take such other actions, if necessary, on commercially reasonable terms, or at all.
RISKS RELATED TO MACROECONOMIC CONDITIONS OR OTHER EXTERNAL FACTORS
OurThe current economic environment, including a potential recession and the resumption of Federal student loan payments, could negatively affect our business has been and will likely continue to be negatively impacted by the COVID-19 pandemic.operating results.
The COVID-19 pandemicU.S. economy is undergoing a period of rapid change and significant uncertainty. A number of factors are causing this change and uncertainty, including elevated inflation, increasing interest rates, evolving government policies and changing U.S. consumer spending patterns. Inflation reached a 40-year high of 9.1% in June 2022, and the mitigation efforts by governmentsannual inflation rate for the U.S. was 6.5% for the twelve months ended December 31, 2022. In response to attemptelevated inflation, the FRB increased interest rates eleven times since early 2022, from a federal funds rate range of 0.00% to control its spread, including0.25% in early 2022 to 5.25% to 5.50% as of December 2023, and has indicated a willingness to keep rates elevated as it deems necessary to combat inflation. The elevated inflation and interest rates, and uncertainty with respect to when the closurerates will decrease, are changing lending and spending patterns, and thereby prompting fears that the U.S. is currently experiencing or will soon experience an economic downturn or prolonged period of non-essential businesses and shelter in place orders, resulted in an unprecedented reduction inslow economic activity and significant dislocation on consumers, businesses, capital markets and the broader economy. In particular, the impact of COVID-19 on the finances of our borrowers has been profound as many have been, and will likely continue to be, impacted by unemployment, reduced earnings and/or elevated economic disruption and insecurity.growth.
In response to the impact of COVID-19, the Company has undertaken a number of initiatives to support its borrowers, protect investor returns, and preserve capital and liquidity. For example, we have added customer support capacity and instituted new payment and hardship plans, adjusted our credit and underwriting processes and standards, and undertaken a number of measures that aim to balance the platform without further use of the Company’s balance sheet. We will continue to actively monitor the situation, assess possible implications to our business and take appropriate actions in an effort to mitigate the adverse consequences of COVID-19. However, there can be no assurances that the initiatives taken by the Company will be sufficient or successful.
There are no comparable recent events to accurately predict the effect COVID-19 may have, and, as a result, its ultimate impact is highly uncertain and subject to change. As of the date of this Report, COVID-19 has had, and may continue to have, a number of adverse effects on our business and results of operations, including materially decreased demand for our products and negative pressure on overall platform returns, including as a result of increased credit risk of borrowers (including elevated delinquencies and charge-off rates) and the implementation of forbearance plans.
Further, our compliance with measures to contain the spread of or otherwise related to COVID-19 has impacted our day-to-day operations and could disrupt our business and operations, as well as that of our key vendors and
counterparties,Our business is sensitive to, and may be adversely impacted by, the current inflation and interest rate environment. Among other things, as inflation and interest rates are elevated: (i) existing borrowers may allocate more of their income to necessities such as housing and food, thereby potentially increasing their risk of default by reducing their ability to make loan payments, (ii) the rate we offer on our deposit products will increase to remain competitive, thereby increasing our cost of funding and reducing our net interest margin, (iii) the return our loan products generate may be less attractive relative to other investment options, thereby reducing marketplace investor demand in our loan products, and (iv) we may need to increase interest rates and/or tighten credit standards for an indefinite period of time. To keep our employees safenew originations, thereby potentially making it more challenging to source enough interested and secure, we have temporarily closed our physical work spaces, instituted additional paid leave policies and leveraged technologyqualified borrowers to enable remote working. The disruptions caused by COVID-19sufficient origination volume. Further, the pace of recent increases in inflation and interest rates creates unique challenges in our ability to operate our business. For example, the rapid increase in interest rates has quickly increased the cost of capital for our non-bank marketplace investors and thereby increased their return expectations. However, because our consumer loans are fixed interest rate products, we are unable to re-price existing loans, and with respect to new originations, we need to re-price methodically to remain competitive and mitigate the adverse impacts of doing so. Therefore, until the interest rate environment stabilizes, we may result in inefficienciesbe challenged to fully meet the return expectations for certain of our marketplace investors which may adversely impact our marketplace volume and delays in product development, marketing, operations and customer service efforts that we cannot fully mitigate.related revenue.
The extentIn addition, changes in, and uncertainty with respect to, which COVID-19 will continuegovernment policies in response to negativelythe current economic climate may adversely impact our business. For example, in response to the COVID-19 pandemic, in March 2020 the U.S. Department of Education implemented a student loan relief program which included a suspension of: (i) federal loan payments, (ii) interest rate accrual and (iii) collections on defaulted loans (collectively, the Student Loan Forbearance Program). However, in connection with an agreement to raise the borrowing capacity of the Federal government, the Student Loan Forbearance Program lapsed and interest accruals resumed in September 2023 and payments resumed in October 2023 (collectively, the Student Loan Payment Resumption).
We are monitoring the Student Loan Payment Resumption and currently believe that its impact on our loan performance should be muted because of: (i) the 12-month “on ramp” period announced by the U.S. Department of Education over which federal student loan borrowers can resume their student loan payments without being considered delinquent, reported to credit bureaus, placed in default or referred to debt collection agencies, (ii) hardship programs from the government and LendingClub, (iii) initiatives to proactively inform our borrowers impacted by the Student Loan Payment Resumption of their payment obligations and available hardship programs, and (iv) our expectation that certain borrowers may prioritize other debt payments, including personal loans, over the repayment of student loans. Further, in anticipation of the potential impact of the Student Loan Payment Resumption, we began undertaking certain changes to our underwriting standards in 2022 that were intended to proactively incorporate the potential impact of the Federal Student Loan Resumption on the credit profile of loan applicants. However, the Student Loan Payment Resumption is unprecedented and therefore its impact is inherently uncertain and there can be no assurance that the factors listed above will materialize or mute the impact of the Student Loan Payment Resumption on our loan performance. We estimate that approximately 20% of the current outstanding unpaid principal balance on LendingClub loans is held by borrowers that have federal student loan payments that resumed pursuant to the Student Loan Payment Resumption. It is possible that the Federal Student Loan Resumption may reduce the ability of these borrowers to make other payments and thereby potentially increase their risk of default on their LendingClub loan(s). It is also possible that the Federal government may implement or leverage another program to mitigate the impact of the Student Loan Payment Resumption.
Finally, an economic downturn or recession could increase the risk of borrower default, reduce investor participation on our marketplace bank platform, cause us to change, postpone or cancel our strategic initiatives, or otherwise negatively affect our business, financial condition and results of operations will depend on future developments which are highly uncertain and cannot be accurately predicted, including the duration of the pandemic, actions taken to treat or control the spread of COVID-19, future strains or mutations of COVID-19, any re-emergence of COVID-19 or related diseases, and the intermediate and longer-term impact on consumers, businesses and the broader economy. For example, COVID-19 raises the possibility of a prolonged global economic downturn, which could further affect the performance of and demand for our products and services and adversely impact our business and results of operations even after the pandemic is contained.operations.
The COVID-19 pandemic,current economic environment, and its impact, may also have the effect of heightening many of the other risks described in “Item 1A. Risk Factors” and elsewhere in our Annual Report, such as managing our liquidity, growing platform volume and our exposure to litigation,the credit and governmentdefault risk of borrowers, maintaining and regulatory investigations, inquiriesincreasing loan originations, maintaining our deposit base and requests.retaining our marketplace investors.
Any one or a combination of the factors identified above could have a material adverse impact on our business, financial condition and results of operations.
Fluctuations in interest rates could negatively affect transaction volume and our net interest income.
We offer loan products with both fixed and variable interest rates, depending on the type of loan. If interest rates rise, potential borrowers could seek to defer taking new loans as they wait for interest rates to decrease and/or settle, and borrowers of variable rate loans may be subject to increased interest rates, which could increase default risk. If interest rates decrease after a loan is made, existing borrowers may prepay their loans to take advantage of the lower rates. Furthermore, investors would lose the opportunity to collect the higher interest rate payable on the corresponding loan and may delay or reduce future loan investments.
Our net interest income is the interest we earn on loans and investments less the interest we pay on our deposits and borrowings. Our net interest margin is the difference between the yield we earn on our assets and the interest rate we pay for deposits and our other sources of funding. Changes in interest rates will cause our net interest income and margin to increase or decrease. To the extent that we hold loans for sale on our balance sheet, we will be at risk to rising interest rates between origination and sale. In order to sell such loans, we may need to reduce the sale price in order to satisfy the yield expectations of our marketplace investors. Further, we are exposed to interest rate risk because our interest-earning assets and interest-bearing sources of funding do not react uniformly or concurrently to changes in interest rates, as the two have different time periods for adjustment and can be tied to different measures of rates. Fluctuations in the interest rate environment may impact our net interest income, net interest margin and/or discourage investors and borrowers from participating inon our marketplace bank platform and may reduce our loan originations, any of which may adversely affect our business.
Notwithstanding the above, we monitor interest rates and have certain avenues to manage our interest rate risk exposure, including changing the interest rate offered on deposits and the interest rate on our loan products. If our interest rate risk management strategies are not appropriately monitored or executed, these activities may not effectively mitigate our interest rate sensitivity or have the desired impact on our results of operations or financial condition.
Our businessAdditionally, we use, and operating results could be adversely affected by the political environment and governmental fiscal and monetary policies.
An unpredictable or volatile political environmentmay in the United States, includingfuture use, financial instruments for hedging and risk management purposes in order to protect against possible fluctuations in interest rates, or for other reasons that we may deem appropriate. However, any related social unrest,current and future hedges we enter into will not completely eliminate the risk associated with fluctuating interest rates and our hedging activities may prove to be ineffective. Any failure to manage our hedging positions properly or inability to enter into hedging instruments under acceptable terms, or any other unintended or unanticipated economic consequences of our hedging activities, could negatively impact business and market conditions, economic growth, financial stability, and business, consumer, investor, and regulatory sentiments, any one or more of which in turn could cause our business and financial results to suffer.
Our business and financial results are also significantly affected by the fiscal and monetary policies of the U.S. government and its agencies. We are particularly affected by the policies of the Federal Reserve Bank, which regulates the supply of money and credit in the United States in pursuit of maximum employment, stable prices, and moderate long-term interest rates. The Federal Reserve Bank and its policies influence the availability and demand for loans and deposits, the rates and other terms for loans and deposits, the conditions in equity, fixed-income, currency, and other markets, and the value of securities and other financial instruments. Additionally, tax and other fiscal policies, moreover, impact not only general economic and market conditions but also give rise to incentives or disincentives that affect how we and our customers prioritize objectives, deploy resources, and run households or operate businesses. Both the timing and the nature of any changes in monetary or fiscal policies, as well as their consequences for the economy and the markets in which we operate, are beyond our control and difficult to predict but could adversely affect our businessfinancial condition and operating results.results of operations.
A decline in social and economic conditions may adversely affect our customers, which may negatively impact our business and results of operations.
As a marketplace bank, we believe our customers are highly susceptible to uncertainties and negative trends in the markets driven by, among other factors, general social and economic conditions in the United States, abroad and abroad.the regional areas where our customers reside. Economic factors include interest rates, unemployment levels, the impact of a federal government shutdown, natural disasters, public health emergencies, pandemics, gasoline prices, adjustments in monthly payments, adjustable-rate mortgages and other debt payments, the rate of inflation, relative returns available from competing investment products and consumer perceptions of economic conditions. Social factors include changes in consumer confidence levels and changes in attitudes with respect to incurring debt and the stigma of personal bankruptcy.
These social and economic factors may affect the ability or willingness of borrowers to make payments on their loans. Because we pass through collected borrower payments to investors or we make payments to investors ratably only to the extent we receive the borrower’s payments on the corresponding loan, if we do not receive payment(s) on the corresponding loan, the investor will not be entitled to the corresponding amount(s) or payment(s) under the terms of the investment or whole loan purchase agreement. For example, increasing inflation and interest rates may
cause borrowers to allocate more of their income to necessities, such as housing and food, thereby potentially increasing their risk of default by reducing their ability to make loan payments.
In some circumstances, economic and/or social factors could lead to a borrower deciding to pre-pay his or hertheir loan obligation.obligations. In the event of a prepayment, while the investor would receive the return of principal, interest would no longer accrue on the loan. Accordingly, the return for the investor would decline as compared to a loan that was timely paid in accordance with theits amortization schedule. There is no penalty to borrowers if they choose to pay their loan early.
Similarly, any adverse impact on the ability of borrowers to make loan payments and/or material increase in pre-payment rates may also have a material impact on the net interest income we earn for loans held on our balance sheet.
We strive to establishmaintain a marketplace bank platform in which annual percentage rates are attractive to borrowers and returns, including the impact of credit losses and prepayments, are attractive to investors.marketplace investors and the Company. These external economic and social conditions and resulting trends or uncertainties could also adversely impact our customers’the ability or desire of our borrowers or marketplace investors to participate on our platform, as borrowers or investors, which could negatively affect our business and results of operations. In addition to the discussion in this section, see “Part II – Item 7. Management’s Discussion and Analysis of Financial Condition and Results of Operations – Overview.”
Our business operations mayand operating results could be adversely impactedaffected by the political events, terrorism, cyber-attacks, public health issues, natural disasters, severe weather, climate change, infrastructure failureenvironment and governmental fiscal and monetary policies.
An unpredictable or outages, labor disputesvolatile political environment in the United States, including any related social unrest, could negatively impact business and othermarket conditions, economic growth, financial stability, and business, interruptions.consumer, investor, and regulatory sentiments, any one or more of which in turn could cause our business and financial results to suffer.
Our business operationsand financial results are subject to interruptionalso significantly affected by among other things, political events, terrorism, cyber-attacks, public health issues, natural disasters, severe weather, climate change, infrastructure failure or outages, labor disputesthe fiscal and monetary policies of the U.S. government and its agencies. We are particularly affected by the policies of the FRB, which regulates the supply of money and credit in the United States in pursuit of maximum employment, stable prices, and moderate long-term interest rates. The FRB and its policies influence the availability and demand for loans and deposits, the rates and other events which could decrease demandterms for our productsloans and services or make it difficult or impossible for us to deliver a satisfactory experience to our customers. Such events could affectdeposits, the stability of our deposit base, impair the ability of our borrowers to repay their outstanding loans, cause significant property damage or otherwise impairconditions in equity, fixed-income, currency, and other markets, and the value of collateral securing our loans,securities and resultother financial instruments. For example, in lossresponse to elevated inflation, the FRB increased interest rates eight times since early 2022, from a federal funds rate range of revenue and/or cause us0.00% to incur additional expenses. Although we have established disaster recovery plans0.25% in early 2022 to 5.25% to 5.50% as of December 2023, and procedures, and we monitor the effects of any such events on our loans, properties and investments, the occurrence of any such event could havehas indicated a material adverse impact on our business, financial condition and results of operations.
LENDINGCLUB CORPORATION
willingness to conduct rate increases as it deems necessary to combat inflation.
Furthermore, inAdditionally, tax and other fiscal policies impact not only general economic and market conditions but also give rise to incentives or disincentives that affect how we and our customers prioritize objectives, deploy resources, and run households or operate businesses. Both the eventtiming and the nature of any disruptionchanges in monetary or fiscal policies, as well as their consequences for the economy and the markets in which we operate, are beyond our control and difficult to our operations or those of the companies with whom we do business with, wepredict but could incur significant losses, require substantial recovery time and experience significant expenditures in order to resume or maintain operations, any of which could have a material adverse impact onadversely affect our business financial condition and results of operations.operating results.
Negative publicity and unfavorable media coverage could negatively affect our business.
Negative publicity about our industry or our company, including with respect to the quality and reliability of our marketplace bank, effectiveness of the credit decisioning or scoring models used in theour marketplace bank platform, the effectiveness of our collection efforts, statements regarding investment returns, changes to our marketplace bank, our ability to grow our borrower and investor base at a rate expected by the market, our ability to effectively manage and resolve borrower and investor complaints, our ability to manage borrower and investor accounts in compliance with regulatory requirements which may not be clear, privacy and security practices, use of loan proceeds by certain borrowers of ours or other companies in our industry for illegal purposes, litigation, regulatory activity, and the experience of borrowers and investors with our marketplace bank, products or services, even if
inaccurate, could adversely affect our reputation and the confidence in, and the use of, our marketplace bank, products and services, which could harm our business and operating results. Harm to our reputation can arise from many sources, including employee misconduct, misconduct by our partners or partners of partners, other online marketplace banks, outsourced service providers or other counterparties, failure by us or our partners to meet minimum standards of service and quality, inadequate protection of borrower and investor information and compliance failures and claims.
Our business operations may be adversely impacted by political events, terrorism, military conflict or acts of war, cyber-attacks, public health issues, natural disasters, severe weather, climate change, infrastructure failure or outages, labor disputes and other business interruptions.
Our business operations are subject to interruption by, among other things, political events, terrorism, military conflict or acts of war (including the conflicts in Ukraine and the Gaza Strip), cyber-attacks, public health issues (such as the COVID-19 pandemic), natural disasters, severe weather, climate change (including longer-term shifts in climate patterns, such as extreme heat, sea level rise and more frequent and prolonged drought), infrastructure failure or outages (including power outages), labor disputes and other events which could: (i) decrease demand for our products and services, (ii) adversely affect the macroeconomy and/or our customers, or (iii) make it difficult or impossible for us to deliver a satisfactory experience to our customers. Any such events could also affect the Company by impacting the stability of our deposit base, impairing the ability of our borrowers to repay their outstanding loans, causing significant property damage or otherwise impair the value of collateral securing our loans, and/or resulting in loss of revenue and/or cause us to incur additional expenses. While we may undertake measures indicated to mitigate the adverse impacts of such events, there are no assurances that any of the measures we take will be sufficient or successful.
Furthermore, in the event of any disruption to our operations or those of the companies with whom we do business with, we could experience delays in product development, marketing, operations and customer service efforts, incur significant losses, require substantial recovery time and experience significant expenditures in order to resume or maintain operations, any of which could have a material adverse impact on our business, financial condition and results of operations.
For example, the Ukrainian-Russian conflict, the responses thereto (such as sanctions imposed by the United States and other countries) and any expansion thereof have had, and may continue to have, unpredictable and/or adverse effects on the domestic and global economy and financial markets. Although we have not yet experienced any material direct impact from the Ukrainian-Russian conflict, in part because our business is conducted exclusively in the United States, our business, financial condition or results of operations may be impacted if the conflict prolongs and/or its impact exacerbates. Further, the geopolitical conflicts such as the Ukrainian-Russian conflict and the conflict in the Gaza Strip, and their impacts, have had, and may continue to have, the effect of heightening many of the other risks described in “Item 1A. Risk Factors” and elsewhere in our Annual Report, such as escalating inflation, elevating the possibility of a decline in economic conditions and increasing cybersecurity risk.
RISKS RELATED TO CREDIT AND COLLECTIONS
If the credit decisioning, pricing, loss forecasting and scoring models we use contain errors, do not adequately assess risk, or are otherwise ineffective, our reputation and relationships with customers could be harmed, our market share could decline and the value of loans held on our balance sheet may be adversely affected.
Our ability to attract customers to, and build trust in, our marketplace bank platform is significantly dependent on our ability to effectively evaluate a borrower’s credit profile and likelihood of default. To conduct this evaluation, we utilize credit decisioning, pricing, loss forecasting and scoring models that assign each loan offered onthrough our marketplace bank platform a grade and a corresponding interest rate. Our models are based on algorithms that evaluate a number of factors, including behavioral data, transactional data, bank data and employment information, which may not effectively predict future loan losses. If we are unable to effectively segment borrowers into relative risk profiles, we may be unable to offer attractive interest rates for borrowers and risk-adjusted returns for marketplace investors.
Additionally, if these models fail to adequately assess the creditworthiness of our borrowers, we may experience higher than forecasted losses. Furthermore, as stated above, we hold loans on our balance sheet. We periodically assess the value of these loans and in doing so we review and incorporate a number of factors including forecasted losses. Accordingly, if we fail to adequately assess the creditworthiness of our borrowers such that we experience higher than forecasted losses, the value of the loans held on our balance sheet may be adversely affected.
We continually refine these algorithms based on new data and changing macro-economicmacroeconomic conditions. However, there is no guarantee that the credit decisioning, pricing, loss forecasting and scoring models that we use have accurately assessed the creditworthiness of our borrowers, or will be effective in assessing creditworthiness in the future.
Similarly, if any of these models contain programming or other errors, are ineffective or the data provided by borrowers or third parties is incorrect or stale, our loan pricing and approval process could be negatively affected, resulting in mispriced or misclassified loans or incorrect approvals or denials of loans. If these errors were to occur, we may be obligated to repurchase the affected loans, marketplace investors may try to rescind their affected purchases or investments or decide not to purchase or invest in loans in the future or borrowers may seek to revise the terms of their loans or reduce the use of our marketplace bank platform for loans.
Additionally, we have entered, and may continue to enter, into credit support agreements where we may be obligated to make payments to certain marketplace investors if the losses on their loan portfolios exceed certain agreed-upon thresholds. If we are unable to accurately predict and manage losses, credit losses may exceed these agreed-upon thresholds and we may be obligated to make payments to these marketplace investors, which could negatively impact our results of operations.
30Further, the use of these models, algorithms and artificial intelligence for determining loan grades and corresponding interest rates may also heighten the risk of legal or regulatory scrutiny. We may be required to alter our models for compliance purposes, which could impact the interest rates offered to borrowers, the risk-adjusted returns offered to investors, result in higher losses or otherwise impact our results of operations.
If collection efforts on delinquent loans are ineffective or unsuccessful, the return on investment for investors in those loans would be adversely affected and investors may not find investing through our marketplace bank platform desirable.
Many of our loan products, including all of our personal loans, are unsecured obligations of borrowers, and they are not secured by any collateral. None of the loans facilitated on our platform are guaranteed or insured by any third party noror backed by any governmental authority in any way. We are the loan servicer for all loans supporting notes alland certificates and certain secured borrowings, and we are the loan servicer for most, though not all, loans sold as whole loans. The ability to collect on the loans is dependent on the borrower’s continuing financial stability and willingness to make loan payments, and consequently, collections can be adversely affected by a number of factors, including job loss, divorce, death, illness, personal bankruptcy or the economic and/or social factors referenced above. above in the risk factor “A decline in social and economic conditions may adversely affect our customers, which may negatively impact our business and results of operations.”Furthermore, the application of various federal and state laws, including federal and state bankruptcy and insolvency laws, may limit the amount that can be recovered on these loans. Accordingly, we and our designated third-party servicers and collection agencies are limited in our ability to collect loans.
In addition, most marketplace investors must depend on LendingClubus or our third-party servicers and collection agents to pursue collection on delinquent borrower loans. Because we make payments ratably on an investor’s investmentCollections are remitted to marketplace investors only ifto the extent we receive the borrower’sborrower payments on the corresponding loan, ifloans. If we, or third parties on our behalf, cannot adequately perform collection services on the loans, the marketplace investor will not be entitled to any paymentsremittances under the terms of the investment. Further, if collection action must be taken in respect of a loan, we or the collection agency may charge a collection fee on any amounts that are obtained (excluding litigation). These fees will correspondingly reduce the amounts of any payments received by an investor. Similarly, the returns to investors may be impacted by declines in market rates for sales of charged-off loans to third partythird-party purchasers. Ultimately, if delinquencies impair
our ability to offer attractivecompetitive risk-adjusted returns for marketplace investors, they may seek alternative investments from ours and our business may suffer.
In addition, because our servicing fees depend on the collectability of the loans, if we experience a significant increase in the number of delinquent or charged-off loans we will be unable to collect our entire servicing fee for such loans and our revenue could be adversely affected.
Further, we use internet-based processes to obtain application information and distribute certain legally required notices to applicants and borrowers of our loans and to obtain electronically signed loan documents. These processes may result in greater risks than paper-based loan originations, including risks regarding the sufficiency of notice for consumer protection laws, risks that borrowers may challenge the authenticity of loan documents or the validity of the borrower’s electronic signature on loan documents and risks that unauthorized changes are made to electronic loan documents. Any of these factors could cause our loans or certain terms of our loans to be unenforceable against a borrower or impair our ability to service the loans, which could adversely affect the value of our loans and our business, financial condition and results of operations.
Credit and other information that we receive from borrowers or third parties about a borrower may be inaccurate or may not accurately reflect the borrower’s creditworthiness, which may cause us to inaccurately price loans made bythrough our marketplace bank.bank platform.
Our ability to review and select qualified borrowers depends on obtaining borrower credit information from consumer reporting agencies, such as TransUnion, Experian or Equifax, and other third parties and weparties. We assign loan grades to loan requests based on our marketplace bank’s credit decisioning and scoring models that take into account reported credit score, other information reported by the consumer reporting agencies and the requested loan amount, in addition to a variety of other factors. A credit score or loan grade assigned to a borrower may not reflect that borrower’s actual creditworthiness because the credit score or loan grade may be based on outdated, incomplete or inaccurate data, including consumer reporting data, and we do not verify the information obtained from thea borrower’s credit report.
Additionally, there is a risk that, following the date of the credit report or other third-party data that we obtain and review, a borrower may have:
•become delinquent in the payment of an outstanding obligation;
•defaulted on a pre-existing debt obligation;
•taken on additional debt; or
•sustained other adverse financial events.
In addition, borrowers supply a variety of information, including information that is included in the loan listings on our marketplace bank platform, and itthis information may be inaccurate or incomplete. To verify a borrower’s identity, income or employment, our verification process and teams connect to various data sources, directly or through third-party service providers, contact the
human resources department of the borrower’s stated employer, or request pay stubs. However, we often do not verify a borrower’s stated income, tenure, job title, home ownership status or intention for the use of loan proceeds.
The factors above may result in loans being issued to otherwise non-qualified borrowers and/or impact our ability to effectively segment borrowers into relative risk profiles, each of which may impair our ability to offer attractivecompetitive risk-adjusted returns for investors, which may cause investors to seek alternative investments from ours and our business may suffer. Additionally, if borrowers default on loans that are not priced correctly because the information provided by the borrowers or third parties is inaccurate, investors may try to rescind their affected investments in these loans or the loans may not perform as expected and our reputation may be harmed.
RISKS RELATED TO OUR INDUSTRY
Substantial and increasing competition in our industry may harm our business.
The financial services and banking industry is increasingly competitive. We compete with financial products and companies that attract borrowers, investors or both, as described in “Item 1. Business – Competition.”
Many of our competitors have significantly greater financial resources and may have access to less expensive capital than we do, and may offer a broader range of products, services or features, assume a greater level of risk, have lower operating or financing costs, or have different profitability expectations than us. Certain competitors may be able to offer lower rates to borrowers than we are able to offer and/or structure their products in a manner that is more attractive to potential customers. Additionally, some of our competitors may also be subject to less burdensome licensing and other regulatory requirements.
If we do not offer, price and develop attractive products and services for our customers, we may not be able to compete effectively against our competitors and our business and results of operations may be materially harmed. Additionally, competition may drive us to take actions that we might otherwise avoid, such as lowering interest rates or fees on loans or raising interest rates on deposits, and that may adversely affect our business and results of operations.
We could be adversely affected by the soundness of other financial institutions.
Financial services institutions are interrelated as a result of trading, clearing, counterparty or other relationships. We have exposure to many different industries and counterparties, and routinely execute transactions with counterparties in the financial services industry, including commercial banks, brokers and dealers, investment banks and other institutional clients. Many of these transactions expose us to credit risk in the event of a default by a counterparty or client. In addition, our credit risk may be exacerbated when our collateral cannot be foreclosed upon or is liquidated at prices not sufficient to recover the full amount of the credit or derivative exposure due. Any such losses could adversely affect our business, financial condition and results of operations.
In addition, events or perceptions with respect liquidity, defaults and other markers of stability, performance and/or strength within the financial services industry have, and may in the future, lead to market-wide liquidity concerns, erosion of confidence in the banking system, the closure of financial services institutions and other adverse consequences. For example, in 2023, Silicon Valley Bank, Signature Bank, and First Republic Bank each failed shortly after substantial reductions in their deposit bases over the course of a few days/weeks. Any such events of perceptions may make our members reluctant to use our products and services or could adversely affect our business, financial condition and results of operations.
RISKS RELATED TO PERSONNEL AND THIRD-PARTIESTHIRD PARTIES
If we fail to attract and retain our highly skilled employees needed to support our business, we may not be able to achieve our anticipated level of growth and our business could suffer.
We believe our success depends on the efforts and talents of our employees, including software engineers, financial, banking, credit and risk personnel, and marketing professionals. Our future success depends on our continued ability to attract, develop, motivate and retain highly qualified and skilled employees. Competition for highly skilled technical and financial personnel, particularly in the San Francisco Bay Area, is extremely intense. Building and maintaining a positive culture and work environment that reinforces the Company’sour values is also critical to attracting and retaining employees.
We have hadpreviously experienced a high attrition rate from employees and expect ourwhile attrition rate to remainrates have materially reduced recently, they may again become elevated. We may not be ableperiodically make adjustments to hire and retain these personnel atour compensation levels consistent withand structures as our existing compensationbusiness and salary structure. Manythe competitive market for talent evolves. Further, many of the companies with
which we compete for experienced employees have greater resources than we have and may be able to offer more attractive terms of employment. While we strive to create a fulfilling workplace with competitive compensation, certain existing and prospective employees may find our workplace and/or compensation levels and structures to be unattractive, which may adversely impact our business by compromising our ability to retain and recruit an appropriately skilled workforce. Additionally, changes in U.S. immigration
policy may make it difficult to renew or obtain visas for certain highly skilled employees that we have hired or are recruiting.
In addition to attracting and retaining highly skilled employees in general, our future performance depends, in part, on our ability to attract and retain key personnel, including our executive officers, the personnel we onboarded as a result of our acquisition of Radius, senior management team and other key personnel, all of whom would be difficult to replace. In 2023, our total headcount decreased by 560 employees compared to the prior year, primarily due to the workforce reduction plans we implemented during the year. These reductions in workforce resulted in the termination of a number of highly contributing employees as well as material reductions in the size and capabilities of a number of our functions, such as recruiting. Further, the reductions in workforce may negatively impact employee morale and our culture, which may increase attrition rates and negatively impact future recruiting efforts.
The loss of the services of our executive officers, or members of our senior management team or key employees and functions, and the process to replace and/or rebuild any of them, would involve significant time and expense and distraction that may significantly delay or prevent the achievement of our business objectives or impair our operations or results.
Misconduct and errors by our employees, contractors and third-party service providers could harm our business and reputation.
We are exposed to many types of operational risk, including the risk of misconduct and errors by our employees and other third-party service providers. Our business depends on our employees, contractors and third-party service providers to facilitate the operation of our business and process a large number of increasingly complex transactions, and if any of our employees, contractors or third-party service providers provide unsatisfactory service or take, convert or misuse funds, documents or data (including customer and/or internal documents or data), make an error, or fail to follow protocol when interacting with customers, we could lose customers, harm our reputation, be liable for damages, be subject to repurchase obligations and be subject to complaints, regulatory actions and penalties.
While we have internal procedures and oversight functions to protect the Companyus against these risks, we could also be perceived to have facilitated or participated in the illegal misappropriation of funds, documents or data, or the failure to follow protocol, and therefore be subject to civil or criminal liability.
Additionally, our use of third partythird-party vendors is subject to increasingly demanding regulatory requirements and attention by our regulators. Regulations require us to perform due diligence of, perform ongoing monitoring of and controlexercise certain controls over our third partythird-party vendors and other ongoing third partythird-party business relationships. We expect that our regulators will hold us responsible for deficiencies in our oversight and control of our third-party relationships and in the performance of the parties with which we have these relationships.
Any of these occurrences could result in our diminished ability to operate our business, potential liability to customers, inability to attract future customers, reputational damage, regulatory intervention, enforcement action and financial harm, which could negatively impact our business, financial condition and results of operations.
Our growth depends in part on the success of our strategic relationships with third parties.
In order to grow our business and effectuate our product to platformbusiness strategy, we anticipate that we will depend in part on our ability to develop and expand our strategic relationship with third parties to offer additional products and services on our platform.
Identifying suitable partners, and negotiating and documenting relationships with them, requires significant time and resources. In some cases, we also compete directly with our partners’ product offerings, and if these partners cease their strategic relationship with us it could result in fewer product and service offerings on our platform, which may impede our ability to execute on our product to platformbusiness strategy. Further, if we are unsuccessful in establishing or maintaining our relationships with third parties, or realizing the anticipated benefits from such partnerships, our ability to compete and to grow our revenue could be impaired and our operating results may suffer.
A disruption or failure in services provided by third parties could materially and adversely affect our business.
We increasingly rely on third parties to provide and/or assist with certain critical aspects of our business, including: (i) customer support, (ii) collections, (iii) loan origination, (iv) data verification and (v) cloud computing. These third parties may be subject to cybersecurity incidents, privacy breaches, service disruptions and/or financial, legal,
regulatory, labor or operational issues; any of which may result in the third party providing inadequate service levels to us or our customers. In addition, these third parties may breach their agreements with us and/or refuse to continue or renew these agreements on commercially reasonable terms. If any third party provides inadequate service levels or fails to provide services at all, we may face business disruptions, customer dissatisfaction, reputational damage and/or financial and legal exposure; any of which may harm our business.
Our controls and procedures may be inadequate, fail or be circumvented and our business, operating results and
financial condition may be adversely affected.
We are required to maintain effective controls and procedures, including internal controls over our operations, financial reporting, disclosure controls and procedures, compliance monitoring and corporate governance policies and procedures. Designing and implementing effective controls and procedures is a continuous effort that requires us to anticipate and react to changes in our business, industry and the economic and regulatory environment and to expend significant resources to maintain a system of controls that is adequate to satisfy our public company and bank regulatory obligations.
If we are unable to establish and maintain appropriate controls and procedures, or if our employees, contractors or third-party service providers fail to abide by or circumvent such controls and procedures, it could cause us to fail to meet our regulatory or financial reporting obligations, cause us to fail to timely detect errors, result in misstatements or omissions in our consolidated financial statements, harm our operating results and financial condition or otherwise adversely affect our business operations. We could also become subject to investigations by the NYSE, the SEC or our banking regulators, which could require additional financial and management resources.
RISKS RELATED TO DATA, INTELLECTUAL PROPERTY AND PRIVACY
Security incidents, system failures, bugs in our system, and similar disruptions could impair our operations, compromise the confidential information of our borrowers and our investors, damage our reputation, and harm our business and financial performance.
We believe the technology platform that powers our marketplace bank enables us to deliver solutions to customers and provides a significant time and cost advantage over traditional banks. The satisfactory performance, reliability and availability of our technology and our underlying network infrastructure are critical to our operations, customer service and reputation. Like all information systems and technology, our systems may contain or develop material errors, failures, vulnerabilities or bugs, particularly when new features or capabilities are released, and may be subject to computer viruses or other malicious code, break-ins, phishing impersonation attacks, attempts to overload our servers with denial-of-service or other attacks, ransomware and similar incidents or disruptions from unauthorized use of our computer systems, as well as unintentional incidents causing data leakage, any of which could lead to interruptions, delays or make it difficult or impossible for us to deliver a satisfactory experience to our customers. Our failure to maintain satisfactory performance, reliability and availability of our technology and our underlying network infrastructure may impair our ability to attract new customers and retain existing customers, which could have a material adverse effect on our business.
Our business involves the collection, storage, processing and transmission of customers’ personal information, including their financial information of customers.information. The highly automated nature of our marketplace bank, our reliance on digital technologies and the types and amount of data collected, stored and processed on our systems make us an attractive target and subject to cyber-attacks, computer viruses, ransomware, physical or electronic break-ins and similar disruptions. While we have taken steps to protect confidential information that we collect, create, or have access to, our security measures or those of our third-party vendors and business partners are subject to breach. Unauthorized access to our proprietary business information or customer data may be obtained through, among other things, break-ins, sabotage, computer malware, viruses, social engineering, ransomware attacks, hacking into the systems or facilities of us or our partners, vendors, or customers, exposing and exploiting design flaws in our software, or other misconduct, including by state-sponsored and other sophisticated organizations. Such incidents have become more prevalent in recent years.years and may target our systems or facilities or those of our partners, vendors, or customers. For example, outside parties have attempted to fraudulently induce employees, vendors, customers, orand others to disclose sensitive or confidential information in order to gain access to our systems. Our security measures could also be compromised by our personnel, theft or errors, or be insufficient to prevent exploitation of security vulnerabilities in software or systems on which we rely.
Cyber-attacks have occurred on our systems in the past and may occur on our systems in the future. Although to date the Company hasin 2023, we did not sufferedsuffer material costs or disruption to our business caused byfrom any such incident, unauthorized access to our marketplace bank and servicing systems can result in confidential borrower and investor information being stolen and potentially used for criminal purposes. Breaches of our security measures could negatively impact our relationships with customers, lead to interruptions or delays or make it difficult or impossible for us to deliver a satisfactory experience to our customers, and expose us to liability related to the loss of the information, time-consuming expensive litigation and negative publicity. Moreover, any future security breach may also result in the theft of our intellectual property, proprietary data, or trade secrets, which could have a material adverse impact on our reputation, business operations and financial performance.
We also may be required to notify regulators, and affected individuals and/or stockholders about any actual or perceived data breach involving personal information or material cybersecurity incident within strict time periods. TheThis notice may be difficult to provide in a timely fashion for many reasons, including due to the complexity of gathering, verifying and analyzing relevant information. Furthermore, these mandatory disclosures regarding a security breach aremay be costly to implement and often lead to
widespread negative publicity, which may cause customers to lose confidence in the effectiveness of our data security measures. Any security breach, whether actual or perceived, would harm our reputation, we could lose borrowers, investors and ecosystem partners and our business and operations could be adversely affected.
Because there are many different cybercrime and hacking techniques and such techniques continue to evolve, we may be unable to anticipate attempted security breaches, react in a timely manner or implement adequate preventative measures. Cyber-attacks may take advantage of weaknesses in third-party technology or standards of which we are unaware or that we do not control and may not be recognized until long after they have been launched against a target.launched. Certain efforts may be state-sponsored or from other sophisticated organizations, and supported by significant financial and technological resources, making them even more difficult to detect. Efforts to prevent hackers from disrupting our services or otherwise accessing our systems are expensive to develop, implement, and maintain. Such efforts require ongoing monitoring and updating as technologies change and efforts to overcome security measures become more sophisticated and may limit the functionality of, or otherwise adversely impact, our service offerings and systems.
The systems we rely upon also remain vulnerable to damage or interruption from a number of other factors, including the failure of our network or software systems, natural disasters, terrorism, telecommunication failures, computer viruses, human error, third-party error, other-man made problems, and similar events or disruptions. Any interruptions or delays in our technology systems or service, whether accidental or willful, could harm our relationships with our customers and our reputation. Additionally, in the event of damage or interruption, our insurance policies may not adequately compensate us for any losses that we may incur. Our disaster recovery plan has not been tested under
actual disaster conditions, and we may not have sufficient capacity to recover all data and services in the event of an outage. These factors could prevent us from processing or posting payments on the loans, impact our bank operations, damage our brand and reputation, divert our employees’ attention, reduce our revenue, subject us to liability and cause customers to abandon our marketplace bank platform, any of which could adversely affect our business, financial condition and results of operations.
Cyber-attacks suffered by third parties upon which we rely could negatively affect our business.
We rely on third-party service providers to provide critical services that help us deliver our solutions and operate our business. These providers may store or otherwise process the same sensitive, proprietary, and confidential information that we handle. For example, in certain circumstances we utilize third-party vendors, including cloud applications and services, to facilitate the servicing of customer accounts. Under these arrangements, third-party vendors require access to certain customer data for the purpose of servicing the accounts. These service providers may not have adequate security measures and could experience a security incident that compromises the confidentiality, integrity, or availability of the systems they operate for us or the information they process on our behalf. Such occurrences could adversely affect our business to the same degree as if we had experienced these occurrences directly, and we may not have recourse to the responsible third-party service providers for the resulting liability we incur.
We also utilize certain information provided by third parties to facilitate the marketing, distribution, servicing and collection of loans. A cyber-attack suffered by a third-partythird party that provides data to us could impact our ability to market, distribute, service or collect for borrowers or investors. For example, Equifax announced a significant cyber breach that impacted millions of consumers. We utilize certain information from Equifax to allow us to market our products through pre-screened offers to qualified borrowers. If a consumer elects to “freeze” their credit data, we would not be able to access their information to make these pre-screened offers. Further, as a result of the release of personal information from a third-party platform, we could experience an increase in fraudulent loan applications or investor accounts. Under our policies, we reimburse investors for any loan obtained as a result of a verified identity fraud and any increase in identity theft could result in increased reimbursement costs.
The collection, processing, storage, use, and disclosure of personal information could give rise to liabilities as a result of governmental regulation, conflicting legal requirements or differing views of personal privacy rights.
We receive, transmit, store and process a large volume of personal information and other user data. There are federal, state and foreign laws regarding privacy and the storing, sharing, use, disclosure, protection and other processing of personal information and other user data. Specifically, personal information is increasingly subject to legislation and regulations in numerous U.S. and international jurisdictions, the intent of which is to protect the privacy of personal information that is collected, processed and transmitted in or from the governing jurisdiction.
Governments, regulators, the plaintiffs’ bar, privacy advocates and customers have increased their focus on how companies collect, process, use, , store, share and transmit personal information. This regulatory framework for privacy issues worldwide is evolving and is likely to continue to evolve for the foreseeable future, which creates uncertainty. For example, in June 2018, California, enacted the California Consumer Privacy Act (CCPA), which became effective on January 1, 2020.2020 and was modified by the California Privacy Rights Act (CPRA) on January 1, 2023. The CCPA and CPRA, among other things, gives California residents expanded rights to access and delete their personal information, opt out of certain personal information sharing, and receive detailed information about how certain personal information is used and shared. The CCPA provides for civil penalties for violations, as well as a private right of action for certain data breaches, which is expected to increase the volume, cost and success of class action data breach litigation. The CCPA excludes information covered byCPRA also established the GLBA, the Driver’sCalifornia Privacy Protection Act,Agency to implement and enforce the FCRA, or the California Financial Information Privacy Act from the CCPA’s scope, but the CCPA’s definition of “personal information” is broadCCPA and may encompass other information that we maintain. The California Attorney General issued, and subsequently updated, proposed regulationsCPRA, as well as to further define and clarify the CCPA.impose administrative fines. The full impact of this law and its corresponding regulations, future enforcement activity and potential liability is unknown. Some observers have noted that the CCPA could mark the beginning of a trend toward more stringent privacy legislation in the U.S., and multiple states have enacted or proposed similar laws. There is also discussion in Congress of new comprehensive federal data protection and privacy law tolaws which we likely would be subject to if it is enacted.
In addition, California voters approved the November 2020 ballot measure which will enact the California Privacy Rights Act (CPRA), which modifies the CCPA and has many provisions that will go into effect on January 1, 2023. Effective as of this year, the CPRA establishes the California Privacy Protection Agency to implement and enforce the CCPA and CPRA, as well as to impose administrative fines.LENDINGCLUB CORPORATION
We cannot yet predict the full impact of the CCPA, CPRA or any other proposed or enacted state, U.S. andor international data privacy legislation on our business or operations, but such laws may require us to modify our data processing practices and policies and to incur substantial costs and expenses in an effort to comply. We could also be adversely affected if other legislation or regulations are expanded to require changes in business practices or privacy policies, or if governing jurisdictions interpret or implement their legislation or regulations in ways that negatively affect our business, financial condition and results of operations. Any actual or perceived failure to comply with data privacy laws or regulations, or related contractual or other obligations, or any perceived privacy rights violation, could lead to investigations, claims, and proceedings by governmental entities and private parties, damages for contract breach, and other significant costs, penalties, and other liabilities, as well as harm to our reputation and market position.
We post on our website our privacy policies and practices concerning the collection, use, disclosure and processing of personal information. We also obtain consent from our borrowers to share personal information under certain conditions. We are subject to the terms of our privacy policies, privacy-related disclosures, and contractual and other privacy-related obligations to our customers and other third parties. Our failure, real or perceived, to comply with applicable privacy policies or federal, state or foreign laws and regulations or any compromise of security that results in the unauthorized release of personal information or other user data could damage our reputation, discourage potential borrowers or investors from using our marketplace bank or result in fines or proceedings brought against us, our issuing banks or other third parties by governmental agencies, borrowers, investors or other third parties, one or all of which could materially adversely affect our business, financial condition and results of operations. In addition to laws, regulations and other applicable common law rules regarding privacy, and privacy advocacy groups, industry groups or other private parties may propose new and different privacy standards. We could also
be subject to liability for the inappropriate use of information made available by us. Because the interpretation and application of privacy and data protection laws and privacy standards are still uncertain, it is possible that these laws or privacy standards may be interpreted and applied in a manner that is inconsistent with our practices. Any inability to adequately address privacy concerns, even if unfounded, or to comply with applicable privacy or data protection laws, regulations and privacy standards, could result in additional cost and liability for us, damage our reputation, inhibit use of our marketplace bank and harm our business.
Any failure to protect our own intellectual property rights could impair our brand, or subject us to claims for alleged infringement by third parties, which could harm our business.
We rely on a combination of copyright, trade secret, trademark, patent and other rights, as well as confidentiality procedures and contractual provisions to protect our proprietary technology, underwriting and credit decisioning data, processes and other intellectual property. However, the steps we take to protect our intellectual property rights may be inadequate. Third parties may seek to challenge, invalidate or circumvent our copyright, trade secret, trademark, patent and other rights or applications for any of the foregoing. Further, as our business continues to expand we may increase our dependence on third parties to provide additional products and services. Third parties who are contractually obligated to protect our intellectual property may be the target of data breaches or may breach their obligations and disseminate, misappropriate or otherwise misuse our proprietary technology, underwriting and data, processes and other intellectual property. Additionally, our competitors, as well as a number of other entities and individuals, may own or claim to own intellectual property relating to our industry. From time to time, third parties may claim that we are infringing on their intellectual property rights, and we may be found to be infringing on such rights. We may, however, be unaware of the intellectual property rights that others may claim cover some or all of our technology or services.
In order to protect our intellectual property rights, we may be required to spend significant resources. Litigation brought to protect and enforce our intellectual property rights could be costly, time-consuming and distracting to management and could result in the impairment or loss of portions of our intellectual property. In addition, any claims or litigation could cause us to incur significant expenses and, if successfully asserted against us, could require that we pay substantial damages or ongoing royalty payments, prevent us from offering our products or operating our platform
or require that we comply with other unfavorable terms. Our failure to secure, protect and enforce our intellectual property rights could seriously adversely affect our brand and adversely impact our business.
Some aspects of our platform include open source software, and any failure to comply with the terms of one or more of these open source licenses could negatively affect our business.
Aspects of our platform include software covered by open source licenses, which may include, by way of example, GNU General Public License and the Apache License. Open source license terms are often ambiguous, and there is little or no legal precedent governing the interpretation of many of the terms of certain of these licenses. Therefore, the potential impact of such terms on our business is somewhat unknown. If portions of our proprietary software are determined to be subject to an open source license, we could be required to publicly release and grant royalty-free licenses under the affected portions of our proprietary source code, re-engineer all or a portion of our technologies or otherwise be limited in the licensing of our technologies, each of which could reduce or eliminate the value of our technologies and products. There can be no assurance that efforts we take to monitor the use of open source software to avoid uses in a manner that would require us to disclose or grant licenses under our proprietary source code will be successful, and such use could inadvertently occur. This could harm our intellectual property position and have a material adverse effect on our business, results of operations, cash flow, and financial condition. In addition to risks related to license requirements, usage of open source software can lead to greater risks than use of third-party commercial software, as open source licensors generally do not provide warranties or controls on the origin of the software. Many of the risks associated with use of open source software cannot be eliminated, and could adversely affect our business.
RISKS RELATED TO TAX AND ACCOUNTING
OurChanges in tax laws and our ability to use our deferred tax assets to offset future taxable income may be subject to certain limitations that could subjecthave a material adverse effect on our business, to higher tax liabilities.financial condition and results of operations.
We are subject to taxes in the United States under federal, state and local jurisdictions in which we operate. The governing tax laws and applicable tax rates vary by jurisdiction and are subject to interpretation and changes. We may be limitedsubject to examination by the tax authorities and such authorities may disagree with our tax positions, which could adversely affect our financial condition.
Further, the amount of tax payable in a given financial statement period may be impacted by sudden or unforeseen changes in tax laws, changes in the portionmix and level of net operating loss carryforwards that we can use inearnings by taxing jurisdictions, or changes to existing accounting rules or regulations. For example, the future to offset taxable income for U.S. federal and state income tax purposes. The Tax Cuts and Jobs Act (the Tax Act) enacted on December 22, 2017, makesmade broad and complex changes to the U.S. tax code. While future interpretative guidance of the Tax Actcode and how many U.S. states will incorporate these federal law changes may have an impact on our business, the Tax Act’s reduction of the federal corporate income tax rate from 35% to 21%, effective January 1, 2018, has reduced our deferred tax asset associated with net operating loss carryforwards (NOLs). A lack of future taxable income would also adversely affectimpact our ability to utilize our NOLs.
In addition, under Section 382 of the Internal Revenue Code of 1986, as amended, (Code), a corporation that undergoes an “ownership change” is subject to limitations on its ability to utilize its NOLs to offset future taxable income. Future changes in our stock ownership, as well as other changes that may be outside of our control, could result in additional ownership changes under Section 382 of the Code.Internal Revenue Code, as amended. Our NOLs may also be impaired under similar provisions of state law.
We assess the available positive and negative evidence to estimate if sufficient future taxable income will be generated to utilize the existing deferred tax assets. On the basis of this evaluation, a full valuation allowance has historically been recorded to recognize only deferred tax assets that are more likely than not to be realized.
Finally, further Further, additional changes to the federal or state tax laws or technical guidance relating to the Tax Act that would further reduce the corporate tax rate could operate to effectively reduce or eliminate the value of any deferred tax asset. Our tax attributes as of December 31, 20202023 may expire unutilized or underutilized, which could prevent us from offsetting future taxable income.
We assess the available positive and negative evidence to estimate if sufficient future taxable income will be generated to utilize certain deferred tax assets. On the basis of this evaluation, a valuation allowance has been recorded to recognize only deferred tax assets that are more likely than not to be realized.
Our ability to accurately forecast net income (loss) is in part a function of our ability to use our NOLs and, more generally, forecast our tax liability. Fluctuations in our tax obligations may differ materially from amounts recorded in our financial statements and could adversely affect our business, financial condition and results of operations in the periods for which such determination is made.
We have incurred net losses in the past and may incur net losses in the future.
As ofAlthough we were profitable for the years ended December 31, 2020, our accumulated deficit was $786.2 million.2023 and 2022, and expect to remain profitable for the year ending December 31, 2024, we have incurred net losses in the past. Our operating expenses may continue to be elevated as we resolve additional matters that arose from legacy management, settle regulatory investigations and examinations, enhance our compliance and technology systems, reestablishcontinue the growth of our business, attract borrowers, investorscustomers and partners, integrate Radius Bank, and further enhance and develop our products and services. These efforts may prove more expensive than we currently anticipate, and we may not succeed in increasing our revenue sufficiently to offset these higher expenses. We may incur additional net losses in the future and may not maintain profitability on a quarterly or annual basis.
If accounting standards change or if our estimates or assumptions relating to our critical accounting policies prove to be incorrect, our results of operations and financial condition could be adversely affected.
Our financial statements are subject to the application of accounting principles generally accepted in the United States of America (GAAP). The application of GAAP is also subject to varying interpretations over time. We are required to adopt new or revised accounting standards or comply with revised interpretations that are issued from time to time by various parties, including accounting standard setters and those who interpret the standards, such as the FASB, the SEC, and bank regulatory authorities. Those changes are beyond our control but could adversely affect our results of operations and financial condition. See “Part II – Item 8. Financial Statements and Supplementary Data – Notes to Consolidated Financial Statements – Note 1. Summary of Significant Accounting Policies – Adoption of New Accounting Standards” below for information on new financial accounting standards issued by the FASB. Additionally, the preparation of our financial statements in conformity with GAAP requires estimates and assumptions that affect the amounts reported and disclosed in our financial statements. While we base our estimates and assumptions on historical experience and other assumptions that we believe to be reasonable under the circumstances, our results of operations may be adversely affected if our assumptions change or if actual circumstances differ from those in our assumptions.
RISKS RELATED TO OWNERSHIP OF OUR COMMON STOCK
Our stock price has been and may continue to be volatile.
Our stock price has declined significantly since the end of the first quarter of 2016 and has exhibited substantial volatility. Our stock price may continue to fluctuate in response to a number of events and factors, such as quarterly operating results; changes in our financial projections provided to the public or our failure to meet those projections; changes in the credit performance onof our platform;loans; the public’s reaction to our press releases, other public announcements and filings with the SEC; progress and resolution with respect to existing litigation and regulatory inquiries; our acquisitionoperation of the Bank,LC Bank; significant transactions or acquisitions; new features, products or services offered by us or our competitors; changes in financial estimates and recommendations by securities analysts; media coverage of our business and financial performance; the operating and stock price performance of, or other developments involving, other companies that investorsstockholders may deem comparable to us; trends in our industry; any significant change in our management; and general economic conditions.
In addition, the stock market in general, and the market prices for companies in our industry, have experienced volatility. These broad market and industry fluctuations may adversely affect the price of our stock, regardless of our operating performance. Price volatility over a given period may cause the average price at which weof any repurchase of our own stock to exceed the stock’s price at a given point in time. Volatility in our stock price also impacts the value of our equity compensation, which affects our ability to recruit and retain employees. In addition, some companies that have experienced volatility in the market price of their stock, including us, have been subject to securities class action litigation. We have been the target of this type of litigation and may continue to be a target in the future.
Securities litigation against us could result in substantial costs and divert our management’s attention from other business concerns, which could harm our business.
Further, our stock could be the target of short sellers who may seek to drive down the price of shares they have sold short by disseminating negative reports or information about the Company. Such negative publicity may lead to additional public scrutiny or may cause further volatility in our stock price, a decline in the value of a stockholder’s investment in us or reputational harm.
Any stock price decline could have a material adverse impact on investorstockholder confidence and employee retention.
If securities or industry analysts do not publish research or reports about our business, or publish inaccurate or unfavorable research reports about our business, our stock price and trading volume could decline.
Research and reports that securities or industry analysts publish about the Company or our business may be consumed by equity investors and influence their opinion of our business and/or investment in our common stock. For example, if one or more of the analysts who cover us downgrades our stock, our stock price may decline. Additionally, if one or more of these analysts cease coverage of the Company or fail to regularly publish reports on us, we could lose visibility in the financial markets, which could cause our stock price or trading volume to decline.
Future issuances and/or sales of common stock may result in significant dilution to our stockholders and may place downward pressure on our stock price.
We may issue additional equity securities to raise capital, support acquisitions, or for a variety of other purposes. We also utilize equity-based compensation as an important tool in recruiting and retaining employees and other service providers. Additional issuances of our stock may be made pursuant to the exercise or vesting of new or existing stock options or restricted stock units, respectively. Dilution to existing holders of our common stock from equity-based compensation and other additional issuances could be substantial and may place downward pressure on our stock price.
Our quarterly results may fluctuate significantly and may not fully reflect the longer term underlying performance of our business.
Our operating and financial results have varied on a quarterly basis during our operating history and may continue to fluctuate significantly. These fluctuations may be due to a variety of factors, some of which are outside of our control and may not fully reflect the underlying performance of our business. Factors that may cause fluctuations in our quarterly financial results include our ability to attract and retain new customers, seasonality in our business, the costs associated with and outcomes of legal and regulatory matters, volatility related to fraud and credit performance, the timing of capital markets transactions, variability in the valuation of loans held on our balance sheet, changes in business or macroeconomic conditions and a variety of other factors, including as a result of the risks set forth in this “Risk Factors” section. Fluctuation in quarterly results and how we perform relative to guidance may adversely affect the price of our common stock.
Anti-takeover provisions in our charter documents and Delaware law may delay or prevent an acquisition of our company.
Our restated Certificate of Incorporation, as amended (Certificate of Incorporation), and our amended and restated Bylaws (Bylaws) contain provisions that can have the effect of delaying or preventing a change in control of us or changes in our management. The provisions, among other things:
•establish a classified board of directors so that not all members of our board of directors are elected at one time;
•permit only our board of directors to establish the number of directors and fill vacancies on the board;
•provide that directors may only be removed “for cause” and only with the approval of two-thirds of our stockholders;
•require two-thirds of all outstanding shares of our capital stock vote to amend some provisions in our restated Certificate of Incorporation and restated Bylaws;
•authorize the issuance of “blank check” preferred stock that our board of directors could use to implement a stockholder rights plan (also known as a “poison pill”);
•eliminate the ability of our stockholders to call special meetings of stockholders;
•prohibit stockholder action by written consent, which will requirerequires that all stockholder actions must be taken at a stockholder meeting;
•do not provide for cumulative voting; and
•establish advance notice requirements for nominations for election to our board of directors or for proposing matters that can be acted upon by stockholders at annual stockholder meetings.
These provisions, alone or together, could delay or prevent hostile takeovers and changes in control or changes in our management. In addition to these provisions, banking laws impose notice, approval, and ongoing regulatory requirements on any shareholderstockholder or other party that seeks to acquire direct or indirect “control” of an FDIC-insured depository institution.institution and bank holding company. These laws include the BHCA and the Change in Bank Control Act. These laws could delay or prevent an acquisition. See “Item 1. Business – Regulation and Supervision – Acquisition of a Significant Interest in the Company” for additional information.
If securities or industry analysts do not publish research or reports about our business, or publish inaccurate or unfavorable research reports about our business, our stock price and trading volume could decline.
Research and reports that securities or industry analysts publish about us or our business may be consumed by equity investors and influence their opinion of our business and/or investment in our common stock. For example, if one or more of the analysts who cover us downgrades our stock, our stock price may decline. Additionally, if one or more of these analysts cease coverage of our company or fail to regularly publish reports on us, we could lose visibility in the financial markets, which could cause our stock price or trading volume to decline.
We do not intend to pay dividends for the foreseeable future.
We currently intend to retain any future earnings to finance the operation and expansion of our business, and we do not expect to declare or pay any dividends in the foreseeable future. As a result, an investora stockholder may only receive a return on their investment in our common stock if the trading price of our common stock increases.
Also, as a bank holding company, our ability to pay dividends is affected by the policies and enforcement powers of the FRB and any future payment of dividends will depend on theLC Bank’s ability to make distributions and payments to the Company as our principal source of funds to pay such dividends. TheLC Bank is also subject to various legal, regulatory and other restrictions on its ability to make distributions and payments to the Company. In addition, in the future, we may enter into borrowing or other contractual arrangements that restrict itsour ability to pay dividends. As a consequence of these various limitations and restrictions, we may not be able to make the payment ofpay dividends on our common stock. See “Item 1. Business – Regulation and Supervision – Regulatory Limits on Dividends and Distributions”Distributions” for additional information.
Item 1B. Unresolved Staff Comments
None.
Item 1C. Cybersecurity
Cybersecurity represents a critical component of our overall approach to risk management. Accordingly, cybersecurity risks are subject to oversight by the Company’s Board of Directors (the Board), primary responsibility for which has been delegated by the Board to its Operational Risk Committee (the Board Operational Risk Committee).
Our cybersecurity policies, processes and practices are informed by the cybersecurity framework established by the National Institute of Standards and Technology. We are able to leverage a cross-functional team that includes senior personnel from our technology, operations, legal, risk management and internal audit functions as and when warranted by the particular cybersecurity matter. In managing cybersecurity risks, we strive to: (i) identify, prevent and mitigate cybersecurity threats; (ii) preserve the confidentiality, security and availability of proprietary or
confidential information; (iii) protect the Company’s intellectual property; (iv) maintain the confidence of our members, marketplace investors and business partners; and (v) provide appropriate and required disclosure of cybersecurity risks and incidents.
Risk Management and Strategy
Our processes for assessing, identifying, and managing material risks from cybersecurity threats are fully integrated into our enterprise risk management (ERM) program and include the following areas of focus:
•Systems Safeguards: Preventing and mitigating cybersecurity threats, including through the use of firewalls, intrusion prevention and detection systems, anti-malware software, access controls and other system safeguards.
•Incident Response: Identifying and responding to cybersecurity incidents in accordance with our information security incident response plan.
•Collaboration: Collaborating internally and with public and private entities, including intelligence and enforcement agencies, industry groups and third-party service providers, to identify, assess and respond to cybersecurity risks.
•Third-Party Risk Management: Maintaining a comprehensive, risk-based approach to identifying and overseeing cybersecurity risks presented by third parties, including vendors, service providers and other external users of our systems.
•Training: Reinforcing our information security policies, processes and practices through periodic mandatory training for Company personnel.
•Governance: Designing a comprehensive framework for the oversight of cybersecurity risk, with regular interaction between the Board Operational Risk Committee and the Company’s ERM function, our Chief Information Security Officer (CISO) and members of Company management and relevant management committees, including the Company’s Management Operational Risk Committee (the Management Operational Risk Committee).
A key part of our strategy for managing risks from cybersecurity threats is the assessment and testing of our processes and practices through auditing, assessments, tabletop exercises, threat modeling, vulnerability scanning and other exercises focused on evaluating the effectiveness of our cybersecurity measures. We engage third parties to perform assessments on our cybersecurity measures, including information security penetration tests, audits and independent reviews of our information security control environment and operating effectiveness. The results of such assessments, audits and reviews are reported to the Board Operational Risk Committee and are used to adjust our cybersecurity policies, standards, processes and practices, as necessary.
Governance
The Board Operational Risk Committee oversees the management of risks from cybersecurity threats, including policies, processes and practices implemented by Company management to address such risks. The Board Operational Risk Committee receives presentations and reports on cybersecurity risks and information regarding any cybersecurity incident that meets established reporting thresholds, as well as ongoing updates until such incident has been addressed. At least once each year, the Board Operational Risk Committee discusses the Company’s approach to cybersecurity risk management with our CISO. Further, the Board periodically, as warranted, receives reports with respect to and engages in discussions with Company management on cybersecurity matters.
Our CISO is principally responsible for overseeing our cybersecurity risk management program, in partnership with other senior personnel across the Company. Our CISO works in coordination with the other members of the Company’s Management Operational Risk Committee, which includes our Chief Executive Officer, Chief Financial Officer, Chief Technology Officer, Chief Risk Officer and General Counsel. Our CISO has served in that role for over 5 years and in various roles in information technology and information security for over 20 years. Our CISO
holds an undergraduate degree in computer information systems and has attained the professional certification of Certified Information Systems Security Professional. The other members of the Management Operational Risk Committee each have relevant qualifications and over 10 years of experience managing risk in the technology and/or financial services industry.
Our CISO, in coordination with the Management Operational Risk Committee, works collaboratively across the Company to implement a program designed to protect our information systems from cybersecurity threats and to promptly respond to any cybersecurity incidents. To facilitate the success of this program, cross-functional teams are deployed to address cybersecurity threats and to respond to cybersecurity incidents in accordance with our information security incident response plan. Our CISO, through his team and use of accompanying technology, monitor the prevention, detection, mitigation and remediation of cybersecurity incidents, and report such incidents to the Management Operational Risk Committee and/or the Board Operational Risk Committee, as and when appropriate.
In 2023, we did not identify any cybersecurity threats that have materially affected or are reasonably likely to materially affect our business strategy, results of operations, or financial condition. However, we cannot eliminate all risks from cybersecurity threats or provide assurances that we have not experienced undetected cybersecurity incidents of a material nature. For additional information about the risks from cybersecurity threats, see “Item 1A. Risk Factors” in this Annual Report.
Item 2. Properties
TheWe lease space for our headquarters in San Francisco, California. Further, we lease additional office space in other parts of the United States, including in the Salt Lake City, Utah and Boston, Massachusetts areas. We believe our current leased properties are adequate for our immediate business needs. For more information set forth underregarding our leases, see “Part II – Item 8. Financial Statements and Supplementary Data – Notes to Consolidated Financial Statements – Note 18.19. Leases” of this Form 10-K is incorporated herein by reference.Annual Report.
Item 3. Legal Proceedings
The information set forth under “Part II – Item 8. Financial Statements and Supplementary Data – Notes to Consolidated Financial Statements – Note 19.20. Commitments and Contingencies” of this Form 10-KAnnual Report is incorporated herein by reference.
Item 4. Mine Safety Disclosures
Not applicable.
PART II
Item 5. Market for Registrant’s Common Equity, Related Stockholder Matters and Issuer Purchases of Equity Securities
Market Information for Common Stock
LendingClub’s common stock is listed on the New York Stock Exchange (NYSE) under the ticker symbol “LC.”
Holders of Record
As of February 26, 2021,January 31, 2024, there were 76 34holders of record of LendingClub’s common stock. Because many of LendingClub’s shares of common stock are held by brokers and other institutions on behalf of stockholders, the Company is unable to estimate the total number of stockholders represented by these record holders.
Dividend Policy
LendingClub has not paid cash or other dividends since its inception, and does not anticipate paying cash or other dividends in the foreseeable future. Further, see “Part“Part I – Item 1. Business – Regulation and Supervision – Regulatory Limits on Dividends and Distributions” Distributions” and “Item 8. Financial Statements and Supplementary Data – Notes to Consolidated Financial Statements – Note 21. Regulatory Requirements” for a summary of certain rules and regulations that limit the ability of the Company or theLC Bank to pay dividends.
Sales of Unregistered Securities
None.
Issuer Purchases of Equity Securities
None.
Performance Graph
This performance graph shall not be deemed “soliciting material” or to be “filed” with the SEC for purposes of Section 18 of the Securities Exchange Act, of 1934, as amended (Exchange Act), or otherwise subject to the liabilities under that Section, and shall not be deemed to be incorporated by reference into any filing of LendingClub under the Securities Act, of 1933, as amended, or the Exchange Act.
The following graph and table compare the cumulative total return to stockholders of LendingClub’s common stock relative to the cumulative total returns of the KBW Nasdaq Bank Index and Standard & Poor’s 500 Index and the Dow Jones Internet Composite Index. An investment of $100 (with reinvestment of all dividends, when applicable) is assumed to have been made in LendingClub’s common stock and in each index at market close on December 31, 20152018 and its relative performance is tracked through December 31, 2020.29, 2023. The returns shown are based on historical results and are not intended to suggest future performance.
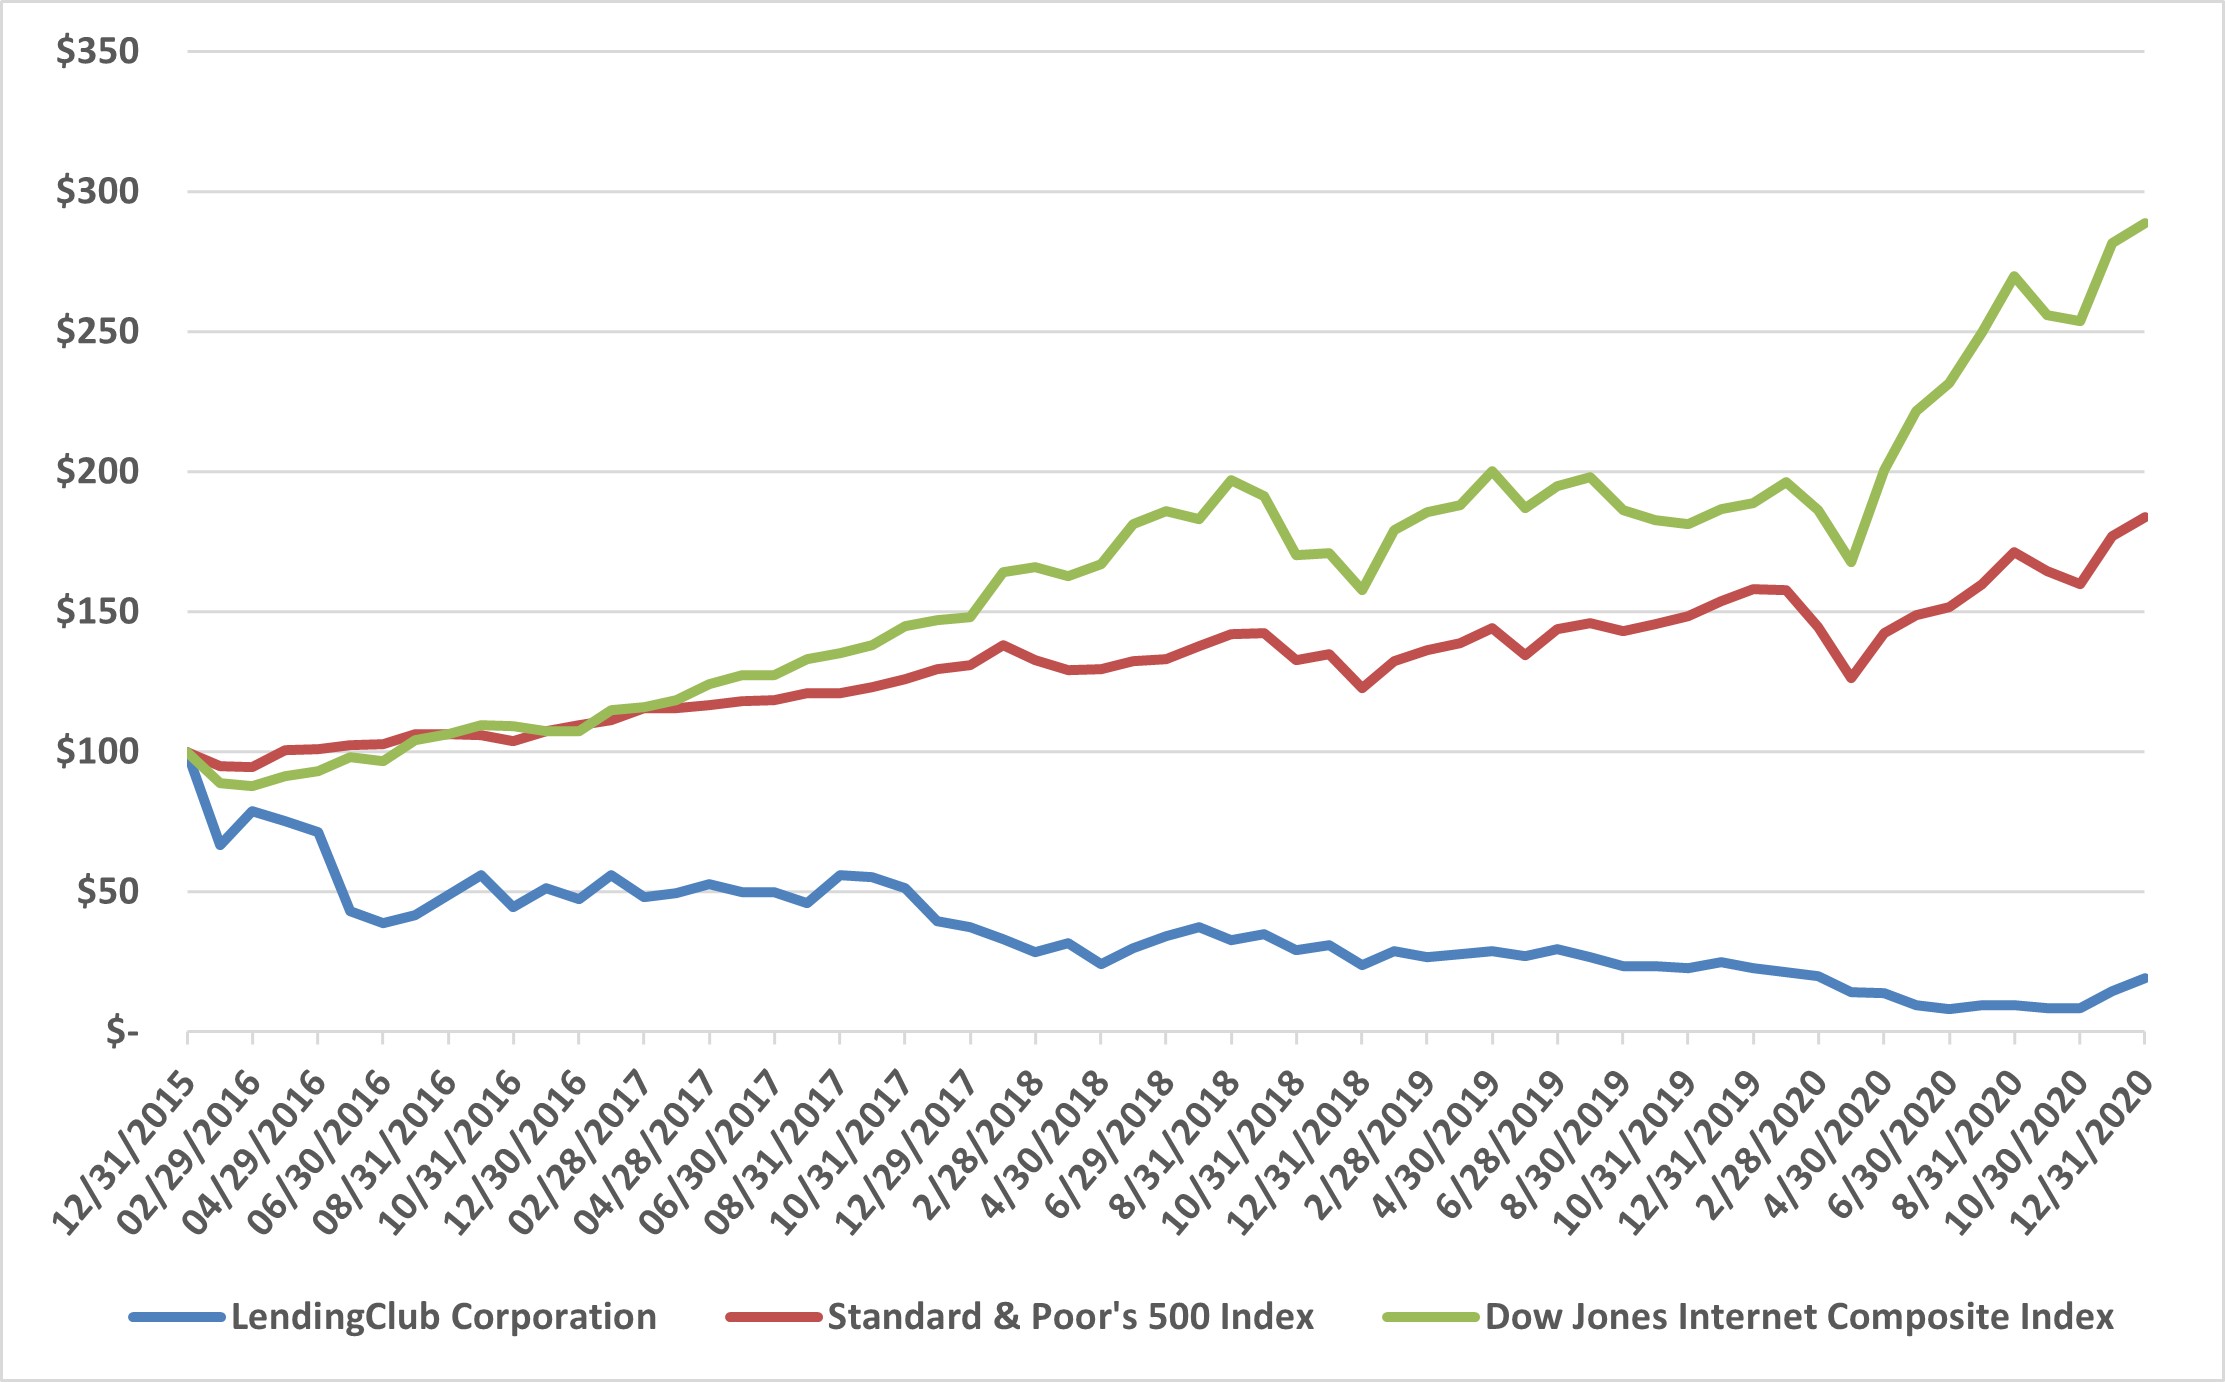

| | December 31, 2015 | | December 30, 2016 | | December 29, 2017 | | December 31, 2018 | | December 31, 2019 | | December 31, 2020 |
| December 31, 2018 | | | December 31, 2018 | | December 31, 2019 | | December 31, 2020 | | December 31, 2021 | | December 30, 2022 | | December 29, 2023 |
| LendingClub Corporation | LendingClub Corporation | $ | 100 | | | $ | 47.51 | | | $ | 37.38 | | | $ | 23.80 | | | $ | 22.84 | | | $ | 19.11 | |
| KBW Nasdaq Bank Index | |
| Standard & Poor’s 500 Index | Standard & Poor’s 500 Index | $ | 100 | | | $ | 109.54 | | | $ | 130.81 | | | $ | 122.65 | | | $ | 158.07 | | | $ | 183.77 | |
| Dow Jones Internet Composite Index | $ | 100 | | | $ | 107.27 | | | $ | 148.12 | | | $ | 157.76 | | | $ | 188.76 | | | $ | 288.80 | |
Item 6. Selected Financial Data
Not applicable.[Reserved]
LENDINGCLUB CORPORATION
Management’s Discussion and Analysis of Financial Condition and Results of Operations
(Tabular Amounts in Thousands, Except Share and Per Share Data and Ratios, or as Noted)
Item 7. Management’s Discussion and Analysis of Financial Condition and Results of Operations
The following discussion and analysis of our financial condition and results of operations should be read in conjunction with the consolidated financial statements and related notes that appear in this Annual Report on Form 10-K (Report).Report. In addition to historical consolidated financial information, the following discussion contains forward-looking statements that reflect our plans, estimates and beliefs. Our actual results could differ materially from those discussed in the forward-looking statements. Factors that could cause or contribute to these differences include those discussed below and in this Annual Report, particularly in “Part I – Item 1A. Risk Factors.”
Overview
LendingClub was founded in 2006 to transformand brought a traditional credit product – the banking industryinstallment loan – into the digital age by leveraging technology, data science, and a unique marketplace model. We started by bringing a traditional credit product, the installment loan, into the digital age and became the largest provider of unsecured personal loans in the United States. OnIn February 1, 2021, LendingClub completed the acquisition of Radius, Bancorp, Inc. (Radius), whereby LendingClub becamebecoming a bank holding company and formed LendingClubforming LC Bank National Association (the Bank) as its wholly-owned subsidiary,subsidiary. LendingClub now operates a leading digital marketplace bank and is one of a small number of fintech companies with a national bank charter. We are building a new of kind of bank, one that aims to advantage our members with the information, tools, and guidance they need to achieve their own version of financial success. We do this by leveraging data and technology to increase access to credit, lower borrowing costs, and improve the return on savings – all through which we will now operate the vast majority of our business. With the acquisition, we combined the complementary strengths of the Company’sa smart, simple, and rewarding digital lending capabilities with an award-winning digital bank.experience.
Prior to the acquisition, we facilitated loan originations by connecting borrowers with investors through our online lending marketplace platform. However, we relied on third-party issuing banks to originate and fund loans initiated by borrowers, which were then sold to investors. Following the acquisition, the Bank became the originator and lender for our unsecured personal loans and auto loans (Consumer Loans).Executive Summary
AsDespite the acquisition occurred after December 31, 2020,interest rate environment and broader economic volatility adversely impacting our business, predominantly through investor demand and pricing for marketplace loans, we have been able to sustain GAAP profitability as a result of our differentiated business model, strong execution, data advantage, and ongoing innovation. While we expect these headwinds to persist, we’re leveraging our Structured Certificates program to drive marketplace originations and managing the business prudently by aligning our expense base to current market conditions. Furthermore, we maintained strong liquidity and capital levels and delivered the following discussion begins withresults, despite a historical business model summary and financial review of 2020, followed by a discussion of the implications to our new business model in 2021 as a bank holding company.
Historical Business Model and 2020 Financial Review
Our primary sources of revenue consisted of transaction fees that were paid to us by issuing banks to facilitate loan originations, net interest income and fair value adjustments on loans invested in by the Company, investor fees that compensated us for the costs we incurred in servicing loans, and a gain or loss on sales of loans.
Loans facilitated through our lending marketplace were funded by the sale of whole loans to banks and other institutional investors, the sale of whole loans facilitated through Structured Programs, the issuance of notes to our self-directed retail investors, or funded directly by the Company with its own capital. The Company’s Structured Program transactions included asset-backed securitization transactions and Certificate Program transactions (which consisted of CLUB Certificate and Levered Certificate transactions). The Company continues to be required to retain a portion of the securities from these transactions.challenging economic environment.
In response2023, our total headcount decreased by 560 employees, or 35%, compared to the prior year, primarily due to the workforce reduction plans we implemented during the year to align our cost structure to our financial profile given the continued adverse impact of COVID-19, we quickly initiated a number of measures intended to help both sides ofthe evolving macroeconomic environment on our marketplace navigate the economic environment by providing flexibility for our members and protecting returns for our investors. To provide flexibility to our members, we rapidly launched a number of new hardship/forbearance plans (Payment Plans), including Skip-a-Pay and interest-only plans, and waived late fees for an extended period of time. To help protect investor returns for new loans, we tightened underwriting including increased income verification requirements and increased interest rates on new loans, added capacity to help borrowers over the phone and launched self-service options online for borrowers looking for help.business.
Investor. •When COVID-19’s economic effects were apparentLoan originations:Loan originations decreased $5.7 billion, or 43%, for the year ended December 31, 2023 compared to the same period in 2022. The decrease was primarily driven by a decrease in unsecured personal loan origination volume. We attribute the decrease in volume and investor demand to the rising interest rate environment.
◦Loan originations held for investment (HFI) at amortized cost decreased $1.5 billion, or 41%, for the year ended December 31, 2023 compared to the prior year.
◦Loan originations HFI at amortized cost as a percentage of loan originations was 29% and 28% for the years ended December 31, 2023 and 2022, respectively. The percentage of loan originations HFI in any period is dependent on many factors, including quarterly loan origination volume, risk-adjusted returns, liquidity and general regulatory capital considerations. We expect this percentage to decrease in the latter portion of the first quarter of 2020, there wasnear-term due to a reduction in investor demand on our platform reflecting market dislocation for unsecured personal loans,
LENDINGCLUB CORPORATION
Management’s Discussion and Analysis of Financial Condition and Results of Operations
(Tabular Amounts in Thousands, Except Share and Per Share Data and Ratios, or as Noted)
driven in part by uncertainty around consumer credit performance and increased liquidity constraints for certain of our investors. In response, since the second quarter of 2020, the Company has structured incentives to secure the funding commitments of our investors. With the origination volume since increasing, we are beginning to see more platform investors return with reductions in structured incentives. Origination volume for the fourth quarter of 2020 was $912 million, an increase from $584 millionshift in the third quarter of 2020 and an increase from $326 million in the second quarter of 2020.mix toward retaining lower-risk securities associated with our Structured Certificates.
Borrower. With respect to existing borrowers, the Company is offering Payment Plans to provide relief to those impacted by COVID-19 through deferrals of loan payments. As previously disclosed, we offer eligible borrowers the opportunity to skip monthly payments in two-month increments through our Skip-a-Pay program. We also launched an interest-only hardship plan and continue to launch or plan to launch additional Payment Plans. Borrowers participating in Skip-a-Pay have the terms of their existing loan extended for a commensurate period, which impacts the duration and payment date for loans. As the current regulatory environment for loan forgiveness or waivers of missed payments evolves, our programs, which address these topics, may evolve over time as well.
Borrower behavior in the aggregate has been strong, and among those enrolled in Payment Plans has been encouraging and reflects the desire for borrowers to remain current on their loan payments:
•Total loan borrower performance is strong as ofnet revenue: Total net revenue decreased $322.6 million, or 27%, for the year ended December 31, 2020. Repayment rates remain at pre-COVID-19 levels, and delinquency and roll rates (the percentage of borrowers who progress into later delinquency stages) are lower than historical averages. Newer vintages are displaying better credit performance2023 compared to pre-COVID-19 vintages and lower enrollment rates into our Skip-a-Pay program.
•Performance among those borrowers enrolledthe same period in hardship plans is encouraging. Approximately 13% of borrowers have enrolled in a Payment Plan at some point during the life of their loan. As of December 31, 2020, approximately 1% of total borrowers were enrolled in a Payment Plan.
Loan Origination Update
The following table shows the loan origination volume issued, loans purchased or pending purchase by the Company, and the available loan inventory as of the end of each period set forth below (in millions):
| | | | | | | | | | | | | | | | | |
| December 31, 2020 | | September 30, 2020 | | June 30,
2020 |
| Loan originations | $ | 912.0 | | | $ | 584.1 | | | $ | 325.8 | |
| Loans purchased or pending purchase by the Company during the quarter | $ | 140.6 | | | $ | 27.6 | | | $ | 18.9 | |
LendingClub inventory (1) | $ | 12.4 | | | $ | 9.0 | | | $ | 15.0 | |
LendingClub inventory as a percentage of loan originations (1) | 1 | % | | 2 | % | | 5 | % |
(1) LendingClub inventory reflects loans purchased or pending purchase by the Company during the period, excluding loans held by the Company through consolidated trusts, if applicable, and not yet sold as of the period end.
In the fourth quarter of 2020, our marketplace facilitated $912.0 million of loan originations, of which $696.3 million was issued through whole loan sales and $140.6 million was purchased or pending purchase by the Company.
Loan inventory purchased by the Company was 1% of total loan originations during the fourth quarter of 2020. This decrease since the second quarter of 2020 was due to lower volumes of loans purchased by the Company due to the strategic decisions we made as a result of COVID-19.
LENDINGCLUB CORPORATION
Management’s Discussion and Analysis of Financial Condition and Results of Operations
(Tabular Amounts in Thousands, Except Share and Per Share Data and Ratios, or as Noted)
Restructuring
On April 21, 2020, the Company disclosed a restructuring plan to address the impact of COVID-19 on the Company’s business by repositioning the Company’s expense base to better reflect the reduction in loan volume and better position the Company for profitability and achieving its strategic goals when the economy and business stabilizes. The restructuring plan included workforce reductions affecting approximately 460 employees. The Company recorded restructuring costs of approximately $17 million and $0.8 million in the second and third quarters of 2020, respectively, which included severance and other personnel-related expenses, lease-related expenses and software impairment. The impact of the reduction in workforce is estimated to lower our ongoing quarterly cash compensation expense by approximately $17 million and stock-based compensation expense by approximately $4 million.
2021 Business Model and Implications
We anticipate that additional strategic and financial benefits of the Radius acquisition will include:
•Increased resiliency with access to stable, low-cost deposit funding replacing higher-cost and more volatile third-party warehouse funding;
•Increased and more stable revenue driven by increased net interest income from Consumer Loans held for investment;
•Expense benefits by capturing the fees that were historically paid to our third-party issuing banks; and
•Ability to attract new members and deepen relationships with existing members through the addition of banking services that leverage LendingClub’s marketing and brand strengths.
We fund our Consumer Loan originations through the Company’s marketplace by either selling loans directly to third-party purchasers or investing our own capital in originated loans and holding those loans for investment. The mix of loans held for investment and originated for sale will depend on a number of factors, including origination volumes, bank capital availability and demand from third-party loan investors.
As the originator of Consumer Loans, origination fees from loans held for sale (HFS) will be recorded as a component of marketplace lending revenue. Marketplace lending revenue will also include servicing revenue associated with loan sales. Origination fees and costs from loans held for investment (HFI) will be amortized through interest income over the life of the loans, and the expected credit losses reflected as a charge through earnings. The lifetime estimated credit losses on HFI loans will be initially recognized through earnings when such loans are originated or otherwise acquired, while the interest received will be recognized according to the loan’s contractual payment terms. Due to this timing difference between credit losses taken through earnings and actual charge-offs, we expect earnings to be disproportionately impacted in the near term from the expected organic growth in our HFI loan portfolio before benefiting from higher levels of interest income in later periods.
The change in our business model to being an originating lender with a stable deposit base will also diversify our funding strategy. As we expand our product offerings and grow our loan originations and HFI loan portfolio, we will increasingly rely on funding from customer deposits to prudently manage reliance on wholesale funding sources that tend to be more susceptible to market dislocations during periods of economic stress. We did not share in any interest rate or credit risk on the loans facilitated through our lending marketplace that were funded by Member Payment Dependent Notes (Retail Notes), certificates and certain secured borrowings because loan balances, interest rates and maturities were matched and offset by an equal balance of notes, certificates or secured borrowings with the exact same interest rates and maturities. As of December 31, 2020, LendingClub ceased offering and selling Retail Notes. The total balance of outstanding Retail Notes will continue to decline as underlying borrower payments are made.
LENDINGCLUB CORPORATION
Management’s Discussion and Analysis of Financial Condition and Results of Operations
(Tabular Amounts in Thousands, Except Share and Per Share Data and Ratios, or as Noted)
The formation of◦Marketplace revenue: Marketplace revenue decreased $392.1 million, or 57%, for the Bank as a nationally chartered association and the organization of our Parent as a bank holding company subjects us to various capital adequacy guidelines issued by the OCC and FRB, including the requirement to maintain minimum regulatory capital ratios in accordance with the Basel Committee on Banking Supervision standardized approach for U.S. banking organizations (U.S. Basel III). In addition to these guidelines and as part of our regulatory approvals, we have made various commitmentsyear ended December 31, 2023 compared to the regulatorssame period in order2022. The decrease was primarily due to demonstrate that we will operatea decrease in loan origination volume and lower loan sales prices resulting from a shift in investor demand from banks to asset managers.
◦Net interest income: Net interest income increased $87.0 million, or 18%, for the bankyear ended December 31, 2023 compared to the same period in 2022. The increase was primarily driven by higher interest income due to a safe higher average balance of loans retained as HFI in the current period, a higher average balance of securities retained associated with our Structured Certificates and sound manner. See “higher interest rates earned on Liquiditycash and Capital Managementcash equivalents, ”partially offset by higher interest rates paid on a higher average balance of deposits.
◦Net interest margin: Net interest margin for additional information.the year ended December 31, 2023 was 7.0%, decreasing from 8.2% in the prior year.
The acquisition of Radius will be accounted•Provision for as a purchase business combination, withcredit losses: Provision for credit losses decreased $23.8 million, or 9%, for the purchase price allocatedyear ended December 31, 2023 compared to the tangiblesame period in 2022. The decrease was primarily due to lower volume of originated loans retained as HFI at amortized cost and identifiable intangible assets acquiredthe related initial provision for credit losses, partially offset by an increase in quantitative and liabilities assumed based on their estimated fair values on February 1, 2021, with the residual difference recorded as goodwill. These estimates, along with our estimate of the acquisition datequalitative allowance for Radius HFI loandue to an increase in expected losses required under ASU 2016-13, Financial Instruments – Credit Losses (Topic 326): Measurement of Credit Losses on Financial Instruments, to be charged through earnings, will be provided in our March 31, 2021 Quarterly Report on Form 10-Q.and a less favorable economic outlook.
The acquisition will also significantly change•Total non-interest expense: Total non-interest expense decreased $200.4 million, or 26%, for the presentation of our financial statements in future periods. Going forward, our financial statements will be structured accordingyear ended December 31, 2023 compared to the presentation requirements for bank holding companies under Article 9same period in 2022. The decrease was primarily driven by a decrease in variable marketing expenses based on lower origination volume and prudent management of expenses and a decrease in compensation expense due to a decrease in headcount as a result of the SEC’s Regulation S-X.
As our transition to a bank holding company occurred after year-end, the following discussion, unless otherwise stated, discusses our Results of Operations under our historical business model.
Key Operatingworkforce reduction plans we implemented in January and Financial Metrics
We regularly review several metrics to evaluate our business, measure our performance, identify trends, formulate financial projections and make strategic decisions. The following presents our key operating and financial metrics:
| | | | | | | | | | | | | | | | | |
| Year Ended December 31, | 2020 | | 2019 | | 2018 |
| Loan originations | $ | 4,343,411 | | | $ | 12,290,093 | | | $ | 10,881,815 | |
| Sales and marketing expense as a percent of loan originations | 1.82 | % | | 2.27 | % | | 2.47 | % |
| Net revenue | $ | 314,702 | | | $ | 758,607 | | | $ | 694,812 | |
| Consolidated net loss | $ | (187,538) | | | $ | (30,690) | | | $ | (128,153) | |
Diluted EPS attributable to common stockholders (1) | $ | (2.63) | | | $ | (0.35) | | | $ | (1.52) | |
Contribution (2) | $ | 173,859 | | | $ | 392,294 | | | $ | 339,328 | |
Contribution margin (2) | 55.2 | % | | 51.7 | % | | 48.8 | % |
Adjusted EBITDA (2) | $ | (27,247) | | | $ | 134,772 | | | $ | 97,519 | |
Adjusted EBITDA margin (2) | (8.7) | % | | 17.8 | % | | 14.0 | % |
Adjusted net income (loss) (2) | $ | (138,567) | | | $ | 2,182 | | | $ | (32,375) | |
Adjusted EPS (1)(2) | $ | (1.53) | | | $ | 0.02 | | | $ | (0.38) | |
(1) See “Item 8. Financial Statements and Supplementary Data – Notes to Consolidated Financial Statements – Note 4. Net Income (Loss) Per Share” and “Note 15. Stockholders' Equity” for additional information.
(2) Represents non-GAAP financial measures. For more information regarding these measures and a reconciliation of these measures to the most comparable GAAP measures, see “Non-GAAP Financial Measures” below.October 2023.
Loan Originations•Net income: Net income decreased $250.7 million, or 87%, for the year ended December 31, 2023 compared to the same period in 2022. Net income for the year ended December 31, 2022 included a $143.5 million income tax benefit related to the reversal of our valuation allowance against our deferred tax assets.
We classified•Diluted Earnings Per Share (EPS): Diluted EPS was $0.36 for the year ended December 31, 2023, compared to $2.79 in the prior year. Diluted EPS for the year ended December 31, 2022 included a $1.38 per share benefit from the deferred tax valuation allowance reversal.
•Pre-provision net revenue (PPNR): PPNR for the year ended December 31, 2023 decreased $122.2 million, or 29%, compared to the same period in 2022.
•Cash and cash equivalents: Total cash and cash equivalents as of December 31, 2023 increased $195.5 million, or 18%, compared to the same period in 2022. The increase is primarily due to an increase in deposits.
•Total assets:Total assets as of December 31, 2023 increased $847.7 million, or 11%, compared to the prior year, primarily reflecting growth in securities related to our Structured Certificates, growth in loans facilitatedheld for sale (HFS) related to our extended seasoning program and an increase in cash and cash equivalents due to the growth in deposits. This increase was partially offset by our platform into three major loan products: standard program personala decrease in loans custom program personal loans and other loans. During 2020,retained as HFI.
•Total deposits: Total depositsas of December 31, 2023 increased $940.9 million, or 15%, compared to the majoritysame period in 2022, primarily due to an increase in customer certificates of the loans facilitated through our platform were standard program personal loans that represent loans made to prime borrowers that are available todeposit. Federal Deposit Insurance Corporation (FDIC)-insured deposits represented approximately 87% of total deposits as of December 31, 2023.
LENDINGCLUB CORPORATION
Management’s Discussion and Analysis of Financial Condition and Results of Operations
(Tabular Amounts in Thousands, Except Share and Per Share Data and Ratios, or as Noted)
institutional investors, private investors and public investors (in the form of Retail Notes). Custom program personal loans include all other personal loans to borrowers who are not eligible for our standard program, including loans primarily made to near-prime and super-prime borrowers, and are available only to private investors. Other loans are comprised of education and patient finance loans, auto refinance loans, and small business loans. In 2019, the Company announced that it will connect applicants looking for a small business loan with strategic partners and earn referral fees, instead of facilitating these loans on its platform. Because we ceased offering and selling Retail Notes•Total equity: Total equity as of December 31, 2020,2023 increased $87.5 million, or 8%, compared to the distinction between our standard programsame period in 2022, primarily reflecting an increase in Additional Paid-In Capital resulting from Stock-Based Compensation expense and custom program personal loans will no longer be relevant for future periods.net income generated over the period.
Loan origination volumeThe above summary should be read in conjunction with Management’s Discussion and weighted-average transaction fees (as a percentAnalysis of origination balance) by major loan products are as follows:
| | | | | | | | | | | | | | | | | | | | | | | | | | |
| Year Ended December 31, | 2020 | | 2019 | | 2018 |
| (in millions, except percentages) | Origination Volume | Weighted-Average Transaction Fee | | Origination Volume | Weighted-Average Transaction Fee | | Origination Volume | Weighted-Average Transaction Fee |
| Personal loans – standard program | $ | 3,007.3 | | 5.01 | % | | $ | 8,533.4 | | 5.03 | % | | $ | 7,936.3 | | 4.87 | % |
| Personal loans – custom program | 782.5 | | 4.98 | | | 2,972.6 | | 4.80 | | | 2,096.3 | | 4.98 | |
| Total personal loans | 3,789.8 | | 5.00 | | | 11,506.0 | | 4.97 | | | 10,032.6 | | 4.89 | |
| Other loans | 553.6 | | 3.28 | | | 784.1 | | 3.44 | | | 849.2 | | 4.29 | |
| Total | $ | 4,343.4 | | 4.78 | % | | $ | 12,290.1 | | 4.87 | % | | $ | 10,881.8 | | 4.84 | % |
Personal loan origination volume for our standard loan program by loan grade was as follows (in millions):
| | | | | | | | | | | | | | | | | | | | | | | | | | |
| Year Ended December 31, | 2020 | | 2019 | | 2018 |
| Personal loan originations by loan grade – standard loan program: | Amount | % of Total | | Amount | % of Total | | Amount | % of Total |
| A | $ | 1,263.6 | | 42 | % | | $ | 2,725.4 | | 32 | % | | $ | 2,132.5 | | 27 | % |
| B | 916.2 | | 30 | % | | 2,608.3 | | 31 | % | | 2,289.6 | | 29 | % |
| C | 575.4 | | 19 | % | | 1,964.6 | | 23 | % | | 2,052.2 | | 26 | % |
| D | 252.1 | | 9 | % | | 1,184.9 | | 14 | % | | 1,098.3 | | 14 | % |
| E | — | | — | % | | 50.0 | | — | % | | 290.1 | | 3 | % |
| F | — | | — | % | | 0.2 | | — | % | | 60.4 | | 1 | % |
| G | — | | — | % | | — | | — | % | | 13.2 | | N/M |
| Total | $ | 3,007.3 | | 100 | % | | $ | 8,533.4 | | 100 | % | | $ | 7,936.3 | | 100 | % |
N/M – Not meaningfulFinancial Highlights
CreditWe regularly review several metrics to evaluate our business, measure our performance, identify trends, formulate financial projections and pricing policy changes made bymake strategic decisions. The following presents our select financial metrics for the Company during 2019 and into 2020 resulted in a change in the mix of personal loan origination volume from higher risk grades D through F to lower risk A through C grades. These changes broadly focused on tightening credit to shift overall platform mix towards lower risk and higher credit quality borrowers.
LENDINGCLUB CORPORATION
Management’s Discussion and Analysis of Financial Condition and Results of Operations
(Tabular Amounts in Thousands, Except Share and Per Share Data and Ratios, or as Noted)
| | | | | | | | | | | | | | | | | |
| As Of and For The Year Ended December 31, | 2023 | | 2022 | | 2021 |
| Non-interest income | $ | 302,781 | | | $ | 712,391 | | | $ | 605,799 | |
| Net interest income | 561,838 | | | 474,825 | | | 212,831 | |
| Total net revenue | 864,619 | | | 1,187,216 | | | 818,630 | |
| Non-interest expense | 566,437 | | | 766,853 | | | 661,386 | |
Pre-provision net revenue (1) | 298,182 | | | 420,363 | | | 157,244 | |
| Provision for credit losses | 243,565 | | | 267,326 | | | 138,800 | |
| Income before income tax benefit (expense) | 54,617 | | | 153,037 | | | 18,444 | |
| Income tax benefit (expense) | (15,678) | | | 136,648 | | | 136 | |
| Net income | $ | 38,939 | | | $ | 289,685 | | | $ | 18,580 | |
| Income tax benefit from release of tax valuation allowance | — | | | 143,495 | | | — | |
Net income excluding income tax benefit (1)(2) | $ | 38,939 | | | $ | 146,190 | | | $ | 18,580 | |
| | | | | |
| Basic EPS – common stockholders | $ | 0.36 | | | $ | 2.80 | | | $ | 0.19 | |
| Diluted EPS – common stockholders | $ | 0.36 | | | $ | 2.79 | | | $ | 0.18 | |
| | | | | |
Diluted EPS excluding income tax benefit (1)(2) | $ | 0.36 | | | $ | 1.41 | | | $ | 0.18 | |
| | | | | |
| LendingClub Corporation Performance Metrics: | |
| Net interest margin | 7.0 | % | | 8.2 | % | | 5.6 | % |
Efficiency ratio (3) | 65.5 | % | | 64.6 | % | | 80.8 | % |
| Return on average equity (ROE) | 3.2 | % | | 28.4 | % | | 2.4 | % |
| Return on average total assets (ROA) | 0.5 | % | | 4.7 | % | | 0.4 | % |
| Marketing as a % of loan originations | 1.3 | % | | 1.5 | % | | 1.5 | % |
| | | | | |
| LendingClub Corporation Capital Metrics: | | | | | |
| Common equity tier 1 capital ratio | 17.9 | % | | 15.8 | % | | 21.3 | % |
| Tier 1 leverage ratio | 12.9 | % | | 14.1 | % | | 16.5 | % |
| Book value per common share | $ | 11.34 | | | $ | 10.93 | | | $ | 8.41 | |
Tangible book value per common share (1) | $ | 10.54 | | | $ | 10.06 | | | $ | 7.46 | |
| | | | | |
Loan Originations (in millions) (4): | | | | | |
| Marketplace loans | $ | 5,253 | | | $ | 9,389 | | | $ | 8,099 | |
| Loan originations held for investment | 2,184 | | | 3,731 | | | 2,282 | |
| Total loan originations | $ | 7,437 | | | $ | 13,121 | | | $ | 10,381 | |
| Loan originations held for investment as a % of total loan originations | 29 | % | | 28 | % | | 22 | % |
| | | | | |
Servicing Portfolio AUM (in millions) (5): | | | | | |
| Total servicing portfolio | $ | 14,122 | | | $ | 16,157 | | | $ | 12,463 | |
| Loans serviced for others | $ | 9,336 | | | $ | 10,819 | | | $ | 10,124 | |
(1) Represents a non-GAAP financial measure. See “Non-GAAP Financial Measures” for additional information.
(2) The year ended December 31, 2022 excludes an income tax benefit of $143.5 million due to the release of our deferred tax asset valuation allowance.
(3) Calculated as the ratio of non-interest expense to total net revenue.
(4) Includes unsecured personal loans and auto loans only.
(5) Assets under management (AUM) reflects loans serviced on our platform, which includes outstanding balances of unsecured personal loans, auto refinance loans and education and patient finance loans serviced for others and retained for investment by the Company.
LENDINGCLUB CORPORATION
Management’s Discussion and Analysis of Financial Condition and Results of Operations
(Tabular Amounts in Thousands, Except Share and Per Share Data and Ratios, or as Noted)
| | | | | | | | | | | | | | | |
| As of December 31, | 2023 | | 2022 | | | | |
| | | | | | | |
| | | | | | | |
| | | | | | | |
| | | | | | | |
| | | | | | | |
| | | | | | | |
| | | | | | | |
| | | | | | | |
| | | | | | | |
| | | | | | | |
| | | | | | | |
| | | | | | | |
| | | | | | | |
| | | | | | | |
| | | | | | | |
| | | | | | | |
| | | | | | | |
| | | | | | | |
| Balance Sheet Data: | | | | | | | |
| Securities available for sale | $ | 1,620,262 | | | $ | 345,702 | | | | | |
| Loans held for sale at fair value | $ | 407,773 | | | $ | 110,400 | | | | | |
| Loans and leases held for investment at amortized cost, net, excluding PPP loans | $ | 4,533,523 | | | $ | 4,638,331 | | | | | |
| PPP loans | $ | 6,392 | | | $ | 66,971 | | | | | |
Total loans and leases held for investment at amortized cost, net (1) | $ | 4,539,915 | | | $ | 4,705,302 | | | | | |
| Loans held for investment at fair value | $ | 262,190 | | | $ | 925,938 | | | | | |
| Total loans and leases held for investment | $ | 4,802,105 | | | $ | 5,631,240 | | | | | |
| Total assets | $ | 8,827,463 | | | $ | 7,979,747 | | | | | |
| Total deposits | $ | 7,333,486 | | | $ | 6,392,553 | | | | | |
| Total liabilities | $ | 7,575,641 | | | $ | 6,815,453 | | | | | |
| Total equity | $ | 1,251,822 | | | $ | 1,164,294 | | | | | |
| | | | | | | |
Allowance Ratios (1): | | | | | | | |
| ALLL to total loans and leases held for investment | 6.4 | % | | 6.5 | % | | | | |
| | | | | | | |
| ALLL to consumer loans and leases held for investment | 7.2 | % | | 7.3 | % | | | | |
| ALLL to commercial loans and leases held for investment | 1.8 | % | | 2.0 | % | | | | |
| | | | | | | |
| Net charge-offs | $ | 261,035 | | | $ | 83,216 | | | | | |
Net charge-off ratio (2) | 5.0 | % | | 2.1 | % | | | | |
| | | | | | | |
| | | | | | | |
| | | | | | | |
| | | | | | | |
| | | | | | | |
| | | | | | | |
| | | | | | | |
| | | | | | | |
| | | | | | | |
(1) Excludes loans held for investment at fair value, which primarily consists of a loan portfolio that was acquired at the end of 2022.
(2) Calculated as net charge-offs divided by average outstanding loans and leases HFI at amortized cost during the period, excluding PPP loans.
Results of Operations
This section of this Form 10-K generally discusses 20202023 and 2019 items and year-to-year comparisons between 2020 and 2019. For discussion related to 20182022 items and year-over-year comparisons between 20192023 and 2018,2022. For discussion related to 2021 items and year-over-year comparisons between 2022 and 2021, see “Part II – Item 7. Management’s Discussion and Analysis of Financial Condition and Results of Operations” in the Annual Report on Form 10-K for the year ended December 31, 2019.2022.
The following table sets forth the Consolidated Statements of Operations data for each of the periods presented:
| | | | | | | | | | | | | | | | | |
| Year Ended December 31, | 2020 | | 2019 | | 2018 |
| Net revenue: | | | | | |
| | | | | |
| Transaction fees | $ | 207,640 | | | $ | 598,760 | | | $ | 526,942 | |
| | | | | |
| Interest income | 209,694 | | | 345,345 | | | 487,462 | |
| Interest expense | (141,503) | | | (246,587) | | | (385,605) | |
| Net fair value adjustments | (117,247) | | | (144,990) | | | (100,688) | |
| Net interest income and fair value adjustments | (49,056) | | | (46,232) | | | 1,169 | |
| Investor fees | 111,864 | | | 124,532 | | | 114,883 | |
| Gain on sales of loans | 30,812 | | | 67,716 | | | 45,979 | |
| Net investor revenue | 93,620 | | | 146,016 | | | 162,031 | |
| | | | | |
| Other revenue | 13,442 | | | 13,831 | | | 5,839 | |
| | | | | |
| Total net revenue | 314,702 | | | 758,607 | | | 694,812 | |
Operating expenses: (1) | | | | | |
| Sales and marketing | 79,055 | | | 279,423 | | | 268,517 | |
| Origination and servicing | 71,193 | | | 103,403 | | | 99,376 | |
| Engineering and product development | 139,050 | | | 168,380 | | | 155,255 | |
| Other general and administrative | 213,021 | | | 238,292 | | | 228,641 | |
| | | | | |
| Goodwill impairment | — | | | — | | | 35,633 | |
| Class action and regulatory litigation expense | — | | | — | | | 35,500 | |
| Total operating expenses | 502,319 | | | 789,498 | | | 822,922 | |
| Loss before income tax expense (benefit) | (187,617) | | | (30,891) | | | (128,110) | |
| Income tax expense (benefit) | (79) | | | (201) | | | 43 | |
| Consolidated net loss | (187,538) | | | (30,690) | | | (128,153) | |
| Less: Income attributable to noncontrolling interests | — | | | 55 | | | 155 | |
| LendingClub net loss | $ | (187,538) | | | $ | (30,745) | | | $ | (128,308) | |
(1) Includes stock-based compensation expense as follows:
| | | | | | | | | | | | | | | | | |
| Year Ended December 31, | 2020 | | 2019 | | 2018 |
| Sales and marketing | $ | 4,104 | | | $ | 6,095 | | | $ | 7,362 | |
| Origination and servicing | 2,689 | | | 3,155 | | | 4,322 | |
| Engineering and product development | 13,411 | | | 19,860 | | | 20,478 | |
| Other general and administrative | 41,329 | | | 44,529 | | | 42,925 | |
| Total stock-based compensation expense | $ | 61,533 | | | $ | 73,639 | | | $ | 75,087 | |
LENDINGCLUB CORPORATION
Management’s Discussion and Analysis of Financial Condition and Results of Operations
(Tabular Amounts in Thousands, Except Share and Per Share Data and Ratios, or as Noted)
Total Net Revenue
| | | | | | | | | | | | | | | | | | | | | | | |
| Year Ended December 31, | 2020 | | 2019 | | Change ($) | | Change (%) |
| Net revenue: | | | | | | | |
| | | | | | | |
| Transaction fees | $ | 207,640 | | | $ | 598,760 | | | $ | (391,120) | | | (65) | % |
| | | | | | | |
| Interest income | 209,694 | | | 345,345 | | | (135,651) | | | (39) | % |
| Interest expense | (141,503) | | | (246,587) | | | 105,084 | | | (43) | % |
| Net fair value adjustments | (117,247) | | | (144,990) | | | 27,743 | | | (19) | % |
| Net interest income and fair value adjustments | (49,056) | | | (46,232) | | | (2,824) | | | (6) | % |
| Investor fees | 111,864 | | | 124,532 | | | (12,668) | | | (10) | % |
| Gain on sales of loans | 30,812 | | | 67,716 | | | (36,904) | | | (54) | % |
| Net investor revenue | 93,620 | | | 146,016 | | | (52,396) | | | (36) | % |
| | | | | | | |
| Other revenue | 13,442 | | | 13,831 | | | (389) | | | (3) | % |
| | | | | | | |
| Total net revenue | $ | 314,702 | | | $ | 758,607 | | | $ | (443,905) | | | (59) | % |
| | | | | | | | | | | | | | | | | | | | | | | |
| Year Ended December 31, | 2019 | | 2018 | | Change ($) | | Change (%) |
| Net revenue: | | | | | | | |
| | | | | | | |
| Transaction fees | $ | 598,760 | | | $ | 526,942 | | | $ | 71,818 | | | 14 | % |
| | | | | | | |
| Interest income | 345,345 | | | 487,462 | | | (142,117) | | | (29) | % |
| Interest expense | (246,587) | | | (385,605) | | | 139,018 | | | (36) | % |
| Net fair value adjustments | (144,990) | | | (100,688) | | | (44,302) | | | 44 | % |
| Net interest income and fair value adjustments | (46,232) | | | 1,169 | | | (47,401) | | | N/M |
| Investor fees | 124,532 | | | 114,883 | | | 9,649 | | | 8 | % |
| Gain on sales of loans | 67,716 | | | 45,979 | | | 21,737 | | | 47 | % |
| Net investor revenue | 146,016 | | | 162,031 | | | (16,015) | | | (10) | % |
| | | | | | | |
| Other revenue | 13,831 | | | 5,839 | | | 7,992 | | | 137 | % |
| | | | | | | |
| Total net revenue | $ | 758,607 | | | $ | 694,812 | | | $ | 63,795 | | | 9 | % |
N/M – Not meaningful
Transaction Fees
Transaction fees are fees paid by issuing banks or education and patient service providers to us for the work we performed in facilitating the origination of loans by our issuing bank partners. With respect to all unsecured personal loans and auto refinance loans for which WebBank acted as the issuing bank, we recorded transaction fee revenue net of program fees paid to WebBank. The fees on these loans are based upon the terms of the loan, including grade, rate, term, channel and other factors. As of December 31, 2020, these fees ranged from 0% to 6% of the initial principal amount of a loan. In connection with the acquisition of Radius, the Bank originates loans and the origination fee paid by borrowers is provided directly to, and retained by, us.
Transaction fees were $207.6 million and $598.8 million for the years ended December 31, 2020 and 2019, respectively, a decrease of 65%. The decrease was due to lower origination volume, primarily due to the impact of
LENDINGCLUB CORPORATION
Management’s Discussion and Analysis of Financial Condition and Results of Operations
(Tabular Amounts in Thousands, Except Share and Per Share Data and Ratios, or as Noted)
COVID-19. Loans facilitated through our lending marketplace decreased to $4.3 billion for the year ended December 31, 2020 compared to $12.3 billion for the year ended December 31, 2019, a decrease of 65%. The average transaction fee as a percentage of the initial principal balance of the loan was 4.78% in 2020 compared to 4.87% in 2019.
In January 2021, we recognized approximately $1.8 million in transaction fee revenue associated with the issuance of loans for which the loan application process had commenced prior to the end of 2020. In January 2020, we recognized approximately $3.6 million in transaction fee revenue associated with the issuance of loans for which the loan application process had commenced prior to the end of 2019.
Net Interest Income and Fair Value Adjustments
Loans Invested in by the Company: In light of COVID-19 and our acquisition of Radius, the Company ceased purchasing loans to support Structured Program transactions. We earn interest income and assume principal and interest rate risk on loans during the period we own the loans. We previously financed a portion of loan purchases with draws on our credit facilities and the associated interest expense reduced net interest income. In the fourth quarter of 2020, we fully repaid and terminated our credit facilities.
Fair value adjustments on loans invested in by the Company are generally negative due to interest cash flow receipts and if there are expected increases and any acceleration in the timing of expected charge-offs and prepayments. As the portfolio of loans invested in by the Company prior to the acquisition of Radius runs off, the Company expects the net negative fair value adjustments on those loans to decrease over the remaining holding period of those loans, absent any significant market price volatility.
Loans, Notes, Certificates and Secured Borrowings: We do not assume principal or interest rate risk on loans facilitated through our lending marketplace that were funded by notes, certificates and certain secured borrowings because loan balances, interest rates and maturities are matched and offset by an equal balance of notes, certificates or secured borrowings with the exact same interest rates and maturities. The changes in fair value of loans, notes, certificates and secured borrowings are shown on our Consolidated Statements of Operations on a net basis. Due to the payment dependent feature of the notes, certificates and secured borrowings, fair value adjustments on loans funded with notes, certificates and secured borrowings resulted in no net effect on our earnings, except for changes in fair value of any applicable credit support agreements related to secured borrowings.
LENDINGCLUB CORPORATION
Management’s Discussion and Analysis of Financial Condition and Results of Operations
(Tabular Amounts in Thousands, Except Share and Per Share Data and Ratios, or as Noted)
The following tables provide additional detail related to net interest income and fair value adjustments for assets invested in by the Company, assets with equal and offsetting liabilities, and total interest income, interest expense and net fair value adjustments:
| | | | | | | | | | | | | | | | | | | | | | | |
| Year Ended December 31, | 2020 | | 2019 | | Change ($) | | Change (%) |
| Loans invested in by the Company, securities available for sale, cash, cash equivalents and restricted cash, and debt: |
| Interest income: | | | | | | | |
| Loans held for investment and held for sale by the Company at fair value | $ | 80,564 | | | $ | 110,597 | | | $ | (30,033) | | | (27) | % |
| Securities available for sale | 12,125 | | | 14,351 | | | (2,226) | | | (16) | % |
| Cash, cash equivalents and restricted cash | 1,053 | | | 6,002 | | | (4,949) | | | (82) | % |
| Total | 93,742 | | | 130,950 | | | (37,208) | | | (28) | % |
| Interest expense: | | | | | | | |
| Credit facilities and securities sold under repurchase agreements | (18,210) | | | (27,839) | | | 9,629 | | | (35) | % |
| Securitization notes and certificates | (7,341) | | | (4,353) | | | (2,988) | | | 69 | % |
| Total | (25,551) | | | (32,192) | | | 6,641 | | | (21) | % |
| Net interest income | 68,191 | | | 98,758 | | | $ | (30,567) | | | (31) | % |
| Net fair value adjustments | (117,247) | | | (144,990) | | | 27,743 | | | (19) | % |
| Net interest income and fair value adjustments | $ | (49,056) | | | $ | (46,232) | | | $ | (2,824) | | | 6 | % |
| | | | | | | |
| Loans, notes, certificates and secured borrowings: |
| Interest income: | | | | | | | |
| Loans held for investment at fair value | $ | 115,952 | | | $ | 214,395 | | | $ | (98,443) | | | (46) | % |
| Interest expense: | | | | | | | |
| Notes, certificates and secured borrowings | (115,952) | | | (214,395) | | | 98,443 | | | (46) | % |
| Net interest income | $ | — | | | $ | — | | | $ | — | | | — | % |
| | | | | | | |
| Total net interest income and fair value adjustments: |
| Interest income | $ | 209,694 | | | $ | 345,345 | | | $ | (135,651) | | | (39) | % |
| Interest expense | (141,503) | | | (246,587) | | | 105,084 | | | (43) | % |
| Net fair value adjustments | (117,247) | | | (144,990) | | | 27,743 | | | (19) | % |
| Net interest income and fair value adjustments | $ | (49,056) | | | $ | (46,232) | | | $ | (2,824) | | | 6 | % |
|
| | | | | | | |
| | | | | | | |
| | | | | | | |
| | | | | | | |
| | | | | | | |
| | | | | | | |
LENDINGCLUB CORPORATION
Management’s Discussion and Analysis of Financial Condition and Results of Operations
(Tabular Amounts in Thousands, Except Share and Per Share Data and Ratios, or as Noted)
| | | | | | | | | | | | | | | | | | | | | | | |
| Year Ended December 31, | 2019 | | 2018 | | Change ($) | | Change (%) |
| Loans invested in by the Company, securities available for sale, cash, cash equivalents and restricted cash, and debt: |
| Interest income: | | | | | | | |
| Loans held for investment and held for sale by the Company at fair value | $ | 110,597 | | | $ | 113,644 | | | $ | (3,047) | | | (3) | % |
| Securities available for sale | 14,351 | | | 7,602 | | | 6,749 | | | 89 | % |
| Cash, cash equivalents and restricted cash | 6,002 | | | 4,056 | | | 1,946 | | | 48 | % |
| Total | 130,950 | | | 125,302 | | | 5,648 | | | 5 | % |
| Interest expense: | | | | | | | |
| Credit facilities and securities sold under repurchase agreements | (27,839) | | | (19,714) | | | (8,125) | | | 41 | % |
| Securitization notes and certificates | (4,353) | | | (3,731) | | | (622) | | | 17 | % |
| Total | (32,192) | | | (23,445) | | | (8,747) | | | 37 | % |
| Net interest income | 98,758 | | | 101,857 | | | $ | (3,099) | | | (3) | % |
| Net fair value adjustments | (144,990) | | | (100,688) | | | (44,302) | | | 44 | % |
| Net interest income and fair value adjustments | $ | (46,232) | | | $ | 1,169 | | | $ | (47,401) | | | N/M |
| | | | | | | |
| Loans, notes, certificates and secured borrowings: |
| Interest income: | | | | | | | |
| Loans held for investment at fair value | $ | 214,395 | | | $ | 362,160 | | | $ | (147,765) | | | (41) | % |
| Interest expense: | | | | | | | |
| Notes, certificates and secured borrowings | (214,395) | | | (362,160) | | | 147,765 | | | (41) | % |
| Net interest income | $ | — | | | $ | — | | | $ | — | | | — | % |
| | | | | | | |
| Total net interest income and fair value adjustments: |
| Interest income | $ | 345,345 | | | $ | 487,462 | | | $ | (142,117) | | | (29) | % |
| Interest expense | (246,587) | | | (385,605) | | | 139,018 | | | (36) | % |
| Net fair value adjustments | (144,990) | | | (100,688) | | | (44,302) | | | 44 | % |
| Net interest income and fair value adjustments | $ | (46,232) | | | $ | 1,169 | | | $ | (47,401) | | | N/M |
|
| | | | | | | |
| | | | | | | |
| | | | | | | |
| | | | | | | |
| | | | | | | |
| | | | | | | |
N/M – Not meaningful
The following tables provide the outstanding average balances, which are key drivers of interest income and interest expense in the periods presented:
| | | | | | | | | | | | | | | | | | | | | | | |
| Outstanding Average Balances |
| Year Ended December 31, | 2020 | | 2019 | | Change ($) | | Change (%) |
| Cash, cash equivalents and restricted cash | $ | 509,839 | | | $ | 508,962 | | | $ | 877 | | | — | % |
| Loans held for investment by the Company | $ | 68,055 | | | $ | 12,474 | | | $ | 55,581 | | | N/M |
| Loans held for sale by the Company | $ | 537,105 | | | $ | 754,693 | | | $ | (217,588) | | | (29) | % |
| Securities available for sale | $ | 217,189 | | | $ | 221,166 | | | $ | (3,977) | | | (2) | % |
| Credit facilities and securities sold under repurchase agreements | $ | 394,782 | | | $ | 481,960 | | | $ | (87,178) | | | (18) | % |
| Securitization notes and certificates | $ | 162,688 | | | $ | 100,747 | | | $ | 61,941 | | | 61 | % |
| Loans held for investment | $ | 879,223 | | | $ | 1,574,271 | | | $ | (695,048) | | | (44) | % |
| Notes, certificates and secured borrowings | $ | 879,236 | | | $ | 1,576,877 | | | $ | (697,641) | | | (44) | % |
N/M – Not meaningful
LENDINGCLUB CORPORATION
Management’s Discussion and Analysis of Financial Condition and Results of Operations
(Tabular Amounts in Thousands, Except Share and Per Share Data and Ratios, or as Noted)
| | | | | | | | | | | | | | | | | | | | | | | |
| Outstanding Average Balances |
| Year Ended December 31, | 2019 | | 2018 | | Change ($) | | Change (%) |
| Cash, cash equivalents and restricted cash | $ | 508,962 | | | $ | 599,832 | | | $ | (90,870) | | | (15) | % |
| Loans held for investment by the Company | $ | 12,474 | | | $ | 140,551 | | | $ | (128,077) | | | (91) | % |
| Loans held for sale by the Company | $ | 754,693 | | | $ | 546,959 | | | $ | 207,734 | | | 38 | % |
| Securities available for sale | $ | 221,166 | | | $ | 144,046 | | | $ | 77,120 | | | 54 | % |
| Credit facilities and securities sold under repurchase agreements | $ | 481,960 | | | $ | 299,419 | | | $ | 182,541 | | | 61 | % |
| Securitization notes and certificates | $ | 100,747 | | | $ | 131,894 | | | $ | (31,147) | | | (24) | % |
| Loans held for investment | $ | 1,574,271 | | | $ | 2,557,575 | | | $ | (983,304) | | | (38) | % |
| Notes, certificates and secured borrowings | $ | 1,576,877 | | | $ | 2,599,676 | | | $ | (1,022,799) | | | (39) | % |
Interest income associated with loans invested in by the Company, securities available for sale, and cash, cash equivalents and restricted cash was $93.7 million and $131.0 million for the years ended December 31, 2020 and 2019, respectively, a decrease of 28%. The decrease was primarily due to a decrease in the average outstanding balance of loans invested in by the Company and a decrease in interest rates for cash and cash equivalents.
Interest expense associated with credit facilities, securities sold under repurchase agreements and securitization notes and certificates was $25.6 million and $32.2 million for the years ended December 31, 2020 and 2019, respectively, a decrease of 21%. The decrease was primarily due to a reduction in interest rates and a decrease in the average outstanding balance of credit facilities and securities sold under repurchase agreements.
Net fair value adjustments were $(117.2) million and $(145.0) million for the years ended December 31, 2020 and 2019, respectively, a decrease of 19%. The decrease was primarily due to a decrease in loans purchased by the Company, partially offset by fair value adjustments recorded in the first quarter of 2020 due to COVID-19, which included an increase in estimated expected credit losses.
Interest income from loans held for investment and the offsetting interest expense from notes, certificates and secured borrowings were both $116.0 million and $214.4 million for the years ended December 31, 2020 and 2019, respectively, a decrease of 46%. The decrease was primarily due to a decrease in the average outstanding balances of loans held for investment and notes, certificates and secured borrowings.
LENDINGCLUB CORPORATION
Management’s Discussion and Analysis of Financial Condition and Results of Operations
(Tabular Amounts in Thousands, Except Share and Per Share Data and Ratios, or as Noted)
Investor Fees
The tables below illustrate the composition of investor fees and the outstanding principal balance of loans serviced, which is a key driver of investor fees, by the method in which the loans were financed for each period presented:
| | | | | | | | | | | | | | | | | | | | | | | |
| Year Ended December 31, | 2020 | | 2019 | | Change ($) | | Change (%) |
| Investors Fees: |
| Whole loans sold | $ | 96,518 | | | $ | 100,123 | | | $ | (3,605) | | | (4) | % |
| Notes, certificates and secured borrowings | 15,346 | | | 24,409 | | | (9,063) | | | (37) | % |
| Total | $ | 111,864 | | | $ | 124,532 | | | $ | (12,668) | | | (10) | % |
| | | | | | | |
Outstanding Principal Balance of Loans Serviced On Our Platform (in millions) (1): |
| Whole loans sold | $ | 10,139 | | | $ | 14,118 | | | $ | (3,979) | | | (28) | % |
| Notes, certificates and secured borrowings | 680 | | | 1,149 | | | (469) | | | (41) | % |
| Total excluding loans invested in by the Company | $ | 10,819 | | | $ | 15,267 | | | $ | (4,448) | | | (29) | % |
| Loans invested in by the Company | 183 | | | 744 | | | (561) | | | (75) | % |
| Total | $ | 11,002 | | | $ | 16,011 | | | $ | (5,009) | | | (31) | % |
(1) As of the end of each respective period.
| | | | | | | | | | | | | | | | | | | | | | | |
| Year Ended December 31, | 2019 | | 2018 | | Change ($) | | Change (%) |
| Investor Fees: | | | | | | | |
| Whole loans sold | $ | 100,123 | | | $ | 82,824 | | | $ | 17,299 | | | 21 | % |
| Notes, certificates and secured borrowings | 24,409 | | | 31,955 | | | (7,546) | | | (24) | % |
Funds and separately managed accounts (1) | — | | | 104 | | | (104) | | | (100) | % |
| Total | $ | 124,532 | | | $ | 114,883 | | | $ | 9,649 | | | 8 | % |
| | | | | | | |
Outstanding Principal Balance of Loans Serviced On Our Platform (in millions) (2): |
| Whole loans sold | $ | 14,118 | | | $ | 10,890 | | | $ | 3,228 | | | 30 | % |
| Notes, certificates and secured borrowings | 1,149 | | | 2,013 | | | (864) | | | (43) | % |
| Total excluding loans invested in by the Company | $ | 15,267 | | | $ | 12,903 | | | $ | 2,364 | | | 18 | % |
| Loans invested in by the Company | 744 | | | 843 | | | (99) | | | (12) | % |
| Total | $ | 16,011 | | | $ | 13,746 | | | $ | 2,265 | | | 16 | % |
(1) Funds are the private funds for which LendingClub Asset Management, LLC (LCAM, a previously held wholly-owned subsidiary of LendingClub), or its subsidiaries acted as general partner. In March 2019, we completed the dissolution of those funds.
(2) As of the end of each respective period.
The Company receives fees to compensate us for the costs we incur in servicing a loan, including managing payments from borrowers, collections, payments to investors, maintaining investors’ account portfolios, providing information, and issuing monthly statements. The amount of investor fee revenue earned is predominantly affected by the servicing rates paid by investors, the outstanding principal balance of loans and the amount of principal and interest collected from borrowers and remitted to investors.
LENDINGCLUB CORPORATION
Management’s Discussion and Analysis of Financial Condition and Results of Operations
(Tabular Amounts in Thousands, Except Share and Per Share Data and Ratios, or as Noted)
Investor fee revenue related to whole loans sold also includes the change in fair value of our servicing assets and liabilities associated with the loans. Servicing rights are recorded as either an asset or liability in “Gain on sales of loans” in the Company’s Consolidated Statements of Operations.
Investor fees – whole loans sold:Investor fee revenue related to the servicing of whole loans sold was $96.5 million and $100.1 million for the years ended December 31, 2020 and 2019, respectively, a decrease of 4%. The decrease in revenue resulting from a lower principal balance of loans serviced was substantially offset by an increase from higher average contractual servicing fees and delinquent loan collections.
Investor fees – notes, certificates and secured borrowings:Investor fee revenue related to the servicing of loans underlying notes, certificates and secured borrowings was $15.3 million and $24.4 million for the years ended December 31, 2020 and 2019, respectively, a decrease of 37%. The decrease was primarily due to a lower principal balance of loans serviced and a decrease in delinquent loan collections and charged-off loan sales.
Gain (Loss) on Sales of Loans
In connection with loan sales and Structured Program transactions, in addition to investor fees earned with respect to the corresponding loan, we recognize a gain or loss on the sale of that loan based on the level to which the contractual loan servicing fee is above or below an estimated market rate loan servicing fee. Additionally, we recognize transactions costs as a loss on sale of loans.
Gain on sales of loans was $30.8 million and $67.7 million for the years ended December 31, 2020 and 2019, respectively, a decrease of 54%. The decrease was due to a decrease in the volume of loans sold that resulted in lower gains on sales of loans.
Other Revenue
Other revenue primarily consists of sublease revenue from our sublet office space in San Francisco, California, and referral revenue that relates to fees earned from third-party companies when customers referred by us consider or purchase products or services from such third-party companies. The table below illustrates the composition of other revenue for each period presented:
| | | | | | | | | | | | | | | | | | | | | | | |
| Year Ended December 31, | 2020 | | 2019 | | Change ($) | | Change (%) |
| Sublease revenue | $ | 6,146 | | | $ | 4,637 | | | $ | 1,509 | | | 33 | % |
| Referral revenue | 5,011 | | | 5,474 | | | (463) | | | (8) | % |
| Other | 2,285 | | | 3,720 | | | (1,435) | | | (39) | % |
| Other revenue | $ | 13,442 | | | $ | 13,831 | | | $ | (389) | | | (3) | % |
| | | | | | | | | | | | | | | | | | | | | | | |
| Year Ended December 31, | 2019 | | 2018 | | Change ($) | | Change (%) |
| Sublease revenue | $ | 4,637 | | | $ | 397 | | | $ | 4,240 | | | N/M |
| Referral revenue | 5,474 | | | 3,645 | | | 1,829 | | | 50 | % |
| Other | 3,720 | | | 1,797 | | | 1,923 | | | 107 | % |
| Other revenue | $ | 13,831 | | | $ | 5,839 | | | $ | 7,992 | | | 137 | % |
N/M – Not meaningful
Operating Expenses
Our operating expenses consist of sales and marketing, origination and servicing, engineering and product development and other general and administrative expenses, as described below.
LENDINGCLUB CORPORATION
Management’s Discussion and Analysis of Financial Condition and Results of Operations
(Tabular Amounts in Thousands, Except Share and Per Share Data and Ratios, or as Noted)
Sales and Marketing: Sales and marketing expense consists primarily of borrower and investor acquisition efforts, including costs attributable to marketing and selling the loans facilitated through the platform we operate. This includes costs of building general brand awareness, and salaries, benefits and stock-based compensation expense related to our sales and marketing team.
Origination and Servicing: Origination and servicing expense consists primarily of salaries, benefits and stock-based compensation expense and vendor costs attributable to activities that most directly relate to facilitating the origination of loans and servicing loans for borrowers and investors. These costs relate to the credit, collections, customer support and payment processing teams and related vendors.
Engineering and Product Development: Engineering and product development expense consists primarily of salaries, benefits and stock-based compensation expense for our engineering and product management teams, information security and technology risk teams, and the cost of contractors who work on the development and maintenance of our platform. Engineering and product development expense also includes non-capitalized hardware and software costs and depreciation, amortization and impairment of technology assets.
Other General and Administrative: Other general and administrative expense consists primarily of salaries, benefits and stock-based compensation expense for our accounting, finance, legal, risk, compliance, human resources and facilities teams, professional services fees and facilities expense.
| | | | | | | | | | | | | | | | | | | | | | | |
| Year Ended December 31, | 2020 | | 2019 | | Change ($) | | Change (%) |
| Sales and marketing | $ | 79,055 | | | $ | 279,423 | | | $ | (200,368) | | | (72) | % |
| Origination and servicing | 71,193 | | | 103,403 | | | (32,210) | | | (31) | % |
| Engineering and product development | 139,050 | | | 168,380 | | | (29,330) | | | (17) | % |
| Other general and administrative | 213,021 | | | 238,292 | | | (25,271) | | | (11) | % |
| | | | | | | |
| Total operating expenses | $ | 502,319 | | | $ | 789,498 | | | $ | (287,179) | | | (36) | % |
| | | | | | | | | | | | | | | | | | | | | | | |
| Year Ended December 31, | 2019 | | 2018 | | Change ($) | | Change (%) |
| Sales and marketing | $ | 279,423 | | | $ | 268,517 | | | $ | 10,906 | | | 4 | % |
| Origination and servicing | 103,403 | | | 99,376 | | | 4,027 | | | 4 | % |
| Engineering and product development | 168,380 | | | 155,255 | | | 13,125 | | | 8 | % |
| Other general and administrative | 238,292 | | | 228,641 | | | 9,651 | | | 4 | % |
| Goodwill impairment | — | | | 35,633 | | | (35,633) | | | (100) | % |
| Class action and regulatory litigation expense | — | | | 35,500 | | | (35,500) | | | (100) | % |
| Total operating expenses | $ | 789,498 | | | $ | 822,922 | | | $ | (33,424) | | | (4) | % |
Sales and marketing: Sales and marketing expense was $79.1 million and $279.4 million for the years ended December 31, 2020 and 2019, respectively, a decrease of 72%. The decrease was primarily due to a decrease in variable marketing expenses based on lower origination volume and a decrease in personnel-related expenses for full-time employees due to lower headcount as a result of a workforce reduction in the second quarter of 2020. Sales and marketing expense as a percent of loan originations decreased to 1.82% in 2020 from 2.27% in 2019 as a result of a decrease in loan origination volume in our higher-cost marketing channels.
Origination and servicing: Origination and servicing expense was $71.2 million and $103.4 million for the years ended December 31, 2020 and 2019, respectively, a decrease of 31%. The decrease was primarily due to a decrease in personnel-related expenses for full-time employees due to lower headcount as a result of a workforce reduction in | | | | | | | | | | | | | | | | | |
| Year Ended December 31, | 2023 | | 2022 | | 2021 |
| Non-interest income: | | | | | |
| Marketplace revenue | $ | 291,484 | | | $ | 683,626 | | | $ | 578,580 | |
| Other non-interest income | 11,297 | | | 28,765 | | | 27,219 | |
| Total non-interest income | 302,781 | | | 712,391 | | | 605,799 | |
| | | | | |
| Interest income: | | | | | |
| Interest on loans held for sale | 35,655 | | | 26,183 | | | 29,540 | |
| Interest and fees on loans and leases held for investment | 616,735 | | | 465,450 | | | 188,977 | |
| Interest on loans held for investment at fair value | 69,866 | | | 12,877 | | | 4,436 | |
| Interest on retail and certificate loans held for investment at fair value | 4,222 | | | 18,135 | | | 57,684 | |
| Interest on securities available for sale | 40,235 | | | 16,116 | | | 11,025 | |
| Other interest income | 65,917 | | | 18,579 | | | 1,170 | |
| Total interest income | 832,630 | | | 557,340 | | | 292,832 | |
| | | | | |
| Interest expense: | | | | | |
| Interest on deposits | 265,556 | | | 60,451 | | | 7,228 | |
| Interest on retail notes and certificates | 4,222 | | | 18,135 | | | 57,684 | |
| Other interest expense | 1,014 | | | 3,929 | | | 15,089 | |
| Total interest expense | 270,792 | | | 82,515 | | | 80,001 | |
| | | | | |
| Net interest income | 561,838 | | | 474,825 | | | 212,831 | |
| | | | | |
| Total net revenue | 864,619 | | | 1,187,216 | | | 818,630 | |
| | | | | |
| Provision for credit losses | 243,565 | | | 267,326 | | | 138,800 | |
| | | | | |
| Non-interest expense: | | | | | |
| Compensation and benefits | 261,948 | | | 339,397 | | | 288,390 | |
| Marketing | 93,840 | | | 197,747 | | | 156,142 | |
| Equipment and software | 53,485 | | | 49,198 | | | 39,490 | |
| Depreciation and amortization | 47,195 | | | 43,831 | | | 44,285 | |
| Professional services | 35,173 | | | 50,516 | | | 47,572 | |
| Occupancy | 17,532 | | | 21,977 | | | 24,249 | |
| Other non-interest expense | 57,264 | | | 64,187 | | | 61,258 | |
| Total non-interest expense | 566,437 | | | 766,853 | | | 661,386 | |
| | | | | |
| Income before income tax benefit (expense) | 54,617 | | | 153,037 | | | 18,444 | |
| Income tax benefit (expense) | (15,678) | | | 136,648 | | | 136 | |
| Net income | $ | 38,939 | | | $ | 289,685 | | | $ | 18,580 | |
LENDINGCLUB CORPORATION
Management’s Discussion and Analysis of Financial Condition and Results of Operations
(Tabular Amounts in Thousands, Except Share and Per Share Data and Ratios, or as Noted)
the second quarter of 2020, reduction in outsourced workforce in the second half of 2020, and lower third-party origination credit expenses as a result of lower origination volume.Marketplace Revenue
Marketplace revenue consists of the following:
| | | | | | | | | | | | | | | | | | | | | | | | | |
| Year Ended December 31, | 2023 | | 2022 | | | | Change ($) | | Change (%) |
| Origination fees | $ | 279,146 | | | $ | 499,179 | | | | | $ | (220,033) | | | (44) | % |
| Servicing fees | 98,613 | | | 80,609 | | | | | 18,004 | | | 22 | % |
| Gain on sales of loans | 47,839 | | | 95,335 | | | | | (47,496) | | | (50) | % |
| Net fair value adjustments | (134,114) | | | 8,503 | | | | | (142,617) | | | N/M |
| Total marketplace revenue | $ | 291,484 | | | $ | 683,626 | | | | | $ | (392,142) | | | (57) | % |
| | | | | | | | | | | | | | | | | | | | | | | | | |
| Year Ended December 31, | 2022 | | 2021 | | | | Change ($) | | Change (%) |
| Origination fees | $ | 499,179 | | | $ | 416,839 | | | | | $ | 82,340 | | | 20 | % |
| Servicing fees | 80,609 | | | 87,639 | | | | | (7,030) | | | (8) | % |
| Gain on sales of loans | 95,335 | | | 70,116 | | | | | 25,219 | | | 36 | % |
| Net fair value adjustments | 8,503 | | | 3,986 | | | | | 4,517 | | | 113 | % |
| Total marketplace revenue | $ | 683,626 | | | $ | 578,580 | | | | | $ | 105,046 | | | 18 | % |
Engineering
We elected to account for HFS loans under the fair value option. With the election of the fair value option, origination fees, net fair value adjustments prior to sale of the loans, and product development: servicing asset gains on the sales of the loans, are reported as separate components of “Marketplace revenue.”
Origination Fees
Origination fees recorded as a component of marketplace revenue are primarily fees earned related to originating and issuing unsecured personal loans that are held for sale.
The following table presents loan origination volume during each of the periods set forth below:
| | | | | | | | | | | | | | | | | | | | | | | | | | | | | |
| Year Ended December 31, | 2023 | | 2022 | | 2021 | | 2023 vs. 2022 Change (%) | | 2022 vs. 2021 Change (%) |
| Marketplace loans | $ | 5,252,668 | | | $ | 9,389,445 | | | $ | 8,099,109 | | | (44) | % | | 16 | % |
| Loan originations held for investment | 2,184,095 | | | 3,731,057 | | | 2,282,206 | | | (41) | % | | 63 | % |
Total loan originations (1) | $ | 7,436,763 | | | $ | 13,120,502 | | | $ | 10,381,315 | | | (43) | % | | 26 | % |
(1)Engineering Includes unsecured personal loans and product development expense was $139.1auto loans only.
Origination fees were $279.1 million and $168.4$499.2 million for the years ended December 31, 20202023 and 2019,2022, respectively, a decrease of 17%44%. The decrease was primarily due to a decrease in personnel-related expenses for full-time employees due to lower headcount as a resultorigination volume of a workforce reduction in the second quartermarketplace loans. Loan origination volume of 2020 and lower depreciation expense, partially offset by an increase in restructuring costs relatingmarketplace loans decreased to the workforce reduction.
We capitalized $28.2 million and $36.1 million in software development costs for the years ended December 31, 2020 and 2019, respectively.
Other general and administrative expense: Other general and administrative expense was $213.0 million and $238.3 million for the years ended December 31, 2020 and 2019, respectively, a decrease of 11%. The decrease was primarily due to decreases in personnel-related expenses for full-time employees due to lower headcount as a result of a workforce reduction in the second quarter of 2020 and lower professional services and facilities expense, partially offset by increases in expenses related to the acquisition of Radius and restructuring costs related to the workforce reduction.
Income Taxes
For the years ended December 31, 2020 and 2019, the Company recorded an income tax benefit of $79 thousand and $201 thousand, respectively. Income tax benefit$5.3 billion for the year ended December 31, 2020 was primarily attributable2023 compared to current state income taxes. Income tax benefit$9.4 billion for the year ended December 31, 2019 was primarily attributablesame period in 2022, a decrease of 44%, resulting from lower investor demand due to the tax effects of other comprehensive income associated with the Company’s available for sale portfolio.rising interest rate environment.
On March 27, 2020, the Coronavirus Aid, Relief, and Economic Security Act (CARES Act) was signed into law to provide certain relief as a result of COVID-19. As of December 31, 2020, the Company has determined that neither the CARES Act nor changes to income tax laws or regulations in other jurisdictions have a significant impact on our effective tax rate. On December 27, 2020, the Consolidated Appropriations Act, 2021 was signed into law and extends several provisions of the CARES Act.As of December 31, 2020, the Company has determined that neither this Act nor changes to income tax laws or regulations in other jurisdictions have a significant impact on our effective tax rate.Servicing Fees
We continuereceive servicing fees to recognize a full valuation allowance against net deferred tax assets. This determination was basedcompensate us for servicing loans on behalf of investors, including managing payments from borrowers, collections and payments to those investors. Servicing fee revenue related to loans sold also includes the assessmentchange in fair value of servicing assets associated with the available positive and negative evidence to estimate if sufficient future taxable income will be generated to utilize the existing deferred tax assets. We intend to continue maintaining a full valuation allowance on our deferred tax assets until there is sufficient evidence to support the reversal of all or some portion of these allowances.
Non-GAAP Financial Measures and Supplemental Financial Information
We use certain non-GAAP financial measures in evaluating our operating results. We believe that Contribution, Contribution Margin, Adjusted Net Income (Loss), Adjusted EBITDA, Adjusted EBITDA Margin, Adjusted Earnings (Loss) Per Share (Adjusted EPS) and Net Cash and Other Financial Assets help identify trends in our core business results and allow for greater transparency with respect to key metrics used by our management in its decision making.loans.
LENDINGCLUB CORPORATION
Management’s Discussion and Analysis of Financial Condition and Results of Operations
(Tabular Amounts in Thousands, Except Share and Per Share Data and Ratios, or as Noted)
Our non-GAAP measures have limitationsThe table below illustrates AUM serviced on our platform by the method in which the loans were financed as analytical toolsof the periods presented. Loans sold and you should not consider them in isolation. These non-GAAP measures should not be viewed as substitutes for, or superior to, net income (loss) as prepared in accordance with GAAP. In evaluating these non-GAAP measures, you should be aware that insubsequently serviced on behalf of the future we will incur expenses similar to the adjustments in this presentation. There are a number of limitations related to the use of these non-GAAP financial measures versus their most directly comparable GAAP measures, which include the following:
•Other companies, including companies in our industry, may calculate these measures differently, which may reduce their usefulness as a comparative measure.
•Although depreciation, impairment and amortization are non-cash charges, the assets being depreciated, impaired and amortized may have to be replaced in the future and Adjusted EBITDA and Adjusted EBITDA Margin do not reflect cash capital expenditure requirements for such replacements or for new capital expenditure requirements.
•These measures do not reflect tax payments that mayinvestor represent a reduction in cash available to us.key driver of our servicing fee revenue.
| | | | | | | | | | | | | | | | | | | | | | | | | |
| As of December 31, | 2023 | | 2022 | | Change ($) | | | | Change (%) |
AUM (in millions): |
| Loans sold | $ | 9,336 | | | $ | 10,819 | | | $ | (1,483) | | | | | (14) | % |
| Loans held by LendingClub Bank | 4,767 | | | 5,263 | | | (496) | | | | | (9) | % |
| Retail notes and certificates | 11 | | | 59 | | | (48) | | | | | (81) | % |
| Other loans invested in by the Company | 8 | | | 16 | | | (8) | | | | | (50) | % |
| Total | $ | 14,122 | | | $ | 16,157 | | | $ | (2,035) | | | | | (13) | % |
| | | | | | | | | | | | | | | | | | | | | | | | | |
| As of December 31, | 2022 | | 2021 | | Change ($) | | | | Change (%) |
AUM (in millions): |
| Loans sold | $ | 10,819 | | | $ | 10,124 | | | $ | 695 | | | | | 7 | % |
| Loans held by LendingClub Bank | 5,263 | | | 2,026 | | | 3,237 | | | | | 160 | % |
| Retail notes and certificates | 59 | | | 238 | | | (179) | | | | | (75) | % |
| Other loans invested in by the Company | 16 | | | 75 | | | (59) | | | | | (79) | % |
| Total | $ | 16,157 | | | $ | 12,463 | | | $ | 3,694 | | | | | 30 | % |
ContributionIn addition to the loans serviced on our marketplace platform, we serviced $133.2 million, $167.0 million and Contribution Margin$214.0 million in outstanding principal balance of commercial loans sold as of December 31, 2023, 2022 and 2021, respectively.
Contribution isServicing fees were $98.6 million and $80.6 million for the years ended December 31, 2023 and 2022, respectively, an increase of 22%. This was primarily due to a non-GAAP financial measure that is calculated as net revenue less “Sales and marketing” and “Origination and servicing” expenses on the Company’s Consolidated Statements of Operations, adjusted to exclude cost structure simplification, restructuring costs, other items (related to one-time expenses resulting from COVID-19) and non-cash stock-based compensation expenses within these captions and income or loss attributable to noncontrolling interests. These costs represent the costs that are most directlybenefit related to generating such revenue. The adjustment for cost structure simplification expense relates to a review of our cost structurerecouping volume-based purchase incentives and a number of expense initiatives underway, including the establishment of a sitean increase in the Salt Lake City area. The expense includes incremental and excess personnel-related expenses associated with establishing our Salt Lake City area site and external advisory fees. The adjustmentfair value of the servicing asset based on higher expected servicing fee revenue, partially offset by a decrease in loan balances serviced for restructuring costs included severance and other personnel-related expenses, lease-related expenses and software impairment related to the impact of COVID-19 on the Company’s business. Contribution margin is a non-GAAP financial measure calculated by dividing Contribution by total net revenue.others.
ContributionGain on Sales of Loans
In connection with loan sales, we recognize a gain or loss on the sale of loans based on the level to which the contractual servicing fee is above or below an estimated market rate of servicing at the time of sale. Additionally, we recognize transaction costs, if any, as a loss on sale of loans.
Gain on sales of loans was $47.8 million and Contribution Margin are measures of overall direct product profitability that our management and board of directors find useful, and believe investors may find useful, in understanding the relationship between costs most directly associated with revenue generating activities and the related revenue, and remaining amount available to support our costs of engineering and product development and other general and administrative expense to evaluate our operating performance and trends. While we believe Contribution and Contribution Margin are useful$95.3 million for the reasons above, they are not an overall measureyears ended December 31, 2023 and 2022, respectively, a decrease of our profitability, as they exclude engineering and product development and other general and administrative expenses50%. The decrease was primarily due to a decrease in the volume of marketplace loans sold.
Net Fair Value Adjustments
We record fair value adjustments on loans that are requiredrecorded at fair value, including gains or losses from sale prices in excess of or less than the loan principal amount sold.
Net fair value adjustments were $(134.1) million and $8.5 million for the years ended December 31, 2023 and 2022, respectively, an increased loss of $142.6 million. The change to run our business. Factors that affect our Contribution and Contribution Margin include revenue mix, variable marketing expenses and origination and servicing expenses.a loss from a gain was primarily due to lower loan sale prices.
LENDINGCLUB CORPORATION
Management’s Discussion and Analysis of Financial Condition and Results of Operations
(Tabular Amounts in Thousands, Except Share and Per Share Data and Ratios, or as Noted)
The following table shows the calculation of Contribution and Contribution Margin:
| | | | | | | | | | | | | | | | | |
| Year Ended December 31, | 2020 | | 2019 | | 2018 |
| Total net revenue | $ | 314,702 | | | $ | 758,607 | | | $ | 694,812 | |
| Sales and marketing expense | (79,055) | | | (279,423) | | | (268,517) | |
| Origination and servicing expense | (71,193) | | | (103,403) | | | (99,376) | |
| Total direct expenses | (150,248) | | | (382,826) | | | (367,893) | |
Cost structure simplification expense (1) | 175 | | | 7,318 | | | 880 | |
Restructuring costs (2) | 2,064 | | | — | | | — | |
Other items (2) | 373 | | | — | | | — | |
Stock-based compensation (2) | 6,793 | | | 9,250 | | | 11,684 | |
| Income attributable to noncontrolling interests | — | | | (55) | | | (155) | |
| Contribution | $ | 173,859 | | | $ | 392,294 | | | $ | 339,328 | |
| Contribution margin | 55.2 | % | | 51.7 | % | | 48.8 | % |
(1) Contribution excludes the portion of personnel-related expense associated with establishing a site in the Salt Lake City area that is included in the “Sales and marketing” and “Origination and servicing” expense categories.
(2) Contribution excludes the portion of expenses included in the “Sales and marketing” and “Origination and servicing” expense categories.Other Non-interest Income
Other non-interest income primarily consists of referral revenue that relates to fees earned from third-party companies when customers referred by us consider or purchase products or services from such third-party companies. The following table presents a reconciliationtables below illustrate the composition of LendingClub net loss to Contributionother non-interest income for each of the periods indicated:period presented:
| | | | | | | | | | | | | | | | | |
| Year Ended December 31, | 2020 | | 2019 | | 2018 |
| LendingClub net loss | $ | (187,538) | | | $ | (30,745) | | | $ | (128,308) | |
| Engineering and product development expense | 139,050 | | | 168,380 | | | 155,255 | |
| Other general and administrative expense | 213,021 | | | 238,292 | | | 228,641 | |
Cost structure simplification expense (1) | 175 | | | 7,318 | | | 880 | |
Restructuring costs (2) | 2,064 | | | — | | | — | |
Other items (2) | 373 | | | — | | | — | |
| Goodwill impairment expense | — | | | — | | | 35,633 | |
| Class action and regulatory litigation expense | — | | | — | | | 35,500 | |
Stock-based compensation expense (2) | 6,793 | | | 9,250 | | | 11,684 | |
| Income tax expense (benefit) | (79) | | | (201) | | | 43 | |
| | | | | |
| Contribution | $ | 173,859 | | | $ | 392,294 | | | $ | 339,328 | |
| Total net revenue | $ | 314,702 | | | $ | 758,607 | | | $ | 694,812 | |
| Contribution margin | 55.2 | % | | 51.7 | % | | 48.8 | % |
| | | | | | | | | | | | | | | | | | | | | | | | | |
| Year Ended December 31, | 2023 | | 2022 | | | | Change ($) | | Change (%) |
| Referral revenue | $ | 4,574 | | | $ | 12,942 | | | | | $ | (8,368) | | | (65) | % |
| | | | | | | | | |
| Other | 6,723 | | | 15,823 | | | | | (9,100) | | | (58) | % |
| Other non-interest income | $ | 11,297 | | | $ | 28,765 | | | | | $ | (17,468) | | | (61) | % |
(1) Contribution excludes the portion of personnel-related expenses associated with establishing a site in the Salt Lake City area that are included in the “Sales and marketing” and “Origination and servicing” expense categories.
(2) Contribution excludes the portion of expenses included in the “Sales and marketing” and “Origination and servicing” expense categories. | | | | | | | | | | | | | | | | | | | | | | | |
| Year Ended December 31, | 2022 | | 2021 | | Change ($) | | Change (%) |
| Referral revenue | $ | 12,942 | | | $ | 14,234 | | | $ | (1,292) | | | (9) | % |
| Realized losses on sales of securities available for sale and other investments | — | | | (93) | | | 93 | | | N/M |
| Other | 15,823 | | | 13,078 | | | 2,745 | | | 21 | % |
| Other non-interest income | $ | 28,765 | | | $ | 27,219 | | | $ | 1,546 | | | 6 | % |
LENDINGCLUB CORPORATION
Management’s Discussion and Analysis of Financial Condition and Results of Operations
(Tabular Amounts in Thousands, Except Share and Per Share Data and Ratios, or as Noted)
Adjusted Net Interest Income (Loss), Adjusted EBITDA, and Adjusted EBITDA Margin
Adjusted Net Income (Loss) is a non-GAAP financial measure defined asThe table below presents net interest income (loss) attributableinformation corresponding to LendingClub adjusted to exclude certain items that are either non-recurring, do not contribute directly to management’s evaluation of its operating results, or non-cash items, such as (1) expenses related to our cost structure simplification, as discussed above, (2) goodwill impairment, (3) legal, regulatory and other expense related to legacy issues, (4) acquisition and related expenses, (5) restructuring costs and (6) other items (consisting of certain non-legacy litigation and/or regulatory settlement expenses, gains on disposal of certaininterest-earning assets and expenses resulting from COVID-19), net of tax. Legacy items are generally those expenses that arose from the decisions of legacy management prior to the board review initiated in 2016 and resulted in the resignation of our former CEO, including legal and other costs associated with ongoing regulatory and government investigations, indemnification obligations, litigation, and termination of certain legacy contracts. In the second quarter of 2020, we added an adjustment to Adjusted Net Income (Loss) for “Restructuring costs” to adjust for severance and other personnel-related expenses, lease-related expenses and software impairment related to the impact of COVID-19 on the Company’s business. In the fourth quarter of 2019, we added an adjustment to Adjusted Net Income (Loss) for “Acquisition and related expenses” to adjust for costs related to the acquisition of Radius. In the second quarter of 2019, we added an adjustment to Adjusted Net Income (Loss) and Adjusted EBITDA for “Other items” to adjust for expenses or gains that are not part of our core operating results. We believe Adjusted Net Income (Loss)interest-bearing funding sources. The average yield/rate is an important measure because it directly reflects the financial performance of our business.
Adjusted EBITDA is a non-GAAP financial measure defined as net income (loss) attributable to LendingClub adjusted to exclude certain items that are either non-recurring, do not contribute directly to management's evaluation of its operating results, or non-cash items, such as (1) cost structure simplification expense, (2) goodwill impairment, (3) legal, regulatory and other expense related to legacy issues, (4) acquisition and related expenses, (5) restructuring costs, (6) other items, as discussed above, (7) depreciation, impairment and amortization expense, (8) stock-based compensation expense and (9) income tax expense (benefit). We believe that Adjusted EBITDA is an important measure of operating performance because it allows management, investors and our board to evaluate and compare our core operating results, including our return on capital and operating efficiencies, from period to period. Additionally, we utilize Adjusted EBITDA as an input into the Company’s calculation of the annual bonus plan. Adjusted EBITDA Margin is a non-GAAP financial measure calculated by dividing Adjusted EBITDAthe period-end interest income/expense by total net revenue.the average balance.
| | | | | | | | | | | | | | | | | | | | | | | | | | | | | | | | | | | | | | | | | | | | | | | | | | | | | |
| Year Ended December 31, |
| 2023 | | 2022 | | 2021 |
| Average
Balance | | Interest Income/
Expense | | Average Yield/
Rate | | Average
Balance | | Interest Income/
Expense | | Average Yield/
Rate | | Average
Balance | | Interest Income/
Expense | | Average Yield/
Rate |
Interest-earning assets (1) | | | | | | | | | | | | | | | | | |
| Cash, cash equivalents, restricted cash and other | $ | 1,293,047 | | | $ | 65,917 | | | 5.10 | % | | $ | 987,833 | | | $ | 18,579 | | | 1.88 | % | | $ | 754,920 | | | $ | 1,170 | | | 0.16 | % |
| Securities available for sale at fair value | 652,047 | | | 40,235 | | | 6.17 | % | | 370,277 | | | 16,116 | | | 4.35 | % | | 288,545 | | | 11,025 | | | 3.82 | % |
| Loans held for sale at fair value | 252,519 | | | 35,655 | | | 14.12 | % | | 162,760 | | | 26,183 | | | 16.09 | % | | 218,349 | | | 29,540 | | | 13.53 | % |
| Loans and leases held for investment at amortized cost: | | | | | | | | | | | | | | | | | |
Unsecured personal loans (2) | 4,143,482 | | | 549,256 | | | 13.26 | % | | 2,967,410 | | | 410,222 | | | 13.82 | % | | 863,266 | | | 122,807 | | | 15.52 | % |
| Secured consumer loans | 402,668 | | | 16,963 | | | 4.21 | % | | 301,023 | | | 11,093 | | | 3.69 | % | | 485,195 | | | 17,105 | | | 3.85 | % |
| Commercial loans and leases | 722,419 | | | 48,307 | | | 6.69 | % | | 669,907 | | | 36,167 | | | 5.40 | % | | 617,483 | | | 30,731 | | | 5.43 | % |
| PPP loans | 26,114 | | | 2,209 | | | 8.46 | % | | 138,575 | | | 7,968 | | | 5.75 | % | | 487,435 | | | 18,334 | | | 4.10 | % |
| Loans and leases held for investment at amortized cost | 5,294,683 | | | 616,735 | | | 11.65 | % | | 4,076,915 | | | 465,450 | | | 11.42 | % | | 2,453,379 | | | 188,977 | | | 8.40 | % |
| Loans held for investment at fair value | 538,577 | | | 69,866 | | | 12.97 | % | | 91,057 | | | 12,877 | | | 14.14 | % | | 34,938 | | | 4,436 | | | 12.70 | % |
| Total loans and leases held for investment | 5,833,260 | | | 686,601 | | | 11.77 | % | | 4,167,972 | | | 478,327 | | | 11.48 | % | | 2,488,317 | | | 193,413 | | | 7.77 | % |
| Retail and certificate loans held for investment at fair value | 28,927 | | | 4,222 | | | 14.60 | % | | 128,047 | | | 18,135 | | | 14.16 | % | | 406,406 | | | 57,684 | | | 14.19 | % |
| Total interest-earning assets | 8,059,800 | | | 832,630 | | | 10.33 | % | | 5,816,889 | | | 557,340 | | | 9.58 | % | | 4,156,537 | | | 292,832 | | | 7.46 | % |
| | | | | | | | | | | | | | | | | |
| Cash and due from banks and restricted cash | 70,653 | | | | | | | 72,764 | | | | | | | 112,012 | | | | | |
| Allowance for loan and lease losses | (345,434) | | | | | | | (234,532) | | | | | | | (77,223) | | | | | |
| Other non-interest earning assets | 676,335 | | | | | | | 547,388 | | | | | | | 426,323 | | | | | |
| Total assets | $ | 8,461,354 | | | | | | | $ | 6,202,509 | | | | | | | $ | 4,617,649 | | | | | |
| | | | | | | | | | | | | | | | | |
| Interest-bearing liabilities | | | | | | | | | | | | | | | | | |
| Interest-bearing deposits: | | | | | | | | | | | | | | | | | |
| Checking and money market accounts | 1,344,431 | | | 34,462 | | | 2.56 | % | | $ | 2,205,691 | | | $ | 16,464 | | | 0.75 | % | | $ | 2,071,640 | | | $ | 5,954 | | | 0.31 | % |
| Savings accounts and certificates of deposit | 5,345,734 | | | 231,094 | | | 4.32 | % | | 2,123,037 | | | 43,987 | | | 2.07 | % | | 383,447 | | | 1,274 | | | 0.36 | % |
Interest-bearing deposits (2) | 6,690,165 | | | 265,556 | | | 3.97 | % | | 4,328,728 | | | 60,451 | | | 1.40 | % | | 2,455,087 | | | 7,228 | | | 0.32 | % |
| Retail notes and certificates | 28,927 | | | 4,222 | | | 14.60 | % | | 128,047 | | | 18,135 | | | 14.16 | % | | 407,471 | | | 57,684 | | | 14.16 | % |
| Other interest-bearing liabilities | 40,193 | | | 1,014 | | | 2.52 | % | | 188,146 | | | 3,929 | | | 2.09 | % | | 560,942 | | | 15,089 | | | 2.69 | % |
| Total interest-bearing liabilities | 6,759,285 | | | 270,792 | | | 4.01 | % | | 4,644,921 | | | 82,515 | | | 1.78 | % | | 3,423,500 | | | 80,001 | | | 2.36 | % |
| | | | | | | | | | | | | | | | | |
LENDINGCLUB CORPORATION
Management’s Discussion and Analysis of Financial Condition and Results of Operations
(Tabular Amounts in Thousands, Except Share and Per Share Data and Ratios, or as Noted)
The following table presents a reconciliation of LendingClub net loss to Adjusted Net Income (Loss) and Adjusted EBITDA for each of the periods indicated:
| | | | | | | | | | | | | | | | | |
| Year Ended December 31, | 2020 | | 2019 | | 2018 |
| LendingClub net loss | $ | (187,538) | | | $ | (30,745) | | | $ | (128,308) | |
Cost structure simplification expense (1) | 228 | | | 9,933 | | | 6,782 | |
| Goodwill impairment | — | | | — | | | 35,633 | |
Legal, regulatory and other expense related to legacy issues (2) | 15,133 | | | 19,609 | | | 53,518 | |
Acquisition and related expenses (3) | 13,184 | | | 932 | | | — | |
Restructuring costs (4) | 17,789 | | | — | | | — | |
Other items (5) | 2,637 | | | 2,453 | | | — | |
| Adjusted net income (loss) | $ | (138,567) | | | $ | 2,182 | | | $ | (32,375) | |
| Depreciation and impairment expense: | | | | | |
| Engineering and product development | 40,897 | | | 49,207 | | | 45,037 | |
| Other general and administrative | 5,847 | | | 6,446 | | | 5,852 | |
| Amortization of intangible assets | 3,122 | | | 3,499 | | | 3,875 | |
| Stock-based compensation expense | 61,533 | | | 73,639 | | | 75,087 | |
| Income tax expense (benefit) | (79) | | | (201) | | | 43 | |
| Adjusted EBITDA | $ | (27,247) | | | $ | 134,772 | | | $ | 97,519 | |
| Total net revenue | $ | 314,702 | | | $ | 758,607 | | | $ | 694,812 | |
| Adjusted EBITDA margin | (8.7) | % | | 17.8 | % | | 14.0 | % |
| | | | | | | | | | | | | | | | | | | | | | | | | | | | | | | | | | | | | | | | | | | | | | | | | | | | | |
| Year Ended December 31, |
| 2023 | | 2022 | | 2021 |
| Average
Balance | | Interest Income/
Expense | | Average Yield/
Rate | | Average
Balance | | Interest Income/
Expense | | Average Yield/
Rate | | Average
Balance | | Interest Income/
Expense | | Average Yield/
Rate |
| Non-interest bearing deposits | 236,618 | | | | | | | 264,099 | | | | | | | 126,982 | | | | | |
| Other liabilities | 261,401 | | | | | | | 274,209 | | | | | | | 289,163 | | | | | |
| Total liabilities | $ | 7,257,304 | | | | | | | $ | 5,183,229 | | | | | | | $ | 3,839,645 | | | | | |
| | | | | | | | | | | | | | | | | |
| Total equity | $ | 1,204,050 | | | | | | | $ | 1,019,280 | | | | | | | $ | 778,004 | | | | | |
| Total liabilities and equity | $ | 8,461,354 | | | | | | | $ | 6,202,509 | | | | | | | $ | 4,617,649 | | | | | |
| | | | | | | | | | | | | | | | | |
| Interest rate spread | | | | | 6.32 | % | | | | | | 7.80 | % | | | | | | 5.10 | % |
| | | | | | | | | | | | | | | | | |
| Net interest income and net interest margin | | | $ | 561,838 | | | 6.97 | % | | | | $ | 474,825 | | | 8.16 | % | | | | $ | 212,831 | | | 5.56 | % |
(1) Includes personnel-related expenses associated with establishing a site in the Salt Lake City area. These expensesNonaccrual loans and any related income are included in “Sales and marketing,” “Origination and servicing,” “Engineering and product development” and “Other general and administrative” expense on the Company’s Consolidated Statements of Operations. In 2019 and 2018, also includes external advisory fees which are included in “Other general and administrative” expense on the Company’s Consolidated Statements of Operations.their respective loan categories.
(2)In 2020 The average yield/rate for unsecured consumer loans decreased in 2023 compared to 2022 due to a shift in the mix toward higher credit quality loans, which generally have lower interest rates. The average yield/rate for interest-bearing deposits increased due to a higher federal funds rate and 2019, includes legacy legal expenses, which are included in “Other general and administrative” expensean increasing concentration of online deposits. We expect pressure on the Company’s Consolidated Statements of Operations. In 2019, also includes expense relatednet interest margin to the dissolution of certain private funds previously managed by LCAM and expense related to the termination of a legacy contract, which are included in “Net fair value adjustments” and “Other general and administrative” expense on the Company’s Consolidated Statements of Operations, respectively. Includes class action and regulatory litigation expense of $35.5 million for the year ended December 31, 2018, which is included in “Class action and regulatory litigation expense” on the Company’s Consolidated Statements of Operations. In 2018, also includes legacy legal expenses which are included in “Other general and administrative” expense on the Company’s Consolidated Statements of Operations.continue during 2024.
(3)
Represents costs related to
An analysis of the acquisitionyear-over-year changes in the categories of Radius.
(4) Includes severanceinterest income and other personnel-related expenses, lease-related expenses and software impairment related to the impact of COVID-19 on the Company’s business.
(5) In 2020, includes expenses related to certain non-legacy litigation and regulatory matters, which are included in “Other general and administrative”interest expense on the Company’s Consolidated Statements of Operations, and one-time expenses resulting from COVID-19, which are includedchanges in “Salesvolume and marketing,” “Originationrate is as follows:
| | | | | | | | | | | | | | | | | | | | | | | |
| 2023 Compared to 2022 | | 2022 Compared to 2021 |
| Increase (Decrease)
Due to Change in: | | Increase (Decrease)
Due to Change in: |
| Average Volume (1) | Average Rate (1) | Total | | Average Volume (1) | Average Rate (1) | Total |
| Interest-earning assets | | | | | | | |
| Cash, cash equivalents, restricted cash and other | $ | 7,243 | | $ | 40,095 | | $ | 47,338 | | | $ | 470 | | $ | 16,939 | | $ | 17,409 | |
| Securities available for sale at fair value | 15,571 | | 8,548 | | 24,119 | | | 3,414 | | 1,677 | | 5,091 | |
| Loans held for sale at fair value | 12,994 | | (3,522) | | 9,472 | | | (8,336) | | 4,979 | | (3,357) | |
| Loans and leases held for investment at amortized cost | 155,258 | | (3,973) | | 151,285 | | | 286,205 | | (9,732) | | 276,473 | |
| Loans held for investment at fair value | 58,140 | | (1,151) | | 56,989 | | | 7,883 | | 558 | | 8,441 | |
| Retail and certificate loans held for investment at fair value | (14,452) | | 539 | | (13,913) | | | (39,422) | | (127) | | (39,549) | |
| Total increase in interest income on interest-earning assets | $ | 234,754 | | $ | 40,536 | | $ | 275,290 | | | $ | 250,214 | | $ | 14,294 | | $ | 264,508 | |
| Interest-bearing liabilities | | | | | | | |
| Checking and money market accounts | $ | (8,592) | | $ | 26,590 | | $ | 17,998 | | | $ | 472 | | $ | 10,038 | | $ | 10,510 | |
| Savings accounts and certificates of deposit | 109,053 | | 78,054 | | 187,107 | | | 20,965 | | 21,748 | | 42,713 | |
| Interest-bearing deposits | 100,461 | | 104,644 | | 205,105 | | | 21,437 | | 31,786 | | 53,223 | |
| Retail notes and certificates | (14,452) | | 539 | | (13,913) | | | (39,573) | | 24 | | (39,549) | |
| Other interest-bearing liabilities | (3,598) | | 683 | | (2,915) | | | (11,798) | | 638 | | (11,160) | |
| Total increase (decrease) in interest expense on interest-bearing liabilities | $ | 82,411 | | $ | 105,866 | | $ | 188,277 | | | $ | (29,934) | | $ | 32,448 | | $ | 2,514 | |
| | | | | | | |
| Increase (decrease) in net interest income | $ | 152,343 | | $ | (65,330) | | $ | 87,013 | | | $ | 280,148 | | $ | (18,154) | | $ | 261,994 | |
(1) Volume and servicing,” “Engineeringrate changes have been allocated on a consistent basis using the respective percentage changes in average balances and product development” and “Other general and administrative” expense on the Company’s Consolidated Statements of Operations. In 2019, consists of expenses related to certain non-legacy litigation and regulatory matters, which are included in “Other general and administrative” expense on the Company’s Consolidated Statements of Operations. Also includes a gain on the sale of our small business operating segment.average rates.
LENDINGCLUB CORPORATION
Management’s Discussion and Analysis of Financial Condition and Results of Operations
(Tabular Amounts in Thousands, Except Share and Per Share Data and Ratios, or as Noted)
Adjusted EPS
Adjusted EPS is a non-GAAP financial measure calculated by dividing Adjusted Net Income (Loss) attributable to both common and preferred stockholders by the weighted-average diluted common and preferred shares outstanding. We believe that Adjusted EPS is an important measure because it directly reflects the core operating results of our business on a per share basis, which analysts have informed us provides a useful comparison from period to period without unusual or non-recurring items.
The following table presents a calculation of Adjusted EPSProvision for each of the periods indicated:
| | | | | | | | | | | | | | | | | |
| Year Ended December 31, | 2020 | | 2019 | | 2018 |
| Common and Preferred Stock (1)(2) | | Common Stock | | Common Stock |
| | | | | |
| | | | | |
| Adjusted net income (loss) attributable to stockholders | $ | (138,567) | | | $ | 2,182 | | | $ | (32,375) | |
| | | | | |
Weighted-average shares – diluted (3) | 90,439,695 | | | 87,278,596 | | | 84,583,461 | |
| Weighted-average other dilutive equity awards | — | | | 515,439 | | | — | |
Non-GAAP diluted shares (3) | 90,439,695 | | | 87,794,035 | | | 84,583,461 | |
| | | | | |
Adjusted EPS – diluted (3) | $ | (1.53) | | | $ | 0.02 | | | $ | (0.38) | |
(1) Presented on an as-converted basis, as the preferred stock is considered common shares because it participates in earnings similar to common stock and does not receive any significant preferences over the common stock.
(2) See “Item 8. Financial Statements and Supplementary Data – Notes to Consolidated Financial Statements – Note 4. Net Income (Loss) Per Share” and “Note 15. Stockholders' Equity” for additional information.
(3) Beginning in the first quarter of 2020, includes the total weighted-average shares outstanding of both common and preferred stock on an as-converted basis.
Supplemental Financial InformationCredit Losses
The following tableallowance for loan and lease losses (ALLL) for lifetime expected losses under CECL on HFI loans and leases at amortized cost is providedinitially recognized as “Provision for credit losses” at the time of origination. The ALLL is estimated using a discounted cash flow (DCF) approach, where effective interest rates are used to delineate betweencalculate the assets and liabilities belonging to our member payment dependent self-directed retail program (Retail Program) note holders and certain VIEs that wenet present value (NPV) of expected cash flows. The effective interest rates are required to consolidate in accordance with GAAP. Such assets are not legally ourscalculated based on the periodic interest income received from the loan’s contractual cash flows and the associated liabilities are payable onlynet investment in the loan, which includes deferred origination fees and costs, to provide a constant rate of return over the loan term. The NPV from the cash flows generated by those assets (i.e. Pass-throughs). As such, these debt holders do not haveDCF approach is then compared to the amortized cost basis of the loans and leases to derive expected credit losses. Under the DCF approach, the provision for credit losses in subsequent periods includes a secured interest in any other assetscredit loss expense relating to the discounting effect due to the passage of LendingClub. We believe this is a useful measure because ittime after the initial recognition of ALLL on originated HFI loans at amortized cost.
The provision for credit losses includes the credit loss expense for HFI loans and leases at amortized cost, available for sale (AFS) securities and unfunded lending commitments. The table below illustrates the
overall financial stability and operating leveragecomposition of the
Company. | | | | | | | | | | | | | | | | | | | | | | | | | | | | | |
| December 31, 2020 | | December 31, 2019 |
| Retail Program (1) | Consolidated VIEs (2) (4) | All Other LendingClub (3) | Consolidated Balance Sheet | | Retail Program (1) | Consolidated VIEs (2) | All Other LendingClub (3) | Consolidated Balance Sheet |
| Assets | | | | | | | | | |
| Cash and cash equivalents | $ | — | | $ | — | | $ | 524,963 | | $ | 524,963 | | | $ | — | | $ | — | | $ | 243,779 | | $ | 243,779 | |
| Restricted cash | — | | 13,473 | | 90,049 | | 103,522 | | | — | | 2,894 | | 240,449 | | 243,343 | |
| Securities available for sale | — | | — | | 142,226 | | 142,226 | | | — | | — | | 270,927 | | 270,927 | |
| Loans held for investment at fair value | 584,066 | | 52,620 | | — | | 636,686 | | | 881,473 | | 197,842 | | — | | 1,079,315 | |
Loans held for investment by the Company at fair value (4) | — | | 46,120 | | 3,834 | | 49,954 | | | — | | 37,638 | | 6,055 | | 43,693 | |
Loans held for sale by the Company at fair value (4) | — | | 92,802 | | 29,100 | | 121,902 | | | — | | — | | 722,355 | | 722,355 | |
| Accrued interest receivable | 3,797 | | 1,134 | | 274 | | 5,205 | | | 5,930 | | 1,815 | | 5,112 | | 12,857 | |
| Property, equipment and software, net | — | | — | | 96,641 | | 96,641 | | | — | | — | | 114,370 | | 114,370 | |
| Operating lease assets | — | | — | | 74,037 | | 74,037 | | | — | | — | | 93,485 | | 93,485 | |
| Intangible assets, net | — | | — | | 11,427 | | 11,427 | | | — | | — | | 14,549 | | 14,549 | |
| Other assets | — | | — | | 96,730 | | 96,730 | | | — | | — | | 143,668 | | 143,668 | |
| Total assets | $ | 587,863 | | $ | 206,149 | | $ | 1,069,281 | | $ | 1,863,293 | | | $ | 887,403 | | $ | 240,189 | | $ | 1,854,749 | | $ | 2,982,341 | |
| Liabilities and Equity | | | | | | | | | |
| Accounts payable | $ | — | | $ | — | | $ | 3,698 | | $ | 3,698 | | | $ | — | | $ | — | | $ | 10,855 | | $ | 10,855 | |
| Accrued interest payable | 3,797 | | 721 | | 54 | | 4,572 | | | 5,930 | | 1,737 | | 1,593 | | 9,260 | |
| Operating lease liabilities | — | | — | | 94,538 | | 94,538 | | | — | | — | | 112,344 | | 112,344 | |
| Accrued expenses and other liabilities | — | | — | | 101,457 | | 101,457 | | | — | | — | | 142,636 | | 142,636 | |
| Payable to investors | — | | — | | 40,286 | | 40,286 | | | — | | — | | 97,530 | | 97,530 | |
| Notes, certificates and secured borrowings at fair value | 584,066 | | 52,620 | | 88 | | 636,774 | | | 881,473 | | 197,842 | | 2,151 | | 1,081,466 | |
Payable to Structured Program note and certificate holders at fair value (4) | — | | 152,808 | | — | | 152,808 | | | — | | 40,610 | | — | | 40,610 | |
| Credit facilities and securities sold under repurchase agreements | — | | — | | 104,989 | | 104,989 | | | — | | — | | 587,453 | | 587,453 | |
| Total liabilities | 587,863 | | 206,149 | | 345,110 | | 1,139,122 | | | 887,403 | | 240,189 | | 954,562 | | 2,082,154 | |
| | | | | | | | | |
| | | | | | | | | |
| | | | | | | | | |
| | | | | | | | | |
| | | | | | | | | |
| | | | | | | | | |
| | | | | | | | | |
| | | | | | | | | |
| Total equity | — | | — | | 724,171 | | 724,171 | | | — | | — | | 900,187 | | 900,187 | |
| Total liabilities and equity | $ | 587,863 | | $ | 206,149 | | $ | 1,069,281 | | $ | 1,863,293 | | | $ | 887,403 | | $ | 240,189 | | $ | 1,854,749 | | $ | 2,982,341 | |
(1) Represents loansprovision for credit losses for each period presented, as well as the loan originations held for investment in each period, which is a key driver for credit loss expense:
| | | | | | | | | | | | | | | | | |
| Year Ended December 31, | 2023 | | 2022 | | 2021 |
| Credit loss expense for Radius loans at acquisition | $ | — | | | $ | — | | | $ | 6,929 | |
| Credit loss expense for loans and leases held for investment | 243,570 | | | 266,679 | | | 134,022 | |
| Credit loss expense for unfunded lending commitments | (5) | | | 647 | | | 1,231 | |
| Total credit loss expense | 243,565 | | | 267,326 | | | 142,182 | |
| Reversal of impairment on securities available for sale | — | | | — | | | (3,382) | |
| Total provision for credit losses | $ | 243,565 | | | $ | 267,326 | | | $ | 138,800 | |
| | | | | |
| Loan originations held for investment | $ | 2,184,095 | | | $ | 3,731,057 | | | $ | 2,282,206 | |
The provision for credit losses was $243.6 million and $267.3 million for the year ended December 31, 2023 and 2022, respectively, a decrease of 9%. The decrease was primarily due to the lower volume of originated loans retained as HFI at fair value that were funded directly by our Retail Program notes. The liabilities are only payable fromamortized cost and the cash flows generated by the associated assets. We do not assume principal or interest rate risk on loans facilitated through our lending marketplace that were funded by our Retail Program because loan balances, interest rates and maturities are matched andrelated initial provision for credit losses, partially offset by an equal balance of notes with the exact same interest ratesincrease in quantitative and maturities. We do not retain anyqualitative allowance due to an increase in expected losses and a less favorable economic interests from our Retail Program. Interest expense on Retail Program notes of $98.3 million and $148.0 million was equally matched and offset by interest income from the related loans of $98.3 million and $148.0 million in 2020 and 2019, respectively, resulting in no net effect on our Net interest income and fair value adjustments.outlook.
(2) Represents assets and equal and offsetting liabilities of certain VIEs that we are required to consolidate in accordance with GAAP, but which are not legally ours. The liabilities are only payable from the cash flows generated by the associated
LENDINGCLUB CORPORATION
Management’s Discussion and Analysis of Financial Condition and Results of Operations
(Tabular Amounts in Thousands, Except Share and Per Share Data and Ratios, or as Noted)
assets. The creditorsactivity in the allowance for credit losses (ACL) was as follows:
| | | | | | | | | | | | | | | | | |
| Year Ended December 31, | 2023 | | 2022 | | 2021 |
| Allowance for loan and lease losses, beginning of period | $ | 327,852 | | | $ | 144,389 | | | $ | — | |
| Credit loss expense for loans and leases held for investment | 243,570 | | | 266,679 | | | 140,951 | |
| Initial allowance for purchased credit deteriorated (PCD) loans acquired during the period | — | | | — | | | 12,440 | |
| Charge-offs | (281,107) | | | (87,473) | | | (10,452) | |
| Recoveries | 20,072 | | | 4,257 | | | 1,450 | |
Allowance for loan and lease losses, end of period (1) | $ | 310,387 | | | $ | 327,852 | | | $ | 144,389 | |
| | | | | |
| Reserve for unfunded lending commitments, beginning of period | $ | 1,878 | | | $ | 1,231 | | | $ | — | |
| Credit loss expense for unfunded lending commitments | (5) | | | 647 | | | 1,231 | |
Reserve for unfunded lending commitments, end of period (2) | $ | 1,873 | | | $ | 1,878 | | | $ | 1,231 | |
(1) Comprised of the VIEs have no recourse to the general credit of the Company. Interest expense on these liabilities owned by third parties of $123.2$355.8 million, $340.4 million and net fair value adjustments of $9.4$145.2 million in 2020 were equally matched and offset by interest incomeallowance for future estimated net charge-offs on the loansexisting portfolio balances, net of $134.6a negative allowance of $45.4 million, resulting in no net effect on our Net interest income and fair value adjustments. Interest expense on these liabilities owned by third parties of $70.8$12.5 million and $0.8 million for expected recoveries of amounts previously charged-off as of December 31, 2023, 2022 and 2021, respectively.
(2) Relates to $78.1 million, $138.0 million and $110.8 million of unfunded commitments as of December 31, 2023, 2022 and 2021, respectively.
| | | | | | | | | | | | | | | | | |
| Year Ended December 31, | 2023 | | 2022 | | 2021 |
| Ratio of allowance for loan and lease losses to total loans and leases held for investment at amortized cost | 6.4 | % | | 6.5 | % | | 5.0 | % |
| | | | | |
| | | | | |
| Average loans and leases held for investment at amortized cost, excluding PPP loans | $ | 5,268,569 | | | $ | 3,938,340 | | | $ | 1,965,944 | |
Net charge-off ratio (1) | 5.0 | % | | 2.1 | % | | 0.5 | % |
(1) Calculated as net fair value adjustments of $13.5 million in 2019 were equally matchedcharge-offs divided by average outstanding loans and offset by interest income on the loans of $84.3 million, resulting in no net effect on our Net interest income and fair value adjustments. Economic interests held by LendingClub, including retained interests, residuals and equity of the VIEs, are reflected in “Loans held for sale by the Company at fair value,” “Loansleases held for investment byduring the Company at fair value” and “Restricted cash,” respectively, within the “All Other LendingClub” column.period, excluding PPP loans.
(3) Represents all other assets and liabilities of LendingClub, other than those related to our Retail Program and certain consolidated VIEs, but includes any economic interests held by LendingClub, including retained interests, residuals and equity of those consolidated VIEs.
(4)Loans and leases are generally placed on nonaccrual status when contractually past due 90 days or more, or earlier if management believes that the probability of collection does not warrant further accrual. Unsecured personal loans are charged-off no later than 120 days past due. The following table presents nonaccrual loans and leases (1):
| | | | | | | | | | | |
| December 31, 2023 | | December 31, 2022 |
| Total nonaccrual loans and leases held for investment at amortized cost | $ | 44,382 | | | $ | 34,827 | |
| Ratio of total nonaccrual loans and leases held for investment to total loans and leases held for investment | 0.9 | % | | 0.7 | % |
| | | |
(1) The Company has sponsored Structured Program transactionsExcluding PPP loans, there were no loans that have been consolidated, resulting in an increase to “Loans held for investment bywere 90 days or more past due and accruing as of both December 31, 2023 and 2022.
For additional information on the Company at fair value,” “Loans held for sale by the Company at fair value”ACL and the related “Payable to Structured Program notenonaccrual loans and certificate holders at fair value.” Seeleases, see “Item 8. Financial Statements and Supplementary Data – Notes to Consolidated Financial Statements – Note 14. Debt1. Summary of Significant Accounting Policies” and “Note 6. Loans and Leases Held for additional information.Investment at Amortized Cost, Net of Allowance For Loan and Lease Losses.”
LENDINGCLUB CORPORATION
Management’s Discussion and OtherAnalysis of Financial AssetsCondition and Results of Operations
(Tabular Amounts in Thousands, Except Share and Per Share Data and Ratios, or as Noted)
Non-interest Expense
The following table provides additional detailNon-interest expense primarily consists of (i) compensation and benefits, which include salaries and wages, benefits and stock-based compensation expense, (ii) marketing, which includes costs attributable to borrower and deposit customer acquisition efforts and building general brand awareness, (iii) equipment and software, (iv) depreciation and amortization, (v) professional services, which primarily consist of consulting fees and (vi) occupancy, which includes rent expense and all other costs related to components ofoccupying our Net Cashoffice spaces.
| | | | | | | | | | | | | | | | | | | | | | | |
| Year Ended December 31, | 2023 | | 2022 | | Change ($) | | Change (%) |
| Non-interest expense: | | | | | | | |
| Compensation and benefits | $ | 261,948 | | | $ | 339,397 | | | $ | (77,449) | | | (23) | % |
| Marketing | 93,840 | | | 197,747 | | | (103,907) | | | (53) | % |
| Equipment and software | 53,485 | | | 49,198 | | | 4,287 | | | 9 | % |
| Depreciation and amortization | 47,195 | | | 43,831 | | | 3,364 | | | 8 | % |
| Professional services | 35,173 | | | 50,516 | | | (15,343) | | | (30) | % |
| Occupancy | 17,532 | | | 21,977 | | | (4,445) | | | (20) | % |
| Other non-interest expense | 57,264 | | | 64,187 | | | (6,923) | | | (11) | % |
| Total non-interest expense | $ | 566,437 | | | $ | 766,853 | | | $ | (200,416) | | | (26) | % |
| | | | | | | | | | | | | | | | | | | | | | | |
| Year Ended December 31, | 2022 | | 2021 | | Change ($) | | Change (%) |
| Non-interest expense: | | | | | | | |
| Compensation and benefits | $ | 339,397 | | | $ | 288,390 | | | $ | 51,007 | | | 18 | % |
| Marketing | 197,747 | | | 156,142 | | | 41,605 | | | 27 | % |
| Equipment and software | 49,198 | | | 39,490 | | | 9,708 | | | 25 | % |
| Depreciation and amortization | 43,831 | | | 44,285 | | | (454) | | | (1) | % |
| Professional services | 50,516 | | | 47,572 | | | 2,944 | | | 6 | % |
| Occupancy | 21,977 | | | 24,249 | | | (2,272) | | | (9) | % |
| Other non-interest expense | 64,187 | | | 61,258 | | | 2,929 | | | 5 | % |
| Total non-interest expense | $ | 766,853 | | | $ | 661,386 | | | $ | 105,467 | | | 16 | % |
Compensation and Other Financial Assets. We believe Net Cash and Other Financial Assets is a useful measure because it illustratesbenefits expense decreased $77.4 million, or 23%, for the overall financial stability and operating leverage ofyear ended December 31, 2023 compared to the Company. This measure is calculated as cash and certain other assets and liabilities, including loans and securities available for sale, which are partially secured and offset by related credit facilities, and working capital.
| | | | | | | | | | | | | | | | | | | | | | | | | | | | | |
| December 31, 2020 | | September 30,
2020 | | June 30,
2020 | | March 31,
2020 | | December 31,
2019 |
Cash and cash equivalents (1) | $ | 524,963 | | | $ | 445,180 | | | $ | 338,394 | | | $ | 294,345 | | | $ | 243,779 | |
Restricted cash committed for loan purchases (2) | 2,692 | | | 308 | | | 290 | | | 4,572 | | | 68,001 | |
| Securities available for sale | 142,226 | | | 187,375 | | | 221,930 | | | 256,554 | | | 270,927 | |
Loans held for investment by the Company at fair value (3) | 49,954 | | | 59,099 | | | 65,557 | | | 71,003 | | | 43,693 | |
Loans held for sale by the Company at fair value (3) | 121,902 | | | 180,801 | | | 587,093 | | | 741,704 | | | 722,355 | |
Payable to Structured Program note and certificate holders at fair value (3) | (152,808) | | | (173,410) | | | (193,034) | | | (206,092) | | | (40,610) | |
| Credit facilities and securities sold under repurchase agreements | (104,989) | | | (120,159) | | | (480,079) | | | (621,020) | | | (587,453) | |
Other assets and liabilities (4) | (7,792) | | | 363 | | | 23,916 | | | 61,107 | | | (6,226) | |
Net cash and other financial assets (5) | $ | 576,148 | | | $ | 579,557 | | | $ | 564,067 | | | $ | 602,173 | | | $ | 714,466 | |
(1) Variationssame period in cash and cash equivalents are2022. The decrease was primarily due to variationsa decrease in headcount as a result of the workforce reduction plans we implemented in January and October of 2023.
Marketing expense decreased $103.9 million, or 53%, for the year ended December 31, 2023 compared to the same period in 2022. The decrease was primarily due to a decrease in variable marketing expenses based on lower origination volume.
Equipment and software expense increased $4.3 million, or 9%, for the year ended December 31, 2023 compared to the same period in 2022. The increase was primarily due to an increase in subscription costs and hosting fees, partially offset by a decrease in support and maintenance expense.
Depreciation and amortization expense increased $3.4 million, or 8%, for the year ended December 31, 2023 compared to the same period in 2022. The increase was primarily due to an increase in the amountamortization of internally-developed software and timing of loan purchases investedpurchased software.
Professional services expense decreased $15.3 million, or 30%, for the year ended December 31, 2023 compared to the same period in by the Company and the corresponding loan sales.2022. The decrease was primarily due to a decrease in consulting fees.
(2) Represents cash and cash equivalents that are transferred to restricted cash for loans that are pending purchase by the Company.
(3) The Company has sponsored Structured Program transactions that have been consolidated, resulting in an increase to “Loans held for investment by the Company at fair value” and the related “Payable to Structured Program note and certificate holders at fair value.” See “Item 8. Financial Statements and Supplementary Data – Notes to Consolidated Financial Statements – Note 14. Debt” for additional information.
LENDINGCLUB CORPORATION
Management’s Discussion and Analysis of Financial Condition and Results of Operations
(Tabular Amounts in Thousands, Except Share and Per Share Data and Ratios, or as Noted)
(4) “Other assets and liabilities” isOccupancy expense decreased $4.4 million, or 20%, for the year ended December 31, 2023 compared to the same period in 2022. The decrease was primarily due to a total of “Accrued interest receivable,” “Other assets,” “Accounts payable,” “Accrued interest payable” and “Accrued expenses and other liabilities,” included on our Consolidated Balance Sheets. This line item represents certain assets and liabilities that impact working capital and are affected by timing differences between revenue anddecrease in rent expense.
Other non-interest expense recognition and related cash activity.
(5) Comparable GAAP measure cannot be provided as not practicable.decreased $6.9 million, or 11%, for the year ended December 31, 2023 compared to the same period in 2022. The decrease was primarily due to a decrease in consumer credit services.
Income Taxes
For the year ended December 31, 2023, we recorded an income tax expense of $15.7 million. The effective tax rate differs from the statutory rate due to the impact of state taxes, the favorable impact of recurring items such as tax credits, the unfavorable impact of the non-deductible portions of executive compensation and stock-based compensation, and the change in unrecognized tax benefits. For the year ended December 31, 2022, we recorded an income tax benefit of $136.6 million primarily due to the release of a $175.6 million valuation allowance against our deferred tax assets, of which $143.5 million was primarily based on our reassessment of the future realizability of our deferred tax assets. For the year ended December 31, 2021, we recorded an income tax benefit of $136 thousand primarily related to a tax benefit associated with the Acquisition, partially offset by income tax expense for state jurisdictions that limit net operating loss carryforward utilization.
In 2022, we evaluated both positive and negative evidence when assessing the recoverability of our net deferred tax assets. Several factors were considered, which primarily included our business model transition and the resulting increase in profitability and the expectation of continued profitability. These factors resulted in the release of the majority of our valuation allowance against our deferred tax assets in 2022.
As of December 31, 2023, we maintained a valuation allowance of $46.1 million related to certain state net operating loss carryforwards (NOLs) and state tax credit carryforwards. The realization and timing of any remaining state NOLs and state tax credit carryforwards is uncertain and may expire before being utilized, based primarily on the allocation of taxable income constraints to the Parent and not related to the earnings of the Company. Changes to deferred tax asset valuation allowances and liabilities related to uncertain tax positions are recorded as current period income tax expense or benefit.
Income taxes are recorded on a separate entity basis whereby each operating segment determines income tax expense or benefit as if it filed a separate tax return. Differences between separate entity and consolidated tax returns are eliminated upon consolidation.
Segment Information
The Company defines its operating segments to be components of the Company for which discrete financial information is evaluated regularly by the loan product typesCompany’s Chief Executive Officer and Chief Financial Officer to allocate resources and evaluate financial performance. This information is reviewed according to the legal organizational structure of personal, educationthe Company’s operations with products and patient finance,services presented separately for the parent bank holding company and auto. While each of these product types are considered operating segments, they are aggregated to represent 1 reportable segment as the education and patient finance and auto loan operating segments are immaterial both individually and in the aggregate. With the acquisition of Radius, the Company is in the process of reorganizing its management structure and defining its operating segments.wholly-owned subsidiary, LC Bank.
Investments in Quarterly Originations by Investment Channel and Investor Concentration
During 2020, our investment channels consisted of (1) Managed accounts and Other institutional investors, which primarily include other non-bank investors, dedicated third-party funds, and public and private funds managed by third-party asset managers, (2) Banks, which are deposit taking institutions or their affiliates, (3) self-directed retail investors, and (4) LendingClub inventory, which includes loan originations purchased by the Company during the period and not yet sold as of the period end.Bank
The following table showsLC Bank operating segment represents the percentagenational bank legal entity and reflects post-Acquisition operating activities. This segment provides a full complement of loan origination volume issued in the periodfinancial products and purchased or pending purchase by eachsolutions, including loans, leases and deposits. It originates loans to individuals and businesses, retains loans for investment, channel as of the end of each period presented:
| | | | | | | | | | | | | | | | | | | | | | | | | | | | | |
| December 31, 2020 | | September 30, 2020 | | June 30,
2020 | | March 31, 2020 | | December 31, 2019 |
| Investor Type: | | | | | | | | | |
| Managed accounts | 51 | % | | 44 | % | | 10 | % | | 16 | % | | 17 | % |
| Banks | 33 | % | | 41 | % | | 68 | % | | 43 | % | | 32 | % |
| Self-directed retail investors | 8 | % | | 13 | % | | 17 | % | | 4 | % | | 3 | % |
| Other institutional investors | 7 | % | | — | % | | — | % | | 17 | % | | 25 | % |
LendingClub inventory (1) | 1 | % | | 2 | % | | 5 | % | | 20 | % | | 23 | % |
| Total | 100 | % | | 100 | % | | 100 | % | | 100 | % | | 100 | % |
(1)LendingClub inventory reflectssells loans purchased or pending purchase by the Company during the period, excluding loans held by the Company through consolidated trusts, if applicable, and not yet sold as of the period end.
The loan origination volume decrease in the fourth quarter of 2020 compared to fourth quarter of 2019 was driven by tighter underwriting criteria due to the impact of COVID-19. This reduction in investor demand resulted in mix changes across our investment channels. In addition, in response to COVID-19 and the related capital market dislocation and planning for the acquisition of Radius, the Company significantly reduced using its own capital to fund the purchase of loans.
Now that LendingClub has become a full-spectrum marketplace bank, we have started development of new products aimed to better serve our customers. As part of this strategic initiative, as previously disclosed in the Current Report on Form 8-K filed on October 7, 2020, LendingClub ceased offering and selling Retail Notes to self-directed retail investors as of December 31, 2020.
LENDINGCLUB CORPORATION
Management’s Discussion and Analysis of Financial Condition and Results of Operations
(Tabular Amounts in Thousands, Except Share and Per Share Data and Ratios, or as Noted)
The following table provides the percentage of loans invested in by the ten largest external investors and by the largest single investor during each of the previous five quarters (by dollars invested):
| | | | | | | | | | | | | | | | | | | | | | | | | | | | | |
| December 31, 2020 | | September 30, 2020 | | June 30,
2020 | | March 31, 2020 | | December 31, 2019 |
| Percentage of loans invested in by ten largest investors | 82 | % | | 83 | % | | 77 | % | | 56 | % | | 51 | % |
| Percentage of loans invested in by largest single investor | 26 | % | | 23 | % | | 22 | % | | 21 | % | | 19 | % |
The composition of the top ten investors may vary from period to period. During the fourth quarter of 2020, the percentage of loans invested in by the Company’s ten largest investors increased compared to the prior year, as a result of a decrease in loan origination volume and an increase in the mix of loans purchased on our platform by bank and managed account investors. A reduction in investor demand furthered investor concentration to a limited number of purchasers that are continuing to purchase loans but are currently doing so at lower volumes relative to historical purchasing activity.
Effectiveness of Scoring Models
Our ability to attract borrowers and investors to our lending marketplace is significantly dependent on our platform’s ability to effectively evaluate a borrower’s credit profile.
Our online lending marketplace platform’s credit decisioning and scoring models are evaluated on a regular basis and the additional data on loan history experience, borrower behavior and prepayment trends that we accumulate are leveraged to continually improve our underwriting models. We believe we have the experience to effectively evaluate a borrower’s creditworthiness and likelihood of default. If our lending marketplace’s credit decisioning and scoring models ultimately prove to be ineffective or fail to appropriately account for a decline in future macroeconomic environment, investors may experience higher than expected losses.
Our current underwriting model leverages a number of custom attributes developed by LendingClub. We modify our credit and pricing policies, leveraging insights on current market conditions and recent vintage performance.
The charts provided below display the historical lifetime cumulative net charge-off rates (expressed as a percent of original loan balances) through December 31, 2020, by booking year, for all standard program loans and 36-month or 60-month terms for each of the years shown. The charts display lifetime cumulative net charge-off rates using months on book for each annual vintage presented. Each annual vintage’s lifetime cumulative net charge-offs vary based on the maturity of each loan’s month on book. In the fourth quarter and year ended December 31, 2020, standard program loans accounted for 68% and 69%, respectively, of all loan origination volume.
LENDINGCLUB CORPORATION
Management’s Discussion and Analysis of Financial Condition and Results of Operations
(Tabular Amounts in Thousands, Except Share and Per Share Data and Ratios, or as Noted)
LendingClub Corporation (Parent Only)
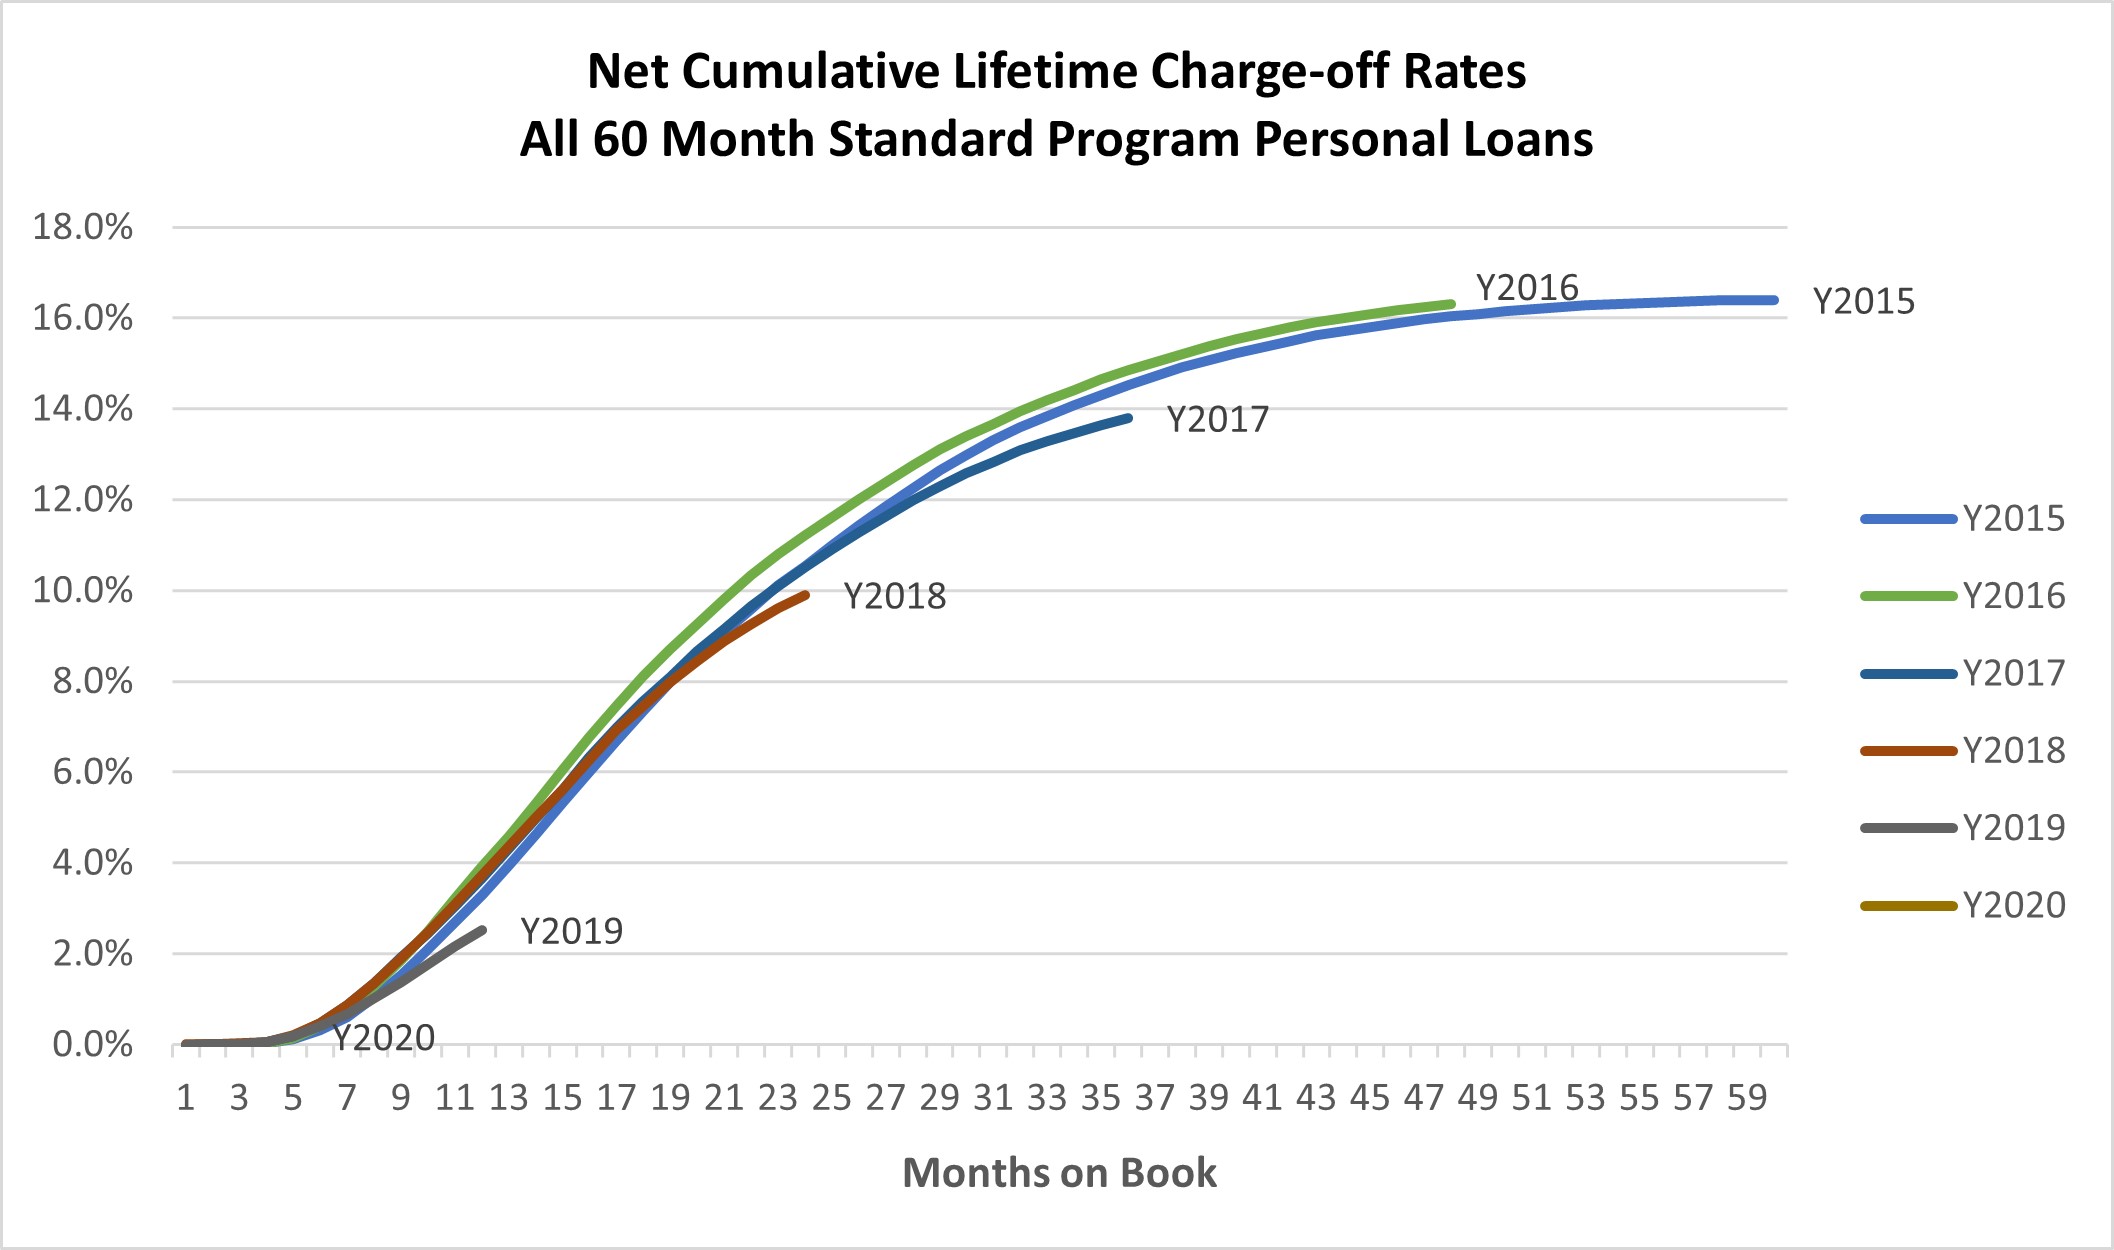
Financial information for the segments is presented in the following table:
| | | | | | | | | | | | | | | | | | | | | | | | | | | | | | | | | | | | | | | | | | | | | | | | | | | | | | | | | | | | | | | | | | | | | | | |
| LendingClub
Bank | | LendingClub
Corporation (Parent only) | | Intercompany
Eliminations | | Consolidated Total |
| Year Ended
December 31, | | Eleven Months Ended December 31, | | Year Ended December 31, | | Year Ended December 31, | | Eleven Months Ended December 31, | | Year Ended December 31, |
| 2023 | | 2022 | | 2021 (1) | | 2023 | | 2022 | | 2021 | | 2023 | | 2022 | | 2021 (1) | | 2023 | | 2022 | | 2021 |
| Non-interest income: | | | | | | | | | | | | | | | | | | | | | | | |
| Marketplace revenue | $ | 206,381 | | | $ | 610,536 | | | $ | 462,821 | | | $ | 41,817 | | | $ | 48,231 | | | $ | 115,759 | | | $ | 43,286 | | | $ | 24,859 | | | $ | — | | | $ | 291,484 | | | $ | 683,626 | | | $ | 578,580 | |
| Other non-interest income | 74,684 | | | 85,208 | | | 94,953 | | | 9,503 | | | 15,628 | | | 16,718 | | | (72,890) | | | (72,071) | | | (84,452) | | | 11,297 | | | 28,765 | | | 27,219 | |
| Total non-interest income | 281,065 | | | 695,744 | | | 557,774 | | | 51,320 | | | 63,859 | | | 132,477 | | | (29,604) | | | (47,212) | | | (84,452) | | | 302,781 | | | 712,391 | | | 605,799 | |
| | | | | | | | | | | | | | | | | | | | | | | |
| Interest income: | | | | | | | | | | | | | | | | | | | | | | | |
| Interest income | 818,206 | | | 526,471 | | | 210,739 | | | 14,424 | | | 30,869 | | | 82,093 | | | — | | | — | | | — | | | 832,630 | | | 557,340 | | | 292,832 | |
| Interest expense | (266,218) | | | (60,954) | | | (8,412) | | | (4,574) | | | (21,561) | | | (71,589) | | | — | | | — | | | — | | | (270,792) | | | (82,515) | | | (80,001) | |
| Net interest income | 551,988 | | | 465,517 | | | 202,327 | | | 9,850 | | | 9,308 | | | 10,504 | | | — | | | — | | | — | | | 561,838 | | | 474,825 | | | 212,831 | |
| | | | | | | | | | | | | | | | | | | | | | | |
| Total net revenue | 833,053 | | | 1,161,261 | | | 760,101 | | | 61,170 | | | 73,167 | | | 142,981 | | | (29,604) | | | (47,212) | | | (84,452) | | | 864,619 | | | 1,187,216 | | | 818,630 | |
| | | | | | | | | | | | | | | | | | | | | | | |
| (Provision for) reversal of credit losses | (243,565) | | | (267,326) | | | (142,182) | | | — | | | — | | | 3,382 | | | — | | | — | | | — | | | (243,565) | | | (267,326) | | | (138,800) | |
| Non-interest expense | (537,026) | | | (724,304) | | | (547,799) | | | (59,015) | | | (89,761) | | | (198,039) | | | 29,604 | | | 47,212 | | | 84,452 | | | (566,437) | | | (766,853) | | | (661,386) | |
| Income (Loss) before income tax benefit (expense) | 52,462 | | | 169,631 | | | 70,120 | | | 2,155 | | | (16,594) | | | (51,676) | | | — | | | — | | | — | | | 54,617 | | | 153,037 | | | 18,444 | |
| Income tax benefit (expense) | (17,881) | | | (42,354) | | | 9,171 | | | 2,203 | | | 125,954 | | | 44,013 | | | — | | | 53,048 | | | (53,048) | | | (15,678) | | | 136,648 | | | 136 | |
| Net income (loss) | $ | 34,581 | | | $ | 127,277 | | | $ | 79,291 | | | $ | 4,358 | | | $ | 109,360 | | | $ | (7,663) | | | $ | — | | | $ | 53,048 | | | $ | (53,048) | | | $ | 38,939 | | | $ | 289,685 | | | $ | 18,580 | |
| Capital expenditures | $ | 59,509 | | | $ | 69,481 | | | $ | 32,602 | | | $ | — | | | $ | — | | | $ | 1,811 | | | $ | — | | | $ | — | | | $ | — | | | $ | 59,509 | | | $ | 69,481 | | | $ | 34,413 | |
| Depreciation and amortization | $ | 30,216 | | | $ | 16,489 | | | $ | 4,569 | | | $ | 16,979 | | | $ | 27,342 | | | $ | 39,716 | | | $ | — | | | $ | — | | | $ | — | | | $ | 47,195 | | | $ | 43,831 | | | $ | 44,285 | |
(1) Because theLendingClub Bank reportable segment was formed upon the Acquisition on February 1, 2021, the associated results are presented for the eleven month period ended December 31, 2021.
An analysis of the Company’s results of operations and material trends for the year ended December 31, 2023 compared to the year ended December 31, 2022 is provided on a consolidated basis in “Results of Operations.”
LENDINGCLUB CORPORATION
Management’s Discussion and Analysis of Financial Condition and Results of Operations
(Tabular Amounts in Thousands, Except Share and Per Share Data and Ratios, or as Noted)
Loan Portfolio Information and Credit MetricsNon-GAAP Financial Measures
FairTo supplement our financial statements, which are prepared and presented in accordance with GAAP, we use the following non-GAAP financial measures: Pre-Provision Net Revenue (PPNR), Net Income Excluding Income Tax Benefit, Diluted EPS Excluding Income Tax Benefit, and Tangible Book Value (TBV) Per Common Share. Our non-GAAP financial measures do have limitations as analytical tools and Delinquenciesyou should not consider them in isolation or as a substitute for an analysis of our results under GAAP.
For loans held for investment that are backed by notes, certificatesWe believe these non-GAAP financial measures provide management and secured borrowings oninvestors with useful supplemental information about the financial performance of our Consolidated Balance Sheets, the outstanding principal balance, fair valuebusiness, enable comparison of financial results between periods where certain items may vary independent of business performance, and percentageenable comparison of loans that are delinquent, by loan product, are as follows:
| | | | | | | | | | | | | | | | | | | | | | | |
| December 31, 2020 | | December 31, 2019 |
| (in millions, except percentages) | Outstanding Principal Balance | Fair Value (1) | Delinquent Loans (1) | | Outstanding Principal Balance | Fair Value (1) | Delinquent Loans (1) |
| Personal loans – standard program | $ | 679.6 | | 93.6 | % | 1.9 | % | | $ | 1,144.8 | | 93.9 | % | 3.1 | % |
| Personal loans – custom program | 0.3 | | 93.7 | | 9.8 | | | 4.1 | | 94.8 | | 5.7 | |
| Total | $ | 679.9 | | 93.6 | % | 1.9 | % | | $ | 1,148.9 | | 93.9 | % | 3.1 | % |
(1) Expressed as a percent of outstanding principal balance.our financial results with other public companies.
For loans investedWe believe PPNR, Net Income Excluding Income Tax Benefit and Diluted EPS Excluding Income Tax Benefit are important measures because they reflect the underlying financial performance of our business operations. PPNR is a non-GAAP financial measure calculated by subtracting the provision for credit losses and income tax benefit/expense from net income. Net Income Excluding Income Tax Benefit adjusts for the release of a deferred tax asset valuation allowance in directly2022. Diluted EPS Excluding Income Tax Benefit is a non-GAAP financial measure calculated by dividing Net Income Excluding Income Tax Benefit by the Company for which there were no associated notes, certificates or secured borrowings, the outstanding principal balance, fair value and percentage of loans that are delinquent, by loan product, are as follows:
| | | | | | | | | | | | | | | | | | | | | | | |
| December 31, 2020 | | December 31, 2019 |
| (in millions, except percentages) | Outstanding Principal Balance (2) | Fair Value (3) | Delinquent Loans (3) | | Outstanding Principal Balance (2) | Fair Value (3) | Delinquent Loans (3) |
| Personal loans – standard program | $ | 171.3 | | 91.2 | % | 2.4 | % | | $ | 597.9 | | 96.5 | % | 0.8 | % |
| Personal loans – custom program | 5.7 | | 92.6 | | 4.0 | | | 92.8 | | 98.1 | | 0.4 | |
Other loans (1) | 12.0 | | 85.9 | | 12.7 | | | 103.7 | | 94.7 | | 3.9 | |
| Total | $ | 189.0 | | 90.9 | % | 3.1 | % | | $ | 794.4 | | 96.4 | % | 1.2 | % |
(1) Components of other loans are less than 10% of the outstanding principal balance if presented individually.
(2) Includes both loans held for investment and loans held for sale.
(3) Expressed as a percent of outstanding principal balance.weighted-average diluted common shares outstanding.
Decreases inWe believe TBV Per Common Share is an important measure used to evaluate the fairCompany’s use of equity. TBV Per Common Share is a non-GAAP financial measure representing the book value of total loans invested incommon equity reduced by the Company as a percentgoodwill and intangible assets, divided by ending number of outstanding principal balance from December 31, 2019 to December 31, 2020 were primarily due to changes in market conditions, including an increase in estimated expected credit lossescommon shares issued and an increase in liquidity premium due to market dislocation relating to COVID-19. In addition, loans to eligible borrowers participating in Skip-a-Pay are not considered delinquent during the commensurate period the loan is extended.
Net Annualized Charge-Off Ratesoutstanding.
The following tables show annualized net charge-off rates, which areprovide a measurereconciliation of the performance of the loans facilitated by our platform. In contrastPre-Provision Net Revenue to the graphs above, these tables show the annualized charged-off balance of loans in a specific period as a percentage of the average outstanding balance for such period.nearest GAAP measure:
| | | | | | | | | | | | | | | | | | | | |
| For the year ended December 31, | 2023 | | 2022 | | 2021 |
| GAAP Net income | $ | 38,939 | | | $ | 289,685 | | | $ | 18,580 | |
| Less: Provision for credit losses | (243,565) | | | (267,326) | | | (138,800) | |
| Less: Income tax benefit (expense) | (15,678) | | | 136,648 | | | 136 | |
| Pre-provision net revenue | $ | 298,182 | | | $ | 420,363 | | | $ | 157,244 | |
Net annualized charge-off rates are affected by the average age and grade distribution of the loans outstanding for a given quarter and the credit performance of those loans. Additionally, in any particular quarter the portfolios include loans from past vintages that were originated under prior credit underwriting parameters, and thus do not reflect the current credit underwriting parameters used to originate new loans. | | | | | | | | | | | | | | | | | | | | |
| For the year ended December 31, | 2023 | | 2022 | | 2021 |
| Non-interest income | $ | 302,781 | | | $ | 712,391 | | | $ | 605,799 | |
| Net interest income | 561,838 | | | 474,825 | | | 212,831 | |
| Total net revenue | 864,619 | | | 1,187,216 | | | 818,630 | |
| Non-interest expense | (566,437) | | | (766,853) | | | (661,386) | |
| Pre-provision net revenue | 298,182 | | | 420,363 | | | 157,244 | |
| Provision for credit losses | (243,565) | | | (267,326) | | | (138,800) | |
| Income before income tax benefit (expense) | 54,617 | | | 153,037 | | | 18,444 | |
| Income tax benefit (expense) | (15,678) | | | 136,648 | | | 136 | |
| GAAP Net income | $ | 38,939 | | | $ | 289,685 | | | $ | 18,580 | |
LENDINGCLUB CORPORATION
Management’s Discussion and Analysis of Financial Condition and Results of Operations
(Tabular Amounts in Thousands, Except Share and Per Share Data and Ratios, or as Noted)
The annualized net charge-off rates for personal loans for both standardfollowing table provides a reconciliation of Net Income Excluding Income Tax Benefit and custom programs in total forDiluted EPS Excluding Income Tax Benefit to the last five quarters were as follows:nearest GAAP measures:
| | | | | | | | | | | | | | | | | |
Total Platform (1) | December 31, 2020 | September 30, 2020 | June 30,
2020 | March 31,
2020 | December 31, 2019 |
Personal loans – standard program: | | | | | |
| Annualized net charge-off rate | 6.2 | % | 3.9 | % | 6.5 | % | 6.4 | % | 7.0 | % |
| Weighted-average age in months | 18.1 | | 16.8 | | 15.0 | | 12.9 | | 12.5 | |
| | | | | |
Personal loans – custom program: | | | | | |
| Annualized net charge-off rate | 10.9 | % | 6.4 | % | 11.4 | % | 10.6 | % | 11.5 | % |
| Weighted-average age in months | 16.3 | | 14.8 | | 12.5 | | 10.1 | | 9.4 | |
| | | | | | | | | | | | | | | | | | | | |
| As of and For The Year Ended December 31, | 2023 | | 2022 | | 2021 |
| GAAP Net income | $ | 38,939 | | | $ | 289,685 | | | $ | 18,580 | |
| Income tax benefit from release of tax valuation allowance | — | | | 143,495 | | | — | |
| Net income excluding income tax benefit | $ | 38,939 | | | $ | 146,190 | | | $ | 18,580 | |
| | | | | | |
| GAAP Diluted EPS – common stockholders | $ | 0.36 | | | $ | 2.79 | | | $ | 0.18 | |
| | | | | | |
| (A) | Income tax benefit from release of tax valuation allowance | N/A | | $ | 143,495 | | | N/A |
| (B) | Weighted-average common shares – Diluted | N/A | | 104,001,288 | | | N/A |
| (A/B) | Diluted EPS impact of income tax benefit | N/A | | $ | 1.38 | | | N/A |
| | | | | | |
| Diluted EPS excluding income tax benefit | $ | 0.36 | | | $ | 1.41 | | | $ | 0.18 | |
(1) Total platform comprises all loans facilitated through our lending marketplace, including whole loans sold and loans financed by notes, certificates and secured borrowings, but excluding education and patient finance loans, auto refinance loans and small business loans.N/A – Not applicable
The annualized net charge-off rate in the fourth quarterfollowing table provides a reconciliation of 2020 comparedTBV Per Common Share to the fourth quarter of 2019 decreased for both the standard and custom personal loan programs. The decrease was primarily due to improved performance from customers who have never taken a hardship plan, partially offset by a higher charge-off rate from customers who have enrolled in a hardship plan.nearest GAAP measure:
| | | | | | | | | | | | | | | | | |
| As of December 31, | 2023 | | 2022 | | 2021 |
| GAAP common equity | $ | 1,251,822 | | | $ | 1,164,294 | | | $ | 850,242 | |
| Less: Goodwill | (75,717) | | | (75,717) | | | (75,717) | |
| Less: Intangible assets | (12,135) | | | (16,334) | | | (21,181) | |
| Tangible common equity | $ | 1,163,970 | | | $ | 1,072,243 | | | $ | 753,344 | |
| | | | | |
| Book value per common share | | | | | |
| GAAP common equity | $ | 1,251,822 | | | $ | 1,164,294 | | | $ | 850,242 | |
| Common shares issued and outstanding | 110,410,602 | | | 106,546,995 | | | 101,043,924 | |
| Book value per common share | $ | 11.34 | | | $ | 10.93 | | | $ | 8.41 | |
| | | | | |
| Tangible book value per common share | | | | | |
| Tangible common equity | $ | 1,163,970 | | | $ | 1,072,243 | | | $ | 753,344 | |
| Common shares issued and outstanding | 110,410,602 | | | 106,546,995 | | | 101,043,924 | |
| Tangible book value per common share | $ | 10.54 | | | $ | 10.06 | | | $ | 7.46 | |
The increase in the weighted-average age in months in the fourth quarter of 2020 compared to the fourth quarter of 2019 for both the standard
Supervision and custom personal loan programs is primarily due to lower origination volume and the aging of the existing platform portfolio.
The annualized net charge-off rates for personal loans for both standard and custom programs for loans retained on our Consolidated Balance Sheets for the last five quarters were as follows:
| | | | | | | | | | | | | | | | | |
Loans Retained on Balance Sheet (1) | December 31, 2020 | September 30, 2020 | June 30,
2020 | March 31, 2020 | December 31, 2019 |
Personal loans – standard program: | | | | | |
| Annualized net charge-off rate | 5.0 | % | 1.5 | % | 4.3 | % | 4.7 | % | 7.1 | % |
| Weighted-average age in months | 16.3 | | 15.6 | | 12.8 | | 11.0 | | 12.4 | |
| | | | | |
Personal loans – custom program: | | | | | |
| Annualized net charge-off rate | 18.8 | % | 3.4 | % | 5.6 | % | (2.6) | % | 1.6 | % |
| Weighted-average age in months | 10.0 | | 8.6 | | 6.4 | | 4.7 | | 3.9 | |
(1) Loans retained on balance sheet include loans invested in by the Company as well as loans held for investment that are funded directly by member payment dependent notes related to our Retail Program and certificates.
The decrease in annualized net charge-off rates for the standard personal loan program in the fourth quarter of 2020 compared to the fourth quarter of 2019 for the loans retained on our Consolidated Balance Sheets primarily reflects a greater decrease in actual net charge-offs proportionate to the decrease in outstanding loan balances. The decrease in actual net charge-offs primarily reflects the effect of Payment Plans to provide relief to those impacted by COVID-19 and improved performance from customers who have never taken a hardship plan.
LENDINGCLUB CORPORATION
Management’s Discussion and Analysis of Financial Condition and Results of Operations
(Tabular Amounts in Thousands, Except Share and Per Share Data and Ratios, or as Noted)
Regulatory Environment
We are regularlysubject to periodic exams, investigations, inquiries or requests, enforcement actions and other proceedings from federal and state regulatory and/or law enforcement agencies, including the federal banking regulators that directly regulate the Company and/or LC Bank. Further, we are subject to claims, individual and class action lawsuits, and lawsuits alleging regulatory violations, government (including state agencies) and regulatory exams, investigations, inquiries or requests, and other proceedings.violations. The number andand/or significance of these claims, lawsuits, exams, investigations, inquiries, requests, proceedings, claims and proceedingslawsuits have been increasing since the Acquisition in part because our business expanded in scope and geographic reach, and our products and services increased in complexity. At this time, the Company is not able to project the impact of becoming a bank holding company operating a national bank on the number or significance of such matters.
State Inquiriesscope and Licensing
We have historically conducted business through nonbank entities, some of which maintain or maintained various financial services licenses in numerous jurisdictions. Much of our business activity is now conducted through the Bank pursuant to the laws applicable to national banks. Nevertheless, our nonbank entities continue to maintain certain state licenses and may continue to be subject to the regulation, supervision and enforcement of various state regulatory authorities with respect to the legacy or residual activities.
We are subject to examination by the New York Department of Financial Services (NYDFS) and regulators in other states with respect to the period prior to our acquisition of Radius and becomingpart because we became a bank holding company operating a national bank. These exams have included the application of state usury rates and lending arrangements where a bank or other third party has made a loan and then sells and assigns it to an entity that is engaged in assisting with the origination or servicing of a loan. For example, in July 2018, the NYDFS issued an Online Lending Report (Lending Report). The Lending Report included, among other things, an analysis of the online lenders operating in New York including their methods of operations, lending practices, interest rates and costs, products offered and complaints and investigations relating to online lenders. The Lending Report also included information and recommendations regarding protecting New York’s markets and consumers. Although the Lending Report noted that the rapid growth of online lending demonstrates there is value to new technologies that allow financial institutions to connect with borrowers in new ways, it noted that in many cases an online lender is the “true lender” and that lending in New York, whether through banks, credit unions or online lenders, should be subject to applicable usury limits. We have periodically had discussions with various regulatory agencies regarding our historical business model and engaged in similar discussions with the NYDFS and other regulators. During the course of such discussions, we decided to voluntarily comply with certain rules and regulations.
Prior to discontinuing the offer and sale of Retail Notes in December 2020,historically the Company undertookhas generally resolved these matters in a review ofmanner that was not materially adverse to its portfolio of licenses and had discussions with regulators in Texas, Arizona, New York, Florida and North Dakota concerning the registrations required for the Company’s issuance of Retail Notesfinancial results or business operations, no assurance can be given as to investors in these states and applied for registrations in these states to facilitate these operations. The Company had discussions with certain of these regulators to resolve concerns regarding the Company’s historical licensing/registration status in connection with Retail Notes issued and reached resolutions with Texas, Arizona and North Dakota to resolve their concerns, the outcome of which is not material to the Company’s operations or financial position. The Company is not able to predict with certainty the timing, outcome or consequenceconsequences of discussions, withany of these matters in the remaining states, including in relation to whether and how any concerns those states have will be resolved. Discussions with these remaining states could result in fines or other penalties, which are not expected to have a material adverse impact on the Company’s operations or results of operations.future.
Regulatory Actions TakenSince the Acquisition, we are subject to supervision, regulation, examination and enforcement by multiple federal banking regulatory bodies. Specifically, as a bank holding company, the Company is subject to ongoing and comprehensive supervision, regulation, examination and enforcement by the Board of Governors of the Federal Reserve System (FRB). Further, as a national bank, LC Bank is subject to ongoing and comprehensive supervision, regulation, examination and enforcement by the OCC. Accordingly, we have been and continue to invest in Relation to COVID-19
Regulators and government officials at the federal government level and in states across the country have issued orders, passed laws or otherwise issued guidance in connection with COVID-19. Some of these orders and laws have placed restrictions on debt collection activity, all or certain types of communications with delinquent borrowers or others, required that borrowers be allowed to defer payments on outstanding debt, govern credit
LENDINGCLUB CORPORATION
Management’s Discussion and Analysis of Financial Condition and Results of Operations
(Tabular Amounts in Thousands, Except Share and Per Share Data and Ratios, or as Noted)
reportingregulatory compliance and be subject to certain parameters, obligations and/or limitations set forth by the usebanking regulations and regulators with respect to the operation of credit reporting, and placed certain restrictions and requirements on operations in the workplace. We have taken steps to monitor regulatory developments relating to COVID-19 and to comply with orders and laws applicable to our business. Given the ongoing nature of the pandemic, it is possible that additional orders, laws, or regulatory guidance may still be issued. The Company is not able to predict the extent of the impact on its business from any regulatory activity relating to or resulting from COVID-19.
Consequences
If we are found to not have complied with applicable laws, regulations or requirements, we could: (i) lose one or more of our licenses or authorizations, or be required to obtain a new license or authorization, (ii) become subject to a consent order or administrative enforcement action, (iii) face lawsuits (including class action lawsuits), sanctions, penalties, or other monetary losses due to judgments, orders, or settlements, (iv) be in breach of certain contracts, which may void or cancel such contracts, (v) decide or be compelled to modify or suspend certain of our business practices and/or (vi) be unable to execute on certain Company initiatives, or (vii) be required to obtain a license in such jurisdiction, which may have an adverse effect on our ability to operate and/or evolve our lending marketplace and other products and/or services; any of which may harm our business or financial results.
See “Part I – Item 1. Business – Regulation and Supervision,” “Part I – Item 1A. Risk Factors – Risks Related to Regulation, Supervision and Compliance,” and “Part I – Item 1A. Risk Factors – Risks Related to Operating Our Business” Business”of this Annual Report for further discussion regarding our supervision and regulatory environment.
Liquidity and Capital Management
Liquidity
Our short-term liquidity needs historically have been satisfied through cash generated from the operations of facilitating loan originations, servicing fee revenue, proceeds from the sales of loans (both as whole loan sales and through Structured Program transactions), principal and interest received on loans invested in by the Company, use of existing cash and cash equivalents, and draws on our credit facilities. Market dislocations from COVID-19 throughout 2020 resulted in a significant reduction in loan origination volume, which impacted transaction fee revenue.
We prepared for the acquisition of Radius in part by selling approximately $470 million of HFS loans in the second half of 2020 and reducing leverage through eliminating the Company’s use of credit facilities, with the objective of realizing the significant value we believe this acquisition creates for the Company. Funding activities were reduced to prioritize excess cash for the completion of the Radius transaction and to inject additional capital to the Bank at the close of the acquisition to facilitate future growth. Further, to prepare for the transition to a bank-based liquidity management framework and the migration of operations into the Bank, the Company ceased the purchase of loans for Structured Program transactions.
The acquisition will enhance our liquidity management strategy by diversifying our funding sources and providing greater stability to our earnings. The stable and lower-cost deposit base will be leveraged to enable marketplace loan origination growth and the opportunity to retain loans for investment. We believe this will strengthen the resiliency of our business model by limiting our reliance on higher-cost and more volatile liquidity sources, including wholesale funding and Structured Program transactions, and reduce our balance sheet’s exposure to fluctuations in fair values during periods of market disruptions. Additionally, fee revenue from our marketplace lending activities and net interest income from loans retained on the balance sheet will generate additional liquidity and capital to facilitate loan growth. These activities will become our principal source of cash flows generated from operations. The acquisition also provides access to conduct secured borrowings through the Federal Home Loan Bank system and the Federal Reserve’s discount window.
LENDINGCLUB CORPORATION
Management’s Discussion and Analysis of Financial Condition and Results of Operations
(Tabular Amounts in Thousands, Except Share and Per Share Data and Ratios, or as Noted)
See “Item 8. Financial Statements and Supplementary Data – Notes to Consolidated Financial Statements – Note 14. Debt”for further information.
We may use our cash, cash equivalents and securities available for sale as additional sources of liquidity. Our cash and cash equivalents of $525.0 million as of December 31, 2020 are primarily held in interest-bearing deposit accounts at investment-grade financial institutions. We used approximately $395 million of our cash on hand to complete the Radius acquisition, including a $250 million infusion to further capitalize the Bank. Consistent with the bank holding company serving as a source of strength for the Bank, the remaining cash balance, excluding restricted cash, will be available to maintain liquidity and capital at the bank holding company.
Principal and interest payments due on our legacy notes and certificates are paid only when received from borrowers on the corresponding retained loans, resulting in no material impact to our liquidity.
Future cash requirements include certain contingent liabilities, including litigations and ongoing regulatory and government investigations primarily related to outstanding legacy issues. As of December 31, 2020 and 2019, we had $21.6 million and $16.0 million in accrued contingent liabilities, respectively, but actual cash payments may vary if outcomes of legal actions or settlements are different. See “Item 8. Financial Statements and Supplementary Data – Notes to Consolidated Financial Statements – Note 19. Commitments and Contingencies”for further information.
We believe, based on our projections, that our cash flow from operations are sufficient to meet our liquidity needs for the next twelve months. See “Item 8. Financial Statements and Supplementary Data – Consolidated Statements of Cash Flows” for additional detail regarding our cash flows.
Capital Management
Net capital expenditures were $31.1 million, or 10% of total net revenue, $50.7 million, or 7% of total net revenue, and $53.0 million, or 8% of total net revenue, for the years ended December 31, 2020, 2019 and 2018, respectively. Capital expenditures generally consist of internally developed software, leasehold improvements and computer equipment. Capital expenditures in 2021 are expected to be approximately $40 million, primarily related to costs associated with the continued development and support of our online lending marketplace platform.
With the Radius acquisition and the ensuing shift in our business model to holding more loans on the balance sheet of the Bank, theThe prudent management of capital is fundamental to the successful achievement of our business initiatives. We actively managereview capital through a process that continuously assesses and monitors the Company’s overall capital adequacy. Our objective is to maintain capital at an amount commensurate with our risk profile and risk tolerance objectives, and to meet both regulatory and market expectations.
The formation of theLC Bank as a nationally chartered association and the organization of the Company as a bank holding company subjects us to various capital adequacy guidelines issued by the OCC and the FRB, including the requirement to maintain regulatory capital ratios in accordance with the Basel Committee on Banking Supervision standardized approach for U.S. banking organizations (U.S.(Basel III). As a Basel III).III standardized approach institution, we selected the one-time election to opt-out of the requirements to include all the components of accumulated other comprehensive income included in common stockholder’s equity. The minimum capital requirements in order to be regarded as a well-capitalized institution under the U.S. Basel III capital framework are as follows:are: a common equityCommon Equity Tier 1 (CET1) risk-based capital ratio of 6.5%4.5%, a Tier 1 risk-based capital ratio of 8.0%6.0%, a total risk-based capital ratio of 10.0%8.0%, and a Tier 1 leverage ratio of 5.0%4.0%. Additionally, a Capital Conservation Buffer (CCB) of 2.5% must be maintained above the minimum risk-based capital requirements in order to avoid certain limitations on capital distributions, stock repurchases, and certain discretionary bonus payments. In addition to these guidelines, the banking regulators may require a banking organization to maintain capital at levels higher than the minimum ratios prescribed under the U.S. Basel III capital framework.In this regard, and unless otherwise directed by the FRB and the OCC, we havethe Company and LC Bank made commitments for the Bank(until February 2024) to maintain a common equity Tier 1CET1 risk-based capital ratio of 11%11.0%, a Tier 1 risk-based capital ratio above 11%11.0%, a total risk-based capital ratio above 13%13.0%, and a Tier 1 leverage ratio of 11%11.0%. On February 2, 2024, the Operating Agreement with the OCC expired and LC Bank and the Company are no longer subject to these ratio commitments. See “Part I – Item 1. Business – Regulation and Supervision – Capital and Liquidity Requirements and Prompt Corrective Action” of this Annual Report for additional information regarding regulatory capital requirements.
LENDINGCLUB CORPORATION
Management’s Discussion and Analysis of Financial Condition and Results of Operations
(Tabular Amounts in Thousands, Except Share and Per Share Data and Ratios, or as Noted)
The following table summarizes the Company’s and LC Bank’s regulatory capital amounts (in millions) and ratios:
| | | | | | | | | | | | | | | | | | | | | | | | | | | | | | | |
| December 31, 2023 | | December 31, 2022 | | Required Minimum plus Required CCB for Non-Leverage Ratios | | |
| Amount | | Ratio | | Amount | | Ratio | | |
| LendingClub Corporation: | | | | | | | | | | | |
CET1 capital (1) | $ | 1,090.2 | | | 17.9 | % | | $ | 1,005.8 | | | 15.8 | % | | 7.0 | % | | |
| Tier 1 capital | $ | 1,090.2 | | | 17.9 | % | | $ | 1,005.8 | | | 15.8 | % | | 8.5 | % | | |
| Total capital | $ | 1,169.2 | | | 19.2 | % | | $ | 1,088.1 | | | 17.1 | % | | 10.5 | % | | |
| Tier 1 leverage | $ | 1,090.2 | | | 12.9 | % | | $ | 1,005.8 | | | 14.1 | % | | 4.0 | % | | |
| Risk-weighted assets | $ | 6,104.5 | | | N/A | | $ | 6,360.7 | | | N/A | | N/A | | |
| Quarterly adjusted average assets | $ | 8,476.1 | | | N/A | | $ | 7,119.0 | | | N/A | | N/A | | |
| | | | | | | | | | | |
| LendingClub Bank: | | | | | | | | | | | |
CET1 capital (1) | $ | 949.4 | | | 15.8 | % | | $ | 852.2 | | | 13.8 | % | | 7.0 | % | | |
| Tier 1 capital | $ | 949.4 | | | 15.8 | % | | $ | 852.2 | | | 13.8 | % | | 8.5 | % | | |
| Total capital | $ | 1,027.4 | | | 17.1 | % | | $ | 932.4 | | | 15.1 | % | | 10.5 | % | | |
| Tier 1 leverage | $ | 949.4 | | | 11.4 | % | | $ | 852.2 | | | 12.5 | % | | 4.0 | % | | |
| Risk-weighted assets | $ | 6,022.2 | | | N/A | | $ | 6,194.0 | | | N/A | | N/A | | |
| Quarterly adjusted average assets | $ | 8,337.4 | | | N/A | | $ | 6,795.2 | | | N/A | | N/A | | |
N/A – Not applicable
(1) Consists of common stockholders’ equity as defined under U.S. GAAP and certain adjustments made in accordance with regulatory capital guidelines, including the addition of the CECL transitional benefit and deductions for goodwill and other intangible assets.
The higher risk-based capital ratios for the Company reflect generally lower risk-weights for assets held by LendingClub Corporation as compared with LC Bank.
In response to the COVID-19 pandemic, the FRB, OCC, and FDIC adopted a minimumfinal rule related to the regulatory capital treatment of threethe allowance for credit losses under CECL. As permitted by the rule, the Company elected to delay the estimated impact of CECL on regulatory capital resulting in a capital benefit of $35 million at December 31, 2021. This benefit is phased out over a three-year transition period that commenced on January 1, 2022 at a rate of 25% each year through January 1, 2025.
Liquidity
We manage liquidity to meet our cash flow and collateral obligations in a timely manner at a reasonable cost. We must maintain operating liquidity to meet our expected daily and forecasted cash flow requirements, as well as contingent liquidity to meet unexpected funding requirements.
As our primary business at LC Bank involves taking deposits and originating loans, a key role of liquidity management is to ensure that customers have timely access to funds from deposits and for loans. Liquidity management also involves maintaining sufficient liquidity to repay borrowings, pay operating expenses and support extraordinary funding requirements when necessary.
LENDINGCLUB CORPORATION
Management’s Discussion and Analysis of Financial Condition and Results of Operations
(Tabular Amounts in Thousands, Except Share and Per Share Data and Ratios, or as Noted)
LendingClub Bank Liquidity
The following table summarizes LC Bank’s primary sources of short-term liquidity as of the periods presented:
| | | | | | | | | | | |
| December 31, 2023 | | December 31, 2022 |
| Cash and cash equivalents | $ | 1,230,206 | | | $ | 1,020,874 | |
Securities available for sale (1) | $ | 370,466 | | | $ | 329,287 | |
| Deposits | $ | 7,426,445 | | | $ | 6,420,827 | |
| | | |
| Available borrowing capacity: | | | |
FHLB of Des Moines borrowing capacity (2) | $ | 661,337 | | | $ | 414,528 | |
FRB Discount Window borrowing capacity (3) | $ | 2,816,501 | | | $ | 191,021 | |
| Total available borrowing capacity | $ | 3,477,838 | | | $ | 605,549 | |
(1) Excludes illiquid securities available for sale.
(2) Includes both loans and securities available for sale pledged as collateral.
(3) LC Bank’s available borrowing capacity under the FRB Discount Window increased upon including its unsecured personal loan portfolio among the loans pledged as collateral beginning in the second quarter of 2023.
The primary uses of LC Bank liquidity include the funding/acquisition of loans and securities purchases; withdrawals, maturities and the payment of interest on deposits; compensation and benefits expense; taxes; capital expenditures, including internally developed software, leasehold improvements and computer equipment; and costs associated with the continued development and support of our online lending marketplace platform.
Net capital expenditures were $59.5 million, or 7% of total net revenue and $69.5 million, or 6% of total net revenue, for the years followingended December 31, 2023 and 2022, respectively. Capital expenditures in 2024 are expected to be approximately $50 million, primarily related to costs associated with the continued development and support of our online lending marketplace platform, including regulatory compliance costs.
LendingClub Holding Company Liquidity
The primary source of liquidity at the holding company is $110.3 million and $56.5 million in cash and cash equivalents as of December 31, 2023 and 2022, respectively. Additionally, the holding company has the ability to access the capital markets through additional registrations and public equity offerings.
Uses of cash at the holding company include the routine cash flow requirements as a bank holding company, such as interest and expenses (including those associated with our office leases), the needs of LC Bank for additional equity and, as required, its formation.need for debt financing and support for extraordinary funding requirements when necessary.
Factors Impacting Liquidity
The Company’s liquidity could be adversely impacted by deteriorating financial and market conditions, the inability or unwillingness of a creditor to provide funding, an idiosyncratic event (e.g., a major loss, causing a perceived or actual deterioration in its financial condition), an adverse systemic event (e.g., default or bankruptcy of a significant capital markets participant), or others.
We believe, based on our projections, that our cash on hand, liquid AFS securities, available borrowing capacity, and net cash flows from operating, investing and financing activities are sufficient to meet our liquidity needs for
LENDINGCLUB CORPORATION
Management’s Discussion and Analysis of Financial Condition and Results of Operations
(Tabular Amounts in Thousands, Except Share and Per Share Data and Ratios, or as Noted)
For further information on the U.S. Basel III framework, see “Part I – Item 1. Business – Regulation and Supervision–Regulatory Capital Requirements and Prompt Corrective Action.”
Contingencies
For a comprehensive discussion of contingenciesnext twelve months, as of December 31, 2020, seewell as beyond the next twelve months. See “Item 8. Financial Statements and Supplementary Data – Notes to Consolidated Financial Statements – Note 19. Commitments and Contingencies.of Cash Flows” for additional detail regarding our cash flows.
Off-Balance Sheet Arrangements
At both December 31, 2020 and 2019, a total of $5.5 million in standby letters of credit were outstanding related to certain financial covenants required for our leased facilities. To date, no amounts have been drawn against the letters of credit, which renew annually and expire at various dates through July 2026.
In the ordinary course of business, we engage in other activities that are not reflected on our Consolidated Balance Sheets, generally referred to as off-balance sheet arrangements. These activities involve our Structured Program transactions with unconsolidated variable interest entities including Company-sponsored securitizations and Certificate Program transactions. These transactions are used by the Company to provide a source of liquidity to finance our business and to diversify our investor base. The Company retains at least 5% of securities and residual interests from these transactions and enters into a servicing arrangement with the unconsolidated variable interest entity. We are exposed to market risk in the securitization market. We provide additional information regarding transactions with unconsolidated variable interest entities in “Item 8. Financial Statements and Supplementary Data – Notes to Consolidated Financial Statements – Note 7. Securitizations and Variable Interest Entities.”
Critical Accounting Estimates
Our significant accounting policies are described in “Item 8. Financial Statements and Supplementary Data – Notes to Consolidated Financial Statements – Note 2. Summary of Significant Accounting Policies” of the consolidated financial statements. We consider certain of these policies to be critical accounting policies as they require significant judgments, assumptions and estimates which we believe are critical in understanding and evaluating our reported financial results. These judgments, estimates and assumptions are inherently subjective and actual results may differ from these estimates and assumptions, and the differences could be material.
Fair Value of Loans Held for Investment, Loans Invested in by the Company, Notes and Certificates
We have elected the fair value option for loans held for investment and related notes and certificates, as well as loans invested in by the Company. We primarily use a discounted cash flow model to estimate fair value based on the present value of estimated future cash flows. This model uses both observable and unobservable inputs and reflects our best estimates of the assumptions a market participant would use to calculate fair value. The following describes the primary inputs that require significant judgment:
Expected loss rates – Expected loss rates are estimates of the principal payments that will not be repaid over the life of a loan held for investment, loan invested in by the Company, note or certificate. Expected loss rates are adjusted to reflect the expected principal recoveries on charged-off loans. Expected loss rates are primarily based on the historical performance of the loans facilitated on our platform but also incorporate discretionary adjustments based on our expectations of future credit performance.
Prepayments – Prepayments are estimates of the amount of principal payments that will occur before they are contractually required during the life of a loan held for investment, loan invested in by the Company, note or certificate. Prepayments reduce the projected principal balances, interest payments and expected time loans are
LENDINGCLUB CORPORATION
Management’s Discussion and Analysis of Financial Condition and Results of Operations
(Tabular Amounts in Thousands, Except Share and Per Share Data and Ratios, or as Noted)
outstanding. Prepayment expectations are primarily based on the historical performance of the loans facilitated on our platform but also incorporate discretionary adjustments based on our expectations of future loan performance.
Discount rates – The discount rates applied to the expected cash flows of loans held for investment and related notes and certificates, as well as loans invested in by the Company, reflect our estimates of the rates of return that investors would require when investing in financial instruments with similar risk and return characteristics.
Fair Value of Asset-backed Securities related to Structured Program Transactions
We classify asset-backed securities related to Structured Program transactions as securities available for sale. These securities are recorded at fair value and unrealized gains and losses are reported, net of taxes, in “Accumulated other comprehensive income (loss)” in the Company’s Consolidated Balance Sheets unless management determines that a security is impaired due to a deterioration in expected cash flows, in which case the unrealized loss is recognized in earnings as a valuation allowance for credit losses.
We estimate fair value based on the price of transactions for similar instruments if available. If market observable prices are not available, we use a discounted cash flow model to estimate fair value based on the present value of estimated future cash flows. This model uses inputs that are both observable and not observable and reflect our best estimates of the assumptions a market participant would use to calculate fair value. The following describes the primary inputs that require significant judgment:
Expected loss rates – Expected loss rates are estimates of the principal payments that will not be repaid over the life of loans backing the security. Expected loss rates are adjusted to reflect the expected principal recoveries on charged-off loans. Expected loss rates are primarily based on the historical performance of the loans facilitated on our platform but also incorporate discretionary adjustments based on our expectations of future credit performance.
Prepayments – Prepayments are estimates of the amount of principal payments that will occur before they are contractually required during the life of loans backing the security. Prepayments reduce the projected principal balances, interest payments and expected time loans are outstanding. Prepayment expectations are primarily based on the historical performance of the loans facilitated on our platform but also incorporate discretionary adjustments based on our expectations of future loan performance.
Discount rates – The discount rates for asset-backed securities reflect our estimates of the rates of return that investors would require when investing in financial instruments with similar risk and return characteristics. The primary source of discount rate observations is the rate of return implied by sales of comparable asset-backed securities.
Fair Value of Servicing Assets
We record servicing assets at their estimated fair values when we sell loans or we assume or acquire a servicing obligation whereby the underlying loans are not included in our financial statements. The gain or loss on a loan sale is recorded separately in “Gain on sales of loans” in our Consolidated Statements of Operations while the component of the gain or loss that is based on the degree to which the contractual servicing fee is above or below an estimated market servicing rate is recorded as a servicing asset. Servicing assets are reported in “Other assets” on our Consolidated Balance Sheets. Changes in the fair value of servicing assets are reported in “Investor fees” on our Consolidated Statements of Operations in the period in which the changes occur.
We use a discounted cash flow model to estimate the fair values of loan servicing assets. The cash flows in the valuation model represent the difference between the servicing fees charged and an estimated market servicing rate. Since servicing fees are generally based on the monthly unpaid principal balance of the underlying loans, the
LENDINGCLUB CORPORATION
Management’s Discussion and Analysis of Financial Condition and Results of Operations
(Tabular Amounts in Thousands, Except Share and Per Share Data and Ratios, or as Noted)
expected cash flows in the model incorporate estimated net expected losses and expected prepayments. The significant assumptions used in valuing our servicing assets are:
Market servicing rates – We consider market servicing rates as those rates which a market participant would require to service the loans that we sell. We estimate these market servicing rates based on our review of available observable market servicing rates.
Discount rates – The discount rates for loan servicing rights reflect our estimates of the rates of return that investors in servicing rights for unsecured consumer credit obligations would require when investing in similar servicing rights.
We also incorporate estimates of net losses and prepayments in our estimation of fair value of servicing assets. These inputs are consistent with the assumptions used in the valuation of loans held for investment and related notes and certificates, as well as loans invested in by the Company.
Loss Contingencies
Loss contingencies, including claims and legal actions arising in the ordinary course of business, are recorded as liabilities in “Accrued expenses and other liabilities” in the Company’s Consolidated Balance Sheets. Associated legal expense is recorded in “Other general and administrative” expense or in “Class action and regulatory litigation expense” for the losses associated with the securities class action lawsuits, as described in “Item 8. Financial Statements and Supplementary Data – Notes to Consolidated Financial Statements – Note 19. Commitments and Contingencies,” in the Company’s Consolidated Statements of Operations. Such liabilities and associated expenses are recorded when the likelihood of loss is probable and an amount or range of loss can be reasonably estimated. The Company will also disclose a range of exposure to incremental loss when such amounts are reasonably possible and can be estimated. In estimating the Company’s exposure to loss contingencies, if an amount within the estimated range of loss is the best estimate, that amount will be accrued. However, if there is no amount within the estimated range of loss that is the best estimate, the Company will accrue the minimum amount within the range, and disclose the amount up to the high end of the range as an exposure to incremental loss, if such amount is considered reasonably possible. Such estimates are based on the best information available at the time. As additional information becomes available, we reassess the potential liability and record an adjustment to our estimate in the period in which the adjustment is probable and an amount or range can be reasonably estimated. The determination of an expected contingent liability and associated litigation expense requires the Company to make assumptions related to the outcome of these matters. Due to the inherent uncertainties of loss contingencies, our estimates may be different than the actual outcomes.
LENDINGCLUB CORPORATION
Management’s Discussion and Analysis of Financial Condition and Results of Operations
(Tabular Amounts in Thousands, Except Share and Per Share Data and Ratios, or as Noted)
Item 7A. Quantitative and Qualitative Disclosures About Market Risk
Market risk represents the risk of potential losses arising from changes in interest rates, foreign exchange rates, equity prices, commodity prices, and/or other relevant market rates or prices. The primary market risk to which we are exposed is interest rate risk. Interest rate risk arises from financial instruments including loans, securities and borrowings, as well as servicing assets, all entered into for purposes other than trading. We have experienced significant dislocation in the capital markets due to COVID-19. See “Part II – Item 7. Management’s Discussion and Analysis of Financial Condition and Results of Operations – Overview” for additional information.
The acquisition of Radius has significantly changed our interest rate risk profile. Loans held for investment will be funded primarily through the Radius deposit base, and the majority of loans on the balance sheet, at any point in time, will be retained in the held-for-investment portfolio and be accounted for at amortized cost. As a result, the primary component of interest rate risk on our financial instruments will arise from the impact of fluctuations in loan and deposit rates on our net interest income. We will measure this sensitivity by assessing the impact of hypothetical changes in interest rates on our net interest income results. Our legacy portfolio of Loans Invested in by the Company at fair value will decline over time. Consequently, the impact of interest rate changes on the fair value of the legacy portfolio will decrease as the portfolio runs off.
As the Radius acquisition was completed in the first quarter of 2021, the following interest rate sensitivity simulations at December 31, 2020 and 2019 do not include Radius financial instruments.
Interest Rate Sensitivity
LendingClub Bank
Our net interest income is affected by changes in the level of interest rates, the impact of interest rate fluctuations on asset prepayments, and the level and composition of deposits and liabilities, among other factors.
Loans Invested in byHFI at LC Bank are funded primarily through our deposit base. The majority of loans HFI are fixed-rate instruments over the Company. term of the loans. As a result, the primary component of December 31, 2020 and 2019, we were exposed to interest rate risk on $171.9 million and $766.0 million of loans invested in by the Companyour financial instruments at fair value, respectively, which have fixed interest rates. Any realized or unrealized lossesLC Bank arises from interest rate changes are recorded in earnings. The following table presents the impact of fluctuations in loan and deposit rates on our net interest income. Therefore, we use a sensitivity analysis to assess the fair valueimpact of loans invested in by the Company due to a hypothetical changechanges in interest rates ason our net interest income results. The outcome of December 31, 2020the analysis is influenced by a variety of assumptions, including the maturity profile and 2019:
| | | | | | | | | | | |
| Loans Invested in by the Company |
| December 31, | 2020 | | 2019 |
| Fair value | $ | 171,856 | | | $ | 766,048 | |
| Interest rates | | | |
| 100 basis point increase | $ | (1,692) | | | $ | (9,806) | |
| 100 basis point decrease | $ | 1,721 | | | $ | 10,014 | |
Securities Available for Sale. Asprepayment level of December 31, 2020our unsecured consumer loans and 2019, we were exposedexpected consumer responses to changes in rates paid on non-maturity deposit products. Our assumptions are periodically calibrated to observed data and/or expected outcomes. We actively monitor the level of exposure to movements in interest rates and have entered into interest rate risk on $142.2 millionswaps, which qualify for hedge accounting treatment, to manage such risk. See “Item 8. Financial Statements and $270.9 million of securities availableSupplementary Data – Note 9. Derivative Instruments and Hedging Activities” for sale, respectively, including $142.0 million and $220.1 million, respectively, of asset-backed securities related to Structured Program transactions. To manage this risk, we limit and monitor maturities, credit ratings, performance of loans underlying Structured Program transactions and concentrations within the investment portfolio.additional information.
The following table presents the change in projected net interest income for the next twelve months due to a hypothetical instantaneous parallel change in interest rates relative to current rates:
| | | | | | | | | | | | | |
| |
| | | | | |
| December 31, 2023 | | December 31, 2022 | | |
| Instantaneous Change in Interest Rates: | | | | | |
| + 200 basis points | (4.8) | % | | (6.9) | % | | |
| + 100 basis points | (2.2) | % | | (3.3) | % | | |
| - 100 basis points | 0.0 | % | | 1.9 | % | | |
| - 200 basis points | (0.4) | % | | 3.5 | % | | |
As illustrated in the table above, net interest income is projected to decrease over the next twelve months during hypothetical rising interest rate environments primarily as a result of higher rates paid on interest-bearing deposits, partially offset by higher rates earned on new loans, investment purchases, and cash and cash equivalents as well as by the impact of our hedging activity. During hypothetical declining interest rate environments net interest income is projected to remain relatively flat. The decrease in sensitivity as of December 31, 2023 relative to the prior year is primarily due to the composition of our loans and deposits, and recent hedging activity. Furthermore, during fluctuating interest rate environments, the increased sensitivity of repricing interest-bearing deposits is more impactful than that of repricing fixed rate loans.
Although we believe that these measurements provide an estimate of our interest rate sensitivity, they do not account for potential changes in credit quality, balance sheet mix, size of our balance sheet, or other business
LENDINGCLUB CORPORATION
Management’s Discussion and Analysis of Financial Condition and Results of Operations
(Tabular Amounts in Thousands, Except Share and Per Share Data and Ratios, or as Noted)
developments that could affect net income. Actual results could differ materially from the estimated outcomes of our simulations.
Maturities
The following table presents the maturities of loans and leases held for investment at amortized cost and at fair value as of December 31, 2023:
| | | | | | | | | | | | | | | | | | | | | | | | | |
| Due in
1 Year or Less | | Due After
1 Year Through
5 Years | | Due After
5 Years
Through
15 Years | | December 31, 2023 | | |
| Unsecured personal | $ | 221,032 | | | $ | 3,578,646 | | | $ | 189,342 | | | $ | 3,989,020 | | | |
| Residential mortgages | 2,833 | | | 5,453 | | | 174,764 | | | 183,050 | | | |
| Secured consumer | 455 | | | 172,231 | | | 77,353 | | | 250,039 | | | |
| | | | | | | | | |
| Total consumer loans held for investment | 224,320 | | | 3,756,330 | | | 441,459 | | | 4,422,109 | | | |
| Equipment finance | 7,674 | | | 81,939 | | | 21,379 | | | 110,992 | | | |
| Commercial real estate | 23,949 | | | 93,242 | | | 263,131 | | | 380,322 | | | |
| Commercial and industrial | 5,798 | | | 30,321 | | | 162,950 | | | 199,069 | | | |
| Total commercial loans and leases held for investment | 37,421 | | | 205,502 | | | 447,460 | | | 690,383 | | | |
| Total loans and leases held for investment | $ | 261,741 | | | $ | 3,961,832 | | | $ | 888,919 | | | $ | 5,112,492 | | | |
| Loans and leases due after one year at fixed interest rates | $ | — | | | $ | 3,898,311 | | | $ | 442,870 | | | $ | 4,341,181 | | | |
| Loans and leases due after one year at variable interest rates | $ | — | | | $ | 63,521 | | | $ | 446,049 | | | $ | 509,570 | | | |
For the contractual maturities and weighted-average yields on the Company’s AFS securities portfolio, see “Item 8. Financial Statements and Supplementary Data – Notes to Consolidated Financial Statements – Note 5. Securities Available for Sale.”
LendingClub Holding Company
At the holding company level, we continue to measure interest rate sensitivity by evaluating the change in fair value of securities available for salecertain assets and liabilities due to a hypothetical change in interest rates. Principal payments on our loans HFI continue to reduce the outstanding balance of this portfolio, and, as a result, the fair value impact from changes in interest rates continues to diminish.
Contingencies
For a comprehensive discussion of contingencies as of December 31, 20202023, see “Item 8. Financial Statements and 2019:Supplementary Data – Notes to Consolidated Financial Statements – Note 20. Commitments and Contingencies.”
| | | | | | | | | | | |
| Securities Available for Sale |
| December 31, | 2020 | | 2019 |
| Fair value | $ | 142,226 | | | $ | 270,927 | |
| Interest rates | | | |
| 100 basis point increase | $ | (1,145) | | | $ | (2,313) | |
| 100 basis point decrease | $ | 1,145 | | | $ | 2,301 | |
Critical Accounting Estimates
Our significant accounting policies are described in “Item 8. Financial Statements and Supplementary Data – Notes to Consolidated Financial Statements – Note 1. Summary of Significant Accounting Policies.” We consider certain of these policies to be critical accounting policies as they require significant management judgments, assumptions and estimates which we believe are critical in understanding and evaluating our reported financial results. These judgments, estimates and assumptions are inherently subjective and actual results may materially differ from these estimates and assumptions.
LENDINGCLUB CORPORATION
Management’s Discussion and Analysis of Financial Condition and Results of Operations
(Tabular Amounts in Thousands, Except Share and Per Share Data and Ratios, or as Noted)
Allowance for Loan and Lease Losses
Servicing Assets. AsUnder the CECL model, we reserve for expected credit losses on our loan and lease portfolio when loans are initially recorded as HFI at amortized cost through the ALLL by using a DCF approach to calculate the NPV of December 31, 2020 and 2019, we were exposed to interest rate risk from our servicing assets of $56.3 million and $89.7 million, respectively. The following table presents the impact toexpected cash flows. Loans accounted for under the fair value of servicing assets due to a hypothetical changeoption do not have an ALLL. Changes in the expected prepayment rates ascredit risk profile of December 31, 2020our loans and 2019:
| | | | | | | | | | | |
| Servicing Assets |
| December 31, | 2020 | | 2019 |
| Fair value | $ | 56,347 | | | $ | 89,680 | |
| Expected prepayment rates | | | |
| 10 percent increase | $ | (1,596) | | | $ | (2,962) | |
| 10 percent decrease | $ | 1,596 | | | $ | 2,962 | |
The fair valuesALLL represents our estimate of expected lifetime credit losses over the contractual life of the loan portfolio. Our determination of the ALLL is based on regular and periodic evaluation of the loan portfolio considering a number of relevant underlying factors, including key assumptions and evaluation of quantitative and qualitative information from internal and external sources. Estimates of expected future loan losses are determined by using statistical models and management’s judgement. The models are designed to forecast probability and timing of default, loss rate exposure at default, recovery expectations, and timing and amount of estimated prepayments by correlating certain macroeconomic unemployment forecast data to historical experience. Our statistical models, applied at the portfolio level to pools of our assetsloans with similar risk characteristics, produce expected cash flows, which are then discounted at the effective interest rate to derive the NPV. The difference between the NPV and liabilities are sensitivethe amortized cost determines the ALLL. The effective interest rate is calculated based on the periodic interest income received from the loan’s contractual cash flows, which includes deferred origination fees and costs, to changesprovide a constant rate of return over the contractual loan term. Under the DCF approach, the provision for credit losses includes credit loss expense in interest rates. Fixed rate assets may decline in valuesubsequent periods relating to the discounting effect due to a risethe passage of time after the initial recognition of ALLL on originated HFI loans at amortized cost.
Our qualitative allowance is primarily based on macroeconomic unemployment forecast information provided by an external third-party economist, incorporating management’s judgement, and is included in interest rates, while floating rate assetsthe estimation of expected future expected credit losses. In addition, the qualitative allowance includes adjustments in circumstances where the statistical model output is inconsistent with management’s expectations relating to economic conditions and expected credit losses. Management may produce less income thanmake adjustments as the assumptions in the underlying analyses change to reflect an estimate of expected if interest rates fall. The impact of changes in interest rates would be reduced bylifetime loan losses and prepayments at the factreporting date, based on the best information available at that increases or decreases in fair values of assets would be partially offset by corresponding changes in fair values of liabilities.time.
Credit Facilities and Securities Sold Under Repurchase Agreements. As of December 31, 2020, all previously existing credit facilities were fully repaid and terminated and the securities sold under repurchase agreements bore fixed interest rates, therefore, we were not exposed to any interest rate risk.As of December 31, 2019, we were exposed to interest rate risk on $387.3 million of funding under the Personal Loan and Auto Loan Warehouse Credit Facilities, $60.0 million of funding under the Revolving Facility and $140.2 million of funding under our securities sold under repurchase agreements.
As described above, because we were not exposed to any interest rate risk related to our credit facilities and securities sold under repurchase agreements at December 31, 2020, the following table presents the impact to the annualized interest expense due to a hypothetical change in the one-month LIBOR rate as of December 31, 2019:
| | | | | | | |
| | | Credit Facilities and Securities Sold Under Repurchase Agreements |
December 31, | | | 2019 |
Carrying value | | | $ | 587,453 | |
One-month LIBOR | | | |
100 basis point increase | | | $ | 5,875 | |
100 basis point decrease | | | $ | (5,875) | |
Cash and Cash Equivalents. As of December 31, 2020 and 2019, we had cash and cash equivalents of $525.0 million and $243.8 million, respectively. These amounts were held primarily in interest-bearing deposits at investment grade financial institutions, institutional money market funds, certificates of deposit, and commercial paper, which are short-term. Due to their short-term nature, we do not believe we have material exposure to changes in the fair value of these liquid investments as a result of changes in interest rates.
Item 7A. Quantitative and Qualitative Disclosures About Market Risk
For a comprehensive discussion regarding quantitative and qualitative disclosures about market risk, see “Item 7. Management’s Discussion and Analysis of Financial Condition and Results of Operations – Market Risk.”
Item 8. Financial Statements and Supplementary Data
REPORT OF INDEPENDENT REGISTERED PUBLIC ACCOUNTING FIRM
To the stockholders and the Board of Directors of LendingClub Corporation:
Opinion on the Financial Statements
We have audited the accompanying consolidated balance sheets of LendingClub Corporation and subsidiaries (the “Company”) as of December 31, 20202023 and 2019,2022, the related consolidated statements of operations,income, comprehensive income, (loss), changes in stockholders’ equity, and cash flows, for each of the three years in the period ended December 31, 2020,2023, and the related notes (collectively referred to as the “financial statements”). In our opinion, the financial statements present fairly, in all material respects, the financial position of the Company as of December 31, 20202023 and 2019,2022, and the results of its operations and its cash flows for each of the three years in the period ended December 31, 2020,2023, in conformity with accounting principles generally accepted in the United States of America.
We have also audited, in accordance with the standards of the Public Company Accounting Oversight Board (United States) (PCAOB), the Company’s internal control over financial reporting as of December 31, 2020,2023, based on criteria established in Internal Control – Integrated Framework (2013) issued by the Committee of Sponsoring Organizations of the Treadway Commission and our report dated March 11, 2021,February 16, 2024, expressed an unqualified opinion on the Company’s internal control over financial reporting.
Basis for Opinion
These financial statements are the responsibility of the Company’s management. Our responsibility is to express an opinion on the Company’s financial statements based on our audits. We are a public accounting firm registered with the PCAOB and are required to be independent with respect to the Company in accordance with the U.S. federal securities laws and the applicable rules and regulations of the Securities and Exchange Commission and the PCAOB.
We conducted our audits in accordance with the standards of the PCAOB. Those standards require that we plan and perform the audit to obtain reasonable assurance about whether the financial statements are free of material misstatement, whether due to error or fraud. Our audits included performing procedures to assess the risks of material misstatement of the financial statements, whether due to error or fraud, and performing procedures that respond to those risks. Such procedures included examining, on a test basis, evidence regarding the amounts and disclosures in the financial statements. Our audits also included evaluating the accounting principles used and significant estimates made by management, as well as evaluating the overall presentation of the financial statements. We believe that our audits provide a reasonable basis for our opinion.
Critical Audit MattersMatter
The critical audit mattersmatter communicated below are mattersis a matter arising from the current-period audit of the financial statements that werewas communicated or required to be communicated to the audit committee and that (1) relaterelates to accounts or disclosures that are material to the financial statements and (2) involved our especially challenging, subjective, or complex judgments. The communication of a critical audit mattersmatter does not alter in any way our opinion on the financial statements, taken as a whole, and we are not, by communicating the critical audit mattersmatter below, providing a separate opinionsopinion on the critical audit mattersmatter or on the accounts or disclosures to which they relate.it relates.
Valuation of Level 3 Financial Assets including Unobservable Inputs therein
–Securities Available1) Allowance for Saleloan and lease losses – See Consumer Loans – Refer to “Note 5. Securities Available6. Loans and Leases Held for Sale
–Investment at Amortized Cost, Net of Allowance for Loan and Lease LossesFair Value of Assets and Liabilities – See Note 8. Fair Value of Assets and Liabilities
–Other Assets – Loan Servicing Assets at Fair Value – See Note 10. Other Assets” to the consolidated financial statements
Critical Audit Matter Description
In structured program transactions that meetThe allowance for loan and lease losses (ALLL) on consumer loans represents the applicable criteriaCompany’s estimate of expected lifetime credit losses over the contractual life of the loan portfolio. The majority of the ALLL relates to be accounted for asthe
unsecured personal loans class of financing receivables within the consumer loan portfolio. The determination of the ALLL is based on the Company’s periodic evaluation of performance of the consumer loan portfolio considering a sale,number of underlying factors, including key assumptions and quantitative and qualitative information. The estimate of expected future loan losses is determined using statistical models and management’s judgement.
The quantitative component of the Company retains certain asset-backed securities including subordinated residual interests and CLUB Certificates, which are classified as securities available for sale. Additionally, the Company has servicing assets related to the ongoing servicing of whole loans previously sold. The fair value of each of these Level 3 assets are estimatedALLL is primarily based on statistical models using a discounted cash flow modelsapproach and include unobservable inputs.known and estimated data based on current probability and timing of defaults, loss rate and recovery exposure at default, timing and amount of estimated prepayments, and relevant risk characteristics to estimate the shortfall in contractual cash flows for each loan pool over the remaining life of the loans.
AuditingQualitative adjustments to the modelsmodeled estimate of expected credit losses are also considered to address certain identified elements that are not directly captured by the statistical model. The qualitative allowance is primarily based on a macroeconomic unemployment forecast provided by an external third-party economist, and unobservable inputs used by managementalso incorporates management’s judgement.In addition, the qualitative allowance includes adjustments in circumstances where the statistical model output is inconsistent with management’s expectations related to estimateeconomic conditions and expected credit losses.
Given the fair valuesize of these Level 3 assets involvesthe unsecured personal loan portfolio and the subjective nature of estimating the ALLL, including management’s expectations related to macroeconomic conditions and complex judgments.expected losses, auditing the ALLL involved a high degree of auditor judgment and an increased extent of effort.
How the Critical Audit Matter Was Addressed in the Audit
Our audit procedures related to the models and unobservable inputsassumptions used by management to estimate the fair value of these Level 3 assetsallowance for loan losses relating to the unsecured personal loan portfolio, included the following, key procedures:among others:
•
◦We tested the effectiveness of the controls over the valuation of asset-backed securities including subordinated residual interests and CLUB Certificates, and the valuation of servicing assets, including controls related to price calibration, discount rate, loss curves and prepayment curves.
•We gained an understanding(i) selection of the significance of inputsstatistical model methodology, (ii) development, execution, and assumptions using sensitivity analysis, identifying relevant inputs and assumptions for further testing.
•We gained an understandingmonitoring of the relevant assumptions used in valuation of servicing rightsstatistical models, (iii) accuracy and evaluated management’s study on market rate of servicing and their expectation of ancillary fees based on historical averages and other estimates.
•We attended the quarterly valuation committee meetings and observed if memberscompleteness of the committee challenge the estimates and assumptions made by the credit risk and loss forecasting teams. We obtained and reviewed management's written policies and procedures to derive the fair value of these assets and determined if valuations were appropriately approved by management.
•We compared management’s assumptions to external sources, including the Company’s comparable market transactionsignificant data where available.
•With the assistance of our fair value specialists, we developed independent estimates of fair values and compared our estimates to the Company’s estimates.
Valuation and Disclosure of Litigation and Regulatory Matters
–Commitments and Contingencies – See Note 19. Commitments and Contingencies
Critical Audit Matter Description
The accrued contingent liability and associated litigation expense related to certain ongoing litigation and regulatory matters is estimated, recorded and disclosed based on the Company’s expectations regarding the probability and magnitude of any expected losses. These estimates are refined as information becomes available over the courseinputs, (iv) determination of the associated matters. The determination of an expected contingent liabilityqualitative adjustment, and associated litigation expense, and evaluation of disclosure with respect to any incremental range of reasonably possible loss, require management to make assumptions and estimates related to the outcome of these matters. Due to the inherent uncertainty involved in the assessment of the outcomes, the actual loss may be different than the Company’s estimate of expected loss. The Company’s accrued contingent liability as of December 31, 2020 was $21.6 million, with contingent liability expense for the year ended December 31, 2020 of $7.4 million. The Company has further concluded there is no range of incremental reasonably possible loss.
Auditing the probability of an unfavorable outcome and the estimate of the associated exposure involves subjective and complex judgement and careful evaluation of the facts in coordination with the Company’s legal counsel as information becomes available.
How the Critical Audit Matter Was Addressed in the Audit
Our audit procedures related to assessing the probability of outcome related to these matters, including the estimated probable loss and management’s conclusion that there is no incremental reasonably possible loss, included the following key procedures:
•We tested the effectiveness of controls over the valuation of contingent liabilities related to outstanding and anticipated litigation and regulatory matters, including the evaluation of whether such exposures are probable or reasonably possible.
•We tested the effectiveness of controls over the presentation(v) overall calculation and disclosure of litigation and regulatory matters.the ALLL.
•We inspected board and committee meeting materials and minutes and attended meetings with General Counsel, Executives and the Audit Committee for updates on litigation and regulatory matters.
•We sent independent third-party confirmations to external counsel and ascertained completeness of the litigation matters brought to our attention by internal counsel.
•◦We evaluated the reasonableness of management’s estimatesaggregation and segmentation of loss contingenciesthe current loan data and historical loan data established by holding meetings with managementthe Company and its appropriateness in supporting the Company’s internal counsel, reviewing the Company’s responses to regulators where applicable.estimate.
•◦We assessed the reasonableness of qualitative adjustments as considered by the Company based on loan portfolio, market conditions and significant assumptions including macroeconomic overlays, in the context of applicable financial reporting framework.
◦We evaluated management’s ability to estimate loss contingencies by comparing actual settlements for matters existing at the endappropriateness of prior periods with their historical forecasts.the Company’s accounting policies and methodologies involved in the application of the applicable accounting standards.
•◦We obtained a legal letter frominvolved our credit specialists to assist us in evaluating the Company’s internal counsel detailingselection of the status of all material current litigation and regulatory matters commensurate with the date of our reports.
Valuation and Classification of Series A Preferred Stock issued in exchange for Common Stock
– Deemed Dividend – See Note 4. Net Income (Loss) Per Share
– Preferred Stock – See Note 15. Stockholders’ Equity
Critical Audit Matter Description
In February 2020,statistical model methodology utilized by the Company entered into an exchange agreement with its largest stockholder, Shanda Asset Management Holdings Limited and its affiliates (Shanda), pursuant to which, on March 20, 2020, Shanda exchanged all of its 19.56 million shares of common stockin estimation for 195,628 newly issued shares of mandatorily convertible non-voting LendingClub preferred stock, series A (Series A Preferred Stock) and a one-time cash payment of $50.2 million.
The Company further evaluatedloan losses, including key assumptions, the disclosure requirements, concluding that the Series A Preferred Stock is considered a separate class of common shares for purposes of calculating net income (loss) per share, and that basic and diluted net income (loss) per share should be computed using the two-class method.
The Company engaged a valuation expert to value the Series A Preferred Stock on the dateexecution of the exchange agreementstatistical models, and determined that the effective conversion price for the Series A Preferred Stock was less than the fair valuereasonableness of the common stock. Based on the assessment performed, the Company concluded that the value differential between the shares exchanged approximated the amount paid in cash and as such identified a beneficial conversion feature, recognized as a deemed dividend of $50.2 million within accumulated deficit. The deemed dividend is an adjustment to net loss to arrive at net loss attributable to common stockholders.
Auditing the Company’s valuation of Series A Preferred Stock and technical accounting conclusionsjudgments related to the share exchange transaction required significant judgement given the complexity involved in applying the relevant accounting standards.
How the Critical Audit Matter Was Addressed in the Audit
Our audit procedures related to assessing the valuation and accounting conclusions related to share exchange transaction included the following key procedures:
•We tested the effectiveness of controls over management’s technical accounting analysis for the share exchange transaction, including analysis of related disclosures.
•We inspected the relevant share exchange agreement and obtained evidence for the related cash payment.
•With the assistance of our valuation specialists, we evaluated the reasonableness of the valuation model and assumptions used by management in estimating the fair value of Series A Preferred Stock
•We consulted with our National Office and utilized individuals with specialized skill and knowledge in technical accounting with respect to application of accounting literature to the share exchange transaction, and evaluated the related accounting conclusions, identification of the beneficial conversion feature, the classification of the transaction in equity, and presentation with respect to net income (loss) per share under the two-class method.
•We inspected the board and committee meeting materials and minutes and attended meetings with General Counsel, Executives and the Audit Committee for updates on share exchange transaction.
/s/ DELOITTE & TOUCHE LLP
San Francisco, California
March 11, 2021February 16, 2024
We have served as the Company’s auditor since 2013.
| | | | | | | | | | | |
| December 31, | 2020 | | 2019 |
| Assets | | | |
| Cash and cash equivalents | $ | 524,963 | | | $ | 243,779 | |
Restricted cash (1) | 103,522 | | | 243,343 | |
| Securities available for sale at fair value | 142,226 | | | 270,927 | |
Loans held for investment at fair value (1) | 636,686 | | | 1,079,315 | |
Loans held for investment by the Company at fair value (1) | 49,954 | | | 43,693 | |
Loans held for sale by the Company at fair value (1) | 121,902 | | | 722,355 | |
Accrued interest receivable (1) | 5,205 | | | 12,857 | |
| Property, equipment and software, net | 96,641 | | | 114,370 | |
| Operating lease assets | 74,037 | | | 93,485 | |
| Intangible assets, net | 11,427 | | | 14,549 | |
| | | |
Other assets (1) | 96,730 | | | 143,668 | |
| Total assets | $ | 1,863,293 | | | $ | 2,982,341 | |
| Liabilities and Equity | | | |
| Accounts payable | $ | 3,698 | | | $ | 10,855 | |
Accrued interest payable (1) | 4,572 | | | 9,260 | |
| Operating lease liabilities | 94,538 | | | 112,344 | |
Accrued expenses and other liabilities (1) | 101,457 | | | 142,636 | |
| Payable to investors | 40,286 | | | 97,530 | |
Notes, certificates and secured borrowings at fair value (1) | 636,774 | | | 1,081,466 | |
Payable to Structured Program note and certificate holders at fair value (1) | 152,808 | | | 40,610 | |
Credit facilities and securities sold under repurchase agreements (1) | 104,989 | | | 587,453 | |
| Total liabilities | 1,139,122 | | | 2,082,154 | |
| Equity | | | |
| Series A Preferred stock, $0.01 par value; 1,200,000 shares authorized; 43,000 and 0 shares issued and outstanding, respectively | 0 | | | 0 | |
| Common stock, $0.01 par value; 180,000,000 shares authorized; 88,149,510 and 89,218,797 shares issued, respectively; 88,149,510 and 88,757,406 shares outstanding, respectively | 881 | | | 892 | |
| Additional paid-in capital | 1,508,020 | | | 1,467,882 | |
| Accumulated deficit | (786,214) | | | (548,472) | |
| Treasury stock, at cost; 0 and 461,391 shares, respectively | 0 | | | (19,550) | |
| Accumulated other comprehensive income (loss) | 1,484 | | | (565) | |
| | | |
| | | |
| Total equity | 724,171 | | | 900,187 | |
| Total liabilities and equity | $ | 1,863,293 | | | $ | 2,982,341 | |
(1) Includes amounts in consolidated variable interest entities (VIEs) presented separately in the table below.
LENDINGCLUB CORPORATION
Consolidated Balance Sheets
(In Thousands, Except Share and Per Share Amounts)
The following table presents the assets and liabilities of consolidated VIEs, which are included in the Consolidated Balance Sheets above. The assets in the table below may only be used to settle obligations of consolidated VIEs and are in excess of those obligations. Additionally, the assets and liabilities in the table below include third-party assets and liabilities of consolidated VIEs only and exclude intercompany balances that eliminate in consolidation.
| | | | | | | | | | | |
| December 31, | 2020 | | 2019 |
| Assets of consolidated VIEs, included in total assets above | | | |
| Restricted cash | $ | 15,983 | | | $ | 30,046 | |
| Loans held for investment at fair value | 52,620 | | | 197,842 | |
| Loans held for investment by the Company at fair value | 50,102 | | | 40,251 | |
| Loans held for sale by the Company at fair value | 98,190 | | | 551,455 | |
| Accrued interest receivable | 1,134 | | | 4,431 | |
| Other assets | 136 | | | 1,359 | |
| Total assets of consolidated variable interest entities | $ | 218,165 | | | $ | 825,384 | |
| Liabilities of consolidated VIEs, included in total liabilities above | | | |
| Accrued interest payable | $ | 721 | | | $ | 3,185 | |
| Accrued expenses and other liabilities | 8 | | | 244 | |
| Notes, certificates and secured borrowings at fair value | 52,620 | | | 197,842 | |
| Payable to Structured Program note and certificate holders at fair value | 152,808 | | | 40,610 | |
| Credit facilities and securities sold under repurchase agreements | 0 | | | 387,251 | |
| Total liabilities of consolidated variable interest entities | $ | 206,157 | | | $ | 629,132 | |
See Notes to Consolidated Financial Statements.
LENDINGCLUB CORPORATION
Consolidated Balance Sheets
(In Thousands, Except Share and Per Share Amounts)
| | | | | | | | | | | | | | | | | |
| Year Ended December 31, | 2020 | | 2019 | | 2018 |
| Net revenue: | | | | | |
| | | | | |
| Transaction fees | $ | 207,640 | | | $ | 598,760 | | | $ | 526,942 | |
| | | | | |
| Interest income | 209,694 | | | 345,345 | | | 487,462 | |
| Interest expense | (141,503) | | | (246,587) | | | (385,605) | |
| Net fair value adjustments | (117,247) | | | (144,990) | | | (100,688) | |
| Net interest income and fair value adjustments | (49,056) | | | (46,232) | | | 1,169 | |
| Investor fees | 111,864 | | | 124,532 | | | 114,883 | |
| Gain on sales of loans | 30,812 | | | 67,716 | | | 45,979 | |
| Net investor revenue | 93,620 | | | 146,016 | | | 162,031 | |
| | | | | |
| Other revenue | 13,442 | | | 13,831 | | | 5,839 | |
| | | | | |
| Total net revenue | 314,702 | | | 758,607 | | | 694,812 | |
| Operating expenses: | | | | | |
| Sales and marketing | 79,055 | | | 279,423 | | | 268,517 | |
| Origination and servicing | 71,193 | | | 103,403 | | | 99,376 | |
| Engineering and product development | 139,050 | | | 168,380 | | | 155,255 | |
| Other general and administrative | 213,021 | | | 238,292 | | | 228,641 | |
| Goodwill impairment | 0 | | | 0 | | | 35,633 | |
| Class action and regulatory litigation expense | 0 | | | 0 | | | 35,500 | |
| Total operating expenses | 502,319 | | | 789,498 | | | 822,922 | |
| Loss before income tax expense (benefit) | (187,617) | | | (30,891) | | | (128,110) | |
| Income tax expense (benefit) | (79) | | | (201) | | | 43 | |
| Consolidated net loss | (187,538) | | | (30,690) | | | (128,153) | |
| Less: Income attributable to noncontrolling interests | 0 | | | 55 | | | 155 | |
| LendingClub net loss | $ | (187,538) | | | $ | (30,745) | | | $ | (128,308) | |
| | | | | |
Net loss per share attributable to common stockholders – Basic and Diluted (1) | $ | (2.63) | | | $ | (0.35) | | | $ | (1.52) | |
Weighted-average common shares – Basic and Diluted (1) | 77,934,302 | | | 87,278,596 | | | 84,583,461 | |
Net income (loss) per share attributable to preferred stockholders – Basic and Diluted (1) | $ | 1.39 | | | $ | 0.00 | | | $ | 0.00 | |
Weighted-average common shares, as converted – Basic and Diluted (1) | 12,505,393 | | | 0 | | | 0 | |
| | | | | | | | | | | |
| December 31, | 2023 | | 2022 |
| Assets | | | |
| Cash and due from banks | $ | 14,993 | | | $ | 23,125 | |
| Interest-bearing deposits in banks | 1,237,511 | | | 1,033,905 | |
| Total cash and cash equivalents | 1,252,504 | | | 1,057,030 | |
Restricted cash (1) | 41,644 | | | 67,454 | |
| Securities available for sale at fair value ($1,663,990 and $399,668 at amortized cost, respectively) | 1,620,262 | | | 345,702 | |
| Loans held for sale at fair value | 407,773 | | | 110,400 | |
| Loans and leases held for investment | 4,850,302 | | | 5,033,154 | |
| Allowance for loan and lease losses | (310,387) | | | (327,852) | |
| Loans and leases held for investment, net | 4,539,915 | | | 4,705,302 | |
Loans held for investment at fair value (1) | 262,190 | | | 925,938 | |
Retail and certificate loans held for investment at fair value (1) | 10,488 | | | 55,425 | |
| Property, equipment and software, net | 161,517 | | | 136,473 | |
| Goodwill | 75,717 | | | 75,717 | |
Other assets (1) | 455,453 | | | 500,306 | |
| Total assets | $ | 8,827,463 | | | $ | 7,979,747 | |
| Liabilities and Equity | | | |
| Deposits: | | | |
| Interest-bearing | $ | 7,001,680 | | | $ | 6,158,560 | |
| Noninterest-bearing | 331,806 | | | 233,993 | |
| Total deposits | 7,333,486 | | | 6,392,553 | |
Borrowings (1) | 8,866 | | | 74,858 | |
Retail notes and certificates at fair value (1) | 10,488 | | | 55,425 | |
| | | |
Other liabilities (1) | 222,801 | | | 292,617 | |
| Total liabilities | 7,575,641 | | | 6,815,453 | |
| Equity | | | |
| | | |
| Common stock, $0.01 par value; 180,000,000 shares authorized; 110,410,602 and 106,546,995 shares issued and outstanding, respectively | 1,104 | | | 1,065 | |
| Additional paid-in capital | 1,669,828 | | | 1,628,590 | |
| Accumulated deficit | (388,806) | | | (427,745) | |
| Accumulated other comprehensive loss | (30,304) | | | (37,616) | |
| | | |
| | | |
| Total equity | 1,251,822 | | | 1,164,294 | |
| Total liabilities and equity | $ | 8,827,463 | | | $ | 7,979,747 | |
(1)Includes amounts in consolidated variable interest entities (VIEs). See “Notes to Consolidated Financial Statements – Note 4. Net Income (Loss) Per Share”7. Securitizations and “Note 15. Stockholders' EquityVariable Interest Entities.”for additional information.
See Notes to Consolidated Financial Statements.
LENDINGCLUB CORPORATION
Consolidated Statements of OperationsIncome
(In Thousands, Except Share and Per Share Amounts)
| | | | | | | | | | | | | | | | | |
| Year Ended December 31, | 2023 | | 2022 | | 2021 |
| Non-interest income: | | | | | |
| Marketplace revenue | $ | 291,484 | | | $ | 683,626 | | | $ | 578,580 | |
| Other non-interest income | 11,297 | | | 28,765 | | | 27,219 | |
| Total non-interest income | 302,781 | | | 712,391 | | | 605,799 | |
| | | | | |
| Interest income: | | | | | |
| Interest on loans held for sale | 35,655 | | | 26,183 | | | 29,540 | |
| Interest and fees on loans and leases held for investment | 616,735 | | | 465,450 | | | 188,977 | |
| Interest on loans held for investment at fair value | 69,866 | | | 12,877 | | | 4,436 | |
| Interest on retail and certificate loans held for investment at fair value | 4,222 | | | 18,135 | | | 57,684 | |
| Interest on securities available for sale | 40,235 | | | 16,116 | | | 11,025 | |
| Other interest income | 65,917 | | | 18,579 | | | 1,170 | |
| Total interest income | 832,630 | | | 557,340 | | | 292,832 | |
| | | | | |
| Interest expense: | | | | | |
| Interest on deposits | 265,556 | | | 60,451 | | | 7,228 | |
| Interest on retail notes and certificates at fair value | 4,222 | | | 18,135 | | | 57,684 | |
| Other interest expense | 1,014 | | | 3,929 | | | 15,089 | |
| Total interest expense | 270,792 | | | 82,515 | | | 80,001 | |
| | | | | |
| Net interest income | 561,838 | | | 474,825 | | | 212,831 | |
| | | | | |
| Total net revenue | 864,619 | | | 1,187,216 | | | 818,630 | |
| | | | | |
| Provision for credit losses | 243,565 | | | 267,326 | | | 138,800 | |
| | | | | |
| Non-interest expense: | | | | | |
| Compensation and benefits | 261,948 | | | 339,397 | | | 288,390 | |
| Marketing | 93,840 | | | 197,747 | | | 156,142 | |
| Equipment and software | 53,485 | | | 49,198 | | | 39,490 | |
| Depreciation and amortization | 47,195 | | | 43,831 | | | 44,285 | |
| Professional services | 35,173 | | | 50,516 | | | 47,572 | |
| Occupancy | 17,532 | | | 21,977 | | | 24,249 | |
| Other non-interest expense | 57,264 | | | 64,187 | | | 61,258 | |
| Total non-interest expense | 566,437 | | | 766,853 | | | 661,386 | |
| | | | | |
| Income before income tax benefit (expense) | 54,617 | | | 153,037 | | | 18,444 | |
| Income tax benefit (expense) | (15,678) | | | 136,648 | | | 136 | |
| Net income | $ | 38,939 | | | $ | 289,685 | | | $ | 18,580 | |
LENDINGCLUB CORPORATION
Consolidated Statements of Income (Continued)
(In Thousands, Except Share and Per Share Amounts)
| | | | | | | | | | | | | | | | | |
| Year Ended December 31, | 2020 | | 2019 | | 2018 |
| LendingClub net loss | $ | (187,538) | | | $ | (30,745) | | | $ | (128,308) | |
| Other comprehensive income (loss), before tax: | | | | | |
| Net unrealized gain (loss) on securities available for sale | 2,044 | | | (526) | | | 252 | |
| Other comprehensive income (loss), before tax | 2,044 | | | (526) | | | 252 | |
| Income tax effect | (5) | | | 216 | | | 83 | |
| Other comprehensive income (loss), net of tax | 2,049 | | | (742) | | | 169 | |
| Less: Other comprehensive income (loss) attributable to noncontrolling interests | 0 | | | (20) | | | 7 | |
| LendingClub other comprehensive income (loss), net of tax | 2,049 | | | (722) | | | 162 | |
| LendingClub comprehensive income (loss) | (185,489) | | | (31,467) | | | (128,146) | |
| Comprehensive income (loss) attributable to noncontrolling interests | 0 | | | (20) | | | 7 | |
| Total comprehensive income (loss) | $ | (185,489) | | | $ | (31,487) | | | $ | (128,139) | |
| | | | | | | | | | | | | | | | | |
| Year Ended December 31, | 2023 | | 2022 | | 2021 |
Earnings per share: (1) | | | | | |
| Net income | $ | 38,939 | | | $ | 289,685 | | | $ | 18,580 | |
| Basic EPS – common stockholders | $ | 0.36 | | | $ | 2.80 | | | $ | 0.19 | |
| Diluted EPS – common stockholders | $ | 0.36 | | | $ | 2.79 | | | $ | 0.18 | |
| Weighted-average common shares – Basic | 108,466,179 | | | 103,547,305 | | | 97,486,754 | |
| Weighted-average common shares – Diluted | 108,468,857 | | | 104,001,288 | | | 102,147,353 | |
| | | | | |
| Basic EPS – preferred stockholders | $ | 0.00 | | | $ | 0.00 | | | $ | 0.19 | |
| Diluted EPS – preferred stockholders | $ | 0.00 | | | $ | 0.00 | | | $ | 0.00 | |
| Weighted-average common shares, as converted – Basic | — | | | — | | | 653,118 | |
| Weighted-average common shares, as converted – Diluted | — | | | — | | | — | |
(1) See “Notes to Consolidated Financial Statements – Note 4. Earnings Per Share” for additional information.
See Notes to Consolidated Financial Statements.
LENDINGCLUB CORPORATION
Consolidated Statements of Comprehensive Income (Loss)
(In Thousands)
| | | | | | | | | | | | | | | | | | | | | | | | | | | | | | | | | | | | | | | | | | | | | | | | | | | | | | | | | | | | | | | | | | | | | | | |
| LendingClub Corporation Stockholders |
| | Preferred Stock | | Common Stock | | Additional
Paid-in
Capital | | Treasury Stock | | Accumulated Other Comprehensive Income (Loss) | | Accumulated
Deficit | | Total
LendingClub Stockholders’
Equity | | Noncontrolling Interests | | Total Equity |
| | Shares | | Amount | | Shares | | Amount | | Shares | | Amount | | |
| | | | | | | | | | | | | | | | | | | | | | | |
| | | | | | | | | | | | | | | | | | | | | | | |
| | | | | | | | | | | | | | | | | | | | | | | |
| | | | | | | | | | | | | | | | | | | | | | | |
| | | | | | | | | | | | | | | | | | | | | | | |
| | | | | | | | | | | | | | | | | | | | | | | |
| | | | | | | | | | | | | | | | | | | | | | | |
| | | | | | | | | | | | | | | | | | | | | | | |
| | | | | | | | | | | | | | | | | | | | | | | |
Balance at
December 31, 2017 | 0 | | | $ | 0 | | | 83,494,769 | | | $ | 840 | | | $ | 1,330,564 | | | 456,540 | | | $ | (19,485) | | | $ | (5) | | | $ | (389,419) | | | $ | 922,495 | | | $ | 5,262 | | | $ | 927,757 | |
| Stock-based compensation | — | | | — | | | — | | | — | | | 84,150 | | | — | | | — | | | — | | | — | | | 84,150 | | | — | | | 84,150 | |
| Net issuances under equity incentive plans, net of tax | — | | | — | | | 2,071,518 | | | 21 | | | (14,552) | | | — | | | — | | | — | | | — | | | (14,531) | | | — | | | (14,531) | |
| ESPP purchase shares | — | | | — | | | 361,840 | | | 3 | | | 5,230 | | | — | | | — | | | — | | | — | | | 5,233 | | | — | | | 5,233 | |
| Net unrealized gain on securities available for sale, net of tax | — | | | — | | | — | | | — | | | — | | | — | | | — | | | 162 | | | — | | | 162 | | | 7 | | | 169 | |
| | | | | | | | | | | | | | | | | | | | | | | |
| Dividends paid and return of capital to noncontrolling interests | — | | | — | | | — | | | — | | | — | | | — | | | — | | | — | | | — | | | — | | | (3,644) | | | (3,644) | |
| Net loss | — | | | — | | | — | | | — | | | — | | | — | | | — | | | — | | | (128,308) | | | (128,308) | | | 155 | | | (128,153) | |
Balance at
December 31, 2018 | 0 | | | $ | 0 | | | 85,928,127 | | | $ | 864 | | | $ | 1,405,392 | | | 456,540 | | | $ | (19,485) | | | $ | 157 | | | $ | (517,727) | | | $ | 869,201 | | | $ | 1,780 | | | $ | 870,981 | |
| Stock-based compensation | — | | | — | | | — | | | — | | | 79,944 | | | — | | | — | | | — | | | — | | | 79,944 | | | — | | | 79,944 | |
Net issuances under equity incentive plans, net of tax (1) | — | | | — | | | 2,665,309 | | | 26 | | | (19,864) | | | 4,851 | | | (65) | | | — | | | — | | | (19,903) | | | — | | | (19,903) | |
| ESPP purchase shares | — | | | — | | | 163,970 | | | 2 | | | 2,410 | | | — | | | — | | | — | | | — | | | 2,412 | | | — | | | 2,412 | |
| Net unrealized loss on securities available for sale, net of tax | — | | | — | | | — | | | — | | | — | | | — | | | — | | | (722) | | | — | | | (722) | | | (20) | | | (742) | |
| | | | | | | | | | | | | | | | | | | | | | | |
| Dividends paid and return of capital to noncontrolling interests | — | | | — | | | — | | | — | | | — | | | — | | | — | | | — | | | — | | | — | | | (1,815) | | | (1,815) | |
| Net loss | — | | | — | | | — | | | — | | | — | | | — | | | — | | | — | | | (30,745) | | | (30,745) | | | 55 | | | (30,690) | |
Balance at
December 31, 2019 | 0 | | | $ | 0 | | | 88,757,406 | | | $ | 892 | | | $ | 1,467,882 | | | 461,391 | | | $ | (19,550) | | | $ | (565) | | | $ | (548,472) | | | $ | 900,187 | | | $ | 0 | | | $ | 900,187 | |
| Stock-based compensation | — | | | — | | | — | | | — | | | 66,626 | | | — | | | — | | | — | | | — | | | 66,626 | | | — | | | 66,626 | |
Net issuances under equity incentive plans, net of tax (2) | — | | | — | | | 3,692,185 | | | 36 | | | (6,914) | | | 5,658 | | | (71) | | | — | | | — | | | (6,949) | | | — | | | (6,949) | |
Net issuances of preferred stock in exchange for common stock (3) | 43,000 | | | 0 | | | (4,300,081) | | | (43) | | | 43 | | | — | | | — | | | — | | | (50,204) | | | (50,204) | | | — | | | (50,204) | |
| Retirement of treasury stock | — | | | — | | | — | | | (4) | | | (19,617) | | | (467,049) | | | 19,621 | | | — | | | — | | | — | | | — | | | — | |
| Net unrealized gain on securities available for sale, net of tax | — | | | — | | | — | | | — | | | — | | | — | | | — | | | 2,049 | | | — | | | 2,049 | | | 0 | | | 2,049 | |
| Net loss | — | | | — | | | — | | | — | | | — | | | — | | | — | | | — | | | (187,538) | | | (187,538) | | | 0 | | | (187,538) | |
Balance at
December 31, 2020 | 43,000 | | | $ | 0 | | | 88,149,510 | | | $ | 881 | | | $ | 1,508,020 | | | 0 | | | $ | 0 | | | $ | 1,484 | | | $ | (786,214) | | | $ | 724,171 | | | $ | 0 | | | $ | 724,171 | |
| | | | | | | | | | | | | | | | | |
| Year Ended December 31, | 2023 | | 2022 | | 2021 |
| Net income | $ | 38,939 | | | $ | 289,685 | | | $ | 18,580 | |
| Other comprehensive income (loss): | | | | | |
| Change in net unrealized gain (loss) on securities available for sale | 10,238 | | | (61,326) | | | 5,562 | |
| Other comprehensive income (loss), before tax | 10,238 | | | (61,326) | | | 5,562 | |
| Income tax effect | (2,926) | | | 16,664 | | | — | |
| Other comprehensive income (loss), net of tax | 7,312 | | | (44,662) | | | 5,562 | |
| Total comprehensive income | $ | 46,251 | | | $ | 245,023 | | | $ | 24,142 | |
See Notes to Consolidated Financial Statements.
LENDINGCLUB CORPORATION
Consolidated Statements of Changes in Equity
(In Thousands, Except Share Data)
| | | | | | | | | | | | | | | | | | | | | | | | | | | | | | | | | | | | | | | | | | | | | | | | | | | | | | | | | | | |
| | Preferred Stock | | Common Stock | | Additional
Paid-in
Capital | | Treasury Stock (1) | | Accumulated Other Comprehensive Income (Loss) | | Accumulated
Deficit | | Total
Equity |
| | Shares | | Amount | | Shares | | Amount | | Shares | | Amount | | |
| | | | | | | | | | | | | | | | | | | |
| | | | | | | | | | | | | | | | | | | |
| | | | | | | | | | | | | | | | | | | |
| | | | | | | | | | | | | | | | | | | |
| | | | | | | | | | | | | | | | | | | |
| | | | | | | | | | | | | | | | | | | |
| | | | | | | | | | | | | | | | | | | |
| | | | | | | | | | | | | | | | | | | |
| | | | | | | | | | | | | | | | | | | |
| | | | | | | | | | | | | | | | | | | |
| | | | | | | | | | | | | | | | | | | |
| | | | | | | | | | | | | | | | | | | |
| | | | | | | | | | | | | | | | | | | |
| | | | | | | | | | | | | | | | | | | |
| | | | | | | | | | | | | | | | | | | |
| | | | | | | | | | | | | | | | | | | |
| | | | | | | | | | | | | | | | | | | |
| Balance at December 31, 2020 | 43,000 | | | $ | — | | | 88,149,510 | | | $ | 881 | | | $ | 1,457,816 | | | — | | | $ | — | | | $ | 1,484 | | | $ | (736,010) | | | $ | 724,171 | |
| Stock-based compensation | — | | | — | | | — | | | — | | | 69,762 | | | — | | | — | | | — | | | — | | | 69,762 | |
| Net issuances under equity incentive plans | — | | | — | | | 4,833,300 | | | 48 | | | (9,343) | | | 4,251 | | | (92) | | | — | | | — | | | (9,387) | |
Net issuances of stock related to acquisition (2) | — | | | — | | | 3,761,114 | | | 38 | | | 41,424 | | | — | | | — | | | — | | | — | | | 41,462 | |
| Exchange of preferred stock for common stock | (43,000) | | | — | | | 4,300,000 | | | 43 | | | (43) | | | — | | | — | | | — | | | — | | | — | |
| Retirement of treasury stock | — | | | — | | | — | | | — | | | — | | | (4,251) | | | 92 | | | — | | | — | | | 92 | |
| Net unrealized gain on securities available for sale, net of tax | — | | | — | | | — | | | — | | | — | | | — | | | — | | | 5,562 | | | — | | | 5,562 | |
| Net income | — | | | — | | | — | | | — | | | — | | | — | | | — | | | — | | | 18,580 | | | 18,580 | |
| Balance at December 31, 2021 | — | | | $ | — | | | 101,043,924 | | | $ | 1,010 | | | $ | 1,559,616 | | | — | | | $ | — | | | $ | 7,046 | | | $ | (717,430) | | | $ | 850,242 | |
| Stock-based compensation | — | | | — | | | — | | | — | | | 73,717 | | | — | | | — | | | — | | | — | | | 73,717 | |
| Net issuances under equity incentive plans | — | | | — | | | 5,503,071 | | | 55 | | | (4,645) | | | 7,751 | | | (98) | | | — | | | — | | | (4,688) | |
| | | | | | | | | | | | | | | | | | | |
| | | | | | | | | | | | | | | | | | | |
| Retirement of treasury stock | — | | | — | | | — | | | — | | | (98) | | | (7,751) | | | 98 | | | — | | | — | | | — | |
| Net unrealized loss on securities available for sale, net of tax | — | | | — | | | — | | | — | | | — | | | — | | | — | | | (44,662) | | | — | | | (44,662) | |
| Net income | — | | | — | | | — | | | — | | | — | | | — | | | — | | | — | | | 289,685 | | | 289,685 | |
| Balance at December 31, 2022 | — | | | $ | — | | | 106,546,995 | | | $ | 1,065 | | | $ | 1,628,590 | | | — | | | $ | — | | | $ | (37,616) | | | $ | (427,745) | | | $ | 1,164,294 | |
| Stock-based compensation | — | | | — | | | — | | | — | | | 61,619 | | | — | | | — | | | — | | | — | | | 61,619 | |
| Net issuances under equity incentive plans | — | | | — | | | 3,863,607 | | | 39 | | | (20,381) | | | — | | | — | | | — | | | — | | | (20,342) | |
| | | | | | | | | | | | | | | | | | | |
| Net unrealized gain on securities available for sale, net of tax | — | | | — | | | — | | | — | | | — | | | — | | | — | | | 7,312 | | | — | | | 7,312 | |
| Net income | — | | | — | | | — | | | — | | | — | | | — | | | — | | | — | | | 38,939 | | | 38,939 | |
| Balance at December 31, 2023 | — | | | $ | — | | | 110,410,602 | | | $ | 1,104 | | | $ | 1,669,828 | | | — | | | $ | — | | | $ | (30,304) | | | $ | (388,806) | | | $ | 1,251,822 | |
(1) Includes shares purchased by the Company in lieu of issuing fractional shares in connection with a 1-for-5 reverse stock split effective on July 5, 2019 and shares that were transferred to the Company to satisfy payment of all or a portion of the exercise price in connection with the exercise of stock options.
(2) Includes shares that were transferred to the Company to satisfy payment of all or a portionStock issued as part of the exercise price in connection with the exercise of stock options.
(3) Includes a payment of $50.2 million that was recorded as a deemed dividend within accumulated deficitconsideration paid related to the beneficial conversion feature of the Series A Preferred Stock issued on March 20, 2020, which would convert into common stock upon a sale by the preferred stockholder to a third party.Acquisition. See “Notes to Consolidated Financial Statements – Note 15. Stockholders' Equity2. Business Acquisition.” for additional information.
See Notes to Consolidated Financial Statements.
LENDINGCLUB CORPORATION
Consolidated Statements of Cash Flows
(In Thousands)
| | | | | | | | | | | | | | | | | |
| Year Ended December 31, | 2023 | | 2022 | | 2021 |
| Cash Flows from Operating Activities: | | | | | |
| Net income | $ | 38,939 | | | $ | 289,685 | | | $ | 18,580 | |
| Adjustments to reconcile net income to net cash (used for) provided by operating activities: | | | | | |
| Net fair value adjustments | 134,114 | | | (8,503) | | | (3,986) | |
| Change in fair value of loan servicing assets | 62,581 | | | 73,229 | | | 54,108 | |
| Gain on sales of loans | (47,839) | | | (95,335) | | | (70,116) | |
| Provision for credit losses | 243,565 | | | 267,326 | | | 138,800 | |
| Accretion of loan deferred fees and costs | (90,723) | | | (86,138) | | | (41,319) | |
| Stock-based compensation, net | 52,389 | | | 66,362 | | | 66,759 | |
| Depreciation and amortization | 47,195 | | | 43,831 | | | 44,285 | |
| Income tax benefit from release of tax valuation allowance | — | | | (143,495) | | | — | |
| Other, net | (8,932) | | | (1,828) | | | 11,263 | |
| Net change to loans held for sale | (1,535,037) | | | 8,032 | | | 4,856 | |
| Net change in operating assets and liabilities: | | | | | |
| Other assets | 54,894 | | | (16,762) | | | (9,733) | |
| Other liabilities | (87,746) | | | (20,836) | | | 26,372 | |
| | | | | |
| | | | | |
| | | | | |
| | | | | |
| | | | | |
| | | | | |
| Net cash (used for) provided by operating activities | (1,136,600) | | | 375,568 | | | 239,869 | |
| Cash Flows from Investing Activities: | | | | | |
| Acquisition of company | — | | | — | | | (145,344) | |
| Cash received from acquisition | — | | | — | | | 668,236 | |
| Net change in loans and leases | 497,276 | | | (2,771,293) | | | (1,517,132) | |
| Net decrease in retail and certificate loans | 47,545 | | | 171,853 | | | 437,870 | |
| Purchases of securities available for sale | (61,648) | | | (222,534) | | | (100,474) | |
| Proceeds from sales of securities available for sale | — | | | — | | | 106,192 | |
| Proceeds from maturities and paydowns of securities available for sale | 97,709 | | | 86,078 | | | 143,402 | |
| Purchases of property, equipment and software, net | (59,509) | | | (69,481) | | | (34,413) | |
| Other investing activities | (4,676) | | | (4,423) | | | (12,747) | |
| | | | | |
| Net cash provided by (used for) investing activities | 516,697 | | | (2,809,800) | | | (454,410) | |
| Cash Flows from Financing Activities: | | | | | |
| Net change in deposits | 921,393 | | | 3,256,501 | | | 1,126,659 | |
| Principal payments on borrowings | (64,448) | | | (270,083) | | | (329,690) | |
| | | | | |
| | | | | |
| | | | | |
| Principal payments on retail notes and certificates | (47,545) | | | (182,260) | | | (438,032) | |
| | | | | |
| | | | | |
| | | | | |
| | | | | |
| | | | | |
| | | | | |
| | | | | |
| | | | | |
| | | | | |
| | | | | |
| | | | | |
| | | | | |
| Other financing activities | (19,833) | | | (9,028) | | | (9,295) | |
| Net cash provided by financing activities | 789,567 | | | 2,795,130 | | | 349,642 | |
| | | | | |
| Net Increase in Cash, Cash Equivalents and Restricted Cash | 169,664 | | | 360,898 | | | 135,101 | |
| Cash, Cash Equivalents and Restricted Cash, Beginning of Period | 1,124,484 | | | 763,586 | | | 628,485 | |
| Cash, Cash Equivalents and Restricted Cash, End of Period | $ | 1,294,148 | | | $ | 1,124,484 | | | $ | 763,586 | |
| | | | | |
LENDINGCLUB CORPORATION
Consolidated Statements of Cash Flows (Continued)
(In Thousands)
| | | | | | | | | | | | | | | | | |
| Year Ended December 31, | 2023 | | 2022 | | 2021 |
| Supplemental Cash Flow Information: | | | | | |
| Cash paid for interest | $ | 258,626 | | | $ | 79,732 | | | $ | 77,334 | |
| Cash paid for taxes | $ | 6,631 | | | $ | 14,462 | | | $ | 4,799 | |
| Cash paid for operating leases included in the measurement of lease liabilities | $ | 12,797 | | | $ | 15,540 | | | $ | 20,546 | |
| Non-cash investing activity: | | | | | |
| Loans and leases held for investment transferred to loans held for sale | $ | — | | | $ | — | | | $ | 402,960 | |
| Net securities retained from Structured Program transactions | $ | 1,299,313 | | | $ | — | | | $ | — | |
| | | | | |
| Non-cash investing and financing activity: | | | | | |
| | | | | |
| Net issuances of stock related to acquisition | $ | — | | | $ | — | | | $ | 41,462 | |
| Non-cash financing activity: | | | | | |
| Derecognition of payable to securitization note and residual certificate holders held in consolidated VIE | $ | — | | | $ | 36,072 | | | $ | — | |
| | | | | |
| | | | | |
| | | | | |
| | | | | |
| | | | | |
| | | | | |
The following presents cash, cash equivalents and restricted cash by category within the Balance Sheet:
| | | | | | | | | | | |
| | December 31, 2023 | | December 31, 2022 |
| Cash and cash equivalents | $ | 1,252,504 | | | $ | 1,057,030 | |
| Restricted cash | 41,644 | | | 67,454 | |
| Total cash, cash equivalents and restricted cash | $ | 1,294,148 | | | $ | 1,124,484 | |
See Notes to Consolidated Financial Statements.
LENDINGCLUB CORPORATION
Consolidated Statements of Changes in Stockholders’ Equity
(In Thousands, Except Share Data)
| | | | | | | | | | | | | | | | | |
| Year Ended December 31, | 2020 | | 2019 | | 2018 |
| Cash Flows from Operating Activities: | | | | | |
| Consolidated net loss | $ | (187,538) | | | $ | (30,690) | | | $ | (128,153) | |
| Adjustments to reconcile consolidated net loss to net cash used for operating activities: | | | | | |
| Net fair value adjustments | 117,247 | | | 144,990 | | | 100,688 | |
| Change in fair value of loan servicing assets and liabilities | 58,730 | | | 58,095 | | | 30,482 | |
| Stock-based compensation, net | 61,533 | | | 73,639 | | | 75,087 | |
| Goodwill impairment charge | 0 | | | 0 | | | 35,633 | |
| Depreciation and amortization | 54,029 | | | 59,152 | | | 54,764 | |
| Gain on sales of loans | (30,812) | | | (67,716) | | | (50,421) | |
| Other, net | 8,922 | | | 7,483 | | | 5,471 | |
| Purchase of loans held for sale | (2,779,493) | | | (7,643,996) | | | (7,397,886) | |
| Principal payments received on loans held for sale | 233,310 | | | 265,820 | | | 210,831 | |
| Proceeds from whole loan sales and Structured Program transactions, net of underwriting fees and costs | 2,981,428 | | | 6,937,984 | | | 6,485,432 | |
| | | | | |
| | | | | |
| Net change in operating assets and liabilities: | | | | | |
| Accrued interest receivable, net | (5,048) | | | (16,298) | | | (3,785) | |
| Other assets | 19,728 | | | 6,609 | | | 52,708 | |
| | | | | |
| Accounts payable | (6,922) | | | 4,158 | | | (3,005) | |
| Accrued interest payable | (4,688) | | | (9,843) | | | (13,372) | |
| Accrued expenses and other liabilities | (41,824) | | | 326 | | | (93,424) | |
| Payable to investors | (60,571) | | | (60,357) | | | (791) | |
| Net cash provided by (used for) operating activities | 418,031 | | | (270,644) | | | (639,741) | |
| Cash Flows from Investing Activities: | | | | | |
| Purchase of loans | (315,135) | | | (633,632) | | | (960,881) | |
| Principal payments received on loans | 691,536 | | | 1,191,428 | | | 1,763,348 | |
| Proceeds from recoveries and sales of charged-off loans | 42,178 | | | 54,032 | | | 63,240 | |
| | | | | |
| Purchases of securities available for sale | (53,736) | | | (144,481) | | | (136,445) | |
| Proceeds from sales, maturities, redemptions and paydowns of securities available for sale | 99,630 | | | 145,880 | | | 153,468 | |
| Proceeds from paydowns of asset-backed securities related to Structured Program transactions | 132,045 | | | 90,648 | | | 47,235 | |
| Purchases of property, equipment and software, net | (31,147) | | | (50,668) | | | (52,976) | |
| | | | | |
| Other investing activities | 400 | | | 561 | | | 1,747 | |
| | | | | |
| Net cash provided by investing activities | 565,771 | | | 653,768 | | | 878,736 | |
| Cash Flows from Financing Activities: | | | | | |
| Proceeds from issuance of notes and certificates | 314,995 | | | 632,962 | | | 953,904 | |
| | | | | |
| Repayments of secured borrowings | (16,867) | | | (56,884) | | | (139,206) | |
| Principal payments on and retirements of notes and certificates | (671,359) | | | (1,147,297) | | | (1,615,800) | |
| Payments on notes and certificates from recoveries/sales of related charged-off loans | (41,179) | | | (55,022) | | | (62,494) | |
| Principal payments on securitization notes | (73,710) | | | (58,025) | | | (45,709) | |
| Proceeds from issuance of securitization notes and certificates | 186,190 | | | 42,500 | | | 258,767 | |
| Proceeds from credit facilities and securities sold under repurchase agreements | 1,195,261 | | | 2,943,948 | | | 2,125,488 | |
| Principal payments on credit facilities and securities sold under repurchase agreements | (1,676,618) | | | (2,815,475) | | | (1,698,214) | |
LENDINGCLUB CORPORATION
Consolidated Statements of Cash Flows
(in Thousands)
| | | | | | | | | | | | | | | | | |
| Year Ended December 31, | 2020 | | 2019 | | 2018 |
| Payment for debt issuance costs | (1,852) | | | (1,419) | | | (4,494) | |
| | | | | |
| | | | | |
| | | | | |
| Net cash inflow (outflow) from consolidation (deconsolidation) of VIE | 0 | | | (5,951) | | | (15,013) | |
| | | | | |
| | | | | |
| Dividends paid on preferred stock | (50,204) | | | 0 | | | 0 | |
| Other financing activities | (7,096) | | | (19,397) | | | 3,545 | |
| Net cash used for financing activities | (842,439) | | | (540,060) | | | (239,226) | |
| Net Increase (Decrease) in Cash, Cash Equivalents and Restricted Cash | 141,363 | | | (156,936) | | | (231) | |
| Cash, Cash Equivalents and Restricted Cash, Beginning of Period | 487,122 | | | 644,058 | | | 644,289 | |
| Cash, Cash Equivalents and Restricted Cash, End of Period | $ | 628,485 | | | $ | 487,122 | | | $ | 644,058 | |
| Supplemental Cash Flow Information: | | | | | |
| Cash paid for interest | $ | 143,840 | | | $ | 254,585 | | | $ | 394,459 | |
| Cash paid for operating leases included in the measurement of lease liabilities | $ | 16,679 | | | $ | 16,816 | | | $ | 0 | |
| Non-cash investing activity: | | | | | |
| Accruals for property, equipment and software | $ | 686 | | | $ | 1,745 | | | $ | 2,256 | |
| Securities retained from Structured Program transactions | $ | 43,458 | | | $ | 197,267 | | | $ | 106,609 | |
| Non-cash investing and financing activity: | | | | | |
| Transfer of whole loans to redeem certificates | $ | 17,414 | | | $ | 122,330 | | | $ | 1,095 | |
| Non-cash financing activity: | | | | | |
| Exchange of common stock for preferred stock | $ | 207,244 | | | $ | 0 | | | $ | 0 | |
| | | | | |
| | | | | |
| Derecognition of payable to securitization note and residual certificate holders held in consolidated VIE | $ | 0 | | | $ | 200,881 | | | $ | 269,151 | |
| | | | | |
| | | | | |
The following presents cash, cash equivalents and restricted cash by category within the Consolidated Balance Sheets:
| | | | | | | | | | | |
| | December 31, 2020 | | December 31, 2019 |
| Cash and cash equivalents | $ | 524,963 | | | $ | 243,779 | |
| Restricted cash | 103,522 | | | 243,343 | |
| Total cash, cash equivalents and restricted cash | $ | 628,485 | | | $ | 487,122 | |
See Notes to Consolidated Financial Statements.Statements
(Tabular Amounts in Thousands, Except Share and Per Share Amounts, Ratios, or as Noted)
1. Summary of Significant Accounting Policies
LENDINGCLUB CORPORATION
Consolidated Statements of Cash Flows
(in Thousands)
1. Basis of Presentation
LendingClub Corporation (LendingClub) operates an online lending marketplace platform that connects borrowers and investors. On February 1, 2021, LendingClub Corporation (LendingClub) completed the acquisition (the Acquisition) of Radius Bancorp, Inc. (Radius), through whichwhereby LendingClub became a bank holding company and formed LendingClub Bank, N.A. (theNational Association (LC Bank) as its wholly-owned subsidiary. Additionally, LendingClub has established various entities to facilitate loan sale transactions, including sponsoring asset-backed securitization transactionsThe Company operates the vast majority of its business through LC Bank, as a lender and Certificate Program transactions (collectively referred tooriginator of loans and as Structured Program transactions), where certain accredited investors and qualified institutional buyers havea regulated bank in the opportunity to invest in senior and subordinated securities backed by a pool of unsecured personal whole loans. Certificate Program transactions include CLUB Certificate and Levered Certificate transactions. LC Trust I (the LC Trust) is an independent Delaware business trust that acquires loans from LendingClub and holds them for the sole benefit of certain investors that have purchased trust certificates issued by the LC Trust that are related to specific underlying loans for the benefit of the investor.United States.
The accompanying consolidated financial statements include LendingClub, its subsidiaries (collectively referred to as the Company, we, or us) and consolidated variable interest entities (VIEs). Noncontrolling interests are reported as a separate component of consolidated equity from the equity attributable to LendingClub’s stockholders for all periods presented. All intercompany balances and transactions have been eliminated.eliminated in consolidation. These consolidated financial statements have been prepared in conformity with accounting principles generally accepted in the United States of America (GAAP) for financial information and, in the opinion of management, contain all adjustments, consisting of onlyincluding normal recurring adjustments, necessary for the fair statement of the results and financial position for the periods presented. These accounting principles require management to make certain estimates and assumptions that affect the amounts in the accompanying financial statements. These estimates and assumptions are inherently subjective in nature and actual results may differ from these estimates and assumptions, and the differences could be material. Certain prior period amounts in the consolidated financial statements and accompanying notes have been reclassified to conform to the current period presentation.
The Company presents loans under a number of different captions to align the assets to their associated liabilities, if any. “Loans held for investment at fair value” are loans which are related to the Company’s Member Payment Dependent Notes (Retail Notes), certificates and secured borrowings program. The Company is not exposed to market risk, interest rate risk or credit risk on these loans and all loan cash flows flow directly to the retail note, certificate and secured borrowing owners. The associated liability for this loan category is included in the caption “Notes, certificates and secured borrowings at fair value.” Loans included in “Loans held for investment by the Company at fair value” and “Loans held for sale by the Company at fair value” are loans which the Company has purchased and from which the Company earns interest income and records net fair value adjustments in earnings for changes in the valuation of loans.
2. Summary of Significant Accounting Policies
Cash and Cash Equivalents
Cash and cash equivalents include the Company’s unrestricted deposits with investment-grade financial institutions, institutional money market funds, certificates of deposit, and commercial paper. The Company considers all highly liquid investments with stated maturity dateshave original maturities of three months or less and include cash on hand, cash items in transit, and amounts due from or held with other depository institutions, primarily with the dateBoard of purchase to be cash equivalents.Governors of the Federal Reserve System (FRB).
Restricted Cash
RestrictedCash items held with other depository institutions in which the ability to withdraw funds is restricted by contractual provisions is classified as restricted cash. Such amounts include: (i) cash consists primarily of bank deposits and money market funds that are: (i) pledged as security for transactions processed on or related to LendingClub’s platform orissuing bank activities byand transactions with certain investors; and (ii) cash received from the borrowerborrowers on loans owned and applied to the loan, but not yet distributed to investors.
Securities
Debt securities purchased and asset-backed securities retained from the investor’s internal platform accountsale of loans are classified as available for sale (AFS) securities. AFS securities represent investment securities with readily determinable fair values that the Company: (i) does not hold for trading purposes and (ii) does not have the positive intent and ability to hold to maturity. AFS securities are measured at fair value, with unrealized gains and losses reported in “Accumulated other comprehensive income (loss)” within the equity section of the Balance Sheet. The amount reported in “Accumulated other comprehensive income (loss)” is net of any valuation allowance and applicable income taxes.
Management evaluates whether debt AFS securities with unrealized losses are impaired on a quarterly basis. For any security that has declined in fair value below its amortized cost basis, the Company recognizes an impairment loss in current period earnings if management has the intent to sell the security or sentif it is more likely than not it will be required to their external account.sell the security before recovery of its amortized cost basis. The assessment of impairment also considers whether the decline in fair value below the security’s amortized cost basis is attributable to credit-related factors. If credit-related factors exist, credit-related impairment has occurred regardless of the Company’s intent to hold the security until it recovers. The credit-related portion of impairment is recognized as provision for credit loss expense in earnings with a corresponding valuation allowance for AFS securities on the Balance Sheet, to the extent the allowance does not reduce the value of the security below its fair value.
LENDINGCLUB CORPORATION
Notes to Consolidated Financial Statements
(Tabular Amounts in Thousands, Except Share and Per Share Amounts, Ratios, or as Noted)
Investor cash balances (excluding transactions-in-process)Equity securities that do not have readily determinable fair values are held in segregated bank or custodial accountsgenerally recorded at cost adjusted for impairment, if any. These securities include FRB stock and Federal Home Loan Bank (FHLB) stock and are not commingled with the Company’s monies or heldreported as “Nonmarketable equity investments” in “Other assets” on the Company’s Consolidated Balance Sheets.
Securities Available for Sale
Debt securities that the Company might not hold until maturity are classified as securities available for sale. In structured program transactions that meet the applicable criteria to be accounted for as a sale, the Company retains certain asset-backed securities including subordinated residual interests and CLUB Certificates, which are classified as securities available for sale. On January 1, 2020, the entity adopted ASU 2016-13, Financial Instruments – Credit Losses (Topic 326): Measurement of Credit Losses on Financial Instruments (CECL) for securities available for sale. Asset-backed securities where the expected cash flows are significantly lower than that of the contractual future cash flows are considered to be purchased with credit deterioration (PCD). The discounted differential in expected and contractual cash flows is included with the purchase price of the asset to determine amortized cost of the security with an equal and offsetting valuation allowance for credit losses. Securities available for sale are recorded at fair value and unrealized gains and losses are reported, net of taxes, in “Accumulated other comprehensive income (loss)” included in Equity in the Company’s Consolidated Balance Sheets unless management determines that the security is impaired due to a deterioration in expected cash flows, in which case the unrealized loss is recognized in earnings within “Net fair value adjustments” as a valuation allowance for credit losses (with the implementation of CECL) or other-than-temporary impairment (prior to the implementation of CECL) in the Company’s Consolidated Statements of Operations.
Management evaluates whether debt securities available for sale with unrealized losses are impaired on a quarterly basis. If the Company intends to sell the security, or if it is more likely than not that it will be required to sell the security before recovery, an impairment is recognized in earnings equal to the entire difference between the amortized cost basis and fair value of the debt security. However, even if the Company does not expect to sell a debt security it must evaluate if a deterioration in cash flows exists.Sheet.
Loans Held for Investment by the Company and Loans Held for Sale by the CompanyLeases
The Company has electedinitially classifies loans and leases as either held for sale (HFS) or held for investment (HFI) based on management’s assessment of its intent and ability to hold the loans for the foreseeable future or until maturity. Management’s intent and ability with respect to certain loans may change from time to time. In order to reclassify loans to HFS, management must have the intent to sell the loans and the ability to reasonably identify the specific loans to be sold.
HFI loans at amortized cost
HFI loans, with the exception of HFI loans accounted for under the fair value option, are measured at historical cost and reported at their outstanding principal balances net of any charge-offs, unamortized deferred fees and costs on originated loans, and for purchased loans, net of any unamortized premiums and discounts. Leases are recorded at the discounted amounts of lease payments receivable plus the estimated residual value of the leased asset, net of unearned income and unamortized deferred fees and costs. Lease payments receivable reflect contractual lease payments adjusted for renewal or termination options that the Company believes the customer is reasonably certain to exercise. Unearned income, deferred fees and costs, and discounts and premiums are accreted and amortized to interest income over the contractual life of the loan using its effective interest rate. In certain circumstances, the Company may transfer loans from HFI to HFS. At the time of transfer, these loans are valued at the lower of amortized cost or fair value.
HFI loans at fair value
HFI loans are measured at fair value if the Company elects the fair value option. The Company may elect the fair value option for certain HFI loans, held for investment by the Company andwhich could include loans held for salepurchased by the Company. Changes in the fair value of loans held by the Company areInterest income is recorded in “Net fair value adjustments” in the Consolidated Statements of Operations in the period of the fair value changes. The Company places loans held by the Company on non-accrual status at 90 days past due. Accrued interest income on loans held by the Company is calculated based on the contractual interest rate of the loan held by the Company and recorded as interest income as earned. When a loan held by the Company is placed on non-accrual status, the Company stops accruing interest and reverses all accrued but unpaid interest as of such date. The Company charges-off loans held by the Company no later than 120 days past due. The Company does not record an allowance for credit losses on accrued interest receivable. The Company accrues interest income on loans on short term hardship programs usingunder the effective interest rate method.
Loans Held for Investmentmethod which considers any purchase premium or discounts. In addition, purchase related discounts absorb credit losses. Retail and Related Notescertificate loans and Certificates
The Company has elected the fair value option for loans held for investment and related notes and certificates.certificates are measured at fair value. Due to the payment dependent feature of the notes and certificates, changes in the fair value of the notes and certificates are offset by changes in the fair values of related loans, resulting in no net effect on the Company’s earnings.
HFS loans at fair value
Loans initially classified as HFS are reported at their fair value with the Company’s election of the fair value option. Origination fees and costs for HFS loans are recognized in earnings at the time of loan origination and are not deferred. Origination fees are recognized in earnings within “Marketplace revenue” on the Consolidated Statements of Income (Income Statement). Changes in the fair value are recorded in “Net fair value adjustments” included in “Marketplace revenue” on the Income Statement.
Accrued Interest Income and Non-Accrual Policy
Interest income is accrued as earned. The Company places loans held for investmentaccrual of interest income is discontinued, and the loan or lease is placed on non-accrualnonaccrual status at 90 days past due or when reasonable doubt exists as to timely collection. Past due status is based on the contractual terms of the loan or lease. When a loan or lease is placed on nonaccrual status, all income previously accrued but not collected is reversed against the current period’s interest income. The Company has a nonaccrual policy which results in the timely reversal of past-due accrued interest, and it does not record an allowance for credit losses (ACL) on accrued interest receivable. However, we record an ACL on accrued interest receivable for past due unsecured personal loans that are less than 90 days past due. Interest receivablecollections on
LENDINGCLUB CORPORATION
Notes to Consolidated Financial Statements
(Tabular Amounts in Thousands, Except Share and Per Share Amounts, Ratios, or as Noted)
nonaccrual loans and leases for which the ultimate collectability of principal is uncertain are applied as principal reductions; otherwise, such collections are credited to income when received. Nonaccrual loans and leases are returned to accrual status when there no longer exists concern over collectability, the borrower has demonstrated, over time, both the intent and ability to repay and the loan or lease has been brought current and future payments are reasonably assured. For loans held for investment measured at fair value, we record interest income over the term of the underlying loans using the effective interest method which considers any purchase discount or premiums.
Allowance for Credit Losses
The ACL represents management’s estimate of expected credit losses in the loan and accruedlease portfolio, excluding loans accounted for under the fair value option. The ACL is measured based on a lifetime expected loss model, which does not require a loss event to occur before a credit loss is recognized. Under the lifetime expected credit loss model, the Company estimates the allowance based on relevant available information related to past events, current conditions, and reasonable and supportable forecasts of future economic conditions. The ACL is estimated using a discounted cash flow (DCF) approach where effective interest payablerates are used to calculate the net present value of expected cash flows. The effective interest rate is calculated based on notesthe periodic interest income received from the loan’s contractual cash flows and certificatesthe net investment in the loan, which includes deferred origination fees and costs, to provide a constant rate of return over the term.
The Company evaluates its estimate of expected credit losses each reporting period and records any additions or reductions to the allowance on the Income Statement as “Provision for credit losses.” Amounts determined to be uncollectible are reducedcharged-off to the allowance. Estimates of expected credit losses include expected recoveries of amounts previously charged-off and amounts expected to be charged-off. If amounts previously charged off are subsequently expected to be collected, the Company may recognize a negative allowance, which is limited to the amount that was previously charged off.
Under applicable accounting guidance, for reporting purposes, the loan and lease portfolio is categorized by portfolio segment. A portfolio segment is defined as the level at which an entity develops and documents a systematic methodology to determine the ACL. The Company’s two portfolio segments are consumer and commercial. The Company further disaggregates its portfolio segments into various classes of financing receivables based on their underlying risk characteristics. The classes within the consumer portfolio segment are unsecured consumer, secured consumer and residential mortgages. The classes within the commercial portfolio segment are commercial and industrial, commercial real estate, and equipment finance.
The ACL is measured on a collective basis when loans share similar risk characteristics. Relevant risk characteristics for the correspondingconsumer portfolio include product type, risk rating, loan heldterm, and monthly vintage. Relevant risk characteristics for the commercial portfolio include product type, risk rating and PCD status. Loans measured on a collective basis generally have an ACL comprised of a quantitative, or modeled, component that is supplemented by a framework of qualitative factors, as discussed below.
The Company will continue to monitor its loan pools on an ongoing basis and adjust accordingly as the risk characteristics of the financial assets may change over time. If a given financial asset does not share similar risk characteristics with other financial assets, the Company shall measure expected credit losses on an individual, rather than on a collective basis. Loans evaluated on an individual basis generally have an ACL that is measured in reference to any collateral securing the loan and/or expected cash flows which are specific to the borrower.
Allowance Calculation Methodology
The Company generally estimates expected credit losses over the contractual term of its loans. The contractual term is adjusted for estimated prepayments when appropriate. The quantitative, or modeled, component of the ACL is primarily based on statistical models that use known or estimated data as of the balance sheet date and forecasted data over the reasonable and supportable period. Known and estimated data include current probability and timing
LENDINGCLUB CORPORATION
Notes to Consolidated Financial Statements
(Tabular Amounts in Thousands, Except Share and Per Share Amounts, Ratios, or as Noted)
of default, loss rate and recovery exposure at default, timing and amount of estimated prepayments, timing and amount of expected draws (for unfunded lending commitments), and relevant risk characteristics. Certain of the Company’s commercial portfolios have limited internal historical loss data and use external credit loss information, including historical charge-off and balance data for peer banking institutions.
The Company obtains historical and forecast macroeconomic information to inform its view of the long-term condition of the economy. Forward-looking macroeconomic factors considered in the Company’s consumer model include, unemployment rate, unemployment insurance claims, gross domestic product (GDP), housing prices, and retail sales. Forward-looking macroeconomic factors are incorporated into the Company’s commercial model for a two-year reasonable and supportable economic forecast period followed by a one-year reversion period during which expected credit losses are expected to revert back on a straight-line basis to historical losses unadjusted for economic conditions. The reasonable and supportable economic forecast period and reversion methodology are accounting estimates which may change in future periods as a result of changes to the current macroeconomic environment.
The quantitative, or modeled, portion of ACL is estimated using a DCF approach. The Company’s statistical models produce expected cash flows, which are then discounted at the effective interest rate to derive net present value. The effective interest rate is calculated based on the periodic interest income received from the loan’s contractual cash flows and the net investment in the loan, which includes deferred origination fees and costs, to provide a constant rate of return over the contractual loan term. This net present value is placed on non-accrual statusthen compared to the amortized cost basis to derive the initial expected credit losses. Under the DCF approach, the provision for credit losses includes credit loss expense in subsequent periods relating to the discounting effect due to the payment dependent naturepassage of time after the initial recognition of ACL on originated HFI loans at amortized cost.
The Company also considers the need for qualitative adjustments to the modeled estimate of expected credit losses. For this purpose, the Company established a qualitative factor framework to periodically assess qualitative adjustments to address certain identified elements that are not directly captured by the statistically modeled expected credit loss. The Company also obtains forecast macroeconomic information to inform its view of the long-term condition of the economy. These factors may include the impact of the non-modeled macroeconomic outlook, forecast unemployment rate and insurance claims, risk rating downgrades, changes in credit policies, problem loan trends, identification of new risks not incorporated into the modeling framework, credit concentrations, changes in underwriting and other external factors.
Zero Credit Loss Expectation Exception
The Company has a zero loss expectation when the loans and securities available for sale, or portions thereof, are issued or guaranteed by certain U.S. government entities or agencies, as those entities or agencies have a long history of no defaults and the highest credit ratings issued by rating agencies. Loans held for investment and related notessecurities available for sale, or portions thereof, which meet this criterion do not have an ACL.
Reserve for Unfunded Lending Commitments
The ACL includes an estimate for expected credit losses on off-balance sheet commitments to extend credit and certificates.unused lines of credit. The Company charges-offestimates these expected credit losses for the unfunded portion of the commitments that are not unconditionally cancellable depending on the likelihood that funding will occur. The reserve for unfunded lending commitments is reported in “Other liabilities” on the Balance Sheet.
Individually Assessed Loans
Loans that do not share similar riskcharacteristics with other financial assets, including collateral-dependent loans, heldare individually assessed for investment and related notespurposes of measuring expected credit losses using the DCF approach.
LENDINGCLUB CORPORATION
Notes to Consolidated Financial Statements
(Tabular Amounts in Thousands, Except Share and Per Share Amounts, Ratios, or as Noted)
For loans that are determined to be collateral dependent, the ACL is determined based on the fair value of the collateral. Loans are considered collateral dependent when the borrower is experiencing financial difficulty and certificates no later thanrepayment of the loan is expected to be substantially satisfied through sale or operation of the collateral. For such loans, the ACL is calculated as the difference between the amortized cost basis and the fair value of the underlying collateral less costs to sell, if applicable.
Purchased Credit Deteriorated Assets
PCD assets are acquired financial assets (or groups of financial assets with similar risk characteristics) that as of the date of acquisition have experienced a more-than-insignificant deterioration in credit quality since origination, as determined by an acquirer’s assessment. The Company considers indicators such as loan rating, FICO score, days past due status, nonaccrual status, charge-off status, bankruptcy, modifications or risk rating to determine whether an acquired asset meets the definition of PCD.
PCD assets are recorded on the acquisition date at their purchase price plus any related initial ACL, which results in a “gross-up” of the asset’s initial amortized cost basis. Recognition of the initial ACL upon the acquisition of PCD assets does not impact net income. Changes in estimates of expected credit losses after acquisition are recognized through the provision for credit losses. Acquired non-PCD assets are accounted for in a manner similar to originated financial assets, whereby any initial ACL is recorded through the “Provision for credit losses” on the Income Statement.
Charge-Offs
Charge-offs are recorded when the Company determines that a loan balance is uncollectible or a loss-confirming event has occurred. Loss confirming events usually involve the receipt of specific adverse information about the borrower and may include borrower delinquency status, bankruptcy, foreclosure, or receipt of an asset valuation indicating a shortfall between the value of the collateral and the book value of the loan when that collateral asset is the sole source of repayment. A full or partial charge-off reduces the amortized cost basis of the loan and the related ACL. Unsecured personal loans are charged-off when a borrower is (i) contractually 120 days past due. The Company does not record an allowancedue or (ii) two payments past due and has filed for credit losses on accrued interest receivable.bankruptcy or is deceased.
Servicing Assets
Servicing assets are capitalized as separate assets when loans are sold and servicing is retained. The Company records servicing assets at their estimated fair values when it sellsvalues. Servicing asset fair value is based on the excess of the contractual servicing fee over an estimated market servicing rate. When servicing assets are recognized from the sale of loans or whenoriginated by the Company, assumes or acquiresthe fair value of the servicing asset is included as a servicing obligation whereby the underlying loans are not included in its financial statements. The gain or loss on a loan sale is recorded separately in “Gain on sales of loans” in the Company’s Consolidated Statements of Operations while the component of the gain or loss that is based on the degree toloan sale and reported within “Marketplace revenue” on the Income Statement. Subsequent changes in fair value are reported within “Servicing fees” in “Marketplace revenue” during the period in which the contractual servicing fee is above or below an estimated market servicing rate is recorded as a servicing asset.changes occur. Servicing assets are reported in “Other assets” on the Company’s Consolidated Balance Sheets. Changes in the fair value of servicing assets are reported in “Investor fees” in the Company’s Consolidated Statements of Operations in the period in which the changes occur.Sheet.
Fair Value of Assets and Liabilities
Fair value is defined as the price that would be received to sell a financial asset or paid to transfer a financial liability in an orderly transaction between market participants at the measurement date (andate. Fair value is based on an exit price). The Company usesprice notion that maximizes the use of observable inputs and minimizes the use of unobservable inputs. Certain of the Company’s assets and liabilities are recorded at fair value measurements in its fair value disclosures and to record securities available for sale, loans held for investment and loans held for sale, notes and certificates, and servicing assetsmeasured on either a recurring or nonrecurring basis. Assets and liabilities that are recorded at fair value on a recurring basis.basis require a fair value measurement at each reporting period.
LENDINGCLUB CORPORATION
Notes to Consolidated Financial Statements
(Tabular Amounts in Thousands, Except Share and Per Share Amounts, Ratios, or as Noted)
The fair value hierarchy includes a three-level classification, which is based on whetherhierarchy that assigns the inputshighest priority to unadjusted quoted prices in active markets and the valuation methodology used for measurement are observable:lowest priority to unobservable inputs.
| | | | | | | | |
| Level 1 | — | Quoted market prices in active markets for identical assets or liabilities. |
| | |
| Level 2 | — | Inputs other than quoted prices included in Level 1 that are observable for the asset or liability either directly or indirectly. |
| | |
| Level 3 | — | Unobservable inputs. |
When developing fair value measurements, the Company maximizes the use of observableUnobservable inputs and minimizes the use of unobservable inputs. However, for certain instruments the Company must utilize unobservable inputs in determining fair value due to the lack of observable inputs in the market, which requiresrequire greater judgment in measuring fair value. In instances where there is limited or no observable market data, fair value measurements for assets and liabilities are based primarily upon the Company’s own estimates, and the measurements reflect information and assumptions that management believes a market participant would use in pricing the asset or liability.
Loans held for investment, loans held for saleDerivative Instruments and related notes, certificates and secured borrowings, are measured at estimated fair value using a discounted cash flow model. The fair valuation methodology considers projected prepayments, underwriting changes and the historical actual defaults, losses and recoveries on the Company’s loans to project future losses and net cash flows on loans. Net cash flows on loans are discounted using an estimate of market rates of return.Hedging Activities
Loan servicing assets are measuredThe Company recognizes all derivative instruments at estimated fair value, usingon a discounted cash flow model. The cash flowsgross basis, as either “Other assets” or “Other liabilities” on the Balance Sheet. Changes in fair value of the valuation model representderivative instruments are recognized in current period earnings.
For derivative instruments that qualify as hedges, the difference betweenCompany designates the contractual servicing fees charged to investors and an estimated market servicing rate. Since contractual servicing fees are generallyhedging instrument based on the monthly unpaid principal balance ofexposure being hedged. The Company’s existing hedging instruments are designated as fair value hedges under the underlying loans, the expected cash flowsportfolio layer method, whereby changes in the model incorporate estimates of net expected losses and prepayments.
LENDINGCLUB CORPORATION
Notes to Consolidated Financial Statements
(Tabular Amounts in Thousands, Except Share and Per Share Amounts, Ratios, or as Noted)
The Company uses prices obtained from third-party pricing services to measure the fair value of securities available for sale when available. The Company compares the prices obtained from its primary independent pricing service to the prices obtained from the additional independent pricing services to determine if the price obtained from the primary independent pricing service is reasonable. When third-party pricing serviceshedging instrument are not available for a security, such as subordinated residual certificates and CLUB Certificates, the Company measuressubstantially offset by changes in the fair value of these securities using a discounted cash flow model incorporating inputs consistent withthe hedged item, both of which are recognized in “Interest and fees on loans held for investment, loans heldinvestment” on the Income Statement. Interest payments made and/or received related to these derivative instruments are presented within the “Operating activities” section on the Statements of Cash Flows.
To qualify for salehedge accounting, the derivatives and related notes, certificates, secured borrowings,hedged items must be designated as a hedge at inception of the hedge relationship. In addition, a derivative must be highly effective at reducing the risk associated with the exposure being hedged. For accounting hedge relationships, the Company formally assesses, both at the inception of the hedge and payable to securitization noteon an ongoing basis, if the derivatives are highly effective in offsetting designated changes in the fair value of the hedged item. The Company assesses effectiveness using a statistical regression analysis. Effectiveness may be assessed qualitatively where the critical terms of the derivative and certificate holders.hedged item match.
Property, Equipment and Software, net
Property, equipment and software are carried at cost less accumulated depreciation and amortization. The Company uses the straight-line method of depreciation and amortization. Estimated useful lives range from three years to five years for furniture and fixtures, computer equipment, and software. Leasehold improvements are amortized over the shorter of the lease term or the estimated useful life.
Internally developed software is capitalized when preliminary development efforts are successfully completed and it is probable that the project will be completed, and the software will be used as intended. Capitalized costs consist of salaries and compensation costs for employees, fees paid to third-party consultants who are directly involved in development efforts, and costs incurred for upgrades and enhancements to add functionality of the software. Other costs are expensed as incurred.
The Company evaluates impairments of its property, equipment and software whenever events or changes in circumstances indicate that the carrying amount of the assets may not be recoverable. If the asset is not recoverable,
LENDINGCLUB CORPORATION
Notes to Consolidated Financial Statements
(Tabular Amounts in Thousands, Except Share and Per Share Amounts, Ratios, or as Noted)
measurement of an impairment loss is based on the fair value of the asset. When an impairment loss is recognized, the carrying amount of the asset is reduced to its estimated fair value.
Goodwill and Other Intangible Assets
Goodwill representsis recorded when the purchase price of an acquired business exceeds the fair value of an acquired business in excess of the aggregate fair value of the identified net assets acquired. Goodwill is not amortized butassigned to the Company’s reporting units at the acquisition date according to the expected economic benefits that the acquired business will provide to the reporting unit. A reporting unit is a business operating segment or a component of a business operating segment. The Company identifies its reporting units based on how the operating segments and reporting units are managed. Accordingly, the Company allocated goodwill to the LC Bank operating segment.
The goodwill of each reporting unit is tested for impairment annually or more frequently whenever events or circumstances indicate that it is more likely than not that the estimated fair value of a reporting unit is below its carrying value.in certain circumstances. The Company’s annual impairment testing date is April 1.performed in the fourth quarter of each calendar year. Impairment exists wheneverwhen the carrying value of goodwill exceeds its estimated fair value. Adverse changes in impairment indicators such as loss of key personnel, lower than forecast financial performance, increased competition, increased regulatory oversight, or unplanned changes in operations could result in impairment.
The Company can elect to either qualitatively assess goodwill for impairment, ifor bypass the qualitative test and proceed directly to a quantitative test. If the Company performs a qualitative assessment of goodwill to test for impairment and concludes it is more likely than not that the estimated fair value of a reporting unit (generally defined as an operating segment or one level below an operating segment for which financial information is available and reviewed regularly by management) exceedsgreater than its carrying value. A qualitativevalue, a quantitative test is not required. However, if we determine it is more likely than not that a reporting unit’s fair value is less than its carrying amount, a quantitative assessment may consider macroeconomicis performed to determine if goodwill impairment exists. Under the quantitative impairment assessment, the fair values of the Company’s reporting units are determined using a combination of income and other industry-specific factors, such as trends in short-term and long-term interest rates and the ability to access capital or company-specific factors, such as market capitalization in excess of net assets, trends in revenue-generating activities and merger or acquisition activity.market-based approaches.
If the Company does not qualitatively assess goodwill it compares a reporting unit’s estimatedOther intangible assets with determinable lives are recorded at their fair value to its carrying value. The Company estimatesupon completion of a business acquisition or certain other transactions, and generally represent the fair value of a reporting unit using either an income approach (discounted cash flow model)customer contracts or the income approach corroborated by a market approach. Goodwill impairment loss is measured as the amount by which the carrying amount of a reporting unit exceeds its fair value.
When applying the income approach, the Company uses a discounted cash flow model, which requires the estimation of cash flows and an appropriate discount rate. The Company projects cash flows expected to be
LENDINGCLUB CORPORATION
Notes to Consolidated Financial Statements
(Tabular Amounts in Thousands, Except Share and Per Share Amounts, Ratios, or as Noted)
generated by a reporting unit inclusive of an estimated terminal value. The discount rate assumption contemplates a weighted-average cost of capital based on both market observable and company-specific factors. The discount rate is risk-adjusted to include any premiums related to equity price volatility, size, and projected capital structure of publicly traded companies in similar lines of business.
The Company relies on several assumptions when estimating the fair value of a reporting unit using the discounted cash flow method. These assumptions include the current discount rate discussed above, as well as transaction fee revenue based on projected loan origination growth and revenue growth, projected operating expenses and Contribution Margin, direct and allocated general and administrative and technology expenses, capital expenditures and income taxes. The Company believes these assumptions to be representative of assumptions that a market participant would use in valuing a reporting unit, but these assumptions involve the use of estimates and judgments, particularly related to future cash flows, which are inherently uncertain. There can be no assurances that estimates and assumptions made for purposes of goodwill impairment testing will prove accurate predictions of the future.
The market approach estimates the fair value of a reporting unit based on certain market value multiples of publicly traded companies in similar lines of business, such as total enterprise value to revenue, or to EBITDA. Under the market approach, the Company also considers fair value implied from any relevant and comparable market transactions.
Goodwill impairment loss is measured as the amount by which the carrying amount of a reporting unit exceeds its fair value. See “Note 11. Intangible Assets and Goodwill”for additional information.
Intangiblerelationships. Such assets are amortized over their useful lives in a manner that best reflects their economic benefit, which may include straight-line or accelerated methods of amortization. IntangibleOther intangible assets are reviewed for impairment quarterly and wheneverwhen events or changes in circumstances indicate that thetheir carrying amount of such assets may not be recoverable. The Company does not have indefinite-lived intangible assets.assets other than goodwill. Intangible assets are reported in “Other assets” on the Balance Sheet.
Loss Contingencies
Loss contingencies, including claims and legal actions arising in the ordinary course of business, are recorded as liabilities in “Accrued expenses and other“Other liabilities” inon the Company’s Consolidated Balance Sheets.Sheet. Associated legal expense is recorded in “Other general and administrative” expense or in “Class action and regulatory litigationnon-interest expense” foron the losses associated with the securities class action lawsuits, as described in “Note 19. Commitments and Contingencies,” in the Company’s Consolidated Statements of Operations.Income Statement. Such liabilities and associated expenses are recorded when the likelihood of loss is probable and an amount or range of loss can be reasonably estimated. The Company will also disclose a range of exposure to incremental loss when such amounts can be estimated and are reasonably possible and can be estimated.to occur in future periods. In estimating the Company’s exposure to loss contingencies, if an amount within the estimated range of loss is the best estimate, that amount will be accrued. However, if there is no amount within the estimated range of loss that is the best estimate, the Company will accrue the minimum amount within the range, and disclose the amount up to the high end of the range as an exposure to incremental loss, if such amount is considered reasonably possible. Such estimates are based on the best information available at the time. As additional information becomes available, the Company reassesses the potential liability and records an adjustment to its estimate in the period in which the adjustment is probable and an amount or range can be reasonably estimated. The determination of an expected contingent liability and associated litigation expense requires the Company to make assumptions related to the outcome of these matters. Due to the inherent uncertainties of loss contingencies, the Company’s estimates may be different than the actual outcomes. Legal fees, including legal fees associated with loss contingencies, are recognized as incurred and included in “Other general and administrative”“Professional services” expense inon the Company’s Consolidated Statements of Operations.
LENDINGCLUB CORPORATION
Notes to Consolidated Financial Statements
(Tabular Amounts in Thousands, Except Share and Per Share Amounts, Ratios, or as Noted)
Revenue Recognition
Transaction Fees: The Company has a single performance obligation to provide customers access to the Company’s platform. Transaction fees are considered revenue from contracts with customers, including issuing banks and education and patient service providers. The Companyrecognizes transaction fee revenue each time a loan is facilitated by the Company, who provides loan application processing and loan facilitation services, resulting in a loan issued by the customers.
Transaction fees are based on the initial principal amount of the loans facilitated by the Company and paid by the issuing banks and education and patient service providers each time a loan is issued by the issuing banks. Transaction fees to which the Company expects to be entitled are variable consideration because loan volume originated over the contractual term is not known at the contract’s inception. The transaction fee is determined each time a loan is issued based on that loan’s initial principal amount.
The Company pays WebBank a loan trailing fee to give WebBank an ongoing financial interest in the performance of the loans it originates and sells to the Company. The Loan Trailing Fee is paid over time based on the amount and timing of principal and interest payments made by borrowers of the underlying loans. The Loan Trailing Fee is consideration payable to WebBank and the loan trailing fee liability is recorded at fair value. Additionally, the Company assumes the issuing bank’s obligation under Utah law to refund the pro-rated amount of the transaction fee in excess of 5% in the event the borrower prepays the loan in full before maturity. Both the loan trailing fees and transaction fee refunds are recorded as a reduction of transaction fee revenue in the Company’s Consolidated Statements of Operations and are included in “Accrued expenses and other liabilities” on the Company’s Consolidated Balance Sheets.
Other Revenue: Other revenue primarily consists of referral fee revenue and sublease revenue from our sublet office space in San Francisco, California. The Company is entitled to receive referral fees from third-party companies when customers referred by the Company consider or purchase products or services from such third-party companies. Referral contracts contain a single performance obligation. The Company recognizes referral fees for each distinct instance when the criteria for receiving the referral fee has been satisfied. Sublease revenue is recognized on a straight-line basis over the term of the lease.
Stock-based Compensation
Stock-based compensation includes expense primarily associated with restricted stock units (RSUs) (RSUs) and performance-based restricted stock units (PBRSUs), stock options, and the Company’s employee stock purchase plan (ESPP), as well as expense associated with stock issued related to acquisitions. Stock-based compensation expense is based on the grant date fair value of the award. The cost is generally recognized over the vesting period on a straight-line basis. Forfeitures are recognized as incurred.
Income Taxes
The Company accounts for income taxes under the asset and liability method. Under this method, deferred tax assets and liabilities are determined on the basis of the differences between the financial statement and tax bases of assets and liabilities using enacted tax rates in effect for the year in which the differences are expected to reverse. The effect of a change in tax rates on deferred tax assets and liabilities is recognized in income in the period that includes the enactment date.
The Company recognizes deferred tax assets to the extent that it believes these assets are more likely than not to be realized. In making such a determination, the Company considers the available positive and negative evidence, including future reversals of existing taxable temporary differences, projected future taxable income, tax-planning strategies, and results of recent operations. Valuation allowances are established when necessary to reduce deferred
LENDINGCLUB CORPORATION
Notes to Consolidated Financial Statements
(Tabular Amounts in Thousands, Except Share and Per Share Amounts, Ratios, or as Noted)
tax assets to the amounts that are more likely than not expected to be realized. If the Company determines that it is able to realize its deferred tax assets in the future in excess of the net recorded amount, the Company decreases the deferred tax asset valuation allowance, which reduces the provision for income taxes.
Uncertain tax positions are recognized only when we believethe Company believes it is more likely than not that the tax position will be upheld on examination by the taxing authorities based on the merits of the position. The Company recognizes interest and penalties, if any, related to uncertain tax positions in “Income tax expense (benefit)benefit (expense)” inon the Consolidated Statements of Operations.Income Statement.
Net Income (Loss)Earnings Per Share
Basic net income (loss)earnings per share (Basic EPS) attributable to common stockholders is computed by dividing net income (loss) attributable to LendingClub by the weighted-average number of common shares outstanding during the period. Diluted net income (loss)earnings per share (Diluted EPS) is computed by dividing net income (loss) attributable to LendingClub by the weighted-average number of common shares outstanding during the period, adjusted for the effects of dilutive issuances of shares of common stock, which predominantly include incremental shares issued for outstanding RSUs, PBRSUs, and stock options. PBRSUs are included in dilutive shares to the extent the pre-established performance targets have been or are estimated to be satisfied as of the reporting date. The dilutive potential common shares are computed using the treasury stock method. The effects of outstanding RSUs, PBRSUs, and stock options are excluded from the computation of Diluted EPS in periods in which the effect would be antidilutive. For periods with more than one class of common shares, the Company computes Basic and Diluted EPS using the two-class method, which is an allocation of net income (loss) among the holders of each class of common shares. The Series A Preferred Stock is considered a separate class of common share for purposes of calculating net income (loss) per share because it participates in earnings similar to common stock and does not receive any significant preferences over the common stock.
Beneficial Conversion Feature
The Company accounts for the beneficial conversion feature (BCF) on its Series A Preferred Stock in accordance with ASC 470-20, Debt with Conversion and Other Options. The Company accretes the BCF discount from the date of issuance to the earliest conversion date, which was March 20, 2020. All of the BCF discount was accreted and recognized as a deemed dividend in “Accumulated deficit” on the Company’s Condensed Consolidated Balance Sheets. See “Note 15. Stockholders' Equity” for additional information.
Consolidation of Variable Interest Entities
A variable interest entity (VIE) is a legal entity that has either a total equity investment that is insufficient to finance its activities without additional subordinated financial support or whose equity investors lack the characteristics of a controlling financial interest. The Company’s variable interest arises from contractual, ownership or other monetary interests in the entity, which change with fluctuations in the fair value of the entity’s net assets. A VIE is consolidated by its primary beneficiary, the party that has both the power to direct the activities that most
LENDINGCLUB CORPORATION
Notes to Consolidated Financial Statements
(Tabular Amounts in Thousands, Except Share and Per Share Amounts, Ratios, or as Noted)
significantly impact the VIE’s economic performance, and the obligation to absorb losses or the right to receive benefits of the VIE that could potentially be significant to the VIE. The Company consolidates a VIE when it is deemed to be the primary beneficiary. The Company assesses whether or not it is the primary beneficiary of a VIE on an ongoing basis.
Transfers of Financial Assets
The Company accounts for transfers of financial assets as sales when it has surrendered control over the transferred assets. Control is generally considered to have been surrendered when the transferred assets have been legally isolated from the Company, the transferee has the right to pledge or exchange the assets without any significant
LENDINGCLUB CORPORATION
Notes to Consolidated Financial Statements
(Tabular Amounts in Thousands, Except Share and Per Share Amounts, Ratios, or as Noted)
constraints, and the Company has not entered into a repurchase agreement, does not hold unconditional call options and has not written put options on the transferred assets. In assessing whether control has been surrendered, the Company considers whether the transferee would be a consolidated affiliate and the impact of all arrangements or agreements made contemporaneously with, or in contemplation of the transfer, even if they were not entered into at the time of transfer. The Company measures gain or loss on sale of financial assets as the net proceeds received on the sale less the carrying amount of the loans sold. The net proceeds of the sale represent the fair value of any assets obtained or liabilities incurred as part of the transaction, including, but not limited to servicing assets, retained securities, and recourse obligations.
Transfers of financial assets that do not qualify for sale accounting arewould be reported as secured borrowings. Accordingly, the related assets would remain on the Company’s Consolidated Balance SheetsSheet and continue to be reported and accounted for as if the transfer had not occurred. Cash proceeds from these transfers are reported as liabilities, with related interest expense recognized over the life of the related assets.
Adoption of New Accounting Standards
The Company adopted the following new accounting standards during the year ended December 31, 2020:2023:
On January 1, 2020, the entity adopted ASU 2016-13,The FASB issued Accounting Standards Update (ASU) 2022-02, Financial Instruments – Credit Losses (Topic 326): Measurement ofTroubled Debt Restructurings and Vintage Disclosures, which eliminates the accounting guidance on troubled debt restructurings (TDRs) for creditors that have adopted the Current Expected Credit Losses (CECL) model and adds a requirement to disclose current period gross charge-offs by year of origination. The Company adopted ASU 2022-02 as of January 1, 2023 on Financial Instruments. For loans accounteda prospective basis. The ASU updates the requirements related to accounting for at amortized cost,credit losses under Accounting Standards Codification 326, including removing anticipatory TDRs and requiring the guidance replacesuse of the incurred loss impairment methodologypost-modified effective interest rate when a discounted cash flow method is used in the CECL calculation. The ASU updates disclosures for creditors with an expected credit loss modelrespect to loan refinancings and restructurings for which a company recognizes an allowance based on the estimate of expected credit loss. As the Company has elected the fair value option for loans and loans accounted for at fair value through net income are outside the scope of Topic 326, there is no impact on the Company’s loan portfolios.borrowers experiencing financial difficulty.
For debt securities availableThe FASB issued ASU 2020-04, Reference Rate Reform (Topic 848): Facilitation of the Effects of Reference Rate Reform on Financial Reporting, and ASU 2022-06, Reference Rate Reform (Topic 848): Deferral of the Sunset Date of Topic 848, which, if certain criteria are met, provide optional expedients and exceptions for sale, Topic 326 requires recognitionapplying GAAP to transactions affected by reference rate reform. The provisions of expected credit losses by recognizing an allowance for credit lossesthis topic are elective and may be applied prospectively as of the beginning of the reporting period when the fair value of the securityelection is below amortized cost and the recognition of this allowance is limited to the difference between the security’s amortized cost basis and fair value. Upon adoption, the amendments in Topic 326 are recognizedmade through a cumulative-effect adjustment to retained earnings, except for debt securities with prior other-than-temporary impairment whereby Topic 326 is applied prospectively.
December 31, 2024. The Company adopted ASC 326 using the prospective transition approach for debt securities for which other-than-temporary impairment had been recognized prior to January 1, 2020. As a result, the amortized cost basis remains the same before and after the effective date of ASC 326. The effective interest rate on these debt securities was not changed. Amounts previously recognized in accumulated other comprehensive incomethis standard as of January April1, 2020 relating to improvements in cashflows expected to be collected are accreted into income over the remaining life2023. The adoption of the asset. Recoveries of amounts previously written off relating to improvements in cash flows after January 1, 2020 are recorded in earnings when received.
Additionally, the Company adopted ASC 326 using the prospective transition approach for PCD financial assets. The Companythis standard did not have any previously classified assets as purchased credit impaired (PCI) under ASC 310-30. In accordance with this standard, management did not reevaluate for PCD upon transition.
Adoption of Topic 326 did not have ana material impact on the Company’s financial position, results of operations, cash flows, and cash flows. The Company did not record a cumulative effect adjustment to retained earnings. The Company included the disclosures required by ASU 2016-13 in “disclosures.
Note 5. Securities Available for Sale.
”
New Accounting Standards Not Yet Adopted
In August 2018,November 2023, the FASB issued ASU 2018-13,2023-07, Fair Value MeasurementSegment Reporting (Topic 820): Disclosure Framework280) – ChangesImprovements to the Disclosure Requirements for Fair Value MeasurementReportable Segment Disclosures, which modifies theimproves reportable segment disclosure requirements, on fair value measurements by removing, modifying, or adding certain disclosures. The ASU eliminates such disclosures as the amount of and reasons for transfers between Level 1 and Level 2 of the fair value hierarchy andprimarily through enhanced
LENDINGCLUB CORPORATION
Notes to Consolidated Financial Statements
(Tabular Amounts in Thousands, Except Share and Per Share Amounts, Ratios, or as Noted)
valuation processes for Level 3 fair value measurements. The ASU adds new disclosure requirements for Level 3 measurements.disclosures about significant segment expenses. The new guidance becamestandard is effective on January 1, 2020for annual periods beginning after December 15, 2023 and did not have a material impact on the Company’s related disclosures.
In August 2018, the FASB issued ASU 2018-15, Intangibles – Goodwill and Other – Internal-Use Software – (Subtopic 350-40): Customer’s Accounting for Implementation Costs Incurred in a Cloud Computing Arrangement That Is a Service Contract, which requires a customer in a hosting arrangement that is a service contract to follow the internal-use software guidance in ASC 350-40 to determine which implementation costs to capitalize as assets or expense as incurred.interim periods beginning after December 15, 2024. The amendments of this standard became effective on January 1, 2020 and the Company adopted the standard using the prospective approach.should be applied retrospectively, with early adoption permitted. The Company has reviewed existing cloud computing arrangements and determined which ones are service contracts. Implementation costs that areis evaluating the impact of this ASU but does not from internal developers relatedexpect it to service contracts that satisfy the criteria for capitalization under ASC 350-40 will be presented with “Other assets” on the Company’s Consolidated Balance Sheets, amortization expense will be presented in the same line on the income statement as the fees for the associated hosted service on the Company’s Consolidated Statements of Operations, and the cash flows will be presented consistent with the presentation of cash flows for the fees related to the hosted service, generally as cash flows from operations, on the Company’s Consolidated Statements of Cash Flows. Adoption of the standard did not have a material impact on the Company’s financial position, results of operations, cash flows, or disclosures.material.
In December 2019,2023, the FASB issued ASU 2019-12,2023-09, Income Taxes (Topic 740): Simplifying the Accounting for - Improvements to Income TaxesTax Disclosures, which is part of the FASB’s initiative to reduce complexity in accounting standards. The ASU eliminates certain exceptions to the general principles of ASC 740, Income Taxes, and simplifiesimproves income tax accounting in several areas.disclosure requirements, primarily through enhanced disclosures surrounding rate reconciliation and income taxes paid. The new standard is effective for fiscalannual periods beginning after December 15, 20202024. The amendments of this standard should be applied prospectively, with earlyretrospective application permitted. Early adoption permitted. The Company early adopted this ASU as of January 1, 2020, and did not have a material impact on its financial position, results of operations, cash flows, and disclosures.
New Accounting Standards Not Yet Adopted
In March 2020, the FASB issued ASU 2020-04, Reference Rate Reform (Topic 848): Facilitation of the Effects of Reference Rate Reform on Financial Reporting, which, if certain criteria are met, provides optional expedients and exceptions for applying generally accepted accounting principles to transactions affected by reference rate reform. These transactions include contract modifications, hedging relationships, and sale or transfer of debt securities classified as held-to-maturity. The provisions of the new standard may be adopted as of the beginning of the reporting period when the election is made until December 31, 2022.also permitted. The Company is evaluating the impact of this ASU will have on its financial position, results of operations, cash flows, and disclosures. The Company hasbut does not elected an adoption date.
In August 2020, the FASB issued ASU 2020-06, Debt with Conversion and Other Options (Subtopic 470-20) and Derivatives and Hedging-Contracts in Entity’s Own Equity (Subtopic 815-40): Accounting for Convertible Instruments and Contracts in an Entity’s Own Equity, which simplifies the accounting for certain financial instruments with characteristics of liabilities and equity including convertible instruments and contracts on an entity’s own equity. The guidance allows for either full or modified retrospective adoption for fiscal periods beginning after December 15, 2021 with early adoption permitted for fiscal periods beginning after December 15, 2020. The Company is evaluating the impact this ASU will have on its financial position, results of operations, cash flows, and disclosures.expect it to be material.
3. Revenue from Contracts2. Business Acquisition
On February 1, 2021, the Company completed the Acquisition. Upon closing, LendingClub acquired all outstanding voting equity interests of Radius in exchange for total consideration as follows:
| | | | | |
| Cash paid | $ | 140,256 | |
Fair value of common stock issued (1) | 40,808 | |
Consideration related to share-based payments (2) | 5,742 | |
| Total consideration paid | $ | 186,806 | |
(1) Calculated using the closing stock price of $10.85 on January 29, 2021, the most recent trading day preceding the Acquisition, multiplied by 3,761,114 shares issued pursuant to the Plan of Merger.
(2) In connection with Customersthe Acquisition, LendingClub agreed to convert equity awards held by Radius employees into cash and LendingClub awards pursuant to the Plan of Merger.
The Company’s revenue from contracts with customers includes transaction feesAcquisition was accounted for as a purchase business combination. Accordingly, the assets acquired and referral fees. Referral feesliabilities assumed are presented at their fair values determined as a component of “Other revenue”the Acquisition date. Determining fair value of identifiable assets, particularly intangibles, loans (including PCD loans), and liabilities acquired and assumed based on DCF analysis or other valuation techniques required management to make estimates that are highly subjective in the Consolidated Statements of Operations.nature based on available information.
LENDINGCLUB CORPORATION
Notes to Consolidated Financial Statements
(Tabular Amounts in Thousands, Except Share and Per Share Amounts, Ratios, or as Noted)
The following table presents an allocation of the Company’s revenue from contracts with customers, disaggregated by revenue source for services transferred over time, fortotal consideration paid to the years ended December 31, 2020fair value of the identifiable tangible and 2019:intangible assets acquired and liabilities assumed:
| | | | | | | | | | | | | | | | | |
| Year Ended December 31, | 2020 | | 2019 | | 2018 |
| Transaction fees | $ | 207,640 | | | $ | 598,760 | | | $ | 526,942 | |
| Referral fees | 5,011 | | | 5,474 | | | 3,645 | |
| Total revenue from contracts with customers | $ | 212,651 | | | $ | 604,234 | | | $ | 530,587 | |
The Company recognizes transaction and referral fees at each distinct instance after the Company satisfies its performance obligations. The Company had 0 bad debt expense for the years ended December 31, 2020 and 2019. Because revenue is recognized at the same time that payments are received, the Company had no contract assets, contract liabilities, or deferred contract costs recorded as of December 31, 2020 and 2019. Additionally, the Company did not recognize any revenue from performance obligations related to prior periods (for example, due to changes in transaction price) for the years ended December 31, 2020 and 2019. For additional detail on the Company’s accounting policy regarding revenue recognition, see “Note 2. Summary of Significant Accounting Policies” above.
4. Net Income (Loss) Per Share | | | | | |
| Assets acquired: | |
| Cash and due from banks | $ | 18,184 | |
| Interest-bearing deposits in banks | 650,052 | |
| Total cash and cash equivalents | 668,236 | |
| Securities available for sale at fair value | 259,037 | |
| Loans and leases held for investment | 1,589,054 | |
| Allowance for loan and lease losses | (12,440) | |
| Loans and leases held for investment, net | 1,576,614 | |
| Property, equipment and software | 1,926 | |
| Goodwill | 75,717 | |
| Other assets | 86,482 | |
| Total assets | 2,668,012 | |
| |
| Liabilities assumed: | |
| Non-interest bearing deposits | 146,187 | |
| Interest-bearing deposits | 1,862,272 | |
| Total deposits | 2,008,459 | |
| Short-term borrowings | 9,870 | |
| Advances from PPPLF | 420,962 | |
| Other long-term debt | 18,630 | |
| Other liabilities | 23,285 | |
| Total liabilities | 2,481,206 | |
| |
| Total consideration paid | $ | 186,806 | |
The following table detailsbelow presents certain unaudited pro forma financial information for illustrative purposes only, for the computationyear ended December 31, 2021, as if the Acquisition took place on the first day of the preceding year. The pro forma information combines the historical results of Radius with the Company’s, basicadjusting for the estimated impact of certain fair value adjustments for the respective periods. The pro forma information does not reflect changes to the provision for credit losses resulting from recording loan assets as fair value, cost savings, or business synergies. As a result, actual amounts would have differed from the unaudited pro forma information presented and diluted net loss per share of common stock and Series A Preferred Stock:the differences could be significant.
| | | | | | | | | | | | | | | | | | | | |
| Year Ended December 31, | 2020 | | 2019 | | 2018 |
| Common Stock | Preferred Stock(1)(2) | | Common Stock | | Common Stock |
| Allocation of undistributed LendingClub net loss | $ | (154,664) | | $ | (32,874) | | | $ | (30,745) | | | $ | (128,308) | |
| Deemed dividend | (50,204) | | 50,204 | | | 0 | | | 0 | |
| Net loss attributable to stockholders | $ | (204,868) | | $ | 17,330 | | | $ | (30,745) | | | $ | (128,308) | |
Weighted-average common shares – Basic and Diluted (2) | 77,934,302 | | 12,505,393 | | | 87,278,596 | | | 84,583,461 | |
| | | | | | |
| | | | | | |
| | | | | | |
Net loss per share attributable to stockholders – Basic and Diluted (2) | $ | (2.63) | | $ | 1.39 | | | $ | (0.35) | | | $ | (1.52) | |
(1) Presented on an as-converted basis.
(2) See “Note 2. Summary of Significant Accounting Policies” and “Note 15. Stockholders' Equity” for additional information. | | | | | | | |
| Year Ended December 31, | 2021 | | |
| Total net revenue | $ | 825,701 | | | |
| Net income | $ | 11,644 | | | |
In February 2020,For the Company entered into an exchange agreement with its largest stockholder, Shanda Asset Management Holdings Limited and its affiliates (Shanda), pursuant to which,year ended December 31, 2021, total net revenue of $73.6 million from the Acquisition is included on March 20, 2020, Shanda exchanged all of 19,562,881 shares of LendingClub common stock, par value of $0.01 per share, held by it for (i) 195,628 newly issued shares of mandatorily convertible, non-voting, LendingClub preferred stock, series A (Series A Preferred Stock), par value of $0.01 per share, and (ii) a one-time cash payment of $50.2 million. The Series A Preferred Stock is considered a separate class of common shares for purposes of calculating net income (loss) per share because it participates in earnings similar to common stock and does not receive any significant preferences over the common stock. See “Note 15. Stockholders' Equity” for additional information. During the period that included the Company’s preferred stock, Basic and Diluted EPS were computed using the two-class method, which is a net income (loss) allocation that determines EPS for each class of common stock according to dividends declared and participation rights in undistributed income (loss).Income Statement.
LENDINGCLUB CORPORATION
Notes to Consolidated Financial Statements
(Tabular Amounts in Thousands, Except Share and Per Share Amounts, Ratios, or as Noted)
3. Marketplace Revenue
Marketplace revenue consists of (i) origination fees, (ii) servicing fees, (iii) gain on sales of loans and (iv) net fair value adjustments, as described below.
Origination Fees: The Company receives fees from borrowers for the origination of unsecured personal loans that are held for sale.
Servicing Fees: The Company receives servicing fees to compensate it for servicing loans on behalf of investors, including managing payments and collections from borrowers and payments to those investors. The amount of servicing fee revenue earned is predominantly affected by the servicing rates paid by investors and the outstanding principal balance of loans serviced for investors. Servicing fee revenue related to loans sold also includes the associated change in the fair value of servicing assets.
Gain on Sales of Loans: In connection with loan sales the Company recognizes a gain or loss on the sale of loans based on the level to which the contractual servicing fee is above or below an estimated market rate of servicing. Additionally, the Company recognizes transaction costs, if any, as a loss on sale of loans.
Net Fair Value Adjustments: The Company records fair value adjustments on loans that are recorded at fair value, including gains or losses from sale prices in excess of or less than the loan principal amount sold.
The following table summarizes the weighted-average common shares that were excluded from the Company’s diluted net loss per share computation because their effect would have been anti-dilutivepresents components of marketplace revenue for the periods presented:
| | | | | | | | | | | | | | | | | |
| Year Ended December 31, | 2020 | | 2019 | | 2018 |
| Preferred stock | 12,505,393 | | | 0 | | | 0 | |
| Stock options | 221,949 | | | 455,627 | | | 893,425 | |
| RSUs and PBRSUs | 299,747 | | | 59,812 | | | 63,959 | |
| Total | 13,027,089 | | | 515,439 | | | 957,384 | |
5. Securities Available for Sale
The Company’s Structured Program transactions include (i) asset-backed securitization transactions and (ii) Certificate Program transactions. Certificate Program transactions include CLUB Certificate and Levered Certificate transactions.
In connection with asset-backed securitizations, the Company is the sponsor and establishes trusts to ultimately purchase the unsecured personal loans from the Company and/or third-party whole loan investors. Securities issued from our asset-backed securitizations are senior or subordinated based on the waterfall criteria of loan payments to each security class. The subordinated residual interests issued from these transactions are first to absorb credit losses in accordance with the waterfall criteria. The assets are transferred into a trust such that the assets are legally isolated from the creditors of the Company and are not available to satisfy obligations of the Company. These assets can only be used to settle obligations of the underlying trusts. The asset-backed securitization senior securities and subordinated residual interests retained by the Company are presented as “Asset-backed senior securities” and “Asset-backed subordinated securities,” respectively, in the securities available for sale tables below.
In addition, the Company sponsors the sale of unsecured personal loans through the issuance of certificate securities under our Certificate Program. The certificate securities are collateralized by loans transferred to a series of a master trust and trade in the over-the-counter market with a CUSIP. The assets are transferred into a trust such that the assets are legally isolated from the creditors of the Company and are not available to satisfy obligations of the Company. These assets can only be used to settle obligations of the underlying Certificate Program trusts. The CLUB Certificate issued securities are pass-through securities of which each owner has an undivided and equal interest in the underlying loans of each transaction. The Levered Certificate issued securities include senior and subordinated securities based on the waterfall criteria of loan payments to each security class. The subordinated securities issued from these transactions are first to absorb credit losses in accordance with the waterfall criteria. The CLUB Certificate issued securities retained by the Company are presented as “CLUB Certificate asset-backed securities” in the securities available for sale tables below.
The Levered Certificate issued senior and subordinated securities retained by the Company are presented in aggregate with securities from asset-backed securitizations as “Asset-backed senior securities” and “Asset-backed subordinated securities,” respectively, in the tables below. The “Other asset-backed securities” caption in the tables below primarily includes investment-grade rated bonds that are collateralized by automobile loan receivables. In the fourth quarter of 2020, the Company liquidated a portion of its investment portfolio, which included commercial paper, corporate debt securities, asset-backed securities, and certificates of deposit. | | | | | | | | | | | | | | | | | |
| Year Ended December 31, | 2023 | | 2022 | | 2021 |
| Origination fees | $ | 279,146 | | | $ | 499,179 | | | $ | 416,839 | |
| Servicing fees | 98,613 | | | 80,609 | | | 87,639 | |
| Gain on sales of loans | 47,839 | | | 95,335 | | | 70,116 | |
| Net fair value adjustments | (134,114) | | | 8,503 | | | 3,986 | |
| Total marketplace revenue | $ | 291,484 | | | $ | 683,626 | | | $ | 578,580 | |
LENDINGCLUB CORPORATION
Notes to Consolidated Financial Statements
(Tabular Amounts in Thousands, Except Share and Per Share Amounts, Ratios, or as Noted)
4. Earnings Per Share
The following table details the computation of the Company’s Basic and Diluted EPS of common stock and Series A Preferred Stock:
| | | | | | | | | | | | | | | | | | | | | | |
| Year Ended December 31, | 2023 | | 2022 | | 2021 |
| Common Stock | | | Common Stock | | | Common Stock | Preferred Stock (1) |
| Basic EPS: | | | | | | | | |
| | | | | | | | |
| | | | | | | | |
| Net income attributable to stockholders | $ | 38,939 | | | | $ | 289,685 | | | | $ | 18,456 | | $ | 124 | |
| Weighted-average common shares – Basic | 108,466,179 | | | | 103,547,305 | | | | 97,486,754 | | 653,118 | |
| Basic EPS | $ | 0.36 | | | | $ | 2.80 | | | | $ | 0.19 | | $ | 0.19 | |
| | | | | | | | |
| Diluted EPS: | | | | | | | | |
| | | | | | | | |
| | | | | | | | |
| Net income attributable to stockholders | $ | 38,939 | | | | $ | 289,685 | | | | $ | 18,580 | | $ | — | |
| Weighted-average common shares – Diluted | 108,468,857 | | | | 104,001,288 | | | | 102,147,353 | | — | |
| Diluted EPS | $ | 0.36 | | | | $ | 2.79 | | | | $ | 0.18 | | $ | 0.00 | |
(1) Presented on an as-converted basis.
In March 2020, the Company issued 195,628 shares of mandatorily convertible, non-voting, Series A Preferred Stock, par value of $0.01 per share. The Series A Preferred Stock was considered a separate class of common shares for purposes of calculating EPS because it participated in earnings similar to common stock and did not receive any significant preferences over common stock. As a result of the preferred stock outstanding during the first quarter of 2021, Basic and Diluted EPS were computed using the two-class method, which is a net income allocation that determines EPS for each class of common stock according to dividends declared and participation rights in undistributed income (loss). The remaining preferred stock was sold during the first quarter of 2021 and, therefore, there were no shares of preferred stock outstanding as of March 31, 2021.
LENDINGCLUB CORPORATION
Notes to Consolidated Financial Statements
(Tabular Amounts in Thousands, Except Share and Per Share Amounts, Ratios, or as Noted)
5. Securities Available for Sale
The amortized cost, gross unrealized gains and losses, allowance for credit losses, and fair value of AFS securities available for sale as of December 31, 2020 and 2019, were as follows:
| | | | | | | | | | | | | | | | | | | | | | | | | | | | | |
| December 31, 2020 | Amortized
Cost | | Gross
Unrealized
Gains | | Gross
Unrealized
Losses | | Allowance for Credit Losses | | Fair
Value |
Asset-backed senior securities (1)(2) | $ | 75,332 | | | $ | 67 | | | $ | (27) | | | $ | 0 | | | $ | 75,372 | |
CLUB Certificate asset-backed securities (1)(2) | 54,525 | | | 576 | | | (772) | | | (4,190) | | | 50,139 | |
Asset-backed subordinated securities (1)(2) | 29,107 | | | 2,128 | | | (174) | | | (14,546) | | | 16,515 | |
| | | | | | | | | |
| | | | | | | | | |
| | | | | | | | | |
| | | | | | | | | |
| | | | | | | | | |
| | | | | | | | | |
| | | | | | | | | |
| | | | | | | | | |
Other securities (2) | 200 | | | 0 | | | 0 | | | 0 | | | 200 | |
| Total securities available for sale | $ | 159,164 | | | $ | 2,771 | | | $ | (973) | | | $ | (18,736) | | | $ | 142,226 | |
| | | | | | | | | | | | | | | | | | | | | | | |
| December 31, 2023 | Amortized
Cost | | Gross
Unrealized
Gains | | Gross
Unrealized
Losses | | Fair
Value |
| Senior asset-backed securities related to Structured Program transactions | $ | 1,165,513 | | | $ | 10,932 | | | $ | (42) | | | $ | 1,176,403 | |
| U.S. agency residential mortgage-backed securities | 261,885 | | | 208 | | | (37,497) | | | 224,596 | |
| U.S. agency securities | 93,452 | | | — | | | (13,348) | | | 80,104 | |
Other asset-backed securities related to Structured Program transactions (1) | 70,662 | | | 2,731 | | | — | | | 73,393 | |
| Mortgage-backed securities | 42,511 | | | — | | | (5,435) | | | 37,076 | |
| Other asset-backed securities | 26,710 | | | 25 | | | (634) | | | 26,101 | |
| Municipal securities | 3,257 | | | — | | | (668) | | | 2,589 | |
Total securities available for sale (2) | $ | 1,663,990 | | | $ | 13,896 | | | $ | (57,624) | | | $ | 1,620,262 | |
| | | | | | | | | | | | | | | | | | | | | | | |
| December 31, 2019 | Amortized
Cost | | Gross
Unrealized
Gains | | Gross
Unrealized
Losses | | Fair
Value |
Asset-backed senior securities (1)(2) | $ | 108,780 | | | $ | 597 | | | $ | (38) | | | $ | 109,339 | |
CLUB Certificate asset-backed securities (1)(2) | 90,728 | | | 41 | | | (1,063) | | | 89,706 | |
Asset-backed subordinated securities (1)(2) | 20,888 | | | 423 | | | (221) | | | 21,090 | |
| Corporate debt securities | 14,333 | | | 11 | | | (1) | | | 14,343 | |
| Certificates of deposit | 13,100 | | | 0 | | | 0 | | | 13,100 | |
| Other asset-backed securities | 12,075 | | | 6 | | | (1) | | | 12,080 | |
| Commercial paper | 9,274 | | | 0 | | | 0 | | | 9,274 | |
| U.S. agency securities | 1,995 | | | 0 | | | 0 | | | 1,995 | |
| | | | | | | |
| Total securities available for sale | $ | 271,173 | | | $ | 1,078 | | | $ | (1,324) | | | $ | 270,927 | |
| | | | | | | | | | | | | | | | | | | | | | | |
| December 31, 2022 | Amortized
Cost | | Gross
Unrealized
Gains | | Gross
Unrealized
Losses | | Fair
Value |
| U.S. agency residential mortgage-backed securities | $ | 255,675 | | | $ | — | | | $ | (41,248) | | | $ | 214,427 | |
| U.S. agency securities | 90,447 | | | — | | | (16,053) | | | 74,394 | |
| Mortgage-backed securities | 26,988 | | | — | | | (4,470) | | | 22,518 | |
| Asset-backed securities related to Structured Program transactions | 8,322 | | | 9,395 | | | — | | | 17,717 | |
| Other asset-backed securities | 14,959 | | | 29 | | | (785) | | | 14,203 | |
| Municipal securities | 3,277 | | | — | | | (834) | | | 2,443 | |
Total securities available for sale (2) | $ | 399,668 | | | $ | 9,424 | | | $ | (63,390) | | | $ | 345,702 | |
(1)As of December 31, 2020 and 2019, $119.32023, $70.1 million and $219.0 million, respectively, of the other asset-backed securities related to Structured Program transactions at fair value are subject to restrictions on transfer pursuant to the Company’s obligations as a “sponsor” under the U.S. Risk Retention Rules (as more fully described in “Part I – Item 1A. Risk Factors – Risk retention rules may increase our compliance costs, impair our liquidity and otherwise adversely affect our operating results.”)Rules.
(2)As of December 31, 20202023 and 2019,2022, includes $133.5$359.5 million and $174.8$319.0 million, respectively, of securities pledged as collateral at fair value.
LENDINGCLUB CORPORATION
Notes to Consolidated Financial Statements
(Tabular Amounts in Thousands, Except Share and Per Share Amounts, Ratios, or as Noted)
A summary of AFS securities available for sale with unrealized losses for which ana credit valuation allowance for credit losses has not been recorded, as of December 31, 2020 and 2019, aggregated by period of continuous unrealized loss, is as follows:
| | | | | | | | | | | | | | | | | | | | | | | | | | | | | | | | | | | |
| Less than
12 months | | 12 months
or longer | | Total |
| December 31, 2020 | Fair
Value | | Unrealized
Losses | | Fair
Value | | Unrealized
Losses | | Fair
Value | | Unrealized
Losses |
| Asset-backed securities related to Structured Program transactions | $ | 26,678 | | | $ | (855) | | | $ | 6,052 | | | $ | (118) | | | $ | 32,730 | | | $ | (973) | |
| | | | | | | | | | | |
| | | | | | | | | | | |
| | | | | | | | | | | |
Total securities with unrealized losses (1) | $ | 26,678 | | | $ | (855) | | | $ | 6,052 | | | $ | (118) | | | $ | 32,730 | | | $ | (973) | |
| | | | | | | | | | | |
| Less than
12 months | | 12 months
or longer | | Total |
| December 31, 2019 | Fair
Value | | Unrealized
Losses | | Fair
Value | | Unrealized
Losses | | Fair
Value | | Unrealized
Losses |
| Asset-backed securities related to Structured Program transactions | $ | 91,350 | | | $ | (1,287) | | | $ | 1,875 | | | $ | (35) | | | $ | 93,225 | | | $ | (1,322) | |
| Corporate debt securities | 4,613 | | | (1) | | | 0 | | | 0 | | | 4,613 | | | (1) | |
| Other asset-backed securities | 3,062 | | | (1) | | | 0 | | | 0 | | | 3,062 | | | (1) | |
| | | | | | | | | | | |
| | | | | | | | | | | |
Total securities with unrealized losses (1) | $ | 99,025 | | | $ | (1,289) | | | $ | 1,875 | | | $ | (35) | | | $ | 100,900 | | | $ | (1,324) | |
(1) The number of investment positions with unrealized losses at December 31, 2020 and 2019 totaled 55 and 70, respectively. | | | | | | | | | | | | | | | | | | | | | | | | | | | | | | | | | | | |
| Less than
12 months | | 12 months
or longer | | Total |
| December 31, 2023 | Fair
Value | | Unrealized
Losses | | Fair
Value | | Unrealized
Losses | | Fair
Value | | Unrealized
Losses |
| Senior asset-backed securities related to Structured Program transactions | $ | 38,359 | | | $ | (42) | | | $ | — | | | $ | — | | | $ | 38,359 | | | $ | (42) | |
| U.S. agency residential mortgage-backed securities | 6,497 | | | (149) | | | 201,426 | | | (37,348) | | | 207,923 | | | (37,497) | |
| U.S. agency securities | — | | | — | | | 80,104 | | | (13,348) | | | 80,104 | | | (13,348) | |
| Mortgage-backed securities | 13,973 | | | (740) | | | 23,103 | | | (4,695) | | | 37,076 | | | (5,435) | |
| Other asset-backed securities | 12,911 | | | (50) | | | 8,538 | | | (584) | | | 21,449 | | | (634) | |
| | | | | | | | | | | |
| Municipal securities | — | | | — | | | 2,589 | | | (668) | | | 2,589 | | | (668) | |
| | | | | | | | | | | |
| Total securities with unrealized losses | $ | 71,740 | | | $ | (981) | | | $ | 315,760 | | | $ | (56,643) | | | $ | 387,500 | | | $ | (57,624) | |
| | | | | | | | | | | |
| Less than
12 months | | 12 months
or longer | | Total |
| December 31, 2022 | Fair
Value | | Unrealized
Losses | | Fair
Value | | Unrealized
Losses | | Fair
Value | | Unrealized
Losses |
| U.S. agency residential mortgage-backed securities | $ | 111,843 | | | $ | (15,831) | | | $ | 102,584 | | | $ | (25,417) | | | $ | 214,427 | | | $ | (41,248) | |
| U.S. agency securities | 50,352 | | | (7,213) | | | 24,042 | | | (8,840) | | | 74,394 | | | (16,053) | |
| Mortgage-backed securities | 2,441 | | | (229) | | | 20,077 | | | (4,241) | | | 22,518 | | | (4,470) | |
| Other asset-backed securities | 4,086 | | | (73) | | | 6,945 | | | (712) | | | 11,031 | | | (785) | |
| Municipal securities | — | | | — | | | 2,443 | | | (834) | | | 2,443 | | | (834) | |
| Total securities with unrealized losses | $ | 168,722 | | | $ | (23,346) | | | $ | 156,091 | | | $ | (40,044) | | | $ | 324,813 | | | $ | (63,390) | |
The Company recorded an allowance for credit loss on those securities where there was a deterioration in future estimated cash flows. The Company also recorded unrealized losses on securities with fair value price reductions due to higher liquidity premiums observed due to the market dislocation related to COVID-19. The Company deemed it not necessary to record unrealized losses as an allowance for credit loss for certain securities due to the nature of those securities and their investment grade quality.
During the year endedAt December 31, 2020,2023, the Company recognized $3.4 million in credit recovery and loss expense. Duringmajority of the years ended December 31, 2019 and 2018, the Company recognized $3.6 million and $3.0 million, respectively, in other-than-temporary impairment charges on itsCompany’s AFS investment portfolio was comprised of senior asset-backed securities related to Structured Program transactions. There were 0transactions and U.S. agency-backed securities. Management considers U.S. agency-backed securities to be of the highest credit losses recognized into earnings for other-than-temporarily impairedquality and rating given the guarantee of principal and interest by certain U.S. government agencies. Most of the remaining securities held byin an unrealized loss position in the Company during the years endedCompany’s AFS investment portfolio at December 31, 2020, 20192023, were rated investment grade. Substantially all of these unrealized losses in the AFS investment portfolio were caused by interest rate increases. The Company does not intend to sell the investment portfolio, and 2018 for whichit is not more likely than not that it will be required to sell any investment before recovery of its amortized cost basis. For a portiondescription of the impairment was previously recognizedmanagement’s quarterly evaluation of AFS securities in other comprehensive income.an unrealized loss position, see “Note 1. Summary of Significant Accounting Policies.”
There was no activity in the allowance for AFS securities during 2023 and 2022. The following table presents the activity in the credit valuation allowance for credit losses forAFS securities, available for sale, by major security type, for the year ended December 31, 2020:during 2021:
| | | | | | | | | | | | | | | | | | |
| | | | | | | | |
| | | | | | | | |
| | | | | | | | |
| | | | | | | | |
| | | | | | | | |
| | | | | | | | |
| Allowance for Credit Losses | CLUB Certificate asset-backed securities | | Asset-backed subordinated securities | Total | | | | |
| Beginning balance as of January 1, 2020 | $ | 0 | | | $ | 0 | | $ | 0 | | | | | |
| Provision for credit loss expense | (236) | | | (3,146) | | (3,382) | | | | | |
| Allowance arising from PCD financial assets | (3,954) | | | (11,400) | | (15,354) | | | | | |
| Ending balance as of December 31, 2020 | $ | (4,190) | | | $ | (14,546) | | $ | (18,736) | | | | | |
| | | | | | | | | | | | | |
| | | | | | | | | |
| | | | | | | | | |
| | | | | | | | | |
| | | | | | | | | |
| | | | | | | | | |
| | | | | | | | | |
| Credit Valuation Allowance | | | | | Asset-backed securities related to Structured Program transactions | | | | |
| Beginning balance as of December 31, 2020 | | | | | $ | (18,736) | | | | | |
| Reversal of credit loss expense | | | | | 3,382 | | | | | |
| Reversal of allowance arising from PCD financial assets | | | | | 15,354 | | | | | |
| Ending balance as of December 31, 2021 | | | | | $ | — | | | | | |
LENDINGCLUB CORPORATION
Notes to Consolidated Financial Statements
(Tabular Amounts in Thousands, Except Share and Per Share Amounts, Ratios, or as Noted)
Securities available for sale purchased with credit deteriorationThe contractual maturities of AFS securities were as follows:
| | | | | | | | | | | | | | | | | |
| December 31, 2023 | Amortized Cost | | Fair Value | | Weighted- average Yield(1) |
| | | | | |
| | | | | |
| | | | | |
| | | | | |
| Due after 1 year through 5 years: | | | | | |
| Senior asset-backed securities related to Structured Program transactions | $ | 1,165,513 | | | $ | 1,176,403 | | | |
| Other asset-backed securities related to Structured Program transactions | 70,662 | | | 73,393 | | | |
| U.S. agency securities | 9,000 | | | 8,746 | | | |
| Mortgage-backed securities | 1,760 | | | 1,596 | | | |
| Other asset-backed securities | 421 | | | 423 | | | |
| Municipal securities | 154 | | | 139 | | | |
| U.S. agency residential mortgage-backed securities | 3 | | | 3 | | | |
| Total due after 1 year through 5 years | 1,247,513 | | | 1,260,703 | | | 7.57 | % |
| Due after 5 years through 10 years: | | | | | |
| U.S. agency securities | 18,848 | | | 17,545 | | | |
| Other asset-backed securities | 14,873 | | | 14,842 | | | |
| U.S. agency residential mortgage-backed securities | 4,869 | | | 4,623 | | | |
| Mortgage-backed securities | 2,024 | | | 1,713 | | | |
| Municipal securities | 466 | | | 410 | | | |
| Total due after 5 years through 10 years | 41,080 | | | 39,133 | | | 2.36 | % |
| Due after 10 years: | | | | | |
| U.S. agency residential mortgage-backed securities | 257,013 | | | 219,970 | | | |
| U.S. agency securities | 65,604 | | | 53,813 | | | |
| Mortgage-backed securities | 38,727 | | | 33,767 | | | |
| Other asset-backed securities | 11,416 | | | 10,836 | | | |
| Municipal securities | 2,637 | | | 2,040 | | | |
| Total due after 10 years | 375,397 | | | 320,426 | | | 2.91 | % |
| | | | | |
| Total securities available for sale | $ | 1,663,990 | | | $ | 1,620,262 | | | 5.10 | % |
(1) The weighted-average yield is computed using the average quarter end amortized cost during the year ended December 31, 2020 were as follows:
| | | | | | | |
| | | Year Ended December 31, 20202023. |
Purchase price of PCD securities at acquisition | | | $ | 27,034 | |
Allowance for credit losses on PCD securities at acquisition | | | 15,353 | |
Par value of acquired PCD securities at acquisition | | | $ | 42,387 | |
The contractual maturities of securities available for sale at December 31, 2020, were as follows:
| | | | | | | | | | | |
| Amortized Cost | | Fair Value |
| Within 1 year: | | | |
| | | |
| | | |
| | | |
| | | |
| | | |
| Other securities | $ | 200 | | | $ | 200 | |
| Total | 200 | | | 200 | |
| | | |
| | | |
| | | |
| Asset-backed securities related to Structured Program transactions | 158,964 | | | 142,026 | |
| | | |
| Total securities available for sale | $ | 159,164 | | | $ | 142,226 | |
During the years ended December 31, 2020, 2019 and 2018, the Company and Consumer Loan Underlying Bond Depositor LLC (Depositor), a subsidiary of the Company, sold a combined $1.3 billion, $4.5 billion and $2.0 billion, respectively, in asset-backed securities related to Structured Program transactions. There were 0 realized gains or losses related to such sales. For further information see “Note 7. Securitizationsno sales of AFS securities during 2023 and Variable Interest Entities.”2022. Proceeds and gross realized gains and losses from other sales ofAFS securities available for saleduring 2021 were as follows:
| | | | | | | | | | | | | | | | | |
| Year Ended December 31, | 2020 | | 2019 | | 2018 |
| Proceeds | $ | 6,217 | | | $ | 12,548 | | | $ | 497 | |
| Gross realized gains | $ | 14 | | | $ | 9 | | | $ | 1 | |
| Gross realized losses | $ | (3) | | | $ | (1) | | | $ | (3) | |
| | | | | | | |
| Year Ended December 31, | | | 2021 |
| Proceeds | | | $ | 106,192 | |
| Gross realized gains | | | $ | 708 | |
| Gross realized losses | | | $ | (952) | |
6. Loans and Leases Held for Investment Loans Heldat Amortized Cost, Net of Allowance for Sale, Notes, CertificatesLoan and Secured BorrowingsLease Losses
Loans Held for Investment, Notes, CertificatesLendingClub records certain loans and Secured Borrowings
The Company issued member payment dependent notesleases HFI at amortized cost. Other HFI and the LC Trust issued certificates as a means to allow investors to invest in the corresponding loans. At December 31, 2020 and 2019,all HFS loans held for investment, notes, certificates and secured borrowings measuredare recorded at fair value with the Company’s election of the fair value option. Accrued interest receivable is excluded from the amortized cost basis of loans and leases HFI and is reported within “Other assets” on a recurring basis werethe Balance Sheet. Net accrued interest receivable related to loans and leases HFI at amortized cost was $32.2 million and $27.9 million as follows:
| | | | | | | | | | | | | | | | | | | | | | | |
| Loans Held for Investment | | Notes, Certificates and Secured Borrowings |
| December 31, | 2020 | | 2019 | | 2020 | | 2019 |
| Aggregate principal balance outstanding | $ | 679,903 | | | $ | 1,148,888 | | | $ | 679,903 | | | $ | 1,148,888 | |
| Net fair value adjustments | (43,217) | | | (69,573) | | | (43,129) | | | (67,422) | |
| Fair value | $ | 636,686 | | | $ | 1,079,315 | | | $ | 636,774 | | | $ | 1,081,466 | |
Atof December 31, 20202023 and 2019, a fair value of $0.8 million and $18.0 million included in “Loans held for investment at fair value” was pledged as collateral for secured borrowings,2022, respectively.
LENDINGCLUB CORPORATION
Notes to Consolidated Financial Statements
(Tabular Amounts in Thousands, Except Share and Per Share Amounts, Ratios, or as Noted)
The following table provides the balances of notes, certificates and secured borrowings at fair value at the end of the periods indicated:
| | | | | | | | | | | |
| December 31, | 2020 | | 2019 |
| Notes | $ | 583,219 | | | $ | 863,488 | |
| Certificates | 52,620 | | | 197,842 | |
| Secured borrowings | 935 | | | 20,136 | |
| Total notes, certificates and secured borrowings | $ | 636,774 | | | $ | 1,081,466 | |
Loans Invested in by the Company
At December 31, 2020 and 2019, loans invested in by the CompanyLeases Held for which there were no associated notes, certificates or secured borrowings (with the exception of $148.3 million and $40.3 million in loansInvestment at fair value in consolidated trusts as of December 31, 2020 and 2019, respectively) were as follows:
| | | | | | | | | | | | | | | | | | | | | | | | | | | | | | | | | | | |
| Loans Invested in by the Company |
| Loans Held for Investment | | Loans Held for Sale | | Total |
| December 31, | 2020 | | 2019 | | 2020 | | 2019 | | 2020 | | 2019 |
| Aggregate principal balance outstanding | $ | 56,388 | | | $ | 47,042 | | | $ | 132,600 | | | $ | 747,394 | | | $ | 188,988 | | | $ | 794,436 | |
| Net fair value adjustments | (6,434) | | | (3,349) | | | (10,698) | | | (25,039) | | | (17,132) | | | (28,388) | |
| Fair value | $ | 49,954 | | | $ | 43,693 | | | $ | 121,902 | | | $ | 722,355 | | | $ | 171,856 | | | $ | 766,048 | |
The net fair value adjustments of $(17.1) million, $(28.4) million and $(30.6) million represent net unrealized losses recorded in earnings on loans invested in by the Company at December 31, 2020, 2019 and 2018, respectively. Total fair value adjustments recorded in earnings on loans invested in by the Company of $(101.7) million, $(141.0) million and $(102.0) million during the years ended December 31, 2020, 2019 and 2018, respectively, include net realized losses and changes in net unrealized losses. Net interest income earned on loans invested in by the Company during the years ended December 31, 2020, 2019 and 2018 was $59.0 million, $80.9 million and $90.9 million, respectively.
The Company useddefines its own capital to purchase $1.6 billion in loans and sold $1.9 billion in loans duringleases HFI portfolio segments as (i) consumer and (ii) commercial. The following table presents the year ended December 31, 2020, which were securitized or sold to series trusts in connection with the Company’s Certificate Program or sold to whole loan investors. The fair valuecomponents of loans invested ineach portfolio segment by the Company was $171.9 million at December 31, 2020, which included $148.3 million related to Structured Program transactions that were consolidated and a related payable to Structured Program note and certificate holders at fair valueclass of $152.8 million asfinancing receivable:
| | | | | | | | | | | |
| December 31, 2023 | | December 31, 2022 |
| Unsecured personal | $ | 3,726,830 | | | $ | 3,866,373 | |
| Residential mortgages | 183,050 | | | 199,601 | |
| Secured consumer | 250,039 | | | 194,634 | |
| | | |
| Total consumer loans held for investment | 4,159,919 | | | 4,260,608 | |
Equipment finance (1) | 110,992 | | | 160,319 | |
| Commercial real estate | 380,322 | | | 373,501 | |
Commercial and industrial (2) | 199,069 | | | 238,726 | |
| Total commercial loans and leases held for investment | 690,383 | | | 772,546 | |
| Total loans and leases held for investment | 4,850,302 | | | 5,033,154 | |
Allowance for loan and lease losses (3) | (310,387) | | | (327,852) | |
Loans and leases held for investment, net (4) | $ | 4,539,915 | | | $ | 4,705,302 | |
(1) Comprised of December 31, 2020.sales-type leases for equipment. See “Note 7. Securitizations and Variable Interest Entities” and “Note 14. Debt19. Leases” for further discussionadditional information.
(2) Includes $6.4 million and $67.0 million of pledged loans under the Paycheck Protection Program (PPP), as of December 31, 2023 and 2022, respectively.
(3) Comprised of $355.8 million and $340.4 million in allowance for future estimated net charge-offs on the Company’s consolidated trustsexisting portfolio balances, net of a negative allowance of $45.4 million and “$12.5 million for expected recoveries of amounts previously charged-off as of Note 8. Fair ValueDecember 31, 2023 and 2022, respectively.
(4) As of AssetsDecember 31, 2023 and Liabilities2022” for a fair value rollforward of loans invested in by, the Company forhad $3.5 billion and $283.6 million in loans pledged as collateral under the years ended FRB Discount Window, respectively. In addition, as of December 31, 20202023 and 2019.2022, the Company had $479.0 million and $156.2 million in loans pledged to the FHLB of Des Moines, respectively.
| | | | | | | | | | | | | | |
| December 31, 2023 | Gross | ALLL | Net | Allowance Ratios (1) |
| Total consumer loans held for investment | $ | 4,159,919 | | $ | 298,061 | | $ | 3,861,858 | | 7.2 | % |
| Total commercial loans and leases held for investment | 690,383 | | 12,326 | | 678,057 | | 1.8 | % |
| Total loans and leases held for investment | $ | 4,850,302 | | $ | 310,387 | | $ | 4,539,915 | | 6.4 | % |
| | | | | | | | | | | | | | |
| December 31, 2022 | Gross | ALLL | Net | Allowance Ratios (1) |
| Total consumer loans held for investment | $ | 4,260,608 | | $ | 312,489 | | $ | 3,948,119 | | 7.3 | % |
| Total commercial loans and leases held for investment | 772,546 | | 15,363 | | 757,183 | | 2.0 | % |
| Total loans and leases held for investment | 5,033,154 | | $ | 327,852 | | $ | 4,705,302 | | 6.5 | % |
At December 31, 2019,(1) Calculated as the ratio of ALLL to loans with a fair value of $551.5 million included in “Loans held for sale by the Companyand leases HFI at fair value” were pledged as collateral for the Company’s warehouse credit facilities, respectively. See “Note 14. Debt” for additional information related to these debt obligations. There were 0 such loans pledged as collateral at December 31, 2020.
LENDINGCLUB CORPORATION
Notes to Consolidated Financial Statements
(Tabular Amounts in Thousands, Except Share and Per Share Amounts, Ratios, or as Noted)
Loans that were 90 days or more past due (including non-accrual loans) were as follows:
| | | | | | | | | | | | | |
| December 31, | 2020 | | | | 2019 |
| Loans held for investment: | | | | | |
| Outstanding principal balance | $ | 4,690 | | | | | $ | 10,755 | |
| Net fair value adjustments | (3,883) | | | | | (9,663) | |
| Fair value | $ | 807 | | | | | $ | 1,092 | |
| Number of loans (not in thousands) | 769 | | | | | 1,428 | |
| | | | | |
| Loans invested in by the Company: | | | | | |
| Outstanding principal balance | $ | 1,090 | | | | | $ | 2,315 | |
| Net fair value adjustments | (921) | | | | | (2,016) | |
| Fair value | $ | 169 | | | | | $ | 299 | |
| Number of loans (not in thousands) | 129 | | | | | 338 | |
7. Securitizations and Variable Interest Entities
VIE Assets and Liabilities
The following tables provideactivity in the classifications of assets and liabilities onACL by portfolio segment was as follows:
| | | | | | | | | | | | | | | | | | | | | | | | | | | | | | | | | | | | | | | | | | | | | | | | | | | | | |
| Year Ended December 31, | 2023 | | 2022 | | 2021 |
| Consumer | | Commercial | | Total | | Consumer | | Commercial | | Total | | Consumer | | Commercial | | Total |
| Allowance for loan and lease losses, beginning of period | $ | 312,489 | | | $ | 15,363 | | | $ | 327,852 | | | $ | 128,812 | | | $ | 15,577 | | | $ | 144,389 | | | $ | — | | | $ | — | | | $ | — | |
Credit loss expense for loans and leases held for investment (1) | 244,518 | | | (948) | | | 243,570 | | | 265,359 | | | 1,320 | | | 266,679 | | | 136,789 | | | 4,162 | | | 140,951 | |
| Initial allowance for PCD loans acquired during the period | — | | | — | | | — | | | — | | | — | | | — | | | 603 | | | 11,837 | | | 12,440 | |
Charge-offs (2) | (278,105) | | | (3,002) | | | (281,107) | | | (85,247) | | | (2,226) | | | (87,473) | | | (8,789) | | | (1,663) | | | (10,452) | |
| Recoveries | 19,159 | | | 913 | | | 20,072 | | | 3,565 | | | 692 | | | 4,257 | | | 209 | | | 1,241 | | | 1,450 | |
| Allowance for loan and lease losses, end of period | $ | 298,061 | | | $ | 12,326 | | | $ | 310,387 | | | $ | 312,489 | | | $ | 15,363 | | | $ | 327,852 | | | $ | 128,812 | | | $ | 15,577 | | | $ | 144,389 | |
| | | | | | | | | | | | | | | | | |
| Reserve for unfunded lending commitments, beginning of period | $ | 18 | | | $ | 1,860 | | | $ | 1,878 | | | $ | — | | | $ | 1,231 | | | $ | 1,231 | | | $ | — | | | $ | — | | | $ | — | |
| Credit loss expense for unfunded lending commitments | (18) | | | 13 | | | (5) | | | 18 | | | 629 | | | 647 | | | — | | | 1,231 | | | 1,231 | |
Reserve for unfunded lending commitments, end of period (3) | $ | — | | | $ | 1,873 | | | $ | 1,873 | | | $ | 18 | | | $ | 1,860 | | | $ | 1,878 | | | $ | — | | | $ | 1,231 | | | $ | 1,231 | |
(1) For the Company’s Consolidated Balance Sheets for its transactions with consolidated and unconsolidated VIEs atyear ended December 31, 20202021, includes $6.9 million of credit loss expense for acquired loans.
(2) Unsecured personal loans are charged-off when a borrower is (i) contractually 120 days past due or (ii) two payments past due and 2019. Additionally, the assetshas filed for bankruptcy or is deceased.
(3) Relates to $78.1 million, $138.0 million and liabilities in the tables below exclude intercompany balances that eliminate in consolidation:
| | | | | | | | | | | | | | | | | |
| December 31, 2020 | Consolidated VIEs | | Unconsolidated VIEs | | Total |
| Assets | | | | | |
| Restricted cash | $ | 15,983 | | | $ | 0 | | | $ | 15,983 | |
| Securities available for sale at fair value | 0 | | | 142,026 | | | 142,026 | |
| Loans held for investment at fair value | 52,620 | | | 0 | | | 52,620 | |
| Loans held for investment by the Company at fair value | 50,102 | | | 0 | | | 50,102 | |
| Loans held for sale by the Company at fair value | 98,190 | | | 0 | | | 98,190 | |
| Accrued interest receivable | 1,134 | | | 87 | | | 1,221 | |
| Other assets | 136 | | | 32,778 | | | 32,914 | |
| Total assets | $ | 218,165 | | | $ | 174,891 | | | $ | 393,056 | |
| Liabilities | | | | | |
| Accrued interest payable | $ | 721 | | | $ | 0 | | | $ | 721 | |
| Accrued expenses and other liabilities | 8 | | | 0 | | | 8 | |
| Notes, certificates and secured borrowings at fair value | 52,620 | | | 0 | | | 52,620 | |
| Payable to Structured Program note and certificate holders at fair value | 152,808 | | | 0 | | | 152,808 | |
| | | | | |
| Total liabilities | 206,157 | | | 0 | | | 206,157 | |
| Total net assets | $ | 12,008 | | | $ | 174,891 | | | $ | 186,899 | |
LENDINGCLUB CORPORATION
Notes to Consolidated Financial Statements
(Tabular Amounts in Thousands, Except Share and Per Share Amounts, Ratios, or as Noted)
| | | | | | | | | | | | | | | | | |
| December 31, 2019 | Consolidated VIEs | | Unconsolidated VIEs | | Total |
| Assets | | | | | |
| Restricted cash | $ | 30,046 | | | $ | 0 | | | $ | 30,046 | |
| Securities available for sale at fair value | 0 | | | 220,135 | | | 220,135 | |
| Loans held for investment at fair value | 197,842 | | | 0 | | | 197,842 | |
| Loans held for investment by the Company at fair value | 40,251 | | | 0 | | | 40,251 | |
| Loans held for sale by the Company at fair value | 551,455 | | | 0 | | | 551,455 | |
| Accrued interest receivable | 4,431 | | | 877 | | | 5,308 | |
| Other assets | 1,359 | | | 52,098 | | | 53,457 | |
| Total assets | $ | 825,384 | | | $ | 273,110 | | | $ | 1,098,494 | |
| Liabilities | | | | | |
| Accrued interest payable | $ | 3,185 | | | $ | 0 | | | $ | 3,185 | |
| Accrued expenses and other liabilities | 244 | | | 0 | | | 244 | |
| Notes, certificates and secured borrowings at fair value | 197,842 | | | 0 | | | 197,842 | |
| Payable to Structured Program note and certificate holders at fair value | 40,610 | | | 0 | | | 40,610 | |
| Credit facilities and securities sold under repurchase agreements | 387,251 | | | 0 | | | 387,251 | |
| Total liabilities | 629,132 | | | 0 | | | 629,132 | |
| Total net assets | $ | 196,252 | | | $ | 273,110 | | | $ | 469,362 | |
| | | | | | | | | | | | | | | | | | | | | | | | | | | | | | | | | | | | | | | | | | | | | | |
| | Gross Charge-Offs by Origination Year | | | | |
| 2023 | | 2022 | | 2021 | | 2020 | | 2019 | | Prior | | | | Total |
| Unsecured personal | | $ | 23,340 | | | $ | 157,502 | | | $ | 94,147 | | | $ | — | | | $ | — | | | $ | — | | | | | $ | 274,989 | |
| Residential mortgages | | — | | | — | | | — | | | — | | | — | | | — | | | | | — | |
| Secured consumer | | 202 | | | 2,233 | | | 681 | | | — | | | — | | | — | | | | | 3,116 | |
| | | | | | | | | | | | | | | | |
| | | | | | | | | | | | | | | | |
| | | | | | | | | | | | | | | | |
| | | | | | | | | | | | | | | | |
| | | | | | | | | | | | | | | | |
| | | | | | | | | | | | | | | | |
| Total consumer loans held for investment | | 23,542 | | | 159,735 | | | 94,828 | | | — | | | — | | | — | | | | | 278,105 | |
| Equipment finance | | — | | | — | | | — | | | — | | | — | | | — | | | | | — | |
| Commercial real estate | | — | | | — | | | — | | | — | | | — | | | — | | | | | — | |
| Commercial and industrial | | — | | | — | | | 1,369 | | | 82 | | | 318 | | | 1,233 | | | | | 3,002 | |
| Total commercial loans and leases held for investment | | — | | | — | | | 1,369 | | | 82 | | | 318 | | | 1,233 | | | | | 3,002 | |
| | | | | | | | | | | | | | | | |
| Total loans and leases held for investment | | $ | 23,542 | | | $ | 159,735 | | | $ | 96,197 | | | $ | 82 | | | $ | 318 | | | $ | 1,233 | | | | | $ | 281,107 | |
Consolidated VIEs
The Company consolidates VIEs when it is deemed to be the primary beneficiary. See “Note 2. Summary of Significant Accounting Policies”for additional information.
LC TrustConsumer Lending Credit Quality Indicators
The Company establishedevaluates the LC Trust forcredit quality of its consumer loan portfolio based on the purpose of acquiring and holding loans for the sole benefit of certain investors that have purchased trust certificates issued by the LC Trust. The Company is obligated to ensure that the LC Trust meets minimum capital requirements with respect to funding the administrative activities and maintaining the operationsaging status of the LC Trust.
Consolidated Trusts
The Company establishes trustsloan and by payment activity. Loan delinquency reporting is based upon borrower payment activity relative to facilitate the sale of loans and issuance of senior and subordinated securities. If the Company is the primary beneficiarycontractual terms of the trust, it isloan. The following tables present the classes of financing receivables within the consumer portfolio segment by credit quality indicator based on delinquency status and origination year:
| | | | | | | | | | | | | | | | | | | | | | | | | | | | | | | | | | | | | | | | | | | | | | |
| December 31, 2023 | | Term Loans and Leases by Origination Year | | | | |
| | 2023 | | 2022 | | 2021 | | 2020 | | 2019 | | Prior | | | | Total |
| Unsecured personal | | | | | | | | | | | | | | | | |
| Current | | $ | 1,498,737 | | | $ | 1,688,512 | | | $ | 438,296 | | | $ | — | | | $ | — | | | $ | — | | | | | $ | 3,625,545 | |
| 30-59 days past due | | 9,034 | | | 17,017 | | | 6,665 | | | — | | | — | | | — | | | | | 32,716 | |
| 60-89 days past due | | 7,767 | | | 15,538 | | | 6,251 | | | — | | | — | | | — | | | | | 29,556 | |
| 90 or more days past due | | 6,924 | | | 16,564 | | | 6,644 | | | — | | | — | | | — | | | | | 30,132 | |
Total unsecured personal (1) | | 1,522,462 | | | 1,737,631 | | | 457,856 | | | — | | | — | | | — | | | | | 3,717,949 | |
| Residential mortgages | | | | | | | | | | | | | | | | |
| Current | | 53 | | | 48,473 | | | 54,855 | | | 29,960 | | | 18,917 | | | 29,041 | | | | | 181,299 | |
| 30-59 days past due | | — | | | — | | | — | | | — | | | 1,331 | | | 420 | | | | | 1,751 | |
| 60-89 days past due | | — | | | — | | | — | | | — | | | — | | | — | | | | | — | |
| 90 or more days past due | | — | | | — | | | — | | | — | | | — | | | — | | | | | — | |
| Total residential mortgages | | 53 | | | 48,473 | | | 54,855 | | | 29,960 | | | 20,248 | | | 29,461 | | | | | 183,050 | |
| Secured consumer | | | | | | | | | | | | | | | | |
| Current | | 125,618 | | | 97,084 | | | 21,949 | | | — | | | 2,460 | | | — | | | | | 247,111 | |
| 30-59 days past due | | 364 | | | 1,295 | | | 417 | | | — | | | — | | | — | | | | | 2,076 | |
| 60-89 days past due | | 94 | | | 373 | | | 168 | | | — | | | — | | | — | | | | | 635 | |
| 90 or more days past due | | — | | | 153 | | | 64 | | | — | | | — | | | — | | | | | 217 | |
| Total secured consumer | | 126,076 | | | 98,905 | | | 22,598 | | | — | | | 2,460 | | | — | | | | | 250,039 | |
| | | | | | | | | | | | | | | | |
| | | | | | | | | | | | | | | | |
| | | | | | | | | | | | | | | | |
| | | | | | | | | | | | | | | | |
| | | | | | | | | | | | | | | | |
| | | | | | | | | | | | | | | | |
| Total consumer loans held for investment | | $ | 1,648,591 | | | $ | 1,885,009 | | | $ | 535,309 | | | $ | 29,960 | | | $ | 22,708 | | | $ | 29,461 | | | | | $ | 4,151,038 | |
(1) Excludes cumulative basis adjustment for loans designated in fair value hedges under the portfolio layer method. As of December 31, 2023, the basis adjustment totaled $8.9 million and represents a consolidated VIE and will reflect senior and subordinated securities held by third parties as a “Payablereduction to Structured Program note and certificate holders at fair value” in the Company’s Consolidated Balance Sheets. If subsequently the Company is not the primary beneficiaryamortized cost of the trust, the Company will deconsolidate the VIE.hedged loans. See “Note 2. Summary of Significant Accounting Policies”9. Derivative Instruments and “Note 14. Debt” for additional information.
Warehouse Credit Facilities
The Company established certain entities (deemed to be VIEs) to enter into warehouse credit facilities for the purpose of purchasing loans from LendingClub. See “Note 14. DebtHedging Activities” for additional information.
LENDINGCLUB CORPORATION
Notes to Consolidated Financial Statements
(Tabular Amounts in Thousands, Except Share and Per Share Amounts, Ratios, or as Noted)
The following tables present a summary of financial assets and liabilities from the Company’s involvement with consolidated VIEs at December 31, 2020 and 2019:
| | | | | | | | | | | | | | | | | |
| December 31, 2020 | Assets | | Liabilities | | Net Assets |
| LC Trust | $ | 55,447 | | | $ | (53,068) | | | $ | 2,379 | |
| Consolidated trusts | 162,460 | | | (153,089) | | | 9,371 | |
| Warehouse credit facility | 258 | | | 0 | | | 258 | |
| Total consolidated VIEs | $ | 218,165 | | | $ | (206,157) | | | $ | 12,008 | |
| | | | | | | | | | | | | | | | | | | | | | | | | | | | | | | | | | | | | | | | | | | | | | |
| December 31, 2022 | | Term Loans and Leases by Origination Year | | | | |
| | 2022 | | 2021 | | 2020 | | 2019 | | 2018 | | Prior | | | | Total |
| Unsecured personal | | | | | | | | | | | | | | | | |
| Current | | $ | 2,835,460 | | | $ | 977,224 | | | $ | — | | | $ | — | | | $ | — | | | $ | — | | | | | $ | 3,812,684 | |
| 30-59 days past due | | 11,149 | | | 9,867 | | | — | | | — | | | — | | | — | | | | | 21,016 | |
| 60-89 days past due | | 7,785 | | | 8,633 | | | — | | | — | | | — | | | — | | | | | 16,418 | |
| 90 or more days past due | | 6,813 | | | 9,442 | | | — | | | — | | | — | | | — | | | | | 16,255 | |
| Total unsecured personal | | 2,861,207 | | | 1,005,166 | | | — | | | — | | | — | | | — | | | | | 3,866,373 | |
| Residential mortgages | | | | | | | | | | | | | | | | |
| Current | | 49,721 | | | 58,353 | | | 31,465 | | | 21,683 | | | 4,546 | | | 33,248 | | | | | 199,016 | |
| 30-59 days past due | | — | | | — | | | — | | | — | | | — | | | — | | | | | — | |
| 60-89 days past due | | — | | | — | | | — | | | — | | | — | | | 254 | | | | | 254 | |
| 90 or more days past due | | — | | | — | | | — | | | — | | | — | | | 331 | | | | | 331 | |
| Total residential mortgages | | 49,721 | | | 58,353 | | | 31,465 | | | 21,683 | | | 4,546 | | | 33,833 | | | | | 199,601 | |
| Secured consumer | | | | | | | | | | | | | | | | |
| Current | | 151,725 | | | 38,076 | | | — | | | 2,543 | | | — | | | — | | | | | 192,344 | |
| 30-59 days past due | | 1,017 | | | 703 | | | — | | | — | | | — | | | — | | | | | 1,720 | |
| 60-89 days past due | | 235 | | | 147 | | | — | | | — | | | — | | | — | | | | | 382 | |
| 90 or more days past due | | 116 | | | 72 | | | — | | | — | | | — | | | — | | | | | 188 | |
| Total secured consumer | | 153,093 | | | 38,998 | | | — | | | 2,543 | | | — | | | — | | | | | 194,634 | |
| | | | | | | | | | | | | | | | |
| | | | | | | | | | | | | | | | |
| | | | | | | | | | | | | | | | |
| | | | | | | | | | | | | | | | |
| | | | | | | | | | | | | | | | |
| | | | | | | | | | | | | | | | |
| Total consumer loans held for investment | | $ | 3,064,021 | | | $ | 1,102,517 | | | $ | 31,465 | | | $ | 24,226 | | | $ | 4,546 | | | $ | 33,833 | | | | | $ | 4,260,608 | |
| | | | | | | | | | | | | | | | | |
| December 31, 2019 | Assets | | Liabilities | | Net Assets |
| LC Trust | $ | 201,696 | | | $ | (199,520) | | | $ | 2,176 | |
| Consolidated trusts | 43,300 | | | (40,687) | | | 2,613 | |
| Warehouse credit facilities | 580,388 | | | (388,925) | | | 191,463 | |
| Total consolidated VIEs | $ | 825,384 | | | $ | (629,132) | | | $ | 196,252 | |
The creditors of the VIEs above have no recourse to the general credit of the Company as the primary beneficiary of the VIEs and the liabilities of the VIEs can only be settled by the respective VIE’s assets.
Unconsolidated VIEs
The Company’s transactions with unconsolidated VIEs include asset-backed securitizations, Certificate Program transactions and loan sale transactions of unsecured personal loans. The Company has various forms of involvement with VIEs, including servicing of loans and holding senior or subordinated residual interests in the VIEs. The accounting for these transactions is based on a primary beneficiary analysis to determine whether the underlying VIEs should be consolidated. If the VIEs are not consolidated and the transfer of the loans from the Company to the VIE meets sale accounting criteria, then the Company will recognize a gain or loss on sales of loans. The Company considers continued involvement in an unconsolidated VIE insignificant if it is the sponsor and servicer and does not hold other significant variable interests. In these instances, the Company’s involvement with the VIE is in the role as an agent and without significant participation in the economics of the VIE. The Company enters into separate servicing agreements with the VIEs and holds at least 5% of the beneficial interests issued by the VIEs to comply with regulatory risk retention rules. The beneficial interests retained by the Company consist of senior securities and subordinated securities and are accounted for as securities available for sale. In connection with these transactions, we make certain customary representations, warranties and covenants. See “Note 2. Summary of Significant Accounting Policies”for additional information.
Investment FundCommercial Lending Credit Quality Indicators
The Company hasevaluates the credit quality of its commercial loan portfolio based on regulatory risk ratings. The Company categorizes loans and leases into risk ratings based on relevant information about the quality and realizable value of collateral, if any, and the ability of borrowers to service their debts, such as current financial information, historical payment experience, credit documentation, public information, and current economic trends, among other factors. The Company analyzes loans and leases individually by classifying the loans and leases based on their associated credit risk and performs this analysis whenever credit is extended, renewed or modified, or when an equity investmentobservable event occurs indicating a potential decline in a private fund (Investment Fund)credit quality, and no less than annually for large balance loans. Risk rating classifications consist of the following:
Pass – Loans and leases that participates in a family of funds with other unrelated third parties. This family of funds purchases assets from third parties unrelated to the Company believes will fully repay in accordance with the contractual loan terms.
Special Mention – Loans and historically purchased whole loansleases with a potential weakness that deserve management’s close attention. If left uncorrected, these potential weaknesses may result in deterioration of the repayment prospects for the loan or the Company’s credit position at some future date.
Substandard – Loans and interests in loansleases that are inadequately protected by the current sound worth and paying capacity of the obligator or of the collateral pledged, if any. Loans and leases so classified have a well-defined weakness or weaknesses that jeopardize the repayment and liquidation of the debt. They are characterized by the distinct possibility that the Company will sustain some loss if the deficiencies are not corrected. Normal payment from the Company. Asborrower is in jeopardy, although loss of December 31, 2020,principal, while still possible, is not imminent.
Doubtful – Loans and leases that have all the Company had an ownership interest of approximately 22%weaknesses inherent in those classified as Substandard, with the Investment Fund. The Company’s investment is deemed to be a variable interestadded characteristic that the weaknesses make collection or liquidation in the Investment Fund because the Company shares in the expected returns and losses of the Investment Fund. The Company has requested a full, redemption of its investment in the Investment Fund. The Investment Fund provides audited financial statements annually and periodic investment statements throughout each calendar year on a delayed basis, which are used by the Company to evaluate performance and recoverability of our investment. At December 31, 2020, the Company’s investment was $7.8 million, which is recognized in “Other assets” on the Company’s Consolidated Balance Sheets.basis of currently known facts, conditions, and values, highly questionable and improbable.
Loss – Loans and leases that are considered uncollectible and of little value.
LENDINGCLUB CORPORATION
Notes to Consolidated Financial Statements
(Tabular Amounts in Thousands, Except Share and Per Share Amounts, Ratios, or as Noted)
The following tables summarize unconsolidated VIEs with whichpresent the Company has significant continuing involvement, but is notclasses of financing receivables within the primary beneficiary at December 31, 2020commercial portfolio segment by risk rating and 2019:origination year:
| | | | | | | | | | | | | | | | | | | | | | | | | | | | | | | | | |
| December 31, 2020 | Carrying Value |
| Total VIE Assets | | Securities Available for Sale | | Accrued Interest Receivable | | Other Assets | | | | | | Net Assets |
| Unconsolidated Trusts | $ | 1,267,611 | | | $ | 57,511 | | | $ | 48 | | | $ | 9,606 | | | | | | | $ | 67,165 | |
| Certificate Program | 1,931,429 | | | 84,515 | | | 39 | | | 15,397 | | | | | | | 99,951 | |
| Investment Fund | 34,376 | | | 0 | | | 0 | | | 7,775 | | | | | | | 7,775 | |
| Total unconsolidated VIEs | $ | 3,233,416 | | | $ | 142,026 | | | $ | 87 | | | $ | 32,778 | | | | | | | $ | 174,891 | |
| | | | | | | | | | | | | | | | | | | | | | | | | | | | | | | | | | | | | | | | | | | | | | | | | | | | |
| December 31, 2023 | | Term Loans and Leases by Origination Year | | | | | | |
| | 2023 | | 2022 | | 2021 | | 2020 | | 2019 | | Prior | | | | Total | | Guaranteed Amount (1) |
| Equipment finance | | | | | | | | | | | | | | | | | | |
| Pass | | $ | 2,945 | | | $ | 33,430 | | | $ | 26,311 | | | $ | 7,754 | | | $ | 9,411 | | | $ | 6,288 | | | | | $ | 86,139 | | | $ | — | |
| Special mention | | — | | | 15,235 | | | 1,962 | | | 5,873 | | | 1,335 | | | — | | | | | 24,405 | | | — | |
| Substandard | | — | | | — | | | — | | | 448 | | | — | | | — | | | | | 448 | | | — | |
| Doubtful | | — | | | — | | | — | | | — | | | — | | | — | | | | | — | | | — | |
| Loss | | — | | | — | | | — | | | — | | | — | | | — | | | | | — | | | — | |
| Total equipment finance | | 2,945 | | | 48,665 | | | 28,273 | | | 14,075 | | | 10,746 | | | 6,288 | | | | | 110,992 | | | — | |
| Commercial real estate | | | | | | | | | | | | | | | | | | |
| Pass | | 49,067 | | | 94,247 | | | 34,535 | | | 43,058 | | | 52,160 | | | 78,062 | | | | | 351,129 | | | 33,423 | |
| Special mention | | — | | | — | | | — | | | — | | | — | | | 13,706 | | | | | 13,706 | | | — | |
| Substandard | | — | | | 3,598 | | | 7,716 | | | — | | | — | | | 2,139 | | | | | 13,453 | | | 9,425 | |
| Doubtful | | — | | | — | | | — | | | — | | | — | | | — | | | | | — | | | — | |
| Loss | | — | | | — | | | 1,515 | | | — | | | — | | | 519 | | | | | 2,034 | | | 1,471 | |
| Total commercial real estate | | 49,067 | | | 97,845 | | | 43,766 | | | 43,058 | | | 52,160 | | | 94,426 | | | | | 380,322 | | | 44,319 | |
| Commercial and industrial | | | | | | | | | | | | | | | | | | |
| Pass | | 40,636 | | | 60,352 | | | 39,304 | | | 9,525 | | | 10,282 | | | 11,626 | | | | | 171,725 | | | 104,928 | |
| Special mention | | — | | | 10,881 | | | 1,532 | | | 729 | | | 137 | | | 444 | | | | | 13,723 | | | 9,384 | |
| Substandard | | — | | | 2,304 | | | 5,426 | | | 673 | | | 1,045 | | | 1,434 | | | | | 10,882 | | | 6,908 | |
| Doubtful | | — | | | 649 | | | — | | | 548 | | | — | | | 286 | | | | | 1,483 | | | 1,214 | |
| Loss | | — | | | — | | | — | | | — | | | — | | | 1,256 | | | | | 1,256 | | | 1,229 | |
| Total commercial and industrial | | 40,636 | | | 74,186 | | | 46,262 | | | 11,475 | | | 11,464 | | | 15,046 | | | | | 199,069 | | | 123,663 | |
| Total commercial loans and leases held for investment | | $ | 92,648 | | | $ | 220,696 | | | $ | 118,301 | | | $ | 68,608 | | | $ | 74,370 | | | $ | 115,760 | | | | | $ | 690,383 | | | $ | 167,982 | |
(1) Represents loan balances guaranteed by the Small Business Association (SBA).
| | | | | | | | | | | | | | | | | | | | | | | | | | | |
| December 31, 2020 | Maximum Exposure to Loss |
| Securities Available for Sale | | Accrued Interest Receivable | | Other Assets | | | | | | Total Exposure |
| Unconsolidated Trusts | $ | 57,511 | | | $ | 48 | | | $ | 9,606 | | | | | | | $ | 67,165 | |
| Certificate Program | 84,515 | | | 39 | | | 15,397 | | | | | | | 99,951 | |
| Investment Fund | 0 | | | 0 | | | 7,775 | | | | | | | 7,775 | |
| Total unconsolidated VIEs | $ | 142,026 | | | $ | 87 | | | $ | 32,778 | | | | | | | $ | 174,891 | |
LENDINGCLUB CORPORATION
Notes to Consolidated Financial Statements
(Tabular Amounts in Thousands, Except Share and Per Share Amounts, Ratios, or as Noted)
| | | | | | | | | | | | | | | | | | | | | | | | | | | | | | | | | | | | | | | | | | | | | | | | | | | | |
| December 31, 2022 | | Term Loans and Leases by Origination Year | | | | | | |
| | 2022 | | 2021 | | 2020 | | 2019 | | 2018 | | Prior | | | | Total | | Guaranteed Amount (1) |
| Equipment finance | | | | | | | | | | | | | | | | | | |
| Pass | | $ | 59,227 | | | $ | 38,218 | | | $ | 25,014 | | | $ | 15,785 | | | $ | 11,880 | | | $ | 3,444 | | | | | $ | 153,568 | | | $ | — | |
| Special mention | | — | | | 2,094 | | | — | | | 3,759 | | | — | | | — | | | | | 5,853 | | | — | |
| Substandard | | — | | | — | | | 859 | | | — | | | 39 | | | — | | | | | 898 | | | — | |
| Doubtful | | — | | | — | | | — | | | — | | | — | | | — | | | | | — | | | — | |
| Loss | | — | | | — | | | — | | | — | | | — | | | — | | | | | — | | | — | |
| Total equipment finance | | 59,227 | | | 40,312 | | | 25,873 | | | 19,544 | | | 11,919 | | | 3,444 | | | | | 160,319 | | | — | |
| Commercial real estate | | | | | | | | | | | | | | | | | | |
| Pass | | 100,602 | | | 53,445 | | | 47,497 | | | 52,834 | | | 35,992 | | | 60,976 | | | | | 351,346 | | | 40,693 | |
| Special mention | | — | | | — | | | 8,415 | | | 260 | | | 1,237 | | | 405 | | | | | 10,317 | | | — | |
| Substandard | | — | | | — | | | — | | | 643 | | | 2,404 | | | 8,215 | | | | | 11,262 | | | — | |
| Doubtful | | — | | | — | | | — | | | — | | | — | | | — | | | | | — | | | — | |
| Loss | | — | | | — | | | — | | | — | | | — | | | 576 | | | | | 576 | | | — | |
| Total commercial real estate | | 100,602 | | | 53,445 | | | 55,912 | | | 53,737 | | | 39,633 | | | 70,172 | | | | | 373,501 | | | 40,693 | |
| Commercial and industrial | | |
| Pass | | 61,076 | | | 99,264 | | | 24,726 | | | 13,866 | | | 5,174 | | | 10,831 | | | | | 214,937 | | | 141,858 | |
| Special mention | | — | | | — | | | — | | | 483 | | | 163 | | | 455 | | | | | 1,101 | | | 44 | |
| Substandard | | — | | | 9,361 | | | 4,529 | | | 3,623 | | | 797 | | | 2,820 | | | | | 21,130 | | | 5,716 | |
| Doubtful | | — | | | — | | | — | | | — | | | — | | | 286 | | | | | 286 | | | 216 | |
| Loss | | — | | | — | | | — | | | — | | | 1 | | | 1,271 | | | | | 1,272 | | | 1,229 | |
| Total commercial and industrial | | 61,076 | | | 108,625 | | | 29,255 | | | 17,972 | | | 6,135 | | | 15,663 | | | | | 238,726 | | | 149,063 | |
| Total commercial loans and leases held for investment | | $ | 220,905 | | | $ | 202,382 | | | $ | 111,040 | | | $ | 91,253 | | | $ | 57,687 | | | $ | 89,279 | | | | | $ | 772,546 | | | $ | 189,756 | |
(1) Represents loan balances guaranteed by the SBA.
| | | | | | | | | | | | | | | | | | | | | | | | | | | | | | | | | |
| December 31, 2019 | Carrying Value |
| Total VIE Assets | | Securities Available for Sale | | Accrued Interest Receivable | | Other Assets | | | | | | Net Assets |
| Unconsolidated Trusts | $ | 1,909,219 | | | $ | 93,881 | | | $ | 362 | | | $ | 18,768 | | | | | | | $ | 113,011 | |
| Certificate Program | 2,585,957 | | | 126,254 | | | 515 | | | 25,588 | | | | | | | 152,357 | |
| Investment Fund | 34,170 | | | 0 | | | 0 | | | 7,742 | | | | | | | 7,742 | |
| Total unconsolidated VIEs | $ | 4,529,346 | | | $ | 220,135 | | | $ | 877 | | | $ | 52,098 | | | | | | | $ | 273,110 | |
| | | | | | | | | | | | | | | | | | | | | | | | | | | |
| December 31, 2023 | 30-59
Days | | 60-89
Days | | 90 or More
Days | | Total Days Past Due | | | | |
| Equipment finance | $ | 1,265 | | | $ | — | | | $ | — | | | $ | 1,265 | | | | | |
| Commercial real estate | — | | | 3,566 | | | 1,618 | | | 5,184 | | | | | |
Commercial and industrial (1) | 12,261 | | | 1,632 | | | 1,515 | | | 15,408 | | | | | |
| Total commercial loans and leases held for investment | $ | 13,526 | | | $ | 5,198 | | | $ | 3,133 | | | $ | 21,857 | | | | | |
| | | | | | | | | | | | | | | | | | | | | | | |
| December 31, 2022 | 30-59
Days | | 60-89
Days | | 90 or More
Days | | Total Days Past Due |
| Equipment finance | $ | 3,172 | | | $ | — | | | $ | 859 | | | $ | 4,031 | |
| Commercial real estate | — | | | 102 | | | — | | | 102 | |
Commercial and industrial (1) | — | | | — | | | 1,643 | | | 1,643 | |
| Total commercial loans and leases held for investment | $ | 3,172 | | | $ | 102 | | | $ | 2,502 | | | $ | 5,776 | |
(1) Past due PPP loans are excluded from the tables.
| | | | | | | | | | | | | | | | | | | | | | | | | | | |
| December 31, 2019 | Maximum Exposure to Loss |
| Securities Available for Sale | | Accrued Interest Receivable | | Other Assets | | | | | | Total Exposure |
| Unconsolidated Trusts | $ | 93,881 | | | $ | 362 | | | $ | 18,768 | | | | | | | $ | 113,011 | |
| Certificate Program | 126,254 | | | 515 | | | 25,588 | | | | | | | 152,357 | |
| Investment Fund | 0 | | | 0 | | | 7,742 | | | | | | | 7,742 | |
| Total unconsolidated VIEs | $ | 220,135 | | | $ | 877 | | | $ | 52,098 | | | | | | | $ | 273,110 | |
LENDINGCLUB CORPORATION
Notes to Consolidated Financial Statements
(Tabular Amounts in Thousands, Except Share and Per Share Amounts, Ratios, or as Noted)
Loan Modifications
“Total VIE Assets” representsThe Company has the remaining principal balancefollowing programs to modify loans for borrowers experiencing financial difficulty. The table below presents the amortized cost of loans heldthat were modified during the year ended December 31, 2023, by unconsolidated VIEsmodification type and delinquency status:
| | | | | | | | | | | |
| Combination – Interest Payment Reduction and Term Extension | | Debt Settlement |
| Unsecured personal | | | |
| Current | $ | 7,741 | | | $ | 70 | |
| 30-59 days | 348 | | | 85 | |
| 60-89 days | 172 | | | 669 | |
| 90 or more days | 265 | | | 6,526 | |
| Total loan modifications | $ | 8,526 | | | $ | 7,350 | |
| | | |
| Percentage of total unsecured personal loans at amortized cost as of end of period | 0.2 | % | | 0.2 | % |
The Company’s Combination modifications primarily provide borrowers with respecta short-term reduction in monthly payments, resulting in a term extension of approximately six months or greater compared to Unconsolidated Trusts, Certificate Program transactions,the original maturity date of the loan. In addition, the Company’s Debt Settlement modifications, which include engaging with third-party debt settlement companies, reduce the principal and interest amounts owed by borrowers. The Company typically charges-off such Debt Settlement loans within a few months following the modification, as payments under the modified agreement are less than the original contractual amounts.
In the event of a borrower defaulting at 120 days past due, the modified loan is charged-off at the time of default. The total amount of charge-offs subsequent to modification related to Combination and Debt Settlement modifications was $0.5 million and $53.1 million, respectively, during the year ended December 31, 2023.
Nonaccrual Assets
Nonaccrual loans and leases are those for which accrual of interest has been suspended. Loans and leases are generally placed on nonaccrual status when contractually past due 90 days or more, or earlier if management believes that the probability of collection does not warrant further accrual, and are charged-off no later than 120 days past due.
LENDINGCLUB CORPORATION
Notes to Consolidated Financial Statements
(Tabular Amounts in Thousands, Except Share and Per Share Amounts, Ratios, or as Noted)
The following table presents nonaccrual loans and leases:
| | | | | | | | | | | | | | | | | | | | | | | |
| Year Ended December 31, | 2023 | | 2022 |
| Nonaccrual(1) | | Nonaccrual with no related ACL(2) | | Nonaccrual(1) | | Nonaccrual with no related ACL(2) |
| Unsecured personal | $ | 30,132 | | | $ | — | | | $ | 16,255 | | | $ | — | |
| Residential mortgages | 312 | | | 312 | | | 331 | | | 331 | |
| Secured consumer | 217 | | | — | | | 188 | | | — | |
| | | | | | | |
| Total nonaccrual consumer loans held for investment | 30,661 | | | 312 | | | 16,774 | | | 331 | |
| | | | | | | |
| Equipment finance | — | | | — | | | 898 | | | 39 | |
| Commercial real estate | 9,663 | | | 2,187 | | | 1,018 | | | 1,018 | |
| Commercial and industrial | 4,058 | | | 1,590 | | | 16,137 | | | 1,229 | |
Total nonaccrual commercial loans and leases held for investment (3) | 13,721 | | | 3,777 | | | 18,053 | | | 2,286 | |
| | | | | | | |
| Total nonaccrual loans and leases held for investment | $ | 44,382 | | | $ | 4,089 | | | $ | 34,827 | | | $ | 2,617 | |
(1) Excluding PPP loans, there were no loans and leases that were 90 days or more past due and accruing as of both December 31, 2023 and 2022.
(2) Subset of total nonaccrual loans and leases.
(3) Includes $10.4 million and $4.9 million in loan balances guaranteed by the SBA as of December 31, 2023 and 2022, respectively.
| | | | | | | | | | | | | | | | | | | | |
| Year Ended December 31, | 2023 | | 2022 |
| Nonaccrual | Nonaccrual Ratios(1) | | Nonaccrual | | Nonaccrual Ratios(1) |
| Total nonaccrual consumer loans held for investment | $ | 30,661 | | 0.7 | % | | $ | 16,774 | | | 0.4 | % |
| Total nonaccrual commercial loans and leases held for investment | 13,721 | | 2.0 | % | | 18,053 | | | 2.3 | % |
| Total nonaccrual loans and leases held for investment | $ | 44,382 | | 0.9 | % | | $ | 34,827 | | | 0.7 | % |
(1) Calculated as the ratio of nonaccruing loans and leases to loans and leases HFI at amortized cost.
Collateral-Dependent Assets
Certain loans on non-accrual status may be considered collateral-dependent loans if the borrower is experiencing financial difficulty and repayment of the loan is expected to be substantially through sale or operation of the collateral. Expected credit losses for the Company’s collateral-dependent loans are calculated as the difference between the amortized cost basis and the netfair value of the underlying collateral less costs to sell, if applicable.
LENDINGCLUB CORPORATION
Notes to Consolidated Financial Statements
(Tabular Amounts in Thousands, Except Share and Per Share Amounts, Ratios, or as Noted)
7. Securitizations and Variable Interest Entities
For additional information regarding the consolidation of VIEs, see “Note 1. Summary of Significant Accounting Policies.”
VIE Assets and Liabilities
The following table presents the classifications of assets held byand liabilities on the Investment Fund using the most current information available. “Securities AvailableCompany’s Balance Sheet for Sale,” “Accrued Interest Receivable,”its transactions with consolidated and “Other Assets” are the balancesunconsolidated VIEs. The Company’s transactions with VIEs include Structured Program transactions. The Company also has various forms of involvement with VIEs, including servicing loans and holding senior asset-backed securities or subordinated interests in the Company’s Consolidated Balance Sheets related to its involvement withVIEs. Additionally, the unconsolidated VIEs. “Other Assets” includes the Company’s servicingcarrying amount of assets and servicing receivables andliabilities in the Company’s equity investment with respect to the Investment Fund. “Total Exposure” refers to the Company’s maximumtables below exclude intercompany balances that were eliminated in consolidation.
| | | | | | | | | | | | | | | | | | | | | | | | | | | | | | | | | | | |
| December 31, 2023 | | December 31, 2022 |
| Consolidated | | Unconsolidated | | Total | | Consolidated | | Unconsolidated | | Total |
| Assets | | | | | | | | | | | |
| Restricted cash | $ | 3,454 | | | $ | — | | | $ | 3,454 | | | $ | 8,048 | | | $ | — | | | $ | 8,048 | |
| Securities available for sale at fair value | — | | | 1,249,796 | | | 1,249,796 | | | — | | | 17,717 | | | 17,717 | |
| | | | | | | | | | | |
| Loans held for investment at fair value | 550 | | | — | | | 550 | | | 3,994 | | | — | | | 3,994 | |
| Retail and certificate loans held for investment at fair value | 420 | | | — | | | 420 | | | 1,946 | | | — | | | 1,946 | |
| Other assets | 14 | | | 31,531 | | | 31,545 | | | 206 | | | 10,464 | | | 10,670 | |
| Total assets | $ | 4,438 | | | $ | 1,281,327 | | | $ | 1,285,765 | | | $ | 14,194 | | | $ | 28,181 | | | $ | 42,375 | |
| Liabilities | | | | | | | | | | | |
| Borrowings | $ | 2,468 | | | $ | — | | | $ | 2,468 | | | $ | 8,085 | | | $ | — | | | $ | 8,085 | |
| Retail notes and certificates | 420 | | | — | | | 420 | | | 1,946 | | | — | | | 1,946 | |
| Other liabilities | 4 | | | 3,301 | | | 3,305 | | | 29 | | | — | | | 29 | |
| Total liabilities | 2,892 | | | 3,301 | | | 6,193 | | | 10,060 | | | — | | | 10,060 | |
| Total net assets (maximum loss exposure) | $ | 1,546 | | | $ | 1,278,026 | | | $ | 1,279,572 | | | $ | 4,134 | | | $ | 28,181 | | | $ | 32,315 | |
Maximum loss exposure to loss from its involvement with unconsolidated VIEs. It represents estimated loss that would be incurred under severe, hypothetical circumstances, for which the Company believes the possibility is extremely remote, such as where the value of interests and any associated collateral declines to zero. Accordingly, this required disclosure is not an indication of expected losses.
LENDINGCLUB CORPORATION
Notes to Consolidated Financial Statements
(Tabular Amounts in Thousands, Except Share and Per Share Amounts, Ratios, or as Noted)
Unconsolidated VIEs
The following table summarizes activity related to the Unconsolidated Trusts and Certificate Program trusts, withunconsolidated VIEs where the transfers were accounted for as a sale on the Company’s consolidated financial statements for the years ended December 31, 2020 and 2019:statements:
| | | | | | | | | | | | | | | | | | | | | | | |
| Year Ended December 31, | 2020 | | 2019 |
| Unconsolidated Trusts | | Unconsolidated Certificate
Program
Trusts | | Unconsolidated Trusts | | Unconsolidated Certificate
Program
Trusts |
Principal derecognized from loans securitized or sold (1) | $ | 255,203 | | | $ | 971,738 | | | $ | 1,553,847 | | | $ | 2,868,709 | |
| Net gains (losses) recognized from loans securitized or sold | $ | (20) | | | $ | 7,897 | | | $ | 4,809 | | | $ | 32,417 | |
Fair value of asset-backed senior and subordinated securities, and CLUB Certificate asset-backed securities retained upon settlement (2) | $ | 12,707 | | | $ | 35,836 | | | $ | 75,924 | | | $ | 140,825 | |
| Cash proceeds from loans securitized or sold | $ | 237,764 | | | $ | 598,694 | | | $ | 1,212,521 | | | $ | 2,555,713 | |
| | | | | | | |
| Cash proceeds from servicing and other administrative fees on loans securitized or sold | $ | 17,684 | | | $ | 26,822 | | | $ | 16,961 | | | $ | 17,071 | |
| Cash proceeds for interest received on senior securities and subordinated securities | $ | 4,559 | | | $ | 8,251 | | | $ | 5,022 | | | $ | 7,717 | |
| | | | | | | | | | | | | | | | | |
| December 31, | 2023 | | 2022 | | 2021 |
| Fair value of consideration received: | | | | | |
| Cash | $ | 172,397 | | | $ | 5,320 | | | $ | — | |
| Asset-backed securities retained | 1,299,313 | | | 2,180 | | | — | |
| Other assets (liabilities) | 16,740 | | | (3,794) | | | — | |
| Total consideration | 1,488,450 | | | 3,706 | | | — | |
| Deconsolidation of debt | — | | | 36,072 | | | — | |
| Fair value of loans sold | (1,474,077) | | | (39,519) | | | — | |
Gain on sales of loans (1) | $ | 14,373 | | | $ | 259 | | | $ | — | |
| | | | | |
| Cash proceeds from continuing involvement: | | | | | |
| Servicing and other administrative fees | $ | 5,475 | | | $ | 8,618 | | | $ | 23,586 | |
| | | | | |
| | | | | |
| Interest received on asset-backed securities retained | $ | 22,786 | | | $ | 7,285 | | | $ | 9,136 | |
| | | | | |
| | | | | |
| | | | | |
| | | | | |
| | | | | |
| | | | | |
| | | | | |
| | | | | |
(1) Included non-cash purchaseConsists primarily of servicing assets recognized at the time of sale, less any transaction costs, and sale of loans requested by investorsexcludes origination fees and fair value adjustments recognized prior to facilitate a Structured Program transaction during the third quarter of 2020.
(2) For Structured Program transactions,sale. Prior period amounts have been reclassified to conform to the Company retained asset-backed senior securities of $26.3 million and $98.7 million, CLUB Certificate asset-backed securities of $18.3 million and $101.3 million, and asset-backed subordinated securities of $4.0 million and $16.8 million for the years ended December 31, 2020 and 2019, respectively.current period presentation.
Off-Balance Sheet LoansBeginning in the second quarter of 2023, the Company resumed its Structured Program transactions with its newly launched Structured Certificates, where it retains the senior securities at a fixed rate, in addition to the amount required pursuant to the U.S. Risk Retention Rules, and sells the residual certificates. See “Note 5. Securities Available for Sale” for the securities retained in the Company’s investment portfolio related to such transactions.
Off-balanceThere is no direct recourse to the Company’s assets, and holders of the securities can look only to those assets of the VIEs that issued their securities for payment. The residual certificates are subject principally to the credit and prepayment risk stemming from the underlying unsecured personal loans.
As of December 31, 2023, the aggregate unpaid principal balance held by unconsolidated VIEs was $1.6 billion, of which $9.5 million was attributable to off-balance sheet loans primarily relate to Structured Program transactions for which the Company has some form of continuing involvement, including as servicer. Delinquent loans are comprised of loans 31that were 30 days or more past due, including non-accrual loans. Loansdue. As of December 31, 2022, the aggregate unpaid principal balance held by unconsolidated VIEs was $433.5 million, of which $14.9 million was attributable to eligible borrowers participating in Skip-a-Pay are not considered delinquent during the commensurate period the loan is extended.off-balance sheet loans that were 30 days or more past due. For such loans, related to Structured Program transactions where servicing is the only form of continuing involvement, the Company would only experience a loss if it was required to repurchase a loan due to a breach in representations and warranties associated with its loan sale or servicing contracts.
As of December 31, 2020, the aggregate unpaid principal balance
LENDINGCLUB CORPORATION
Notes to Consolidated Financial Statements
(Tabular Amounts in Thousands, Except Share and Per Share Amounts, Ratios, or as Noted)
8. Fair Value Measurements
For a description of the off-balance sheet loans pursuant to Structured Program transactions was $3.2 billion,fair value hierarchy and the Company’s fair value methodologies, see “Note 1. Summary of which $94.8 million was attributable to off-balance sheet loans that were 31 days or more past due. As of December 31, 2019,Significant Accounting Policies.” The Company records certain assets and liabilities at fair value as listed in the aggregate unpaid principal balance offollowing tables.
Recurring Fair Value Measurements
The following tables present, by level within the off-balance sheet loans pursuant to Structured Program transactions was $4.4 billion, of which $145.6 million was attributable to off-balance sheet loans that were 31 days or more past due.fair value hierarchy, the Company’s assets and liabilities measured at fair value on a recurring basis:
| | | | | | | | | | | | | | | | | | | | | | | |
| December 31, 2023 | Level 1 | | Level 2 | | Level 3 | | Balance at
Fair Value |
| Assets: | | | | | | | |
| Loans held for sale at fair value | $ | — | | | $ | — | | | $ | 407,773 | | | $ | 407,773 | |
| Loans held for investment at fair value | — | | | — | | | 262,190 | | | 262,190 | |
| Retail and certificate loans held for investment at fair value | — | | | — | | | 10,488 | | | 10,488 | |
| Securities available for sale: | | | | | | | |
| Senior asset-backed securities related to Structured Program transactions | — | | | — | | | 1,176,403 | | | 1,176,403 | |
| U.S. agency residential mortgage-backed securities | — | | | 224,596 | | | — | | | 224,596 | |
| U.S. agency securities | — | | | 80,104 | | | — | | | 80,104 | |
| Other asset-backed securities related to Structured Program transactions | — | | | — | | | 73,393 | | | 73,393 | |
| Mortgage-backed securities | — | | | 37,076 | | | — | | | 37,076 | |
| Other asset-backed securities | — | | | 26,101 | | | — | | | 26,101 | |
| Municipal securities | — | | | 2,589 | | | — | | | 2,589 | |
| | | | | | | |
| Total securities available for sale | — | | | 370,466 | | | 1,249,796 | | | 1,620,262 | |
| Servicing assets | — | | | — | | | 77,680 | | | 77,680 | |
| Other assets | — | | | 3,525 | | | — | | | 3,525 | |
| Total assets | $ | — | | | $ | 373,991 | | | $ | 2,007,927 | | | $ | 2,381,918 | |
| | | | | | | |
| Liabilities: | | | | | | | |
| Borrowings | $ | — | | | $ | — | | | $ | 2,468 | | | $ | 2,468 | |
| Retail notes and certificates | — | | | — | | | 10,488 | | | 10,488 | |
| Other liabilities | — | | | 12,072 | | | 7,655 | | | 19,727 | |
| Total liabilities | $ | — | | | $ | 12,072 | | | $ | 20,611 | | | $ | 32,683 | |
LENDINGCLUB CORPORATION
Notes to Consolidated Financial Statements
(Tabular Amounts in Thousands, Except Share and Per Share Amounts, Ratios, or as Noted)
Retained Interests from Unconsolidated VIEs
The Company and other investors in the subordinated interests issued by trusts and Certificate Program trusts have rights to cash flows only after the investors holding the senior securities issued by the trusts have first received their contractual cash flows. The investors and the trusts have no direct recourse to the Company’s assets, and holders of the securities issued by the trusts can look only to the assets of the securitization trusts that issued their securities for payment. The beneficial interests held by the Company are subject principally to the credit and prepayment risk stemming from the underlying unsecured personal whole loans.
See “Note 8. Fair Value of Assets and Liabilities” for additional information on the fair value sensitivity of asset-backed securities related to Structured Program transactions.
8. Fair Value of Assets and Liabilities
For a description of the fair value hierarchy and the Company’s fair value methodologies, see “Note 2. Summary of Significant Accounting Policies.” The Company records certain assets and liabilities at fair value as listed in the following tables.
Financial Instruments, Assets and Liabilities Recorded at Fair Value
The following tables present the fair value hierarchy for assets and liabilities measured at fair value at December 31, 2020 and 2019:
| | | | | | | | | | | | | | | | | | | | | | | |
| December 31, 2020 | Level 1 Inputs | | Level 2 Inputs | | Level 3 Inputs | | Balance at Fair Value |
| Assets: | | | | | | | |
| Loans held for investment | $ | 0 | | | $ | 0 | | | $ | 636,686 | | | $ | 636,686 | |
| Loans held for investment by the Company | 0 | | | 0 | | | 49,954 | | | 49,954 | |
| Loans held for sale by the Company | 0 | | | 0 | | | 121,902 | | | 121,902 | |
| Securities available for sale: | | | | | | | |
| Asset-backed senior securities and subordinated securities | 0 | | | 75,372 | | | 16,515 | | | 91,887 | |
| CLUB Certificate asset-backed securities | 0 | | | 0 | | | 50,139 | | | 50,139 | |
| | | | | | | |
| | | | | | | |
| | | | | | | |
| | | | | | | |
| | | | | | | |
| Other securities | 0 | | | 200 | | | 0 | | | 200 | |
| Total securities available for sale | 0 | | | 75,572 | | | 66,654 | | | 142,226 | |
| Servicing assets | 0 | | | 0 | | | 56,347 | | | 56,347 | |
| Total assets | $ | 0 | | | $ | 75,572 | | | $ | 931,543 | | | $ | 1,007,115 | |
| | | | | | | |
| Liabilities: | | | | | | | |
| Notes, certificates and secured borrowings | $ | 0 | | | $ | 0 | | | $ | 636,774 | | | $ | 636,774 | |
| Payable to Structured Program note and certificate holders | 0 | | | 0 | | | 152,808 | | | 152,808 | |
| Deferred revenue | 0 | | | 0 | | | 4,776 | | | 4,776 | |
| Loan trailing fee liability | 0 | | | 0 | | | 7,494 | | | 7,494 | |
| Total liabilities | $ | 0 | | | $ | 0 | | | $ | 801,852 | | | $ | 801,852 | |
| | | | | | | |
| | | | | | | |
| | | | | | | |
| | | | | | | |
| | | | | | | |
| | | | | | | |
| | | | | | | |
| | | | | | | |
| | | | | | | |
| | | | | | | |
LENDINGCLUB CORPORATION
Notes to Consolidated Financial Statements
(Tabular Amounts in Thousands, Except Share and Per Share Amounts, Ratios, or as Noted)
| | | | | | | | | | | | | | | | | | | | | | | |
| December 31, 2019 | Level 1 Inputs | | Level 2 Inputs | | Level 3 Inputs | | Balance at
Fair Value |
| Assets: | | | | | | | |
| Loans held for investment | $ | 0 | | | $ | 0 | | | $ | 1,079,315 | | | $ | 1,079,315 | |
| Loans held for investment by the Company | 0 | | | 0 | | | 43,693 | | | 43,693 | |
| Loans held for sale by the Company | 0 | | | 0 | | | 722,355 | | | 722,355 | |
| Securities available for sale: | | | | | | | |
| Asset-backed senior securities and subordinated securities | 0 | | | 109,339 | | | 21,090 | | | 130,429 | |
| CLUB Certificate asset-backed securities | 0 | | | 0 | | | 89,706 | | | 89,706 | |
| Corporate debt securities | 0 | | | 14,343 | | | 0 | | | 14,343 | |
| Certificates of deposit | 0 | | | 13,100 | | | 0 | | | 13,100 | |
| Other asset-backed securities | 0 | | | 12,080 | | | 0 | | | 12,080 | |
| Commercial paper | 0 | | | 9,274 | | | 0 | | | 9,274 | |
| U.S. agency securities | 0 | | | 1,995 | | | 0 | | | 1,995 | |
| | | | | | | |
| | | | | | | |
| Total securities available for sale | 0 | | | 160,131 | | | 110,796 | | | 270,927 | |
| Servicing assets | 0 | | | 0 | | | 89,680 | | | 89,680 | |
| Total assets | $ | 0 | | | $ | 160,131 | | | $ | 2,045,839 | | | $ | 2,205,970 | |
| | | | | | | |
| Liabilities: | | | | | | | |
| Note, certificates and secured borrowings | $ | 0 | | | $ | 0 | | | $ | 1,081,466 | | | $ | 1,081,466 | |
| Payable to Structured Program note and certificate holders | 0 | | | 0 | | | 40,610 | | | 40,610 | |
| Loan trailing fee liability | 0 | | | 0 | | | 11,099 | | | 11,099 | |
| | | | | | | |
| Total liabilities | $ | 0 | | | $ | 0 | | | $ | 1,133,175 | | | $ | 1,133,175 | |
As presented in the tables above, the Company has elected the fair value option for certain liabilities. Changes in the fair value of these financial liabilities caused by a change in the Company’s risk are reported in other comprehensive income (OCI). For the year ended December 31, 2020, the amount reported in OCI is zero because these financial liabilities are either payable only upon receipt of cash flows from underlying loans or secured by cash collateral. | | | | | | | | | | | | | | | | | | | | | | | |
| December 31, 2022 | Level 1 | | Level 2 | | Level 3 | | Balance at Fair Value |
| Assets: | | | | | | | |
| Loans held for sale at fair value | $ | — | | | $ | — | | | $ | 110,400 | | | $ | 110,400 | |
| Loans held for investment at fair value | — | | | — | | | 925,938 | | | 925,938 | |
| Retail and certificate loans held for investment at fair value | — | | | — | | | 55,425 | | | 55,425 | |
| Securities available for sale: | | | | | | | |
| U.S. agency residential mortgage-backed securities | — | | | 214,427 | | | — | | | 214,427 | |
| U.S. agency securities | — | | | 74,394 | | | — | | | 74,394 | |
| Mortgage-backed securities | — | | | 22,518 | | | — | | | 22,518 | |
| Other asset-backed securities | — | | | 14,203 | | | — | | | 14,203 | |
| Asset-backed securities related to Structured Program transactions | — | | | 5,248 | | | 12,469 | | | 17,717 | |
| Municipal securities | — | | | 2,443 | | | — | | | 2,443 | |
| Total securities available for sale | — | | | 333,233 | | | 12,469 | | | 345,702 | |
| Servicing assets | — | | | — | | | 84,308 | | | 84,308 | |
| Other assets | — | | | — | | | 5,099 | | | 5,099 | |
| Total assets | $ | — | | | $ | 333,233 | | | $ | 1,193,639 | | | $ | 1,526,872 | |
| | | | | | | |
| Liabilities: | | | | | | | |
| Borrowings | $ | — | | | $ | — | | | $ | 8,085 | | | $ | 8,085 | |
| Retail notes and certificates | — | | | — | | | 55,425 | | | 55,425 | |
| Other liabilities | — | | | — | | | 8,583 | | | 8,583 | |
| Total liabilities | $ | — | | | $ | — | | | $ | 72,093 | | | $ | 72,093 | |
Financial instruments are categorized in the valuation hierarchy based on the significance of observable or unobservable factors in the overall fair value measurement. SinceFor the Company’s loans held for investment and related notes, certificates, and secured borrowings, loans held for sale, loan servicing rights, asset-backed securities related to Structured Program transactions, and loan trailing fee liabilityfinancial instruments listed in the tables above that do not trade in an active market with readily observable prices, the Company uses significant unobservable inputs to measure the fair value of these assets and liabilities. These fair value estimates may also include observable, actively quoted components derived from external sources. As a result, changes in fair value for assets and liabilities within the Level 2 or Level 3 categories may include changes in fair value that were attributable to observable and unobservable inputs, respectively. The Company primarily uses a discounted cash flowDCF model to estimate the fair value of Level 3 instruments based on the present value of estimated future cash flows. This model uses inputs that are inherently judgmental and reflect ourthe Company’s best estimates of the assumptions a market participant would use to calculate fair value. Due to changes in the availability of market observable inputs, the Company transferred $517 thousand of asset-backed securities related to Structured Program transactions out of Level 3 during the year ended December 31, 2020. The Company did not transfer any other assets or liabilities in or out of Level 3 during the years ended December 31, 2020 or 2019.2023 and 2022.
LENDINGCLUB CORPORATION
Notes to Consolidated Financial Statements
(Tabular Amounts in Thousands, Except Share and Per Share Amounts, Ratios, or as Noted)
Fair valuation adjustments are recorded through earnings related to Level 3 instruments for the years endedAs of December 31, 2020 and 2019. Certain unobservable inputs may (in isolation) have either a directionally consistent or opposite impact on2023, the fair value of the financial instrument for a given change in that input. When multiple inputs are used within the valuation techniques, a change in one input in a certain direction may be offset by an opposite change from another input.
Loans Held for Investment, Notes, Certificates and Secured Borrowings
Significant Unobservable Inputs
The following table presents quantitative information aboutCompany updated the significant unobservable inputs used for the Company’s Level 3 fair value measurements for loans held for investment, notes, certificates and secured borrowings at December 31, 2020 and 2019:
| | | | | | | | | | | | | | | | | | | | | | | | | | | | | | | | | | | | | | | | | | | | | | | | | | | | | |
| | | Loans Held for Investment, Notes, Certificates and Secured Borrowings |
| | | | | | | December 31, 2020 | | December 31, 2019 |
| | | | | | | Minimum | | Maximum | | Weighted-
Average | | Minimum | | Maximum | | Weighted-
Average |
| Discount rates | | 7.6 | % | | 15.0 | % | | 9.4 | % | | 6.0 | % | | 12.0 | % | | 7.9 | % |
Net cumulative expected loss rates (1) | | 4.3 | % | | 28.1 | % | | 11.2 | % | | 3.6 | % | | 34.9 | % | | 11.9 | % |
Cumulative expected prepayment rates (1) | | 27.3 | % | | 35.7 | % | | 30.4 | % | | 28.7 | % | | 38.6 | % | | 31.7 | % |
| | | | | | | | | | | | | | | | | |
| | | | | | | |
| | | | | |
| | | | | | | | | | | | | | | | | |
| | | | | | | | | | | | | | | | | |
| | | | | | | | | | | | |
| | | | | | | | | | | | |
| | | | | | | | | | | | |
| | | | | | | | | | | | | | | | | |
(1) Expressed as a percentage of the original principal balance of the loan, note, certificate or secured borrowing.
Significant Recurring Level 3 Fair Value Input Sensitivity
At December 31, 2020 and 2019, the discounted cash flow methodology used to estimate the note, certificate and secured borrowings’ fair values used the same projected net cash flows as their related loans. As demonstrated by the following tables,in the fair value adjustments for loans held for investmentmeasurement of its Level 3 assets from a cumulative credit loss rate and loans held for sale were largely offsetcumulative prepayment rate to an annualized net charge-off rate and annualized prepayment rate, respectively. The Company believes the updated inputs are more comparable to those used by other companies in the corresponding fair value adjustments duefinancial services industry. As such, the prior period comparative disclosures below have been conformed to the payment dependent design of the notes, certificates and secured borrowings.
LENDINGCLUB CORPORATION
Notes to Consolidated Financial Statements
(Tabular Amounts in Thousands, Except Share and Per Share Amounts, Ratios, or as Noted)
Fair Value Reconciliation
The following table presents additional information about Level 3 loans held for investment, loans held for sale, and notes, certificates and secured borrowings measured at fair value on a recurring basis for the years ended December 31, 2020 and 2019:
| | | | | | | | | | | | | | | | | | | | | | | | | | | | | | | | | | | | | | | | | | | | | | | | | | | | | |
| Loans Held for Investment | | Loans Held for Sale | | Notes, Certificates
and Secured Borrowings |
| Outstanding Principal Balance | | Valuation Adjustment | | Fair Value | | Outstanding Principal Balance | | Valuation Adjustment | | Fair Value | | Outstanding Principal Balance | | Valuation Adjustment | | Fair Value |
| Balance at December 31, 2018 | $ | 2,013,438 | | | $ | (130,187) | | | $ | 1,883,251 | | | $ | 0 | | | $ | 0 | | | $ | 0 | | | $ | 2,033,258 | | | $ | (127,383) | | | $ | 1,905,875 | |
| Purchases | 632,962 | | | (21) | | | 632,941 | | | 2,490,734 | | | (26,560) | | | 2,464,174 | | | 0 | | | 0 | | | 0 | |
| Transfers (to) from loans held for investment and/or loans held for sale | (123,036) | | | 0 | | | (123,036) | | | 122,330 | | | 0 | | | 122,330 | | | 0 | | | 0 | | | 0 | |
| Issuances | 0 | | | 0 | | | 0 | | | 0 | | | 0 | | | 0 | | | 632,962 | | | 0 | | | 632,962 | |
| Sales | 0 | | | 0 | | | 0 | | | (2,613,064) | | | 24,789 | | | (2,588,275) | | | 0 | | | 0 | | | 0 | |
| Principal payments and retirements | (1,183,670) | | | 0 | | | (1,183,670) | | | 0 | | | 0 | | | 0 | | | (1,326,526) | | | 14 | | | (1,326,512) | |
| Charge-offs, net of recoveries | (190,806) | | | 138,857 | | | (51,949) | | | 0 | | | 0 | | | 0 | | | (190,806) | | | 135,785 | | | (55,021) | |
| | | | | | | | | | | | | | | | | |
| Change in fair value recorded in earnings | 0 | | | (78,222) | | | (78,222) | | | 0 | | | 1,771 | | | 1,771 | | | 0 | | | (75,838) | | | (75,838) | |
| Balance at December 31, 2019 | $ | 1,148,888 | | | $ | (69,573) | | | $ | 1,079,315 | | | $ | 0 | | | $ | 0 | | | $ | 0 | | | $ | 1,148,888 | | | $ | (67,422) | | | $ | 1,081,466 | |
| Purchases | 314,995 | | | 0 | | | 314,995 | | | 1,564,081 | | | (40,167) | | | 1,523,914 | | | 0 | | | 0 | | | 0 | |
| Transfers (to) from loans held for investment and/or loans held for sale | (17,916) | | | 0 | | | (17,916) | | | 17,413 | | | 0 | | | 17,413 | | | 0 | | | 0 | | | 0 | |
| Issuances | 0 | | | 0 | | | 0 | | | 0 | | | 0 | | | 0 | | | 314,995 | | | 0 | | | 314,995 | |
| Sales | 0 | | | 0 | | | 0 | | | (1,581,494) | | | 52,010 | | | (1,529,484) | | | 0 | | | 0 | | | 0 | |
| Principal payments and retirements | (687,723) | | | 0 | | | (687,723) | | | 0 | | | 0 | | | 0 | | | (705,639) | | | 0 | | | (705,639) | |
| Charge-offs, net of recoveries | (78,341) | | | 39,641 | | | (38,700) | | | 0 | | | 0 | | | 0 | | | (78,341) | | | 37,161 | | | (41,180) | |
| | | | | | | | | | | | | | | | | |
| Change in fair value recorded in earnings | 0 | | | (13,285) | | | (13,285) | | | 0 | | | (11,843) | | | (11,843) | | | 0 | | | (12,868) | | | (12,868) | |
| Balance at December 31, 2020 | $ | 679,903 | | | $ | (43,217) | | | $ | 636,686 | | | $ | 0 | | | $ | 0 | | | $ | 0 | | | $ | 679,903 | | | $ | (43,129) | | | $ | 636,774 | |
LENDINGCLUB CORPORATION
Notes to Consolidated Financial Statements
(Tabular Amounts in Thousands, Except Share and Per Share Amounts, Ratios, or as Noted)
Loans Invested in by the Company
Significant Unobservable Inputs
The following table presents quantitative information about the significant unobservable inputs used for the Company’s Level 3 fair value measurements for loans invested in by the Company at December 31, 2020 and 2019:
| | | | | | | | | | | | | | | | | | | | | | | | | | | | | | | | | | | | | | | | | | | | | | | | | | | | | |
| | | | Loans Invested in by the Company |
| | | | | | | December 31, 2020 | | December 31, 2019 |
| | | | | | | Minimum | | Maximum | | Weighted-
Average | | Minimum | | Maximum | | Weighted-
Average |
| Discount rates | | 8.7 | % | | 16.2 | % | | 9.6 | % | | 6.0 | % | | 11.5 | % | | 7.8 | % |
Net cumulative expected loss rates (1) | | 5.0 | % | | 28.0 | % | | 8.9 | % | | 3.6 | % | | 36.6 | % | | 10.9 | % |
Cumulative expected prepayment rates (1) | | 26.8 | % | | 41.0 | % | | 30.5 | % | | 27.3 | % | | 41.0 | % | | 31.6 | % |
(1) Expressed as a percentage of the original principal balance of the loan.
Significant Recurring Level 3 Fair Value Input Sensitivity
The fair value sensitivity of loans invested in by the Company to adverse changes in key assumptions as of December 31, 2020 and 2019, are as follows:
| | | | | | | | |
| December 31, 2020 | December 31, 2019 |
| Fair value of loans invested in by the Company | $ | 171,856 | | $ | 766,048 | |
| Expected weighted-average life (in years) | 1.2 | 1.5 |
| Discount rates | | |
| 100 basis point increase | $ | (1,692) | | $ | (9,806) | |
| 200 basis point increase | $ | (3,355) | | $ | (19,410) | |
| Expected credit loss rates on underlying loans | | |
| 10% adverse change | $ | (1,739) | | $ | (9,558) | |
| 20% adverse change | $ | (3,514) | | $ | (19,136) | |
| Expected prepayment rates | | |
| 10% adverse change | $ | (454) | | $ | (2,429) | |
| 20% adverse change | $ | (924) | | $ | (4,740) | |
LENDINGCLUB CORPORATION
Notes to Consolidated Financial Statements
(Tabular Amounts in Thousands, Except Share and Per Share Amounts, Ratios, or as Noted)
Fair Value Reconciliation
The following table presents additional information about Level 3 loans invested in by the Company measured at fair value on a recurring basis for the years ended December 31, 2020 and 2019:
| | | | | | | | | | | | | | | | | | | | | | | | | | | | | | | | | | | | | | | | | | | | | | | | | | | | | |
| Loans Held For Investment
by the Company | | Loans Held For Sale
by the Company | | Total Loans Invested
in by the Company |
| Outstanding Principal Balance | | Valuation Adjustment | | Fair Value | | Outstanding Principal Balance | | Valuation Adjustment | | Fair Value | | Outstanding Principal Balance | | Valuation Adjustment | | Fair Value |
Balance at
December 31, 2018 | $ | 3,518 | | | $ | (935) | | | $ | 2,583 | | | $ | 869,715 | | | $ | (29,694) | | | $ | 840,021 | | | $ | 873,233 | | | $ | (30,629) | | | $ | 842,604 | |
| Purchases | 2,993 | | | (2,303) | | | 690 | | | 5,343,146 | | | 1 | | | 5,343,147 | | | 5,346,139 | | | (2,302) | | | 5,343,837 | |
| Transfers (to) from loans held for investment and/or loans held for sale | 49,996 | | | (1,471) | | | 48,525 | | | (49,290) | | | 1,471 | | | (47,819) | | | 706 | | | 0 | | | 706 | |
| Sales | 0 | | | 0 | | | 0 | | | (5,122,450) | | | 119,369 | | | (5,003,081) | | | (5,122,450) | | | 119,369 | | | (5,003,081) | |
| Principal payments and retirements | (5,214) | | | 0 | | | (5,214) | | | (268,366) | | | 0 | | | (268,366) | | | (273,580) | | | 0 | | | (273,580) | |
| Charge-offs, net of recoveries | (4,251) | | | 2,169 | | | (2,082) | | | (25,361) | | | 23,973 | | | (1,388) | | | (29,612) | | | 26,142 | | | (3,470) | |
| | | | | | | | | | | | | | | | | |
| Change in fair value recorded in earnings | 0 | | | (809) | | | (809) | | | 0 | | | (140,159) | | | (140,159) | | | 0 | | | (140,968) | | | (140,968) | |
Balance at
December 31, 2019 | $ | 47,042 | | | $ | (3,349) | | | $ | 43,693 | | | $ | 747,394 | | | $ | (25,039) | | | $ | 722,355 | | | $ | 794,436 | | | $ | (28,388) | | | $ | 766,048 | |
| Purchases | 1,435 | | | (1,296) | | | 139 | | | 1,568,844 | | | (6) | | | 1,568,838 | | | 1,570,279 | | | (1,302) | | | 1,568,977 | |
| Transfers (to) from loans held for investment and/or loans held for sale | 41,934 | | | 0 | | | 41,934 | | | (41,431) | | | 0 | | | (41,431) | | | 503 | | | 0 | | | 503 | |
| Sales | 0 | | | 0 | | | 0 | | | (1,907,446) | | | 87,723 | | | (1,819,723) | | | (1,907,446) | | | 87,723 | | | (1,819,723) | |
| Principal payments and retirements | (29,640) | | | 0 | | | (29,640) | | | (207,483) | | | 0 | | | (207,483) | | | (237,123) | | | 0 | | | (237,123) | |
| Charge-offs, net of recoveries | (4,383) | | | 906 | | | (3,477) | | | (27,278) | | | 25,627 | | | (1,651) | | | (31,661) | | | 26,533 | | | (5,128) | |
| | | | | | | | | | | | | | | | | |
| Change in fair value recorded in earnings | 0 | | | (2,695) | | | (2,695) | | | 0 | | | (99,003) | | | (99,003) | | | 0 | | | (101,698) | | | (101,698) | |
Balance at
December 31, 2020 | $ | 56,388 | | | $ | (6,434) | | | $ | 49,954 | | | $ | 132,600 | | | $ | (10,698) | | | $ | 121,902 | | | $ | 188,988 | | | $ | (17,132) | | | $ | 171,856 | |
LENDINGCLUB CORPORATION
Notes to Consolidated Financial Statements
(Tabular Amounts in Thousands, Except Share and Per Share Amounts, Ratios, or as Noted)
Asset-Backed Securities RelatedThe following significant unobservable inputs were used in the fair value measurement of the Company’s Level 3 assets:
•Discount rate – The weighted-average rate at which the expected cash flows are discounted to Structured Program Transactionsarrive at the net present value of the loan. The discount rate is primarily determined based on marketplace investor return expectations.
•Annualized net charge-off rate – The annualized rate of average charge-offs, net of recoveries, expressed as a percentage of the average principal balance of loan pools with similar risk characteristics. The calculation of this annualized rate also incorporates a qualitative estimate of credit losses based on the Company’s current macroeconomic outlook.
•Annualized prepayment rate – The annualized rate of prepayments expressed as a percentage of the average principal balance of loan pools with similar risk characteristics.
An increase in each of the inputs above, in isolation, would result in a decrease in the fair value measurement.
The sensitivity calculations are hypothetical and should not be considered to be predictive of future performance. The effect on fair value of a variation in assumptions generally cannot be determined because the relationship of the change in assumptions to the fair value may not be linear. Changes in one factor may lead to changes in other factors, which could impact the hypothetical results.
Loans Held for Sale at Fair Value
In the third quarter of 2023, the Company established an extended seasoning program for which it began accumulating loans into the HFS portfolio to meet investor demand for seasoned loans. As a result, the balance of the HFS portfolio increased significantly compared to the same period in the prior year.
Significant Unobservable Inputs
The following table presents quantitative information about the significant unobservable inputs were used forin the Company’s Level 3 fair value measurements for asset-backed securities related to Structured Program transactions at December 31, 2020 and 2019:measurement of loans HFS:
| | | | | | | | | | | | | | | | | | | | | | | | | | | | | | | | | | | | | | | | | | | | | | | | | | | | | |
| | | | Asset-Backed Securities Related to Structured Program Transactions |
| | | | | | | December 31, 2020 | | December 31, 2019 |
| | | | | | | Minimum | | Maximum | | Weighted-
Average | | Minimum | | Maximum | | Weighted-
Average |
| Discount rates | | 2.2 | % | | 25.1 | % | | 8.4 | % | | 3.4 | % | | 20.7 | % | | 8.8 | % |
Net cumulative expected loss rates (1) | | 5.4 | % | | 28.9 | % | | 18.8 | % | | 4.5 | % | | 37.9 | % | | 19.2 | % |
Cumulative expected prepayment rates (1) | | 6.3 | % | | 30.5 | % | | 24.8 | % | | 17.3 | % | | 35.1 | % | | 29.4 | % |
| | | | | | | | | | | | | | | | | | | | | | | | | | | | | | | | | | | | | | | | | |
| | | |
| | | December 31, 2023 | | December 31, 2022 |
| | | Minimum | | Maximum | | Weighted-
Average | | Minimum | | Maximum | | Weighted-Average |
| Discount rate | | 8.1 | % | | 10.3 | % | | 9.0 | % | | 5.0 | % | | 12.6 | % | | 9.1 | % |
Annualized net charge-off rate (1) | | 2.7 | % | | 12.9 | % | | 6.5 | % | | 1.9 | % | | 23.2 | % | | 11.6 | % |
Annualized prepayment rate (1) | | 15.7 | % | | 22.5 | % | | 19.9 | % | | 18.5 | % | | 27.7 | % | | 22.9 | % |
(1) Expressed as a percentageThe weighted-average rate is calculated using the original principal balance of the outstanding collateral balance.each loan pool.
Significant Recurring Fair Value Input Sensitivity
The following tables present adverse changes to the fair value sensitivity of Level 2 and Level 3 asset-backed securities related to Structured Program transactions to changes in key assumptions at December 31, 2020 and 2019:
| | | | | | | | | | | | | | | | | |
| December 31, 2020 |
| Asset-Backed Securities Related to
Structured Program Transactions |
| Senior
Securities | | Subordinated Securities | | CLUB Certificates |
| Fair value of interests held | $ | 75,372 | | | $ | 16,515 | | | $ | 50,139 | |
| Expected weighted-average life (in years) | 0.9 | | 1.4 | | 0.9 |
| Discount rates | | | | | |
| 100 basis point increase | $ | (579) | | | $ | (161) | | | $ | (405) | |
| 200 basis point increase | $ | (1,145) | | | $ | (343) | | | $ | (800) | |
| Expected credit loss rates on underlying loans | | | | | |
| 10% adverse change | $ | 0 | | | $ | (1,831) | | | $ | (1,528) | |
| 20% adverse change | $ | 0 | | | $ | (3,718) | | | $ | (3,095) | |
| Expected prepayment rates | | | | | |
| 10% adverse change | $ | 0 | | | $ | (791) | | | $ | (659) | |
| 20% adverse change | $ | 0 | | | $ | (1,736) | | | $ | (1,343) | |
LENDINGCLUB CORPORATION
Notes to Consolidated Financial Statements
(Tabular Amounts in Thousands, Except Share and Per Share Amounts, Ratios, or as Noted)
| | | | | | | | | | | | | | | | | |
| December 31, 2019 |
| Asset-Backed Securities Related to
Structured Program Transactions |
| Senior
Securities | | Subordinated Securities | | CLUB Certificates |
| Fair value of interests held | $ | 109,339 | | | $ | 21,090 | | | $ | 89,706 | |
| Expected weighted-average life (in years) | 1.1 | | 1.4 | | 1.1 |
| Discount rates | | | | | |
| 100 basis point increase | $ | (1,050) | | | $ | (300) | | | $ | (823) | |
| 200 basis point increase | $ | (2,076) | | | $ | (513) | | | $ | (1,627) | |
| Expected credit loss rates on underlying loans | | | | | |
| 10% adverse change | $ | 0 | | | $ | (2,162) | | | $ | (2,163) | |
| 20% adverse change | $ | 0 | | | $ | (4,273) | | | $ | (4,311) | |
| Expected prepayment rates | | | | | |
| 10% adverse change | $ | 0 | | | $ | (814) | | | $ | (654) | |
| 20% adverse change | $ | 0 | | | $ | (1,495) | | | $ | (1,279) | |
The sensitivity of loans HFS at fair value to adverse changes in key assumptions was as follows:
| | | | | | | | | | | |
| December 31, 2023 | | December 31, 2022 |
| Loans held for sale at fair value | $ | 407,773 | | | $ | 110,400 | |
| Expected remaining weighted-average life (in years) | 1.5 | | 1.4 |
| Discount rate: | | | |
| 100 basis point increase | $ | (5,093) | | | $ | (1,334) | |
| 200 basis point increase | $ | (10,051) | | | $ | (2,643) | |
| Annualized net charge-off rate: | | | |
| 10% increase | $ | (5,102) | | | $ | (2,289) | |
| 20% increase | $ | (10,184) | | | $ | (4,505) | |
| Annualized prepayment rate: | | | |
| 10% increase | $ | (851) | | | $ | (529) | |
| 20% increase | $ | (1,628) | | | $ | (1,008) | |
Fair Value Reconciliation
The following table presents additional information about Level 3 asset-backed securities related to Structured Program transactions measuredloans HFS at fair value on a recurring basis for the years ended December 31, 2020 and 2019:activity:
| | | | | | | | | | | |
| December 31, 2020 | | December 31, 2019 |
| Fair value at beginning of period | $ | 110,796 | | | $ | 60,279 | |
| Additions | 27,578 | | | 118,721 | |
| Redemptions | (5,215) | | | (17,900) | |
| Transfers | (517) | | | 0 | |
| Cash received | (72,258) | | | (45,701) | |
| Change in unrealized gain (loss) | 2,578 | | | (992) | |
| Accrued interest | 7,075 | | | 0 | |
| Provision for credit loss expense | (3,383) | | | 0 | |
| Other-than-temporary impairment | 0 | | | (3,611) | |
| Fair value at end of period | $ | 66,654 | | | $ | 110,796 | |
| | | | | | | | | | | | | | | | | | | | | |
| | | | | | | | | |
| | | | | | | | | | | | | | | | | |
| Balance at December 31, 2021 | | | | | | | | | | | $ | 142,370 | | | | | | | |
| Originations and purchases | | | | | | | | | | | 9,045,701 | | | | | | | |
| | | | | | | | | | | | | | | | | |
| Sales | | | | | | | | | | | (9,039,892) | | | | | | | |
| Principal payments | | | | | | | | | | | (31,253) | | | | | | | |
| Transfers | | | | | | | | | | | (11,907) | | | | | | | |
| Fair value adjustments recorded in earnings | | | | | | | | | | | 5,381 | | | | | | | |
| Balance at December 31, 2022 | | | | | | | | | | | $ | 110,400 | | | | | | | |
| Originations and purchases | | | | | | | | | | | 4,942,457 | | | | | | | |
| Sales | | | | | | | | | | | (4,634,155) | | | | | | | |
| Principal payments | | | | | | | | | | | (70,350) | | | | | | | |
| | | | | | | | | | | | | | | | | |
| Transfers | | | | | | | | | | | 195,106 | | | | | | | |
| Fair value adjustments recorded in earnings | | | | | | | | | | | (135,685) | | | | | | | |
| Balance at December 31, 2023 | | | | | | | | | | | $ | 407,773 | | | | | | | |
| | | | | | | | | | | | | |
| | | | | | | | | | | | | | | | | |
| | | | | | | | | | | | | | | | | |
| | | | | | | | | | | | | | | | | |
| | | | | | | | | | | | | | | | | |
| | | | | | | | | | | | | | | | | |
| | | | | | | | | | | | | | | | | |
| | | | | | | | | | | | | | | | | |
| | | | | | | | | | | | | | | | | |
| | | | | | | | | | | | | | | | | |
| | | | | | | | | | | | | | | | | |
| | | | | | | | | | | | | | | | | |
| | | | | | | | | |
| | | | | | | | | | | | | | | | | |
| | | | | | | | | | | | | | | | | |
| | | | | | | | | | | | | | | | | |
| | | | | | | | | | | | | | | | | |
| | | | | | | | | | | | | | | | | |
| | | | | | | | | | | | | | | | | |
| | | | | | | | | | | | | | | | | |
| | | | | | | | | | | | | | | | | |
| | | | | | | | | | | | | | | | | |
| | | | | | | | | | | | | | | | | |
| | | | | | | | | | | | | | | | | |
| | | | | | | | | |
The following table summarizes the aggregate fair value of the Company’s HFS loans, as well as the amount that was 90 days or more past due:
| | | | | | | | | | | | | | | | | | | | | | | |
| December 31, 2023 | | December 31, 2022 |
| Total | | 90 or more days past due | | Total | | 90 or more days past due |
| Aggregate unpaid principal balance | $ | 431,955 | | | $ | 1,395 | | | $ | 114,920 | | | $ | 188 | |
| Cumulative fair value adjustments | (24,182) | | | (1,102) | | | (4,520) | | | (153) | |
| Fair value of loans held for sale | $ | 407,773 | | | $ | 293 | | | $ | 110,400 | | | $ | 35 | |
LENDINGCLUB CORPORATION
Notes to Consolidated Financial Statements
(Tabular Amounts in Thousands, Except Share and Per Share Amounts, Ratios, or as Noted)
Loans Held for Investment at Fair Value
Significant Unobservable Inputs
The following significant unobservable inputs were used in the fair value measurement of loans HFI held at fair value:
| | | | | | | | | | | | | | | | | | | | | | | | | | | | | | | | | | | | | | | | | | | | | | | | | | | | | |
| | | | |
| | | | | | | December 31, 2023 | | December 31, 2022 |
| | | | | | | Minimum | | Maximum | | Weighted-
Average | | Minimum | | Maximum | | Weighted-Average |
| Discount rate | | 8.4 | % | | 16.2 | % | | 12.8 | % | | 8.8 | % | | 17.1 | % | | 12.7 | % |
Annualized net charge-off rate (1) | | 1.9 | % | | 5.9 | % | | 3.7 | % | | 1.6 | % | | 5.3 | % | | 3.2 | % |
Annualized prepayment rate (1) | | 18.6 | % | | 27.7 | % | | 22.6 | % | | 19.5 | % | | 31.0 | % | | 24.0 | % |
(1) The weighted-average rate is calculated using the original principal balance of each loan pool.
Fair Value Sensitivity
The sensitivity of loans HFI at fair value to adverse changes in key assumptions was as follows:
| | | | | | | | | | | |
| December 31, 2023 | | December 31, 2022 |
| Loans held for investment at fair value | $ | 262,190 | | | $ | 925,938 | |
| Expected remaining weighted-average life (in years) | 0.9 | | 0.9 |
| Discount rate: | | | |
| 100 basis point increase | $ | (1,957) | | | $ | (7,471) | |
| 200 basis point increase | $ | (3,888) | | | $ | (14,830) | |
| Annualized net charge-off rate: | | | |
| 10% increase | $ | (1,753) | | | $ | (5,574) | |
| 20% increase | $ | (3,595) | | | $ | (11,307) | |
| Annualized prepayment rate: | | | |
| 10% increase | $ | (857) | | | $ | (4,311) | |
| 20% increase | $ | (1,675) | | | $ | (7,480) | |
Fair Value Reconciliation
The following table presents loans HFI at fair value activity:
| | | | | | | | | | | | | | | | | | | | | |
| | | | | | | | | |
| | | | | | | | | | | | | | | | | |
| Balance at December 31, 2021 | | | | | | | | | | | $ | 21,240 | | | | | | | |
| Purchases | | | | | | | | | | | 954,086 | | | | | | | |
| Principal payments | | | | | | | | | | | (74,393) | | | | | | | |
| Transfers | | | | | | | | | | | 22,294 | | | | | | | |
| | | | | | | | | | | | | | | | | |
| Interest income accretion and fair value adjustments recorded in earnings | | | | | | | | | | | 2,711 | | | | | | | |
| Balance at December 31, 2022 | | | | | | | | | | | $ | 925,938 | | | | | | | |
| Purchases | | | | | | | | | | | 4,243 | | | | | | | |
| Principal payments | | | | | | | | | | | (485,043) | | | | | | | |
| | | | | | | | | | | | | | | | | |
| Transfers | | | | | | | | | | | (195,106) | | | | | | | |
| Interest income accretion and fair value adjustments recorded in earnings | | | | | | | | | | | 12,158 | | | | | | | |
| Balance at December 31, 2023 | | | | | | | | | | | $ | 262,190 | | | | | | | |
LENDINGCLUB CORPORATION
Notes to Consolidated Financial Statements
(Tabular Amounts in Thousands, Except Share and Per Share Amounts, Ratios, or as Noted)
The following table summarizes the aggregate fair value of the Company’s HFI loans held at fair value, as well as the amount that was 90 days or more past due:
| | | | | | | | | | | | | | | | | | | | | | | |
| December 31, 2023 | | December 31, 2022 |
| Total | | 90 or more days past due | | Total | | 90 or more days past due |
| Aggregate unpaid principal balance | $ | 281,031 | | | $ | 3,774 | | | $ | 1,002,465 | | | $ | 6,345 | |
| Cumulative fair value adjustments | (18,841) | | | (3,037) | | | (76,527) | | | (5,158) | |
| Fair value of loans held for investment | $ | 262,190 | | | $ | 737 | | | $ | 925,938 | | | $ | 1,187 | |
Retail and Certificate Loans and Related Notes and Certificates
The Company does not assume principal or interest rate risk on loans that were funded by its member payment-dependent self-directed retail program (Retail Program) because loan balances, interest rates and maturities are matched and offset by an equal balance of notes with the exact same interest rates and maturities. At December 31, 2023 and 2022, the DCF methodology used to estimate the retail note and certificate’s fair values used the same projected net cash flows as their related loans. Therefore, the fair value adjustments for retail loans held for investment were largely offset by the corresponding fair value adjustments due to the payment-dependent design of the retail notes and certificates.
Asset-Backed Securities Related to Structured Program Transactions
Prior year comparative disclosures related to significant unobservable inputs, fair value sensitivities and fair value rollforwards for asset-backed securities related to Structured Program transactions are not presented below as the comparability between periods would not be meaningful given that the current period consists primarily of its newly launched Structured Certificates that the Company began entering into in the second quarter of 2023. See “Note 7. Securitizations and Variable Interest Entities” for more information.
Senior Asset-Backed Securities Related to Structured Program Transactions
As of December 31, 2023, the fair value of the senior asset-backed securities related to Structured Program transactions was $1.2 billion with an expected remaining weighted-average life of 1.5 years. Discount rate, which includes credit spreads, was the significant unobservable input used to measure the fair value of this Level 3 asset. The minimum, maximum and weighted-average discount rate assumptions were 7.0% as of December 31, 2023. A hypothetical 100 and 200 basis point increase in the discount rate would decrease the fair value by $18.0 million and $36.0 million, respectively.
The following table presents senior asset-backed securities related to Structured Program transactions activity:
| | | | | | | | | | | |
| December 31, 2023 | | | | |
| Fair value at beginning of period | $ | — | | | | | | | |
| Additions | 1,225,796 | | | | | | | |
| | | | | | | |
| Cash received | (60,283) | | | | | | | |
| Change in unrealized gain | 10,890 | | | | | | | |
| | | | | | | |
| Fair value at end of period | $ | 1,176,403 | | | | | | | |
| | | | | | | |
| | | | | | | |
| | | | | | | |
| | | | | | | |
| | | | | | | |
| | | | | | | |
| | | | | | | |
| | | | | | | |
LENDINGCLUB CORPORATION
Notes to Consolidated Financial Statements
(Tabular Amounts in Thousands, Except Share and Per Share Amounts, Ratios, or as Noted)
Other Asset-Backed Securities Related to Structured Program Transactions
Significant Unobservable Inputs
The following significant unobservable inputs were used in the fair value measurement of other asset-backed securities related to Structured Program transactions:
| | | | | | | | | | | | | | | | | | | | | | | | | | | | | | | | | | | | | | | | | | | | | | | |
| | | | | | | December 31, 2023 | | | | | | | | |
| | | | | | | Minimum | | Maximum | | Weighted-
Average | | | | | | | | | | | | |
| Discount rate | | 8.1 | % | | 10.3 | % | | 9.0 | % | | | | | | | | | | | | |
Annualized net charge-off rate (1) | | 4.9 | % | | 5.9 | % | | 5.5 | % | | | | | | | | | | | | |
Annualized prepayment rate (1) | | 19.2 | % | | 21.0 | % | | 20.1 | % | | | | | | | | | | | | |
(1) The weighted-average rate is calculated using the original principal balance of each security.
Fair Value Sensitivity
The sensitivity in the fair value of other asset-backed securities related to Structured Program transactions to changes in key assumptions was as follows:
| | | | | | | |
| December 31, 2023 |
| | | |
| Fair value of interests held | $ | 73,393 | | | |
| Expected remaining weighted-average life (in years) | 1.5 | | |
| Discount rate | | | |
| 100 basis point increase | $ | (927) | | | |
| 200 basis point increase | $ | (1,836) | | | |
| Annualized net charge-off rate | | | |
| 10% increase | $ | (882) | | | |
| 20% increase | $ | (1,771) | | | |
| Annualized prepayment rate | | | |
| 10% increase | $ | (203) | | | |
| 20% increase | $ | (430) | | | |
Fair Value Reconciliation
The following table presents additional information about Level 3 other asset-backed securities related to Structured Program transactions measured at fair value:
| | | | | | | | | |
| December 31, 2023 | | |
| Fair value at beginning of period | $ | 12,469 | | | | | |
| Additions | 73,516 | | | | | |
| | | | | |
| Cash received | (12,634) | | | | | |
| Change in unrealized gain | 42 | | | | | |
| | | | | |
| Fair value at end of period | $ | 73,393 | | | | | |
| | | | | |
| | | | | |
| | | | | |
| | | | | |
| | | | | |
| | | | | |
| | | | | |
| | | | | |
LENDINGCLUB CORPORATION
Notes to Consolidated Financial Statements
(Tabular Amounts in Thousands, Except Share and Per Share Amounts, Ratios, or as Noted)
Servicing Assets
Significant Unobservable Inputs
The following table presents quantitative information about the significant unobservable inputs were used forin the Company’s Level 3 fair value measurementsmeasurement for servicing assets at December 31, 2020 and 2019:related to loans sold to investors:
| | | | | | | | | | | | | | | | | | | | | | | | | | | | | | | | | | | | | | | | | | | | | | | | | | | | | |
| | | | Servicing Assets |
| | | | | | | December 31, 2020 | | December 31, 2019 |
| | | | | | | Minimum | | Maximum | | Weighted-
Average | | Minimum | | Maximum | | Weighted-Average |
| Discount rates | | 4.8 | % | | 16.4 | % | | 9.9 | % | | 2.9 | % | | 14.8 | % | | 8.6 | % |
Net cumulative expected loss rates (1) | | 4.5 | % | | 26.3 | % | | 12.5 | % | | 3.7 | % | | 36.1 | % | | 12.4 | % |
Cumulative expected prepayment rates (1) | | 27.0 | % | | 38.9 | % | | 31.2 | % | | 27.5 | % | | 41.8 | % | | 32.5 | % |
Total market servicing rates (% per annum on outstanding principal balance) (2) | | 0.62 | % | | 0.62 | % | | 0.62 | % | | 0.66 | % | | 0.66 | % | | 0.66 | % |
| | | | | | | | | | | | | | | | | | | | | | | | | | | | | | | | | | | | | | | | | | | | | | | | | | | | | |
| | | | |
| | | | | | | December 31, 2023 | | December 31, 2022 |
| | | | | | | Minimum | | Maximum | | Weighted-
Average | | Minimum | | Maximum | | Weighted-Average |
| Discount rate | | 8.7 | % | | 17.3 | % | | 11.3 | % | | 7.5 | % | | 16.4 | % | | 10.1 | % |
Annualized net charge-off rate (1) | | 1.9 | % | | 24.0 | % | | 8.7 | % | | 1.3 | % | | 23.7 | % | | 9.3 | % |
Annualized prepayment rate (1) | | 15.6 | % | | 25.7 | % | | 20.3 | % | | 16.3 | % | | 30.9 | % | | 24.4 | % |
Market servicing rate (2) | | 0.62 | % | | 0.62 | % | | 0.62 | % | | 0.62 | % | | 0.62 | % | | 0.62 | % |
(1) Expressed as a percentage ofThe weighted-average rate is calculated using the original principal balance of the loan.each loan pool.
(2) Includes collectionThe fees estimated to be paid to a hypothetical third-party servicer.willing market participant would require for the servicing of loans with similar characteristics as those in the Company’s serviced portfolio.
Significant Recurring Level 3 Fair Value Input Sensitivity
The sensitivity of the fair value of servicing assets to adverse changes in key assumptions was as follows:
| | | | | | | | | | | | | | |
| | | |
| December 31, 2023 | | December 31, 2022 |
| Fair value of servicing assets | $ | 77,680 | | | | $ | 84,308 | | | |
| Expected remaining weighted-average life (in years) | 1.2 | | | 1.2 | | |
| Discount rate: | | | | | | |
| 100 basis point increase | $ | (675) | | | | $ | (726) | | | |
| 200 basis point increase | $ | (1,349) | | | | $ | (1,451) | | | |
| Annualized net charge-off rate: | | | | | | |
| 10% increase | $ | (878) | | | | $ | (1,037) | | | |
| 20% increase | $ | (1,756) | | | | $ | (2,074) | | | |
| Annualized prepayment rate: | | | | | | |
| 10% increase | $ | (1,550) | | | | $ | (1,994) | | | |
| 20% increase | $ | (3,100) | | | | $ | (3,989) | | | |
| | | | | | |
| | | | | | |
| | | | | | |
The Company’s selection of the most representative market servicing rates for servicing assets is inherently judgmental. The Company reviews third-party servicing rates for its loans, loans in similar credit sectors, and market servicing benchmarking analyses provided by third-party valuation firms, when available. The table below shows the impact on the estimated fair value of servicing assets, calculated using different market servicing rate assumptionsassumptions:
| | | | | | | | | | | | | | |
| | | |
| December 31, 2023 | | December 31, 2022 |
| Weighted-average market servicing rate assumptions | 0.62 | % | | | 0.62 | % | | |
| Change in fair value from: | | | | | | |
| Market servicing rate increase by 0.10% | $ | (8,719) | | | | $ | (10,505) | | | |
| Market servicing rate decrease by 0.10% | $ | 8,719 | | | | $ | 10,505 | | | |
LENDINGCLUB CORPORATION
Notes to Consolidated Financial Statements
(Tabular Amounts in Thousands, Except Share and Per Share Amounts, Ratios, or as Noted)
Fair Value Reconciliation
The following table presents servicing assets measured at fair value activity:
| | | | | | | |
| | | |
| Fair value at December 31, 2021 | $ | 67,726 | | | |
Issuances (1) | 93,352 | | | |
| Change in fair value, included in Marketplace Revenue | (73,229) | | | |
| Other net changes | (3,541) | | | |
| Fair value at December 31, 2022 | $ | 84,308 | | | |
Issuances (1) | 56,032 | | | |
| Change in fair value, included in Marketplace Revenue | (62,581) | | | |
| Other net changes | (79) | | | |
| Fair value at December 31, 2023 | $ | 77,680 | | | |
(1) Represents the servicing assets recorded when loans are sold. Included in “Gain on sales of loans” within “Marketplace revenue” on the Income Statement.
Financial Instruments Not Recorded at Fair Value
The following tables present the carrying amount and estimated fair values, by level within the fair value hierarchy, of the Company’s assets and liabilities that are not recorded at fair value on a recurring basis:
| | | | | | | | | | | | | | | | | | | | | | | | | | | | | |
| December 31, 2023 | Carrying Amount | | Level 1 | | Level 2 | | Level 3 | | Balance at
Fair Value |
| Assets: | | | | | | | | | |
| Loans and leases held for investment, net | $ | 4,539,915 | | | $ | — | | | $ | — | | | $ | 4,675,354 | | | $ | 4,675,354 | |
| Other assets | 37,605 | | | — | | | 36,884 | | | 1,017 | | | 37,901 | |
| Total assets | $ | 4,577,520 | | | $ | — | | | $ | 36,884 | | | $ | 4,676,371 | | | $ | 4,713,255 | |
| | | | | | | | | |
| Liabilities: | | | | | | | | | |
Deposits (1) | $ | 1,714,889 | | | $ | — | | | $ | — | | | $ | 1,714,203 | | | $ | 1,714,203 | |
| Borrowings | 6,398 | | | — | | | — | | | 6,398 | | | 6,398 | |
| | | | | | | | | |
| | | | | | | | | |
| Other liabilities | 59,015 | | | — | | | 36,823 | | | 22,192 | | | 59,015 | |
| Total liabilities | $ | 1,780,302 | | | $ | — | | | $ | 36,823 | | | $ | 1,742,793 | | | $ | 1,779,616 | |
| | | | | | | | | | | | | | | | | | | | | | | | | | | | | |
| December 31, 2022 | Carrying Amount | | Level 1 | | Level 2 | | Level 3 | | Balance at
Fair Value |
| Assets: | | | | | | | | | |
| | | | | | | | | |
| Loans and leases held for investment, net | $ | 4,705,302 | | | $ | — | | | $ | — | | | $ | 4,941,825 | | | $ | 4,941,825 | |
| Other assets | 36,646 | | | — | | | 35,300 | | | 1,397 | | | 36,697 | |
| Total assets | $ | 4,741,948 | | | $ | — | | | $ | 35,300 | | | $ | 4,943,222 | | | $ | 4,978,522 | |
| Liabilities: | | | | | | | | | |
Deposits (1) | $ | 860,808 | | | $ | — | | | $ | — | | | $ | 860,808 | | | $ | 860,808 | |
| Borrowings | 66,773 | | | — | | | 2,619 | | | 64,154 | | | 66,773 | |
| | | | | | | | | |
| | | | | | | | | |
| Other liabilities | 62,247 | | | — | | | 30,311 | | | 31,936 | | | 62,247 | |
| Total liabilities | $ | 989,828 | | | $ | — | | | $ | 32,930 | | | $ | 956,898 | | | $ | 989,828 | |
(1) Excludes deposit liabilities with no defined or contractual maturities.
LENDINGCLUB CORPORATION
Notes to Consolidated Financial Statements
(Tabular Amounts in Thousands, Except Share and Per Share Amounts, Ratios, or as Noted)
9. Derivative Instruments and Hedging Activities
Credit Derivatives
Beginning in the second quarter of 2023, the Company entered into credit support agreements related to loan sales, whereby it is obligated to make payments to a limited number of strategic investors approximately 18 months after sale if credit losses exceed certain initial agreed-upon thresholds, subject to a maximum dollar amount. Accordingly, these are accounted for as credit derivative liabilities, measured at fair value, and recorded in “Other liabilities” on the Balance Sheet. The initial fair value of the derivative liabilities is recorded in “Gain on sales of loans” with changes in the fair value recorded in “Net fair value adjustments,” both within “Marketplace revenue” on the Income Statement.
As of December 31, 2023, the total notional amount, or maximum dollar exposure, of the credit derivative liabilities was $7.3 million with a fair value of $6.4 million, which was based on the combined impact of both the quantitative and qualitative credit loss forecast. For the year ended December 31, 2023, the Company recognized a loss of $6.4 million in earnings.
Hedging
The Company is exposed to changes in the fair value of its fixed-rate loans due to changes in benchmark interest rates. Beginning in the third quarter of 2023, the Company entered into interest rate swaps to manage its exposure to changes in fair value of these loans attributable to changes in the Secured Overnight Financing Rate (SOFR). The interest rate swaps qualify as fair value hedges and involve the payment of fixed-rate amounts to a counterparty in exchange for the receipt of variable-rate payments over the life of the agreements, ranging from approximately one to three years.
The table below presents the notional and gross fair value amounts of the Company’s derivatives used for hedging as of December 31, 20202023:
| | | | | | | | | | | | |
| |
| Notional | | Gross Derivative Liability Fair Value (1) | |
| Derivatives used for hedging: | | | |
| Interest rate swaps | $ | 1,500,000 | | | $ | (8,547) | | |
| | | | |
| | | | |
| | | | |
| | | | |
| | | | |
| | | | |
(1) Recorded in “Other liabilities” on the Balance Sheet.
The following table summarizes the gains (losses) recognized on the Company’s fair value hedges for year ended December 31, 2023:
| | | | | |
| |
| |
| Gains (losses) recognized on: | |
| Hedged item | $ | 8,881 | |
| Derivatives used for hedging | (8,547) | |
Interest settlement on derivative (1) | 2,514 | |
Total gains on fair value hedges (2) | $ | 2,848 | |
| |
| |
| |
| |
| |
(1) Includes accrued interest receivable and 2019:accrued interest payable.
| | | | | | | | | | | | | | |
| Servicing Assets | | |
| December 31, 2020 | | December 31, 2019 |
| Weighted-average market servicing rate assumptions | 0.62 | % | | | 0.66 | % | | |
| Change in fair value from: | | | | | | |
| Servicing rate increase by 0.10% | $ | (7,379) | | | | $ | (13,978) | | | |
| Servicing rate decrease by 0.10% | $ | 7,379 | | | | $ | 13,979 | | | |
LENDINGCLUB CORPORATION
Notes to Consolidated Financial Statements
(Tabular Amounts in Thousands, Except Share and Per Share Amounts, Ratios, or as Noted)
The following table presents the cumulative basis adjustments for fair value of servicing assets to adverse changes in key assumptionshedges as of December 31, 2020 and 2019:2023:
| | | | | | | | | | | | | | |
| Servicing Assets | | |
| December 31, 2020 | | December 31, 2019 |
| Fair value of Servicing Assets | $ | 56,347 | | | | $ | 89,680 | | | |
| Discount rates | | | | | | |
| 100 basis point increase | $ | (455) | | | | $ | (680) | | | |
| 200 basis point increase | $ | (911) | | | | $ | (1,360) | | | |
| Expected loss rates | | | | | | |
| 10% adverse change | $ | (346) | | | | $ | (582) | | | |
| 20% adverse change | $ | (691) | | | | $ | (1,165) | | | |
| Expected prepayment rates | | | | | | |
| 10% adverse change | $ | (1,596) | | | | $ | (2,962) | | | |
| 20% adverse change | $ | (3,192) | | | | $ | (5,924) | | | |
Fair Value Reconciliation
The following table presents additional information about Level 3 servicing assets measured at fair value on a recurring basis for the years ended December 31, 2020 and 2019:
| | | | | | | |
| Servicing Assets | | |
Fair value at December 31, 2018 | $ | 64,006 | | | |
Issuances (1)
| 79,692 | | | |
Change in fair value, included in investor fees | (58,172) | | | |
Other net changes included in deferred revenue | 4,154 | | | |
Fair value at December 31, 2019 | $ | 89,680 | | | |
Issuances (1)
| 33,990 | | | |
Change in fair value, included in investor fees | (58,730) | | | |
Other net changes included in deferred revenue | (8,593) | | | |
Fair value at December 31, 2020 | $ | 56,347 | | | |
| | | | | | | | | | | |
| Balance Sheet Line Item | Carrying Amount of Closed Portfolio (1) | | Cumulative Fair Value Adjustment to Hedged Item (2) |
| Loans and leases held for investment at amortized cost | $ | 3,109,854 | | | $ | 8,881 | |
| | | |
(1) Represents the gains or losses on salesamortized cost of the relatedtotal closed portfolio of loans designated in a portfolio method hedge relationship in which the hedged item is a stated layer that is expected to be remaining at the end of the hedging relationship. At December 31, 2023, the amortized cost of loans designated as the hedged item in the portfolio layer hedging relationship was $1.5 billion.
(2) Included in the carrying amount of the closed portfolio of loans.
LENDINGCLUB CORPORATION
Notes to Consolidated Financial Statements
(Tabular Amounts in Thousands, Except Share and Per Share Amounts, Ratios, or as Noted)
Loan Trailing Fee Liability
Significant Unobservable Inputs
The following table presents quantitative information about the significant unobservable inputs used for the Company’s Level 3 fair value measurements for loan trailing fee liability at December 31, 2020 and 2019:
| | | | | | | | | | | | | | | | | | | | | | | | | | | | | | | | | | | | | | | | | | | | | | | | | | | | | |
| | | | Loan Trailing Fee Liability |
| | | | | | | December 31, 2020 | | December 31, 2019 |
| | | | | | | Minimum | | Maximum | | Weighted
Average- | | Minimum | | Maximum | | Weighted
Average- |
| Discount rates | | 4.8 | % | | 16.4 | % | | 10.5 | % | | 2.9 | % | | 14.8 | % | | 9.3 | % |
Net cumulative expected loss rates (1) | | 4.5 | % | | 26.3 | % | | 14.3 | % | | 3.7 | % | | 36.0 | % | | 14.4 | % |
Cumulative expected prepayment rates (1) | | 27.1 | % | | 39.0 | % | | 31.6 | % | | 28.5 | % | | 41.7 | % | | 33.0 | % |
(1) Expressed as a percentage of the original principal balance of the loan.
Significant Recurring Level 3 Fair Value Input Sensitivity
The fair value sensitivity of the loan trailing fee liability to adverse changes in key assumptions would not result in a material impact on the Company’s financial position.
Fair Value Reconciliation
The following table presents additional information about the Level 3 loan trailing fee liability measured at fair value on a recurring basis for the years ended December 31, 2020 and 2019:
| | | | | | | | | | | |
| Year Ended December 31, | 2020 | | 2019 |
| Fair value at beginning of period | $ | 11,099 | | | $ | 10,010 | |
| Issuances | 2,978 | | | 7,815 | |
| Cash payment of Loan Trailing Fee | (7,402) | | | (7,908) | |
| Change in fair value, included in Origination and Servicing | 819 | | | 1,182 | |
| Fair value at end of period | $ | 7,494 | | | $ | 11,099 | |
LENDINGCLUB CORPORATION
Notes to Consolidated Financial Statements
(Tabular Amounts in Thousands, Except Share and Per Share Amounts, Ratios, or as Noted)
Financial Instruments, Assets, and Liabilities Not Recorded at Fair Value
The following tables present the fair value hierarchy for financial instruments, assets, and liabilities not recorded at fair value:
| | | | | | | | | | | | | | | | | | | | | | | | | | | | | |
| December 31, 2020 | Carrying Amount | | Level 1 Inputs | | Level 2 Inputs | | Level 3 Inputs | | Balance at
Fair Value |
| Assets: | | | | | | | | | |
Cash and cash equivalents (1) | $ | 524,963 | | | $ | 0 | | | $ | 524,963 | | | $ | 0 | | | $ | 524,963 | |
Restricted cash (1) | 103,522 | | | 0 | | | 103,522 | | | 0 | | | 103,522 | |
| Servicer reserve receivable | 22 | | | 0 | | | 22 | | | 0 | | | 22 | |
| Deposits | 892 | | | 0 | | | 892 | | | 0 | | | 892 | |
| Total assets | $ | 629,399 | | | $ | 0 | | | $ | 629,399 | | | $ | 0 | | | $ | 629,399 | |
| Liabilities: | | | | | | | | | |
| Accrued expenses and other liabilities | $ | 13,552 | | | $ | 0 | | | $ | 0 | | | $ | 13,552 | | | $ | 13,552 | |
| Accounts payable | 3,698 | | | 0 | | | 3,698 | | | 0 | | | 3,698 | |
| Payable to investors | 40,286 | | | 0 | | | 40,286 | | | 0 | | | 40,286 | |
| | | | | | | | | |
| Credit facilities and securities sold under repurchase agreements | 104,989 | | | 0 | | | 65,121 | | | 39,868 | | | 104,989 | |
| Total liabilities | $ | 162,525 | | | $ | 0 | | | $ | 109,105 | | | $ | 53,420 | | | $ | 162,525 | |
(1) Carrying amount approximates fair value due to the short maturity of these financial instruments.
| | | | | | | | | | | | | | | | | | | | | | | | | | | | | |
| December 31, 2019 | Carrying Amount | | Level 1 Inputs | | Level 2 Inputs | | Level 3 Inputs | | Balance at
Fair Value |
| Assets: | | | | | | | | | |
Cash and cash equivalents (1) | $ | 243,779 | | | $ | 0 | | | $ | 243,779 | | | $ | 0 | | | $ | 243,779 | |
Restricted cash (1) | 243,343 | | | 0 | | | 243,343 | | | 0 | | | 243,343 | |
| Servicer reserve receivable | 73 | | | 0 | | | 73 | | | 0 | | | 73 | |
| Deposits | 953 | | | 0 | | | 953 | | | 0 | | | 953 | |
| Total assets | $ | 488,148 | | | $ | 0 | | | $ | 488,148 | | | $ | 0 | | | $ | 488,148 | |
| Liabilities: | | | | | | | | | |
| Accrued expenses and other liabilities | $ | 24,899 | | | $ | 0 | | | $ | 0 | | | $ | 24,899 | | | $ | 24,899 | |
| Accounts payable | 10,855 | | | 0 | | | 10,855 | | | 0 | | | 10,855 | |
| Payable to investors | 97,530 | | | 0 | | | 97,530 | | | 0 | | | 97,530 | |
| | | | | | | | | |
| Credit facilities and securities sold under repurchase agreements | 587,453 | | | 0 | | | 77,143 | | | 510,310 | | | 587,453 | |
| Total liabilities | $ | 720,737 | | | $ | 0 | | | $ | 185,528 | | | $ | 535,209 | | | $ | 720,737 | |
(1) Carrying amount approximates fair value due to the short maturity of these financial instruments.
LENDINGCLUB CORPORATION
Notes to Consolidated Financial Statements
(Tabular Amounts in Thousands, Except Share and Per Share Amounts, Ratios, or as Noted)
9.10. Property, Equipment and Software, Net
Property, equipment and software, net, consist of the following:
| | December 31, | December 31, | 2020 | | 2019 | December 31, | 2023 | | 2022 |
Internally developed software (1) | $ | 101,953 | | | $ | 117,510 | |
Software (1) | |
| Leasehold improvements | Leasehold improvements | 35,140 | | | 39,315 | |
| Computer equipment | Computer equipment | 27,030 | | | 26,669 | |
| Purchased software | 19,004 | | | 11,846 | |
| Furniture and fixtures | Furniture and fixtures | 8,203 | | | 9,406 | |
| Construction in progress | 2,761 | | | 4,937 | |
| Total property, equipment and software | Total property, equipment and software | 194,091 | | | 209,683 | |
| Accumulated depreciation and amortization | Accumulated depreciation and amortization | (97,450) | | | (95,313) | |
| Total property, equipment and software, net | Total property, equipment and software, net | $ | 96,641 | | | $ | 114,370 | |
(1) Includes $13.9$66.9 million and $21.3$43.7 million inof development in progress for internally-developed software and $4.6 million and $3.0 million of development in progress to customize purchased software as of December 31, 20202023 and 2019,2022, respectively.
Depreciation and amortization expense on property, equipment and software was $45.2$43.0 million, $51.6$39.0 million and $47.0$38.2 million for the years ended December 31, 2020, 20192023, 2022 and 2018,2021, respectively.
11. Goodwill and Intangible Assets
Goodwill
The Company’s Goodwill balance was $75.7 million as of both December 31, 2023 and 2022. The Company recordeddid not record any goodwill impairment expense on its internally developed software of $5.7 million, $3.9 million and $3.8 million forduring the years ended December 31, 2020, 20192023, 2022 and 2018, respectively. The Company records2021. Goodwill is not amortized, but is subject to annual impairment expense on its leasehold improvements and furniture and fixtures and its internally developed software in “Other general and administrative” and “Engineering and product development” expense, respectively,tests that are performed in the Consolidated Statementsfourth quarter of Operations.
each calendar year. For additional detail, see “
10. Other Assets
Other assets consistNote 1. Summary of the following:
| | | | | | | | | | | |
| December 31, | 2020 | | 2019 |
Loan servicing assets, at fair value (1) | $ | 56,347 | | | $ | 89,680 | |
| Prepaid expenses | 16,455 | | | 14,862 | |
| Accounts receivable | 10,243 | | | 19,017 | |
| Other investments | 8,275 | | | 8,242 | |
| | | |
| | | |
| Other | 5,410 | | | 11,867 | |
Total other assets | $ | 96,730 | | | $ | 143,668 | |
(1) Significant Accounting Policies.Loans underlying loan servicing rights had a total outstanding principal balance of $10.1 billion and $14.1 billion as of December 31, 2020 and 2019, respectively.”
11. Intangible Assets
Intangible assets consist of customer relationships. Intangible assets, net of accumulated amortization, are included in “Other assets” on the Balance Sheet. The gross and net carrying values and accumulated amortization as of December 31, 2020 and 2019, were as follows:
| | | | | | | | | | | |
| December 31, | 2020 | | 2019 |
| Gross Carrying Value | $ | 39,500 | | | $ | 39,500 | |
| Accumulated Amortization | (28,073) | | | (24,951) | |
| Net Carrying Value | $ | 11,427 | | | $ | 14,549 | |
| | | | | | | | | | | |
| December 31, | 2023 | | 2022 |
| Gross carrying value | $ | 54,500 | | | $ | 54,500 | |
| Accumulated amortization | (42,365) | | | (38,166) | |
| Net carrying value | $ | 12,135 | | | $ | 16,334 | |
LENDINGCLUB CORPORATION
Notes to Consolidated Financial Statements
(Tabular Amounts in Thousands, Except Share and Per Share Amounts, Ratios, or as Noted)
The customer relationship intangible assets are amortized on an accelerated basis over a 14 year period.from ten to fourteen years. Amortization expense associated with intangible assets for the years ended December 31, 2020, 20192023, 2022 and 20182021 was $3.1$4.2 million, $3.5$4.8 million and $3.9$5.2 million, respectively. There was no impairment loss for the years ended December 31, 2023, 2022 and 2021.
The expected future amortization expense for intangible assets as of December 31, 2020,2023, is as follows:
| | Year Ending December 31, | |
| 2021 | $ | 2,746 | |
| 2022 | 2,370 | |
| 2023 | 1,994 | |
| 2024 | 2024 | 1,618 | |
| 2025 | 2025 | 1,241 | |
| 2026 | |
| 2027 | |
| 2028 | |
| Thereafter | Thereafter | 1,458 | |
| Total | Total | $ | 11,427 | |
12. Accrued ExpensesOther Assets
Other assets consist of the following:
| | | | | | | | | | | |
| December 31, | 2023 | | 2022 |
Deferred tax assets, net (1) | $ | 151,411 | | | $ | 173,687 | |
Servicing assets (2) | 78,401 | | | 85,654 | |
| Nonmarketable equity investments | 42,891 | | | 38,320 | |
| Accrued interest receivable | 35,793 | | | 30,901 | |
| Operating lease assets | 26,611 | | | 63,872 | |
Intangible assets, net (3) | 12,135 | | | 16,334 | |
| | | |
| | | |
| | | |
| Other | 108,211 | | | 91,538 | |
Total other assets | $ | 455,453 | | | $ | 500,306 | |
(1) See “Note 18. Income Taxes” for additional detail.
(2) Loans underlying servicing assets had a total outstanding principal balance of $9.5 billion and $11.0 billion as of December 31, 2023 and 2022, respectively.
(3) See “Note 11. Goodwill and Intangible Assets” for additional detail.
13. Deposits
Deposits consist of the following:
| | | | | | | | | | | |
| December 31, | 2023 | | 2022 |
| Interest-bearing deposits: | | | |
| Savings and money market accounts | $ | 4,349,239 | | | $ | 3,616,657 | |
| Certificates of deposit | 1,714,889 | | | 860,808 | |
| Checking accounts | 937,552 | | | 1,681,095 | |
| Total | $ | 7,001,680 | | | $ | 6,158,560 | |
| Noninterest-bearing deposits | 331,806 | | | 233,993 | |
| Total deposits | $ | 7,333,486 | | | $ | 6,392,553 | |
LENDINGCLUB CORPORATION
Notes to Consolidated Financial Statements
(Tabular Amounts in Thousands, Except Share and Per Share Amounts, Ratios, or as Noted)
Total certificates of deposit at December 31, 2023 are scheduled to mature as follows:
| | | | | |
| 2024 | $ | 1,559,553 | |
| 2025 | 142,515 | |
| 2026 | 1,593 | |
| 2027 | 9,226 | |
| 2028 | 2,002 | |
| |
| Total certificates of deposit | $ | 1,714,889 | |
The following table presents the amount of certificates of deposit with denominations exceeding the Federal Deposit Insurance Corporation (FDIC) limit of $250 thousand, segregated by time remaining until maturity, as of December 31, 2023:
| | | | | | | | | | | | | | | | | | | | | | | | | | | | | |
| Three months or less | | Over 3 months through
6 months | | Over 6 months through
12 months | | Over
12 months | | Total |
| Certificates of deposit | $ | 5,673 | | | $ | 8,139 | | | $ | 132,912 | | | $ | 3,403 | | | $ | 150,127 | |
14. Borrowings
Short-term Borrowings
The Company entered into repurchase agreements pursuant to which the Company sold securities (subject to an obligation to repurchase such securities at a specified future date and price) in exchange for cash. There was no debt outstanding under the Company’s repurchase agreements at December 31, 2023. The aggregate debt outstanding under the Company’s repurchase agreements was $2.6 million at December 31, 2022.
In addition, the Company has available borrowing capacity with the FRB and FHLB of Des Moines totaling $3.5 billion and $605.5 million, with pledged collateral totaling $6.4 million and $754.0 million, at December 31, 2023 and 2022, respectively.
LENDINGCLUB CORPORATION
Notes to Consolidated Financial Statements
(Tabular Amounts in Thousands, Except Share and Per Share Amounts, Ratios, or as Noted)
Long-term Debt
The following table summarizes the Company’s long-term debt, as of the dates indicated:
| | | | | | | | | | | |
| December 31, | 2023 | | 2022 |
Advances from PPPLF (1): | | | |
| Aggregate debt outstanding (fixed interest rate of 0.35%) | $ | 6,398 | | | $ | 64,154 | |
| Pledged collateral | $ | 6,392 | | | $ | 66,971 | |
| | | |
| | | |
| | | |
| | | |
Retail notes and certificates(2): | | | |
| Aggregate debt outstanding | $ | 10,488 | | | $ | 55,425 | |
| | | |
| | | |
Payable on Structured Program borrowings (3): | | | |
| Aggregate debt outstanding | $ | 2,468 | | | $ | 8,085 | |
| | | |
| Pledged collateral | $ | 3,930 | | | $ | 9,708 | |
(1) Collateralized by SBA PPP loans originated by the Company. The maturity date of the PPPLF borrowings matches the maturity date of the pledged SBA PPP loans. When loans are forgiven by the SBA, the corresponding PPPLF advance is paid by the Company.
(2) The Company does not assume principal or interest rate risk on loans that were funded by Retail Notes because loan balances, interest rates and maturities were matched and offset by an equal balance of notes with the exact same interest rates and maturities. As of December 31, 2020, LendingClub ceased offering and selling Retail Notes. The total balance of outstanding Retail Notes will continue to decline as underlying borrower payments are made.
(3) Consists of certificate participations and securities of certain consolidated VIEs held by third-party investors and secured by “Loans held for investment at fair value” totaling $0.5 million and $4.0 million and "Restricted cash” of $3.4 million and $5.7 million as of December 31, 2023 and 2022, respectively.
15. Other Liabilities
Accrued expenses and otherOther liabilities consist of the following:
| | | | | | | | | | | |
| December 31, | 2020 | | 2019 |
| Accrued compensation | $ | 28,805 | | | $ | 30,484 | |
Contingent liabilities (1) | 21,592 | | | 16,000 | |
| Accrued expenses | 14,382 | | | 36,797 | |
| Transaction fee refund reserve | 14,119 | | | 25,541 | |
| Loan trailing fee liability, at fair value | 7,494 | | | 11,099 | |
| Deferred revenue | 4,923 | | | 13,688 | |
| Other | 10,142 | | | 9,027 | |
| | | |
| | | |
| Total accrued expenses and other liabilities | $ | 101,457 | | | $ | 142,636 | |
| | | | | | | | | | | |
| December 31, | 2023 | | 2022 |
| Accounts payable and accrued expenses | $ | 54,619 | | | $ | 98,173 | |
| Operating lease liabilities | 37,869 | | | 77,291 | |
| | | |
Payable to investors (1) | 36,823 | | | 30,311 | |
| | | |
| | | |
| Other | 93,490 | | | 86,842 | |
| | | |
| | | |
| Total other liabilities | $ | 222,801 | | | $ | 292,617 | |
(1) See “Note 19. CommitmentsRepresents principal and Contingencies” for further information.interest on loans collected by the Company and pending disbursement to investors.
13.
LENDINGCLUB CORPORATION
Notes to Consolidated Financial Statements
(Tabular Amounts in Thousands, Except Share and Per Share Amounts, Ratios, or as Noted)
16. Accumulated Other Comprehensive Income (Loss)
Accumulated other comprehensive income (loss) represents other cumulative gains and losses that are not reflected in earnings. The components of other comprehensive income (loss) were as follows:
| | | | | | | | | | | | | | | | | |
| Year Ended December 31, | 2020 |
| Before Tax | | Tax Effect | | Net of Tax |
| Change in net unrealized gain (loss) on securities available for sale | $ | 2,044 | | | $ | (5) | | | $ | 2,049 | |
| Other comprehensive income (loss) | $ | 2,044 | | | $ | (5) | | | $ | 2,049 | |
| | | | | | | | | | | | | | | | | |
| Year Ended December 31, | 2023 |
| Before Tax | | Tax Effect | | Net of Tax |
| Change in net unrealized gain on securities available for sale | $ | 10,238 | | | $ | (2,926) | | | $ | 7,312 | |
| Other comprehensive income | $ | 10,238 | | | $ | (2,926) | | | $ | 7,312 | |
| | | | | | | | | | | | | | | | | |
| Year Ended December 31, | 2019 |
| Before Tax | | Tax Effect | | Net of Tax |
| Change in net unrealized gain (loss) on securities available for sale | $ | (526) | | | $ | 216 | | | $ | (742) | |
| Other comprehensive income (loss) | $ | (526) | | | $ | 216 | | | $ | (742) | |
| | | | | | | | | | | | | | | | | |
| Year Ended December 31, | 2022 |
| Before Tax | | Tax Effect | | Net of Tax |
| Change in net unrealized loss on securities available for sale | $ | (61,326) | | | $ | 16,664 | | | $ | (44,662) | |
| Other comprehensive loss | $ | (61,326) | | | $ | 16,664 | | | $ | (44,662) | |
LENDINGCLUB CORPORATION
Notes to Consolidated Financial Statements
(Tabular Amounts in Thousands, Except Share and Per Share Amounts, Ratios, or as Noted)
| | | | | | | | | | | | | | | | | |
| Year Ended December 31, | 2018 |
| Before Tax | | Tax Effect | | Net of Tax |
| Change in net unrealized gain (loss) on securities available for sale | $ | 252 | | | $ | 83 | | | $ | 169 | |
| Other comprehensive income (loss) | $ | 252 | | | $ | 83 | | | $ | 169 | |
| | | | | | | | | | | | | | | | | |
| Year Ended December 31, | 2021 |
| Before Tax | | Tax Effect | | Net of Tax |
| Change in net unrealized gain on securities available for sale | $ | 5,562 | | | $ | — | | | $ | 5,562 | |
| Other comprehensive income | $ | 5,562 | | | $ | — | | | $ | 5,562 | |
Accumulated other comprehensive income (loss) balances were as follows:
| | | | | |
| Total
Accumulated Other Comprehensive Income (Loss) |
Balance at December 31, 20182021 | $ | 1577,046 | |
Change in netNet unrealized gain (loss)loss on securities available for sale | (44,662) | | (742) |
Less: Other comprehensive income (loss) attributable to noncontrolling interests | (20) | |
Balance at December 31, 20192022 | $ | (565)(37,616) | |
Change in netNet unrealized gain (loss) on securities available for sale | 7,312 | | 2,049 |
Balance at December 31, 20202023 | $ | 1,484(30,304) | |
14. Debt
Credit Facilities and Securities Sold Under Repurchase Agreements
The Company may enter into arrangements in the ordinary course of business pursuant to which the Company can incur indebtedness. Below is a description of certain of these arrangements:
Warehouse Credit Facilities
Through wholly-owned subsidiaries, the Company entered into secured warehouse credit facilities (Warehouse Facility or Facilities), to finance the Company’s personal loans and auto refinance loans and to pay fees and expenses related to the applicable facilities. Each subsidiary entered into a credit agreement and security agreement with a commercial bank as administrative agent and a national banking association as collateral trustee and paying agent. The creditors of the Warehouse Facilities had no recourse to the general credit of the Company.
All previously existing Warehouse Facilities were fully repaid and terminated as of December 31, 2020. As of December 31, 2019, the Company had $387.3 million in aggregate debt outstanding under the Warehouse Facilities, with collateral consisting of loans at fair value of $551.5 million included in “Loans held for sale by the Company at fair value,” and restricted cash of $25.1 million included in the Consolidated Balance Sheets.
At December 31, 2019, borrowings under these facilities bore weighted-average interest rates ranging from 3.76% to 4.42%. The Company paid monthly unused commitment fees ranging from 0.375% to 1.250% per annum on the average undrawn portion available.
Revolving Credit Facility
In December 2015, the Company entered into a credit and guaranty agreement and a pledge and security agreement with several lenders and a financial services company, as collateral agent, for an aggregate $120.0 million secured revolving credit facility (Revolving Facility).
LENDINGCLUB CORPORATION
Notes to Consolidated Financial Statements
(Tabular Amounts in Thousands, Except Share and Per Share Amounts, Ratios, or as Noted)
The Company had the ability to borrow under the Revolving Facility until December 17, 2020. This facility matured and was repaid in the fourth quarter of 2020. The Company had $60.0 million in debt outstanding under the Revolving Facility as of December 31, 2019. At December 31, 2019, borrowings under the Revolving Facility bore a weighted-average interest rate of 4.46%. The Company paid a quarterly commitment fee ranging from 0.25% to 0.375% per annum, depending on the Company’s total net leverage ratio, on the average undrawn portion available under the Revolving Facility.
Repurchase Agreements
The Company entered into repurchase agreements pursuant to which the Company sold securities (subject to an obligation to repurchase such securities at a specified future date and price) in exchange for cash, primarily to finance securities retained from the Company’s Structured Program transactions. As of December 31, 2020 and 2019, the Company had $105.0 million and $140.2 million in aggregate debt outstanding under its repurchase agreements, respectively, which is amortized over time through regular principal and interest payments collected from the pledged securities, and at December 31, 2020, have contractual repurchase dates ranging from September 2022 to March 2028. The contractual repurchase dates correspond to either a set repurchase schedule or to the maturity dates of the underlying securities, which have a remaining weighted-average estimated life from 0.9 to 1.4 years. At December 31, 2020 and 2019, the repurchase agreements bear interest rates ranging from 3.05% to 4.00% and 3.41% to 4.40%, respectively, which are either fixed or based on a benchmark of the three-month LIBOR rate or the weighted-average interest rate of the securities sold plus a spread. Securities sold are included in “Credit facilities and securities sold under repurchase agreements” on the Consolidated Balance Sheets. Underlying securities retained and pledged as collateral under repurchase agreements were $133.5 million and $174.8 million, respectively, at December 31, 2020 and 2019.
Payable to Structured Program Note and Certificate Holders
The Company consolidates certain sponsored Structured Program transactions through master trusts comprised of unsecured personal whole loans. The trusts sold certificate participations and securities to third-party investors in an amount equal to approximately 95% of the loans. The remaining certificate participations, securities, and residual interests were retained by the Company. The Company is the primary beneficiary of the trusts, which are consolidated. As of December 31, 2020 and 2019, the certificate participations and securities held by third-party investors of $152.8 million and $40.6 million, respectively, are included in “Payable to Structured Program note and certificate holders at fair value” in the Consolidated Balance Sheets and were secured by loans held for investment and loans held for sale by the Company at fair value of $148.3 million and $40.3 million and restricted cash of $13.5 million and $2.9 million included in the Consolidated Balance Sheets at December 31, 2020 and 2019, respectively.
15. Stockholders’ Equity
Preferred Stock
The Company authorized 10,000,000 shares of preferred stock with a par value of $0.01 per share. In February 2020, the Company filed Certificates of Designations with the Secretary of State of Delaware to designate, of the total authorized shares of preferred stock, 1,200,000 shares of Series A Preferred Stock and 600,000 shares of Series B Preferred Stock. As of December 31, 2020, there were 43,000 shares of Series A Preferred Stock outstanding and 0 shares of Series B Preferred Stock outstanding.
Each share of Series A Preferred Stock will automatically convert into 100 shares of LendingClub common stock upon a permissible transfer to an unaffiliated third party (subject to adjustment and the other terms described in its respective Certificate of Designations), provided that upon such conversion, the holder, together with its affiliates, will not own or control, in the aggregate, more than 9.9% of the Company’s outstanding common stock. A
LENDINGCLUB CORPORATION
Notes to Consolidated Financial Statements
(Tabular Amounts in Thousands, Except Share and Per Share Amounts, Ratios, or as Noted)
permissible transfer is a transfer (a) to the Company; (b) in a widespread public distribution; (c) in which no one transferee (or group of associated transferees) would receive 2% or more of any class of the Company’s voting securities then outstanding (including pursuant to a related series of such transfers); or (d) to a transferee that would control more than 50% of the Company voting securities (not including voting securities such person is acquiring from the transferor). The shares of Series A Preferred Stock have no voting rights, except as otherwise required by the General Corporation Law of the State of Delaware.
The Series A Preferred Stock ranks pari passu with the common stock, and junior to any other series of preferred stock that is issued by the Company with respect to rights upon liquidation, winding up and dissolution and as to rights to dividends, provided, however, that in case of a liquidation, winding up or dissolution the Series A Preferred Stock has a right to receive $0.01 per share before any payment is made to the holders of LendingClub common stock, and will thereafter participate on a pari passu basis with the common stock.
The Series B Preferred Stock, if issued, will (a) be nonredeemable; (b) have a minimum preferential quarterly dividend of $0.001 per share or any higher per share dividend declared on LendingClub common stock; (c) in the event of a liquidation be entitled to receive a preferred liquidation payment equal to $0.001 per share plus the per share amount paid in respect of a share of LendingClub common stock; (d) will have one vote, voting together with LendingClub common stock; and (e) in the event of any merger, consolidation or other transaction in which shares of LendingClub common stock are exchanged, will be entitled to receive the per share amount paid in respect of each share of LendingClub common stock. The rights of holders of the Series B Preferred Stock with respect to dividends, liquidation and voting, and in the event of mergers and consolidations, are protected by customary antidilution provisions. There are 0 issued Series B Preferred Stock.
Issuance of Series A Preferred Stock in Exchange for Common Stock
In February 2020, the Company and Radius Bancorp, Inc. (Radius) entered into an Agreement and Plan of Merger (Merger Agreement), by and among the Company, a wholly owned-subsidiary of the Company, and Radius, pursuant to which the Company will acquire Radius and thereby acquire its wholly-owned subsidiary, Radius Bank (the Merger). In connection with the Merger and in order to facilitate compliance with federal banking regulations by Shanda, in February 2020, the Company also entered into a Share Exchange Agreement (the Exchange Agreement) pursuant to which Shanda exchanged all of its shares of the Company’s common stock (with voting rights), or 19,562,881 shares, for Series A Preferred Stock, or 195,628 shares, and a one-time cash payment of $50.2 million.
On the date of the Exchange Agreement, the effective conversion price for the Series A Preferred Stock was less than the fair value of the common stock, resulting in a beneficial conversion feature that the Company recognized as a deemed dividend to the preferred stockholders and, accordingly, an adjustment to net loss to arrive at net loss attributable to common stockholders. As a result, the Company recorded the deemed dividend of $50.2 million within accumulated deficit for the quarter ended March 31, 2020. There were 0 other deemed dividends recorded during 2020.
Shareholder Protection Agreement
In February 2020, the board of directors of the Company adopted a Temporary Bank Charter Protection Agreement (Protection Agreement) and simultaneously declared a dividend of one right for each outstanding share of LendingClub common stock (each such right, a Common Right) and one right for each outstanding share of Series A Preferred Stock (each such right, a Series A Preferred Right and, together with the Common Rights, the Rights) to stockholders of record at the close of business on March 19, 2020. The Protection Agreement provides for the dilution of any person or group of persons that acquires: (i) 25% or more equity interest in the Company, or (ii) 10.0% or more of any class of the Company’s voting securities. In accordance with its terms, the Protection Agreement expired upon the closing of the Merger on February 1, 2021.
LENDINGCLUB CORPORATION
Notes to Consolidated Financial Statements
(Tabular Amounts in Thousands, Except Share and Per Share Amounts, Ratios, or as Noted)
Retirement of treasury stock
In the first quarter 2020, we retired 467,049 shares, or $19.6 million, of common stock previously held as treasury shares. The Company also retired the 19,562,881 shares of common stock acquired from Shanda as part of the Exchange Agreement. These retirements reduced the number of issued shares of common stock by that same amount. Under the applicable state law, these shares resume the status of authorized and unissued shares upon retirement. Since the repurchase price was lower than the original issuance price, the excess of share repurchase price over par value was recorded to additional paid-in capital.
16.17. Employee Incentive Plans
The Company’s 2014 Equity Incentive Plan (EIP) providesequity incentive plans provide for granting awards, including RSUs, PBRSUs, cash awards and stock options to employees, officers and directors.
Common Stock Reserved for Future Issuance
As of December 31, 2020 and 2019, the Company had sharesShares of common stock reserved for future issuance was as follows:
| | | | | | | | | | | |
| December 31, | 2020 | | 2019 |
| Available for future RSU, PBRSU and stock option grants | 12,552,761 | | | 12,861,058 | |
| Unvested RSUs, PBRSUs and stock options outstanding | 14,631,526 | | | 12,323,868 | |
Available for ESPP (1) | 4,134,033 | | | 3,123,203 | |
| Total reserved for future issuance | 31,318,320 | | | 28,308,129 | |
(1) In connection with the Company’s cost structure simplification efforts, future purchases through the Company’s employee stock purchase plan (ESPP) were suspended effective upon the completion of the offering period on May 10, 2019.
Stock-based Compensation
Stock-based compensation expense was as follows for the periods presented:
| | | | | | | | | | | | | | | | | |
| Year Ended December 31, | 2020 | | 2019 | | 2018 |
| RSUs and PBRSUs | $ | 60,745 | | | $ | 70,772 | | | $ | 66,005 | |
| Stock options | 788 | | | 2,383 | | | 7,387 | |
| ESPP | 0 | | | 484 | | | 1,695 | |
| Total stock-based compensation expense | $ | 61,533 | | | $ | 73,639 | | | $ | 75,087 | |
The following table presents the Company’s stock-based compensation expense recorded in the Consolidated Statements of Operations:
| | | | | | | | | | | | | | | | | |
| Year Ended December 31, | 2020 | | 2019 | | 2018 |
| Sales and marketing | $ | 4,104 | | | $ | 6,095 | | | $ | 7,362 | |
| Origination and servicing | 2,689 | | | 3,155 | | | 4,322 | |
| Engineering and product development | 13,411 | | | 19,860 | | | 20,478 | |
| Other general and administrative | 41,329 | | | 44,529 | | | 42,925 | |
| Total stock-based compensation expense | $ | 61,533 | | | $ | 73,639 | | | $ | 75,087 | |
| | | | | | | | | | | |
| December 31, | 2023 | | 2022 |
| Available for future RSU, PBRSU and stock option grants | 22,732,012 | | | 17,473,925 | |
| Unvested RSUs, PBRSUs and stock options outstanding | 9,338,246 | | | 11,676,962 | |
| Available for ESPP | 7,484,043 | | | 6,302,187 | |
| Total reserved for future issuance | 39,554,301 | | | 35,453,074 | |
LENDINGCLUB CORPORATION
Notes to Consolidated Financial Statements
(Tabular Amounts in Thousands, Except Share and Per Share Amounts, Ratios, or as Noted)
The Company capitalized $5.1 million, $6.3 million and $9.1 million of stock-basedStock-based Compensation
Stock-based compensation expense, associated with developing softwareincluded in “Compensation and benefits” expense on the Income Statement, was as follows for internal use during the years ended December 31, 2020, 2019 and 2018, respectively.periods presented:
| | | | | | | | | | | | | | | | | |
| Year Ended December 31, | 2023 | | 2022 | | 2021 |
| RSUs and PBRSUs | $ | 61,619 | | | $ | 74,334 | | | $ | 70,935 | |
| Stock options | — | | | 46 | | | 599 | |
| Stock-based compensation expense, gross | 61,619 | | | 74,380 | | | 71,534 | |
| Less: Capitalized stock-based compensation expense | 9,230 | | | 8,018 | | | 4,383 | |
| Stock-based compensation expense, net | $ | 52,389 | | | $ | 66,362 | | | $ | 67,151 | |
Restricted Stock Units
The following table summarizes the activities for the Company’s RSUs during the year ended December 31, 2020:RSUs:
| | Number
of Units | | Weighted-
Average
Grant Date
Fair Value |
| Unvested at December 31, 2019 | 9,597,404 | | | $ | 16.78 | |
| Number
of Units | | | Number
of Units | | Weighted-
Average
Grant Date
Fair Value |
| Unvested at December 31, 2022 | |
| Granted | Granted | 11,247,846 | | | $ | 9.27 | |
| Vested | Vested | (4,139,425) | | | $ | 15.66 | |
| Forfeited/expired | Forfeited/expired | (5,310,713) | | | $ | 13.61 | |
| Unvested at December 31, 2020 | 11,395,112 | | | $ | 11.26 | |
| Unvested at December 31, 2023 | |
|
During the year ended December 31, 2020,2023, the Company granted 11,247,8467,138,085 RSUs with an aggregate fair value of $104.3$54.0 million.
As of December 31, 2020,2023, there was $120.0$59.4 million of unrecognized compensation cost related to unvested RSUs, which is expected to be recognized over the next 2.8 years.a weighted-average period of approximately 1.8 years, subject to any forfeitures.
Performance-based Restricted Stock Units
PBRSUs are restricted stock unit awards that are earned and eligible for vesting (if applicable) based upon the achievement of certain pre-established performance metrics over a specific performance period. OurThe Company’s outstanding PBRSU awards each have a separate market-based component andperformance metric with a performance-based component. Certain of ourthree-year performance period, following which any earned portion is immediately vested. For these PBRSU awards, have additional time-based vesting for any earned shares. With respect to PBRSU awards with market-based metrics, the compensation expense of the award is fixed at the time of grant (incorporating the probability of achieving the market-based metrics), not adjusted for actual performance and expensed over the performance and vesting period. With respect to PBRSU awards with performance-based metrics, the compensation expense of the award is set at the time of grant (assuming a target level of achievement), adjusted for actual performance during the performance period and expensed over the performance and vesting period.
LENDINGCLUB CORPORATION
Notes to Consolidated Financial Statements
(Tabular Amounts in Thousands, Except Share and Per Share Amounts, Ratios, or as Noted)
The following table summarizes the activities for the Company’s PBRSUs duringPBRSUs:
| | | | | | | | | | | |
| Number
of Units | | Weighted-
Average
Grant Date
Fair Value |
| Unvested at December 31, 2022 | 1,754,898 | | | $ | 11.19 | |
| Granted | 807,499 | | | $ | 7.15 | |
| Vested | (870,766) | | | $ | 4.22 | |
| Forfeited/expired | (221,818) | | | $ | 12.37 | |
| Unvested at December 31, 2023 | 1,469,813 | | | $ | 12.60 | |
| | | |
During the year ended December 31, 2020:
| | | | | | | | | | | |
| Number
of Units | | Weighted-
Average
Grant Date
Fair Value |
| Unvested at December 31, 2019 | 471,589 | | | $ | 16.94 | |
| Granted | 1,424,438 | | | $ | 4.67 | |
| Vested | (181,956) | | | $ | 17.34 | |
Forfeited/expired (1) | (272,760) | | | $ | 13.85 | |
| Unvested at December 31, 2020 | 1,441,311 | | | $ | 5.31 | |
| | | |
(1) Primarily relates to the portion of PBRSUs granted in 2019 that were unearned as a result of not achieving certain pre-established performance metrics during the performance period.
For the years ended December 31, 2020, 2019 and 2018,2023, the Company recognized $2.8 million, $3.9 million and $2.8 million in stock-based compensation expense related togranted 807,499 PBRSUs respectively.with an aggregate fair value of $5.8 million.
As of December 31, 2020,2023, there was $3.8$5.9 million of unrecognized compensation cost related to unvested PBRSUs, which is expected to be recognized over the next 2.1 years.a weighted-average period of approximately 1.4 years, subject to any forfeitures.
Stock Options
The following table summarizes the activities for the Company’s stock options during 2020:options:
| | | | | | | | | | | | | | | | | | | | | | | |
| Number of
Options | | Weighted-Average
Exercise
Price Per
Share | | Weighted-Average
Remaining
Contractual Life (in years) | | Aggregate Intrinsic Value (1) (in thousands) |
| Outstanding at December 31, 2019 | 2,254,888 | | | $ | 29.27 | | | | | |
| | | | | | | |
| Exercised | (150,473) | | | $ | 0.75 | | | | | |
| Forfeited/Expired | (309,299) | | | $ | 38.92 | | | | | |
| Outstanding at December 31, 2020 | 1,795,116 | | | $ | 29.99 | | | 3.66 | | $ | 2,882 | |
| | | | | | | |
| Exercisable at December 31, 2020 | 1,795,116 | | | $ | 29.99 | | | 3.66 | | $ | 2,882 | |
| | | | | | | | | | | | | | | | | | | | | | | |
| Number of
Options | | Weighted-Average
Exercise
Price Per
Share | | Weighted-Average
Remaining
Contractual Life (in years) | | Aggregate Intrinsic Value (1) (in thousands) |
| Outstanding at December 31, 2022 | 1,249,451 | | | $ | 37.11 | | | | | |
| | | | | | | |
| Exercised | (35,473) | | | $ | 5.30 | | | | | |
| Forfeited/Expired | (345,376) | | | $ | 35.57 | | | | | |
| Outstanding at December 31, 2023 | 868,602 | | | $ | 39.02 | | | 1.2 | | $ | 15 | |
| | | | | | | |
| Exercisable at December 31, 2023 | 868,602 | | | $ | 39.02 | | | 1.2 | | $ | 15 | |
(1) The aggregate intrinsic value is calculated as the difference between the exercise price of the underlying awards and the Company’s closing stock price of $10.56$8.74 as reported on the New York Stock Exchange on December 31, 2020.29, 2023.
The aggregate intrinsic value of options exercised was $1.8$0.1 million, $5.9$1.7 million and $1.9$5.1 million for the years ended December 31, 2020, 20192023, 2022 and 2018,2021, respectively. The total fair value of stock options vested for both the years ended December 31, 2020, 20192022 and 20182021 was $1.0 million, $2.8 million and $9.8 million, respectively.
$0.3 million. As of December 31, 2020,2022, all stock options were fully vested and there was 0no unrecognized compensation cost related to outstanding stock options.
Thereremaining. In addition, there were 0no stock options granted during the years ended December 31, 2020, 20192023, 2022 and 2018.2021.
LENDINGCLUB CORPORATION
Notes to Consolidated Financial Statements
(Tabular Amounts in Thousands, Except Share and Per Share Amounts, Ratios, or as Noted)
17.18. Income Taxes
Loss before incomeIncome tax benefit (expense) consisted of the following:
| | | | | | | | | | | | | | | | | |
| Year Ended December 31, | 2023 | | 2022 | | 2021 |
| Current: | | | | | |
| Federal | $ | (3,180) | | | $ | — | | | $ | — | |
| State | 5,060 | | | (20,812) | | | (3,541) | |
| Total current tax benefit (expense) | $ | 1,880 | | | $ | (20,812) | | | $ | (3,541) | |
| | | | | |
| Deferred: | | | | | |
| Federal | $ | (11,427) | | | $ | 121,520 | | | $ | 2,066 | |
| State | (6,131) | | | 35,940 | | | 1,611 | |
| Total deferred benefit (expense) | $ | (17,558) | | | $ | 157,460 | | | $ | 3,677 | |
| Income tax benefit (expense) | $ | (15,678) | | | $ | 136,648 | | | $ | 136 | |
Income tax expense (benefit) less income (loss) attributable to noncontrolling interests was $(187.6) million, $(30.9) million and $(128.3) million for the yearsyear ended December 31, 2020, 2019 and 2018, respectively. Income2023 was $15.7 million. The effective tax expense (benefit) consistedrate differs from the statutory rate due to the impact of state taxes, the favorable impact of recurring items such as tax credits,the unfavorable impact of the following fornon-deductible portions of executive compensation and stock-based compensation, and the periods shown below:
| | | | | | | | | | | | | | | | | |
| Year Ended December 31, | 2020 | | 2019 | | 2018 |
| Current: | | | | | |
| Federal | $ | (1) | | | $ | (141) | | | $ | (57) | |
| State | (78) | | | (60) | | | 100 | |
| Total current tax expense (benefit) | $ | (79) | | | $ | (201) | | | $ | 43 | |
| | | | | |
| Deferred: | | | | | |
| Federal | $ | 0 | | | $ | 0 | | | $ | 0 | |
| State | 0 | | | 0 | | | 0 | |
| Total deferred tax expense (benefit) | $ | 0 | | | $ | 0 | | | $ | 0 | |
| Income tax expense (benefit) | $ | (79) | | | $ | (201) | | | $ | 43 | |
change in unrecognized tax benefits. Income tax benefit for the year ended December 31, 20202022 was $136.6 million, primarily due to the release of a $175.6 million valuation allowance against the Company’s deferred tax assets, of which $143.5 million was primarily attributable to current state income taxes.based on the Company’s reassessment of the future realizability of its deferred tax assets. Income tax benefit for the year ended December 31, 20192021 was $136 thousand, primarily attributablerelated to thea tax effects of unrealized gains recorded to other comprehensive incomebenefit associated with the Company’s available for sale portfolio. IncomeAcquisition, partially offset by income tax expense for the year ended December 31, 2018 was primarily attributable to current state income taxes, partially offset by the tax effects of unrealized gains recorded to other comprehensive income associated with the Company’s available for sale portfolio.jurisdictions that limit net operating loss carryforward utilization.
AThe table below presents a reconciliation of the income taxes expectedtax benefit (expense) at the statutory federal income tax rate andto the income tax expense (benefit) forbenefit (expense) at the years ended December 31, 2020, 2019 and 2018, is as follows:effective income tax rate:
| | Year Ended December 31, | Year Ended December 31, | 2020 | | 2019 | | 2018 |
| Tax at federal statutory rate | $ | (39,399) | | | $ | (6,499) | | | $ | (26,936) | | |
| Year Ended December 31, | |
| Year Ended December 31, | |
| Statutory federal tax expense | |
| Statutory federal tax expense | |
| Statutory federal tax expense | |
| State tax, net of federal tax benefit | State tax, net of federal tax benefit | (81) | | | (60) | | | 100 | | |
| Stock-based compensation expense | 8,044 | | | 4,773 | | | 6,559 | | |
| State tax, net of federal tax benefit | |
| State tax, net of federal tax benefit | |
| Stock-based compensation tax benefit (expense) | |
| Stock-based compensation tax benefit (expense) | |
| Stock-based compensation tax benefit (expense) | |
| Research and development tax credits | |
| Research and development tax credits | |
| Research and development tax credits | Research and development tax credits | (994) | | | (2,336) | | | (7,839) | | |
| Change in valuation allowance | Change in valuation allowance | 29,728 | | | (802) | | | 19,140 | | |
| Change in valuation allowance | |
| Change in valuation allowance | |
| Change in unrecognized tax benefit | |
| Change in unrecognized tax benefit | |
| Change in unrecognized tax benefit | Change in unrecognized tax benefit | 497 | | | 1,168 | | | 3,920 | | |
| | Non-deductible expenses | Non-deductible expenses | 2,278 | | | 3,250 | | | 5,143 | | |
| | Non-deductible expenses | |
| | Non-deductible expenses | |
| Other | Other | (152) | | | 305 | | | (44) | | |
| Income tax expense (benefit) | $ | (79) | | | $ | (201) | | | $ | 43 | | |
| Other | |
| Other | |
| Income tax benefit (expense) | |
| Income tax benefit (expense) | |
| Income tax benefit (expense) | |
| |
LENDINGCLUB CORPORATION
Notes to Consolidated Financial Statements
(Tabular Amounts in Thousands, Except Share and Per Share Amounts, Ratios, or as Noted)
The significant components of the Company’s net deferred tax assets and liabilitiesasset were as of December 31, 2020 and 2019 were:follows:
| | December 31, | December 31, | 2020 | | 2019 | December 31, | 2023 | | 2022 |
| Deferred tax assets: | Deferred tax assets: | |
| Net operating loss carryforwards | Net operating loss carryforwards | $ | 163,381 | | | $ | 118,090 | |
| Net operating loss carryforwards | |
| Net operating loss carryforwards | |
| Allowance for loan and lease losses | |
| Stock-based compensation | Stock-based compensation | 10,218 | | | 11,480 | |
| Unrealized loss on AFS securities | |
| Deferred compensation | |
| Reserves and accruals | Reserves and accruals | 15,652 | | | 23,008 | |
| Operating lease liabilities | Operating lease liabilities | 28,032 | | | 33,824 | |
| Goodwill | Goodwill | 17,375 | | | 19,818 | |
| Intangible assets | 3,151 | | | 3,074 | |
| | Tax credit carryforwards | |
| Tax credit carryforwards | |
| Tax credit carryforwards | Tax credit carryforwards | 18,215 | | | 16,679 | |
| Other | Other | 868 | | | 498 | |
| Gross deferred tax assets | |
| Valuation allowance | |
| Total deferred tax assets | Total deferred tax assets | 256,892 | | | 226,471 | |
| Valuation allowance | (211,228) | | | (169,526) | |
| Deferred tax assets – net of valuation allowance | $ | 45,664 | | | $ | 56,945 | |
| | Deferred tax liabilities: | Deferred tax liabilities: | |
| Deferred tax liabilities: | |
| Deferred tax liabilities: | |
| Internally developed software | Internally developed software | $ | (16,956) | | | $ | (20,225) | |
| Servicing fees | (2,780) | | | (4,389) | |
| Internally developed software | |
| Internally developed software | |
| Servicing assets | |
| | Operating lease assets | Operating lease assets | (22,048) | | | (28,224) | |
| Change in tax method | (1,769) | | | (3,988) | |
| Operating lease assets | |
| Operating lease assets | |
| Leases | |
| | Other | |
| | Other | |
| | Other | Other | (2,111) | | | (119) | |
| Total deferred tax liabilities | Total deferred tax liabilities | $ | (45,664) | | | $ | (56,945) | |
| Deferred tax asset (liability) – net | $ | 0 | | | $ | 0 | |
| Deferred tax assets, net | |
TheIn 2022, the Company continues to recognize a full valuation allowance againstevaluated both positive and negative evidence when assessing the recoverability of its net deferred tax assets. This determination was based onSeveral factors were considered, which primarily included the assessmentCompany’s business model transition and resulting increase in profitability and the expectation of continued profitability. These factors resulted in the release of the available positive and negative evidence to estimate if sufficient future taxable income will be generated to utilizemajority of the existingCompany’s valuation allowance against its deferred tax assets.assets during 2022. As of December 31, 2020 and 2019,2023, the Company maintained a valuation allowance was $211.2of $46.1 million solely related to certain state net operating loss carryforwards (NOLs) and $169.5 million, respectively.state tax credit carryforwards.
As of December 31, 2020,2023, the Company had federal and state net operating loss (NOL) carryforwardsNOLs (prior to the application of statutory tax rates) of approximately $551.5$88.8 million and $642.2$534.5 million, respectively. Federal and state NOLs of approximately $88.8 million and $28.9 million, respectively, to offset future taxable income. The federal and majority ofcarry forward indefinitely while the remaining state NOL carryforwardsNOLs primarily start expiring in 2026 and 2028, respectively. Federal and2030. The carryforwards, net of the valuation allowance for certain state NOL carryforwards generated after 2017 carryforward indefinitely.states, are expected to be fully utilized prior to expiration. Additionally, as of December 31, 2020,2023, the Company had federal and state research and development credit carryforwards of $17.3$31.8 million and $18.6$24.9 million, respectively. The federal research credit carryforwards will expire beginning in 20262036 and the state research credits may be carried forward indefinitely. As of December 31, 2020, the Company also had other state tax credit carryforwards of $2.2 million, which will expire beginning in 2021.
In general, a corporation’s ability to utilize its NOL and research and development credit carryforwards may be substantially limited due to the ownership change limitations as required by Section 382 and 383 of the Internal Revenue Code of 1986, as amended (Code), as well as similar state provisions. The federal and state Section 382 and 383 limitations may limit the use of a portion of the Company’s domestic NOL and tax credit carryforwards. Further, a portion of the carryforwards may expire before being applied to reduce future income tax liabilities.
LENDINGCLUB CORPORATION
Notes to Consolidated Financial Statements
(Tabular Amounts in Thousands, Except Share and Per Share Amounts, Ratios, or as Noted)
A reconciliation of the beginning and ending balance of total unrecognized tax benefits for the years ended December 31, 2020, 2019 and 2018, iswas as follows:
| | Year Ended December 31, | Year Ended December 31, | 2020 | | 2019 | | 2018 | Year Ended December 31, | 2023 | | 2022 | | 2021 |
| Beginning balance | Beginning balance | $ | 15,998 | | | $ | 13,377 | | | $ | 7,784 | |
| Gross increase for tax positions related to prior years | Gross increase for tax positions related to prior years | 0 | | | 0 | | | 2,744 | |
| Gross increase for tax positions related to the current year | Gross increase for tax positions related to the current year | 1,628 | | | 2,621 | | | 2,849 | |
| Ending balance | Ending balance | $ | 17,626 | | | $ | 15,998 | | | $ | 13,377 | |
If the unrecognized tax benefit asAs of December 31, 2020 is2023, $19.5 million of unrecognized tax benefits, if recognized, there will be no effect onwould impact the Company’s effective tax rate as the tax benefit would increase a deferred tax asset, which is currently offset with a full valuation allowance. As of December 31, 2020, therate. The Company had noapproximately $0.4 million and $0.2 million accrued for the payment of interest and penalties related to unrecognized tax benefits.benefits as of December 31, 2023 and 2022, respectively. The Company does not expect any significant increases or decreases to its unrecognized benefits within the next twelve months.
The Company files income tax returns in the United States and various state jurisdictions. As of December 31, 2020,2023, the Company’s federal tax returns for 20162019 and earlier, and the state tax returns for 20152018 and earlier were no longer subject to examination by the taxing authorities. However, tax periods closed in a prior period may be subject to audit and re-examination by tax authorities for which tax carryforwards are utilized in subsequent years.
18.19. Leases
Lessor Arrangements
The Company has operatinglessor arrangements which consist of sales-type leases for its headquarters in San Francisco, California, as well as additional office space for its origination and servicing operations inequipment (Equipment Finance). Such arrangements may include options to renew or to purchase the Salt Lake City area, Utah, and Westborough, Massachusetts. As of December 31, 2020,leased equipment at the lease agreements have remaining lease terms ranging from approximately one year to eight years. Someend of the lease agreements include options to extendterm. For the lease term for up to an additional fifteen years. In addition, the Company is the sublessor of a portion of its office space in San Francisco, with lease terms of one year to two years. As ofyears ended December 31, 2020,2023, 2022 and 2021, interest earned on Equipment Finance was $8.9 million, $10.2 million and $10.8 million, respectively, and is included in “Interest and fees on loans and leases held for investment” on the Company pledged $0.8 million of cash and $5.5 million in letters of credit as security deposits in connection with its lease agreements.Income Statement.
The Company entered into lease amendments during the second quartercomponents of 2020 due to COVID-19. The Company elected to remeasure the lease liability using the original discount rate with an adjustment to the ROU asset by the amount of the remeasurement. This accounting policy election did not have a material impact to the Company’s financial position, results of operations, cash flows, or disclosures.
The Company reviewed operating lease ROUEquipment Finance assets for impairment. In June 2020, the Company terminated 1 of its operating leases resulting in a reduction in the operating lease liability of $6.1 million and a corresponding reduction in the operating lease asset of $5.3 million. For the year ending December 31, 2020, the Company recognized impairment expense of $3.6 million, net, for several of its operating lease assets, included in “Other general and administrative expense” on the Company’s Consolidated Statement of Operations. NaN impairment expense was recorded during the year ended December 31, 2019.
Balance sheet information as of December 31, 2020 and 2019 related to leases wasare as follows:
| | | | | | | | | | |
| ROU Assets and Lease Liabilities | December 31, 2020 | December 31, 2019 | | |
| Operating lease assets | $ | 74,037 | | $ | 93,485 | | | |
Operating lease liabilities (1) | $ | 94,538 | | $ | 112,344 | | | |
(1) The difference between operating lease assets and operating lease liabilities is the unamortized balance of deferred rent. | | | | | | | | | | | | | |
| December 31, | 2023 | | 2022 | | |
| Lease receivables | $ | 92,546 | | | $ | 137,969 | | | |
| Unguaranteed residual asset values | 28,913 | | | 39,262 | | | |
| Unearned income | (11,072) | | | (17,786) | | | |
| Deferred fees | 605 | | | 874 | | | |
| Total | $ | 110,992 | | | $ | 160,319 | | | |
LENDINGCLUB CORPORATION
Notes to Consolidated Financial Statements
(Tabular Amounts in Thousands, Except Share and Per Share Amounts, Ratios, or as Noted)
Future minimum lease payments based on maturity of the Company’s lessor arrangements as of December 31, 2023 were as follows:
| | | | | |
| 2024 | $ | 38,583 | |
| 2025 | 27,289 | |
| 2026 | 16,411 | |
| 2027 | 7,845 | |
| 2028 | 4,053 | |
| Thereafter | 1,545 | |
| Total lease payments | $ | 95,726 | |
| Discount effect | (3,180) | |
| Present value of future minimum lease payments | $ | 92,546 | |
Lessee Arrangements
The Company has various operating leases, including with respect to its headquarters in San Francisco, California, and office spaces in the Salt Lake City, Utah, and Boston, Massachusetts areas. As of December 31, 2023, the lease agreements have remaining lease terms ranging from approximately two years to five years. Some of the lease agreements include options to extend the lease term for up to an additional fifteen years. As of December 31, 2023, the Company pledged $0.4 million of cash and $1.1 million in letters of credit as security deposits in connection with its lease agreements.
Balance sheet information related to leases was as follows:
| | | | | | | | | | | | | |
| ROU Assets and Lease Liabilities | Balance Sheet Classification | December 31, 2023 | December 31, 2022 | | |
| Operating lease assets | Other assets | $ | 26,611 | | $ | 63,872 | | | |
| Operating lease liabilities | Other liabilities | $ | 37,869 | | $ | 77,291 | | | |
Components of net lease costs for the years ended December 31, 2020, 2019 and 2018, were as follows:
| | | | | | | | | | | | | | | | | | | | |
| Year Ended December 31, |
| Net Lease Costs | Income Statement Classification | 2020 | | 2019 | | 2018 |
Operating lease costs (1) | Other general and administrative expense | $ | (17,346) | | $ | (19,502) | | $ | (17,183) |
| Sublease revenue | Other revenue | 6,146 | | | 4,637 | | | 397 | |
| Net lease costs | | $ | (11,200) | | | $ | (14,865) | | | $ | (16,786) | |
(1) Includes variable lease costs of $1.5 million, $1.6 million and $0.6 million for the years ended December 31, 2020, 2019 and 2018, respectively. | | | | | | | | | | | | | | | | | | | | |
| Year Ended December 31, |
| Net Lease Costs | Income Statement Classification | 2023 | | 2022 | | 2021 |
| Operating lease costs | Occupancy | $ | (11,963) | | | $ | (15,189) | | | $ | (18,773) | |
| Sublease revenue | Other non-interest income | — | | | 2,847 | | | 6,149 | |
| Net lease costs | | $ | (11,963) | | | $ | (12,342) | | | $ | (12,624) | |
Supplemental cash flow information related to the Company’s operating leases for the year ended December 31, 2020 was as follows:
| | Year Ended December 31, | Year Ended December 31, | 2020 | 2019 | |
| Year Ended December 31, | |
| Year Ended December 31, | |
| Non-cash operating activity: | Non-cash operating activity: | | |
Leased assets obtained in exchange for new and amended operating lease liabilities (1) | $ | 84 | | $ | 15,277 | | |
| Non-cash operating activity: | |
| Non-cash operating activity: | |
Leased assets obtained or adjusted in exchange for new, amended, and modified operating lease liabilities (1) | |
Leased assets obtained or adjusted in exchange for new, amended, and modified operating lease liabilities (1) | |
Leased assets obtained or adjusted in exchange for new, amended, and modified operating lease liabilities (1) | |
(1) Represents non-cash activity and, accordingly, is not reflected in the Consolidated Statements of Cash Flows. Amount includesAmounts include noncash remeasurements of the operating lease right-of-useROU asset.
LENDINGCLUB CORPORATION
Notes to Consolidated Financial Statements
(Tabular Amounts in Thousands, Except Share and Per Share Amounts, Ratios, or as Noted)
The Company’s future minimum undiscounted lease payments under operating leases and anticipated sublease revenue as of December 31, 20202023 were as follows:
| | | | | | | | | | | | | | | | | |
| Operating Lease
Payments | | Sublease
Revenue | | Net |
| 2021 | $ | 19,271 | | | $ | (6,767) | | | $ | 12,504 | |
| 2022 | 14,134 | | | (2,918) | | | 11,216 | |
| 2023 | 10,761 | | | 0 | | | 10,761 | |
| 2024 | 11,072 | | | 0 | | | 11,072 | |
| 2025 | 11,393 | | | 0 | | | 11,393 | |
| Thereafter | 56,990 | | | 0 | | | 56,990 | |
Total lease payments (1) | $ | 123,621 | | | $ | (9,685) | | | $ | 113,936 | |
| Discount effect | 29,083 | | | | | |
| Present value of future minimum lease payments | $ | 94,538 | | | | | |
(1) As of December 31, 2020, the Company entered into an additional operating lease which had not yet commenced and is therefore not part of the table above nor included in the lease right-of-use asset and liability. This lease commenced when the Company obtained possession of the underlying asset, which was on January 1, 2021. The lease term is 8.25 years and has an undiscounted future rent payment of approximately $8.6 million. | | | | | | | | | |
| Operating Lease
Payments | | | | |
| 2024 | $ | 12,798 | | | | | |
| 2025 | 13,129 | | | | | |
| 2026 | 7,228 | | | | | |
| 2027 | 4,265 | | | | | |
| 2028 | 3,922 | | | | | |
| Thereafter | 909 | | | | | |
| Total lease payments | $ | 42,251 | | | | | |
| Discount effect | 4,382 | | | | | |
| Present value of future minimum lease payments | $ | 37,869 | | | | | |
The weighted-average remaining lease term and discount rate used in the calculation of the Company’s operating lease assets and liabilities were as follows:
| | | | | | | | | |
| Lease Term and Discount Rate | December 31, 20202023 | | | | |
| Weighted-average remaining lease term (in years) | 8.963.72 | | | | |
| Weighted-average discount rate | 5.765.04 | % | | | | |
LENDINGCLUB CORPORATION
Notes to Consolidated Financial Statements
(Tabular Amounts in Thousands, Except Share and Per Share Amounts, Ratios, or as Noted)
19.20. Commitments and Contingencies
Operating Lease Commitments
For discussion regarding the Company’s operating lease commitments, see “Note 18.19. Leases.”
Loan Purchase Obligation
Under the Company’s loan account program with WebBank, which served as the Company’s primary issuing bank for loans facilitated through the Company’s platform, WebBank retained ownership of the loans it originated for 2 business days after origination. As part of this arrangement, the Company is committed to purchase any loans that have been fully approved at par plus accrued interest, at the conclusion of the two business days. As of December 31, 2020 and 2019, the Company was committed to purchase loans with an outstanding principal balance of $13.8 million and $91.3 million at par, respectively.
Loan Repurchase Obligations
The Company is generally required to repurchase loans or interests therein in the event of identity theft or certain other types of fraud on the part of the borrower or education and patient service providers. The Company may also repurchase loans or interests therein in connection with certain customer accommodations. In connection with certain whole loan and Certificate Program sales, as well as to facilitate access to securitization markets, the Company has agreed to repurchase loans if representations and warranties made with respect to such loans arewere breached under certain circumstances. In the case of certain securitization transactions, the Company has also agreed to repurchase or substitute loans for which a borrower fails to make the first payment due under a loan. The Company believes such provisions are customary and consistent with institutional loan and securitization market standards.
In addition to and distinct from the repurchase obligations described in the preceding paragraph, the Company performs certain administrative functions for a variety of retail and institutional investors, including executing, without discretion, loan investments as directed by the investor. To the extent loans do not meet the investor’s investment criteria at the time of issuance, or are transferred to the investor as a result of a system error by the Company, the Company repurchases such loans or interests therein at par.
As a result of the loan repurchase obligations described above, the Company repurchased $3.3 million, $5.5 million and $4.0 million in loans or interests therein during 2020, 2019 and 2018 respectively.
PurchaseUnfunded Loan Commitments
As required by applicable regulations,of December 31, 2023 and 2022, the Company must make firm offerscontractual amount of credit with respect to prescreened direct mail it sends out to prospective applicants provided such applicants continue to meet the credit worthiness criteria which were used to screen themunfunded loan commitments was $78.1 million and $138.0 million, respectively. See “Note 6. Loans and Leases Held for Investment at the timeAmortized Cost, Net of their applicationAllowance For Loan and the application is completed priorLease Losses” for additional detail related to the offer’s stated expiration date. If such loans are accepted by the applicants but not otherwise funded by investors on the platform, the Company is required to facilitate fundingreserve for the loans directly with its issuing bank partners at minimum amounts, which are generally below the requested loan amount. The Company was required to purchase approximately $1.1 million of such loans during 2020. During the month of January 2021, $0.1 million of these loans were required to be purchased by the Company.unfunded lending commitments.
Legal
The Company is subject to various claims brought in a litigation or regulatory context. These matters include lawsuits, including but not limited to, putative class action lawsuits and routine litigation matters arising in the ordinary course of business. In addition, if the Company, could not arrange forand its business practices and compliance with licensing and other investorsregulatory requirements, is subject to invest inperiodic exams, investigations, inquiries or purchase loans that the Company facilitated and that were originated by an issuing bank partner but did not meet the credit criteria for purchase by the issuing bank partner, the Company was contractually committed to purchase those loans. As of both December 31, 2020 and 2019, the Company had a $9.0 million deposit in a bank account to secure potential future purchases ofrequests, enforcement
LENDINGCLUB CORPORATION
Notes to Consolidated Financial Statements
(Tabular Amounts in Thousands, Except Share and Per Share Amounts, Ratios, or as Noted)
these loans, if necessary. The funds are recorded as restricted cash onactions and other proceedings from federal and state regulatory and/or law enforcement agencies, including from the Company’s Consolidated Balance Sheets. During the year ended December 31, 2020,federal banking regulators that directly regulate the Company was required to purchase $36.1 million of loans facilitated by the Company and/or Springstone Financial, LLC (a previously held wholly-owned subsidiary of LendingClub). These purchased loans are held on the Company’s Consolidated Balance Sheets and have a fair value of $4.5 million and $45.7 million as of December 31, 2020 and 2019, respectively.
Acquisition-related Commitments
In connection with the Company’s acquisition of Radius, the Company entered into acquisition-related agreements that provide for the payment of certain contingent fees estimated at approximately $3 million as of December 31, 2020, due upon closing of the transaction. See “Note 23. Subsequent Events” for further information.
Legal
The Company is subject to various claims brought in a litigation or regulatory context. These matters include lawsuits and federal regulatory litigation, including but not limited to putative class action lawsuits, derivative lawsuits, and litigation with the FTC. In addition, the Company is subject to federal or state regulatory examinations, investigations, or actions relating to the Company’s business practices or licensing. It is also party to a number of routine litigation matters arising in the ordinary course of business.LC Bank. The majority of these claims and proceedings relate to or arise from alleged state or federal law and regulatory violations, or are alleged commercial disputes or consumer complaints. The Company accrues for costs related to contingencies when a loss from such claims is probable and the amount of loss can be reasonably estimated. In determining whether a loss from a claim is probable and the loss can be reasonably estimated, the Company reviews and evaluates its litigation and regulatory matters on at least a quarterly basis in light of potentially relevant factual and legal developments. If the Company determines an unfavorable outcome is not probable or the amount of loss cannot be reasonably estimated, the Company does not accrue for a potential litigation loss. In those situations, the Company discloses an estimate or range of the reasonably possible losses, if such estimates can be made. Except as otherwise specifically noted below, at this time, the Company does not believe that it is possible to estimate the reasonably possible losses or a range of reasonably possible losses related to the matters described below.
FTC LawsuitRegulatory Examinations and Actions Relating to the Company’s Business Practices, Licensing and Compliance with Applicable Laws
The Company is and has been subject to periodic inquiries, exams and enforcement actions brought by federal and state regulatory agencies relating to the Company’s business practices, the required licenses to operate its business, and operating in compliance with applicable laws, including the requirements of its licenses and the regulatory framework applicable to its business.
In 2016,the past, the Company receivedhas successfully resolved such matters in a formal request for information from the Federal Trade Commission (FTC). The FTC commenced an investigation concerning certainmanner that was not material to its results of financial operations in any period and that did not materially limit the Company’s policies and practices and related legal compliance.
On April 25, 2018, the FTC filed a complaint in the Northern District of California (FTC v. LendingClub Corporation, No. 3:18-cv-02454) alleging causes of action for violations of the FTC Act, including claims of deception in connection with disclosures relatedability to the origination fee associated with loans available through the Company’s platform, and in connection with communications relating to the likelihood of loan approval during the application process, and a claim of unfairness relating to certain unauthorized charges to borrowers’ bank accounts. The FTC’s complaint also alleged a violation of the Gramm-Leach-Bliley Act regarding the Company’s practices in deliveringconduct its privacy notice. Following the Court’s ruling on a motion to dismiss filed by the Company, the FTC filed an amended complaint on October 22, 2018, which reasserted the same causes of action from the original complaint. On November 13, 2018, the Company filed an answer to the amended complaint. Following a motion by the FTC to strike certain affirmative defenses in the answer, the Company filed an amended answer in the case on May 29, 2019. The discovery period in the case is closed.
On February 27, 2020, both the Company and the FTC filed various motions with the Court, including motions to exclude expert testimony and motions for summary judgment as to some or all of the claims in the case. The FTC also filed a motion for partial judgment on the pleadings in the case. These motions were heard by the Court on
LENDINGCLUB CORPORATION
Notes to Consolidated Financial Statements
(Tabular Amounts in Thousands, Except Share and Per Share Amounts, Ratios, or as Noted)
April 27, 2020. On June 1, 2020, the Court issued an order granting in part and denying in part both the Company’s and the FTC’s motions for summary judgment. The Court also denied the motions to exclude expert testimony and granted in part and denied in part the FTC’s motion for partial judgment on the pleadings. The FTC’s Gramm-Leach-Bliley Act claim has been dismissed from the case, but issues relating to the FTC’s three other claims will need to be tried. On July 30, 2020, the Company filed a motion to stay the litigation pending the U.S. Supreme Court’s decisions in two cases (F.T.C. v. Credit Bureau Center and AMG Capital Management, LLC v. F.T.C.) that raise the issue whether the FTC is entitled to seek monetary relief under Section 13(b) of the FTC Act. On August 20, 2020, the Court issued an order granting the Company’s motion to stay proceedings in the case until the U.S. Supreme Court issues its decision in the Credit Bureau Center and AMG Capital Management cases. As a result of this order, the trial that was scheduled for October 19, 2020 will need to be rescheduled at a later date following the Supreme Court’s ruling. The Supreme Court has vacated its prior grant of review in the Credit Bureau Center case but heard oral argument in the AMG Capital Management case on January 13, 2021. The exact timing of a ruling by the Supreme Court in that case is uncertain but is anticipated to be issuedbusiness. However, no later than June 2021. The impact of the Supreme Court decision could impact our case which is why the trial was stayed pending the Supreme Court decision. The Company denies, and will continue to vigorously defend against, the claims remaining in this case. Notwithstanding the Company’s vigorous defense, the Company and the FTC have participated in voluntary settlement conferences and may engage in additional settlement discussions. No assurances can be given as to the timing, outcome or consequences of this matter.these matters or other similar matters if or as they arise.
Class Action Lawsuits Following Announcement of FTC Litigation
21. Regulatory Requirements
In May 2018, followingLendingClub and LC Bank are subject to comprehensive supervision, examination and enforcement, and regulation by the announcementFRB and the Office of the FTC’s litigation against the Company, putative shareholder class action litigation was filed in the U.S. District CourtComptroller of the Northern DistrictCurrency (OCC), including generally similar capital adequacy requirements adopted by the FRB and the OCC, respectively. These requirements establish required minimum ratios for Common Equity Tier 1 (CET1) risk-based capital, Tier 1 risk-based capital, total risk-based capital and a Tier 1 leverage ratio; set risk-weighting for assets and certain other items for purposes of California (the risk-based capital ratios; and define what qualifies as capital for purposes of meeting the capital requirements. Failure to meet minimum capital requirements can result in certain mandatory and possibly additional discretionary actions by regulators that, if undertaken, could have a direct material effect on the Company.
Veal v. LendingClub Corporation et.al.
The minimum capital requirements under the Basel Committee on Banking Supervision standardized approach for U.S. banking organizations (Basel III) capital framework are: a CET1 risk-based capital ratio of 4.5%, No. 5:18-cv-02599) againsta Tier 1 risk-based capital ratio of 6.0%, a total risk-based capital ratio of 8.0%, and a Tier 1 leverage ratio of 4.0%. Additionally, a Capital Conservation Buffer (CCB) of 2.5% must be maintained above the minimum risk-based capital requirements in order to avoid certain limitations on capital distributions, stock repurchases, and certain discretionary bonus payments. In addition to these guidelines, the regulators assess any particular institution’s capital adequacy based on numerous factors and may require a particular banking organization to maintain capital at levels higher than the generally applicable minimums prescribed under the Basel III capital framework. In this regard, and unless otherwise directed by the FRB and the OCC, the Company and certainLC Bank made commitments (until February 2024) to maintain a CET1 risk-based capital ratio of its current11.0%, a Tier 1 risk-based capital ratio above 11.0%, a total risk-based capital ratio above 13.0%, and former officers and directors alleging violationsa Tier 1 leverage ratio of federal securities laws in connection11.0%. On February 2, 2024, the Operating Agreement with the Company’s description of feesOCC expired and compliance with federal privacy law in securities filings. On January 7, 2019, the lead plaintiffs filed a consolidated amended class action complaint which asserts the same causes of action as the original complaintLC Bank and adds additional allegations. That complaint was subsequently dismissed by the Court with leave to amend. Plaintiff filed a Second Amended Complaint on December 19, 2019, which modified and added certain allegations and dropped one of the former officer defendants as a defendant in the case, but otherwise advanced the same causes of action. On June 12, 2020, the Court issued an order granting a motion to dismiss by defendants without leave to amend, in part, and with leave to amend, in part. On July 27, 2020, the lead plaintiffs filed a notice with the Court indicating their intention not to file a Third Amended Complaint in this case and requesting that the Court enter judgment. The Court entered judgment and dismissed all claims in the case the same day. The lead plaintiffs have appealed the judgment to the U.S. Court of Appeals for the Ninth Circuit. The timing of a ruling in the appeal is uncertain. The Company denies and will vigorously defend against the allegations in the case. No assurances can be given as to the timing, outcome or consequences of this matter.
In July 2019, a putative class action lawsuit was filed against the Company in federal court in the State of New York (Shron v. LendingClub Corp., 1:19-cv-06718) alleging various claims including fraud, unjust enrichment, breach of contract, and violations of the federal Truth-in-Lending Act and New York General Business Law sections 349 and 350, et seq., based on allegations, among others, that the Company made misleading or inadequate statements or omissions in relationare no longer subject to the total cost and origination fee associated with loans available through the Company’s platform. The plaintiff sought to represent classes of similarly situated individuals in the lawsuit. The Company filed a motion to compel arbitration of plaintiff’s claims on an individual basis. The Court denied that motion on July 13, 2020. The Company filed a notice of appeal with respect to the Court’s decision. The parties have finalized a settlement to resolve this litigation, the terms of which are not material to the Company’s financial position or results of operations, the Court has vacated its prior order denying the Company’s motion to compel arbitration, and the case has been dismissed with prejudice.these ratio commitments.
LENDINGCLUB CORPORATION
Notes to Consolidated Financial Statements
(Tabular Amounts in Thousands, Except Share and Per Share Amounts, Ratios, or as Noted)
Derivative Litigation Following FTC LawsuitThe following table summarizes the Company’s and LC Bank’s regulatory capital amounts (in millions) and ratios:
| | | | | | | | | | | | | | | | | | | | | | | | | | | | | | | |
| December 31, 2023 | | December 31, 2022 | | Required Minimum plus Required CCB for Non-Leverage Ratios | | |
| Amount | | Ratio | | Amount | | Ratio | | |
| LendingClub Corporation: | | | | | | | | | | | |
CET1 capital (1) | $ | 1,090.2 | | | 17.9 | % | | $ | 1,005.8 | | | 15.8 | % | | 7.0 | % | | |
| Tier 1 capital | $ | 1,090.2 | | | 17.9 | % | | $ | 1,005.8 | | | 15.8 | % | | 8.5 | % | | |
| Total capital | $ | 1,169.2 | | | 19.2 | % | | $ | 1,088.1 | | | 17.1 | % | | 10.5 | % | | |
| Tier 1 leverage | $ | 1,090.2 | | | 12.9 | % | | $ | 1,005.8 | | | 14.1 | % | | 4.0 | % | | |
| Risk-weighted assets | $ | 6,104.5 | | | N/A | | $ | 6,360.7 | | | N/A | | N/A | | |
| Quarterly adjusted average assets | $ | 8,476.1 | | | N/A | | $ | 7,119.0 | | | N/A | | N/A | | |
| | | | | | | | | | | |
| LendingClub Bank: | | | | | | | | | | | |
CET1 capital (1) | $ | 949.4 | | | 15.8 | % | | $ | 852.2 | | | 13.8 | % | | 7.0 | % | | |
| Tier 1 capital | $ | 949.4 | | | 15.8 | % | | $ | 852.2 | | | 13.8 | % | | 8.5 | % | | |
| Total capital | $ | 1,027.4 | | | 17.1 | % | | $ | 932.4 | | | 15.1 | % | | 10.5 | % | | |
| Tier 1 leverage | $ | 949.4 | | | 11.4 | % | | $ | 852.2 | | | 12.5 | % | | 4.0 | % | | |
| Risk-weighted assets | $ | 6,022.2 | | | N/A | | $ | 6,194.0 | | | N/A | | N/A | | |
| Quarterly adjusted average assets | $ | 8,337.4 | | | N/A | | $ | 6,795.2 | | | N/A | | N/A | | |
N/A – Not applicable
In August 2019, a putative shareholder derivative action was filedConsists of common stockholders’ equity as defined under U.S. GAAP and certain adjustments made in accordance with regulatory capital guidelines, including the Court of Chancery for the State of Delaware (Fisher v. Sanborn, et al., Case No. 2019-0631) against certainaddition of the Company’s currentCECL transitional benefit and former officersdeductions for goodwill and directors and naming the Company as a nominal defendant. This lawsuit accuses the individual defendants of breaching their fiduciary duties by failing to adequately monitor the Company and prevent it from engaging in the purported regulatory violations alleged by the FTC and by causing the Company to make allegedly false and misleading public statements (as alleged in the other intangible assets.Veal action). The lawsuit also alleges that certain of the individual defendants breached their fiduciary duties by selling Company shares while in possession of material, non-public information. The defendants have filed a motion to dismiss the operative complaint in the case, which was heard by the Court on July 2, 2020. It is unclear when the Court will issue a ruling on the motion. No assurances can be given as to the timing, outcome or consequences of this matter.
Regulatory Investigation by the State of Massachusetts
In June 2018,response to the Company receivedCOVID-19 pandemic, the FRB, OCC, and FDIC adopted a civil investigative demand from the office of the Attorney General of the State of Massachusetts. The investigationfinal rule related to the advertisement, provision and servicingregulatory capital treatment of personal loans to Massachusetts’ consumers facilitatedthe allowance for credit losses under CECL. As permitted by the rule, the Company includingelected to delay the Company’s compliance with the Massachusetts Small Loan Law and the Small Loan Rate Order promulgated under it. The Company cooperated with the investigation and finalized an Assuranceestimated impact of DiscontinuanceCECL on regulatory capital resulting in a CET1 capital benefit of $35 million at December 31, 2021. This benefit is phased out over a three-year transition period that commenced on January 2020 with the Attorney General’s Office to resolve the investigation, the terms1, 2022 at a rate of which are not material to the Company’s financial position or results of operations.
In December 2019, the Massachusetts Division of Banks raised concerns pertaining to the Company’s compliance with the Massachusetts Small Loan Law similar to those the Massachusetts Attorney General’s Office raised during its investigation of the Company. The Company has agreed to resolve the Division’s concerns on terms that are not material to the Company’s financial position or results of operations.
Regulatory Examinations and Actions Relating to the Company’s Business Practices and Licensing25% each year through January 1, 2025.
The Company has been subjectFederal Deposit Insurance Act provides for a system of “prompt corrective action” (PCA). The PCA regime provides for capitalization categories ranging from “well-capitalized” to periodic inquiries“critically undercapitalized.” An institution’s PCA category is determined primarily by its regulatory capital ratios. The PCA requires remedial actions and enforcement actions brought by federalimposes limitations that become increasingly stringent as its PCA capitalization category declines, including the ability to accept and/or rollover brokered deposits. At December 31, 2023 and state regulatory agencies relating to2022, the Company’s business practices,and LC Bank’s regulatory capital ratios exceeded the thresholds required licenses to operate its business,be regarded as well-capitalized institutions and its manner of operating in accordance with themet all capital adequacy requirements of its licenses. In the past, the Company has successfully resolved inquiries in a mannerto which they are subject. There have been no events or conditions since December 31, 2023 that was not material to its results of financial operations in any period and that did not materially limitmanagement believes would change the Company’s ability to conduct its business.categorization.
The Company is routinely subject to examination for compliance with applicableFederal laws and regulations inlimit the states in which it is licensed. Asdividends that a national bank may pay. Dividends that may be paid by a national bank without the express approval of the OCC are limited to that bank’s retained net profits for the preceding two calendar years plus retained net profits up to the date of this Report,any dividend declaration in the Company is subject to examinationcurrent calendar year. Retained net profits, as defined by the New York DepartmentOCC, consist of Financial Services (NYDFS) and other regulators. The Company periodically has discussions with various regulatory agencies regarding its business model and has engagednet income less dividends declared during the period. No dividends were declared by LC Bank in similar discussions with the NYDFS. During the course of such discussions with the NYDFS, which remain ongoing, the Company decided to voluntarily comply with certain rules and regulations of the NYDFS. No assurances can be given as to the timing, outcome2023 or consequences of this matter or others if or as they arise.2022.
Putative Class Actions
In February 2020,Federal law restricts the amount and the terms of both credit and non-credit transactions between a putative class action lawsuit was filed againstbank and its nonbank affiliates. These covered transactions may not exceed 10% of the Company inbank’s capital and surplus (which for this purpose represents tier 1 and tier 2 capital, as calculated under the U.S. District Court forrisk-based capital rules, plus the Northern Districtbalance of California (Erceg v. LendingClub Corporation, No. 3:20-cv-01153). The lawsuit alleges violations of California and Massachusetts law based on allegations that LendingClub recorded a call with plaintiff without notifying him that it would be recorded. Plaintiff seeks to represent a purported class of similarly situated individuals who had phone calls recorded by LendingClub without their knowledge and consent. LendingClub filedthe
LENDINGCLUB CORPORATION
Notes to Consolidated Financial Statements
(Tabular Amounts in Thousands, Except Share and Per Share Amounts, Ratios, or as Noted)
a motionACL excluded from tier 2 capital) with any single nonbank affiliate and 20% of the bank’s capital and surplus with all its nonbank affiliates. Covered transactions that are extensions of credit may require collateral to dismiss certain of plaintiff’s claims, strike nationwide class allegations, and, alternatively,be pledged to stayprovide added security to the litigation. Rather than oppose that motion, plaintiff filed an amended complaint. bank.
22. Segment Reporting
The Company againdefines operating segments to be components of the Company for which discrete financial information is evaluated regularly by the Company’s Chief Executive Officer and Chief Financial Officer to allocate resources and evaluate financial performance. This information is reviewed according to the legal organizational structure of the Company’s operations with products and services presented separately for the parent bank holding company and its wholly-owned subsidiary, LC Bank. Income taxes are recorded on a separate entity basis whereby each operating segment determines income tax expense or benefit as if it filed a motion to stay, or alternatively to dismiss certainseparate tax return.
All of the claimsCompany’s revenue is generated in the amended complaintUnited States. The Company has experienced reductions in marketplace investor demand in connection with increases in interest rates and volatility in the macro economy. However, no individual borrower or marketplace investor accounted for 10% or more of total net revenue during the year ended December 31, 2023.
LendingClub Bank
The LC Bank operating segment represents the national bank legal entity and reflects post-Acquisition operating activities. This segment provides a full complement of financial products and solutions, including loans, leases and deposits. It originates loans to strike nationwide class allegations. That motion was heard by the Court on July 9, 2020. On July 28, 2020, the Court entered an order granting the Company’s motionindividuals and businesses, retains loans for investment, sells loans to stay Plaintiff’s California claims pending a decision by the California Supreme Court in a case involving the California Invasion of Privacy Act, dismissinginvestors and manages relationships with prejudice Plaintiff’s claim under Massachusetts law, and denying the Company’s motion to strike Plaintiff’s nationwide class allegations. No assurances can be given as to the timing, outcome or consequences of this matter.deposit holders.
LendingClub Corporation (Parent Only)
In July 2020, a putative class action lawsuit was filed againstThe LendingClub Corporation (Parent only) operating segment represents the holding company legal entity and predominately reflects the operations of the Company in the U.S. District Court for the Southern District of New York (Sosa v. LendingClub Corporation, No. 1:20-cv-05256). The lawsuit alleges violations of the Americans with Disabilities Act and various state law claims based on allegations that the plaintiff, who alleges he is visually-impaired, encountered access barriers in visiting LendingClub’s website that denied the plaintiff the full enjoyment of the services of the website. The plaintiff sought to represent a class of similarly situated individuals in the lawsuit and sought monetary, injunctive, and declaratory relief, among other relief. In September 2020, LendingClub filed an answer to plaintiff’s complaint denying liability in the case. The parties have reached agreement to resolve the matter, the terms of which are not materialprior to the Company’s financial position or results of operations and the plaintiff has filed a notice of voluntary dismissal of the case with prejudice.Acquisition. This caseactivity includes, but is now concluded.
In February 2021, a putative class action lawsuit was filed against the Company in the U.S. District Courtnot limited to, servicing fee revenue for the Southern District of Texas (Bradford v. Lending Club Corporation, No. 4:21-cv-00588). The lawsuit asserts a cause of action under the Fair Credit Reporting Act (FCRA) based on allegations that the Company obtained Plaintiff’s credit report without his consent or authorization and without a permissible purpose under the FCRA. Plaintiff seeks to represent a class of allegedly similarly situated persons in the case and seeks monetary, injunctive, and declaratory relief, among other relief. No assurances can be given asloans serviced prior to the timing, outcome or consequences of this matter.
California Private Attorneys General Lawsuit
In September 2018, a putative action under the California Private Attorney General Act was brought against the Company in the California Superior Court (Brott v. LendingClub Corporation, et al., CGC-18-570047) alleging violations of the California Labor Code. The complaint by a former employee alleges that the Company improperly failed to pay certain hourly employees for all wages owed, pay the correct rate of pay including overtime,Acquisition, and provide accurate wage statements. The lawsuit alleges that the plaintiffinterest income and aggrieved employees are entitled to recover civil penalties under the California Labor Code. The parties have reached a resolution of this matter, the terms of which are not materialinterest expense related to the Company’s financial position or results of operations. The resolution will require court approval. The parties have finalized a written settlement agreementRetail Program and will seek the Court’s approval of the negotiated resolution. It remains unclear when the Court will consider approving the settlement or issuing a ruling in connection with the same.Structured Program transactions
Certain Financial Considerations Relating to Litigation and Investigations
With respectentered into prior to the matters discussed above, the Company had $21.6 million and $16.0 million in accrued contingent liabilities as of December 31, 2020 and 2019, respectively. The increase in accrued contingent liabilities
as of December 31, 2020 compared to December 31, 2019 was primarily related to legal expenses for legacy litigation and regulatory matters during 2020, which is included in “Other general and administrative” expense on the Company’s Consolidated Statements of Operations.Acquisition.
LENDINGCLUB CORPORATION
Notes to Consolidated Financial Statements
(Tabular Amounts in Thousands, Except Share and Per Share Amounts, Ratios, or as Noted)
In addition toFinancial information for the foregoing, the Companysegments is subject to, and may continue to be subject to, legal proceedings and regulatory actionspresented in the ordinary course of business. No assurance can be given as to the timing, outcome or consequences of any of these matters.following tables:
| | | | | | | | | | | | | | | | | | | | | | | | | | | | | | | | | | | | | | | | | | | | | | | | | | | | | | | | | | | | | | | | | | | | | | | |
| LendingClub
Bank | | LendingClub Corporation (Parent only) | | Intercompany
Eliminations | | Consolidated Total |
| Year Ended December 31, | | Eleven Months Ended December 31, | | Year Ended December 31, | | Year Ended December 31, | | Eleven Months Ended December 31, | | Year Ended December 31, |
| 2023 | | 2022 | | 2021 (1) | | 2023 | | 2022 | | 2021 | | 2023 | | 2022 | | 2021 (1) | | 2023 | | 2022 | | 2021 |
| Non-interest income: | | | | | | | | | | | | | | | | | | | | | | | |
| Marketplace revenue | $ | 206,381 | | | $ | 610,536 | | | $ | 462,821 | | | $ | 41,817 | | | $ | 48,231 | | | $ | 115,759 | | | $ | 43,286 | | | $ | 24,859 | | | $ | — | | | $ | 291,484 | | | $ | 683,626 | | | $ | 578,580 | |
| Other non-interest income | 74,684 | | | 85,208 | | | 94,953 | | | 9,503 | | | 15,628 | | | 16,718 | | | (72,890) | | | (72,071) | | | (84,452) | | | 11,297 | | | 28,765 | | | 27,219 | |
| Total non-interest income | 281,065 | | | 695,744 | | | 557,774 | | | 51,320 | | | 63,859 | | | 132,477 | | | (29,604) | | | (47,212) | | | (84,452) | | | 302,781 | | | 712,391 | | | 605,799 | |
| | | | | | | | | | | | | | | | | | | | | | | |
| Interest income: | | | | | | | | | | | | | | | | | | | | | | | |
| Interest income | 818,206 | | | 526,471 | | | 210,739 | | | 14,424 | | | 30,869 | | | 82,093 | | | — | | | — | | | — | | | 832,630 | | | 557,340 | | | 292,832 | |
| Interest expense | (266,218) | | | (60,954) | | | (8,412) | | | (4,574) | | | (21,561) | | | (71,589) | | | — | | | — | | | — | | | (270,792) | | | (82,515) | | | (80,001) | |
| Net interest income | 551,988 | | | 465,517 | | | 202,327 | | | 9,850 | | | 9,308 | | | 10,504 | | | — | | | — | | | — | | | 561,838 | | | 474,825 | | | 212,831 | |
| | | | | | | | | | | | | | | | | | | | | | | |
| Total net revenue | 833,053 | | | 1,161,261 | | | 760,101 | | | 61,170 | | | 73,167 | | | 142,981 | | | (29,604) | | | (47,212) | | | (84,452) | | | 864,619 | | | 1,187,216 | | | 818,630 | |
| | | | | | | | | | | | | | | | | | | | | | | |
| (Provision for) reversal of credit losses | (243,565) | | | (267,326) | | | (142,182) | | | — | | | — | | | 3,382 | | | — | | | — | | | — | | | (243,565) | | | (267,326) | | | (138,800) | |
| Non-interest expense | (537,026) | | | (724,304) | | | (547,799) | | | (59,015) | | | (89,761) | | | (198,039) | | | 29,604 | | | 47,212 | | | 84,452 | | | (566,437) | | | (766,853) | | | (661,386) | |
| Income (Loss) before income tax benefit (expense) | 52,462 | | | 169,631 | | | 70,120 | | | 2,155 | | | (16,594) | | | (51,676) | | | — | | | — | | | — | | | 54,617 | | | 153,037 | | | 18,444 | |
| Income tax benefit (expense) | (17,881) | | | (42,354) | | | 9,171 | | | 2,203 | | | 125,954 | | | 44,013 | | | — | | | 53,048 | | | (53,048) | | | (15,678) | | | 136,648 | | | 136 | |
| Net income (loss) | $ | 34,581 | | | $ | 127,277 | | | $ | 79,291 | | | $ | 4,358 | | | $ | 109,360 | | | $ | (7,663) | | | $ | — | | | $ | 53,048 | | | $ | (53,048) | | | $ | 38,939 | | | $ | 289,685 | | | $ | 18,580 | |
| Capital expenditures | $ | 59,509 | | | $ | 69,481 | | | $ | 32,602 | | | $ | — | | | $ | — | | | $ | 1,811 | | | $ | — | | | $ | — | | | $ | — | | | $ | 59,509 | | | $ | 69,481 | | | $ | 34,413 | |
| Depreciation and amortization | $ | 30,216 | | | $ | 16,489 | | | $ | 4,569 | | | $ | 16,979 | | | $ | 27,342 | | | $ | 39,716 | | | $ | — | | | $ | — | | | $ | — | | | $ | 47,195 | | | $ | 43,831 | | | $ | 44,285 | |
20. Restructuring Costs
On April 20, 2020,LendingClub Bank reportable segment was formed upon the Company approved a restructuring plan to addressAcquisition on February 1, 2021, the impact of COVID-19 onassociated results are presented for the Company’s business. The restructuring plan was completed on April 21, 2020 and resulted in a reduction of approximately 30% of the Company’s workforce. During the yeareleven month period ended December 31, 2020, the Company recorded $17.8 million in restructuring costs within operating expenses, which was comprised of $8.0 million in compensation costs, $5.6 million in related non-cash lease expenses and impairment, and $4.2 million in impairment of internally developed software. All of the $8.0 million in compensation costs expensed were paid out during the year, resulting in 0 restructuring liability as of December 31, 2020. NaN such restructuring costs were recorded during the year ended December 31, 2019.
The following table presents the restructuring costs for the year ended December 31, 2020, recorded in the Company’s Consolidated Statements of Operations:
| | | | | | | | |
| | | | |
Year Ended December 31, | 2020 | | | |
Sales and marketing | $ | 1,271 | | | | |
Origination and servicing | 793 | | | | |
Engineering and product development | 7,245 | | | | |
Other general and administrative | 8,480 | | | | |
Total | $ | 17,789 | | | | |
21. Segment Reporting
The Company defines its operating segments by the loan product types of personal, education and patient finance, and auto. While each of these product types are considered operating segments, they are aggregated to represent 1 reportable segment as the education and patient finance and auto loan operating segments are immaterial both individually and in the aggregate. In the second quarter of 2019, the Company sold certain assets relating to its small business operating segment and announced that it will connect applicants looking for a small business loan with strategic partners and earn referral fees, instead of facilitating these loans on its platform.
All of the Company’s revenue is generated in the United States. No individual borrower or investor accounted for 10% or more of consolidated net revenue for any of the periods presented.
22. Related Party Transactions
Related party transactions must be reviewed and approved by the Audit Committee of the Company’s board of directors when not conducted in the ordinary course of business subject to the standard terms of the Company’s lending marketplace or certificate investment program. Any material amendment or modification to an existing related party transaction is also subject to the review and approval of the Audit Committee. Related party transactions may include any transaction between entities under common control or with a related person that has occurred since the beginning of the Company’s latest fiscal year or is currently proposed. The Company has defined related persons as members of the board of directors, executive officers, principal owners of the Company’s outstanding stock and any immediate family members of each such related person, as well as any other person or entity with significant influence over the Company’s management or operations.2021.
LENDINGCLUB CORPORATION
Notes to Consolidated Financial Statements
(Tabular Amounts in Thousands, Except Share and Per Share Amounts, Ratios, or as Noted)
Several of the Company’s executive officers and directors (including immediate family members) have made deposits and withdrawals to their investor accounts and purchased loans or interests therein. The Company believes all such transactions by related persons were made in the ordinary course of business and were transacted on terms and conditions that were not more favorable than those obtained by similarly situated third-party investors. | | | | | | | | | | | | | | | | | | | | | | | | | | | | | | | | | | | | | | | | | | | | | | | |
| LendingClub Bank | | LendingClub Corporation
(Parent only) | | Intercompany
Eliminations | | Consolidated Total |
| | December 31, 2023 | | December 31, 2022 | | December 31, 2023 | | December 31, 2022 | | December 31, 2023 | | December 31, 2022 | | December 31, 2023 | | December 31, 2022 |
| Assets | | | | | | | | | | | | | | | |
| Total cash and cash equivalents | $ | 1,230,206 | | | $ | 1,020,874 | | | $ | 110,273 | | | $ | 56,475 | | | $ | (87,975) | | | $ | (20,319) | | | $ | 1,252,504 | | | $ | 1,057,030 | |
| Restricted cash | — | | | — | | | 46,628 | | | 75,409 | | | (4,984) | | | (7,955) | | | 41,644 | | | 67,454 | |
| Securities available for sale at fair value | 1,617,309 | | | 329,287 | | | 2,953 | | | 16,415 | | | — | | | — | | | 1,620,262 | | | 345,702 | |
| Loans held for sale at fair value | 407,773 | | | 110,400 | | | — | | | — | | | — | | | — | | | 407,773 | | | 110,400 | |
| Loans and leases held for investment, net | 4,539,915 | | | 4,705,302 | | | — | | | — | | | — | | | — | | | 4,539,915 | | | 4,705,302 | |
| Loans held for investment at fair value | 253,800 | | | 906,711 | | | 8,390 | | | 19,227 | | | — | | | — | | | 262,190 | | | 925,938 | |
| Retail and certificate loans held for investment at fair value | — | | | — | | | 10,488 | | | 55,425 | | | — | | | — | | | 10,488 | | | 55,425 | |
| Property, equipment and software, net | 144,439 | | | 102,274 | | | 17,078 | | | 34,199 | | | — | | | — | | | 161,517 | | | 136,473 | |
| Investment in subsidiary | — | | | — | | | 816,703 | | | 755,319 | | | (816,703) | | | (755,319) | | | — | | | — | |
| Goodwill | 75,717 | | | 75,717 | | | — | | | — | | | — | | | — | | | 75,717 | | | 75,717 | |
| Other assets | 341,680 | | | 339,341 | | | 131,135 | | | 173,851 | | | (17,362) | | | (12,886) | | | 455,453 | | | 500,306 | |
| Total assets | 8,610,839 | | | 7,589,906 | | | 1,143,648 | | | 1,186,320 | | | (927,024) | | | (796,479) | | | 8,827,463 | | | 7,979,747 | |
| Liabilities and Equity | | | | | | | | | | | | | | | |
| Total deposits | 7,426,445 | | | 6,420,827 | | | — | | | — | | | (92,959) | | | (28,274) | | | 7,333,486 | | | 6,392,553 | |
| Borrowings | 6,398 | | | 64,154 | | | 2,468 | | | 10,704 | | | — | | | — | | | 8,866 | | | 74,858 | |
| Retail notes and certificates | — | | | — | | | 10,488 | | | 55,425 | | | — | | | — | | | 10,488 | | | 55,425 | |
| Other liabilities | 154,077 | | | 189,185 | | | 86,086 | | | 116,318 | | | (17,362) | | | (12,886) | | | 222,801 | | | 292,617 | |
| Total liabilities | 7,586,920 | | | 6,674,166 | | | 99,042 | | | 182,447 | | | (110,321) | | | (41,160) | | | 7,575,641 | | | 6,815,453 | |
| Total equity | 1,023,919 | | | 915,740 | | | 1,044,606 | | | 1,003,873 | | | (816,703) | | | (755,319) | | | 1,251,822 | | | 1,164,294 | |
| Total liabilities and equity | $ | 8,610,839 | | | $ | 7,589,906 | | | $ | 1,143,648 | | | $ | 1,186,320 | | | $ | (927,024) | | | $ | (796,479) | | | $ | 8,827,463 | | | $ | 7,979,747 | |
In February 2020, the Company entered into an exchange agreement with its largest stockholder, Shanda, pursuant to which, in March 2020, Shanda exchanged all of 19,562,881 shares of LendingClub common stock held by it for (i) 195,628 newly issued shares of mandatorily convertible, non-voting, LendingClub preferred stock, series A, both with a par value of $0.01 per share, and (ii) a one-time cash payment of $50.2 million. See “Note 15. Stockholders' Equity,” for additional information.
As of December 31, 2020, the Company had a $7.8 million investment and an approximate 22% ownership interest in an Investment Fund, a private fund that participates in a family of funds with other unrelated third parties. This family of funds purchases assets from third parties unrelated to the Company and, prior to 2020, purchased whole loans and interests in loans from the Company. The Company has requested a full redemption of our investment in the Investment Fund. The Company’s investment in the Investment Fund is recorded in “Other assets” on the Company’s Consolidated Balance Sheets. The Company believes all arrangements were on terms and conditions that were not more favorable than those obtained by other third-party investors. The Investment Fund provides audited financial statements annually and periodic investment statements throughout each calendar year on a delayed basis, which are used by the Company to evaluate performance and recoverability of our investment.
23. Subsequent Events
The Company has evaluated the impact of events that have occurred subsequent to December 31, 2020, through the date the consolidated financial statements were filed with the SEC. Based on this evaluation, other than as recorded or disclosed within these consolidated financial statements and related notes, including as disclosed below, the Company has determined no additional subsequent events were required to be recognized or disclosed.
Radius Bancorp, Inc. Acquisition
On February 1, 2021, the Company completed the acquisition of Radius Bancorp, Inc. (Radius), in accordance with the Plan of Merger previously disclosed, for total consideration of approximately $145 million in cash and $40.8 million in LendingClub common stock (3,761,114 shares). The acquisition combines the Company’s complementary digital lending capabilities with those of a digital bank. The acquisition will be accounted for as a purchase business combination with the purchase price allocated to the tangible and identifiable intangible assets acquired and liabilities assumed based on their fair values at the acquisition date. The residual difference will be recorded as goodwill. The Company is in the process of completing its initial fair value estimates, which will be included in its Quarterly Report on Form 10-Q for the quarter ended March 31, 2021.
The acquisition of Radius will significantly change the presentation of our financial statements in future periods. Going forward, the Company’s financial statements will be structured according to the presentation requirements for bank holding companies under Article 9 of the SEC’s Regulation S-X.
LENDINGCLUB CORPORATION
Notes to Consolidated Financial Statements
(Tabular Amounts in Thousands, Except Share and Per Share Amounts, Ratios, or as Noted)
23. LendingClub Corporation – Parent Company-Only Financial Statements
The following tables present standalone condensed financial statements for LendingClub Corporation (Parent Company). These statements are provided in accordance with SEC rules, which require such disclosures when the restricted net assets of a consolidated subsidiary exceed 25% of consolidated net assets, and should be read in conjunction with the Consolidated Financial Statements and the accompanying Notes to the Consolidated Financial Statements. For purposes of these condensed financial statements, the Parent’s wholly-owned subsidiary is presented in accordance with the equity method of accounting.
Statements of Income
| | | | | | | | | | | | | | | | | | | | | |
| Year Ended December 31, | 2023 | | 2022 | | 2021 | | | | |
| Non-interest income: | | | | | | | | | |
| Marketplace revenue | $ | 41,817 | | | $ | 48,231 | | | $ | 115,759 | | | | | |
| Other non-interest income | 9,503 | | | 15,628 | | | 16,718 | | | | | |
| Total non-interest income | 51,320 | | | 63,859 | | | 132,477 | | | | | |
| | | | | | | | | |
| Interest income: | | | | | | | | | |
| Interest on loans held for sale | — | | | 1,390 | | | 11,025 | | | | | |
| Interest on loans held for investment at fair value | 2,589 | | | 2,875 | | | 4,436 | | | | | |
| Interest on retail and certificate loans held for investment at fair value | 4,222 | | | 18,135 | | | 57,684 | | | | | |
| Interest on securities available for sale | 6,802 | | | 7,608 | | | 8,922 | | | | | |
| Other interest income | 811 | | | 861 | | | 26 | | | | | |
| Total interest income | 14,424 | | | 30,869 | | | 82,093 | | | | | |
| | | | | | | | | |
| Interest expense: | | | | | | | | | |
| Interest on retail notes and certificates at fair value | 4,222 | | | 18,135 | | | 57,684 | | | | | |
| Other interest expense | 352 | | | 3,426 | | | 13,905 | | | | | |
| Total interest expense | 4,574 | | | 21,561 | | | 71,589 | | | | | |
| | | | | | | | | |
| Net interest income | 9,850 | | | 9,308 | | | 10,504 | | | | | |
| | | | | | | | | |
| Total net revenue | 61,170 | | | 73,167 | | | 142,981 | | | | | |
| | | | | | | | | |
| Reversal of credit losses | — | | | — | | | (3,382) | | | | | |
| | | | | | | | | |
| Non-interest expense: | | | | | | | | | |
| Compensation and benefits | 6,520 | | | 7,770 | | | 31,010 | | | | | |
| Marketing | — | | | 188 | | | 5,460 | | | | | |
| Equipment and software | 246 | | | 194 | | | 2,459 | | | | | |
| Depreciation and amortization | 16,979 | | | 27,342 | | | 39,716 | | | | | |
| Professional services | 1,210 | | | 523 | | | 14,666 | | | | | |
| Occupancy | 9,552 | | | 13,346 | | | 17,751 | | | | | |
| Other non-interest expense | 24,508 | | | 40,398 | | | 86,977 | | | | | |
| Total non-interest expense | 59,015 | | | 89,761 | | | 198,039 | | | | | |
| | | | | | | | | |
| Income (Loss) before income tax benefit | 2,155 | | | (16,594) | | | (51,676) | | | | | |
| Income tax benefit | 2,203 | | | 125,954 | | | 44,013 | | | | | |
| Income (Loss) before undistributed earnings of subsidiary | 4,358 | | | 109,360 | | | (7,663) | | | | | |
| Equity in undistributed earnings of subsidiary | 34,581 | | | 127,277 | | | 79,291 | | | | | |
| Net income | $ | 38,939 | | | $ | 236,637 | | | $ | 71,628 | | | | | |
| | | | | | | | | |
LENDINGCLUB CORPORATION
Notes to Consolidated Financial Statements
(Tabular Amounts in Thousands, Except Share and Per Share Amounts, Ratios, or as Noted)
In accordance with federal laws and regulations, dividends paid by LC Bank to the Company are subject to certain restrictions.See “Note 21. Regulatory Requirements” for more information.
Statements of Comprehensive Income
| | | | | | | | | | | | | | | | | |
| Year Ended December 31, | 2023 | | 2022 | | 2021 |
| Net income | $ | 38,939 | | | $ | 236,637 | | | $ | 71,628 | |
| Other comprehensive income (loss), net of tax: | | | | | |
| Net unrealized gain (loss) on securities available for sale | 6,706 | | | (1,556) | | | 9,153 | |
| Equity in other comprehensive loss of subsidiary | (1,282) | | | (43,528) | | | (2,619) | |
| Other comprehensive income (loss), net of tax | 5,424 | | | (45,084) | | | 6,534 | |
| Total comprehensive income | $ | 44,363 | | | $ | 191,553 | | | $ | 78,162 | |
Balance Sheets
| | | | | | | | | | | |
| December 31, | 2023 | | 2022 |
| Assets | | | |
| Cash and due from banks | $ | 96,384 | | | $ | 34,119 | |
| Interest-bearing deposits in banks | 13,889 | | | 22,356 | |
| Total cash and cash equivalents | 110,273 | | | 56,475 | |
| Restricted cash | 46,628 | | | 75,409 | |
| Securities available for sale at fair value ($264 and $8,322 at amortized cost, respectively) | 2,953 | | | 16,415 | |
| | | |
| Loans held for investment at fair value | 8,390 | | | 19,227 | |
| Retail and certificate loans held for investment at fair value | 10,488 | | | 55,425 | |
| Property, equipment and software, net | 17,078 | | | 34,199 | |
| Investment in subsidiary | 937,987 | | | 923,618 | |
| Other assets | 126,899 | | | 165,973 | |
| Total assets | $ | 1,260,696 | | | $ | 1,346,741 | |
| Liabilities and Equity | | | |
| Borrowings | $ | 2,468 | | | $ | 10,704 | |
| Retail notes and certificates at fair value | 10,488 | | | 55,425 | |
| | | |
| Other liabilities | 86,086 | | | 116,318 | |
| Total liabilities | 99,042 | | | 182,447 | |
| Equity | | | |
| | | |
| Common stock, $0.01 par value; 180,000,000 shares authorized; 110,410,602 and 106,546,995 shares issued and outstanding, respectively | 1,104 | | | 1,065 | |
| Additional paid-in capital | 1,669,828 | | | 1,628,590 | |
| Accumulated deficit | (468,097) | | | (427,745) | |
| Accumulated other comprehensive loss | (41,181) | | | (37,616) | |
| Total equity | 1,161,654 | | | 1,164,294 | |
| Total liabilities and equity | $ | 1,260,696 | | | $ | 1,346,741 | |
LENDINGCLUB CORPORATION
Notes to Consolidated Financial Statements
(Tabular Amounts in Thousands, Except Share and Per Share Amounts, Ratios, or as Noted)
Statements of Cash Flows
| | | | | | | | | | | | | | | | | |
| Year Ended December 31, | 2023 | | 2022 | | 2021 |
| Cash Flows from Operating Activities: | | | | | |
| Parent company net income | $ | 38,939 | | | $ | 236,637 | | | $ | 71,628 | |
| Adjustments to reconcile net income to net cash provided by operating activities: | | | | | |
| Equity in undistributed earnings of subsidiary | (34,581) | | | (127,277) | | | (79,291) | |
| Income tax benefit | (2,203) | | | (125,954) | | | (44,013) | |
| Net fair value adjustments | (2,903) | | | (5,929) | | | (5,936) | |
| Reversal of credit losses | — | | | — | | | (3,382) | |
| Change in fair value of loan servicing assets | 50,281 | | | 33,840 | | | 37,138 | |
| | | | | |
| Stock-based compensation, net | 5,253 | | | 6,310 | | | 14,506 | |
| Depreciation and amortization | 16,979 | | | 27,342 | | | 39,716 | |
| Gain on sales of loans | — | | | — | | | (3,372) | |
| | | | | |
| Other, net | 274 | | | 16 | | | 9,326 | |
| Net change to loans held for sale | 5,953 | | | 31,658 | | | 90,609 | |
| Net change in operating assets and liabilities: | | | | | |
| Other assets | (30,602) | | | 42,219 | | | (29,556) | |
| Other liabilities | (30,741) | | | (38,258) | | | (95,737) | |
| Net cash provided by operating activities | 16,649 | | | 80,604 | | | 1,636 | |
| Cash Flows from Investing Activities: | | | | | |
| Acquisition of company | — | | | — | | | (145,344) | |
| Payments for investments in and advances to subsidiary | — | | | (50,000) | | | (250,001) | |
| | | | | |
| Purchase of servicing asset investment | (50,576) | | | (59,880) | | | — | |
| Proceeds from servicing asset investment | 72,343 | | | 24,564 | | | — | |
| Net change in loans and leases | 5,066 | | | 4,443 | | | 1,360 | |
| Net decrease in retail and certificate loans | 47,545 | | | 171,853 | | | 437,870 | |
| | | | | |
| | | | | |
| Proceeds from maturities and paydowns of securities available for sale | 7,861 | | | 46,548 | | | 103,258 | |
| Purchases of property, equipment and software, net | — | | | — | | | (1,811) | |
| Other investing activities | 200 | | | 2,370 | | | 8,804 | |
| Net cash provided by investing activities | 82,439 | | | 139,898 | | | 154,136 | |
| Cash Flows from Financing Activities: | | | | | |
| | | | | |
| | | | | |
| Principal payments on retail notes and certificates | (47,545) | | | (182,260) | | | (438,032) | |
| Principal payments on Structured Program borrowings | (4,073) | | | (21,423) | | | (90,187) | |
| | | | | |
| | | | | |
| Principal payments on short-term borrowings | (2,619) | | | (25,415) | | | (81,935) | |
| | | | | |
| | | | | |
| | | | | |
| | | | | |
| | | | | |
| | | | | |
| | | | | |
| | | | | |
| Principal payments on long term debt | — | | | (15,300) | | | — | |
| Other financing activities | (19,834) | | | (9,028) | | | (9,295) | |
| Net cash used for financing activities | (74,071) | | | (253,426) | | | (619,449) | |
| Net Change in Cash, Cash Equivalents and Restricted Cash | 25,017 | | | (32,924) | | | (463,677) | |
| Cash, Cash Equivalents and Restricted Cash, Beginning of Period | 131,884 | | | 164,808 | | | 628,485 | |
| Cash, Cash Equivalents and Restricted Cash, End of Period | $ | 156,901 | | | $ | 131,884 | | | $ | 164,808 | |
(1) Prior period amounts have been reclassified to conform to the current period presentation.
Item 9. Changes in and Disagreements with Accountants on Accounting and Financial Disclosure
None.
Item 9A. Controls and Procedures
Evaluation of Disclosure Controls and Procedures
The Company’s management evaluated, with the participation of the Company’s Chief Executive Officer (CEO) and Chief Financial Officer (CFO), the effectiveness of the Company’s disclosure controls and procedures (as defined in Rule 13a-15(e) under the Securities Exchange Act of 1934, as amended)Act) as of December 31, 2020.2023. In designing and evaluating its disclosure controls and procedures, the Company’s management recognizes that any controls and procedures, no matter how well designed and operated, can provide only reasonable assurance, not absolute assurance, of achieving the desired control objectives, and is required to apply its judgment in evaluating the cost-benefit relationship of possible controls and procedures.
Based on the evaluation, the Company’s CEO and CFO concluded that the Company’s disclosure controls and procedures as of December 31, 2020,2023, were designed and functioned effectively to provide reasonable assurance that the information required to be disclosed by the Company in reports filed under the Securities and Exchange Act of 1934, as amended, is (i) recorded, processed, summarized, and reported within the time periods specified in the SEC’s rules and forms, and (ii) accumulated and communicated to management, including the principal executive and principal financial officers, as appropriate, to allow timely decisions regarding required disclosure.
Management’s Annual Report on Internal Control over Financial Reporting
The Company’s management is responsible for maintaining effective internal control over financial reporting and for assessing the effectiveness of internal control over financial reporting, as defined in Rule 13a-15(f) of the 1934Exchange Act. Under the supervision and with the participation of the Company’s CEO and CFO, management conducted an evaluation of the effectiveness of its internal control over financial reporting as of December 31, 2020,2023, based on the criteria established in Internal Control – Integrated Framework (2013) issued by the Committee of Sponsoring Organizations of the Treadway Commission. As a result of this assessment, management concluded that, as of December 31, 2020,2023, our internal control over financial reporting was effective in providing reasonable assurance regarding the reliability of financial reporting and the preparation of financial statements for external purposes in accordance with generally accepted accounting principles. Deloitte & Touche LLP, has independently audited the effectiveness of our internal control over financial reporting and its report is included below.
All internal control systems, no matter how well designed, have inherent limitations, including the possibility of human error and the circumvention or overriding of controls. Further, because of changes in conditions, the effectiveness of internal controls may vary over time. Projections of any evaluation of effectiveness to future periods are subject to the risk that controls may become inadequate because of changes in conditions, or that the degree of compliance with the policies or procedures may deteriorate. Accordingly, even those systems determined to be effective can provide only reasonable assurance with respect to financial statement preparation and presentation.
Changes in Internal Control Over Financial Reporting
No change in the Company’s internal control over financial reporting (as defined in Rule 13a-15(f) under the Securities Exchange Act of 1934)Act) occurred during the fiscal quarter ended December 31, 2020,2023, that has materially affected, or is reasonably likely to materially affect, the Company’s internal control over financial reporting.
REPORT OF INDEPENDENT REGISTERED PUBLIC ACCOUNTING FIRM
To the stockholders and the Board of Directors of LendingClub Corporation
Opinion on Internal Control over Financial Reporting
We have audited the internal control over financial reporting of LendingClub Corporation and subsidiaries (the “Company”) as of December 31, 2020,2023, based on criteria established in Internal Control — Integrated Framework (2013) issued by the Committee of Sponsoring Organizations of the Treadway Commission (COSO). In our opinion, the Company maintained, in all material respects, effective internal control over financial reporting as of December 31, 2020,2023, based on criteria established in Internal Control — Integrated Framework (2013) issued by COSO.
We have also audited, in accordance with the standards of the Public Company Accounting Oversight Board (United States) (PCAOB), the consolidated financial statements as of and for the year ended December 31, 2020,2023, of the Company and our report dated March 11, 2021,February 16, 2024, expressed an unqualified opinion on those financial statements.
Basis for Opinion
The Company’s management is responsible for maintaining effective internal control over financial reporting and for its assessment of the effectiveness of internal control over financial reporting, included in the accompanying Management’s Annual Report on Internal Control over Financial Reporting. Our responsibility is to express an opinion on the Company’s internal control over financial reporting based on our audit. We are a public accounting firm registered with the PCAOB and are required to be independent with respect to the Company in accordance with the U.S. federal securities laws and the applicable rules and regulations of the Securities and Exchange Commission and the PCAOB.
We conducted our audit in accordance with the standards of the PCAOB. Those standards require that we plan and perform the audit to obtain reasonable assurance about whether effective internal control over financial reporting was maintained in all material respects. Our audit included obtaining an understanding of internal control over financial reporting, assessing the risk that a material weakness exists, testing and evaluating the design and operating effectiveness of internal control based on the assessed risk, and performing such other procedures as we considered necessary in the circumstances. We believe that our audit provides a reasonable basis for our opinion.
Definition and Limitations of Internal Control over Financial Reporting
A company’s internal control over financial reporting is a process designed to provide reasonable assurance regarding the reliability of financial reporting and the preparation of financial statements for external purposes in accordance with generally accepted accounting principles. A company’s internal control over financial reporting includes those policies and procedures that (1) pertain to the maintenance of records that, in reasonable detail, accurately and fairly reflect the transactions and dispositions of the assets of the company; (2) provide reasonable assurance that transactions are recorded as necessary to permit preparation of financial statements in accordance with generally accepted accounting principles, and that receipts and expenditures of the company are being made only in accordance with authorizations of management and directors of the company; and (3) provide reasonable assurance regarding prevention or timely detection of unauthorized acquisition, use, or disposition of the company’s assets that could have a material effect on the financial statements.
Because of its inherent limitations, internal control over financial reporting may not prevent or detect misstatements. Also, projections of any evaluation of effectiveness to future periods are subject to the risk that controls may become inadequate because of changes in conditions, or that the degree of compliance with the policies or procedures may deteriorate.
/s/ DELOITTE & TOUCHE LLP
San Francisco, California
March 11, 2021February 16, 2024
Item 9B. Other Information
Rule 10b5-1 Trading Plans
During the fourth quarter of 2023, none of the Company’s directors or executive officers adopted or terminated any contract, instruction or written plan for the purchase or sale of the Company’s securities that was intended to satisfy the affirmative defense conditions of Rule 10b5-1(c) or any “non-Rule 10b5-1 trading arrangement.”
Item 9C. Disclosure Regarding Foreign Jurisdictions that Prevent Inspections
Not Applicable.
PART III
Item 10. Directors, Executive Officers and Corporate Governance
The information required by Item 10 will be included in our definitive proxy statement with respect to our 20212024 Annual Meeting of Stockholders (Proxy Statement) and is incorporated herein by reference. The Proxy Statement will be filed with the Securities and Exchange CommissionSEC pursuant to Regulation 14A within 120 days of the end of the 20202023 fiscal year.
Item 11. Executive Compensation
The information required by Item 11 will be included in the Proxy Statement under the headings “Board of Directors and Corporate Governance – Compensation Committee Interlocks and Insider Participation,” “Board of Directors and Corporate Governance – Director Compensation,” “Executive Compensation” and “Report of the Compensation Committee,” and is incorporated herein by reference.
Item 12. Security Ownership of Certain Beneficial Owners and Management and Related Stockholder Matters
The information required by Item 12 will be included in the Proxy Statement under the headings “Security Ownership of Certain Beneficial Owners and Management” and “Executive Compensation – Securities Authorized for Issuance Under Equity Compensation Plans,” and is incorporated herein by reference.
Item 13. Certain Relationships and Related Transactions, and Director Independence
The information required by Item 13 will be included in the Proxy Statement under the headings “Related Party Transactions” and “Board of Directors and Corporate Governance – Director Independence,” and is incorporated herein by reference.
Item 14. Principal Accountant Fees and Services
The information required by Item 14 will be included in the Proxy Statement under the heading “Ratification of Appointment of Independent Registered Public Accounting Firm,” and is incorporated herein by reference.
PART IV
Item 15. Exhibits and Financial Statement ScheduleSchedules
(a) Documents filed as part of this Annual Report on Form 10-K:Report:
1. Financial Statements
The following consolidated financial statements are included in Part II, Item 8 of this Annual Report on Form 10-K:Report:
2. Financial Statement ScheduleSchedules
Financial statement schedules have been omitted because they are not required, not applicable, not present in amounts sufficient to require submission of the schedule, or the required information is shown in the Consolidated Financial Statements or Notes thereto.
3. Exhibits
The documents listed in the Exhibit indexIndex of this Annual Report on Form 10-K are incorporated by reference or are filed with this Annual Report, on Form 10-K, in each case as indicated therein on the Exhibit Index immediately following the signature page of this Annual Report on Form 10-K.Report.
Item 16. Form 10-K Summary
None.
SIGNATURES
Pursuant to the requirements of Section 13 or 15(d) of the Securities Exchange Act of 1934, the registrant has duly caused this reportAnnual Report to be signed on its behalf by the undersigned, thereunto duly authorized.
Date: March 11, 2021February 16, 2024
| | | | | | | | | | | |
| LENDINGCLUB CORPORATION |
| | |
| By: | | /s/ Scott Sanborn |
| Scott Sanborn |
| Chief Executive Officer |
POWER OF ATTORNEY
KNOW ALL PERSONS BY THESE PRESENTS, that each person whose signature appears below constitutes and appoints Scott Sanborn and Thomas Casey,Andrew LaBenne, jointly and severally, his or her attorney-in-fact, with the power of substitution, for him or her in any and all capacities, to sign any amendments to this Annual Report on Form 10-K and to file the same, with exhibits thereto and other documents in connection therewith, with the Securities and Exchange Commission, hereby ratifying and confirming all that each of said attorneys-in-fact, or his or her substitute or substitutes, may do or cause to be done by virtue hereof.
Pursuant to the requirements of the Securities Exchange Act of 1934, this Annual Report on Form 10-K has been signed below by the following persons on behalf of the registrant and in the capacities and on the dates indicated. | | | | | | | | | | | | | | |
| | | | |
| Signature | | Title | | Date |
| | | | |
| /s/ Scott Sanborn | | Chief Executive Officer and Director | | March 11, 2021February 16, 2024 |
| Scott Sanborn | | | | |
| | | | |
/s/ Thomas W. CaseyAndrew LaBenne | | Chief Financial Officer and Director | | March 11, 2021February 16, 2024 |
Thomas W. CaseyAndrew LaBenne | | | | |
| | | | |
| /s/ Fergal Stack | | Principal Accounting Officer | | March 11, 2021February 16, 2024 |
| Fergal Stack | | | | |
| | | | |
/s/ Susan AtheyFaiz Ahmad | | Director | | March 11, 2021February 16, 2024 |
Susan AtheyFaiz Ahmad | | | | |
| | | | |
| /s/ Stephen Cutler | | Director | | February 16, 2024 |
| Stephen Cutler | | | | |
| | | | |
| /s/ Allan Landon | | Director | | March 11, 2021February 16, 2024 |
| Allan Landon | | | | |
| | | | |
| /s/ Timothy J. Mayopoulos | | Director | | March 11, 2021February 16, 2024 |
| Timothy J. Mayopoulos | | | | |
| | | | |
/s/ Patricia McCord | | Director | | March 11, 2021 |
Patricia McCord | | | | |
| | | | |
| /s/ John C. Morris | | Director | | March 11, 2021February 16, 2024 |
| John C. Morris | | | | |
| | | | |
| /s/ Kathryn S. Reimann | | Director | | February 16, 2024 |
| Kathryn S. Reimann | | | | |
| | | | |
| /s/ Erin Selleck | | Director | | March 11, 2021February 16, 2024 |
| Erin Selleck | | | | |
| | | | |
/s/ Simon WilliamsJaney Whiteside | | Director | | March 11, 2021February 16, 2024 |
Simon WilliamsJaney Whiteside | | | | |
| | | | |
| /s/ Michael Zeisser | | Director | | March 11, 2021February 16, 2024 |
| Michael Zeisser | | | | |
EXHIBIT INDEX
| | | | | | | | | | | | | | | | | | | | |
| | | Incorporated by Reference | |
Exhibit
Number | Exhibit Description | Form | File No. | Exhibit | Filing
Date | Filed
Herewith |
| | | | | | |
| | | | | | |
| | | | | | |
| | | | | | |
| | | | | | |
| | | | | | |
| | | | | | |
| | | | | | |
| | | | | | |
| | | | | | |
| | | | | | |
| | | | | | |
| | | | | | |
| | | | | | |
| | | | | | |
| | | | | | |
| | | | | | |
| | | | | | |
| | | | | | |
| | | | | | |
| | | | | | |
| | | | | | | | | | | | | | | | | | | | |
| | | Incorporated by Reference | |
Exhibit
Number | Exhibit Description | Form | File No. | Exhibit | Filing
Date | Filed
Herewith |
| | | | | | |
| | | | | | |
| | | | | | |
| | | | | | |
| | | | | | |
| | | | | | |
| | | | | | |
| | | | | | |
| | | | | | |
| | | | | | |
| | | | | | |
| | | | | | |
| | | | | | |
| | | | | | |
| | | | | | |
| | | | | | |
| | | | | | |
| | | | | | |
| | | | | | |
| | | | | | |
| | | | | | | | | | | | | | | | | | | | |
| | | Incorporated by Reference | |
Exhibit
Number | Exhibit Description | Form | File No. | Exhibit | Filing
Date | Filed
Herewith |
| | | | | | |
| 101 | The following financial information from LendingClub Corporation’s Annual Report on Form 10-K for the year ended December 31, 20202023 formatted in Inline XBRL (Extensible Business Reporting Language) includes: (i) the Consolidated Balance Sheets, (ii) the Consolidated Statements of Operations,Income, (iii) the Consolidated Statements of Comprehensive Income, (Loss), (iv) the Consolidated Statements of Changes in Stockholders’ Equity, (v) the Consolidated Statements of Cash Flows, and (vi) Notes to the Consolidated Financial Statements. | | | | | X |
| 104 | Cover Page Interactive Data File (as formatted as Inline XBRL and contained in Exhibit 101) | | | | | |
* Confidential treatment has been requested for certain portions of this Exhibit. The omitted material has been filed separately with the SEC.
** Certain information in the exhibit was omitted pursuant to Item 601(b)(2) of Regulation S-K because it is both not material and would be competitively harmful if publicly disclosed. The Company undertakes to furnish, supplementally, a copy of the unredacted exhibit to the SEC upon request.
† Schedules have been omitted as they are not material, not applicable or not required. They will be furnished supplementally to the SEC upon request.