U.S. SECURITIES AND EXCHANGE COMMISSION
| | | | | |
| x | ☒
| ANNUAL REPORT PURSUANT TO SECTION 13 OR 15(d) OF THE SECURITIES EXCHANGE ACT OF 1934 |
For the fiscal year ended December 31,
20212023
| | | | | |
| o | ☐
| TRANSITION REPORT PURSUANT TO SECTION 13 OR 15(d) OF THE SECURITIES EXCHANGE ACT OF 1934 |
For the transition period from ____ to ____
Commission file no. 000-22507
THE FIRST BANCSHARES, INC.
(Exact name of registrant as specified in its charter)
| | | | | | | | |
| Mississippi | | 64-0862173 |
Mississippi
| | 64-0862173
|
(State or Other Jurisdiction of
Incorporation or Organization) | | (I.R.S. Employer Identification Number) |
| Incorporation or Organization)
| |
| | |
6480 U.S. Hwy. 98 West, Suite A | | |
| Hattiesburg, Mississippi | | 39402 |
Hattiesburg, Mississippi
| | 39402
|
(Address of principal executive offices) | | (Zip Code) |
| | | | | | | | |
Issuer’s telephone number: | (601) 268-8998 | |
Securities registered under Section 12(b) of the Exchange Act:
| | | | | | | | | | | | | | |
| Title of Each Class | | Trading Symbol(s) | | Name of Each Exchange on
Which Registered
|
Common Stock, $1.00 par value | | FBMS | | FBMS
| The Nasdaq Stock Market LLC |
Securities registered pursuant to Section 12(g) of the Act: None
Indicate by check mark if the registrant is a well-known seasoned issuer, as defined in rule 405 of the Securities Act.
Indicate by check mark if the registrant is not required to file reports pursuant to Section 13 or 15(d) of the Act.
Indicate by check mark whether the registrant (1) has filed all reports required to be filed by Section 13 or 15(d) of the Exchange Act of 1934 during the preceding 12 months (or for such shorter period that the registrant was required to file such reports), and (2) has been subject to such filing requirements for the past 90 days.
Indicate by check mark whether the registrant has submitted electronically and every Interactive Data File required to be submitted pursuant to Rule 405 of Regulation S-T (§ 232.405 of this chapter) during the preceding 12 months (or for such shorter period that the registrant was required to submit such files).
Indicate by check mark whether the registrant is a large accelerated filer, an accelerated filer, a non-accelerated filer, a smaller reporting company, or emerging growth company. See the definitions of “large accelerated filer,” “accelerated filer,” “non-accelerated filer,” “smaller reporting company,” and “emerging growth company” in Rule 12b-2 of the Exchange Act (Check one):
Large accelerated filer ⌧x Accelerated filer ◻o Non-accelerated filer ◻o Smaller reporting company ☐o Emerging growth company ☐o
If an emerging growth company, indicate by check mark if the registrant has elected not to use the extended transition period for complying with any new or revised financial accounting standards provided pursuant to Section 13(a) of the Exchange Act. ◻o Indicate by check mark whether the registrant has filed a report on and attestation to its management's assessment of the effectiveness of its internal control over financial reporting under Section 404(b) of the Sarbanes-Oxley Act (15 U.S.C. 7262(b)) by the registered public accounting firm that prepared or issued its audit report. x
If securities are registered pursuant to Section 12(b) of the Act, indicate by check mark whether the financial statements of the registrant included in the filing reflect the correction of an error to previously issued financial statements. o
Indicate by check mark whether any of those error corrections are restatements that required a recovery analysis of incentive-based compensation received by any of the registrant's executive officers during the relevant recovery period pursuant to §240.10D-1(b). o
Indicate by check mark whether the registrant is a shell company (as defined in Rule 12b-2 of the Act). Yes ◻o No ☒x
Based on the price at which the registrant’s Common Stock was last sold on June 30,
2021,2023, the last business day of the registrant’s most recently completed second fiscal quarter, the aggregate market value of the registrant’s Common Stock held by non-affiliates of the registrant was
$751.5$776.6 million.
On March 3, 2022,February 21, 2024, the registrant had outstanding 20,485,83031,227,881 shares of common stock.
| | | | | | | | |
Auditor Firm PCAOB ID: 686 | Auditor Name: BKD,FORVIS, LLP | Auditor Location: Jackson, MS |
DOCUMENTS INCORPORATED BY REFERENCE
Certain portions of the Registrant’s proxy statement to be filed for the Annual Meeting of Shareholders to be held May
19, 202223, 2024 are incorporated by reference into Part III of this Annual Report on Form 10-K. Other than those portions of the proxy statement specifically incorporated by reference pursuant to Items 10-14 of Part III hereof, no other portions of the proxy statement shall be deemed so incorporated.
THE FIRST BANCSHARES, INC.
TABLE OF CONTENTS
THE FIRST BANCSHARES, INC.
This Annual Report on Form 10-K, including information incorporated by reference herein, contains statements which constitute forward-looking statements within the meaning of Section 27A of the Securities Act of 1933 (the “Securities Act”) and Section 21E of the Securities Exchange Act of 1934 (the “Exchange Act”). Forward-looking statements are statements that include projections, predictions, expectations, or beliefs about future events or results or otherwise are not statements of historical fact, and may include statements relating to our projected growth, anticipated future financial performance, financial condition, credit quality and management’s long-term performance goals, as well as statements relating to the anticipated effects on our business, financial condition and results of operations from expected developments or events, our business, growth and strategies. Such statements are often characterized by the use of qualifying words (and their derivatives) such as “may,” “would,” “could,” “should,” “will,” “expect,” “anticipate,” “predict,” “project,” ”seek,” “potential,” “aim,” “continue,” “assume,” “believe,” “intend,” “plan,” “forecast,” “goal,” “estimate,” or other statements concerning opinions or judgments of the Company, the Bank, and management about possible future events or outcomes.
These forward-looking statements are not historical facts, and are based upon current expectations, estimates and projections about our industry, management’s beliefs and certain assumptions made by management, many of which, by their nature, are inherently uncertain and beyond our control. The inclusion of these forward-looking statements should not be regarded as a representation by us or any other person that such expectations, estimates and projections will be achieved. Accordingly, we caution you that any such forward-looking statements are not guarantees of future performance and are subject to risks, assumptions and uncertainties that are difficult to predict and that are beyond our control. Although we believe that the expectations reflected in these forward-looking statements are reasonable as of the date of this Annual Report, actual results may prove to be materially different from the results expressed or implied by the forward-looking statements. There are or will be important factors that could cause our actual results to differ materially from those indicated in these forward-looking statements, including, but not limited to, the following:
Factors that could influence the accuracy of such forward-looking statements include, but are not limited to, competitive pressures among financial institutions increasing significantly; economic conditions, either nationally or locally, in areas in which the Company conducts operations being less favorable than expected; interest rate risk; legislation or regulatory changes which adversely affect the ability of the consolidated Company to conduct business combinations or new operations; financial success or changing strategies of the Bank’s customers or vendors; actions of government regulators; and the risk that anticipated benefits from the recent acquisitions are not realized in the time frame anticipated or at all as a result of changes in general economic and market conditions.
Potential risks and uncertainties that could cause our actual results to differ materially from those anticipated in any forward-looking statements include, but are not limited to, the following:
| ● | the negative impacts and disruptions resulting from the outbreak of Coronavirus Disease 2019 (“COVID-19”) on the economies and communities we serve, which has had and may continue to have an adverse impact on our business operations and performance, and could have a negative impact on our credit portfolio, stock price, borrowers and the economy as a whole both globally and domestically; |
| ● | disruptions to the financial markets as a result of the current or anticipated impact of military conflict, including escalating military tension between Russia and Ukraine, terrorism or other geopolitical events; |
| ● | government or regulatory responses to the COVID-19 pandemic, including additional interest rate changes by the Federal Reserve, additional quarantines, or other regulations or laws enacted to counter the effects of the COVID-19 pandemic on the economy; |
| ● | the costs and effects of litigation, investigations, inquiries or similar matters, or adverse facts and developments related thereto, including the costs and effects of litigation related to our participation in government stimulus programs associated with the COVID-19 pandemic; |
•risks and uncertainties relating to recent, pending or potential future mergers or acquisitions, including risks related to the completion of such acquisitions within expected timeframes and the successful integration of the business that we acquire into our operations;
•the risks that a future economic downturn and contraction, including a recession, could have a material adverse effect on our capital, financial condition, credit quality, results of operations and future growth, including the risk that the strength of the current economic environment could be weakened by the continued impact of rising interest rates, and inflation;
•disruptions to the financial markets as a result of the current or anticipated impact of military conflict, including Russia's military action in Ukraine, the conflict in Israel and surrounding areas, terrorism or other geopolitical events;
•governmental monetary and fiscal policies, including interest rate policies of the Board of Governors of the Federal Reserve;
| ● | reduced earnings due to higher credit losses generally and specifically because losses in the sectors of our loan portfolio secured by real estate are greater than expected due to economic factors, including declining real estate values, increasing interest rates, increasing unemployment, or changes in payment behavior or other factors occurring in those areas;
|
| ● | general economic conditions, either nationally or regionally and especially in our primary service areas, becoming less favorable than expected resulting in, among other things, a deterioration in credit quality; |
| ● | adverse changes in asset quality and resulting credit risk-related losses and expenses; |
| ● | ability of borrowers to repay loans, which can be adversely affected by a number of factors, including changes in economic conditions, adverse trends or events affecting business industry groups, reductions in real estate values or markets, business closings or layoffs, natural disasters, public health emergencies and international instability; |
| ● | current or future legislation, regulatory changes or changes in monetary, tax or fiscal policy that adversely affect the businesses in which we or our customers or our borrowers are engaged, including the impact of the Dodd-Frank Wall Street Reform and Consumer Protection Act of 2010 (“Dodd-Frank Act”), the Federal Reserve’s action with respect to interest rates, the capital requirements promulgated by the Basel Committee on Banking Supervision (“Basel Committee”). Potential impacts from the Tax Cuts and Jobs Act, the Coronavirus Aid, Relief, and Economic Security Act (the “CARES Act”) of 2020, uncertainty relating to calculations of LIBOR and other regulatory responses to economic conditions; |
| ● | changes in political conditions or the legislative or regulatory environment; |
| ● | the adequacy of the level of our allowance for credit losses and the amount of credit loss provision required to replenish the allowance in future periods; |
| ● | reduced earnings due to higher credit losses because our loans are concentrated by loan type, industry segment, borrower type, or location of the borrower or collateral; |
| ● | changes in the interest rate environment which could reduce anticipated or actual margins; |
| ● | increased funding costs due to market illiquidity, increased competition for funding, higher interest rates, and increased regulatory requirements with regard to funding; |
| ● | results of examinations by our regulatory authorities, including the possibility that the regulatory authorities may, among other things, require us to increase our allowance for credit losses through additional credit loss provisions or write-down of our assets; |
| ● | the rate of delinquencies and amount of loans charged-off; |
| ● | the impact of our efforts to raise capital on our financial position, liquidity, capital, and profitability; |
| ● | risks and uncertainties relating to not successfully integrating the currently contemplated or completed acquisitions within our currently expected timeframe and other terms; |
| ● | significant increases in competition in the banking and financial services industries; |
| ● | changes in the securities markets; |
| ● | loss of consumer confidence and economic disruptions resulting from national disasters or terrorist activities; |
•the costs and effects of litigation, investigations, inquiries or similar matters, or adverse facts and developments related thereto, including the costs and effects of litigation related to our participation in government stimulus programs associated with the COVID-19 pandemic;
•reduced earnings due to higher credit losses generally and specifically because losses in the sectors of our loan portfolio secured by real estate are greater than expected due to economic factors, including declining real estate values, increasing interest rates, increasing unemployment, or changes in payment behavior or other factors occurring in those areas;
•general economic conditions, either nationally or regionally and especially in our primary service areas, becoming less favorable than expected resulting in, among other things, a deterioration in credit quality;
•adverse changes in asset quality and resulting credit risk-related losses and expenses;
•ability of borrowers to repay loans, which can be adversely affected by a number of factors, including changes in economic conditions, adverse trends or events affecting business industry groups, reductions in real estate values or markets, business closings or layoffs, natural disasters, public health emergencies and international instability;
•changes in laws and regulations affecting our businesses, including governmental monetary and fiscal policies, legislation and regulations relating to bank products and services, as well as changes in the enforcement and interpretation of such laws and regulations by applicable governmental and self-regulatory agencies, which could require us to change certain business practices, increase compliance risk, reduce our revenue, impose additional costs on us, or otherwise negatively affect our businesses;
•the financial impact of future tax legislation;
•changes in political conditions or the legislative or regulatory environment, including the possibility that the U.S. could default on its debt obligations;
•the adequacy of the level of our allowance for credit losses and the amount of credit loss provision required to replenish the allowance in future periods;
•reduced earnings due to higher credit losses because our loans are concentrated by loan type, industry segment, borrower type, or location of the borrower or collateral;
•changes in the interest rate environment which could reduce anticipated or actual margins;
•increased funding costs due to market illiquidity, increased competition for funding, higher interest rates, and increased regulatory requirements with regard to funding;
•results of examinations by our regulatory authorities, including the possibility that the regulatory authorities may, among other things, require us to increase our allowance for credit losses through additional credit loss provisions or write-down of our assets;
•the rate of delinquencies and amount of loans charged-off;
•the impact of our efforts to raise capital on our financial position, liquidity, capital, and profitability;
•significant increases in competition in the banking and financial services industries;
•changes in the securities markets;
•significant turbulence or a disruption in the capital or financial markets and the effect of a fall in stock market prices on our investment securities;
•loss of consumer confidence and economic disruptions resulting from national disasters or terrorist activities;
•our ability to retain our existing customers, including our deposit relationships;
| ● |
•changes occurring in business conditions and inflation; •changes in technology or risks related to cybersecurity; •changes in deposit flows; •changes in accounting principles, policies, or guidelines; •our ability to maintain adequate internal control over financial reporting; •risks related to the continued use, availability and reliability of "benchmark" rates and the discontinuation of quotation of London Inter Bank Offered Rate ("LIBOR"); and •other risks and uncertainties detailed from time to time in our filings with the Securities and Exchange Commission (“SEC”). our ability to retain our existing customers, including our deposit relationships;
|
| ● | changes occurring in business conditions and inflation; |
| ● | changes in technology or risks related to cybersecurity; |
| ● | changes in deposit flows; |
| ● | changes in accounting principles, policies, or guidelines, including the impact of the new current expected credit loss (“CECL”) standard; |
| ● | our ability to maintain adequate internal control over financial reporting; |
| ● | risks related to the continued use, availability and reliability of London Inter-Bank Offered Rate (“LIBOR”) and other “benchmark” rates; and |
| ● | other risks and uncertainties detailed from time to time in our filings with the Securities and Exchange Commission (“SEC”). |
We have based our forward-looking statements on our current expectations about future events. Although we believe that the expectations reflected in and the assumptions underlying our forward-looking statements are reasonable, we cannot guarantee that these expectations will be achieved or the assumptions will be accurate. The Company disclaims any obligation to update such factors or to publicly announce the results of any revisions to any of the forward-looking statements included herein to reflect future events or developments. Additional information concerning these risks and uncertainties is contained in this Annual Report on Form 10-K for the year ended December 31, 2021,2023, included in Item 1A. Risk Factors and in our future filings with the SEC. Further information on The First Bancshares, Inc. is available in its filings with the Securities and Exchange Commission, available at the SEC’s website, http://www.sec.gov.
The First Bancshares, Inc. (“Company”) was incorporated on June 23, 1995 to serve as a bank holding company for The First Bank (“The First”), formerly known as The First, A National Banking Association, headquartered in Hattiesburg, Mississippi. The Company is a Mississippi corporation and is a registered bank holding company. The First began operations on August 5, 1996 from our main office in the Oak Grove community, which is now incorporated within the city of Hattiesburg. As of December 31,
2021,2023, The First operated
90116 locations in Mississippi, Alabama, Florida, Georgia and Louisiana. Our principal executive offices are located at 6480 U.S. Highway 98 West, Hattiesburg, Mississippi 39402, and our telephone number is (601) 268-8998.
The Company is a community-focused financial institution that offers a full range of financial services to individuals, businesses, municipal entities, and nonprofit organizations in the communities that it serves. These services include consumer and commercial loans, deposit accounts and safe deposit services.
We have
benefittedbenefited from historically strong asset quality metrics compared to most of our peers, which we believe illustrates our historically disciplined underwriting and credit culture. As such, we benefited from our strength by taking advantage of growth opportunities when many of our peers were unable to do so. We have also focused on growing earnings per share and increasing our tangible common equity and tangible book value per share.
In recent years, we have developed and executed a regional expansion strategy to take advantage of growth opportunities through several acquisitions, which has allowed us to expand our footprint to Alabama, Florida Louisiana and Georgia. We believe the conversion and integration of these acquisitions have been successful to date, and we are optimistic that these markets will continue to contribute to our future growth and success. In addition, we continue to experience organic loan growth by continuing to strengthen our relationships with existing clients and creating new relationships.
On January 15, 2022, The First, then named The First, A National Banking Association, converted from a national banking association to a Mississippi state-chartered bank and changed its name to The First Bank. The First Bank is now a member of the Federal Reserve System through the Federal Reserve Bank of Atlanta.
Unless otherwise indicated or unless the context requires otherwise, all references in this report to “the Company”, “we”, “us”, “our”, or similar references, mean The First Bancshares, Inc. and our subsidiaries, including our banking subsidiary, The First, on a consolidated basis. References to “The First” or the “Bank” mean our wholly owned banking subsidiary, The First Bank.
At December 31,
2021, we2023, The First employed
7941,078 full-time
equivalent employees spanning
5five states and
90116 locations.
We are In 2023 alone, our team members donated over 3,500 volunteer hours to more than 700 organizations including delivering financial education to over 52,000 community members and students.
The First is dedicated to providing competitive compensation and
benefitbenefits programs to help attract and maintain
highly skilled and
highly trainedexperienced employees. Our compensation and
benefitbenefits programs
include:include a
401-K401(k) plan with matching
contributions;contributions, a Loan Incentive Plan for our lending
officers; an Executive Incentive Plan; andofficers, an Employee Stock Ownership
Plan.Plan, healthcare and dental insurance benefits, health savings accounts, flexible spending accounts, life and disability insurance, as well as paid time off. The Company offers a Continuing Education Program for our employees to support and help them attain personal goals and professional achievements by encouraging and supporting those who pursue and participate in continuing their education.
We endeavor
The First endeavors to ensure that the
makeupcomposition of our employees, management team and board of directors are reflective of the diversity of the communities we serve.
WeAs a company, we believe in the importance of diversity,
and value the benefits that diversity
can bring,affords our organization, and
we are dedicated to fostering and maintaining an inclusive culture that solicits multiple perspectives and views and is free of conscious or unconscious bias and discrimination.
We strive
In addition to maintainmaintaining a safe and healthy working environment. We provideworkplace, The First provides our employees with access to a Grief Counseling and Confidential Assistance Program, which provides counseling services to employees on a confidential basis to ensure our employees get the help they may need.need when they need it. The First also has an Employee Support Program funded by our Heritage Community Foundation for bank employees who suffer a loss of loved ones, emergency medical procedures and other issues that affect employees. In response2023, our employees contributed over $76 thousand to the COVID-19 pandemic, we have taken steps to ensure the safety of ourHeritage Community Foundation, which benefited employees in need, nonprofit organizations and local disaster relief efforts.
clients by implementing procedures and protocols concerning: social distancing, business travel, sanitation and disinfection, encouraged employees to work remotely, improved and upgraded electronic delivery and execution of documents to limit in person exposure.
Market Areas
As of December 31,
2021,2023, The First had
90116 locations across Mississippi, Louisiana, Alabama, Florida and Georgia.
On January
15,1, 2023, we completed the acquisition of Heritage Southeast Bancorporation, Inc. ("HSBI"), pursuant to an Agreement and Plan of Merger dated July 7, 2022,
The First, then named The First, A National Banking Association, converted from a national banking association to a Mississippi state-chartered bankby and
changed its name tobetween the Company and HSBI. Upon completion of the merger of HSBI with and into the Company, Heritage Southeast Bank ("Heritage Bank"), HSBI's wholly-owned subsidiary, merged with and into The First Bank. The
First is nowCompany paid a
membertotal consideration of approximately $221.5 million to the former HSBI shareholders as consideration in the acquisition, which included approximately 6,920,909 shares of the
Federal Reserve System through the Federal Reserve BankCompany's common stock, and approximately $16 thousand in cash in lieu of
Atlanta.On December 3, 2021, the Bank completed its acquisition of seven Cadence Bank, N.A. (“Cadence”) branches in Northeast Mississippi (the “Cadence Branches”). In connection with the acquisition of the Cadence Branches, the Bank assumed $410.2 million in deposits, acquired $40.3 million in loans at fair value, acquired certain assets associated with the Cadence Branches at their book value, and paid a deposit premium of $1.0 million to Cadence.
fractional shares.
We strive to provide our customers with the breadth of products and services offered by large regional banks, while maintaining the timely response and personal service of a locally owned and managed bank. In addition to offering a full range of deposit services and loan products, we have a mortgage and private banking division. The following is a description of the products and services we offer.
Deposit Services. We offer a full range of deposit services that are typically available in most banks and savings institutions, including checking accounts, NOW accounts, savings accounts, and other time deposits of various types, ranging from daily money market accounts to longer-term certificates of deposit. The transaction accounts and time certificates are tailored to our principal market areas at rates competitive to those offered by other banks in these areas. All deposit accounts are insured by the Federal Deposit Insurance Corporation (“FDIC”) up to the maximum amount allowed by law. We solicit these accounts from individuals, businesses, associations, organizations, and governmental authorities. In addition, we offer certain retirement account services, such as Individual Retirement Accounts (IRAs) and health savings accounts.
Loan Products. We offer a full range of commercial and personal loans. Commercial loans include both secured and unsecured loans for working capital (including loans secured by inventory and accounts receivable), business expansion (including acquisition of real estate and improvements), and purchase of equipment and machinery.machinery, and interest rate swap agreements to facilitate the risk management strategies of certain commercial customers. Consumer loans include equity lines of credit, secured and unsecured loans for financing automobiles, home improvements, education, and personal investments. We also make real estate construction and acquisition loans. Our lending activities are subject to a variety of lending limits imposed by federal law. While differing limits apply in certain circumstances based on the type of loan or the nature of the borrower (including the borrower’s relationship to the bank), in general we are subject to an aggregate loans-to-one-borrower limit of 15% of our unimpaired capital and surplus.
Mortgage Loan Division. We have a residential mortgage loan division which originates conventional, or government agency insured loans to purchase existing residential homes, construct new homes or refinance existing mortgages.
Private Banking Division. We have a private banking division, which offers financial and wealth management services to individuals who meet certain criteria.
Other Services. Other bank services we offer include on-lineonline internet banking services, automated teller machines, voice response telephone inquiry services, commercial sweep accounts, cash management services, safe deposit boxes, merchant services, mobile deposit, direct deposit of payroll and social security checks, and automatic drafts for various accounts. We network with other automated teller machines that may be used by our customers throughout our market area and other regions. The First also offers credit card services through a correspondent bank.
CompetitionCompetition
The First generally competes with other financial institutions through the selection of banking products and services offered, the pricing of services, the level of service provided, the convenience and availability of services, and the degree of expertise and the personal manner in which services are offered. State law permits statewide branching by banks and savings institutions, and many financial institutions in our market area have branch networks. Consequently, commercial banking in Mississippi, Alabama, Louisiana, Florida, and Georgia is highly competitive. Many large banking organizations currently operate in our market area, several of which are controlled by out-of-state ownership. In addition, competition between commercial banks and thrift institutions (savings institutions and credit unions) has been intensified significantly by the elimination of many previous distinctions between the various types of financial institutions and the expanded powers and increased activity of thrift institutions in areas of banking which previously had been the sole domain of commercial banks. Federal legislation, together with other regulatory changes by the primary regulators of the various financial institutions, has resulted in the almost total elimination of practical distinctions between a commercial bank and a thrift institution. Consequently, competition among financial institutions of all types is largely unlimited with respect to legal ability and authority to provide most financial services. Currently there are numerous other commercial banks, savings institutions, and credit unions operating in The First’s primary service area.
We face increased competition from both federally-chartered and state-chartered financial and thrift institutions, as well as credit unions, consumer finance companies, insurance companies, and other institutions in the Company’s market area. Some of these competitors are not subject to the same degree of regulation and restriction imposed upon the Company. Many of these competitors also have broader geographic markets and substantially greater resources and lending limits than the Company and offer certain services such as trust banking that the Company does not currently provide. In addition, many of these competitors have numerous branch offices located throughout the extended market areas of the Company that may provide these competitors with an advantage in geographic convenience that the Company does not have at present.
We also compete with numerous financial and quasi-financial institutions for deposits and loans, including providers of financial services over the internet, and financial technology, or fintech companies. Recent technology advances and other changes have allowed parties to effect financial transactions that previously required the involvement of banks. For example, consumers can maintain funds in brokerage accounts or mutual funds that would have historically been held as bank deposits. Consumers can also complete transactions such as paying bills and transferring funds directly without the assistance of banks. These nontraditional financial service providers have been successful in developing digital and other products and services that effectively compete with traditional banking services, but are in some cases subject to fewer regulatory restrictions than banks and bank holding companies, allowing them to operate with greater flexibility and lower cost structures. Although digital products and services have been important competitive features of financial institutions for some time, the COVID-19 pandemic has accelerated the move toward digital financial services products and we expect that trend to continue.
Pursuant to the Securities Exchange Act of 1934, as amended (the “Exchange Act”) we are required to file Annual Reports on Form 10-K, Quarterly Reports on Form 10-Q, Current Reports on Form 8-K, proxy statements, and other filings pursuant to Section 13(a) or 15(d) of the Exchange Act, and amendments to such filings. The SEC maintains a website at www.sec.gov that contains the reports, proxy statements, and other filings we electronically file with the SEC. Such information is also available free of charge on or through our website www.thefirstbank.com as soon as reasonably practicable after each is electronically filed with, or furnished to, the SEC. Information appearing on the Company’s website is not part of any report that it files with the SEC.
SUPERVISION AND REGULATION
We are extensively regulated under federal and state law. The following is a brief summary that does not purport to be a complete description of all regulations that affect us or all aspects of those regulations. This discussion is qualified in its entirety by reference to the particular statutory and regulatory provisions described below and is not intended to be an exhaustive description of the statutes or regulations applicable to the Company’s and The First’s business. In addition, proposals to change the laws and regulations governing the banking industry are frequently raised at both the state and federal levels. The likelihood and timing of any changes in these laws and regulations, and the impact such changes may have on us and The First, are difficult to predict. In addition, bank regulatory agencies may issue enforcement actions, policy statements, interpretive letters and similar written guidance applicable to us
or to The First. Changes in applicable laws, regulations or regulatory guidance, or their interpretation by regulatory agencies or courts may have a material adverse effect on our and The First’s business, operations, and earnings.
We, The First, and our nonbank affiliates must undergo regular on-site examinations by the appropriate regulatory agency, which will examine for adherence to a range of legal and regulatory compliance responsibilities. A bank regulator conducting an examination has complete access to the books and records of the examined institution. The results of the examination are confidential. Supervision and regulation of banks, their holding companies and affiliates is intended primarily for the protection of depositors and customers, the
DIFDeposit Insurance Fund ("DIF") of the FDIC, and the U.S. banking and financial system rather than holders of our capital stock.
Bank Holding Company Regulation
We are registered as a bank holding company with the Federal Reserve under the Bank Holding Company Act, as amended ("BHC Act"). As such, we are subject to comprehensive supervision, and regulation by the Federal Reserve and are subject to its regulatory reporting requirements. Federal law subjects bank holding companies, such as the Company, to particular restrictions on the types of activities in which they may engage, and to a range of supervisory requirements and activities, including regulatory enforcement actions for violations of laws and regulations.
Violations of laws and regulations, or other unsafe and unsound practices, may result in regulatory agencies imposing fines or penalties, cease and desist orders, or taking other enforcement actions. Under certain circumstances, these agencies may enforce these remedies directly against officers, directors, employees, and other parties participating in the affairs of a bank or bank holding company. Like all bank holding companies, we are regulated extensively under federal and state law. Under federal and state laws and regulations pertaining to the safety and soundness of insured depository institutions, state banking regulators, the Federal Reserve, and separately the FDIC as the insurer of bank deposits, have the authority to compel or restrict certain actions on our part if they determine that we have insufficient capital or other resources, or are otherwise operating in a manner that may be deemed to be inconsistent with safe and sound banking practices. Under this authority, our bank regulators can require us or our subsidiaries to enter into informal or formal supervisory agreements, including board resolutions, memoranda of understanding, written agreements and consent or cease and desist orders, pursuant to which we would be required to take identified corrective actions to address cited concerns and to refrain from taking certain actions.
If we become subject to and are unable to comply with the terms of any future regulatory actions or directives, supervisory agreements, or orders, then we could become subject to additional, heightened supervisory actions and orders, possibly including consent orders, prompt corrective action restrictions and/or other regulatory actions, including prohibitions on the payment of dividends on our common
stock and preferred stock. If our regulators were to take such additional supervisory actions, then we could, among other things, become subject to significant restrictions on our ability to develop any new business, as well as restrictions on our existing business, and we could be required to raise additional capital, dispose of certain assets and liabilities within a prescribed period of time, or both. The terms of any such supervisory action could have a material negative effect on our business, reputation, operating flexibility, financial condition, and the value of our common
stock and preferred stock.
Bank holding companies are generally restricted to engaging in the business of banking, managing or controlling banks; and certain other activities determined by the Federal Reserve to be closely related to banking. In addition, the Federal Reserve has the power to order a bank holding company or its subsidiaries to terminate any nonbanking activity or terminate its ownership or control of any nonbank subsidiary, when it has reasonable cause to believe that continuation of such activity or such ownership or control constitutes a serious risk to the financial safety, soundness, or stability of any bank subsidiary of that bank holding company.
The BHC Act was substantially amended through the Financial Services Modernization Act
Source of 1999, commonly referred to as the Gramm-Leach Bliley Act, or the GLBA. The GLBA eliminated long-standing barriers to affiliations among banks, securities firms, insurance companies, and other financial services providers. Strength Obligations
A bank holding company, whose subsidiary deposit institutions are "well capitalized" and "well managed" may elect to become a "financial holding company" and thereby engage without prior Federal Reserve approval in certain banking and non-banking activities that are deemed to be financial in nature or incidental to financial activity. These "financial in nature" activities include securities underwriting, dealing, and market making; organizing, sponsoring, and managing mutual funds; insurance underwriting and agency; merchant banking activities; and other activities that the Federal Reserve has determined to be closely related to banking. Generally, no regulatory approval is required for a financial holding company to acquire a
company, other than a bank or savings association, engaged in activities that are financial in nature or incidental to activities that are financial in nature,such as determined by the Federal Reserve. The Company is not a financial holding company.
Source of Strength Obligations
A bank holding companyus, is required to act as a source of financial and managerial strength to its subsidiary bank. The term "source of financial strength" means the ability of a company, such as us, that directly or indirectly owns or controls an insured depository institution, such as The First, to provide financial assistance to such insured depository institution in the event of financial distress. The appropriate federal banking agency for the depository institution (in the case of The First, this agency is the Federal Reserve) may require reports from us to assess our ability to serve as a source of strength and to enforce compliance with the source of strength requirements by requiring us to provide financial assistance to The First in the event of financial distress. If we were to enter bankruptcy or become subject to the orderly liquidation process established by the Dodd-Frank Act, any commitment by us to a federal bank regulatory agency to maintain the capital of The First would be assumed by the bankruptcy trustee or the FDIC, as appropriate, and entitled to a priority of payment. In addition, the FDIC provides that any insured depository institution generally will be liable for any loss incurred by the FDIC in connection with the default of, or any assistance provided by the FDIC to, a commonly controlled insured depository institution. The First is an FDIC-insured depository institution and thus subject to these requirements.
The BHC Act permits acquisitions of banks by bank holding companies, such that we and any other bank holding company, whether located in Mississippi or elsewhere, may acquire a bank located in any other state, subject to certain deposit-percentage, age of bank charter requirements, and other restrictions. The BHC Act requires that a bank holding company obtain the prior approval of the Federal Reserve before (i) acquiring direct or indirect ownership or control of more than 5% of the voting shares of any additional bank or bank holding company, (ii) taking any action that causes an additional bank or bank holding company to become a subsidiary of the bank holding company, or (iii) merging or consolidating with any other bank holding company. The Federal Reserve may not approve any such transaction that would result in a monopoly or would be in furtherance of any combination or conspiracy to monopolize or attempt to monopolize the business of banking in any section of the United States, or the effect of which may be substantially to lessen competition or to tend to create a monopoly in any section of the country, or that in any other manner would be in restraint of trade, unless the anticompetitive effects of the proposed transaction are clearly outweighed by the public interest in meeting the convenience and needs of the community to be served. The Federal Reserve is also required to consider: (1) the financial and managerial resources of the companies involved, including pro forma capital ratios; (2) the risk to the stability of the United States banking or financial system; (3) the convenience and needs of the communities to be served, including performance under the
CRA;Community Reinvestment Act ("CRA"); and (4) the effectiveness of the companies in
combattingcombating money laundering.
Federal law restricts the amount of voting stock of a bank holding company or a bank that a person may acquire without the prior approval of banking regulators. Under the federal Change in Bank Control Act and the regulations thereunder, a person or group must give advance notice to the Federal Reserve before acquiring control of any bank holding company, such as the Company, or before acquiring control of any state member bank, such as The First. Upon receipt of such notice, the Federal Reserve may approve or disapprove the acquisition. The Change in Bank Control Act creates a rebuttable presumption of control if a member or group acquires a certain percentage or more of a bank holding company’s or bank’s voting stock. As a result, a person or entity generally must provide prior notice to the Federal Reserve before acquiring the power to vote 10% or more of our outstanding common stock. The overall effect of such laws is to make it more difficult to acquire a bank holding company and a bank by tender offer or similar means than it might be to acquire control of another type of corporation. Consequently, shareholders of the Company may be less likely to benefit from the rapid increases in stock prices that may result from tender offers or similar efforts to acquire control of other companies. Investors should be aware of these requirements when acquiring shares of our stock.
Governance and Financial Reporting Obligations
We are required to comply with various corporate governance and financial reporting requirements under the Sarbanes-Oxley Act of 2002, as well as rules and regulations adopted by the SEC, the Public Company Accounting Oversight Board ("PCAOB"), and NASDAQ. In particular, we are required to include management and independent registered public accounting firm reports on internal controls as part of our Annual Report on Form 10-K in order to comply with Section 404 of the Sarbanes-Oxley Act. We have evaluated our controls,
including compliance with the SEC rules on internal controls, and have and expect to continue to spend significant amounts of time and money on compliance with these rules. Our failure to comply with these internal control rules may materially adversely affect our reputation, ability to obtain the necessary certifications to financial statements, and the values of our securities.
The Dodd-Frank Act addresses many investor protections, corporate governance, and executive compensation matters that will affect most U.S. publicly traded companies. The Dodd-Frank Act (1) grants shareholders of U.S. publicly traded companies an advisory vote on executive compensation; (2) enhances independence requirements for Compensation Committee members; and (3) requires companies listed on national securities exchanges to adopt incentive-based compensation claw-back policies for executive officers.
Volcker Rule
Section 13 of the BHC Act, common referred to as the "Volcker Rule," generally prohibits banking organizations from (i) engaging in certain proprietary trading, and (ii) acquiring or retaining an ownership interest in or sponsoring a "covered fund," all subject to certain exceptions. The Volcker Rule also specifies certain limited activities in which banking organizations may continue to engage and requires us to maintain a compliance program. Banking, organizations, such as us, with $10 billion or less in total consolidated assets and with total trading assets and liabilities of less than 5% of total consolidated assets are exempt from the Volcker Rule.
The Dodd-Frank Act required the banking agencies and the SEC to establish joint rules or guidelines for financial institutions with more than $1 billion in assets, such as us and The First, which prohibit incentive compensation arrangements that the agencies determine to encourage inappropriate risks by the institution. The banking agencies issued proposed rules in 2011 and previously issued guidance on sound incentive compensation policies. In 2016, the banking agencies also proposed rules that would, depending upon the assets of the institution, directly regulate incentive compensation arrangements and would require enhanced oversight and recordkeeping. As of December 31,
2021,2023, these rules have not been
implemented by the banking agencies.implemented. We have undertaken efforts to ensure that our incentive compensation plans do not encourage inappropriate risks, consistent with three key principles-that incentive compensation arrangements should appropriately balance risk and financial rewards, be compatible with effective controls and risk management, and be supported by strong corporate governance.
In October 2022, the SEC adopted a final rule directing national securities exchanges and associations, including Nasdaq, to implement listing standards that require listed companies to adopt policies mandating the recovery or "clawback" of excess incentive-based compensation earned by a current or former executive officer during the three fiscal years preceding the date the listed company is required to prepare an accounting restatement, including to correct an error that would result in a material misstatement if the error were corrected in the current period or left uncorrected in the current period. Nasdaq's listing standards pursuant to the SEC's rule became effective on October 2, 2023. We adopted a compensation recovery policy pursuant to the Nasdaq listing standards effective as of October 2, 2023. The policy is included as Exhibit 97.1 to this Form 10-K.
Shareholder Say-On-Pay Votes
The Dodd-Frank Act requires public companies to take shareholders’ votes on proposals addressing compensation (known as say-on-pay), the frequency of a say-on-pay vote, and the golden parachutes available to executives in connection with change-in-control transactions. Public companies must give shareholders the opportunity to vote on the compensation at least every three years and the opportunity to vote on frequency at least every six years, indicating whether the say-on-pay vote should be held annually, biennially, or triennially. The say-on-pay, the say-on-parachute and the say-on-frequency votes are explicitly nonbinding and cannot override a decision of our Board of Directors.
We are subject to oversight by the SEC, the PCAOB, NASDAQ and various state securities and insurance regulators. We and our subsidiaries have from time to time received requests for information from regulatory authorities in various states, including state attorneys general, securities regulators and other regulatory authorities, concerning our business practices. Such requests are considered incidental to the normal conduct of business.
We and The First are each required under federal law to maintain certain minimum capital levels based on ratios of capital to total assets and capital to risk-weighted assets. The required capital ratios are minimums, and the Federal Reserve may determine that a banking organization, based on its size, complexity or risk profile, must maintain a higher level of capital in order to operate in a safe and sound manner. Risks such as concentration of credit risks and the risk arising from non-traditional activities, as well as the institution’s exposure to a decline in the economic value of its capital due to changes in interest rates, and an institution’s ability to manage those risks, are important factors that are to be taken into account by the federal banking agencies in assessing an institution’s overall capital adequacy.
The following is a brief description of the relevant provisions of these capital rules and their potential impact on our and The First’s capital levels.
We and The First are each subject to the following risk-based capital ratios: a CET1 risk-based capital ratio, a Tier 1 risk-based capital ratio, which includes CET1 and additional Tier 1 capital and a total capital ratio, which includes Tier 1 and Tier 2 capital. CET1
is primarily comprised of the sum of common stock instruments and related surplus net of treasury stock and retained earnings less certain adjustments and deductions, including with respect to goodwill, intangible assets, mortgage servicing assets and deferred tax assets subject to temporary timing differences. Additional Tier 1 capital is primarily comprised of noncumulative perpetual preferred stock. Tier 2 capital consists of instruments disqualified from Tier 1 capital, including qualifying subordinated debt and a limited amount of loan loss reserves up to a maximum of 1.25% of risk-weighted assets, subject to certain eligibility criteria. The capital rules also define the risk-weights assigned to assets and off-balance sheet items to determine the risk-weighted asset components of the risk-based capital rules, including, for example, certain "high volatility" commercial real estate, past due assets, structured securities and equity holdings.
The leverage capital ratio, which serves as a minimum capital standard, is the ratio of Tier 1 capital to quarterly average assets net of goodwill, certain other intangible assets, and certain required deduction items. The required minimum leverage ratio for all banks and bank holding companies (unless exempt) is 4%.
In addition, effective January 1, 2019, the capital rules required a capital conservation buffer of CET1 of 2.5% above each of the minimum capital ratio requirements (CET1, Tier 1, and total risk-based capital), which is designed to absorb losses during periods of economic stress. These buffer requirements must be met for a bank or bank holding company to be able to pay dividends, engage in share buybacks or make discretionary bonus payments to executive management without restriction.
Failure to be well-capitalized or to meet minimum capital requirements could result in certain mandatory and possible additional discretionary actions by regulators that, if undertaken, could have an adverse material effect on our operations or financial condition. Failure to be well-capitalized or to meet minimum capital requirements could also result in restrictions on the Company’s or The First’s ability to pay dividends or otherwise distribute capital or to receive regulatory approval of applications or other restrictions on its growth.
The Federal Deposit Insurance Corporation Improvement Act of 1991 ("FDICIA"), among other things, requires the federal bank regulatory agencies to take "prompt corrective action" regarding depository institutions that do not meet minimum capital requirements. FDICIA establishes five regulatory capital tiers: "well capitalized," "adequately capitalized," "undercapitalized," "significantly undercapitalized," and "critically undercapitalized." A depository institution’s capital tier will depend upon how its capital levels compare to various relevant capital measures and certain other factors, as established by regulation. FDICIA generally prohibits a depository institution from making any capital distribution (including payment of a dividend) or paying any management fee to its holding company if the depository institution would thereafter be undercapitalized. The FDICIA imposes progressively more restrictive restraints on operations, management and capital distributions, depending on the category in which an institution is classified. Undercapitalized depository institutions are subject to restrictions on borrowing from the Federal Reserve System. In addition, undercapitalized depository institutions may not accept brokered deposits absent a waiver from the FDIC, are subject to growth limitations and are required to submit capital restoration plans for regulatory approval. A depository
institution’s holding company must guarantee any required capital restoration plan, up to an amount equal to the lesser of 5% of the depository institution’s assets at the time it becomes undercapitalized or the amount of the capital deficiency when the institution fails to comply with the plan. Federal banking agencies may not accept a capital plan without determining, among other things, that the plan is based on realistic assumptions and is likely to succeed in restoring the depository institution’s capital. If a depository institution fails to submit an acceptable plan, it is treated as if it is significantly undercapitalized. All of the federal bank regulatory agencies have adopted regulations establishing relevant capital measures and relevant capital levels for federally insured depository institutions.
To be well-capitalized, The First must maintain at least the following capital ratios:
| ● | 6.5% CET1 to risk-weighted assets; |
| ● | 8.0% Tier 1 capital to risk-weighted assets; |
| ● | 10.0% Total capital to risk-weighted assets; and |
•6.5% CET1 to risk-weighted assets;
•8.0% Tier 1 capital to risk-weighted assets;
•10.0% Total capital to risk-weighted assets; and
•5.0% leverage ratio.
The First was well capitalized at December 31, 2021,2023, and brokered deposits are not restricted.
The Federal Reserve has not yet revised the well-capitalized standard for bank holding companies to reflect the higher capital requirements imposed under the current capital rules applicable to banks. For purposes of the Federal Reserve’s Regulation Y, bank holding companies, such as the Company, must maintain a Tier 1 risk-based capital ratio of 6.0% or greater and a total risk-based capital ratio of 10.0% or greater to be well-capitalized. If the Federal Reserve were to apply the same or a very similar well-capitalized standard to bank holding companies as that applicable to The First, the Company’s capital ratios as of December 31, 20212023 would exceed such revised well-capitalized standard. Also, the Federal Reserve may require bank holding companies, including the Company, to maintain capital ratios substantially in excess of mandated minimum levels, depending upon general economic conditions and a bank holding company’s particular condition, risk profile and growth plans.
On October 29, 2019, the federal banking agencies issued a final rule to simplify the regulatory capital requirements for eligible banks and holding companies with less than $10 billion in consolidated assets that opt into the Community Bank Leverage Ratio ("CBLR") framework, as required by Section 201 of the Economic Growth, Relief and Consumer Protection Act (the "Regulatory Relief Act"). A qualifying community banking organization that exceeds the CBLR threshold would be exempt from the agencies’ current capital framework, including the risk-based capital requirements and capital conservation buffer described above, and would be deemed well-capitalized under the agencies’ prompt corrective action regulations. The Regulatory Relief Act defines a "qualifying community banking organization" as a depository institution or depository institution holding company with total consolidated assets of less than $10 billion. Under the final rule, if a qualifying community banking organization elects to use the CBLR framework, it will be considered "well-capitalized" so long as its CBLR is greater than 9%. The First has chosen not to opt into the CBLR at this time.
In
2021,2023, our and The First’s regulatory capital ratios were above the applicable well-capitalized standards and met the capital conservation buffer. Based on current estimates, we believe that we and The First will continue to exceed all applicable well-capitalized regulatory capital requirements and the capital conservation buffer in
2022.2024. Certain regulatory capital ratios of the Company and The First, as of December 31,
2021,2023, are shown in the following table:
| | | | | | | | | | | |
| | Capital Adequacy Ratios | |
| | | | Regulatory | | Minimum | | | | | |
| | | | Minimums | | Capital Required | | | | | |
| | Regulatory | | to be Well | | Basel III Fully | | The First | | | |
| | Minimums | | Capitalized | | Phased-In | | Bancshares, Inc. | | The First | |
Common Equity Tier 1 risk-based capital ratio | | 4.5 | % | 6.5 | % | 7.0 | % | 13.7 | % | 16.6 | % |
Tier 1 risk-based capital ratio | | 6.0 | % | 8.0 | % | 8.5 | % | 14.1 | % | 16.6 | % |
Total risk-based capital ratio | | 8.0 | % | 10.0 | % | 10.5 | % | 18.6 | % | 17.4 | % |
Leverage ratio | | 4.0 | % | 5.0 | % | 4.0 | % | 9.2 | % | 10.8 | % |
| | | | | | | | | | | | | | | | | | | | | | | | | | | | | |
| Capital Adequacy Ratios |
| Regulatory
Minimums | | Regulatory
Minimums
to be Well
Capitalized | | Minimum Capital Required Basel III Fully Phased-In | | The First
Bancshares, Inc. | | The First |
| Common Equity Tier 1 risk-based capital ratio | 4.5 | % | | 6.5 | % | | 7.0 | % | | 12.1 | % | | 13.8 | % |
| Tier 1 risk-based capital ratio | 6.0 | % | | 8.0 | % | | 8.5 | % | | 12.5 | % | | 13.8 | % |
| Total risk-based capital ratio | 8.0 | % | | 10.0 | % | | 10.5 | % | | 15.0 | % | | 14.8 | % |
| Leverage ratio | 4.0 | % | | 5.0 | % | | 4.0 | % | | 9.7 | % | | 10.7 | % |
We are a legal entity separate and distinct from The First and our other subsidiaries. The primary sources of funds for our payment of dividends to our shareholders are cash on hand and dividends from The First. Various federal and state statutory provisions and regulations limit the amount of dividends that The First may pay.
In addition, in deciding whether or not to declare a dividend of any particular size, the Company’s board of directors must consider its and the Bank’s current and prospective capital, liquidity, and other needs. In addition to state law limitations on the Company’s ability to pay dividends, the Federal Reserve imposes limitations on the Company’s ability to pay dividends. Federal Reserve regulations limit dividends, stock repurchases and discretionary bonuses to executive officers if the Company’s regulatory capital is below the level of regulatory minimums plus the applicable capital conservation buffer.
In addition, we and The First are subject to various general regulatory policies and requirements relating to the payment of dividends, including requirements to maintain adequate capital above regulatory minimums. The appropriate federal bank regulatory authority may prohibit the payment of dividends where it has determined that the payment of dividends would be an unsafe or unsound practice. The Federal Reserve has indicated that paying dividends that deplete a bank’s capital base to an inadequate level would be an unsound and unsafe banking practice. The Federal Reserve has indicated that depository institutions and their holding companies should generally pay dividends only out of current operating earnings. Further, under Mississippi law, The First must obtain the non-objection of the Commissioner of the Mississippi Department of Banking and Consumer Finance prior to paying any dividend to the Company.
Under a Federal Reserve policy adopted in 2009, the board of directors of a bank holding company must consider different factors to ensure that its dividend level is prudent relative to maintaining a strong financial position, and is not based on overly optimistic earnings scenarios, such as potential events that could affect its ability to pay, while still maintaining a strong financial position. As a general matter, the Federal Reserve has indicated that the board of directors of a bank holding company should consult with the Federal Reserve and eliminate, defer or significantly reduce the bank holding company’s dividends if:
| ● | its net income available to shareholders for the past four quarters, net of dividends previously paid during that period, is not sufficient to fully fund the dividends; |
| ● | its prospective rate of earnings retention is not consistent with its capital needs and overall current and prospective financial condition; or |
| ● | it will not meet, or is in danger of not meeting, its minimum regulatory capital adequacy ratios. |
•its net income available to shareholders for the past four quarters, net of dividends previously paid during that period, is not sufficient to fully fund the dividends;
•its prospective rate of earnings retention is not consistent with its capital needs and overall current and prospective financial condition; or
•it will not meet, or is in danger of not meeting, its minimum regulatory capital adequacy ratios.
The First, which is a member of the Federal Reserve System, is subject to comprehensive supervision and regulation by the Federal Reserve, and is subject to its regulatory reporting requirements, as well as supervision and regulation by the Mississippi Department of Banking and Consumer Finance. As a member bank of the Federal Reserve System, The First is required to hold stock in its district Federal Reserve Bank in an amount equal to 6% of its capital stock and surplus (half paid to acquire stock with the remainder held as a cash reserve). Member banks do not have any control over the Federal Reserve System as a result of owning the stock and the stock cannot be sold or traded.
The deposits of The First are insured by the FDIC up to applicable limits, and, accordingly, The First is also subject to certain FDIC regulations and the FDIC has backup examination authority and some enforcement powers over The First.
In addition, as discussed in more detail below, The First and any other of our subsidiaries that offer consumer financial products and services are subject to regulation and potential supervision by the
CFPB.Consumer Financial Protection Bureau ("CFPB"). In addition, the Dodd-Frank Act permits states to adopt consumer protection laws and regulations that are stricter than those regulations promulgated by the CFPB, and state attorneys general are permitted to enforce certain federal consumer financial protection law.
Broadly, regulations applicable to The First include limitations on loans to a single borrower and to its directors, officers and employees; restrictions on the opening and closing of branch offices; the maintenance of required capital
ratios; the granting of credit under equal and fair conditions; the disclosure of the costs and terms of such credit; requirements to maintain reserves against deposits and loans; limitations on the types of investment that may be made by The First; requirements governing risk management practices; restrictions on the ability of institutions to guarantee its debt; and certain specific accounting requirements on the Company that may be more restrictive and may result in greater or earlier charges to earnings or reductions in its capital than generally accepted accounting principles.
Transactions with Affiliates and Insiders
The First is subject to restrictions on extensions of credit and certain other transactions between The First and the Company or any nonbank affiliate. Generally, these covered transactions with either the Company or any affiliate are limited to 10% of The First’s capital and surplus, and all such transactions between The First Bank and the Company and all of its nonbank affiliates combined are limited to 20% of The First’s capital and surplus. Loans and other extensions of credit from The First to the Company or any affiliate generally are required to be secured by eligible collateral in specified amounts. In addition, any transaction between The First and the Company or any affiliate are required to be on an arm’s length basis.
Federal banking laws also place similar restrictions on certain extensions of credit by insured banks, such as The First, to their directors, executive officers and principal shareholders.
Federal Reserve rules require depository institutions, such as The First, to maintain reserves against their transaction accounts, primarily NOW and regular checking accounts. Effective March 26, 2020, the Federal Reserve eliminated reserve requirements for all depository institutions. These reserve requirements are subject to annual adjustment by the Federal Reserve.
FDIC Insurance Assessments and Depositor Preference
The First’s deposits are insured by the FDIC’s DIF up to the limits under applicable law, which currently are set at $250,000 per depositor, per insured bank, for each account ownership category. The First is subject to FDIC assessments for its deposit insurance. The FDIC calculates quarterly deposit insurance assessments based on an institution’s average total consolidated assets less its average tangible equity, and applies one of four risk categories determined by reference to its capital levels, supervisory ratings, and certain other factors. The assessment rate schedule can change from time to time, at the discretion of the FDIC, subject to certain limits.
As of June 30, 2020, the DIF reserve ratio fell to 1.30%, below the statutory minimum of 1.35%. The FDIC, as required under the Federal Deposit Insurance Act, established a plan on September 15, 2020 to restore the DIF reserve ration to meet or exceed the statutory minimum of 1.35% within eight years. On October 18, 2022, the FDIC adopted an amended restoration plan to increase the likelihood that the reserve ratio would be restored to at least 1.35% by September 30, 2028. The FDIC's amended restoration plan increases the initial base deposit insurance assessment rate schedules uniformly by 2 basis points, beginning in the first quarterly assessment period of 2023. The FDIC could further increase the deposit insurance assessments for certain insured depository institutions, including The First, if the DIF reserve ratio is not restored as projected.
In November 2023, the FDIC approved a final rule to implement a special assessment to recover the loss to DIF associated with several bank failures that occurred during early 2023. The assessment base for the special assessment is equal to estimated uninsured deposits reported as of December 31, 2022, adjusted to exclude the first $5 billion, to be collected at an annual rate of approximately 13.4 basis points for an anticipated total of eight quarterly assessment periods, beginning the first quarterly assessment period of 2024. The First did not have uninsured deposits in excess of $5 billion, and so is not subject to this special assessment.
Insurance of deposits may be terminated by the FDIC upon a finding that the institution has engaged in unsafe and unsound practices, is in an unsafe or unsound condition to continue operations, or has violated any applicable law, regulation, rule, order or condition imposed by a bank’s federal regulatory agency. In addition, the Federal Deposit Insurance Act provides that, in the event of the liquidation or other resolution of an insured depository institution, the claims of depositors of the institution, including the claims of the FDIC as subrogee of insured depositors, and certain claims for administrative expenses of the FDIC as a receiver, will have priority over other general unsecured claims against the institution, including those of the parent bank holding company.
Standards for Safety and Soundness
The Federal Deposit Insurance Act requires the federal bank regulatory agencies to prescribe, by regulation or guideline, operational and managerial standards for all insured depository institutions relating to: (1) internal controls; (2) information systems and audit systems; (3) loan documentation; (4) credit underwriting; (5) interest rate risk exposure; and (6) asset quality. The federal banking agencies have adopted regulations and Interagency Guidelines Establishing Standards for Safety and Soundness to implement these required standards. These guidelines set forth the safety and soundness standards used to identify and address problems at insured depository institutions before capital becomes impaired. Under the regulations, if a regulator determines that a bank fails to meet any standards prescribed by the guidelines, the regulator may require the bank to submit an acceptable plan to achieve compliance, consistent with deadlines for the submission and review of such safety and soundness compliance plans.
Under the Uniting and Strengthening America by Providing Appropriate Tools Required to Intercept and Obstruct Terrorism (“USA PATRIOT”) Act of 2001, financial institutions are subject to prohibitions against specified financial transactions and account relationships as well as enhanced due diligence and “know your customer” standards in their dealings with foreign financial institutions and foreign customers. The USA PATRIOT Act, and its implementing regulations adopted by the FinCEN, a bureau of the U.S. Department of the Treasury, requires financial institutions to establish anti-money laundering programs with minimum standards that include:
| ● | the development of internal policies, procedures, and controls; |
| ● | the designation of a compliance officer; |
| ● | an ongoing employee training program; |
| ● | an independent audit function to test the programs; and |
| ● | identify and verify the identity of beneficial owners of legal entity customers. |
•the development of internal policies, procedures, and controls;
•the designation of a compliance officer;
•an ongoing employee training program;
•an independent audit function to test the programs; and
•identify and verify the identity of beneficial owners of legal entity customers.
Banking regulators will consider compliance with the Act’s money laundering provisions in acting upon acquisition and merger proposals. Bank regulators routinely examine institutions for compliance with these obligations and have been active in imposing cease and desist and other regulatory orders and money penalty sanctions against institutions found to be violating these obligations. Sanctions for violations of the Act can be imposed in an amount equal to twice the sum involved in the violating transaction, up to $1 million. On January 1, 2021, Congress passed federal legislation that made sweeping changes to federal anti-money laundering laws, including changes that will be implemented in subsequent years.
The
OFACOffice of Foreign Assets Control ("OFAC") is responsible for helping to ensure that U.S. entities do not engage in transactions with certain prohibited parties, as defined by various Executive Orders and acts of Congress. OFAC publishes, and routinely updates, lists of names of persons and organizations suspected of aiding, harboring or engaging in terrorist acts, including the Specially Designated Nationals and Blocked Persons List. If we find a name on any transaction, account or wire transfer that is on an OFAC list, we must undertake certain specified activities, which could include blocking or freezing the account or transaction requested, and we must notify the appropriate authorities.
Concentrations in Lending
During 2006, the federal bank regulatory agencies released guidance on “Concentrations in Commercial Real Estate Lending” (the “Guidance”) and advised financial institutions of the risks posed by CRE lending concentrations. The Guidance requires that appropriate processes be in place to identify, monitor and control risks associated with real estate lending concentrations. Higher allowances for loan losses and capital levels may also be required. The Guidance is triggered when CRE loan concentrations exceed either:
| ● | Total reported loans for construction, land development, and other land of 100% or more of a bank’s total risk-based capital; or |
| ● | Total reported loans secured by multifamily and nonfarm nonresidential properties and loans for construction, land development, and other land of 300% or more of a bank’s total risk-based capital. |
•Total reported loans for construction, land development, and other land of 100% or more of a bank’s total risk-based capital; or
•Total reported loans secured by multifamily and nonfarm nonresidential properties and loans for construction, land development, and other land of 300% or more of a bank’s total risk-based capital.
The Guidance also applies when a bank has a sharp increase in CRE loans or has significant concentrations of CRE secured by a particular property type. We have always had exposures to loans secured by CRE due to the nature of our markets and the loan needs of both retail and commercial customers. We believe our long term experience in CRE lending, underwriting policies, internal controls, and other policies currently in place, as well as our loan and credit monitoring and administration procedures, are generally appropriate to managing our concentrations as required under the Guidance.
Community Reinvestment Act
The First is subject to the provisions of the CRA, which imposes a continuing and affirmative obligation, consistent with their safe and sound operation, to help meet the credit needs of entire communities where the bank accepts deposits, including low- and moderate-income neighborhoods. The Federal Reserve’s assessment of The First’s CRA record is made available to the public. Further, a less than satisfactory CRA rating will slow, if not preclude, expansion of banking activities and prevent a company from becoming or remaining a financial holding company. Following the enactment of the Gramm-Leach-Bliley Act (“GLB”), CRA agreements with private parties must be disclosed and annual CRA reports must be made to a bank’s primary federal regulator. A bank holding company will not be permitted to become or remain a financial holding company and no new activities authorized under GLB may be commenced by a holding company or by a bank financial subsidiary if any of its bank subsidiaries received less than a “satisfactory” CRA rating in its latest CRA examination. Federal CRA regulations require, among other things, that evidence of discrimination against applicants on a prohibited basis, and illegal or abusive lending practices be considered in the CRA evaluation. The First has a rating of “Satisfactory” in its most recent CRA evaluation.
On October 24, 2023, the OCC, the FRB, and FDIC issued a final rule to modernize their respective CRA regulations. The revised rules substantially alter the methodology for assessing compliance with the CRA, with material aspects taking effect January 1, 2026 and revised data reporting requirements taking effect January 1, 2027. Among other things, the revised rules evaluate lending outside traditional assessment areas generated by the growth of non-branch delivery systems, such as online and mobile banking, apply a metrics-based benchmarking approach to assessment, and clarify eligible CRA activities. The final rules may make it more challenging and/or costly for the Bank to receive a rating of at least "satisfactory" on its CRA exam.
Privacy, Credit Reporting, and Data Security
The GLB generally prohibits disclosure of consumer information to non-affiliated third parties unless the consumer has been given the opportunity to object and has not objected to such disclosure. Financial institutions are further required to disclose their privacy policies to customers annually. Financial institutions, however, will be required to comply with state law if it is more protective of consumer privacy than the GLB. The GLB also directed federal regulators to prescribe standards for the security of consumer information. The First is subject to such standards, as well as standards for notifying customers in the event of a security breach. The First utilizes credit bureau data in underwriting activities. Use of such data is regulated under the Fair Credit Reporting Act and Regulation V on a uniform, nationwide basis, including credit reporting, prescreening, and sharing of information between affiliates and the use of credit data. The Fair and Accurate Credit Transactions Act, which amended the Fair Credit Reporting Act, permits states to enact identity theft laws that are not inconsistent with the conduct required by the provisions of that Act. We are also required to have an information security program to safeguard the confidentiality and security of customer information and to ensure proper disposal.
Customers must be notified when unauthorized disclosure involves sensitive customer information that may be misused. On November 18, 2021, theThe federal banking agencies issued a new rule effective in 2022 that requiresalso require banks to notify their regulators within 36 hours of a “computer-security incident” that rises to the level of a “notification incident.”
In general, a bank may not extend credit, lease, sell property, or furnish any services or fix or vary the consideration for them on the condition that (1) the customer obtain or provide some additional credit, property, or services from or to the bank or bank holding company or their subsidiaries or (2) the customer not obtain some other credit, property, or services from a competitor, except to the extent reasonable conditions are imposed to assure the soundness of the credit extended. A bank may, however, offer combined-balance products and may otherwise offer more favorable terms if a customer obtains two or more traditional bank products. The law also expressly permits banks to engage in other forms
of tying and authorizes the Federal Reserve to grant additional exceptions by regulation or order. Also, certain foreign transactions are exempt from the general rule.
Activities of The First are subject to a variety of statutes and regulations designed to protect consumers. These laws and regulations include, among numerous other things, provisions that:
| ● | limit the interest and other charges collected or contracted for by The First, including rules respecting the terms of credit cards and of debit card overdrafts; |
| ● | govern The First’s disclosures of credit terms to consumer borrowers; |
| ● | require The First to provide information to enable the public and public officials to determine whether it is fulfilling its obligation to help meet the housing needs of the communities it serves; |
| ● | prohibit The First from discriminating on the basis of race, creed or other prohibited factors when it makes decisions to extend credit; |
| ● | govern the manner in which The First may collect consumer debts; and |
| ● | prohibit unfair, deceptive or abusive acts or practices in the provision of consumer financial products and services. |
•limit the interest and other charges collected or contracted for by The First, including rules respecting the terms of credit cards and of debit card overdrafts;
•govern The First’s disclosures of credit terms to consumer borrowers;
•require The First to provide information to enable the public and public officials to determine whether it is fulfilling its obligation to help meet the housing needs of the communities it serves;
•prohibit The First from discriminating on the basis of race, creed or other prohibited factors when it makes decisions to extend credit;
•govern the manner in which The First may collect consumer debts; and
•prohibit unfair, deceptive or abusive acts or practices in the provision of consumer financial products and services.
The CFPB has issued rules to implement requirements of the Dodd-Frank Act pertaining to mortgage loan origination (including with respect to loan originator compensation and loan originator qualifications) as well as integrated mortgage disclosure rules. In addition, the CFPB has issued rules that require servicers to comply with new standards and practices with regard to: error correction; information disclosure; force-placement of insurance; information management policies and procedures; requiring information about mortgage loss mitigation options be provided to delinquent borrowers; providing delinquent borrowers access to servicer personnel with continuity of contact about the borrower’s mortgage loan account; and evaluating borrowers’ applications for available loss mitigation options. These rules also address initial rate adjustment notices for adjustable-rate mortgages (ARMs), periodic statements for residential mortgage loans, and prompt crediting of mortgage payments and response to requests for payoff amounts.
In 2020, the CARES Act granted certain forbearance rights and protection against foreclosure to borrowers with a “federally backed mortgage loan,” including certain first or subordinate lien loans designed principally for the occupancy of one to four families. These consumer protections continued during the COVID 19 pandemic emergency.
Non-Discrimination Policies
The First is also subject to, among other things, the provisions of the Equal Credit Opportunity Act (the “ECOA”) and the Fair Housing Act (the “FHA”), both of which prohibit discrimination based on race or color, religion, national origin, sex, and familial status
in any aspect of a consumer or commercial credit or residential real estate transaction. The Department of Justice (the “DOJ”), and the federal bank regulatory agencies have issued an Interagency Policy Statement on Discrimination in Lending that provides guidance to financial institutions in determining whether discrimination exists, how the agencies will respond to lending discrimination, and what steps lenders might take to prevent discriminatory lending practices. The DOJ has increased its efforts to prosecute what it regards as violations of the ECOA and FHA.
Effect of Governmental Monetary and Fiscal Policies
The difference between the interest rate paid on deposits and other borrowings and the interest rate received on loans and securities comprises most of a bank’s earnings. In order to mitigate the interest rate risk inherent in the industry, the banking business is becoming increasingly dependent on the generation of fee and service charge revenue.
The earnings and growth of a bank are affected by both general economic conditions and the monetary and fiscal policy of the U.S. government and its agencies, particularly the Federal Reserve. The Federal Reserve sets national monetary policy such as seeking to curb inflation and combat recession. This is accomplished by its open-market operations in U.S. government securities, adjustments in the amount of reserves that financial institutions are required to maintain and adjustments to the discount rates on borrowings and target rates for federal funds transactions. The actions of the Federal Reserve in these areas influence the growth of bank loans, investments and deposits and also affect interest
rates on loans and deposits. The nature and timing of any future changes in monetary policies and their potential impact on the Company cannot be predicted.
Our business is subject to risk. The following discussion, along with management’s discussion and analysis and our financial statements and footnotes, sets forth the most significant risks and uncertainties that we believe could adversely affect our business, financial condition or results of operations. Additional risks and uncertainties that management is not aware of or that management currently deems immaterial may also have a material adverse effect on our business, financial condition or results of operations. There is no assurance that this discussion covers all potential risks that we face. Further, to the extent that any of the information contained in this Annual Report on Form 10-K constitutes forward-looking statements, the risk factors set forth below also are cautionary statements identifying important factors that could cause our actual results to differ materially from those expressed in any forward-looking statements made herein.
Risk Factors Associated with Our Business
General economic conditions in the areas where our operations or loans are concentrated may adversely affect our financial results or liquidity.
A sudden or severe downturn in the economy in the geographic markets we serve in the states of Mississippi, Louisiana, Alabama, Florida or Georgia may affect the ability of our customers to meet loan payment obligations on a timely basis. The local economic conditions in these areas have a significant impact on our commercial, real estate, and construction loans, the ability of borrowers to repay these loans and the value of the collateral securing such loans. Any deterioration in the economic conditions of these market areas could negatively impact the financial results of the Company’s banking operations, earnings, and profitability.
Our Bank requires liquidity in the form of available funds to meet its deposit, debt and other obligations as they come due, borrower requests to draw on committed credit facilities as well as unexpected demands for cash payments. Adverse economic changes may cause customers to withdraw deposit balances, thereby causing a strain on our liquidity.
Moreover, customers with larger uninsured deposit account balances often are small-and mid-sized businesses that rely upon deposit funds for payment of operational expenses and, as a result, are more likely to closely monitor for financial condition and performance of their depository institutions. As a result, in the event of financial distress, uninsured depositors historically have been more likely to withdraw their deposits. If a significant portion of our deposits were to be withdrawn within a short period of time, additional sources of liquidity may be required to meet withdrawal demands. We have historically had access to a number of alternative sources of liquidity, but if there is an increase in volatility in the credit and liquidity markets there is no assurance that we will be able to obtain such liquidity on terms that are favorable to us, or at all.
We may be vulnerable to certain sectors of the economy, including real estate.
A significant portion of our loan portfolio is secured by real estate. TheReal estate values in our markets have experienced periods of fluctuation over the last several years, and the market value of real estate can fluctuate significantly in a relatively short period of time as a result of market conditions in the geographic area in which the real estate is located.time. If the economy deteriorates and real estate values decline materially in one or more of our markets, the credit risk associated with our loan portfolio could increase, a significant part of our loan portfolio could become under-collateralized
and losses incurred upon borrower defaults would increase. This could result in additional loancredit loss accruals which would negatively impact our earnings. Our ability to dispose of foreclosed real estate at prices above the respective carrying values could also be impacted, which could cause our results of operations to be adversely affected.
Unpredictable market conditions may adversely affect the industry in which we operate.
The capital and credit markets are subject to volatility and disruption. Dramatic declines in the housing market in years past caused home prices to fall and increased foreclosures, unemployment and under-employment. These events, if they were to happen again, could negatively impact the credit performance of mortgage loans and result in significant write-downs of asset values, including government-sponsored entities as well as major commercial and investment banks. Market turmoil and tightening of credit could lead to an increased level of commercial and consumer delinquencies, lack of consumer confidence and widespread reduction of business activity. Generally, a worsening of these conditions would have
an adverse effect on us and others in the financial institution industry, particularly in our real estate markets, as lower home prices and increased foreclosures would result in higher charge-offs and delinquencies.
The state of the economy and various economic factors, including inflation, recession, unemployment, interest rates and the level of U.S. debt, as well as governmental action and uncertainty resulting from U.S. and global political trends, may directly and indirectly, have a destabilizing effect on our financial condition and results of operations.
In addition, the U.S. government's decisions regarding its debt ceiling and the possibility that the U.S. could default on its debt obligations could cause further interest rate increases, disrupt access to capital markets and deepen recessionary conditions. An unfavorable or uncertain national or regional political or economic environment could drive losses beyond those which are provided for in our allowance for
loancredit losses and could negatively impact our results of operations.
We must maintain an appropriate allowance for credit losses.
The First, as lender, is exposed to the risk that its customers will be unable to repay their loans in accordance with their terms and that any collateral securing the payment of their loans may not be sufficient to assure repayment. Credit losses are inherent in the business of making loans and could have a material adverse effect on our operating results. Credit risk with respect to our real estate and construction loan portfolio relates principally to the creditworthiness of the borrower corporations and the value of the real estate serving as security for the repayment of loans. Credit risk with respect to our commercial and consumer loan portfolio will relate principally to the general creditworthiness of the borrower businesses and individuals within our local markets.
On January 1, 2021, the Company adopted the Accounting Standards Update ("ASU") 2016-13, Financial Instruments - Credit Losses ("ASC 326.326"). The FASBFinancial Accounting Standards Board (the “FASB”) issued ASC 326 to replace the incurred loss model for loans and other financial assets with an expected loss model and requires consideration of a wider range of reasonable and supportable information to determine credit losses. In accordance with ASC 326, the Company has developed an allowance for credit losses (“ACL”) methodology effective January 1, 2021, which replaces its previous allowance for loan losses methodology. The ACL is a valuation account that is deducted from loans’ amortized cost basis to present the net amount expected to be collected on the loans. Loans are charged-off against the allowance when management believes the uncollectibility of a loan balance is confirmed. Expected recoveries do not exceed the aggregate of amounts previously charged-off and expected to be charged-off. Management estimates the allowance balance using relevant available information, from internal and external sources, relating to past events, current conditions, and reasonable and supportable forecasts. Historical credit loss experience provides the basis for the estimation of expected credit losses. Adjustments to historical loss information are made for differences in current risk characteristics such as differences in underwriting standards, portfolio mix, delinquency level, or term as well as for changes in environment conditions, such as changes in unemployment rates, property values, or other relevant factors. Management may selectively apply external market data to subjectively adjust the Company’s own loss history including index or peer data. Management evaluates the adequacy of the ACL quarterly and makes provisions for credit losses based on this evaluation. See Note B – Summary of Significant Accounting Policies in the notes to consolidated financial statements.
Changes in economic conditions or individual business or personal circumstances affecting borrowers, new information regarding existing loans, identification of additional problem loans and other factors, both within and outside of our control, may require an increase in the ACL. Further, if actual charge-offs in future periods exceed our estimation of charge-offs, we may need additional provision for loan losses to restore the adequacy of our ACL. If we are required to materially increase our level of ACL for any reason, such increases could have an adverse effect on our business, financial condition, and results of operations.
We are subject to risks related to changes in market interest rates.
Our assets and liabilities are primarily monetary in nature, and as a result we are subject to significant risks resulting from changes in interest rates. Our profitability is largely dependent upon net interest income. Unexpected movement in interest rates markedly changing the slope of the current yield curve could cause net interest margins to decrease, subsequently decreasing net interest income. In addition, such changes could adversely affect the valuation of our assets and liabilities.
The fair market value of the securities portfolio and the investment income from these securities also fluctuates depending on general economic and market conditions. In addition, actual net investment income and/or cash flows from investments that carry prepayment risk, such as mortgage-backed and other asset-backed securities, may differ from those anticipated at the time of investment as a result of interest rate fluctuations.
At present
Beginning in early 2022, in response to growing signs of inflation, the
Company’s one-year interest rate sensitivity position is asset sensitive. As with most financial institutions, the Company’s results of operations are affected by changes inFRB increased interest rates
rapidly. Further, the FRB has increased the benchmark rapidly and
has announced an intention to take further actions to mitigate rising inflationary pressures. Rising interest rates can have a negative impact on our business by reducing the
Company’samount of money our clients borrow or by adversely affecting their ability to
manage this risk. The difference betweenrepay outstanding loan balances that may increase due to adjustments in their variable rates. In addition, as interest rates
chargedrise, so have competitive pressures on
interest-earning assets andthe deposit cost of funds. We may have to offer more attractive interest rates
paid on interest-bearing liabilities may be affected by changes in market interest rates, changes in relationships between interest rate indices, and/to depositors to compete for deposits, or
changes in the relationships between long-term and short-term market interest rates. A change in this difference mightpursue other sources of liquidity, such as wholesale funds, which could result in
an increase in interest expense relative to interest income, or a decrease in the Company’s interest rate spread.We may be adversely affected by changes in the method of determining the London Interbank Offered Rate (“LIBOR”), or the replacement of LIBOR with an alternative reference rate, for our variable rate loans and the interest expense paidnegative pressure on our subordinated notes and our subordinated debentures.
In July 2017, the United Kingdom’s Financial Conduct Authority (“FCA”), which regulates LIBOR, announced that it intends to stop persuading or compelling banks to submit rates for the calculation of LIBOR to the LIBOR administration after 2021. In November 2020, the FCA announced it will consult on its intention to extend the retirement date of certain offered rates whereby the publication of the one week and two month LIBOR offered rates will cease after December 31, 2021; but the publication of the remaining LIBOR offered rates will continue until June 20, 2023. The Alternative Reference Rate Committee has announced secured overnight financing rate (“SOFR”) as its recommended alternative to LIBOR. SOFR is a measure of the cost of borrowing cash overnight, collateralized by the U.S. Treasury securities, and is based on directly observable U.S. Treasury-backed repurchase transactions. At this time, itnet interest income. It is not possible to predict whether these specific recommendationsthe pace and proposalsmagnitude of changes in interest rates, or the impact rate changes will be broadly accepted, whether they will continue to evolve, and what the effect of their implementation may behave on the markets for floating-rate financial instruments.
AsCompany’s results of December 31, 2021, approximately $55.3 million or 1.9% of our outstanding loans were indexed to 30-day, 90-day, and one-year LIBOR. The transition from LIBOR has resulted in and could continue to result in added costs and employee efforts and could present additional risk. We are subject to litigation and reputational risks if we are unable to renegotiate and amend existing contracts with counterparties that are dependent on LIBOR, including contracts that do not have fallback language.
Uncertainty as to the nature of such potential changes, alternative reference rates, the replacement or disappearance of LIBOR or other reforms may adversely affect the value of and the return on our subordinated notes and our subordinated debentures, as well as the interest we pay on those securities.
operations.
Certain changes in interest rates, inflation, or the financial markets could affect demand for our products and our ability to deliver products efficiently.
Loan originations, and therefore loan revenues, could be adversely impacted by rising interest rates. Increases in market interest rates can have negative impacts on our business, including reducing our customers’ desire to borrow money from us or adversely affecting their ability to repay their outstanding loans by increasing their debt service obligations through the periodic reset of adjustable interest rate loans. If our borrowers’ ability to repay their loans is impaired by increasing interest payment obligations, our level of non-performing assets would increase, producing an adverse effect on operating results. Asset values, especially commercial real estate as collateral, securities or other fixed rate earning assets, can decline significantly with relatively minor changes in interest rates. If interest rates were to decrease, our yield on our variable rate loans and on our new loans would decrease, reducing our net interest income. In addition, lower interest rates may reduce our realized yields on investment securities, which would reduce our net interest income and cause downward pressure on net interest margin in future periods. A significant reduction in our net interest income could have a material adverse impact on our capital, financial condition and results of operations. Continued increases in inflation could cause operating costs related to salaries and benefits, technology, and supplies to increase at a faster pace than revenues.
Evaluation of investment securities for impairment involves subjective determinations and could materially impact our results of operations and financial condition.
The evaluation of impairments is a quantitative and qualitative process, which is subject to risks and uncertainties, and is intended to determine whether declines in the fair value of investments should be recognized in current period earnings. The risks and uncertainties include changes in general economic conditions, the issuers’ financial condition or future recovery prospects, the effects of changes in interest rates or credit spreads and the expected recovery period. Estimating future cash flows involves incorporating information received from third-party sources and making internal assumptions and judgments regarding the future performance of the underlying collateral and assessing the probability that an adverse change in future cash flows has occurred. The determination of the amount of impairments is based upon the Company’s quarterly evaluation and assessment of known and inherent risks associated with the respective asset class. Such evaluations and assessments are revised as conditions change and new information becomes available.
Additionally, our management considers a wide range of factors about the security issuer and uses its reasonable judgment in evaluating the cause of the decline in the estimated fair value of the security and in assessing the prospects for recovery. Inherent in management’s evaluation of the security are assumptions and estimates about the operations of the issuer and its future earnings potential. Impairments to the carrying value of our investment securities may need to be taken in the future, which could have a material adverse effect on our results of operations and financial condition.
Changes in the policies of monetary authorities and other government action could adversely affect profitability.
The results of operations of the Company are affected by credit policies of monetary authorities, particularly the Board of Governors of the Federal Reserve System, which we refer to as the Federal Reserve Board. The instruments of monetary policy employed by the Federal Reserve Board include open market operations in U.S. government securities, changes in the discount rate or the federal funds rate on bank borrowings and changes in reserve requirements against bank deposits. In view of changing conditions in the national economy and monetary policy, we cannot predict the impact of future changes in interest rates, deposit levels, loan demand or the Company’s business and earnings. Furthermore, the actions of the United States government and other governments in responding to developing situations or implementing new fiscal or trade policies may result in currency fluctuations, exchange controls, market disruption and other unanticipated economic effects. Such actions could have an adverse effect on our results of operations and profitability.
We are subject to regulation by various Federal and State entities.
The Company and The First are subject to extensive regulation by various regulatory agencies, including the Federal Reserve Board, the FDIC, the Mississippi Department of Banking and Consumer Finance and the CFPB. See Supervision and Regulation above for more information. New regulations issued by these agencies may adversely affect our ability to carry on our business activities. The Company is subject to various Federal and state laws and certain changes in these laws and regulations may adversely affect operations. The Company and The First are also subject to the accounting rules and regulations of the SEC and the
Financial Accounting Standards Board.FASB. Changes in accounting rules could adversely affect the reported financial statements or results of operations of the Company and may also require extraordinary efforts or additional costs to implement. Any of these laws or regulations may be modified or changed from time to time, and we cannot be assured that such modifications or changes will not adversely affect the Company.
The full impact
Tax law and regulatory changes could adversely affect our financial condition and results of operations.
Changes to tax laws, including a repeal of all or part of the Tax Cuts and Jobs Act
(the "Tax Act") on us and
our customers is unknown at present, creating uncertainty and risk related to our customers’ future demand for credit and our future results.Increased economic activity expected to result from the decrease in tax rates on businesses generally could spur additional economic activity that would encourage additional borrowing. At the same time, some customers may elect to use their additional cash flow from lower taxes to fund their existing levels of activity, decreasing borrowing needs. The eliminationimplementation of the federalInflation Reduction Act of 2022 ("IRA"), could significantly impact our business in the form of greater than expected income tax deductibility of business interest expense for a significant numberand taxes payable. Such changes may also negatively impact the financial condition of our customers effectively increasesand/or overall economic conditions. Further, future regulatory reforms that could include a heightened focus and scrutiny on BSA/AML related compliance, expansion of consumer protections, the costregulation of borrowingloan portfolios and makes equitycredit concentrations to borrows impacted by climate changes, increased capital and liquidity requirements and limitations or hybrid funding relatively more attractive. Thisadditional taxes on share repurchases and dividends, could increase our costs and impact our business.
On August 16, 2022, the IRA was signed into law in the United States. The IRA includes various tax provisions, including an excise tax on stock repurchases and a corporate alternative minimum tax that generally applies to U.S. corporations with average adjusted financial statement income over a three-year period in excess of $1 billion. We do not currently expect the IRA to have a long-term negativematerial impact on business customer borrowing. Someour financial results, including on our annual estimated effective tax rate or all of this benefit could be lost toon our liquidity, the extent that the banks and financial services companies we compete with elect to lower interest rates and fees and we are forced to respond in order to remain competitive. Additionally, the tax benefits could be repealed as a result of future regulatory actions. There is no assurance that presently anticipated benefitseffects of the Tax Act for the Company will be realized.measures are unknown at this time.
We may be required to pay additional insurance premiums to the FDIC, which could negatively impact earnings.
Pursuant to the Dodd-Frank Act, the limit on FDIC coverage has been permanently increased to $250,000, causing the premiums assessed to
The deposits of The First
are insured by the FDIC
up to
increase. Depending upon any future losseslegal limits and, accordingly, subject it to the payment of FDIC deposit insurance assessments. The First's regular assessments are determined by the level of its assessment base and its risk classification, which is based on its regulatory capital levels and the level of supervisory concern that
is poses. Moreover, the FDIC
has the unilateral power to change deposit insurance
fund may suffer, there can be no assurance that there will not be additional premiumassessment rates and the manner in which deposit insurance is calculated and also to charge special assessments to FDIC-insured institutions. The FDIC utilized these powers during the financial crisis for the purpose of restoring the reserve ratios of the Deposit Insurance Fund. Beginning in the first quarterly assessment period of 2023, the FDIC deposit insurance premiums were increased by two basis points. Any future special assessments, increases in
order to replenish the fund. The FDIC may need to set a higher base rate schedule or impose special assessments due to future financial institution failures and updated failure and loss projections. Potentially higher FDIC assessment rates
than those currently projectedor premiums, or required prepayments in FDIC insurance premiums could
have an adverse impact onreduce our
profitability or limit our ability to pursue certain business opportunities, which could materially and adversely affect our business, financial condition, and results of operations.
We are subject to industry competition which may have an adverse impact upon our success.
The profitability of the Company depends on its ability to compete successfully with other financial services companies. We operate in a highly competitive financial services environment. Certain competitors are larger and may have more resources than we do. We face competition in our regional market areas from other commercial banks, savings institutions, credit unions, internet banks, finance companies, mutual funds, insurance companies, brokerage and investment banking firms, and other financial intermediaries that offer similar services. Some of the nonbank competitors are not subject to the same extensive regulations that govern the Company or The First and may have greater flexibility in competing for business.
Many of these competitors also have broader geographic markets and substantially greater resources and lending limits than The First and offer certain services such as trust banking that The First does not currently provide. In addition, many of these competitors have numerous branch offices located throughout the extended market areas of The First that may provide these competitors with an advantage in geographic convenience that The First does not have at present.
Currently there are numerous other commercial banks, savings institutions, and credit unions operating in The First’s primary service area.
We also compete with numerous financial and quasi-financial institutions for deposits and loans, including providers of financial services over the internet. Recent technology advances and other changes have allowed parties to effectuate financial transactions that previously required the involvement of banks. For example, consumers can maintain funds in brokerage accounts or mutual funds that would have historically been held as bank deposits. Consumers can also complete transactions such as paying bills and transferring funds directly without the assistance of banks. The process of eliminating banks as intermediaries, known as “disintermediation,” could result in the loss of fee income, as well as the loss of customer deposits and the related income generated from those deposits. The loss of these revenue streams and access to lower cost deposits as a source of funds could have a material adverse effect on our financial condition and results of operations.
Some of our competitors have reduced or eliminated certain service charges on deposit accounts, including overdraft fees, and additional competitors may be willing to reduce or eliminate service or other fees in order to attract additional customers. If the Company chooses to reduce or eliminate certain categories of fees, including those related to deposit accounts, fee income related to these products and services would be reduced. If the Company chooses not to take such actions, we may be at a competitive disadvantage in attracting customers for certain fee producing products.
Our information systems may experience an interruption or breach in security.
We necessarily collect, use and hold personal and financial information concerning individuals and businesses with which we have a banking relationship. This information includes non-public, personally identifiable information that is protected under applicable federal and state laws and regulations. As such, we rely heavily on communications and information systems to conduct our business. Any failure, interruption or breach in security of these systems could result in failures or disruptions in our customer relationship management, deposit, loan and other systems. While we have policies and procedures designed to prevent or limit the effect of the failure, interruption or security breach of our information systems, there can be no assurance that we can prevent any such failures, interruptions, cyber security breaches or other security breaches or, if they do occur, that they will be adequately addressed. We have been, and likely will continue to be, subject to various forms of external security breaches, which may include computer hacking, acts of vandalism or theft, malware, computer viruses or other malicious codes, phishing, employee error or malfeasance, catastrophes, unforeseen events or other cyber-attacks. To date, we have seen no material impact on our business or operations from these attacks or events. Any future significant compromise or breach of our data security, whether external or internal, or misuse of customer, associate, supplier or Company data could damage our reputation, result in a loss of customer business, subject us to additional regulatory scrutiny, or expose us to civil litigation and possible financial liability, any of which could have a material adverse effect on our financial condition and results of operations. In addition, as the regulatory environment related to information security, data collection and use, and privacy becomes increasingly rigorous, with
new and constantly changing requirements applicable to our business, compliance with those requirements could also result in additional costs.
It is difficult or impossible to defend against every risk being posed by changing technologies or criminals intent on committing cyber-crime. In the last few years, there have been an increasing number of cyber incidents and cyber criminals continue to increase their sophistication, including several well-publicized cyber-attacks that targeted other companies in the United States, including financial services companies much larger than us. These cyber incidents have been initiated from a variety of sources, including terrorist organizations and hostile foreign governments. As technology advances, the ability to initiate transactions and access data has also become more widely distributed amount mobile devices, personal computers, automated teller machines, remote deposit capture sites and similar access points, some of which are not controlled or secured by us. It is possible that we could have exposure to liability and suffer losses as a result of a security breach or cyber-attack that occurred through no fault of our own. Further, the probability of a successful cyber-attack against us or one of our third-party services providers cannot be predicted, and in some cases, prevented.
Natural disasters, public health emergencies, acts of war or terrorism and other external events could affect our ability to operate.
Our market areas are susceptible to natural disasters such as hurricanes and tornados. Natural disasters can disrupt operations, result in damage to properties that may be serving as collateral for our loan assets and negatively affect the local economies in which we operate. Climate change may be increasing the nature, severity and frequency of adverse weather conditions, making the impact from these types of natural disasters on our customers or us worse. We cannot
predict whether or to what extent damage caused by future hurricanes, tornados or other natural disasters will affect operations or the economies in our market areas, but such weather events could cause a decline in loan originations, a decline in the value or destruction of properties serving as collateral for our loans and an increase in the risk of delinquencies, foreclosures or loan losses.
In addition, health emergencies, disease pandemics, acts of war or terrorism, trade policies and sanctions, including the repercussions of the
attack by Russia onongoing military conflicts in Ukraine
and the Middle East, and other external events could cause disruption in our operations. The occurrence of any of these events could have a material adverse effect on our business, financial condition and results of operations.
Our business is susceptible to fraud.
Our business exposes us to fraud risk from our loan and deposit customers, the parties they do business with, as well as from our employees, contractors and vendors. We rely on financial and other data from new and existing customers which could turn out to be fraudulent when accepting such customers, executing their financial transactions and making and purchasing loans and other financial assets. In times of increased economic stress, we are at increased risk of fraud losses. We believe we have underwriting and operational controls in place to prevent or detect such fraud, but we cannot provide assurance that these controls will be effective in detecting fraud or that we will not experience fraud losses or incur costs or other damage related to such fraud, at levels that adversely affect our financial results or reputation. Our lending customers may also experience fraud in their businesses which could adversely affect their ability to repay their loans or make use of our services. Our exposure and the exposure of our customers to fraud may increase our financial risk and reputation risk as it may result in unexpected loan losses that exceed those that have been provided for in our allowance for
loancredit losses.
We may not be able to attract and retain skilled personnel. Our success depends, in large part, on our ability to attract and retain key personnel. Competition for the best personnel in most activities we engage in can be intense, and we may not be able to hire personnel or to retain them. The unexpected loss of services of one or more of our key personnel could have a material adverse impact on our business because of the difficulty of promptly finding qualified replacement personnel with comparable skills, knowledge of our market, relationships in the communities we serve, and years of industry experience. Although we have employment agreements with certain of our executive officers, there is no guarantee that these officers and other key personnel will remain employed with the Company.
The
failuresoundness of other financial institutions could adversely affect the Company.
Our ability to engage in routine funding transactions could be adversely affected by the actions and
potential failurescommercial soundness of other financial institutions. Financial institutions are interrelated as a result of trading, clearing, counterparty and other relationships.
We have exposure to different industries and counterparties, and through transactions with counterparties in the financial services industry, including broker-dealers, commercial banks, investment banks, and other financial intermediaries. As a result, defaults by,
declines in the financial condition of, or even rumors or concerns about, one or more financial institutions or the financial services industry generally could negatively impact market-wide liquidity and could lead to losses or defaults by the Company or by other institutions.
The novel coronavirus, COVID-19, has adversely affected our business, financial condition, results of operations
Recent negative developments affecting the banking industry, and
our liquidity, andresulting media coverage, have eroded customer confidence in the
ultimate affect will depend on future developments, which are highly uncertain and cannot be predicted, including the scope and duration of the pandemic and actions taken by governmental authorities in response to the pandemic.The COVID-19 pandemic has created extensive disruptions to the global economy and to the lives of individuals throughout the world, and will likely continue to have an impact for at least the near term. The pandemic and related efforts to contain it have disrupted global economic activity, adversely affected the functioning of financial markets, impacted interest rates, increased economic and market uncertainty, and disrupted trade, supply chains and the labor market. During the past two years, governments, businesses,
banking system. and the public have taken unprecedented actions to contain the spread of COVID-19 and to mitigate its effects, including quarantines, travel bans, shelter-in-place orders,The closures of businessesSilicon Valley Bank and schools, fiscal stimulus packages, vaccineSignature Bank in March 2023 and mask mandates,First Republic Bank in May 2023, and legislation designed to deliver monetary aid and other relief. At present, most restrictions on movement have been lifted and widely available vaccines have proved to be effective in improving the economic outlook. As of December 31, 2021, economic conditions in our market area have returned close to pre-pandemic levels. Commercial activity has improved to levels close to those existing prior to the outbreak of the pandemic. While the overall outlook has improved based on the availability of the vaccine, the emergence of new variants of the virus have impeded the ability to fully resolve the pandemic and, as such, the risk of further economic disruptions and the possible reimplementation of business restrictions remains. Until the pandemic is fully controlled, the potential for adverse impact on our customers and the markets in which we operate and on our business, operations and financial condition is expected to remain elevated.
Federal, state and local governments have mandated or encouraged financial services companies to make accommodations to borrowers and other customers affected by the COVID-19 pandemic. Legal and regulatory responses to concerns about similar future events, have generated significant market volatility among publicly traded bank holding companies and, in particular, regional banks like the COVID-19 pandemic could result in additional regulation or restrictions affecting the conduct of our businessCompany. These market developments have negatively impacted customer confidence in the future. In additionsafety and soundness of regional banks. As a result, customers may choose to the potential affects from negative economic conditions noted above, the Company instituted a program to help COVID-19 impacted customers. This program includes waiving NSF fees, offering payment deferment and other loan relief, as appropriate, for customers impacted by COVID-19. During the first half 2021, we originated $111.5 million of additional PPP loans under the second round of PPP loans. Furthermore, there has been litigation against banks related to their participationmaintain deposits with larger financial institutions or invest in the PPP and other government stimulus programs, the costs and effectshigher yielding short-term fixed income securities, all of which could be material to us.
COVID-19 continues to present risks to ourmaterially adversely impact the Company's liquidity, loan portfolio. Timely loan repaymentfunding capacity, net interest margin, capital and results of operations. While the Department of the Treasury, the Federal Reserve, and the valueFDIC took action to ensure that depositors of collateral supporting the loans are affected by the strength of our borrower’s business. Concern about the spread of COVID-19 has caused business shutdowns, limitations on commercial activity and financial transactions, labor shortages, supply chain interruptions, increased unemployment and commercial property vacancy rates, reduced profitability and ability for property ownersthese failed banks had access to make mortgage payments, and overall economic and financial market instability, all of which may cause our customers totheir deposits, including uninsured deposit accounts, there is no guarantee that such actions will be unable to make scheduled loan payments. If the effects of COVID-19 resultsuccessful in widespread and sustained repayment shortfalls on loansrestoring customer confidence in our portfolio, we could incur significant delinquencies, foreclosures and credit losses, particularly if the available collateral is insufficient to cover our exposure. The future effects of COVID-19 on economic activity could negatively affect the collateral values associated with our existing loans, the ability to liquidate the real estate collateral securing our residential and commercial real estate loans, our ability to maintain loan origination volume and to obtain additional financing, the future demand for or profitability of our lending and services,regional banks and the financial condition and credit risk of our customers. Further, in the event of delinquencies, regulatory changes and policies designed to protect borrowers may slow or prevent us from making our business decisions or may result in a delay in our taking certain remediation and collection actions, such as foreclosure. Approximately 16% of our loan portfolio also includes exposure to sectors that have been and may continue to be subject to increased risk from the economic impact of COVID-19, including hotels, restaurants, retail, and direct energy.
As a result of the adverse impact of COVID-19 on our customers, we have faced and may continue to face a decrease in demand for certain products and disruptions in the operations of our customers’ vendors. In addition, the Company will be required to evaluate the impact of COVID-19 on the carrying value of certain of its assets, including goodwill, and to conduct impairments tests on those assets, which may result in impairment charges on these assets in future periods that could be material.
The Federal Reserve lowered the primary credit rate by 50 and 100 basis points on March 3 and March 15, 2020, respectively, for a total of 150 basis points to a range of 0 percent to 0.25 percent to mitigate the economic effects of the COVID-19 pandemic and to support the liquidity and stability of banking institutions as they serve the increased demand for credit, which has continued into 2022. Prolonged duration of reduced interest rates could negatively impact our net interest income, margin and future profitability and have a material adverse effect on our financial results. In addition, increasing interest rates could negatively impact our cost of borrowing and reduce the amount of money our customers borrow or adversely affect their ability to repay outstanding loan balances that may increase due to adjustments in their variable rates. The continued economic impact of COVID-19 may also impair the ability of our borrowers to make their monthly loan payments, which would result in increases in delinquencies, declining collateral values, defaults, foreclosures and other losses on our loans as well as impact our operations and business. A protracted COVID-19 pandemic could further negatively affect the carrying amount of our goodwill, indefinite-lived intangibles and long-lived assets and result in realized losses on our financial assets. In addition, a decline in consumer confidence also could result in lower loan originations and decreases in deposits. It is not possible to predict the extent, severity or duration of these conditions or when normal economic and operating conditions will resume.
system more broadly.
Additionally, COVID-19 could negatively affect our internal controls over financial reporting as many of our employees are required to work from home and therefore new processes, procedures, and controls could be required to respond to changes in our business environment. The increased reliance on remote access to information systems increases our exposure to potential cybersecurity breaches as well as the information systems of our vendors or business partners. Further, should a significant number of our employees be required to quarantine, the attention of the management team could be diverted and our overall workforce could be significantly reduced.
The extent to which the pandemic impacts the Company’s results will depend on future developments, which are highly uncertain and cannot be predicted, including the duration of the pandemic, government and regulatory responses to the pandemic, new information which may emerge concerning its severity and the actions necessary to contain it or address its impact, among others. Behavioral changes are not fully known and may not be temporary. See the section captioned “COVID-19 Impact” in Part II. Financial Information, Item 7. Management’s Discussion and Analysis of Financial Condition and Results of Operations elsewhere in this report for further discussion.
We may engage in acquisitions of other businesses from time to time, which may adversely impact our results.
From time to time, we may engage in acquisitions of other businesses. Difficulty in integrating an acquired business or company may cause us not to realize expected revenue increases, cost savings, increases in geographic or product presence, or other anticipated benefits from any acquisition. The integration could result in higher than expected deposit attrition (run-off), loss of key employees, disruption of the Company’s business or the business of the acquired company, or otherwise adversely affect the Company’s ability to maintain relationships with customers and employees or achieve the anticipated benefits of the acquisition. The acquired companies may also have legal contingencies, beyond those that we are aware of, that could result in unexpected costs. The Company may need to make additional investment in equipment and personnel to manage higher asset levels and loan balances as a result of any significant acquisition, which may adversely impact earnings.
We may fail to realize the anticipated cost savings and other financial benefits of recent acquisitions in the timeframe we expect, or at all.
The Company completed the
Southwest Georgia Financial Corporation (“SWG”Beach Bancorp, Inc. ("BBI") acquisition on
April 2, 2020August 1, 2022, and the acquisition of
the Cadence BranchesHSBI on
December 3, 2021.January 1, 2023. Achieving the anticipated cost savings and financial benefits of the mergers will depend, in part, on whether we can successfully integrate these businesses with and into the business of The First. It is possible that the integration process could result in the loss of key employees, the disruption of each company’s ongoing businesses or inconsistencies in standards, controls, procedures, and policies that adversely affect our ability to maintain relationships with clients, customers, depositors, and employees or to achieve the anticipated benefits of the mergers. In addition, the integration of certain operations following the mergers has required and will continue to require the dedication of significant management resources, which may temporarily distract management’s attention from the day-to-day business of the combined company. Any inability to realize the full extent of, or any of, the anticipated cost savings and financial benefits of the mergers, as well as any delays encountered in the integration process, could have an adverse effect on the business and results of operations of the combined company.
We have incurred and may continue to incur significant transaction and merger-related costs in connection with our recent acquisitions.
We have incurred and may continue to incur a number of non-recurring costs associated with our recent acquisitions. These costs and expenses include fees paid to financial, legal and accounting advisors, severance, retention bonus and other potential employment-related costs, filing fees, printing expenses and other related charges. There are also a large number of processes, policies, procedures, operations, technologies and systems that must be integrated in connection with the integration of these companies’ businesses. While we have assumed that a certain level of expenses would be incurred in connection with the acquisitions, there are many factors beyond our control that could affect the total amount or the timing of the integration and implementation expenses.
There may also be additional unanticipated significant costs in connection with the acquisitions that we may not recoup. These costs and expenses could reduce the realization of efficiencies, strategic benefits and additional income we expect to achieve from the
acquisitions. Although we expect that these benefits will offset the transaction expenses and implementation costs over time, the net benefit may not be achieved in the near term or at all, which could have a material adverse impact on our financial results.
We may incur impairment to goodwill.
We review our goodwill at least annually. Significant negative industry or economic trends, reduced estimates of future cash flows or disruptions to our business, could indicate that goodwill might be impaired. Our valuation methodology for assessing impairment requires management to make judgements and assumptions based on historical experience and to rely on projections of future operating performance. We operate in a competitive environment and projections of future operating results and cash flows may vary significantly from actual results. In addition, if our analysis results
isin an impairment to our goodwill, we would be required to record a non-cash charge to earnings in our financial statements during the period in which such impairment is determined to exist. Any such charge could have a material adverse effect on our results of operations.
Risks Relating to Our Securities
The price of our common stock may fluctuate significantly, which may make it difficult for investors to resell shares of common stock at a time or price they find attractive.
Our stock price may fluctuate significantly as a result of a variety of factors, many of which are beyond our control. In addition to those described in “Special Cautionary Notice Regarding Forward-Looking Statements,” these factors include, among others:
| ● | actual or anticipated quarterly fluctuations in our operating results, financial condition or asset quality; |
| ● | changes in financial estimates or the publication of research reports and recommendations by financial analysts or actions taken by rating agencies with respect to us or other financial institutions; |
| ● | failure to declare dividends on our common stock from time to time; |
| ● | failure to meet analysts’ revenue or earnings estimates; |
| ● | failure to integrate acquisitions or realize anticipated benefits from acquisitions; |
| ● | strategic actions by us or our competitors, such as acquisitions, restructurings, dispositions or financings; |
| ● | fluctuations in the stock price and operating results of our competitors or other companies that investors deem comparable to us; |
| ● | future sales of our common stock or other securities; |
| ● | proposed or final regulatory changes or developments; |
| ● | anticipated or pending regulatory investigations, proceedings, or litigation that may involve or affect us; |
| ● | reports in the press or investment community generally relating to our reputation or the financial services industry; |
| ● | domestic and international economic and political factors unrelated to our performance; |
| ● | general market conditions and, in particular, developments related to market conditions for the financial services industry; |
| ● | adverse weather conditions, including floods, tornadoes and hurricanes; |
•changes in financial estimates or the publication of research reports and recommendations by financial analysts or actions taken by rating agencies with respect to us or other financial institutions;
•failure to declare dividends on our common stock from time to time;
•failure to integrate acquisitions or realize anticipated benefits from acquisitions;
•strategic actions by us or our competitors, such as acquisitions, restructurings, dispositions or financings;
•fluctuations in the stock price and operating results of Contentsour competitors or other companies that investors deem comparable to us;
| ● | public health emergencies, including disease pandemics; and |
| ● | disruptions to the financial markets as a result of the current or anticipated impact of military conflict, including escalating military tension between Russia and Ukraine, terrorism or other geopolitical events. |
•future sales of our common stock or other securities;•proposed or final regulatory changes or developments;
•anticipated or pending regulatory investigations, proceedings, or litigation that may involve or affect us;
•reports in the press or investment community generally relating to our reputation or the financial services industry;
•domestic and international economic and political factors unrelated to our performance;
•general market conditions and, in particular, developments related to market conditions for the financial services industry;
•adverse weather conditions, including floods, tornadoes and hurricanes;
•public health emergencies, including disease pandemics; and
•disruptions to the financial markets as a result of the current or anticipated impact of military conflict, including the ongoing military conflicts in Ukraine and the Middle East, terrorism or other geopolitical events.
In addition, in recent years, the stock market in general has experienced extreme price and volume fluctuations. This volatility has had a significant effect on the market price of securities issued by many companies, including for reasons unrelated to their operating performance. These broad market fluctuations may adversely affect our stock price, notwithstanding our operating results. We expect that the market price of our common stock will continue to fluctuate and there can be no assurances about the levels of the market prices for our common stock.
General market fluctuations, industry factors and general economic and political conditions and events, such as economic slowdowns or recessions, interest rate changes or credit loss trends, could also cause our stock price to decrease regardless of operating results.
We may need to rely on the financial markets to provide needed capital.
Our common stock is listed and traded on the Nasdaq stock market. Although we anticipate that our capital resources will be adequate for the foreseeable future to meet our capital requirements, at times we may depend on the liquidity of the capital markets to raise additional capital. Our historical ability to raise capital through the sale of capital stock and debt securities may be affected by economic and market conditions or regulatory changes that are beyond our control. Adverse changes in our operating performance or financial condition could make raising additional capital difficult or more expensive or limit our access to customary sources of funding. If the market should fail to operate, or if conditions in the capital markets are adverse, our efforts to raise capital could require the issuance of securities at times and with maturities, conditions and rates that are disadvantageous, and which could have a dilutive impact on our current stockholders. Should these risks materialize, the ability to further expand our operations through organic or acquisitive growth may be limited.
Securities issued by the Company, including the Company’s common stock, are not FDIC insured.
Securities issued by the Company, including the Company’s common stock, are not savings or deposit accounts or other obligations of any bank and are not insured by the FDIC, the
Deposit Insurance Fund,DIF, or any other governmental agency or instrumentality, or any private insurer, and are subject to investment risk, including the possible loss of principal.
Anti-takeover laws and certain agreements and charter provisions may adversely affect the price of our common stock.
Certain provisions of state and federal law and our articles of incorporation may make it more difficult for someone to acquire control of the Company. Under federal law, subject to certain exemptions, a person, entity, or group must notify the federal banking agencies before acquiring 10% or more of the outstanding voting stock of a bank holding company, including the Company’s shares. Banking agencies review the acquisition to determine if it will result in a change of control. The banking agencies have 60 days to act on the notice, and take into account several factors, including the resources of the acquiror and the antitrust effects of the acquisition. There also are Mississippi statutory provisions and provisions in our articles of incorporation that may be used to delay or block a takeover attempt. As a result, these statutory provisions and provisions in our articles of incorporation could result in the Company being less attractive to a potential acquiror.
The trading volume in our common stock is less than that of other larger financial services companies.
Although our common stock is listed for trading on the Nasdaq Global Market, the trading volume for our common stock is low relative to other larger financial services companies, and you are not assured liquidity with respect to transactions in our common stock. A public trading market having the desired characteristics of depth, liquidity and orderliness depends on the presence in the marketplace of willing buyers and sellers of our common stock at any given time. This presence depends on the individual decisions of investors and general economic and market conditions over which we have no control. Given the lower trading volume of our common stock, significant sales of our common stock, or the expectation of these sales, could cause our stock price to fall.
You may not receive dividends on our common stock.
Although we have historically declared quarterly cash dividends on our common stock, we are not required to do so and may reduce or cease to pay common stock dividends in the future. If we reduce or cease to pay common stock dividends, the market price of our common stock could be adversely affected.
The principal source of funds from which we pay cash dividends are the dividends received from The First. Federal and state banking laws and regulations and state corporate laws restrict the amount of dividends we may declare and pay from The First. See “Item 1. Business – Regulation and Supervision” included herein for more information.
If we fail to pay dividends, capital appreciation, if any, of our common stock may be the sole opportunity for gains on an investment in our common stock. In addition, in the event The First becomes unable to pay dividends to us, we may not be able to service our debt or pay our other obligations or pay dividends on our common stock and preferred stock. Accordingly, our inability to receive dividends from The First could also have a material adverse effect on our business, financial condition and results of operations and the value of your investment in our common stock.
ITEM 1B. UNRESOLVED STAFF COMMENTS
ITEM 1C. CYBERSECURITY
The Company’s information security program is designed to protect the security of our computer systems, networks, software and information assets, including customer information. The program is comprised of technical controls, policies, guidelines, and procedures. These technical controls, policies, guidelines, and procedures are intended to align with regulatory guidance, and common industry standard security practices.
The board of directors and our executives appreciate the severity of cybersecurity-related risks and support the continuous development of and investment in the information security program.
Commitment to Security and Confidentiality
At the Company, we expect each associate to be responsible for the security and confidentiality of customer information. We communicate this responsibility to associates during on-boarding and throughout their employment. Annually, training courses are assigned to each associate to complete on how to protect the confidentiality of customer information at the time of hire and during each year of employment.
We regularly provide associates with information security awareness training, including the recognition and appropriate handling of potential phishing emails, which can introduce malware to a bank’s network, result in the theft of user credentials and, ultimately, place customer information at risk.We regularly use phishing campaigns to train associates to determine their ability to recognize phishing emails. For associates who fail a phishing campaign, the associates are assigned additional training courses.
Associates must also follow established procedures for the safe storage and handling and secure disposal of customer information. Old or obsolete computer assets are subject to defined procedures and processes to ensure safe destruction of information contained on those devices. For paper-based information or documents, we dispose of paper using shred bins for destruction.
Cybersecurity Incident Response Plan
As part of our information security program, we have adopted an Information Security Incident Response Plan (Incident Response Plan), which is administered by the Company’s Chief Information Security Officer (CISO).The Incident Response Plan describes the Company’s processes, procedures, and responsibilities for responding to incidents including security and cybersecurity. The Incident Response Plan is intended to be followed in the event of a cybersecurity incident, including implementation of (i) forensic and containment, eradication, and remediation actions by information technology and security personnel and (ii) operational response actions by business units, communications, legal, and risk personnel. The Incident Response Plan includes an annual tabletop exercise to simulate responses to cybersecurity events. If applicable, each exercise may result in postmortem and discuss lessons learned to evaluate any improvements to the Incident Response Plan.
The Incident Response Plan includes processes for escalation and reporting of cybersecurity incidents to the Incident Response Team.
Network and Device Security
The Company employs a constantly evolving, defense-in-depth methodology to cybersecurity. Robust high-availability firewalls are in place at the perimeter.Remote workers are supported through the Company’s secure VPN and uses multifactor authentication. The Company has a vulnerability management program in place that includes a managed detect and response platform to ensure monitoring of the Company’s network, ensures the timely installation of software patches, and provides a risk-based approach to addresses vulnerabilities across the network.Network security controls are in place to prevent unauthorized access to the network or the Company’s IT resources. The Company employs controls over its managed workstations, servers, and other endpoints to prevent inappropriate access or damage to physical, virtual, or data assets.Data loss prevention programs are in place to prevent the inappropriate transmission or exposure of sensitive data assets or customer information.
Cybersecurity training is provided to all employees as part of the overall cybersecurity program. The Company contracts with third party vendors to conduct internal and external penetration tests against the Company’s networks and IT assets to ensure controls are operating in an appropriate manner.
Impacts of Cybersecurity Incidents
To date, the Company has not experienced a cybersecurity incident that has materially impacted our business strategy, results of operations, or financial condition. Addressing cybersecurity risks is a priority for the Company, and the Company is committed to enhancing its systems of internal controls and business continuity and disaster recovery plans.
Third-Party Vendor Controls
Before engaging third-party service providers, the Company carries out a due diligence process. This process is led by the Enterprise Risk Management team and Information Security performs due diligence through the process. Risk assessments are reviewed using Service Organization Controls (SOC) reports, self- attestation questionnaires, and other tools.
Any third-party service provider or vendor utilized as part of the Company’s cybersecurity framework is required to comply with the Company’s policies regarding non-public personal information and information security. Third parties processing sensitive customer data are contractually required to meet all legal and regulatory obligations to protect customer data against security threats or unauthorized access. After contract executions, vendors undergo ongoing monitoring to ensure they continue to meet their security obligations.
Our Board of Directors’ Role in Oversight of Cybersecurity Threats
Our Board of Directors is responsible for overseeing the Company’s business and affairs, including risks associated with cybersecurity threats. The Board oversees the Company’s corporate risk governance processes primarily through its committees, and oversight of cybersecurity threats is delegated primarily to our Board Risk Committee.
The Board Risk Committee has primary responsibility for overseeing the Company’s comprehensive Enterprise Risk Management program. The Enterprise Risk Management program assists senior management in identifying, assessing, monitoring, and managing risk, including cybersecurity risk, in a rapidly changing environment. Cybersecurity matters and assessments are regularly included in Board Risk Committee meetings.
The Board’s oversight of cybersecurity risk is supported by our CISO and Cybersecurity Manager. The CISO and the Cybersecurity Manager attend Board Risk Committee meetings, periodically provides cybersecurity and other information security updates to the Board Risk Committee. The CISO also provides an annual information security program summary report to the Board, outlining the overall status of our information security program and the Company’s compliance with regulatory guidelines.
Our Management’s Role in Assessing and Managing Cybersecurity Matters
The Company’s CISO directs the Company’s information security program and our information technology risk management.The CISO and Cybersecurity Manager along with a team of dedicated security personnel examines risks to the Company’s information systems and assets, designs and implements security solutions, monitors the environment, and provides immediate responses to threats.
Role of the Chief Information Security Officer and Cybersecurity Manager
Our CISO is responsible for the Company’s information security program. In this role, the CISO manages the Company’s information security Program.
The CISO has experience with FDIC regulated financial institutions and holds the certification as a Certified Banking Chief Information Security Officer (CBISO) and participates in various Information Security peer groups and serves on the Mississippi Bankers Associations - Information Security Committee.
The Company’s Cybersecurity Manager oversees the day-to-day cybersecurity operations.
The CISO and Cybersecurity Manager support the information security risk oversight responsibilities of the Board and its committees. The CISO reports to our Chief Information Officer, who in turn reports to our Chief Executive Officer and President. The Cybersecurity Manager reports to the Information Technology Director, who in turn reports to the Chief Information Officer.
Our Cybersecurity Manager has experience spanning multiple OCC and FDIC regulated financial institutions across the nation. He holds various cybersecurity related certifications and is currently registered with the International Information Systems Security Certification Consortium as a Certified Information Systems Security Professional (CISSP) member in good standing.
Role of the Enterprise Risk Manager
Our Enterprise Risk Manager is responsible for oversight of the Company’s information technology governance and risk program. In this role, the Enterprise Risk Manager provides independent oversight of information technology risk, promotes effective challenge to the Company’s information technology systems, and ensures that high level risks receive appropriate attention. The Enterprise Risk Manager is a member of the Company’s Risk Management Group and reports to the Chief Risk Officer, who in turn reports to the Board Risk Committee.
Role of the IT Risk Governance Subcommittee
Governance of the information security program begins with the IT Risk Governance Subcommittee, a management level subcommittee, whose objective is to protect the integrity, security, safety and resiliency of corporate information systems and assets. Together, our CISO leads the Company’s IT Risk Governance Committee. The IT Risk Governance Committee meets regularly to review the development of the program and develop recommendations and provides regular reports to management, and, ultimately, the Board Risk Committee through the CISO.
Role of Enterprise Risk Management
Enterprise Risk Management (ERM) is a holistic process to identify, assess/measure, mitigate/control, and aggregate/escalate/report organizational risks, both internal and external, in order to make decisions aimed at maximizing shareholder value and achieving strategic goals.The overarching ERM program shapes information security strategy and development. ERM works with information security management to facilitate performance of Risk Assessments, the results of which are used to identify opportunities to strengthen the program.
Our Company’s main office, which is the holding company headquarters, is located at 6480 U.S. Highway 98 West in Hattiesburg, Mississippi. As of year-end, we had
87110 full service banking and financial service offices, one motor bank facility and
twofive loan production offices across Mississippi, Alabama, Florida, Georgia and Louisiana. Management ensures that all properties, whether owned or leased, are maintained in suitable condition.
The following table sets forth banking office locations that are leased by the Company.
| | | | | |
| Alabama | Georgia |
•Theodore - Bayley’s Corner | |
· •Bayley’Dauphin Islands Corner
| · •Ocean SpringsJonesboro
|
· •Dauphin IslandFairhope
| · MississippiPanama City Beach
|
· •FairhopeSpanish Fort
| · •PascagoulaColumbus - Loan Production Office
|
· Florida
| •Gulfport - Hardy Court | · Pensacola Downtown
|
· •KillernPensacola - Garden Street
| · •Spanish FortPascagoula
|
· •Mary EstherSt. Petersburg - Loan Production Office
| · •Starkville UniversityPetal
|
· •Metairie
| · Tallahassee – Apalachee Parkway
| |
· •NicevilleTallahassee – Thomasville Road 700 John Sims Parkway East
| | · Petal
· •Niceville –Tampa - Westshore 750 John Sims Parkway East
| |
ITEM 3. LEGAL PROCEEDINGS
From time to time the Company and/or The First may be named as defendants in various lawsuits arising out of the normal course of business. At present,
with the exception of the matter described below, the Company is not aware of any legal proceedings that it anticipates may materially adversely affect its business.
Nancy Hall, et al. v. The First Bancshares, Inc., Case No. 2:23-cv-192, United States District Court, Southern District of Mississippi.
On December 7, 2023, Nancy Hall, individually and on behalf of all others similarly situated ("Plaintiff"), sued The First Bancshares, Inc., as successor in interest to Heritage Southeast Bank, in a putative class action complaint in federal district court for the Southern District of Mississippi. Plaintiff asserts claims based on the alleged improper assessment and collection of overdraft fees. Specifically, Plaintiff's claims relate to overdraft fees resulting from alleged "authorized positive, settle negative" or APSN debit card transactions. The complaint asserts causes of action of breach of contract, including the covenant of good faith and fair dealing, and unjust enrichment. The complaint also asserts a claim for alleged violations of Regulation E of the Electronic Funds Transfer Act. The complaint seeks an unspecified amount of damages, restitution, costs, attorney's fees, and interest, as well as injunctive relief.
On February 1, 2024, the Company filed its Answer and Affirmative Defenses, and the proceedings remain ongoing. At this stage of the proceedings, it is not feasible to predict the outcome or a range of loss, should a loss occur, from this proceeding. Accordingly, no accrual has been made and no estimated range of potential loss can be determined at this time.
ITEM 4. MINE SAFETY DISCLOSURES
ITEM 5. MARKET FOR REGISTRANT’S COMMON EQUITY, RELATED STOCKHOLDER MATTERS AND ISSUER PURCHASES OF EQUITY SECURITIES
Shares of our common stock are traded on the Nasdaq global market under the symbol “FBMS.”
There were approximately
3,3624,618 record holders of the Company’s common stock at
March 3, 2022February 21, 2024 and
20,485,83031,227,881 shares outstanding.
Subject to the approval of the Board of Directors and applicable regulatory requirements, the Company expects to continue its policy of paying regular cash dividends on a quarterly basis. A discussion of certain limitations on the ability of The
First’sFirsts to pay dividends to the Company and the ability of the Company to pay dividends on its common stock is set forth in Part 1 – Item 1. Business – Supervision and Regulation of this report.
Issuer Purchases of Equity Securities
The following table sets forth shares of our common stock we repurchased during the quarter ended December 31,
2021.
| | | | | | | | | |
| | | | | | | Total Number of | | |
| | Total | | | | | Shares Purchased as | | Maximum Number of |
| | Number of | | Average | | Part of Publicly | | Shares that May Yet |
| | Shares | | Price Paid | | Announced Plans or | | Be Purchased Under |
Period | | Purchased | | Per Share | | Programs | | the Plans or Programs |
October | | — | | $ | — | | — | | 628,914 |
November | | 188 | | | 40.25 | | — | | 600,472 |
December | | 6,672 | | | 38.64 | | — | | 640,266 |
Total | | 6,860 | (a) | $ | 39.04 | | — | | |
| (a) | The 6,860 shares purchased in the 4th quarter were withheld by the Company in order to satisfy employee tax obligations for vesting of restricted stock awards. |
2023. | | | | | | | | | | | | | | | | | | | | | | | | | | | | | |
| Period | | Total
Number of
Shares
Purchased | | | Average
Price Paid
Per Share | | Total Number of
Shares Purchased as
Part of Publicly
Announced Plans or
Programs | | Maximum Number of
Shares that May Yet
Be Purchased Under
the Plans or Programs (in thousands) (a) |
| October | | — | | | $ | — | | — | | $ | 50,000 |
| November | | — | | | — | | — | | 50,000 |
| December | | 856 | | | 26.91 | | — | | 50,000 |
| Total | | 856 | (b) | | $ | 26.91 | | — | | |
29
(a)On February 28, 2023, the Company announced that its Board of Directors authorized a new share repurchase program (the "2023 Repurchase Program"), pursuant to which the Company may purchase up to an aggregate of $50.0 million in shares of the Company's issued and outstanding common stock. The 2023 Repurchase Program expired on December 31, 2023.
(b)The 856 shares purchased in the fourth quarter were withheld by the Company in order to satisfy employee tax obligations for vesting of restricted stock awards.
The following performance graph and related information are neither “soliciting material” nor “filed’ with the SEC, nor shall such information be incorporated by reference into any future filings under the Securities Act of 1933 or the Securities Exchange Act of 1934, each as amended, except to the extent the Company specifically incorporates it by reference to such filing.
The performance graph compares the cumulative five-year shareholder return on the Company’s common stock, assuming an investment of $100 on December 31,
20162018 and the reinvestment of dividends thereafter, to that of the common stocks of United States companies reported in the Nasdaq Composite-Total Returns Index and the common stocks of the Nasdaq OMX Banks Index. The Nasdaq OMX Banks Index contains securities of Nasdaq-listed companies classified according to the Industry Classification Benchmark as banks. They include banks providing a broad range of financial services, including retail banking, loans and money transmissions.
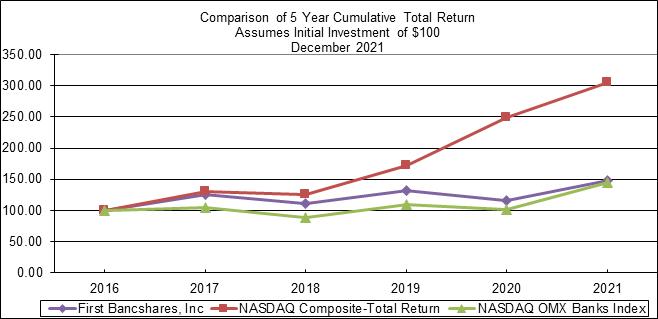
| | | | | | | | | | | | | | | | | | | | | | | | | | | | | | | | | | | | | | | | | | | | | | | | | | |
| Legend |
| | | | | | | | | | | | | | | | |
| Symbol | | Total Returns Index For: | | 2018 | | 2019 | | 2020 | | 2021 | | 2022 | | 2023 | |
| | | | | | | | | | | | | | | | |
| | | First Bancshares, Inc. | | 100.00 | | 118.55 | | 104.82 | | 133.07 | | 112.80 | | 106.66 | |
| | | NASDAQ Composite-Total Returns | | 100.00 | | 136.69 | | 198.10 | | 242.03 | | 163.28 | | 236.17 | |
| | | NASDAQ OMX Banks Index | | 100.00 | | 124.38 | | 115.04 | | 164.41 | | 137.65 | | 132.91 | |
| | | | | | | | | | | | | | | | |
| | | | | | | | | | | | | | | | |
| Notes: |
| | | | | | | | | | | | | | | | |
| A. | | The lines represent monthly index levels derived from compounded daily returns that include all dividends. |
| B. | | The indexes are reweighted daily, using the market capitalization on the previous trading day. |
| C. | | If the monthly interval, based on the fiscal year-end, is not a trading day, the preceding trading day is used. |
| D. | | The index level for all series was set to $100.00 on 12/31/2018. |
ITEM 7. MANAGEMENT’S DISCUSSION AND ANALYSIS OF FINANCIAL CONDITION AND RESULTS OF OPERATIONS
The following provides a narrative discussion and analysis of The First Bancshares’ financial condition
as of December 31, 2023 and 2022 and results of operations for the years ended December 31,
2021, 2020,2023, 2022, and
2019.2021. This discussion should be read in conjunction with the consolidated financial statements and the supplemental financial data included in Part II. Item 8. Financial Statements and Supplementary Data included elsewhere in this report.
Critical Accounting Policies
Management’s Discussion and Analysis of Financial Condition and Results of Operations is based on our consolidated financial statements, which have been prepared in accordance with U.S. generally accepted accounting principles. The preparation of these financial statements requires us to make estimates and judgements that affect the reported amounts of assets, liabilities, revenues and expenses. While we base estimates on historical experience, current information and other factors deemed to be relevant, actual results could differ from those estimates. Accounting policies considered critical to our financial results include the allowance for credit losses and related provision, income taxes, goodwillbusiness combinations and business combinations.goodwill. The most critical of these is the accounting policy related to the allowance for credit losses.
The allowance is based in large measure upon management's evaluation of borrowers' abilities to make loan payments, local and national economic conditions, and other subjective factors. If any of these factors were to deteriorate, management would update its estimates and judgments which may require additional loss provisions.As a result of the Company's immediate response to COVID-19, including loan modifications/payment deferral programs and the PPP, as well as acquisition and integration of SWG and Cadence Branches, and increased uncertainty related to certain judgments and estimates, the Company has elected to temporarily defer or suspend the application of one provision of U.S. Generally Accepted Accounting Principles (GAAP), as allowed by the CARES Act, which was signed into law by the President on March 27, 2020. Sections 4013 and 4014 of the CARES Act provide the Company with temporary relief from troubled debt restructurings which the Company believes prudent to elect in these challenging times to allow us time to provide consistent, high-quality financial information to our investors and other stakeholders. Temporary relief was set to expire on the earlier of the first day of the fiscal year that begins after the date on which the national emergency concerning COVID-19 terminates or January 1, 2022. The Company adopted CECL as of January 1, 2021.
COVID-19 IMPACT
In March 2020, the World Health Organization recognized the novel COVID-19 as a pandemic. The spread of COVID-19 has created a global public health crisis that has resulted in unprecedented uncertainty, volatility and disruption in financial markets and in governmental, commercial and consumer activity in the United States and globally. In response to the outbreak, federal and state authorities in the U.S. introduced various measures to try to limit or slow the spread of the virus, including travel restrictions, nonessential business closures, stay-at-home orders, and strict social distancing and shelter in place. These actions, together with responses to the pandemic by businesses and individuals, have resulted in rapid decreases in commercial and consumer activity, temporary closures of many businesses that have led to a loss of revenues and a rapid increase in unemployment, material decreases in oil and gas prices and in business valuations, disrupted global supply chains, market downturns and volatility, changes in consumer behavior related to pandemic fears, related emergency response legislation and an expectation that Federal Reserve policy will maintain a low interest rate environment for the foreseeable future. These disruptions may result in a decline in demand for banking products or services, including loans and deposits, which could impact our future financial condition, result of operations and liquidity. The impacts of the COVID-19 pandemic on the economy and the banking industry are rapidly evolving and the future effects are unknown at this time. The Company is working to adapt to the changing environment and proactively plan for contingencies. To that end, the Company has and is taking steps to protect the health of our employees and to work with our customers experiencing difficulties as a result of this virus. The Company has many non-branch personnel working remotely. We have also been working through loan modifications and payment deferral programs to assist affected customers.
The pandemic has had and in some cases is continuing to have an adverse impact on certain industries the Company serves, including hotels, restaurants, retail, and direct energy. As of December 31, 2021, the Company's aggregate outstanding exposure in these segments was $478.9 million, or 16.2% of total loans. While it is not yet possible to know the full effect that the pandemic will have on the economy, or to what extent this crisis will impact the Company, all available current industry statistics and internal monitoring of loan repayment ability and payment forgiveness across the portfolio has been analyzed in an attempt to understand the correlation with asset quality and degree of possible deterioration.
On March 27, 2020, the CARES Act was signed into law. The CARES Act is a $2 trillion stimulus package that is intended to provide relief to U.S businesses and consumers struggling as a result of the pandemic. A provision in the CARES Act includes a $349 billion fund for the creation of the PPP through the Small Business Administration ("SBA") and Treasury Department. The PPP is intended to provide loans to small businesses to pay their employees, rent, mortgage interest, and utilities. The loans may be forgiven conditioned upon the client providing payroll deductions evidencing their compliant use of funds and otherwise complying with the terms of the program. The PPP was amended in April of 2020 to include an additional $320 billion in funding. On June 5, 2020, President Trump signed into law the Paycheck Protection Program Flexibility Act of 2020 ("PPPFA") that amends the CARES Act. The PPPFA extended the covered period in which to use PPP loans, extended the forgiveness period from eight weeks to a maximum of 24 weeks and increased flexibility for small businesses that have had issues with rehiring employees and attempting to fill vacant positions due to COVID-19. The program reduced the proportion of proceeds that must be spent on payroll costs from 75% to 60%. In addition, the PPPFA also extended the payment deferral period for the PPP loans until the date when the amount of loan forgiveness is determined and remitted to the lender.
Section 4013 of the CARES Act, "Temporary Relief from Troubled Debt Restructurings," provides banks the option to temporarily suspend certain requirements under U.S. GAAP related to troubled debt restructurings ("TDRs") for a limited period of time to account for the effects of COVID-19. To qualify for Section 4013 of the CARES Act, borrowers must have been current at December 31, 2019. All modifications are eligible as long as they are executed between March 1, 2020 and the earlier of (i) December 31, 2020, or (ii) the 60th day after the end of the COVID-19 national emergency declared by the President of the U.S. Loans that were current as of December 31, 2019 are not TDRs. In addition, under guidance from the federal banking agencies, other short-term modifications made on a good faith basis in response to COVID-19 to borrowers who were current prior to any relief are not TDRs under ASC Subtopic 310-40, "Troubled Debt Restructuring by Creditors." These modifications include short-term (e.g., up to six months) modifications such as payment deferrals, fee waivers, extensions of repayment terms, or delays in payment that are insignificant. Borrowers considered current are those that are less than 30 days past due on their contractual payments at the time a modification program is implemented. We began receiving requests from our borrowers for loan and lease deferrals in March 2020. Payment modifications include the deferral of principal payments or the deferral of principal and interest payments for terms generally 90-180 days. Requests are evaluated individually and approved modifications are based on the unique circumstances of each borrower. For the year ended December 31, 2021, we have modified approximately 1,643 loans for $710.7 million, of which 1,391 loans for $582.3 million were modified to defer monthly principal and interest payments and 252 loans for $128.4 million were modified from monthly principal and interest payments to interest only. For the year ended December 31, 2021, we have approximately 419 PPP loans approved through the SBA for a balance of $41.1 million.
Effective January 1, 2021, the Company adopted ASU 2016-13, Financial Instruments – Measurement of Current Expected Credit Losses on Financial Instruments (“CECL”), which modified the accounting for the allowance for loan losses from an incurred loss model to an expected loss model, as discussed more fully under “PartPart II – Item 8. Financial Statements and Supplementary Data – Note B – Summary of Significant Accounting Policies of this report.
Companies are required to perform periodic reviews of individual securities in their investment portfolios to determine whether decline in the value
Assets acquired and liabilities assumed as part of a
security is other than temporary. A reviewbusiness combination are generally recorded at their fair value at the date of
other-than-temporary impairment requires companies to make certain judgments regarding the materialityacquisition. The excess of
the decline, its effect on the financial statements and the probability, extent and timing of a valuation recovery and the company’s intent and ability to hold the security. Pursuant to these requirements, management assesses valuation declines to determine the extent to which such changes are attributable to fundamental factors specific to the issuer, such as financial condition, business prospects or other factors or market-related factors, such as interest rates. Declines inpurchase price over the fair value of
securities below their cost thatassets acquired and liabilities assumed is recorded as goodwill. Determining the fair value of identifiable assets, particularly intangibles, and liabilities acquired also require management to make estimates, which are
deemedbased on all available information and in some cases assumptions with respect to
be other-than-temporarythe timing and amount of future revenues and expenses associated with an asset. Business combinations are
recorded in earnings as realized losses.discussed more fully under Part II - Item 8. Financial Statements and Supplementary Data - Note B - Summary of Significant Accounting Policies and Note C Business Combinations of this report.
Goodwill is assessed for impairment both annually and when events or circumstances occur that make it more likely than not that impairment has occurred. As part of its testing, the Company first assesses qualitative factors to determine whether it is more likely than not that the fair value of a reporting unit is less than its carrying amount. If the Company determines the fair value of a reporting
unit is less than its carrying amount using these qualitative factors, the Company compares the fair value of goodwill with its carrying amount, and then measures impaired loss by comparing the implied fair value of goodwill with the carrying amount of that goodwill. Other intangibles are also assessed for impairment, both annually and when events or circumstances occur, that make it more likely than not that impairment has occurred.
During the first quarter Goodwill is discussed more fully under Part II - Item 8. Financial Statements and Supplementary Data - Note B - Summary of 2020, management determined that the deterioration in the general economic conditions as a resultSignificant Accounting Policies of the COVID-19 pandemic represented a triggering event prompting an evaluation of goodwill impairment. Based on the analyses performed in the first quarter of 2020, we determined that goodwill was not impaired. Due to the ongoing economic uncertainty present at the end of the second quarter, thethis report.
Overview
The Company
prepared a Step 1 goodwill impairment analysis as of June 30, 2020. In testing goodwill for impairment, the Company compared the estimated fair value of its reporting unit to its carrying amount, including goodwill. The estimated fair value of the reporting unit exceeded its book value.In 2021, the Company elected to perform qualitative assessments, on a quarterly basis, to determine if it was more likely than not that the fair value of the reporting unit exceeded their carrying values. The qualitative assessments indicated that is was more likely than not that the fair value of the reporting unit exceeded it carrying value, resulting in no impairment. As a result, we do not believe there exists any impairment to goodwill and intangible assets or long-lived assets due to the COVID-19 pandemic. In addition, in future periods the Company will be required to evaluate the impact of COVID-19 on the carrying value of certain of its assets, including goodwill, and to conduct impairments tests on those assets, which may result in impairment charges on these assets in future periods that could be material.
Overview
The First Bancshares, Inc. (the Company) was incorporated on June 23, 1995, and serves as a bank holding company for The First, Bank (“The First”), formerly known as The First, A National Banking Association, located in Hattiesburg, Mississippi. The First began operations on August 5, 1996, from its main office in the Oak Grove community, which is now incorporated within the city of Hattiesburg. Currently, the First has 90116 locations in Mississippi, Alabama, Florida, Georgia and Louisiana. The Company and The First engage in a general commercial and retail banking business characterized by personalized service and local decision-making, emphasizing the banking needs of small to medium-sized businesses, professional concerns, and individuals.
The Company’s primary source of revenue is interest income and fees, which it earns by lending and investing the funds which are held on deposit. Because loans generally earn higher rates of interest than investments, the Company seeks to employ as much of its deposit funds as possible in the form of loans to individuals, businesses, and other organizations. To ensure sufficient liquidity, the Company also maintains a portion of its deposits in cash, government securities, deposits with other financial institutions, and overnight loans of excess reserves (known as “Federal Funds Sold”) to correspondent banks. The revenue which the Company earns (prior to deducting its overhead expenses) is essentially a function of the amount of the Company’s loans and deposits, as well as the profit margin (“interest spread”) and fee income which can be generated on these amounts.
Highlights for the year:
•In the year-over-year comparison, net income available to common shareholders increased $12.5 million, or 19.9%, from $62.9 million for the year ended December 31, 2021 include: | ● | During the first quarter of 2021, the Company adopted CECL methodology for estimating credit losses, effective January 1, 2021.2022 to $75.5 million for the same period ended December 31, 2023. |
| ● | In year-over-year comparison, net income available to common shareholders increased $11.7 million, or 22.2%, from $52.5 million for the year ended December 31, 2020 to $64.2 million for the year ended December 31, 2021. |
| ● | In year-over-year comparison, net interest income, excluding accretion income and PPP fee income increased $2.7 million, or 1.8%. |
| ● | On December 3, 2021, the Company closed its acquisition of seven branches from Cadence Bank which included $40.5 million in loans and $410.2 million in deposits. The Company recorded a bargain purchase gain of $1.3 million related to this acquisition. |
•Excluding the loans acquired from the Heritage Bank acquisition of $1.159 billion, total loans increased $236.9 million for the year ended December 31, 2023, representing net growth of 6.3%, as compared to the same period ended December 31, 2022.•Past due loans of $11.7 million to total loans was 0.23% for the year ended December 31, 2023, compared to $6.1 million, or 0.16% for the same period ended December 31, 2022.
| ● | On December 14, 2021, the U.S. Department of Treasury informed the Company of its eligibility to receive $175.0 million of non-dilutive Tier 1 perpetual preferred capital under the Emergency Capital Investment Program (“ECIP”), subject to the Company’s acceptance of the final terms of the ECIP. |
| ● | Subsequent to year end, on January 15, 2022, the Bank converted from a national banking association to a Mississippi state-chartered bank and became a member bank of the Federal Reserve System. |
At December 31, 2021,2023, the Company had approximately $6.077$7.999 billion in total assets, an increase of $924.7 million$1.538 billion compared to $5.153$6.462 billion at December 31, 2020.2022. Loans, including mortgage loans held for sale and net of the allowance for credit losses, decreasedincreased to $2.936$5.119 billion at December 31, 20212023 from $3.109$3.740 billion at December 31, 2020.2022. Deposits increased to $5.227$6.463 billion at December 31, 20212023 from $4.215$5.494 billion at December 31, 2020.2022. Stockholders’ equity increased to $676.2$949.0 million at December 31, 20212023 from $644.8$646.7 million at December 31, 2020.2022. The additionacquisition of the seven CadenceHeritage Bank branches during 20212023 contributed, at acquisition, $412.9 million, $40.5 million$1.565 billion, $1.159 billion, net of purchase accounting adjustments, and $410.2 million$1.392 billion, net of purchase accounting adjustments, in assets, loans, and deposits, respectively.
The First (Bank only) reported net income of
$73.9$81.8 million,
$60.0$72.6 million and
$51.1$73.9 million for the years ended December 31,
2021, 2020,2023, 2022, and
2019,2021, respectively. For the years ended December 31,
2021, 20202023, 2022 and
2019,2021, the Company reported consolidated net income available to common stockholders of
$64.2$75.5 million,
$52.5$62.9 million and
$43.7$64.2 million, respectively. The following discussion should be read in conjunction with
the Selected Consolidated Financial Data and the Company's consolidated financial statements and the Notes thereto and the other financial data included elsewhere.
The following is a summary of the results of operations for The First (Bank only) the years ended December 31,
2021, 2020,2023, 2022, and
2019 ($ in thousands):
| | | | | | | | | |
| | 2021 | | 2020 | | 2019 |
Interest income | | $ | 176,735 | | $ | 179,328 | | $ | 148,503 |
Interest expense | | | 12,306 | | | 21,071 | | | 21,805 |
Net interest income | | | 164,429 | | | 158,257 | | | 126,698 |
| | | | | | | | | |
Provision for credit losses | | | (1,104) | | | 25,151 | | | 3,738 |
| | | | | | | | | |
Net interest income after provision for loan losses | | | 165,533 | | | 133,106 | | | 122,960 |
| | | | | | | | | |
Non-interest income | | | 37,362 | | | 40,984 | | | 25,885 |
Non-interest expense | | | 108,791 | | | 100,966 | | | 82,750 |
| | | | | | | | | |
Income tax expense | | | 20,210 | | | 13,108 | | | 15,085 |
| | | | | | | | | |
Net income | | $ | 73,894 | | $ | 60,016 | | $ | 51,010 |
2021. | | | | | | | | | | | | | | | | | |
| ($ in thousands) | 2023 | | 2022 | | 2021 |
| Interest income | $ | 340,897 | | $ | 200,375 | | $ | 176,735 |
| Interest expense | 83,638 | | 15,085 | | 12,306 |
| Net interest income | 257,259 | | 185,290 | | 164,429 |
| Provision for credit losses | 14,500 | | | 5,605 | | (1,104) |
| Net interest income after provision for loan losses | 242,759 | | 179,685 | | 165,533 |
| Non-interest income | 39,722 | | 34,288 | | 37,362 |
| Non-interest expense | 177,324 | | 122,373 | | 108,791 |
| Income tax expense | 23,352 | | 19,033 | | 20,210 |
| Net income | $ | 81,805 | | $ | 72,567 | | $ | 73,894 |
The following reconciles the above table to the amounts reflected in the consolidated financial statements of the Company at December 31,
2021, 2020,2023, 2022, and
2019 ($ in thousands):
| | | | | | | | | |
| | 2021 | | 2020 | | 2019 |
Net interest income: | | | | | | | | | |
Net interest income of The First | | $ | 164,429 | | $ | 158,257 | | $ | 126,699 |
Interest expense | | | (7,365) | | | (5,573) | | | (4,893) |
| | $ | 157,064 | | $ | 152,684 | | $ | 121,806 |
| | | | | | | | | |
Net income available to common shareholders: | | | | | | | | | |
Net income of The First | | $ | 73,894 | | $ | 60,016 | | $ | 51,103 |
Net loss of the Company | | | (9,727) | | | (7,511) | | | (7,358) |
| | $ | 64,167 | | $ | 52,505 | | $ | 43,745 |
2021.
| | | | | | | | | | | | | | | | | |
| ($ in thousands) | 2023 | | 2022 | | 2021 |
| Net interest income: | | | | | |
| Net interest income of The First | $ | 257,259 | | | $ | 185,290 | | | $ | 164,429 | |
| Interest expense | 7,934 | | | 7,474 | | | 7,365 | |
| $ | 249,325 | | | $ | 177,816 | | | $ | 157,064 | |
| | | | | |
| Net income available to common shareholders: | | | | | |
| Net income of The First | $ | 81,805 | | | $ | 72,567 | | | $ | 73,894 | |
| Net loss of the Company | (6,348) | | | (9,648) | | | (9,727) | |
| $ | 75,457 | | | $ | 62,919 | | | $ | 64,167 | |
The Company reported consolidated net income available to common stockholders of $64.2$75.5 million for the year ended December 31, 2021,2023, compared to a consolidated net income of $52.5$62.9 million for the year ended December 31, 2020. The change in provision for credit loss expenses in year over year comparison accounted for $19.62022.
Net interest income was $249.3 million
net of tax of the change. The Company recorded a bargain purchase gain and loss on sale of land of $674 thousand, net of tax for the
year end December 31, 2021 compared to a bargain purchase and sale of land gains of $8.3 million, net of tax for the yeartwelve months ended December 31,
2020.Net interest income increased $4.4 million in year-over-year comparison, primarily due to interest income earned on a higher volume of securities and a reduction in interest expense due to changes in rates. Non-interest income increased $2.3 million in year-over-year comparison excluding the gains mentioned above. Interchange fee income increased $2.1 million and the U.S. Treasury Rapid Response Program (“RRP”) grant of $1.4 million, net of tax accounted for the increase in year-over-year comparison. Non-interest expense was $114.6 million for the year ended December 31, 2021,2023, an increase of $8.2 million as compared to the same period ended December 31, 2020. An increase of $4.6 million in salaries and employee benefits and an increase of $1.7 million in occupancy expense contributed to the increase.
The Company reported consolidated net income available to common stockholders of $52.5 million for the year ended December 31, 2020, compared to a consolidated net income of $43.7 million for the year ended December 31, 2019. Excluding the bargain purchase and sale of land gains of $8.3 million, net of tax, and the increased provision expense of $16.5 million, net of tax, net income available to common shareholders increased $17.0 million in year-over-year comparison. Net interest income increased $30.9$71.5 million in year-over-year comparison, primarily due to interest income earned on a higher volume of loans (including loans acquired from Heritage Bank and securities. Beach Bank).
Non-interest income increased $6.5was $46.7 million in year-over-year comparison excludingfor the awards and gains mentioned above. Mortgage income increased $4.5year ended December 31, 2023, an increase of $9.7 million as compared to the same period ended December 31, 2022. Service charges on deposit accounts and interchange fee income increased $1.4accounted for $11.7 million inof the year-over-year comparison. increase.
Non-interest expense was $106.3$184.7 million atfor the year ended December 31, 2020,2023, an increase of $17.8$54.2 million as compared to the same period ended December 31, 2022. The increase was partially attributable to $2.7 million in year-over-year comparison, of which $12.3acquisition and charter conversion charges and $32.1 million isin increased operating expenses related to the acquisitions of Beach Bank and Heritage Bank as well as $5.2 million in expenses associated with the U.S. Treasury awards and increases in FDIC premiums of $1.7 million and a $4.9 million increase in core deposit amortization for the year ended December 31, 2023.
The Company reported consolidated net income available to common stockholders of $62.9 million for the year ended December 31, 2022, compared to a consolidated net income of $64.2 million for the year ended December 31, 2021. In the year-over-year comparison, Paycheck Protection Program ("PPP") loans fee income decreased $9.8 million.
Net interest income increased $14.0 million for the year ended December 31, 2022 compared to the same time period in 2021, primarily due to interest income earned on a higher volume of securities and loans and increased interest rates.
Non-interest income decreased $512 thousand for the year ended December 31, 2022 compared to the same time period in 2021. Increased service charges on deposit accounts and interchange fee income of $2.5 million was offset by a decrease in mortgage income of $4.5 million.
Non-interest expense was $130.5 million for the year ended December 31, 2022, an increase of $15.9 million as compared to the same period ended December 31, 2021. An increase of $4.8 million in acquisition and charter conversion charges and $3.3 million related to the ongoing operations of
First Floridathe Cadence Bank
(“FFB”)branches and
SWG.$5.1 million related to the Beach Bank branch operations accounted for the increase in non-interest expense.
See Note C – Business Combinations in the accompanying notes to the consolidated financial statements included elsewhere in this report for more information on how the Company accounts for business combinations.
Consolidated Net Interest Income
The largest component of net income for the Company is net interest income, which is the difference between the income earned on assets and interest paid on deposits and borrowings used to support such assets. Net interest income is determined by the rates earned on the Company’s interest-earning assets and the rates paid on its interest-bearing liabilities, the relative amounts of interest-earning assets and interest-bearing liabilities, and the degree of mismatch and the maturity and repricing characteristics of its interest-earning assets and interest-bearing liabilities.
Consolidated net interest income was approximately $157.1$249.3 million for the year ended December 31, 2021,2023, as compared to $152.7$177.8 million for the year ended December 31, 2020. This increase was the direct result of2022, primarily due to interest income earned on a higher volume of securitiesloans (including loans acquired from Heritage Bank and a reduction in interest expense due to changes in rates during 2021 as compared to 2020.Beach Bank). Average interest-bearing liabilities for the year 20212023 were
$4.548 $4.935 billion compared to $3.902$3.944 billion for the year 2020. At December 31, 2021, the fully tax equivalent (“FTE”) net interest spread, which is the difference between the yield on earning assets and the rates paid on interest-bearing liabilities, was 3.18% compared to 3.59% at December 31, 2020.2022. Net interest margin, which is net interest income divided by average earning assets, was 3.21%3.59% for the year 20212023 compared to 3.64%3.19% for the year 2020. At December 31, 2021, the FTE average yield on all earning assets decreased 66 basis points to 3.61% compared to 4.27% at December 31, 2020.2022. Rates paid on average interest-bearing liabilities decreasedincreased to 0.43%1.86% for the year 20212023 compared to 0.68%0.57% for the year 2020.2022. Interest earned on assets and interest accrued on liabilities is significantly influenced by market factors, specifically interest rates as set by Federalfederal agencies. Average loans comprised 60.8%71.4% of average earnings assets for the year 20212023 compared to 71.0%58.0% for the year 2020.
2022.
Consolidated net interest income was approximately
$152.7$177.8 million for the year ended December 31,
2020,2022, as compared to
$121.8$157.1 million for the year ended December 31,
2019.2021. This increase was the direct result of higher volume of
securities and loans and
securitiesincreased interest rates during
20202022 as compared to
2019.2021. Average interest-bearing liabilities for the year
20202022 were
$3.902$3.944 billion compared to
$2.345$3.435 billion for the year
2019. At December 31, 2020, the fully tax equivalent (“FTE”) net interest spread, which is the difference between the yield on earning assets and the rates paid on interest-bearing liabilities, was 3.59% compared to 3.75% at December 31, 2019.2021. Net interest margin, which is net interest income divided by average earning assets, was
3.64%3.19% for the year
20202022 compared to
4.02%3.21% for the year
2019. At December 31, 2020, the FTE average yield on all earning assets decreased 62 basis points to 4.27% compared to 4.89% at December 31, 2019.2021. Rates paid on average interest-bearing liabilities
decreased to 0.68%was 0.57% for the year
2020 compared to 1.14%2022 and remained unchanged for the year
2019.ended 2021. Interest earned on assets and interest accrued on liabilities is significantly influenced by market factors, specifically interest rates as set by
Federalfederal agencies. Average loans comprised
71.0%58.0% of average earnings assets for the year
20202022 compared to
76.5%60.8% for the year
2019.2021.
Average Balances, Income and Expenses, and Rates. The following tables depict, for the periods indicated, certain information related to the average balance sheet and average yields on assets and average costs of liabilities. Such yields are derived by dividing income or expense by the average balance of the corresponding assets or liabilities. Average balances have been derived from daily averages.
Average Balances, Income and Expenses, and Rates
| | | | | | | | | | | | | | | | | | | | | | | | | | | | | | | | | | | | | | | | | | | | | | | | | | | | | | | | |
| | Years Ended December 31, |
| | 2023 | | 2022 | | 2021 |
| ($ in thousands) | | Average
Balance | | Income/
Expenses | | Yield/
Rate | | Average
Balance | | Income/
Expenses | | Yield/
Rate | | Average
Balance | | Income/
Expenses | | Yield/ Rate |
| Assets | | | | | | | | | | | | | | | | | | |
| Earning Assets | | | | | | | | | | | | | | | | | | |
| Loans (1)(2) | | $ | 5,036,021 | | | $ | 294,541 | | | 5.85 | % | | $ | 3,302,265 | | | $ | 157,761 | | | 4.78 | % | | $ | 3,019,605 | | | $ | 151,203 | | | 5.01 | % |
| Securities (4) | | 1,918,575 | | | 47,913 | | | 2.50 | % | | 2,023,214 | | | 46,305 | | | 2.29 | % | | 1,305,262 | | | 28,035 | | | 2.15 | % |
| Federal funds sold and interest bearing deposits with other banks (3) | | 97,183 | | | 2,453 | | | 2.52 | % | | 366,465 | | | 50 | | | 0.01 | % | | 642,042 | | | 121 | | | 0.02 | % |
| Total earning assets | | 7,051,779 | | | 344,907 | | | 4.89 | % | | 5,691,944 | | | 204,116 | | | 3.59 | % | | 4,966,909 | | | 179,359 | | | 3.61 | % |
| Other | | 866,869 | | | | | | | 584,164 | | | | | | | 526,877 | | | | | |
| Total assets | | $ | 7,918,648 | | | | | | | $ | 6,276,108 | | | | | | | $ | 5,493,786 | | | | | |
| | | | | | | | | | | | | | | | | | |
| Liabilities | | | | | | | | | | | | | | | | | | |
| Interest-bearing liabilities | | $ | 4,934,875 | | | $ | 91,608 | | | 1.86 | % | | $ | 3,943,531 | | | $ | 22,577 | | | 0.57 | % | | $ | 3,434,964 | | | $ | 19,681 | | | 0.57 | % |
| Demand deposits | | 2,012,129 | | | | | | | 1,660,696 | | | | | | | 1,366,529 | | | | | |
| Other liabilities | | 77,252 | | | | | | | 45,065 | | | | | | | 34,827 | | | | | |
| Stockholders’ equity | | 894,392 | | | | | | | 626,816 | | | | | | | 657,466 | | | | | |
| Total liabilities and stockholders’ equity | | $ | 7,918,648 | | | | | | | $ | 6,276,108 | | | | | | | $ | 5,493,786 | | | | | |
| | | | | | | | | | | | | | | | | | |
| Net interest spread | | | | | | 3.03 | % | | | | | | 3.02 | % | | | | | | 3.04 | % |
| Net yield on interest-earning assets | | | | $ | 253,299 | | | 3.59 | % | | | | $ | 181,539 | | | 3.19 | % | | | | $ | 159,678 | | | 3.21 | % |
(1) | | | | | | | | | | | | | | | | | | | | | | | | | |
| | Years Ended December 31, | |
| | 2021 | | 2020 | | 2019 | |
| | Average | | Income/ | | Yield/ | | Average | | Income/ | | Yield/ | | Average | | Income/ | | Yield/ | |
($ in thousands) | | Balance | | Expenses | | Rate | | Balance | | Expenses | | Rate | | Balance | | Expenses | | Rate | |
Assets | | | | | | | | | | | | | | | | | | | | | | | | | |
Earning Assets | | | | | | | | | | | | | | | | | | | | | | | | | |
Loans (1)(2) | | $ | 3,019,605 | | $ | 151,203 | | 5.01 | % | $ | 3,020,280 | | $ | 157,564 | | 5.22 | % | $ | 2,341,202 | | $ | 128,857 | | 5.50 | % |
Securities (4) | | | 1,305,262 | | | 28,035 | | 2.15 | % | | 917,858 | | | 23,747 | | 2.59 | % | | 635,967 | | | 20,616 | | 3.24 | % |
Federal funds sold and interest bearing deposits with other banks (3) | | | 642,042 | | | 121 | | 0.02 | % | | 317,848 | | | 378 | | 0.12 | % | | 84,171 | | | 264 | | 0.31 | % |
Total earning assets | | | 4,966,909 | | | 179,359 | | 3.61 | % | | 4,255,986 | | | 181,689 | | 4.27 | % | | 3,061,340 | | | 149,737 | | 4.89 | % |
Other | | | 526,877 | | | | | | | | 523,412 | | | | | | | | 401,614 | | | | | | |
Total assets | | $ | 5,493,786 | | | | | | | $ | 4,779,398 | | | | | | | $ | 3,462,954 | | | | | | |
| | | | | | | | | | | | | | | | | | | | | | | | | |
Liabilities | | | | | | | | | | | | | | | | | | | | | | | | | |
Interest-bearing liabilities | | $ | 4,548,169 | | $ | 19,681 | | 0.43 | % | $ | 3,901,797 | | $ | 26,664 | | 0.68 | % | $ | 2,344,755 | | $ | 26,723 | | 1.14 | % |
Demand deposits (1) | | | 253,324 | | | | | | | | 235,909 | | | | | | | | 154,122 | | | | | | |
Other liabilities | | | 34,827 | | | | | | | | 34,582 | | | | | | | | 505,376 | | | | | | |
Stockholders’ equity | | | 657,466 | | | | | | | | 607,110 | | | | | | | | 458,701 | | | | | | |
Total liabilities and stockholders’ equity | | $ | 5,493,786 | | | | | | | $ | 4,779,398 | | | | | | | $ | 3,462,954 | | | | | | |
| | | | | | | | | | | | | | | | | | | | | | | | | |
Net interest spread | | | | | | | | 3.18 | % | | | | | | | 3.59 | % | | | | | | | 3.75 | % |
Net yield on interest-earning assets | | | | | $ | 159,678 | | 3.21 | % | | | | $ | 155,025 | | 3.64 | % | | | | $ | 123,014 | | 4.02 | % |
(2)Includes loan fees of $7,665, $7,453, and $17,138 for the years ended December 31, 2023, 2022, and 2021, respectively.
(3)Includes Excess Balance Account-First National Banker’s Bank.
| (1) | All loans and deposits were made to borrowers or received from depositors in the United States. Includes nonaccrual loans of $28,013, $33,774, and $38,835 for the years ended December 31, 2021, 2020, and 2019, respectively. Loans include held for sale loans.(4) |
| (2) | Includes loan fees of $17,138, $9,899, and $4,322 for the years ended December 31, 2021, 2020, and 2019, respectively. |
| (3) | Includes Excess Balance Account-Mississippi National Banker’s Bank. |
| (4) | Fully tax equivalent yield assuming a 25.3% tax rate. |
Analysis of Changes in Net Interest Income. The following table presents the consolidated dollar amount of changes in interest income and interest expense attributable to changes in volume and to changes in rate. The combined effect in both volume and rate which cannot be separately identified has been allocated proportionately to the change due to volume and due to rate.
Analysis of Changes in Consolidated Net Interest Income
| | | | | | | | | | | | | | | | | | | | | | | | | | | | | | | | | | | | | | |
| | Year Ended December 31,
2023 versus 2022
Increase (decrease) due to | | Year Ended December 31,
2022 versus 2021
Increase (decrease) due to |
| ($ in thousands) | | Volume | | Rate | | Net | | Volume | | Rate | | Net |
| Earning Assets | | | | | | | | | | | | |
| Loans | | $ | 82,887 | | | $ | 53,893 | | | $ | 136,780 | | | $ | 14,176 | | | $ | (7,595) | | | $ | 6,581 | |
| Securities (1) | | (2,405) | | | 4,013 | | | 1,608 | | | 15,436 | | | 2,832 | | | 18,268 | |
| Federal funds sold and interest bearing deposits with other banks | | (28) | | | 2,431 | | | 2,403 | | | (55) | | | (37) | | | (92) | |
| Total interest income | | 80,454 | | | 60,337 | | | 140,791 | | | 29,557 | | | (4,800) | | | 24,757 | |
| Interest-Bearing Liabilities | | | | | | | | | | | | |
| Interest-bearing transaction accounts | | 903 | | | 19,659 | | | 20,562 | | | 1,278 | | | (745) | | | 533 | |
| Money market accounts and savings | | 491 | | | 16,071 | | | 16,562 | | | 226 | | | 819 | | | 1,045 | |
| Time deposits | | 2,078 | | | 18,160 | | | 20,238 | | | 294 | | | (52) | | | 242 | |
| Borrowed funds | | 10,642 | | | 1,027 | | | 11,669 | | | 241 | | | 835 | | | 1,076 | |
| Total interest expense | | 14,114 | | | 54,917 | | | 69,031 | | | 2,039 | | | 857 | | | 2,896 | |
| Net interest income | | $ | 66,340 | | | $ | 5,420 | | | $ | 71,760 | | | $ | 27,518 | | | $ | (5,657) | | | $ | 21,861 | |
| | | | | | | | | | | | | | | | | | |
| | Year Ended December 31, | | Year Ended December 31, |
| | 2021 versus 2020 | | 2020 versus 2019 |
| | Increase (decrease) due to | | Increase (decrease) due to |
($ in thousands) | | Volume | | Rate | | Net | | Volume | | Rate | | Net |
Earning Assets | | | | | | | | | | | | | | | | | | |
Loans | | $ | (35) | | $ | (6,246) | | $ | (6,281) | | $ | 37,283 | | $ | (8,576) | | $ | 28,707 |
Securities (1) | | | 9,949 | | | (5,749) | | | 4,200 | | | 9,122 | | | (5,991) | | | 3,131 |
| | | | | | | | | | | | | | | | | | |
Federal funds sold and interest bearing deposits with other banks | | | 386 | | | (635) | | | (249) | | | 721 | | | (607) | | | 114 |
Total interest income | | | 10,300 | | | (12,630) | | | (2,330) | | | 47,126 | | | (15,174) | | | 31,952 |
Interest-Bearing Liabilities | | | | | | | | | | | | | | | | | | |
Interest-bearing transaction accounts | | | 2,100 | | | (3,746) | | | (1,646) | | | (1,202) | | | 1,835 | | | 633 |
Money market accounts and savings | | | 950 | | | (2,757) | | | (1,807) | | | 1,992 | | | (1,901) | | | 91 |
Time deposits | | | (1,267) | | | (2,836) | | | (4,103) | | | 1,487 | | | (2,345) | | | (858) |
Borrowed funds | | | 1,251 | | | (678) | | | 573 | | | 1,443 | | | (1,368) | | | 75 |
Total interest expense | | | 3,034 | | | (10,017) | | | (6,983) | | | 3,720 | | | (3,779) | | | (59) |
Net interest income | | $ | 7,266 | | $ | (2,613) | | $ | 4,653 | | $ | 43,406 | | $ | (11,395) | | $ | 32,011 |
(1)Fully tax equivalent yield assuming a 25.3% tax rate.
Interest Sensitivity. The Company monitors and manages the pricing and maturity of its assets and liabilities in order to diminish the potential adverse impact that changes in interest rates could have on its net interest income. A monitoring technique employed by the Company is the measurement of the Company’s interest sensitivity "gap," which is the positive or negative dollar difference between assets and liabilities that are subject to interest rate repricing within a given period of time. The Company also performs asset/liability modeling to assess the impact varying interest rates and balance sheet mix assumptions will have on net interest income. Interest rate sensitivity can be managed by repricing assets or liabilities, selling securities available-for-sale, replacing an asset or liability at maturity, or adjusting the interest rate during the life of an asset or liability. Managing the amount of assets and liabilities repricing in the same time interval helps to hedge the risk and minimize the impact on net interest income of rising or falling interest rates. The Company evaluates interest sensitivity risk and then formulates guidelines regarding asset generation and repricing, funding sources and pricing, and off-balance sheet commitments in order to decrease interest rate sensitivity risk.
In the third quarter of 2022, the Company ceased the Deposit Reclassification program it implemented at the beginning of 2020. The program reclassified non-interest bearing and NOW deposit balances to money market accounts. The following tables illustrate the Company’s consolidated interest rate sensitivity and consolidated cumulative gap position by maturity at December 31,
2023, 2022, and 2021. Deposits at December 31, 2021
2020, and 2019 ($ in thousands):
| | | | | | | | | | | | | | | |
| | December 31, 2021 |
| | | | | After Three | | | | | | | | | |
| | Within | | Through | | Within | | Greater Than | | | |
| | Three | | Twelve | | One | | One Year or | | | |
| | Months | | Months | | Year | | Nonsensitive | | Total |
Assets | | | | | | | | | | | | | | | |
Earning Assets: | | | | | | | | | | | | | | | |
Loans | | $ | 147,728 | | $ | 256,450 | | $ | 404,178 | | $ | 2,563,053 | | $ | 2,967,231 |
Securities (2) | | | 8,959 | | | 51,457 | | | 60,416 | | | 1,713,642 | | | 1,774,058 |
Funds sold and other | | | — | | | 804,481 | | | 804,481 | | | — | | | 804,481 |
Total earning assets | | $ | 156,687 | | $ | 1,112,388 | | $ | 1,269,075 | | $ | 4,276,695 | | $ | 5,545,770 |
Liabilities | | | | | | | | | | | | | | | |
Interest-bearing liabilities: | | | | | | | | | | | | | | | |
Interest-bearing deposits: | | | | | | | | | | | | | | | |
NOW accounts (1) | | $ | — | | $ | 1,771,510 | | $ | 1,771,510 | | $ | — | | $ | 1,771,510 |
Money market accounts | | | 817,476 | | | — | | | 817,476 | | | — | | | 817,476 |
Savings deposits (1) | | | — | | | 502,808 | | | 502,808 | | | — | | | 502,808 |
Time deposits | | | 132,025 | | | 312,958 | | | 444,983 | | | 139,626 | | | 584,609 |
Total interest-bearing deposits | | | 949,501 | | | 2,587,276 | | | 3,536,777 | | | 139,626 | | | 3,676,403 |
Total interest-bearing liabilities | | | 949,501 | | | 2,587,276 | | | 3,536,777 | | | 139,626 | | | 3,676,403 |
Interest-sensitivity gap per period | | $ | (792,814) | | $ | (1,474,888) | | $ | (2,267,702) | | $ | 4,137,069 | | $ | 1,869,367 |
Cumulative gap at December 31, 2021 | | $ | (792,814) | | $ | (2,267,702) | | $ | (2,267,702) | | $ | 1,869,367 | | $ | 1,867,367 |
Ratio of cumulative gap to total earning assets at December 31, 2021 | | | (14.3) | % | | (40.9) | % | | (40.9) | % | | 33.7 | % | | |
| | | | | | | | | | | | | | | |
| | December 31, 2020 |
| | | | | After Three | | | | | | | | | |
| | Within | | Through | | Within | | Greater Than | | | |
| | Three | | Twelve | | One | | One Year or | | | |
| | Months | | Months | | Year | | Nonsensitive | | Total |
Assets | | | | | | | | | | | | | | | |
Earning Assets: | | | | | | | | | | | | | | | |
Loans | | $ | 220,572 | | $ | 222,176 | | $ | 442,748 | | $ | 2,702,362 | | $ | 3,145,110 |
Securities (2) | | | 9,211 | | | 24,012 | | | 33,223 | | | 1,016,434 | | | 1,049,657 |
Funds sold and other | | | — | | | 424,870 | | | 424,870 | | | — | | | 424,870 |
Total earning assets | | $ | 229,783 | | $ | 671,058 | | $ | 900,841 | | $ | 3,718,796 | | $ | 4,619,637 |
Liabilities | | | | | | | | | | | | | | | |
Interest-bearing liabilities: | | | | | | | | | | | | | | | |
Interest-bearing deposits: | | | | | | | | | | | | | | | |
NOW accounts (1) | | $ | — | | $ | 1,347,778 | | $ | 1,347,778 | | $ | — | | $ | 1,347,778 |
Money market accounts | | | 705,357 | | | — | | | 705,357 | | | — | | | 705,357 |
Savings deposits (1) | | | — | | | 395,116 | | | 395,116 | | | — | | | 395,116 |
Time deposits | | | 116,796 | | | 303,571 | | | 420,367 | | | 160,682 | | | 581,049 |
Total interest-bearing deposits | | | 822,153 | | | 2,046,465 | | | 2,868,618 | | | 160,682 | | | 3,029,300 |
Borrowed funds (3) | | | 110,182 | | | 554 | | | 110,736 | | | 3,911 | | | 114,647 |
Total interest-bearing liabilities | | | 932,335 | | | 2,047,019 | | | 2,979,354 | | | 164,593 | | | 3,143,947 |
Interest-sensitivity gap per period | | $ | (702,552) | | $ | (1,375,961) | | $ | (2,078,513) | | $ | 3,554,203 | | $ | 1,475,690 |
Cumulative gap at December 31, 2020 | | $ | (702,552) | | $ | (2,078,513) | | $ | (2,078,513) | | $ | 1,475,690 | | $ | 860,789 |
Ratio of cumulative gap to total earning assets at December 31, 2020 | | | (15.2) | % | | (45.0) | % | | (45.0) | % | | 31.9 | % | | |
are shown without reclassification for consistency with the current period presentation. | | | | | | | | | | | | | | | | | | | | | | | | | | | | | |
| $ in thousands | December 31, 2023 |
| Within
Three
Months | | After Three
Through
Twelve
Months | | Within
One
Year | | Greater Than
One Year or
Nonsensitive | | Total |
| Assets | | | | | | | | | |
| Earning assets: | | | | | | | | | |
| Loans | $ | 262,916 | | $ | 406,261 | | $ | 669,177 | | $ | 4,503,779 | | $ | 5,172,956 | |
| Securities (2) | 51,735 | | 35,679 | | 87,414 | | 1,609,490 | | 1,696,904 | |
| Funds sold and other | — | | 130,948 | | 130,948 | | — | | 130,948 | |
| Total earning assets | $ | 314,651 | | $ | 572,888 | | $ | 887,539 | | $ | 6,113,269 | | $ | 7,000,808 | |
| Liabilities | | | | | | | | | |
| Interest-bearing liabilities: | | | | | | | | | |
| Interest-bearing deposits: | | | | | | | | | |
| NOW accounts (1) | $ | — | | $ | 1,914,792 | | $ | 1,914,792 | | $ | — | | $ | 1,914,792 | |
| Money market accounts | 1,090,484 | | — | | 1,090,484 | | — | | 1,090,484 | |
| Savings deposits (1) | — | | 532,827 | | 532,827 | | — | | 532,827 | |
| Time deposits | 361,342 | | 618,134 | | 979,476 | | 96,280 | | 1,075,756 | |
| Total interest-bearing deposits | 1,451,826 | | 3,065,753 | | 4,517,579 | | 96,280 | | $ | 4,613,859 | |
| Borrowed funds (3) | 250,000 | | 140,000 | | 390,000 | | — | | 390,000 | |
| Total interest-bearing liabilities | 1,701,826 | | 3,205,753 | | 4,907,579 | | 96,280 | | 5,003,859 | |
| Interest-sensitivity gap per period | $ | (1,387,175) | | $ | (2,492,865) | | $ | (4,020,040) | | $ | 6,016,989 | | $ | 1,996,949 | |
| Cumulative gap at December 31, 2023 | $ | (1,387,175) | | $ | (3,880,040) | | $ | (4,020,040) | | $ | 1,996,949 | | $ | 1,996,949 | |
| Ratio of cumulative gap to total earning assets at December 31, 2023 | (19.8) | % | | (55.4) | % | | (57.4) | % | | 28.5 | % | | |
| | | | | | | | | | | | | | | |
| | December 31, 2019 |
| | | | | After Three | | | | | | | | | |
| | Within | | Through | | Within | | Greater Than | | | |
| | Three | | Twelve | | One | | One Year or | | | |
| | Months | | Months | | Year | | Nonsensitive | | Total |
Assets | | | | | | | | | | | | | | | |
Earning Assets: | | | | | | | | | | | | | | | |
Loans | | $ | 179,998 | | $ | 272,741 | | $ | 452,739 | | $ | 2,158,429 | | $ | 2,611,168 |
Securities (2) | | | 9,125 | | | 25,282 | | | 34,407 | | | 757,370 | | | 791,777 |
Funds sold and other | | | — | | | 79,128 | | | 79,128 | | | — | | | 79,128 |
Total earning assets | | $ | 189,123 | | $ | 377,151 | | $ | 566,274 | | $ | 2,915,799 | | $ | 3,482,073 |
Liabilities | | | | | | | | | | | | | | | |
Interest-bearing liabilities: | | | | | | | | | | | | | | | |
Interest-bearing deposits: | | | | | | | | | | | | | | | |
NOW accounts (1) | | $ | — | | $ | 941,597 | | $ | 941,597 | | $ | — | | $ | 941,597 |
Money market accounts | | | 462,810 | | | — | | | 462,810 | | | — | | | 462,810 |
Savings deposits (1) | | | — | | | 287,200 | | | 287,200 | | | — | | | 287,200 |
Time deposits | | | 123,978 | | | 378,170 | | | 502,148 | | | 159,570 | | | 661,718 |
Total interest-bearing deposits | | | 586,788 | | | 1,606,967 | | | 2,193,755 | | | 159,570 | | | 2,353,325 |
Borrowed funds (3) | | | 207,965 | | | 1,000 | | | 208,965 | | | 5,354 | | | 214,319 |
Total interest-bearing liabilities | | | 794,753 | | | 1,607,967 | | | 2,402,720 | | | 164,924 | | | 2,567,644 |
Interest-sensitivity gap per period | | $ | (605,630) | | $ | (1,230,816) | | $ | (1,836,446) | | $ | 2,750,875 | | $ | 914,429 |
Cumulative gap at December 31, 2019 | | $ | (605,630) | | $ | (1,836,466) | | $ | (1,836,446) | | $ | 914,429 | | $ | 914,429 |
Ratio of cumulative gap to total earning assets at December 31, 2019 | | | (17.4) | % | | (52.7) | % | | (52.7) | % | | 26.3 | % | | |
| | | | | | | | | | | | | | | | | | | | | | | | | | | | | |
| $ in thousands | December 31, 2022 |
| Within
Three
Months | | After Three
Through
Twelve
Months | | Within
One
Year | | Greater Than
One Year or
Nonsensitive | | Total |
| Assets | | | | | | | | | |
| Earning assets: | | | | | | | | | |
| Loans | $ | 180,128 | | $ | 247,781 | | $ | 427,909 | | $ | 3,350,693 | | $ | 3,778,602 | |
| Securities (2) | 13,565 | | 58,431 | | 71,996 | | 1,876,589 | | 1,948,585 | |
| Funds sold and other | — | | 78,139 | | 78,139 | | — | | 78,139 | |
| Total earning assets | $ | 193,693 | | $ | 384,351 | | $ | 578,044 | | $ | 5,227,282 | | $ | 5,805,326 | |
| Liabilities | | | | | | | | | |
| Interest-bearing liabilities: | | | | | | | | | |
| Interest-bearing deposits: | | | | | | | | | |
| NOW accounts (1) | $ | — | | $ | 1,769,699 | | $ | 1,769,699 | | $ | — | | $ | 1,769,699 | |
| Money market accounts | 825,813 | | — | | 825,813 | | — | | 825,813 | |
| Savings deposits (1) | — | | 542,296 | | 542,296 | | — | | 542,296 | |
| Time deposits | 118,108 | | 440,087 | | 558,195 | | 168,200 | | 726,395 | |
| Total interest-bearing deposits | 943,921 | | 2,752,082 | | 3,696,003 | | 168,200 | | $ | 3,864,203 | |
| Borrowed funds (3) | 130,100 | | — | | 130,100 | | — | | 130,100 | |
| Total interest-bearing liabilities | 1,074,021 | | 2,752,082 | | 3,826,103 | | 168,200 | | 3,994,303 | |
| Interest-sensitivity gap per period | $ | (880,328) | | $ | (2,367,731) | | $ | (3,248,059) | | $ | 5,059,082 | | $ | 1,811,023 | |
| Cumulative gap at December 31, 2022 | $ | (880,328) | | $ | (3,248,059) | | | $ | (3,248,059) | | $ | 1,811,023 | | $ | 1,811,023 | |
| Ratio of cumulative gap to total earning assets at December 31, 2022 | (15.2) | % | | (55.9) | % | | (55.9) | % | | 31.2 | % | | |
| | | | | | | | | | | | | | | | | | | | | | | | | | | | | |
| $ in thousand | December 31, 2021 |
| Within
Three
Months | | After Three
Through
Twelve
Months | | Within
One
Year | | Greater Than
One Year or
Nonsensitive | | Total |
| Assets | | | | | | | | | |
| Earning assets: | | | | | | | | | |
| Loans | $ | 147,728 | | $ | 256,450 | | $ | 404,178 | | $ | 2,563,053 | | $ | 2,967,231 | |
| Securities (2) | 8,959 | | 51,457 | | 60,416 | | 1,713,642 | | 1,774,058 | |
| Funds sold and other | — | | 804,481 | | 804,481 | | — | | 804,481 | |
| Total earning assets | $ | 156,687 | | $ | 1,112,388 | | $ | 1,269,075 | | $ | 4,276,695 | | $ | 5,545,770 | |
| Liabilities | | | | | | | | | |
| Interest-bearing liabilities: | | | | | | | | | |
| Interest-bearing deposits: | | | | | | | | | |
| NOW accounts (1) | $ | — | | $ | 1,771,510 | | $ | 1,771,510 | | $ | — | | $ | 1,771,510 | |
| Money market accounts | 817,476 | | — | | 817,476 | | — | | 817,476 | |
| Savings deposits (1) | — | | 502,808 | | 502,808 | | — | | 502,808 | |
| Time deposits | 132,025 | | 312,958 | | 444,983 | | 139,626 | | 584,609 | |
| Total interest-bearing deposits | 949,501 | | 2,587,276 | | 3,536,777 | | 139,626 | | 3,676,403 | |
| Total interest-bearing liabilities | 949,501 | | 2,587,276 | | 3,536,777 | | 139,626 | | 3,676,403 | |
| Interest-sensitivity gap per period | $ | (792,814) | | $ | (1,474,888) | | $ | (2,267,702) | | $ | 4,137,069 | | $ | 1,869,367 | |
| Cumulative gap at December 31, 2021 | $ | (792,814) | | $ | (2,267,702) | | $ | (2,267,702) | | $ | 1,869,367 | | $ | 1,869,367 | |
| Ratio of cumulative gap to total earning assets at December 31, 2021 | (14.3) | % | | (40.9) | % | | (40.9) | % | | 33.7 | % | | |
(1) | NOW and savings accounts are subject to immediate withdrawal and repricing. These deposits do not tend to immediately react to changes in interest rates and the Company believes these deposits are fairly stable. Therefore, these deposits are included in the repricing period that management believes most closely matches the periods in which they are likely to reprice rather than the period in which the funds can be withdrawn contractually. |
(2) | Securities include mortgage backed and other installment paying obligations based upon stated maturity dates. |
(3) | Does not include subordinated debentures of $144,726, $144,592, $80,678 for the years ended December 31, 2021, 2020, and 2019, respectively. |
(1)NOW and savings accounts are subject to immediate withdrawal and repricing. These deposits do not tend to immediately react to changes in interest rates and the Company believes these deposits are fairly stable. Therefore, these deposits are included in the repricing period that management believes most closely matches the periods in which they are likely to reprice rather than the period in which the funds can be withdrawn contractually.
(2)Securities include mortgage backed and other installment paying obligations based upon stated maturity dates.
(3)Does not include subordinated debentures of $123,386, $145,027, $144,592 for the years ended December 31, 2023, 2022, and 2021, respectively.
The Company generally would benefit from increasing market rates of interest when it has an asset-sensitive gap and generally from decreasing market rates of interest when it is liability sensitive. The Company currently is asset sensitive within the one-year time frame based on effective GAP which uses behavioral assumptions that model the rate sensitivity of non-maturity deposits by looking at the deposits’ behavior rather than their contractual ability to re-price.reprice. The cash flows used in the analysis are the projected dollars of assets and liabilities that “reprice” (including maturities, repricing, likely calls, prepayments, etc.). However, the Company's gap analysis is not a precise indicator of its interest sensitivity position. The analysis presents only a static view of the timing of maturities and repricing opportunities, without taking into consideration that changes in interest rates do not affect all assets and liabilities equally. For example, rates paid on a substantial portion of core deposits may change contractually within a relatively short time frame, but those rates are viewed by management as significantly less interest-sensitive than market-based rates such as those paid on non-core deposits. Accordingly, management believes a liabilityan asset sensitive-position within one year would not be as indicative of the Company’s true interest sensitivity as it would be for an organization which depends to a greater extent on purchased funds to support earning assets. Net interest income is also affected by other significant factors, including changes in the volume and mix of earning assets and interest-bearing liabilities.
The following tables depict, for the periods indicated, certain information related to interest rate sensitivity in net interest income and market value of equity:
| | | | | | | | | | | | | | | | | | | | | | | | | | |
| December 31, 2023 | | | | | | | | |
| | Net Interest Income at Risk | | Market Value of Equity |
Change in Interest
Rates | | % Change
from Base | | Bank
Policy Limit | | % Change
from Base | | Bank
Policy Limit |
| Up 400 bps | | (19.0) | % | | (20.0) | % | | (12.4) | % | | (40.0) | % |
| Up 300 bps | | (9.1) | % | | (15.0) | % | | (6.7) | % | | (30.0) | % |
| Up 200 bps | | (2.3) | % | | (10.0) | % | | (2.0) | % | | (20.0) | % |
| Up 100 bps | | 0.7 | % | | (5.0) | % | | 0.6 | % | | (10.0) | % |
| Down 100 bps | | 0.5 | % | | (5.0) | % | | (2.4) | % | | (10.0) | % |
| Down 200 bps | | 2.3 | % | | (10.0) | % | | (5.0) | % | | (20.0) | % |
| | | | | | | | | | | | | | | | | | | | | | | | | | |
| December 31, 2022 | | | | | | | | |
| | Net Interest Income at Risk | | Market Value of Equity |
Change in Interest
Rates | | % Change
from Base | | Bank
Policy Limit | | % Change
from Base | | Bank
Policy Limit |
| Up 400 bps | | (11.3) | % | | (20.0) | % | | (16.6) | % | | (40.0) | % |
| Up 300 bps | | (6.4) | % | | (15.0) | % | | (10.6) | % | | (30.0) | % |
| Up 200 bps | | (2.9) | % | | (10.0) | % | | (5.8) | % | | (20.0) | % |
| Up 100 bps | | (0.9) | % | | (5.0) | % | | (2.2) | % | | (10.0) | % |
| Down 100 bps | | 1.1 | % | | (5.0) | % | | 0.9 | % | | (10.0) | % |
| Down 200 bps | | (0.7) | % | | (10.0) | % | | (2.2) | % | | (20.0) | % |
| | | | | | | | | |
| | Net Interest Income at Risk | | Market Value of Equity | |
Change in Interest | | % Change | | Bank | | % Change | | Bank | |
Rates | | from Base | | Policy Limit | | from Base | | Policy Limit | |
Up 400 bps | | 11.3 | % | (20.0) | % | 20.0 | % | (40.0) | % |
Up 300 bps | | 10.2 | % | (15.0) | % | 18.9 | % | (30.0) | % |
Up 200 bps | | 8.1 | % | (10.0) | % | 15.5 | % | (20.0) | % |
Up 100 bps | | 4.7 | % | (5.0) | % | 9.4 | % | (10.0) | % |
Down 100 bps | | (3.3) | % | (5.0) | % | (15.0) | % | (10.0) | % |
Down 200 bps | | (4.6) | % | (10.0) | % | (34.2) | % | (20.0) | % |
December 31, 2020
| | | | | | | | | |
| | Net Interest Income at Risk | | Market Value of Equity | |
Change in Interest | | % Change | | | | % Change | | | |
Rates | | from Base | | Policy Limit | | from Base | | Policy Limit | |
Up 400 bps | | 14.7 | % | (20.0) | % | 36.5 | % | (40.0) | % |
Up 300 bps | | 12.4 | % | (15.0) | % | 31.9 | % | (30.0) | % |
Up 200 bps | | 9.2 | % | (10.0) | % | 24.6 | % | (20.0) | % |
Up 100 bps | | 5.1 | % | (5.0) | % | 14.1 | % | (10.0) | % |
Down 100 bps | | (2.1) | % | (5.0) | % | (19.7) | % | (10.0) | % |
Down 200 bps | | (3.0) | % | (10.0) | % | (31.2) | % | (20.0) | % |
December 31, 2019
| | | | | | | | | |
| | Net Interest Income at Risk | | Market Value of Equity | |
Change in Interest | | % Change | | | | % Change | | | |
Rates | | from Base | | Policy Limit | | from Base | | Policy Limit | |
Up 400 bps | | 0.7 | % | (20.0) | % | 21.3 | % | (40.0) | % |
Up 300 bps | | 2.1 | % | (15.0) | % | 19.9 | % | (30.0) | % |
Up 200 bps | | 2.3 | % | (10.0) | % | 16.3 | % | (20.0) | % |
Up 100 bps | | 1.6 | % | (5.0) | % | 9.8 | % | (10.0) | % |
Down 100 bps | | (3.0) | % | (5.0) | % | (6.4) | % | (10.0) | % |
Down 200 bps | | (5.1) | % | (10.0) | % | 0.1 | % | (20.0) | % |
| | | | | | | | | | | | | | | | | | | | | | | | | | |
| December 31, 2021 | | | | | | | | |
| | Net Interest Income at Risk | | Market Value of Equity |
Change in Interest
Rates | | % Change
from Base | | Bank
Policy Limit | | % Change
from Base | | Bank
Policy Limit |
| Up 400 bps | | 11.3% | | (20.0) | % | | 20.0% | | (40.0) | % |
| Up 300 bps | | 10.2% | | (15.0) | % | | 18.9% | | (30.0) | % |
| Up 200 bps | | 8.1% | | (10.0) | % | | 15.5% | | (20.0) | % |
| Up 100 bps | | 4.7% | | (5.0) | % | | 9.4% | | (10.0) | % |
| Down 100 bps | | (3.3) | % | | (5.0) | % | | (15.0) | % | | (10.0) | % |
| Down 200 bps | | (4.6) | % | | (10.0) | % | | (34.2) | % | | (20.0) | % |
Allowance and Provision for Credit Losses
On January 1, 2021, the Company adopted the ASC 326. The FASB issued ASC 326 to replace the incurred loss model for loans and other financial assets with an expected loss model and requires consideration of a wider range of reasonable and supportable information to determine credit losses. In accordance with ASC 326, the Company has developed an ACL methodology effective January 1, 2021, which replaces its previous allowance for loan losses methodology.
The ACL is a valuation account that is deducted from loans’ amortized cost basis to present the net amount expected to be collected on the loans. It is comprised of a general allowance for loans that are collectively assessed in pools with similar risk characteristics and a specific allowance for individually assessed loans. Loans are charged-off against the allowance when management believes the uncollectibility of a loan balance is confirmed. Expected recoveries do not exceed the aggregate of amounts previously charged-off and expected to be charged-off. The allowance is continuously monitored by management to maintain a level adequate to absorb expected credit losses in the loan portfolio.
Management estimates the allowance balance using relevant available information, from internal and external sources, relating to past events, current conditions, and reasonable and supportable forecasts. Historical credit loss experience provides the basis for the estimation of expected credit losses. Adjustments to historical loss information are made for differences in current risk characteristics such as differences in underwriting standards, portfolio mix, delinquency level, or term as well as for changes in environment conditions, such as changes in unemployment rates, property values, or other relevant factors. Management may selectively apply external market data to subjectively adjust the Company’s own loss history including index or peer data. Management evaluates the adequacy of the ACL quarterly and makes provisions for credit losses based on this evaluation. See Note B – Summary of Significant Accounting Policies in the accompanying notes to the consolidated financial statements included elsewhere in this report for a complete description of the Company’s methodology and the quantitative and qualitative factors included in the calculation.
Upon the adoption of ASC 326, the Company recorded a $397 thousand increase to the ACL.
At December 31,
2021,2023, the ACL was
$30.7$54.0 million, or
1.0%1.1% of LHFI,
a decreasean increase of
$5.1$15.1 million, or
14.2%38.8% when compared to December 31,
2020.2022. The
decrease2023 increase is
relatedattributable to
charge-offs takenloan growth and the acquisition of HSBI in January 2023. The Bank acquired loans totaling $1.159 billion, net of purchase accounting adjustments, and recorded initial ACL on
severalPCD loans
during 2021 and was offset by a slight increaseof $3.2 million related to the
ASC 326 transition entry.HSBI acquisition. In addition, the 2023 provision for credit losses includes $10.7 million associated with day one post-merger accounting provision recorded for non-PCD loans and unfunded commitments acquired in the HSBI acquisition. At December 31,
2020,2022, the allowance for
loancredit losses was approximately
$35.8$38.9 million, which was
1.2%1.0% of LHFI. The Company maintains the allowance at a level that management believes is adequate to absorb
probable incurredexpected credit losses
inherent in the loan portfolio.
The 2022 provision for credit losses includes $3.9 million associated with a day one post-merger accounting provision recorded for non-PCD loans, unfunded commitments. A $1.3 million initial allowance was recorded on PCD loans acquired in the BBI merger. Specifically, identifiable and quantifiable losses are immediately charged-off against the allowance; recoveries are generally recorded only when sufficient cash payments are received subsequent to the charge-off.
The provision for credit losses is a charge to earnings to maintain the allowance for credit losses at a level consistent with management’s assessment of the collectability of the loan portfolio in light of current economic conditions and market trends. The Company’s provision for credit losses was a
negative $1.1$13.8 million for the year ended December 31,
20212023 and
the provision for loan losses was $25.2$5.4 million for the year ended December 31,
2020,2022, and
$3.7a negative $1.5 million for the year ended December 31,
2019.2021. A majority of the 2023 and 2022 increase in the Company's provision for credit losses is attributed to the HSBI and BBI acquisitions detailed herein. The
negative provision for 2021 is attributed to the improved macroeconomic outlook
for 2021 and the Company’s ACL calculation under ASC
326 resulted in a negative provision for 2021. The $21.4 million increase in 2020 was related to our estimates of probable incurred losses associated with COVID-19 pandemic.326.
At December 31, 2021,2023, management believes the allowance is appropriate and has been derived from consistent application of our methodology. Should any of the factors considered by management in evaluating the appropriateness of the allowance for credit losses change, management’s estimate of inherentexpected credit losses in the portfolio could also change, which would affect the level of future provisions for loancredit losses. During the first quarter
Allowance for Credit Losses on Off Balance Sheet Credit Exposures
On January 1, 2021, the Company adopted ASC 326.
The Company estimates expected credit losses over the contractual period in which the Company is exposed to credit risk via a contractual obligation to extend credit, unless that obligation is unconditionally cancellable by the Company. The ACL on off-balance sheet credit (“OBSC”) exposures is adjusted as a provision for credit loss expense. The estimate includes consideration of the likelihood that funding will occur and an estimate of expected credit losses on commitments expected to be funded over its estimated life. Upon adoption of ASC 326, theThe Company recorded anmaintains a separate ACL on OBSC exposures, including unfunded commitments and letters of $718 thousand. Forcredit, which is included on the year ended December 31, 2021, the Company recorded a $352 thousandaccompanying consolidated balance sheet. The Company's provision for credit losses on OBSC exposures.exposures was $750 thousand for the year end December 31, 2023, $255 thousand for the year ended December 31, 2022, and $352 thousand for the year ended December 31, 2021. The increase in the ACL on OBSC exposures for the year ended December 31, 2023 compared to the same period in 2022 was due to the day one provision for unfunded commitments related to the HSBI acquisition and an increase in unfunded commitments.
A loan is placed on
non-accrualnonaccrual and the accrual of interest discontinued, when based on all available information and events, it displays characteristics causing management to determine that the collection of all principal, interest, and other related fees due according to the contractual terms of the loan agreement is not probable. Also identified along with these loans in nonaccrual status,
are loans determined by management to be labelled as “troubled debt restructure” based on regulatory guidance, as well as loans 90 days or greater past due and still accruing interest.
Once these loans are identified, they are evaluated to determine whether the ultimate repayment source will be liquidation of collateral or some future source of cash flow. If the only source of repayment will come from the liquidation of collateral, they are analyzed and documented as to whether any impairment exists. This method considers collateral exposure, as well as all expected expenses related to the disposal of the collateral. If there is any impairment, specific allowances for these loans are then accounted for on a per loan basis. Loans that are identified as criticized or classified based on unsatisfactory repayment performance, or other evidence of deteriorating credit quality, are not reviewed until they meet one of the three criteria described above.
Total nonaccrual loans at December 31,
2021,2023, were
$28.0$10.7 million, a decrease of
$5.8$1.9 million compared to
$33.8$12.6 million at December 31,
2020. A majority of the decrease is related to charge-offs of $4.8 million during 2021.2022. Management believes these relationships were adequately reserved at December 31,
2021. Restructured loans not reported as past due or nonaccrual at December 31, 2021 totaled $5.2 million.2023. See Note E – Loans in the accompanying notes to the consolidated financial statements included elsewhere in this report for a description of
restructuredmodified loans.
A potential problem loan is one in which management has serious doubts about the borrower’s future performance under the terms of the loan contract and does not meet the standard of a non-performing asset as outlined by regulatory guidance. These loans may or may not be current as to principal and interest repayment, but they still possess some asset quality characteristics that give management a reason to believe that repayment in full under the contractual terms of the agreement are possible. The level of potential problem loans is one factor used in the determination of the adequacy of the allowance for credit losses. At December 31, 20212023 and 2020,2022, The First had potential problem loans of $154.8$107.1 million and $161.7$108.1 million, respectively. The decrease
Summary of
LoanCredit Loss Experience
Consolidated Allowance for Credit Losses
| | | | | | | |
| | Years Ended December 31, | |
($in thousands) | | 2021 (1) | | 2020 | |
Average LHFI outstanding | | $ | 3,019,605 | | $ | 3,020,280 | |
Loans outstanding at year end, including LHFS | | $ | 2,967,231 | | $ | 3,145,110 | |
| | | | | | | |
Total nonaccrual loans | | $ | 28,013 | | $ | 33,774 | |
| | | | | | | |
Beginning balance of allowance | | $ | 35,820 | | $ | 13,908 | |
Impact of ASC 326 adoption on non-PCD loans | | | (718) | | | — | |
Impact of ASC 326 adoption on PCD loans | | | 1,115 | | | — | |
Loans charged-off | | | (6,213) | | | (4,479) | |
Total recoveries | | | 2,194 | | | 1,240 | |
Net loans (charged-off) recoveries | | | (4,019) | | | (3,239) | |
Provision for credit losses (2) | | | (1,456) | | | 25,151 | |
Balance at year end | | $ | 30,742 | | $ | 35,820 | |
| | | | | | | |
Net charge-offs to average loans | | | 0.13 | % | | 0.11 | % |
Allowance as percent of total loans | | | 1.04 | % | | 1.14 | % |
Nonaccrual loans as a percentage of total loans | | | 0.94 | % | | 1.07 | % |
Allowance as a multiple of nonaccrual loans | | | 1.10 | X | | 1.06 | X |
| (1)
| Effective January 1, 2021, The Company adopted ASC 326 using the modified retrospective approach; therefore, prior period balances are presented under legacy GAAP.
|
| (2)
| The negative provision of $1.1 million for credit losses on the consolidated statements of income includes a $1.5 million negative loan loss provision and a $352 thousand provision for OBSC exposures for the year ended December 31, 2021.
|
| | | | | | | | | | | | | | | | | | | | |
| | Years Ended December 31, |
| ($ in thousands) | | 2023 | | 2022 | | 2021 (1) |
| Average LHFI outstanding | | $ | 5,036,021 | | | $ | 3,302,265 | | | $ | 3,019,605 | |
| Loans outstanding at year end, including LHFS | | $ | 5,172,956 | | | $ | 3,778,630 | | | $ | 2,967,231 | |
| | | | | | |
| Total nonaccrual loans | | $ | 10,690 | | | $ | 12,591 | | | $ | 28,013 | |
| | | | | | |
| Beginning balance of allowance | | $ | 38,917 | | | $ | 30,742 | | | $ | 35,820 | |
| Impact of ASC 326 adoption on non-PCD loans | | — | | | — | | | (718) | |
| Impact of ASC 326 adoption on PCD loans | | — | | | — | | | 1,115 | |
| Initial allowance on acquired PCD loans | | 3,176 | | | 1,303 | | | — | |
| Loans charged-off | | (3,092) | | | (1,218) | | | (6,213) | |
| Total recoveries | | 1,281 | | | 2,740 | | | 2,194 | |
| Net loans (charged-off) recoveries | | (1,811) | | | 1,522 | | | (4,019) | |
| Provision for credit losses (2) | | 13,750 | | | 5,350 | | | (1,456) | |
| Balance at year end | | $ | 54,032 | | | $ | 38,917 | | | $ | 30,742 | |
| | | | | | |
| Net charge-offs to average loans | | (0.04)% | | 0.05% | | 0.13% |
| Allowance as percent of total loans | | 1.04% | | 1.03% | | 1.04% |
| Nonaccrual loans as a percentage of total loans | | 0.21% | | 0.33% | | 0.94% |
| Allowance as a multiple of nonaccrual loans | | 5.05X | | 3.10X | | 1.10 X |
42
(1)Effective January 1, 2021, The Company adopted ASC 326 using the modified retrospective approach.
(2)The negative provision of $1.5 million for credit losses on the consolidated statements of income is net of a $370 thousand provision for credit marks in the Cadence Bank Branches loans acquired for the year ended December 31, 2022.
At December 31, 2021,2023, allowance as of percent of total loans decreased 0.10%increased 0.01% to 1.04% when compared to 1.14%1.03% at December 31, 2020.2022. The decreaseincrease is attributed to the $1.5 millionincrease in negative credit lossloan volume related to the HSBI acquisition and a $177.9 million decreaseorganic loan growth in loans outstanding at year end compared the year end 2020.2023. At December 31, 2021,2023, nonaccrual loans as a percentage of total loans decreased 0.13%0.12% to 0.94%0.21% when compared to 1.07%0.33% at December 31, 2020.2022. The decrease is attributed to a $5.8$1.9 million decrease in nonaccrual loans and a decrease in loans outstanding mentioned above.
At December 31, 2021,2022, allowance as of percent of total loans decreased 0.01% to 1.03% when compared to 1.04% at December 31, 2021. The decrease is attributed to the increase in loan volume related to the BBI acquisition and organic loan growth in 2022. At December 31, 2022, nonaccrual loans as a percentage of total loans decreased 0.61% to 0.33% when compared to 0.94% at December 31, 2021. The decrease is attributed to a $15.4 million decrease in nonaccrual loans mentioned above.
The following table represents the components of the ACL
consisted offor the
following ($ in thousands):
| | | |
| | Allowance |
Allocated: | | | |
Collateral dependent loans | | $ | 6 |
Loans collectively evaluated | | | 30,736 |
Total | | $ | 30,742 |
Loanyears 2023, 2022, and 2021.
| | | | | | | | | | | | | | | | | |
| ($ in thousands) | Allowance for Credit Losses |
| Allocated: | 2023 | | 2022 | | 2021 |
| Collateral dependent loans | $ | 408 | | | $ | 5 | | | $ | 6 | |
| Loans collectively evaluated | 53,624 | | | 38,912 | | | 30,736 | |
| Total | $ | 54,032 | | | $ | 38,917 | | | $ | 30,742 | |
Loans collectively evaluated are those loans or pools of loans assigned a grade by internal loan review.
The following table represents the activity of the allowance for
loancredit losses for the years
20212023, 2022, and
2020 ($ in thousands):
| | | | | | |
| | Analysis of the Allowance for Credit Losses |
| | 2021 (1) | | 2020 |
Balance at beginning of period | | $ | 35,820 | | $ | 13,908 |
Impact of ASC 326 adoption on non-PCD loans | | | (718) | | | — |
Impact of ASC 326 adoption on PCD loans | | | 1,115 | | | — |
Loans charged-off: | | | | | | |
Commercial, financial and agriculture | | | (1,662) | | | (1,496) |
Commercial real estate | | | (3,523) | | | (2,256) |
Consumer real estate | | | (473) | | | (280) |
Consumer installment | | | (555) | | | (447) |
Total | | | (6,213) | | | (4,479) |
Recoveries on loans previously charged-off: | | | | | | |
Commercial, financial and agriculture | | | 433 | | | 169 |
Commercial real estate | | | 888 | | | 418 |
Consumer real estate | | | 311 | | | 251 |
Consumer installment | | | 562 | | | 402 |
Total | | | 2,194 | | | 1,240 |
Net (charge-offs) recoveries | | | (4,019) | | | (3,239) |
Provision for credit losses (2) | | | (1,456) | | | 25,151 |
Balance at end of period | | $ | 30,742 | | $ | 35,820 |
| | | | | | | | | | | | | | | | | |
| ($ in thousands) | Analysis of the Allowance for Credit Losses |
| 2023 | | 2022 | | 2021 (1) |
| Balance at beginning of period | $ | 38,917 | | | $ | 30,742 | | | $ | 35,820 | |
| Impact of ASC 326 adoption on non-PCD loans | — | | | — | | | (718) | |
| Impact of ASC 326 adoption on PCD loans | — | | | — | | | 1,115 | |
| Initial allowance on acquired PCD loans | 3,176 | | | 1,303 | | | — | |
| Loans charged-off: | | | | | |
| Commercial, financial and agriculture | (745) | | | (259) | | | (1,662) | |
| Commercial real estate | (250) | | | (72) | | | (3,523) | |
| Consumer real estate | (49) | | | (204) | | | (473) | |
| Consumer installment | (2,048) | | | (683) | | | (555) | |
| Total | (3,092) | | | (1,218) | | | (6,213) | |
| Recoveries on loans previously charged-off: | | | | | |
| Commercial, financial and agriculture | 349 | | | 433 | | | 433 | |
| Commercial real estate | 116 | | | 591 | | | 888 | |
| Consumer real estate | 249 | | | 1,015 | | | 311 | |
| Consumer installment | 567 | | | 701 | | | 562 | |
| Total | 1,281 | | | 2,740 | | | 2,194 | |
| Net (charge-offs) recoveries | (1,811) | | | 1,522 | | | (4,019) | |
| Provision: | | | | | |
| Initial provision for acquired non-PCD loans | 10,719 | | | 3,855 | | | — | |
| Provision for credit losses charged to expense (2) | 3,031 | | | 1,495 | | | (1,456) | |
| Balance at end of period | $ | 54,032 | | | $ | 38,917 | | | $ | 30,742 | |
(1)Effective January 1, 2021, The Company adopted ASC 326 using the modified retrospective approach; therefore, prior period balances are presented under legacy GAAP.approach.
(2)The negative provision of $1.1$1.5 million for credit losses on the consolidated statements of income includesis net of a $1.5 million negative loan loss provision and a $352$370 thousand provision for OBSC exposurescredit marks in the Cadence Bank Branches loans acquired for the year ended December 31, 2021.
2022.
The following tables represents how the ACL is allocated to a particular loan type as well as the percentage of the category to total gross loans at December 31,
20212023 and
2020 ($ in thousands):2022.
Allocation of the Allowance for Credit Losses
| | | | | | | | | | | |
| | December 31, 2021 (1) | | December 31, 2020 | |
| | | | | | | | | | | |
| | | | | % of loans in | | | | | % of loans in | |
| | | | | each category to | | | | | each category to | |
| | Amount | | total gross loans | | Amount | | total gross loans | |
Commercial, financial and agriculture | | $ | 4,873 | | 13.4 | % | $ | 6,214 | | 18.6 | % |
Commercial real estate | | | 17,552 | | 57.0 | % | | 24,319 | | 52.9 | % |
Consumer real estate | | | 7,889 | | 28.3 | % | | 4,736 | | 27.2 | % |
Consumer installment | | | 428 | | 1.3 | % | | 551 | | 1.3 | % |
Total loans | | $ | 30,742 | | 100 | % | $ | 35,820 | | 100 | % |
| | | | | | | | | | | | | | | | | | | | | | | | | | | | | | | | | | | |
| ($ in thousands) | December 31, 2023 | | December 31, 2022 | | December 31, 2021 |
| Amount | | % of loans in
each category to
total gross loans | | Amount | | % of loans in
each category to
total gross loans | | Amount | | % of loans in
each category to
total gross loans |
| Commercial, financial and agriculture | $ | 8,844 | | | 15.5 | % | | $ | 6,349 | | | 14.2 | % | | $ | 4,873 | | | 13.4 | % |
| Commercial real estate | 29,125 | | | 59.2 | % | | 20,389 | | | 56.5 | % | | 17,552 | | | 57.0 | % |
| Consumer real estate | 15,260 | | | 24.2 | % | | 11,599 | | | 28.1 | % | | 7,889 | | | 28.3 | % |
| Consumer installment | 803 | | | 1.1 | % | | 580 | | | 1.2 | % | | 428 | | | 1.3 | % |
| Total loans | $ | 54,032 | | | 100 | % | | $ | 38,917 | | | 100 | % | | $ | 30,742 | | | 100 | % |
(1) Effective January 1, 2021, The Company adopted ASC 326 using the modified retrospective approach; therefore, prior period balances are presented under legacy GAAP.
Non-interest Income
The Company's primary sources of non-interest income are mortgage banking operations and service charges on deposit accounts. Other sources of non-interest income include bankcard fees, commissions on check sales, safe deposit box rent, wire transfer fees, official check fees and bank owned life insurance income.
Non-interest income was
$37.5$46.7 million at December 31,
2021, a decrease2023, an increase of
$4.4$9.7 million or
10.5%26.4% compared to December 31,
2020. The decrease includes2022. This increase was partially attributable to $11.7 million in service charges on deposit accounts and interchange fee income, a
$7.6$5.3 million
decrease inincrease associated with the
bargain purchase gain andU.S. Treasury awards, offset by a $9.8 million loss on the sale of
land,available-for-sale securities. Non-interest income was $37.0 million at December 31, 2022, a decrease of $512 thousand or 1.4% compared to December 31, 2021. Increased service charges on deposit accounts and interchange fee income of $2.5 million was offset by a decrease in mortgage income of
$1.6 million, an increase of $1.1 million in other income and an increase in interchange fees of $2.1$4.5 million.
Non-interest income was $41.9 million at December 31, 2020, an increase of $14.9 million or 55.4% compared to December 31, 2019. The increase includes an $8.3 million, net of tax, bargain purchase gain and sale of land, an increase in mortgage income of $4.5 million and an increase in interchange fee income of $1.4 million.
Non-interest expense was $114.6$184.7 million for the year ended December 31, 2021,2023, an increase of $8.2$54.2 million, or 7.7%41.6% in year-over-year comparison. AnThe increase of $4.6was partially attributable to $2.7 million in salariesacquisition and employee benefitscharter conversion charges and an increase$32.1 million in increased operating expenses related to the acquisitions of Beach Bank and Heritage Bank as well as $5.2 million in expenses associated with the U.S. Treasury awards and increases in FDIC premiums of $1.7 million and a $4.9 million increase in occupancy expense contributed tocore deposit amortization for the increase.year ended December 31, 2023. Non-interest expense was $106.3$130.5 million for the year ended December 31, 2020,2022, an increase of $17.8$15.9 million compared to December 31, 2019,2021. An increase of which $12.3$4.8 million isin acquisition and charter conversion charges and $3.3 million related to the ongoing operations of FFBthe Cadence Bank branches and SWG. The remaining
$5.1 million related to the Beach Bank branch operations accounted for the increase in non-interest expense.
increase of $5.5 million in expenses are related to increases in salaries and employee benefits of $6.3 million and increases in occupancy of $386 thousand. Other expenses decreased $1.2 million in the year-over-year comparison.
The following table sets forth the primary components of non-interest expense for the periods
indicated ($ in thousands):indicated.
Non-interest Expense
| | | | | | | | | |
| | Years ended December 31, |
| | 2021 | | 2020 | | 2019 |
Salaries and employee benefits | | $ | 65,856 | | $ | 61,230 | | $ | 47,016 |
Occupancy | | | 12,713 | | | 11,282 | | | 8,775 |
Furniture and equipment | | | 2,848 | | | 2,551 | | | 2,021 |
Supplies and printing | | | 903 | | | 925 | | | 798 |
Professional and consulting fees | | | 4,035 | | | 3,897 | | | 3,558 |
Marketing and public relations | | | 615 | | | 512 | | | 859 |
FDIC and OCC assessments | | | 2,074 | | | 1,351 | | | 632 |
ATM expense | | | 3,623 | | | 3,042 | | | 2,794 |
Bank communications | | | 1,754 | | | 2,028 | | | 1,779 |
Data processing | | | 1,578 | | | 1,137 | | | 898 |
Acquisition expense/charter conversion | | | 1,607 | | | 3,315 | | | 6,275 |
Other | | | 16,953 | | | 15,071 | | | 13,164 |
Total | | $ | 114,559 | | $ | 106,341 | | $ | 88,569 |
Amounts previously reported have been adjusted to reflect the breakout of acquisition expenses. Total non-interest expense did not change.
| | | | | | | | | | | | | | | | | |
| ($ in thousands) | Years ended December 31, |
| 2023 | | 2022 | | 2021 |
| Salaries and employee benefits | $ | 93,412 | | | $ | 73,077 | | | $ | 65,856 | |
| Occupancy | 17,381 | | | 12,854 | | | 12,713 | |
| Furniture and equipment | 3,987 | | | 2,981 | | | 2,848 | |
| Supplies and printing | 1,240 | | | 967 | | | 903 | |
| Professional and consulting fees | 6,446 | | | 3,558 | | | 4,035 | |
| Marketing and public relations | 833 | | | 393 | | | 615 | |
| FDIC and OCC assessments | 3,849 | | | 2,122 | | | 2,074 | |
| ATM expense | 5,821 | | | 3,873 | | | 3,623 | |
| Bank communications | 3,579 | | | 1,904 | | | 1,754 | |
| Data processing | 2,771 | | | 2,211 | | | 1,578 | |
| Acquisition expense/charter conversion | 9,075 | | | 6,410 | | | 1,607 | |
| Other | 36,332 | | | 20,133 | | | 16,953 | |
| Total | $ | 184,726 | | | $ | 130,483 | | | $ | 114,559 | |
Income tax expense consists of two components. The first is the current tax expense which represents the expected income tax to be paid to taxing authorities. The Company also recognizes deferred tax for future income/deductible amounts resulting from differences in the financial statement and tax bases of assets and liabilities. Income tax expense was
$21.3 million for the year ended December 31, 2023, $15.8 million for the year ended December 31, 2022 and $16.9 million for the year ended December 31,
2021, $10.6 million for the year ended December 31, 2020 and $12.7 million for the year ended December 31, 2019.2021. The Company’s effective income tax rate was
20.9%22.1%,
16.8%20.0% and
22.5%20.9% for the years ended December 31,
2021, 20202023, 2022 and
2019,2021, respectively. The effective tax rate differs each year primarily due to our investments in bank-qualified municipal securities,
bank-owedbank-owned life insurance, and certain merger related expenses.
The increase in the Company’s effective rate for 2021 compared 2020 was primarily due to the $6.9 million, non-taxable, decrease in the bargain purchase gain. The reduction in the Company’s effective rate for 2020 compared to 2019 was primarily due to the $7.8 million, non-taxable, bargain purchase gain related to the SWG acquisition and the CARES Act that was signed into law on March 27, 2020. The CARES Act includes several significant provisions for corporations including increasing the amount of deductible interest under section 163(j), allowing companies to carryback certain net operating losses, and increasing the amount of net operating loss that corporations can use to offset income. Income taxes are discussed more fully under Note K – Income Tax
ofin the accompanying notes to the consolidated financial statements included elsewhere in this report.
Analysis of Financial Condition
Loans. Loans typically provide higher yields than the other types of earning assets, and thus one of the Company's goals is for loans to be the largest category of the Company's earning assets. At December 31, 2021, 2020,2023, 2022, and 2019,2021, respectively, average loans accounted for 60.8%71.4%, 71.0%58.0% and 76.5%60.8% of average earning assets. Management attempts to control and counterbalance the inherent credit and liquidity risks associated with the higher loan yields without sacrificing asset quality to achieve its asset mix goals. Loans,
excluding mortgage loans held for sale, averaged $5.036 billion during 2023 and $3.302 billion during 2022, as compared to $3.020 billion during 2021 and $3.020 billion during 2020, as compared to $2.341 billion during 2019.
2021.
In the context of this discussion, a "real estate mortgage loan" is defined as any loan, other than loans for construction purposes, secured by real estate, regardless of the purpose of the loan. The Company follows the common practice of financial institutions in the Company’s market area of obtaining a security interest in real estate whenever possible, in addition to any other available collateral. This collateral is taken to reinforce the likelihood of the ultimate repayment of the loan and tends to increase the magnitude of the real estate loan portfolio component. Generally, the Company limits its loan-to-value ratio to 80%. Management attempts to maintain a conservative philosophy regarding its underwriting guidelines and believes it will reduce the risk elements of its loan portfolio through strategies that diversify the lending mix.
Loans held for sale consist of mortgage loans originated by the Bank and sold into the secondary market. Commitments from investors to purchase the loans are obtained upon origination.
The following table sets forth the Company’s
commercial and construction real estate loansloan portfolio maturing within specified intervals at December 31,
2021 ($ in thousands):2023.
Loan Maturity Schedule and Sensitivity to Changes in Interest Rates
| | | | | | | | | | | | | | | |
| | | | | After One, | | After Five but | | After | | | |
| | Due in One | | but Within | | Within | | Fifteen | | | |
| | Year or Less | | Five Years | | Fifteen Years | | Years | | Total |
Commercial, financial and agricultural | | $ | 71,956 | | $ | 214,425 | | $ | 98,085 | | $ | 13,050 | | $ | 397,516 |
Commercial real estate | | | 201,862 | | | 691,530 | | | 740,376 | | | 49,928 | | | 1,683,696 |
Consumer real estate | | | 116,171 | | | 216,431 | | | 158,409 | | | 347,644 | | | 838,655 |
Consumer installment | | | 6,511 | | | 29,960 | | | 3,215 | | | — | | | 39,686 |
Total | | $ | 396,500 | | $ | 1,152,346 | | $ | 1,000,085 | | $ | 410,622 | | $ | 2,959,553 |
| | | | | | | | | | | | | | | |
Loans with fixed interest rates: | | | | | | | | | | | | | | | |
Commercial, financial and agricultural | | $ | 33,758 | | $ | 185,175 | | $ | 86,898 | | $ | 10,074 | | $ | 315,905 |
Commercial real estate | | | 166,961 | | | 608,138 | | | 531,056 | | | 2,943 | | | 1,309,098 |
Consumer real estate | | | 82,769 | | | 136,788 | | | 98,521 | | | 70,407 | | | 388,485 |
Consumer installment | | | 5,534 | | | 28,157 | | | 3,049 | | | — | | | 36,740 |
Total | | $ | 289,022 | | $ | 958,258 | | $ | 719,524 | | $ | 83,424 | | $ | 2,050,228 |
| | | | | | | | | | | | | | | |
Loans with floating interest rates: | | | | | | | | | | | | | | | |
Commercial, financial and agricultural | | $ | 38,198 | | $ | 29,250 | | $ | 11,187 | | $ | 2,976 | | $ | 81,611 |
Commercial real estate | | | 34,901 | | | 83,392 | | | 209,320 | | | 46,985 | | | 374,598 |
Consumer real estate | | | 33,402 | | | 79,643 | | | 59,888 | | | 277,237 | | | 450,170 |
Consumer installment | | | 977 | | | 1,803 | | | 166 | | | — | | | 2,946 |
Total | | $ | 107,478 | | $ | 194,088 | | $ | 280,561 | | $ | 327,198 | | $ | 909,325 |
| | | | | | | | | | | | | | | | | | | | | | | | | | | | | | | | |
| ($ in thousands) | | Due in One
Year or Less | | After One,
but Within
Five Years | | After Five but
Within
Fifteen Years | | After
Fifteen
Years | | Total |
| Commercial, financial and agricultural | | $ | 209,690 | | | $ | 392,382 | | | $ | 191,341 | | | $ | 6,911 | | | $ | 800,324 | |
| Commercial real estate | | 314,080 | | | 1,414,550 | | | 1,168,566 | | | 161,959 | | | 3,059,155 | |
| Consumer real estate | | 129,208 | | | 365,095 | | | 187,040 | | | 571,452 | | | 1,252,795 | |
| Consumer installment | | 13,285 | | | 39,110 | | | 5,125 | | | 248 | | | 57,768 | |
| Total | | $ | 666,263 | | | $ | 2,211,137 | | | $ | 1,552,072 | | | $ | 740,570 | | | $ | 5,170,042 | |
| | | | | | | | | | |
| Loans with fixed interest rates: | | | | | | | | | | |
| Commercial, financial and agricultural | | $ | 130,524 | | | $ | 275,836 | | | $ | 126,964 | | | $ | 5,436 | | | $ | 538,760 | |
| Commercial real estate | | 231,270 | | | 1,215,711 | | | 717,414 | | | 19,742 | | | 2,184,137 | |
| Consumer real estate | | 68,229 | | | 267,122 | | | 104,973 | | | 89,254 | | | 529,578 | |
| Consumer installment | | 11,987 | | | 36,252 | | | 4,386 | | | 239 | | | 52,864 | |
| Total | | $ | 442,010 | | | $ | 1,794,921 | | | $ | 953,737 | | | $ | 114,671 | | | $ | 3,305,339 | |
| | | | | | | | | | |
| Loans with floating interest rates: | | | | | | | | | | |
| Commercial, financial and agricultural | | $ | 79,166 | | | $ | 116,546 | | | $ | 64,377 | | | $ | 1,475 | | | $ | 261,564 | |
| Commercial real estate | | 82,810 | | | 198,839 | | | 451,152 | | | 142,217 | | | 875,018 | |
| Consumer real estate | | 60,979 | | | 97,973 | | | 82,067 | | | 482,198 | | | 723,217 | |
| Consumer installment | | 1,298 | | | 2,858 | | | 739 | | | 9 | | | 4,904 | |
| Total | | $ | 224,253 | | | $ | 416,216 | | | $ | 598,335 | | | $ | 625,899 | | | $ | 1,864,703 | |
The information presented in the above table is based on the contractual maturities of the individual loans, including loans which may be subject to renewal at their contractual maturity. Renewal of such loans is subject to review and credit approval, as well as modification of terms upon their maturity.
Investment Securities. The investment securities portfolio is a significant component of the Company’s total earning assets. Total securities averaged $1.919 billion in 2023, as compared to $2.023 billion in 2022, and $1.305 billion in 2021, as compared to $917.9 million in 2020, and $636.0 million in 2019.2021. This represents 26.3%27.2%, 21.6%35.5%, and 20.8%26.3% of the average earning assets for the years ended December 31, 2021, 20202023, 2022 and 2019,2021, respectively. At December 31, 2021,2023, investment securities, including equity securities, were $1.774$1.735 billion and represented 29.6%28.5% of earning assets. The Company attempts to maintain a portfolio of high quality, highly liquid investments with returns competitive with short-term U.S. Treasury or agency obligations. This objective is particularly important as the Company focuses on growing its loan portfolio. The
Company primarily invests in securities of U.S. Treasury, U.S. Government agencies, municipals, and corporate obligations with maturities up to ten years.
The following table details the weighted-average yield for each range of maturities of securities held-to-maturity using the amortized cost at December 31, 2023 (tax equivalent basis):
| | | | | | | | | | | | | | | | | | | | | | | | | | | | | | | | |
| | Within One Year | | After One, But Within Five Years | | Maturing After Five But Within Ten Years | | After Ten Years | | Total |
| Securities held-to-maturity | | | | | | | | | | |
| U.S. Treasury | | 1.48 | % | | 1.67 | % | | — | % | | — | % | | 1.60 | % |
| Obligations of U.S. government agencies and sponsored entities | | — | % | | 3.49 | % | | 3.30 | % | | — | % | | 3.34 | % |
| Tax-exempt and taxable obligations of states and municipal subdivisions | | 1.91 | % | | 2.04 | % | | 3.96 | % | | 4.83 | % | | 4.57 | % |
| Mortgage-backed securities - residential | | — | % | | — | % | | 1.61 | % | | 2.45 | % | | 2.34 | % |
| Mortgage-backed securities - commercial | | — | % | | 2.12 | % | | 3.40 | % | | 3.86 | % | | 3.57 | % |
| Corporate obligations | | — | % | | — | % | | — | % | | 3.13 | % | | 3.13 | % |
| Total held-to-maturity | | 1.62 | % | | 2.00 | % | | 3.71 | % | | 4.57 | % | | 4.18 | % |
Mortgage-backed securities are included in maturity categories based on their stated maturity date. Expected maturities may differ from contractual maturities because issuers may have the right to call or prepay obligations.
Short-Term Investments. Short-term investments, consisting of Federal Funds Sold, funds due from banks and interest-bearing deposits with banks, averaged $97.2 million in 2023, $366.5 million in 2022, and $642.0 million in 2021, $317.8 million in 2020, and $84.2 million in 2019.2021. There were no federal funds sold at December 31, 2021, 2020,2023, 2022, and 2019.2021. These funds are a primary source of the Company's liquidity and are generally invested in an earning capacity on an overnight basis.
Deposits. Average total deposits at December 31, 20212023 were $4.631$6.555 billion, an increase of $713.7 thousand,$1.127 billion, or 18.2%20.8% compared to 2020.2022. Average total deposits at December 31, 20202022 were $3.918$5.428 billion, an increase of $1.118 billion,$796.9 million, or 39.9%17.2% compared to $2.799$4.631 billion in 2019. 2021.
At December 31, 2021,2023, total deposits were $5.227$6.463 billion, compared to $4.215$5.494 billion at December 31, 2020,2022, an increase of $1.012 billion,$968.5 million, or 24.0%17.6%, and $3.077$5.227 billion at December 31, 2019. Deposits2021. During January 2023, deposits totaling $1.392 billion, net of purchase accounting adjustments, were acquired in the Heritage Bank acquisition. During August 2022, deposits totaling $490.6 million were acquired in the BBI acquisition. During December 2021, deposits totaling $410.2 million were acquired in 2021 with the acquisition of the Cadence branches. DepositsBank branches acquisition.
As of $476.1 millionDecember 31, 2023 and 2022, the Company had estimated uninsured deposits of $2.145 billion and $2.076 billion, respectively. These estimates were acquired in 2020 withderived using the acquisitionsame methodologies and assumptions used for the Bank's regulatory reporting.
In the third quarter of
SWG. Deposits of $686.4 million were acquired in 2019 with2022, the
acquisitions of FPB and FFB.The Company implementedceased the Deposit Reclassification program it implemented at the beginning of 2020. ThisThe program reclassifies non-interest-bearing depositsreclassified non-interest bearing and NOW deposit balances to money market accounts. This program reduces our reserve balance required at the Federal Reserve Bank of Atlanta and provides additional funds for liquidity or lending. At December 31, 2021, $794.3 million in non-interest deposit balances and $1.032 billion in NOW deposit accounts were reclassified as money market accounts. A distribution of the Company’s deposits with reclassification showing the year-to-date average balancesbalance of deposits by type and weighted-average rates paid duringis presented for the years presented ($noted periods in thousands):
| | | | | | | | | | | | | | | | |
| | December 31, |
| | 2021 | | 2020 | | 2019 | |
| | | | | Average | | | | | Average | | | | | Average | |
| | Average | | Rate | | Average | | Rate | | Average | | Rate | |
| | Balance | | Paid | | Balance | | Paid | | Balance | | Paid | |
Non-interest-bearing accounts | | $ | 253,324 | | | | $ | 235,909 | | | | $ | 154,122 | | | |
Interest bearing deposits: | | | | | | | | | | | | | | | | |
NOW accounts and other | | | 1,529,293 | | 0.48 | % | | 1,261,264 | | 0.70 | % | | 958,226 | | 0.85 | % |
Money market accounts | | | 1,870,156 | | 0.08 | % | | 1,421,922 | | 0.24 | % | | 864,041 | | 0.37 | % |
Savings accounts | | | 440,977 | | 0.03 | % | | 346,612 | | 0.05 | % | | 268,426 | | 0.06 | % |
Time deposits | | | 537,538 | | 0.57 | % | | 651,887 | | 1.08 | % | | 554,543 | | 1.43 | % |
Total interest-bearing deposits | | | 4,377,964 | | 0.27 | % | | 3,681,685 | | 0.53 | % | | 2,645,236 | | 0.74 | % |
Total deposits | | $ | 4,631,288 | | 0.26 | % | $ | 3,917,594 | | 0.50 | % | $ | 2,799,358 | | 0.70 | % |
Average deposits increased $738.4 million, or 18.7%, inthe following table. Deposits at December 31, 2021 compared to 2020. are shown without reclassification for consistency with the current period presentation.
| | | | | | | | | | | | | | | | | | | | | | | | | | | | | | | | | | | |
| December 31, |
| ($ in thousands) | 2023 | | 2022 | | 2021 |
| Average
Balance | | Average
Rate
Paid | | Average
Balance | | Average
Rate
Paid | | Average
Balance | | Average
Rate
Paid |
| Non-interest-bearing accounts | $ | 2,012,935 | | | | | $ | 1,660,301 | | | | | $ | 1,366,529 | | | |
| Interest bearing deposits: | | | | | | | | | | | |
| NOW accounts and other | 2,017,154 | | | 1.41 | % | | 1,810,575 | | | 0.44 | % | | 1,529,293 | | | 0.48 | % |
| Money market accounts | 1,013,701 | | | 1.79 | % | | 831,463 | | | 0.29 | % | | 756,951 | | | 0.20 | % |
| Savings accounts | 606,421 | | | 0.18 | % | | 535,449 | | | 0.04 | % | | 440,977 | | | 0.03 | % |
| Time deposits | 904,629 | | | 2.61 | % | | 590,385 | | | 0.58 | % | | 537,538 | | | 0.59 | % |
| Total interest-bearing deposits | 4,541,905 | | | 1.57 | % | | 3,767,872 | | | 0.37 | % | | 3,264,759 | | | 0.37 | % |
| Total deposits | $ | 6,554,840 | | | 1.09 | % | | $ | 5,428,173 | | | 0.26 | % | | $ | 4,631,288 | | | 0.26 | % |
The most significant growth during
20212023 compared to
20202022 was in
money market accounts.time deposits. The average cost of interest-bearing deposits and total deposits was
0.27%1.57% and 1.09% during 2023 compared to 0.37% and 0.26%
during 2021in 2022. Average cost of interest bearing deposits increased 120 basis points to 1.57% at December 31, 2023 compared to
0.53% and 0.49%0.37% during the same time period in
2020.2022. Average cost of total deposits increased 83 basis points to 1.09% at December 31, 2023 compared to 0.26% during the same time period in 2022. The
decreaseincrease in the average cost of
interest-bearing deposit during 2021 compared to 2020 was related to lower average interest ratesdeposits paid on
most of our interest-bearing deposit products
asin 2023 compared to 2022, is a result of
lowerhigher average market interest rates.
Average cost of interest-bearing deposits and total deposits remained unchanged at December 31, 2022 compared to 2021.
The Company’s loan-to-deposit ratio, which excludes mortgage loans held for sale, was 80.0% at December 31, 2023, 68.7% at December 31, 2022 and 56.6% at December 31, 2021, 74.1% at December 31, 2020 and 84.5% at December 31, 2019.2021. The loan-to-deposit ratio averaged 65.2%76.8% during 2021.2023. Core deposits, which exclude time deposits of $250,000 or more, in 2021 and time deposits of $100,000 or more in 2020 and 2019, provide a relatively stable funding source for the Company's loan portfolio and other earning assets. The Company's core deposits were $6.084 billion at December 31, 2023, $5.198 billion at December 31, 2022, and $4.504 billion at December 31, 2021, $3.853 billion at December 31, 2020, and $2.650 billion at December 31, 2019. 2021.
Management anticipates that a stable base of deposits will be the Company's primary source of funding to meet both its short-term and long-term liquidity needs in the future. The Company has purchased brokered deposits from time to time to help fund loan growth. Brokered deposits and jumbo certificates of deposit generally carry a higher interest rate than traditional core deposits. Further, brokered deposit customers typically do not have loan or other relationships with the Company. The Company has adopted a policy not to permit brokered deposits to represent more than 10% of all of the Company’s deposits. Transaction account balancesThe Company's brokered deposits were above normal as1.8% of deposits at December 31, 2020, due to PPP loan proceeds.2023.
Maturities of Certificates of Deposit
of $250,000 or More
| | | | | | | | | | | | | | | |
| | | | | | | | After Six | | | | | | |
| | | | | After Three | | Through | | | | | | |
| | Within Three | | Through Six | | Twelve | | After Twelve | | | |
($ in thousands) | | Months | | Months | | Months | | Months | | Total |
December 31, 2021 | | $ | 29,695 | | $ | 34,282 | | $ | 40,104 | | $ | 37,399 | | $ | 141,480 |
| | | | | | | | | | | | | | | | | | | | | | | | | | | | | | | | |
| ($ in thousands) | | Within Three
Months | | After Three
Through Six
Months | | After Six
Through
Twelve
Months | | After Twelve
Months | | Total |
| December 31, 2023 | | $ | 103,032 | | | $ | 122,629 | | | $ | 44,767 | | | $ | 22,443 | | | $ | 292,871 | |
Borrowed funds consist of advances from the Federal Home Loan Bank of Dallas (“FHLB”), loans from First Horizon Bank, loans from the Federal Reserve Bank, federal funds purchased and reverse repurchase agreements. At December 31, 2021,2023, advances from the FHLB totaled $0 compared to $110.0$130.1 million at December 31, 20202022 and $206.3 million$0 at December 31, 2019.2021. The advances are collateralized by a blanket lien on the first mortgage loans in the amount of the outstanding borrowings, FHLB capital stock, and amounts on deposit with the FHLB. There were $0, $0 and $2.7 millionno federal funds purchased at December 31, 2023, 2022, and 2021, 2020,respectively.
On March 12, 2023, the Federal Reserve Board announced the Bank Term Funding Program ("BTFP"), which offers loans to banks with a term up to one year. The loans are secured by pledging the banks' U.S. treasuries, agency securities, agency mortgage-backed securities, and 2019, respectively. As partany other qualifying asset. These pledged securities will be valued at
par for collateral purposes. The BTFP offers up to one year fixed-rate term borrowings that are prepayable without penalty.
In 2023, the
FFB acquisition, the Company assumed two loansBank participated in the
amountBTFP and had outstanding debt of
$3.5$390.0 million and
$2.0pledged securities with a fair value of $362.4 million
with First Horizon Bank. Principalat December 31, 2023. The securities pledged have a par value of $398.1 million. The Bank's BTFP borrowings, which were drawn between March 15, 2023 and
December 28, 2023, bear interest
are payable quarterly at rates ranging from
3.80% - 4.10%. In 2021, the Company repaid the two loans acquired4.69% to 4.83% and are set to mature one year from
the FFB acquisition.their issuance date.
Subordinated Debentures
In
On June 30, 2006, the Company issued
subordinated debentures of $4.1 million
of floating rate junior subordinated deferrable interest debentures to The First Bancshares
Inc. Statutory Trust 2 (“Trust 2”). The
debentures are the sole asset of Trust 2, and the Company is the sole owner of the
common equity
of Trust 2. Trust 2 issued $4.0 million of Trust Preferred Securities to investors. The Company’s obligations under the debentures and related documents, taken together, constitute a full and unconditional guarantee by the Company of the Trust
2.2’s obligations under the preferred securities. The
Trust 2 issued $4,000,000 of preferred securities
to investors.are redeemable by the Company at its option. The
Company makes interest payments and will make principal payments onpreferred securities must be redeemed upon maturity of the debentures
to the Trust 2. These payments will be the source of funds used to retirein 2036. Interest on the preferred securities
whichis the three-month term Secured Overnight Financing Rate ("SOFR") plus 1.65% plus a tenor spread adjustment of 0.026161% and is payable quarterly. The terms of the subordinated debentures are
redeemable at any time beginning in 2011 and thereafter, and mature in 2036. The Company entered into this arrangementidentical to
provide funding for expected growth.Inthose of the preferred securities.
On July 27, 2007, the Company issued
subordinated debentures of $6.2 million
of floating rate junior subordinated deferrable interest debentures to The First Bancshares
Inc. Statutory Trust 3 (“Trust 3”). The Company
isowns all of the common equity of Trust 3, and the debentures are the sole
ownerasset of
Trust 3. Trust 3 issued $6.0 million of Trust Preferred Securities to investors. The Company’s obligations under the
equitydebentures and related documents, taken together, constitute a full and unconditional guarantee by the Company of the Trust
3.3’s obligations under the preferred securities. The
Trust 3 issued $6,000,000 of preferred securities
to investors.are redeemable by the Company at its option. The
Company makes interest payments and will make principal payments onpreferred securities must be redeemed upon maturity of the debentures
to the Trust 3. These payments will be the source of funds used to retirein 2037. Interest on the preferred securities
whichis the three-month term SOFR plus 1.40% plus a tenor spread adjustment of 0.026161% and is payable quarterly. The terms of the subordinated debentures are
redeemable at any time beginning in 2012 and thereafter, and mature in 2037. The Company entered into this arrangementidentical to
provide funding for expected growth.those of the preferred securities.
In 2018, as a result of the acquisition of FMB Banking Corporation ("FMB"), the Company acquired FMB’s Capital Trust 1 (“Trust 1”), which consistedbecame the successor to FMB's obligations in respect of $6.1$6.2 million of floating rate junior subordinated deferrable interest debentures in whichissued to FMB Capital Trust 1 ("FMB Trust"). The debentures are the Company owns allsole asset of FMB Trust, and the common equity. The Company is the sole owner of the common equity of FMB Trust. FMB Trust 1.issued $6.0 million of Trust Preferred Securities to investors. The Company’s obligations under the debentures and related documents, taken together, constitute a full and unconditional guarantee by the Company of FMB Trust's obligations under the preferred securities. The preferred securities issued by the FMB Trust are redeemable by the Company at its option. The preferred securities must be redeemed upon maturity of the debentures in 2033. Interest on the preferred securities is the three-month term SOFR plus 2.85% plus a tenor spread adjustment of 0.026161% and is payable quarterly.
On January 1, 2023, as a result of the acquisition of HSBI, the Company became the successor to HSBI's obligations in respect of $10.3 million of subordinated debentures issued $6,000,000to Liberty Shares Statutory Trust II ("Liberty Trust"). The debentures are the sole asset of Liberty Trust, and the Company is the sole owner of the common equity of Liberty Trust. Liberty Trust issued $10.0 million of preferred securities to investors.an investor. The Company makes interest payments and will make principal payments onCompany's obligations under the debentures toand related documents, taken together, constitute a full and unconditional guarantee by the Company of Liberty Trust's obligations under the preferred securities. The preferred securities issued by the Liberty Trust 1. These payments willare redeemable by the Company at its option. The preferred securities must be redeemed upon maturity of the source of funds used to retiredebentures in 2036. Interest on the preferred securities whichis the three-month term SOFR plus 1.48% plus a tenor spread adjustment of 0.026161% and is payable quarterly.
In accordance with the provisions of ASC Topic 810, Consolidation, the Trust 2, Trust 3, FMB Trust, and Liberty Trust are
redeemable at any time beginningnot included in
2008 and thereafter, and mature in 2033.the consolidated financial statements.
On April 30, 2018,
theThe Company entered into two Subordinated Note Purchase Agreements pursuant to which the Company sold and issued $24.0 million in aggregate principal amount of 5.875% fixed-to-floating rate subordinated notes due 2028
(the "Notes due 2028") and $42.0 million in aggregate principal amount of 6.40% fixed-to-floating rate subordinated notes due 2033
(collectively,(the “Notes due 2033”). In May of 2023, the
“Notes”). Deferred issuance costs included inCompany redeemed all $24.0 million of the
outstanding 5.875% fixed-to-floating rate subordinated
debt were $961 thousand and $1.1 million at December 31, 2020 and December 31, 2019.notes due 2028.
The Notes due 2033 are not convertible into or exchangeable for any other securities or assets of the Company or any of its subsidiaries. The Notes due 2033 are not subject to redemption at the option of the holder. Principal and interest on the Notes due 2033 are subject to acceleration only in limited circumstances. The Notes due 2033 are unsecured, subordinated obligations of the Company and rank junior in right to payment to the Company’s current and future senior indebtedness, and each Note is pari passu in right to payment with respect to the other Notes. The Notes due 2033 have a fifteen year term, maturing May 1, 2033, and will bear interest at a fixed annual rate of 6.40%, payable quarterly in arrears, for the first ten years of the term. Thereafter, the interest rate will re-set quarterly to an interest rate per annum equal to a benchmark rate (which is expected to be three-month term SOFR plus 3.39% plus a tenor spread adjustment of 0.026161%), payable quarterly in arrears. As provided in the Notes due 2033, under specified conditions the interest rate on the Notes due 2033 during the applicable floating rate period may be determined based on a rate other than Three-Month Term SOFR. The Company entered into this arrangementis entitled to provide funding for expected growth.redeem the Notes due 2033, in whole or in part, on any interest payment date on or after May 1, 2028, and to redeem the Notes due 2033 at any time in whole upon certain other specified events.
On September 25, 2020, theThe Company entered into a Subordinated Note Purchase Agreement with certain qualified institutional buyers pursuant to which the Company sold and issued $65.0 million in aggregate principal amount of its 4.25% Fixed to Floating Rate Subordinated Notes due 2030.2030 (the "Notes due 2030"). The Notes due 2030 are unsecured and have a ten-year term, maturing October 1, 2030, and will bear interest at a fixed annual rate of 4.25%, payable semi-annually in arrears, for the first five years of the term. Thereafter, the interest rate will reset quarterly to an interest rate per annum equal to a benchmark rate (which is expected to be the Three-Month Term Secured Overnight Financing Rate ("SOFR")SOFR plus 412.6 basis points,points), payable quarterly in arrears. As provided in the Notes due 2030, under specified conditions the interest rate on the Notes due 2030 during the applicable floating rate period may be determined based on a rate other than Three-Month Term SOFR. The Company is entitled to redeem the Notes due 2030, in whole or in part, on any interest payment date on or after October 1, 2025, and to redeem the Notes due 2030 at any time in whole upon certain other specified events.
The Company had
$144.7$123.4 million of subordinated debt, net of deferred issuance costs
$2.1$1.6 million and unamortized fair value mark
$646 thousand,$2.1 million, at December 31,
2021,2023, compared to
$144.6$145.0 million, net of deferred issuance costs
$2.2$1.9 million and unamortized fair value mark
$700$593 thousand, at December 31,
2020.2022. The decrease in subordinated debt was attributable to the Company's redemption of $24.0 million of its Notes due 2028 and the Company's repayment of $2.0 million of its Notes due 2030 in May of 2023, which resulted in the Company recording a $217 thousand gain on the repurchased debt. The decrease in subordinated debt was partially offset by the addition of $9.0 million, net purchase accounting adjustments, of subordinated debt that the Company acquired as part of the HSBI acquisition.
The Federal Reserve Board and bank regulatory agencies require bank holding companies and financial institutions to maintain capital at adequate levels based on a percentage of assets and off-balance sheet exposures, adjusted for risk weights ranging from 0% for U.S government and agency securities, to 600% for certain equity exposures. In November 2019, the federal banking agencies adopted a rule revising the scope of commercial real estate mortgages subject to a 150% risk weight. Under the risk-based standard, capital is classified into two tiers. Tier 1 capital consists of common stockholders’ equity, excluding the unrealized gain (loss) on available-for-sale securities, minus certain intangible assets. Tier 2 capital consists of the general reserve for loan losses, subject to certain limitations. An institution’s total risk-based capital for purposes of its risk-based capital ratio consists of the sum of its Tier 1 and Tier 2 capital. The risk-based regulatory minimum requirements are 6% for Tier 1 and 8% for total risk-based capital.
Bank holding companies and banks are also required to maintain capital at a minimum level based on total assets, which is known as the leverage ratio. The minimum requirement for the leverage ratio is 4%. All but the highest rated institutions are required to maintain ratios 100 to 200 basis points above the minimum. The Company and The First exceeded their minimum regulatory capital ratios as of December 31,
2021, 20202023, 2022 and
2019.2021.
The Federal Reserve and the Federal Deposit Insurance Corporation approved final capital rules in July 2013, that substantially amended the existing capital rules for banks. These new rules reflect, in part, certain standards initially adopted by the Basel Committee on Banking Supervision in December 2010 (which standards are commonly referred to as “Basel III”) as well as requirements contemplated by the Dodd-Frank Act.
Under the Basel III capital rules, the Company is required to meet certain minimum capital requirements that differ from past capital requirements. The rules implement a new capital ratio of common equity Tier 1 capital to risk-weighted assets. Common equity Tier 1 capital generally consists of retained earnings and common stock (subject to certain adjustments) as well as accumulated other comprehensive income (“AOCI”), however, the Company exercised a one-time irrevocable option to exclude certain components of AOCI as of March 31, 2015. The Company is required to establish a “conservation buffer,” consisting of a common equity Tier 1 capital amount equal to 2.5% of risk-weighted assets effective January 2019. An institution that does not meet the conservation buffer will be subject to restrictions on certain activities including payment of dividends, stock repurchases, and discretionary bonuses to executive officers.
The prompt corrective action rules have been modified to include the common equity Tier 1 capital ratio and to increase the Tier 1 capital ratio requirements for the various thresholds. For example, the requirements for the Company to be considered well-capitalized under the rules include a 5.0% leverage ratio, a 6.5% common equity Tier
1capital1 capital ratio, an 8.0% Tier 1 capital ratio, and a 10.0% total capital ratio.
The rules modify the manner in which certain capital elements are determined. The rules make changes to the methods of calculating the risk-weighting of certain assets, which in turn affects the calculation of the risk-weighted capital ratios. Higher risk weights are assigned to various categories of assets, including commercial real estate loans, credit facilities that finance the acquisition, development or construction of real property, certain exposures or credit that are 90 days past due or are nonaccrual, securitization exposures, and in certain cases mortgage servicing rights and deferred tax assets.
The Company was required to comply with the new capital rules on January 1, 2015, with a measurement date of March 31, 2015. The conservation buffer was phased-in beginning in 2016, and took full effect on January 1, 2019. Certain calculations under the rules will also have phase-in periods. Under this guidance banking institutions with a CETI, Tier 1 Capital Ratio and Total Risk Based Capital above the minimum regulatory adequate capital ratios but below the capital conservation buffer will face constraints on their ability to pay dividends, repurchase equity and pay discretionary bonuses to executive officers, based on the amount of the shortfall.
On December 14, 2021, the U.S. Department of Treasury informed the Company of its eligibility to receive $175.0 million of non-dilutive Tier 1 perpetual preferred capital under the ECIP. Established by the Consolidated Appropriations Act of 2021, the ECIP was created to encourage low-and moderate-income community financial institutions to augment their efforts to support small businesses and consumers in their communities.
Analysis of Capital
| | | | | | | | | | | | | | | | | | | |
| | | | | | Minimum | | | | | | | | | | | | | |
| | | | | | Capital | | | | | | | | | | | | | |
| | | | | | Required | | | | | | | | | | | | | |
| | | | | | Basel III | | | | | | | | | | | | | |
| | Adequately | | Well | | Fully | | The Company | | The First | |
Capital Ratios | | Capitalized | | Capitalized | | Phased In | | December 31, | | December 31, | |
| | | | | | | | 2021 | | 2020 | | 2019 | | 2021 | | 2020 | | 2019 | |
Leverage | | 4.0 | % | 5.0 | % | 7.0 | % | 9.2 | % | 9.2 | % | 10.3 | % | 10.8 | % | 10.4 | % | 11.8 | % |
Risk-based capital: | | | | | | | | | | | | | | | | | | | |
Common equity Tier 1 | | 4.5 | % | 6.5 | % | 7.0 | % | 13.7 | % | 13.5 | % | 12.5 | % | 16.6 | % | 15.8 | % | 15.1 | % |
Tier 1 | | 6.0 | % | 8.0 | % | 8.5 | % | 14.1 | % | 14.0 | % | 13.0 | % | 16.6 | % | 15.8 | % | 15.1 | % |
Total | | 8.0 | % | 10.0 | % | 10.5 | % | 18.6 | % | 19.1 | % | 15.8 | % | 17.4 | % | 16.9 | % | 15.6 | % |
| | | | | | | | | | | | | | | | | | | | | | | | | | | | | | | | | | | | | | | | | | | | | | | | | | | | | | | | |
| Capital Ratios | | Adequately
Capitalized | | Well
Capitalized | | Minimum
Capital
Required
Basel III
Fully
Phased In | | The Company
December 31, | | The First
December 31, |
| | | | | | | | 2023 | | 2022 | | 2021 | | 2023 | | 2022 | | 2021 |
| Leverage | | 4.0 | % | | 5.0 | % | | 7.0 | % | | 9.7 | % | | 9.3 | % | | 9.2 | % | | 10.7 | % | | 11.1 | % | | 10.8 | % |
| Risk-based capital: | | | | | | | | | | | | | | | | | | |
| Common equity Tier 1 | | 4.5 | % | | 6.5 | % | | 7.0 | % | | 12.1 | % | | 12.7 | % | | 13.7 | % | | 13.8 | % | | 15.6 | % | | 16.6 | % |
| Tier 1 | | 6.0 | % | | 8.0 | % | | 8.5 | % | | 12.5 | % | | 13.0 | % | | 14.1 | % | | 13.8 | % | | 15.6 | % | | 16.6 | % |
| Total | | 8.0 | % | | 10.0 | % | | 10.5 | % | | 15.0 | % | | 16.7 | % | | 18.6 | % | | 14.8 | % | | 16.4 | % | | 17.4 | % |
Liquidity and Capital Resources
Liquidity management involves monitoring the Company’s sources and uses of funds in order to meet its day-to-day cash flow requirements while maximizing profits. Liquidity represents the ability of a company to convert assets into cash or cash equivalents without significant loss and to raise additional funds by increasing liabilities. Liquidity management is made more complicated because different balance sheet components are subject to varying degrees of management control. For example, the timing of maturities of the investment portfolio is very predictable and subject to a high degree of control at the time investment decisions are made; however, net deposit inflows and outflows are far less
predictable and are not subject to the same degree of control. Asset liquidity is provided by cash and assets which are readily marketable, which can be pledged, or which will mature in the near future. Liability liquidity is provided by access to core funding sources, principally the ability to generate customer deposits in the Company’s market area.
The Company’s federal funds sold position, which includes funds due from banks and interest-bearing deposits with banks, is typically its primary source of liquidity. Federal funds sold averaged
$642.0$97.2 million during the year ended December 31,
20212023 and averaged
$317.8$366.5 million at December 31,
2020.2022. In addition, the Company has available advances from the FHLB. Advances available are generally based upon the amount of qualified first mortgage loans which can be used for collateral. At December 31,
2021,2023, advances available totaled approximately
$1.478$2.051 billion, of which
$5.2$355.2 million had been drawn, or used for letters of credit.
As of December 31, 2021,2023, the market value of unpledged debt securities plus pledged securities in excess of current pledging requirements comprised $985.4$661.8 million of the Company’s investment balances, compared to $513.2 million$1.066 billion at December 31, 2020. The increase in unpledged debt securities from December 2021 compared to December 2020 is primarily due to an increase in acquired deposits.2022. Other forms of balance sheet liquidity include but are not necessarily limited to any outstanding federal funds sold and vault cash. Management believes that available investments and other potentially liquid assets, along with the standby funding sources it has arranged, are more than sufficient to meet the Company’s current and anticipated short-term liquidity needs.
The Company’s liquidity ratio as of December 31, 20212023 was 41.1%17.6%, as compared to internal liquidity policy guidelines of 10% minimum. Other liquidity ratios reviewed include the following along with policy guidelines for the periods indicated:
| | | | | | |
| | December 31, 2021 | | Policy Maximum | | |
Loans to Deposits (including FHLB advances) | | 55.8 | % | 90.0 | % | In Policy |
Net Non-core Funding Dependency Ratio | | (14.6) | % | 20.0 | % | In Policy |
Fed Funds Purchased / Total Assets | | 0.0 | % | 10.0 | % | In Policy |
FHLB Advances / Total Assets | | 0.0 | % | 20.0 | % | In Policy |
FRB Advances / Total Assets | | 0.0 | % | 10.0 | % | In Policy |
Pledged Securities to Total Securities | | 48.5 | % | 90.0 | % | In Policy |
| | | | | | |
| | December 31, 2020 | | Policy Maximum | | |
Loans to Deposits (including FHLB advances) | | 70.9 | % | 90.0 | % | In Policy |
Net Non-core Funding Dependency Ratio | | (4.4) | % | 20.0 | % | In Policy |
Fed Funds Purchased / Total Assets | | 0.0 | % | 10.0 | % | In Policy |
FHLB Advances / Total Assets | | 2.1 | % | 20.0 | % | In Policy |
FRB Advances / Total Assets | | 0.0 | % | 10.0 | % | In Policy |
Pledged Securities to Total Securities | | 54.9 | % | 90.0 | % | In Policy |
| | | | | | |
| | December 31, 2019 | | Policy Maximum | | |
Loans to Deposits (including FHLB advances) | | 79.2 | % | 90.0 | % | In Policy |
Net Non-core Funding Dependency Ratio | | 8.9 | % | 20.0 | % | In Policy |
Fed Funds Purchased / Total Assets | | 0.1 | % | 10.0 | % | In Policy |
FHLB Advances / Total Assets | | 5.2 | % | 20.0 | % | In Policy |
FRB Advances / Total Assets | | 0.0 | % | 10.0 | % | In Policy |
Pledged Securities to Total Securities | | 56.5 | % | 90.0 | % | In Policy |
Continued growth in core deposits and relatively high levels of potentially liquid investments have had a positive impact on our liquidity position in recent periods, but no assurance can be provided that our liquidity will continue at current robust levels.
| | | | | | | | | | | | | | | | | |
| December 31, 2023 | | Policy Maximum | | |
| Loans to Deposits (including FHLB advances) | 79.3 | % | | 90.0 | % | | In Policy |
| Net Non-core Funding Dependency Ratio | 8.3 | % | | 20.0 | % | | In Policy |
| Fed Funds Purchased / Total Assets | 0.0 | % | | 10.0 | % | | In Policy |
| FHLB Advances / Total Assets | 0.0 | % | | 20.0 | % | | In Policy |
| FRB Advances / Total Assets | 5.0 | % | | 10.0 | % | | In Policy |
| Pledged Securities to Total Securities | 58.6 | % | | 90.0 | % | | In Policy |
| | | | | |
| December 31, 2022 | | Policy Maximum | | |
| Loans to Deposits (including FHLB advances) | 67.9 | % | | 90.0 | % | | In Policy |
| Net Non-core Funding Dependency Ratio | 4.4 | % | | 20.0 | % | | In Policy |
| Fed Funds Purchased / Total Assets | 0.0 | % | | 10.0 | % | | In Policy |
| FHLB Advances / Total Assets | 2.0 | % | | 20.0 | % | | In Policy |
| FRB Advances / Total Assets | 0.0 | % | | 10.0 | % | | In Policy |
| Pledged Securities to Total Securities | 46.9 | % | | 90.0 | % | | In Policy |
| | | | | |
| December 31, 2021 | | Policy Maximum | | |
| Loans to Deposits (including FHLB advances) | 55.8 | % | | 90.0 | % | | In Policy |
| Net Non-core Funding Dependency Ratio | (14.6) | % | | 20.0 | % | | In Policy |
| Fed Funds Purchased / Total Assets | 0.0 | % | | 10.0 | % | | In Policy |
| FHLB Advances / Total Assets | 0.0 | % | | 20.0 | % | | In Policy |
| FRB Advances / Total Assets | 0.0 | % | | 10.0 | % | | In Policy |
| Pledged Securities to Total Securities | 48.5 | % | | 90.0 | % | | In Policy |
The holding company’s primary uses of funds are ordinary operating expenses and stockholder dividends, and its primary source of funds is dividends from the Bank since the holding company does not conduct regular banking operations. Management anticipates that the Bank will have sufficient earnings to provide dividends to the holding company to meet its funding requirements for the foreseeable future.
Management regularly reviews the liquidity position of the Company and has implemented internal policies which establish guidelines for sources of asset-based liquidity and limit the total amount of purchased funds used to support the balance sheet and funding from non-core sources.
During March 2020, in response to COVID-19, the Federal Reserve lowered the primary credit rate by 150 basis points to 0.25 percent and extended terms to 90 days to enhance market liquidity and encourage use of the discount window. In addition, the Federal Reserve announced it would begin quantitative easing, or large-scale asset purchases, consisting primarily of Treasury securities and mortgage-backed securities to stem the effects of the pandemic on the financial markets. A prolonged outbreak of the COVID-19 pandemic could cause a widespread liquidity crisis, and the availability of these funds or the options to sell securities currently held could be hindered. The full impact and duration of COVID-19 on our business is unknown but if it continues to curtail economic activity, it could impact our ability to obtain funding and result in the reduction of or the cessation of dividends.On March 28, 2019, the Company announced that its Board of Directors authorized a share repurchase program to purchase up to an aggregate of $20 million of the Company’s common stock (the “March 2019 program”). This share repurchase program had an expiration dateAs of December 31, 2019. Under the March 2019 program, the Company could repurchase shares of its common stock periodically in a manner determined by the Company’s management. The actual means and timing of purchase, target number of shares and maximum price or range of prices under the program was determined by management at its discretion and depended on a number of factors, including the market price of the Company’s common stock, general market and economic conditions, and applicable legal and regulatory requirements. The Company repurchased 168,188 shares under the March 2019 program in 2019.
On May 7, 2020, the Company announced the renewal of its share repurchase program that previously expired on December 31, 2019. Under the program, the Company could from time to time repurchase up to $15 million in shares of its common stock in any manner determined appropriate by the Company's management. The actual timing and method of any purchases,2023, the target number of shares and the maximum price (or range of prices) under the program,federal funds rate was determined by management at its discretion and depended on a number of factors, including the market price of the Company's common stock, general market and economic conditions, and applicable legal and regulatory requirements. The renewed share repurchase program expired on December 31, 2020. The Company repurchased 289,302 shares in 2020 pursuant5.25% to the program.
On December 16, 2020, the Company announced that its Board of Directors has authorized a share repurchase program (the “2021 Repurchase Program”), pursuant to which the Company may purchase up to an aggregate of $30 million in shares of the Company’s issued and outstanding common stock. Under the program, the Company could, but is not required to, from time to time repurchase up $30 million of its own common stock in any manner determined appropriate by the Company’s management. The actual timing and method of any purchases, the target number of shares and the maximum price (or range of prices) under the program, was be determined by management at is discretion and depended on a number of factors, including the market price of the Company’s common stock, general market and economic conditions, and applicable legal and regulatory requirements. The 2021 Repurchase Program expired on December 31, 2021. The Company repurchased 165,623 shares in 2021 pursuant to the 2021 Repurchase Program.
5.50%.
On February 8, 2022, the Company announced the renewal of the 2021 Repurchase Program that previously expired on December 31, 2021. Under the renewed 2021 Repurchase Program, the Company could
from time to time repurchase up to an aggregate of
$30$30.0 million of the Company’s issued and outstanding common stock in any manner determined appropriate by the Company’s management, less the amount of prior purchases under the program during the 2021 calendar year. The renewed 2021 Repurchase Program was completed in February 2022 when the Company’s repurchases under the program approached the maximum authorized amount.
The Company repurchased 600,000 shares under the 2021 Repurchase Program in the first quarter of 2022.
On March 9, 2022, the Company announced that its Board of Directors authorized a new share repurchase program (the “2022 Repurchase Program”), pursuant to which the Company could purchase up to an aggregate of $30.0 million in shares of the Company’s issued and outstanding common stock during the 2022 calendar year. Under the program, the Company could, but was not required to, from time to time repurchase up $30.0 million of shares of its own common stock in any manner determined appropriate by the Company’s management. The actual timing and method of any purchases, the target number of shares and the maximum price (or range of prices) under the program, was determined by management at is discretion and will depend on a number of factors, including the market price of the Company’s common stock, general market and economic conditions, and applicable legal and regulatory requirements. The 2022 Repurchase Program expired on December 31, 2022.
The Inflation Reduction Act of 2022 signed into law in August 2022 includes a provision for an excise tax equal to 1% of the fair market value of any stock repurchased by covered corporations during a taxable year, subject to certain limits and provisions. The excise tax is effective beginning in fiscal year 2023. While we may complete transactions subject to the new excise tax, we do not expect a material impact to our statement of condition or result of operations.
On February 28, 2023, the Company announced that its Board of Directors has authorized a new share repurchase program (the “2022"2023 Repurchase Program”Program"), pursuant to which the Company may purchase up to an aggregate of $30$50.0 million in shares of the Company’sCompany's issued and outstanding common stock during the 20202023 calendar year. Under the program, the Company may, but is not required to, from time to time repurchase up $30$50.0 million of shares of its own common stock in any manner determined appropriate by the Company’s management. The actual timing and method of any purchases, the target number of shares and the maximum price (or range of prices) under the program, will be determined by management at is discretion and will depend on a number of factors, including the market price of the Company’s common stock, general market and economic conditions, and applicable legal and regulatory requirements. The 20222023 Repurchase Program expired on December 31, 2023.
On February 28, 2024, the Company announced that its Board of Directors has authorized a new share repurchase program (the "2024 Repurchase Program"), pursuant to which the Company may purchase up to an aggregate of $50.0 million in shares of the Company's issued and outstanding common stock during the 2024 calendar year. Under the program, the Company may, but is not required to, from time to time repurchase up $50.0 million of shares of its own common stock in any manner determined appropriate by the Company’s management. The actual timing and method of any purchases, the target number of shares and the maximum price (or range of prices) under the program, will be determined by management at is discretion and will depend on a number of factors, including the market price of the Company’s common stock, general market and economic conditions, and applicable legal and regulatory requirements. The 2024 Repurchase Program will
have an expiration date ofexpire on December 31,
2022.2024.
Commitments and Contractual Obligations
The following table presents, as of December 31,
2021,2023, fixed and determinable contractual obligations to third parties by payment date. Amounts in the table do not include accrued or accruing interest. Payments related to leases are based on actual payments specified in the underlying contracts. Further discussion of the nature of each obligation is included in the referenced note to the consolidated financial statements included elsewhere in this Form 10-K.
| | | | | | | | | | | | | | | | | |
| | | | | | | After One | | After Three | | | | | | |
| | Note | | Within One | | But Within | | But Within | | After Five | | | |
($ in thousands) | | Reference | | Year | | Three Years | | Five Years | | Years | | Total |
Deposits without a stated maturity | | G | | $ | 4,642,175 | | $ | — | | $ | — | | $ | — | | $ | 4,642,175 |
Time deposits | | G | | | 444,983 | | | 105,481 | | | 23,840 | | | 10,305 | | | 584,609 |
Lease obligations | | I | | | 1,346 | | | 2,261 | | | 1,480 | | | 1,199 | | | 6,286 |
Trust preferred subordinated debentures | | N | | | — | | | — | | | — | | | 15,850 | | | 15,850 |
Subordinated note purchase agreement | | N | | | — | | | — | | | — | | | 128,876 | | | 128,876 |
Total Contractual obligations | | | | $ | 5,088,504 | | $ | 107,742 | | $ | 25,320 | | $ | 156,230 | | $ | 5,377,796 |
| | | | | | | | | | | | | | | | | | | | | | | | | | | | | | | | | | | | | | |
| ($ in thousands) | | Note
Reference | | Within One
Year | | After One
But Within
Three Years | | After Three
But Within
Five Years | | After Five
Years | | Total |
| Deposits without a stated maturity | | G | | $ | 5,387,116 | | | $ | — | | | $ | — | | | $ | — | | | $ | 5,387,116 | |
| Time deposits | | G | | 971,259 | | | 73,460 | | | 22,510 | | | 8,527 | | | 1,075,756 | |
| Borrowings | | H | | 390,000 | | | — | | | — | | | — | | | 390,000 | |
| Lease obligations | | I | | 1,240 | | | 2,225 | | | 1,825 | | | 2,999 | | | 8,289 | |
| Trust preferred subordinated debentures | | N | | — | | | — | | | — | | | 25,016 | | | 25,016 | |
| Subordinated note purchase agreement | | N | | — | | | — | | | — | | | 98,370 | | | 98,370 | |
| Total Contractual obligations | | | | $ | 6,749,615 | | | $ | 75,685 | | | $ | 24,335 | | | $ | 134,912 | | | $ | 6,984,547 | |
The Bank does not engage in subprime lending activities targeted towards borrowers in high risk categories.
Information on new accounting matters is set forth in Note B – Summary of Significant Accounting Policies in the accompanying notes to the consolidated financial statements included elsewhere in this report. This information is incorporated herein by reference.
Impact of Inflation
Unlike most industrial companies, the assets and liabilities of financial institutions such as the Company are primarily monetary in nature. Therefore, interest rates have a more significant effect on the Company’s performance than do the effects of changes in the general rate of inflation and change in prices. In addition, interest rates do not necessarily move in the same direction or in the same magnitude as the prices of goods and services. As discussed previously, management seeks to manage the relationships between interest sensitive assets and liabilities in order to protect against wide interest rate fluctuations, including those resulting from inflation.
ITEM 7A. QUANTITATIVE AND QUALITATIVE DISCLOSURES ABOUT MARKET RISK
Interest Rate Risk Management
Market risk arises from changes in interest rates, exchange rates, commodity prices and equity prices. The Company does not engage in the trading of financial instruments, nor does it have exposure to currency exchange rates. Our market risk exposure is primarily that of interest rate risk, and we have established policies and procedures to monitor and limit our earnings and balance sheet exposure to changes in interest rates. The principal objective of interest rate risk management is to manage the financial components of the Company’s balance sheet in a manner that will optimize the risk/reward equation for earnings and capital under a variety of interest rate scenarios.
To identify areas of potential exposure to interest rate changes, we utilize commercially available modeling software to perform earnings simulations and calculate the Company’s market value of portfolio equity under varying interest rate scenarios every month. The model imports relevant information for the Company’s financial instruments and incorporates management’s assumptions on pricing, duration, and optionality for anticipated new volumes. Various rate scenarios consisting of key rate and yield curve projections are then applied in order to calculate the expected effect of a given interest rate change on interest income, interest expense, and the value of the Company’s financial instruments. The rate projections can be shocked (an immediate and parallel change in all base rates, up or down), ramped (an incremental increase or decrease in rates over a specified time period), economic (based on current trends and econometric models) or stable (unchanged from current actual levels).
We use seven standard interest rate scenarios in conducting our 12-month net interest income simulations: “static,” upward shocks of 100, 200, 300 and 400 basis points, and downward shocks of 100, and 200 basis points. Pursuant to policy guidelines, we typically attempt to limit the projected decline in net interest income relative to the stable rate scenario to no more than 5% for a 100-basis point (bp) interest rate shock, 10% for a 200 bp shock, 15% for a 300 bp shock, and 20% for a 400 bp shock. As of December 31,
2021,2023, the Company had the following estimated net interest income, without factoring in any potential negative impact on spreads resulting from competitive pressures or credit quality deterioration:
| | | | | | | | | | | | | | | |
December 31, 2021 | | Net Interest Income at Risk – Year 1 | |
($ in thousands) | | -200 bp | | -100 bp | | STATIC | | +100 bp | | +200 bp | | +300 bp | | +400 bp | |
Net Interest Income | | 137,418 | | 139,280 | | 144,009 | | 150,739 | | 155,719 | | 158,649 | | 160,275 | |
Dollar Change | | (6,591) | | (4,729) | | | | 6,730 | | 11,710 | | 14,640 | | 16,266 | |
NII @ Year 1 | | (4.6) | % | (3.3) | % | | | 4.7 | % | 8.1 | % | 10.2 | % | 11.3 | % |
| | | | | | | | | | | | | | | | | | | | | | | | | | | | | | | | | | | | | | | | | | | | |
| December 31, 2023 | | Net Interest Income at Risk – Sensitivity Year 1 |
| ($ in thousands) | | -200 bp | | -100 bp | | STATIC | | +100 bp | | +200 bp | | +300 bp | | +400 bp |
| Net Interest Income | | 236,936 | | | 232,589 | | | 231,521 | | | 233,208 | | | 226,151 | | | 210,556 | | | 187,595 | |
| Dollar Change | | 5,415 | | | 1,068 | | | | | 1,687 | | | (5,370) | | | (20,965) | | | (43,926) | |
| NII @ Risk - Sensitivity Year 1 | | 2.3 | % | | 0.5 | % | | | | 0.7 | % | | (2.3) | % | | (9.1) | % | | (19.0) | % |
If there were an immediate and sustained downward adjustment of 200 basis points in interest rates, all else being equal, net interest income over the next twelve months would likely be approximately $6.6$5.4 million lowerhigher than in a stable interest rate scenario, for a negative variance of 4.6%2.3%. The unfavorable variance increases if rates were to drop below 200 basis points, due to the fact that certain deposit rates are already relatively low (on NOW accounts and savings accounts, for example), and will hit a natural floor of close to zero while non-floored variable-rate loan yields continue to drop. This effect is exacerbated by accelerated prepayments on fixed-rate loans and mortgage-backed securities when rates decline, although rate floors on some of our variable-rate loans partially offset other negative pressures. While we view further interest rate reductions as highly unlikely, the potential percentage drop in net interest income exceeds our internal policy guidelines in declining interest rate scenarios and we will continue to monitor our interest rate risk profile and take corrective action as deemed appropriate.
Net interest income would likely
increasedecrease by
$11.7$5.4 million, or
8.1%(2.3)%, if interest rates were to increase by 200 basis points relative to a stable interest rate
scenario, with the favorable variance expanding the higher interest rates rise.scenario. The initial increase in rising rate scenarios will be limited to some extent by the fact that some of our variable-rate loans are currently at rate floors, resulting in a re-pricing lag while base rates are increasing to floored levels, but we believe the Company still would benefit from a material upward shift in the yield curve.
The Company’s one-year cumulative GAP ratio was approximately
118.0% at December 31, 2023, 180.0% at December 31, 2022 and 164.5% at December 31,
2021, 211.7% at December 31, 2020 and 151.9% at December 31, 2019.2021. The Company is considered “asset-sensitive” which means that there are more assets repricing than liabilities within the first year.
In addition to the net interest income simulations shown above, we run stress scenarios modeling the possibility of no balance sheet growth, the potential runoff of
“surge” core deposits which flowed into the Company in the most recent economic cycle, and potential unfavorable movement in deposit rates relative to yields on earning assets. Even though net interest income will naturally be lower with no balance sheet growth, the rate-driven variances projected for net interest income in a static growth environment are similar to the changes noted above for our standard projections. When a greater level of non-maturity deposit runoff is assumed or unfavorable deposit rate changes are factored into the model, projected net interest income in declining rate and flat rate scenarios does not change materially relative to standard growth projections. However, the benefit we would otherwise experience in rising rate scenarios is minimized and net interest income remains relatively flat.
The economic value (or “fair value”) of financial instruments on the Company’s balance sheet will also vary under the interest rate scenarios previously discussed. The difference between the projected fair value of the Company’s financial assets and the fair value of its financial liabilities is referred to as the economic value of equity (“EVE”), and changes in EVE under different interest rate scenarios are effectively a gauge of the Company’s longer-term exposure to interest rate risk. Fair values for financial instruments are estimated by discounting projected cash flows (principal and interest) at projected replacement interest rates for each account type, while the fair value of non-financial accounts is assumed to equal their book value for all rate scenarios. An economic value simulation is a static measure utilizing balance sheet accounts at a given point in time, and the measurement can change substantially over time as the characteristics of the Company’s balance sheet evolve and interest rate and yield curve assumptions are updated.
The change in economic value under different interest rate scenarios depends on the characteristics of each class of financial instrument, including stated interest rates or spreads relative to current or projected market-level interest rates or spreads, the likelihood of principal prepayments, whether contractual interest rates are fixed or floating, and the average remaining time to maturity. As a general rule, fixed-rate financial assets become more valuable in declining rate scenarios and less valuable in rising rate scenarios, while fixed-rate financial liabilities gain in value as interest rates rise and lose value as interest rates decline. The longer the duration of the financial instrument, the greater the impact a rate change will have on its value. In our economic value simulations, estimated prepayments are factored in for financial instruments with stated maturity dates, and decay rates for non-maturity deposits are projected based on historical patterns and management’s best estimates. The table below shows estimated changes in the Company’s EVE as of the periods indicated under different interest rate scenarios relative to a base case of current interest rates:
| | | | | | | | | | | | | | | |
| | December 31, 2021 - Balance Sheet Shock | |
| | | | | | STATIC | | | | | | | | | |
($ in thousands) | | -200 bp | | -100 bp | | (Base) | | +100 bp | | +200 bp | | +300 bp | | +400 bp | |
Market Value of Equity | | 818,527 | | 1,057,506 | | 1,243,831 | | 1,360,616 | | 1,436,669 | | 1,478,980 | | 1,492,421 | |
Change in EVE from base | | (425,304) | | (186,325) | | | | 116,785 | | 192,838 | | 235,149 | | 248,590 | |
% Change | | (34.2) | % | (15.0) | % | | | 9.4 | % | 15.5 | % | 18.9 | % | 20.0 | % |
Policy Limits | | (20.0) | % | (10.0) | % | | | (10.0) | % | (20.0) | % | (30.0) | % | (40.0) | % |
| | | | | | | | | | | | | | | | | | | | | | | | | | | | | | | | | | | | | | | | | | | | |
| | December 31, 2023 - Balance Sheet Shock |
| ($ in thousands) | | -200 bp | | -100 bp | | STATIC
(Base) | | +100 bp | | +200 bp | | +300 bp | | +400 bp |
| Market Value of Equity | | 1,286,790 | | | 1,321,286 | | | 1,354,363 | | | 1,362,597 | | | 1,327,813 | | | 1,263,361 | | | 1,187,080 | |
| Change in EVE from base | | (67,573) | | | (33,077) | | | | | 8,234 | | | (26,550) | | | (91,002) | | | (167,283) | |
| % Change | | (5.0) | % | | (2.4) | % | | | | 0.6 | % | | (2.0) | % | | (6.7) | % | | (12.4) | % |
| Policy Limits | | (20.0) | % | | (10.0) | % | | | | (10.0) | % | | (20.0) | % | | (30.0) | % | | (40.0) | % |
| | | | | | | | | | | | | | | | | | | | | | | | | | | | | | | | | | | | | | | | | | | | |
| | December 31, 2022 - Balance Sheet Shock |
| ($ in thousands) | | -200 bp | | -100 bp | | STATIC
(Base) | | +100 bp | | +200 bp | | +300 bp | | +400 bp |
| Market Value of Equity | | 1,366,982 | | | 1,410,341 | | | 1,397,164 | | | 1,366,639 | | | 1,316,226 | | | 1,248,624 | | | 1,165,069 | |
| Change in EVE from base | | (30,182) | | | 13,177 | | | | | (30,525) | | | (80,938) | | | (148,540) | | | (232,095) | |
| % Change | | (2.2) | % | | 0.9 | % | | | | (2.2) | % | | (5.8) | % | | (10.6) | % | | (16.6) | % |
| Policy Limits | | (20.0) | % | | (10.0) | % | | | | (10.0) | % | | (20.0) | % | | (30.0) | % | | (40.0) | % |
| | | | | | | | | | | | | | | |
| | December 31, 2020 - Balance Sheet Shock | |
| | | | | | STATIC | | | | | | | | | |
($ in thousands) | | -200 bp | | -100 bp | | (Base) | | +100 bp | | +200 bp | | +300 bp | | +400 bp | |
Market Value of Equity | | 663,134 | | 774,745 | | 964,302 | | 1,100,056 | | 1,201,063 | | 1,272,207 | | 1,316,039 | |
Change in EVE from base | | (301,168) | | (189,557) | | | | 135,754 | | 236,761 | | 307,905 | | 351,737 | |
% Change | | (31.2) | % | (19.7) | % | | | 14.1 | % | 24.6 | % | 31.9 | % | 36.5 | % |
Policy Limits | | (20.0) | % | (10.0) | % | | | (10.0) | % | (20.0) | % | (30.0) | % | (40.0) | % |
The tables show that our EVE will generally deteriorate in declining rate scenarios, but should benefit from a parallel shift upward in the yield curve. As noted previously, however, management is of the opinion that the potential for a significant rate decline is low. We also run stress scenarios for EVE to simulate the possibility of higher loan prepayment rates, unfavorable changes in deposit rates, and higher deposit decay rates. Model results are highly sensitive to changes in assumed decay rates for non-maturity deposits, in particular.
ITEM 8. FINANCIAL STATEMENTS AND SUPPLEMENTARY DATA
Report of Independent Registered Public Accounting Firm
To the Stockholders, Board of Directors and Audit Committee
The First Bancshares, Inc.
Opinion on the Consolidated Financial Statements
We have audited the accompanying consolidated balance
sheetsheets of The First Bancshares, Inc. (the “Company”) as of December 31,
2021,2023 and 2022, the related consolidated statements of income, comprehensive income
(loss), stockholders’ equity and cash flows for
each of the
year thenyears in the three-year period ended
December 31, 2023, and the related notes (collectively referred to as the “financial statements”). In our opinion, the consolidated financial statements referred to above present fairly, in all material respects, the financial position of the Company as of December 31,
2021,2023 and 2022, and the results of its operations and its cash flows for
each of the
year thenyears in the three-year period ended
December 31, 2023, in conformity with accounting principles generally accepted in the United States of America.
We also have audited, in accordance with the standards of the Public Company Accounting Oversight Board (United States) (PCAOB), the Company’s internal control over financial reporting as of December 31, 2021,2023, based on criteria established in Internal Control – Integrated Framework (2013) issued by the Committee of Sponsoring Organizations of the Treadway Commission (COSO) and our report dated March 11, 2022,February 29, 2024, expressed an unqualified opinion on the effectiveness of the Company’s internal control over financial reporting.thereon.
Adoption of New Accounting Standard
As discussed in Note B to the consolidated financial statements, the Company has changed its method of accounting for the allowance for credit losses in 2021 due to the adoption of ASU No. 2016-13, Financial Instruments – Credit Losses (Topic 326): Measurement of Credit Losses on Financial Instruments. As discussed below, the allowance for credit losses is considered a critical audit matter.
Basis for Opinion
These financial statements are the responsibility of the Company’s management. Our responsibility is to express an opinion on the Company’s financial statements based on our
audit.audits.
We are a public accounting firm registered with the Public Company Accounting Oversight Board (United States) (“PCAOB”)PCAOB and are required to be independent with respect to the Company in accordance with the U.S. federal securities laws and the applicable rules and regulations of the Securities and Exchange Commission and the PCAOB.
We conducted our auditaudits in accordance with the standards of the PCAOB. Those standards require that we plan and perform the auditaudits to obtain reasonable assurance about whether the financial statements are free of material misstatement, whether due to error or fraud.
Our
auditaudits included performing procedures to assess the risks of material misstatement of the financial statements, whether due to error or fraud, and performing procedures that respond to those risks. Such procedures include examining, on a test basis, evidence regarding the amounts and disclosures in the financial statements. Our
auditaudits also included evaluating the accounting principles used and significant estimates made by management, as well as evaluating the overall presentation of the financial statements. We believe that our
audit providesaudits provide a reasonable basis for our opinion.
Critical Audit Matters
The critical audit
mattermatters communicated below
is a matterare matters arising from the current-period audit of the financial statements that were communicated or required to be communicated to the audit committee and that: (1) relate to accounts or disclosures that are material to the financial statements and (2) involved our especially challenging, subjective, or complex judgments. The communication of critical audit matters does not alter in any way our opinion on the financial statements, taken as a whole, and we are not, by communicating the critical audit matter below, providing separate opinions on the critical audit matter or on the accounts or disclosures to which they relate.
Allowance for Credit Losses
The Company’s loan portfolio totaled
$2.97$5.17 billion as of December 31,
20212023, and the allowance for credit losses on loans was
$30.7$54 million. The Company’s unfunded loan commitments totaled
$537$866 million, with an allowance for credit loss of
$1.1$2.1 million.
The Company’s available-for-sale securities portfolio totaled $1.8 billion as of December 31, 2021, and the allowance for credit losses on securities was $0. Together these amounts represent the allowance for credit losses (“ACL”).
As more fully described in Notes B, D, E and Q to the Company’s consolidated financial statements, the Company estimates its exposure to expected credit losses as of the balance sheet date, for existing financial instruments held at amortized cost, securities classified as available for sale and off-balance sheet exposures, such as unfunded loan commitments, letters of credit and other financial guarantees that are not unconditionally cancellable by the Company.
The determination of the ACL requires management to exercise significant judgment and consider numerous subjective factors, including determining qualitative factors utilized to adjust historical loss rates, loan credit risk grading and identifying loans requiring individual evaluation among others. As disclosed by management, different assumptions and conditions could result in a materially different amount for the estimate of the ACL.
We identified the
ACL at December 31, 2021, as well as atvaluation of the
January 1, 2021 adoption date of Topic 326,ACL as a critical audit matter. Auditing the ACL involved a high degree of subjectivity in evaluating management’s estimates, such as evaluating
management’smanagement's identification of credit quality indicators, grouping of loans determined to be similar into pools, estimating the remaining life of loans in a pool, assessment of economic conditions and other environmental factors, evaluating the adequacy of specific allowances associated with individually evaluated loans and assessing the appropriateness of loan credit risk grades.
The primary procedures we performed
at initial adoption of Topic 326 and as of December 31,
2021,2023, to address this critical audit matter included:
| ● | Testing the design and operating effectiveness of controls, including those related to technology, over the allowance for credit losses including data completeness and accuracy, classifications of loans by loan segment, verification of historical net loss data and calculated net loss rates, the establishment of qualitative adjustments, credit ratings and risk classification of loans and establishment of specific reserves on individually evaluated loans and management’s review and disclosure controls over the allowance for credit losses; |
| ● | Testing of completeness and accuracy of the information utilized in the allowance for credit losses; |
| ● | Testing the allowance for credit losses model’s computational accuracy; |
| ● | Evaluating the qualitative adjustments, including assessing the basis for the adjustments and the reasonableness of the significant assumptions; |
•Testing the design and operating effectiveness of controls, including those related to technology, over the allowance for credit losses including:
◦loan data completeness and accuracy,
◦classifications of loans by loan segment,
◦verification of historical net loss data and calculated net loss rates,
◦the establishment of qualitative adjustments,
◦credit ratings and risk classification of loans,
◦establishment of specific reserves on individually evaluated loans,
◦and management’s review and disclosure controls over the allowance for credit losses;
•Testing of completeness and accuracy of the information utilized in the allowance for credit losses;
•Testing the allowance for credit losses model’s computational accuracy;
•Evaluating the qualitative adjustments, including assessing the basis for the adjustments and the reasonableness of the significant assumptions;
•Testing the loan review function and evaluating the accuracy of loan credit ratings;
•Evaluating the reasonableness of specific allowances on individually evaluated loans;
•Evaluating the overall reasonableness of assumptions used by management considering the past performance of the Company;
•Evaluating the disclosures in the consolidated financial statements.
Acquisition
As described in Note C to the Company’s consolidated financial statements, the Company consummated the acquisition of Heritage Southeast Bancorporation, Inc. and its wholly-owned subsidiary, Heritage Bank, resulting in goodwill of approximately $91.9 million being recognized on the Company’s consolidated balance sheet. As part of the acquisition, management assessed that the acquisition qualified as a business combination and all identifiable assets and liabilities acquired were valued at fair value as part of the purchase price allocation as of the acquisition date. The identification and valuation of such acquired assets and assumed liabilities requires management to exercise significant judgment. Management utilized outside vendors to assist with estimating the fair value.
We identified the consummated acquisition and the valuation of acquired assets and assumed liabilities as a critical audit matter. Auditing the acquired assets and assumed liabilities and other acquisition-related considerations involved a high degree of subjectivity in evaluating management’s fair value estimates and purchase price allocations.
The primary procedures we performed to address this critical audit matter included:
| ● | Testing the loan review function and evaluating the accuracy of loan credit ratings: |
| ● | Evaluating the reasonableness of specific allowances on individually evaluated loans |
| ● | Evaluating the overall reasonableness of assumptions used by management considering the past performance of the Company and evaluating trends identified within peer groups; |
| ● | Evaluating the disclosures in the consolidated financial statements |
•Obtained and read the executed Agreement and Plan of Merger documents to gain an understanding of the underlying terms of the consummated acquisition;
•Testing the design and operating effectiveness of controls including:
◦Evaluating the significant assumptions used for valuing significant assets and liabilities assumed;
•Assessed management’s application of accounting guidance related to the business combination and management’s determination of whether the transaction was an acquisition of a business as defined within the ASC 805, Business Combinations, framework;
•Assessed the completeness and accuracy of management’s purchase accounting model, including the balance sheet acquired and related fair value purchase price allocations made to identified assets acquired and liabilities assumed;
•Obtained and evaluated significant outside vendor valuation estimates, and challenging management’s review of the appropriateness of the valuations including but not limited to, testing critical inputs, assumptions applied and valuation models utilized by the outside vendors;
•Utilized internal valuation specialists to assist with testing the related fair value estimates;
•Tested the completeness and accuracy of management’s calculation of total consideration paid;
•Tested the accuracy of the goodwill calculation resulting from the acquisition, which was the difference between the total consideration paid and the fair value of the net assets acquired;
•Read and evaluated the adequacy of the disclosures made in the notes to the Company’s consolidated financial statements.
We have served as the Company’s auditor since 2021.
Jackson, Mississippi
March 11, 2022
Report of Independent Registered Public Accounting Firm
Shareholders and the Board of Directors of The First Bancshares
Hattiesburg, Mississippi
Opinion on the Financial Statements
We have audited the accompanying consolidated balance sheets of The First Bancshares, Inc. (the "Company") as of December 31, 2020, the related consolidated statements of income, comprehensive income, shareholders’ equity, and cash flows for each of the two years in the period ended December 31, 2020, and the related notes (collectively referred to as the "financial statements"). In our opinion, the financial statements present fairly, in all material respects, the financial position of the Company as of December 31, 2020, and the results of its operations and its cash flows for each of the two years in the period ended December 31, 2020, in conformity with accounting principles generally accepted in the United States of America.
Basis for Opinion
These financial statements are the responsibility of the Company's management. Our responsibility is to express an opinion on the Company's financial statements based on our audits. We are a public accounting firm registered with the Public Company Accounting Oversight Board (United States) ("PCAOB") and are required to be independent with respect to the Company in accordance with the U.S. federal securities laws and the applicable rules and regulations of the Securities and Exchange Commission and the PCAOB.
We conducted our audits in accordance with the standards of the PCAOB. Those standards require that we plan and perform the audit to obtain reasonable assurance about whether the financial statements are free of material misstatement, whether due to error or fraud. Our audits included performing procedures to assess the risks of material misstatement of the financial statements, whether due to error or fraud, and performing procedures that respond to those risks. Such procedures included examining, on a test basis, evidence regarding the amounts and disclosures in the financial statements. Our audits also included evaluating the accounting principles used and significant estimates made by management, as well as evaluating the overall presentation of the financial statements. We believe that our audits provide a reasonable basis for our opinion.
We served as the Company's auditor from 2018 to 2021.
Atlanta, Georgia
March 12, 2021
THE FIRST BANCSHARES, INC.
CONSOLIDATED BALANCE SHEETS
DECEMBER 31,
20212023 AND
20202022
($ in thousands except per share data)
| | | | | | | | | | | |
| 2023 | | 2022 |
| ASSETS | | | |
| Cash and due from banks | $ | 224,199 | | | $ | 67,176 | |
| Interest-bearing deposits with banks | 130,948 | | | 78,139 | |
| Total cash and cash equivalents | 355,147 | | | 145,315 | |
| Securities available-for-sale, at fair value (amortized cost: $1,164,227 in 2023; $1,418,337 in 2022; allowance for credit losses: $0 in both 2023 and 2022) | 1,042,365 | | | 1,257,101 | |
| Securities held to maturity, net of allowance for credit losses of $0 (fair value: $615,944 - 2023; $642,097 - 2022) | 654,539 | | | 691,484 | |
| Other securities | 37,754 | | | 33,944 | |
| Total securities | 1,734,658 | | | 1,982,529 | |
| Loans held for sale | 2,914 | | | 4,443 | |
| Loans, net of ACL of $54,032 in 2023 and $38,917 in 2022 | 5,116,010 | | | 3,735,240 | |
| Interest receivable | 33,300 | | | 27,723 | |
| Premises and equipment | 174,309 | | | 143,518 | |
| Operating lease right-of-use assets | 6,387 | | | 7,620 | |
| Finance lease right-of-use assets | 1,466 | | | 1,930 | |
| Cash surrender value of life insurance | 134,249 | | | 95,571 | |
| Goodwill | 272,520 | | | 180,254 | |
| Other real estate owned | 8,320 | | | 4,832 | |
| Other assets | 160,065 | | | 132,742 | |
| Total assets | $ | 7,999,345 | | | $ | 6,461,717 | |
| LIABILITIES AND STOCKHOLDERS' EQUITY | | | |
| Deposits: | | | |
| Non-interest-bearing | $ | 1,849,013 | | | $ | 1,630,203 | |
| Interest-bearing | 4,613,859 | | | 3,864,201 | |
| Total deposits | 6,462,872 | | | 5,494,404 | |
| Interest payable | 22,702 | | | 3,324 | |
| Borrowed funds | 390,000 | | | 130,100 | |
| Subordinated debentures | 123,386 | | | 145,027 | |
| Operating lease liabilities | 6,550 | | | 7,810 | |
| Finance lease liabilities | 1,739 | | | 1,918 | |
| Allowance for credit losses on off-balance sheet credit exposures | 2,075 | | | 1,325 | |
| Other liabilities | 40,987 | | | 31,146 | |
| Total liabilities | 7,050,311 | | | 5,815,054 | |
| Stockholders’ Equity: | | | |
| Common stock, par value $1 per share: 80,000,000 shares authorized; 32,338,983 shares issued in 2023, 40,000,000 shares authorized, and 25,275,369 shares issued in 2022, respectively | 32,339 | | | 25,275 | |
| Additional paid-in capital | 775,232 | | | 558,833 | |
| Retained earnings | 300,150 | | | 252,623 | |
| Accumulated other comprehensive (loss) income | (117,576) | | | (148,957) | |
| Treasury stock, at cost (1,249,607 shares - 2023; 1,249,607 shares - 2022) | (41,111) | | | (41,111) | |
| Total stockholders' equity | 949,034 | | | 646,663 | |
| Total liabilities and stockholders' equity | $ | 7,999,345 | | | $ | 6,461,717 | |
| | | | | | |
| | 2021 | | 2020 |
ASSETS | | | | | | |
Cash and due from banks | | $ | 115,232 | | $ | 137,684 |
Interest-bearing deposits with banks | | | 804,481 | | | 424,870 |
Total cash and cash equivalents | | | 919,713 | | | 562,554 |
Debt securities available-for-sale securities, at fair value | | | 1,751,832 | | | 1,022,182 |
Other securities | | | 22,226 | | | 27,475 |
Total securities | | | 1,774,058 | | | 1,049,657 |
Loans held for sale | | | 7,678 | | | 21,432 |
Loans, net of ACL of $30,742 in 2021 and ALLL $35,820 in 2020 (1) | | | 2,928,811 | | | 3,087,858 |
Interest receivable | | | 23,256 | | | 26,344 |
Premises and equipment | | | 125,959 | | | 114,823 |
Operating lease right-of-use assets | | | 4,095 | | | 5,969 |
Finance lease right-of-use assets | | | 2,394 | | | 2,658 |
Cash surrender value of life insurance | | | 87,420 | | | 73,732 |
Goodwill | | | 156,663 | | | 156,944 |
Other real estate owned | | | 2,565 | | | 5,802 |
Other assets | | | 44,802 | | | 44,987 |
Total assets | | $ | 6,077,414 | | $ | 5,152,760 |
LIABILITIES AND STOCKHOLDERS' EQUITY | | | | | | |
Deposits: | | | | | | |
Non-interest-bearing | | $ | 756,118 | | $ | 571,079 |
Interest-bearing | | | 4,470,666 | | | 3,644,201 |
Total deposits | | | 5,226,784 | | | 4,215,280 |
Interest payable | | | 1,711 | | | 2,134 |
Borrowed funds | | | — | | | 114,647 |
Subordinated debentures | | | 144,726 | | | 144,592 |
Operating lease liabilities | | | 4,192 | | | 6,031 |
Finance lease liabilities | | | 2,094 | | | 2,281 |
Allowance for credit losses on off-balance sheet credit exposures (1) | | | 1,070 | | | — |
Other liabilities | | | 20,665 | | | 22,980 |
Total liabilities | | | 5,401,242 | | | 4,507,945 |
Stockholders’ Equity: | | | | �� | | |
Common stock, par value $1 per share: 40,000,000 shares authorized;21,668,644 shares issued in 2021, 40,000,000 shares authorized and 21,598,993 shares issued in 2020, respectively | | | 21,669 | | | 21,599 |
Additional paid-in capital | | | 459,228 | | | 456,919 |
Retained earnings | | | 206,228 | | | 154,241 |
Accumulated other comprehensive income | | | 7,978 | | | 25,816 |
Treasury stock, at cost (649,607 shares - 2021; 483,984 shares - 2020) | | | (18,931) | | | (13,760) |
Total stockholders' equity | | | 676,172 | | | 644,815 |
Total liabilities and stockholders' equity | | $ | 6,077,414 | | $ | 5,152,760 |
(1)
| – Beginning January 1, 2022, ACL is based on current expected credit loss methodology. Prior to January 1, 2021, ALLL was based on incurred loss methodology.
|
The accompanying notes are an integral part of these statements.
THE FIRST BANCSHARES, INC.
CONSOLIDATED STATEMENTS OF INCOME
YEARS ENDED DECEMBER 31,
2021, 2020,2023, 2022, AND
20192021
($ in thousands, except per share amount)
| | | | | | | | | |
| | 2021 | | 2020 | | | 2019 |
INTEREST INCOME | | | | | | | | | |
Interest and fees on loans | | $ | 151,203 | | $ | 157,564 | | $ | 128,858 |
Interest and dividends on securities: | | | | | | | | | |
Taxable interest and dividends | | | 16,685 | | | 13,961 | | | 14,244 |
Tax-exempt interest | | | 7,721 | | | 6,913 | | | 3,566 |
Interest on federal funds sold | | | — | | | 8 | | | 7 |
Interest on deposits in banks | | | 1,136 | | | 902 | | | 1,854 |
Total interest income | | | 176,745 | | | 179,348 | | | 148,529 |
| | | | | | | | | |
INTEREST EXPENSE | | | | | | | | | |
Interest on deposits | | | 12,062 | | | 19,608 | | | 19,763 |
Interest on borrowed funds | | | 7,619 | | | 7,056 | | | 6,960 |
Total interest expense | | | 19,681 | | | 26,664 | | | 26,723 |
Net interest income | | | 157,064 | | | 152,684 | | | 121,806 |
Provision for credit losses | | | (1,104) | | | 25,151 | | | 3,738 |
Net interest income after provision for credit losses | | | 158,168 | | | 127,533 | | | 118,068 |
| | | | | | | | | |
NON-INTEREST INCOME | | | | | | | | | |
Service charges on deposit accounts | | | 7,264 | | | 7,213 | | | 7,838 |
Other service charges and fees | | | 1,508 | | | 1,355 | | | 1,047 |
Interchange fees | | | 11,562 | | | 9,433 | | | 8,024 |
Secondary market mortgage income | | | 8,823 | | | 10,446 | | | 5,988 |
Bank owned life insurance income | | | 1,955 | | | 1,514 | | | 1,414 |
Gain (loss) on sale of premises | | | (264) | | | 443 | | | 13 |
Securities gains | | | 143 | | | 281 | | | 122 |
Gain (loss) on sale of other real estate | | | (300) | | | (537) | | | (144) |
Financial assistance and bank enterprise awards | | | 1,826 | | | 968 | | | 947 |
Bargain purchase gain | | | 1,300 | | | 7,835 | | | — |
Other | | | 3,656 | | | 2,925 | | | 1,698 |
Total non-interest income | | | 37,473 | | | 41,876 | | | 26,947 |
| | | | | | | | | |
NON-INTEREST EXPENSE | | | | | | | | | |
Salaries | | | 53,371 | | | 50,853 | | | 40,152 |
Employee benefits | | | 12,485 | | | 10,377 | | | 6,864 |
Occupancy | | | 12,713 | | | 11,282 | | | 8,775 |
Furniture and equipment | | | 2,848 | | | 2,551 | | | 2,021 |
Supplies and printing | | | 903 | | | 925 | | | 798 |
Professional and consulting fees | | | 4,035 | | | 3,897 | | | 3,558 |
Marketing and public relations | | | 615 | | | 512 | | | 859 |
FDIC and OCC assessments | | | 2,074 | | | 1,351 | | | 632 |
ATM expense | | | 3,623 | | | 3,042 | | | 2,794 |
Bank communications | | | 1,754 | | | 2,028 | | | 1,779 |
Data processing | | | 1,578 | | | 1,137 | | | 898 |
Acquisition expense/charter conversion | | | 1,607 | | | 3,315 | | | 6,275 |
Other | | | 16,953 | | | 15,071 | | | 13,164 |
| | | | | | | | | | | | | | | | | |
| 2023 | | 2022 | | 2021 |
| INTEREST INCOME | | | | | |
| Interest and fees on loans | $ | 294,541 | | | $ | 157,768 | | | $ | 151,203 | |
| Interest and dividends on securities: | | | | | |
| Taxable interest and dividends | 32,202 | | | 29,656 | | | 16,685 | |
| Tax-exempt interest | 11,737 | | | 11,017 | | | 7,721 | |
| Interest on deposits in banks | 2,453 | | | 1,952 | | | 1,136 | |
| Total interest income | 340,933 | | | 200,393 | | | 176,745 | |
| | | | | |
| INTEREST EXPENSE | | | | | |
| Interest on deposits | 71,359 | | | 13,978 | | | 12,062 | |
| Interest on borrowed funds | 20,249 | | | 8,599 | | | 7,619 | |
| Total interest expense | 91,608 | | | 22,577 | | | 19,681 | |
| Net interest income | 249,325 | | | 177,816 | | | 157,064 | |
| Provision for credit losses, LHFI | 13,750 | | | 5,350 | | | (1,456) | |
| Provision for credit losses, OBSC exposures | 750 | | | 255 | | | 352 | |
| Net interest income after provision for credit losses | 234,825 | | | 172,211 | | | 158,168 | |
| | | | | |
| NON-INTEREST INCOME | | | | | |
| Service charges on deposit accounts | 14,175 | | | 8,668 | | | 7,264 | |
| Other service charges and fees | 3,177 | | | 1,833 | | | 1,508 | |
| Interchange fees | 18,914 | | | 12,702 | | | 11,562 | |
| Secondary market mortgage income | 2,866 | | | 4,303 | | | 8,823 | |
| Bank owned life insurance income | 3,319 | | | 2,101 | | | 1,955 | |
| BOLI death proceeds | — | | | 1,630 | | | — | |
| Gain (loss) on sale of premises | 35 | | | (116) | | | (264) | |
| Securities (loss) gain | (9,716) | | | (82) | | | 143 | |
| Gain (loss) on sale of other real estate | 6 | | | 214 | | | (300) | |
| Government awards/grants | 6,197 | | | 873 | | | 1,826 | |
| Bargain purchase gain | — | | | 281 | | | 1,300 | |
| Other | 7,732 | | | 4,554 | | | 3,656 | |
| Total non-interest income | 46,705 | | | 36,961 | | | 37,473 | |
| | | | | |
| NON-INTEREST EXPENSE | | | | | |
| Salaries | 76,609 | | | 57,903 | | | 53,371 | |
| Employee benefits | 16,803 | | | 15,174 | | | 12,485 | |
| Occupancy | 17,381 | | | 12,854 | | | 12,713 | |
| Furniture and equipment | 3,987 | | | 2,981 | | | 2,848 | |
| Supplies and printing | 1,240 | | | 967 | | | 903 | |
| Professional and consulting fees | 6,446 | | | 3,558 | | | 4,035 | |
| Marketing and public relations | 833 | | | 393 | | | 615 | |
| FDIC and OCC assessments | 3,849 | | | 2,122 | | | 2,074 | |
| ATM expense | 5,821 | | | 3,873 | | | 3,623 | |
| Bank communications | 3,579 | | | 1,904 | | | 1,754 | |
| Data processing | 2,771 | | | 2,211 | | | 1,578 | |
| Acquisition expense/charter conversion | 9,075 | | | 6,410 | | | 1,607 | |
| Other | 36,332 | | | 20,133 | | | 16,953 | |
| Total non-interest expense | 184,726 | | | 130,483 | | | 114,559 | |
| | | | | |
| | | | | |
THE FIRST BANCSHARES, INC.
CONSOLIDATED STATEMENTS OF INCOME
YEARS ENDED DECEMBER 31,
2021, 2020,2023, 2022, AND
2019
| | | | | | | | | |
Continued: | | 2021 | | 2020 | | 2019 |
Total non-interest expense | | | 114,559 | | | 106,341 | | | 88,569 |
Income before income taxes | | $ | 81,082 | | $ | 63,068 | | $ | 56,446 |
Income taxes | | | 16,915 | | | 10,563 | | | 12,701 |
| | | | | | | | | |
Net income available to common stockholders | | $ | 64,167 | | $ | 52,505 | | $ | 43,745 |
| | | | | | | | | |
Earnings per share: | | | | | | | | | |
Basic | | $ | 3.05 | | $ | 2.53 | | $ | 2.57 |
Diluted | | | 3.03 | | | 2.52 | | | 2.55 |
2021
($ in thousands, except per share amount)
| | | | | | | | | | | | | | | | | |
| Continued: | | | | | |
| 2023 | | 2022 | | 2021 |
| Income before income taxes | $ | 96,804 | | | $ | 78,689 | | | $ | 81,082 | |
| Income taxes | 21,347 | | | 15,770 | | | 16,915 | |
| | | | | |
| Net income available to common stockholders | $ | 75,457 | | | $ | 62,919 | | | $ | 64,167 | |
| | | | | |
| Earnings per share: | | | | | |
| Basic | $ | 2.41 | | | $ | 2.86 | | | $ | 3.05 | |
| Diluted | 2.39 | | | 2.84 | | | 3.03 | |
The accompanying notes are an integral part of these statements.
THE FIRST BANCSHARES, INC.
CONSOLIDATED STATEMENTS OF COMPREHENSIVE INCOME
(LOSS)
YEARS ENDED DECEMBER 31,
2021, 2020,2023, 2022, AND
2019
| | | | | | | | | |
($ in thousands) | | 2021 | | 2020 | | 2019 |
| | | | | | | | | |
Net income | | $ | 64,167 | | $ | 52,505 | | $ | 43,745 |
Other comprehensive income: | | | | | | | | | |
Unrealized holding gain/(loss) arising during the period on available-for-sale securities | | | (23,738) | | | 21,345 | | | 16,084 |
Reclassification adjustment for (gains) included in net income | | | (143) | | | (281) | | | (122) |
Unrealized holding gain/(loss) arising during the period on available-for-sale securities | | | (23,881) | | | 21,064 | | | 15,962 |
Income tax benefit (expense) | | | 6,043 | | | (5,337) | | | (4,077) |
Other comprehensive income (loss) | | | (17,838) | | | 15,727 | | | 11,885 |
Comprehensive income | | $ | 46,329 | | $ | 68,232 | | $ | 55,630 |
2021
| | | | | | | | | | | | | | | | | |
| ($ in thousands) | 2023 | | 2022 | | 2021 |
| | | | | |
| Net income | $ | 75,457 | | | $ | 62,919 | | | $ | 64,167 | |
| Other comprehensive income (loss): | | | | | |
| Unrealized holding gain/(loss) arising during the period on available-for-sale securities | 31,921 | | | (173,428) | | | (23,738) | |
| Net unrealized loss at time of transfer on securities available-for-sale transferred to held-to-maturity | — | | | (36,838) | | | — | |
| Reclassification adjustment for (accretion) amortization of unrealized holdings gain/(loss) included in accumulated other comprehensive income from the transfer of securities available-for-sale to held-to-maturity | 372 | | | 97 | | | — | |
| Reclassification adjustment for loss/(gains) included in net income | 9,716 | | | 82 | | | (143) | |
| Unrealized holding gain/(loss) arising during the period on available-for-sale securities | 42,009 | | | (210,087) | | | (23,881) | |
| Income tax (expense) benefit | (10,628) | | | 53,152 | | | 6,043 | |
| Other comprehensive income (loss) | 31,381 | | | (156,935) | | | (17,838) | |
| Comprehensive income (loss) | $ | 106,838 | | | $ | (94,016) | | | $ | 46,329 | |
The accompanying notes are an integral part of these statements.
THE FIRST BANCSHARES, INC.
CONSOLIDATED STATEMENTS OF CHANGES IN STOCKHOLDERS’ EQUITY
YEARS ENDED DECEMBER 31,
2019, 20202021, 2022 AND
20212023
($ in thousands except per share amount)
| | | | | | | | | | | | | | | | | | | | | | | | |
| | | | | | | | | | | | | | Accumulated | | | | | | | | |
| | | | | | | | | | | | | | Other | | | | | | | | | |
| | | | | | | | Additional | | | | | Comprehensive | | | | | | | | | |
| | Common Stock | | Paid-in | | Retained | | Income | | Treasury Stock | | | |
| | Shares | | Amount | | Capital | | Earnings | | (Loss) | | Shares | | Amount | | Total |
Balance, January 1, 2019 | | | 14,857,092 | | $ | 14,857 | | $ | 278,659 | | $ | 71,998 | | $ | (1,796) | | | (26,494) | | $ | (464) | | $ | 363,254 |
Net income, 2019 | | | — | | | — | | | — | | | 43,745 | | | — | | | — | | | — | | | 43,745 |
Common stock repurchased | | | — | | | — | | | — | | | — | | | — | | | (168,188) | | | (5,229) | | | (5,229) |
Other comprehensive income | | | — | | | — | | | — | | | — | | | 11,885 | | | — | | | — | | | 11,885 |
Dividend on common stock, $.31 per common share | | | — | | | — | | | — | | | (5,283) | | | — | | | — | | | — | | | (5,283) |
Issuance of shares for FPB acquisition | | | 2,377,501 | | | 2,378 | | | 75,842 | | | — | | | — | | | — | | | — | | | 78,220 |
Issuance of shares for FFB acquisition | | | 1,682,889 | | | 1,683 | | | 53,785 | | | — | | | — | | | — | | | — | | | 55,468 |
Issuance restricted stock grant | | | 89,315 | | | 89 | | | (89) | | | — | | | — | | | — | | | — | | | — |
Restricted stock grant forfeited | | | (7,931) | | | (8) | | | 8 | | | — | | | — | | | — | | | — | | | — |
Compensation expense | | | — | | | — | | | 1,661 | | | — | | | — | | | — | | | — | | | 1,661 |
Repurchase of restricted stock for payment of taxes | | | (1,918) | | | (2) | | | (61) | | | — | | | — | | | — | | | — | | | (63) |
Balance, December 31, 2019 | | | 18,996,948 | | $ | 18,997 | | $ | 409,805 | | $ | 110,460 | | $ | 10,089 | | | (194,682) | | $ | (5,693) | | $ | 543,658 |
| | | | | | | | | | | | | | | | | | | | | | | | | | | | | | | | | | | | | | | | | | | | | | | |
| Common Stock | | Additional
Paid-in
Capital | | Retained
Earnings | | Accumulated
Other
Comprehensive
Income
(Loss) | | Treasury Stock | | Total |
| Shares | | Amount | | | | | Shares | | Amount | |
| Balance, January 1, 2021 | 21,598,993 | | $ | 21,599 | | $ | 456,919 | | $ | 154,241 | | $ | 25,816 | | | (483,984) | | | $ | (13,760) | | | $ | 644,815 |
| Net income, 2021 | — | | — | | — | | 64,167 | | — | | | | | | 64,167 |
| Common stock repurchased | — | | — | | — | | — | | — | | (165,623) | | | (5,171) | | | (5,171) | |
| Other comprehensive loss | — | | — | | — | | — | | (17,838) | | — | | — | | (17,838) |
| Dividend on common stock, $.58 per common share | — | | — | | — | | (12,180) | | | — | | — | | — | | (12,180) | |
| Issuance restricted stock grant | 93,578 | | 94 | | (94) | | | — | | — | | — | | — | | — |
| Restricted stock grant forfeited | (2,021) | | | (2) | | | 2 | | — | | — | | — | | — | | — |
| Compensation expense | — | | — | | 3,100 | | — | | — | | — | | — | | 3,100 |
| Repurchase of restricted stock for payment of taxes | (21,906) | | | (22) | | | (699) | | | — | | — | | — | | — | | (721) | |
| Balance, December 31, 2021 | 21,668,644 | | $ | 21,669 | | $ | 459,228 | | $ | 206,228 | | $ | 7,978 | | (649,607) | | | $ | (18,931) | | | $ | 676,172 |
| | | | | | | | | | | | | | | |
| Net income, 2022 | — | | | — | | | — | | | 62,919 | | | — | | | — | | | — | | | 62,919 | |
| Common stock repurchased | — | | | — | | | — | | | — | | | — | | | (600,000) | | | (22,180) | | | (22,180) | |
| Other comprehensive loss | — | | | — | | | — | | | — | | | (156,935) | | | — | | | — | | | (156,935) | |
| Dividend on common stock, $.74 per common share | — | | | — | | | — | | | (16,524) | | | — | | | — | | | — | | | (16,524) | |
| Issuance of common shares for BBI acquisition | 3,498,936 | | | 3,499 | | | 97,970 | | | — | | | — | | | — | | | — | | | 101,469 | |
| Issuance restricted stock grant | 129,950 | | | 130 | | | (130) | | | — | | | — | | | — | | | — | | | — | |
| Restricted stock grant forfeited | (2,500) | | | (3) | | | 3 | | | — | | | — | | | — | | | — | | | — | |
| Compensation expense | — | | | — | | | 2,425 | | | — | | | — | | | — | | | — | | | 2,425 | |
| Repurchase of restricted stock for payment of taxes | (19,661) | | | (20) | | | (663) | | | — | | | — | | | — | | | — | | | (683) | |
| Balance, December 31, 2022 | 25,275,369 | | | $ | 25,275 | | | $ | 558,833 | | | $ | 252,623 | | | $ | (148,957) | | | (1,249,607) | | | $ | (41,111) | | | $ | 646,663 | |
| | | | | | | | | | | | | | | |
| Net income, 2023 | — | | — | | — | | 75,457 | | — | | — | | — | | 75,457 |
| Other comprehensive income | — | | — | | — | | — | | 31,381 | | | — | | — | | 31,381 | |
| Dividend on common stock, $.90 per common share | — | | — | | — | | (27,930) | | | — | | — | | — | | (27,930) | |
| Issuance of common shares for HSBI acquisition | 6,920,422 | | 6,920 | | 214,602 | | | — | | — | | — | | — | | 221,522 |
| Issuance restricted stock grant | 167,173 | | 167 | | (167) | | | — | | — | | — | | — | | — |
| Restricted stock grant forfeited | (12,194) | | | (12) | | | 12 | | — | | — | | — | | — | | — |
| Compensation expense | — | | — | | 2,302 | | — | | — | | — | | — | | 2,302 |
| Repurchase of restricted stock for payment of taxes | (11,787) | | | (11) | | | (350) | | | — | | — | | — | | — | | (361) | |
| Balance, December 31, 2023 | 32,338,983 | | $ | 32,339 | | $ | 775,232 | | $ | 300,150 | | $ | (117,576) | | (1,249,607) | | | $ | (41,111) | | | $ | 949,034 |
THE FIRST BANCSHARES, INC.
CONSOLIDATED STATEMENTS OF CHANGES IN STOCKHOLDERS’ EQUITY
YEARS ENDED DECEMBER 31, 2019, 2020 AND 2021
($ In Thousands except per share amount)
| | | | | | | | | | | | | | | | | | | | | | | | |
| | | | | | | | | | | | | | Accumulated | | | | | | | | | |
| | | | | | | | Additional | | | | | Other | | | | | | | | | |
| | Common Stock | | Paid-in | | Retained | | Comprehensive | | Treasury Stock | | | |
| | Shares | | Amount | | Capital | | Earnings | | Income (Loss) | | Shares | | Amount | | Total |
Net income, 2020 | | | — | | | — | | | — | | | 52,505 | | | — | | | | | | | | | 52,505 |
Common stock repurchased | | | — | | | — | | | — | | | — | | | — | | | (289,302) | | | (8,067) | | | (8,067) |
Other comprehensive income | | | — | | | — | | | — | | | — | | | 15,727 | | | — | | | — | | | 15,727 |
Dividend on common stock, $.42 per common share | | | — | | | — | | | — | | | (8,724) | | | — | | | — | | | — | | | (8,724) |
Issuance of shares for SWG acquisition | | | 2,546,967 | | | 2,547 | | | 45,311 | | | — | | | — | | | — | | | — | | | 47,858 |
Issuance restricted stock grant | | | 78,189 | | | 78 | | | (78) | | | — | | | — | | | — | | | — | | | — |
Restricted stock grant forfeited | | | (7,421) | | | (7) | | | 7 | | | — | | | — | | | — | | | — | | | — |
Compensation expense | | | — | | | — | | | 2,352 | | | — | | | — | | | — | | | — | | | 2,352 |
Repurchase of restricted stock for payment of taxes | | | (15,690) | | | (16) | | | (478) | | | — | | | — | | | — | | | — | | | (494) |
Balance, December 31, 2020 | | | 21,598,993 | | $ | 21,599 | | $ | 456,919 | | $ | 154,241 | | $ | 25,816 | | | (483,984) | | $ | (13,760) | | $ | 644,815 |
THE FIRST BANCSHARES, INC.
CONSOLIDATED STATEMENTS OF CHANGES IN STOCKHOLDERS’ EQUITY
YEARS ENDED DECEMBER 31, 2019, 2020 AND 2021
($ In Thousands except per share amount)
| | | | | | | | | | | | | | | | | | | | | | | | |
| | | | | | | | | | | | | | Accumulated | | | | | | | | |
| | | | | | | | | | | | | | Other | | | | | | | | |
| | | | | | | | Additional | | | | | Comprehensive | | | | | | | | |
| | Common Stock | | Paid-in | | Retained | | Income | | Treasury Stock | | | |
| | Shares | | Amount | | Capital | | Earnings | | (Loss) | | Shares | | Amount | | Total |
Net income, 2021 | | | — | | | — | | | — | | | 64,167 | | | — | | | — | | | — | | | 64,167 |
Common stock repurchased | | | — | | | — | | | — | | | — | | | — | | | (165,623) | | | (5,171) | | | (5,171) |
Other comprehensive loss | | | — | | | — | | | — | | | — | | | (17,838) | | | — | | | — | | | (17,838) |
Dividend on common stock, $.58 per common share | | | — | | | — | | | — | | | (12,180) | | | — | | | — | | | — | | | (12,180) |
Issuance restricted stock grant | | | 93,578 | | | 94 | | | (94) | | | — | | | — | | | — | | | — | | | — |
Restricted stock grant forfeited | | | (2,021) | | | (2) | | | 2 | | | — | | | — | | | — | | | — | | | — |
Compensation expense | | | — | | | — | | | 3,100 | | | — | | | — | | | — | | | — | | | 3,100 |
Repurchase of restricted stock for payment of taxes | | | (21,906) | | | (22) | | | (699) | | | — | | | — | | | — | | | — | | | (721) |
Balance, December 31, 2021 | | | 21,668,644 | | $ | 21,669 | | $ | 459,228 | | $ | 206,228 | | $ | 7,978 | | | (649,607) | | $ | (18,931) | | $ | 676,172 |
| | | | | | | | | | | | | | | | | | | | | | | | |
See Notes to Consolidated Financial Statements
THE FIRST BANCSHARES, INC.
CONSOLIDATED STATEMENTS OF CASH FLOWS
YEARS ENDED DECEMBER 31,
2021, 20202023, 2022 AND
20192021
| | | | | | | | | | | | | | | | | |
| ($ in thousands) | 2023 | | 2022 | | 2021 |
| CASH FLOWS FROM OPERATING ACTIVITIES | | | | | |
| Net income | $ | 75,457 | | | $ | 62,919 | | | $ | 64,167 | |
| Adjustments to reconcile net income to net cash provided by operating activities: | | | | | |
| Depreciation and amortization | 12,099 | | | 12,173 | | | 13,792 | |
| FHLB stock dividends | (355) | | | (28) | | | (27) | |
| Provision for credit losses | 14,500 | | | 5,605 | | | (1,104) | |
| Deferred income taxes | 7,006 | | | 940 | | | 1,739 | |
| Restricted stock expense | 2,302 | | | 2,425 | | | 3,100 | |
| Increase in cash value of life insurance | (3,319) | | | (2,101) | | | (1,955) | |
| Amortization and accretion, net, related to acquisitions | (4,432) | | | 1,706 | | | (30) | |
| Bank premises and equipment loss/(gain) | (35) | | | 116 | | | 264 | |
| Acquisition gain | — | | | (281) | | | (1,300) | |
| Securities loss (gain) | 9,716 | | | 82 | | | (143) | |
| Loss on sale/writedown of other real estate | 774 | | | 159 | | | 815 | |
| Residential loans originated and held for sale | (91,786) | | | (152,776) | | | (230,456) | |
| Proceeds from sale of residential loans held for sale | 93,315 | | | 156,011 | | | 244,210 | |
| Changes in: | | | | | |
| Interest receivable | (1,228) | | | (2,987) | | | 3,218 | |
| Other assets | 16,086 | | | (45,692) | | | (1,056) | |
| Interest payable | 19,378 | | | 1,613 | | | (463) | |
| Operating lease liability | (1,260) | | | (1,306) | | | (1,839) | |
| Other liabilities | (39,710) | | | 51,449 | | | 2,783 | |
| Net cash provided by operating activities | 108,508 | | | 90,027 | | | 95,715 | |
| | | | | |
| CASH FLOWS FROM INVESTING ACTIVITIES | | | | | |
| Available-for-sale securities: | | | | | |
| Sales | 285,793 | | | 21,069 | | | — | |
| Maturities, prepayments, and calls | 132,919 | | | 197,417 | | | 229,091 | |
| Purchases | (8,473) | | | (6,500) | | | (988,536) | |
| Held-to-maturity securities: | | | | | |
| Maturities, prepayments, and calls | 40,469 | | | 474 | | | — | |
| Purchases | — | | | (602,718) | | | — | |
| Purchases of other securities | (17,094) | | | (11,444) | | | — | |
| Proceeds from redemption of other securities | 14,466 | | | 1,237 | | | 5,276 | |
| Net (increase)/decrease in loans | (227,896) | | | (326,113) | | | 202,194 | |
| Net changes to premises and equipment | (3,688) | | | (15,522) | | | (7,125) | |
| Bank-owned life insurance - death proceeds | 221 | | | 1,630 | | | — | |
| Purchase of bank owned life insurance | — | | | — | | | (11,733) | |
| Proceeds from sale of other real estate owned | 3,069 | | | 8,930 | | | 4,562 | |
| Proceeds from sale of land | 1,416 | | | 712 | | | — | |
| Cash received in excess of cash paid for acquisition | 106,793 | | | 23,939 | | | 358,916 | |
| Net cash provided by (used in) investing activities | 327,995 | | | (706,889) | | | (207,355) | |
| | | | | | | | | |
($ in thousands) | | 2021 | | 2020 | | 2019 |
CASH FLOWS FROM OPERATING ACTIVITIES | | | | | | | | | |
Net income | | $ | 64,167 | | $ | 52,505 | | $ | 43,745 |
Adjustments to reconcile net income to net cash provided by operating activities: | | | | | | | | | |
Depreciation and amortization | | | 13,792 | | | 12,354 | | | 5,314 |
FHLB Stock dividends | | | (27) | | | (133) | | | (171) |
Provision for credit losses | | | (1,104) | | | 25,151 | | | 3,738 |
Deferred income taxes | | | 1,739 | | | (3,015) | | | 912 |
Restricted stock expense | | | 3,100 | | | 2,352 | | | 1,661 |
Increase in cash value of life insurance | | | (1,955) | | | (1,514) | | | (1,414) |
Amortization and accretion, net, related to acquisitions | | | (30) | | | (3,945) | | | (1,791) |
Bank premises and equipment loss/(gain) | | | 264 | | | (443) | | | (13) |
Acquisition gain | | | (1,300) | | | (7,835) | | | — |
Securities gains | | | (143) | | | (281) | | | (122) |
Loss on sale/writedown of other real estate | | | 815 | | | 1,352 | | | 680 |
Residential loans originated and held for sale | | | (230,456) | | | (318,969) | | | (186,132) |
Proceeds from sale of residential loans held for sale | | | 244,210 | | | 308,347 | | | 180,120 |
Changes in: | | | | | | | | | |
Interest receivable | | | 3,218 | | | (9,185) | | | (1,203) |
Other assets | | | (1,056) | | | (5,313) | | | 1,157 |
Interest payable | | | (463) | | | (374) | | | 914 |
Operating lease liability | | | (1,839) | | | (1,545) | | | (898) |
Other liabilities | | | 2,783 | | | 1,676 | | | (1,797) |
Net cash provided by operating activities | | | 95,715 | | | 51,185 | | | 44,700 |
| | | | | | | | | |
CASH FLOWS FROM INVESTING ACTIVITIES | | | | | | | | | |
Purchases of available-for-sale securities | | | (988,536) | | | (356,755) | | | (180,502) |
Purchases of other securities | | | — | | | (3,056) | | | (11,085) |
Proceeds from maturities and calls of available-for-sale securities | | | 229,091 | | | 203,670 | | | 109,189 |
Proceeds from sales of securities available-for-sale | | | — | | | 579 | | | 32,976 |
Proceeds from redemption of other securities | | | 5,276 | | | 3,407 | | | 2,712 |
Decrease/(increase) in loans | | | 202,194 | | | (131,589) | | | (44,102) |
Net additions to premises and equipment | | | (7,125) | | | (4,398) | | | (7,892) |
Purchase of bank owned life insurance | | | (11,733) | | | (5,683) | | | — |
Proceeds from sale of other real estate owned | | | 4,562 | | | 4,036 | | | 5,097 |
Proceeds from sale of land | | | — | | | 1,416 | | | — |
Proceeds from sale of other assets | | | — | | | — | | | 65 |
Cash received in excess of cash paid for acquisition | | | 358,916 | | | 29,245 | | | 30,860 |
Net cash used in investing activities | | | (207,355) | | | (259,128) | | | (62,682) |
THE FIRST BANCSHARES, INC.
CONSOLIDATED STATEMENTS OF CASH FLOWS
YEARS ENDED DECEMBER 31, 2023, 2022 AND 2021
| | | | | | | | | | | | | | | | | |
| Continued: | | | | | |
| 2023 | | 2022 | | 2021 |
| CASH FLOWS FROM FINANCING ACTIVITIES | | | | | |
| Increase/(decrease) in deposits | (427,481) | | (223,322) | | 601,575 | |
| Proceeds from borrowed funds | 7,600,043 | | 2,055,401 | | — |
| Repayment of borrowed funds | (7,340,143) | | (1,950,301) | | (114,647) |
| Dividends paid on common stock | (27,550) | | | (16,275) | | | (11,991) | |
| Cash paid to repurchase common stock | — | | (22,180) | | | (5,171) | |
| Repurchase of restricted stock for payment of taxes | (361) | | | (683) | | | (721) | |
| Principal payment on finance lease liabilities | (179) | | | (176) | | | (187) |
| Payment on subordinated debt issuance costs | — | | — | | (59) |
| Called/repayment of subordinated debt | (31,000) | | — | | — |
| Net cash (used in) provided by financing activities | (226,671) | | (157,536) | | 468,799 |
| | | | | |
| Net change in cash and cash equivalents | 209,832 | | (774,398) | | 357,159 |
| Cash and cash equivalents at beginning of year | 145,315 | | 919,713 | | 562,554 |
| Cash and cash equivalents at end of year | $ | 355,147 | | $ | 145,315 | | $ | 919,713 |
| | | | | |
| Supplemental disclosures: | | | | | |
| | | | | |
| Cash paid during the year for: | | | | | |
| Interest | $ | 51,101 | | $ | 16,932 | | $ | 16,368 |
| Income taxes, net of refunds | 16,084 | | 7,194 | | 15,717 |
| | | | | |
| Non-cash activities: | | | | | |
| Transfers of loans to other real estate | 6,602 | | 2,560 | | 2,143 |
| Transfer of securities available-for-sale to held-to-maturity | — | | 139,598 | | — |
| Issuance of restricted stock grants | 168 | | 130 | | 94 |
| Stock issued in connection with BBI acquisition | — | | 101,469 | | — |
| Stock issued in connection with HSBI acquisition | 221,522 | | — | | — |
| Dividends on restricted stock grants | 380 | | 249 | | 189 |
| Right-of-use assets obtained in exchange for operating lease liabilities | 817 | | 2,698 | | 168 |
| Lease liabilities arising from BBI acquisition | — | | 3,390 | | — |
| Lease liabilities arising from HSBI acquisition | 184 | | — | | — |
The accompanying notes are an integral part of these statements.
THE FIRST BANCSHARES, INC.
CONSOLIDATED STATEMENTS OF CASH FLOWS
YEARS ENDED DECEMBER 31, 2021, 2020 AND 2019
| | | | | | | | | |
Continued: | | | | | | | | | |
| | 2021 | | 2020 | | 2019 |
CASH FLOWS FROM FINANCING ACTIVITIES | | | | | | | | | |
Increase/(decrease) in deposits | | | 601,575 | | | 664,413 | | | (67,821) |
Proceeds from borrowed funds | | | 0 | | | 212,000 | | | 364,715 |
Repayment of borrowed funds | | | (114,647) | | | (321,172) | | | (258,673) |
Dividends paid on common stock | | | (11,991) | | | (8,589) | | | (5,190) |
Cash paid to repurchase common stock | | | (5,171) | | | (8,067) | | | (5,229) |
Repurchase of restricted stock for payment of taxes | | | (721) | | | (494) | | | (63) |
Principal payment on finance lease liabilities | | | (187) | | | (183) | | | 0 |
Issuance of subordinated debt, net | | | 0 | | | 63,725 | | | 0 |
Payment on subordinated debt issuance costs | | | (59) | | | 0 | | | 0 |
Net cash provided by financing activities | | | 468,799 | | | 601,633 | | | 27,739 |
| | | | | | | | | |
Net increase in cash and cash equivalents | | | 357,159 | | | 393,690 | | | 9,757 |
Cash and cash equivalents at beginning of year | | | 562,554 | | | 168,864 | | | 159,107 |
Cash and cash equivalents at end of year | | $ | 919,713 | | $ | 562,554 | | $ | 168,864 |
| | | | | | | | | |
Supplemental disclosures: | | | | | | | | | |
| | | | | | | | | |
Cash paid during the year for: | | | | | | | | | |
Interest | | $ | 16,368 | | $ | 22,476 | | $ | 20,673 |
Income taxes, net of refunds | | | 15,717 | | | 13,971 | | | 11,102 |
| | | | | | | | | |
Non-cash activities: | | | | | | | | | |
Transfers of loans to other real estate | | | 2,143 | | | 3,595 | | | 1,706 |
Issuance of restricted stock grants | | | 94 | | | 78 | | | 89 |
Stock issued in connection with FPB acquisition | | | 0 | | | 0 | | | 78,220 |
Stock issued in connection with FFB acquisition | | | 0 | | | 0 | | | 55,468 |
Stock issued in connection with SWG acquisition | | | 0 | | | 47,858 | | | 0 |
Dividends on restricted stock grants | | | 189 | | | 135 | | | 93 |
Right-of-use assets obtained in exchange for operating lease liabilities | | | 168 | | | 3,162 | | | 6,717 |
The accompanying notes are an integral part of these statements.
THE FIRST BANCSHARES, INC.
NOTES TO CONSOLIDATED FINANCIAL STATEMENTS
NOTE A - NATURE OF BUSINESS
The First Bancshares, Inc. (the “Company”) is a bank holding company whose business is primarily conducted by its wholly-owned subsidiary, The First Bank (the “Bank”), formerly known as The First, A National Banking Association. The Bank provides a full range of banking services in its primary market area of Mississippi, Louisiana, Alabama, Florida, and Georgia. The Company is regulated by the Federal Reserve Bank. Its subsidiary bank is currently subject to the regulation of the Federal Reserve Bank and the Mississippi Department of Banking and Consumer Finance, and was previously subject to the regulation of the
Office of the Comptroller of the Currency (OCC).OCC.
On January 15, 2022, the Bank, then named The First, A National Banking Association, converted from a national banking association to a Mississippi state-chartered bank and changed its name to The First Bank. The First Bank is a member of the Federal Reserve System through the Federal Reserve Bank of Atlanta. The charter conversion and name change are expected to have only a minimal impact on the Bank’s clients, and deposits will continue to be insured by the Federal Deposit Insurance Corporation up to the applicable limits.
The principal products produced, and services rendered by the Company and are as follows:
Commercial Banking - The Company provides a full range of commercial banking services to corporations and other business customers. Loans are provided for a variety of general corporate purposes, including financing for commercial and industrial projects, income producing commercial real estate, owner-occupied real estate and construction and land development. The Company also provides deposit services, including checking, savings and money market accounts and certificate of deposit as well as treasury management services.
Consumer Banking - The Company provides banking services to consumers, including checking, savings, and money market accounts as well as certificate of deposit and individual retirement accounts. In addition, the Company provides consumers with installment and real estate loans and lines of credit.
Mortgage Banking - The Company provides residential mortgage banking services, including construction financing, for conventional and government insured home loans to be sold in the secondary market.
NOTE B - SUMMARY OF SIGNIFICANT ACCOUNTING POLICIES
The Company and the Bank follow accounting principles generally accepted in the United States of America including, where applicable, general practices within the banking industry.
Principles of Consolidation
The consolidated financial statements include the accounts of the Company and the Bank. All significant intercompany accounts and transactions have been eliminated in consolidation.
The preparation of financial statements in conformity with accounting principles generally accepted in the United States of America requires management to make estimates and assumptions that affect the reported amounts of assets and liabilities and disclosure of contingent assets and liabilities at the date of the financial statements and the reported amounts of revenues and expenses during the reporting period. Actual results could differ from those estimates. Material estimates that are particularly susceptible to significant change in the near term relate to the determination of the allowance for credit losses, acquisition accounting, intangible assets, deferred tax assets, and fair value of financial instruments. It is reasonably possible the Company’s estimate of the allowance for credit losses and determination of impairment of goodwill or intangible assets could change as a result of the continued impact of the COVID-19 pandemic on the economy. The resulting change in these estimates could be material to the Company’s consolidated financial statements.
Investments in debt securities are accounted for as follows:
Available-for-Sale Securities
Debt securities classified as available-for-sale ("AFS") are those securities that are intended to be held for an indefinite period of time, but not necessarily to maturity. Any decision to sell a security classified as available-for-sale would be based on various factors, including movements in interest rates, liquidity needs, security risk assessments, changes in the mix of assets and liabilities and other similar factors. These securities are carried at their estimated fair value, and the net unrealized gain or loss is reported net of tax, as component of accumulated other comprehensive income (loss), net of tax, in stockholders’ equity, until realized. Premiums and discounts are recognized in interest income using the interest method. The Company evaluates all securities quarterly to determine if any securities in a loss position require a provision for credit losses in accordance with ASC 326, Measurement of Credit Losses on Financial Instruments. Gains and losses on the sale of available-for-sale securities are determined using the adjusted cost of the specific security sold. AFS securities are placed on nonaccrual status at the time any principal to interest payments become 90 days delinquent or if full collection of interest or principal becomes uncertain. Accrued interest for a security placed on nonaccrual is reversed against interest income. There was no accrued interest related to AFS securities reversed against interest income for the years ended December 31, 2023, 2022, and 2021.
Allowance for Credit Losses – Available-for-Sale Securities
On January 1, 2021, the Company adopted Accounting Standards Update (“ASU”) 2016-13, Financial Instruments - Credit Losses (“ASC 326”), which introduces guidance on reporting credit losses for assets held at amortized cost basis and available for sale debt securities (“AFS”).
For AFS debt securities in an unrealized loss position, the Company first assesses whether it intends to sell or is more likely than not that the Company will be required to sell the security before recovery of its amortized cost basis. If either of the criteria regarding intent or requirement to sell is met, the security’s amortized cost basis is written down to fair value through income. For securities that do not meet these criteria, the Company evaluates whether the decline in fair value has resulted from credit losses or other factors. In making this assessment, the Company considers the extent to which fair value is less than amortized cost, any changes to the rating of the security by a rating agency, and adverse conditions specifically related to the security, among other factors. If this assessment indicates that a credit loss exists, the present value of cash flows expected to be collected from the security are compared to the amortized cost basis of the security. If the present value of cash flows expected to be collected is less than the amortized cost basis, a credit loss exists and an allowance for credit losses is recorded for the credit loss, limited by the amount that the fair value is less than the amortized cost basis. Any impairment that has not been recorded through an allowance for credit losses is recognized in other comprehensive income. Changes in the allowance for credit losses are recorded as provision for (or reversal of) credit loss expense. Losses are charged against the allowance when management believes the uncollectability of a security is confirmed or when either of the criteria regarding intent or requirement to sell is met.
Accrued interest receivable is excluded from the estimate of credit losses for securities AFS.
Securities to be Held-to-Maturity
Debt securities classified as held-to-maturity
("HTM") are those securities for which there is a positive intent and ability to hold to maturity. These securities are carried at cost adjusted for amortization of premiums and accretion of discounts, computed by the interest method.
Gain and losses on the sales are determined using the adjusted cost of the specific security sold. HTM securities are placed on nonaccrual status at the time any principal to interest payments become 90 days delinquent or if full collection of interest or principal becomes uncertain. Accrued interest for a security placed on nonaccrual is reversed against interest income. There
werewas no
held-to-maturityaccrued interest related to HTM securities
atreversed against interest income for the years ended December 31,
20212023, 2022, and
2020.2021.
Allowance for Credit Losses – Held-to-Maturity Securities
Management measures expected credit losses on HTM debt securities on a pooled basis. That is, for pools of such securities with common risk characteristics, the historical lifetime probability of default and severity of loss in the event of default is derived or obtained from external sources and adjusted for the expected effects of reasonable and supportable forecasts over the expected lives of the securities.
Expected credit losses on each security in the HTM portfolio that does not share common risk characteristics with any of the identified pools of debt securities are individually measured based on net realizable value, of the difference between the discounted value of the expected future cash flows, based on the original effective interest rate, and the recorded amortized cost basis of the security.
Loss forecasts for HTM debt securities utilize Moody's municipal and corporate database, based on a scenario-conditioned probability of default and loss rate platform. The core of the stressed default probabilities and loss rates is based on the methodological relationship between key macroeconomic risk factors and historical defaults over nearly 50 years. Loss forecasts for structured HTM securities utilize VeriBanc's Estimated CAMELS Rating and the Modified Texas Ratio for each piece of underlying collateral and are applied to Intex models for the underlying assets cashflow resulting in collateral cashflow forecasts. These securities are assumed not to share similar risk characteristics due to the heterogeneous nature of the underlying collateral. As a result of this evaluation, management determined that the expected credit losses associated with these securities is not significant for financial reporting purposes and therefore, no allowance for credit losses has been recognized during the years ended December 31, 2023 and 2022.
Accrued interest receivable is excluded from the estimate of credit losses for securities HTM.
Trading Account Securities
Trading account securities are those securities which are held for the purpose of selling them at a profit. There were
0no trading account securities at December 31,
20212023 and
2020.2022.
Equity securities are carried at fair value, with changes in fair value reported in net income. Equity securities without readily determinable fair values are carried at cost, minus impairment, if any, plus or minus changes resulting from observable price changes in orderly transactions for the identical or a similar investment. There were 0no equity securities at December 31, 20212023 and 2020.2022.
Other securities are carried at cost and are restricted in marketability. Other securities consist of investments in the FHLB, Federal Reserve Bank and First National Bankers’ Bankshares, Inc. Management reviews for impairment based on the ultimate recoverability of the cost basis.
Shares of FHLB, Federal Reserve Bank and First National Bankers’ Bankshares, Inc. common stock are equity securities that do not have a readily determinable fair value because their ownership is restricted and lacks marketability. The common stock is carried at cost and evaluated for impairment. The Company’s investment in member bank stock is included in other securities in the accompanying consolidated balance sheets. Management reviews for impairment based on the ultimate recoverability of the cost basis.
NaN other-than-temporaryNo impairment was noted for the years ended December 31,
2021, 20202023, 2022 and
2019.2021.
Interest income includes amortization of purchase premiums or discounts. Premiums and discounts on securities are amortized on the level-yield method without anticipating prepayments, except for mortgage backed securities where prepayments are anticipated. Gains and losses on sales are recorded on the trade date and determined using the specific identification method.
A debt security is placed on nonaccrual status at the time any principal or interest payments become
ninety90 days past due. Interest accrued but not received for a security placed in nonaccrual is reversed against interest income.
Loans
heldHeld for
saleSale (LHFS)
The Bank originates fixed rate single family, residential first mortgage loans on a presold basis. The Bank issues a rate lock commitment to a customer and concurrently “locks in” with a secondary market investor under a best efforts delivery mechanism. Such loans are sold without the mortgage servicing rights being retained by the Bank. The terms of the loan are dictated by the secondary investors and are transferred within several weeks of the Bank initially funding the loan. The Bank recognizes certain origination fees and service release fees upon the sale, which are included in other income on loans in the consolidated statements of income. Between the initial funding of the loans by the Bank and the subsequent purchase by the investor, the Bank carries the loans held for sale at
the lower of cost or fair value in the aggregate as determined by the outstanding commitments from investors.
Loans Held for Investment (LHFI)
LHFI that management has the intent and ability to hold for the foreseeable future or until maturity or payoff are carried at the principal amount outstanding, net of the allowance for credit losses, unearned income, any unamortized deferred fees or costs on originated loans and unamortized premiums or discounts on purchased loans. Interest income on loans is recognized based on the principal balance outstanding and the stated rate of the loan and is excluded from the estimate of credit losses. Interest income is accrued in the unpaid principal balance. Loan origination fees and certain direct origination costs are deferred and recognized as an adjustment of the related loan yield using the interest method. Premiums and discounts on purchased loans not deemed purchase credit
impaireddeteriorated are deferred and amortized as a level yield adjustment over the respective term of the loan.
The new standard under CECL removes the notion of impairment as previously defined under
Under ASC 310-10-35 and replaces it with less prescriptive guidance under ASC 326-20-30-2. If326-20-30-2, if the Bank determines that a loan does not share risk characteristics with its other financial assets, the Bank shall evaluate the financial asset for expected credit losses on an individual basis. Factors considered by management in determining impairment include payment status, collateral values, and the probability of collecting scheduled payments of principal and interest when due. Generally, impairment is measured on a loan by loan basis using the fair value of the supporting collateral.
Loans are generally placed on a nonaccrual status, and the accrual of interest on such loan is discontinued, when principal or interest is past due ninety90 days or when specifically determined to be impaired unless the loan is well-secured and in the process of collection. When a loan is placed on nonaccrual status, interest accrued but not received is generally reversed against interest income. If collectability is in doubt, cash receipts on nonaccrual loans are used to reduce principal rather than recorded in interest income. Past due status is determined based upon contractual terms. Loans are returned to accrual status when the obligation is brought current or has performed in accordance with the contractual terms for a reasonable period of time and the ultimate collectability of the total contractual principal and interest is no longer in doubt.
Allowance for Credit Losses (ACL)
The ACL represents the estimated losses for financial assets accounted for on an amortized cost basis. Expected losses are calculated using relevant information, from internal and external sources, about past events, including historical experience, current conditions, and reasonable and supportable forecasts that affect the collectability of the reported amount. Historical credit loss experience provides the basis for the estimation of expected credit losses. Adjustments to historical loss information are made for differences in current risk characteristics such as differences in underwriting standards, portfolio mix, delinquency level, or term as well as for changes in environment conditions, such as changes in unemployment rates, property values, or other relevant factors. Management may selectively apply external market data to subjectively adjust the Company’s own loss history including index or peer data. Expected losses are estimated over the contractual term of the loans, adjusted for expected prepayments. The contractual term excludes expected extensions, renewals, and modifications. Loans are charged-off against the allowance when management believes the uncollectibility of a loan balance is confirmed and recoveries are credited to the allowance when received. Expected recoveries amounts may not exceed the aggregate of amounts previously charged-off.
The ACL is measured on a collective basis when similar risk characteristics exist. Generally, collectively assessed loans are grouped by call code (segments). Segmenting loans by call code will group loans that contain similar types of collateral, purposes, and are usually structured with similar terms making each loan’s risk profile very similar to the rest in that segment. Each of these segments then flows up into one of the four bands (bands), Commercial, Financial, and Agriculture, Commercial Real Estate, Consumer Real Estate, and Consumer Installment. In accordance with the guidance in ASC 326, the Company redefined its LHFI portfolio segments and related loan classes based on the level at which risk is monitored within the ACL methodology. Construction loans for 1-4 family residential properties with a call code 1A1, and other construction, all land development and other land loans with a call code 1A2 were previously separated between the Commercial Real Estate or Consumer Real Estate bands based on loan type code. Under our ASC 326 methodology 1A1 loans are all defined as part of the Consumer Real Estate band and 1A2 loans are all defined as part of the Commercial Real Estate Band.
The probability of default (“PD”) calculation analyzes the historical loan portfolio over the given lookback period to identify, by segment, loans that have defaulted. A default is defined as a loan that has moved to past due 90 days and greater, nonaccrual status, or experienced a charge-off during the period. The model observes loans over a 12-month window, detecting any events previously defined. This information is then used by the model to calculate annual iterative count-based PD rates for each segment. This process is then repeated for all dates within the historical data range. These averaged
PD’sPDs are used for an immediate reversion back to the historical mean. The historical data used to calculate this input was captured by the Company from 2009 through the most recent quarter end.
The Company utilizes reasonable and supportable forecasts of future economic conditions when estimating the ACL on loans. The model’s calculation also includes a 24-month forecasted PD based on a regression model that calculated a comparison of the Company’s historical loan data to various national economic metrics during the same periods. The results showed the Company’s past losses having a high rate of correlation to unemployment, both regionally and nationally. Using this information, along with the most recently published Wall Street Journal survey of sixty economists’ forecasts predicting unemployment rates out over the next eight quarters, a corresponding future PD can be calculated for the forward-looking 24-month period. This data can also be used to predict loan losses at different levels of stress, including a baseline, adverse and severely adverse economic condition. After the forecast period, PD rates revert to the historical mean of the entire data set.
The loss given default (“LGD”) calculation is based on actual losses (charge-offs, net recoveries) at a loan level experienced over the entire lookback period aggregated to get a total for each segment of loans. The aggregate loss amount is divided by the exposure at default to determine an LGD rate. Defaults occurring during the lookback period are included in the denominator, whether a loss occurred or not and exposure at default is determined by the loan balance immediately preceding the default event. If there is not a minimum of five past defaults in a loan segment, or less than 15.0% calculated LGD rate, or the total balance at default is less than 1% of the balance in the respective call code as of the model run date, a proxy index is used. This index is proprietary to the Company’s ACL modeling vendor derived from loss data of other client institutions similar in organization structure to the Company. The vendor also provides a “crisis” index derived from loss data between the post-recessionary years of 2008-2013 that the Company uses.
The model then uses these inputs in a non-discounted version of discounted cash flow (“DCF”) methodology to calculate the quantitative portion of estimated losses. The model creates loan level amortization schedules that detail out the expected monthly payments for a loan including estimated prepayments and payoffs. These expected cash flows are discounted back to present value using the loan’s coupon rate instead of the effective interest rate. On a quarterly basis, the Company uses internal credit portfolio data, such as changes in portfolio volume and composition, underwriting practices, and levels of past due loans, nonaccruals and classified assets along with other external information not used in the quantitative calculation to determine if any subjective qualitative adjustments are required so that all significant risks are incorporated to form a sufficient basis to estimate credit losses.
ASC 326 requires that a loan be evaluated for losses individually and reserved for separately, if the loan does not share similar risk characteristics to any other loan segments. The Company’s process for determining which loans require specific evaluation follows the standard and is two-fold. All non-performing loans, including nonaccrual loans
and loans considered to be
TDRs or purchased credit deteriorated (“PCD”), are evaluated to determine if they meet the definition of collateral dependent under the new standard. These are loans where no more payments are expected from the borrower, and foreclosure or some other collection action is probable. Secondly, all non-performing loans that are not considered to be collateral dependent but are 90 days or greater past due and/or have a balance of $500 thousand or greater, will be individually reviewed to determine if the loan displays similar risk characteristic to substandard loans in the related segment.
The Company adopted ASU No. 2022-02 effective January 1, 2023. These amendments eliminate the TDR recognition and measurement guidance and enhanced disclosures for loan modifications to borrowers experiencing financial difficulty.
Prior to the adoption of ASU 2022-02, TDRs are loans for which the contractual terms on the loan have been modified and both of the following conditions exist: (1) the borrower is experiencing financial difficulty and (2) the restructuring constitutes a concession. Concessions could include a reduction in the interest rate on the loan, payment extensions, forgiveness of principal, forbearance or other actions intended to maximize collection. The Company assesses all loan modifications to determine whether they constitute a TDR.
Purchased Credit Deteriorated Loans
The Company purchases individual loans and groups of loans, some of which have shown evidence of credit deterioration since origination. These PCD loans are recorded at the amount paid. It is the Company’s policy that a loan meets this definition if it is adversely risk rated as Non-Pass (Special Mention, Substandard, Doubtful or Loss) including
nonaccrual as well as loans identified as TDR’s.nonaccrual. An allowance for credit losses is determined using the same methodology as other loans held for investment. The initial allowance for credit losses determined on a collective basis is allocated to individual loans. The sum of the loan’s purchase price and allowance for credit losses becomes its initial amortized cost basis. The difference between the initial amortized cost basis and the par value of the loan is a noncredit discount or premium, which is amortized into interest income over the life of the loan. Subsequent changes to the allowance for credit losses are recorded through provision expense.
Upon adoption of ASC 326, the
The Company electedcontinues to maintain segments of loans that were previously accounted for under ASC 310-30 Accounting for Purchased Loans with Deteriorated Credit Qualityand will continue to account for these segments as a unit of account unless the loan is collateral dependent. PCD loans that are collateral dependent will be assessed individually. Loans are only removed from the existing segments if they are written off, paid off, or sold. Upon adoption of ASC 326, the allowance for credit losses was determined for each segment and added to the band’s carrying amount to establish a new amortized cost basis. The difference between the unpaid principal balance of the segment and the new amortized cost basis is the noncredit premium or discount, which will be amortized into interest income over the remaining life of the segment. Changes to the allowance for credit losses after adoption are recorded through provision expense.
Premises and equipment are stated at cost, less accumulated depreciation. The depreciation policy is to provide for depreciation over the estimated useful lives of the assets using the straight-line method. Repairs and maintenance expenditures are charged to operating expenses; major expenditures for renewals and betterments are capitalized and depreciated over their estimated useful lives. Upon retirement, sale, or other disposition of property and equipment, the cost and accumulated depreciation are eliminated from the accounts, and any gains or losses are included in operations. Building and related components are depreciated using the straight-line method with useful lives ranging from 10 to 39 years. Furniture, fixtures, and equipment are depreciated using the straight-line (or accelerated) method with useful lives ranging from 3 to 10 years.
Other real estate owned consists of properties acquired through foreclosure and as held for sale property, are initially recorded at fair value less costs to sell when acquired, establishing a new cost basis. Physical possession of residential real estate property collateralizing a consumer mortgage loan occurs when legal title is obtained upon completion of foreclosure or when the borrower conveys all interest in the property to satisfy the loan through completion of a deed in lieu of foreclosure or through similar legal agreement. These assets are subsequently accounted for at lower of cost or fair value less estimated costs to sell. If fair value declines subsequent to foreclosure, a valuation allowance is recorded through expense. Operation costs after acquisition are expensed. Any write-down to fair value required at the time of foreclosure is charged to the allowance for
loancredit losses. Subsequent gains or losses on other real estate are reported in other operating income or expenses. At December 31,
20212023 and
2020,2022, other real estate owned totaled
$2.6$8.3 million and
$5.8$4.8 million, respectively.
Goodwill and Other Intangible Assets
Goodwill arises from business combinations and is determined as the excess of the fair value of the consideration transferred, plus the fair value of any noncontrolling interests in the acquiree, over the fair value of any net assets acquired and liabilities assumed as of the acquisition date. Goodwill and intangible assets acquired in a business combination and determined to have an indefinite useful life are not amortized but tested for impairment at least annually or more frequently if events and circumstances exists that indicate that a goodwill impairment test should be performed. The Company will perform a qualitative assessment to determine whether the existence of events or circumstances leads to a determination that is more likely than not the fair value is less than the carrying amount, including goodwill. If, based on the evaluation, it is determined to be more likely than not that the fair value is less than the carrying value, then goodwill is tested further for impairment. The goodwill impairment loss, if any, is measured as the amount by which the carrying amount of the reporting unit, including goodwill, exceeds its fair value. Subsequent increases in goodwill value are not recognized in the consolidated financial statements. The Commercial/Retail Bank segment of the Company is the only reporting unit for
which the goodwill analysis is prepared. Intangible assets with a finite useful lives are amortized over their estimated useful lives to their estimated residual values. Goodwill is the only intangible assets with an indefinite life on our balance sheet.
The change in goodwill during the year is as
follows ($ in thousands):
| | | | | | | | | |
| | 2021 | | 2020 | | 2019 |
Beginning of year | | $ | 156,944 | | $ | 158,572 | | $ | 89,750 |
Acquired goodwill | | | (281) | | | (1,628) | | | 68,822 |
End of year | | $ | 156,663 | | $ | 156,944 | | $ | 158,572 |
follows:
| | | | | | | | | | | | | | | | | |
| ($ in thousands) | 2023 | | 2022 | | 2021 |
| Beginning of year | $ | 180,254 | | | $ | 156,663 | | | $ | 156,944 | |
| Acquired goodwill and provisional adjustments | 92,266 | | | 23,591 | | | (281) | |
| End of year | $ | 272,520 | | | $ | 180,254 | | | $ | 156,663 | |
Other intangible assets consist of core deposit and acquired customer relationship intangible assets arising from whole bank and branch acquisitions and are amortized on a straight-line basis over a 10-year average life. Such assets are periodically evaluated as to the recoverability of carrying values. The definite-lived intangible assets had the following carrying values at December 31, 20212023 and 2020:2022:
| | | | | | | | | | | | | | | | | | | | |
| ($ in thousands) | | |
| 2023 | | Gross
Carrying
Amount | | Accumulated
Amortization | | Net
Carrying
Amount |
| Core deposit intangibles | | $ | 99,071 | | | $ | (30,259) | | | $ | 68,812 | |
| | | | | | |
| 2022 | | | | | | |
| Core deposit intangibles | | $ | 55,332 | | | $ | (20,696) | | | $ | 34,636 | |
| | | | | | | | | |
($ in thousands) | | |
| | Gross | | | | | Net |
| | Carrying | | Accumulated | | Carrying |
2021 | | Amount | | Amortization | | Amount |
Core deposit intangibles | | $ | 45,541 | | $ | (16,032) | | $ | 29,509 |
| | | | | | | | | |
2020 | | | | | | | | | |
Core deposit intangibles | | $ | 42,651 | | $ | (11,895) | | $ | 30,756 |
The related amortization expense of business combination related intangible assets is as follows:
| | | |
($ in thousands) | | Amount |
Aggregate amortization expense for the year ended December 31: | | | |
2019 | | $ | 3,216 |
2020 | | | 4,093 |
2021 | | | 4,137 |
| | | |
| | Amount |
Estimated amortization expense for the year ending December 31: | | | |
2022 | | $ | 4,256 |
2023 | | | 4,210 |
2024 | | | 4,180 |
2025 | | | 4,165 |
2026 | | | 4,165 |
Thereafter | | | 8,533 |
| | $ | 29,509 |
| | | | | |
| ($ in thousands) | Amount |
| Aggregate amortization expense for the year ended December 31: | |
| 2021 | $ | 4,137 | |
| 2022 | 4,664 | |
| 2023 | 9,563 | |
| | | | | |
| Amount |
| Estimated amortization expense for the year ending December 31: | |
| 2024 | $ | 9,533 | |
| 2025 | 9,518 | |
| 2026 | 9,518 | |
| 2027 | 9,185 | |
| 2028 | 8,193 | |
| Thereafter | 22,865 | |
| Total amortization expense | $ | 68,812 | |
Cash Surrender Value of Life Insurance
The Company invests in bank owned life insurance (“BOLI”). BOLI involves the purchase of life insurance by the Company on a chosen group of employees. The Company is the owner of the policies and, accordingly, the cash surrender value of the policies is reported as an asset, and increases in cash surrender values are reported as income.
Financing costs related to the issuance of junior subordinated debentures are being amortized over the life of the instruments and are included in other liabilities.
The Company accounts for stock-based compensation in accordance with ASC Topic 718, Compensation - Stock Compensation. Compensation cost is recognized for all restricted stock granted based on the weighted average fair value stock price at the grant date.
Common stock shares repurchased are recorded at cost. Cost of shares retired or reissued is determined using the first-in, first-out method.
The Company and its subsidiary file consolidated income tax returns. The subsidiary provides for income taxes on a separate return basis and remits to the Company amounts determined to be payable.
Income taxes are provided for the tax effects of the transactions reported in the financial statements and consist of taxes currently payable plus deferred taxes related primarily to differences between the bases of assets and liabilities as measured by income tax laws and their bases as reported in the financial statements. The deferred tax assets and liabilities represent the future tax consequences of those differences, which will either be taxable or deductible when the assets and liabilities are recovered or settled.
ASC Topic 740, Income Taxes, provides guidance on financial statement recognition and measurement of tax positions taken, or expected to be taken, in tax returns. ASC Topic 740 requires an evaluation of tax positions to determine if the tax positions will more likely than not be sustainable upon examination by the appropriate taxing authority. The Company, at December 31, 20212023 and 2020,2022, had no uncertain tax positions that qualify for either recognition or disclosure in the financial statements.
Advertising costs are expensed in the period in which they are incurred. Advertising expense for the years ended December 31,
2023, 2022 and 2021,
2020was $833 thousand, $393 thousand, and
2019, was $391 thousand,
$333 thousand, and $648 thousand, respectively.
Cash and cash equivalents include cash, deposits with other financial institutions with maturities fewer than 90 days,
and federal funds
sold.sold, and collateral identified as "restricted cash" related to the Company's back-to-back SWAP transactions. Net cash flows are reported for customer loan and deposit transactions, interest bearing deposits in other financial institutions, and federal funds purchased and repurchase agreements.
Off-Balance Sheet Financial Instruments
In the ordinary course of business, the subsidiary bank enters into off-balance sheet financial instruments consisting of commitments to extend credit, credit card lines and standby letters of credit. The face amount for these items represents the exposure to loss, before considering customer collateral or ability to repay. Such financial instruments are recorded in the financial statements when they are funded.
ACL on Off-Balance Sheet Credit (OBSC) Exposures
Under ASC 326, the Company is required to estimate expected credit losses for OBSC which are not unconditionally cancellable. The Company estimates expected credit losses over the contractual period in which the Company is exposed to credit risk via a contractual obligation to extend credit unless that obligation is unconditionally cancellable by the Company. The ACL on OBSC exposures is adjusted as a provision for credit loss expense. The estimate includes consideration of the likelihood that funding will occur and an estimate of expected credit losses on commitments expected to be funded over its estimated life. Expected credit losses related to OBSC exposures are presented as a liability.
Earnings Available to Common Stockholders
Per share amounts are presented in accordance with ASC Topic 260, Earnings Per Share. Under ASC Topic 260, two per share amounts are considered and presented, if applicable. Basic per share data is calculated based on the weighted-average number of common shares outstanding during the reporting period. Diluted per share data includes any dilution from securities that may be converted into common stock, such as outstanding restricted stock. There were no anti-dilutive common stock equivalents excluded in the calculations.
The following tables disclose the reconciliation of the numerators and denominators of the basic and diluted computations available to common stockholders ($ in thousands, except per share amount):
| | | | | | | | |
| | Net | | Weighted Average | | | |
| | Income | | Shares | | Per Share |
December 31, 2021 | | (Numerator) | | (Denominator) | | Amount |
Basic per common share | | $ | 64,167 | | 21,017,189 | | $ | 3.05 |
Effect of dilutive shares: | | | | | | | | |
Restricted Stock | | | — | | 149,520 | | | |
| | $ | 64,167 | | 21,166,709 | | $ | 3.03 |
| | | | | | | | |
December 31, 2020 | | | | | | | | |
Basic per common share | | $ | 52,505 | | 20,718,544 | | $ | 2.53 |
Effect of dilutive shares: | | | | | | | | |
Restricted Stock | | | — | | 104,106 | | | |
| | $ | 52,505 | | 20,822,650 | | $ | 2.52 |
| | | | | | | | |
December 31, 2019 | | | | | | | | |
Basic per common share | | $ | 43,745 | | 17,050,095 | | $ | 2.57 |
Effect of dilutive shares: | | | | | | | | |
Restricted Stock | | | — | | 133,990 | | | |
| | $ | 43,745 | | 17,184,085 | | $ | 2.55 |
stockholders.
| | | | | | | | | | | | | | | | | | | | |
| ($ in thousands, except per share amount) | | | | | | |
| December 31, 2023 | | Net
Income
(Numerator) | | Weighted Average
Shares
(Denominator) | | Per Share
Amount |
| Basic per common share | | $ | 75,457 | | | 31,373,718 | | | $ | 2.41 | |
| Effect of dilutive shares: | | | | | | |
| Restricted Stock | | — | | | 192,073 | | | |
| | $ | 75,457 | | | 31,565,791 | | | $ | 2.39 | |
| | | | | | |
| December 31, 2022 | | | | | | |
| Basic per common share | | $ | 62,919 | | | 22,023,595 | | $ | 2.86 | |
| Effect of dilutive shares: | | | | | | |
| Restricted Stock | | — | | | 141,930 | | |
| | $ | 62,919 | | | 22,165,525 | | $ | 2.84 | |
| | | | | | |
| December 31, 2021 | | | | | | |
| Basic per common share | | $ | 64,167 | | | 21,017,189 | | | $ | 3.05 | |
| Effect of dilutive shares: | | | | | | |
| Restricted Stock | | — | | | 149,520 | | | |
| | $ | 64,167 | | | 21,166,709 | | | $ | 3.03 | |
The diluted per share amounts were computed by applying the treasury stock method.
Business combinations are accounted for under ASC 805, “Business Combinations”, using the acquisition method of accounting. The acquisition method of accounting requires an acquirer to recognize the assets acquired and the liabilities assumed at the acquisition date measured at their fair values as of that date. To determine the fair values, the Company relies on third party valuations, such as appraisals, or internal valuations based on discounted cash flow analyses or other valuation techniques. Under the acquisition method of accounting, the Company identifies the acquirer and the closing date and applies applicable recognition principles and conditions. Acquisition-related costs are costs the Company incurs to effectaffect a business combination. Those costs include advisory, legal, accounting, valuation, and other professional or consulting fees. Some other examples of costs to the Company include systems conversion, integration planning consultants and advertising costs. The Company accounts for acquisition-related costs as expenses in the periods in which the costs are incurred and the services are received, with one exception. The costs to issue debt or equity securities is recognized in accordance with other applicable GAAP. These acquisition-related costs have been and will be included within the Consolidated Statements of Income classified within the non-interest expense caption.
Derivative Financial Instruments
The Company enters into interest rate swap agreements primarily to facilitate the risk management strategies of certain commercial customers. The interest rate swap agreements entered into by the Company are all entered into under what is referred to as a back-to-back interest rate swap, as such, the net positions are offsetting assets and liabilities, as well as income and expenses. All derivative instruments are recorded in the consolidated statement of financial condition at their respective fair values, as components of other assets and other liabilities. Under a back-to-back interest rate swap program, the Company enters into an interest rate swap with the customer and another offsetting swap with a counterparty. The result is two mirrored interest rate swaps, absent a credit event, which will offset in the financial statements. These swaps are not designated as hedging instruments and are recorded at fair value in other assets and other liabilities. The change in fair value is recognized in the income statement as other income and fees.
In addition, the Company will enter into risk participation agreements that are derivative financial instruments and are recorded at fair value. These derivatives are not designated as hedges and therefore, changes in fair value are recorded directly through earnings at each reporting period. Under a risk participation-out agreement, a derivative asset, the Company participates out a portion of the credit risk associated with the interest rate swap position executed with the commercial borrower, for a fee paid to the participating bank. Under a risk participation-in agreement, a derivative liability, the Company assumes, or participates in, a portion of the credit risk associated with the interest rate swap position with the commercial borrower, for a fee received from the other bank.
Entering into derivative contracts potentially exposes the Company to the risk of counterparties' failure to fulfill their legal obligations, including, but not limited to, potential amounts due or payable under each derivative contract. Notional principal amounts are often used to express the volume of these transactions, but the amounts potentially subject to credit risk are much smaller. The Company assesses the credit risk of its dealer counterparties by regularly monitoring publicly available credit rating information, evaluating other market indicators, and periodically reviewing detailed financials.
The Company records the fair value of its interest rate swap contracts separately within other assets and other liabilities as current accounting rules do not permit the netting of customer and counterparty fair value amounts in the consolidated statement of financial condition.
Investment in Limited Partnership
The Company invested $4.4 million in a limited partnership that provides low-income housing. The Company is not the general partner and does not have controlling ownership. The carrying value of the Company’s investment in the limited partnership was
$2.1$1.2 million at December 31,
20212023 and
$2.5$1.6 million at December 31,
2020,2022, net of amortization, using the proportional method and is reported in other assets on the Consolidated Balance Sheets. The Company’s maximum exposure to loss is limited to the carrying value of its investment. The Company received $481 thousand in low-income housing tax credits during
2021, 20202023, 2022 and
2019.2021.
Certain reclassifications have been made to the 20202022 and 20192021 financial statements to conform with the classifications used in 2021.2023. These reclassifications did not impact the Company’s consolidated financial condition or results of operations.
Effect of Recently Adopted Accounting Standards
In March 2020, the Financial Accounting Standards Board ("FASB") issued Accounting Standards Update (“ASU”) 2016-13, No. 2020-04, Reference Rate Reform (ASC 848): “Facilitation of the Effects of Reference Rate Reform on Financial Reporting.” This ASU provides temporary optional guidance to ease the potential burden in accounting for reference rate reform. The ASU provides optional expedients and exceptions for applying generally accepted accounting principles to contract modifications and hedging relationships, subject to meeting certain criteria, that reference London Interbank Offer Rate ("LIBOR") or another reference rate expected to be discontinued. It is intended to help stakeholders during the global market-wide reference rate transition period. The Company adopted ASU 2020-04 effective January 1, 2023. Adoption of ASU 2020-04 did not have a material impact on the Company's consolidated financial statements.
In October 2021, the FASB issued ASU No. 2021-08, Business Combination (Topic 805): “Accounting for Contract Assets and Contract Liabilities from Contracts with Customers.” This ASU requires entities to apply Topic 606 to recognize and measure contract assets and contract liabilities in a business combination. The amendment improves comparability after the business combination by providing consistent recognition and measurement guidance for revenue contracts with customers acquired in a business combination and revenue contracts with customers not acquired in a business combination. The Company adopted ASU 2021-08 effective January 1, 2023. Adoption of ASU 2021-08 did not have a material impact on the Company's consolidated financial statements.
In March 2022, FASB issued ASU No. 2022-02, "Financial Instruments – Credit Losses (Topic 326): Troubled Debt Restructurings and Vintage Disclosures.” These amendments eliminate the TDR recognition and measurement guidance and instead require that an entity evaluate whether the modification represents a new loan or a continuation of an existing loan. The amendments also enhance existing disclosure requirements and introduce new requirements related to certain modifications of receivables made to borrowers experiencing financial difficulty. For public business entities, these amendments require that an entity disclose current period gross write-offs by year of origination for financing receivables and net investment in leases within the scope of Subtopic 326-20. Gross write-off information must be included in the vintage disclosures required for public business entities in accordance with paragraph 326-20-50-6, which requires that an entity disclose the amortized cost basis of financing receivables by credit quality indicator and class of financing receivable by year of origination. The Company adopted ASU 2022-02 effective January 1, 2023. Adoption of ASU 2022-02 did not have a material impact on the Company's consolidated financial statements.
In July 2023, FASB issued ASU No. 2023-03, "Presentation of Financial Statements (Topic 205), Income Statement - Reporting Comprehensive Income (Topic 220), Distinguishing Liabilities from Equity (Topic 480), Equity (Topic 505), and Compensation - Stock Compensation (Topic 718): Amendments to SEC Paragraph Pursuant to SEC Staff Accounting Bulletin No. 120, SEC Staff Announcement at the March 24, 2022 Emerging Issues Task Force ("EITF") Meeting, and Staff Accounting Bulletin Topic 6.B, Accounting Series Release 280 - General Revision of Regulation S-X: Income or Loss Applicable to Common Stock." This ASU amends the FASB Accounting Standards Codification for SEC paragraphs pursuant to SEC Staff Accounting Bulletin No. 120, SEC Staff Announcement at the March 24, 2022 EITF Meeting, and Staff Accounting Bulletin Topic 6.B, Accounting Series Release 280 - General Revision of Regulation S-X: Income or Loss Applicable to Common Stock. These updates were effective immediately and did not have a material impact on the Company's consolidated financial statements.
New Accounting Standards That Have Not Yet Been Adopted
In March 2023, FASB issued ASU No. 2023-01, Leases (Topic 842) - "Common Control Arrangements." This ASU requires entities to determine whether a related party arrangement between entities under common control is a lease. If the arrangement is determined to be a lease, an entity must classify and account for the lease on the same basis as an arrangement with a related party. The ASU requires all entities to amortize leasehold improvements associated with common control leases over the useful life to the common control group. This guidance is effective for the Company January 1, 2024, and is not expected to have a material impact on the Company's consolidated financial statements.
In March 2023, FASB issued ASU No. 2023-02, Investments - Equity Method and Joint Venture (Topic 323): "Accounting for Investments in Tax Credit Structures Using the Proportional Amortization Method." These amendments allow reporting entities to elect to account for qualifying tax equity investments using the proportional amortization method, regardless of the program giving rise to the related income tax credits. This guidance is effective for the Company January 1, 2024, and is not expected to have a material impact on the Company's consolidated financial statements.
In October 2023, FASB issued ASU No. 2023-06, "Disclosure Improvements: Codification Amendments in Response to the SEC's Disclosure Update and Simplification Initiative." This ASU amends the ASC to incorporate certain disclosure requirements from SEC Release No. 33-10532 - Disclosure Update and Simplification that was issued in 2018. The effective date for each amendment will be the date on which the SEC's removal of that related disclosure from Regulation S-K becomes effective, with early adoption prohibited. This guidance is not expected to have a material impact on the Company's consolidated financial statements.
In November 2023, FASB issued ASU No. 2023-07, "Segment Reporting (Topic 280): Improvements to Reportable Segment Disclosures." This ASU amends the ASC to improve reportable segment disclosure requirements primarily through enhanced disclosures about significant segment expenses. The key amendments: 1. Require that a public entity disclose, on an annual and interim basis, significant segment expenses that are regularly provided to the chief operating decision maker (CODM) and included within each reported measure of segment profit or loss. 2. Require that a public entity disclose, on an annual and interim basis, an amount for other segment items by reportable segment and a description of its composition. The other segment items category is the difference between segment revenue less the
significant expenses disclosed and each reported measure of segment profit or loss. 3. Require that a public entity provide all annual disclosures about a reportable segment's profit or loss and assets currently required by FASB ASU Topic 280, Segment Reporting, in interim periods. 4. Clarify that if the CODM uses more than one measure of a segment's profit or loss in assessing segment performance and deciding how to allocate resources, a public entity may report one or more of those additional measures of segment profit. However, at least one the reported segment profit or loss measures (or the single reported measure, if only one is disclosed) should be the measure that is most consistent with the measurement principles used in measuring the corresponding amounts in the public entity's consolidated financial statements. 5. Require that a public entity disclose the title and position of the CODM and an explanation of how the CODM uses the reported measure(s) of segment profit or loss in assessing segment performance and deciding how to allocate resources. 6. Require that a public entity has a single reportable segment provide all the disclosures required by the amendments in the ASU and all existing segment disclosures in Topic 280. This ASU is effective for fiscal years beginning after December 15, 2023, and interim periods within fiscal years beginning after December 15, 2024. This guidance is not expected to have a material impact on the Company's consolidated financial statements.
In December 2023, FASB issued ASU No. 2023-09, "Income Taxes (Topic 740): Improvements to Income Tax Disclosures." This ASU amendments require that a public business entities on an annual basis (1) disclose specific categories in the rate reconciliation and (2) provide additional information for reconciling items that meet a quantitative threshold (if the effect of those reconciling items is equal to or greater than 5 percent of the amount computed by multiplying pretax income (or loss) by the applicable statutory income tax rate). The amendments require that all entities disclose on an annual basis the following information about income taxes paid: 1. The amount of income taxes paid (net of refunds received) disaggregated by federal (national), state, and foreign taxes. 2. The amount of income taxes paid (net of refunds received) disaggregated by individual jurisdictions in which income taxes paid (net of refunds received) is equal to or greater than 5 percent of total income taxes paid (net of refunds received). The amendments also require that all entities disclose the following information: 1. Income (or loss) from continuing operations before income tax expense (or benefit) disaggregated between domestic and foreign. 2. Income tax expense (or benefit) from continuing operations disaggregated by federal (national), state, and foreign. This ASU is effective for annual periods beginning after December 15, 2024. This guidance is not expected to have a material impact on the Company's consolidated financial statements.
NOTE C - BUSINESS COMBINATIONS
The Company accounts for its business combinations using the acquisition method. Acquisition accounting requires the total purchase price to be allocated to the estimated fair values of assets acquired and liabilities assumed, including certain intangible assets that must be recognized. Typically, this allocation results in the purchase price exceeding the fair value of net assets acquired, which is recorded as goodwill. Core deposit intangibles are a measure of the value of checking, money market and savings deposits acquired in business combinations accounted for under the acquisition method. Core deposit intangibles and other identified intangibles with finite useful lives are amortized using the straight-line method over their estimated useful lives of up to 10 years.
Financial assets acquired in a business combination after January 1, 2021, are recorded in accordance with ASC 326. Loans that the Company acquires in connection with acquisitions are recorded at fair value with no carryover of the related allowance for credit losses. PCD loans that have experienced more than insignificant credit deterioration since origination are recorded at the amount paid. The ACL is determined on a collective basis and is allocated to the individual loans. The sum of the loan’s purchase price and ACL becomes its initial amortized cost basis. The difference between the initial amortized cost basis and the par value of the loan is a noncredit discount or premium, which is amortized into interest income over the life of the loan. Non-PCD loans are acquired that have experienced no or insignificant deterioration in credit quality since origination. The difference between the fair value and outstanding balance of the non-PCD loans is recognized as an adjustment to interest income over the lives of the loan.
Acquisitions
Heritage Southeast Bank
On January 1, 2023, the Company completed its acquisition of HSBI, pursuant to an Agreement and Plan of Merger dated July 27, 2022, by and between the Company and HSBI (the "HSBI Merger Agreement"). Upon the completion of the merger of HSBI with and into the Company, Heritage Bank, HSBI's wholly-owned subsidiary, was merged with and into The First Bank. Under the terms of the HSBI Merger Agreement, each share of HSBI common stock was converted into the right to receive 0.965 of share of Company common stock. The Company paid a total consideration of $221.5 million to the former HSBI shareholders as consideration in the acquisition, which included 6,920,422 shares of the Company's common stock, and $16 thousand in cash in lieu of fractional shares. The HSBI acquisition provided the opportunity for the Company to expand its operations in Georgia and the Florida panhandle.
In connection with the acquisition of HSBI, the Company recorded approximately $91.9 million of goodwill, of which $3.2 million funded the ACL for estimated losses on the acquired PCD loans, and $43.7 million core deposit intangible. Goodwill is not deductible for income taxes. The core deposit intangible will be amortized to expense over 10 years.
Expenses associated with the HSBI acquisition were $388 thousand and $4.9 million for the three months and twelve months period ended December 31, 2023, respectively. These costs included charges associated with legal and consulting expenses, which have been expensed as incurred.
The following table summarizes the finalized fair values of the assets acquired and liabilities assumed including the goodwill generated from the transaction on January 1, 2023, along with valuation adjustments that have been made since initially reported.
| | | | | | | | | | | | | | | | | |
| ($ in thousands) | As Initially
Reported | | Measurement
Period
Adjustments | | As Adjusted |
| Identifiable assets: | | | | | |
| Cash and due from banks | $ | 106,973 | | | $ | (180) | | | $ | 106,793 | |
| Investments | 172,775 | | | — | | | 172,775 | |
| Loans | 1,155,712 | | | — | | | 1,155,712 | |
| Core deposit intangible | 43,739 | | | — | | | 43,739 | |
| Personal and real property | 35,963 | | | — | | | 35,963 | |
| Other real estate owned | 857 | | | 332 | | | 1,189 | |
| Bank owned life insurance | 35,579 | | | — | | | 35,579 | |
| Deferred taxes | 6,761 | | | (632) | | | 6,129 | |
| Interest receivable | 4,349 | | | — | | | 4,349 | |
| Other assets | 3,103 | | | — | | | 3,103 | |
| Total assets | 1,565,811 | | | (480) | | | 1,565,331 | |
| | | | | |
| Liabilities and equity: | | | | | |
| Deposits | 1,392,432 | | | — | | | 1,392,432 | |
| Trust Preferred | 9,015 | | | — | | | 9,015 | |
| Other liabilities | 34,271 | | | — | | | 34,271 | |
| Total liabilities | 1,435,718 | | | — | | | 1,435,718 | |
| Net assets acquired | 130,093 | | | (480) | | | 129,613 | |
| Consideration paid | 221,538 | | | — | | | 221,538 | |
| Goodwill | $ | 91,445 | | | $ | 480 | | | $ | 91,925 | |
During the fourth quarter of 2023, the Company finalized its analysis and valuation adjustments have been made to cash and due from banks, other real estate owned, and deferred taxes since initially reported.
Beach Bancorp, Inc.
On August 1, 2022, the Company completed its acquisition of BBI, pursuant to an Agreement and Plan of Merger dated April 26, 2022 by and between the Company and BBI (the "BBI Merger Agreement"). Upon the completion of the merger of BBI with and into the Company, Beach Bank, BBI's wholly-owned subsidiary, was merged with and into The First Bank. Under the terms of the BBI Merger Agreement, each share of BBI common stock and each share of BBI preferred stock was converted into the right to receive 0.1711 of a share of Company common stock (the "BBI Exchange Ratio"), and all stock options awarded under the BBI equity plans were converted automatically into an option to purchase shares of Company common stock on the same terms and conditions as applicable to each such BBI option as in effect immediately prior to the effective time, with the number of shares underlying each such option and the applicable exercise price adjusted based on the BBI Exchange Ratio. The BBI merger provides the opportunity for the Company to expand its operations in the Florida panhandle and enter the Tampa market. The Company paid consideration of approximately $101.5 million to the former BBI shareholders including 3,498,936 shares of the Company's common stock and
approximately $1 thousand in cash in lieu of fractional shares, and also assumed options entitling the owners thereof to purchase an additional 310,427 shares of the Company's common stock.
In connection with the acquisition of BBI, the Company recorded approximately $23.7 million of goodwill and $9.8 million core deposit intangible. Goodwill is not deductible for income taxes. The core deposit intangible will be amortized to expense over 10 years. The Company also incurred $1.3 million of provision for credit losses on credit marks from the loans acquired from Beach Bank.
Expenses associated with the BBI acquisition were $4.0 thousand and $1.4 million for the three months and twelve months period ended December 31, 2023, respectively. These costs included charges associated with legal and consulting expenses, which have been expensed as incurred.
The following table summarizes the finalized fair values of the assets acquired and liabilities assumed including the goodwill generated from the transaction on August 1, 2022, along with valuation adjustments that have been made since initially reported.
| | | | | | | | | | | | | | | | | |
| ($ in thousands) | As Initially Reported | | Measurement Period Adjustments | | As Adjusted |
| Purchase price: | | | | | |
| Cash and stock | $ | 101,470 | | | $ | — | | | $ | 101,470 | |
| Total purchase price | 101,470 | | | — | | | 101,470 | |
| Identifiable assets: | | | | | |
| Cash | $ | 23,939 | | | $ | — | | | $ | 23,939 | |
| Investments | 22,907 | | | (264) | | | 22,643 | |
| Loans | 482,903 | | | 2,268 | | | 485,171 | |
| Other real estate | 8,797 | | | (580) | | | 8,217 | |
| Bank owned life insurance | 10,092 | | | — | | | 10,092 | |
| Core deposit intangible | 9,791 | | | — | | | 9,791 | |
| Personal and real property | 13,825 | | | (1,868) | | | 11,957 | |
| Deferred tax asset | 28,105 | | | (970) | | | 27,135 | |
| Other assets | 9,649 | | | (414) | | | 9,235 | |
| Total assets | 610,008 | | | (1,828) | | | 608,180 | |
| Liabilities and equity: | | | | | |
| Deposits | 490,588 | | | 3 | | | 490,591 | |
| Borrowings | 25,000 | | | — | | | 25,000 | |
| Other liabilities | 14,772 | | | — | | | 14,772 | |
| Total liabilities | 530,360 | | | 3 | | | 530,363 | |
| Net assets acquired | 79,648 | | | (1,831) | | | 77,817 | |
| Goodwill | $ | 21,822 | | | $ | 1,831 | | | $ | 23,653 | |
During the third quarter of 2023, the Company finalized its analysis and valuation adjustments that were made to investments, loans, other real estate, personal and real property, deferred tax asset, other assets, and deposits.
Cadence Bank Branches
On December 03, 2021, The First completed its acquisition of seven Cadence Bank, N.A. (“Cadence”) branches in Northeast Mississippi (the “Cadence Branches”). In connection with the acquisition of the Cadence Branches, The First assumed $410.2 million in deposits, acquired $40.3 million in loans at fair value, acquired certain assets associated with the Cadence Branches at their book value, and paid a deposit premium of $1.0 million to Cadence. As a result of the acquisition, the Company will have an opportunity to increase its deposit base and reduce transaction costs. The Company also expects to reduce costs through economies of scale.
In connection with the acquisition of the Cadence Branches, the Company recorded a $1.6 million bargain purchase gain and $2.9 million core deposit intangible. The bargain purchase gain was generated as a result of the estimated fair value of net assets acquired exceeding the merger consideration, based on provisional fair values. The bargain purchase gain is considered non-taxable for income taxes purposes. The core deposit intangible will be amortized to expense over 10 years.
Expenses associated with the branch acquisition of the Cadence Branches were $81 thousand and $189 thousand for the three months and twelve months period ended December 31, 2023. These costs included charges associated with due diligence as well as legal and consulting expenses, which have been expensed as incurred. The Company also incurred $370 thousand of provision for credit losses on credit marks from the loans acquired.
The following table summarizes the provisional fair values of the assets acquired and liabilities assumed and the goodwill (bargain purchase gain) generated from the transaction:
| | | | | | | | | | | | | | | | | |
| ($ in thousands) | As Initially
Reported | | Measurement
Period
Adjustments | | As Adjusted |
| Identifiable assets: | | | | | |
| Cash and due from banks | $ | 359,916 | | | $ | — | | | $ | 359,916 | |
| Loans | 40,262 | | | — | | | 40,262 | |
| Core deposit intangible | 2,890 | | | — | | | 2,890 | |
| Personal and real property | 9,675 | | | — | | | 9,675 | |
| Other assets | 135 | | | — | | | 135 | |
| Total assets | 412,878 | | | — | | | 412,878 | |
| | | | | |
| Liabilities and equity: | | | | | |
| Deposits | 410,171 | | | — | | | 410,171 | |
| Other liabilities | 407 | | | (281) | | | 126 | |
| Total liabilities | 410,578 | | | (281) | | | 410,297 | |
| Net assets acquired | 2,300 | | | 281 | | | 2,581 | |
| Consideration paid | 1,000 | | | — | | | 1,000 | |
| Bargain purchase gain | $ | (1,300) | | | $ | (281) | | | $ | (1,581) | |
During the fourth quarter of 2022, the Company finalized its analysis and valuation adjustments were made to other liabilities since initially reported.
Supplemental Pro Forma Information
The following table presents certain supplemental pro forma information, for illustrative purposes only, for the years December 31, 2023 and 2022 as if the BBI and HSBI acquisitions had occurred on January 1, 2022. The pro forma financial information is not necessarily indicative of the results of operations had the acquisitions been effective as of this date.
| | | | | | | | | | | |
| ($ in thousands) | Pro Forma for the Year Ended December 31, |
| 2023 | | 2022 |
| (unaudited) | | (unaudited) |
| Net interest income | $ | 249,325 | | | $ | 248,639 | |
| Non-interest income | 46,705 | | | 58,645 | |
| Total revenue | 296,030 | | | 307,284 | |
| Income before income taxes | 105,879 | | | 118,465 | |
Supplemental pro-forma earnings were adjusted to exclude acquisition costs incurred.
NOTE D - SECURITIES
The following table summarizes the amortized cost, gross unrealized gains, and losses, and estimated fair values of AFS securities and securities HTM at December 31, 2023 and 2022:
| | | | | | | | | | | | | | | | | | | | | | | |
| ($ in thousands) | December 31, 2023 |
| Amortized
Cost | | Gross
Unrealized
Gains | | Gross
Unrealized
Losses | | Fair
Value |
| Available-for-sale: | | | | | | | |
| U.S. Treasury | $ | 16,985 | | | $ | — | | | $ | 310 | | | $ | 16,675 | |
| Obligations of U.S. government agencies and sponsored entities | 119,868 | | | 1 | | | 14,946 | | | 104,923 | |
| Tax-exempt and taxable obligations of states and municipal subdivisions | 486,293 | | | 449 | | | 48,276 | | | 438,466 | |
| Mortgage-backed securities - residential | 297,735 | | | 11 | | | 34,430 | | | 263,316 | |
| Mortgage-backed securities - commercial | 198,944 | | | 76 | | | 20,675 | | | 178,345 | |
| Corporate obligations | 41,347 | | | — | | | 3,750 | | | 37,597 | |
| Other | 3,055 | | | — | | | 12 | | | 3,043 | |
| Total available-for-sale | $ | 1,164,227 | | | $ | 537 | | | $ | 122,399 | | | $ | 1,042,365 | |
| Held-to-maturity: | | | | | | | |
| U.S. Treasury | $ | 89,688 | | | $ | — | | | $ | 2,804 | | | $ | 86,884 | |
| Obligations of U.S. government agencies and sponsored entities | 33,659 | | | — | | | 1,803 | | | 31,856 | |
| Tax-exempt and taxable obligations of states and municipal subdivisions | 246,908 | | | 9,566 | | | 14,697 | | | 241,777 | |
| Mortgage-backed securities - residential | 141,573 | | | — | | | 14,237 | | | 127,336 | |
| Mortgage-backed securities - commercial | 132,711 | | | — | | | 12,334 | | | 120,377 | |
| Corporate obligations | 10,000 | | | — | | | 2,286 | | | 7,714 | |
| Total held-to-maturity | $ | 654,539 | | | $ | 9,566 | | | $ | 48,161 | | | $ | 615,944 | |
| | | | | | | | | | | | | | | | | | | | | | | |
| ($ in thousands) | December 31, 2022 |
| Amortized
Cost | | Gross
Unrealized
Gains | | Gross
Unrealized
Losses | | Fair
Value |
| Available-for-sale: | | | | | | | |
| U.S. Treasury | $ | 135,752 | | | $ | — | | | $ | 11,898 | | | $ | 123,854 | |
| Obligations of U.S. government agencies and sponsored entities | 163,054 | | | 3 | | | 18,688 | | | 144,369 | |
| Tax-exempt and taxable obligations of states and municipal subdivisions | 519,190 | | | 598 | | | 61,931 | | | 457,857 | |
| Mortgage-backed securities - residential | 341,272 | | | 11 | | | 42,041 | | | 299,242 | |
| Mortgage-backed securities - commercial | 215,200 | | | 60 | | | 24,363 | | | 190,897 | |
| Corporate obligations | 43,869 | | | — | | | 2,987 | | | 40,882 | |
| Total available-for-sale | $ | 1,418,337 | | | $ | 672 | | | $ | 161,908 | | | $ | 1,257,101 | |
| Held-to-maturity: | | | | | | | |
| U.S. Treasury | $ | 109,631 | | | $ | — | | | $ | 5,175 | | | $ | 104,456 | |
| Obligations of U.S. government agencies and sponsored entities | 33,789 | | | — | | | 2,153 | | | 31,636 | |
| Tax-exempt and taxable obligations of states and municipal subdivisions | 247,467 | | | 4,525 | | | 13,699 | | | 238,293 | |
| Mortgage-backed securities - residential | 156,119 | | | — | | | 17,479 | | | 138,640 | |
| Mortgage-backed securities - commercial | 134,478 | | | 7 | | | 13,798 | | | 120,687 | |
| Corporate obligations | 10,000 | | | — | | | 1,615 | | | 8,385 | |
| Total held-to-maturity | $ | 691,484 | | | $ | 4,532 | | | $ | 53,919 | | | $ | 642,097 | |
The Company reassessed classification of certain investments and effective October 2022, the Company transferred $863 thousand of obligations of U.S. government agencies and sponsored entities, $1.2 million of mortgage -backed securities - commercial, and $137.5 million of tax-exempt and taxable obligations of states and municipal subdivisions from AFS to HTM securities. The securities were transferred at their amortized costs basis, net of any remaining unrealized gain or loss reported in accumulated other comprehensive income. The related unrealized loss of $36.8 million included in other comprehensive income remained in other comprehensive income, to be amortized out of other comprehensive income with an offsetting entry to interest income as a yield adjustment through earnings over the remaining term of the securities. There was no allowance for credit loss associated with the AFS securities that were transferred to HTM.
ACL on Securities
Securities Available-for-Sale
Quarterly, the Company evaluates if a security has a fair value less than its amortized cost. Once these securities are identified, in order to determine whether a decline in fair value resulted from a credit loss or other factors, the Company performs further analysis as outlined below:
•Review the extent to which the fair value is less than the amortized cost and determine if the decline is indicative of credit loss or other factors.
•The securities that violate the credit loss trigger above would be subjected to additional analysis.
•If the Company determines that a credit loss exists, the credit portion of the allowance will be measured using the DCF analysis using the effective interest rate. The amount of credit loss the Company records will be limited to the amount by which the amortized cost exceeds the fair value. The allowance for the calculated credit loss will be monitored going forward for further credit deterioration or improvement.
At December 31, 2023 and 2022, the results of the analysis did not identify any securities where the decline was indicative of credit loss factors; therefore, no DCF analysis was performed, and no credit loss was recognized on any of the securities AFS.
Accrued interest receivable is excluded from the estimate of credit losses for securities AFS. Accrued interest receivable totaled $5.2 million and $6.2 million at December 31, 2023 and 2022, respectively and was reported in interest receivable on the accompanying Consolidated Balance Sheet.
All AFS securities were current with no securities past due or on nonaccrual as of December 31, 2023.
Securities Held to Maturity
At December 31, 2023, the potential credit loss exposure totaled $205 thousand and $242 thousand at December 31, 2023 and 2022, respectively and consisted of tax-exempt and taxable obligations of states and municipal subdivisions and corporate obligations securities. After applying appropriate probability of default (“PD”) and loss given default (“LGD”) assumptions, the total amount of current expected credit losses was deemed immaterial. Therefore, no reserve was recorded for the years ended December 31, 2023 and 2022.
Accrued interest receivable is excluded from the estimate of credit losses for securities held-to-maturity. Accrued interest receivable totaled $3.4 million and $3.6 million at December 31, 2023 and 2022, respectively and was reported in interest receivable on the accompanying Consolidated Balance Sheet.
At December 31, 2023, the Company had no securities held-to-maturity that were past due 30 days or more as to principal or interest payments. The Company had no securities held-to-maturity classified as nonaccrual for the years ended December 31, 2023 and 2022.
The Company monitors the credit quality of the debt securities held-to-maturity through the use of credit ratings. The Company monitors the credit ratings on a quarterly basis. The following table summarizes the amortized cost of debt securities held-to-maturity at December 31, 2023, aggregated by credit quality indicators.
| | | | | | | | | | | | | | |
| ($ in thousands) | | December 31, 2023 | | December 31, 2022 |
| Aaa | | $ | 431,527 | | | $ | 467,736 | |
| Aa1/Aa2/Aa3 | | 129,751 | | | 110,854 | |
| A1/A2 | | 13,902 | | | 13,757 | |
| BBB | | 10,000 | | | 10,000 | |
| Not rated | | 69,359 | | | 89,137 | |
| Total | | $ | 654,539 | | | $ | 691,484 | |
The amortized cost and fair value of debt securities are shown by contractual maturity. Expected maturities may differ from contractual maturities if borrowers have the right to call or prepay obligations with or without call or prepayment penalties.
| | | | | | | | | | | | | | |
| ($ in thousands) | | December 31, 2023 |
| Available-for-Sale | | Amortized
Cost | | Fair
Value |
| Within one year | | $ | 45,559 | | | $ | 45,246 | |
| One to five years | | 150,165 | | | 143,592 | |
| Five to ten years | | 306,927 | | | 270,342 | |
| Beyond ten years | | 164,897 | | | 141,524 | |
| Mortgage-backed securities: residential | | 297,735 | | | 263,316 | |
| Mortgage-backed securities: commercial | | 198,944 | | | 178,345 | |
| Total | | $ | 1,164,227 | | | $ | 1,042,365 | |
| Held-to-maturity | | | | |
| Within one year | | $ | 39,082 | | | $ | 38,725 | |
| One to five years | | 72,333 | | | 69,387 | |
| Five to ten years | | 54,428 | | | 49,697 | |
| Beyond ten years | | 214,412 | | | 210,422 | |
| Mortgage-backed securities: residential | | 141,573 | | | 127,336 | |
| Mortgage-backed securities: commercial | | 132,711 | | | 120,377 | |
| Total | | $ | 654,539 | | | $ | 615,944 | |
The proceeds from sales and calls of securities and the associated gains and losses are listed below:
| | | | | | | | | | | | | | | | | |
| ($ in thousands) | 2023 | | 2022 | | 2021 |
| Gross gains | $ | 65 | | | $ | 82 | | | $ | 202 | |
| Gross losses | 9,781 | | | 164 | | | 59 | |
| Realized net (loss) gain | $ | (9,716) | | | $ | (82) | | | $ | 143 | |
The amortized costs of securities pledged as collateral, to secure public deposits and for other purposes, was $1.095 billion and $1.031 billion at December 31, 2023 and 2022, respectively.
The following table summarizes securities in an unrealized losses position for which an allowance for credit losses has not been recorded at December 31, 2023 and 2022. The securities are aggregated by major security type and length of time in a continuous unrealized loss position:
| | | | | | | | | | | | | | | | | | | | | | | | | | | | | | | | | | | |
| 2023 |
| ($ in thousands) | Less than 12 Months | | 12 Months or Longer | | Total |
| Fair
Value | | Unrealized
Losses | | Fair
Value | | Unrealized
Losses | | Fair
Value | | Unrealized
Losses |
| Available-for-sale: | | | | | | | | | | | |
| U.S. Treasury | $ | — | | | $ | — | | | $ | 16,675 | | | $ | 310 | | | $ | 16,675 | | | $ | 310 | |
| Obligations of U.S. government agencies and sponsored entities | 123 | | | — | | | 104,495 | | | 14,946 | | | 104,618 | | | 14,946 | |
| Tax-exempt and taxable obligations of states and municipal subdivisions | 20,879 | | | 1,479 | | | 389,113 | | | 46,797 | | | 409,992 | | | 48,276 | |
| Mortgage-backed securities - residential | 222 | | | 2 | | | 262,012 | | | 34,428 | | | 262,234 | | | 34,430 | |
| Mortgage-backed securities - commercial | 2,896 | | | 52 | | | 170,256 | | | 20,623 | | | 173,152 | | | 20,675 | |
| Corporate obligations | — | | | — | | | 37,597 | | | 3,750 | | | 37,597 | | | 3,750 | |
| Other | 3,055 | | | 12 | | | — | | | — | | | 3,055 | | | 12 | |
| Total available-for-sale | $ | 27,175 | | | $ | 1,545 | | | $ | 980,148 | | | $ | 120,854 | | | $ | 1,007,323 | | | $ | 122,399 | |
| Held-to-maturity: | | | | | | | | | | | |
| U.S. Treasury | $ | — | | | $ | — | | | $ | 86,884 | | | $ | 2,804 | | | $ | 86,884 | | | $ | 2,804 | |
| Obligations of U.S. government agencies and sponsored entities | 747 | | | 5 | | | 31,109 | | | 1,798 | | | 31,856 | | | 1,803 | |
| Tax-exempt and taxable obligations of states and municipal subdivisions | 10,472 | | | 3,949 | | | 91,480 | | | 10,748 | | | 101,952 | | | 14,697 | |
| Mortgage-backed securities - residential | — | | | — | | | 127,336 | | | 14,237 | | | 127,336 | | | 14,237 | |
| Mortgage-backed securities - commercial | 920 | | | 2 | | | 119,457 | | | 12,332 | | | 120,377 | | | 12,334 | |
| Corporate obligations | — | | | — | | | 7,714 | | | 2,286 | | | 7,714 | | | 2,286 | |
| Total held-to-maturity | $ | 12,139 | | | $ | 3,956 | | | $ | 463,980 | | | $ | 44,205 | | | $ | 476,119 | | | $ | 48,161 | |
| | | | | | | | | | | | | | | | | | | | | | | | | | | | | | | | | | | |
| 2022 |
| Less than 12 Months | | 12 Months or Longer | | Total |
| ($ in thousands) | Fair
Value | | Unrealized
Losses | | Fair
Value | | Unrealized
Losses | | Fair
Value | | Unrealized
Losses |
| Available-for-sale: | | | | | | | | | | | |
| U.S. Treasury | $ | 4,563 | | | $ | 419 | | | $ | 119,292 | | | $ | 11,479 | | | $ | 123,855 | | | $ | 11,898 | |
| Obligations of U.S. government agencies and sponsored entities | 34,254 | | | 2,293 | | | 109,431 | | | 16,395 | | | 143,685 | | | 18,688 | |
| Tax-exempt and taxable obligations of states and municipal subdivisions | 275,202 | | | 31,152 | | | 159,508 | | | 30,779 | | | 434,710 | | | 61,931 | |
| Mortgage-backed securities: residential | 76,125 | | | 4,970 | | | 222,274 | | | 37,071 | | | 298,399 | | | 42,041 | |
| Mortgage-backed securities: commercial | 50,193 | | | 3,025 | | | 136,062 | | | 21,338 | | | 186,255 | | | 24,363 | |
| Corporate obligations | 35,142 | | | 1,995 | | | 5,739 | | | 992 | | | 40,881 | | | 2,987 | |
| Total available-for-sale | $ | 475,479 | | | $ | 43,854 | | | $ | 752,306 | | | $ | 118,054 | | | $ | 1,227,785 | | | $ | 161,908 | |
| Held-to-maturity: | | | | | | | | | | | |
| U.S. Treasury | $ | 104,457 | | | $ | 5,175 | | | $ | — | | | $ | — | | | $ | 104,457 | | | $ | 5,175 | |
| Obligations of U.S. government agencies and sponsored entities | 31,636 | | | 2,153 | | | — | | | — | | | 31,636 | | | 2,153 | |
| Tax-exempt and taxable obligations of states and municipal subdivisions | 127,628 | | | 13,583 | | | 15,303 | | | 116 | | | 142,931 | | | 13,699 | |
| Mortgage-backed securities - residential | 138,639 | | | 17,479 | | | — | | | — | | | 138,639 | | | 17,479 | |
| Mortgage-backed securities - commercial | 119,758 | | | 13,798 | | | — | | | — | | | 119,758 | | | 13,798 | |
| Corporate obligations | 8,385 | | | 1,615 | | | — | | | — | | | 8,385 | | | 1,615 | |
| Total held-to-maturity | $ | 530,503 | | | $ | 53,803 | | | $ | 15,303 | | | $ | 116 | | | $ | 545,806 | | | $ | 53,919 | |
At December 31, 2023 and December 31, 2022, the Company’s securities portfolio consisted of 1,125 and 1,265 securities, respectively, which were in an unrealized loss position. AFS securities in unrealized loss positions are evaluated for impairment related to credit losses at least quarterly. The unrealized losses shown above are due to increases in market rates over the yields available at the time of purchase of the underlying securities and not credit quality. The Company does not intend to sell these securities and it is more likely than not that the Company will not be required to sell the investments before recovery of their amortized cost basis. No allowance for credit losses was needed at December 31, 2023 or 2022.
NOTE E - LOANS
The Company uses four different categories to classify loans in its portfolio based on the underlying collateral securing each loan. The loans grouped together in each category have been determined to share similar risk characteristics with respect to credit quality. Those four categories are commercial, financial and agriculture, commercial real estate, consumer real estate, consumer installment;
Commercial, financial and agriculture - Commercial, financial and agriculture loans include loans to business entities issued for commercial, industrial, or other business purposes. This type of commercial loan shares a similar risk characteristic in that unlike commercial real estate loans, repayment is largely dependent on cash flow generated from the operation of the business.
Commercial real estate - Commercial real estate loans are grouped as such because repayment is mainly dependent upon either the sale of the real estate, operation of the business occupying the real estate, or refinance of the debt obligation. This includes both owner-occupied and non-owner occupied CRE secured loans, because they share similar risk characteristics related to these variables.
Consumer real estate - Consumer real estate loans consist primarily of loans secured by 1-4 family residential properties and/or residential lots. This includes loans for the purpose of constructing improvements on the residential property, as well as home equity lines of credit.
Consumer installment - Installment and other loans are all loans issued to individuals that are not for any purpose related to operation of a business, and not secured by real estate. Repayment on these loans is mostly dependent on personal income, which may be impacted by general economic conditions.
The composition of the loan portfolio as of December 31, 2023 and December 31, 2022, is summarized below:
| | | | | | | | | | | |
| ($ in thousands) | December 31, 2023 | | December 31, 2022 |
| Loans held for sale | | | |
| Mortgage loans held for sale | $ | 2,914 | | | $ | 4,443 | |
| Total LHFS | $ | 2,914 | | | $ | 4,443 | |
| | | |
| Loans held for investment | | | |
| Commercial, financial, and agriculture (1) | $ | 800,324 | | | $ | 536,192 | |
| Commercial real estate | 3,059,155 | | | 2,135,263 | |
| Consumer real estate | 1,252,795 | | | 1,058,999 | |
| Consumer installment | 57,768 | | | 43,703 | |
| Total loans | 5,170,042 | | | 3,774,157 | |
| Less allowance for credit losses | (54,032) | | | (38,917) | |
| Net LHFI | $ | 5,116,010 | | | $ | 3,735,240 | |
(1)Loan balance includes $386 thousand and $710 thousand in PPP loans as of December 31, 2023 and 2022, respectively.
Loans held for sale consist of mortgage loans originated by the Bank and sold into the secondary market. Commitments from investors to purchase the loans are obtained upon origination.
Accrued interest receivable is not included in the amortized cost basis of the Company’s LHFI. At December 31, 2023 and 2022, accrued interest receivable for LHFI totaled $24.7 million and $18.0 million, respectively, with no related ACL and was reported in interest receivable on the accompanying consolidated balance sheet.
Nonaccrual and Past Due LHFI
Past due LHFI are loans contractually past due 30 days or more as to principal or interest payments. Generally, the Company will place a delinquent loan in nonaccrual status when the loan becomes 90 days or more past due. At the time a loan is placed in nonaccrual status, all interest which has been accrued on the loan but remains unpaid is reversed and deducted from earnings as a reduction of reported interest income. No additional interest is accrued on the loan balance until the collection of both principal and interest becomes reasonably certain.
The following tables presents the aging of the amortized cost basis in past due loans in addition to those loans classified as nonaccrual including PCD loans:
| | | | | | | | | | | | | | | | | | | | | | | | | | | | | | | | | | | | | | | | | |
| December 31, 2023 |
| ($ in thousands) | Past Due
30 to 89
Days | | Past Due 90
Days or More
and
Still Accruing | | Nonaccrual | | PCD | | Total
Past Due,
Nonaccrual
and PCD | | Total
LHFI | | Nonaccrual
and PCD
with No
ACL |
| Commercial, financial, and agriculture (1) | $ | 2,043 | | | $ | 313 | | | $ | 353 | | | $ | 965 | | | $ | 3,674 | | | $ | 800,324 | | | $ | 465 | |
| Commercial real estate | 1,698 | | | 630 | | | 3,790 | | | 647 | | | 6,765 | | | 3,059,155 | | | 410 | |
| Consumer real estate | 3,992 | | | 220 | | | 1,806 | | | 3,098 | | | 9,116 | | | 1,252,795 | | | 680 | |
| Consumer installment | 180 | | | — | | | 31 | | | — | | | 211 | | | 57,768 | | | — | |
| Total | $ | 7,913 | | | $ | 1,163 | | | $ | 5,980 | | | $ | 4,710 | | | $ | 19,766 | | | $ | 5,170,042 | | | $ | 1,555 | |
(1)Total loan balance includes $386 thousand in PPP loans as of December 31, 2023.
| | | | | | | | | | | | | | | | | | | | | | | | | | | | | | | | | | | | | | | | | |
| December 31, 2022 |
| ($ in thousands) | Past Due
30 to 89
Days | | Past Due 90
Days or More
and
Still Accruing | | Nonaccrual | | PCD | | Total
Past Due,
Nonaccrual
and PCD | | Total
LHFI | | Nonaccrual
and PCD
with No
ACL |
| Commercial, financial, and agriculture (1) | $ | 220 | | | $ | — | | | $ | 19 | | | $ | — | | | $ | 239 | | | $ | 536,192 | | | $ | — | |
| Commercial real estate | 1,984 | | | — | | | 7,445 | | | 1,129 | | | 10,558 | | | 2,135,263 | | | 4,560 | |
| Consumer real estate | 3,386 | | | 289 | | | 2,965 | | | 1,032 | | | 7,672 | | | 1,058,999 | | | 791 | |
| Consumer installment | 173 | | | — | | | 1 | | | — | | | 174 | | | 43,703 | | | — | |
| Total | $ | 5,763 | | | $ | 289 | | | $ | 10,430 | | | $ | 2,161 | | | $ | 18,643 | | | $ | 3,774,157 | | | $ | 5,351 | |
(1)Total loan balance includes $710 thousand in PPP loans as of December 31, 2022.
Acquired Loans
In connection with the acquisitions of BBI and HSBI, the Company acquired loans both with and without evidence of credit quality deterioration since origination. Acquired loans are recorded at their fair value at the time of acquisition with no carryover from the acquired institution's previously recorded allowance for credit losses. Acquired loans are accounted for under ASC 326, Financial Instruments - Credit Losses (“ASC 326”) introduces guidance on reportingLosses.
The fair value for acquired loans recorded at the time of acquisition is based upon several factors including the timing and payment of expected cash flows, as adjusted for estimated credit losses and prepayments, and then discounting these cash flows using comparable market rates. The resulting fair value adjustment is recorded in the form of premium or discount to the unpaid principal balance of each acquired loan. As it relates to acquired PCD loans, the net premium or net discount is adjusted to reflect the Company's allowance for assets heldcredit losses ("ACL") recorded for PCD loans at the time of acquisition, and the remaining fair value adjustment is accreted or amortized into interest income over the remaining life of the loan. As it relates to acquired loans not classified as PCD ("non-PCD") loans, the credit loss and yield components of the fair value adjustments are aggregated, and the resulting net premium or net discount is accreted or amortized into interest income over the average remaining life of those loans. The Company records an ACL for non-PCD loans at the time of acquisition through provision expense, and therefore, no further adjustments are made to the net premium or net discount for non-PCD loans.
The estimated fair value of the non-PCD loans acquired in the BBI acquisition was $460.0 million, which is net of a $8.8 million discount. The gross contractual amounts receivable of the acquired non-PCD loans at acquisition was approximately $468.8 million, of which $6.4 million is the amount of contractual cash flows not expected to be collected.
The estimated fair value of the non-PCD acquired in the HSBI acquisition was $1.091 billion, which is net of a $33.7 million discount. The gross contractual amounts receivable of the acquired non-PCD loans at acquisition was approximately $1.125 billion, of which $16.5 million is the amount of contractual cash flows not expected to be collected.
The following table shows the carrying amount of loans acquired in the BBI and HSBI acquisition transaction for which there was, at the date of acquisition, more than insignificant deterioration of credit quality since origination:
| | | | | | | | | | | |
| ($ in thousands) | BBI | | HSBI |
| Purchase price of loans at acquisition | $ | 27,669 | | | $ | 52,356 | |
| Allowance for credit losses at acquisition | 1,303 | | | 3,176 | |
| Non-credit discount (premium) at acquisition | 530 | | | 2,325 | |
| Par value of acquired loans at acquisition | $ | 29,502 | | | $ | 57,857 | |
As of December 31, 2023 and 2022, the amortized cost of the Company’s PCD loans totaled $57.8 million and $24.0 million, respectively, which had an estimated ACL of $3.7 million and $1.7 million, respectively.
Loan Modifications
The Company adopted ASU No. 2022-02 effective January 1, 2023. These amendments eliminate the TDR recognition and measurement guidance and enhanced disclosures for loan modifications to borrowers experiencing financial difficulty.
Occasionally, the Company modifies loans to borrowers in financial distress by providing principal forgiveness, term extension, and other-than-insignificant payment delay or interest rate reduction. When principal forgiveness is provided, the amount of forgiveness is charged-off against the allowance for credit losses.
In some cases, the Company provides multiple types of concessions on one loan. Typically, one type of concession, such as term extension, is granted initially. If the borrower continues to experience financial difficulty, another concession, such as principal forgiveness, may be granted. For loans included in the "combination" columns below, multiple types of modifications have been made on the same loan within the current reporting period. The combination is at least two of the following: a term extension, principal forgiveness, an other-than-insignificant payment delay and/or an interest rate reduction.
The following table presents the amortized cost basis of loans at December 31, 2023 that were both experiencing financial difficulty and available for sale debt securities (“AFS”). For assets held atmodified during 2023, by class and by type of modification. The percentage of the amortized cost basis Accounting Standards Codification (“ASC”) 326 eliminatesof loans that were modified to borrowers in financial distress as compared to the amortized cost basis of each class of financing receivable is also presented below:
| | | | | | | | | | | | | | |
| ($ in thousands) | | Term Extension | | Percentage of Total Loans Held for Investment |
| Commercial real estate | | $ | 581 | | | 0.02 | % |
| Total | | $ | 581 | | | 0.02 | % |
The Company has not committed to lend additional amounts to the borrowers included in the previous table.
Debt Restructurings Prior to the Adoption of ASU 2022-02
If the Company grants a concession to a borrower for economic or legal reasons related to a borrower’s financial difficulties that it would not otherwise consider, the loan is classified as TDRs.
As of December 31, 2022 and 2021 the Company had TDRs totaling $21.8 million and $24.2 million, respectively. As of December 31, 2022, the Company had no additional amount committed on any loan classified as TDR. As of December 31, 2022 and 2021 TDRs had a related ACL of $841 thousand and $4.3 million, respectively.
The following table presents LHFI by class modified as TDRs that occurred during the twelve months ended December 31, 2022 and 2021.
| | | | | | | | | | | | | | | | | | | | | | | | | | |
| ($ in thousands, except for number of loans) | | | | | | | | |
| December 31, 2022 | | Number of
Loans | | Outstanding
Recorded
Investment
Pre-Modification | | Outstanding
Recorded
Investment
Post-Modification | | Interest
Income
Recognized |
| Consumer real estate | | 1 | | $ | 134 | | | $ | 135 | | | $ | 7 | |
| Total | | 1 | | $ | 134 | | | $ | 135 | | | $ | 7 | |
| | | | | | | | | | | | | | | | | | | | | | | | | | |
| December 31, 2021 | | | | | | | | |
| Commercial, financial, and agriculture | | 1 | | $ | 38 | | | $ | 37 | | | $ | 4 | |
| Commercial real estate | | 5 | | 5,151 | | | 4,890 | | | 230 | |
| Consumer real estate | | 4 | | 222 | | | 187 | | | 5 | |
| Consumer installment | | 1 | | 13 | | | 1 | | | — | |
| Total | | 11 | | $ | 5,424 | | | $ | 5,115 | | | $ | 239 | |
The TDRs presented above increased the ACL $22 thousand and $1.6 million and resulted in no charge-offs for the years ended December 31, 2022, and 2021, respectively.
The following table presents loans by class modified as TDRs for which there was a payment default within twelve months following the modification during the year ending December 31, 2022 and 2021.
| | | | | | | | | | | | | | | | | | | | | | | | | | |
| ($ in thousands, except for number of loans) | | 2022 | | 2021 |
Troubled Debt Restructurings
That Subsequently Defaulted: | | Number of
Loans | | Recorded
Investment | | Number of
Loans | | Recorded
Investment |
| Commercial real estate | | — | | $ | — | | | — | | $ | — | |
| Consumer real estate | | 1 | | 134 | | | 2 | | 55 | |
| Total | | 1 | | $ | 134 | | | 2 | | $ | 55 | |
The modifications described above included one of the following or a combination of the following: maturity date extensions, interest only payments, amortizations were extended beyond what would be available on similar type loans, and payment waiver. No interest rate concessions were given on these loans nor were any of these loans written down. A loan is considered to be in a payment default once it is 30 days contractually past due under the modified terms. The TDRs presented above increased the ACL $22 thousand and $21 thousand resulted in no charge-offs for the years ended December 31, 2022, and 2021, respectively.
The following tables represents the Company’s TDRs at December 31, 2022:
| | | | | | | | | | | | | | | | | | | | | | | | | | | | | | | | |
| December 31, 2022 | | | | | | | | | | |
| ($ in thousands) | | Current
Loans | | Past Due
30-89 | | Past Due 90
days and still
accruing | | Nonaccrual | | Total |
| Commercial, financial, and agriculture | | $ | 49 | | | $ | — | | | $ | — | | | $ | — | | | $ | 49 | |
| Commercial real estate | | 13,561 | | | — | | | — | | | 6,121 | | | 19,682 | |
| Consumer real estate | | 1,077 | | | — | | | — | | | 929 | | | 2,006 | |
| Consumer installment | | 14 | | | — | | | — | | | — | | | 14 | |
| Total | | $ | 14,701 | | | $ | — | | | $ | — | | | $ | 7,050 | | | $ | 21,751 | |
| Allowance for credit losses | | $ | 350 | | | $ | — | | | $ | — | | | $ | 491 | | | $ | 841 | |
Collateral Dependent Loans
The following table presents the amortized cost basis of collateral dependent individually evaluated loans by class of loans as of December 31, 2023 and 2022:
| | | | | | | | | | | | | | | | | | | | | | | |
| December 31, 2023 | | | | | | | |
| ($ in thousands) | Real Property | | Equipment | | Miscellaneous | | Total |
| Commercial financial, and agriculture | $ | — | | | $ | 496 | | | $ | 918 | | | $ | 1,414 | |
| Commercial real estate | 710 | | | — | | | — | | | 710 | |
| Consumer real estate | 778 | | | — | | | — | | | 778 | |
| Total | $ | 1,488 | | | $ | 496 | | | $ | 918 | | | $ | 2,902 | |
| | | | | | | | | | | |
| December 31, 2022 | | | |
| ($ in thousands) | Real Property | | Total |
| Commercial real estate | $ | 4,560 | | | $ | 4,560 | |
| Consumer real estate | 998 | | | 998 | |
| Total | $ | 5,558 | | | $ | 5,558 | |
A loan is collateral dependent when the borrower is experiencing financial difficulty and repayment of the loan is expected to be provided substantially through the sale of the collateral. The following provides a qualitative description by class of loan of the collateral that secures the Company’s collateral dependent LHFI:
•Commercial, financial and agriculture – Loans within these loan classes are secured by equipment, inventory accounts, and other non-real estate collateral.
•Commercial real estate – Loans within these loan classes are secured by commercial real property.
•Consumer real estate - Loans within these loan classes are secured by consumer real property.
•Consumer installment - Loans within these loan classes are secured by consumer goods, equipment, and non-real estate collateral.
There have been no significant changes to the collateral that secures these financial assets during the period.
Loan Participations
The Company has loan participations, which qualify as participating interest, with other financial institutions. As of December 31, 2023, these loans totaled $304.0 million, of which $165.9 million had been sold to other financial institutions and $138.1 million was purchased by the Company. As of December 31, 2022, these loans totaled $202.6 million, of which $100.1 million had been sold to other financial institutions and $102.5 million was purchased by the company. The loan participations convey proportionate ownership rights with equal priority to each participating interest holder; involving no recourse (other than ordinary representations and warranties) to, or subordination by, any participating interest holder; all cash flows are divided among the participating interest holders in proportion to each holder’s share of ownership; and no holder has the right to pledge the entire financial asset unless all participating interest holders agree.
Credit Quality Indicators
The Company categorizes loans into risk categories based on relevant information about the ability of borrowers to service their debt, such as current financial information, historical payment experience, credit documentation, public information, and current economic trends, among other factors. The Company analyzes loans individually to classify the loans as to credit risk. The Company uses the following definitions for risk ratings:
Pass: Loan classified as pass are deemed to possess average to superior credit quality, requiring no more than normal attention.
Special Mention: Loans classified as special mention have a potential weakness that deserves management's close attention. If left uncorrected, these potential weaknesses may result in deterioration of the repayment prospects for the loan or of the Company’s credit position at some future date.
Substandard: Loans classified as substandard are inadequately protected by the current incurrednet worth and paying capacity of the obligor or of the collateral pledged, if any. Loans so classified have a well-defined weakness or weaknesses that jeopardize the liquidation of the debt. They are characterized by the distinct possibility that the institution will sustain some loss approachif the deficiencies are not corrected.
Doubtful: Loans classified as doubtful have all the weaknesses inherent in those classified as substandard, with the added characteristic that the weaknesses make collection or liquidation in full, on the basis of currently existing facts, conditions, and instead requires an entityvalues, highly questionable and improbable.
These above classifications were the most current available as of December 31, 2023, and were generally updated within the prior year.
The tables below present the amortized cost basis of loans by credit quality indicator and class of loans based on the most recent analysis performed at year ends December 31, 2023 and 2022. Revolving loans converted to reflect its current estimateterm as of all expected credit losses. year ended December 31, 2023 and 2022 were not material to the total loan portfolio.
| | | | | | | | | | | | | | | | | | | | | | | | | | | | | | | | | | | | | | | | | | | | | | | | | | |
| ($ in thousands) | | Term Loans Amortized Cost Basis by Origination Year | | | | |
| As of December 31, 2023 | | 2023 | | 2022 | | 2021 | | 2020 | | 2019 | | Prior | | Revolving
Loans | | Total |
| Commercial, financial and agriculture: | | | | | | | | | | | | | | | | |
| Risk Rating | | | | | | | | | | | | | | | | |
| Pass | | $ | 102,263 | | | $ | 150,420 | | | $ | 113,487 | | | $ | 47,313 | | | $ | 36,065 | | | $ | 64,020 | | | $ | 281,646 | | | $ | 795,214 | |
| Special mention | | — | | | — | | | — | | | 141 | | | 797 | | | 3 | | | 10 | | | 951 | |
| Substandard | | 451 | | | 330 | | | 121 | | | 185 | | | 550 | | | 1,894 | | | 628 | | | 4,159 | |
| Doubtful | | — | | | — | | | — | | | — | | | — | | | — | | | — | | | — | |
| Total commercial, financial and agriculture | | $ | 102,714 | | | $ | 150,750 | | | $ | 113,608 | | | $ | 47,639 | | | $ | 37,412 | | | $ | 65,917 | | | $ | 282,284 | | | $ | 800,324 | |
| Current period gross write offs | | $ | 14 | | | $ | 51 | | | $ | 225 | | | $ | 139 | | | $ | 206 | | | $ | 110 | | | $ | — | | | $ | 745 | |
| | | | | | | | | | | | | | | | |
| Commercial real estate: | | | | | | | | | | | | | | | | |
| Risk Rating | | | | | | | | | | | | | | | | |
| Pass | | $ | 385,954 | | | $ | 825,505 | | | $ | 558,742 | | | $ | 377,085 | | | $ | 253,746 | | | $ | 569,428 | | | $ | 6,397 | | | $ | 2,976,857 | |
| Special mention | | — | | | 660 | | | 6,118 | | | 3,111 | | | 9,545 | | | 22,648 | | | — | | | 42,082 | |
| Substandard | | 136 | | | 7,293 | | | 393 | | | 566 | | | 5,427 | | | 26,401 | | | — | | | 40,216 | |
| Doubtful | | — | | | — | | | — | | | — | | | — | | | — | | | — | | | — | |
| Total commercial real estate | | $ | 386,090 | | | $ | 833,458 | | | $ | 565,253 | | | $ | 380,762 | | | $ | 268,718 | | | $ | 618,477 | | | $ | 6,397 | | | $ | 3,059,155 | |
| Current period gross write offs | | $ | — | | | $ | — | | | $ | 193 | | | $ | — | | | $ | — | | | $ | 57 | | | $ | — | | | $ | 250 | |
| | | | | | | | | | | | | | | | |
| Consumer real estate: | | | | | | | | | | | | | | | | |
| Risk Rating | | | | | | | | | | | | | | | | |
| Pass | | $ | 176,144 | | | $ | 334,056 | | | $ | 219,071 | | | $ | 127,539 | | | $ | 59,615 | | | $ | 163,464 | | | $ | 153,821 | | | $ | 1,233,710 | |
| Special mention | | — | | | 1,081 | | | — | | | — | | | 643 | | | 3,246 | | | 412 | | | 5,382 | |
| Substandard | | 502 | | | 404 | | | 511 | | | 1,559 | | | 514 | | | 6,988 | | | 3,225 | | | 13,703 | |
| Doubtful | | — | | | — | | | — | | | — | | | — | | | — | | | — | | | — | |
| Total consumer real estate | | $ | 176,646 | | | $ | 335,541 | | | $ | 219,582 | | | $ | 129,098 | | | $ | 60,772 | | | $ | 173,698 | | | $ | 157,458 | | | $ | 1,252,795 | |
| Current period gross write offs | | $ | 5 | | | $ | 19 | | | $ | — | | | $ | — | | | $ | — | | | $ | 25 | | | $ | — | | | $ | 49 | |
| | | | | | | | | | | | | | | | |
| Consumer installment: | | | | | | | | | | | | | | | | |
| Risk Rating | | | | | | | | | | | | | | | | |
| Pass | | $ | 24,482 | | | $ | 12,408 | | | $ | 7,316 | | | $ | 2,919 | | | $ | 1,213 | | | $ | 1,195 | | | $ | 8,156 | | | $ | 57,689 | |
| Special mention | | — | | | — | | | — | | | — | | | — | | | — | | | — | | | — | |
| Substandard | | — | | | 8 | | | 17 | | | 42 | | | 11 | | | — | | | 1 | | | 79 | |
| Doubtful | | — | | | — | | | — | | | — | | | — | | | — | | | — | | | — | |
| Total consumer installment | | $ | 24,482 | | | $ | 12,416 | | | $ | 7,333 | | | $ | 2,961 | | | $ | 1,224 | | | $ | 1,195 | | | $ | 8,157 | | | $ | 57,768 | |
| Current period gross write offs | | $ | 226 | | | $ | 567 | | | $ | 223 | | | $ | 179 | | | $ | 156 | | | $ | 576 | | | $ | 121 | | | $ | 2,048 | |
| | | | | | | | | | | | | | | | |
| Total | | | | | | | | | | | | | | | | |
| Pass | | $ | 688,843 | | | $ | 1,322,389 | | | $ | 898,616 | | | $ | 554,856 | | | $ | 350,639 | | | $ | 798,107 | | | $ | 450,020 | | | $ | 5,063,470 | |
| Special mention | | — | | | 1,741 | | | 6,118 | | | 3,252 | | | 10,985 | | | 25,897 | | | 422 | | | 48,415 | |
| Substandard | | 1,089 | | | 8,035 | | | 1,042 | | | 2,352 | | | 6,502 | | | 35,283 | | | 3,854 | | | 58,157 | |
| Doubtful | | — | | | — | | | — | | | — | | | — | | | — | | | — | | | — | |
| Total | | $ | 689,932 | | | $ | 1,332,165 | | | $ | 905,776 | | | $ | 560,460 | | | $ | 368,126 | | | $ | 859,287 | | | $ | 454,296 | | | $ | 5,170,042 | |
| Current period gross write offs | | $ | 245 | | | $ | 637 | | | $ | 641 | | | $ | 318 | | | $ | 362 | | | $ | 768 | | | $ | 121 | | | $ | 3,092 | |
| | | | | | | | | | | | | | | | | | | | | | | | | | | | | | | | | | | | | | | | | | | | | | | | | | |
| ($ in thousands) | | Term Loans Amortized Cost Basis by Origination Year | | | | |
| As of December 31, 2022 | | 2022 | | 2021 | | 2020 | | 2019 | | 2018 | | Prior | | Revolving
Loans | | Total |
| Commercial, financial and agriculture: | | | | | | | | | | | | | | | | |
| Risk Rating | | | | | | | | | | | | | | | | |
| Pass | | $ | 181,761 | | | $ | 141,174 | | | $ | 55,690 | | | $ | 53,954 | | | $ | 43,441 | | | $ | 52,038 | | | $ | 181 | | | $ | 528,239 | |
| Special mention | | 380 | | | 5,188 | | | 1,664 | | | — | | | — | | | 412 | | | — | | | 7,644 | |
| Substandard | | 50 | | | — | | | — | | | 34 | | | 33 | | | 192 | | | — | | | 309 | |
| Doubtful | | — | | | — | | | — | | | — | | | — | | | — | | | — | | | — | |
| Total commercial, financial and agriculture | | $ | 182,191 | | | $ | 146,362 | | | $ | 57,354 | | | $ | 53,988 | | | $ | 43,474 | | | $ | 52,642 | | | $ | 181 | | | $ | 536,192 | |
| Commercial real estate: | | | | | | | | | | | | | | | | |
| Risk Rating | | | | | | | | | | | | | | | | |
| Pass | | $ | 582,895 | | | $ | 436,661 | | | $ | 305,140 | | | $ | 217,626 | | | $ | 140,682 | | | $ | 368,185 | | | $ | 1,765 | | | $ | 2,052,954 | |
| Special mention | | 672 | | | 1,345 | | | 3,938 | | | 11,643 | | | 9,885 | | | 16,612 | | | — | | | 44,095 | |
| Substandard | | 50 | | | 2,830 | | | 908 | | | 1,694 | | | 4,797 | | | 27,935 | | | — | | | 38,214 | |
| Doubtful | | — | | | — | | | — | | | — | | | — | | | — | | | — | | | — | |
| Total commercial real estate | | $ | 583,617 | | | $ | 440,836 | | | $ | 309,986 | | | $ | 230,963 | | | $ | 155,364 | | | $ | 412,732 | | | $ | 1,765 | | | $ | 2,135,263 | |
| Consumer real estate: | | | | | | | | | | | | | | | | |
| Risk Rating | | | | | | | | | | | | | | | | |
| Pass | | $ | 325,853 | | | $ | 226,355 | | | $ | 136,052 | | | $ | 59,376 | | | $ | 51,515 | | | $ | 129,923 | | | $ | 112,278 | | | $ | 1,041,352 | |
| Special mention | | — | | | — | | | — | | | — | | | 823 | | | 3,846 | | | — | | | 4,669 | |
| Substandard | | 519 | | | 554 | | | 1,481 | | | 648 | | | 1,706 | | | 6,894 | | | 1,176 | | | 12,978 | |
| Doubtful | | — | | | — | | | — | | | — | | | — | | | — | | | — | | | — | |
| Total consumer real estate | | $ | 326,372 | | | $ | 226,909 | | | $ | 137,533 | | | $ | 60,024 | | | $ | 54,044 | | | $ | 140,663 | | | $ | 113,454 | | | $ | 1,058,999 | |
| Consumer installment: | | | | | | | | | | | | | | | | |
| Risk Rating | | | | | | | | | | | | | | | | |
| Pass | | $ | 18,925 | | | $ | 11,618 | | | $ | 5,031 | | | $ | 2,078 | | | $ | 832 | | | $ | 1,445 | | | $ | 3,725 | | | $ | 43,654 | |
| Special mention | | — | | | — | | | — | | | — | | | — | | | — | | | — | | | — | |
| Substandard | | 4 | | | 13 | | | 24 | | | — | | | 3 | | | 5 | | | — | | | 49 | |
| Doubtful | | — | | | — | | | — | | | — | | | — | | | — | | | — | | | — | |
| Total consumer installment | | $ | 18,929 | | | $ | 11,631 | | | $ | 5,055 | | | $ | 2,078 | | | $ | 835 | | | $ | 1,450 | | | $ | 3,725 | | | $ | 43,703 | |
| Total | | | | | | | | | | | | | | | | |
| Pass | | $ | 1,109,434 | | | $ | 815,808 | | | $ | 501,913 | | | $ | 333,034 | | | $ | 236,470 | | | $ | 551,591 | | | $ | 117,949 | | | $ | 3,666,199 | |
| Special mention | | 1,052 | | | 6,533 | | | 5,602 | | | 11,643 | | | 10,708 | | | 20,870 | | | — | | | 56,408 | |
| Substandard | | 623 | | | 3,397 | | | 2,413 | | | 2,376 | | | 6,539 | | | 35,026 | | | 1,176 | | | 51,550 | |
| Doubtful | | — | | | — | | | — | | | — | | | — | | | — | | | — | | | — | |
| Total | | $ | 1,111,109 | | | $ | 825,738 | | | $ | 509,928 | | | $ | 347,053 | | | $ | 253,717 | | | $ | 607,487 | | | $ | 119,125 | | | $ | 3,774,157 | |
Allowance for Credit Losses (ACL)
The
allowance for credit lossesACL is a valuation account that is deducted from
theloans’ amortized cost basis
of the financial assets to present the net amount expected to be
collected. This guidance also changescollected on the
accountingloans. It is comprised of a general allowance for
purchased loans
and debt securities with credit deterioration.ASC 326 also applies to off-balance sheet credit (“OBSC”) exposures such as unfunded loan commitments, letters of credit and other financial guarantees that are not unconditionally cancellablecollectively assessed in pools with similar risk characteristics and a specific allowance for individually assessed loans. The allowance is continuously monitored by the Company. The Company estimatesmanagement to maintain a level adequate to absorb expected credit losses overin the contractual period in which the Company is exposed to credit risk via a contractual obligation to extend credit, unless that obligation is unconditionally cancellable by the Company. The ACL on OBSC exposures is adjusted as a provision for credit loss expense. The estimate includes consideration of the likelihood that funding will occur and an estimate of expected credit losses on commitments expected to be funded over its estimated life. Expected credit losses related to OBSC exposures are presented as a liability.
loan portfolio.
The ACL represents the estimated losses for financial assets accounted for on an amortized cost basis. Expected losses are calculated using relevant information, from internal and external sources, about past events, including historical experience, current conditions, and reasonable and supportable forecasts that affect the collectability of the reported amount. Historical credit loss experience provides the basis for the estimation of expected credit losses. Adjustments to historical loss information are made for differences in current loan-specific risk characteristics such as differences in underwriting standards, portfolio mix, delinquency level, or term as well as for changes in environment conditions, such as changes in unemployment rates, property values, or other relevant factors. Management may selectively apply external market data to subjectively adjust the Company’s own loss history including index or peer data. Expected losses are estimated over the contractual term of the loans, adjusted for expected prepayments. The contractual term excludes
expected extensions, renewals, and modifications. Loans are charged-off against the allowance when management believes the uncollectibility of a loan balance is confirmed and recoveries are credited to the allowance when received. Expected
recoveriesrecovery amounts may not exceed the aggregate of amounts previously charged-off.
The ACL is measured on a collective basis when similar risk characteristics exist. Generally, collectively assessed loans are grouped by call code (segments). Segmenting loans by call code will group loans that contain similar types of collateral, purposes, and are usually structured with similar terms making each loan’s risk profile very similar to the rest in that segment. Each of these segments then flows up into one of the four bands (bands), Commercial, Financial, and Agriculture, Commercial Real Estate, Consumer Real Estate, and Consumer Installment. In accordance with the guidance in ASC 326, the Company redefined its LHFI portfolio segments and related loan classes based on the level at which risk is monitored within the ACL methodology. Construction loans for 1-4 family residential properties with a call code 1A1, and other construction, all land development and other land loans with a call code 1A2 were previously separated between the Commercial Real Estate or Consumer Real Estate bands based on loan type code. Under our ASC 326 methodology 1A1 loans are all defined as part of the Consumer Real Estate band and 1A2 loans are all defined as part of the Commercial Real Estate Band.
The probability of default (“PD”)PD calculation analyzes the historical loan portfolio over the given lookback period to identify, by segment, loans that have defaulted. A default is defined as a loan that has moved to past due 90 days and greater, nonaccrual status, or experienced a charge-off during the period. The model observes loans over a 12-month window, detecting any events previously defined. This information is then used by the model to calculate annual iterative count-based PD rates for each segment. This process is then repeated for all dates within the historical data range. These averaged PD’sPDs are used for an immediate reversion back to the historical mean. The historical data used to calculate this input was captured by the Company from 2009 through the most recent quarter end.
The Company utilizes reasonable and supportable forecasts of future economic conditions when estimating the ACL on loans. The model’s calculation also includes a 24-month forecasted PD based on a regression model that calculated a comparison of the Company’s historical loan data to various national economic metrics during the same periods. The results showed the Company’s past losses having a high rate of correlation to unemployment, both regionally and nationally. Using this information, along with the most recently published Wall Street Journal survey of sixty economists’ forecasts predicting unemployment rates out over the next eight quarters, a corresponding future PD can be calculated for the forward-looking 24-month period. This data can also be used to predict loan losses at different levels of stress, including a baseline, adverse and severely adverse economic condition. After the forecast period, PD rates revert to the historical mean of the entire data set.
The LGD calculation is based on actual losses (charge-offs, net recoveries) at a loan level experienced over the entire lookback period aggregated to get a total for each segment of loans. The aggregate loss amount is divided by the exposure at default to determine an LGD rate. Defaults occurring during the lookback period are included in the denominator, whether a loss occurred or not and exposure at default is determined by the loan balance immediately preceding the default event. If there is not a minimum of five past defaults in a loan segment, or less than 15.0% calculated LGD rate, or the total balance at default is less than
1%1.0% of the balance in the respective call code as of the model run date, a proxy index is used. This index is proprietary to the Company’s ACL modeling vendor derived from loss data of other client institutions similar in organization structure to the Company. The vendor also provides a “crisis” index derived from loss data between the post-recessionary years of 2008-2013 that the Company uses.
The model then uses these inputs in a non-discounted version of DCF methodology to calculate the quantitative portion of estimated losses. The model creates loan level amortization schedules that detail out the expected monthly payments for a loan including estimated prepayments and payoffs. These expected cash flows are discounted back to present value using the loan’s coupon rate instead of the effective interest rate. On a quarterly basis, the Company uses internal credit portfolio data, such as changes in portfolio volume and composition, underwriting practices, and levels of past due loans, nonaccruals and classified assets along with other external information not used in the quantitative calculation to determine if any subjective qualitative adjustments are required so that all significant risks are incorporated to form a sufficient basis to estimate credit losses.
The Company has purchased loans, some of which have experienced more than insignificant credit deterioration since origination. These PCD loans are recorded at the amount paid. It is the Company’s policy that a loan meets this definition if it is adversely risk rated as Non-Pass (Special Mention, Substandard, Doubtful or Loss) including non-accrual loans, as well as loans identified as TDR’s. An allowance for credit losses is determined using the same methodology as other loans held for investment. The initial allowance for credit losses determined on a collective basis is allocated to individual loans. The sum of the loan’s purchase price and allowance for credit losses becomes its initial amortized cost basis. The difference between the initial amortized cost basis and the par value of the loan is a noncredit discount or premium, which is amortized into interest income over the life of the loan. Subsequent changes to the allowance for credit losses are recorded through provision expense.
Upon adoption of ASC 326, the Company elected to maintain segments of loans that were previously accounted for under ASC 310-30 Accounting for Purchased Loans with Deteriorated Credit Quality and will continue to account for these segments as a unit of account unless the loan is collateral dependent. PCD loans that are collateral dependent will be assessed individually. Loans are only removed from the existing segments if they are written off, paid off, or sold. Upon adoption of ASC 326, the allowance for credit losses was determined for each segment and added to the band’s carrying amount to establish a new amortized cost basis. The difference between the unpaid principal balance of the segment and the new amortized cost basis is the noncredit premium or discount, which will be amortized into interest income over the remaining life of the segment. Changes to the allowance for credit losses after adoption are recorded through provision expense.
The Company adopted ASC 326 using the prospective transition approach for PCD assets that were previously classified as purchased credit impaired (“PCI”) and accounted for under ASC 310-30. In accordance with the standard, management did not reassess whether PCI assets met the criteria of PCD assets as of the date of adoption. Upon adoption of ASC 326, the Company increased the ACL by $1.1 million and adjusted the amortized cost basis of the PCD assets. The remaining noncredit discount of approximately $685 thousand (based on the adjusted amortized cost basis) will be accreted into interest income at the effective interest rate as of January 1, 2021. Loans that do not share risk characteristics are evaluated on an individual basis. Loans evaluated individually are not included in the collective evaluation. Loans classified as nonaccrual, TDRs, greater than 90 days past due and still accruing interest, and PCD loans that are collateral dependent will be reviewed quarterly for potential individual assessment. Any loan classified as nonaccrual, TDR, or PCD that is not determined to need individual assessment will be evaluated collectively within its respective segment.
ASC 326 requires that a loan be evaluated for losses individually and reserved for separately, if the loan does not share similar risk characteristics to any other loan segments. The Company’s process for determining which loans require specific evaluation follows the standard and is two-fold. All non-performing loans, including nonaccrual loans, loans considered to be TDRs or PCDs, are evaluated to determine if they meet the definition of collateral dependent under the new standard. These are loans where no more payments are expected from the borrower, and foreclosure or some other collection action is probable. Secondly, all non-performing loans that are not considered to be collateral dependent, but are 90 days or greater past due and/or have a balance of $500 thousand or greater, will be individually reviewed to determine if the loan displays similar risk characteristic to substandard loans in the related segment.
TDRs are loans for which the contractual terms on the loan have been modified and both of the following conditions exist: (1) the borrower is experiencing financial difficulty and (2) the restructuring constitutes a concession. Concessions could include a reduction in the interest rate on the loan, payment extensions, forgiveness of principal, forbearance or other actions intended to maximize collection. The Company assesses all loan modifications to determine whether they constitute a TDR.
The allowance for OBSC exposures was determined using the same methodology that is applied to LHFI. Utilization rates are determined based on historical usage.
The Company adopted ASC 326 using the prospective transition approach for debt securities for which other-than-temporary impairment had been recognized prior to January 1, 2021. As of December 31, 2020, the Company did not have any other-than-temporarily impaired investment securities. Therefore, upon adoption of ASC 326, the Company determined that an allowance for credit losses on available-for-sale securities was not deemed material.
Securities available-for-sale are reported at fair value with unrealized holding gains and losses reported as a separate component of stockholders’ equity and other comprehensive income (loss), net of taxes. Securities that are held as available-for-sale are used as a part of our asset/liability management strategy. Securities that may be sold in response to interest rate changes, changes in prepayment risk, the need to increase regulatory capital, and other similar factors are classified as available-for-sale. The Company evaluates all securities quarterly to determine if any securities in a loss position require a provision for credit losses in accordance with ASC 326, Measurement of Credit Losses on Financial Instruments. The Company first assesses whether it intends to sell or is more likely than not that the Company will be required to sell the security before recovery of its amortized cost basis. If either of the criteria regarding intent or requirement to sell is met, the security’s amortized cost basis is written down to fair value through income. For securities that do not meet these criteria, the Company evaluates whether the decline in fair value has resulted from credit losses or other factors. In making this assessment, the Company considers the extent to which fair value is less than amortized cost, any changes to the rating of the security by a rating agency, and adverse conditions specifically related to the security, among other factors. If this assessment indicates that a credit loss exists, the present value of cash flows expected to be collected from the security are compared to the amortized cost basis of the security. If the present value of cash flows expected to be collected is less than the amortized cost basis, a credit loss exists and an allowance for credit losses is recorded for the credit loss, limited by the amount that the fair value is less than the amortized cost basis. Any impairment that has not been recorded through an allowance for credit losses is recognized in other comprehensive income. Changes in the allowance for credit losses are recorded as provision for (or reversal of) credit loss expense. Losses are charged against the allowance when management believes the uncollectability of a security is confirmed or when either of the criteria regarding intent or requirement to sell is met.
Accrued interest receivable on available-for-sale debt securities totaled $5.7 million at December 31, 2020 and is excluded from the estimate of credit losses.
The Company made the following policy elections related to the adoption of the guidance in ASC 326:
| ● | Accrued interest will be written off against interest income when the related financial asset is charged off. Therefore, accrued interest will be excluded from the amortized cost basis for purposes of calculating the allowance for credit losses. Accrued interest receivable is presented with other assets in a separate line item in the consolidated balance sheet. |
| ● | The fair value of collateral practical expedient has been elected on certain loans, in determining the allowance for credit losses, for which the repayment is expected to be provided substantially through the operation or sale of the collateral when the borrower is experiencing financial difficulty. |
The adoption of ASC 326 increased the allowance for credit losses on loans by approximately $397 thousand and OBSC exposures by approximately $718 thousand at January 1, 2021, as shown below. The increase in the allowance for credit losses on loans includes the $1.1 million increase for PCD loans as discussed above, less a decrease in ACL for certain pooled loans:
| | | | | | | | | |
($ in thousands) | | | | | | | | January 1, |
| | December 31, | | | | | 2021 |
| | 2020 | | | | | As Reported |
| | Pre-ASC 326 | | Transition | | Under |
Assets: | | Adoption | | Adjustment | | ASC 326 |
Loans | | | | | | | | | |
Commercial, financial, and agriculture | | $ | 6,214 | | $ | (1,153) | | $ | 5,061 |
Commercial real estate | | | 24,319 | | | (4,032) | | | 20,287 |
Consumer real estate | | | 4,736 | | | 5,629 | | | 10,365 |
Consumer installment | | | 551 | | | (47) | | | 504 |
Allowance for credit losses on loans | | $ | 35,820 | | $ | 397 | | $ | 36,217 |
Liabilities: | | | | | | | | | |
Allowance for credit losses on OBSC exposures | | | 0 | | | 718 | | | 718 |
Total allowance for credit losses | | $ | 35,820 | | $ | 1,115 | | $ | 36,935 |
The transition had no net impact to retained earnings because the allowance for OBSC exposures was offset by decrease in the allowance for certain pooled loans.
New Accounting Standards That Have Not Yet Been Adopted
In March 2020, the Financial Accounting Standards Board (“FASB”) issued Accounting Standards Update (“ASU”) No. 2020-04, Reference Rate Reform (ASC 848): “Facilitation of the Effects of Reference Rate Reform on Financial Reporting.” This ASU provides temporary optional guidance to ease the potential burden in accounting for reference rate reform. The ASU provides optional expedients and exceptions for applying generally accepted accounting principles to contract modifications and hedging relationships, subject to meeting certain criteria, that reference LIBOR or another reference rate expected to be discontinued. It is intended to help stakeholders during the global market-wide reference rate transition period. The guidance is effective for all entities as of March 12, 2020 through December 31, 2022. The Company is assessing ASU 2020-04 and its impact on the Company’s transition away from LIBOR for its loan and other financial instruments.
In October 2021, FASB issued ASU No. 2021-08, Business Combination (Topic 805):“Accounting for Contract Assets and Contract Liabilities from Contracts with Customers.” This ASU requires entities to apply Topic 606 to recognize and measure contract assets and contract liabilities in a business combination. The amendment improves comparability after the business combination by providing consistent recognition and measurement guidance for revenue contracts with customers acquired in a business combination and revenue contracts with customers not acquired in a business combination. This ASU is effective for the Company after December 15, 2022. The Company is assessing ASU 2021-08 and its impact on the Company’s consolidated financial statements.
In November 2021, FASB issued ASU No. 2021-10, Government Assistance (Topic 832):“Disclosures by Business Entities about Government Assistance.” These amendments are expected to increase transparency in financial reporting by requiring business entities to disclose information about certain types of government assistance they receive. This ASU is effective for the Company’s financial statements after December 31, 2021. The Company is assessing ASU 2021-10 and its impact on the Company’s consolidated financial statements.
NOTE C - BUSINESS COMBINATIONS
The Company accounts for its business combinations using the acquisition method. Acquisition accounting requires the total purchase price to be allocated to the estimated fair values of assets acquired and liabilities assumed, including certain intangible assets that must be recognized. Typically, this allocation results in the purchase price exceeding the fair value of net assets acquired, which is recorded as goodwill. Core deposit intangibles are a measure of the value of checking, money market and savings deposits acquired in business combinations accounted for under the acquisition method. Core deposit intangibles and other identified intangibles with finite useful lives are amortized using the straight-line method over their estimated useful lives of up to ten years.
Financial assets acquired in a business combination after January 1, 2021, are recorded in accordance with ASC 326. Loans that the Company acquires in connection with acquisitions are recorded at fair value with no carryover of the related allowance for credit losses. PCD loans that have experienced more than insignificant credit deterioration since origination are recorded at the amount paid. The ACL is determined on a collective basis and is allocated to the individual loans. The sum of the loan’s purchase price and ACL becomes its initial amortized cost basis. The difference between the initial amortized cost basis and the par value of the loan is a noncredit discount or premium, which is amortized into interest income over the life of the loan. Non-PCD loans are acquired that have experienced no or insignificant deterioration in credit quality since origination. The difference between the fair value and outstanding balance of the non-PCD loans is recognized as an adjustment to interest income over the lives of the loan.
Acquisitions
Cadence Bank Branches
On December 3, 2021, The First completed its acquisition of seven Cadence Bank, N.A. (“Cadence”) branches in Northeast Mississippi (the “Cadence Branches”). In connection with the acquisition of the Cadence Branches, The First assumed $410.2 million in deposits, acquired $40.3 million in loans at fair value, acquired certain assets associated with the Cadence Branches at their book value, and paid a deposit premium of $1.0 million to Cadence. As a result of the acquisition, the Company will have an opportunity to increase its deposit base and reduce transaction costs. The Company also expects to reduce costs through economies of scale.
In connection with the acquisition of the Cadence Branches, the Company recorded a $1.3 million bargain purchase gain and $2.9 million core deposit intangible. The bargain purchase gain was generated as a result of the estimated fair value of net assets acquired exceeding the merger consideration, based on provisional fair values. The bargain purchase gain is considered non-taxable for income taxes purposes.
The core deposit intangible will be amortized to expense over 10 years.
Expenses associated with the branch acquisition of the Cadence Branches were $1.4 million for the twelve-month period ended December 31, 2021. These costs included charges associated with due diligence as well as legal and consulting expenses, which have been expensed as incurred. The Company also incurred $370 thousand of provision for credit losses on credit marks from the loans acquired.
The assets acquired and liabilities assumed and consideration paid in the acquisition of the Cadence Branches were recorded at their estimated fair values based on management’s best estimates using information available at the date of the acquisition and are subject to adjustment for up to one year after the closing date of the acquisition. While the fair values are not expected to be materially different from the estimates, accounting guidance provides that an acquirer must recognize adjustments to provisional amounts that are identified during the measurement period, which will run through December 3, 2022 in respect of the Cadence Branches, in the measurement period in which the adjustment amounts are determined. The acquirer must record in the financial statements, the effect on earnings of changes in depreciation, amortization or other income effects, if any, as a result of changes to the provisional amounts, calculated as if the accounting had been completed at the acquisition date. The items most susceptible to adjustment are the credit fair value adjustments on loans, core deposit intangible and the deferred income tax assets resulting from the acquisition.
The following table summarizes the provisional fair values of the assets acquired and liabilities assumed and the goodwill (bargain purchase gain) generated from the transaction ($ in thousands):
| | | |
Purchase price: | | | |
Cash | | $ | 1,000 |
Total purchase price | | | 1,000 |
| | | |
Identifiable assets: | | | |
Cash | | $ | 359,916 |
Loans | | | 40,262 |
Core deposit intangible | | | 2,890 |
Personal and real property | | | 9,675 |
Other assets | | | 135 |
Total assets | | | 412,878 |
| | | |
Liabilities and equity: | | | |
Deposits | | | 410,171 |
Other liabilities | | | 407 |
Total liabilities | | | 410,578 |
Net assets acquired | | | 2,300 |
Bargain purchase gain | | $ | (1,300) |
Southwest Georgia Financial Corporation
On April 3, 2020, the Company completed its acquisition of Southwest Georgia Financial Corporation (“SWG”), and immediately thereafter merged its wholly-owned subsidiary, Southwest Georgia Bank with and into The First. The Company paid a total consideration of $47.9 million to the SWG shareholders as consideration in the merger, which included 2,546,967 shares of Company common stock and approximately $2 thousand in cash. As a result of the acquisition, the Company was able to increase its loan and deposit base and reduce costs through economies of scale. The merger strengthened the Company’s market share and brought forth additional opportunities by adding a new market area in the Company’s footprint.
In connection with the acquisition, the Company recorded a $7.8 million bargain purchase gain and $4.6 million core deposit intangible. The bargain purchase gain was generated as a result of the estimated fair value of net assets acquired exceeding the merger consideration, based on fair values, which is reflected as an adjustment to retained earnings. The bargain purchase gain is considered non-taxable for income taxes purposes. The core deposit intangible will be amortized to expense over 10 years.
The Company acquired the $394.6 million loan portfolio at an estimated fair value discount of $2.3 million. The discount represents expected credit losses, adjusted for market interest rates and liquidity adjustments.
Expenses associated with the SWG acquisition were $0 and $2.5 million for the twelve months period ended December 31, 2021 and 2020. These costs included system conversion and integrating operations charges and legal and consulting expenses, which have been expensed as incurred.
The following table summarizes the finalized fair values of the assets acquired, liabilities assumed and the bargain purchase gain assumed in the SWG transaction, as of the acquisition date ($ in thousands):
| | | | | | | | | |
| | | | | Measurement | | | |
| | As Initially | | Period | | | |
| | Reported | | Adjustments | | As Adjusted |
Identifiable assets: | | | | | | | | | |
Cash and due from banks | | $ | 29,247 | | | — | | $ | 29,247 |
Investments | | | 89,737 | | | — | | | 89,737 |
Loans | | | 392,292 | | | — | | | 392,292 |
Core deposit intangible | | | 4,556 | | | — | | | 4,556 |
Personal and real property | | | 18,558 | | | — | | | 18,558 |
Bank owned life insurance | | | 6,963 | | | — | | | 6,963 |
Other assets | | | 2,589 | | | 813 | | | 3,402 |
Total assets | | | 543,942 | | | 813 | | | 544,755 |
| | | | | | | | | |
Liabilities and equity: | | | | | | | | | |
Deposits | | | 476,099 | | | — | | | 476,099 |
Borrowed funds | | | 9,500 | | | — | | | 9,500 |
Other liabilities | | | 3,461 | | | — | | | 3,461 |
Total liabilities | | | 489,060 | | | — | | | 489,060 |
Net assets acquired | | | 54,882 | | | 813 | | | 55,695 |
Consideration paid | | | 47,859 | | | (1) | | | 47,858 |
Bargain purchase gain | | $ | (7,023) | | | 812 | | $ | (7,835) |
During the second quarter of 2021, the Company finalized its analysis and valuation adjustments have been made to other assets since initially reported.
The outstanding principal balance and the carrying amount of these loans included in the consolidated balance sheet at December 31,2020, are as follows ($ in thousands):
| | | |
| | December 31, |
| | 2020 |
Outstanding principal balance | | $ | 297,528 |
Carrying amount | | | 295,772 |
Supplemental Pro Forma Information
The following table presents certain supplemental pro forma information, for illustrative purposes only, for the years December 31, 2021 and 2020 as if the SWG and Cadence Branches acquisitions had occurred on January 1, 2020. The pro forma financial information is not necessarily indicative of the results of operations had the acquisitions been effective as of this date.
| | | | | | |
($ in thousands) | | Pro Forma for the Year Ended |
| | December 31, |
| | 2021 | | 2020 |
| | (unaudited) | | (unaudited) |
Net interest income | | $ | 157,064 | | $ | 158,241 |
Non-interest income | | | 37,473 | | | 43,077 |
Total revenue | | | 194,537 | | | 201,318 |
Income before income taxes | | | 82,456 | | | 66,283 |
Supplemental pro-forma earnings were adjusted to exclude acquisition costs incurred. The Company’s operating results for the year ended December 31, 2021, include the operating results of the acquired assets and assumed liabilities of the Cadence Branches subsequent to the acquisition date. Due to the timing of the data conversion and the integration of operations of the branches onto the
Company’s existing operations, historical reporting of the acquired branches is impracticable, and therefore, disclosure of the amounts of revenue and expenses attributable to the acquired branches since the acquisition date are not available.
Non-credit impaired loans acquired in the acquisitions were accounted for in accordance with ASC 310-20, Receivables-Nonrefundable Fees and Other Costs. Purchased credit impaired loans acquired in the SWG acquisition were accounted for in accordance with ASC 310-30 Accounting for Purchased Loans with Deteriorated Credit Quality.
NOTE D - SECURITIES
On January 1, 2021, the Company adopted ASC 326, which made changes to the accounting for AFS debt securities whereby credit losses should be presented as an allowance, rather than as a write-down when management does not intend to sell and does not believe that it is more likely than not they will be required to sell prior to maturity. In addition, ASC 326 requires financial assets measured at amortized cost, including held-to-maturity debt securities, to measure an expected credit loss under CECL methodology that requires consideration of a broader range of reasonable and supportable information to inform credit losses estimates. For further discussion on the Company’s accounting policies and policy elections related to the accounting standard update refer to Note B “Summary of Significant Accounting Policies” to the Consolidated Financial Statements for additional information.
All securities information presented as of December 31, 2021 is in accordance with ASC 326. All securities information presented prior to January 1, 2021 is in accordance with previous applicable GAAP. See Company’s prior accounting policies in Note B “Summary of Significant Accounting Policies” of the 2020 Form 10-K.
Available-for-sale
ASC 326 makes targeted improvements to the accounting for credit losses on securities AFS. The concept of other-than-temporarily impaired has been replaced with the allowance for credit losses. Unlike securities held-to-maturity, securities available-for-sale are evaluated on an individual level and pooling of securities is not allowed.
Quarterly, the Company evaluates if a security has a fair value less than its amortized cost. Once these securities are identified, in order to determine whether a decline in fair value resulted from a credit loss or other factors, the Company performs further analysis as outlined below:
| ● | Review the extent to which the fair value is less than the amortized cost and determine if the decline is indicative of credit loss or other factors. |
| ● | The securities that violate the credit loss trigger above would be subjected to additional analysis. |
| ● | If the Company determines that a credit loss exists, the credit portion of the allowance will be measured using the DCF analysis using the effective interest rate. The amount of credit loss the Company records will be limited to the amount by which the amortized cost exceeds the fair value. The allowance for the calculated credit loss will be monitored going forward for further credit deterioration or improvement. |
At December 31, 2021, the results of the analysis did not identify any securities where the decline was indicative of credit loss factors; therefore, no DCF analysis was performed and no credit loss was recognized on any of the securities AFS.
Accrued interest receivable is excluded from the estimate of credit losses for securities AFS. At December 31, 2021, accrued interest receivable totaled $6.8 million for securities AFS and was reported in interest receivable on the accompanying Consolidated Balance Sheet.
All AFS securities were current with no securities past due or on nonaccrual as of December 31, 2021.
The following table summarizes the amortized cost, gross unrealized gains and losses, and estimated fair values of AFS securities at December 31, 2021 and 2020:
| | | | | | | | | | | | |
($ in thousands) | | December 31, 2021 |
| | | | | Gross | | Gross | | | |
| | Amortized | | Unrealized | | Unrealized | | Fair |
| | Cost | | Gains | | Losses | | Value |
Available-for-sale securities: | | | | | | | | | | | | |
U.S Treasury | | $ | 135,889 | | $ | 83 | | $ | 814 | | $ | 135,158 |
Obligations of U.S. government agencies and sponsored entities | | | 182,877 | | | 1,238 | | | 1,094 | | | 183,021 |
Tax-exempt and taxable obligations of states and municipal subdivisions | | | 698,861 | | | 12,452 | | | 2,811 | | | 708,502 |
Mortgage-backed securities - residential | | | 410,269 | | | 4,123 | | | 3,425 | | | 410,967 |
Mortgage-backed securities - commercial | | | 277,353 | | | 2,917 | | | 2,939 | | | 277,331 |
Corporate obligations | | | 35,904 | | | 962 | | | 13 | | | 36,853 |
Total available-for-sale | | $ | 1,741,153 | | $ | 21,775 | | $ | 11,096 | | $ | 1,751,832 |
| | | | | | | | | | | | |
($ in thousands) | | December 31, 2020 |
| | | | | Gross | | Gross | | |
| | Amortized | | Unrealized | | Unrealized | | Fair |
| | Cost | | Gains | | Losses | | Value |
Available-for-sale securities: | | | | | | | | | | | | |
U.S Treasury | | $ | 9,063 | | $ | 320 | | $ | 0 | | $ | 9,383 |
Obligations of U.S. government agencies and sponsored entities | | | 97,107 | | | 3,130 | | | 67 | | | 100,170 |
Tax-exempt and taxable obligations of states and municipal subdivisions | | | 464,348 | | | 16,326 | | | 300 | | | 480,374 |
Mortgage-backed securities - residential | | | 228,257 | | | 8,206 | | | 42 | | | 236,421 |
Mortgage-backed securities - commercial | | | 158,784 | | | 6,087 | | | 60 | | | 164,811 |
Corporate obligations | | | 30,063 | | | 976 | | | 16 | | | 31,023 |
Total available-for-sale | | $ | 987,622 | | $ | 35,045 | | $ | 485 | | $ | 1,022,182 |
The amortized cost and fair value of debt securities are shown by contractual maturity. Expected maturities may differ from contractual maturities if borrowers have the right to call or prepay obligations with or without call or prepayment penalties.
| | | | | | |
($ in thousands) | | December 31, 2021 |
| | Amortized | | Fair |
Available-for-Sale | | Cost | | Value |
Within one year | | $ | 33,767 | | $ | 33,972 |
One to five years | | | 248,751 | | | 251,747 |
Five to ten years | | | 406,890 | | | 408,579 |
Beyond ten years | | | 364,123 | | | 369,236 |
Mortgage-backed securities: residential | | | 410,269 | | | 410,967 |
Mortgage-backed securities: commercial | | | 277,353 | | | 277,331 |
Total | | $ | 1,741,153 | | $ | 1,751,832 |
The proceeds from sales and calls of securities and the associated gains and losses are listed below ($ in thousands):
| | | | | | | | | |
| | 2021 | | 2020 | | 2019 |
Gross gains | | $ | 202 | | $ | 289 | | $ | 147 |
Gross losses | | | 59 | | | 8 | | | 25 |
Realized net gain | | $ | 143 | | $ | 281 | | $ | 122 |
The amortized costs of securities pledged as collateral, to secure public deposits and for other purposes, was $889.5 million and $576.0 million at December 31, 2021 and December 31,2020, respectively.
The following table summarizes available-for-sale securities with unrealized losses position for which an allowance for credit losses has not been recorded at December 31, 2021 and that are not deemed to be other than temporarily impaired as of December 31, 2020. The securities are aggregated by major security type and length of time in a continuous unrealized loss position:
| | | | | | | | | | | | | | | | | | |
| | 2021 |
($ in thousands) | | Less than 12 Months | | 12 Months or Longer | | Total |
| | | | | | | | | | | | | | | |
| | Fair | | Unrealized | | Fair | | Unrealized | | Fair | | Unrealized |
| | Value | | Losses | | Value | | Losses | | Value | | Losses |
U.S. Treasury | | $ | 130,098 | | $ | 814 | | $ | 0 | | $ | 0 | | $ | 130,098 | | $ | 814 |
Obligations of U.S. government agencies and sponsored entities | | | 121,402 | | | 933 | | | 5,254 | | | 161 | | | 126,656 | | | 1,094 |
Tax-exempt and taxable obligations of states and municipal subdivisions | | | 249,430 | | | 2,692 | | | 3,692 | | | 119 | | | 253,122 | | | 2,811 |
Mortgage-backed securities: residential | | | 284,183 | | | 3,228 | | | 8,912 | | | 197 | | | 293,095 | | | 3,425 |
Mortgage-backed securities: commercial | | | 174,697 | | | 2,836 | | | 3,038 | | | 103 | | | 177,735 | | | 2,939 |
Corporate obligations | | | 6,692 | | | 8 | | | 42 | | | 5 | | | 6,734 | | | 13 |
Total available-for-sale | | $ | 966,502 | | $ | 10,511 | | $ | 20,938 | | $ | 585 | | $ | 987,440 | | $ | 11,096 |
| | | | | | | | | | | | | | | | | | |
| | 2020 |
| | Less than 12 Months | | 12 Months or Longer | | Total |
| | | | | | | | | | | | | | | |
| | Fair | | Unrealized | | Fair | | Unrealized | | Fair | | Unrealized |
($in thousands) | | Value | | Losses | | Value | | Losses | | Value | | Losses |
U.S. Treasury | | $ | 0 | | $ | 0 | | $ | 0 | | $ | 0 | | $ | — | | $ | — |
Obligations of U.S. government agencies and sponsored entities | | | 6,593 | | | 65 | | | 326 | | | 2 | | | 6,919 | | | 67 |
Tax-exempt and taxable obligations of states and municipal subdivisions | | | 10,193 | | | 300 | | | 0 | | | 0 | | | 10,193 | | | 300 |
Mortgage-backed securities: residential | | | 30,202 | | | 42 | | | 11 | | | 0 | | | 30,213 | | | 42 |
Mortgage-backed securities: commercial | | | 10,134 | | | 29 | | | 3,596 | | | 31 | | | 13,730 | | | 60 |
Corporate obligations | | | 5,217 | | | 8 | | | 40 | | | 8 | | | 5,257 | | | 16 |
Total available-for-sale | | $ | 62,339 | | $ | 444 | | $ | 3,973 | | $ | 41 | | $ | 66,312 | | $ | 485 |
At December 31, 2021 and December 31, 2020, the Company’s securities portfolio consisted of 304 and 71 securities, respectively, which were in an unrealized loss position. AFS securities in unrealized loss positions are evaluated for impairment related to credit losses at least quarterly. The unrealized losses shown above are due to increases in market rates over the yields available at the time of purchase of the underlying securities and not credit quality. The Company does not intend to sell these securities and it is more likely than not that the Company will not be required to sell the investments before recovery of their amortized cost basis. NaN allowance for credit losses was needed at December 31, 2021. The Company did not consider these investments to be other-than-temporarily impaired at December 31, 2020.
NOTE E - LOANS
On January 1, 2021, the Company adopted ASU 326. The FASB issued ASU 326 to replace the incurred loss model for loans and other financial assets with an expected loss model and requires consideration of a wider range of reasonable and supportable information to determine credit losses. In accordance with ASC 326, the Company has developed an ACL methodology, which replaces its previous allowance for loan losses methodology. All loan information presented as of December 31, 2021 is in accordance with ASC 326. All loan information presented prior to January 1, 2021 is in accordance with previous applicable GAAP. See the Company’s prior accounting policies in Note B “Summary of Significant Accounting Policies” of the 2020 Form 10-K.
The Company uses four different categories to classify loans in its portfolio based on the underlying collateral securing each loan. The loans grouped together in each category have been determined to share similar risk characteristics with respect to credit quality. Those four categories are commercial, financial and agriculture, commercial real estate, consumer real estate, consumer installment;
Commercial, financial and agriculture - Commercial, financial and agriculture loans include loans to business entities issued for commercial, industrial, or other business purposes. This type of commercial loan shares a similar risk characteristic in that unlike commercial real estate loans, repayment is largely dependent on cash flow generated from the operation of the business.
Commercial real estate - Commercial real estate loans are grouped as such because repayment is mainly dependent upon either the sale of the real estate, operation of the business occupying the real estate, or refinance of the debt obligation. This includes both owner-occupied and non-owner occupied CRE secured loans, because they share similar risk characteristics related to these variables.
Consumer real estate - Consumer real estate loans consist primarily of loans secured by 1-4 family residential properties and/or residential lots. This includes loans for the purpose of constructing improvements on the residential property, as well as home equity lines of credit.
Consumer installment – Installment and other loans are all loans issued to individuals that are not for any purpose related to operation of a business, and not secured by real estate. Repayment on these loans is mostly dependent on personal income, which may be impacted by general economic conditions.
The composition of the loan portfolio as of December 31, 2021 and December 31, 2020, is summarized below:
| | | | | | |
($ in thousands) | | December 31, 2021 | | December 31, 2020 |
Loans held for sale | | | | | | |
Mortgage loans held for sale | | $ | 7,678 | | $ | 21,432 |
Total LHFS | | $ | 7,678 | | $ | 21,432 |
| | | | | | |
Loans held for investment | | | | | | |
Commercial, financial and agriculture (1) | | $ | 397,516 | | $ | 579,443 |
Commercial real estate | | | 1,683,698 | | | 1,652,993 |
Consumer real estate | | | 838,654 | | | 850,206 |
Consumer installment | | | 39,685 | | | 41,036 |
Total loans | | | 2,959,553 | | | 3,123,678 |
Less allowance for credit losses | | | (30,742) | | | (35,820) |
Net LHFI | | $ | 2,928,811 | | $ | 3,087,858 |
| (1)
| Loan balance includes $41.1 million and $239.7 million in PPP loans as of December 31,2021 and 2020, respectively
|
Loans held for sale consist of mortgage loans originated by the Bank and sold into the secondary market. Commitments from investors to purchase the loans are obtained upon origination.
Accrued interest receivable is not included in the amortized cost basis of the Company’s LHFI. At December 31, 2021, accrued interest receivable for LHFI totaled $16.4 million with no related ACL and was reported in interest receivable on the accompanying consolidated balance sheet.
Nonaccrual and Past Due LHFI
Past due LHFI are loans contractually past due 30 days or more as to principal or interest payments. Generally, the Company will place a delinquent loan in nonaccrual status when the loan becomes 90 days or more past due. At the time a loan is placed in nonaccrual status, all interest which has been accrued on the loan but remains unpaid is reversed and deducted from earnings as a reduction of reported interest income. No additional interest is accrued on the loan balance until the collection of both principal and interest becomes reasonably certain.
The following tables presents the aging of the amortized cost basis in past due loans in addition to those loans classified as nonaccrual including PCD loans:
| | | | | | | | | | | | | | | | | | | | | |
| | December 31, 2021 |
| | | | | Past Due 90 | | | | | | | | Total | | | | | Nonaccural |
| | Past Due | | Days or More | | | | | | | | Past Due, | | | | | and PCD |
| | 30 to 89 | | and | | | | | | | | Nonaccrual | | Total | | with No |
($in thousands) | | Days | | Still Accruing | | Nonaccrual | | PCD | | and PCD | | LHFI | | ACL |
Commercial, financial and agriculture (1) | | $ | 246 | | $ | — | | $ | 190 | | $ | — | | $ | 436 | | $ | 397,516 | | $ | — |
Commercial real estate | | | 453 | | | — | | | 19,445 | | | 2,082 | | | 21,980 | | | 1,683,698 | | | 1,661 |
Consumer real estate | | | 2,140 | | | 45 | | | 3,776 | | | 2,512 | | | 8,473 | | | 838,654 | | | 1,488 |
Consumer installment | | | 121 | | | — | | | 7 | | | 1 | | | 129 | | | 39,685 | | | — |
Total | | $ | 2,960 | | $ | 45 | | $ | 23,418 | | $ | 4,595 | | $ | 31,018 | | $ | 2,959,553 | | $ | 3,149 |
(1)Total loan balance includes $41.1 million in PPP loans as of December 31, 2021.
| | | | | | | | | | | | | | | | | | |
| | December 31, 2020 |
| | | | | Past Due 90 | | | | | | | | Total | | | |
| | Past Due | | Days or More | | | | | | | | Past Due, | | | |
| | 30 to 89 | | and | | | | | | | | Nonaccrual | | Total |
($in thousands) | | Days | | Still Accruing | | Nonaccrual | | PCI | | and PCI | | LHFI |
Commercial, financial and agriculture (1) | | $ | 1,007 | | $ | 244 | | $ | 2,197 | | $ | 221 | | $ | 3,669 | | $ | 579,443 |
Commercial real estate | | | 2,116 | | | 1,553 | | | 19,499 | | | 3,388 | | | 26,556 | | | 1,652,993 |
Consumer real estate | | | 5,389 | | | 895 | | | 2,480 | | | 5,954 | | | 14,718 | | | 850,206 |
Consumer installment | | | 419 | | | — | | | 32 | | | 3 | | | 454 | | | 41,036 |
Total | | $ | 8,931 | | $ | 2,692 | | $ | 24,208 | | $ | 9,566 | | $ | 45,397 | | $ | 3,123,678 |
(1)Total loan balance includes $239.7 million in PPP loans as of December 31, 2020.
Acquired Loans
On January 1, 2021, the Company adopted ASC 326 and elected to account for its existing acquired PCI loans as PCD loans included within the LHFI portfolio. The Company elected to maintain segments of loans that were previously accounted for under ASC 310-30 and will continue to account for these segments as a unit of account unless the loan is collateral dependent. PCD loans that are collateral dependent will be assessed individually. Loans are only removed from the existing segments if they are written off, paid off, or sold. Upon adoption of ASC 326, the ACL was determined for each segment and added to the band’s carrying amount to establish a new amortized cost basis. The difference between the unpaid principal balance of the segment and the new amortized cost basis was the noncredit discount of approximately $685 thousand, which will be accreted into interest income over the remaining life of the segment. Changes to the ACL after adoption are recorded through provision expense. As of December 31, 2021, the amortized cost of the Company’s PCD loans totaled $8.6 million, which had an estimated ACL of $855 thousand.
Prior to the adoption of FASB ASC 326, the Company acquired loans with deteriorated credit quality in 2014, 2017, 2018, 2019 and 2020. These loans were recorded at estimated fair value at the acquisition date with no carryover of the related allowance for loan losses. The acquired loans were segregated as of the acquisition date between those considered to be performing (acquired non-impaired loans) and those with evidence of credit deterioration (PCI loans). Acquired loans are considered to be impaired if it is probable, based on current available information, that the Company will be unable to collect all cash flows as expected. If expected cash flows cannot reasonably be estimated as to what will be collected, there will not be any interest income recognized on these loans.
Impaired LHFI
Prior to the adoption of FASB ASC 326, the Company individually evaluated impaired LHFI. The following table provides a detail of impaired loans broken out according to class as of December 31, 2020 and 2019. The following table does not include PCI loans. The recorded investment included in the following table represents customer balances net of any partial charge-offs recognized on the loans, net of any deferred fees and costs. Recorded investment excludes any insignificant amount of accrued interest receivable on loans 90-days or more past due and still accruing. The unpaid balance represents the recorded balance prior to any partial charge-offs.
| | | | | | | | | | | | | | | |
December 31, 2020 | | | | | | | | | | | Average | | Interest |
($ in thousands) | | | | | | | | | | | Recorded | | Income |
| | Recorded | | Unpaid | | Related | | Investment | | Recognized |
| | Investment | | Balance | | Allowance | | YTD | | YTD |
Impaired loans with no related allowance: | | | | | | | | | | | | | | | |
Commercial, financial and agriculture | | $ | 0 | | $ | 0 | | $ | 0 | | $ | 198 | | $ | 0 |
Commercial real estate | | | 5,884 | | | 6,087 | | | 0 | | | 11,433 | | | 47 |
Consumer real estate | | | 712 | | | 758 | | | 0 | | | 790 | | | 5 |
Consumer installment | | | 23 | | | 24 | | | 0 | | | 17 | | | 0 |
Total | | $ | 6,619 | | $ | 6,869 | | $ | 0 | | $ | 12,438 | | $ | 52 |
| | | | | | | | | | | | | | | |
Impaired loans with a related allowance: | | | | | | | | | | | | | | | |
Commercial, financial and agriculture | | $ | 2,241 | | $ | 2,254 | | $ | 1,235 | | $ | 2,186 | | $ | 58 |
Commercial real estate | | | 17,973 | | | 18,248 | | | 4,244 | | | 13,687 | | | 36 |
Consumer real estate | | | 536 | | | 544 | | | 176 | | | 734 | | | 4 |
Consumer installment | | | 26 | | | 26 | | | 14 | | | 86 | | | 0 |
Total | | $ | 20,776 | | $ | 21,072 | | $ | 5,669 | | $ | 16,693 | | $ | 98 |
| | | | | | | | | | | | | | | |
Total impaired loans: | | | | | | | | | | | | | | | |
Commercial, financial and agriculture | | $ | 2,241 | | $ | 2,254 | | $ | 1,235 | | $ | 2,384 | | $ | 58 |
Commercial real estate | | | 23,857 | | | 24,335 | | | 4,244 | | | 25,120 | | | 83 |
Consumer real estate | | | 1,248 | | | 1,302 | | | 176 | | | 1,524 | | | 9 |
Consumer installment | | | 49 | | | 50 | | | 14 | | | 103 | | | 0 |
Total Impaired Loans | | $ | 27,395 | | $ | 27,941 | | $ | 5,669 | | $ | 29,131 | | $ | 150 |
| | | | | | | | | | | | | | | |
| | | | | | | | | | | Average | | Interest |
| | | | | | | | | | | Recorded | | Income |
December 31, 2019 | | Recorded | | Unpaid | | Related | | Investment | | Recognized |
($ in thousands) | | Investment | | Balance | | Allowance | | YTD | | YTD |
Impaired loans with no related allowance: | | | | | | | | | | | | | | | |
Commercial, financial and agriculture | | $ | 59 | | $ | 62 | | $ | — | | $ | 294 | | $ | 7 |
Commercial real estate | | | 13,556 | | | 13,671 | | | — | | | 10,473 | | | 591 |
Consumer real estate | | | 542 | | | 594 | | | — | | | 2,173 | | | — |
Consumer installment | | | 21 | | | 21 | | | — | | | 23 | | | — |
Total | | $ | 14,178 | | $ | 14,348 | | $ | — | | $ | 12,963 | | $ | 598 |
| | | | | | | | | | | | | | | |
Impaired loans with a related allowance: | | | | | | | | | | | | | | | |
Commercial, financial and agriculture | | $ | 2,434 | | $ | 2,434 | | $ | 1,182 | | $ | 2,039 | | $ | 13 |
Commercial real estate | | | 12,428 | | | 12,563 | | | 3,021 | | | 10,026 | | | 49 |
Consumer real estate | | | 639 | | | 657 | | | 141 | | | 560 | | | 3 |
Consumer installment | | | 260 | | | 260 | | | 80 | | | 164 | | | 2 |
Total | | $ | 15,761 | | $ | 15,914 | | $ | 4,424 | | $ | 12,789 | | $ | 67 |
| | | | | | | | | | | | | | | |
Total impaired loans: | | | | | | | | | | | | | | | |
Commercial, financial and agriculture | | $ | 2,493 | | $ | 2,496 | | $ | 1,182 | | $ | 2,333 | | $ | 20 |
Commercial real estate | | | 25,984 | | | 26,234 | | | 3,021 | | | 20,499 | | | 640 |
Consumer real estate | | | 1,181 | | | 1,251 | | | 141 | | | 2,733 | | | 3 |
Consumer installment | | | 281 | | | 281 | | | 80 | | | 187 | | | 2 |
Total Impaired Loans | | $ | 29,939 | | $ | 30,262 | | $ | 4,424 | | $ | 25,752 | | $ | 665 |
The cash basis interest earned in the chart above is materially the same as the interest recognized during impairment for the years ended December 31, 2020 and 2019.
The gross interest income that would have been recorded in the period that ended if the nonaccrual loans had been current in accordance with their original terms and had been outstanding throughout the period or since origination, if held for part of twelve months for the years ended December 31, 2020 and 2019, was $1.5 million and $348 thousand, respectively. The Company had 0 loan commitments to borrowers in nonaccrual status at December 31, 2020 and 2019.
Troubled Debt Restructurings
If the Company grants a concession to a borrower for economic or legal reasons related to a borrower’s financial difficulties that it would not otherwise consider, the loan is classified as TDRs.
In response to the COVID-19 pandemic and its economic impact to its customers, the Company implemented a short-term modification program in accordance with interagency regulatory guidance to provide temporary payment relief to those borrowers directly impacted by COVID-19 who were not more than 30 days past due at the time of the modification. This program allowed for a deferral of payments for up two successive 90-day periods for a cumulative maximum of 180 days. Pursuant to interagency guidance, such short-term deferrals are not deemed to meet the criteria for reporting as TDRs. For borrowers requiring a longer-term modification following the short-term loan modification program the Company worked with these borrowers whose loans were not more 30 days past due at December 31, 2019 and who required modification as a result of COVID-19 to modify such loans under Section 4013 of the CARES Act.
As of December 31, 2021, 2020, and 2019 the Company had TDRs totaling $24.2 million, $27.5 million, and $32.0 million, respectively. As of December 31, 2021, the Company had 0 additional amount committed on any loan classified as TDR. As of December 31, 2021, TDRs had a related ACL of $4.3 million, compared to a related allowance for loan loss of $4.1 million and $2.1 million at December 31, 2020 and 2019, respectively.
The following table presents LHFI by class modified as TDRs that occurred during the twelve months ended December 31, 2021, 2020, and 2019 ($ in thousands, except for number of loans).
| | | | | | | | | | | |
| | | | Outstanding | | Outstanding | | |
| | | | Recorded | | Recorded | | Interest |
| | Number of | | Investment | | Investment | | Income |
December 31, 2021 | | Loans | | Pre-Modification | | Post-Modification | | Recognized |
Commercial, financial and agriculture | | 1 | | $ | 38 | | $ | 37 | | $ | 4 |
Commercial real estate | | 5 | | | 5,151 | | | 4,890 | | | 230 |
Consumer real estate | | 4 | | | 222 | | | 187 | | | 5 |
Consumer installment | | 1 | | | 13 | | | 1 | | | 0 |
Total | | 11 | | $ | 5,424 | | $ | 5,115 | | $ | 239 |
| | | | | | | | | | | |
December 31, 2020 | | | | | | | | | | | |
Commercial, financial and agriculture | | 1 | | $ | 12 | | $ | 9 | | $ | 2 |
Commercial real estate | | 7 | | | 2,067 | | | 2,042 | | | 40 |
Consumer installment | | 1 | | | 1 | | | 1 | | | — |
Total | | 9 | | $ | 2,080 | | $ | 2,052 | | $ | 42 |
| | | | | | | | | | | |
December 31, 2019 | | | | | | | | | | | |
Commercial, financial and agriculture | | 7 | | $ | 979 | | $ | 1,023 | | $ | 19 |
Commercial real estate | | 14 | | | 15,953 | | | 16,122 | | | 137 |
Consumer real estate | | 3 | | | 551 | | | 553 | | | 12 |
Consumer installment | | 2 | | | 10 | | | 11 | | | — |
Total | | 26 | | $ | 17,493 | | $ | 17,709 | | $ | 168 |
The TDRs presented above increased the ACL $1.6 million and increased the allowance for loan losses $127 thousand and $1.4 million and resulted in 0 charge-offs for the years ended December 31, 2021, 2020, and 2019, respectively.
The following table presents loans by class modified as TDRs for which there was a payment default within twelve months following the modification during the year ending December 31, 2021, 2020, and 2019 ($ in thousands, except for number of loans).
| | | | | | | | | | | | | | | | |
| | 2021 | | 2020 | | 2019 |
Troubled Debt Restructurings | | Number of | | Recorded | | Number of | | Recorded | | Number of | | Recorded |
That Subsequently Defaulted: | | Loans | | Investment | | Loans | | Investment | | Loans | | Investment |
Commercial, financial and agriculture | | — | | $ | — | | — | | $ | — | | | 10 | | $ | 458 |
Commercial real estate | | — | | | — | | 4 | | | 1,121 | | | 4 | | | 15,423 |
Consumer real estate | | 2 | | | 55 | | — | | | — | | | — | | | — |
Total | | 2 | | $ | 55 | | 4 | | $ | 1,121 | | | 14 | | $ | 15,881 |
The modifications described above included one of the following or a combination of the following: maturity date extensions, interest only payments, amortizations were extended beyond what would be available on similar type loans, and payment waiver. No interest rate concessions were given on these loans nor were any of these loans written down. A loan is considered to be in a payment default once it is 30 days contractually past due under the modified terms. The TDRs presented above increased the ACL $21 thousand and the allowance for loan losses $81 thousand and $1.3 million and resulted in no charge-offs for the years ended December 31, 2021, 2020, and 2019 respectively.
The following tables represents the Company’s TDRs at December 31, 2021 and 2020:
| | | | | | | | | | | | | | | |
December 31, 2021 | | | | | | | | | | | | | | | |
| | | | | | | | Past Due 90 | | | | | | |
| | Current | | Past Due | | days and still | | | | |
| | Loans | | 30-89 | | accruing | | Nonaccrual | | Total |
($ in thousands) | | | | | | | | | | | | | | | |
Commercial, financial and agriculture | | $ | 63 | | $ | — | | $ | — | | $ | 107 | | $ | 170 |
Commercial real estate | | | 3,367 | | | — | | | — | | | 16,858 | | | 20,225 |
Consumer real estate | | | 1,772 | | | — | | | — | | | 1,973 | | | 3,745 |
Consumer installment | | | 18 | | | — | | | — | | | — | | | 18 |
Total | | $ | 5,220 | | $ | — | | $ | — | | $ | 18,938 | | $ | 24,158 |
Allowance for credit losses | | $ | 90 | | $ | — | | $ | — | | $ | 4,217 | | $ | 4,307 |
| | | | | | | | | | | | | | | |
December 31, 2020 | | | | | | | | | | | | | | | |
| | | | | | | | Past Due 90 | | | | | | |
| | Current | | Past Due | | days and still | | | | | |
($ in thousands) | | Loans | | 30-89 | | accruing | | Nonaccrual | | Total |
Commercial, financial and agriculture | | $ | 59 | | $ | — | | $ | — | | $ | 765 | | $ | 824 |
Commercial real estate | | | 4,560 | | | 49 | | | — | | | 18,076 | | | 22,685 |
Consumer real estate | | | 1,559 | | | 269 | | | — | | | 2,161 | | | 3,989 |
Consumer installment | | | 23 | | | 3 | | | — | | | — | | | 26 |
Total | | $ | 6,201 | | $ | 321 | | $ | — | | $ | 21,002 | | $ | 27,524 |
Allowance for loan losses | | $ | 163 | | $ | 29 | | $ | — | | $ | 3,936 | | $ | 4,128 |
For the year ended December 31, 2021, we have modified approximately 1,643 loans for $710.7 million, of which 1,391 loans for $582.3 million were modified to defer monthly principal and interest payments and 252 loans for $128.4 million were modified from monthly principal and interest payments to interest only. As of December 31, 2021, we have approximately 419 PPP loans approved through the SBA for a balance of $41.1 million outstanding. PPP loans were excluded from the allowance for credit losses.
Collateral Dependent Loans
The following table presents the amortized cost basis of collateral dependent individually evaluated loans by class of loans as of December 31, 2021:
| | | | | | |
($ in thousands) | | Real Property | | Total |
Commercial real estate | | $ | 1,712 | | $ | 1,712 |
Consumer real estate | | | 1,858 | | | 1,858 |
Total | | $ | 3,570 | | $ | 3,570 |
A loan is collateral dependent when the borrower is experiencing financial difficulty and repayment of the loan is expected to be provided substantially through the sale of the collateral. The following provides a qualitative description by class of loan of the collateral that secures the Company’s collateral-dependent LHFI:
| ● | Commercial, financial and agriculture – Loans within these loan classes are secured by equipment, inventory accounts, and other non-real estate collateral. |
| ● | Commercial real estate – Loans within these loan classes are secured by commercial real property. |
| ● | Consumer real estate - Loans within these loan classes are secured by consumer real property. |
| ● | Consumer installment - Loans within these loan classes are secured by consumer goods, equipment, and non-real estate collateral. |
There have been no significant changes to the collateral that secures these financial assets during the period.
Loan Participations
The Company has loan participations, which qualify as participating interest, with other financial institutions. As of December 31, 2021, these loans totaled $118.4 million, of which $77.8 million had been sold to other financial institutions and $40.6 million was purchased by the Company. As of December 31, 2020, these loans totaled $127.7 million, of which $80.3 million had been sold to other financial institutions and $47.4 million was purchased by the company. The loan participations convey proportionate ownership rights with equal priority to each participating interest holder; involving no recourse (other than ordinary representations and warranties) to, or subordination by, any participating interest holder; all cash flows are divided among the participating interest holders in proportion to each holder’s share of ownership; and no holder has the right to pledge the entire financial asset unless all participating interest holders agree.
Credit Quality Indicators
The Company categorizes loans into risk categories based on relevant information about the ability of borrowers to service their debt, such as current financial information, historical payment experience, credit documentation, public information, and current economic trends, among other factors. The Company analyzes loans individually to classify the loans as to credit risk. The Company uses the following definitions for risk ratings:
Pass: Loan classified as pass are deemed to possess average to superior credit quality, requiring no more than normal attention.
Special Mention: Loans classified as special mention have a potential weakness that deserves management's close attention. If left uncorrected, these potential weaknesses may result in deterioration of the repayment prospects for the loan or of the Company’s credit position at some future date.
Substandard: Loans classified as substandard are inadequately protected by the current net worth and paying capacity of the obligor or of the collateral pledged, if any. Loans so classified have a well-defined weakness or weaknesses that jeopardize the liquidation of the debt. They are characterized by the distinct possibility that the institution will sustain some loss if the deficiencies are not corrected.
Doubtful: Loans classified as doubtful have all the weaknesses inherent in those classified as substandard, with the added characteristic that the weaknesses make collection or liquidation in full, on the basis of currently existing facts, conditions, and values, highly questionable and improbable.
These above classifications were the most current available as of December 31, 2021, and were generally updated within the prior year.
The tables below present the amortized cost basis of loans by credit quality indicator and class of loans based on the most recent analysis performed. Revolving loans converted to term as of year ended December 31, 2021 were not material to the total loan portfolio.
| | | | | | | | | | | | | | | | | | | | | | | | |
($ in thousands) | | Term Loans Amortized Cost Basis by Origination Year | | | | | | |
| | | | | | | | | | | | | | | | | | | Revolving | | | |
As of December 31, 2021 | | 2021 | | 2020 | | 2019 | | 2018 | | 2017 | | Prior | | Loans | | Total |
Commercial, financial and: | | | | | | | | | | | | | | | | | | | | | | | | |
agriculture | | | | | | | | | | | | | | | | | | | | | | | | |
Risk Rating | | | | | | | | | | | | | | | | | | | | | | | | |
Pass | | $ | 152,798 | | $ | 60,106 | | $ | 52,802 | | $ | 47,988 | | $ | 22,083 | | $ | 43,773 | | $ | 178 | | $ | 379,728 |
Special mention | | | — | | | 255 | | | 749 | | | 90 | | | 481 | | | 29 | | | — | | | 1,604 |
Substandard | | | — | | | — | | | 1,398 | | | 6,184 | | | 360 | | | 8,242 | | | — | | | 16,184 |
Doubtful | | | — | | | — | | | — | | | — | | | — | | | — | | | — | | | — |
Total commercial, financial and agriculture | | $ | 152,798 | | $ | 60,361 | | $ | 54,949 | | $ | 54,262 | | $ | 22,924 | | $ | 52,044 | | $ | 178 | | $ | 397,516 |
| | | | | | | | | | | | | | | | | | | | | | | | |
Commercial real estate: | | | | | | | | | | | | | | | | | | | | | | | | |
Risk Rating | | | | | | | | | | | | | | | | | | | | | | | | |
Pass | | $ | 402,284 | | $ | 313,288 | | $ | 207,879 | | $ | 177,943 | | $ | 134,234 | | $ | 332,588 | | $ | — | | $ | 1,568,216 |
Special mention | | | 1,326 | | | 2,259 | | | 1,782 | | | 15,076 | | | 2,779 | | | 15,519 | | | — | | | 38,741 |
Substandard | | | 3,904 | | | 3,189 | | | 1,931 | | | 17,147 | | | 18,814 | | | 31,756 | | | — | | | 76,741 |
Doubtful | | | — | | | — | | | — | | | — | | | — | | | — | | | — | | | — |
Total commercial real estate | | $ | 407,514 | | $ | 318,736 | | $ | 211,592 | | $ | 210,166 | | $ | 155,827 | | $ | 379,863 | | $ | — | | $ | 1,683,698 |
| | | | | | | | | | | | | | | | | | | | | | | | |
Consumer real estate: | | | | | | | | | | | | | | | | | | | | | | | | |
Risk Rating | | | | | | | | | | | | | | | | | | | | | | | | |
Pass | | $ | 243,340 | | $ | 164,359 | | $ | 70,465 | | $ | 66,940 | | $ | 51,988 | | $ | 121,238 | | $ | 98,444 | | $ | 816,774 |
Special mention | | | — | | | — | | | 331 | | | 26 | | | 1,746 | | | 1,949 | | | — | | | 4,052 |
Substandard | | | 444 | | | 532 | | | 1,280 | | | 3,410 | | | 1,288 | | | 9,241 | | | 1,633 | | | 17,828 |
Doubtful | | | — | | | — | | | — | | | — | | | — | | | — | | | — | | | — |
Total consumer real estate | | $ | 243,784 | | $ | 164,891 | | $ | 72,076 | | $ | 70,376 | | $ | 55,022 | | $ | 132,428 | | $ | 100,077 | | $ | 838,654 |
| | | | | | | | | | | | | | | | | | | | | | | | |
Consumer installment: | | | | | | | | | | | | | | | | | | | | | | | | |
Risk Rating | | | | | | | | | | | | | | | | | | | | | | | | |
Pass | | $ | 17,980 | | $ | 9,245 | | $ | 4,222 | | $ | 1,645 | | $ | 1,088 | | $ | 1,758 | | $ | 3,697 | | $ | 39,635 |
Special mention | | | — | | | — | | | — | | | — | | | 1 | | | — | | | — | | | 1 |
Substandard | | | — | | | 26 | | | 3 | | | 5 | | | 8 | | | 7 | | | — | | | 49 |
Doubtful | | | — | | | — | | | — | | | — | | | — | | | — | | | — | | | — |
Total consumer installment | | $ | 17,980 | | $ | 9,271 | | $ | 4,225 | | $ | 1,650 | | $ | 1,097 | | $ | 1,765 | | $ | 3,697 | | $ | 39,685 |
| | | | | | | | | | | | | | | | | | | | | | | | |
Total | | | | | | | | | | | | | | | | | | | | | | | | |
Pass | | $ | 816,402 | | $ | 546,998 | | $ | 335,368 | | $ | 294,516 | | $ | 209,393 | | $ | 499,357 | | $ | 102,319 | | $ | 2,804,353 |
Special mention | | | 1,326 | | | 2,514 | | | 2,862 | | | 15,192 | | | 5,007 | | | 17,497 | | | — | | | 44,398 |
Substandard | | | 4,348 | | | 3,747 | | | 4,612 | | | 26,746 | | | 20,470 | | | 49,246 | | | 1,633 | | | 110,802 |
Doubtful | | | 0 | | | 0 | | | 0 | | | 0 | | | 0 | | | 0 | | | 0 | | | 0 |
Total | | $ | 822,076 | | $ | 553,259 | | $ | 342,842 | | $ | 336,454 | | $ | 234,870 | | $ | 566,100 | | $ | 103,952 | | $ | 2,959,553 |
At December 31, 2020, and based on the most recent analysis performed, the risk category of loans by class of loans (excluding mortgage loans held for sale) was as follows:
| | | | | | | | | | | | | | | |
| | Commercial, | | | | | | | | | | | |
December 31, 2020 | | Financial and | | Commercial | | Consumer | | Consumer | | | |
($ in thousands) | | Agriculture | | Real Estate | | Real Estate | | Installment | | Total |
Pass | | $ | 563,772 | | $ | 1,530,366 | | $ | 834,920 | | $ | 40,884 | | $ | 2,969,942 |
Special Mention | | | 2,143 | | | 64,012 | | | 1,889 | | | 20 | | | 68,064 |
Substandard | | | 11,875 | | | 66,535 | | | 13,397 | | | 132 | | | 91,939 |
Doubtful | | | 1,653 | | | 23 | | | - | | | - | | | 1,676 |
Subtotal | | $ | 579,443 | | $ | 1,660,936 | | $ | 850,206 | | $ | 41,036 | | $ | 3,131,621 |
Less: Unearned discount | | | - | | | 7,943 | | | - | | | - | | | 7,943 |
LHFI, net of unearned discount | | $ | 579,443 | | $ | 1,652,993 | | $ | 850,206 | | $ | 41,036 | | $ | 3,123,678 |
Allowance for Credit Losses (ACL)
The ACL is a valuation account that is deducted from loans’ amortized cost basis to present the net amount expected to be collected on the loans. It is comprised of a general allowance for loans that are collectively assessed in pools with similar risk characteristics and a specific allowance for individually assessed loans. The allowance is continuously monitored by management to maintain a level adequate to absorb expected losses inherent in the loan portfolio. See Note 3. “Accounting Standards” to the Consolidated Financial Statements for additional information.
The following table presents the activity in the allowance for credit losses by portfolio segment for the yearyears ended December 31, 20212023, 2022, and the allowance for loan losses for the year ended December 31, 2020:
| | | | | | | | | | | | | | | |
| | December 31, 2021 |
| | Commercial, | | | | | | | | |
| | Financial and | | Commercial | | Consumer | | Consumer | | |
($ in thousands) | | Agriculture | | Real Estate | | Real Estate | | Installment | | Total |
Allowance for credit losses: | | | | | | | | | | | | | | | |
Beginning balance | | $ | 6,214 | | $ | 24,319 | | $ | 4,736 | | $ | 551 | | $ | 35,820 |
Impact of ASC 326 adoption on | | | | | | | | | | | | | | | |
non-PCD loans | | | (1,319) | | | (4,607) | | | 5,257 | | | (49) | | | (718) |
Impact of ASC 326 adoption on | | | | | | | | | | | | | | | |
PCD loans | | | 166 | | | 575 | | | 372 | | | 2 | | | 1,115 |
Provision for credit losses (1) | | | 1,041 | | | (100) | | | (2,314) | | | (83) | | | (1,456) |
Loans charged-off | | | (1,662) | | | (3,523) | | | (473) | | | (555) | | | (6,213) |
Recoveries | | | 433 | | | 888 | | | 311 | | | 562 | | | 2,194 |
Total ending allowance balance | | $ | 4,873 | | $ | 17,552 | | $ | 7,889 | | $ | 428 | | $ | 30,742 |
2021. | | | | | | | | | | | | | | | | | | | | | | | | | | | | | |
| December 31, 2023 |
| ($ in thousands) | Commercial,
Financial and
Agriculture | | Commercial
Real Estate | | Consumer
Real Estate | | Consumer
Installment | | Total |
| Allowance for credit losses: | | | | | | | | | |
| Beginning balance | $ | 6,349 | | | $ | 20,389 | | | $ | 11,599 | | | $ | 580 | | | $ | 38,917 | |
| Initial allowance on PCD loans | 727 | | | 2,260 | | | 182 | | | 7 | | | 3,176 | |
| Provision for credit losses | 2,164 | | | 6,610 | | | 3,279 | | | 1,697 | | | 13,750 | |
| Loans charged-off | (745) | | | (250) | | | (49) | | | (2,048) | | | (3,092) | |
| Recoveries | 349 | | | 116 | | | 249 | | | 567 | | | 1,281 | |
| Total ending allowance balance | $ | 8,844 | | | $ | 29,125 | | | $ | 15,260 | | | $ | 803 | | | $ | 54,032 | |
| | | | | | | | | | | | | | | | | | | | | | | | | | | | | |
| December 31, 2022 |
| ($ in thousands) | Commercial,
Financial and
Agriculture | | Commercial
Real Estate | | Consumer
Real Estate | | Consumer
Installment | | Total |
| Allowance for credit losses: | | | | | | | | | |
| Beginning balance | $ | 4,873 | | | $ | 17,552 | | | $ | 7,889 | | | $ | 428 | | | $ | 30,742 | |
| Initial allowance on PCD loans | 614 | | | 576 | | | 113 | | | — | | | 1,303 | |
| Provision for credit losses | 688 | | | 1,742 | | | 2,786 | | | 134 | | | 5,350 | |
| Loans charged-off | (259) | | | (72) | | | (204) | | | (683) | | | (1,218) | |
| Recoveries | 433 | | | 591 | | | 1,015 | | | 701 | | | 2,740 | |
| Total ending allowance balance | $ | 6,349 | | | $ | 20,389 | | | $ | 11,599 | | | $ | 580 | | | $ | 38,917 | |
| | | | | | | | | | | | | | | | | | | | | | | | | | | | | |
| December 31, 2021 |
| ($ in thousands) | Commercial,
Financial and
Agriculture | | Commercial
Real Estate | | Consumer
Real Estate | | Consumer
Installment | | Total |
| Allowance for credit losses: | | | | | | | | | |
| Beginning balance | $ | 6,214 | | | $ | 24,319 | | | $ | 4,736 | | | $ | 551 | | | $ | 35,820 | |
| Impact of ASC 326 adoption on | | | | | | | | | |
| non-PCD loans | (1,319) | | | (4,607) | | | 5,257 | | | (49) | | | (718) | |
| Impact of ASC 326 adoption on | | | | | | | | | |
| PCD loans | 166 | | | 575 | | | 372 | | | 2 | | | 1,115 | |
| Provision for credit losses (1) | 1,041 | | | (100) | | | (2,314) | | | (83) | | | (1,456) | |
| Loans charged-off | (1,662) | | | (3,523) | | | (473) | | | (555) | | | (6,213) | |
| Recoveries | 433 | | | 888 | | | 311 | | | 562 | | | 2,194 | |
| Total ending allowance balance | $ | 4,873 | | | $ | 17,552 | | | $ | 7,889 | | | $ | 428 | | | $ | 30,742 | |
| | | | | |
| (1) | The negative provision of $1.1$1.5 million for credit losses on the consolidated statements of income includes a $1.5 million negative loan loss provision,is net of a $370 thousand provision for credit marks in the Cadence Bank Branches loans acquired and a $352 thousand provision for OBSC exposures for the year ended December 31, 2021.2022. |
| | | | | | | | | | | | | | | | | | |
| | December 31, 2020 |
| | Commercial, | | | | | | | | | | |
| | Financial and | | Commercial | | Consumer | | Consumer | | | | |
($in thousands) | | Agriculture | | Real Estate | | Real Estate | | Installment | | Unallocated | | Total |
Allowance for loan losses: | | | | | | | | | | | | | | | | | | |
Beginning balance | | $ | 3,043 | | $ | 8,836 | | $ | 1,694 | | $ | 296 | | $ | 39 | | $ | 13,908 |
Provision for loan losses | | | 4,498 | | | 17,321 | | | 3,071 | | | 300 | | | (39) | | | 25,151 |
Loans charged-off | | | (1,496) | | | (2,256) | | | (280) | | | (447) | | | — | | | (4,479) |
Recoveries | | | 169 | | | 418 | | | 251 | | | 402 | | | — | | | 1,240 |
Total ending allowance balance | | $ | 6,214 | | $ | 24,319 | | $ | 4,736 | | $ | 551 | | $ | — | | $ | 35,820 |
The Company recorded a $$13.8 million, provision for credit losses for the year ended December 31, 2023, compared to $5.4 million for the year ended December 31, 2022. The 2023 provision for credit losses increase is attributable to loan growth and the acquisition of HSBI in January 2023. Total loans were $5.116 billion at December 31, 2023, compared to $3.735 billion at December 31, 2022, representing an increase of $1.381 billion, or 37.0%. During January 2023, loans totaling $1.159 billion, net of purchase accounting adjustments, were acquired as part of the HSBI
acquisition. The initial ACL on PCD loans recorded in March 2023, of $3.2 million was related to the HSBI acquisition. In addition, the 2023 provision for credit losses includes $10.7 million associated with day one post-merger accounting provision recorded for non-PCD loans and unfunded commitments acquired in the HSBI acquisition. The 2022 provision includes $3.9 million associated with day one post-merger accounting provision recorded for non-PCD loans and unfunded commitments and a $1.3 million initial allowance recorded on PCD loans acquired as part of the BBI merger.
The Company recorded a $5.4 million, provision for credit losses for the year ended December 31, 2022, compared to $1.5 million, negative provision for credit losses for the year ended December 31,
2021, compared to $25.22021. The 2022 provision for credit losses includes $3.9 million
associated with day one post-merger accounting provision recorded for
non-PCD loans and unfunded commitments. A $1.3 million initial allowance was recorded on PCD loans acquired in the
year ended December 31, 2020.BBI merger. The negative provision for 2021 was composed of a
$1.5$1.5 million decrease in the ACL for LHFI, net of $370 thousand provision for credit marks on the Cadence
Bank Branches loans
acquired, and a $352 thousand increase in the reserve for OBSC exposures.acquired. The negative provision for credit losses in 2021 was primarily due to the improved macroeconomic outlook for 2021.
The higher provision in 2020 was related to our estimates of probable incurred losses associated with COVID-19. The following table provides the ending balance in the Company’s LHFI and the ACL, broken down by portfolio segment as of December 31,
2021.2023 and 2022. The table also provides additional detail as to the amount of our loans and allowance that correspond to individual versus collective impairment
evaluation ($ in thousands).
| | | | | | | | | | | | | | | |
December 31, 2021 | | Commercial, | | | | | | | | | | | | |
| | Financial and | | Commercial | | Consumer | | Consumer | | |
| | Agriculture | | Real Estate | | Real Estate | | Installment | | Total |
LHFI | | | | | | | | | | | | | | | |
Individually evaluated | | $ | — | | $ | 1,712 | | $ | 1,858 | | $ | — | | $ | 3,570 |
Collectively evaluated | | | 397,516 | | | 1,681,986 | | | 836,796 | | | 39,685 | | | 2,955,983 |
Total | | $ | 397,516 | | $ | 1,683,698 | | $ | 838,654 | | $ | 39,685 | | $ | 2,959,553 |
| | | | | | | | | | | | | | | |
Allowance for Credit Losses | | | | | | | | | | | | | | | |
Individually evaluated | | $ | — | | $ | 4 | | $ | 2 | | $ | — | | $ | 6 |
Collectively evaluated | | | 4,873 | | | 17,548 | | | 7,887 | | | 428 | | | 30,736 |
Total | | $ | 4,873 | | $ | 17,552 | | $ | 7,889 | | $ | 428 | | $ | 30,742 |
The following table provides the ending balance in the Company’s LHFI and the allowance for loan losses, broken down by portfolio segment as of December 31, 2020. The table also provides additional detail as to the amount of our loans and allowance that correspond to individual versus collective impairment evaluation. The impairment evaluation corresponds to the Company’s systematic methodology for estimating it Allowance for Loan Losses ($ in thousands).
| | | | | | | | | | | | | | | |
December 31, 2020 | | Commercial, | | | | | | | | | | | | |
| | Financial and | | Commercial | | Consumer | | Consumer | | |
| | Agriculture | | Real Estate | | Real Estate | | Installment | | Total |
LHFI | | | | | | | | | | | | | | | |
Individually evaluated | | $ | 2,241 | | $ | 23,857 | | $ | 1,248 | | $ | 49 | | $ | 27,395 |
Collectively evaluated | | | 574,152 | | | 1,971,292 | | | 494,833 | | | 41,498 | | | 3,081,775 |
PCI Loans | | | 244 | | | 9,056 | | | 5,185 | | | 23 | | | 14,508 |
Total | | $ | 576,637 | | $ | 2,004,205 | | $ | 501,266 | | $ | 41,570 | | $ | 3,123,678 |
| | | | | | | | | | | | | | | |
Allowance for Loan Losses | | | | | | | | | | | | | | | |
Individually evaluated | | $ | 1,235 | | $ | 4,244 | | $ | 176 | | $ | 14 | | $ | 5,669 |
Collectively evaluated | | | 4,979 | | | 20,075 | | | 4,560 | | | 537 | | | 30,151 |
Total | | $ | 6,214 | | $ | 24,319 | | $ | 4,736 | | $ | 551 | | $ | 35,820 |
96
| | | | | | | | | | | | | | | | | | | | | | | | | | | | | | | | |
| ($ in thousands) | | Commercial,
Financial and
Agriculture | | Commercial
Real Estate | | Consumer
Real Estate | | Consumer
Installment | | Total |
| December 31, 2023 | | | | | |
| LHFI | | | | | | | | | | |
| Individually evaluated | | $ | 1,414 | | | $ | 710 | | | $ | 778 | | | $ | — | | | $ | 2,902 | |
| Collectively evaluated | | 798,910 | | | 3,058,445 | | | 1,252,017 | | | 57,768 | | | 5,167,140 | |
| Total | | $ | 800,324 | | | $ | 3,059,155 | | | $ | 1,252,795 | | | $ | 57,768 | | | $ | 5,170,042 | |
| | | | | | | | | | |
| Allowance for Credit Losses | | | | | | | | | | |
| Individually evaluated | | $ | 408 | | | $ | — | | | $ | — | | | $ | — | | | $ | 408 | |
| Collectively evaluated | | 8,436 | | | 29,125 | | | 15,260 | | | 803 | | | 53,624 | |
| Total | | $ | 8,844 | | | $ | 29,125 | | | $ | 15,260 | | | $ | 803 | | | $ | 54,032 | |
| | | | | | | | | | | | | | | | | | | | | | | | | | | | | | | | |
| ($ in thousands) | | Commercial,
Financial and
Agriculture | | Commercial
Real Estate | | Consumer
Real Estate | | Consumer
Installment | | Total |
| December 31, 2022 | | | | | |
| LHFI | | | | | | | | | | |
| Individually evaluated | | $ | — | | | $ | 4,560 | | | $ | 998 | | | $ | — | | | $ | 5,558 | |
| Collectively evaluated | | 536,192 | | | 2,130,703 | | | 1,058,001 | | | 43,703 | | | 3,768,599 | |
| Total | | $ | 536,192 | | | $ | 2,135,263 | | | $ | 1,058,999 | | | $ | 43,703 | | | $ | 3,774,157 | |
| | | | | | | | | | |
| Allowance for Credit Losses | | | | | | | | | | |
| Individually evaluated | | $ | — | | | $ | — | | | $ | 5 | | | $ | — | | | $ | 5 | |
| Collectively evaluated | | 6,349 | | | 20,389 | | | 11,594 | | | 580 | | | 38,912 | |
| Total | | $ | 6,349 | | | $ | 20,389 | | | $ | 11,599 | | | $ | 580 | | | $ | 38,917 | |
NOTE F - PREMISES AND EQUIPMENT
Premises and equipment owned and utilized in the operations of the Company are stated at cost, less accumulated depreciation and amortization as follows:
| | | | | | |
($ in thousands) | | 2021 | | 2020 |
Premises: | | | | | | |
Land | | $ | 37,939 | | $ | 34,976 |
Buildings and improvements | | | 89,165 | | | 78,490 |
Equipment | | | 28,978 | | | 26,992 |
Construction in progress | | | 1,357 | | | 521 |
| | | 157,439 | | | 140,979 |
Less accumulated depreciation and amortization | | | 31,480 | | | 26,156 |
Total | | $ | 125,959 | | $ | 114,823 |
| | | | | | | | | | | |
| ($ in thousands) | 2023 | | 2022 |
| Premises: | | | |
| Land | $ | 48,460 | | | $ | 40,846 | |
| Buildings and improvements | 126,013 | | | 100,830 | |
| Equipment | 41,788 | | | 32,486 | |
| Construction in progress | 1,808 | | | 6,447 | |
| 218,069 | | | 180,609 | |
| Less accumulated depreciation and amortization | 43,760 | | | 37,091 | |
| Total | $ | 174,309 | | | $ | 143,518 | |
The amounts charged to operating expense for depreciation were
$7.4 million, $5.7 million, and $5.4 million
$4.9 millionin 2023, 2022 and
$3.8 million in 2021,
2020 and 2019, respectively.
Time deposits that meet or exceed the FDIC Insurance limit of $250,000 at December 31,
20212023 and
2020,2022, were
$141.5$292.9 million and
$149.4$146.6 million, respectively.
At December 31,
2021,2023, the scheduled maturities of time deposits included in interest-bearing deposits were as
follows ($ in thousands):
| | | |
Year | | Amount |
2021 | | $ | 444,983 |
2022 | | | 81,276 |
2023 | | | 24,205 |
2024 | | | 10,801 |
2025 | | | 13,039 |
Thereafter | | | 10,305 |
Total | | $ | 584,609 |
follows:
| | | | | | | | |
| ($ in thousands) | | |
| Year | | Amount |
| 2024 | | $ | 971,259 | |
| 2025 | | 59,867 | |
| 2026 | | 13,593 | |
| 2027 | | 7,575 | |
| 2028 | | 14,935 | |
| Thereafter | | 8,527 | |
| Total | | $ | 1,075,756 | |
At December 31, 20212023 and 2020,2022, borrowed funds consisted of the following ($following:
| | | | | | | | | | | |
| ($ in thousands) | 2023 | | 2022 |
| Bank Term Funding Program | $ | 390,000 | | | $ | — | |
| FHLB advances | — | | | 130,100 | |
| Total | $ | 390,000 | | | $ | 130,100 | |
On March 12, 2023, the Federal Reserve Board announced the Bank Term Funding Program ("BTFP"), which offers loans to banks with a term up to one year. The loans are secured by pledging the banks' U.S. treasuries, agency securities, agency securities, agency mortgage-backed securities, and any other qualifying asset. These pledged securities will be valued at par for collateral purposes. The BTFP offers up to one year fixed-rate term borrowings that are prepayable without penalty.
In 2023, the Bank participated in
thousands):
| | | | | | |
| | 2021 | | 2020 |
FHLB advances | | $ | — | | $ | 110,000 |
First Horizon Bank | | | — | | | 4,647 |
Total | | $ | — | | $ | 114,647 |
the BTFP and had outstanding debt of $390.0 million, pledged securities totaling a fair value for $362.4 million at December 31, 2023. The securities pledged have a par value of $398.1 million. The Bank's BTFP borrowings, which were drawn between March 15, 2023 and December 28, 2023, bear interest rates ranging from 4.69% to 4.83% and are set to mature one year from their issuance date.
In
2021, the Company repaid $110.0 million in FHLB advances and $4.6 million in borrowings from First Horizon Bank. In 2020,2022, each advance from the FHLB was payable at its maturity date, with a prepayment penalty for fixed rate advances. Interest was payable monthly at rates ranging from
0.72%4.55% to
0.77%4.58%. Advances due to the FHLB are collateralized by a blanket lien on first mortgage loans in the amount of the outstanding borrowings, FHLB capital stock, and amounts on deposit with the FHLB. In
2020,2022, advances due to the FHLB were collateralized by
$3.120$3.651 billion in loans. Based on this collateral and holdings of FHLB stock, the Company is eligible to borrow up to a total of
$1.478$2.051 billion and
$1.421$1.679 billion at December 31,
20212023 and
2020,2022, respectively.
On November 1, 2019,
Payments over the
Company acquired First Florida Bancorp and assumed two borrowings in the amount of $3.5 million and $2.0 million with First Horizon Bank. Principal and interest were payable quarterly at rates ranging from 3.80% - 4.10%.
next five years are as follows: | | | | | |
| ($ in thousands) | |
| 2024 | $ | 390,000 | |
| 2025 | — | |
| 2026 | — | |
| 2027 | — | |
| 2028 | — | |
NOTE I – LEASE OBLIGATIONS
The Company enters into leases in the normal course of business primarily for financial centers,
back officeback-office operations locations and business development offices. The Company’s leases have remaining terms ranging from 1 to
108 years.
The Company includes lease extension and termination options in the lease term if, after considering relevant economic factors, it is reasonably certain the Company will exercise the option. In addition, the Company has elected to account for any non-lease components in its real estate leases as part of the associated lease component. The Company has also elected not to recognize leases with original lease terms of 12 months or less (short-term leases) on the Company’s balance sheet.
Leases are classified as operating or finance leases at the lease commencement date.
Lease expense for operating leases and short-term leases is recognized on a straight-line basis over the lease term and is recorded in net occupancy and equipment expense in the consolidated statements of income and other comprehensive income. Right-of-use assets represent our right to use an underlying asset for the lease term and lease liabilities represent our obligation to make lease payments arising from the lease. Right-of-use assets and lease liabilities are recognized at the lease commencement date and based on the estimated present value of lease payments over the lease term.
The Company uses its incremental borrowing rate at lease commencement to calculate the present value of lease payments when the rate implicit in a lease is not known. The Company’s incremental borrowing rate is based on the FHLB amortizing advance rate, adjusted for the lease term and other factors.
The following table details balance sheet information, as well as weighted-average lease terms and discount rates, related to leases at December 31,
20212023 and
2020 ($ in thousands):
| | | | | | | |
| | December 31, | | December 31, | |
| | 2021 | | 2020 | |
Right-of-use assets: | | | | | | | |
Operating leases | | $ | 4,095 | | $ | 5,969 | |
Finance leases, net of accumulated depreciation | | | 2,394 | | | 2,658 | |
Total right-of-use assets | | $ | 6,489 | | $ | 8,627 | |
| | | | | | | |
Lease liabilities: | | | | | | | |
Operating lease | | $ | 4,192 | | $ | 6,031 | |
Finance lease | | | 2,094 | | | 2,281 | |
Total lease liabilities | | $ | 6,286 | | $ | 8,312 | |
| | | | | | | |
Weighted average remaining lease term | | | | | | | |
Operating leases | | | 4.0 years | | | 4.4 years | |
Finance leases | | | 9.9 years | | | 11.2 years | |
| | | | | | | |
Weighted average discount rate | | | | | | | |
Operating leases | | | 2.4 | % | | 2.3 | % |
Finance leases | | | 2.2 | % | | 2.0 | % |
2022. | | | | | | | | | | | |
| ($ in thousands) | December 31,
2023 | | December 31,
2022 |
| Right-of-use assets: | | | |
| Operating leases | $ | 6,387 | | | $ | 7,620 | |
| Finance leases, net of accumulated depreciation | 1,466 | | | 1,930 | |
| Total right-of-use assets | $ | 7,853 | | | $ | 9,550 | |
| | | |
| Lease liabilities: | | | |
| Operating lease | $ | 6,550 | | | $ | 7,810 | |
| Finance lease | 1,739 | | | 1,918 | |
| Total lease liabilities | $ | 8,289 | | | $ | 9,728 | |
| | | |
| Weighted average remaining lease term | | | |
| Operating leases | 7.2 years | | 7.5 years |
| Finance leases | 7.9 years | | 8.9 years |
| | | |
| Weighted average discount rate | | | |
| Operating leases | 2.0% | | 1.8% |
| Finance leases | 2.2% | | 2.2% |
The table below summarizes our net lease costs ($ in thousands):
| | | | | | | | | |
| | December 31, |
| | 2021 | | 2020 | | 2019 |
Operating lease cost | | $ | 1,657 | | $ | 1,763 | | $ | 898 |
Finance lease cost: | | | | | | | | | |
Interest on lease liabilities | | | 7 | | | 7 | | | — |
Amortization of right-of-use | | | 263 | | | 183 | | | — |
Net lease cost | | $ | 1,927 | | $ | 1,953 | | $ | 898 |
costs.
| | | | | | | | | | | | | | | | | |
| ($ in thousands) | December 31, |
| 2023 | | 2022 | | 2021 |
| Operating lease cost | $ | 1,504 | | | $ | 1,464 | | | $ | 1,657 | |
| Finance lease cost: | | | | | |
| Interest on lease liabilities | 40 | | | 44 | | | 7 | |
| Amortization of right-of-use | 464 | | | 464 | | | 263 | |
| Net lease cost | $ | 2,008 | | | $ | 1,972 | | | $ | 1,927 | |
The table below summarizes the maturity of remaining lease liabilities at December 31,
2021 ($ in thousands):2023.
| | | | | | | | | | | |
| ($ in thousands) | December 31, 2023 |
| Operating Leases | | Finance Leases |
| | | |
| 2024 | $ | 1,144 | | | $ | 220 | |
| 2025 | 1,043 | | | 220 | |
| 2026 | 945 | | | 222 | |
| 2027 | 777 | | | 252 | |
| 2028 | 691 | | | 252 | |
| Thereafter | 2,439 | | | 735 | |
| Total lease payments | 7,039 | | | 1,901 | |
| Less: Interest | (489) | | | (162) | |
| Present value of lease liabilities | $ | 6,550 | | | $ | 1,739 | |
| | | | | | |
| | December 31, 2021 |
| | Operating Leases | | Finance Leases |
| | | | | | |
2022 | | $ | 1,260 | | $ | 220 |
2023 | | | 1,124 | | | 220 |
2024 | | | 865 | | | 220 |
2025 | | | 666 | | | 220 |
2026 | | | 454 | | | 222 |
Thereafter | | | 24 | | | 1,238 |
Total lease payments | | | 4,393 | | | 2,340 |
Less: Interest | | | (201) | | | (246) |
Present value of lease liabilities | | $ | 4,192 | | $ | 2,094 |
NOTE J - REGULATORY MATTERS
On January 15, 2022, The First, A National Banking Association, a subsidiary of the Company, converted from a national banking association to a Mississippi state-chartered bank and changed its name to The First Bank. The First Bank is a member of the Federal Reserve System through the Federal Reserve Bank of Atlanta.
The Company and its subsidiary bank are subject to regulatory capital requirements administered by federal banking agencies. Failure to meet minimum capital requirements can initiate certain mandatory and possibly additional discretionary actions by regulators that, if undertaken, could have a direct material effect on the Company’s financial statements. Under capital adequacy guidelines and the regulatory framework for prompt corrective action, the Company and its subsidiary bank must meet specific capital guidelines that involve quantitative measures of assets, liabilities, and certain off-balance sheet items as calculated under regulatory accounting practices. Capital amounts and classifications are also subject to qualitative judgment by regulators about components, risk weightings, and other related factors.
To ensure capital adequacy, quantitative measures have been established by regulators, and these require the Company and its subsidiary bank to maintain minimum amounts and ratios (set forth in the table below) of total and Tier 1 capital (as defined) to risk-weighted assets (as defined), Tier 1 capital to adjusted total assets (leverage) and common equity Tier 1.
Management believes, as of December 31, 2021,2023, that the Company met all capital adequacy requirements to which they are subject. Under Basel III requirements, a financial institution is considered to be well-capitalized if it has a total risk-based capital ratio of 10% or more, has a Tier 1 risk-based capital ratio of 8% or more, has a common equity Tier 1 of 6.5%, and has a Tier 1 leverage
capital ratio of 5% or more.
The actual capital amounts and ratios, excluding unrealized losses, at December 31,
20212023 and
20202022 are presented in the following table. No amount was deducted from capital for interest-rate risk
exposure ($ in thousands).exposure.
| | | | | | | | | | | | | | | | | | | | | | | | | | |
| ($ in thousands) | | | | | | | | |
| December 31, 2023 | | Company
(Consolidated) | | Subsidiary The First |
| | Amount | | Ratio | | Amount | | Ratio |
| | | | | | | | |
| Total risk-based | | $ | 892,310 | | | 15.0 | % | | $ | 875,071 | | | 14.8 | % |
| Common equity Tier 1 | | 715,858 | | | 12.1 | % | | 821,246 | | | 13.8 | % |
| Tier 1 risk-based | | 740,113 | | | 12.5 | % | | 821,246 | | | 13.8 | % |
| Tier 1 leverage | | 740,113 | | | 9.7 | % | | 821,246 | | | 10.7 | % |
| | | | | | | | |
| December 31, 2022 | | Amount | | Ratio | | Amount | | Ratio |
| Total risk-based | | $ | 753,708 | | | 16.7 | % | | $ | 739,616 | | | 16.4 | % |
| Common equity Tier 1 | | 570,660 | | | 12.7 | % | | 701,099 | | | 15.6 | % |
| Tier 1 risk-based | | 586,068 | | | 13.0 | % | | 701,099 | | | 15.6 | % |
| Tier 1 leverage | | 586,068 | | | 9.3 | % | | 701,099 | | | 11.1 | % |
| | | | | | | | | | | |
| | | | | | | | | | | |
| | Company | | Subsidiary | |
December 31, 2021 | | (Consolidated) | | The First | |
| | Amount | | Ratio | | Amount | | Ratio | |
| | | | | | | | | | | |
Total risk-based | | $ | 662,658 | | 18.6 | % | $ | 618,472 | | 17.4 | % |
Common equity Tier 1 | | | 488,290 | | 13.7 | % | | 588,334 | | 16.6 | % |
Tier 1 risk-based | | | 503,644 | | 14.1 | % | | 588,334 | | 16.6 | % |
Tier 1 leverage | | | 503,644 | | 9.2 | % | | 588,334 | | 10.8 | % |
| | | | | | | | | | | |
December 31, 2020 | | | | | | | | | | | |
| | Amount | | Ratio | | Amount | | Ratio | |
Total risk-based | | $ | 618,025 | | 19.1 | % | $ | 549,273 | | 16.9 | % |
Common equity Tier 1 | | | 438,109 | | 13.5 | % | | 513,453 | | 15.8 | % |
Tier 1 risk-based | | | 453,409 | | 14.0 | % | | 513,453 | | 15.8 | % |
Tier 1 leverage | | | 453,409 | | 9.2 | % | | 513,453 | | 10.4 | % |
The minimum amounts of capital and ratios, not including Accumulated Other Comprehensive Income, as established by banking regulators at December 31,
2021,2023, and
2020,2022, were as
follows ($ in thousands):
| | | | | | | | | | | |
| | Company | | Subsidiary | |
December 31, 2021 | | (Consolidated) | | The First | |
| | Amount | | Ratio | | Amount | | Ratio | |
| | | | | | | | | | | |
Total risk-based | | $ | 285,049 | | 8.0 | % | $ | 284,209 | | 8.0 | % |
Common equity Tier 1 | | | 160,340 | | 4.5 | % | | 159,868 | | 4.5 | % |
Tier 1 risk-based | | | 213,787 | | 6.0 | % | | 213,157 | | 6.0 | % |
Tier 1 leverage | | | 142,524 | | 4.0 | % | | 142,105 | | 4.0 | % |
| | | | | | | | | | | |
| | | | | | | | | | | |
| | | | | | | | | |
December 31, 2020 | | Amount | | Ratio | | Amount | | Ratio | |
Total risk-based | | $ | 258,896 | | 8.0 | % | $ | 259,136 | | 8.0 | % |
Common equity Tier 1 | | | 145,629 | | 4.5 | % | | 145,764 | | 4.5 | % |
Tier 1 risk-based | | | 194,172 | | 6.0 | % | | 194,352 | | 6.0 | % |
Tier 1 leverage | | | 129,448 | | 4.0 | % | | 129,568 | | 4.0 | % |
follows:
| | | | | | | | | | | | | | | | | | | | | | | | | | |
| ($ in thousands) | | | | | | | | |
| December 31, 2023 | | Company
(Consolidated) | | Subsidiary The First |
| | Amount | | Ratio | | Amount | | Ratio |
| | | | | | | | |
| Total risk-based | | $ | 475,183 | | | 8.0 | % | | $ | 474,679 | | | 8.0 | % |
| Common equity Tier 1 | | 267,291 | | | 4.5 | % | | 267,007 | | | 4.5 | % |
| Tier 1 risk-based | | 356,387 | | | 6.0 | % | | 356,009 | | | 6.0 | % |
| Tier 1 leverage | | 237,592 | | | 4.0 | % | | 237,339 | | | 4.0 | % |
| | | | | | | | | | | | | | | | | | | | | | | | | | |
| December 31, 2022 | | Amount | | Ratio | | Amount | | Ratio |
| Total risk-based | | $ | 360,597 | | | 8.0 | % | | $ | 360,071 | | | 8.0 | % |
| Common equity Tier 1 | | 202,836 | | | 4.5 | % | | 202,540 | | | 4.5 | % |
| Tier 1 risk-based | | 270,447 | | | 6.0 | % | | 270,053 | | | 6.0 | % |
| Tier 1 leverage | | 180,298 | | | 4.0 | % | | 180,035 | | | 4.0 | % |
The principal sources of funds to the Company to pay dividends are the dividends received from the Bank. Consequently, dividends are dependent upon The First’s earnings, capital needs, regulatory policies, as well as statutory and regulatory limitations. Federal Reserve regulations limit dividends, stock repurchases and discretionary bonuses to executive officers if the Company’s regulatory capital is below the level of regulatory minimums plus the applicable capital conservation buffer. Federal and state banking laws and regulations restrict the amount of dividends and loans a bank may make to its parent company. Approval by the Company’s regulators is required if the total of all dividends declared in any calendar year exceed the total of its net income for that year combined with its retained net income of the preceding two years. In
2021,2023, the Bank had available
$116.0$147.3 million to pay dividends.
On December 14, 2021, the U.S. Department of Treasury informed the Company of its eligibility to receive $175.0 million of non-dilutive Tier 1 perpetual preferred capital under the ECIP. Established by the Consolidated Appropriations Act of 2021, the ECIP was created to encourage low-and moderate-income community financial institutions to augment their efforts to support small businesses and consumers in their communities. The Company has not accepted any capital from the ECIP, and any subsequent acceptance will be subject to approval by the Company’s board of directors and acceptance of the terms governing the ECIP established by the U.S. Department of Treasury.
The components of income tax expense are as
follows ($ in thousands):follows:
| | | | | | | | | | | | | | | | | |
| ($ in thousands) | Years Ended December 31, |
| 2023 | | 2022 | | 2021 |
| Current: | | | | | |
| Federal | $ | 11,754 | | | $ | 12,071 | | | $ | 12,546 | |
| State | 2,587 | | | 2,759 | | | 2,630 | |
| Deferred | 7,006 | | | 940 | | | 1,739 | |
| Total income tax expense | $ | 21,347 | | | $ | 15,770 | | | $ | 16,915 | |
| | | | | | | | | |
| | Years Ended December 31, |
| | 2021 | | 2020 | | 2019 |
Current: | | | | | | | | | |
Federal | | $ | 12,546 | | $ | 11,270 | | $ | 9,477 |
State | | | 2,630 | | | 2,308 | | | 2,312 |
Deferred | | | 1,739 | | | (3,015) | | | 912 |
Total income tax expense | | $ | 16,915 | | $ | 10,563 | | $ | 12,701 |
The Company's income tax expense differs from the amounts computed by applying the federal income tax statutory rates to income before income taxes. A reconciliation of the differences is as
follows ($ in thousands):
| | | | | | | | | | | | | | | | |
| | Years Ended December 31, | |
| | 2021 | | 2020 | | 2019 | |
| | Amount | | % | | Amount | | % | | Amount | | % | |
Income taxes at statutory rate | | $ | 17,027 | | 21 | % | $ | 13,244 | | 21 | % | $ | 11,854 | | 21 | % |
Tax-exempt income, net | | | (1,692) | | (2) | % | | (1,868) | | (2) | % | | (1,176) | | (2) | % |
Bargain purchase gain | | | 0 | | 0 | % | | (1,645) | | (3) | % | | 0 | | 0 | |
Nondeductible expenses | | | 29 | | 0 | % | | 188 | | 0 | % | | 348 | | 1 | % |
State income tax, net of federal tax effect | | | 2,299 | | 3 | % | | 1,600 | | 3 | % | | 1,969 | | 4 | % |
Federal tax credits, net | | | (715) | | (1) | % | | (715) | | (1) | % | | (334) | | (1) | % |
Other, net | | | (33) | | 0 | % | | (241) | | (1) | % | | 40 | | 0 | % |
| | $ | 16,915 | | 17 | % | $ | 10,563 | | 17 | % | $ | 12,701 | | 23 | % |
follows:
| | | | | | | | | | | | | | | | | | | | | | | | | | | | | | | | | | | |
| ($ in thousands) | Years Ended December 31, |
| 2023 | | 2022 | | 2021 |
| Amount | | % | | Amount | | % | | Amount | | % |
| Income taxes at statutory rate | $ | 20,289 | | | 21 | % | | $ | 16,525 | | | 21 | % | | $ | 17,027 | | | 21 | % |
| Tax-exempt income, net | (1,696) | | | (2) | % | | (2,369) | | | (3) | % | | (1,692) | | | (2) | % |
| Nondeductible expenses | 144 | | | — | % | | 391 | | | — | % | | 29 | | | — | % |
| State income tax, net of federal tax effect | 3,064 | | | 4 | % | | 2,251 | | | 3 | % | | 2,299 | | | 3 | % |
| Federal tax credits, net | (715) | | | (1) | % | | (715) | | | (1) | % | | (715) | | | (1) | % |
| Other, net | 261 | | | — | % | | (313) | | | — | % | | (33) | | | — | % |
| $ | 21,347 | | | 22 | % | | $ | 15,770 | | | 20 | % | | $ | 16,915 | | | 21 | % |
The components of deferred income taxes included in the consolidated financial statements were as
follows ($ in thousands):
| | | | | | |
| | December 31, |
| | 2021 | | 2020 |
Deferred tax assets: | | | | | | |
Allowance for loan losses | | $ | 7,566 | | $ | 9,062 |
Net operating loss carryover | | | 2,109 | | | 2,147 |
Nonaccrual loan interest | | | 1,447 | | | 1,356 |
Other real estate | | | 247 | | | 252 |
Deferred compensation | | | 1,267 | | | 1,285 |
Loan purchase accounting | | | 966 | | | 2,268 |
Lease liability | | | 1,547 | | | 2,103 |
Other | | | 2,421 | | | 2,046 |
| | | 17,570 | | | 20,519 |
Deferred tax liabilities: | | | | | | |
Unrealized gain on available-for-sale securities | | | (2,702) | | | (8,743) |
Securities | | | (778) | | | (880) |
Premises and equipment | | | (7,637) | | | (7,698) |
Core deposit intangible | | | (6,255) | | | (7,051) |
Goodwill | | | (2,121) | | | (1,906) |
Right-of-use asset | | | (1,702) | | | (2,103) |
Other | | | (485) | | | (550) |
| | | (21,680) | | | (28,931) |
Net deferred tax liability, included in other liabilities | | $ | (4,110) | | $ | (8,412) |
follows: | | | | | | | | | | | |
| ($ in thousands) | December 31, |
| 2023 | | 2022 |
| Deferred tax assets: | | | |
| Allowance for credit losses | $ | 13,276 | | | $ | 9,581 | |
| Net operating loss carryover | 27,256 | | | 24,531 | |
| Nonaccrual loan interest | 826 | | | 600 | |
| Other real estate | 1,092 | | | 894 | |
| Deferred compensation | 1,161 | | | 1,205 | |
| Loan purchase accounting | 6,438 | | | 2,554 | |
| Unrealized loss on available-for-sale securities | 38,776 | | | 48,738 | |
| Lease liability | 2,037 | | | 2,395 | |
| Other | 5,014 | | | 3,299 | |
| 95,876 | | | 93,797 | |
| Deferred tax liabilities: | | | |
| Securities | (560) | | | (627) | |
| Premises and equipment | (9,017) | | | (6,588) | |
| Core deposit intangible | (16,094) | | | (7,628) | |
| Goodwill | (2,651) | | | (2,388) | |
| Right-of-use asset | (1,929) | | | (2,517) | |
| Other | (1,461) | | | (596) | |
| (31,712) | | | (20,344) | |
| Net deferred tax asset/(liability), included in other assets/(liabilities) | $ | 64,164 | | | $ | 73,453 | |
During 2020, the Company assumed a deferred tax liability of $2.5 million in its acquisition of SWG as well as utilized provisions of the CARES Act to carryback $712 thousand of net operating losses acquired as part of its 2019 acquisition of Florida Parishes Bank.
With the acquisition of Baldwin Bancshares, Inc. in 2013, BayBCB Holding Company, Inc. in 2014, Gulf Coast Community Bank in 2017, Sunshine Financial, Inc. in 2018, and Florida Parishes BankFPB Financial Corp. in 2019, and SWG in 2020, BBI in 2022, and HSBI in 2023, the Company assumed federal tax net operating loss carryovers. $18.5$228.9 million of net operating losses remain available to the Company and begin to expire in 2026. The Company expects to fully utilize the net operating losses.
The Company follows the guidance of ASC Topic 740, Income Taxes, which prescribes a recognition threshold and measurement attribute for the financial statement recognition and measurement of a tax position taken or expected to be taken in a tax return. ASC Topic 740 also provides guidance on derecognition, classification, interest and penalties, accounting in interim periods, disclosure, and transition. As of December 31, 2021,2023, the Company had no uncertain tax
positions that it believes should be recognized in the financial statements. The tax years still subject to examination by taxing authorities are years subsequent to
2017.
2019.
NOTE L - EMPLOYEE BENEFITS
The Company and the Bank provide a deferred compensation arrangement (401k plan) whereby employees contribute a percentage of their compensation. For employee contributions of six percent or less, the Company and its subsidiary bank provide a 50% matching contribution. Contributions totaled
$1.5 million in 2023, $1.2 million in 2022, and $1.1 million in
2021, $990 thousand in 2020, and $771 thousand in 2019.2021.
The Company sponsors an Employee Stock Ownership Plan (ESOP) for employees who have completed one year of service for the Company and attained age 21. Employees become fully vested after five years of service. Contributions to the plan are at the discretion of the Board of Directors. At December 31,
2021,2023, the ESOP held 5,728 shares valued at
$221$168 thousand of Company common stock and had no debt obligation. All shares held by the plan were considered outstanding for net income per share purposes. Total ESOP expense was
$ 3$24 thousand for
2021, $262023, $33 thousand for
2020,2022, and
$11$3 thousand for
2019.2021.
In 2014, the Company established a Supplemental Executive Retirement Plan (“SERP”) for three active key executives. During 2016, the Company established a SERP for eight additional active key executives. Pursuant to the SERP, these officers are entitled to receive 180 equal monthly payments commencing at the later of obtaining age 65 or separation from service. The costs of such benefits, assuming a retirement date at age 65, are accrued by the Company and included in other liabilities in the Consolidated Balance Sheets. The SERP balance at December 31,
20212023 and
20202022 was
$2.7$4.6 million and
$1.8$3.7 million, respectively. The Company accrued to expense
$951 thousand for 2023, $945 thousand for 2022, and $945 thousand for 2021
$676 thousand for 2020, and $257 thousand for 2019 for future benefits payable under the SERP. The SERP is an unfunded plan and is considered a general contractual obligation of the Company.
Upon the acquisition of Iberville Bank, Southwest
Banc Shares, Inc., FMB
Banking Corporation, and SWG, the Bank assumed deferred compensation agreements with directors and employees. At December 31,
2021,2023, the total liability of the deferred compensation agreements was
$907$763 thousand, $1.1 million,
$3.0$2.6 million, and
$433$273 thousand, respectively. Deferred compensation expense totaled
$21$24 thousand,
$138$152 thousand,
$189$112 thousand, and
$40$19 thousand, respectively for
2021.
2023.
In 2007, the Company adopted the 2007 Stock Incentive Plan. The 2007 Plan provided for the issuance of up to 315,000 shares of Company Common Stock, $1.00 par value per share. In 2015, the Company adopted an amendment to the 2007 Stock Incentive Plan which provided for the issuance of an additional 300,000 shares of Company Common Stock, $1.00 par value per share, for a total of 615,000 shares. In 2020,2021, the Company adopted an amendment to the 2007 Stock Incentive Plan which provided for the issuance of an additional 500,000 shares of Company Common Stock, $1.00 par value per share, for a total of 1,115,000 shares. Shares issued under the 2007 Plan may consist in whole or in part of authorized but unissued shares or treasury shares. Total shares issuable under the plan are 493,579239,964 at year-end 2021,2023, and 93,578167,173 and 78,189129,950 shares were issued in 20212023 and 2020,2022, respectively.
A summary of changes in the Company’s nonvested shares for the year follows:
| | | | | |
| | | | Weighted- |
| | | | Average |
| | | | Grant-Date |
Nonvested shares | | Shares | | Fair Value |
Nonvested at January 1, 2021 | | 315,331 | | $ | 28.13 |
Granted | | 93,578 | | | |
Vested | | (92,578) | | | |
Forfeited | | (2,021) | | | |
Nonvested at December 31, 2021 | | 314,310 | | $ | 30.58 |
| | | | | | | | | | | | | | |
| Nonvested shares | | Shares | | Weighted-
Average
Grant-Date
Fair Value |
| Nonvested at January 1, 2023 | | 364,056 | | | $ | 31.88 | |
| Granted | | 167,173 | | | |
| Vested | | (54,094) | | | |
| Forfeited | | (12,194) | | | |
| Nonvested at December 31, 2023 | | 464,941 | | | $ | 31.08 | |
As of December 31, 2021,2023, there was $4.8$8.5 million of total unrecognized compensation cost related to nonvested shares granted under the Plan. The costs isare expected to be recognized over the remaining term of the vesting period (approximately
(approximately 5 years). The total fair value of shares vested during the years ended December 31,
2023, 2022 and 2021
2020 and 2019 was
$3.2$1.7 million,
$3.2$2.5 million, and
$240 thousand.$3.2 million.
Compensation cost in the amount of
$3.1 million was recognized for the year ended December 31, 2021, $2.3 million was recognized for the year ended December 31,
20202023, $2.4 million was recognized for the year ended December 31, 2022 and
$1.7$3.1 million for the year ended December 31,
2019.2021. Shares of restricted stock granted to employees under this stock plan are subject to restrictions as to the vesting period. The restricted stock award becomes 100% vested on the earliest of 1) the vesting period provided the Grantee has not incurred a termination of employment prior to that date, 2) the Grantee’s retirement, or 3) the Grantee’s death. During this period, the holder is entitled to full voting rights and dividends. The dividends are held by the Company and only paid if and when the grants are vested. The 2007 Plan also contains a double trigger change-in-control provision pursuant to which unvested shares of stock granted through the plan will be accelerated upon a change in control if the executive is terminated without cause as a result of the transaction (as long as the shares granted remain part of the Company or are transferred into the shares of the new company).
In 2022, as part of the BBI acquisition, the Company assumed outstanding options previously granted by BBI under the BBI 2018 Stock Option Plan ("legacy BBI options"). In connection with the assumption of the legacy BBI options, the Company reserved for issuance 310,427 shares of common stock to be issued upon exercise of such options. These options had a weighted average exercise price of $29.23 and were fully vested upon acquisition.
NOTE N - SUBORDINATED DEBT
On June 30, 2006, the Company issued $4.1 million of floating rate junior subordinated deferrable interest debentures to The First Bancshares Statutory Trust 2
in which the Company owns all of the common equity.(“Trust 2”). The debentures are the sole asset of Trust
2, and the Company is the sole owner of the common equity of Trust 2.
The Trust
2 issued
$4,000,000$4.0 million of Trust Preferred Securities to investors. The Company’s obligations under the debentures and related documents, taken together, constitute a full and unconditional guarantee by the Company of the
Trust’sTrust 2’s obligations under the preferred securities. The preferred securities are redeemable by the Company at its option. The preferred securities must be redeemed upon maturity of the debentures in 2036. Interest on the preferred securities is the
three month London Interbank Offerthree-month term Secured Overnight Financing Rate
(LIBOR)("SOFR") plus 1.65%
plus a tenor spread adjustment of 0.026161% and is payable quarterly. The terms of the subordinated debentures are identical to those of the preferred securities.
On July 27, 2007, the Company issued $6.2 million of floating rate junior subordinated deferrable interest debentures to The First Bancshares Statutory Trust 3
in which the(“Trust 3”). The Company owns all of the common
equity. Theequity of Trust 3, and the debentures are the sole asset of Trust 3.
The Trust
3 issued
$6,000,000$6.0 million of Trust Preferred Securities to investors. The Company’s obligations under the debentures and related documents, taken together, constitute a full and unconditional guarantee by the Company of the
Trust’sTrust 3’s obligations under the preferred securities. The preferred securities are redeemable by the Company at its option. The preferred securities must be redeemed upon maturity of the debentures in 2037. Interest on the preferred securities is the
three month LIBORthree-month term SOFR plus 1.40%
plus a tenor spread adjustment of 0.026161% and is payable quarterly. The terms of the subordinated debentures are identical to those of the preferred securities.
In 2018, as a result of the acquisition of FMB Banking Corporation ("FMB"), the Company acquired FMB’s Capital Trust 1, which consistedbecame the successor to FMB's obligations in respect of $6.1$6.2 million of floating rate junior subordinated deferrable interest debentures in which the Company owns all of the common equity.issued to FMB Capital Trust 1 ("FMB Trust"). The debentures are the sole asset of FMB Trust, 1. Theand the Company is the sole owner of the common equity of FMB Trust. FMB Trust issued $6,000,000$6.0 million of Trust Preferred Securities to investors. The Company’s obligations under the debentures and related documents, taken together, constitute a full and unconditional guarantee by the Company of the Trust’sFMB Trust's obligations under the preferred securities. The preferred securities issued by the FMB Trust are redeemable by the Company at its option. The preferred securities must be redeemed upon maturity of the debentures in 2033. Interest on the preferred securities is the three month LIBORthree-month term SOFR plus 2.85% plus a tenor spread adjustment of 0.026161% and is payable quarterly. The terms
On January 1, 2023, as a result of the acquisition of HSBI, the Company became the successor to HSBI's obligations in respect of $10.3 million of subordinated debentures issued to Liberty Shares Statutory Trust II ("Liberty Trust"). The debentures are identicalthe sole asset of Liberty Trust, and the Company is the sole owner of the common equity of Liberty Trust. Liberty Trust issued $10.0 million of preferred securities to thosean investor. The Company's obligations under the debentures and related documents, taken together, constitute a full and unconditional guarantee by the Company of
Liberty Trust's obligations under the preferred securities. The preferred securities issued by the Liberty Trust are redeemable by the Company at its option. The preferred securities must be redeemed upon maturity of the debentures in 2036. Interest on the preferred securities is the three-month term SOFR plus 1.48% plus a tenor spread adjustment of 0.026161% and is payable quarterly.
In accordance with the provisions of ASC Topic 810, Consolidation, the trustsTrust 2, Trust 3, FMB Trust, and Liberty Trust are not included in the consolidated financial statements.
NotesNotes
On April 30, 2018, The Company entered into two Subordinated Note Purchase Agreements pursuant to which the Company sold and issued $24.0 million in aggregate principal amount of 5.875% fixed-to-floating rate subordinated notes due 2028 (the "Notes due 2028") and $42.0 million in aggregate principal amount of 6.40% fixed-to-floating rate subordinated notes due 2033 (collectively,(the “Notes due 2033”). In May of 2023, the “Notes”).
Company redeemed all $24.0 million of the outstanding 5.875% fixed-to-floating rate subordinated notes due 2028.
The Notes due 2033 are not convertible into or exchangeable for any other securities or assets of the Company or any of its subsidiaries. The Notes due 2033 are not subject to redemption at the option of the holder. Principal and interest on the Notes due 2033 are subject to acceleration only in limited circumstances. The Notes due 2033 are unsecured, subordinated obligations of the Company and rank junior in right to payment to the Company’s current and future senior indebtedness, and each Note is pari passu in right to payment with respect to the other Notes. The Notes due 2033 have a fifteen year term, maturing May 1, 2033, and will bear interest at a fixed annual rate of 6.40%, payable quarterly in arrears, for the first ten years of the term. Thereafter, the interest rate will re-set quarterly to an interest rate per annum equal to a benchmark rate (which is expected to be three-month term SOFR plus 3.39% plus a tenor spread adjustment of 0.026161%), payable quarterly in arrears. As provided in the Notes due 2033, under specified conditions the interest rate on the Notes due 2033 during the applicable floating rate period may be determined based on a rate other than Three-Month Term SOFR. The Company is entitled to redeem the Notes due 2033, in whole or in part, on any interest payment date on or after May 1, 2028, and to redeem the Notes due 2033 at any time in whole upon certain other specified events.
On September 25, 2020, The Company entered into a Subordinated Note Purchase Agreement with certain qualified institutional buyers pursuant to which the Company sold and issued $65.0 million in aggregate principal amount of its 4.25% Fixed to Floating Rate Subordinated Notes due
2030.2030 (the "Notes due 2030"). The Notes
due 2030 are unsecured and have a ten-year term, maturing October 1, 2030, and will bear interest at a fixed annual rate of 4.25%, payable semi-annually in arrears, for the first five years of the term. Thereafter, the interest rate will reset quarterly to an interest rate per annum equal to a benchmark rate (which is expected to be the Three-Month Term SOFR plus 412.6 basis
points,points), payable quarterly in arrears. As provided in the Notes
due 2030, under specified conditions the interest rate on the Notes
due 2030 during the applicable floating rate period may be determined based on a rate other than Three-Month Term SOFR. The Company is entitled to redeem the Notes
due 2030, in whole or in part, on any interest payment date on or after October 1, 2025, and to redeem the Notes
due 2030 at any time in whole upon certain other specified events.
The Company had
$144.7$123.4 million of subordinated debt, net of deferred issuance costs
$2.1$1.6 million and unamortized fair value mark
$646 thousand,$2.1 million, at December 31,
2021,2023, compared to
$144.6$145.0 million, net of deferred issuance costs
$2.2$1.9 million and unamortized fair value mark
$700$593 thousand, at December 31,
2020.
2022. The decrease in subordinated debt was attributable to the Company's redemption of $24.0 million of its Notes due 2028 and the Company's repayment of $2.0 million of its Notes due 2030 in May of 2023, which resulted in the Company recording a $217 thousand gain on the repurchased debt. The decrease in subordinated debt was partially offset by the addition of $9.0 million, net purchase accounting adjustments, of subordinated debt that the Company acquired as part of the HSBI acquisition.
Shares held in treasury totaled
1,249,607 at December 31, 2023, 1,249,607 at December 31, 2022 and 649,607 at December 31,
2021, 483,984 at December 31, 2020 and 194,682 at December 31, 2019.On March 28, 2019, the Company announced that its Board of Directors authorized a share repurchase program to purchase up to an aggregate of $20 million of the Company’s common stock (the “March 2019 program”). This share repurchase program had an expiration date of December 31, 2019. Under the March 2019 program, the Company could repurchase shares of its common stock periodically in a manner determined by the Company’s management. The actual means and timing of purchase, target number of shares and maximum price or range of prices under the program was determined by management at its discretion and depended on a number of factors, including the market price of the Company’s common stock, general market and economic conditions, and applicable legal and regulatory requirements. The Company repurchased 168,188 shares under the March 2019 program during 2019.
On May 7, 2020, the Company announced the renewal of its share repurchase program that previously expired on December 31, 2019. Under the program, the Company could from time to time repurchase up to $15 million of shares of its common stock in any manner determined appropriate by the Company’s management. The actual timing and method of any purchases, the target number of shares and the maximum price (or range of prices) under the program, was determined by management at its discretion and depended on a number of factors, including the market price of the Company’s common stock, general market and economic conditions, and applicable legal and regulatory requirements. The renewed share repurchase program expired on December 31, 2020. The Company repurchased 289,302 shares in 2020 pursuant to the program.
On December 16, 2020, the Company announced that its Board of Directors has authorized a share repurchase program (the “2021 Repurchase Program”), pursuant to which the Company may purchase up to an aggregate of $30 million in shares of the Company’s issued and outstanding common stock. Under the program, the Company could, but is not required to, from time to time repurchase up $30 million of its own common stock in any manner determined appropriate by the Company’s management. The actual timing and method of any purchases, the target number of shares and the maximum price (or range of prices) under the program, was be determined by management at is discretion and depended on a number of factors, including the market price of the Company’s common stock, general market and economic conditions, and applicable legal and regulatory requirements. The 2021 Repurchase Program expired on December 31, 2021. The Company repurchased 165,623 shares in 2021 pursuant to the 2021 Repurchase Program.
On February 8, 2022, the Company announced the renewal of the 2021 Repurchase Program that previously expired on December 31, 2021. Under the renewed 2021 Repurchase Program, the Company could repurchase up to an aggregate of $30$30.0 million of the Company’s issued and outstanding common stock in any manner determined appropriate by the Company’s management, less the amount of prior purchases under the program during the 2021 calendar year. The renewed 2021 Repurchase Program was completed in February 2022 when the Company’s repurchases under the program
approached the maximum authorized amount.
The Company repurchased 600,000 shares under the 2021 Repurchase Program in the first quarter of 2022.
On March 9, 2022, the Company announced that its Board of Directors authorized a new share repurchase program (the “2022 Repurchase Program”), pursuant to which the Company could purchase up to an aggregate of $30.0 million in shares of the Company’s issued and outstanding common stock during the 2022 calendar year. Under the program, the Company could, but was not required to, from time to time repurchase up $30.0 million of shares of its own common stock in any manner determined appropriate by the Company’s management. The actual timing and method of any purchases, the target number of shares and the maximum price (or range of prices) under the program, was determined by management at is discretion and will depend on a number of factors, including the market price of the Company’s common stock, general market and economic conditions, and applicable legal and regulatory requirements. The 2022 Repurchase Program expired on December 31, 2022.
The Inflation Reduction Act of 2022 signed into law in August 2022 includes a provision for an excise tax equal to 1% of the fair market value of any stock repurchased by covered corporations during a taxable year, subject to certain limits and provisions. The excise tax is effective beginning in fiscal year 2023. While we may complete transactions subject to the new excise tax, we do not expect a material impact to our statement of condition or result of operations.
On February 28, 2023, the Company announced that its Board of Directors has authorized a new share repurchase program (the “2022"2023 Repurchase Program”Program"), pursuant to which the Company may purchase up to an aggregate of $30$50.0 million in shares of the Company’sCompany's issued and outstanding common stock during the 20202023 calendar year. Under the program, the Company may, but is not required to, from time to time repurchase up $30$50.0 million of shares of its own common stock in any manner determined appropriate by the Company’s management. The actual timing and method of any purchases, the target number of shares and the maximum price (or range of prices) under the program, will be determined by management at is discretion and will depend on a number of factors, including the market price of the Company’s common stock, general market and economic conditions, and applicable legal and regulatory requirements. The 20222023 Repurchase Program expired on December 31, 2023.
On February 28, 2024, the Company announced that its Board of Directors has authorized a new share repurchase program (the "2024 Repurchase Program"), pursuant to which the Company may purchase up to an aggregate of $50.0 million in shares of the Company's issued and outstanding common stock during the 2024 calendar year. Under the program, the Company may, but is not required to, from time to time repurchase up $50.0 million of shares of its own common stock in any manner determined appropriate by the Company’s management. The actual timing and method of any purchases, the target number of shares and the maximum price (or range of prices) under the program, will be determined by management at is discretion and will depend on a number of factors, including the market price of the Company’s common stock, general market and economic conditions, and applicable legal and regulatory requirements. The 2024 Repurchase Program will
have an expiration date ofexpire on December 31,
2022.
2024.
NOTE P - RELATED PARTY TRANSACTIONS
In the normal course of business, the Bank makes loans to its directors and executive officers and to companies in which they have a significant ownership interest. Such loans amounted to approximately
$21.9$23.7 million and
$22.7$28.3 million at December 31,
20212023 and
2020,2022, respectively. The activity in loans to current directors, executive officers, and their affiliates during the year ended December 31,
2021,2023, is summarized as
follows ($ in thousands):
| | | |
Loans outstanding at beginning of year | | $ | 22,685 |
New loans | | | 650 |
Repayments | | | (1,480) |
Loans outstanding at end of year | | $ | 21,855 |
follows:
| | | | | |
| ($ in thousands) | |
| Loans outstanding at beginning of year | $ | 28,338 | |
| Advances/new loans | 725 | |
| Removed/payments | (5,383) | |
| Loans outstanding at end of year | $ | 23,680 | |
Deposits from principal officers, directors, and their affiliates at year-end
20212023 and
20202022 were
$14.8$15.6 million and
$10.5$16.8 million.
NOTE Q - COMMITMENTS, CONTINGENCIES, AND CONCENTRATIONS OF CREDIT RISK
In the normal course of business, there are outstanding various commitments and contingent liabilities, such as guaranties, commitments to extend credit, overdraft protection, etc., which are not reflected in the accompanying financial statements. Commitments to extend credit and letters of credit include some exposure to credit loss in the event of nonperformance of the customer. Commitments to extend credit are agreements to lend to a customer as long as there is no violation of any condition established in the contract. Standby letters of credit are conditional commitments issued by the Bank to guarantee the performance of a customer to a third party. The credit policies and procedures for such commitments are the same as those used for lending activities. Because these instruments have fixed maturity dates and because a number expire without being drawn upon, they generally do not present any significant liquidity risk. No significant losses on commitments were incurred during the
two years ended December 31,
2021,2023 and 2022, nor are any significant losses as a result of these transactions anticipated.
The contractual amounts of financial instruments with off-balance-sheet risk at year-end were as follows:
| | | | | | | | | | | | |
| | 2021 | | 2020 |
($ in thousands) | | Fixed Rate | | Variable Rate | | Fixed Rate | | Variable Rate |
Commitments to make loans | | $ | 80,760 | | $ | 23,946 | | $ | 97,738 | | $ | 16,203 |
Unused lines of credit | | | 213,332 | | | 309,791 | | | 157,006 | | | 195,221 |
Standby letters of credit | | | 2,586 | | | 9,737 | | | 4,182 | | | 11,486 |
| | | | | | | | | | | | | | | | | | | | | | | |
| 2023 | | 2022 |
| ($ in thousands) | Fixed Rate | | Variable Rate | | Fixed Rate | | Variable Rate |
| Commitments to make loans | $ | 34,380 | | | $ | 50,226 | | | $ | 43,227 | | | $ | 15,758 | |
| Unused lines of credit | 231,335 | | | 605,646 | | | 243,043 | | | 404,025 | |
| Standby letters of credit | 15,573 | | | 13,114 | | | 4,260 | | | 9,909 | |
Commitments to make loans are generally made for periods of 90 days or less. The fixed rate loan commitments have interest rates ranging from 1.0% to 18.0% and maturities ranging from 1 year to 30 years.
ALLOWANCE FOR CREDIT LOSSES (“ACL”) ON OFF BALANCE SHEET CREDIT (“OBSC”) Exposures
The Company adopted ASC 326, effective January 1, 2021, which requires the Company to estimate expected credit losses for OBSC exposures which are not unconditionally cancellable. The Company maintains a separate ACL on OBSC exposures, including
unfunded commitments and letters of credit, which is included on the accompanying consolidated balance sheet as offor the years ended December 31, 2021.2023 and 2022. The ACL on OBSC exposures is adjusted as a provision for credit loss expense. The estimate includes consideration of the likelihood that funding will occur and an estimate of expected credit losses on commitments expected to be funded over its estimated life. Upon adoption of ASC 326,
Changes in the Company recorded an ACL on unfunded commitments of $718 thousand.OBSC exposures were as follows for the presented periods:
| | | | | | | | | | | | | | | | | |
| ($ in thousands) | 2023 | | 2022 | | 2021 |
| Balance at beginning of period | $ | 1,325 | | $ | 1,070 | | $ | — |
| Adoption of ASU 326 | — | | — | | 718 |
| Credit loss expense related to OBSC exposures | 750 | | 255 | | 352 |
| Balance at end of period | $ | 2,075 | | $ | 1,325 | | $ | 1,070 |
Adjustments to the ACL on OBSC exposures are recorded to provision for credit losses OBSC exposures. The Company recorded
a $353$750 thousand,
$255 thousand, and $352 thousand to the provision for credit losses
OBSC exposures for the years ended December 31, 2023, 2022, and 2021 respectively. The increase in the ACL on OBSC exposures for the year ended December 31,
2021.2023 compared to the same period in 2022 was due to the day one provision for unfunded commitments related to the HSBI acquisition and an increase in unfunded commitments.
No credit loss estimate is reported for OBSC exposures that are unconditionally cancellable by the Company or for undrawn amounts under such arrangements that may be drawn prior to the cancellation on the arrangement.
The Company currently has 87 full service110 full-service banking and financial service offices, one motor bank facility and twofive loan production offices across Mississippi, Alabama, Florida, Georgia, and Louisiana. Management closely monitors its credit concentrations and attempts to diversify the portfolio within its primary market area. As of December 31, 2021,2023, management does not consider there to be any significant credit concentrations within the loan portfolio. Although the
Bank’s loan portfolio, as well as existing commitments, reflects the diversity of its primary market area, a substantial portion of a borrower's ability to repay a loan is dependent upon the economic stability of the area.
In the normal course of business, the Company and its subsidiary are subject to pending and threatened legal actions. Although the Company is not able to predict the outcome of such actions, after reviewing pending and threatened actions with counsel, management believes that based on the information currently available the outcome of such actions, individually or in the aggregate, will not have a material adverse effect on the Company’s consolidated financial statements.
NOTE R - FAIR VALUES OF ASSETS AND LIABILITIES
The Company follows the guidance of ASC Topic 820, Fair Value Measurements and Disclosures, that which establishes a framework for measuring fair value and expands disclosures about fair value measurements. The guidance defines the fair value as the price that would be received to sell an asset or paid to transfer a liability in an orderly transaction between market participants at the measurement date. It also establishes a fair value hierarchy which requires an entity to maximize the use of observable inputs and minimize the use of unobservable inputs when measuring fair value.
In accordance with the guidance, the Company groups its financial assets and financial liabilities measured at fair value in three levels, based on the markets in which the assets and liabilities are traded, and the reliability of the assumptions used to determine fair value. These levels are:
Level 1:Valuations for assets and liabilities traded in active exchange markets, such as the New York Stock Exchange. Valuations are obtained from readily available pricing sources for market transactions involving identical assets or liabilities. Level 2:Valuations for assets and liabilities traded in less active dealer or broker markets. Valuations are obtained from third party pricing services for identical or comparable assets or liabilities which use observable inputs other than Level 1 prices, such as quoted prices for similar assets or liabilities; quoted prices in markets that are not active; or other inputs that are observable or can be corroborated by observable market data for substantially the full term of the assets and liabilities. Level 3:Significant unobservable inputs that reflect a company’s own assumptions about the assumptions that market participants would use in pricing an asset or liability.Following
The following methods and assumptions were used to estimate the fair value of each class of financial instrument for which it is practicable to estimate that value:
Cash and Cash Equivalents – For such short-term instruments, the carrying amount is a descriptionreasonable estimate of the valuation methodologies used for instruments measured at fair value on a recurring basis and recognized in the accompanying consolidated balance sheets.value.
Debt Securities-The fair value of available-for-sale securities is determined by various valuation methodologies. Where quoted market prices are available in an active market, securities are classified within Level 1. If quoted market prices are not available, then fair values are
estimated by using pricing models or quoted prices of securities with similar characteristics. Level 2 securities include obligations of U.S. government corporations and agencies, obligations of states and political subdivisions, mortgage-backed securities, and collateralized mortgage obligations. In certain cases where Level 1 or Level 2 inputs are not available, securities are classified within Level 3 of the hierarchy. For securities where quoted prices or market prices of similar securities are not available, fair values are calculated using the discounted cash flow or other market indicators (Level 3).
Loans – The fair value of loans was estimated by discounting the expected future cash flows using the current interest rates at which similar loans would be made for the same remaining maturities, in accordance with the exit price notion as defined by FASB ASC 820, Fair Value Measurement ("ASC 820"). Expected future cash flows were projected based on contractual cash flows, adjusted for estimated prepayments and as a result of the adoption of ASU 2016-01, which also included credit risk and other market factors to calculate the exit price fair value in accordance with ASC 820.
Loans Held for Sale - Loans held for sale are carried at fair value in the aggregate as determined by the outstanding commitments from investors. As, such we classify those loans subjected to nonrecurring fair value adjustments as Level 2 of the fair value hierarchy.
Interest Rate Swaps - The Company offers interest rate swaps to certain commercial loan customers to allow them to hedge the risk of rising interest rates on their variable rate loans. The Company originates a variable rate loan and enters into a variable to fixed interest rate swap with the customer. The Company also enters into an offsetting swap with a correspondent bank. These back-to-back agreements are intended to offset each other and allow the Company to originate a variable rate loan, while providing the contract or fixed interest payments for the customer. In addition, the Company will enter into risk participation agreements ("RPA"). Under an RPA-in agreement, a derivative liability, the Company assumes, or participates in, a portion of the credit risk associated with the interest rate swap position with the commercial borrower, for a fee received from the other bank. Under an RPA-out agreement, a derivative asset, the Company participates out a portion of the credit risk associated with the interest rate swap position executed with the commercial borrower, for a fee paid to the participating bank. RPAs are derivative financial instruments recorded at fair value. Although we have determined that a majority of the inputs used to value our derivatives fall within Level 2 of the fair value hierarchy, the credit assumptions associated with our risk participation agreements utilize Level 3 inputs.
Accrued Interest Receivable – The carrying amount of accrued interest receivable approximates fair value and is classified as level 2 for accrued interest receivable related to investments securities and Level 3 for accrued interest receivable related to loans.
Deposits – The fair values of demand deposits are, as required by ASC Topic 825, equal to the carrying value of such deposits. Demand deposits include non-interest-bearing demand deposits, savings accounts, NOW accounts, and money market demand accounts. The fair value of variable rate term deposits, those repricing within six months or less, approximates the carrying value of these deposits. Discounted cash flows have been used to value fixed rate term deposits and variable rate term deposits repricing after six months. The discount rate used is based on interest rates currently being offered on comparable deposits as to amount and term.
Short-Term Borrowings – The carrying value of any federal funds purchased and other short-term borrowings approximates their fair values.
FHLB and Other Borrowings – The fair value of the fixed rate borrowings is estimated using discounted cash flows, based on current incremental borrowing rates for similar types of borrowing arrangements. The carrying amount of any variable rate borrowing approximates its fair value.
Subordinated Debentures – Fair values are determined based on the current market value of like instruments of a similar maturity and structure.
Accrued Interest Payable – The carrying amount of accrued interest payable approximates fair value resulting in a Level 2 classification.
Off-Balance Sheet Instruments – Fair values of off-balance sheet financial instruments are based on fees charged to enter into similar agreements. However, commitments to extend credit do not represent a significant value until such commitments are funded or closed. Management has determined that these instruments do not have a distinguishable fair value and no fair value has been assigned.
The following table presents the Company’s securities that are measured at fair value on a recurring basis and the level within the hierarchy in which the fair value measurements fell as of December 31,
20212023 and
2020 ($ in thousands):
| | | | | | | | | | | | |
December 31, 2021 | | Fair Value Measurements |
($ in thousands) | | | | | Quoted Prices in | | Significant | | | |
| | | | | Active Markets | | Other | | Significant |
| | | | | For | | Observable | | Unobservable |
| | | | | Identical Assets | | Inputs | | Inputs |
| | Fair Value | | (Level 1) | | (Level 2) | | (Level 3) |
Available-for-sale | | | | | | | | | | | | |
U.S. Treasury | | $ | 135,158 | | $ | 135,158 | | $ | 0 | | $ | 0 |
Obligations of U.S. government agencies and sponsored entities | | | 183,021 | | | 0 | | | 183,021 | | | 0 |
Municipal securities | | | 708,502 | | | 0 | | | 688,379 | | | 20,123 |
Mortgage-backed Securities | | | 688,298 | | | 0 | | | 688,298 | | | 0 |
Corporate obligations | | | 36,853 | | | 0 | | | 36,810 | | | 43 |
Total available for sale | | $ | 1,751,832 | | $ | 135,158 | | $ | 1,596,508 | | $ | 20,166 |
| | | | | | | | | | | | |
December 31, 2020 | | Fair Value Measurements |
($ in thousands) | | | | | Quoted Prices in | | Significant | | | |
| | | | | Active Markets | | Other | | Significant |
| | | | | For | | Observable | | Unobservable |
| | | | | Identical Assets | | Inputs | | Inputs |
| | Fair Value | | (Level 1) | | (Level 2) | | (Level 3) |
Available-for-sale | | | | | | | | | | | | |
U.S. Treasury | | $ | 9,383 | | $ | 9,383 | | $ | 0 | | $ | 0 |
Obligations of U.S. government agencies and sponsored entities | | | 100,170 | | | 0 | | | 100,170 | | | 0 |
Municipal securities | | | 480,374 | | | 0 | | | 460,248 | | | 20,126 |
Mortgage-backed securities | | | 401,232 | | | 0 | | | 401,232 | | | 0 |
Corporate obligations | | | 31,023 | | | 0 | | | 30,788 | | | 235 |
Total available for sale | | $ | 1,022,182 | | $ | 9,383 | | $ | 992,438 | | $ | 20,361 |
2022:
| | | | | | | | | | | | | | | | | | | | | | | | | | |
| December 31, 2023 | | Fair Value Measurements |
| ($ in thousands) | | Fair Value | | Quoted Prices in
Active Markets
For
Identical Assets
(Level 1) | | Significant
Other
Observable
Inputs
(Level 2) | | Significant
Unobservable
Inputs
(Level 3) |
| Assets: | | | | | | | | |
| Available-for-sale | | | | | | | | |
| U.S. Treasury | | $ | 16,675 | | | $ | 16,675 | | | $ | — | | | $ | — | |
| Obligations of U.S. government agencies and sponsored entities | | 104,923 | | | — | | | 104,923 | | | — | |
| Municipal securities | | 438,466 | | | — | | | 420,283 | | | 18,183 | |
| Mortgage-backed Securities | | 441,661 | | | — | | | 441,661 | | | — | |
| Corporate obligations | | 37,597 | | | — | | | 37,567 | | | 30 | |
| Other | | 3,043 | | | — | | | 3,043 | | | — | |
| Total investment securities available-for-sale | | $ | 1,042,365 | | | $ | 16,675 | | | $ | 1,007,477 | | | $ | 18,213 | |
| Loans held for sale | | 2,914 | | | — | | | 2,914 | | | — | |
| Interest rate swaps | | $ | 12,170 | | | $ | — | | | $ | 12,129 | | | $ | 41 | |
| Liabilities: | | | | | | | | |
| Interest rate swaps | | $ | 12,175 | | | $ | — | | | $ | 12,129 | | | $ | 46 | |
| | | | | | | | | | | | | | | | | | | | | | | | | | |
| December 31, 2022 | | Fair Value Measurements |
| ($ in thousands) | | Fair Value | | Quoted Prices in
Active Markets
For
Identical Assets
(Level 1) | | Significant
Other
Observable
Inputs
(Level 2) | | Significant
Unobservable
Inputs
(Level 3) |
| Assets: | | | | | | | | |
| Available-for-sale | | | | | | | | |
| U.S. Treasury | | $ | 123,854 | | | $ | 123,854 | | | $ | — | | | $ | — | |
| Obligations of U.S. government agencies and sponsored entities | | 144,369 | | | — | | | 144,369 | | | — | |
| Municipal securities | | 457,857 | | | — | | | 442,740 | | | 15,117 | |
| Mortgage-backed securities | | 490,139 | | | — | | | 490,139 | | | — | |
| Corporate obligations | | 40,882 | | | — | | | 40,851 | | | 31 | |
| Total investment securities available-for-sale | | $ | 1,257,101 | | | $ | 123,854 | | | $ | 1,118,099 | | | $ | 15,148 | |
| Loans held for sale | | $ | 4,443 | | | $ | — | | | $ | 4,443 | | | $ | — | |
| Interest rate swaps | | $ | 12,825 | | | $ | — | | | $ | 12,825 | | | $ | — | |
| Liabilities: | | | | | | | | |
| Interest rate swaps | | $ | 12,825 | | | $ | — | | | $ | 12,825 | | | $ | — | |
The following is a reconciliation of activity for assets measured at fair value based on significant unobservable (Level 3) information:
| | | | | | |
| | Bank-Issued Trust |
| | Preferred Securities |
($ in thousands) | | 2021 | | 2020 |
Balance, January 1 | | $ | 235 | | $ | 408 |
Paydowns | | | (215) | | | (162) |
Gain included in income | | | 27 | | | — |
Unrealized (loss) included in comprehensive income | | | (4) | | | (11) |
Balance, December 31 | | $ | 43 | | $ | 235 |
| | | | | | |
| | Municipal Securities |
($ in thousands) | | 2021 | | 2020 |
Balance, January 1 | | $ | 20,126 | | $ | 10,345 |
Purchases | | | 6,019 | | | 19,397 |
Maturities, calls and paydowns | | | (5,457) | | | (3,334) |
Transfer to level 2 | | | — | | | (6,294) |
Unrealized (loss) gain included in comprehensive income | | | (565) | | | 12 |
| | | | | | | | | | | | | | |
| | Bank-Issued Trust
Preferred Securities |
| ($ in thousands) | | 2023 | | 2022 |
| Balance, January 1 | | $ | 31 | | | $ | 43 | |
| Paydowns | | (1) | | | (12) | |
| Balance, December 31 | | $ | 30 | | | $ | 31 | |
Table of Contents
| | | | | | | | | | | | | | |
| | Municipal Securities |
| ($ in thousands) | | 2023 | | 2022 |
| Balance, January 1 | | $ | 15,117 | | | $ | 20,123 | |
| Maturities, calls and paydowns | | (2,639) | | | (2,328) | |
| Transfer from level 2 to level 3 | | 6,085 | | | — | |
| Unrealized (loss) gain included in comprehensive income | | (380) | | | (2,678) | |
| Balance, December 31 | | $ | 18,183 | | $ | 15,117 |
| | | | | | | | |
| | Interest Rate Swaps - Risk Participations |
| ($ in thousands) | | 2023 |
| Balance, January 1 | | $ | — | |
| RPA-in | | (46) | |
| RPA-out | | 41 | |
| Balance at December 31 | | $ | $
(5) | | 20,123
| $
| 20,126
|
The following methods and assumptions were used to estimate the fair values of the Company’s assets measured at fair value on a recurring basis at December 31,
20212023 and
2020.2022. The following tables present quantitative information about recurring Level 3 fair value
measurements ($ in thousands):
| | | | | | | | | |
| | | | | | | Significant Unobservable | | |
Trust Preferred Securities | | Fair Value | | Valuation Technique | | Inputs | | Range of Inputs |
December 31, 2021 | | $ | 43 | | Discounted cash flow | | Discount rate | | 2.35% - 2.47% |
December 31, 2020 | | $ | 235 | | Discounted cash flow | | Discount rate | | 1.08% - 2.48% |
| | | | | | | | | |
| | | | | | | Significant Unobservable | | |
Municipal Securities | | Fair Value | | Valuation Technique | | Inputs | | Range of Inputs |
December 31, 2021 | | $ | 20,123 | | Discounted cash flow | | Discount rate | | 0.50% - 1.90% |
December 31, 2020 | | $ | 20,126 | | Discounted cash flow | | Discount rate | | 0.50% - 2.45% |
measurements:
| | | | | | | | | | | | | | | | | | | | | | | | | | |
| ($ in thousands) | | | | | | | | |
| Bank-Issued Trust Preferred Securities | | Fair Value | | Valuation Technique | | Significant Unobservable
Inputs | | Range of Inputs |
| December 31, 2023 | | $ | 30 | | | Discounted cash flow | | Discount rate | | 7.81% - 7.89% |
| December 31, 2022 | | $ | 31 | | | Discounted cash flow | | Discount rate | | 6.98% - 7.19% |
| | | | | | | | | | | | | | | | | | | | | | | | | | |
| Municipal Securities | | Fair Value | | Valuation Technique | | Significant Unobservable
Inputs | | Range of Inputs |
| December 31, 2023 | | $ | 18,183 | | Discounted cash flow | | Discount rate | | 2.34% - 5.50% |
| December 31, 2022 | | $ | 15,117 | | Discounted cash flow | | Discount rate | | 3.00% - 4.00% |
| | | | | | | | | | | | | | | | | | | | | | | | | | |
| Interest Rate Swaps - Risk Participations | | Fair Value | | Valuation Technique | | Significant Unobservable
Inputs | | Range of Inputs |
| December 31, 2023 | | $ | (5) | | Credit Value Adjustment | | Credit Spread | | 225 bps - 300 bps |
| | | | | | Recovery Rate | | 70% |
Following is a description of the valuation methodologies used for assets and liabilities measured at fair value on a non-recurring basis and recognized in the accompanying balance sheets, as well as the general classification of such assets and liabilities pursuant to the valuation hierarchy.
Collateral Dependent Loans
Loans for which it is probable that the Company will not collect all principal and interest due according to contractual terms are measured for impairment. If the impaired loan is identified as collateral dependent, then the fair value method of measuring the amount of impairment is utilized. This method requires obtaining a current independent appraisal of the collateral. These appraisals may utilize a single valuation approach or a combination of approaches including comparable sales and the income approach. Adjustments are routinely made in the appraisal process by the independent appraisers to adjust for differences between the comparable sales and income date available for similar loans and collateral underlying such loans. Such adjustments, if any, result in a Level 3 classification of the inputs for determining fair value. The Company adjusts the appraisal for cost associated with litigation and collections. Non-real estate collateral may be valued using an appraisal, net book value per the borrower’s financial statements, or aging reports, adjusted or discounted based on management’s expertise and knowledge of the client and client’s business, resulting in a Level 3 fair value classification. Impaired loans are evaluated on a quarterly basis for additional impairment.
Other real estate owned consists of properties obtained through foreclosure. The adjustment at the time of foreclosure is recorded through the allowance for loancredit losses. Fair value of other real estate owned is based on current independent appraisals of the collateral less costs to sell when acquired, establishing a new costs basis. These assets are subsequently accounted for at lower of cost or fair value less estimated costs to sell. Fair value is commonly based on recent real estate appraisals, which are updated no less frequently than annually. These appraisals may utilize a single valuation approach or a combination of approaches including comparable sales and the income approach with data from comparable properties. Adjustments are routinely made in the appraisal process by the independent appraisers to adjust for differences between the comparable sales and income data available. Such adjustments, if any, result in a Level 3 classification of the inputs for determining fair value. In the determination of fair value subsequent to foreclosure, management also considers other factors or recent developments, such as changes in market conditions from the time of valuation and anticipated sales values considering plans for disposition, which could result in an adjustment to lower the collateral value estimates indicated in the appraisals. The Company adjust the appraisal 10 percent for carrying costs. Periodic revaluations are classified as Level 3 in the fair value hierarchy since assumptions are used that may not be observable in the market. Due to the subjective nature of establishing the fair value when the asset is acquired, the actual fair value of the other real estate owned or foreclosed asset could differ from the original estimate. If it is determined the fair value declines subsequent to foreclosure, a valuation allowance is recorded through other income. Operating costs associated with the assets after acquisition are also recorded as non-interest expense. Gains and losses on the disposition of other real estate owned and foreclosed assets are netted and recorded in other income. Other real estate measured at fair value on a non-recurring basis at December 31, 2021,2023, amounted to $2.6$8.3 million. Other real estate owned is classified within Level 3 of the fair value hierarchy.
The following table presents the fair value measurement of assets and liabilities measured at fair value on a nonrecurring basis and the level within the fair value hierarchy in which the fair value measurements were reported at December 31, 20212023 and 2020:
2022:
| | | | | | | | | | | | | | | | | | | | | | | | | | |
| | Fair Value Measurements Using |
| ($ in thousands) | | Fair Value | | Quoted Prices in
Active Markets
For
Identical Assets
(Level 1) | | Significant
Other
Observable
Inputs
(Level 2) | | Significant
Unobservable
Inputs
(Level 3) |
| December 31, 2023 | | | | | | | | |
| Collateral dependent loans | | $ | 2,494 | | | $ | — | | | $ | — | | | $ | 2,494 | |
| Other real estate owned | | 8,320 | | | — | | | — | | | 8,320 | |
| | | | | | | | |
| December 31, 2022 | | | | | | | | |
| Collateral dependent loans | | $ | 5,552 | | | $ | — | | | $ | — | | | $ | 5,552 | |
| Other real estate owned | | 4,832 | | | — | | | — | | | 4,832 | |
| | | | | | | | | | | | |
| | Fair Value Measurements Using |
| | | | | Quoted Prices in | | Significant | | | |
| | | | | Active Markets | | Other | | Significant |
| | | | | For | | Observable | | Unobservable |
| | | | | Identical Assets | | Inputs | | Inputs |
($ in thousands) | | Fair Value | | (Level 1) | | (Level 2) | | (Level 3) |
December 31, 2021 | | | | | | | | | | | | |
Collateral dependent loans | | $ | 3,564 | | $ | 0 | | $ | 0 | | $ | 3,564 |
Other real estate owned | | | 2,565 | | | 0 | | | 0 | | | 2,565 |
| | | | | | | | | | | | |
December 31, 2020 | | | | | | | | | | | | |
Impaired loans | | $ | 15,107 | | $ | 0 | | $ | 0 | | $ | 15,107 |
Other real estate owned | | | 5,802 | | | 0 | | | 0 | | | 5,802 |
The following methods and assumptions were used to estimate the
Estimated fair
value of each class of financial instrument for which it is practicable to estimate that value:Cash and Cash Equivalents – For such short-term instruments, the carrying amount is a reasonable estimate of fair value.
Investment in securities available-for-sale and held-to-maturity – The fair value measurement for securities available-for-sale was discussed earlier. The same measurement approach was used for securities held-to-maturity and other securities.
Loans – The fair value of loans was estimated by discounting the expected future cash flows using the current interest rates at which similar loans would be madevalues for the same remaining maturities, in accordance with the exit price notion as defined by FASB ASC 820, Fair Value Measurement ("ASC 820"). Expected future cash flows were projected based on contractual cash flows, adjusted for estimated prepayments and as a result of the adoption of ASU 2016-01, which also included credit risk and other market factors to calculate the exit price fair value in accordance with ASC 820.
Bank-owned Life Insurance – The fair value of bank-owned life insurance approximates the carrying amount, because upon liquidation of these investments, the Company would receive the cash surrender value which equals the carrying amount.
Accrued Interest Receivable – The carrying amount of accrued interest receivable approximates fair value and is classified as level 2 for accrued interest receivable related to investments securities and Level 3 for accrued interest receivable related to loans.
Deposits – The fair values of demand deposits are, as required by ASC Topic 825, equal to the carrying value of such deposits. Demand deposits include non-interest-bearing demand deposits, savings accounts, NOW accounts, and money market demand accounts. The fair value of variable rate term deposits, those repricing within six months or less, approximates the carrying value of these deposits. Discounted cash flows have been used to value fixed rate term deposits and variable rate term deposits repricing after six months. The discount rate used is based on interest rates currently being offered on comparable deposits as to amount and term.
Short-Term Borrowings – The carrying value of any federal funds purchased and other short-term borrowings approximates their fair values.
FHLB and Other Borrowings – The fair value of the fixed rate borrowings is estimated using discounted cash flows, based on current incremental borrowing rates for similar types of borrowing arrangements. The carrying amount of any variable rate borrowing approximates its fair value.
Subordinated Debentures – Fair values are determined based on the current market value of like instruments of a similar maturity and structure.
Accrued Interest Payable – The carrying amount of accrued interest payable approximates fair value resulting in a Level 2 classification.
Off-Balance Sheet Instruments – Fair values of off-balance sheetCompany's financial instruments are based on fees charged to enter into similar agreements. However, commitments to extend credit do not represent a significant value until such commitments are funded or closed. Management has determined that these instruments do not have a distinguishable fair value and no fair value has been assigned.
as follows, as of the dated noted:
| | | | | | | | | | | | | | | | | | | | | | | | | | | | | | | | |
| | Fair Value Measurements |
| December 31, 2023 | | Carrying
Amount | | Estimated
Fair Value | | Quoted
Prices
(Level 1) | | Significant
Other Observable
Inputs
(Level 2) | | Significant
Unobservable
Inputs
(Level 3) |
| ($ in thousands) | |
| Financial Instruments: | | | | | | | | | | |
| Assets: | | | | | | | | | | |
| Cash and cash equivalents | | $ | 355,147 | | | $ | 355,147 | | | $ | 355,147 | | | $ | — | | | $ | — | |
| Securities available-for-sale | | 1,042,365 | | | 1,042,365 | | | 16,675 | | | 1,007,477 | | | 18,213 | |
| Securities held-to-maturity | | 654,539 | | | 615,944 | | | — | | | 615,944 | | | — | |
| Loans held for sale | | 2,914 | | | 2,914 | | | — | | | 2,914 | | | — | |
| Loans, net | | 5,116,010 | | | 4,877,935 | | | — | | | — | | | 4,877,935 | |
| Accrued interest receivable | | 33,300 | | | 33,300 | | | — | | | 8,632 | | | 24,668 | |
| Interest rate swaps | | 12,170 | | | 12,170 | | | — | | | 12,129 | | | 41 | |
| | | | | | | | | | |
| Liabilities: | | | | | | | | | | |
| Non-interest-bearing deposits | | $ | 1,849,013 | | | $ | 1,849,013 | | | $ | — | | | $ | 1,849,013 | | | $ | — | |
| Interest-bearing deposits | | 4,613,859 | | | 4,430,227 | | | — | | | 4,430,227 | | | — | |
| Subordinated debentures | | 123,386 | | | 109,426 | | | — | | | — | | | 109,426 | |
| FHLB and other borrowings | | 390,000 | | | 390,000 | | | — | | | 390,000 | | | — | |
| Accrued interest payable | | 22,702 | | | 22,702 | | | — | | | 22,702 | | | — | |
| Interest rate swaps | | 12,175 | | | 12,175 | | | — | | | 12,129 | | | 46 | |
| | | | | | | | | | | | | | | | | | | | | | | | | | | | | | | | |
| | Fair Value Measurements |
| December 31, 2022 | | Carrying
Amount | | Estimated
Fair Value | | Quoted
Prices
(Level 1) | | Significant
Other Observable
Inputs
(Level 2) | | Significant
Unobservable
Inputs
(Level 3) |
| ($ in thousands) | | | | | |
| Financial Instruments: | | | | | | | | | | |
| Assets: | | | | | | | | | | |
| Cash and cash equivalents | | $ | 145,315 | | | $ | 145,315 | | | $ | 145,315 | | | $ | — | | | $ | — | |
| Securities available-for-sale | | 1,257,101 | | | 1,257,101 | | | 123,854 | | | 1,118,099 | | | 15,148 | |
| Securities held-to-maturity | | 691,484 | | | 642,097 | | | — | | | 642,097 | | | — | |
| Loans held for sale | | 4,443 | | | 4,443 | | | — | | | 4,443 | | | — | |
| Loans, net | | 3,735,240 | | | 3,681,313 | | | — | | | — | | | 3,681,313 | |
| Accrued interest receivable | | 27,723 | | | 27,723 | | | — | | | 9,757 | | | 17,966 | |
| Interest rate swaps | | 12,825 | | | 12,825 | | | — | | | 12,825 | | | — | |
| | | | | | | | | | |
| Liabilities: | | | | | | | | | | |
| Non-interest-bearing deposits | | $ | 1,630,203 | | | $ | 1,630,203 | | | $ | — | | | $ | 1,630,203 | | | $ | — | |
| Interest-bearing deposits | | 3,864,201 | | | 3,505,990 | | | — | | | 3,505,990 | | | — | |
| Subordinated debentures | | 145,027 | | | 133,816 | | | — | | | — | | | 133,816 | |
| FHLB and other borrowings | | 130,100 | | | 130,100 | | | — | | | 130,100 | | | — | |
| Accrued interest payable | | 3,324 | | | 3,324 | | | — | | | 3,324 | | | — | |
| Interest rate swaps | | 12,825 | | | 12,825 | | | — | | | 12,825 | | | — | |
| | | | | | | | | | | | | | | |
| | Fair Value Measurements |
| | | | | | | | | | | Significant | | Significant |
| | | | | | | | Quoted | | Other Observable | | Unobservable |
December 31, 2021 | | Carrying | | Estimated | | Prices | | Inputs | | Inputs |
($ in thousands) | | Amount | | Fair Value | | (Level 1) | | (Level 2) | | (Level 3) |
Financial Instruments: | | | | | | | | | | | | | | | |
Assets: | | | | | | | | | | | | | | | |
Cash and cash equivalents | | $ | 919,713 | | $ | 919,713 | | $ | 919,713 | | $ | 0 | | $ | 0 |
Securities available-for-sale | | | 1,751,832 | | | 1,751,832 | | | 135,158 | | | 1,596,508 | | | 20,166 |
Loans, net | | | 2,928,811 | | | 2,956,297 | | | 0 | | | 0 | | | 2,956,297 |
Accrued interest receivable | | | 23,256 | | | 23,256 | | | 0 | | | 6,838 | | | 16,418 |
| | | | | | | | | | | | | | | |
Liabilities: | | | | | | | | | | | | | | | |
Non-interest-bearing deposits | | $ | 756,118 | | $ | 756,118 | | $ | 0 | | $ | 756,118 | | $ | 0 |
Interest-bearing deposits | | | 4,470,666 | | | 4,431,771 | | | 0 | | | 4,431,771 | | | 0 |
Subordinated debentures | | | 144,726 | | | 156,952 | | | 0 | | | 0 | | | 156,952 |
Accrued interest payable | | | 1,711 | | | 1,711 | | | 0 | | | 1,711 | | | 0 |
| | | | | | | | | | | | | | | |
| | Fair Value Measurements |
| | | | | | | | | | | Significant | | Significant |
| | | | | | | | Quoted | | Other Observable | | Unobservable |
December 31, 2020 | | Carrying | | Estimated | | Prices | | Inputs | | Inputs |
($ in thousands) | | Amount | | Fair Value | | (Level 1) | | (Level 2) | | (Level 3) |
Financial Instruments: | | | | | | | | | | | | | | | |
Assets: | | | | | | | | | | | | | | | |
Cash and cash equivalents | | $ | 562,554 | | $ | 562,554 | | $ | 562,554 | | $ | 0 | | $ | 0 |
Securities available-for-sale | | | 1,022,182 | | | 1,022,182 | | | 9,383 | | | 992,438 | | | 20,361 |
Loans, net | | | 3,087,858 | | | 3,089,318 | | | 0 | | | 0 | | | 3,089,318 |
Accrued interest receivable | | | 26,344 | | | 26,344 | | | 0 | | | 5,690 | | | 20,654 |
| | | | | | | | | | | | | | | |
Liabilities: | | | | | | | | | | | | | | | |
Non-interest-bearing deposits | | $ | 571,079 | | $ | 571,079 | | $ | 0 | | $ | 571,079 | | $ | 0 |
Interest-bearing deposits | | | 3,644,201 | | | 3,647,845 | | | 0 | | | 3,647,845 | | | 0 |
Subordinated debentures | | | 144,592 | | | 145,289 | | | 0 | | | 0 | | | 145,289 |
FHLB and other borrowings | | | 114,647 | | | 114,647 | | | 0 | | | 114,647 | | | 0 |
Accrued interest payable | | | 2,134 | | | 2,134 | | | 0 | | | 2,134 | | | 0 |
NOTE S - REVENUE FROM CONTRACTS WITH CUSTOMERS
All of the Company’s revenue from contracts with customers within the scope of ASC 606 is recognized within non-interest income. The guidance does not apply to revenue associated with financial instruments, including loans and investment securities that are accounted for under other GAAP, which comprise a significant portion of our revenue stream. A description of the Company’s revenue streams accounted for under ASC 606 is as follows:
Service Charges on Deposit Accounts: The Company earns fees from deposit customers for transaction-based, account maintenance, and overdraft services. Transaction-based fees, which include services such as ATM use fees, stop payment charges, statement rendering, and ACH fees, are recognized at the time the transaction is executed at the point in the time the Company fulfills the
customer’s request. Account maintenance fees, which relate primarily to monthly maintenance, are earned over the course of a month, representing the period over which the Company satisfies the performance obligation. Overdraft fees are recognized at the point in time that the overdraft occurs. Service charges on deposits are withdrawn from the customer’s account balance.
Interchange Income: The Company earns interchange fees from debit and credit card holder transaction conducted through various payment networks. Interchange fees from cardholder transactions represent a percentage of the underlying transaction value and are recognized daily, concurrently with the transaction processing services provided by the cardholder. Gains/Losses on Sales of OREO: The Company records a gain or loss from the sale of OREO when control of the property transfers to the buyer, which generally occurs at the time of an executed deed. When the Company finances the sale of OREO to the buyer, the Company assesses whether the buyer is committed to perform their obligations under the contract and whether the collectability of the transaction prices is probable. Once these criteria are met, the OREO asset is derecognized and the gain or loss on sale is recorded upon the transfer of control of the property to the buyer. In determining the gain or loss on the sale, the Company adjusts the transaction price and related gain (loss) on sale if a significant financing component is present. All of the Company’s revenue from contracts with customers in the scope of ASC 606 is recognized within non-interest income. The following table presents the Company’s sources of non-interest income for December 31,
2021, 2020,2023, 2022, and
2019.2021. Items outside the scope of ASC 606 are noted as such.
| | | | | | | | | | | | |
| | Year Ended December 31, 2021 |
| | Commercial/ | | Mortgage | | | | | | |
Revenue by Operating Segments | | Retail | | Banking | | Holding | | | |
($ in thousands) | | Bank | | Division | | Company | | Total |
Non-interest income | | | | | | | | | | | | |
Service charges on deposits | | | | | | | | | | | | |
Overdraft fees | | $ | 3,122 | | $ | 0 | | $ | 0 | | $ | 3,122 |
Other | | | 4,140 | | | 2 | | | 0 | | | 4,142 |
Interchange income | | | 11,562 | | | 0 | | | 0 | | | 11,562 |
Investment brokerage fees | | | 1,349 | | | 0 | | | 0 | | | 1,349 |
Net (losses) on OREO | | | (300) | | | 0 | | | 0 | | | (300) |
Net gains on sales of securities (a) | | | 143 | | | 0 | | | 0 | | | 143 |
Gain on acquisition | | | 1,300 | | | 0 | | | 0 | | | 1,300 |
Loss on premises and equipment | | | (264) | | | 0 | | | 0 | | | (264) |
Other | | | 7,487 | | | 8,821 | | | 111 | | | 16,419 |
Total non-interest income | | $ | 28,539 | | $ | 8,823 | | $ | 111 | | $ | 37,473 |
| | | | | | | | | | | | |
| | Year Ended December 31, 2020 |
| | Commercial/ | | Mortgage | | | | | | |
Revenue by Operating Segments | | Retail | | Banking | | Holding | | | |
($ in thousands) | | Bank | | Division | | Company | | Total |
Non-interest income | | | | | | | | | | | | |
Service charges on deposits | | | | | | | | | | | | |
Overdraft fees | | $ | 3,218 | | $ | 0 | | $ | 0 | | $ | 3,218 |
Other | | | 3,993 | | | 2 | | | 0 | | | 3,995 |
Interchange income | | | 9,433 | | | 0 | | | 0 | | | 9,433 |
Investment brokerage fees | | | 932 | | | 0 | | | 0 | | | 932 |
Net (losses) on OREO | | | (537) | | | 0 | | | 0 | | | (537) |
Net gains on sales of securities (a) | | | 281 | | | 0 | | | 0 | | | 281 |
Gain on acquisition | | | 7,835 | | | 0 | | | 0 | | | 7,835 |
Gain on premises and equipment | | | 443 | | | 0 | | | 0 | | | 443 |
Other | | | 4,940 | | | 10,444 | | | 892 | | | 16,276 |
Total non-interest income | | $ | 30,538 | | $ | 10,446 | | $ | 892 | | $ | 41,876 |
| | | | | | | | | | | | | | | | | | | | | | | |
| ($ in thousands) | Year Ended December 31, 2023 |
| Commercial/
Retail
Bank | | Mortgage
Banking
Division | | Holding
Company | | Total |
| Revenue by Operating Segments |
| Non-interest income | | | | | | | |
| Service charges on deposits | | | | | | | |
| Overdraft fees | $ | 8,154 | | | $ | — | | | $ | — | | | $ | 8,154 | |
| Other | 6,021 | | | — | | | — | | | 6,021 | |
| Interchange income | 18,914 | | | — | | | — | | | 18,914 | |
| Investment brokerage fees | 1,623 | | | — | | | — | | | 1,623 | |
| Net gains on OREO | 6 | | | — | | | — | | | 6 | |
| Net losses on sales of securities (1) | (9,716) | | | — | | | — | | | (9,716) | |
| Gain on premises and equipment | 35 | | | — | | | — | | | 35 | |
| Gain on sale of loans | 1,512 | | | — | | | — | | | 1,512 | |
| Other | 10,307 | | | 2,866 | | | 6,983 | | | 20,156 | |
| Total non-interest income | $ | 36,856 | | | $ | 2,866 | | | $ | 6,983 | | | $ | 46,705 | |
| | | | | | | | | | | | | | | | | | | | | | | |
| ($ in thousands) | Year Ended December 31, 2022 |
| Commercial/
Retail
Bank | | Mortgage
Banking
Division | | Holding
Company | | Total |
| Revenue by Operating Segments |
| Non-interest income | | | | | | | |
| Service charges on deposits | | | | | | | |
| Overdraft fees | $ | 4,023 | | | $ | 93 | | | $ | — | | | $ | 4,116 | |
| Other | 8,679 | | | — | | | — | | | 8,679 | |
| Interchange income | 12,702 | | | — | | | — | | | 12,702 | |
| Investment brokerage fees | 1,566 | | | — | | | — | | | 1,566 | |
| Net gains on OREO | 214 | | | — | | | — | | | 214 | |
| Net losses on sales of securities (1) | (82) | | | — | | | — | | | (82) | |
| Gain on acquisition (1) | 281 | | | — | | | — | | | 281 | |
| Loss on premises and equipment | (116) | | | — | | | — | | | (116) | |
| Other | 2,724 | | | 4,210 | | | 2,667 | | | 9,601 | |
| Total non-interest income | $ | 29,991 | | | $ | 4,303 | | | $ | 2,667 | | | $ | 36,961 | |
| | | | | | | | | | | | | | | | | | | | | | | |
| ($ in thousands) | Year Ended December 31, 2021 |
| Commercial/
Retail
Bank | | Mortgage
Banking
Division | | Holding
Company | | Total |
| Revenue by Operating Segments |
| Non-interest income | | | | | | | |
| Service charges on deposits | | | | | | | |
| Overdraft fees | $ | 3,122 | | | $ | — | | | $ | — | | | $ | 3,122 | |
| Other | 4,140 | | | 2 | | | — | | | 4,142 | |
| Interchange income | 11,562 | | | — | | | — | | | 11,562 | |
| Investment brokerage fees | 1,349 | | | — | | | — | | | 1,349 | |
| Net (losses) on OREO | (300) | | | — | | | — | | | (300) | |
| Net gains on sales of securities (1) | 143 | | | — | | | — | | | 143 | |
| Gain on acquisition (1) | 1,300 | | | — | | | — | | | 1,300 | |
| Loss on premises and equipment | (264) | | | — | | | — | | | (264) | |
| Other | 7,487 | | | 8,821 | | | 111 | | | 16,419 | |
| Total non-interest income | $ | 28,539 | | | $ | 8,823 | | | $ | 111 | | | $ | 37,473 | |
111
(1)Not within scope of ASC 606.
| | | | | | | | | | | | |
| | Year Ended December 31, 2019 |
Revenue by Operating Segments | | Commercial/ | | Mortgage | | | | | | |
| | Retail | | Banking | | Holding | | | |
| | Bank | | Division | | Company | | Total |
($ in thousands) | | | | | | | | | | | | |
Non-interest income | | | | | | | | | | | | |
Service charges on deposits | | | | | | | | | | | | |
Overdraft fees | | $ | 4,277 | | $ | 1 | | $ | — | | $ | 4,278 |
Other | | | 3,558 | | | 2 | | | — | | | 3,560 |
Interchange income | | | 8,024 | | | — | | | — | | | 8,024 |
Investment brokerage fees | | | 83 | | | — | | | — | | | 83 |
Net gains (losses) on OREO | | | (144) | | | — | | | — | | | (144) |
Net gains (losses) on sales of | | | — | | | — | | | | | | |
securities (a) | | | 122 | | | — | | | — | | | 122 |
Other | | | 3,977 | | | 5,985 | | | 1,062 | | | 11,024 |
Total non-interest income | | $ | 19,897 | | $ | 5,988 | | $ | 1,062 | | $ | 26,947 |
| (a) | Not within scope of ASC 606 |
NOTE T - PARENT COMPANY FINANCIAL INFORMATION
The balance sheets, statements of income and cash flows for The First Bancshares, Inc. (parent company only) follows:
Condensed Balance Sheets
| | | | | | |
| | December 31, |
($ in thousands) | | 2021 | | 2020 |
Assets: | | | | | | |
Cash and cash equivalents | | $ | 34,731 | | $ | 67,231 |
Investment in subsidiary bank | | | 776,215 | | | 720,159 |
Investments in statutory trusts | | | 496 | | | 496 |
Bank owned life insurance | | | 3,818 | | | 4,202 |
Other | | | 6,187 | | | 2,659 |
| | $ | 821,447 | | $ | 794,747 |
Liabilities and Stockholders’ Equity: | | | | | | |
Subordinated debentures | | $ | 144,726 | | $ | 144,592 |
Borrowed funds | | | 0 | | | 4,647 |
Other | | | 549 | | | 693 |
Stockholders’ equity | | | 676,172 | | | 644,815 |
| | $ | 821,447 | | $ | 794,747 |
| | | | | | | | | | | |
| December 31, |
| ($ in thousands) | 2023 | | 2022 |
| Assets: | | | |
| Cash and cash equivalents | $ | 13,485 | | | $ | 9,843 | |
| Investment in subsidiary bank | 1,056,369 | | | 778,885 | |
| Investments in statutory trusts | 806 | | | 496 | |
| Bank owned life insurance | 348 | | | 333 | |
| Other | 3,275 | | | 3,962 | |
| $ | 1,074,283 | | | $ | 793,519 | |
| Liabilities and Stockholders’ Equity: | | | |
| Subordinated debentures | $ | 123,386 | | | $ | 145,027 | |
| Other | 1,863 | | | 1,830 | |
| Stockholders’ equity | 949,034 | | | 646,663 | |
| $ | 1,074,283 | | | $ | 793,519 | |
Condensed Statements of Income
| | | | | | | | | | | | | | | | | |
| Years Ended December 31, |
| ($ in thousands) | 2023 | | 2022 | | 2021 |
| Income: | | | | | |
| Interest and dividends | $ | 36 | | | $ | 17 | | | $ | 10 | |
| Dividend income | 65,000 | | | 16,000 | | | — | |
| Other | 6,983 | | | 2,667 | | | 111 | |
| 72,019 | | | 18,684 | | | 121 | |
| Expenses: | | | | | |
| Interest on borrowed funds | 7,970 | | | 7,492 | | | 7,375 | |
| Legal and professional | 1,136 | | | 593 | | | 941 | |
| Other | 6,266 | | | 7,498 | | | 4,828 | |
| 15,372 | | | 15,583 | | | 13,144 | |
| Income (loss) before income taxes and equity in undistributed income of subsidiary | 56,647 | | | 3,101 | | | (13,023) | |
| Income tax benefit | 2,005 | | | 3,263 | | | 3,295 | |
| Income (loss) before equity in undistributed income of subsidiary | 58,652 | | | 6,364 | | | (9,728) | |
| Equity in undistributed income of subsidiary | 16,805 | | | 56,555 | | | 73,895 | |
| | | | | |
| Net income | $ | 75,457 | | | $ | 62,919 | | | $ | 64,167 | |
| | | | | | | | | |
| | Years Ended December 31, |
($ in thousands) | | 2021 | | 2020 | | 2019 |
Income: | | | | | | | | | |
Interest and dividends | | $ | 10 | | $ | 20 | | $ | 26 |
Dividend income | | | 0 | | | 18,526 | | | 50,390 |
Other | | | 111 | | | 892 | | | 1,062 |
| | | 121 | | | 19,438 | | | 51,478 |
Expenses: | | | | | | | | | |
Interest on borrowed funds | | | 7,375 | | | 5,593 | | | 4,918 |
Legal and professional | | | 941 | | | 1,014 | | | 3,401 |
Other | | | 4,828 | | | 4,361 | | | 2,418 |
| | | 13,144 | | | 10,968 | | | 10,737 |
(Loss) income before income taxes and equity in undistributed income of subsidiary | | | (13,023) | | | 8,470 | | | 40,741 |
Income tax benefit | | | 3,295 | | | 2,545 | | | 2,291 |
(Loss) income before equity in undistributed income of Subsidiary | | | (9,728) | | | 11,015 | | | 43,032 |
Equity in undistributed income of subsidiary | | | 73,895 | | | 41,490 | | | 713 |
| | | | | | | | | |
Net income | | $ | 64,167 | | $ | 52,505 | | $ | 43,745 |
Condensed Statements of Cash Flows
| | | | | | | | | |
| | Years Ended December 31, |
($ in thousands) | | 2021 | | 2020 | | 2019 |
Cash flows from operating activities: | | | | | | | | | |
Net income | | $ | 64,167 | | $ | 52,505 | | $ | 43,745 |
Adjustments to reconcile net income to net cash used in operating activities: | | | | | | | | | |
Equity in undistributed income of Subsidiary | | | (73,895) | | | (41,490) | | | (713) |
Restricted stock expense | | | 3,100 | | | 2,352 | | | 1,661 |
Other, net | | | (3,343) | | | 329 | | | 1,185 |
Net cash (used in) provided by operating activities | | | (9,970) | | | 13,696 | | | 45,878 |
| | | | | | | | | |
Cash flows from investing activities: | | | | | | | | | |
Net outlays for acquisitions | | | 0 | | | 1,726 | | | (32,363) |
Net cash ( used in) provided by investing activities | | | 0 | | | 1,726 | | | (32,363) |
| | | | | | | | | |
Cash flows from financing activities: | | | | | | | | | |
Dividends paid on common stock | | | (11,991) | | | (8,589) | | | (5,190) |
Repurchase of restricted stock for payment of taxes | | | (721) | | | (494) | | | (63) |
Common stock repurchased | | | (5,171) | | | (8,067) | | | (5,229) |
Repayment of borrowed funds | | | (4,647) | | | (707) | | | (173) |
Issuance of subordinated debt | | | 0 | | | 63,725 | | | 0 |
Net cash (used in) provided by financing Activities | | | (22,530) | | | 45,868 | | | (10,655) |
| | | | | | | | | |
Net (decrease) increase in cash and cash equivalents | | | (32,500) | | | 61,290 | | | 2,860 |
Cash and cash equivalents at beginning of year | | | 67,231 | | | 5,941 | | | 3,081 |
| | | | | | | | | |
Cash and cash equivalents at end of year | | $ | 34,731 | | $ | 67,231 | | $ | 5,941 |
113
| | | | | | | | | | | | | | | | | |
| Years Ended December 31, |
| ($ in thousands) | 2023 | | 2022 | | 2021 |
| Cash flows from operating activities: | | | | | |
| Net income | $ | 75,457 | | | $ | 62,919 | | | $ | 64,167 | |
| Adjustments to reconcile net income to net cash used in operating activities: | | | | | |
| Equity in undistributed income of Subsidiary | (16,805) | | | (56,555) | | | (73,895) | |
| Restricted stock expense | 2,302 | | | 2,425 | | | 3,100 | |
| Other, net | 9,263 | | | 6,255 | | | (3,343) | |
| Net cash provided by (used in) operating activities | 70,217 | | | 15,044 | | | (9,970) | |
| | | | | |
| Cash flows from investing activities: | | | | | |
| Investment in bank | — | | | (1,300) | | | — | |
| Other, net | — | | | 290 | | | — | |
| Net cash (used in) investing activities | — | | | (1,010) | | | — | |
| | | | | |
| Cash flows from financing activities: | | | | | |
| Dividends paid on common stock | (27,550) | | | (16,275) | | | (11,991) | |
| Repurchase of restricted stock for payment of taxes | (361) | | | (683) | | | (721) | |
| Common stock repurchased | — | | | (22,180) | | | (5,171) | |
| Repayment of borrowed funds | — | | | — | | | (4,647) | |
| Called/repayment of subordinated debt | (31,000) | | | — | | | — | |
| Other, net | (7,664) | | | 216 | | | — | |
| Net cash (used in) financing activities | (66,575) | | | (38,922) | | | (22,530) | |
| | | | | |
| Net increase (decrease) in cash and cash equivalents | 3,642 | | | (24,888) | | | (32,500) | |
| Cash and cash equivalents at beginning of year | 9,843 | | | 34,731 | | | 67,231 | |
| | | | | |
| Cash and cash equivalents at end of year | $ | 13,485 | | | $ | 9,843 | | | $ | 34,731 | |
NOTE U - OPERATING SEGMENTS
The Company is considered to have three principal business segments in
2021, 2020,2023, 2022, and
2019,2021, the Commercial/Retail Bank, the Mortgage Banking Division, and the Holding Company.
| | | | | | | | | | | | |
| | Year Ended December 31, 2021 |
| | Commercial/ | | Mortgage | | | | | | |
| | Retail | | Banking | | Holding | | | |
($ in thousands) | | Bank | | Division | | Company | | Total |
Interest income | | $ | 176,153 | | $ | 582 | | $ | 10 | | $ | 176,745 |
Interest expense | | | 12,166 | | | 140 | | | 7,375 | | | 19,681 |
Net interest income (loss) | | | 163,987 | | | 442 | | | (7,365) | | | 157,064 |
Provision (credit) for credit losses | | | (1,104) | | | 0 | | | 0 | | | (1,104) |
Net interest income (loss) after provision for loan losses | | | 165,091 | | | 442 | | | (7,365) | | | 158,168 |
Non-interest income | | | 28,539 | | | 8,823 | | | 111 | | | 37,473 |
Non-interest expense | | | 103,430 | | | 5,361 | | | 5,768 | | | 114,559 |
Income (loss) before income taxes | | | 90,200 | | | 3,904 | | | (13,022) | | | 81,082 |
Income tax (benefit) expense | | | 19,222 | | | 988 | | | (3,295) | | | 16,915 |
Net income (loss) | | $ | 70,978 | | $ | 2,916 | | $ | (9,727) | | $ | 64,167 |
| | | | | | | | | | | | |
Total Assets | | $ | 6,015,664 | | $ | 16,519 | | $ | 45,231 | | $ | 6,077,414 |
Net Loans | | | 2,929,995 | | | 6,494 | | | 0 | | | 2,936,489 |
| | | | | | | | | | | | |
| | Year Ended December 31, 2020 |
| | Commercial/ | | Mortgage | | | | | | |
| | Retail | | Banking | | Holding | | | |
($ in thousands) | | Bank | | Division | | Company | | Total |
Interest income | | $ | 178,462 | | $ | 866 | | $ | 20 | | $ | 179,348 |
Interest expense | | | 20,801 | | | 270 | | | 5,593 | | | 26,664 |
Net interest income (loss) | | | 157,661 | | | 596 | | | (5,573) | | | 152,684 |
Provision (credit) for loan losses | | | 25,076 | | | 75 | | | 0 | | | 25,151 |
Net interest income (loss) after provision for loan losses | | | 132,585 | | | 521 | | | (5,573) | | | 127,533 |
Non-interest income | | | 30,538 | | | 10,446 | | | 892 | | | 41,876 |
Non-interest expense | | | 95,370 | | | 5,596 | | | 5,375 | | | 106,341 |
Income (loss) before income taxes | | | 67,753 | | | 5,371 | | | (10,056) | | | 63,068 |
Income tax (benefit) expense | | | 11,749 | | | 1,359 | | | (2,545) | | | 10,563 |
Net income (loss) | | $ | 56,004 | | $ | 4,012 | | $ | (7,511) | | $ | 52,505 |
| | | | | | | | | | | | |
Total Assets | | $ | 5,044,647 | | $ | 33,525 | | $ | 74,588 | | $ | 5,152,760 |
Net Loans | | | 3,099,675 | | | 9,615 | | | 0 | | | 3,109,290 |
| | | | | | | | | | | | |
| | Year Ended December 31, 2019 |
| | Commercial/ | | Mortgage | | | | | | |
| | Retail | | Banking | | Holding | | | |
($ in thousands) | | Bank | | Division | | Company | | Total |
Interest income | | $ | 147,500 | | $ | 1,003 | | $ | 26 | | $ | 148,529 |
Interest expense | | | 21,388 | | | 417 | | | 4,918 | | | 26,723 |
Net interest income (loss) | | | 126,112 | | | 586 | | | (4,892) | | | 121,806 |
Provision (credit) for loan losses | | | 3,781 | | | (43) | | | 0 | | | 3,738 |
Net interest income (loss) after provision for loan losses | | | 122,331 | | | 629 | | | (4,892) | | | 118,068 |
Non-interest income | | | 19,897 | | | 5,988 | | | 1,062 | | | 26,947 |
Non-interest expense | | | 78,440 | | | 4,310 | | | 5,819 | | | 88,569 |
Income (loss) before income taxes | | | 63,914 | | | 2,181 | | | (9,649) | | | 56,446 |
Income tax (benefit) expense | | | 14,595 | | | 490 | | | (2,384) | | | 12,701 |
Net income (loss) | | $ | 49,319 | | $ | 1,691 | | $ | (7,265) | | $ | 43,745 |
| | | | | | | | | | | | |
Total Assets | | $ | 3,902,703 | | $ | 26,231 | | $ | 12,929 | | $ | 3,941,863 |
Net Loans | | | 2,584,385 | | | 12,875 | | | 0 | | | 2,597,260 |
114
| | | | | | | | | | | | | | | | | | | | | | | |
| ($ in thousands) | Year Ended December 31, 2023 |
| Commercial/
Retail
Bank | | Mortgage
Banking
Division | | Holding
Company | | Total |
| Interest income | $ | 340,566 | | | $ | 331 | | | $ | 36 | | | $ | 340,933 | |
| Interest expense | 83,497 | | | 141 | | | 7,970 | | | 91,608 | |
| Net interest income (loss) | 257,069 | | | 190 | | | (7,934) | | | 249,325 | |
| Provision (credit) for credit losses | 14,500 | | | — | | | — | | | 14,500 | |
| Net interest income (loss) after provision for loan losses | 242,569 | | | 190 | | | (7,934) | | | 234,825 | |
| Non-interest income | 36,856 | | | 2,866 | | | 6,983 | | | 46,705 | |
| Non-interest expense | 172,133 | | | 5,191 | | | 7,402 | | | 184,726 | |
| Income (loss) before income taxes | 107,292 | | | (2,135) | | | (8,353) | | | 96,804 | |
| Income tax (benefit) expense | 23,892 | | | (540) | | | (2,005) | | | 21,347 | |
| Net income (loss) | $ | 83,400 | | | $ | (1,595) | | | $ | (6,348) | | | $ | 75,457 | |
| | | | | | | |
| Total Assets | $ | 7,971,373 | | | $ | 10,058 | | | $ | 17,914 | | | $ | 7,999,345 | |
| Net Loans | 5,114,434 | | | 4,490 | | | — | | | 5,118,924 | |
| | | | | | | | | | | | | | | | | | | | | | | |
| ($ in thousands) | Year Ended December 31, 2022 |
| Commercial/
Retail
Bank | | Mortgage
Banking
Division | | Holding
Company | | Total |
| Interest income | $ | 199,937 | | | $ | 439 | | | $ | 17 | | | $ | 200,393 | |
| Interest expense | 14,979 | | | 106 | | | 7,492 | | | 22,577 | |
| Net interest income (loss) | 184,958 | | | 333 | | | (7,475) | | | 177,816 | |
| Provision (credit) for loan losses | 5,605 | | | — | | | — | | | 5,605 | |
| Net interest income (loss) after provision for loan losses | 179,353 | | | 333 | | | (7,475) | | | 172,211 | |
| Non-interest income | 29,991 | | | 4,303 | | | 2,667 | | | 36,961 | |
| Non-interest expense | 116,899 | | | 5,493 | | | 8,091 | | | 130,483 | |
| Income (loss) before income taxes | 92,445 | | | (857) | | | (12,899) | | | 78,689 | |
| Income tax (benefit) expense | 19,250 | | | (217) | | | (3,263) | | | 15,770 | |
| Net income (loss) | $ | 73,195 | | | $ | (640) | | | $ | (9,636) | | | $ | 62,919 | |
| | | | | | | |
| Total Assets | $ | 6,428,889 | | | $ | 18,194 | | | $ | 14,634 | | | $ | 6,461,717 | |
| Net Loans | 3,734,659 | | | 5,024 | | | — | | | 3,739,683 | |
| | | | | | | | | | | | | | | | | | | | | | | |
| ($ in thousands) | Year Ended December 31, 2021 |
| Commercial/
Retail
Bank | | Mortgage
Banking
Division | | Holding
Company | | Total |
| Interest income | $ | 176,153 | | | $ | 582 | | | $ | 10 | | | $ | 176,745 | |
| Interest expense | 12,166 | | | 140 | | | 7,375 | | | 19,681 | |
| Net interest income (loss) | 163,987 | | | 442 | | | (7,365) | | | 157,064 | |
| Provision (credit) for loan losses | (1,104) | | | — | | | — | | | (1,104) | |
| Net interest income (loss) after provision for loan losses | 165,091 | | | 442 | | | (7,365) | | | 158,168 | |
| Non-interest income | 28,539 | | | 8,823 | | | 111 | | | 37,473 | |
| Non-interest expense | 103,430 | | | 5,361 | | | 5,768 | | | 114,559 | |
| Income (loss) before income taxes | 90,200 | | | 3,904 | | | (13,022) | | | 81,082 | |
| Income tax (benefit) expense | 19,222 | | | 988 | | | (3,295) | | | 16,915 | |
| Net income (loss) | $ | 70,978 | | | $ | 2,916 | | | $ | (9,727) | | | $ | 64,167 | |
| | | | | | | |
| Total Assets | $ | 6,015,664 | | | $ | 16,519 | | | $ | 45,231 | | | $ | 6,077,414 | |
| Net Loans | 2,929,995 | | | 6,494 | | | — | | | 2,936,489 | |
NOTE V - SUMMARY OF QUARTERLY RESULTS OF OPERATIONS AND PER SHARE AMOUNTS (UNAUDITED)
| | | | | | | | | | | | |
($ in thousands, except per share amounts) | | March 31 | | June 30 | | Sept. 30 | | Dec. 31 |
2021 | | | | | | | | | | | | |
Total interest income | | $ | 45,187 | | $ | 43,238 | | $ | 44,435 | | $ | 43,885 |
Total interest expense | | | 5,958 | | | 5,188 | | | 4,407 | | | 4,128 |
Net interest income | | $ | 39,229 | | $ | 38,050 | | $ | 40,028 | | $ | 39,757 |
Provision for credit losses | | | 0 | | | 0 | | | 0 | | | (1,104) |
Net interest income after provision for credit losses | | | 39,229 | | | 38,050 | | | 40,028 | | | 40,861 |
Total non-interest income | | | 9,472 | | | 8,822 | | | 9,586 | | | 9,593 |
Total non-interest expense | | | 27,264 | | | 27,452 | | | 29,053 | | | 30,790 |
Income tax expense | | | 4,793 | | | 3,820 | | | 4,429 | | | 3,873 |
Net income available to common stockholders | | $ | 16,644 | | $ | 15,600 | | $ | 16,132 | | $ | 15,791 |
Per common share: | | | | | | | | | | | | |
Net income, basic | | $ | 0.79 | | $ | 0.74 | | $ | 0.77 | | $ | 0.75 |
Net income, diluted | | | 0.79 | | | 0.74 | | | 0.76 | | | 0.75 |
Cash dividends declared | | | 0.13 | | | 0.14 | | | 0.15 | | | 0.16 |
| | | | | | | | | | | | |
2020 | | | | | | | | | | | | |
Total interest income | | $ | 41,598 | | $ | 45,799 | | $ | 46,338 | | $ | 45,613 |
Total interest expense | | | 7,533 | | | 6,619 | | | 6,365 | | | 6,147 |
Net interest income | | $ | 34,065 | | $ | 39,180 | | $ | 39,973 | | $ | 39,466 |
Provision for loan losses | | | 7,102 | | | 7,606 | | | 6,921 | | | 3,522 |
Net interest income after provision for loan losses | | | 26,963 | | | 31,574 | | | 33,052 | | | 35,944 |
Total non-interest income | | | 6,474 | | | 15,680 | | | 8,794 | | | 10,928 |
Total non-interest expense | | | 23,439 | | | 28,070 | | | 26,936 | | | 27,896 |
Income tax expense | | | 1,687 | | | 2,241 | | | 2,993 | | | 3,642 |
Net income available to common stockholders | | $ | 8,311 | | $ | 16,943 | | $ | 11,917 | | $ | 15,334 |
Per common share: | | | | | | | | | | | | |
Net income, basic | | $ | 0.44 | | $ | 0.79 | | $ | 0.56 | | $ | 0.72 |
Net income, diluted | | | 0.44 | | | 0.79 | | | 0.55 | | | 0.72 |
Cash dividends declared | | | 0.10 | | | 0.10 | | | 0.10 | | | 0.12 |
| | | | | | | | | | | | |
2019 | | | | | | | | | | | | |
Total interest income | | $ | 33,273 | | $ | 37,571 | | $ | 37,241 | | $ | 40,444 |
Total interest expense | | | 6,142 | | | 6,799 | | | 6,782 | | | 7,000 |
Net interest income | | $ | 27,131 | | $ | 30,772 | | $ | 30,459 | | $ | 33,444 |
Provision for loan losses | | | 1,123 | | | 791 | | | 974 | | | 850 |
Net interest income after provision for loan losses | | | 26,008 | | | 29,981 | | | 29,485 | | | 32,594 |
Total non-interest income | | | 5,554 | | | 6,716 | | | 7,103 | | | 7,574 |
Total non-interest expense | | | 21,893 | | | 20,891 | | | 20,825 | | | 24,960 |
Income tax expense | | | 2,034 | | | 3,823 | | | 3,491 | | | 3,353 |
Net income available to common stockholders | | $ | 7,635 | | $ | 11,983 | | $ | 12,272 | | $ | 11,855 |
Per common share: | | | | | | | | | | | | |
Net income, basic | | $ | 0.48 | | $ | 0.69 | | $ | 0.71 | | $ | 0.64 |
Net income, diluted | | | 0.63 | | | 0.70 | | | 0.74 | | | 0.72 |
Cash dividends declared | | | 0.07 | | | 0.08 | | | 0.08 | | | 0.08 |
115
| | | | | | | | | | | | | | | | | | | | | | | | | | |
| ($ in thousands, except per share amounts) | | March 31 | | June 30 | | Sept. 30 | | Dec. 31 |
| 2023 | | | | | | | | |
| Total interest income | | $ | 80,338 | | | $ | 86,194 | | | $ | 85,681 | | | $ | 88,720 | |
| Total interest expense | | 15,412 | | | 20,164 | | | 24,977 | | | 31,055 | |
| Net interest income | | $ | 64,926 | | | $ | 66,030 | | | $ | 60,704 | | | $ | 57,665 | |
| Provision for credit losses | | 11,000 | | | 1,250 | | | 1,000 | | | 1,250 | |
| Net interest income after provision for credit losses | | 53,926 | | | 64,780 | | | 59,704 | | | 56,415 | |
| Total non-interest income | | 12,612 | | | 12,423 | | | 19,324 | | | 2,346 | |
| Total non-interest expense | | 45,670 | | | 46,899 | | | 47,724 | | | 44,433 | |
| Income tax expense | | 4,597 | | | 6,525 | | | 6,944 | | | 3,281 | |
| Net income available to common stockholders | | $ | 16,271 | | | $ | 23,779 | | | $ | 24,360 | | | $ | 11,047 | |
| Per common share: | | | | | | | | |
| Net income, basic | | $ | 0.52 | | | $ | 0.76 | | | $ | 0.78 | | | $ | 0.35 | |
| Net income, diluted | | 0.52 | | | 0.75 | | | 0.77 | | | 0.35 | |
| Cash dividends declared | | 0.21 | | | 0.22 | | | 0.23 | | | 0.24 | |
| | | | | | | | |
| 2022 | | | | | | | | |
| Total interest income | | $ | 42,741 | | | $ | 45,847 | | | $ | 53,874 | | | $ | 57,931 | |
| Total interest expense | | 4,102 | | | 3,746 | | | 4,726 | | | 10,003 | |
| Net interest income | | $ | 38,639 | | | $ | 42,101 | | | $ | 49,148 | | | $ | 47,928 | |
| Provision for credit losses | | — | | | 600 | | | 4,300 | | | 705 | |
| Net interest income after provision for credit losses | | 38,639 | | | 41,501 | | | 44,848 | | | 47,223 | |
| Total non-interest income | | 11,157 | | | 8,664 | | | 9,022 | | | 8,118 | |
| Total non-interest expense | | 28,590 | | | 30,955 | | | 35,903 | | | 35,035 | |
| Income tax expense | | 4,377 | | | 3,457 | | | 3,924 | | | 4,012 | |
| Net income available to common stockholders | | $ | 16,829 | | | $ | 15,753 | | | $ | 14,043 | | | $ | 16,294 | |
| Per common share: | | | | | | | | |
| Net income, basic | | $ | 0.81 | | | $ | 0.77 | | | $ | 0.61 | | | $ | 0.68 | |
| Net income, diluted | | 0.81 | | | 0.76 | | | 0.61 | | | 0.67 | |
| Cash dividends declared | | 0.17 | | | 0.18 | | | 0.19 | | | 0.20 | |
| | | | | | | | |
| 2021 | | | | | | | | |
| Total interest income | | $ | 45,187 | | | $ | 43,238 | | | $ | 44,435 | | | $ | 43,885 | |
| Total interest expense | | 5,958 | | | 5,188 | | | 4,407 | | | 4,128 | |
| Net interest income | | $ | 39,229 | | | $ | 38,050 | | | $ | 40,028 | | | $ | 39,757 | |
| Provision for loan losses | | — | | | — | | | — | | | (1,104) | |
| Net interest income after provision for loan losses | | 39,229 | | | 38,050 | | | 40,028 | | | 40,861 | |
| Total non-interest income | | 9,472 | | | 8,822 | | | 9,586 | | | 9,593 | |
| Total non-interest expense | | 27,264 | | | 27,452 | | | 29,053 | | | 30,790 | |
| Income tax expense | | 4,793 | | | 3,820 | | | 4,429 | | | 3,873 | |
| Net income available to common stockholders | | $ | 16,644 | | | $ | 15,600 | | | $ | 16,132 | | | $ | 15,791 | |
| Per common share: | | | | | | | | |
| Net income, basic | | $ | 0.79 | | | $ | 0.74 | | | $ | 0.77 | | | $ | 0.75 | |
| Net income, diluted | | 0.79 | | | 0.74 | | | 0.76 | | | 0.75 | |
| Cash dividends declared | | 0.13 | | | 0.14 | | | 0.15 | | | 0.16 | |
NOTE W - COVID-19 UPDATE
DERIVATIVE FINANCIAL INSTRUMENTS
The COVID-19 pandemic continuesCompany enters into interest rate swap agreements primarily to have significant effects on global markets, supply chains, businessesfacilitate the risk management strategies of certain commercial customers. The interest rate swap agreements entered into by the Company are all entered into under what is referred to as a back-to-back interest rate swap, as such, the net positions are offsetting assets and communities. COVID-19 could potentially impactliabilities, as well as income and expenses and risk participation. All derivative instruments are recorded in the Company’s futureconsolidated statement of financial condition at their respective fair values, as components of other assets and resultsother liabilities.
Under a back-to-back interest rate swap program, the Company enters into an interest rate swap with the customer and another offsetting swap with a counterparty. The result is two mirrored interest rate swaps, absent a credit event, which will offset in the financial statements. These swaps are not designated as hedging instruments and are recorded at fair value in other assets and other liabilities. The change in fair value is recognized in the income statement as other income and fees.
Risk participation agreements are derivative financial instruments and are recorded at fair value. These derivatives are not designated as hedges and therefore, changes in fair value are recorded directly through earnings at each reporting period. Under a risk participation-out agreement, a derivative asset, the Company participates out a portion of operationsthe credit risk associated with the interest rate swap position executed with the commercial borrower, for a fee paid to the participating bank. Under a risk participation-in agreement, a derivative liability, the Company assumes, or participates in, a portion of the credit risk associated with the interest rate swap position with the commercial borrower, for a fee received from the other bank. The Company has two risk participation-in swaps and one risk participation-out swap at December 31, 2023.
The following table provides outstanding interest rate swaps at December 31, 2023 and December 31, 2022.
| | | | | | | | | | | |
| ($ in thousands) | December 31, 2023 | | December 31, 2022 |
| Notional amount | $ | 493,290 | | | $ | 328,756 | |
| Weighted average pay rate | 5.2 | % | | 4.6 | % |
| Weighted average receive rate | 5.2 | % | | 4.3 | % |
| Weighted average maturity in years | 5.39 | | 6.11 |
The following table provides the fair value of interest rate swap contracts at December 31, 2023 and December 31, 2022 included in other assets and other liabilities.
| | | | | | | | | | | | | | | | | | | | | | | |
| ($ in thousands) | December 31, 2023 | | December 31, 2022 |
| Derivative Assets | | Derivative Liabilities | | Derivative Assets | | Derivative Liabilities |
| Interest rate swap contracts | $ | 12,170 | | | 12,175 | | | 12,825 | | | 12,825 | |
The Company also enters into a collateral agreement with the counterparty requiring the Company to post cash or
cash equivalent collateral to mitigate the credit risk in the transaction. At December 31, 2023 and December 31, 2022, the Company had $500 thousand of collateral posted with its counterparties, which is included in the consolidated statement of financial condition as cash and cash equivalents as "restricted cash". The Company also receives a swap spread to compensate it for the credit exposure it takes on the customer-facing portion of the transaction and this upfront cash payment from the counterparty is recorded in other income, net of any transaction execution expenses, in the consolidated statement of operations. For the year ended December 31, 2023 and December 31, 2022, net swap spread income included in other income was $1.3 million and $193 thousand, respectively.
Entering into derivative contracts potentially exposes the Company to the risk of counterparties' failure to fulfill their legal obligations, including, but not limited to,
additional credit loss reserves, additional collateral and/potential amounts due or
modificationspayable under each derivative contract. Notional principal amounts are often used to
debt obligations, liquidity, limited dividend payouts or potential shortages of personnel.
The pandemic is having an adverse impact on certain industriesexpress the Company serves, including hotels, restaurants, retail, and direct energy. As of December 31, 2021, the Company’s aggregate outstanding exposure in these segments was $478.9 million, and total loan modifications resulting from COVID-19 were approximately $710.7 million. While it is still not yet possible to know the full effect that the pandemic will have on the economy, or to what extent this crisis will impact the Company, all available current industry statistics and internal monitoring of loan repayment ability and payment forgiveness across the portfolio has been analyzed in an attempt to understand the correlation with asset quality and degree of possible deterioration.
Despite recent improvements in certain economic indicators, significant constraints to commerce remain in place, and significant uncertainty remains over the timing and scope of additional government stimulus packages. The duration and extent of the downturn and speed of the related recovery on our business, customers, and the economy as a whole remains uncertain. It is unknown how long the adverse conditions associated with the COVID-19 pandemic will last and what the complete financial effect will be to the Company. It is reasonably possible that estimates made in the financial statements could be materially and adversely impacted in the near term as a resultvolume of these conditions, includingtransactions, but the determinationamounts potentially subject to credit risk are much smaller. The Company assesses the credit risk of the allowance forits dealer counterparties by regularly monitoring publicly available credit losses,rating information, evaluating other market indicators, and periodically reviewing detailed financials.
The Company records the fair value of
financial instruments, impairment of goodwillits interest rate swap contracts separately within other assets and other
intangible assetsliabilities as current accounting rules do not permit the netting of customer and
income taxes.counterparty fair value amounts in the consolidated statement of financial condition.
ITEM 9. CHANGES IN AND DISAGREEMENTS WITH ACCOUNTANTS ON ACCOUNTING AND FINANCIAL DISCLOSURE
ITEM 9A. CONTROLS AND PROCEDURES
Evaluation of Disclosure Controls and Procedures
The Company’s management, under the supervision of and with the participation of the Chief Executive Officer and Chief Financial Officer, conducted an evaluation of the Company’s disclosure controls and procedures as defined in Rules 13a-15(e) and 15d-15(e) under the Securities Exchange Act of 1934, as amended (the “Exchange Act”) as of December 31,
2021.2023. Disclosure controls and procedures are controls and procedures designed to ensure that information required to be disclosed in reports filed or submitted under the Exchange Act is recorded, processed, summarized and reported within the time periods specified in the rules and forms of the SEC, and that such information is accumulated and communicated to our management, including our Chief Executive Officer and our Chief Financial Officer, as appropriate, to allow timely decisions regarding required disclosure. Based on that evaluation, the Chief Executive Officer and the Chief Financial Officer have concluded that the Company’s disclosure controls and procedures were effective as of the end of the period covered by this report. No changes were made to the Company’s internal controls over financial reporting (as defined in Rule 13a-15(f) under the Securities Exchange Act of 1934) during the last fiscal quarter that materially affected or are reasonably likely to materially affect, the Company’s internal control over financial reporting.
The First Bancshares, Inc.
Management’s Report on Internal Control over Financial Reporting
Management of the Company is responsible for establishing and maintaining effective internal control over financial reporting (as defined in Rule 13a-15(f) or 15d-15(f) under the Exchange Act. Internal control over financial reporting is a process designed under the supervision of the Chief Executive Officer and the Chief Financial Officer to provide reasonable assurance regarding the reliability of financial reporting and the preparation of financial statements for external purposes in accordance with U.S. generally accepted accounting principles.
Because of its inherent limitations, internal control over financial reporting may not prevent or detect misstatements. All internal control systems, no matter how well designed, have inherent limitations. Therefore, even those systems determined to be effective can provide only reasonable assurance with respect to financial statement preparation and presentation. Projections of any evaluation of effectiveness to future periods are subject to the risk that controls may become inadequate because of changes in conditions, or that the degree of compliance with the policies or procedures may deteriorate.
The Company’s management, under the supervision of and with the participation of the Chief Executive Officer and Chief Financial Officer, conducted an evaluation of the effectiveness of internal control over financial reporting as of December 31,
20212023 based on the framework issued by the Committee of Sponsoring Organizations of the Treadway Commission (COSO) in Internal Control-Integrated Framework (2013). Based on that assessment, our management believes that, as of December 31,
2021,2023, the Company’s internal control over financial reporting was effective based on those criteria.
As permitted by SEC guidance, management has excluded the operations of the
Cadence BranchesHSBI acquisition from the scope of management’s report on internal control over financial reporting.
The Cadence Branches wereHSBI was acquired during the year ended December 31,
2021.2023. For the year ended December 31,
2021, the Cadence Branches2023, HSBI represented approximately
6.8%19.6% of total consolidated assets.
Due to the timing of the data conversion and the integration of operations of the branches onto the Company’s existing operations, historical reporting of the acquired branches is impracticable, and therefore, disclosure of the amounts of revenue and expenses attributable to the acquired branches since the acquisition date are not available.This Annual Report on Form 10-K contains an audit report of
BKDFORVIS, LLP, our independent registered public accounting firm, regarding internal control over financial reporting for the fiscal year ended December 31,
20212023 pursuant to the rules of the SEC. Their report appears in the section captioned “Report of Independent Registered Public Accounting Firm” included in Part II. Item 8 – Financial Statements and Supplementary Data of this report.
Effective January 1, 2021, the Company adopted ASC 326. The Company designed new controls and modified existing controls as part of the adoption. Management revised previous internal controls used under legacy GAAP and incorporated new internal controls related to the methodology of the new allowance for credit losses. There were no other changes in the Company's internal control over financial reporting that occurred during the period covered by this report that have materially affected, or are reasonably likely to materially affect, the Company's internal control over financial reporting.
Report of Independent Registered Public Accounting Firm
To the Stockholders, Board of Directors and Audit Committee
The First Bancshares, Inc.
Opinion on the Internal Control over Financial Reporting
We have audited The First Bancshares, Inc.’s (the “Company”) internal control over financial reporting as of December 31, 2021,2023, based on criteria established in Internal Control – Integrated Framework: (2013)issued by the Committee of Sponsoring Organizations of the Treadway Commission (COSO).In our opinion, the Company maintained, in all material respects, effective internal control over financial reporting as of December 31, 2021,2023, based on criteria established in
Internal Control – Integrated Framework: (2013)issued by the Committee of Sponsoring Organizations of the Treadway Commission (COSO).As described in management’s report on internal control over financial reporting, the scope of management’s assessment of internal control over financial reporting as of December 31, 2021, has excluded the operations of the Cadence Branches acquired on December 3, 2021. We have also excluded the Cadence Branches from the scope of our audit of internal control over financial reporting, which represented approximately 7% of consolidated total assets and less than 1% of revenues and for the year ended December 31, 2021.
COSO.
We also have audited, in accordance with the standards of the Public Company Accounting Oversight Board (United States) (“PCAOB”), the consolidated financial statements of the Company as of December 31, 2023 and 2022 and for each of the years in the three-year period ended December 31, 2023, and our report dated March 11, 2022,February 29, 2024 expressed an unqualified opinion thereon.on those consolidated financial statements.
The Company’s management is responsible for maintaining effective internal control over financial reporting and for its assessment of the effectiveness of internal control over financial reporting, included in the accompanying [title of management’s report]Management’s Report on Internal Control Over Financial Reporting. Our responsibility is to express an opinion on the Company’s internal control over financial reporting based on our audit.
We are a public accounting firm registered with the PCAOB and are required to be independent with respect to the Company in accordance with the U.S. federal securities laws and the applicable rules and regulations of the Securities and Exchange Commission and the PCAOB.
We conducted our audit in accordance with the standards of the PCAOB. Those standards require that we plan and perform the audit to obtain reasonable assurance about whether effective internal control over financial reporting was maintained in all material respects.
Our audit included obtaining an understanding of internal control over financial reporting, assessing the risk that a material weakness exists, and testing and evaluating the design and operating effectiveness of internal control based on the assessed risk. Our audit also included performing such other procedures as we considered necessary in the circumstances. We believe that our audit provides a reasonable basis for our opinion.
As described in Management’s Annual Report on Internal Control over Financial Reporting, the scope of management’s assessment of internal control over financial reporting as of December 31, 2023, has excluded Heritage Southeast Bancorporation, Inc. which was acquired during the year ended December 31, 2023. We have also excluded Heritage Southeast Bancorporation, Inc. from the scope of our audit of internal control over financial reporting. Heritage Southeast Bancorporation, Inc. represented approximately 22.4 percent of consolidated revenues for the year ended December 31, 2023, and approximately 19.6 percent of consolidated total assets as of December 31, 2023.
Definitions and Limitations of Internal Control over Financial Reporting
A company’s internal control over financial reporting is a process designed to provide reasonable assurance regarding the reliability of financial reporting and the preparation of reliable financial statements
for external purposes in accordance with
accounting principles generally accepted
in the United States of America. Because management’s assessment and our audit also were conducted to meet the reporting requirements of Section 112 of the Federal Deposit Insurance Corporation Improvement Act (FDICIA), our audit of the Company’s internal control over financial reporting included controls over the preparation of financial statements in accordance with accounting
principles generally accepted in the United States of America and with the Federal Financial Institutions Examination Council Instructions for Consolidated Reports of Condition and Income.principles. A company’s internal control over financial reporting includes those policies and procedures that (1) pertain to the maintenance of records that, in reasonable detail, accurately and fairly reflect the transactions and dispositions of the assets of the company; (2) provide reasonable assurance that transactions are recorded as necessary to permit preparation of financial statements in accordance with
accounting principles generally accepted
in the United States of America,accounting principles, and that receipts and expenditures of the company are being made only in accordance with authorizations of management and directors of the company; and (3) provide reasonable assurance regarding prevention or timely detection
and correction of unauthorized acquisition, use, or disposition of the company’s assets that could have a material effect on the financial statements.
Because of its inherent limitations, internal control over financial reporting may not prevent or detect misstatements. Also, projections of any evaluation of effectiveness to future periods are subject to the risk that controls may become inadequate because of changes in conditions or that the degree of compliance with the policies or procedures may deteriorate.
Jackson, Mississippi
March 11, 2022
February 29, 2024
ITEM 9B. OTHER INFORMATION
Not applicable.
SERP Amendments
On November 16, 2023, the Board approved amendments to the Supplemental Executive Retirement Plan Agreement dated January 1, 2020 with M. Ray (Hoppy) Cole, Jr. (the "Cole 2020 SERP Amendment") and the Supplemental Executive Retirement Plan Agreement dated January 1, 2021 with Donna T. (Dee Dee) Lowery (the "2021 Lowery SERP Amendment"). The 2020 Cole SERP Amendment and the 2021 Lowery SERP Amendment were executed on February 26, 2024. The material terms of the agreements are summarized below.
Mr. Cole's 2020 SERP, as amended. Mr. Cole's 2020 SERP, as amended, provides for a lifetime benefit equal to 50% of "compensation" (as defined in the 2020 SERP), less any amounts payable under his 2014 SERP, which will be payable in equal monthly installments upon Mr. Cole's separation from service following attainment of age 65 while in the employment of the Bank (except in the case of Mr. Cole's death, in which case the death benefit will be paid in a lump sum).
•If Mr. Cole separates from service prior to age 65, other than by reason of his death or a termination for cause other than in connection with a change in control, then he will receive an annual benefit equal to the "early termination benefit" (as defined in the 2020 SERP).
•If Mr. Cole separates from service following a change in control prior to age 65, then he will receive 100% of the "change in control benefit" (as defined in the 2020 SERP).
•In the event of Mr. Cole's death, his beneficiary will receive a lump sum payment equal to 50% of Mr. Cole's compensation multiplied by a factor of 17, less any amounts already paid under the 2021 or 2014 SERPs, plus an additional lump sum death benefit payment determined by Mr. Cole's age at death.
Ms. Lowery's 2021 SERP. Ms. Lowery's 2021 SERP, as amended, provides for a lifetime benefit equal to 50% of "compensation" (as defined in the 2021 SERP), less any amounts payable under her 2014 SERP, which will be payable in equal monthly installments upon Ms. Lowery's separation from service following attainment of age 65 while in the employment of the Bank (except in the case of Ms. Lowery's death, in which case the death will be paid in a lump sum).
•If Ms. Lowery separates from service prior to age 65, other than by reason of her death or a termination for cause other than in connection with a change in control, then she will receive an annual benefit equal to the "early termination benefit" (as defined in the 2021 SERP).
•If Ms. Lowery separates from service following a change in control prior to age 65, then she will receive 100% of the "change in control benefit" (as defined in the 2021 SERP).
•In the event of Ms. Lowery's death, her beneficiary will receive a lump sum payment equal to 50% of Ms. Lowery's compensation multiplied by a factor of 21, less any amounts already paid under the 2021 or 2014 SERPs.
On November 16, 2023, the Board also approved amendments to the Supplemental Executive Retirement Plan Agreement dated May 15, 2014 with Mr. Cole (the "2014 Cole SERP Amendment") and the Supplemental Executive Retirement Plan Agreement dated May 19, 2014 with Ms. Lowery (the "2014 Lowery SERP Amendment"), to remove the death benefit provided under each agreement. The 2014 Cole SERP Amendment and the 2014 Lowery SERP Amendment were executed on February 26, 2024.
The summary provided herein is qualified in its entirety by reference to the full text of the 2020 Cole SERP Amendment, the 2021 Lowery SERP Amendment, the 2014 Cole SERP Amendment and the 2014 Lowery SERP Amendment, which are attached hereto as Exhibits 10.13, 10.17, 10.11 and 10.15, respectively.
Rule 10b5-1 Trading Arrangements
During the quarter ended December 31, 2023, none of the Company's directors or executive officers adopted or terminated any contract, instruction or written plan for the purchase or sale of Company securities that was intended to satisfy the affirmative defense conditions of Rule 10b5-(c) or any "non-Rule 10b5-1 trading arrangement.
ITEM 10. DIRECTORS, EXECUTIVE OFFICERS, AND CORPORATE GOVERNANCE
Information required by this item is set forth in our definitive proxy materials regarding our Annual Meeting of Shareholders to be held May
19, 2022,23, 2024, which proxy materials will be filed with the SEC on or about April
6, 2022.
ITEM 11. EXECUTIVE COMPENSATION
Information required by this item is set forth in our definitive proxy materials regarding our Annual Meeting of Shareholders to be held May
19, 2022,23, 2024, which proxy materials will be filed with the SEC on or about April
6, 2022.
10, 2024.
ITEM 12. SECURITY OWNERSHIP OF CERTAIN BENEFICIAL OWNERS AND MANAGEMENT AND RELATED STOCKHOLDER MATTERS
Information required by this item is set forth in our definitive proxy materials regarding our Annual Meeting of Shareholders to be held May
19, 2022,23, 2024, which proxy materials will be filed with the SEC on or about April
6, 2022.
10, 2024.
ITEM 13. CERTAIN RELATIONSHIPS AND RELATED TRANSACTIONS AND DIRECTOR INDEPENDENCE
Information required by this item is set forth in our definitive proxy materials regarding our Annual Meeting of Shareholders to be held May
19, 2022,23, 2024, which proxy materials will be filed with the SEC on or about April
6, 2022.
10, 2024.
ITEM 14. PRINCIPAL ACCOUNTANT FEES AND SERVICES
Information required by this item is set forth in our definitive proxy materials regarding our Annual Meeting of Shareholders to be held May
19, 2022,23, 2024, which proxy materials will be filed with the SEC on or about April
6, 2021.
10, 2024.
ITEM 15. EXHIBITS AND FINANCIAL STATEMENT SCHEDULES
(a) | The following documents are filed as part of this Report: |
| 1. | The following documents are filed as part of this Report: 1.The following consolidated financial statements of The First Bancshares, Inc. and subsidiaries are incorporated as part of this Report under Item 8 – Financial Statements and Supplementary Data. 2.Consolidated balance sheets – December 31, 2021 and 2020Financial Statement Schedules: Consolidated statements of income – Years ended December 31, 2021, 2020, and 2019
Consolidated statements of other comprehensive income – Years ended December 31, 2021, 2020, and 2019
Consolidated statements of changes in stockholders’ equity– Years ended December 31, 2021, 2020 and 2019
Consolidated statements of cash flows –Years ended December 31, 2021, 2020, and 2019
Notes to consolidated financial statements – December 31, 2021, 2020, and 2019
| 2. | Consolidated Financial Statement Schedules: |
All schedules have been omitted, as the required information is either inapplicable or included in the Notes to Consolidated Financial Statements. | 3. | Exhibits required to be filed by Item 601 of Regulation S-K, by Item 15(b) are listed below. |
3.Exhibits required to be filed by Item 601 of Regulation S-K, by Item 15(b) are listed below. (b)Exhibits: All other financial statements and schedules are omitted as the required information is inapplicable or the required information is presented in the consolidated financial statements or related notes. | (a) | | | | | | Exhibit No. | 3. Exhibits: |
10.14
|
| Form of Supplemental Executive Retirement Agreements for Executives of The First, A National Banking Association (incorporated herein by reference to Exhibit 10.11 to The First Bancshares Annual Report on Form 10-K filed on March 16, 2017).+ | |
|
| 10.15
10.19 |
| Form of Stock Incentive Agreement for Restricted Stock Award pursuant to The First Bancshares, Inc. 2007 Stock Incentive Plan (incorporated herein by reference to Exhibit 10.12 to the Company’s Annual Report on Form 10-K filed on March 16, 2018).+ | |
|
| 10.16
10.20 |
| Amendment to Stock Incentive Agreement for Outstanding Shares of Restricted Stock, dated as of October 15, 2019 (incorporated by reference to Exhibit 10.2 of the Company’s Current Report on Form 8-K filed on October 21, 2019). + | |
|
| 10.17
10.21 |
| Subordinated Note Purchase Agreement between The First Bancshares, Inc. and the several purchasers of the Subordinated Notes, dated September 25, 2020 (incorporated by reference to Exhibit 10.1 of the Company’s Current Report on Form 8-K filed on September 25, 2020). | |
|
________________________ *Filed herewith. + Denotes management contract or compensatory plan or arrangement.
ITEM 16. FORM 10-K SUMMARY None.
In accordance with Section 13 or 15(d) of the Exchange Act, the registrant caused this report to be signed on its behalf by the undersigned, thereunto duly authorized. | | | | | | | | |
| | THE FIRST BANCSHARES, INC. | | | | Date: March 11, 2022 February 29, 2024 | By: | /s/ M. Ray (Hoppy) Cole, Jr. | | | M. Ray (Hoppy) Cole, Jr. | | | Chief Executive Officer and President (Principal Executive Officer) , Chairman of the Board | | | | Date: March 11, 2022 February 29, 2024 | By: | /s/ Dee Dee Lowery | | | Dee Dee Lowery | | | Executive VP and Chief Financial Officer | | |
(Principal Financial and Principal Accounting Officer)
|
KNOW ALL PERSONS BY THESE PRESENTS, that each person whose signature appears below hereby constitutes and appoints M. Ray (Hoppy) Cole, Jr. and Donna T. (Dee Dee) Lowery, with full power to act without the other, his or her true and lawful attorney-in-fact and agent, with full and several powers of substitution and resubsititution, for him or her and in his or her name, place and stead, in any and all capacities, to sign any and all amendments to this Annual Report on Form 10-K, and to file the same, with all exhibits thereto and other documents in connection therewith, with the Securities and Exchange Commission, and hereby grants to such attorneys-in-fact and agents, and each of them, full power and authority to do and perform each and every act and thing requisite and necessary to be done, as fully as to all intents and purposes as each of the undersigned might or could do in person, hereby ratifying and confirming all that said attorneys-in-fact and agents, or any of them, or their or his substitute or substitutes, may lawfully do or cause to be done by virtue hereof. In accordance with the Exchange Act, this report has been signed below by the following persons on behalf of the registrant and in the capacities and on the dates indicated. | | | | | | | | | | | | | | |
| SIGNATURES | | CAPACITIES | | CAPACITIES
DATE | DATE
| | | | |
| /s/ E. Ricky Gibson | | Director | | Director and Chairman of the Board
February 29, 2024 | March 11, 2022
| /s/ Rodney D. Bennett
| | Director
|
| March 11, 2022
| /s/ David W. Bomboy | | Director | | Director
February 29, 2024 | March 11, 2022
| /s/ Jonathan A. Levy | | Director | | February 29, 2024 | | /s/ Charles R. Lightsey | | Director | | Director
February 29, 2024 | March 11, 2022
| /s/ Fred McMurry | | Director | | Director
February 29, 2024 | March 11, 2022
| /s/ Thomas E. Mitchell | | Director | | Director
February 29, 2024 | March 11, 2022
| /s/ Renee Moore | | Director | | Director
February 29, 2024
| March 11, 2022
| /s/ Ted E. Parker | | Lead Director | | Director
February 29, 2024 | March 11, 2022
| /s/ J. Douglas Seidenburg | | Director | | Director
February 29, 2024 | March 11, 2022
| /s/ Andrew D. Stetelman | | Director | | Director
February 29, 2024 | March 11, 2022
| /s/ Valencia M. Williamson | | Director | | February 29, 2024 | | /s/ M. Ray (Hoppy) Cole, Jr. | | CEO, President, Director, and Director Chairman of | | February 29, 2024 | March 11, 2022
| | |
|
| (Principalthe Board (Principal Executive Officer)
| |
|
/s/ Donna T. (Dee Dee) Lowery | | Executive VP & Chief Financial Officer | | February 29, 2024 | | | | (Principal Financial and Accounting Officer) | |
| March 11, 2022
|


