
☒ANNUAL REPORT PURSUANT TO SECTION 13 OR 15(d) OF THE SECURITIES EXCHANGE ACT OF 1934
2023
☐o TRANSITION REPORT PURSUANT TO SECTION 13 OR 15(d) OF THE SECURITIES EXCHANGE ACT OF 1934
| Delaware | 87-3764229 | ||||||||
State or other jurisdiction of incorporation or organization | (I.R.S. Employer Identification No.) | ||||||||
605 5th Ave. S. Suite 400 Seattle, WA 98104 (Address of principal executive offices)
Registrant’s telephone number, including area code | ||
| Title of each class | Trading Symbol(s) | Name of each exchange on which registered | ||||||||||||
Class A Common Stock | GETY | New York Stock Exchange | ||||||||||||
| Large accelerated filer |
| Accelerated filer |
| ||||||||||
Non-accelerated filer |
| Smaller reporting company |
| ||||||||||
| Emerging growth company |
| |||||||||||
Indicate by check mark whether the registrant has filed a report on and attestation to its management’s assessment of the effectiveness of its internal control over financial reporting under Section 404(b) of the Sarbanes-Oxley Act (15 U.S.C. 7262(b)) by the registered public accounting firm that prepared or issued its audit report. ☐o
If securities are registered pursuant to Section 12(b) of the Act, indicate by check mark whether the financial statements of the registrant included in the filing reflect the correction of an error to previously issued financial statements. ☐o
Indicate by check mark whether any of those error corrections are restatements that required a recovery analysis of incentive-based compensation received by any of the registrant’s executive officers during the relevant recovery period pursuant to §240.10D-1(b). ☐o
| ||||||||||
|
| |||||||||
| ||||||||||
| ||||||||||
| ||||||||||
| ||||||||||
| ||||||||||
| ||||||||||
| ||||||||||
| ||||||||||
| ||||||||||
| ||||||||||
| ||||||||||
| ||||||||||
| ||||||||||
| ||||||||||
| ||||||||||
| ||||||||||
| ||||||||||
| ||||||||||
| ||||||||||
| ||||||||||
| ||||||||||
| ||||||||||
| ||||||||||
•our inability to continue to license third-party content and offer relevant quality and diversity of content to satisfy customer needs; •our ability to attract new customers and retain and motivate an increase in spending by its existing customers; •the user experience of our customers on its websites; •the extent to which we are able to maintain and expand the breadth and quality of our content library through content licensed from third-party suppliers, content acquisitions and imagery captured by our staff of in-house photographers; •the mix of and basis upon which we license our content, including the price-points at, and the license models and purchase options through, which we license our content; •the risk that we operate in a highly competitive market; •the risk that we are unable to successfully execute our business strategy or effectively manage costs; •our inability to effectively manage our growth; •our inability to maintain an effective system of internal controls and financial reporting; •the risk that we may lose the right to use “Getty Images” trademarks; •our inability to evaluate our future prospects and challenges due to evolving markets and customers’ industries; •The increase use of AI applications such as generative AI technologies that may result in harm to our brand, reputation, business, or intellectual property; •the legal, social and ethical issues relating to the use of new and evolving technologies, such as Artificial Intelligence (“AI”), including statements regarding AI and innovation momentum; •the risk that our operations in and continued expansion into international markets bring additional business, political, regulatory, operational, financial and economic risks; •our inability to adequately adapt our technology systems to ingest and deliver sufficient new content; • |
| the risk of technological interruptions or cybersecurity breaches, incidents, and vulnerabilities; |
1
2
These and other factors that could cause actual results to differ from those implied by the forward-looking statements in this Annual Report are more fully described under the heading “Item 1A. Risk Factors”. The risks described under the heading “Item 1A. Risk Factors” in this Annual Report are not exhaustive. New risk factors emerge from time to time and it is not possible to predict all such risk factors, nor can we assess the impact of all such risk factors on our business or the extent to which any factor or combination of factors may cause actual results to differ materially from those contained in any forward-looking statements. All forward-looking statements attributable to us or persons acting on our behalf are expressly qualified in their entirety by the foregoing cautionary statements. We undertake no obligations to update or revise publicly any forward-looking statements, whether as a result of new information, future events or otherwise, except as required by law.
further details.
4
includes artificial intelligence and machine learning driven search functionality and image editing andgenerative AI-services designed to be commercially safe, natural language processing, AI based integrated APIs, to become a global, trusted industry leader in the visual content space.

 |  |  | |||||||||
Content | Premium creative and editorial content including stills, music and video. | Budget-conscious creative stills and video | Free and very low cost creative stills
| ||||||||
Key Customer | Enterprise customers | SMBs | SMBs, prosumers and professional/semiprofessional content creators | ||||||||
Go-to-Market Approach | Premium account management with supporting services (e.g., research, rights and clearance, digital asset management)
| Primarily e-commerce and online service | Self-service | ||||||||
Rights | Extensive protections and rights customized to customer needs
| Industry standard | Limited/no indemnification | ||||||||
Business Models | A la carte, subscription and custom assignments | A la carte and subscription | Subscription, Ad-supported and API monetization | ||||||||
5
| •iStock is our value offering of creative stills and videos, which provides a significant volume of exclusive image and video content to small to medium sized businesses, furnishing them with a powerful and cost-efficient means to produce and maintain their visual narrative. Customers can purchase on an a la carte basis and through a range of monthly and annual subscription options. Customers can also use Generative AI by iStock to create, ready to use AI generated content that is designed to be commercially safe and is trained exclusively with Getty Images creative content. •Unsplash is a widely accessed, creative stills offering serving the fast-growing and broad-based creator economy ranging from prosumers and semi-professional creators to full time creative professionals working at corporates and agencies. Customers can purchase an unlimited subscription, which includes premium content that has specific legal protections, or download from the millions of free images. •In addition to our websites, customers and partners can access and integrate our content, metadata, and search capabilities into their workflows via our APIs, such as through Canva, and through a range of mobile apps and plugins, including Adobe Creative Cloud, WordPress, and other publishing and workflow platforms. • |
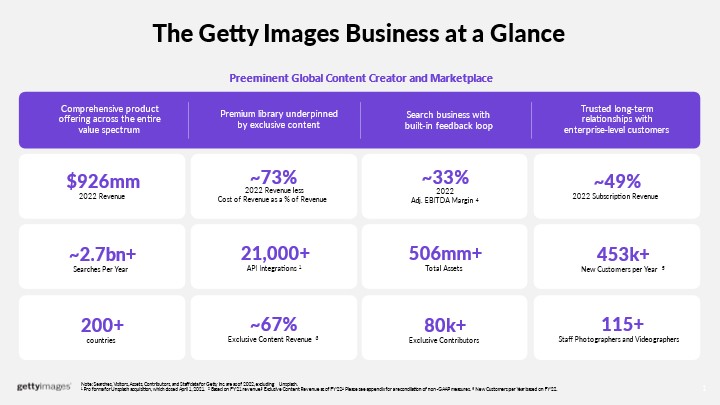
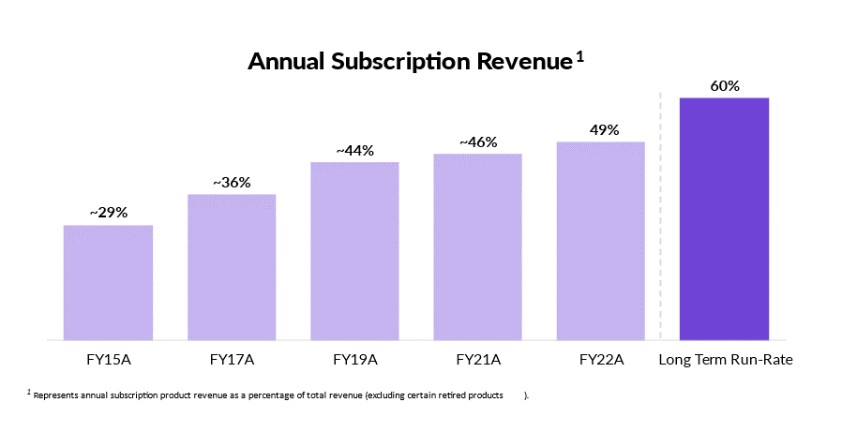
In recent years, we have shifted revenues towardstoward subscription products including annual subscription products to drive revenue growth and durability. As of December 31, 2022,2023, annual subscriptions represented approximatelymore than half of total revenue. We offer a complete range of subscription products on our Getty Images, iStock and Unsplash websites. Our Premium Access offeringsubscription offers all of Getty Images’ Creative and Editorial image and video content and music in one subscription. We similarly continue to see more subscription adoption in e-commerce through our iStock subscription, which includes images video and music, and Unsplash+, which is an unlimited imageimage-only subscription. In all cases, our annual subscriptions provide greater customer and revenue visibility and upside through expanded consumption and ongoing cross-sell and upsell opportunities via our dedicated Customer Success team.
6
With a consistently differentiated, authentic and high-quality content offering at our core, we have a rich history of embracing disruption and innovation with regard to how that content is packaged, accessed, licensed, created and distributed to an evolving universe of customers.
•A growing base of more than 557,000 contributors, of which over 80,000 are exclusive to Getty Images. •Over 70 exclusive editorial content partners, such as AFP, Disney, Globo, ITN, Bloomberg, BBC Studios, CBS, The Boston Globe, Fairfax Media, NBC News Archives and Sky News, who rely upon Getty Images to manage and license their content and Formula One, NBA, NHL, MLB, NASCAR, FIFA and International Olympic Committee, who, in addition to distributing content from their events through Getty Images, grant us unique commercial rights with event and content access. •Nearly 400 dedicated staff content experts across creative and editorial who guide and contribute to the creation of over 10 million new visual assets per quarter and have been recognized with more than 1,400 major industry awards including the 2022 Pulitzer Prize for Breaking News Photography, World Press Photo, Picture of the Year International, Sony World Photography Awards, White House Photographer of the Year, The Lucie Awards, Visa d’Or, Ville de Perpignan Remi Ochlik, UK Picture Guild Awards, Press Photographer of the Year, Sports Photographer of the Year and Creative Review Photography Annual. •A unique comprehensive visual archival collection covering a broad range of geographies, time periods and content categories such as news, sport, celebrity, music and fashion. |
Collectively, these represent a growing library of over 520562 million total assets that delivers unmatched depth, breadth, and quality to meet the expanding needs of our growing customer base. For more information, see “—Our Content Contributors” below.
2023.
7
proprietary search algorithms to deliver the unique insights to our customers. We operate multiple websites which are available on a global basis, maintained in 23 different languages, localized for their respective markets, and which provide for e-commerce transactions in 24 local currencies.
Global Digital Visual Content Market
We believe the industry is poised for accelerating growth as a result of the following long-term trends:
8
Our Business Transformation
9
Continued emphasis on subscription offerings: We have achieved growth in our Average Annual Revenue per User (“ARPU”) and corresponding Lifetime Value as we increase our subscription revenue mix. Annual subscription revenues now comprise roughly half our core product revenues,total revenue, and we expect to further increase penetration over time through an emphasis on our e-commerce offerings and continued growth of our larger subscription offerings.

1

10
reflects the significant opportunity across the “long tail” creator economy. In addition to growing the existing advertising revenue streams, we are monetizing existing API integrations through licensing fees and have introduced Unsplash+, an unlimited subscription that launched October 2022, that includes premium content (with corresponding license protections) to Unsplash users.
Participate in the growing metaverse/NFT market: We believe our partnership with Candy Digital as the exclusive developer and marketplace for Getty Images Non-Fungible Tokens (“NFT”) and our expansive and proprietary visual archives and exclusive relationships with Image Partners such as the NBA, FIFA, Formula One and NASCAR present significant opportunities within the metaverse/NFT market as it continues to develop.
11
Archive
Getty Images maintains one of the largest and best privately-owned photographic archives in the world with over 135 million images cross geographies, time periods and verticals. Additionally, we exclusively represent and maintain unique archives such as Hulton, Bettman, Sygma and Gamma. These key collections often hold historical significance and are irreplaceable. We believe they are a key differentiator versus competitors.
12
By capturing powerful imagery, we strive to make an impact for today and for posterity. Our imagery moves hearts and minds across the globe, shifting perceptions and powering commerce and ideas at the same time.
•We are trustworthy, transparent and honest. •We always raise the bar. •We collectively bring solutions. •We care, are kind, courteous and respectful. •We are inclusive of different voices, perspectives and experiences. •We are one Getty Images with no silos. •We deliver on our commitments and commercial goals. •We put the customer at the heart of everything we do. •We reject biased behavior and discrimination. Employees |
Employees
As of December 31, 2022,2023, we had more than 1,700 employees, of which approximately 63% were located in the Americas region, approximately 30% in the EMEA region, and the remainder in the APAC region. Some of our employees in Brazil, Germany, France and Spain are subject to collective bargaining agreements that set minimum salaries, benefits, working conditions and/or termination requirements. We consider our employee relations to be satisfactory. See “Item 1A. Risk
13
engaging with employees in regular feedback loops, including live discussions and a bi-annual engagement survey, and that feedback then provides insights that fuel all of our employee programming from learning and development to our total rewards approaches and everything in between. Internationally, we customize our compensation and benefits to remain competitive and responsive to our employees’ needs, including global mental health and well-being programs.
•The Digital Millennium Copyright Act, which regulates digital material and created updated copyright laws to address the unique challenges of regulating the use of digital content. •The Directive on Copyright in the Digital Single Market, which regulates a marketplace for copyright in the European Union. •The Controlling the Assault of Non-Solicited Pornography and Marketing Act of 2003 and similar laws adopted by a number of states, which regulate the format, functionality and distribution of commercial solicitation e-mails, create criminal penalties for unmarked sexually-oriented material, and control other online marketing practices. •The Children’s Online Privacy Protection Act and the Prosecutorial Remedies and Other Tools to End Exploitation of Children Today Act of 2003, which regulate the collection or use of information, and restrict the distribution of certain materials, as related to certain protected age groups. In addition, the Protection of Children from Sexual Predators Act of 1998 provides for reporting and other obligations by online service providers in the area of child pornography. •The Federal Trade Commission Act and numerous state “mini-FTC” acts, which bar “deceptive” and “unfair” trade practices, including in the contexts of online advertising and representations made in privacy policies and other online representations. •The European Union General Data Protection Regulation and UK Data Protection Act, which regulate how we can collect and process the personal data of, primarily, European Union and UK residents. •The California Consumer Privacy Act (as amended by the California Privacy Rights Act, together the “CCPA”) which regulates how we can collect and process the personal data of California residents. •The Colorado Privacy Act (“CPA”), which regulates how we can collect and process the personal data of Colorado residents. •The Connecticut Data Privacy Act (“CTDPA”), which regulates how we can collect and process the personal data of Connecticut residents. •The Utah Consumer Privacy Act (“UCPA”), which regulates how we can collect and process the personal data of Utah residents. •The Virginia Consumer Data Protection Act (“VACDPA”), which regulates how we can collect and process the personal data of Virginia residents. •The Illinois Biometric Information Privacy Act (“BIPA”), which regulates how we can collect and process biometric identifiers of Illinois residents. •The Texas Capture or Use of Biometric Identifier Act (“CUBI”), which regulates how we can collect and process biometric identifiers of Texas residents. •The Washington Biometric Privacy Law (“H.B. 1493”), which regulates how we can collect and process biometric identifiers of Washington residents. |
In particular, we are subject to U.S. federal and state, and foreign laws and regulations regarding privacy and data protection as well as foreign, federal and state regulation. In certain instances, we may also have obligations under several U.S. state data breach or breach notification laws. Foreign data protection, privacy, content regulation, consumer protection, and other laws and regulations can be more restrictive than those in the United States and often have extraterritorial application, and the interpretation and application of these laws are continuously evolving and remain in flux. See “Item 1A. Risk Factors—We collect, store, process, transmit and use personal information, which subjects us to governmental regulation and other legal obligations related to privacy, information security and data protection in many jurisdictions. Any cybersecurity breaches or our actual or perceived failure to comply with such legal obligations by us, or by our third-party service providers or partners, could harm our business.”
14
as evolving regulatory views and legislation regarding taxation of e-commerce businesses such as the Organization for Economic Cooperation and Development’s Base
15
Operational Risks Related to Our Business
A
16
content strategies may not attract relevant content from a suitably diverse network of suppliers and our pricing strategies may discourage purchases. To the extent that we are unable to attract new customers, our costs to acquire and retain customers increase, or our existing customers do not continue to license content from us for these or any other reasons, our results of operations and financial condition could be materially and adversely affected.
17
staff from us and others to devote greater resources to research and development of products and technologies. Increased competition and pricing pressures may result in reduced sales, lower margins, losses or the failure of our product and services to maintain and grow their current market share, any of which could harm our business. If we are unable to compete successfully against competitors and adapt to emerging technologies, our financial condition, growth prospects and results of operations could be materially and adversely affected.
Additionally, if Although we continue to evaluate and manage our costs, the ability to effectively manage such costs is subject to risks and uncertainties, and we cannot be sure that these requirements divertactivities, or any other activities that we may undertake in the future, will achieve the desired cost management or efficiencies. Failure to effectively manage our management’s attention from other business concerns, theycosts, whether as a result of being a public company or otherwise, could have a material adverse effect onadversely affect our business,results of operations and financial condition and resultscurtail investment in growth opportunities
18
Failure to effectively manage our costs could adversely affect our results of operations and eliminate potential investment for growth.
We continue to evaluate and manage our costs. However, the ability to effectively manage our operating costs is subject to risks and uncertainties, and we cannot be sure that these activities, or any other activities that we may undertake in the future, will achieve the desired cost management or efficiencies. Failure to effectively manage our costs adversely affect our results of operations and financial condition and curtail investment in growth opportunities.
We may lose the right to use “Getty Images” trademarks in the event we experience a change of control or otherwise exceed the permitted usage of this trademark.
Planned expansion
Currently our operations focus on our marketplace for digital content. Further expansion of our operations and our marketplace into additional products and services,AI applications such as NFTs,generative AI machine learning (“ML”), AI modified or generated content and data products, involves numerous risks and challenges, including potential new competition, increased capital requirements and increased marketing spend to achieve customer awareness of these new products and services. Growth into additional content, product and service areastechnologies may
19
require changes result in harm to our existingbrand, reputation, business, modelor intellectual property, and cost structure and modifications tocould otherwise adversely affect our infrastructure and may expose us to new regulatory and legal risks, anyresults of which may require expertise in areas in which we have little or no experience. There is no guarantee that we will be able to successfully expand our products and services into these areas.
operations.
Social, ethical and legal issues relating to the use of new and evolving technologies, such as
Social, ethical and legal issues relating to the use of new and evolving technologies such as AI in our products and services may result in reputational harm and other liability and may cause us to incur additional costs to resolve such issues. As with many innovations, AI presents risks and challenges that could affect its adoption, and therefore our business. If we enable or offer solutions that draw controversy due to their perceived or actual impact on society, we may experience brand or reputational harm, competitive harm or legal liability. Potential governmental regulation related to AI ethics may also increase the burden and cost of research and development in this area or subject us to brand or reputational harm or legal liability. Changes in AI-related regulation could disproportionately impact and disadvantage us and require us to change our business practices, whichtechnology may negatively impact our financial results. Failureability to address AI ethics issues by us or othersattract, engage, and retain customers; protect and monetize our intellectual property; maintain and grow other revenue streams; and retain customers and grow trust in our industry could undermine public confidence in AI, which could slowbrand. The rapid advancement and adoption of generative AI technologies poses risks to our business operations, particularly in the licensing of creative images and videos. Generative AI presents a dual-threat scenario: the unauthorized use of our intellectual property to train AI models and the potential for these models to create competitive or substitutive content. Recent advances and continued rapid development in generative AI technology may alter the market for our products and services. Failure to address
could adversely affect our business, brand, financial condition or results of operations.
20
•effectively market our products and gain market acceptance;
The manner in which
Our customer base is diverse, but trends in their industries present risks to our business. In recent years, traditional outlets for media and advertising, such as newspapers, magazines, book publishing and television, have experienced consolidation and undergone other significant changes, and, in many cases, also experienced diminishing readership and viewership, as applicable, and ultimately periodic declines in revenues and profitability. Corporate in-house content users have experienced reduced budgets and shifts in use patterns that have changed the way they acquire and use our content, including an increase in reliance on in-house creative and marketing capabilities instead of outsourcing this work to agencies. We have also seen an increasing shift away from print media to digital and online media use. Content used online has historically been characterized by lower resolutions and lower price points but potentially significantly higher volumes than print-based applications. If we are unable to adapt our content offerings and distribution technology to address any current or future changes to customer industries, our future growth prospects and results of operation could be materially and adversely affected.
21
Action
Unless we increase customer and supplier awareness of certain of our new and emerging products and services, our revenue may not continue to grow.
In order to increase the number of our customers and suppliers for these new product lines, we may be required to expend greater resources on advertising, marketing, and other brand-building efforts to preserve and enhance customer and supplier awareness of our core brand, as well as accept lower margins to attract suppliers. If we are unable to increase market awareness of our new and emerging products and services or otherwise take advantage of evolving consumer trends and preferences, our growth prospects, results of operations and financial condition may be materially and adversely affected.
22
The impact of currency fluctuations could adversely and materially affect our business and results of operations.
23
We may not meet our growth objectives and strategies, which may impact our competitiveness and results of operations.
As part of our business, we seek to achieve profitable growth by attracting new customers and retaining existing customers through various customer experience, content, marketing and pricing strategies, incentivizing customers to seek our content. As we continue to invest in growth opportunities, including investments in new technologies and capabilities, we may experience unfavorable demand for our content or we may be unable to deploy these technology-based solutions successfully or profitably. Our inability to invest effectively in new growth opportunities could impact our competitiveness and render it difficult for us to meet our growth objectives and strategies, which could adversely impact our business, financial condition or results of operations.
Technological interruptions that impair access to our websites or the efficiency of our websites and technology systems could damage our reputation and brand and adversely affect our results of operations.
24
Additionally, some of the computer and communications hardware necessary to operate our corporate functions are located in metropolitan areas worldwide, which systems and operations could be damaged or interrupted by fire, flood, power loss, telecommunications failure, earthquake and similar events. We do not have redundancy for all of our systems, many of our critical applications reside in only one of our data centers or in the cloud, and our disaster recovery planning may not account for all eventualities. In addition, we may have inadequate insurance coverage to compensate for any related loss.
Occasionally, we migrate data among data centers and to third-party hosted environments. If a transition among data centers or to third-party service providers encounters unexpected interruptions, unforeseen complexity, or unplanned disruptions despite precautions undertaken during the process, this may impair our delivery of products and services to customers and result in increased costs and liabilities, which may harm our results of operations and our business.
It is also possible that hardware or software failures or errors in our systems (or those of our third-party service providers) could result in data loss or corruption, cause the information that we collect or maintain to be incomplete or contain inaccuracies that our customers regard as significant, or cause us to fail to meet customer expectations or comply with regulatory notification requirements. Furthermore, our ability to collect and report data may be delayed or interrupted by a number of factors, including access to the internet, the failure of our network or software systems, security breaches or significant variability in visitor traffic on customer websites.
If
25
Although cybersecurity and the continued development and enhancement of the processes, practices and controls that are designed to protect our systems, computers, software, data and networks from attack, damage or unauthorized access are a high priority for us, our efforts may not be enough to prevent a party from circumventing our security measures, or the security measures of our third-party service providers, and accessing and misusing the proprietary information of our employees, customers and contributors. Accounts created with weak or recycled passwords could allow cyber-attackers to gain access to confidential data.
Additionally, failure by customers, vendors or content providers to remove accounts of their own employees, or the granting of accounts by the customer, vendor or content provider in an uncontrolled manner, may allow for access by former or unauthorized representatives.
26
27
Our ability to meet expenses and debt service obligations will depend on our future performance, which could be affected by financial, business, economic and other factors. In addition, a breach of any of the covenants in our outstanding debt agreements or our inability to comply with the required financial ratios could result in a default under our debt instruments, including the Credit Facility. If an event of default occurs, our creditors could elect to declare all borrowings outstanding, together with accrued and unpaid interest, to be immediately due and payable and/or require us to apply all of our available cash to repay borrowings. If we are not able to pay our debt service obligations we may be required to refinance all or part of our debt, sell assets, borrow more money or raise additional equity capital.
partners due to economic volatility, rising interest rates, supply chain disruptions, inflation or other unfavorable changes could result in these companies scaling back operations, exiting businesses, merging with other businesses or filing for bankruptcy protection and potentially ceasing operations, all of which could adversely affect our business, financial condition and results of operations. unauthorized parties, which may include our competitors, are successful in copying and using aspects of our intellectual property or confidential information, including our search algorithms and our trade secrets, our business could be harmed. legislative or regulatory bodies may change current laws or regulations or enact new ones. We cannot guarantee that our technology is not infringing or violating any third-party intellectual property rights or rights related to the use of technology, or that it will not infringe or violate such rights in the future. these risks could be difficult to eliminate or manage and, if not addressed, could adversely affect our business, financial performance, and growth.Risks Related to the COVID-19 Pandemic and Global Economic ConditionsThe extent to which the COVID-19 pandemic will have a continued impact remains uncertain.The COVID-19 pandemic has evolved significantly and has impacted, and may continue to impact in the future, the U.S. and global economy. The duration and severity of COVID-19 is uncertain and difficult to predict, and the emergence of COVID-19 variants has resulted in setbacks to economic recovery. Subsequent surges in the outbreak could lead to one or more of the following conditions that could have a material adverse impact on our business operations and financial condition: decreased business spending by our customers and prospective customers, reduced demand for our products, lower renewal rates by our customers; increased customer losses/churn and turnover of talent; increased challenges in or cost of acquiring new customers and talent; reduction in the amount of content uploaded by our contributors and/or reduction in the number of contributors on our site because of reduced royalties earned by our contributors; inability of our contributors who create customized exclusive content (“Custom Content”) and editorial photographers to complete assignments because of travel and in-person event restrictions, including event organizer or league shut down or postponement of sports and entertainment events; increased competition; increased risk in collectability of accounts receivable; reduced productivity due to remote work arrangements; lost productivity due to illness and/or illness of family members; inability to hire key roles; adverse effects on our strategic partners’ businesses; impairment charges; extreme currency exchange-rate fluctuations; inability to recover costs from insurance carriers; business continuity concerns for us and our third-party vendors; inability of counterparties to perform under their agreements with us; increased risk of vulnerability to cybersecurity attacks or breaches resulting from a greater number of our employees working remotely for extended periods of time; and challenges with internet infrastructure due to high loads. Our inability to respond to and manage the potential impact of such events effectively could have a material adverse effect on our business, financial condition and results of operations.As we generally recognize revenue from our customers as content is downloaded, the impact to our reported revenue resulting from changes in our sales activity due to COVID-19 may not be fully apparent until future periods. Our efforts to help mitigate the negative impact of new outbreaks on our business may not be effective, and we may be affected by a protracted economic downturn. Even though the COVID-19 outbreak has subsided, we may continue to experience impacts to our business as a result of COVID-19’s global economic impact and any recession that has occurred or may occur in the future. Further, as the COVID-19 situation is continuously evolving, COVID-19 may also affect our operating and financial results in a manner that is not presently known to us or in a manner that we currently do not consider to present significant risks to our operations.The impact of worldwide economic, political and social conditions may adversely affect our business and results of operations.Global economic, political and social conditions can affect the business of our customers and the markets they serve, as well as disrupt the business of our vendors, third-party resellers and strategic partners. Numerous external forces beyond our control, including generally weak or uncertain economic conditions, supply chain disruptions, rising interest rates, inflation, negative or uncertain political climates, changes in government, global health epidemics (such as COVID-19), geopolitical conflicts and wars such as the Russia-Ukraine and Israel-Hamas wars, government shutdowns and/or the financial stability of the banking industry could adversely affect our financial condition. Particularly, our financial condition is affected by worldwide economic conditions and their impact on content generation and marketing and advertising spending. Expenditures by our customers generally tend to reflect overall economic conditions, and to the extent that the economy stagnates as a result of macroeconomic conditions, companies may reduce their spending with us. This could have a serious adverse impact on our business. To the extent that overall economic conditions reduce spending on digital content, our ability to retain current and obtain new customers could be hindered, which could reduce our revenue and negatively impact our business. In addition, if we are unable to successfully anticipate changing economic, political and social conditions, we may be unable to effectively plan for and respond to those changes and our business could be negatively affected.Further, economic, political and social macro developments in the United States, Europe, and Asia could negatively affect our ability to conduct business in those territories. Financial difficulties experienced by our customers, third-party resellers, vendors and strategic28Risks Related to PersonnelThe loss of key personnel, an inability to attract and retain additional personnel or difficulties in the integration of new members of our management team into our Company could affect our ability to successfully grow our business.Our future success depends in large part upon the continued service of the members of our executive management team and key employees. All members of our executive management team are subject to employment agreements. In addition, our28success also depends on our ability to attract and retain qualified technical, sales and marketing, customer support, financial and accounting, legal and other managerial personnel, as well as high quality photographers for our product line covering entertainment, sports and news (“Editorial”). The competition for skilled personnel in the industries in which we operate is intense. Our personnel generally may terminate their employment at any time for any reason. We may incur significant costs to attract and retain highly skilled personnel, and we may lose new employees to our competitors before we realize the benefit of our investment in recruiting them. As we move into new geographies, we will need to attract and recruit skilled personnel across functional areas. Some of our employees in Brazil, Germany, France and Spain are subject to collective bargaining agreements and employees in other jurisdictions may unionize. If we fail to attract new personnel or if we suffer increases in costs or business operations interruptions as a result of a labor dispute, or fail to retain and motivate our current personnel, we might not be able to operate our businesses effectively or efficiently, serve our customers properly or maintain the quality of our content and services.We may be exposed to risks related to our use of independent contractors.We rely on independent third parties to provide certain services for our Company. The state of the law regarding independent contractor status varies from jurisdiction to jurisdiction and is subject to change based on court decisions and regulation. For example, on April 30, 2018, the California Supreme Court adopted a new standard for determining whether a company “employs” or is the “employer” for purposes of the California Wage Orders in its decision in the Dynamex Operations West, Inc. v. Superior Court case. This standard was expanded and codified in California via Assembly Bill 5, which was signed into law in September 2019 and became effective as of January 1, 2020. The Dynamex decision and Assembly Bill 5 altered the analysis of whether an individual, who is classified by a hiring entity as an independent contractor in California, has been properly classified as an independent contractor. Assembly Bill 5 was amended to include exclusions for photographers, videographers and editors where specific requirements are met. In addition, independent workers have been the subject of widespread national discussion and it is possible that other jurisdictions may enact laws similar to Assembly Bill 5 or that otherwise impact our business and our relationships with independent third parties. As a result, there is significant uncertainty regarding the future of the worker classification regulatory landscape.From time to time, we may be involved in lawsuits and claims that assert that certain independent contractors should be classified as our employees. Adverse determinations regarding the status of any of our independent contractors could, among other things, entitle such individuals to the reimbursement of certain expenses and to the benefit of wage-and-hour laws, and could result in the Company being liable for income taxes, employment, social security, and withholding taxes and benefits for such individuals. Any such adverse determination could result in a material reduction of the number of subcontractors we can use for our business or significantly increase our costs to serve our customers, which could adversely affect our business, financial condition and results of operations.Risks Related to Our Intellectual Property and Confidential InformationOur business and prospects would suffer if we are unable to protect and enforce our intellectual property rights and confidential information.The success of our business depends on our ability to protect and enforce our patents, trade secrets, trademarks, copyrights and all of our other intellectual property rights and other confidential information, including our intellectual property rights underlying our owned content library, websites and search algorithms. Despite our efforts to protect our intellectual property rights, which may afford only limited legal protections, unauthorized parties have attempted, and may continue to, attempt to copy and use aspects of our intellectual property and other confidential information. Effective legal protection for our patents, trade secrets, trademarks, copyrights and other intellectual property assets may not be available or practical in every country in which we operate or intend to operate. Moreover, policing our intellectual property rights is difficult, costly and may not always be effective. We may commence legal proceedings to protect our IP rights, which may increase our operating expenses. We could be subject to countersuits as a result. To the extent any29We or one of our affiliates have registered “Getty Images,” “iStock,” “Unsplash” and other marks and logos as trademarks in the United States and other jurisdictions. Nevertheless, competitors may adopt trademarks similar to ours, or purchase keywords in internet search engine marketing programs that are confusingly similar to our trademarks, thereby impeding our ability to build brand identity and possibly leading to confusion among existing and potential new customers. In addition, there could be infringement claims by third parties regarding any of our trademarks or our use of other intellectual29property that could damage our reputation and brand, prove costly to defend irrespective of their validity, and, if such claims are ultimately validated, materially and adversely affect our financial condition and results of operations.We currently own the www.gettyimages.com, www.istock.com and www.unsplash.com internet domain names in addition to various other domain names. Domain names are generally regulated by internet regulatory bodies. If we lose the ability to use a domain name in a particular country, we would be forced either to incur significant additional expenses to market our products within that country or to elect not to sell products in that country. Either result could harm our business and results of operations. The regulation of domain names in the United States and in foreign countries is subject to change, including the establishment of additional top-level domains and domain name registrars or the modification of the requirements for holding domain names. As a result, we may not be able to acquire or maintain the domain names that utilize our brand names in the United States or other countries in which we conduct business or in which we may conduct business in the future.In order to protect our trade secrets and other confidential information, we rely in part on confidentiality agreements with our employees, consultants and third parties with whom we have relationships. These agreements may not prevent disclosure of trade secrets and other confidential information and may not provide an adequate remedy in the event of misappropriation or any unauthorized disclosure or independent discovery of our trade secrets and confidential information. Costly and time-consuming litigation could be necessary to enforce or determine the scope of our trade secret rights and related confidentiality and nondisclosure provisions. Failure to adequately protect our trade secrets and other confidential information could adversely affect our competitive business position.Litigation or proceedings before the U.S. Patent and Trademark Office, U.S. Copyright Office or other governmental authorities and administrative bodies in the United States and foreign countries may be necessary in the future to enforce and protect our patent rights, copyrights, trademarks, trade secrets, domain names and other intellectual property rights and to determine the validity, enforcement and scope of the intellectual property rights of others. Furthermore, the monitoring and protection of our intellectual property rights may become more difficult, costly and time consuming as we continue to expand internationally, particularly in those markets, such as China and certain other developing countries in Asia, in which legal protection of intellectual property rights is less robust than in the United States and in Europe. Our efforts to enforce or protect our intellectual property rights may be ineffective and could result in substantial costs and diversion of resources and management time, each of which could materially and adversely affect our results of operations.We rely on intellectual property laws and contractual restrictions to protect the content in our library. Intellectual property laws and protections may change and such changes may impact our protections, adversely impacting our business and financial position. Certain countries do not prioritize the enforcement of intellectual property laws, and litigation in those countries may be costly and ineffective. Consequently, these intellectual property laws afford us only limited protection. Unauthorized parties have attempted, and may continue to attempt, to improperly use our content. We cannot guarantee that we will be able to prevent the unauthorized use of our content or that we will be successful in stopping such use once it is detected.Advancements in technology, including advancements in generative AI technology, have made unauthorized copying and wide dissemination of unlicensed content easier. At the same time, detection of unauthorized use of our intellectual property and enforcement of our intellectual property rights have become more challenging, in part due to the increasing volume and sophistication of attempts at unauthorized use of our intellectual property, including from generative AI developers or technologies. As our business and the presence and impact of bad actors become more global in scope, we may not be able to protect our proprietary rights in a cost-effective manner in other jurisdictions. In addition, intellectual property protection may not be available in every country in which our products and services are distributed or made available through the internet.If we are unable to protect and enforce our intellectual property rights, we may not succeed in realizing the full value of our assets, our business and profitability may suffer as a result of misuse of our intellectual property. In addition, we are currently engaged in litigation in the United States and England to enforce our intellectual property rights, and we may in the future be required to do so in the United States or elsewhere, and such litigation may be costly and time consuming. See “Item 3—Legal Proceedings” for additional information.30Our products and services may infringe on intellectual property rights of third parties, which could require us to incur substantial costs and distract our management.Media, internet and technology companies are frequently the target of litigation based on allegations of infringement, misappropriation or other violations of intellectual property rights or rights related to their use of technology. Some internet, technology and media companies, including some of our competitors, own large numbers of patents, copyrights, trademarks, trade secrets and other intellectual property rights, which they may use as a basis to assert claims against us. We have developed proprietary technology and a robust infrastructure to power our products and services, and this technology is critical to our business. Third parties may in the future assert that the technology we have developed or the content that we display and distribute infringes, misappropriates or otherwise violates their intellectual property rights, and as we face increasing competition, the possibility of intellectual property rights claims against us grows. Such litigation may involve patent holding companies or other adverse patent owners who have no relevant product revenue, and therefore our own issued and pending patents may provide little or no deterrence to these patent owners in bringing intellectual property rights claims against us. Existing laws and regulations are evolving and subject to different interpretations, and various federal and state30We license a significant majority of the content in our library from third parties, and we cannot guarantee that each supplier holds the rights or releases he or she claims or that such rights and releases are adequate. From time to time we receive notices from third parties claiming that certain content that we license infringes their intellectual property rights. In such circumstances, we may not be able to obtain licenses to use those rights on commercially reasonable terms or at all, we may have to stop selling such content, and we may have to pay damages or satisfy indemnification commitments to our customers, or we may incur significant expense to defend against claims of infringement. While we offer our customers indemnification for only certain specified amounts of legal costs and direct damages arising from the use of images, video or music licensed through us, our contractual liability limitations with respect to such indemnification obligations may not be enforceable in all jurisdictions. We maintain insurance policies to cover potential intellectual property disputes; however, such insurance does not cover all exposures, including the potential damages associated with any willful infringements.We cannot predict whether assertions of third-party intellectual property rights or any infringement or misappropriation or other claims arising from such assertions will substantially harm our business or results of operations. If we are forced to defend against any infringement or misappropriation or other claims, whether they are with or without merit, are settled out of court, or are determined in our favor, we may be required to expend significant time and financial resources on the defense of such claims.Furthermore, an adverse outcome of a dispute may require us to: pay damages, potentially including statutory damages and attorneys’ fees if we are found to have willfully infringed a party’s intellectual property rights; expend additional development resources to redesign our technology; enter into potentially unfavorable royalty or license agreements in order to obtain the right to use necessary technologies, content, or materials; and/or indemnify our partners and/or other third parties. Royalty or licensing agreements, if required or desirable, may be unavailable on terms acceptable to us, or at all, and may require significant royalty payments and other expenditures. In addition, any lawsuits regarding intellectual property rights, regardless of their success or merit, could be expensive to resolve, cause harm to our reputation, and would divert the time and attention of our management and technical personnel.Although we have insurance to cover indemnification claims, we have incurred, and will continue to incur, legal fees and other expenses, as well as a diversion of management time and resources related to such claims and related settlements, which may increase over time, and adversely affect our financial condition and results of operations.Much of the software and technologies used to provide our services incorporate, or have been developed with, “open source” software, which may restrict how we use or distribute our services or require that we publicly release certain portions of our source code.Much of the software and technologies used to provide our services incorporate, or have been developed with, “open source” software. Such “open source” software may be subject to third-party licenses that impose restrictions on our software and services.services depending on how such software is used, including whether it is modified, distributed or made available. Under certain open source licenses, if certain conditions were met, we could be required to publicly release or license aspects of the source code of our software or to make our software available under open source licenses.licenses free of31charge. Few courts have interpreted open source licenses, and the way these licenses may be interpreted and enforced is therefore subject to some uncertainty. To avoid the public release of the affected portions of our source code, we could be required to expend substantial time and resources to re-engineer some or all of our software, which could reduce or eliminate the value of our services and technologies and materially and adversely affect our ability to sustain and grow our business.If an author or other third-party that distributes open source software were to allege that we had not complied with the conditions of one or more of these licenses, we could be required to incur significant legal expenses defending against such allegations and could be subject to significant damages, enjoined from the sale of our services that contained the open source software and required to comply with the foregoing conditions, which could disrupt the distribution and sale of some of our services. In addition, use of open source software can lead to greater risks than use of third-party commercial software because open source licensors generally do not provide warranties or controls on the origin of the software. The use of open source software can also carry security risks arising from unknown vulnerabilities that can be exploited by malware in unanticipated ways, which can lead to disruption and/or harm to operations and protected data. Additionally, because any software source code we contribute to open source projects is publicly available, while we may benefit from the contributions of others, our ability to protect our intellectual property rights in such software source code may be limited or lost entirely, and we will be unable to prevent our competitors or others from using such contributed software source code. Similarly, we may be subject to third-party intellectual property claims as a user of or contributor to such open source software. Any of31Risks Related to Legal and Regulatory MattersAn increase in federal, state and foreign government regulation of the industries and markets in which we operate, including with respect to the internet and e-commerce, could have a negative impact on our business.Existing or future laws and other regulations that may materially affect our business include, but are not limited to, those that govern or restrict:●privacy and biometric issues and data collection, processing, retention and transmission;●data and cybersecurity;●automatic contract or subscription renewal;●credit card fraud and processing;●consumer protection;●advertising, marketing and sales of our content and services;●pricing and taxation of goods and services offered over the internet;●website content, or the manner in which products and services may be offered, paid for and/or marketed over the internet;●sources of liability for companies involved in internet services or e-commerce;●piracy and intellectual property rights;●internet neutrality and internet access;●controls on overseas suppliers and other similar anti-terrorism controls, anti-bribery and anti-corruption conduct and policies; and●outsourcing, contracting and employment.•privacy and biometric issues and data collection, processing, retention and transmission;•data and cybersecurity;•subscriptions practices, including automatic contract or subscription renewal, billing and cancellation;•credit card fraud and processing;•consumer protection;•advertising, marketing and sales of our content and services;•pricing and taxation of goods and services offered over the internet;•website content, or the manner in which products and services may be offered, paid for and/or marketed over the internet;•sources of liability for companies involved in internet services or e-commerce;•piracy and intellectual property rights;•the development and use of AI generated content;•internet neutrality and internet access;•controls on overseas suppliers and other similar anti-terrorism controls, anti-bribery and anti-corruption conduct and policies; and•outsourcing, contracting and employment.For example, we are subject to numerous laws and regulations at the international and United States national and state level, including the following:●The United States Foreign Corrupt Practices Act and the U.K. Anti-Bribery Act (and similar global legislation), which prohibits corporations and individuals from engaging in specified activities to obtain or retain business or to influence a person working in an official capacity. Under these acts, it is generally illegal to pay, offer to pay, or authorize the payment of anything of value to any foreign government official, government staff member, political party, or political candidate in an attempt to obtain or retain business, or to otherwise influence a person working in an official capacity.●The U.K. Modern Slavery Act, which prohibits corporations and individuals from engaging in the trafficking of or facilitation of trafficking of humans. Under this Act, it is illegal to engage in or do business with any individual or entity that engages in such trafficking and obligates companies and individuals to put in place appropriate controls to mitigate against such risks.●OFAC regulations, under which all U.S. individuals and businesses are prohibited from engaging in transactions with countries subject to comprehensive trade embargoes (such as Cuba and Iran) unless a specific exemption from the regulations exists (such as those for information, all materials and people-to-people exchanges) or a license is obtained from OFAC. Transactions with persons, groups or entities designated as terrorists or as their supporters or associates are also prohibited. A list of Specially Designated Nationals consisting of “drug kingpins,” terrorists and others considered a danger to the United States, is maintained by the Treasury Department’s Office of Foreign Assets Control. Known as the “OFAC List,” it contains over 5,000 names and is updated often. No U.S. person, individual or business in the United States, or, in some instances, the foreign subsidiaries of U.S. companies, may conduct any kind of business with anyone on the OFAC List, and companies are expected to keep track of all changes to this list. Penalties for violations of these rules can be severe, including having the violator’s assets frozen or forfeited and up to $250,000 or twice the transaction value per violation in fines.●The Illinois Biometric Information Privacy Act regulates the collection, use, safeguarding, and storage of “biometric identifiers” by private entities. While the statute specifically excludes photographs from its scope to date there has been no dispositive judicial interpretations of that language.●The Washington Biometric Privacy Law, which oversees the collection, use and storage of “biometric identifiers,” which include fingerprints, voiceprints, eye retinas, irises and other unique biological identifiers or characteristics used to identify a specific individual, while specifically excluding photographs from its scope.•The United States Foreign Corrupt Practices Act and the U.K. Anti-Bribery Act (and similar global legislation), which prohibits corporations and individuals from engaging in specified activities to obtain or retain business or to influence a person working in an official capacity. Under these acts, it is generally illegal to pay, offer to pay, or authorize the payment of anything of value to any foreign government official, government staff member, political party, or political candidate in an attempt to obtain or retain business, or to otherwise influence a person working in an official capacity.32•The U.K. Modern Slavery Act, which prohibits corporations and individuals from engaging in the trafficking of or facilitation of trafficking of humans. Under this Act, it is illegal to engage in or do business with any32●Several foreign jurisdictions and U.S. states have adopted, and other jurisdictions are expected to enact, statutes that regulate the collection, use, transmission and storage of personal information and require reporting certain breaches of the security of personal information.●Several jurisdictions, including the United Kingdom and the United States, are in the process of adopting or reforming or expected to adopt or reform legislation that impacts the content we distribute, including the E.U. Copyright Directive, the Copyright Act, the Digital Millennium Copyright Act, and various statutes and regulations impacting rights of publicity for those depicted in imagery.
individual or entity that engages in such trafficking and obligates companies and individuals to put in place appropriate controls to mitigate against such risks.●Several foreign jurisdictions and U.S. states have adopted, and other jurisdictions are expected to enact, statutes that purport to void or substantially limit automatic renewal provisions of certain contractor or free or discounted trial incentives.•OFAC regulations, under which all U.S. individuals and businesses are prohibited from engaging in transactions with countries subject to comprehensive trade embargoes (such as Cuba and Iran) unless a specific exemption from the regulations exists (such as those for information, all materials and people-to-people exchanges) or a license is obtained from OFAC. Transactions with persons, groups or entities designated as terrorists or as their supporters or associates are also prohibited. A list of Specially Designated Nationals consisting of “drug kingpins,” terrorists and others considered a danger to the United States, is maintained by the Treasury Department’s Office of Foreign Assets Control. Known as the “OFAC List,” it contains over 5,000 names and is updated often. No U.S. person, individual or business in the United States, or, in some instances, the foreign subsidiaries of U.S. companies, may conduct any kind of business with anyone on the OFAC List, and companies are expected to keep track of all changes to this list. Penalties for violations of these rules can be severe, including having the violator’s assets frozen or forfeited and up to $250,000 or twice the transaction value per violation in fines.
On December 14, 2017,
33
matters, diversity, responsible sourcing and social investments and other ESG related matters, in our SEC filings or in other public disclosures. These ESG-related initiatives and goals within the scope of ESG could be difficult and expensive to implement, the technologies needed to implement them may not be cost effective and may not advance at a sufficient pace, and we could be criticized for the accuracy, adequacy or completeness of the disclosure. Further, statements about our ESG relatedESG-related initiatives and goals, and progress against those goals, may be based on standards for measuring progress that are still developing, internal controls and processes that continue to evolve, and assumptions that are subject to change in the future. In addition, we could be criticized for the scope or nature of such initiatives or goals, or for any revisions to these goals. If our ESG-related data, processes and reporting are incomplete or inaccurate, or if we fail to achieve progress with respect to our goals within the scope of ESG on a timely basis, or at all, our reputation, business, financial performance and growth could be adversely affected.
34
the effective cost of purchasing goods from us increases for those residing in these states or jurisdictions. We might also incur significant financial and organizational burdens in order to set up the infrastructure required to comply with these applicable new tax regulations.
35
Data protection legislation is also becoming increasingly common in the United States at both the federal and state level. For example, in June 2018, the State of California enacted the California Consumer Privacy Act (“CCPA”), which came into effect on January 1, 2020. The CCPA requires, among other things, companies that collect personal information about California residents to make new disclosures to those residents about their data collection, use and sharing practices, allows residents to opt out of certain data sharing with third parties, and provides a new cause of action for data breaches. The California Privacy Rights Act (“CPRA”) came into effect on January 1, 2023 (with a look back to January 2022). It amends and expands the CCPA to add additional disclosure obligations (including an obligation to disclose retention periods or criteria for categories of personal information), grant consumers additional rights (including rights to correct their data, limit the use and disclosure of sensitive personal information, and opt out of the sharing of personal information for certain targeted behavioral advertising purposes), and establishes a privacy enforcement agency known as the California Privacy Protection Agency (“CPPA”). The CPPA will serve as California’s chief privacy regulator, which will likely result in greater regulatory activity and enforcement in the privacy area.
36
We are, from time to time, subject to various litigation, the unfavorable outcomes of which might have a material adverse effect on our financial condition, results of operations and cash flow.
37
The market prices of securities of companies have experienced fluctuations that often have been unrelated or disproportionate to their operating results. In the past, stockholders have sometimes instituted securities class action litigation against companies following periods of volatility in the market price of their securities. Any similar litigation against us could result in substantial costs, divert management’s attention and resources, and harm our business, financial condition, and results of operations.
Although the CC Neuberger Principal Holdings II Sponsor LLC (the “Sponsor”) and the initial stockholders of CCNB remain subject to certain restrictions regarding the transfer of a portion of the shares of our Class A Common Stock following the Business Combination, these shares may be sold after the expiration of their respective lock-ups.
38
projections may vary widely and may not accurately predict the results we actually achieve. Our stock price may decline if our actual results do not match the projections of these securities research analysts. While we expect research analyst coverage, if no analysts commence or maintain coverage of us, the trading price and volume for our Class A Common Stockcommon stock could be adversely affected. If any analyst who may cover us were to cease coverage of us or fail to regularly publish reports on us, we could lose visibility in the financial markets, which in turn could cause the trading price or trading volume of our Class A Common Stockcommon stock to decline.
common stock.
common stock.
39
rules and regulations thereunder. To the extent the exclusive forum provision restricts the courts in which claims arising under the Securities Act may be brought, there is uncertainty as to whether a court would enforce such a provision. We note that investors cannot waive compliance with the federal securities laws and the rules and regulations thereunder. Furthermore, the enforceability of similar choice of forum provisions in other companies’ certificates of incorporation has been challenged in legal proceedings, and it is possible that a court could find these types of provisions to be inapplicable or unenforceable. While the Delaware courts have determined that such choice of forum provisions are facially valid, a stockholder may nevertheless seek to bring a claim in a venue other than those designated in the exclusive forum provisions, and there can be no assurance that such provisions will be enforced by a court in those other jurisdictions. If a court were to find the exclusive-forum provision contained in our Amended and Restated BylawsCertificate of Incorporation to be inapplicable or unenforceable in an action, we may incur additional costs associated with resolving such action in other jurisdictions, which could harm our business.
common stock.
40
Court’s judgment in favor of the Plaintiffs. Alta has cross appealed that portion of the Court’s judgment in favor of the Company.
On May 2, 2023, the defendants moved to dismiss or, in the alternative, to transfer the case to the Northern District of California. The defendants’ motion is premised on their contention that Stability AI, Ltd. is not subject to personal jurisdiction in Delaware. Getty Images served jurisdictional discovery requests on Defendants on May 12, 2023, and the parties agreed to extend Getty Images (US), Inc.’s time to respond to the motion to dismiss while the parties engage in discovery relating to the defendants’ activities within Delaware and other states in the U.S. On January 26, 2024, the court dismissed the defendants’ motion to dismiss without prejudice with leave to re-file upon the completion of jurisdictional discovery.
In June 2023, Stability filed a motion to strike certain portions of the claim and grant summary judgment on Getty Images’ secondary infringement claim. The court conducted a hearing on the issues in October 2023. Following the hearing, the Judge issued an order denying Stability’s motion in its entirety and granted costs to Getty Images. The order became final and public in late January 2024. Stability has requested an appeal against that decision. The case schedule has been set for the next stages of the litigation, including disclosures and any additional changes to the parties' claims or defense. A trial date has not yet been set.
41
Securities Authorized for Issuance Under Equity Compensation Plans
Refer to “Item 12. Security Ownership of Certain Beneficial Owners and Management and Related Stockholder Matters–Equity Compensation Plan Information” for information regarding securities authorized for issuance under our equity compensation plans.
42
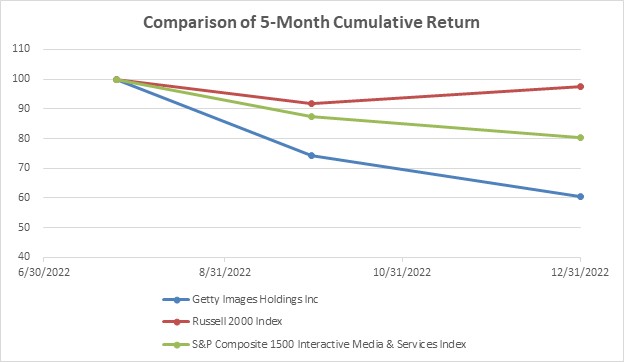
Stock Performance Graph
| | AR | | | | | | ||||||
|
| 7/25/2022 |
| 9/30/2022 |
| 12/31/2022 |
| ||||||
Getty Images Holdings, Inc. | | $ | 100.00 | | $ | 74.21 | | $ | 60.56 | | |||
Russell 2000 Index | | $ | 100.00 | | $ | 91.87 | | $ | 97.57 | | |||
S&P Composite 1500 Interactive Media & Services Index | | $ | 100.00 | | $ | 87.39 | | $ | 80.49 | | |||

| 7/25/2022 | 12/31/2022 | 6/30/2023 | 12/31/2023 | |||||||||||||||||
| Getty Images Holdings, Inc. | $ | 100.00 | $ | 60.56 | $ | 53.33 | $ | 57.38 | ||||||||||||
| Russell 2000 Index | $ | 100.00 | $ | 97.57 | $ | 105.44 | $ | 114.04 | ||||||||||||
| S&P Composite 1500 Interactive Media & Services Index | $ | 100.00 | $ | 80.49 | $ | 126.27 | $ | 149.55 | ||||||||||||
43
44
For over 2729 years, Getty Images has embraced innovation; from analogue to digital, from offline to e-commerce, from stills to video, from single image purchasing to subscriptions, from websites to application programming interfaces (“APIs”)., from pre-shot content to AI generated content designed to be commercially safe. With quality content at the core of our offerings, we embrace innovation as a means to better service our existing customers and to reach new ones.
licensing.
45
In addition to our websites, customers and partners can access and integrate our content, metadata and search capabilities via our APIs and through a range of mobile apps and plugins.
•We offer a comprehensive suite of high quality, authentic content, purchase and licensing options and services to meet the needs of our customers, regardless of project requirements, needs or budgets. • |
| Our content sourcing and production, rights oversight, |
For content contributors:
Unsplash Acquisition
On April 1, 2021, we acquired the entirety of Unsplash, Inc. (“Unsplash”), in exchange for $89.2 million in net cash funded through existing cash on hand plus an additional earnout potential of approximately $20.0 million based on revenue targets over two and three years. With more than 102 million images downloaded every month, the Unsplash platform powers the creativity of tens of millions of users via the Unsplash website and thousands of partner integrations through the Unsplash API. Through the combination of the Getty Images, iStock and Unsplash brands, and their corresponding websites and APIs, Getty Images is uniquely positioned to reachcontent distribution are all supported by a unique, scalable cloud-based unified platform with powerful artificial intelligence/machine learning and enable creativity and communications across the full spectrum of the world’s growing creative community.
Impact of COVID-19
The COVID-19 pandemic has and is significantly impacting economies around the world. During this time, ensuring that ourdata addressing all customers continue toat scale.
46
DuringCustomers licensing from Getty Images and iStock receive trusted copyright claim protections, model and property releases and the heightability to secure the necessary clearances for their intended use of the pandemiccontent.
The economic uncertainty caused by COVID-19 has had an impact on our customers, which resulted in an unfavorable impact to our revenue and certain key performance indicatorsnearly $220 million for the year ended
See also “Item 1.A. Risk Factors—The extentAI models, allowing them to which the COVID-19 pandemic will have a continued impact remains uncertain.”
continue to create more high-quality pre-shot imagery.
In addition to the consideration paid at Closing, in the third quarter of 2022, in accordance with the Business Combination Agreement, the Company issued 58,999,956 shares of Class A Common Stock (Earn-Out Shares) to equity holders of Legacy Getty.
47
Beginning with the three months ended September 30, 2022, the Company made two changes to its reporting that has some impact on reported KPI’s. First, activity for LATAM, Turkey and Israel, which was previously excluded from these metrics, is now included due to completion of a system migration. Additionally, the method by which we aggregate our customer accounts was updated to better align with our internal sales CRM system. We have not restated historical periods given the immaterial impact to the KPI’s, except for LTM total active annual subscribers and LTM annual subscriber revenue retention rate for which the legacy reporting format is detailed below.
| | | | | | | |
| | Last Twelve Months Ended December 31, |
| ||||
|
| 2022 |
| 2021 |
| 2020 |
|
LTM total purchasing customers (thousands)1 | | 835 | | 794 | | 715 | |
LTM total active annual subscribers (thousands)1 |
| 129 |
| 75 | | 59 | |
LTM paid download volume (millions)1,2 |
| 95 |
| 89 | | 83 | |
LTM annual subscriber revenue retention rate |
| 100.1 | % | 104.5 | % | 87.9 | % |
Image collection (millions)1 |
| 497 |
| 458 | | 426 | |
Video collection (millions) |
| 24 |
| 20 | | 17 | |
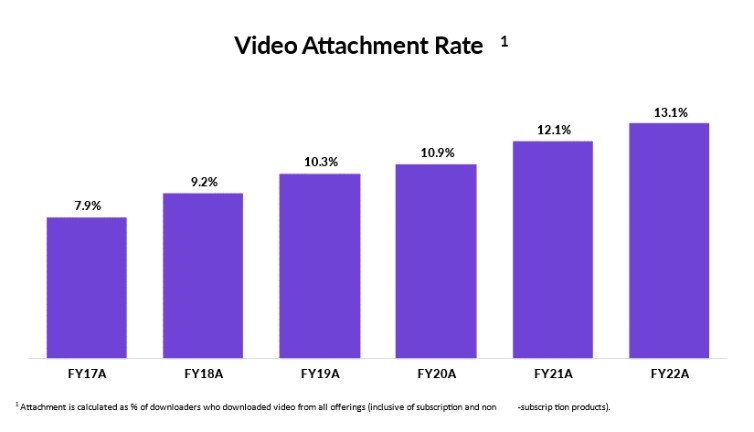
LTM video attachment rate1,3 |
| 13.1 | % | 12.1 | % | 10.9 | % |
| Years Ended December 31, | |||||||||||||||||
| 2023 | 2022 | 2021 | |||||||||||||||
LTM total purchasing customers (thousands)1 | 799 | 835 | 794 | ||||||||||||||
LTM total active annual subscribers (thousands)1 | 236 | 129 | 75 | ||||||||||||||
LTM paid download volume (millions)1,2 | 95 | 95 | 89 | ||||||||||||||
| LTM annual subscriber revenue retention rate | 92.4 | % | 100.1 | % | 104.5 | % | |||||||||||
Image collection (millions)1 | 535 | 497 | 458 | ||||||||||||||
| Video collection (millions) | 28 | 24 | 20 | ||||||||||||||
LTM video attachment rate1 | 14.1 | % | 13.1 | % | 12.1 | % | |||||||||||
respectively. signals that our content continues to meet our customers evolving needs. for December 31, 2023 and December 31, 2022, respectively. Video attachment rate is a measure of the percentage of total paid customer downloaders who are video downloaders. Customer demand for video content continues to grow and represents a significant opportunity for revenue growth for Getty Images. The video attachment rate provides management and investors with an indication of our customers’ level of engagement with our video content offering. Our expansion of video across our subscription products is focused on further increasing the attachment rate over time. The increase in video attachment rates from the LTM periods ending December 31, offering, improved search and site prominence for video content, and upselling of video into subscriptions. In September 2023 and January 2024, we launched Generative AI by Getty Images and Generative AI by iStock, respectively. They are generative AI text to image tools that were trained exclusively on Getty Images’ world‑class creative content and designed for commercial use. Customers that download visuals through the tool will receive the standard royalty‑free license. amortization) We expect depreciation expense to remain stable as we continue to innovate and invest in the design, user experience and performance of our websites. years. Consolidated statements of operations Years Ended (In thousands) December 31, increase (decrease) 2022 2021 $ change % change Revenue $ 926,244 $ 918,688 $ 7,556 0.8 % Cost of revenue (exclusive of depreciation and amortization shown separately below) 254,990 248,152 6,838 2.8 % Selling, general and administrative expense 376,683 367,704 8,979 2.4 % Depreciation 49,574 51,099 (1,525) (3.0) % Amortization 43,645 49,361 (5,716) (11.6) % Restructuring costs — (475) 475 NM Other operating (income) expense, net (681) 861 (1,542) NM Operating expense 724,211 716,702 7,509 1.0 % Income from operations 202,033 201,986 47 — % Interest expense (117,229) (122,160) 4,931 (4.0) % Gain on fair value adjustment for swaps and foreign currency exchange contract - net 23,508 19,282 4,226 21.9 % Unrealized foreign exchange gains - net 24,643 36,406 (11,763) (32.3) % Loss on extinguishment of debt (2,693) — (2,693) NM Loss on fair value adjustment for warrant liabilities - net (160,728) — (160,728) NM Other non-operating (expense) income, net (3,051) 612 (3,663) NM Total other expense (235,550) (65,860) (169,690) 257.7 % (Loss) Income before income taxes (33,517) 136,126 (169,643) NM Income tax expense (44,126) (18,729) (25,397) 135.6 % Net (Loss) income $ (77,643) $ 117,397 $ (195,040) NM Revenue by product Years Ended (In thousands) December 31, increase / (decrease) 2022 % of revenue 2021 % of revenue $ change % change CN % change Creative 585,400 63.2 % 596,917 65.0 % (11,517) (1.9) % 2.7 % Editorial 325,770 35.2 % 306,631 33.4 % 19,139 6.2 % 11.5 % Other 15,074 1.6 % 15,140 1.6 % (66) (0.4) % 4.1 % Total revenue $ 926,244 100.0 % $ 918,688 100.0 % $ 7,556 0.8 % 5.7 % •increases were also seen in insurance expense ($1.7 million), other taxes ($0.7 million) and travel and entertainment ($1.5 million). the Company’s loss on litigation of $1.1 million was comprised of legal fees related to two lawsuits by former public warrant holders. Consolidated statements of operations (In thousands) Year Ended December 31, increase (decrease) 2021 2020 $change % change Revenue $ 918,688 $ 815,401 $ 103,287 12.7 % Cost of revenue (exclusive of depreciation and amortization shown separately below) 248,152 226,066 22,086 9.8 % Selling, general and administrative expense 367,704 324,423 43,281 13.3 % Depreciation 51,099 52,358 (1,259) (2.4) % Amortization 49,361 47,002 2,359 5.0 % Restructuring costs (475) 9,135 (9,610) NM Other operating expense, net 861 161 700 NM Operating expense 716,702 659,145 57,557 8.7 % Income from operations 201,986 156,256 45,730 29.3 % Interest expense (122,160) (124,926) 2,766 (2.2) % Fair value adjustment for swaps & foreign currency exchange contract - net 19,282 (14,255) 33,537 NM Foreign exchange gain (losses) - net 36,406 (45,073) 81,479 NM Other non-operating income, net 612 139 473 NM Total other expense (65,860) (184,115) 118,255 (64.2) % Income (loss) before income taxes 136,126 (27,859) 163,985 NM Income tax expense (18,729) (9,516) (9,213) 96.8 % Net income (loss) $ 117,397 $ (37,375) $ 154,772 NM Revenue by product Year ended (In thousands) December 31, increase / (decrease) 2021 % of revenue 2020 % of revenue $change % change CN % change Creative 596,917 65.0 % 532,732 65.3 % 64,185 12.0 % 9.5 % Editorial 306,631 33.4 % 266,699 32.7 % 39,932 15.0 % 12.4 % Other 15,140 1.6 % 15,970 2.0 % (830) (5.2) % (7.2) % Total revenue $ 918,688 100.0 % $ 815,401 100.0 % $ 103,287 12.7 % 10.2 % Non-GAAP Financial Measures (in thousands) Year Ended December 31, 2022 2021 2020 Net (loss) income $ (77,643) $ 117,397 $ (37,375) Add/(less) non-GAAP adjustments: Depreciation and amortization 93,219 100,460 99,360 Restructuring and other operating (income) expense (681) 386 9,296 Interest expense 117,229 122,160 124,926 Fair value adjustments, foreign exchange and other non operating (expense) income — net 1 (45,100) (56,300) 59,189 Loss on extinguishment of debt 2,693 — — Loss on fair value adjustment for warrant liabilities — net 160,728 — — Income tax expense 44,126 18,729 9,516 Stock based compensation expense 9,292 6,441 8,002 Adjusted EBITDA $ 303,863 $ 309,273 $ 272,914 Net (loss) income margin (8.6) % 12.8 % (4.6) % Adjusted EBITDA Margin 32.8 % 33.7 % 33.5 % Future cash needs Year Ended December 31, increase (decrease) (Dollars in thousands) 2022 2021 $ change % change Net cash provided by operating activities $ 163,117 $ 188,890 $ (25,773) (13.6) % Net cash used in investing activities $ (61,291) $ (136,926) $ 75,635 55.2 % Net cash used in financing activities $ (184,347) $ (19,265) $ (165,082) (856.9) % Effects of exchange rate fluctuations $ (6,614) $ (2,479) $ (4,135) (166.8) % Our investing activities used $61.3 million and $136.9 million in cash during the year ended December 31, 2022 and 2021, respectively, which was used in part to acquire property and equipment. The property and equipment Year Ended December 31, increase (decrease) (Dollars in thousands) 2021 2020 $change % change Net cash provided by operating activities $ 188,890 $ 148,463 $ 40,427 27.2 % Net cash used in investing activities $ (136,926) $ (53,484) $ (83,442) (156.0) % Net cash used in financing activities $ (19,265) $ (52,002) $ 32,737 63.0 % Effects of exchange rate fluctuations $ (2,479) $ 104 $ (2,583) NM Contractual obligations, guarantees and other potentially significant uses of cash 2027 and (Dollars in thousands) 2023-2024 2025-2026 thereafter Total Long-term indebtedness, including current portion and interest1 $ 259,513 $ 1,295,037 $ 314,625 $ 1,869,175 Operating lease obligations1 25,813 18,775 26,618 71,206 Minimum royalty guarantee payments to suppliers of content2 77,122 55,049 26,082 158,253 IT Commitments 7,643 2,072 — 9,715 Other commitments 3,040 255 — 3,295 Total $ 373,131 $ 1,371,188 $ 367,325 $ 2,111,644 2023. Capital expenditures Revenue recognition Cont Balance Sheets. Income taxes The statements of operations of foreign subsidiaries are translated into U.S. dollars, our reporting currency, at the prior month’s average daily exchange rate. When these exchange rates change from period to period, they cause fluctuations in reported results of operations that are not necessarily indicative of fundamental company operating performance but instead may reflect the performance of foreign currencies. controls pursuant to Sarbanes-Oxley Act of 2002, and this Annual Report does not include such attestation report. Non-Equity Stock Option Incentive Plan All Other Salary Bonus Awards Awards Compensation Compensation Total Named Executive Officer Year ($)(1) ($)(2) ($) ($)(3) ($)(4) ($)(5)(6) ($) Craig Peters, Chief Executive Officer and Director 2022 975,294 — — — 476,085 24,934 1,476,313 2021 946,833 — — — 1,422,144 23,015 2,391,992 Nathaniel Gandert, Senior Vice President and Chief Technology Officer 2022 519,401 — — — 125,000 16,596 660,997 2021 504,275 — — — 378,707 15,984 898,966 Gene Foca, Senior Vice President and Chief Marketing Officer (7) 2022 502,174 10,000 — — 125,000 22,322 659,496 Milena Alberti- Perez, former Senior Vice President and Chief Financial Officer 2022 134,712 — — — — 813,672 948,384 2021 429,808 50,000 — 2,741,400 — 8,844 3,230,052 Number of Number of securities securities underlying underlying Option unexercised unexercised exercise Option Grant options (#) options (#) price expiration Named Executive Officer Date (Exercisable) (1) (Unexercisable) ($) date Craig Peters, Chief Executive Officer 2/26/2017 71,869 — $ 3.13 2/25/2027 2/26/2017 127,420 — $ 3.13 2/25/2027 2/26/2017 172,264 — $ 3.13 2/25/2027 3/1/2017 1,565,691 — $ 3.13 2/28/2027 4/10/2019 1,975,927 282,276 $ 2.74 4/9/2029 4/10/2019 939,415 — $ 2.74 4/9/2029 Nathaniel Gandert, Senior Vice President and Chief Technology Officer 2/26/2017 13,996 — $ 3.13 2/25/2027 2/26/2017 29,535 — $ 3.13 2/25/2027 2/26/2017 39,938 — $ 3.13 2/25/2027 3/1/2017 488,216 — $ 3.13 2/28/2027 4/10/2019 862,852 123,265 $ 2.74 4/9/2029 4/10/2019 292,930 — $ 2.74 4/9/2029 Mr. Gene Foca, Senior Vice President and Chief Marketing Officer 03/01/2017 639,523 — $ 3.13 2/28/2027 04/10/2019 1,119,166 159,881 $ 2.74 4/9/2029 Total Fees earned or Stock All Other paid in cash Awards Compensation Total Name ($) ($) ($) ($) Chinh Chu — — — — Mark Getty — — — — Michael Harris — — — — Jonathan Klein 122,329 — — 122,329 Patrick Maxwell — — — — James Quella 22,329 390,000 — 412,329 Hilary Schneider 80,144 — — 80,144 Jeff Titterton 8,219 390,000 — 398,219 Brett Watson — — — — Number of Shares of Class A Common Name of Beneficial Owners Stock Percentage Directors and Executive Officers Mark Getty(1) 13,347,502 3.4 % Patrick Maxwell — — % Hilary Schneider(2) 173,204 * % Craig Peters(3) 5,155,992 1.3 % Brett Watson — — % Chinh E. Chu(4) 5,777,998 1.5 % Michael Harris — — % Jonathan Klein(5) 4,548,102 1.2 % James Quella(6) 40,000 * % Jeffrey Titterton — — % Gene Foca(7) 1,918,570 * % Nate Gandert(8) 1,850,732 * % All directors and executive officers as a group (22 total) 39,372,844 10.0 % Five Percent Holders of the Company The Getty Family Stockholders(9) 191,374,006 48.4 % Koch Icon Investments, LLC(10) 80,499,253 20.4 % NBOKS(11) 78,847,968 19.9 % CC Neuberger Principal Holdings II Sponsor LLC(12) 25,580,000 6.5 % * Less than 1 % Number of Number of securities remaining securities to be available for future issued upon exercise Weighted-average issuance under equity of outstanding exercise price of compensation plans options, warrants outstanding options, (excluding securities and rights warrants and rights reflected in column (a)) Plan Category (a) (b) (c) Equity compensation plans approved by security holders: 2022 Equity Incentive Plan 34,302,400 (1) $ 3.08 (2) 16,744,429 2022 Employee Share Purchase Plan — — 5,000,000 2022 Earn Out Plan — — 6,000,000 Equity compensation plans not approved by security holders(3) N/A N/A N/A Total Item 13. Certain Relationships and Related Transactions, and Director Independence Fiscal Fiscal Fee Category (In thousands) 2022 2021 Audit Fees $ 2,287 $ 1,521 Tax Fees 777 433 All Other Fees 1 1 Total Fees $ 3,065 $ 1,955 Report of Independent Registered Public Accounting Firm (PCAOB ID: 42) 3.1 3.2 4.1 4.2* 4.3* First Supplemental Indenture, dated February 19, 2019, between Getty Images, Inc. and Wilmington Trust, National 4.4* 10.1 10.3 10.4* 10.8* 10.9* 10.10* Form of Award Agreement Awarding Stock Options under the Getty Images Holdings, Inc. 2022 Equity Incentive Employment Agreement with Craig Peters dated July 1, 2015, as amended on January 27, 2017, November 3, 2017, January 1, 2019, April 1, 2020 21.1* 23.1* 31.1* 31.2* 32.1** Certification of Chief Executive Officer 32.2** Certification of Chief Financial Officer Pursuant to 18 U.S.C. Section 1350, as adopted 104 Cover Page Interactive Data File. Formatted in Inline XBRL and contained in exhibit 101. † Certain of the exhibits and schedules to this exhibit have been omitted in accordance with Regulation S-K Item 601(b)(2). The Company agrees to furnish supplementally a copy of all omitted exhibits and schedules to the SEC upon its request. * Filed Herewith ** Furnished Herewith Indicates management contract or compensatory plan or arrangement Date: March /s/ Craig Peters Craig Peters Chief Executive Officer and Director /s/ Jennifer Leyden Name: Craig Peters Jennifer Leyden Title: Chief Executive Officer and Director Chief Financial Officer (Principal Executive Officer) (Principal Financial Officer) Date: March March /s/ Chris Hoel Name: Chris Hoel Title: Chief Accounting Officer (Principal Accounting Officer) Date: March /s/ Mark Getty /s/ Chin Chu Name: Mark Getty Chin Chu Title: Director Director Date: March March /s/ Michael Harris /s/ Jonathan Klein Name: Michael Harris Jonathan Klein Title: Director Director Date: March March /s/ Patrick Maxwell /s/ James Quella Name: Patrick Maxwell James Quella Title: Director Director Date: March March /s/ Hilary Schneider /s/ Jeffrey Titterton Name: Hilary Schneider Jeffrey Titterton Title: Director Director Date: March March /s/ Brett Watson Name: Brett Watson Title: Director Date: March December 31, 2022 2021 ASSETS CURRENT ASSETS: Cash and cash equivalents $ 97,912 $ 186,301 Restricted cash 4,482 5,228 Accounts receivable – net of allowance of $6,460 and $5,946 129,603 143,362 Prepaid expenses 15,728 12,778 Taxes receivable 11,297 11,992 Other current assets 10,497 15,368 Total current assets 269,519 375,029 PROPERTY AND EQUIPMENT – NET 172,083 170,896 RIGHT OF USE ASSETS 47,231 — GOODWILL 1,499,578 1,503,245 IDENTIFIABLE INTANGIBLE ASSETS – NET 419,548 478,852 DEFERRED INCOME TAXES – NET 8,272 8,893 OTHER LONG-TERM ASSETS 51,952 41,092 TOTAL $ 2,468,183 $ 2,578,007 LIABILITIES, REDEEMABLE PREFERRED STOCK AND STOCKHOLDERS’ EQUITY (DEFICIT) CURRENT LIABILITIES: Accounts payable $ 93,766 $ 94,993 Accrued expenses 49,327 66,569 Income taxes payable 8,031 10,502 Short-term debt – net — 6,481 Deferred revenue 171,371 167,550 Total current liabilities 322,495 346,095 LONG-TERM DEBT – NET 1,428,847 1,750,990 LEASE LIABILITIES 46,218 — DEFERRED INCOME TAXES – NET 37,075 24,595 UNCERTAIN TAX POSITIONS 37,333 42,701 OTHER LONG-TERM LIABILITIES 3,167 26,961 Total liabilities 1,875,135 2,191,342 Commitments and contingencies (Note 13) REDEEMABLE PREFERRED STOCK: Redeemable Preferred Stock, $0.01 par value, 900,000 shares authorized, 677,484 shares outstanding at December 31, 2021 (aggregate liquidation preference of $685,350). No shares were issued or outstanding at December 31, 2022. — 685,350 STOCKHOLDERS’ EQUITY (DEFICIT): Preferred Stock, $0.0001 par value; 1.0 million shares authorized; no shares issued and outstanding as of December 31, 2022 and December 31, 2021. — — Class A common stock, $0.0001 par value: 2.0 billion shares authorized; 394.8 million shares issued and outstanding as of December 31, 2022 and 196.1 million shares issued and outstanding as of December 31, 2021 39 20 Class B common stock, $0.0001 par value: 5.1 million shares authorized; no shares issued and no shares outstanding as of December 31, 2022 and December 31, 2021. — — Additional paid-in capital 1,936,324 935,082 Accumulated deficit (1,282,354) (1,203,440) Accumulated other comprehensive loss (108,928) (78,403) Total Getty Images Holdings, Inc. stockholders’ equity (deficit) 545,081 (346,741) Noncontrolling interest 47,967 48,056 Total stockholders’ equity (deficit) 593,048 (298,685) TOTAL $ 2,468,183 $ 2,578,007 Year Ended December 31, 2022 2021 2020 REVENUE $ 926,244 $ 918,688 $ 815,401 OPERATING EXPENSE: Cost of revenue (exclusive of depreciation and amortization shown separately below) 254,990 248,152 226,066 Selling, general and administrative expenses 376,683 367,704 324,423 Depreciation 49,574 51,099 52,358 Amortization 43,645 49,361 47,002 Restructuring costs — (475) 9,135 Other operating (income) expense — net (681) 861 161 Operating expense 724,211 716,702 659,145 INCOME FROM OPERATIONS 202,033 201,986 156,256 OTHER EXPENSE, NET: Interest expense (117,229) (122,160) (124,926) Gain (loss) on fair value adjustment for swaps and foreign currency exchange contract – net 23,508 19,282 (14,255) Unrealized foreign exchange gains (losses) – net 24,643 36,406 (45,073) Loss on extinguishment of debt (2,693) — — Loss on fair value adjustment for warrant liabilities — net (160,728) — — Other non-operating (expense) income – net (3,051) 612 139 Total other expense – net (235,550) (65,860) (184,115) (LOSS) INCOME BEFORE INCOME TAXES (33,517) 136,126 (27,859) INCOME TAX EXPENSE (44,126) (18,729) (9,516) NET (LOSS) INCOME (77,643) 117,397 (37,375) Less: Net (loss) income attributable to noncontrolling interest (89) 329 (182) Premium on early redemption of Redeemable Preferred Stock 26,678 — — Redeemable Preferred Stock dividend 43,218 71,393 64,120 NET (LOSS) INCOME ATTRIBUTABLE TO GETTY IMAGES HOLDINGS, INC. $ (147,450) $ 45,675 $ (101,313) Net (loss) income per share attributable to Class A Getty Images Holdings, Inc. common Basic $ (0.53) $ 0.23 (0.52) Diluted $ (0.53) $ 0.23 (0.52) Weighted-average Class A common shares outstanding: Basic 276,942,660 196,084,650 196,082,503 Diluted 276,942,660 201,507,355 196,082,503 Year Ended December 31, 2022 2021 2020 NET (LOSS) INCOME $ (77,643) $ 117,397 (37,375) OTHER COMPREHENSIVE LOSS: Net foreign currency translation adjustment losses (30,525) (31,603) 32,895 COMPREHENSIVE (LOSS) INCOME (108,168) 85,794 (4,480) Less: Comprehensive (loss) gain attributable to noncontrolling interest (89) 328 (179) COMPREHENSIVE (LOSS) INCOME ATTRIBUTABLE TO GETTY IMAGES HOLDINGS, INC. $ (108,079) $ 85,466 $ (4,301) Total Accumulated Getty Images Redeemable Additional Other Holdings, Inc. Total Preferred Stock Class A Common Stock Class B Common Stock Paid-In Accumulated Comprehensive Stockholders’ Noncontrolling Stockholders’ Shares Amount Shares Amount Shares Amount Capital Deficit Loss Equity (Deficit) Interest Equity (Deficit) BALANCE — December 31, 2019 543,526 $ 549,837 153,302,255 $ 1,533 — $ — $ 1,054,600 $ (1,283,315) $ (79,695) (306,877) $ 47,907 $ (258,970) Retroactive application of recapitalization — — 42,778,659 (1,513) — — 1,513 — — — — — BALANCE — December 31, 2019, after effect of recapitalization (Note 3) 543,526 $ 549,839 196,080,914 $ 20 — $ — $ 1,056,113 $ (1,283,315) $ (79,695) $ (306,877) $ 47,907 $ (258,970) Net loss — — — — — — — (37,193) — (37,193) (182) (37,375) Other comprehensive income — — — — — — — — 32,895 32,895 3 32,898 Issuance of common stock in connection with employee stock option exercise — — 1,598 — — — — — — — — — Redeemable Preferred Stock dividend 63,384 64,120 — — — — (64,120) — — (64,120) — (64,120) Equity-based compensation activity — — — — — — 8,007 — — 8,007 — 8,007 BALANCE — December 31, 2020 606,910 $ 613,959 196,082,512 $ 20 — $ — $ 1,000,000 $ (1,320,508) $ (46,800) $ (367,288) $ 47,728 $ (319,560) Net loss — — — — — — — 117,068 — 117,068 329 117,397 Other comprehensive (loss) — — — — — — — — (31,603) (31,603) (1) (31,604) Issuance of common stock in connection with option exercises — — 12,790 — — — 35 — — 35 — 35 Redeemable Preferred Stock dividend 70,574 71,393 — — — — (71,393) — — (71,393) — (71,393) Equity-based compensation activity — — — — — — 6,440 — — 6,440 — 6,440 BALANCE — December 31, 2021 677,484 $ 685,350 196,095,302 $ 20 — $ — $ 935,082 $ (1,203,440) $ (78,403) $ (346,741) $ 48,056 $ (298,685) Net loss — — — — — — — (77,554) — (77,554) (89) (77,643) Other comprehensive (loss) — — — — — — — — (30,525) (30,525) (30,525) Cumulative effect of accounting change- adoption of ASU 2019-12 (Note 2) — — — — — — — (1,360) — (1,360) — (1,360) Issuance of common stock in connection with option exercises — — 1,581,275 — — — 194 — — 194 — 194 Common shares withheld for settlement of taxes in connection with equity-based compensation — — (679,914) — — — (6,267) — — (6,267) — (6,267) Equity-based compensation activity — — — — — — 9,547 — — 9,547 — 9,547 Redeemable Preferred Stock dividend 38,109 43,218 — — — — (43,218) — — (43,218) — (43,218) Premium on early redemption of Redeemable Preferred Stock — 26,678 — — — — (26,678) — — (26,678) — (26,678) Redemption of Redeemable Preferred Stock for (715,593) (755,246) 15,000,000 2 — — 140,248 — — 140,250 — 140,250 Issuance of Class A and Class B common stock upon Business Combination and PIPE Investment, net of tax impact and issuance costs — — 107,068,311 10 5,140,000 1 694,449 — — 694,460 — 694,460 Issuance of Class A common stock upon exercise of Private Placement Warrants — — 11,555,996 1 — — 232,852 — — 232,853 — 232,853 Issuance of Class A common stock upon exercise of Public Warrants — — 10,328 — — — 121 — — 121 — 121 Issuance of Class A common stock upon vesting of Earn-out shares — — 58,999,956 6 — — (6) — — — — — Conversion of Class B common stock to Class A common Stock — — 5,140,000 — (5,140,000) (1) — — — (1) — (1) BALANCE — December 31, 2022 — $ — 394,771,254 $ 39 — $ — $ 1,936,324 $ (1,282,354) $ (108,928) $ 545,081 $ 47,967 $ 593,048 Year Ended December 31, 2022 2021 2020 CASH FLOWS FROM OPERATING ACTIVITIES: Net (loss) income $ (77,643) $ 117,397 $ (37,375) Adjustments to reconcile net (loss) income to net cash provided by operating activities: Depreciation 49,574 51,099 52,358 Amortization 43,645 49,361 47,002 Unrealized exchange gains on foreign denominated debt (26,636) (39,173) 45,553 Equity-based compensation 9,292 6,440 8,002 Non-cash fair value adjustment for warrant liabilties — net 160,728 — — Deferred income taxes – net 15,801 5,793 (11,449) Uncertain tax positions (5,368) (20,507) 1,832 Restructuring — (475) 9,135 Non-cash fair value adjustment for swaps and foreign currency exchange contracts — net (22,005) (20,196) 15,943 Amortization of debt issuance costs 6,096 6,741 5,601 Non cash operating lease costs 9,760 — — Impairment of right of use assets 2,563 — — Loss on extinguishment of debt 2,693 — — Transaction cost allocated to common stock warrants 4,262 — — Non-cash fair value adjustment of contingent consideration (4,039) 1,373 — Other 3,428 (250) 1,802 Changes in current assets and liabilities: Accounts receivable 6,016 (16,075) 9,061 Accounts payable 6,001 (555) 7,400 Accrued expenses (14,231) 18,712 (13,443) Lease liabilities, non-current (11,408) — — Income taxes receivable/payable (188) 320 2,523 Interest Payable 261 — — Deferred revenue 9,140 24,783 4,483 Other (4,625) 4,102 35 Net cash provided by operating activities 163,117 188,890 148,463 CASH FLOWS FROM INVESTING ACTIVITIES: Acquisition of property and equipment (59,291) (49,317) (44,862) Purchase of a Minority Investment (2,000) — (8,500) Acquisition of a business, net of cash acquired — (89,206) — Other investing activities — 1,597 (122) Net cash used in investing activities (61,291) (136,926) (53,484) CASH FLOWS FROM FINANCING ACTIVITIES: Cash contributions from business combination 864,164 — — Cash paid for equity issuance costs (106,917) (1,851) — Payment of Redeemable Preferred Stock (614,996) — — Repayment of debt (310,400) (17,449) (52,007) Cash paid for settlement of employee taxes related to option exercises (6,267) — — Proceeds from option and warrant exercises 313 35 5 Redemption of Warrants for cash (244) — — Payment of contingent consideration (10,000) — — Net cash used in financing activities (184,347) (19,265) (52,002) EFFECTS OF EXCHANGE RATE FLUCTUATIONS (6,614) (2,479) 104 NET (DECREASE) INCREASE IN CASH, CASH EQUIVALENTS AND RESTRICTED CASH (89,135) 30,220 43,081 CASH, CASH EQUIVALENTS AND RESTRICTED CASH - Beginning of period 191,529 161,309 118,228 CASH, CASH EQUIVALENTS AND RESTRICTED CASH - End of period $ 102,394 $ 191,529 $ 161,309 SUPPLEMENTAL DISCLOSURES: Interest paid $ 110,909 $ 115,258 $ 119,506 Income taxes paid, including foreign taxes withheld $ 30,800 $ 32,300 $ 12,900 See notes to consolidated financial statements. Accounting Principles — The Company’s accompanying consolidated financial statements have been prepared in conformity with accounting principles generally accepted in the United States of America (“U.S. GAAP”). Estimates and Assumptions — The preparation of the consolidated financial statements in conformity with U.S. GAAP requires reported as a component of OCI and is subsequently recognized in earnings when the hedged exposure affects earnings. The ineffective portion of the gain or loss is recognized in earnings. For derivative instruments designated as either fair value or cash flow hedges, changes in the time value are excluded from the assessment of hedge effectiveness and are recognized in earnings. Gains and losses from changes in fair values of derivatives that are not designated as hedges for accounting purposes are recognized in As of December 31, 2022 2021 Cash and cash equivalents $ 97,912 $ 186,301 Restricted cash 4,482 5,228 Total cash, cash equivalents and restricted cash $ 102,394 $ 191,529 Allowance for doubtful accounts changed as follows during the years presented (in thousands): Year Ended December 31, 2022 2021 2020 Beginning of year $ 5,946 $ 7,773 $ 7,843 Provision 1,465 750 2,002 Deductions (951) (2,577) (2,072) End of year $ 6,460 $ 5,946 $ 7,773 that it is more likely than not that the indefinite-lived asset is impaired. Intangible assets with a finite life and long-lived assets are reviewed for impairment whenever an event occurs, or circumstances change that indicate their carrying value may not be recoverable through projected undiscounted cash flows expected to be generated by the asset. If the evaluation of the projected cash flows indicates that the carrying value of the asset is not recoverable, the asset is written down to its fair value. 2021. Related-Party Transactions — The Company paid annual management fees to Getty Investments, LLC (“Getty Investments”) in the amount of $0.9 million who choose to work with the Company under contract typically receive royalties between 20% to 50% of the total license fee charged customers. The Company also owns the copyright to certain content in its collections (wholly owned content), including content produced by staff photographers for the Editorial Stills product, for which the Company does not pay any third-party royalties. Cost of revenue also includes costs of assignment photo shoots but excludes depreciation and amortization associated with creating or buying content. reviewed and adjusted based on management’s assessments of realizable deferred tax assets. The Company accounts for the global intangible low-tax income (“GILTI”) earned by foreign subsidiaries included in gross U.S. taxable income in the period incurred. See 15, 2024. In addition to the consideration paid at Closing, during a period to expire 10 years from the Closing Date (the “Earn-Out Period”), within 10 business days after the occurrence of an applicable triggering event, as described below, the Company was required to issue to former equity holders of Legacy Getty an aggregate of up to 59,000,000 shares of the Company’s Class A common stock (the “Earn-Out Shares”), upon the terms and subject to the conditions set forth in the Business Combination Agreement and the other agreements contemplated thereby. The Earn-Out Shares were issuable in three equal tranches if (i) the volume weighted average price of the shares of the Company’s Class A common stock over any 20 trading days within any 30 consecutive trading day period was greater than or equal to $12.50, $15.00 and $17.50, respectively, or (ii) if there was a change of control of the Company prior to the expiration of the Earn-Out Period that would result in the holders of shares of the Company’s Class A common stock receiving a price per share equal to or in excess of $12.50, $15.00 and $17.50, respectively. The Earn-Out Shares were accounted for as equity-classified equity instruments and recorded in additional paid-in capital as part of the Business Combination. The following table reconciles the elements of the Business Combination to the Consolidated Statement of Cash Flows and the Consolidated Statements of Redeemable Preferred Stock and Stockholders’ Equity (Deficit) for the year ended December 31, 2022 (in thousands): Cash – CCNB trust and cash, net of redemptions $ 4,164 Cash – PIPE Financing 360,000 Cash – Forward Purchase Agreement 200,000 Cash – Backstop Agreement 300,000 Less: Cash paid to redeem Redeemable Preferred Stock (614,996) Less: Transaction costs paid during the year ended December 31, 2022 (106,917) Net cash contributions from the Business Combination and related transactions $ 142,251 Add: Non-cash assets received from CCNB 806 Add: Transaction costs allocated to warrants 4,262 Add: Cash paid to redeem Redeemable Preferred Stock 614,996 Add: Tax effect of change in tax basis due to business combination 6,508 Less: Fair value of Public, Private Placement and Forward Purchase Warrants (72,374) Less: Transaction costs previously paid by Legacy Getty during 2021 or accrued at December 31, 2022 (1,989) Net Business Combination and related transactions, excluding Redeemable Preferred Stock redemption $ 694,460 Add: Fair value of Class A common stock issued to redeem Redeemable Preferred Stock 140,250 Net Business Combination and related transactions, including Redeemable Preferred Stock redemption $ 834,710 Common stock of CCNB, net of redemptions 508,311 CCNB shares held by the Sponsor 25,700,000 Shares issued in the PIPE Financing 36,000,000 Shares issued in the Forward Purchase Agreement 20,000,000 Shares issued in the Backstop Agreement 30,000,000 Total shares issued in Business Combination and related transactions 112,208,311 Shares issued for Getty Images common stock 196,938,915 Shares issued upon redemption of Getty Images Redeemable Preferred Stock 15,000,000 Total shares of common stock immediately following the Business Combination 324,147,226 To estimate the fair value of the Contingent Consideration, the Company used a variation of an income approach where revenue was simulated in a risk-neutral framework using Geometric Brownian Motion, which is a model of stock price behavior that is used in option pricing models such as the Black-Scholes option pricing model. The real options method extends this model to situations where the asset of interest (revenue in this case) is not priced in the market. The Company determined the acquisition-date fair value of the Contingent Consideration to be $13.2 million, based on the likelihood of paying cash related to the contingent earn-out clauses, as part of the consideration transferred. See “Note 7 — Fair Value of Financial Instruments” for subsequent measurements of these contingent liabilities. Cash $ 95,418 Contingent Consideration 13,200 Total fair value of consideration transferred $ 108,618 Fair Value at Assets acquired and liabilities assumed: Acquisition Date Cash and cash equivalents $ 6,213 Accounts receivable 1,061 Other current assets 736 Prepaid expenses 118 Property and equipment 1,729 Other long term assets 306 Identifiable intangible assets 23,900 Goodwill 75,782 Total assets acquired $ 109,845 Accounts payable and accrued expenses (128) Deferred income tax liability (1,099) Total liabilities assumed (1,227) Net assets acquired $ 108,618 Public Warrants — As part of CCNB’s initial public offering, 20,700,000 Public Warrants were sold. The Public Warrants entitled the holder thereof to purchase one share of Class A common stock at a price of $11.50 per share, subject to adjustments. The Public Warrants were only exercisable for a whole number of shares of Class A common stock. No fractional shares were to be issued upon exercise of the warrants. The Public Warrants were set to expire at 5:00 p.m. New York City time on July 22, 2027, or earlier upon redemption or liquidation. The Public Warrants were listed on the NYSE under the symbol “GETY.WS.” Foreign Currency Risk — Certain assets, liabilities and future operating transactions are exposed to foreign currency exchange rate risk. The Company has utilized derivative financial instruments, namely foreign currency forwards and option contracts, to reduce the impact of foreign currency exchange rate risks where natural hedges do not exist. The Company is exposed to market risk from foreign currency exchange rate fluctuations as a result of foreign currency-denominated revenues and expenses. The Company has entered into certain foreign currency derivative contracts, including foreign currency forward options to manage these risks. These contracts were economic hedges of the Company’s exposures but were not designated as hedges, as defined in the applicable accounting guidance, for financial reporting purposes. The notional amounts outstanding under these contracts as of December 31, 2021 was $15.2 million. These contracts were carried at fair value, as determined by quoted market exchange rates. At December 31, 2023 and 2022 the Company held no foreign currency contracts. The Company As of December 31, 2022 2021 Asset Liability Asset Liability Derivatives not designated as hedging instruments: Interest rate swaps $ 9,032 $ — $ — $ 13,759 Foreign currency exchange options — — 804 — Total derivatives $ 9,032 $ — $ 804 $ 13,759 Short-term derivative assets are included in As of December 31, 2022 Level 1 Level 2 Level 3 Total Money market funds (cash equivalents) $ 20,462 $ — $ — $ 20,462 Derivative assets: Interest rate swaps — 9,032 — 9,032 $ 20,462 $ 9,032 $ — $ 29,494 As of December 31, 2021 Level 1 Level 2 Level 3 Total Money market funds (cash equivalents) $ 30,096 $ — $ — $ 30,096 Derivative assets: Foreign currency exchange options — 804 — 804 $ 30,096 $ 804 $ — $ 30,900 As of December 31, 2022 Level 1 Level 2 Level 3 Total Term Loans $ — $ 1,112,990 $ — $ 1,112,990 Senior Notes — 297,354 — 297,354 $ — $ 1,410,344 $ — $ 1,410,344 As of December 31, 2021 Level 1 Level 2 Level 3 Total Term Loans $ — $ 1,475,759 $ — $ 1,475,759 Senior Notes — 318,375 — 318,375 Contingent Consideration — — 14,039 14,039 Derivative liabilities: Interest Rate Swap Contracts — 13,759 — 13,759 $ — $ 1,807,893 $ 14,039 $ 1,821,932 The fair value of the Company’s Term Loans and Senior Notes are based on market quotes provided by a third-party pricing source. See “Note 12 — Debt” for additional disclosures on the Term Loans and Senior Notes. the Company classified the financial liability as Level 3. The fair value of the Contingent Consideration may change significantly as additional data is obtained, impacting the Company’s assumptions regarding probabilities of outcomes used to estimate the fair value of the liabilities. In evaluating this information, considerable judgment is required to interpret the data used to develop the assumptions and estimates. The estimates of fair value may not be indicative of the amounts that could be realized in a current market exchange. Accordingly, the use of different market assumptions and/or different valuation techniques may have a material effect on the estimated fair value amounts, and such changes could materially impact the Company’s results of operations in future periods. Fair Value as of Contingent Consideration Probability-adjusted discounted cash flow Probabilities of success — % Years until milestone is expected to be achieved 0.33 years Discount rate Year end December 31, 2022 2021 Balance, beginning of period $ 14,039 $ — Issuance of Contingent Consideration in connection with acquisition — 13,200 Payment (10,000) — Change in fair value of Contingent Consideration (4,039) 839 Balance, end of period $ — $ 14,039 Public, Private Placement and Forward Purchase Warrants — When outstanding, the Public Warrants were classified within Level 1 as they were publicly traded and had an observable market price in an active market. The Forward Purchase Warrants, which had identical terms as the Public Warrants, were valued similar to the Public Warrants and were classified within Level 2. The following table presents the change in the fair value of the Private Placement Warrants for the year ended December 31, 2022 (in thousands): Year end December 31, Balance, beginning of period Assumed in Business Combination (Note 3) Change in fair value Exercise Balance, end of period Estimated Useful Lives December 31, (in Years) 2022 2021 Contemporary imagery 5 $ 377,858 $ 379,837 Computer hardware purchased 3 6,783 5,639 Computer software developed for internal use 3 119,516 114,434 Leasehold improvements 2–20 8,361 11,459 Furniture, fixtures and studio equipment 5 10,856 15,167 Archival imagery 40 94,043 97,547 Other 3–4 2,352 2,439 Property and equipment 619,769 626,522 Less: accumulated depreciation (447,686) (455,626) Property and equipment, net $ 172,083 $ 170,896 Goodwill was tested for impairment as million for both years. Goodwill Accumulated before impairment impairment charge Goodwill – net December 31, 2020 $ 1,955,837 $ (525,000) $ 1,430,837 Effects of fluctuations in foreign currency exchange rates (3,374) — (3,374) Goodwill related to acquisition 75,782 — 75,782 December 31, 2021 $ 2,028,245 $ (525,000) $ 1,503,245 Effects of fluctuations in foreign currency exchange rates (3,667) — (3,667) December 31, 2022 $ 2,024,578 $ (525,000) $ 1,499,578 Identifiable intangible assets consisted of the following at December 31 (in thousands, except years): As of December 31, 2022 2022 2021 Range of Estimated Useful Lives Gross Accumulated Net Gross Accumulated Net (Years) Amount Amortization Amount Amount Amortization Amount Trade name Indefinite $ 389,484 $ — $ 389,484 $ 402,581 $ — $ 402,581 Trademarks and trade names 5–10 104,053 (104,026) 27 104,174 (96,041) 8,133 Patented and unpatented technology 3–10 109,275 (103,419) 5,856 112,288 (97,818) 14,470 Customer lists, contracts, and relationships 5–11 391,454 (367,273) 24,181 404,421 (350,997) 53,424 Non-compete Covenant 3 900 (900) — 900 (811) 89 Other identifiable intangible assets 3–13 5,059 (5,059) — 7,110 (6,955) 155 $ 1,000,225 $ (580,677) $ 419,548 $ 1,031,474 $ (552,622) $ 478,852 Fiscal Years Ended December 31, 2023 $ 23,892 2024 $ 2,092 2025 $ 2,083 2026 $ 729 2027 $ 279 Year end December 31, 2022 2021 Long term note receivable from a related party (Note 2) $ 24,000 $ 24,000 Minority and other investments 12,097 10,621 Derivative asset (Note 7) 9,032 — Tax receivable (Note 13) 2,700 3,300 Equity method investment 2,064 1,207 Long term deposits 1,609 1,754 Other 450 210 $ 51,952 $ 41,092 Accrued Expenses — Accrued expenses at the reported Balance Sheet dates are summarized below (in thousands): Year end December 31, 2022 2021 Accrued compensation and related costs $ 23,851 $ 38,232 Lease liabilities 10,094 — Interest payable 9,993 9,750 Accrued professional fees 4,334 5,198 Accrued contingent consideration — 9,456 Accrued restructuring — 1,033 Derivative liabilities — 686 Other 1,055 2,214 $ 49,327 $ 66,569 Year end December 31, 2022 2021 Deferred revenue (net of current portion) $ 3,167 $ 3,387 Derivative liabilities (net of current portion) — 13,073 Accrued Contingent Consideration (net of current portion) — 4,583 Deferred rent (net of current portion) — 3,370 Accrued restructuring (net of current portion) — 1,441 Other — 1,107 $ 3,167 $ 26,961 Year end December 31, 2022 2021 Senior Notes $ 300,000 $ 300,000 USD Term Loans 687,400 997,800 EUR Term Loans 446,996 473,798 Less: issuance costs and discounts amortized to interest expense (5,549) (14,127) Less: short-term debt – net — (6,481) Long-term debt – net $ 1,428,847 $ 1,750,990 the Consolidated Statements of Operations related to this payment. The loss on extinguishment of debt represents the acceleration of amortization of issuance costs and debt discount related to the $300.0 million payment. Under the terms of the Credit Facility, the prepayment of $300.0 million was applied against the quarterly installments of $2.6 million. Accordingly, the remaining balance on the USD Term Loans is due at maturity. The Company leases real estate under operating lease agreements that expire on various dates and does not anticipate any difficulties in renewing those leases that expire within the next several years or in leasing other space or hosting facilities, if required. The Company enters into unconditional purchase obligations related to contracts for cloud-based services, infrastructure and other business services as well as minimum royalty guarantees in connection with certain content licenses. The future minimum payments under debt obligations, non-cancelable operating leases and other purchase obligations are as follows as of December 31, Years ended December 31, 2023 2024 2025 2026 2027 Thereafter Total USD Term Loans and EUR Term loans: Principal payments $ — $ — $ — $ 1,134,396 $ — $ — $ 1,134,396 Interest payments1 102,271 98,269 89,838 12,303 — — 302,681 Senior Notes: Principal payments — — — — 300,000 — 300,000 Interest payments 29,250 29,250 29,250 29,250 14,625 — 131,625 Revolver commitment fee 404 69 — — — — 473 Operating lease payments on facilities leases 13,592 12,221 11,824 6,951 6,019 20,599 71,206 Minimum royalty guarantee payments to content suppliers 39,607 37,515 36,117 18,932 9,038 17,044 158,253 Technology purchase commitments 4,826 2,817 2,045 27 — — 9,715 Other commitments 2,796 244 255 — — — 3,295 Total commitments $ 192,746 $ 180,385 $ 169,329 $ 1,201,859 $ 329,682 $ 37,643 $ 2,111,644 1 These are estimated payments based on interest rate curves valued as of December 31, 2022. 2022. partners Year Ended December 31, 2022 2021 2020 Creative Stills $ 585,400 $ 596,917 $ 532,732 Editorial Stills 325,770 306,631 266,699 Other 15,074 15,140 15,970 Total Revenue $ 926,244 $ 918,688 $ 815,401 15. REDEEMABLE PREFERRED STOCK Common Stock — Upon the closing of the Business Combination, the Company’s certificate of incorporation was amended and restated to, among other things, increase the total number of authorized shares of all classes of capital stock to 2,006,140,000 shares, $0.0001 par value per share, of which, 2,000,000,000 shares are designated as Class A common stock, 5,140,000 shares are designated as Class B common stock, and 1,000,000 shares are designated as preferred stock. 2023 and 2022, respectively. 2023. Weighted Remaining Number Average Average of Exercise Contractual awards Price Life (in Years) Outstanding — December 31, 2021 (1) 26,271 $ 3.98 5.87 Retroactive application of recapitalization 7,331 $ (0.87) — Outstanding — December 31, 2021, after effect of recapitalization (Note 3) 33,602 $ 3.11 5.87 Granted 978 6.18 Exercised (2,959) 4.36 Pre-vesting forfeitures (1,659) 3.32 Post-vesting cancellations (27) 2.77 Outstanding - December 31, 2022 29,935 3.08 5.85 Exercisable - December 31, 2022 26,412 $ 3.01 5.62 Vested and expected to vest after December 31, 2022 29,863 $ 3.08 5.85 December 31, 2022 2021 Stock options outstanding $ 75,888 $ 12,794 Stock options exercisable $ 68,431 $ 9,254 Stock options vested and expected to vest $ 75,704 $ 12,641 The weighted-average grant-date fair value of stock options, the valuation model used to estimate the fair value, and the assumptions Year Ended December 31, 2022 2021 2020 Weighted average grant date fair value per award $ 3.17 $ 1.19 $ 1.22 Valuation model used Black-Scholes Black-Scholes Black-Scholes Expected award price volatility 50 % 35 % 50 % Risk-free rate of return 4.15 % 1.15 % 1.08 % Expected life of awards 5.7 years 6.1 years 6.1 years Expected rate of dividends None None None Number of Weighted Average awards Grant-Date Fair Value Outstanding — December 31, 2021 — Granted 4,368 $ 5.58 Vested — Cancelled (1) $ 5.60 Outstanding - December 31, 2022 4,367 $ 5.58 — The following table presents a summary of PSU activity (in thousands except weighted average data): The Company’s leases relate primarily to office facilities that expire on various dates from As of December 31, 2022 Right of use asset $ 47,231 Lease liabilities, current 10,094 Lease liabilities, non-current 46,218 Total lease liabilities $ 56,312 Weighted average remaining lease term 6.3 years Weighted average discount rate 5.6 % Cash paid for amounts included in lease liabilities $ 14,150 Right of use asset obtained in exchange for lease obligation upon adoption $ 53,076 Right of use asset obtained in exchange for lease obligations $ 6,050 Year ended December 31, 2023 $ 12,978 2024 12,244 2025 11,988 2026 6,592 2027 5,456 Thereafter 18,659 Total undiscounted lease payments 67,917 Less: imputed interest (11,605) Total lease liabilities $ 56,312 Due to hybrid working arrangements, the Company The components of (loss) income Year Ended December 31, 2022 2021 2020 United States $ (95,489) $ 104,984 $ (27,823) Foreign 61,972 31,142 (36) Income (loss) before income taxes $ (33,517) $ 136,126 $ (27,859) Year Ended December 31, 2022 2021 2020 Current: United States $ 20,652 $ 22,321 $ 8,854 Foreign 9,487 (7,756) 12,095 Total current income tax expense (benefit) 30,139 14,565 20,949 Deferred: United States 13,356 4,698 (13,227) Foreign 631 (534) 1,794 Total deferred income tax expense (benefit) 13,987 4,164 (11,433) Total provision for income tax expense $ 44,126 $ 18,729 $ 9,516 Year Ended December 31, 2022 2021 2020 Federal income tax expense (benefit) at the statutory rate $ (7,039) $ 28,586 $ (5,849) Effect of: State taxes, net of federal benefit (3,092) 3,632 643 Tax impact of foreign earnings and losses 11,453 (10,171) 3,644 Stock-based compensation 2,230 236 169 Nondeductible net loss on fair value adjustment for warrant liabilities 34,659 — — Valuation allowance 12,223 1,532 13,763 Tax credits (6,852) (5,030) (3,213) Other, net 544 (56) 359 Income tax expense (benefit) $ 44,126 $ 18,729 $ 9,516 A reconciliation of the beginning and ending amounts of unrecognized tax benefits is as follows (in thousands): Year Ended December 31, 2022 2021 2020 Uncertain tax benefits, beginning of year $ 33,425 $ 47,637 $ 45,003 Gross increase to tax positions related to prior years 31 121 1,239 Gross decrease to tax positions related to prior years (1,109) (413) (42) Gross increase to tax positions related to the current year 675 2,204 2,082 Gross decrease to tax positions related to the current year — — — Settlements — — — Lapse of statute of limitations (4,055) (16,124) (645) Uncertain tax benefits, end of year $ 28,967 $ 33,425 $ 47,637 Deferred tax assets, liabilities and valuation allowance are as follows (in thousands): December 31, 2022 2021 Deferred tax assets Income tax attributes $ 225,831 $ 204,531 Accrued liabilities and reserves 7,109 8,796 Operating lease liabilities 10,969 11,667 Prepaid expenses — 6,483 Stock-based compensation expense 6,736 9,308 Other 1,656 1,150 Gross deferred tax assets 252,301 241,935 Less valuation allowance (216,745) (205,877) Total deferred tax assets 35,556 36,058 Deferred tax liabilities Amortization and depreciation (43,556) (39,167) Operating lease assets (9,139) (10,512) Prepaid expenses (1,569) — Other (10,095) (2,081) Net deferred tax liabilities, net of valuation allowance $ (28,803) $ (15,702) Deferred Net Operating Tax Loss Assets Carryforwards United States, expiring between 2024 and 2040 $ 10,676 $ 152,048 Foreign, expiring between 2022 and 2042 25,288 104,343 Foreign, indefinite 54,944 416,776 Total $ 90,908 $ 673,167 Tax Credits United States, federal tax credit carryforwards: Foreign tax credits, expiring between 2022 and 2032 $ 42,540 Total $ 42,540 Leased Employee Property Termination Losses Costs Total Balance — December 31, 2019 $ 2,958 $ 7,857 $ 10,815 Reduction of accrual due to net cash payments (715) (13,315) (14,030) Additional charges and adjustments 319 8,816 9,135 Accretion expense 259 — 259 Effects of fluctuations in foreign currency exchange rates 45 473 518 Balance — December 31, 2020 2,866 3,831 6,697 Reduction of accrual due to net cash payments (901) (2,946) (3,847) Additional charges and adjustments 131 (606) (475) Accretion expense 225 — 225 Effects of fluctuations in foreign currency exchange rates (46) (80) (126) Balance — December 31, 2021 2,275 199 2,474 Reduction of accrual due to net cash payments — (164) (164) Additional charges and adjustments — (33) (33) Effect of accounting change- adoption of ASC 842 (Note 2) (2,275) — (2,275) Effects of fluctuations in foreign currency exchange rates — (2) (2) Balance — December 31, 2022 $ — $ — $ — As of December 31, 2023, 2022 December 31, 2022 2021 2020 Americas $ 525,775 $ 496,607 $ 457,327 Europe, the Middle East, and Africa 293,673 317,435 270,701 Asia-Pacific 106,796 104,646 87,373 Total Revenues $ 926,244 $ 918,688 $ 815,401 Included in Americas is the United States, which comprises The Company’s long-lived tangible assets were located as follows (in thousands): December 31, 2022 2021 Americas $ 87,819 $ 85,213 Europe, the Middle East, and Africa 83,928 85,307 Asia-Pacific 336 376 Total long-lived tangible assets $ 172,083 $ 170,896 Year end December 31, 2022 2021 2020 NET (LOSS) INCOME $ (77,643) 117,397 (37,375) Less: Net (loss) income attributable to noncontrolling interest (89) 329 (182) Premium on early redemption of Redeemable Preferred Stock 26,678 — — Redeemable Preferred Stock dividend 43,218 71,393 64,120 NET (LOSS) INCOME ATTRIBUTABLE TO GETTY IMAGES HOLDINGS, INC. - Basic $ (147,450) $ 45,675 $ (101,313) Weighted-average Class A common stock outstanding: Basic 276,942,660 196,084,650 196,082,503 Effect of dilutive securities — 5,422,705 — Diluted 276,942,660 201,507,355 196,082,503 Net (loss) income per share of Class A common stock attributable to Getty Images Holdings, Inc. common stockholders: Basic $ (0.53) $ 0.23 $ (0.52) Diluted $ (0.53) $ 0.23 $ (0.52) December 31, 2022 2021 2020 Common stock options 29,934,987 13,826,565 34,484,353 Restricted stock units 4,367,413 — — 34,302,400 13,826,565 34,484,3531The Company launched Unsplash+ during the three months ended December 31, 2022. This new Unsplash subscription will now beis included within these KPIs from the launch date forward. The impact is not yet material.2Excludes downloads from Editorial Subscriptions, Editorial feeds and certain API structured deals, including bulk unlimited deals. Excludes downloads starting in Q3’22 tied to a two-year deal signed with Amazon in July 2022, as the magnitude of the potential download volume over the deal term could result in significant fluctuations in this metric without corresponding impact to revenue in the same period.3The underlying calculation of this metric was changed versus previously reported metrics. This change was made to exclude the impact of downloader activity from our free trial subscriptions, which are skewed entirely to stills-only content.Total purchasing customers is the count of total customers who made a purchase within the reporting period based on billed revenue. This metric provides management and investors with an understanding of both how we are growing our purchasing customer base and combined with revenue, an understanding of our average revenue per purchasing customer. This metric differs from total customers, which is a count of all downloading customers, irrespective of whether they made a purchase in the period. The increaseThis decrease is tied to both our continued shift into subscription products and continued contraction in total purchasingour agency customers reflects growth in new customers, consistencywho consume nearly entirely on an a la carte or transactional basis.50Total active annual subscribers is the count of customers who were on an annual subscription product during the LTM reporting period. This metric provides management and investors with visibility into the rate at which we are growing our annual subscriber base and is highly correlated to the percentage of our revenue that comes from annual subscription products. Growth in annual subscribers reflects the Company’s deliberate focus on expanding its subscription offerings for customers to provide comprehensive content solutions across all price points. The increase of approximately 83% over the corresponding period in 2022 was driven primarily by our e-commerce subscriptions, including our iStock and Unsplash+ subscriptions. Absent the reporting changes noted above, LTM total active annual subscribers under legacy reporting would have been 212 thousand and 116 thousand up 56% fromfor December 31, 2023 and December 31, 2022, to December 31, 2021.Paid download volume is a count of the number of paid downloads by our customers in the reported period. This metric informs both management and investors about the volumes at which customers are engaging with our content over time. Growth in paid download volumes is a signal that our content is continuing to meet the evolving needs of our customers. Paid download volume increasedwas flat in the LTM ended December 31, 2022,2023, as compared to the LTM ended December 31, 20212022, but up compared to the LTM ended December 31, 2021. The steady demand in paid download volumes during a year with a myriad of macro-economic challenges, is a strong outcome and 2020.Annual subscriber revenue retention rate calculates retention of total revenue for customers on annual subscription products, comparing the customer’s total booked revenue (inclusive of spend for both annual subscription and non-annual subscription products) in the LTM period to the prior twelve month period. For example, LTM annual subscriber booked revenue (the amount of revenue invoiced to customers) for the period ended December 31, 20222023 was 100.1%92.4% of revenue from these customers in the period ended December 31, 2021.2022. Revenue retention rate informs management and investors on the degree to which we are maintaining or growing revenue from our annual subscriber base. As we continue to focus on growing subscriptions as percentage of total revenue, revenue retention for these customers is a key driver of the predictability of our financial model with respect to revenue. LTM annual subscriber revenue retention rate decreased for the period ended December 31, 2022,2023, as compared to the period ended December 31, 2021. This decrease2022. The decline was largely due to the LTM ending December 31, 2021 benefiting from the COVID impacted LTM ending December 31, 2020.primarily driven by lower revenue retention rates on some of our smaller e-commerce subscription customers. Absent the reporting changes noted above, LTM annual subscriber retention rate under legacy reporting would have been 90.7% and 99.2%.Image and Video collection is a count of the total images and videos in our content library as of the reporting date. Management and investors can view growth in the size, both depth and breadth, of the content library as an indication of our ability to continue to expand our content offering with premium, high quality, contemporary content to meet the evolving needs of our customers. Image and video collections increased during the period ending December 31, 20222023 as compared to the periodperiods ending December 31, 20212022 and 2020.2021.4820212022 and 20202021 to the period ending December 31, 20222023 reflects the increase inincreased customer awareness of our video demand from our customers.Executive summaryRevenueWe generate revenue by licensing content to customers through multiple license models and purchase options, as well as by providing related services to our customers. The key image licensing model in the pre-shot market is RF. Content licensed on a RF basis is subject to a standard set of terms, allowing the customer to use the image for an unlimited duration and without limitation on the use or application. Within our video offering, we also offer a licensing model known as Rights-Ready. The Rights-Ready model offers a limited selection of broader usage categories, thus simplifying the purchase process.51In addition to licensing imagery and video, we also generate revenue from custom content solutions, photo and video assignments, music content in some of our subscriptions, print sales, data licensing and licensing our digital asset management systems to help customers manage their owned and licensed digital content.References to “reported revenue” in this discussion and analysis are to our revenue as reported in our historical audited consolidated financial statements for the relevant periods and reflect the effect of changes in foreign currency exchange rates. References to “currency neutral” (“Currency Neutral” or “CN”) revenue growth (expressed as a percentage) in this section refer to our revenue growth (expressed as a percentage), excluding the effect of changes in foreign currency exchange rates. See “— Non-GAAP Financial Measures” for additional information regarding Currency Neutral revenue growth (expressed as a percentage).Cost of revenue (exclusive of depreciation and amortization shown separately below)The ownership rights to the majority of the content we license are retained by the owners, and licensing rights are provided to us by a large network of content contributors and content partners. When we license content entrusted to us by content suppliers, we pay royalties to them at varying rates depending on the license model and the use of that content that our customers select. Suppliers who choose to work with us under contract typically receive royalties of 20% to 50% of the total license fee we charge customers, depending on the basis on which their content is licensed by our customers. Contributors will be compensated on an annual recurring basis for any inclusion of their content in AI data training sets and, in certain cases, share in the revenue generated by AI tools and services trained with their content. We also own the copyright to certain content in our collections (wholly-owned content), including content produced by our staff photographers for our editorial product, for which we do not pay any third-party royalties. Cost of revenue includes certain costs of our assignment photo shoots, but excludes amortization associated with creating or buying content. Cost of revenue consists primarily of royalties owed to content contributors, comprised of photographers, filmmakers, third-party companies that license their collection of content through us (“ImageContent Partners”) and third party music content providers. We expect our cost of revenue as a percentage of revenue to vary modestly based on changes in revenue mix by product, as royalty rates vary depending on license model and use of content.Selling, general and administrative expensesSelling, general and administrative expenses (“SG&A”) primarily consists of staff costs, marketing expense, occupancy costs, professional fees and other general operating charges. We expect our selling, general and administrative expenses to increase in absolute dollars but remain relatively constant as a percentage of revenue in the near term. Absolute dollar spending will increase as we continue to expand our operations and hire additional personnel to invest in our growth, in addition to incurring incremental expenses to comply with the additional requirements of being a public company.growth. Lastly, we expect our marketing to increase in absolute dollars but to stay relatively constant as a percentage of revenue. However, the Company will continue to evaluate opportunities to incrementally invest in marketing as may be appropriate.DepreciationDepreciation expense consists of internally developed software, content and equipment depreciation. We record property and equipment at cost and reflect Balance Sheet balances net of accumulated depreciation. We record depreciation expense on a straight-line basis. We depreciate leasehold improvements over the shorter of the respective lives of the leases or the useful lives of the improvements.49AmortizationAmortization expense consists of the amortization of intangible assets related to acquired customer relationships, trademarks and other intangible assets. The majority of our intangible assets have been fully amortized as of December 31, 2023. We expect amortization expense to decreasebe insignificant in the coming years as some of our intangibles become fully amortized.Factors affecting results of operationsA shift in the product mix of our revenue may affect our overall cost of revenue as a percentage of revenue. Our revenues and profitability are also subject to fluctuations in foreign exchange rates. The weakening or strengthening of our reporting52currency, the U.S. dollar, during any given period as compared to currencies that we collect revenues in, most notably, the Euro and British pound, impacts our reported revenues.Our future financial condition and results of operation will also be dependent upon various factors that generally affect the digital content industry, including the general trends affecting the media, marketing and advertising customer bases that we target, protection of intellectual property, and new and expanding technology such as generative artificial intelligence technologies. In addition, our financial condition and results of operation will continue to be affected by factors that affect internet commerce companies and by general macroeconomic factors such as the global uncertainty caused by, among other things, any lingering effects of the Hollywood actors and writers strike and COVID-19 pandemic, the military conflictconflicts between Russia and Ukraine and in the Middle East, high interest rates, currency fluctuations, high inflation and labor shortages.Results of OperationsComparison of the Years Ended December 31, 20222023 and 2021Consolidated statements of operations (In thousands) Years Ended
December 31,increase (decrease) 2023 2022 $ change % change REVENUE $ 916,555 $ 926,244 $ (9,689) (1.0) % OPERATING EXPENSE: Cost of revenue (exclusive of depreciation and amortization shown separately below) 250,249 254,990 (4,741) (1.9) % Selling, general and administrative expenses 402,516 375,582 26,934 7.2 % Depreciation 54,374 49,574 4,800 9.7 % Amortization 24,069 43,645 (19,576) (44.9) % Loss on litigation 116,051 1,101 114,950 NM Recovery of loss on litigation (60,000) — (60,000) NM Other operating expense (income) – net 1,624 (681) 2,305 NM Operating expense 788,883 724,211 64,672 8.9 % INCOME FROM OPERATIONS 127,672 202,033 (74,361) (36.8) % OTHER EXPENSE, NET: Interest expense (126,884) (117,229) (9,655) 8.2 % (Loss) gain on fair value adjustment for swaps and foreign currency exchange contract – net (7,573) 23,508 (31,081) NM Unrealized foreign exchange (losses) gain – net (23,772) 24,643 (48,415) NM Loss on extinguishment of debt — (2,693) 2,693 NM Net loss on fair value adjustment for warrant liabilities — (160,728) 160,728 NM Other non-operating income (expense) – net 3,652 (3,051) 6,703 NM Total other expense – net (154,577) (235,550) 80,973 (34.4) % LOSS BEFORE INCOME TAXES (26,905) (33,517) 6,612 (19.7) % INCOME TAX BENEFIT (EXPENSE) 46,482 (44,126) 90,608 NM NET INCOME (LOSS) $ 19,577 $ (77,643) $ 97,220 NM ____________________NM - Not meaningful5053The following table presents our results of operations for the periods indicated:Revenue by product (In thousands) Years Ended
December 31,increase / (decrease) 2023 % of revenue 2022 % of revenue $ change % change CN % change Creative 578,727 63.1 % 585,398 63.2 % (6,671) (1.1) % (0.6) % Editorial 320,643 35.0 % 325,779 35.2 % (5,136) (1.6) % (1.2) % Other 17,185 1.9 % 15,067 1.6 % 2,118 14.1 % 14.9 % Total revenue $ 916,555 100.0 % $ 926,244 100.0 % $ (9,689) (1.0) % (0.5) % Certain prior year amounts have been reclassified to conform to the current year presentation. Consolidated Revenue. For the year ended December 31, 2023, reported revenue was $916.6 million as compared to reported revenue of $926.2 million for the year ended December 31, 2022. On a reported basis for the year ended December 31, 2023, revenue decreased by 1.0% (0.5% CN) year over year. Foreign exchange movements negatively impacted reported revenue growth for the year ended December 31, 2023 by 50 basis points, largely driven by the strengthening dollar relative to the EUR and GBP. Additionally, starting in Q2 2023, the Hollywood actors and writers strikes negatively impacted both our Creative and Editorial product lines.Creative. In Creative, revenue decreased on a reported basis 1.1% (0.6% CN) for the year ended December 31, 2023. At the product level, decreases for the year included Getty Images Stills and Video (decreased $23.8 million) and iStock monthly subscriptions and ALC credit sales (decreased $11.3 million), which was in part due to our continued focus on driving customers to our committed solutions. Offsetting increases were led by our iStock annual subscriptions (increased $12.1 million) and Getty Images annual subscriptions (increased $17.2 million). Without the declines of our agency business, which sits entirely in Creative, the Creative business is growing.Editorial. In Editorial, revenue decreased on a reported basis 1.6% (1.2% CN) for the year ended December 31, 2023. The decrease was driven by editorial ALC (decreased $9.8 million), which is partially due to our continued focus on driving customers to our committed solutions. Also, comparative results were impacted by the US political midterm elections, Men’s World Cup and Winter Olympics all occurring in the prior year. Offsetting increases were seen across both assignments (increased by $3.4 million) and editorial subscriptions (increased $1.3 million).Other. This category includes music licensing, digital asset management and distribution services, print sales, and data licensing revenues. Revenue for the year ended December 31, 2023 from our Other products increased on a reported basis by 14.1% (14.9% CN). The increase was driven by music licensing (increase of $1.2 million), digital asset management and distribution services (increase of $0.9 million) and data licensing (increase of $0.7 million), partially offset by print sales (decreased by $0.8 million).Cost of revenue (exclusive of depreciation and amortization). Cost of revenue for the year ended December 31, 2023 was $250.2 million (27.3% of revenue) compared to $255.0 million (27.5% of revenue) in the prior year. The decrease in cost of revenue as a percentage of revenue compared to the prior year was due primarily to revenue mix by product. Generally, cost of revenue rates vary modestly period over period based on changes in revenue mix by product, as royalty rates vary depending on the license model and use of content.Selling, general and administrative expense. Reported SG&A expense increased by $26.9 million or 7.2% (7.5% CN) for the year ended December 31, 2023 as compared to the year ended December 31, 2022. SG&A fluctuations from the prior period include the following:•increase of $31.2 million related to staff costs for the year ended December 31, 2023. The increase was largely driven by equity-based compensation (increased $28.4 million), resulting primarily from grants of restricted stock units.•increase in professional fees of $5.7 million for the year ended December 31, 2023. The increase was primarily related to legal fees associated with ongoing litigation related to our intellectual property rights. Beginning in the third quarter of 2023, the Company reclassified historical legal fees associated with our warrant litigation from “Selling, general and administrative expenses” to “Loss on litigation” within the Condensed Consolidated Statements of Operations. As a result, for the six months ended June 30, 2023, $6.4 million has been reclassified to Loss on litigation and for the year ended December 31, 2022, $1.1 million has been reclassified to Loss on litigation.54•decrease in marketing spend of 13.1% ($7.3 million) for the year ended December 31, 2023. For the year ended December 31, 2023, marketing spend as a percentage of sales decreased to 5.3% from the year ended December 31, 2022 ratio of 6.0%. The decrease was due primarily to decreased investment in digital marketing.•decrease of $2.0 million related to occupancy costs (primarily rent expense), as we continue to evaluate our office space needs now and into the future.Depreciation expense. For the year ended December 31, 2023, depreciation expense was $54.4 million which was in line with the prior year.Amortization expense. For the year ended December 31, 2023, amortization expense was $24.1 million which was a decrease of $19.6 million compared to the prior year. The decrease was due to several of our intangible assets becoming fully amortized in the fourth quarter of 2022.Loss on litigation. For the year ended December 31, 2023, the Company’s loss on litigation of $116.1 million was comprised of the summary judgment amounts related to two lawsuits filed by former public warrant holders, in addition to pre and post judgment interest and associated legal fees and other direct costs through December 31, 2023. Loss on Litigation will increase in the future to the extent we continue to incur costs associated with this litigation.Recovery of loss on litigation. The Company has recognized recovery of loss on litigation of $60.0 million, which represents the limit of the Company’s third-party insurance coverage related to the lawsuits filed by former public warrant holders.Other operating (income) expense - net. For the year ended December 31, 2023, the increase in other operating expense, net from the prior year was $2.3 million. This increase in net expense was due to the prior year change in fair value of the Contingent Consideration related to our Unsplash acquisition. For further details, see “Note 7— Fair Value of Financial Instruments” in our consolidated financial statements included elsewhere in this Annual Report. Additionally, the prior year income from the change in fair value of Contingent Consideration was partially offset by expenses associated with the abandonment of some of our office space in North America as we continue to evaluate our global office space needs. We recognized insignificant amounts of other operating expense, net for the year ended December 31, 2023.Interest expense. We recognized interest expense of $126.9 million and $117.2 million for the year ended December 31, 2023 and December 31, 2022, respectively. Our interest expense primarily consists of interest charges on our outstanding U.S. dollar and Euro term loans (the “Term Loans”), $300.0 million of Senior Unsecured Notes (the “Senior Notes”), and our revolving credit facility as well as the amortization of original issue discount on our Term Loans and amortization of deferred debt financing fees. The increase in interest expense was due to the rise in interest rates in 2023 as compared to 2022. The increase was partially offset by the Company voluntarily prepaying a total of $50.4 million of outstanding indebtedness in 2023.Fair value adjustment for swaps and foreign currency exchange contract - net. We recognized fair value adjustment loss for our swaps and foreign currency exchange contracts, net of $7.6 million for the year ended December 31, 2023, compared with net gains of $23.5 million for the year ended December 31, 2022. Gains and losses are driven by changes in interest and foreign exchange rates, relative to the rates in our derivatives.Unrealized foreign exchange gains - net. We recognized foreign exchange losses, net of $23.8 million for the year ended December 31, 2023, compared with gains of $24.6 million for the year ended December 31, 2022. These changes are primarily driven by fluctuations in the EUR related to our EUR Term Loans.Loss on extinguishment of debt. For the year ended December 31, 2022, the Company utilized proceeds from the Business Combination along with cash on hand to repay $300.0 million of outstanding indebtedness on its USD Term Loans. The loss on debt extinguishment represents the acceleration of the issuance costs and debt discount. There were no such costs in the current year.Net loss on fair value adjustment of warrant liabilities. For the year ended December 31, 2022, there was a loss on fair value of our warrant liability of $160.7 million. There was no such warrant liability in the current year.Other non-operating income (expense) - net. We recognized other non-operating income, net of $3.7 million and expense of $3.1 million for the year ended December 31, 2023 and December 31, 2022, respectively. For the year ended December 31, 2023, the income primarily related to interest income from our cash and cash equivalents. For the year ended55December 31, 2022, the expense relates to the transaction costs that were allocated to the fair value of the warrant liability, which were expensed upon the Closing of the Business Combination.Income tax expense. The Company’s income tax expense decreased by $90.6 million to a benefit of ($46.5) million for the year ended December 31, 2023, as compared to an expense of $44.1 million for the year ended December 31, 2022. The Company’s effective income tax rate for the year ended December 31, 2023 is 172.8%, compared to (131.7%) for the year ended December 31, 2022. The decrease in tax expense compared to the prior year is primarily due to the release of the Ireland valuation allowance and a release of uncertain tax position reserves in current year.Comparison of the Year Ended December 31, 2022 and December 31, 2021Consolidated statements of operations (In thousands) Years Ended
December 31,increase (decrease) 2022 2021 $ change % change REVENUE $ 926,244 $ 918,688 $ 7,556 0.8 % OPERATING EXPENSE: Cost of revenue (exclusive of depreciation and amortization shown separately below) 254,990 248,152 6,838 2.8 % Selling, general and administrative expenses 375,582 367,704 7,878 2.1 % Depreciation 49,574 51,099 (1,525) (3.0) % Amortization 43,645 49,361 (5,716) (11.6) % Loss on litigation 1,101 — 1,101 NM Other operating expense (income) – net (681) 386 (1,067) NM Operating expense 724,211 716,702 7,509 1.0 % INCOME FROM OPERATIONS 202,033 201,986 47 — OTHER EXPENSE, NET: Interest expense (117,229) (122,160) 4,931 (4.0) % (Loss) gain on fair value adjustment for swaps and foreign currency exchange contract – net 23,508 19,282 4,226 21.9 % Unrealized foreign exchange (losses) gain – net 24,643 36,406 (11,763) (32.3) % Loss on extinguishment of debt (2,693) — (2,693) NM Net loss on fair value adjustment for warrant liabilities (160,728) — (160,728) NM Other non-operating income (expense) – net (3,051) 612 (3,663) NM Total other expense – net (235,550) (65,860) (169,690) 257.7 % (LOSS) INCOME BEFORE INCOME TAXES (33,517) 136,126 (169,643) NM INCOME TAX BENEFIT (EXPENSE) (44,126) (18,729) (25,397) 135.6 % NET INCOME (LOSS) $ (77,643) $ 117,397 $ (195,040) NM ____________________NM - Not meaningful56Revenue by product (In thousands) Year ended
December 31,increase / (decrease) 2022 % of revenue 2021 % of revenue $ change % change CN % change Creative 585,398 63.2 % 596,913 65.0 % (11,515) (1.9) % 2.7 % Editorial 325,779 35.2 % 306,635 33.4 % 19,144 6.2 % 11.5 % Other 15,067 1.6 % 15,140 1.6 % (73) (0.5) % 4.1 % Total revenue $ 926,244 100.0 % $ 918,688 100.0 % $ 7,556 0.8 % 5.7 % Certain prior year amounts have been reclassified to conform to the current year presentation. Consolidated Revenue. For the year ended December 31, 2022, reported revenue was $926.2 million as compared to reported revenue of $918.7 million for the year ended December 31, 2021. On a reported basis for the year ended December 31, 2022 revenue increased by 0.8% (5.7% CN) year over year. Foreign exchange movements have negatively impacted reported revenue growth for the year ended December 31, 2022 by 490 basis points, largely driven by the strengthening dollar relative to the EUR and GBP.Creative. In Creative, revenue decreased on a reported basis 1.9% (increased 2.7% CN) for the year ended December 31, 2022. At the product level, decreases for the current periodyear ended December 31, 2022 was driven largely by our Premium Royalty Free ALC product (decreased $21.8 million), which was largely due to our continued focus on driving customers to our committed solutions. This decrease was partially offset by our Premium Access subscription product, which showed growth compared to the prior year (increased $9.0 million). Absent the currency impact, the annual subscriptions grew across all product offerings with additional growth from Unsplash, more than offsetting the declines within our ALC products.Editorial. In Editorial, revenue increased on a reported basis 6.2% (11.5% CN) for the year ended December 31, 2022. The increase was seen across assignments (increased $11.2 million), our editorial subscription and Premium Access offerings (increased $5.7 million) and ALC (increased $2.2 million). These increases were primarily driven by Entertainment (from the COVID-19 recovery we have seen since 2021) and Sport (which has grown beyond the pre-COVID periods and has performed at historically high levels during the period).Other. This category includes music licensing, digital asset management and distribution services, print sales, and data licensing revenues. Revenue for the year ended December 31, 2022 from our Other products decreased on a reported basis by 0.4%0.5% (increased 4.1% CN). The decrease was driven by print sales (decreased $1.2 million); which was partially offset by music licensing (increased $0.8 million) and digital asset management and distribution services (increased $0.4 million).Cost of revenue (exclusive of depreciation and amortization). Cost of revenue for the year ended December 31, 2022 was $255.0 million (27.5% of revenue) compared to $248.2 million (27.0% of revenue) in the prior year. The increase in cost of revenue as a percentage of revenue compared to the prior year was due primarily to revenue mix by product. Generally, cost of revenue rates vary modestly period over period based on changes in revenue mix by product, as royalty rates vary depending on the license model and use of content.Selling, general and administrative expense. Reported SG&A expense increased by $9.0$7.9 million or 2.4% (5.7%2.1% (5.4% CN) for the year ended December 31, 2022 as compared to the year ended December 31, 2021. SG&A fluctuations from the prior period include the following:●increase in computer related expenses of $3.2 million for the year ended December 31, 2022. The increase is•increase in computer related expenses of $3.2 million for the year ended December 31, 2022. The increase was due primarily to our continued growth and related cloud storage needs.•increase in professional fees of $2.0 million for the year ended December 31, 2022. The increase was largely due to fees associated with our public company readiness efforts. Beginning in the third quarter of 2023, the Company reclassified historical legal fees associated with our warrant litigation from “Selling, general and administrative expenses” to “Loss on litigation” within the Condensed Consolidated Statements of Operations. As a result, for the three months ended December 31, 2022, $1.1 million has been reclassified to Loss on litigation.•●increase in professional fees of $3.1 million for the year ended December 31, 2022. The increase is largely due to fees associated with our public company readiness efforts.●increase in marketing spend of 3.9% ($2.1 million) for the year ended December 31, 2022. For the year ended December 31, 2022, marketing spend as a percentage of sales increased to 6.0% from the year ended December 31, 2021 ratio of 5.8%. These increases were due primarily to increased investment in affiliate and digital marketing. ●increases were also seen in insurance expense ($1.7 million), other taxes ($0.7 million) and travel and entertainment ($1.5 million).●decrease of $2.2 million related to staff costs for the year ended December 31, 2022. The decrease was largely due to a reduction in bonus expense tied to company performance, which was partially offset by an increase in salaries and wages, driven by our annual raise cycle and increased headcount.●decrease of $1.8 million related to occupancy costs (primarily rent expense), as we continue to evaluate our office space needs now and into the future.5157•decrease of $2.2 million related to staff costs for the year ended December 31, 2022 The decrease was largely due to a reduction in bonus expense tied to company performance, which was partially offset by an increase in salaries and wages, driven by our annual raise cycle and increased headcount.•decrease of $1.8 million related to occupancy costs (primarily rent expense), as we continue to evaluate our office space needs now and into the future.Depreciation expense. For the year ended December 31, 2022, depreciation expense was $49.6 million which was in line with the prior year.Amortization expense. For the year ended December 31, 2022, amortization expense was $43.6 million which was a decrease of $5.7 million compared to the prior year. The decrease was due to several of our intangible assets becoming fully amortized in the fourth quarter of 2022.Restructuring costs.Loss on litigation. We recognized insignificant amounts of restructuring costs forFor the yearsyear ended December 31, 2022, and 2021.Other operating (income) expense - net. For the year ended December 31, 2022, the decrease in other operating expense, net from the prior period was $1.5$1.1 million. This decrease in expense was driven by the change in fair value of the Contingent Consideration related to our Unsplash acquisition. For further details, see “Note“Note 7 — Fair Value of Financial Instruments” in our consolidated financial statements included elsewhere in this Annual Report. Additionally, this change was partially offset by expenses associated with the abandonment of some of our office space in North America as we continue to evaluate our global office space needs.Interest expense. We recognized interest expense of $117.2 million and $122.2 million for the year ended December 31, 2022 and December 31, 2021, respectively. Our interest expense primarily consists of interest charges on our outstanding Term Loans, Senior Notes, and the unused portion of our revolving credit facility as well as the amortization of original issue discount on our term loans and amortization of deferred debt financing fees. The Company repaid $300.0 million of outstanding indebtedness in Q3 2022, which decreased our interest expense for the remainder of 2022 as compared to 2021. This decrease was partially offset by the rise in interest rates during 2022.Fair value adjustment for swaps and foreign currency exchange contract - net. We recognized fair value adjustment gains for our swaps and foreign currency exchange contracts, net of $23.5 million for the year ended December 31, 2022, compared with net gains of $19.3 million for the year ended December 31, 2021. Gains and losses are driven by changes in interest and foreign exchange rates, relative to the rates in our derivatives.Unrealized Foreign exchange gains - net. We recognized foreign exchange gains, net of $24.6 million for the year ended December 31, 2022, compared with gains of $36.4 million for the year ended December 31, 2021. These changes are primarily driven by fluctuations in the EUR related to our EUR Term Loans.Loss on extinguishment of debt. The Company utilized proceeds from the Business Combination along with cash on hand to repay $300.0 million of outstanding indebtedness on its USD Term Loans. The loss on debt extinguishment represents the acceleration of the issuance costs and debt discount.LossNet loss on fair value adjustment for warrant liabilities - net.liabilities. For the year ended December 31, 2022, there was a net loss on fair value of our warrant liability of $160.7 million. There was no such warrant liability in the prior year.Other non-operating (expense) income - net. We recognized other non-operating expense, net of $3.1 million and other non-operating income, net of $0.6 million for the year ended December 31, 2022 and December 31, 2021, respectively. The increase in expense from the prior year period relates to the transaction costs that were allocated to the fair value of the warrant liability, which were expensed upon the Closing of the Business Combination.Income tax expense. The Company’s income tax expense increased by $25.4 million to an expense of $44.1 million for the year ended December 31, 2022, as compared to an expense of $18.7 million for the year ended December 31, 2021. The Company’s effective income tax rate for the year ended December 31, 2022 is (131.7)%(131.7%), compared to 13.8% for the year ended December 31, 2021. The increase in tax expense compared to the prior year is primarily due to changes in58nondeductible net loss on fair value adjustment for warrant liabilities in the current year, nondeductible officer compensation, and a release of uncertain tax position reserves in 2021.52Comparison of the Year Ended December 31, 2021 and December 31, 2020NM - Not meaningfulConsolidated Revenue. For the year ended December 31, 2021, reported revenue was $918.7 million as compared to reported revenue of $815.4 million for the year ended December 31, 2020. On a reported basis for the year ended December 31, 2021, revenue increased by 12.7% (10.2% CN) year over year.Creative. In Creative, revenue increased on a reported basis 12.0% (9.5% CN) for the year ended December 31, 2021. Our Premium Royalty Free ALC product drove continued growth (increased by $23.8 million), a result of simplifying our licensing model for our customers. In addition, sales and marketing initiatives along with a focus on cultivating new customers grew our E-Commerce business (increased by $9.1 million). Lastly, our increased outbound sales focus on production and broadcast customers stimulated strong growth across our Creative video content, which includes numerous exclusive content collections (increased by $17.1 million).Editorial. In Editorial, revenue increased on a reported basis 15.0% (12.4% CN) for the year ended December 31, 2021. The increase was driven largely by recovery from the prior-year COVID-19 impacts. The increase was seen across assignments (increased by $11.6 million), editorial stills (increased by $20.4 million) and editorial video (increased by $7.9 million), and primarily in Sport and Entertainment. While we saw some improvement in Entertainment for the year ended December 31, 2021, large events did not return to full scale in 2021 relative to pre-COVID-19 levels.Other. This category includes music licensing, digital asset management and distribution services, print sales, data licensing revenues and certain retired products including Rights Managed. Revenue for the year ended December 31, 2021 from our Other product decreased on a reported basis by 5.2% (7.2% CN) compared to the year ended December 31, 2020. The decrease for the year ended December 31, 2021 was driven primarily by the retirement of our Rights Managed licensing model.53Cost of revenue (exclusive of depreciation and amortization). Cost of revenue for the year ended December 31, 2021 was $248.2 million (27.0% of revenue) compared to $226.1 million (27.7% of revenue) in the prior year. The decrease in cost of revenue as a percentage of revenue compared to the prior year was due primarily to revenue mix by product. Generally, cost of revenue rates will vary modestly period over period based on changes in revenue mix by product, as royalty rates vary depending on the license model and use of content.Selling, general and administrative expense. Reported SG&A expense increased by $43.3 million or 13.3% for the year ended December 31, 2021 compared to the year ended December 31, 2020. SG&A fluctuations from the prior year include the following:●increase in staff costs of $35.1 million for the year ended December 31, 2021. The change was largely driven by increases in salaries due to normal recurring annual salary raises. Additionally, 2021 results reflected an increase in our bonus and commission expense resulting from our strong operating results during the year.●increases in marketing spend of 9.7% ($4.7 million) for the year ended December 31, 2021. This increase was largely due to a lower marketing spend in 2020 tied to cost control initiatives implemented during the onset of COVID-19 that we have since reversed. For the year ended December 31, 2021, marketing spend as a percentage of sales decreased to 5.8% from the year ended December 31, 2020 ratio of 6.0%. Depreciation expense. For the year ended December 31, 2021, depreciation expense was $51.1 million which was in line with the prior year.Amortization expense. For the year ended December 31, 2021, amortization expense increased by $2.4 million compared to the prior year. The increase was driven by increases in intangible assets related to our acquisition of Unsplash.Restructuring costs. For the year ended December 31, 2021, the decrease in restructuring costs from prior period was $9.6 million. The decline was driven by a reduction in employee termination costs.Other operating expense - net. We recognized insignificant amounts of other operating expense, net for the years ended December 31, 2021 and 2020. Interest expense. We recognized interest expense of $122.2 million for the year ended December 31, 2021. Our interest expense primarily consists of interest charges on our outstanding Term Loans, Senior Notes, and the unused portion of our revolving credit facility as well as the amortization of original issue discount on our term loans and amortization of deferred debt financing fees.Fair value adjustment for swaps and foreign currency exchange contract - net. We recognized fair value adjustment gains for our swaps and foreign currency exchange contracts, net of $19.3 million for the year ended December 31, 2021, compared with net losses of $14.3 million for the year ended December 31, 2020. Gains and losses were driven by changes in interest and foreign exchange rates, relative to the rates in our derivativesForeign exchange gains (losses) - net. We recognized foreign exchange gains, net of $36.4 million for the year ended December 31, 2021, compared with losses, net of $45.1 million for the year ended December 31, 2020. These changes were primarily driven by fluctuations in the EUR related to our EUR Term Loans.Other non-operating income - net. We recognized insignificant amounts of other non-operating income, net for the years ended December 31, 2021 and 2020.Income tax expense. Our income tax expense increased by $9.2 million to an expense of $18.7 million for the year ended December 31, 2021 as compared to a $9.5 million expense for the year ended December 31, 2020. Our effective income tax rate for the year ended December 31, 2021 was 13.8% compared to (34.2)% for the year ended December 31, 2020. The change in tax expense compared to the prior year was primarily due to increases in pre-tax income, U.S. foreign inclusion, and foreign withholding tax expense.54In addition to our results determined in accordance with generally accepted accounting principles in the United States (“GAAP”), we believe the non-GAAP measures of Currency Neutral (CN)(“CN”) revenue growth (expressed as a percentage) and Adjusted Earnings Before Interest, Taxes, Depreciation, and Amortization (“EBITDA”) are useful in evaluating our operating performance. We believe that non-GAAP financial information, when taken collectively, may be helpful to investors because it provides consistency and comparability with past financial performance and assists in comparisons with other companies, some of which use similar non-GAAP information to supplement their GAAP results. The non-GAAP financial information is presented for supplemental informational purposes only, and should not be considered a substitute for financial information presented. Investors are encouraged to review the related GAAP financial measures and the reconciliation of these non-GAAP financial measures to their most comparable GAAP financial measures.Currency Neutral RevenueCurrency Neutral revenue growthchanges (expressed as a percentage) excludes the impact of fluctuating foreign currency values pegged to the U.S. dollar between comparative periods by translating all local currencies using the current period exchange rates. We consistently apply this approach to revenue for all countries where the functional currency is not the U.S. dollar. We believe that this presentation provides useful supplemental information regarding changes in our revenue not driven by fluctuations in the value of foreign currencies.Adjusted EBITDAA reconciliation is provided below to the most comparable financial measure stated in accordance with GAAP. We define Adjusted EBITDA Margin as the ratio of Adjusted EBITDA to revenue.(in thousands) Year Ended December 31, 2023 2022 2021 Net income (loss) $ 19,577 $ (77,643) $ 117,397 Add/(less) non-GAAP adjustments: Depreciation and amortization 78,443 93,219 100,460 Loss on litigation, net of recovery 156,051 1,101 — Other operating expense (income) – net 1,624 (681) 386 Interest expense 126,884 117,229 122,160 Fair value adjustments, foreign exchange and other non operating (expense) income — net227,693 (45,100) (56,300) Loss on extinguishment of debt — 2,693 — Loss on fair value adjustment for warrant liabilities — net — 160,728 — Income tax expense (46,482) 44,126 18,729 Equity-based compensation expense 37,652 9,292 6,441 Adjusted EBITDA $ 301,442 $ 304,964 $ 309,273 Net income (loss) margin 2.1 % (8.4) % 12.8 % Adjusted EBITDA Margin 32.9 % 32.9 % 33.7 % ____________________1 Beginning with the third quarter of 2023 reporting period, the Company reclassified historical legal fees associated with our warrant litigation from “Selling, general and administrative expenses” to “Loss on litigation” within the Condensed Consolidated Statements of Operations. The aggregate amount of these fees reported through June 30, 2023, totaled $7.5 million, with $1.1 million recognized for the three months ended December 31, 2022 and $6.4 million recognized for the six months ended June 30, 2023. This change in classification serves to increase our Adjusted EBITDA by $6.4 million for the year ended December 31, 2023 and $1.1 million for the year ended December 31, 2022, when compared to classification in prior periods.2 Fair value adjustments for our swaps and foreign currency exchange contracts, foreign exchange gains (losses) and other insignificant non-operating related (expenses) income.59(1)Fair value adjustments for our swaps and foreign currency exchange contracts, foreign exchange gains (losses) and other insignificant non-operating related (expenses) income.Liquidity and Capital ResourcesOur sources of liquidity are our existing cash and cash equivalents, cash provided by operations and amounts available under our revolving credit facility. As of December 31, 2023, 2022 2021 and 2020,2021, we had cash and cash equivalents of $136.6 million, $97.9 million $186.3 million and $156.5$186.3 million, respectively, and availability under our revolving credit facility. On May 4, 2023, we increased and extended our revolving credit facility to $150.0 million, which expires May 4, 2028. Additionally, we voluntarily prepaid a total of $50.4 million of outstanding indebtedness in February 2024, of $80.0 million.2023. Our principal liquidity needs include debt service and capital expenditures, as well as those required to support working capital, internal growth, and strategic acquisitions and investments. Deferred revenue represents the majority of our current liabilities, which given its nature is not expected to require cash settlement.As we have previously disclosed, the Company has been named as a defendant in two lawsuits filed by former public warrant holders. The plaintiffs generally alleged breaches of the Warrant Agreement, dated August 4, 2020, and alternative claims for violations of the federal securities laws, including claims under the Securities Act of 1933 and/or the Securities Exchange Act of 1934. On October 27, 2023, the Court issued its decision on the cross-motions for summary judgment and entered judgment in favor of Plaintiffs on their breach of contract claims in the amount of $36.9 million for Alta Partners, LLC and $51.0 million for the CRCM plaintiffs, plus, in each case, pre-judgment interest of 9.0% per annum. The Company’s Loss on Litigation is comprised of these summary judgment amounts, in addition to pre and post-judgment interest and associated legal fees and other direct costs through December 31, 2023. The Company has recognized Recovery of Loss on Litigation of $60.0 million, which represents the limit of the Company’s insurance coverage for this matter. As of December 31, 2023, the Company had a remaining insurance recovery receivable of $48.6 million. The Company has appealed the part of the Court’s decision that ruled in favor of the plaintiffs.55We have previously disclosed that we have open tax audits in various jurisdictions and some of these jurisdictions require taxpayers to pay assessed taxes in advance or at the time of appealing such assessments. The Company has open tax audits in various jurisdictions and some of these jurisdictions require taxpayers to pay assessed taxes in advance or at the time of appealing such assessments. One such jurisdiction is Canada, where one of the Company’s subsidiaries, iStockphoto ULC, recently received tax assessments from the CRA asserting additional tax is due. The position taken by the CRA is related to the transactions between iStockphoto ULC and other affiliates within the Getty Images group for the 2015 Canadian income tax return filed. The Company believes the CRA position lacks merit and intends to appeal and vigorously contest these assessments.the appeal process in Canada, the Company may be required to pay a portion of the assessed amounts, which we estimate could be up to $19.3 million. Such required payment is not an admission that the Company believes it is subject to such taxes. The Company believes it is more likely than not it will prevail on appeal, however, if the CRA were to be successful in the appeal process, we estimate the maximum potential outcome could be up to $29.2 million.We expect to fund our ordinary course operating activities from existing cash and cash flows from operations and believe that these sources of liquidity will be sufficient to fund our ordinary course operations and other planned investing activities for at least the next 12 months and thereafter for the foreseeable future. From time to time, we may evaluate potential acquisitions, investments and other growth and strategic opportunities. While we believe we have sufficient liquidity to fund our ordinary course operations for the foreseeable future, our sources of liquidity could be affected by current and future difficult economic conditions, payment of certain restructuring costs, reliance on key personnel, international risks, intellectual property claims, the resolution of pending or future tax audits or other factors described herein under “Potential Liability and Insurance” below and “Item 7A. Quantitative and Qualitative Disclosures About Market Risk.”We may, from time to time, incur or increase borrowings under the revolving credit facility or issue new debt securities, if market conditions are favorable, to meet our future cash needs or to reduce our borrowing costs. We or our affiliates from time to time consider potential transactions intended to rationalize our consolidated balance sheet. In connection with any such transactions, we may, among other things, seek to retire our outstanding notes or loans through cash purchases and/or exchanges for equity or other securities, in open market purchases, privately negotiated transactions, tenders or otherwise. Such repurchases, exchanges, or other transactions, if any, will depend on prevailing market conditions, our liquidity requirements, contractual restrictions and other factors. The Company became a public reporting company as a result of the closing of the Business Combination on July 22, 2022. The net proceeds from the Business Combination were primarily used to reduce debt of the Company and therefore reduce our borrowing costs starting in the second half of 2022.60The Business Combination resulted in aggregate gross proceeds to the Company of approximately $864.0 million. As a result of the Business Combination, the previously outstanding Redeemable Preferred Stock of Legacy Getty was redeemed in full through a combination of a cash payment of approximately $615.0 million and 15,000,000 shares of the Company’s Class A Common Stockcommon stock with a fair value at issuance of $140.2 million. Additionally, the Company used $300.0 million of cash to repay a portion of its outstanding indebtedness related to the USD Term Loans, which when combined with the retirement of the preferred shares, resulted in a reduction of approximately $1.1 billion of balance sheet obligations.Our liquidity may also be adversely affected by the resolution of pending or future tax audits.audits and legal proceedings. See discussion above. We may be subject to tax liabilities in excess of amounts reserved for liabilities for uncertain tax positions on our consolidated balance sheets. In addition, certain jurisdictions in which we have current open tax audits require taxpayers to pay assessed taxes in advance of contesting, whether by way of litigation or appeal, an adverse determination or assessment by the relevant taxing authority. The amount of any such advance payment depends upon the amount in controversy and may be material, and payment of any such amount could adversely affect our liquidity. A jurisdiction that collects any such advance payment generally will repay such amounts if we ultimately prevail in the related litigation or appeal. See “Note 13 — Commitments and Contingencies” and “Note 20 — Income Taxes” in our consolidated financial statements included elsewhere in this report, for additional discussions of our pending tax audits and our uncertain tax positions and risks related thereto.Cash FlowsYear Ended
December 31,increase (decrease) (Dollars in thousands) 2023 2022 $ change % change Net cash provided by operating activities $ 132,716 $ 163,117 $ (30,401) (18.6) % Net cash used in investing activities $ (56,999) $ (61,291) $ 4,292 7.0 % Net cash used in financing activities $ (45,350) $ (184,347) $ 138,997 75.4 % Effects of exchange rate fluctuations $ 8,089 $ (6,614) $ 14,703 NM ____________________NM - Not meaningfulCash provided by operating activities was $132.7 million for the year December 31, 2023 as compared to cash provided by operating activities of $163.1 million for the year ended December 31, 2022. The primary driver of our decrease in cash provided by operating activities of $30.4 million was an increase in our interest expense driven by the rise in interest rates from 2022 to 2023. We also saw an increase in the use of cash related to our ongoing intellectual property rights and warrant litigation.Our investing activities used $57.0 million and $61.3 million in cash during the year ended December 31, 2023 and 2022, respectively, which was used to acquire property and equipment. The property and equipment was mainly related to internal software development as we continued to innovate and invest in the design, user experience and performance of our websites.For the year ended December 31, 2023 and 2022, our financing activities used $45.4 million and $184.3 million of cash, respectively. Financing activities for the year ended December 31, 2023 primarily includes voluntary principal payments on our Term Loans and cash paid for settlement of employee taxes related to exercise of equity-based awards, partially offset by proceeds from common stock issuance related to employee options exercised. Financing activities for the year ended December 31, 2022 primarily related to the Business Combination, including cash contributions ($864.2 million) which were used to pay equity issuance costs ($106.9 million), retire our Redeemable Preferred Stock ($615.0 million) and prepay a portion of our USD Term Loans ($310.4 million). Additionally, during the six months ended June 30, 2022, the61Table of ContentUnsplash Inc. Two-Year Earnout was achieved and was paid during the three months ended September 30, 2022 ($10.0 million).Year Ended
December 31,increase (decrease) (Dollars in thousands) 2022 2021 $ change % change Net cash provided by operating activities $ 163,117 $ 188,890 $ (25,773) (13.6) % Net cash used in investing activities $ (61,291) $ (136,926) $ 75,635 55.2 % Net cash used in financing activities $ (184,347) $ (19,265) $ (165,082) (856.9) % Effects of exchange rate fluctuations $ (6,614) $ (2,479) $ (4,135) (166.8) % Cash provided by operating activities was $163.1 million for the year ended December 31, 2022, as compared to cash provided by operating activities of $188.9 million for the year ended December 31, 2021. NetThe primary driver of our decrease in cash provided by operating activities forof $25.8 million was changes in working capital, which increased cash flows from operating activities by $2.4 million in 2022 as compared to increased cash flows from operating activities of $31.3 million in 2021. Within working capital, the year ended December 31, 2022 is primarily due to a net lossprimary components of $77.6 million adjusted for noncash expensesthe difference between periods are reduced cash flows from changes in the timing of $249.8 million and a decrease inpayments of accrued expenses and changes in deferred revenue, partially offset by increased cash flows from the change in timing of $14.2 million.collections related to accounts receivable and timing of the payments for accounts payable. The largest of these categories is accrued expenses, with the primary driver of the change between periods being accrued bonus. The Company’s annual bonus for 2021 (paid in 2022) was significantly larger than the 2020 bonus (paid in 2021).56iswas mainly related to internal software development as we continuecontinued to innovate and invest in the design, user experience and performance of our websites. In addition, on April 1, 2021, we acquired Unsplash Inc. in exchange for $89.2 million in net cash plus an additional earnout potential of approximately $20.0 million based on revenue targets over two and three years, funded through existing cash on hand.For the year ended December 31, 2022 and 2021, our financing activities used $184.3 million and $19.3 million of cash, respectively. Financing activities for the year ended December 31, 2022 primarily relaterelated to the Business Combination, including cash contributions ($864.2 million) which were used to pay equity issuance costs ($106.9 million), retire our Redeemable Preferred Stock ($615.0 million) and prepay a portion of our USD Term Loans ($310.4 million). Additionally, during the six months ended June 30, 2022, the Unsplash Two-Year Earnout was achieved and was paid during the three months ended September 30, 2022 ($10.0 million).NM - Not meaningfulCash provided by operating activities was $188.9 million for the year ended December 31, 2021 as compared to cash provided by operating activities of $148.5 million for the year ended December 31, 2020. Net cash provided by operating activities for the year ended December 31, 2021 is primarily due to net income of $117.4 million adjusted for noncash expenses of $40.2 million, an increase in accrued expenses of $18.7 million and deferred revenue of $24.8 million which was partially offset by an increase in our accounts receivable of $16.1 million.Our investing activities used $136.9 million and $53.5 million in cash during the year ended December 31, 2021 and 2020, respectively, which was used to acquire a business and property and equipment. On April 1, 2021, we acquired Unsplash Inc. in exchange for $89.2 million in net cash plus an additional earnout potential of approximately $20.0 million based on revenue targets over two and three years, funded through existing cash on hand. The property and equipment mainly related to internal software development as we continue to innovate and invest in the design, user experience and performance of our websites.For the year ended December 31, 2021 and 2020, our financing activities used $19.3 million and $52.0 million of cash, respectively. Financing activities for the year ended December 31, 2021 included principal payments on our Term Loans.A summary of contractual cash obligations as of December 31, 20222023 were as follows:(Dollars in thousands) 2024-2025 2026-2027 2028 and
thereafterTotal Long-term indebtedness, including current portion and interest1$ 243,175 $ 1,455,584 $ — $ 1,698,759 Operating lease obligations226,439 14,956 22,571 63,966 Minimum royalty guarantee payments to suppliers of content382,108 34,529 19,942 136,579 IT Commitments 14,564 1,063 — 15,627 Other commitments 3,280 222 — 3,502 Total $ 369,566 $ 1,506,354 $ 42,513 $ 1,918,433 ____________________1Interest payments are estimated based on interest rate curves valued as of December 31, 2022.2Offsetting operating lease payments will be immaterial receipts for subleased facilities.3Offsetting the minimum royalty guarantee payments to content suppliers will be minimum guaranteed receipts from content suppliers.5762We have historically had a predictable level of capital expenditures, a significant portion of which has been discretionary and growth-related. Our capital expenditures have generally consisted of costs related to imagery and other content creation, capitalized labor for development of software, purchased computer hardware, and leasehold improvements. Content creation capital expenditures include capitalized internal and external labor for ingesting and editing creative content, imagecontent acquisition, buying imagecontent collections from photographers or ImageContent Partners, and cameras, lenses and miscellaneous imaging equipment primarily for our editorial operations. Software includes computer software developed for internal use and consists of internal and external costs incurred during the application development stage of software development and costs of upgrades or enhancements that result in additional software functionality.Off-balance sheet arrangementsFrom time to time, we may issue small amounts of letters of credit to provide credit support for leases, guarantees, and contractual commitments. The fair values of the letters of credit reflect the amount of the underlying obligation and are subject to fees competitively determined in the marketplace. As of December 31, 2023, 2022 2021 and 2020,2021, we had no material letters of credit outstanding or other off-balance sheet arrangements except for operating leases entered into in the normal course of business.Effects of inflation and changing pricesWe do not believe that inflation has had a material effect on our business, financial condition or results of operations. If our costs were to become subject to significant inflationary pressures, we may not be able to fully offset such higher costs through price increases. Our inability or failure to do so could harm our business and adversely affect our financial condition and results of operations.Potential Liability and InsuranceWe indemnify certain customers from claims related to alleged infringements of the intellectual property rights of third parties or misappropriation of publicity or personality rights of third parties, such as claims arising from copyright infringement or failure to secure model and property releases for images we license if such a release is required. The standard terms of these indemnifications require us to defend those claims upon notice and pay related damages, if any. We typically mitigate this risk by requiring all uses of licenses to be within the scope of our licenses, and by securing necessary model and property releases for Creative Stills content and by contractually requiring contributing photographers and other content partners to do the same prior to submitting any content to us, and by limiting damages/liability in certain circumstances. Additionally, we require all contributors and ImageContent Partners, as well as companies that are potential acquisition targets to warrant that the content licensed to or purchased by us does not and will not infringe upon or misappropriate the rights of third parties. We also require content providers, including contributing photographers, ImageContent Partners and other content partners and sellers of businesses or image collections that we have purchased to indemnify us in certain circumstances where a claim arises in relation to an image they have provided or sold to us. ImageContent Partners and other content partners are also typically required to carry insurance policies for losses related to such claims and individual contributors are encouraged to carry such policies and we have insurance policies to cover litigation costs for such claims. We will record liabilities for these indemnifications if and when such claims are probable and the range of possible payments and available recourse from content partners can be estimated, as applicable. Historically, the exposure to such claims has been immaterial, as were the recorded liabilities for intellectual property infringement at December 31, 2023, 2022 2021 and 2020.2021. As such, management believes the estimated fair value of these liabilities is minimal.In the ordinary course of business, we also enter into certain types of agreements that contingently require us to indemnify counterparties against third-party claims. These may include:●•agreements with vendors and suppliers, under which we may indemnify them against claims arising from our use of their products or services;•agreements with customers other than those licensing images, under which we may indemnify them against claims and uncollectible trade accounts receivable arising from their use of our products or services in their markets;•agreements with agents, delegates and distributors, under which we may indemnify them against claims arising from their distribution of our products or services;•●agreements with customers other than those licensing images, under which we may indemnify them against claims and uncollectible trade accounts receivable arising from their use of our products or services in their markets;●agreements with agents, delegates and distributors, under which we may indemnify them against claims arising from their distribution of our products or services;●real estate and equipment leases, under which we may indemnify lessors against third-party claims relating to use of their property; ●agreements with directors and officers, under which we indemnify them to the full extent allowed by Delaware law against claims relating to their service to us; and5863
•agreements with directors and officers, under which we indemnify them to the full extent allowed by Delaware law against claims relating to their service to us; and●agreements with purchasers of businesses we have sold, under which we may indemnify the purchasers against claims arising from our operation of the businesses prior to sale.•agreements with purchasers of businesses we have sold, under which we may indemnify the purchasers against claims arising from our operation of the businesses prior to sale.The nature and terms of these indemnifications vary from contract to contract, and generally a maximum obligation is not stated. Because management does not believe a material liability is probable, no related liabilities were recorded at December 31, 2023, 2022 2021 and 2020.2021. We are subject to a variety of claims and suits that arise from time to time in the ordinary course of our business. Although management currently believes that resolving claims against us, individually or in aggregate, will not have a material adverse impact on our financial statements, these matters are subject to inherent uncertainties and management’s judgment about these matters may change in the future. Additionally, we hold insurance policies that mitigate potential losses arising from certain indemnifications, and historically, significant costs related to performance under these obligations have not been incurred.Income taxesWe account for income taxes and accruals for uncertain tax positions using the asset and liability approach. Our income tax expense, deferred tax assets and liabilities, and reserves for unrecognized tax benefits reflect management’s best assessment of current and future taxes to be paid. Our judgments, assumptions, and estimates relative to the current provision for income taxes take into account current tax laws, our interpretation of current tax laws and possible outcomes of future audits conducted by foreign and domestic tax authorities. Changes in tax law or our interpretation of tax laws and future tax audits could significantly impact the amounts provided for income taxes in our consolidated financial statements.We conduct operations on a global basis and are subject to income taxes in the United States and numerous foreign jurisdictions. Significant judgment is required in evaluating and estimating our provision and accruals for these taxes. Our effective tax rate is subject to significant variation due to several factors, including variability in accurately predicting our taxable income and the geographical mix of our pre-tax earnings. In addition, we are subject to audit in various jurisdictions, and such jurisdictions may assess additional income tax liabilities. We record unrecognized tax benefits as liabilities in accordance with ASC 740, “Income Taxes” (“ASC 740”) and adjust these liabilities when our judgment changes as result of the evaluation of new information not previously available. Such amounts are based on management’s judgment and best estimate as to the ultimate outcome of tax audits.Critical accounting policies and estimatesThe preparation of consolidated financial statements in conformity with GAAP requires us to make estimates and assumptions that affect the reported amounts of assets and liabilities and disclosure of contingent assets and liabilities at the date of the consolidated financial statements and revenues and expenses reported during the period. Some of the estimates and assumptions that require the most difficult judgments are:●the assumptions used to estimate unused capped subscription-based and credit-based products;●the assumptions used to allocate transaction price to multiple performance obligations for uncapped subscription arrangements;●the sufficiency of the allowance for doubtful accounts;●the assumptions used to assess the recoverability of goodwill;●the appropriateness of the valuation and useful lives of intangibles and other long-lived assets;●the assumptions used to estimate the Contingent Consideration;●the assumptions used to value equity-based compensation arrangements;●the appropriateness of the amount of accrued income taxes, including the potential outcome of future tax consequences of events that have been recognized in the consolidated financial statements as well as the deferred tax asset valuation allowances; and●the assumptions used to estimate the fair value of Public, Private Placement and Forward Purchase Warrants (as each is defined in the notes to the consolidated financial statements included elsewhere in this report).•the assumptions used to estimate unused capped subscription-based and credit-based products;•the assumptions used to allocate transaction price to multiple performance obligations for uncapped subscription arrangements;•the assumptions used to estimate accrued litigation reserves and insurance recoveries; and•the appropriateness of the amount of accrued income taxes, including the potential outcome of future tax consequences of events that have been recognized in the consolidated financial statements as well as the deferred tax asset valuation allowances.These judgments are inherently uncertain which directly impacts their valuation and accounting. Actual results and outcomes may differ from our estimates and assumptions.59Revenue is derived principally from licensing rights to use images, video footage and music that are delivered digitally. Digital content licenses are generally purchased on a monthly or annual subscription basis, whereby a customer either pays for a predetermined quantity of content or for access to our content library that may be downloaded over a specific period of time, or, on a transactional basis, whereby a customer pays for individual content licenses at the time of download. Also, a significant portion of revenue is generated through the sale and subsequent use of credits. Various amounts of credits are required to license digital content.We recognize revenue gross64Table of contributor royalties because we are the principal in the transaction as we are the party responsible for the performance obligation and we control the product or service prior to transferring to the customer. We also license content to customers through third-party delegates worldwide (approximately 3% of total revenues for the years ended December 31, 2022, 2021 and 2020). Delegates sell our products directly to customers as the principal in those transactions. Accordingly, we recognize revenue net of costs paid to delegates. Delegates typically earn and retain 35% to 50% of the license fee, and we recognize the remaining 50% to 65% as revenue.We maintain a credit department that sets and monitors credit policies that establish credit limits and ascertains customer creditworthiness, thus reducing the risk of potential credit loss. Revenue is not recognized unless it is determined that collectability is reasonably assured. Revenue is recorded at invoiced amounts (including discounts and applicable sales taxes) less an allowance for sales returns which is based on historical information. Customer payments received in advance of revenue recognition are contract liabilities and are recorded as deferred revenue. Customers that do not pay in advance are invoiced and are required to make payments under standard credit terms.The Company recognizes revenue under the core principle to depict the transfer of control to our customers in an amount reflecting the consideration to which we expect to be entitled. In order to achieve that core principle, we apply the following five-step approach: (i) identify the contract with a customer, (ii) identify the performance obligations in the contract, (iii) determine the transaction price, (iv) allocate the transaction price to the performance obligations in the contract and (v) recognize revenue when a performance obligation is satisfied.The recognition and measurement of revenue requires the use of judgments and estimates. Specifically, judgment is used in identifying the performance obligations and the standalone selling price of the performance obligations. At contract inception, we assess the product offerings in our contracts to identify performance obligations that are distinct. A performance obligation is distinct when it is separately identifiable from other items and if a customer can benefit from it on its own or with other resources that are readily available to the customer.For digital content licenses, we recognize revenue on capped subscription-based, credit-based sales and single image licenses when content is downloaded, at which time the license is provided. In addition, we estimate expected unused licenses for capped subscription-based and credit-based products and recognize the revenue associated with the unused licenses throughout the subscription or credit period. The estimate of unused licenses is based on historical download activity and future changes in the estimate could impact the timing of revenue recognition of our subscription products.For uncapped digital content subscriptions, we have determined that access to the existing content library and future digital content updates represent two separate performance obligations. As such, a portion of the total contract consideration related to access to the existing content library is recognized as revenue at the commencement of the contract when control of the content library is transferred. The remaining contractual consideration is recognized as revenue ratably over the term of the contract when updated digital content is transferred to the licensee, in line with when the control of the new content is transferred. Management allocates the total contract consideration to each performance obligation based on a relative standalone selling price basis. We do not sell “existing content” and “future content” separately to the customer. We believe that the best estimate for value provided to the customer for each performance obligation is based on our customers’ historical content download and usage patterns. We determine the standalone selling price for each based on these observable patterns.RevenueLitigation reserves and insurance recoveriesThe Company recognizes a charge for litigation reserves when a loss is probable, and the amount is material and reasonably determinable. The amount accrued represents the Company’s best estimate of the loss, including related interest if applicable or, if no best estimate within a range of outcomes exists, the minimum amount in the range is reserved and high end of the range is disclosed. If it is determined that a loss is only reasonably possible or that a loss is probable but the amount is not reasonably estimable, the Company discloses the nature of the possible loss and gives an estimate of the possible range of loss. Our estimates and judgments could change based on new information, changes in laws or regulations, or the outcome of legal proceedings, settlements, or other factors. If different estimates and judgments were applied with respect to these matters, it is likely that reserves would be recorded for different amounts. The reserve for litigation is accrued in “Litigation Reserves” on the Condensed Consolidated Balance Sheets and related legal and professional fees associated with hosted software services is recognized ratably over the term of the license.60Foreign currenciesAssets and liabilities for subsidiaries with functional currencies other than the U.S. dollar are recorded in foreign currencies and translated at the exchange rate on the Balance Sheet date. Revenue and expenses are translated at average rates of exchange prevailing during the year. Translation adjustments resulting from this process are charged or credited to “Other comprehensive income (loss)” (“OCI”), as a separate component of stockholder’s deficit. Transaction gains and losses arising from transactions denominated in a currency other than the functional currency of the entity involvedlitigation are included in “Foreign exchange gain (losses) — net” in“Accounts Payable” or “Accrued Liabilities” on the Condensed Consolidated Statements of Operations. For the year ended December 31, 2022, 2021 and 2020, the Company recognized net foreign currency transaction gains of $24.6 million and $36.4 million and losses of $45.1 million, respectively.Accounts receivable, netAccounts receivable are trade receivables, net of reserves for allowances for doubtful accounts totaling $6.5 million as of December 31, 2022, $5.9 million as of December 31, 2021 and $7.8 million as of December 31, 2020.Allowance for doubtful accounts is calculated based on historical losses, existing economic conditions, and analysis of specific older account balances of customer and delegate accounts. Trade receivables are written off when collection efforts have been exhausted. The allowance for sales returns is estimated based on historical returns as a percentage of revenue. Estimated sales returns are recorded as a reduction of revenue and were insignificant in all periods presented. Less than 7% of the recorded trade receivables were more than 90 days past-due as of December 31, 2022, compared to less than 6% at December 31, 2021 and less than 10% at December 31, 2020. Concentration of credit risk with respect to trade receivables is limited due to the large number of customers and their dispersion across many geographic areas.GoodwillThe Company evaluates goodwill for impairment annually or more frequentlyalso recognizes the benefit of recoveries of losses on litigation when an event occurs, or circumstances change that indicate the carrying value of the one reporting unit may not be recoverable. Circumstances that could indicate impairment and require impairment tests more frequently than annually include: significant adverse changes in legal factors or market and economic conditions, a significant decline in the financial results of the Company’s operations, significant changes in strategic plans, adverse actions by regulators, unanticipated changes in competition and market share, or a planned disposition of a significant portion of the business. Management performs the annual goodwill impairment analysis as of October 1 each year. The Company performed a qualitative screen for its 2022, 2021 and 2020 goodwill impairment analyses. All of the factors above were considered as well as the current price of its common stock. Given the significant headroom in excess of 100%, the Company passed a qualitative assessment in regard to goodwill impairment, determining that it is unlikely the fair value of the reporting unit is less than its carrying value. As circumstances change, it is possible that future goodwill impairment analysis could result in goodwill impairments, which would be included in the calculation of income or loss from operations.Identifiable intangible assetsIdentifiable intangible assets are assets that do not have physical representation but that arise from contractual or other legal rights or are capable of being separated or divided from the Company and sold, transferred, licensed, rented or exchanged. Identifiable intangible assets are amortized on a straight-line basis over their estimated useful lives, unless such life is determined to be indefinite. The remaining useful lives of identifiable intangible assets are reassessed each reporting period to determine whether events and circumstances warrant revisions to the remaining periods of amortization. Potential impairment of identifiable intangible assets is evaluated annually or whenever circumstances indicate that the carrying value may not be recoverable through projected discounted or undiscounted cash flows expected to be generated by the asset. There have been no significant impairments or significant changes in estimated useful lives during any of the periods presented.61Impairment of long-lived assetsLong-lived assets are reviewed for impairment whenever events or changes in circumstances indicate that carrying amounts may not be recoverable. Impairment exists when the carrying value of an asset is not recoverable and exceeds its fair value. The carrying value of an asset is not recoverable if it exceeds the sum of the undiscounted future cash flows expected to result from the use and eventual disposition of the asset. The fair value of an asset is the price that would be received to sell the asset in an orderly transaction between market participants at the measurement date. Impairments are included in other operating expenses or, if material, shown separately and included in the calculation of income or loss from operations. There have been no significant impairments during any of the periods presented.Contingent ConsiderationThe Company records a liability for contingent consideration at the date of a business combination and reassesses the fair value of the liability each period until it is settled. Upon settlement of these liabilities, the portion of the contingent consideration payment that is attributable to the initial amount recorded as part of the business combination will be classified as a cash flow from financing activities and the portion of the settlement that is attributable to subsequent changes in the fair value of the contingent consideration will be classified as a cash flow from operating activities in the consolidated statement of cash flows.Equity-Based CompensationEquity-based compensation is accounted for in accordance with authoritative guidance for equity-based payments. This guidance requires equity-based compensation cost to be measured at the grant date based on the fair value of the award and recognized as expense over the applicable service period, which is the vesting period, net of estimated forfeitures. Compensation expense for equity-based payments that contain service conditions is recorded on a straight-line basis, over the service period of generally four years. Compensation expense for equity-based payments that contain performance conditions is not recorded until it is probable that the performance conditionsuch recoveries will be achieved. The estimation of stock awards that will ultimately vest requires judgment, and to the extent actual results or updated estimates differreceived. These recoveries are typically receivable from our current estimates, such amounts will be recorded as a cumulative adjustmentthird-party insurance carriers for legal claims and related costs that are included in the period estimates are revised. We consider many factors when estimating expected forfeitures, including types of awards, employee class, and historical experience. Actual results and future estimates may differ substantially from current estimates.We use the Black-Scholes option pricing model to determine the fair value of the stock options granted. The Black-Scholes option pricing model requires the input of highly subjective assumptions, including the fair value of the underlying share of our common stock (prior to the Business Combination), the expected term of the option, the expected volatility of the price of our common stock and risk-free interest rates.Given the recency of the Business Combination, the expected volatility assumption for equity-based compensation is based“Loss on historical volatilities of the common stock of public companies with characteristics similar to those of the Company. The risk-free rate of return represents the implied yield available during the month the award was granted for a U.S. Treasury zero-coupon security issued with a term equal to the expected life of the awards. The expected term is measured from the grant date and is basedLitigation” on the simplified method calculation. The assumptions used to determine the fair valueCondensed Consolidated Statement of the option awards represent management’s best estimates. These estimates involve inherent uncertainties and the application of management’s judgment.Prior to the Business Combination, certain employees of the Company were granted equity awards under Legacy Getty’s Amended and Restated 2012 Equity Incentive Plan (“Legacy Getty 2012 Plan”). Upon closing of the Business Combination, awards under the Legacy Getty 2012 Plan were converted at the Exchange Ratio, and the Company’s board of directors approved the Getty Images Holdings, Inc. 2022 Equity Incentive Plan (“2022 Plan”). The 2022 Plan provides for the grant of stock options, including incentive stock options and nonqualified stock options, stock appreciation rights, restricted stock, dividend equivalents, RSUs and other stock or cash-based awards. Under the 2022 Plan, up to 51,104,577 shares of Class A Common Stock is available for issuance.62Common Stock ValuationsFor reporting periods prior to the closing of the Business Combination on July 22, 2022, our board of directors utilized various valuation methodologies in accordance with the framework of the American Institute of Certified Public Accountants’ Technical Practice Aid, Valuation of Privately Held Company Equity Securities Issued as Compensation, to estimate the fair value of Legacy Getty’s common stock. These estimates and assumptions include numerous objective and subjective factors to determine the fair value of common stock at each grant date, including the following factors:●relevant precedent transactions including our capital transactions;●the liquidation preferences, rights, preferences, and privileges of preferred stock relative to the common stock;●our actual operating and financial performance;●our current business conditions and projections;●our stage of development;●the likelihood and timing of achieving a liquidity event for the common stock underlying the stock options, such as an initial public offering, given prevailing market conditions;●any adjustment necessary to recognize a lack of marketability of the common stock underlying the granted options;●the market performance of comparable publicly traded companies; and●U.S. and global capital market conditions.In valuing our common stock, our board of directors determined the equity value of the business generally using the income approach and the market approach valuation methods. After the Equity Value is determined and allocated to the various classes of stock, a discount for lack of marketability (“DLOM”), is applied to arrive at the fair value of the common stock. A DLOM is applied based on the theory that as a private company, an owner of the stock has limited opportunities to sell this stock and any sale would involve significant transaction costs, thereby reducing overall fair market value.In addition, the board of directors also considered any secondary transactions involving our common stock. In its evaluation of those transactions, the board of directors considered the facts and circumstances of each transaction to determine the extent to which they represented a fair value exchange. Factors considered include transaction volume, timing, whether the transactions occurred among willing and unrelated parties, and whether the transactions involved investors with access to the Company’s financial information.Application of these approaches involves the use of estimates, judgment, and assumptions that are highly complex and subjective, such as those regarding our expected future revenue, expenses, and future cash flows, discount rates, market multiples, the selection of comparable companies, and the probability of possible future events. Changes in any or all of these estimates and assumptions or the relationships between those assumptions impact our valuations as of each valuation date and may have a material impact on the valuation of our common stock.The fair value of our Class A Common Stock is determined based on the quoted market price on the New York Stock Exchange since the closing of our Business Combination on July 22, 2022.Public, Private Placement and Forward Purchase Common Stock Warrant LiabilitiesThe Company evaluated the Public, Private Placement and Forward Purchase Warrants under ASC 815-40, Derivatives and Hedging-Contracts in Entity’s Own Equity (“ASC 815-40”), and concluded they do not meet the criteria to be indexed to the Company’s own stock as certain provisions of the warrant agreement could change the settlement amount of these warrants based on variables that would not be considered inputs to the valuation model for a fixed-for-fixed equity instrument. Since the Public, Private Placement and Forward Purchase Warrants meet the definition of a derivative under ASC 815-40, the Company recorded these warrants as liabilities in the Consolidated Balance Sheets at fair value, with subsequent changes in their respective fair values recognized in the change in fair value of warrant liabilities within the consolidated statements of operations at each reporting date.The Public Warrants were publicly traded and thus had an observable market price to estimate fair value. The Forward Purchase Warrants, which have identical terms as the Public Warrants, were valued similar to the Public Warrants. The Private Placement Warrants were valued using a Black-Scholes option-pricing model as described in “Note 5 — Common Stock Warrants” in our consolidated financial statements included elsewhere in this Annual Report.63The Company computes income taxes and accruals for uncertain tax positions under the asset and liability method in accordance with ASC 740 for accounting for income taxes and uncertain tax positions. Deferred income taxes are provided for the temporary differences between the consolidated financial statement carrying amounts and the tax basis of the Company’s assets and liabilities and operating loss and tax credit carryforwards. The Company establishes a valuation allowance for deferred tax assets if it is not more likely than not that these items will either expire before the taxCompany is able to realize their benefits will be realized.or future deductibility is uncertain. Periodically, the valuation allowance is reviewed and adjusted based on management’s assessments of realizable deferred tax assets. The Company accounts for the global intangible low-tax income (“GILTI”) earned by foreign subsidiaries included in gross U.S. taxable income in the period incurred.65Recent Accounting PronouncementsPlease refer to “Note 2 — Summary of Significant Accounting Policies” in our consolidated financial statements included elsewhere in this Annual Report for a description of recently adopted accounting pronouncements and recently issued accounting pronouncements not yet adopted.Report.Item 7A. Quantitative and Qualitative Disclosures About Market Risk.Interest rate market riskFor the year ended December 31, 20222023, we were exposed to changes in LIBOR and Adjusted Term SOFR interest rates on the USD Term Loans of the senior secured credit facilities, subject to a minimum floor of 0.00%. On February 3, 2023, we amended our Credit Agreement to replace LIBOR with Adjusted Term SOFR on the USD Term Loans effective from the start of the next interest period and thereafter were exposed to changes in Term SOFR interest rates on the USD Term Loans of the senior secured credit facilities. The Adjusted Term SOFR rate is subject to a minimum floor of 0.00%. As of December 31, 2022,2023, the principal outstanding of our USD Term Loans of the senior secured credit facility was $687.4$637.0 million. As of December 31, 2022,2023, the applicable LIBORAdjusted Term SOFR is above said floor. To offset our exposure to interest rate changes, Getty Images has entered into interest rate swap agreements with notionals of $355.0 million. These swap arrangements also havehad an embedded floor of 0.00%. Based on the principal outstanding, incorporating the effect of the swap agreements, as of December 31, 20222023 each one eighth percentage point increase in the LIBORTerm SOFR rate hereafterthereafter would have correspondingly increaseincreased our interest expense on the senior secured credit facilities by approximately $0.4 million per annum. On February 2, 2023, we amended our Credit Agreement to replace LIBOR with Adjusted Term SOFR on the USD Term Loans effective from the start of the next interest period.annum.. We are also exposed to changes in EURIBOR interest rates on the senior secured term loan, subject to a minimum floor of 0.00%. As of December 31, 2022,2023, the principal outstanding of our EUR Term Loans of the senior secured term was €419.0 million. Based on the principal outstanding as of December 31, 2022,2023, each one eighth percentage point increase in the EURIBOR rate would correspondingly increase our interest expense on the senior secured credit facilities by approximately $0.6 million per annum.Foreign currency market riskWe are exposed to foreign currency risk by virtue of our international operations. For each of the twelve months ended December 31, 20222023 and 2021,2022, we derived approximately 50% of our revenue from operations outside the United States. Getty Images and its subsidiaries enter into transactions that are denominated in currencies other than Getty Images’ functional currency, including Euro and British pounds. Some of these transactions result in foreign currency denominated assets and liabilities that are revalued each month. Upon revaluation, transaction gains and losses are generated, which, with the exception of those related to long-term intercompany balances, are reported as exchange gains and losses in our consolidated statements of income in the periods in which the exchange rates fluctuate. Transaction gains and losses on foreign currency denominated long-term intercompany balances for which settlement is not planned or anticipated in the foreseeable future, are reported in “Accumulated other comprehensive” income in our consolidated balance sheets.Transaction gains and losses arising from revaluation of assets and liabilities denominated in the same foreign currencies may offset each other, in part, acting as a natural hedge. Where our assets and liabilities are not naturally hedged, we may enter into non-exotic foreign currency exchange contracts to reduce our exposure to transaction gains and losses. These foreign exchange contracts are generally up to eighteen months in original maturity and primarily require the sale of either Euro or British Pounds and the purchase of U.S. dollars. The contracts during the current period have not been designated as hedges as defined by ASC 815, “Derivatives and Hedging,” and therefore gains and losses arising from revaluation of these forward contracts are recorded as exchange gains and losses in our consolidated statements of income in the periods in which the exchange rates fluctuate. These gains and losses generally offset, at least in part, the gains and losses of the underlying exposures that are being hedged.64Item 8. Financial Statements and Supplementary Data.The information required by this item is incorporated by reference to the consolidated financial statements and accompanying notes set forth on pages F-2 through F-32through F-40 of this Annual Report on Form 10-K.66Item 9. Changes in and Disagreements With Accountants on Accounting and Financial Disclosure.Item 9A. Controls and Procedures.Evaluation of Disclosure Controls and ProceduresWe maintain disclosure controls and procedures (as that term is defined in Rules 13a-15(e) and 15d-15(e) under the Securities Exchange Act of 1934, as amended (“Exchange Act”))Act) that are designed to ensure that information required to be disclosed in the Company’s reports under the Exchange Act is recorded, processed, summarized and reported within the time periods specified in the SEC’s rules and forms and that such information is accumulated and communicated to our management, including our Chief Executive Officer and Chief Financial Officer, as appropriate, to allow timely decisions regarding required disclosures. Any controls and procedures, no matter how well-designed and operated, can provide only reasonable assurance of achieving the desired control objectives. Our management, with the participation of our Chief Executive Officer and Chief Financial Officer, has evaluated the effectiveness of the design and operation of our disclosure controls and procedures as of December 31, 2022. Based upon thatour evaluation our Chief Executive Officer and Chief Financial Officermanagement concluded that, as of December 31, 2022,2023, our disclosure controls and procedures were effective to accomplish their objectives at thea reasonable assurance level.Management’s Annual Report on Internal Control over Financial ReportingOur management is responsible for establishing and Attestation Report of the Registered Public Accounting FirmThis Annual Report does not include a report of management’s assessment regardingmaintaining adequate internal control over financial reporting. Internal controls over financial reporting (as such term is defineda process designed to provide reasonable assurance regarding the reliability of financial reporting and the preparation of our financial statements for external reporting purposes in Rules 13a-15(f)accordance with generally accepted accounting principles. Because of its inherent limitations, internal controls over financial reporting may not prevent or detect all misstatements.No evaluation of controls can provide absolute assurance that misstatement due to error or fraud will not occur or that all control issues or instances of fraud have been detected.Our management conducted an evaluation of the effectiveness of our internal controls over financial reporting based on the framework and 15d-15(f) undercriteria established in Internal Control – Integrated Framework (2013), issued by the Securities Exchange Act) orCommittee of Sponsoring Organizations of the Treadway Commission. Based on this evaluation, management concluded that, as of December 31, 2023, our internal controls over financial reporting were effective.As we are an emerging growth company and smaller reporting company, we are exempt from the requirement to obtain an attestation report of the company’s registered public accounting firm due to a transition period established by the rules of the SEC for newly public companies. Additionally,from our independent registered public accounting firm will not be required to opine on the effectivenessassessment of our internal control over financial reporting until we are no longer an emerging growth company.Changes in Internal Control over Financial ReportingThere were no changes in our internal controls over financial reporting, (as such term isas defined in Rules 13a-15(f) and 15d-15(f) underof the Securities Exchange Act)Act, that occurred during the period covered by this Annual Report that have materially affected, or are reasonably likely to materially affect, our internal control over financial reporting.Item 9B. Other Information.None.Insider Trading Arrangements and PoliciesDuring the fiscal quarter ended December 31, 2023, certain of our directors and officers (as defined in Section 16a-1(f) of the Securities Exchange Act of 1934, as amended) adopted or terminated trading arrangements intended to satisfy the affirmative defense conditions of Rule 10b5-1(c). Information regarding these Rule 10b5-1 trading arrangements is presented in the table below. There were no “non-Rule 10b5-1 trading arrangements” (as defined in Item 408(a) of Regulation S-K) adopted or terminated by any director or officer during the fiscal quarter ended December 31, 2023. The trading arrangements described below were entered into during an open insider trading window and were in compliance with our insider trading policies and procedures. Actual sale transactions will be disclosed publicly in filings with the SEC in accordance with applicable securities laws, rules, and regulations.67Trading Arrangement Name and Title Action Date Adopted/ Terminated Rule 10b5-1 Total Shares to be Sold Expiration Date2Chinh Chu1, DirectorTerminate 11/28/2023 X 16,333,198 08/01/2024 Chinh Chu1, DirectorAdopt 11/28/2023 X 16,333,198 11/01/2024 Mikael Cho, Senior Vice President, CEO - Unsplash Adopt 11/21/2023 X 108,987 10/24/2024 Kjelti Kellough, Senior Vice President, Secretary and General Counsel Adopt 11/16/2023 X 300,000 10/24/2024 Jennifer Leyden, Senior Vice President, Chief Financial Officer Adopt 11/16/2023 X 35,493 6/21/2024 Kenneth Mainardis, Senior Vice President, Global Content Adopt 11/22/2023 X 1,095,845 10/24/2024 Peter Orlowsky, Senior Vice President, Strategic Development Adopt 11/27/2023 X 158,061 10/24/2024 Michael Teaster, Senior Vice President, Chief of Staff Adopt 12/14/2023 X 185,000 10/24/2024 1 Chinh Chu is a current member of the Company’s Board. Mr. Chu currently holds his Getty Images’ securities through CC Capital SP, LP (“CC Capital”). Mr. Chu controls the investment decisions and voting powers of CC Capital. The 10b5-1 plan was entered into by CC Capital.2 Each plan terminates on the earlier of: (i) the expiration date listed in the table above, (ii) the first date on which all trades set forth in the plan have been executed, or (iii) such date the plan is otherwise terminated according to its terms.Item 9C. Disclosure Regarding Foreign Jurisdictions that Prevent InspectionsNot Applicable.6568Item 10. Directors, ExecutiveExecutive Officers and Corporate GovernanceExecutiveThe information required by this item will be included under the caption “Proposal 1: Election of Directors,” “Continuing Directors,” “Executive Officers,” “Corporate Governance,” “Committees of the Board” and DirectorsThe following persons are the members“Delinquent Section 16(a) Reports” of our boardProxy Statement for the 2024 Annual Meeting of directors and our executive officers asStockholders to be filed with the SEC within 120 days of the date of this Annual Report:NameAgePositionExecutive Officersfiscal year ended December 31, 2023 (the CraigPeters53ChiefExecutiveOfficer,Director(ClassIII)MikaelCho37SeniorVicePresident,CEO,UnsplashGrantFarhall47SeniorVicePresident,ChiefProductOfficerGeneFoca57SeniorVicePresident,ChiefMarketingOfficerNateGandert49SeniorVicePresident,ChiefTechnologyOfficerChris Hoel51Vice President, Chief Accounting OfficerKjeltiKellough49SeniorVicePresident,GeneralCounselJenniferLeyden49SeniorVicePresident,ChiefFinancialOfficerKenMainardis51SeniorVicePresident,GlobalContentPeterOrlowsky54SeniorVicePresident,StrategicDevelopmentAndrewSaunders59SeniorVicePresident,CreativeContentMichael Teaster56Senior Vice President, Chief of StaffLizanneVaughan54SeniorVicePresident,ChiefPeopleOfficerNon-EmployeeDirectorsMarkGetty62Chair(ClassII)PatrickMaxwell57Director(ClassI)James Quella73Director (Class I)Jeffrey Titterton50Director (Class I)ChinhChu56Director(ClassII)BrettWatson42Director(ClassII)MichaelHarris43Director(ClassIII)JonathanKlein62Director(ClassIII)HilarySchneider61Director(ClassIII)“Executive OfficersAllProxy Statement”) and is incorporated herein by reference. Additionally, a list of our executive officers other than Mikael Cho, Grant Farhall, Kjelti Kellough, Ken Mainardis and Andrew Saunders, are located indirectors appears below.Further, the United States.Craig Peters.Mr. Peters has served as our CEO since 2019. Mr. Peters served as our Senior Vice President, Chief Operating Officer from 2016 until 2019. Prior to 2016, Mr. Peters held a variety of Senior Vice President and Vice President roles with Getty Images. Prior to joining Getty Images, Mr. Peters held key leadership roles in media and technology within established and early-stage organizations. These included WireImage (acquired by Getty Images), FOX Sports Interactive, the PGA TOUR, Homestead.com (acquired by Intuit) and positions with A. T. Kearney and Eastman Kodak Company. In 2005, while at the PGA TOUR, Mr. Peters accepted an Emmy by the National Television Academy for Outstanding Achievement in Advanced Media Technology for the Enhancement of Original Television Content.We believe Mr. Peters is qualified to serve on our board of directors because of the perspective and experience he brings as our Chief Executive Officer.66Mikael Cho.Mr. Cho has served as Co-Founder and Chief Executive Officer for Unsplash since 2013 and is responsible for leading and operating Unsplash’s overall strategy and vision. In 2013, Mr. Cho founded Unsplash as a blog with ten photos and the mission to make world-class images accessible to enable everyone to create. Prior to founding Unsplash, Mr. Cho held co-founder and leadership roles at companies in the digital and creative sectors, including Crew, a marketplace for creative talent, Uber Foundry, a digital design studio, and WHYNOTBLUE Digital Agency.Grant Farhall.Mr. Farhall has served as our Senior Vice President, Chief Product Officer since 2020, where he is responsible for our overall product strategy and vision. In his role, Mr. Farhall oversees our e-commerce platform and websites, user experiences, customer research and SEO strategy, with the aim of making it easier for our customers to discover, license and share content to connect with their audiences, and drive impact for the business. His career at Getty Images spans more than a decade, including his prior role as Vice President of E-Commerce from 2019 until 2020 and his role as General Manager of iStock from 2017 until 2019. Prior to joining Getty Images, Mr. Farhall worked in broadcast journalism and managed several design and web development agencies.Gene Foca.Mr. Foca has served as our Senior Vice President, Chief Marketing Officer since 2017. As Chief Marketing Officer, Mr. Foca is responsible for the global marketing and communications organization, overseeing our brand portfolio, strategy and execution for all marketing channels from digital to communications, as well as marketing data science and operations. He has a wealth of experience across ecommerce, product and digital marketing, bringing over 20 years’ experience as a strategic and data driven marketing leader and general manager, launching and growing some of the world’s biggest content and ecommerce businesses. Mr. Foca joined Getty Images after nearly five years at Amazon in Seattle and New York from 2012 through 2016, working with Kindle and retail ecommerce, as well as a brief stint at Fresh Direct overseeing customer marketing. Prior to that, he served as SVP of Marketing for News Digital/News Corporation, where he focused on content app launches and subscription marketing from 2010 until 2011. He previously spent nearly 19 years at Time Warner in senior ecommerce and consumer marketing leadership roles, primarily with the Time Incorporated division from 1991 until 2010.Nate Gandert.Mr. Gandert has served as our Senior Vice President, Chief Technology Officer since 2016. In his role as Chief Technology Officer, Mr. Gandert is responsible for leading our overall technology strategy and vision, as well as our data and insights capabilities. Mr. Gandert oversees all advancements, innovations and operations delivered by the technology and product functions, including our search architecture, application and software development, e-commerce platform and websites with the aim of enriching our product offering to better serve customers worldwide. His remit also includes the development of internal and customer value using data, AI and machine learning.Mr. Gandert’s career at Getty Images spans over 13 years during which time he has served in various Vice President, Senior Director, Director and professional level roles. Prior to joining Getty Images, Mr. Gandert held vice president and leadership roles at other companies in the e-commerce and media sectors, holding more than 25 years of industry experience overall.Chris Hoel.Mr. Hoel has served as Vice President, Finance and Chief Accounting Officer of Getty Images since April 2014. Mr. Hoel is responsible for Getty Images’ Accounting, External Financial Reporting, and Finance Operations functions, and has 30 years of accounting and finance experience. He joined Getty Images in 2009 as the Director, Finance, before being promoted to Senior. Director, Finance in 2011, and then Vice President, Finance in 2013 and to Vice President, Chief Accounting Officer in 2014. Mr. Hoel previously held the role of Corporate Controller for Fisher Communications, Inc. from July 2005 to March 2009, and Controller/Associate Director of SEC Reporting for Xcyte Therapies from February 2001 to July 2005. Prior to his career with Xcyte Therapies, Mr. Hoel held progressively more responsible financial/accounting positions in both public accounting and private industry.Mr. Hoel earned his bachelor’s degree in Accounting from Central Washington University and has been a Certified Public Accountant since 1995.67Kjelti Kellough.Ms. Kellough has served as our General Counsel since 2019. In her role as General Counsel, Ms. Kellough leads our global Legal and Facilities functions and is responsible for overseeing its worldwide legal affairs, including corporate governance, compliance, governmental relations, litigation, intellectual property and corporate matters, and real estate and facilities matters. Prior to her role as our General Counsel, Ms. Kellough served as Vice President, Corporate Counsel from 2012 until 2019, overseeing corporate commercial legal matters for the Americas, as well as global legal support for our product and marketing functions. Ms. Kellough also held various Senior Director and Director roles with Getty Images. Ms. Kellough has more than 20 years of legal experience and prior to joining Getty Images in 2009, Ms. Kellough was a corporate finance partner at TingleMerrett LLP and an intellectual property and corporate associate at Blake, Cassels & Graydon LLP.Jennifer Leyden.Ms. Leyden has served as our Senior Vice President, Chief Financial Officer since January 2022. As Chief Financial Officer, Ms. Leyden is responsible for our Global Finance and Accounting, Financial Reporting and Analysis, Business Intelligence, Tax, Treasury, and Investor Relations functions. Ms. Leyden has more than 25 years of financial, accounting and leadership experience. She joined Getty Images in 2016 as the Senior Director, Enterprise Reporting and Analysis, before being promoted to Vice President, Financial Planning and Analysis in February 2019, Senior Vice President of Investor Relations and Finance in 2021 and to CFO in 2022. Before joining Getty Images, Ms. Leyden held the role of CFO for six years at Physique 57, a global fitness brand. In this role, she led Physique 57 through a period of rapid expansion and topline growth, driving scalable cost base efficiencies while navigating the business through a period of dynamic and explosive growth in the broader health and wellness industry. Ms. Leyden also spent 10 years at Sony Music Entertainment in several progressively impactful financial roles, ending her tenure there as the Senior Director of Finance for Columbia Records, one of the largest and most iconic record labels in the world. She launched her career by becoming licensed as a Certified Public Accountant and spent four years in public accounting.Ken Mainardis.Mr. Mainardis has served as our Senior Vice President, Global Content since 2019, where he oversees all of our content divisions across its editorial and creative spectrum. From sport, entertainment, news, and archival product lines, to managing our creative division, Mr. Mainardis has responsibility for overseeing the production and sourcing of photography, video, custom content solutions and associated services. Mr. Mainardis joined Getty Images in 2004 as Managing Editor, EMEA and a year later became Director of Editorial Photography with a focus on major editorial events until April of 2010. In April 2010, Mr. Mainardis took on the new role of Senior Director, Editorial Services and Events with a global brief responsible for editorial event operations and services. In 2013, he was appointed Vice President, Sports Imagery and Operations, before being promoted to Senior Vice President of Editorial in 2017. In 2019, Mr. Mainardis also assumed executive responsibility for our creative division. Mr. Mainardis began his career in 1995 as an assignments editor for the Reuters News Agency in their London bureau, before taking on the role of Global Sports Editor for Reuters Pictures in 2000. Mr. Mainardis is also a board member of the News Media Coalition, a not-for-profit trade organization protecting the news media’s access to events of public interest.Peter Orlowsky.Mr. Orlowsky has served as our Senior Vice President, Strategic Development since 2017. Mr. Orlowsky is responsible for evaluating and building key business strategies and partnerships, as well as for identifying and developing new business opportunities for Getty Images. In this role, Mr. Orlowsky drives global content licensing and distribution deals with leading technology, multimedia and service providers worldwide, as well as oversees our relationships with global partners. Mr. Orlowsky has been with Getty Images for over 20 years, serving several roles at various levels including Vice President and Senior Director, across Getty Images in business development and sales.Andrew Saunders.Mr. Saunders has served as our Senior Vice President, Creative Content since 2015 and has worked with Getty Images since 1991. In his role Mr. Saunders directs the creation of imagery and video used in award-winning advertising, design and editorial around the world. Working closely with photographers, filmmakers and art directors globally, Mr. Saunders plays a critical role in ensuring that we are continually evolving and provides fresh relevant content, which in turn engages and inspires communicators around the globe. His foresight into cultural and societal trends that shape visual communications drives our creative offering. Prior to his current role, Mr. Saunders held a number of positions within the creative department at Getty Images, including at the Vice President level. Mr. Saunders68began his career at Tony Stone Images, which was acquired by Getty Images, following five years as a commercial photographer. Within Tony Stone Images, and subsequently Getty Images, he provided a major hand in leading the evolution of pre-shot imagery from the traditional stock photo editor approach into what has become the accepted norm — a global creative team of researchers and art directors that are closely aligned with the methods of an advertising agency. While he trained as a photographer, Mr. Saunders’ particular expertise lies in being able to apply the trends that he and his team see in advertising and in society, to the forging of the next generation of photography.Michael Teaster.As our senior vice president, Chief of Staff, since September 2022, Mr. Teaser supports our Global Leadership Team and our board of directors with company planning, priority management, and delivery. Mr. Teaser has 25 years of industry‑related experience and has served in several executive roles for Getty Images. Prior to his current role, Mr. Teaser served as Senior Vice President of Business Operations from 2017 to 2019, before which he also served as Senior Vice President of Global Sales from 2008 to 2017, among other executive roles. Previously, Mr. Teaser served as Vice President of Licensee Relations for The Image Bank, a company that was later acquired by Getty Images in 1999.Lizanne Vaughan.Ms. Vaughan has served as our Senior Vice President, Chief People Officer since 2019. In her role Ms. Vaughan oversees all aspects of our diverse global workforce. As Chief People Officer, Ms. Vaughan drives corporate culture and values, ensuring we have a world-class human resources strategy to support growth and success, further strengthening our competitive advantage through commitment to culture, diversity and inclusion and aligning human capital to company strategy. Her responsibilities also include directing and leading people-centric global initiatives and programs that align with our objectives, including staffing, diversity and inclusion initiatives, employee and leadership development, employee relations, compensation and benefits. Ms. Vaughan has worked with Getty Images for over 16 years, including as Vice President, Corporate Counsel from 2012 until 2019 overseeing global claims and litigation matters for the business, serving as employment and legal compliance counsel. Ms. Vaughan also served in various Senior Director and Director roles within the legal department. Prior to her time with Getty Images, Ms. Vaughan served as an Instructor at the University of Washington, as well as Seattle University, and as counsel at Oles Morrison Rinker & Baker LLP.Non-Employee DirectorsMark Getty.Mr. Getty has served as the Chair of our board of directors since he co-founded Getty Images in March 1995 and was Executive Chair of Getty Images through 2005. From 2005 to 2018, he was a non-executive director on our board of directors and in 2018 resumed the role of Chair on a resumption of control of Getty Images by the Getty Family Stockholders.In the late 1980s, Mr. Getty began his professional career with Kidder Peabody in New York and then joined Hambros Bank Limited in London in 1991.In his capacity as Trustee and Director of various Getty family entities, Mr. Getty oversees a diverse program of investments in all asset classes. In addition, he has been particularly involved in the family’s direct private equity investment activities, which have included: Wisden Crincinfo, a leading online publisher of cricket data; Hawk-Eye, a sports technology business that is a leader in ball tracking for officiating and broadcast enhancement in tennis, soccer and cricket; Hakluyt, a UK-based provider of commercial and strategic intelligence and research services to major corporate and financial institutions; 7digital, a leading B2B digital music platform in the UK; and &Beyond Group, a leading luxury adventure travel and lodging business in Africa.Mr. Getty was a trustee of the National Gallery in London between 1999 and 2015, as well as its Chair between 2008 and 2015. He was appointed KBE in 2016 in recognition of his services to the Arts. In 2017, he became the Chair of Trustees of the British School in Rome.We believe Mr. Getty is qualified to serve on our board of directors because of his historical familiarity with our business and his extensive experience in supporting the growth of our business.69James Quella.Mr. Quella has served as a director of Getty Images since July 2022, and also serves as a member of the Audit Committee. Mr. Quella previously served as a Director of CCNB II from August 2020 through the Closing Date of July 2022, and as a director on our board of directors since the Closing Date. Mr. Quella currently serves as a director and has served on the Compensation and Audit Committees of Dun & Bradstreet Corporation since April 2019. Mr. Quella has previously served as chairman of the board of Michaels Companies, Inc. from March 2019 to April 2021, having previously served as Lead Independent Director since November 2018 and as a Director of Fidelity & Guaranty Life Insurance Company from 2017 to 2020. Mr. Quella retired as a Senior Managing Director, Senior Operating Partner and Head of the Portfolio Operations Group at Blackstone, an investment business on behalf of pension funds, large institutions and individuals, in the Private Equity Group in June 2013, having served in these roles since February 2003. Mr. Quella was Managing Director in Private Equity and Senior Operating Partner and Head of the Portfolio Operations Group at DLJ Merchant Banking from 2000 to 2003. In the last 20 years, Mr. Quella has been a director of Advanstar, Allied Waste, Catalent Pharma Solutions, Inc., Columbia House, Celanese Corporation, Decrane Aerospace, DJO Global, Inc., Freescale Semiconductor, Inc., Graham Packaging Company, L.P., Houghton Mifflin Harcourt Company, Intelenet Global Services, Jostens, Lionbridge Technologies, Inc., The Nielsen Company, Vanguard Health Systems, Inc., and Von Hoffman. Mr. Quella received a B.A. in International Studies from The University of Wisconsin-Madison and an M.B.A. with Dean’s Honors from the University of Chicago Graduate School of Business.We believe Mr. Quella’s qualifications to serve on our board of directors include his financial expertise, as well as his significant experience in working with companies transitioning from control by private equity sponsors.Patrick Maxwell.Mr. Maxwell has served as a member of our board of directors since October 2012. Mr. Maxwell has followed a career in private equity investment management since 1991, initially working with the UK-based investment bank, Hambros. Amongst other deals he was involved with, Mr. Maxwell led Hambros’ co-investment alongside the Getty family in the founding of Getty Images. Mr. Maxwell also spent four years living and working in South Africa establishing an investment banking business for Hambros in that region. In May 2004, Mr. Maxwell began working with Mark Getty and the Getty family office, Sutton Place. Mr. Maxwell’s primary focus has been to build family wealth via long term business-building investments in the content-based media sector, including Getty Images, the Wisden Cricinfo group, 7 Digital, Hawk-Eye Innovations and Hakluyt & Co. Mr. Maxwell has also been involved in the oversight of Getty family interests in Wormsley Estate (the Getty family’s home and multi-activity rural estate in the UK) and in &Beyond (a South African-based luxury adventure travel and lodging business).In addition to his board position at Getty Images, Mr. Maxwell has served on the board of directors of Getty Capital Limited since June 2018, &Beyond since July 2007, Tara Getty Foundation since April 2009, Sutton Place Foundation since May 2010 and The Africa Foundation Trust since November 2014. Mr. Maxwell also served as a Partner of Sutton Place Managers LLP from May 2004 to May 2019. Mr. Maxwell was a Trustee of the Royal Ballet School from 2000 to 2011, a Trustee and Investment Committee Chairman of the Henry Smith Charity, £1 billion endowment-based grant-making charity, from 2011 to 2019 and a Director of the UK Tennis & Rackets Association from 2013 to 2018. Mr. Maxwell is a graduate of Oxford University and qualified as a Chartered Accountant with PWC in 1990.We believe Mr. Maxwell is qualified to serve on our board of directors because of his significant investment and financial expertise, and his historical familiarity with our business and his extensive experience in the content-based media sector.Chinh E. Chu.Mr. Chu served as Chief Executive Officer and Director of CCNB from May 2020 through the Closing Date, and as a director on our board of directors since the Closing Date. Mr. Chu has over 30 years of investment and acquisition experience. Since August 2020, Mr. Chu has been the Chief Executive Officer and Director of CC Neuberger Principal Holdings III (“CCNB3”) (NYSE: PRPC), a blank check company co-founded by CC Capital Partners, LLC (“CC Capital”) and formed for substantially similar purposes as our company, which has not yet announced or completed its initial business combination. Mr. Chu also served as Chief Executive Officer and Director of CCNB1 (NYSE: PCPL) from August 2020 until the consummation of the business combination with E2open Holdings, LLC in February 2021 (NYSE: ETWO). Mr. Chu now serves as the chairman of the Board of E2open (NYSE: ETWO) since February 2021. Mr. Chu served as the Vice Chairman of Collier Creek Holdings (“Collier Creek”) (NYSE: CCH), a blank check company co-founded by him and formed for substantially similar purposes as CCNB. On August 28, 2020, Collier Creek consummated the acquisition of Utz Brands Holdings, LLC, the parent of Utz Quality Foods, LLC, a leading manufacturer of branded salty snacks, to form Utz Brands (NYSE: UTZ). In 2016, Mr. Chu co-founded CF Corporation for substantially similar purposes as CCNB. CF Corporation sold 69.070million units in its IPO, generating gross proceeds of $690.0 million. On November 30, 2017, CF Corporation consummated the acquisition of Fidelity & Guaranty Life, a provider of annuities and life insurance products, for approximately $1.835 billion plus the assumption of $405 million of existing debt, and related transactions. In connection with the FGL business combination, the name of the company was changed from “CF Corporation” to “FGL Holdings” (NYSE: FG). Mr. Chu served as Co-Executive Chairman of FGL Holdings.Mr. Chu is the founder and the Senior Managing Partner of CC Capital, a private investment firm which he founded in November 2015. As Senior Managing Director of CC Capital, Mr. Chu led the effort to take Dun & Bradstreet private in a $7.2 billion deal that closed in February 2019. Before founding CC Capital, Mr. Chu worked at Blackstone from 1990 to December 2015, where Mr. Chu led numerous investments across multiple sectors, including technology, financial services, chemicals, specialty pharma and healthcare products, and packaging. Mr. Chu was a Senior Managing Director at Blackstone from 2000 until his departure in December 2015, where he served, at various points, as a member of Blackstone’s Executive Committee, the Co-Chair of Blackstone’s Private Equity Executive Committee and as a member of Blackstone Capital Partners’ Investment Committee.Before joining Blackstone in 1990, Mr. Chu worked at Salomon Brothers in the Mergers & Acquisitions Department. In addition to Mr. Chu’s role as Chairman of E2open, he has served on the boards of directors of Dun & Bradstreet (NYSE: DNB) since 2019 and E2open Holdings, LLC (NYSE: ETWO) and CCNB3 (NYSE:PRPC) since 2020. Mr. Chu previously served on the board of directors of AVINTIV from 2011 to 2012, BankUnited Inc. from 2009 to 2014, Kronos Incorporated from 2014 to 2015, Biomet, Inc. from July 2007 to September 2007 and from 2013 to 2015, Freescale Semiconductor, Ltd. from 2011 to 2015, HealthMarkets, Inc. from 2006 to 2016 and NCR Corporation (NYSE: NCR) from 2015 to 2021. Mr. Chu also previously served on the board of directors of Stearns Mortgage, Alliant Insurance Services, Inc., AlliedBarton Security Services, Celanese Corporation, DJO Global, Inc., Graham Packaging, the London International Financial Futures and Options Exchange, Nalco Company, Nycomed, Stiefel Laboratories and SunGard Data Systems, Inc. Mr. Chu received a B.S. in Finance from the University of Buffalo.We believe Mr. Chu is qualified to serve on our Board because of his substantial experience in mergers and acquisitions, corporate finance and strategic business planning; his track record at CC Capital and Blackstone and in advising and managing multi-national companies; and his experience serving as a director for various public and private companies.Brett Watson.Mr. Watson has served as a member of our board of directors since February 2019. Mr. Watson has been the President of Koch Equity Development LLC since December of 2020. Before that, Mr. Watson was a Senior Managing Director of Koch Equity Development LLC.In addition to his board position at Getty Images, Mr. Watson currently serves on the boards of directors of the parent companies of Infor, Hexagon AB, Transaction Network Services, and MI Windows and Doors. He formerly served on the boards of directors of ADT Inc., Solera Holdings Inc., Globus, and the Flint Group. Mr. Watson earned both his B.S. and M.B.A. degrees from Binghamton University.We believe Mr. Watson is qualified to serve on our board of directors because of his broad financial experience and extensive knowledge of corporate governance.Michael Harris.Mr. Harris has served as a member of the our board of directors since February 2019. Since 2019, Mr. Harris has also served as a Managing Director of Koch Equity Development, where he has been employed since October 2013. Mr. Harris is responsible for the origination, evaluation and execution of acquisitions and investments for Koch Industries, Inc. In this capacity, he evaluates opportunities across industries with specific expertise in the software, technology, aerospace and defense, and industrial manufacturing sectors. Prior to joining Koch, Mr. Harris has worked for Bank of America Merrill Lynch advising clients on mergers and acquisitions, capital deployment and structured equity capital alternatives from 2011 to 2013. He has also previously worked at Orbital Sciences Corporation as a mechanical engineer in their Launch Systems group from 2005 to 2011.In addition to his board position at Getty Images, Mr. Harris has served as a board observer of Infor since 2017. He formerly served on the board of Truck-Lite, a leading manufacturer of lighting solutions for commercial and off-road vehicles from December 2015 to December 2019. Mr. Harris holds his B.S. and M.S. degrees in Mechanical Engineering from Brigham Young University. He also holds a M.B.A degree from Columbia Business School.71We believe Mr. Harris is qualified to serve on our board of directors because of his broad experience in the finance, software and technology industries, as well as his product development experience.Jonathan Klein.Mr. Klein has served as a member of our board of directors since 1995. He currently serves as its Deputy Chairman and has served as a member of our audit committee since 2016. Mr. Klein led Getty Images as a Co-Founder and Chief Executive Officer for more than 20 years from 1995 to 2015. Mr. Klein is currently an Executive in Residence at General Catalyst, a venture capital firm focused on early stage and growth investments, where he has been since April 2018. Mr. Klein also serves on the boards of directors of Squarespace since July 2010, Etsy, Inc. since June 2011 and as chairman of the board of directors of Jumia Technologies AG since December 2018. He currently serves as a director of multiple private companies and non-profit organizations. Mr. Klein received an LL.M. from the University of Cambridge in 1992.We believe that Mr. Klein is qualified to serve as a member of our board of directors because of his significant investment and financial expertise, his historical familiarity with our business, and his experience as a director of several publicly traded companies coupled with his knowledge of our industry.Hilary Schneider.Ms. Schneider has served as a member of our board of directors since 2020 and as Chief Executive Officer of the Shutterfly family of brands, a leading ecommerce and manufacturing platform for personalized products and custom design, since 2020. Ms. Schneider previously served as Chief Executive Officer of Wag!, the country’s largest on-demand mobile dog walking and dog care service, from 2018 to 2019. Prior to this role, Ms. Schneider served as President and CEO of LifeLock, the leader in identity theft protection, through its public listing and acquisition by Symantec, as well as serving in a series of executive positions at Yahoo! from 2006 to 2010 and in several senior leadership roles at Knight Ridder from 2002 to 2005.In addition to her board position at Getty Images, Ms. Schneider also serves on the boards of Vail Resorts and Digital Ocean since 2010, and water.org since 2011. Ms. Schneider holds a B.A. in economics from Brown University and an M.B.A. from Harvard Business School.We believe Ms. Schneider is qualified to serve on our board of directors because of her comprehensive experience in the content-based media sector and her extensive knowledge of high-growth companies.Jeffrey Titterton.Mr. Titterton has served as our director since November 2022, currently serves as the Chief Marketing Officer of Stripe, Inc., and served as the Chief Operating Officer of Zendesk Inc. from April 2021 until November 15, 2022. He previously served as Zendesk Inc.’s Chief Marketing Officer from October 2018 until April 2021 and its Senior Vice President, Marketing from May 2017 to October 2018. From January 2017 to May 2017, Mr. Titterton served as the Head of Global Campaign and Engagement Marketing for Adobe Inc., a software company, and as Head of Engagement Marketing, Creative Cloud, from August 2013 to January 2017. Prior to that, Mr. Titterton served as the Chief Marketing Officer for 99designs, a graphic design marketplace, from August 2011 to August 2013. Mr. Titterton holds a B.A. in English with a concentration in economics from Cornell University.We believe Mr. Titterton is qualified to serve on our board of directors because of his comprehensive public company experience and his extensive knowledge of e-commerce.Board CompositionOur business and affairs are organized under the direction of our board of directors. Our board of directors currently consists of ten members. The primary responsibilities of our board of directors is to provide oversight, strategic guidance, counseling and direction to our management. Our board of directors meets on a regular basis and additionally as required.72Our board of directors is divided into three classes, Class I, Class II and Class III, with members of each class serving staggered three-year terms. Currently, our board of directors is divided into the following classes:●Class I, which consists of Patrick Maxwell, James Quella and Jeffrey Titterton and whose term will expire at the first annual meeting of stockholders to be held in 2023;●Class II, which consists of Mark Getty, Brett Watson and Chinh Chu whose term will expire at the Company’s second annual meeting of stockholders to be held in 2024; and●Class III, which consists of Hilary Schneider, Michael Harris, Jonathan Klein and Craig Peters, whose terms will expire at the Company’s third annual meeting of stockholders to be held in 2025.At each annual meeting of stockholders to be held after the initial classification, the successors to directors whose terms then expire will be elected to serve from the time of election and qualification until the third annual meeting following their election and until their successors are duly elected and qualified. This classification of our board of directors may have the effect of delaying or preventing changes in our control or management.In connection with the execution of the Business Combination Agreement, the Sponsor, the equityholders of the Sponsor, certain equityholders of Legacy Getty and certain other parties thereto entered into the Stockholders Agreement with Getty Images, pursuant to which, among other things, the initial composition of Board consists of (i) three directors nominated by Getty Investments, (ii) two directors nominated by Koch Icon, (iii) one director nominated by CC Capital, (iv) the chief executive officer of Getty Images and (v) a number of independent directors sufficient to comply with the requisite independence requirements of the NYSE and the rules and regulations of the SEC. The number of nominees that each of Getty Investments, Koch Icon and CC Capital will be entitled to nominate pursuant to the Stockholders Agreement is subject to reduction based on the aggregate number of shares of Class A Common Stock held by such stockholders, as further described in the Stockholders Agreement attached as an exhibit to this Annual Report.Director IndependenceOur board of directors has determined that each of the directors on our board of directors, other than Craig Peters and Mark Getty, qualify as “independent directors,” as defined under the rules of the NYSE, and that our board of directors consists of a majority of “independent directors,” as defined under the rules of the SEC and the NYSE relating to director independence requirements. In addition, our board of directors is subject to the rules of the SEC and the NYSE relating to the membership, qualifications, and operations of the audit committee, as discussed below.Role of Our Board of Directors in Risk Oversight/Risk CommitteeOne of the key functions of our board of directors is informed oversight of the Company’s risk management process. Our board of directors does not have a standing risk management committee, but rather administers this oversight function directly through our board of directors as a whole, as well as through various standing committees of our board of directors that address risks inherent in their respective areas of oversight. In particular, (i) our board of directors is responsible for monitoring and assessing major risks facing the Company, (ii) the audit committee of our board of directors oversees risks relating to financial matters, financial reporting and auditing, and (iii) the compensation committee of our board of directors oversees risks relating to the design and implementation of our compensation policies and procedures.Board CommitteesOur board of directors has three standing committees—an audit committee, a compensation committee, and a nominating and corporate governance committee. We may from time to time establish other committees. Copies of the charters for each committee are available on our website.Audit CommitteeOur audit committee consists of Hilary Schneider, Jonathan Klein and James Quella. Our board of directors has determined that each of the members of the audit committee satisfies the independence requirements of the NYSE corporate governance standards and Rule 10A-3 under the Exchange Act and is financially literate (as defined under the rules of the NYSE). In arriving at this determination, our board of directors has examined each audit committee member’s scope of experience, the nature of their prior and/or current employment and all other factors determined to be relevant under the rules and regulations of the NYSE and the SEC.73Hilary Schneider serves as the chair of the audit committee. Our board of directors has determined that Ms. Schneider qualifies as an audit committee financial expert within the meaning of SEC regulations and meets the financial sophistication requirements of the NYSE rules. In making this determination, our board of directors has considered formal education and previous professional experience in financial roles. Both our independent registered public accounting firm and management periodically meet privately with the audit committee members.The functions of the audit committee include, among other things:●evaluating the performance, independence and qualifications of our independent auditors and determining whether to retain our existing independent auditors or engage new independent auditors;●reviewing our financial reporting processes and disclosure controls;●reviewing and approving the engagement of our independent auditors to perform audit services and any permissible non-audit services;●reviewing the quality and adequacy of our internal control policies and procedures, including the responsibilities, budget and staffing of our internal audit function;●reviewing with the independent auditors, and internal audit department, if applicable, the annual audit plan;●obtaining and reviewing at least annually a report by the Company’s independent auditors describing the independent auditors’ internal quality control procedures, issues raised by the most recent internal quality-control review and all relationships between the independent auditor and the Company, if any;●monitoring the rotation of the lead partner of our independent auditor on the our engagement team as required by law;●prior to engagement of any independent auditor, and at least annually thereafter, reviewing relationships that may reasonably be thought to bear on their independence, and assessing and otherwise taking the appropriate action to oversee the independence of our independent auditor;●reviewing our annual and quarterly financial statements and reports, including the disclosures contained in “Item 7. Management’s Discussion and Analysis of Financial Condition and Results of Operations,” and discussing the statements and reports with our independent auditors and management;●reviewing with our independent auditors and management significant issues in internal audit reports and responses by management;●reviewing with management and our auditors any earnings press releases and other public announcements related to financials;●establishing and overseeing procedures for the receipt, retention and treatment of complaints received by the Company regarding accounting, internal accounting controls or auditing matters;●preparing the report that the SEC requires in our annual proxy statement;●reviewing and providing oversight of any related party transactions in accordance with our related party transaction policy and reviewing and monitoring compliance with legal, regulatory and ethical responsibilities;●reviewing our major financial risk exposures; and●reviewing and evaluating on an annual basis the performance of the audit committee and the audit committee charter.The composition and function of the audit committee complies with all applicable requirements of the Sarbanes-Oxley Act and all applicable SEC rules and regulations. We will comply with future requirements to the extent they become applicable to the Company.Compensation CommitteeOur compensation committee consists of Brett Watson, Chinh Chu and Hilary Schneider. Our board of directors has determined that each of the members of the compensation committee is a non- employee director, as defined in Rule 16b-3 promulgated under the Exchange Act, and satisfies the independence requirements of the NYSE. Mr. Watson serves as the chair of the compensation committee. The functions of the compensation committee include, among other things:●reviewing and approving the corporate goals and objectives that pertain to the determination of executive compensation;●reviewing and approving the compensation and other terms of employment of the our executive officers;●making recommendations to our board of directors regarding the adoption or amendment of equity and cash incentive plans and approving amendments to such plans to the extent authorized by the board;●reviewing and making recommendations to our board of directors regarding the type and amount of compensation to be paid or awarded to our non-employee board members;●reviewing and establishing stock ownership guidelines for executive officers and non-employee board members;74●reviewing and assessing the independence of compensation consultants, independent legal counsel and other advisors as required by Section 10C of the Exchange Act;●administering our equity incentive plans;●reviewing and approving the terms of any employment agreements, severance arrangements, transition or consulting agreements, retirement agreements and change-in-control agreements or provisions and any other material arrangements for our executive officers;●approving or recommending for approval the creation or revision of any clawback policy allowing the Company to recoup compensation paid to officers, directors and employees;●reviewing with management our disclosures under the caption “Compensation Discussion and Analysis” in our periodic reports or proxy statements to be filed with the SEC, to the extent such caption is included in any such report or proxy statement;●preparing an annual report on executive compensation that the SEC requires in our annual proxy statement; and●reviewing and evaluating on an annual basis the performance of the compensation committee and recommending such changes as deemed necessary to our board of directors.The composition and function of the compensation committee complies with all applicable requirements of the Sarbanes-Oxley Act and all applicable SEC and NYSE rules and regulations. We will comply with future requirements to the extent they become applicable to the Company.Nominating and Corporate Governance CommitteeThe Company’s nominating and corporate governance committee consists of Michael Harris and Patrick Maxwell. Our board of directors has determined that each of the members of nominating and corporate governance committee satisfies the independence requirements of the NYSE and the SEC. Mr. Harris serves as the chair of the nominating and corporate governance committee.The functions of the nominating and corporate governance committee include, among other things:●identifying, reviewing and making recommendations of candidates to serve on our board of directors;●evaluating the performance of our board of directors, committees of the board and individual directors and determining whether continued service on our board of directors is appropriate;●evaluating nominations by stockholders of candidates for election to our board of directors;●evaluating the current size, composition and governance of our board of directors and its committees and making recommendations to the board for approvals;●reviewing the leadership structure of our board of directors, including the separation of the Chair and Chief Executive Officer roles and/or appointment of a lead independent director of the board;●reviewing corporate governance policies and principles and recommending to our board of directors any changes to such policies and principles;●reviewing issues and developments related to corporate governance;●reviewing, approving, and monitoring directors’ compliance with our Code of Business Conduct and Ethics;●assisting the Company in fulfilling its corporate responsibility strategy; and●reviewing periodically the nominating and corporate governance committee charter, structure and membership requirements and recommending any proposed changes to our board of directors, including undertaking an annual review of its own performance.The composition and function of the nominating and corporate governance committee complies with all applicable requirements of the Sarbanes-Oxley Act and all applicable SEC and NYSE rules and regulations. We will comply with future requirements to the extent they become applicable.Limitation on Liability and Indemnification of Directors and OfficersOur Amended and Restated Certificate of Incorporation limits the Company’s directors’ liability to the fullest extent permitted under the DGCL. The DGCL allows for directors of a corporation to not be personally liable for monetary damages for breach of their fiduciary duties as directors, except for liability:●for any transaction from which the director derives an improper personal benefit;75●for any act or omission not in good faith or that involves intentional misconduct or a knowing violation of law;●for any unlawful payment of dividends or redemption of shares; or●for any breach of a director’s duty of loyalty to the corporation or its stockholders.If the DGCL is amended to authorize corporate action further eliminating or limiting the personal liability of directors, then the liability of our directors will be eliminated or limited to the fullest extent permitted by the DGCL, as so amended. The DGCL and the our Amended and Restated Bylaws provide that the Company will, in certain situations, indemnify the Company’s directors and officers and may indemnify other employees and other agents, to the fullest extent permitted by law. Any indemnified person is also entitled, subject to certain limitations, to advancement, direct payment, or reimbursement of reasonable expenses (including attorneys’ fees and disbursements) in advance of the final disposition of the proceeding.We maintain a directors’ and officers’ insurance policy pursuant to which our directors and officers are insured against liability for actions taken in their capacities as directors and officers. We believe these provisions in our Amended and Restated Certificate of Incorporation and Amended and Restated Bylaws and the indemnification agreements are necessary to attract and retain qualified persons as directors and officers.Code of Business Conduct and Business Ethics for Employees, Executive Officers, and DirectorsThe Company has adopted a Code of Conduct and Business Ethics applicable to its directors, executive officers and employees, including its principal executive officer, principal financial officer, principal accounting officer or controller, or persons performing similar functions that complies with the rules and regulations of the NYSE. The Code of Conduct and Business Ethics codifies the business and ethical principles that govern all aspects of the Company’s business. A copy of the Code of Conduct and Business Ethics has been filed with the SEC and is provided on our website, gettyimages.com. The Company will disclose on its website all disclosures that are required by law or the NYSE listing standards concerning any amendments to or waivers of certain provisions of its Code of Conduct and Business Ethics. The information on any of our websites is deemed not to be incorporated in this Annual Report.Executive CompensationThis discussion may contain forward-looking statements thatOfficers and Board of DirectorsThe following persons are based onthe members of our current plans, considerations, expectations and determinations regarding future compensation programs. Actual compensation programs that we adopt may differ materially from the prior or planned programs summarized or referred to in this discussion. References in this section to our compensation committee refer to Legacy Getty’s compensation committee prior to the completionboard of the Business Combination and to our current compensation committee after the completion of the Business Combination.The Company is an “emerging growth company,” as defined under the JOBS Act. As an emerging growth company, we have opted to comply with the executive compensation rules applicable to “smaller reporting companies,” as such term is defined under the Securities Act of 1933, as amended, which require compensation disclosure for our principal executive officerdirectors and our next two most highly compensated executive officers other than our principal executive officer as of the end of the last completed fiscal year (collectively, the “Named Executive Officers” or “NEOs”). Also, as an emerging growth company, we are not required to include, and have not included, a Compensation Discussion and Analysis (CD&A) and certain of the other compensation tables required by Item 402 of Regulation S-K. Further, as an emerging growth company, we are exempt from certain other requirements related to executive compensation, including the requirement to hold advisory votes on the executive pay of our NEOs, the requirement to disclose the CEO pay ratio and the requirement to disclose pay versus performance information.The following executives were our Named Executive Officers as of December 31, 2022:●Craig Peters, Chief Executive Officer (“CEO”);●Nathaniel Gandert, Senior Vice President and Chief Technology Officer;●Gene Foca, Senior Vice President and Chief Marketing Officer; and●Milena Alberti-Perez, former Senior Vice President and Chief Financial Officer (until January 5, 2022).Ms. Alberti-Perez has been included as an NEO in accordance with SEC rules because Ms. Alberti-Perez would have been one of the two most highly compensated executive officers as of the enddate of the last completed fiscal year but for the fact that she was not serving in such capacity as of December 31, 2022.76To achieve our compensation objectives, we historically have provided our executives with a compensation package consisting of the following elements:Name Position Compensation ElementCraig Peters Compensation PurposeChief Executive Officer, Director (Class III) Base SalaryProvide a fixed level of cash compensation to attract, retain and reward talented and skilled executive talent that is competitive for the talent specific to scope and impact of job responsibilities and our industryAnnual Cash Bonus (“Non-Sales Bonus Plan”)Incentivize and reward our executives for annual contributions to our performance by tying to both Getty Images and individual performance metricsLong-Term Incentive CompensationPromote an ownership culture and the maximization of long-term stockholder value by aligning the interests of our executives and stockholders2022 Summary Compensation TableThe following table provides information regarding the compensation earned by or paid to our NEOs with respect to the years indicated.(1)Reflects base salary actually paid in 2022. See “— Base Salary” below for more information. The 2022 amount for Ms. Alberti-Perez includes base salary paid following her departure as our Chief Financial Officer on January 4, 2022 but prior to her termination of employment.(2)Mr. Foca’s bonus reflects a one-time go-public transaction related bonus paid on September 2, 2022 in the amount of $10,000. Ms. Alberti-Perez’ bonus reflects signing-bonus granted on January 20, 2021 in the amount of $50,000 and for which repayment was not triggered as a result of her departure.(3)On April 4, 2021, our compensation committee granted an option to purchase 1,800,000 Legacy Getty Common Shares to Ms. Alberti-Perez (the “Option”) in connection with her commencement of employment as Senior Vice President, andCEO, UnsplashGrant Farhall Senior Vice President, Chief Product Officer Gene Foca Senior Vice President, Chief Marketing Officer Nate Gandert Senior Vice President, Chief Technology Officer Chris Hoel Vice President, Chief Accounting Officer Kjelti Kellough Senior Vice President, General Counsel Jennifer Leyden Senior Vice President, Chief Financial Officer. Amounts represent the grant date fair valueOfficerKen Mainardis Senior Vice President, Global Content Peter Orlowsky Senior Vice President, Strategic Development Michael Teaster Senior Vice President, Chief of the stock option granted to Ms. Alberti-Perez, as computedStaffLizanne Vaughan Senior Vice President, Chief People Officer Daine March Weston Senior Vice President, Ecommerce Non-Employee Directors Mark Getty, self-employed, serving in accordance with FASB ASC Topic 718, excluding estimated forfeitures. See various capacities including Trustee and director of various Getty family entities“Note 17 — Equity-Based Compensation” to our audited consolidated financial statements containedChair (Class II)Patrick Maxwell, Private Equity Management Director (Class I) James Quella, self-employed Director (Class I) Jeffrey Titterton, Chief Marketing Officer, Stripe, Inc. Director (Class I) Chinh Chu, Senior Managing Director and Founder, CC Capital Partners, LLC Director (Class II) Brett Watson, President, Koch Equity Development LLC Director (Class II) Michael Harris, Managing Director of Koch Equity Development LLC Director (Class III) Jonathan Klein, Executive in this Annual Report for the assumptions used in computing this option’s grant date fair value. Ms. Alberti-Perez exercised the vested portion of the Option prior to completion of the Business Combination with all unvested Options cancelledResidence at the date of termination of her employment.General CatalystDirector (Class III) (4)Reflects non-equity incentive plan compensation for 2022 paid to each NEO pursuantHilary Schneider, Strategic Advisor to the Non-Sales Bonus Plan. See board of directors of Shutterfly“—Non Sales Bonus Plan” below for more information.Director (Class III)7769(5)2022 amounts include reportable income on our split-benefit life insurance policies ($4,083, $1,532, $2,497 and $328 for Mr. Peters, Mr. Gandert, Mr. Foca and Ms. Alberti-Perez, respectively) and a tax gross up for said income ($4,259, $493, $1,407 and $405 for Mr. Peters, Mr. Gandert, Mr. Foca and Ms. Alberti-Perez, respectively), gym membership allowance of $600 for Mr. Peters and Mr. Gandert, imputed income associated with executive supplemental life policies ($3,793, $1,771, $6,218 and $257 for Mr. Peters, Mr. Gandert, Mr. Foca and Ms. Alberti-Perez, respectively), employer matching contributions under our 401(k) plan ($12,200, $12,200, $12,200 and $5,389 for Mr. Peters, Mr. Gandert, Mr. Foca and Ms. Alberti-Perez, respectively) and severance payments in the amount of $813,672 for Ms. Alberti-Perez (including cash consideration in lieu of 2021 Non-Sales Bonus payout, as well as monthly severance payments and COBRA subsidy as per the terms of the executive employment agreement described under Potential Payments Upon Termination below) .(6)2021 amounts include reportable income on our split-benefit life insurance policies ($3,460, $921 and $1,311 for Mr. Peters, Ms. Alberti-Perez and Mr. Gandert, respectively), a tax gross-up for said income ($2,132, $677 and $422 for Mr. Peters, Ms. Alberti-Perez and Mr. Gandert, respectively), a $303 cash payment under the anniversary program for Mr. Peters in recognition of his 15 years of service, gym membership allowance of $600 for Mr. Peters and Mr. Gandert, imputed income associated with executive supplemental life policies ($4,920, $657 and $2,051 for Mr. Peters, Ms. Alberti-Perez and Mr. Gandert, respectively), and employer matching contributions under our 401(k) plan ($11,600, $6,588 and $11,600 for Mr. Peters, Ms. Alberti-Perez and Mr. Gandert, respectively).(7)Mr. Foca’s 2021 compensation is notItem 11. Executive CompensationThe information required by this item will be included as he was not an NEO in 2021.Narrative Disclosure to 2022 Summary Compensation TableFor 2022, the compensation program for our NEOs consisted of base salary and a cash bonus opportunity under the Non-Sales Bonus Plan. In addition, our NEOs were covered by company-sponsored executive lifecaption “Executive Compensation” and disability benefits“Compensation Committee Interlocks and were eligible to participate in any employee benefit programs generally available to all employees. Our compensation committee did not grant any equity awards to our NEOs in 2022.Base SalaryBase salary is set at a level that reflects the remit, scope, and impactInsider Participation” of the roleProxy Statement and is commensurate with the NEO’s contributions, prior experience, and sustained performance. Initial base salaries of our executive officers are established through arm’s-length negotiation at the time the individual NEO is hired, taking into consideration any relevant factors as well as experience and competitive market data. Thereafter, our compensation committee has generally reviewed, and adjusted as necessary, base salaries for each of our NEOs, at a minimum annually and whenever there is a change in the scope of the NEO’s role. In setting base salary levels for 2022, our compensation committee considered a range of factors, including:●the individual’s anticipated responsibilities and experience;●the collective experience and knowledge in compensating similarly situated individuals at other companies informed by the Radford Global Technology and Radford Global Sales compensation surveys; and●the value of the NEO’s existing equity awards.Annual Cash Bonus Plan “Non-Sales Bonus Plan”We maintain an annual cash bonus plan for our non-sales employees, including our NEOs. Like our other non-sales employees, in 2022, our NEOs were eligible for a target bonus opportunity reflected as a percentage of their base salaries, as applicable. Typically, their target bonus payment is based on an individual performance component and a company performance component, each of which is equally weighted.For 2022, a Non-Sales Bonus Plan was approvedincorporated herein by our compensation committee on October 13, 2022. For purposes of the 2022 Non-Sales Bonus Plan, our compensation committee selected year on year currency neutral growth of an adjusted EBITDA measure (less capital expenditures and before Non-Sales Bonus payments) as the Company performance component. Further, the individual performance for each NEO was based solely on his or her performance as determined in the discretion of the CEO after taking into consideration the achievement of the objectives and key performance indicators for his or her role, an evaluation of his or her performance as measured against Getty Images’ Leadership Principles, and his or her contribution to the overall success of Getty Images. In the case of the CEO, his individual performance was evaluated by our board of directors.reference.78Our compensation committee evaluated the Company’s performance against the company performance component and each individual NEO’s performance against his or her individual performance component following the end of the year and exercised its discretion to determine the amount to be paid based on the level of achievement of the company performance component and the amount to be paid based on our NEOs’ individual performance and approved the amount of each NEO’s annual bonus as set forth in the “Non-Equity Incentive Plan Compensation” column of the 2022 Summary Compensation Table above.Long-Term Incentive CompensationTo date, all of our NEO equity compensation has been delivered in the form of options to purchase shares of our Class A Common Stock, but no equity awards were issued to our NEOs in 2022. Please see the “Outstanding Equity Awards at 2022 Fiscal Year-End” table and “Potential Payments Upon Termination or Change in Control” below for a description of the vesting, termination and change in control treatment of the awards granted to date.Equity CompensationAlthough no equity awards were granted to our NEOs in 2022, our board of directors has adopted, and our stockholders approved, the 2022 Plan, the Getty Images Holdings, Inc. 2022 Earn Out Plan (the “Earn Out Plan”) and the Getty Images Holdings, Inc. 2022 Employee Stock Purchase Plan (the “ESPP” and together with the Earnout Plan and the 2022 Plan, the “Equity Incentive Plans”). The purpose of the Equity Incentive Plans is to align the interests of eligible participants with our stockholders by providing incentive equity compensation tied to the Company’s performance. The intent of the Equity Incentive Plans is to advance the Company’s interests and increase stockholder value by attracting, retaining and motivating key personnel.The 2012 Equity Incentive Plan of the Partnership and the Legal Getty 2012 Plan (the “2012 Equity Plans”) were adopted on October 18, 2012, as amended from time to time (including most recently on September 1, 2021). Although the 2012 Equity Plans were terminated in connection with the Business Combination, it will continue to govern the terms and conditions of any outstanding awards previously granted thereunder.See “Item 12. Security Ownership of Certain Beneficial Owners and Management and Related Stockholder Matters— MattersThe information required by this item will be included under the caption “Security Ownership of Certain Beneficial Owners and Management” and “Executive Compensation—Securities Authorized for Issuance Under Equity Compensation Plans.”Section 401(k) PlanWe sponsor a tax-qualified Section 401(k) profit-sharing plan (the “401(k) Plan”) for all employees, including our NEOs. Our full-time employees are eligible to participate inPlans” of the 401(k) PlanProxy Statement and may contribute up to a specified percentage of their base salary to the 401(k) Plan. We make safe harbor matching contributions to the 401(k) Plan on behalf of employees who are eligible to participate in the 401(k) Plan. We match 4% of a participant’s salary deferrals. The total matching contribution does not exceed the match allocated based on IRS annual compensation limits.Pension BenefitsNone of our NEOs participated in any defined benefit pension plans in 2022.Nonqualified Deferred CompensationNone of our NEOs participated in any non-qualified deferred compensation plans, supplemental executive retirement plans, or any other unfunded retirement arrangements in 2022.Other Benefits and PerquisitesWe offer benefits to our NEOs on the same basis as provided to all of our employees, including health, dental and vision insurance; life insurance (supplemental life insurance at the executive level is paidincorporated herein by the Company); accidental death and dismemberment insurance; short-and long-term disability insurance; a health savings account and flexible spending accounts. Additionally, some executives, including our NEOs, may receive gym reimbursement and transit subsidies, and are eligible for our split-benefit life insurance policies and executive disability insurance.79Employment AgreementsWe have entered into employment agreements with each of our NEOs that generally set forth the terms and conditions of employment, including base salary, target bonus opportunities, the opportunity to participate in our equity incentive plans and standard employee benefit plan participation. In addition, the NEO employment agreements also contain provisions for certain payments and benefits in connection with certain terminations of employment, including a termination of employment in connection with a change in control of Getty Images as described further in “Potential Payments upon Termination or Change in Control” below.Mr. PetersWe entered into an amended and restated employment agreement with Mr. Peters as of July 1, 2015, providing that commencing on December 31, 2017, and on each annual anniversary thereafter, the employment term would be automatically extended for a one-year term unless we or Mr. Peters provide three months’ notice not to renew the employment agreement term. Subsequently, the employment agreement was amended on January 27, 2017 (to adjust the annual bonus percentage), on November 3, 2017 (to extend its term until December 31, 2020, subject to automatic one-year extensions unless either party provided three months’ notice of non-renewal), and on January 1, 2019 (to elevate Mr. Peters to the position of Chief Executive Officer, adjust his base salary, and to extend its term until December 31, 2021, subject to automatic one-year renewals unless either party provides three months’ notice of non- renewal). On April 1, 2020 we amended Mr. Peters’ employment agreement to reduce his base salary in response to the COVID-19 pandemic and make other corresponding adjustments, and on October 1, 2020 we further amended his employment agreement to restore his base salary to its pre-COVID-19 pandemic level and make other corresponding adjustments.Additionally, his employment agreement sets forth his duties as well as his annual base salary (currently $983,650 and subject to annual review by our board of directors), a target annual bonus award in an amount equal to a percentage of his annual base salary (currently 75%), the opportunity to participate in our equity incentive plan, and participation in our employee benefit plans on a no less favorable basis as those benefits are generally made available to the other senior executives of Getty Images. The employment agreement also contains certain restrictive covenants involving non-solicitation, non-competition, confidentiality of information, and the treatment and ownership of intellectual property arising during his employment with Getty Images. Further, the employment agreement provides for the rights and responsibilities of the parties in the event of certain terminations of Mr. Peters’ employment, as further described in “Potential Payments upon Termination or Change in Control” below.Mr. GandertWe entered into an employment agreement with Mr. Gandert as of June 1, 2016, providing that commencing on December 31, 2019, and on each annual anniversary thereafter, the employment term would be automatically extended for a one-year term unless we or Mr. Gandert provide three months’ notice not to renew the employment agreement term. On April 1, 2020, we amended Mr. Gandert’s employment agreement to reduce his base salary in response to the COVID-19 pandemic and make other corresponding adjustments, and on October 1, 2020, we further amended his employment agreement to restore his base salary to its pre-COVID-19 pandemic level and make other corresponding adjustments.The employment agreement sets forth Mr. Gandert’s position as Chief Technology Officer and duties as well as his annual base salary (currently $523,850 and subject to annual review by our board of directors), a target annual bonus award in an amount equal to a percentage of Mr. Gandert’s annual base salary (currently 50%), the opportunity to participate in our equity incentive plans and participation in our employee benefit plans that are no less favorable than those generally made available to other senior executives of Getty Images. The employment agreement also contains certain restrictive covenants involving non-solicitation, non-competition, confidentiality of information, and the treatment and ownership of intellectual property arising during his employment with Getty Images. Further, the employment agreement provides for the rights and responsibilities of the parties in the event of certain terminations of Mr. Gandert’s employment, as further described in “Potential Payments upon Termination or Change in Control” below.Mr. FocaWe entered into an employment agreement with Mr. Foca as of January 3, 2017, providing that commencing on December 31, 2019, and on each annual anniversary thereafter, the employment term would be automatically extended for a one-year term unless we or Mr. Foca provide three months’ written notice not to renew the employment agreement term. On April 1, 2020, we amended Mr. Foca’s employment agreement to reduce his base salary in response to the COVID-19 pandemic and make other corresponding adjustments, and on October 1, 2020, we further amended his employment agreement to restore his base salary to its pre-COVID-19 pandemic level and make other corresponding adjustments.80The employment agreement sets forth Mr. Foca’s position as Senior Vice President, Chief Marketing Officer and duties as well as his annual base salary (currently $477,405 and subject to annual review by our board of directors), a target annual bonus award in an amount equal to a percentage of Mr. Foca’s annual base salary (currently 50%), the opportunity to participate in our equity incentive plans and participation in our employee benefit plans that are no less favorable than those generally made available to other senior executives of Getty Images. The employment agreement also contains certain restrictive covenants involving confidentiality of information, and the treatment and ownership of intellectual property arising during his employment with Getty Images. Further, the employment agreement provides for the rights and responsibilities of the parties in the event of certain terminations of Mr. Foca’s employment, as further described in “Potential Payments upon Termination or Change in Control” below.Ms. Alberti-PerezWe entered into an employment agreement with Ms. Alberti-Perez to serve as our Chief Financial Officer as of December 9, 2020, which agreement was amended on December 30, 2020 and was set to expire on December 31, 2024, with automatic one-year renewals thereafter, unless we or Ms. Alberti-Perez provided three months’ notice not to renew the employment agreement term.The employment agreement set forth Ms. Alberti-Perez’ duties as well as her initial annual base salary of $450,000 (subject to annual review by our board of directors but which could not be decreased below its then current level), a target annual bonus award in an amount equal to 50% of her annual base salary (based upon the achievement of the performance goals established by our compensation committee), a cash sign-on bonus in the amount of $50,000 (subject to repayment if her employment was terminated prior to the first anniversary of her initial employment date), the opportunity to participate in our equity incentive plans, the grant of her Option, and participation in our employee benefit plans that were no less favorable than those generally made available to other senior executives of Getty Images.The employment agreement also contained certain restrictive covenants involving non-solicitation, non-competition, confidentiality of information, and the treatment and ownership of intellectual property arising during her employment with Getty Images.On January 5, 2022, we announced that effective January 4, 2022, Ms. Alberti-Perez departed the role of Chief Financial Officer. We also announced that effective January 4, 2022, Jennifer Leyden was appointed as our Chief Financial Officer.Potential Payments Upon Termination or Change in ControlEach of the NEO’s employment agreements provides for severance payments and benefits upon certain terminations of employment with Getty Images and its affiliates, as described further below. Each NEO’s rights with respect to his or her equity participation in Getty Images or its affiliates is governed by the applicable equity documents (as defined in the respective employment agreement) and the NEO’s rights with respect to employee benefits will be governed by the documents governing such employee benefits.As provided in the applicable employment agreement, upon the termination of an NEO’s employment term and his or her employment by us for “cause” or due to his or her resignation without “good reason” (as each such term is defined in his or her respective employment agreement), the NEO will be entitled to receive his or her base salary through the date of termination, any annual bonus earned, but unpaid, as of the termination date for the immediately preceding fiscal year, reimbursement for any unreimbursed business expenses that have been properly incurred by him or her prior to the termination date and that are or have been submitted in accordance with the applicable Getty Images policy, and such employees benefits (as defined in his or her employment agreement), if any, that the NEO may be entitled under our employee benefit plans, which will not include payment for any unused vacation or paid time off, as applicable, unless required by applicable law (all of the amounts described in this sentence are referred to the “Accrued Rights”).Upon the termination of an NEO’s employment term and his or her employment due to the NEO’s “death” or “disability” (as each such term is defined in his or her respective employment agreement), the NEO will be entitled to receive the Accrued Rights and his or her estate will benefit from a term life insurance policy provided by Getty Images and intended to provide a payment of a death benefit equal to the “base severance” (as defined below).In the event that an NEO’s employment term and his or her employment is terminated by Getty Images without “cause” or by the NEO for “good reason” (as each such term is defined in his or her respective employment agreement), the NEO will be entitled to receive, in addition to the Accrued Rights, and subject to his or her execution and non-revocation of a release of claims in a form acceptable to81Getty Images as provided in his or her employment agreement and continued compliance with the following restrictive covenants set forth in his or her employment agreement:●payments totaling in the aggregate (i) the sum of (x) 150% (200% in the case of Mr. Peters) of the NEO’s base salary and (y) 150% (200% in the case of Mr. Peters) of the NEO’s target annual bonus in respect of the fiscal year that the termination date occurs or (ii), in the case of Mr. Peters, his base salary and target annual bonus for the period from the termination date through the last day of the employment term, if greater than such amount in (i), in each case, payable over a 18-month (24- month in the case of Mr. Peters) period (such amounts, the “base severance”); and●continued coverage under our group health and welfare plans for a period until the later of 18 months (24 months in the case of Mr. Peters) following the termination date on the same basis (including payment of monthly premiums) as provided by us to senior-level executives (or, a monthly payment in an amount equal to our cost of providing such benefit if this benefit would trigger adverse tax consequences), which will be discontinued if the NEO becomes eligible for similar benefits from a successor employer (the “Continued Health Benefits”).In the event that an NEO elects not to extend the employment term of his or her employment agreement, unless terminated earlier, he or she will be entitled to receive the Accrued Rights. In the event we elect not to extend the employment term of an NEO’s employment agreement, unless terminated earlier, he or she will be entitled to receive the Accrued Rights and, subject to the NEO’s execution and non-revocation of a release of claims in a form acceptable to us as provided in the employment agreement, the Continued Health Benefits and equal payments totaling in the aggregate the base severance payable over an 18-month (24-month in the case of Mr. Peters) period.Outstanding Equity Awards at 2022 Fiscal Year-End TableThe following table presents information regarding outstanding equity awards held by our NEOs as of December 31, 2022:(1)The option awards vests over four years, with 25% of the total number of shares vesting on the first anniversary of the vesting commencement date and the remaining 75% vesting in equal quarterly installments thereafter. In addition, the stock option will fully vest and become fully exercisable upon a Change in Control (as defined in the option agreement) of Getty Images subject to the understanding that the Business Combination did not constitute a change in control for purposes of the option agreement.Director CompensationDuring 2022, four of our non-employee directors, Messrs. Klein, Quella, and Titterton, and Ms. Schneider, received compensation for serving as members of our board of directors. Mr. Klein received $122,329, which represents an annual cash board retainer for the period82of his service on our board of directors and a committee member retainer for his service on the Audit Committee post-July 22, 2022. Mr. Quella was appointed to our board of directors on July 22, 2022, and received $22,329, representing a pro-rated annual retainer for the period of his service on our board of directors and a committee member retainer for his service on the Audit Committee. Mr. Titterton was appointed to our board of directors on October 18, 2022 and received $8,219, representing a pro-rated annual retainer for the period of his service on our board of directors. Ms. Schneider received $80,144 in cash, which represents an annual cash board retainer for the period of her service on our board of directors, and pro-rated Chairperson and committee member retainers for her service on the Audit and Compensation committees, respectively. Following their appointment to our board of directors, Messrs. Quella and Titteron also received a grant of Restricted Stock Units (granted on December 7, 2022). Mr. Peters, our Chief Executive Officer, who is an employee-director, received no compensation for serving as a member of our board of directors.The following table sets forth information regarding the compensation earned by or paid to the non- employee members of our board of directors during the year ended December 31, 2022:Non-Employee Director Compensation ProgramIn 2022, four of our non-employee directors received compensation (cash retainers, equity awards, fees or other compensation) for service on our board of directors, as well as the boards of directors of predecessor entities. Our board of directors expects to review director compensation periodically to ensure that director compensation remains competitive such that we are able to recruit and retain qualified directors.On February 27, 2023, our board of directors adopted our Non-Employee Directors Annual Compensation Program designed to align compensation with business objectives and the creation of stockholder value, while enabling Getty Images to attract, retain, incentivize and reward directors who contribute to the long-term success of the Company. Pursuant to this policy, each member of our board of directors who is not our employee nor Mark Getty, Patrick Maxwell, Brett Watson, or Michael Harris, is eligible to receive the following compensation for his or her service as a member of our board of directors:●Cash Fees. Commencing on July 22, 2022, an annual cash retainer of $40,000 per year. The chairs of the Audit committee, Compensation committee, and Nominating and Corporate Governance committee receive cash retainers in the amount of $20,000, $15,000, and $10,000, respectively, for his or her respective committee service as a chair. Members of the Audit committee, Compensation committee, and Nominating and Corporate Governance committee receive cash retiners in the amount of $10,000, $7,500, and $5,000 respectively. All cash fees shall be pro-rated for the director’s time served on the board of directors; and●Equity. Eligible directors will receive a grant of RSUs equal to the grant value of $390,000 at the time of grant, with a four-year vesting period, subject to the director’s continued service on our board of directors. Directors with existing options were not issued a new grant at the time of the approval of the program.Our policy is to reimburse our non-employee directors for reasonable out of pocket expenses incurred that are integrally related to service as a member of our board of directors, including travel and lodging expenses related to attendance at meetings or performing other services in their capacities as directors.83Compensation Committee Interlocks and Insider ParticipationNone of our officers currently serves, or in the past year has served, as a member of the compensation committee of any entity that has one or more officers serving on our board of directors.Item 12. Security Ownership of Certain Beneficial Owners and Management and Related Stockholder MattersThe following table sets forth, as of March 1, 2023, the number of shares of our Class A Common Stock beneficially owned by each director, NEO, all directors and executive officers as a group, and each person or entity we know to be the beneficial owner of more than 5% of our Class A Common Stock.In accordance with the rules of the SEC, beneficial ownership includes voting or investment power with respect to securities and includes the shares of Class A Common Stock issuable pursuant to options and warrants that are exercisable or settled within 60 days of the date of this table. Shares of Class A Common Stock issuable pursuant to options and warrants are deemed outstanding for computing the percentage of the class beneficially owned by the person holding such securities but are not deemed outstanding for computing the percentage of the class beneficially owned by any other person. Except as otherwise indicated, all share ownership is as of March 1, 2023 and the percentage of beneficial ownership is based on 395,267,686 shares of Class A Common Stock outstanding. Unless otherwise indicated, we believe that all persons named in the table below have sole voting and investment power with respect to all shares of Class A Common Stock beneficially owned by them. To our knowledge, no shares of Class A Common Stock beneficially owned by any executive officer or director have been pledged as security.The business address of each beneficial owner is c/o Getty Images Holdings, Inc., 605 5th Ave. S. Suite 400, Seattle, WA 98104, unless otherwise indicated below.1)Interests shown consist of (i) 7,794,004 shares of Class A Common Stock held by Mark Getty and (ii) (a) 5,089,413 shares of Class A Common Stock to be held by The October 1993 Trust and (b) 464,085 shares of Class A Common Stock held by The Options Settlement, which shares Mr. Getty may be deemed to beneficially own by virtue of his indirect ownership in such entities. This number does not include 178,026,504 shares of Class A Common Stock held by Getty Investments. Mr. Getty is one of three directors of Getty Investments (the other two directors being Pierre du Preez and Jan Moehl) and therefore he may be deemed to share voting and investment power over the shares held by Getty Investments.2)Interests shown consist of 173,204 shares of Class A Common Stock issuable upon exercise of vested options.843)Interests shown consist of (i) 21,130 shares of Class A Common Stock held directly by Mr. Peters and (ii) 5,134,862 shares of Class A Common Stock issuable upon exercise of vested options.4)Interests shown consist of 5,777,998 shares of Class A Common Stock held by CC Capital SP, LP. CC Capital SP, LP is controlled by Chinh Chu. As such, Mr. Chu is deemed to be the beneficial owner of the shares held by CC Capital SP, LP. Interests do not include any shares indirectly owned by Mr. Chu as a result of his partnership interest in CC Neuberger Principal Holdings II Sponsor LLC or its affiliates.5)Interests shown consist of (i) (a) 3,673,608 shares of Class A Common Stock held directly by Mr. Klein and (b) 516,463 shares of Class A Common Stock held by Aston Aladmax LLC, which Mr. Klein may be deemed to beneficially own, and (ii) 358,031 shares of Class A Common Stock issuable upon exercise of vested options.6)Interest shown consist of 40,000 shares of Class A Common Stock.7)Interest shown consists of 1,918,570 shares of Class A Common Stock issuable upon exercise of vested options.8)Interest shown consists of 1,850,732 shares of Class A Common Stock issuable upon exercise of vested options.9)Interests shown consist of (i) 178,026,504 shares of Class A Common Stock held by Getty Investments, (ii) 5,089,413 shares of Class A Common Stock held by The October 1993 Trust, (iii) 464,085 shares of Class A Common Stock held by The Options Settlement, and (iv) 7,794,004 shares of Class A Common Stock held by Mark Getty. The Cheyne Walk Trust is the sole owner of Cheyne Walk Master Fund 2 LP, which is the majority owner of Getty Investments, and the Cheyne Walk Trust may be deemed to have indirect beneficial ownership of Getty Investments’ 178,026,504 shares of Class A Common Stock. According to a Schedule 13D filed with the SEC on September 6, 2022, the business address of Getty Investments, the Cheyne Walk Trust and Cheyne Walk Master Fund 2 LP is 5390 Kietzke Lane, Suite 202, Reno, Nevada 89511.10)Interests shown consist of 80,499,253 shares of Class A Common Stock held by Wood River Capital, LLC as the nominee of Koch Icon Investments, LLC (“Koch Icon”). According to a Schedule 13D filed with the SEC on September 6, 2022, Koch Icon is a subsidiary of Koch Equity Development LLC (“Koch Equity”), Koch Equity is a subsidiary of Koch Investments Group, LLC (“KIG”), KIG is a subsidiary of Koch Investments Group Holdings, LLC (“KIGH”), and KIGH is a subsidiary of Koch Industries, Inc. (“Koch Industries”). The business address of Koch Icon, Koch Equity, KIG, KIGH and Koch Industries is c/o Koch Industries, Inc., 4111 East 37th Street North, Wichita, Kansas 67220.11)According to a Schedule 13D/A filed with the SEC on September 20, 2023 and a Form 4 filed with the SEC on February 9, 2023:Interests shown consist of 64,523,168 shares of Class A Common Stock held directly by Neuberger Berman Opportunistic Capital Solutions Master Fund LP (“NBOKS”) and 14,324,800 shares of Class A Common Stock directly held by CC Neuberger Principal Holdings II Sponsor LLC. Neuberger Berman Investment Advisers LLC (“NBIA”) serves as investment adviser to NBOKS and, in such capacity, exercises voting or investment power over the shares held directly by NBOKS. Neuberger Berman Investment Advisers LLC (“NBIA”). Neuberger Berman Investment Advisers Holdings LLC (“NBIA Holdings”) is the holding company of NBIA and a subsidiary of Neuberger Berman Group LLC (“NB Group”). CC Neuberger Principal Holdings II Sponsor LLC is owned by two entities: CC NB Sponsor 2 Holdings LLC and NBOKS. The business address of NBOKS, NB Group, NBIA Holdings and NBIA is 290 Avenue of Americas, New York, New York 10104.12)According to a Schedule 13G filed with the SEC on February 14, 2023:Interest shown consist of 25,580,000 shares of Class A Common Stock held by CC Neuberger Principal Holdings II Sponsor LLC. This amount includes the 14,324,800 shares of Class A Common Stock beneficially owned by NBOKS, NB Group, NBIA Holdings and NBIA. See footnote 12 above. The business address of CC Neuberger Principal Holdings II Sponsor LLC is 200 Park Avenue, 58th Floor, New York, New York 10166.85Securities Authorized for Issuance Under Equity Compensation PlansThe table below provides information about our shares of Class A Common Stock that may be issued upon the exercise of options and Restricted Stock Units under all of our existing equity compensation plans as of December 31, 2022.1.Represents shares subject to outstanding awards granted, of which (i) 4,367,413 shares of Class A Common Stock are subject to outstanding RSUs and (ii) 29,934,987 shares of Class A Common Stock are subject to outstanding options.2.The weighted-average exercise price is calculated based solely on the exercise prices of the outstanding options and does not reflect the shares that will be issued upon the vesting of outstanding awards of restricted shares or RSUs, which have no exercise price.3.As of December 31, 2022, there were no equity compensation plans not approved by shareholders under which equity securities of the Company were authorized for issuance.Business Combination AgreementAs described elsewhere inThe information required by this Annual Report, Legacy Getty,item will be included under the Partnership, CCNB, the Company (then Vector Holding, LLC), Domestication Merger Sub, G Merger Sub 1,caption “Certain Relationships and G Merger Sub 2 entered into the Business Combination Agreement on December 9, 2021, pursuant to which (i) on the Closing Date the Company (then Vector Holding, LLC) was statutorily converted from a Delaware limited liability company to a Delaware corporationRelated Person Transactions” and at 12:01 a.m. on the Closing Date, CCNB was merged with and into Domestication Merger Sub, with Domestication Merger Sub surviving the merger as a wholly-owned direct subsidiary“Corporate Governance—Director Independence” of the Company, (ii) onProxy Statement and is incorporated herein by reference.Additional information regarding certain related party balances and transactions is included in “Note 2 — Summary of Significant Accounting Policies” to the Closing Date following the Domestication Merger, G Merger Sub 1 was merged with and into Legacy Getty, with Legacy Getty surviving the merger as an indirect wholly- owned subsidiary of the Company and (iii) immediately after the First Getty Merger, Legacy Getty was merged with and into G Merger Sub 2 with G Merger Sub 2 surviving the merger as an indirect wholly- owned subsidiary of the Company. See also “Note 3—Business Combination” in our consolidated financial statements included elsewhere in this Annual Report for more information.Earn Out SharesReport.Pursuant to the Business Combination Agreement, certain eligible former Legacy Getty equity holders had the contingent right (an “earnout”) to receive, for no additional consideration, a pro rata amount of shares of Class A Common Stock, if at any time during the 10 year period following July 22, 2022, the volume weighted average price of the Class A Common Stock was greater than or equal to, for any 20 trading days within any 30 consecutive trading day period: $12.50 for the first earnout (the “First Price Triggering Event”); $15.00 for the second earnout (the “Second Price Triggering Event”); and $17.50 for the third earnout (the “Third Price Triggering Event” and together with the First Price Triggering Event and the Second Price Triggering Event, the “Triggering Events”).The First Price Triggering Event occurred on August 24, 2022, and each of the Second Price Triggering Event and the Third Price Triggering Event occurred on August 25, 2022. In connection with the Triggering Events, the Company issued an aggregate 58,999,956 shares of Class A common stock (the “Earn-Out Shares”) to eligible former Legacy Getty equity holders.86In addition, each of the B-1 Vesting Event and the B-2 Vesting Event (as defined in the Company’s Amended and Restated Certificate of Incorporation) occurred on August 24, 2022 and August 25, 2022, respectively, which resulted in the cashless conversion of an aggregate 5,140,000 shares of the Company’s Class B common stock, par value $0.0001 per share, into an aggregate 5,140,000 shares of Class A Common Stock. The holders of the Sponsor Earn-Out Shares previously agreed to be subject to a twelve-month lock-up in respect of the Sponsor Earn-Out Shares, and they may not sell or transfer (subject to customary exceptions) the Sponsor Earn-Out Shares until the expiration of the lock-up period on July 23, 2023.Preferred Stockholders AgreementOn February 19, 2019, Koch Icon, the Partnership, and certain other parties entered into a stockholders agreement (the “Preferred Stockholders Agreement”) with Legacy Getty that provided for, among other things, certain voting rights, information rights, board nomination rights and drag-along rights. The Preferred Stockholders Agreement was terminated in connection with the Business Combination.Employee Stockholders AgreementOn February 19, 2019, Legacy Getty, the Partnership, Getty Investments, Mark Getty and other parties entered into an amended and restated stockholders agreement (the “Employee Stockholders Agreement”) that provided for, among other things, certain share transfer restrictions, tag-along rights and drag-along rights. The Employee Stockholders Agreement terminated in connection with the Business Combination.Stockholders AgreementConcurrently with the execution and delivery of the Business Combination Agreement, the Company, the Getty Family Stockholders, Koch Icon, the Sponsor, CC NB Sponsor 2 Holdings LLC, NBOKS and certain other parties thereto entered into the Stockholders Agreement relating to, among other things, the composition of our board of directors following the Closing, certain voting provisions and lock-up restrictions. Pursuant to the Stockholders Agreement, (i) the Sponsor, Joel Alsfine, James Quella and Jonathan Gear (together with their respective successors and any permitted transferees) agreed to be subject to a twelve-month lock-up period in respect of their Founder Shares (subject to certain customary exceptions) and (ii) the Getty Family Stockholders (together with their respective successors and any permitted transferees) and Koch Icon (together with its respective successors and any permitted transferees) agreed to be subject to a 180-day lockup period in respect of their shares of Class A Common Stock received in the Business Combination (subject to certain customary exceptions). Pursuant to the Stockholders Agreement, the initial composition of our board of directors is (a) three directors nominated by Getty Investments, (b) two directors nominated by Koch Icon, (c) one director nominated by CC Capital, (d) the chief executive officer of the Company (which is Craig Peters) and (e) a number of independent directors sufficient to comply with the requisite independence requirements of the NYSE and the rules and regulations of the SEC.Registration Rights AgreementConcurrently with the Closing, the Company, the Sponsor and the persons identified on Schedule A thereto, entered into the Registration Rights Agreement, which provides customary demand and piggyback registration rights. Pursuant to the Registration Rights Agreement, the Company agreed that, as soon as practicable, and in any event within 30 days after the Closing, the Company will file with the SEC a shelf registration statement. In addition, the Company will use its commercially reasonable best efforts to have such shelf registration statement declared effective as soon as practicable after the filing thereof, but no later than the 90th day (or the 120th day if the SEC notifies the Company that it will “review” such shelf registration statement) following the filing deadline, in each case subject to the terms and conditions set forth therein; and the Company will not be subject to any form of monetary penalty for its failure to do so.Warrant AgreementEach Public, Private Placement and Forward Purchase Warrant represented a right to acquire shares of Class A Common Stock, pursuant to the terms and conditions of the Warrant Agreement dated August 4, 2020 (as amended by the Warrant Assumption Agreement dated July 22, 2022, the “Warrant Agreement”). See “Note 5—Common Stock Warrants” in our consolidated financial statements included elsewhere in this Annual Report for information on the exercise and/or redemption of all outstanding Public, Private Placement and Forward Purchase Warrants in accordance with the terms of the Warrant Agreement.87Consulting Services AgreementOn March 25, 2020, the Partnership, Legacy Getty and Getty Investments entered into the amended and restated consulting services agreement, which was amended by the parties thereto on October 1, 2020 (as so amended, the “Consulting Services Agreement”). Pursuant to the Consulting Services Agreement, the Partnership agreed to pay, or cause another member of the group to pay, Getty Investments a fee for advisory, consulting and other services. Pursuant to the Consulting Services Agreement, subject to certain conditions, the Partnership and/or Legacy Getty paid an annual monitoring fee to Getty Investments payable in quarterly installments. The Partnership was also required to reimburse Getty Investments’ reasonable out-of-pocket expenses incurred in connection with services provided pursuant to the Consulting Services Agreement. The Consulting Services Agreement was terminated in connection with the Business Combination.In connection with the Consulting Services Agreement, Legacy Getty paid annual management fees to Getty Investments in the amount of approximately $1.5 million and $1.3 million for the years ended December 31, 2021 and 2020, respectively, and approximately $750,000 during the year ended December 31, 2022.Restated Option AgreementGetty Investments is a party to a Restated Option Agreement, dated February 9, 1998 (as amended on February 9, 1998, February 24, 2008, and August 14, 2012, the “Restated Option Agreement”) pursuant to which Getty Investments has the right to obtain ownership of the Getty Marks (as defined in the Restated Option Agreement) in the event one or more third parties acquire a controlling interest in Getty Images, Inc. In connection with the entry into the Business Combination Agreement, Getty Investments entered into the Fourth Amendment to the Restated Option Agreement, which provides that the Restated Option Agreement will automatically terminate if, and on the date following the Closing Date on which, the Getty Family Stockholders (together with their respective successors and any permitted transferees) beneficially own less than 27,500,000 shares of Class A Common Stock (as adjusted for stock splits, stock combinations, and similar transactions).Indemnification AgreementsWe currently indemnify our directors and executive officers to the fullest extent permitted by law. Further, we have entered into customary indemnification agreements with our directors and executive officers. These agreements require us to indemnify these individuals to the fullest extent permitted by applicable law against liabilities that may arise by reason of their service to the Company, and to advance expenses incurred as a result of any proceeding against them as to which they could be indemnified.There is currently no pending material litigation or proceeding involving any of the Company’s directors, officers or employees for which indemnification is sought.Employment AgreementsSee “Item 11. Executive Compensation” for information regarding compensation arrangements with our named executive officers and directors, which include, among other things, employment, termination of employment and change in control arrangements, stock awards and certain other benefits.Stephanie Liverani, the spouse of Mikael Cho, Senior Vice President – CEO, Unsplash, is employed by a subsidiary of Getty Images and serves as Vice President & Co-Founder, Unsplash. In 2022, she was paid approximately $220,000 in base salary and $78,000 in cash bonus. Additionally, Christopher Liverani, the brother-in-law of Mikael Cho, Senior Vice President – CEO, Unsplash, is employed by a subsidiary of Getty Images and serves as Brand Partnerships Executive. In 2022, he was paid approximately $110,000 in base salary and $970,000 in commissions. Each individual participated in other regular and customary employee benefit programs generally available to all Getty Images employees. In addition, the amount of compensation was determined in accordance with the Company’s standard compensation practices applicable to similarly situated employees.88Policy for Approval of Related Party TransactionsOur board of directors has adopted a written related person transaction policy that sets forth the following policies and procedures for the review and approval or ratification of related person transactions. Under the policy:●any related person transaction, and any material amendment or modification to a related person transaction, must be reviewed and approved or ratified by a committee of our board of directors composed solely of independent directors who are disinterested or by the disinterested members of our board of directors; and●any employment relationship or transaction involving an executive officer and any related compensation must be approved by the compensation committee of our board of directors or recommended by the compensation committee to our board of directors for its approval.In connection with the review and approval or ratification of a related person transaction:●management must disclose to the committee or disinterested directors, as applicable, the name of the related person and the basis on which the person is a related person, the material terms of the related person transaction, including the approximate dollar value of the amount involved in the transaction, and all the material facts as to the related person’s direct or indirect interest in, or relationship to, the related person transaction;●management must advise the committee or disinterested directors, as applicable, as to whether the related person transaction complies with the terms of our agreements governing our material outstanding indebtedness that limit or restrict our ability to enter into a related person transaction;●management must advise the committee or disinterested directors, as applicable, as to whether the related person transaction will be required to be disclosed in our applicable filings under the Exchange Act, and related rules, and, to the extent required to be disclosed, management must ensure that the related person transaction is disclosed in accordance with such Acts and related rules; and●management must advise the committee or disinterested directors, as applicable, as to whether the related person transaction constitutes a “personal loan” for purposes of Section 402 of the Sarbanes- Oxley Act.In addition, the related person transaction policy provides that the committee or disinterested directors, as applicable, in connection with any approval or ratification of a related person transaction involving a non-employee director or director nominee, should consider whether such transaction would compromise the director or director nominee’s status as an “independent” or “non-employee” director, as applicable, under the rules and regulations of the SEC and NYSE.A “related person transaction” is a transaction, arrangement or relationship in which the Company or any of its subsidiaries was, is or will be a participant, the amount of which involved exceeds $120,000, and in which any related person had, has or will have a direct or indirect material interest. A “related person” means:●any person who is, or at any time during the applicable period was, one of the Company’s executive officers or one of the Company’s directors;●any person who is known to be the beneficial owner of more than 5% of the Company’s voting stock;●any immediate family member of any of the foregoing persons, which means any child, stepchild, parent, stepparent, spouse, sibling, mother-in-law, father-in-law, son-in-law, daughter-in-law, brother-in-law or sister-in-law of a director, executive officer or a beneficial owner of more than 5% of our Class A Common Stock, and any person (other than a tenant or employee) sharing the household of such director, executive officer or beneficial owner of more than 5% of our Class A Common Stock; and●any firm, corporation or other entity in which any of the foregoing persons is a partner or principal or in a similar position or in which such person has a 10% or greater beneficial ownership interest.89Director IndependenceFor information on director independence, see “Item 10. Directors, Executive Officers and Corporate Governance.”Item 14. Principal Accountant Fees and ServicesThe following is a summaryinformation required by this item will be included under the caption “Independent Registered Pubic Accounting Firm Fees and Other Matters” of the fees billed to usProxy Statement and is incorporated herein by Ernst & Young LLP for professional services rendered for the fiscal years ended December 31, 2022 and December 31, 2021:Audit Fees. Audit fees consist of fees billed for professional services rendered for the annual audit of our consolidated financial statements presented within this Form 10-K, the review of the interim consolidated financial statements presented in our quarterly reports on Form 10-Q and our registration statements on Form S-4 and other regulatory filings.Tax Fees. Tax fees include fees billed by Ernst & Young LLP related to tax compliance and consulting services.All Other Fees. All other fees consisted of fees related to a certain accounting research software product.The Audit Committee determined that Ernst & Young LLP’s provision of these services, and the fees that we paid for these services, are compatible with maintaining the independence of the independent registered public accounting firm. The Audit Committee approved all services that Ernst & Young LLP provided in the fiscal years ended December 31, 2022 and 2021.9070Item 15. EXHIBIT AND FINANCIAL STATEMENT SCHEDULES(a)(a) The following documents are filed as part of this annual report.11 Financial Statements42)F-1F-1F-2F-2F-3F-3F-4F-4F-5F-5F-6F-6F-7F-722 Financial Statement SchedulesAll schedules are omitted because they are not applicable or the required information is shown in the consolidated financial statements or notes thereto.33 ExhibitsawExhibit Number DescriptionExhibit NumberDescription2.1†AssociationAssociation (incorporated by reference to Exhibit 4.3 of the Company's Form 10-K, filed with the SEC on March 14, 2023)4.5* 917110.5Ù10.5^10.6Ù10.6^10.7Ù10.7^Ù^Ù^Ù^PlanPlan (incorporated by reference to Exhibit 10.10 ofthe Company's Form 10-K, filed with the SEC on March 14, 2023)10.11*Ù10.11^10.12Ù10.12^ and, October 1, 2020 (incorporated by reference to Exhibit 10.11 to Vector Holding, LLC’s Registration Statement on Form S-4, filed with the SEC on, and January 18, 2022)1, 2024.10.13Ù10.13^10.14Ù10.14*^10.15*Ù10.1610.1710.189272Pursuantpursuant to 18 U.S.C. Section 1350, as adopted Pursuantpursuant to Section 906 of the Sarbanes-Oxley Act of 2002Pursuantpursuant to Section 906 of the Sarbanes-Oxley Act of 2002101101 Interactive Data Files Pursuant to Rule 405 of Regulation S-T: (i) Consolidated Balance Sheets, (ii) Consolidated Statements of Operations, (iii) Consolidated Statements of Comprehensive (Loss) Income, (iv) Consolidated Statement of Redeemable Preferred Stock and Stockholders’ Equity (Deficit), (v) Consolidated Statements of Cash Flows, and (vi) Notes to Consolidated Financial Statements. The instance document does not appear in the Interactive Data File because its XBRL tags are embedded within the Inline XBRL document Ù^93Not applicable.9473Pursuant to the requirements of Section 13 or 15(d) of the Securities Exchange Act of 1934, the registrant has duly caused this report to be signed on its behalf by the undersigned, thereunto duly authorized.13, 2023GETTY IMAGES HOLDINGS, INC.(REGISTRANT)By:By:Name:Name:Title:Title:Pursuant to the requirements of the Securities Exchange Act of 1934, this report has been signed below by the following persons on behalf of the registrant and in the capacities and on the dates indicated./s/ Craig Peters Name:Name:Title:Title:13, 2023Date:Date:13, 202313, 2023Name:Name:Title:Title:13, 2023Date:Date:13, 2023Name:Name:Title:Title:13, 2023Date:Date:13, 2023Name:Name:Title:Title:13, 2023Date:Date:13, 2023Name:Name:Title:Title:13, 2023Date:Date:13, 202313, 20239574To the Stockholders and the Board of DirectorsGetty Images Holdings, Inc.Opinion on the Financial StatementsWe have audited the accompanying consolidated balance sheets of Getty Images Holdings, Inc. (the “Company”) as of December 31, 20222023 and 2021,2022, the related consolidated statements of operations, comprehensive income (loss) income,, redeemable preferred stock and stockholders’ equity (deficit) and cash flows for each of the three years in the period ended December 31, 2022,2023, and the related notes (collectively referred to as the “consolidated financial statements”). In our opinion, the consolidated financial statements present fairly, in all material respects, the financial position of the Company at December 31, 20222023 and 2021,2022, and the results of its operations and its cash flows for each of the three years in the period ended December 31, 20222023 in conformity with U.S. generally accepted accounting principles.Adoption of FASB Accounting Standard Update Leases (Topic 842)As discussed in Note 2 to the consolidated financial statements, the Company changed its method of accounting for leases in 2022 due to the adoption of ASU Topic 842, Leases.Basis for OpinionThese financial statements are the responsibility of the Company’s management. Our responsibility is to express an opinion on the Company’s financial statements based on our audits. We are a public accounting firm registered with the Public Company Accounting Oversight Board (United States) (PCAOB) and are required to be independent with respect to the Company in accordance with the U.S. federal securities laws and the applicable rules and regulations of the Securities and Exchange Commission and the PCAOB.We conducted our audits in accordance with the standards of the PCAOB and in accordance with auditing standards generally accepted in the United States of America.PCAOB. Those standards require that we plan and perform the audit to obtain reasonable assurance about whether the financial statements are free of material misstatement, whether due to error or fraud. The Company is not required to have, nor were we engaged to perform, an audit of its internal control over financial reporting. As part of our audits we are required to obtain an understanding of internal control over financial reporting but not for the purpose of expressing an opinion on the effectiveness of the Company’s internal control over financial reporting. Accordingly, we express no such opinion.Our audits included performing procedures to assess the risks of material misstatement of the financial statements, whether due to error or fraud, and performing procedures that respond to those risks. Such procedures included examining, on a test basis, evidence regarding the amounts and disclosures in the financial statements. Our audits also included evaluating the accounting principles used and significant estimates made by management, as well as evaluating the overall presentation of the financial statements. We believe that our audits provide a reasonable basis for our opinion./s/Ernst & Young LLPWe have served as the Company’s auditor since 2013.Seattle, WashingtonMarch 13, 2023F-1CONSOLIDATED BALANCE SHEETS(In thousands, except share and par value data)December 31, 2023 2022 ASSETS CURRENT ASSETS: Cash and cash equivalents $ 136,623 $ 97,912 Restricted cash 4,227 4,482 Accounts receivable – net of allowance of $6,526 and $6,460, respectively 138,730 129,603 Prepaid expenses 15,798 15,728 Insurance recovery receivable 48,615 — Taxes receivable 9,758 11,297 Other current assets 11,253 10,497 Total current assets 365,004 269,519 PROPERTY AND EQUIPMENT – NET 179,378 172,083 RIGHT OF USE ASSETS 41,098 47,231 GOODWILL 1,501,814 1,499,578 IDENTIFIABLE INTANGIBLE ASSETS – NET 403,805 419,548 DEFERRED INCOME TAXES – NET 69,400 8,272 OTHER LONG-TERM ASSETS 41,262 51,952 TOTAL $ 2,601,761 $ 2,468,183 LIABILITIES AND STOCKHOLDERS’ EQUITY CURRENT LIABILITIES: Accounts payable $ 102,525 $ 93,766 Accrued expenses 43,653 49,327 Income taxes payable 11,325 8,031 Litigation reserves 98,149 — Deferred revenue 176,349 171,371 Total current liabilities 432,001 322,495 LONG-TERM DEBT – NET 1,398,658 1,428,847 LEASE LIABILITIES 39,858 46,218 DEFERRED INCOME TAXES – NET 21,580 37,075 UNCERTAIN TAX POSITIONS 24,772 37,333 OTHER LONG-TERM LIABILITIES 3,462 3,167 Total liabilities 1,920,331 1,875,135 Commitments and contingencies (Note 13) STOCKHOLDERS’ EQUITY: Preferred Stock, $0.0001 par value; 1.0 million shares authorized; no shares issued and outstanding as of December 31, 2023 and December 31, 2022. — — Class A common stock, $0.0001 par value: 2.0 billion shares authorized; 405.0 million shares issued and outstanding as of December 31, 2023 and 394.8 million shares issued and outstanding as of December 31, 2022 40 39 Class B common stock, $0.0001 par value: 5.1 million shares authorized; no shares issued and no shares outstanding as of December 31, 2023 and December 31, 2022. — — Additional paid-in capital 1,983,276 1,936,324 Accumulated deficit (1,263,015) (1,282,354) Accumulated other comprehensive loss (87,076) (108,928) Total Getty Images Holdings, Inc. stockholders’ equity 633,225 545,081 Noncontrolling interest 48,205 47,967 Total stockholders’ equity 681,430 593,048 TOTAL $ 2,601,761 $ 2,468,183 See notes to consolidated financial statements.F-2CONSOLIDATED STATEMENTS OF OPERATIONS(In thousands, except share and per share amounts)Year Ended
December 31,2023 2022 2021 REVENUE $ 916,555 $ 926,244 $ 918,688 OPERATING EXPENSE: Cost of revenue (exclusive of depreciation and amortization shown separately below) 250,249 254,990 248,152 Selling, general and administrative expenses 402,516 375,582 367,704 Depreciation 54,374 49,574 51,099 Amortization 24,069 43,645 49,361 Loss on litigation 116,051 1,101 — Recovery of loss on litigation (60,000) — — Other operating expense (income) – net 1,624 (681) 386 Operating expense 788,883 724,211 716,702 INCOME FROM OPERATIONS 127,672 202,033 201,986 OTHER EXPENSE, NET: Interest expense (126,884) (117,229) (122,160) (Loss) gain on fair value adjustment for swaps and foreign currency exchange contract – net (7,573) 23,508 19,282 Unrealized foreign exchange (losses) gain – net (23,772) 24,643 36,406 Loss on extinguishment of debt — (2,693) — Net loss on fair value adjustment for warrant liabilities — (160,728) — Other non-operating income (expense) – net 3,652 (3,051) 612 Total other expense – net (154,577) (235,550) (65,860) (LOSS) INCOME BEFORE INCOME TAXES (26,905) (33,517) 136,126 INCOME TAX BENEFIT (EXPENSE) 46,482 (44,126) (18,729) NET INCOME (LOSS) 19,577 (77,643) 117,397 Less: Net income (loss) attributable to noncontrolling interest 238 (89) 329 Premium on early redemption of Redeemable Preferred Stock — 26,678 — Redeemable Preferred Stock dividend — 43,218 71,393 NET INCOME (LOSS) ATTRIBUTABLE TO GETTY IMAGES HOLDINGS, INC. $ 19,339 $ (147,450) $ 45,675 Net income (loss) per share attributable to Class A Getty Images Holdings, Inc. common stockholders: Basic $ 0.05 $ (0.53) 0.23 Diluted $ 0.05 $ (0.53) 0.23 Weighted-average Class A common shares outstanding: Basic 399,037,805 276,942,660 196,084,650 Diluted 411,495,025 276,942,660 201,507,355 See notes to consolidated financial statements.F-3CONSOLIDATED STATEMENTS OF COMPREHENSIVE INCOME (LOSS) INCOME(In thousands)Year Ended
December 31,2023 2022 2021 NET INCOME (LOSS) $ 19,577 $ (77,643) 117,397 OTHER COMPREHENSIVE INCOME (LOSS): Net foreign currency translation adjustment gain (losses) 21,852 (30,525) (31,603) COMPREHENSIVE INCOME (LOSS) 41,429 (108,168) 85,794 Less: Comprehensive gain (loss) attributable to noncontrolling interest 238 (89) 328 COMPREHENSIVE INCOME (LOSS) ATTRIBUTABLE TO GETTY IMAGES HOLDINGS, INC. $ 41,191 $ (108,079) $ 85,466 See notes to consolidated financial statements.F-4CONSOLIDATED STATEMENTS OF REDEEMABLE PREFERRED STOCK AND STOCKHOLDERS’ EQUITY (DEFICIT)(In thousands, except share amounts)
cash and share considerationRedeemable
Preferred StockClass A
Common StockClass B
Common StockAdditional
Paid-In
CapitalAccumulated
DeficitAccumulated
Other
Comprehensive
LossTotal
Getty Images
Holdings, Inc.
Stockholders’
Equity (Deficit)Noncontrolling
InterestTotal
Stockholders’
Equity (Deficit)Shares Amount Shares Amount Shares Amount BALANCE — December 31, 2020 606,910 $ 613,957 153,303,505 $ 1,533 — $ — $ 998,487 $ (1,320,508) $ (46,800) $ (367,288) $ 47,728 $ (319,560) Retroactive application of recapitalization — $ — 42,779,007 $ (1,513) — $ — $ 1,513 $ — $ — $ — $ — $ — BALANCE — December 31, 2020, after effect of recapitalization 606,910 $ 613,957 196,082,512 $ 20 — $ — $ 1,000,000 $ (1,320,508) $ (46,800) $ (367,288) $ 47,728 $ (319,560) Net loss — — — — — — — 117,068 — 117,068 329 117,397 Other comprehensive (loss) — — — — — — — — (31,603) (31,603) (1) (31,604) Issuance of common stock in connection with equity-based compensation arrangements — — 12,790 — — — 35 — — 35 — 35 Redeemable Preferred Stock dividend 70,574 71,393 — — — — (71,393) — — (71,393) — (71,393) Equity-based compensation activity — — — — — — 6,440 — — 6,440 — 6,440 BALANCE — December 31, 2021 677,484 $ 685,350 196,095,302 $ 20 — $ — $ 935,082 $ (1,203,440) $ (78,403) $ (346,741) $ 48,056 $ (298,685) Net loss — — — — — — — (77,554) — (77,554) (89) (77,643) Other comprehensive (loss) — — — — — — — — (30,525) (30,525) (30,525) Cumulative effect of accounting change- adoption of ASU 2019-12 (Note 2) — — — — — — — (1,360) — (1,360) — (1,360) Issuance of common stock in connection with equity-based compensation arrangements — — 1,581,275 — — — 194 — — 194 — 194 Common shares withheld for settlement of taxes in connection with equity-based compensation — — (679,914) — — — (6,267) — — (6,267) — (6,267) Equity-based compensation activity — — — — — — 9,547 — — 9,547 — 9,547 Redeemable Preferred Stock dividend 38,109 43,218 — — — — (43,218) — — (43,218) — (43,218) Premium on early redemption of Redeemable Preferred Stock — 26,678 — — — — (26,678) — — (26,678) — (26,678) Redemption of Redeemable Preferred Stock for cash and share consideration (715,593) (755,246) 15,000,000 2 — — 140,248 — — 140,250 — 140,250 Issuance of Class A and Class B common stock upon Business Combination and PIPE Investment, net of tax impact and issuance costs — — 107,068,311 10 5,140,000 1 694,449 — — 694,460 — 694,460 Issuance of Class A common stock upon exercise of Private Placement Warrants — — 11,555,996 1 — — 232,852 — — 232,853 — 232,853 Issuance of Class A common stock upon exercise of Public Warrants — — 10,328 — — — 121 — — 121 — 121 Issuance of Class A common stock upon vesting of Earn-out shares — — 58,999,956 6 — — (6) — — — — — Conversion of Class B common stock to Class A common Stock — — 5,140,000 — (5,140,000) (1) — — — (1) — (1) BALANCE — December 31, 2022 — — 394,771,254 39 — — 1,936,324 (1,282,354) (108,928) 545,081 47,967 593,048 Net income — — — — — — — 19,339 — 19,339 238 19,577 Other comprehensive income — — — — — — — — 21,852 21,852 — 21,852 Issuance of common stock in connection with equity-based compensation arrangements — — 12,035,420 1 — — 15,049 — — 15,050 — 15,050 Common shares withheld for settlement of taxes in connection with equity-based compensation — — (1,835,887) — — — (8,713) — — (8,713) — (8,713) Equity-based compensation activity — — — — — — 40,616 — 40,616 — 40,616 BALANCE — December 31, 2023 — $ — 404,970,787 $ 40 — $ — $ 1,983,276 $ (1,263,015) $ (87,076) $ 633,225 $ 48,205 $ 681,430 See notes to consolidated financial statements.F-5CONSOLIDATED STATEMENTS OF CASH FLOWS
(In thousands)Year Ended
December 31,2023 2022 2021 CASH FLOWS FROM OPERATING ACTIVITIES: Net income (loss) $ 19,577 $ (77,643) $ 117,397 Adjustments to reconcile net income (loss) to net cash provided by operating activities: Depreciation 54,374 49,574 51,099 Amortization 24,069 43,645 49,361 Unrealized exchange gains on foreign denominated debt 16,579 (26,636) (39,173) Equity-based compensation 37,652 9,292 6,440 Non-cash fair value adjustment for common stock warrants — 160,728 — Deferred income taxes – net (76,624) 15,801 5,793 Uncertain tax positions (12,561) (5,368) (20,507) Non-cash fair value adjustment for swaps and foreign currency exchange contracts 7,573 (22,005) (20,196) Amortization of debt issuance costs 3,965 6,096 6,741 Non cash operating lease costs 12,173 9,760 — Impairment of right of use assets — 2,563 — Loss on extinguishment of debt — 2,693 — Transaction costs allocated to common stock warrants — 4,262 — Non-cash fair value adjustment of contingent consideration — (4,039) 1,373 Other 4,458 3,428 (725) Changes in assets and liabilities: Accounts receivable (11,704) 6,016 (16,075) Accounts payable 9,799 6,001 (555) Accrued expenses (6,808) (14,231) 18,712 Insurance recovery receivable (48,615) — — Litigation reserves 98,149 — — Lease liabilities, non-current (13,187) (11,408) — Income taxes receivable/payable 8,027 (188) 320 Deferred revenue 4,532 9,140 24,783 Other 1,288 (4,364) 4,102 Net cash provided by operating activities 132,716 163,117 188,890 CASH FLOWS FROM INVESTING ACTIVITIES: Acquisition of property and equipment (56,999) (59,291) (49,317) Purchase of a minority investment — (2,000) — Acquisition of a business, net of cash acquired — — (89,206) Other investing activities — — 1,597 Net cash used in investing activities (56,999) (61,291) (136,926) CASH FLOWS FROM FINANCING ACTIVITIES: Repayment of debt (50,400) (310,400) (17,449) Payment of contingent consideration — (10,000) — Payment of Redeemable Preferred Stock — (614,996) — Cash contributions from business combination — 864,164 — Cash paid for debt issuance costs (1,137) — — Proceeds from common stock issuance 15,050 — — Cash paid for settlement of employee taxes related to exercise of equity-based awards (8,713) (6,267) — Cash paid for equity issuance costs (150) (106,917) (1,851) Proceeds from option and warrant exercises — 313 35 Redemption of warrants for cash — (244) — Net cash used in financing activities (45,350) (184,347) (19,265) EFFECTS OF EXCHANGE RATE FLUCTUATIONS 8,089 (6,614) (2,479) NET INCREASE (DECREASE) IN CASH, CASH EQUIVALENTS AND RESTRICTED CASH 38,456 (89,135) 30,220 CASH, CASH EQUIVALENTS AND RESTRICTED CASH - Beginning of period 102,394 191,529 161,309 CASH, CASH EQUIVALENTS AND RESTRICTED CASH - End of period $ 140,850 $ 102,394 $ 191,529 SUPPLEMENTAL DISCLOSURES: Interest paid $ 122,826 $ 110,909 $ 115,258 Income taxes paid, including foreign taxes withheld $ 31,700 $ 30,800 $ 32,300 F-6NOTES TO CONSOLIDATED FINANCIAL STATEMENTS1.DESCRIPTION OF THE BUSINESS1. DESCRIPTION OF THE BUSINESSGetty Images Holdings, Inc. (the “Company” or “Getty Images”) is a preeminent global visual content creator and marketplace.marketplace that offers a full range of content solutions to meet the needs of customers around the globe, no matter their size. Through Getty Images, iStock, and Unsplash brands, websites and APIs, the Company serves customers in almost every country in the world and is one of the first places people turn to discover, purchase and share powerful visual content from the world’s best photographers and videographers. The Company offers a full range of content, with over 520562 million assets available through its industry-leading sites. The Company servicesserves businesses in almost every country in the world with websites in 23 languages bringing content to mediamedia outlets, advertising agencies and corporations and, increasingly, serving individual creators and prosumers.On July 22, 2022 (the “Closing Date”), the Company consummated the transactions in the Business Combination Agreement, dated December 9, 2021 (the “Business Combination Agreement” and the consummation of such transactions, the “Closing”), by and among CC Neuberger Principal Holdings II, a Cayman Islands exempted company (“CCNB”), the Company (at such time, named Vector Holding, LLC, a Delaware limited liability company and wholly-owned subsidiary of CCNB), Vector Domestication Merger Sub, LLC, a Delaware limited liability company and wholly-owned subsidiary of the Company (“Domestication Merger Sub”), Vector Merger Sub 1, LLC, a Delaware limited liability company and a wholly-owned subsidiary of CCNB (“G Merger Sub 1”), Vector Merger Sub 2, LLC, a Delaware limited liability company and a wholly-owned subsidiary of CCNB (“G Merger Sub 2”), Griffey Global Holdings, Inc., a Delaware corporation (“Legacy Getty”), and Griffey Investors, L.P., a Delaware limited liability companypartnership (the “Partnership”). On the day prior to the Closing Date, the Company statutorily converted from a Delaware limited liability company to a Delaware corporation (the “Statutory Conversion”). On the Closing Date, CCNB merged with and into Domestication Merger Sub, with Domestication Merger Sub surviving the merger as a wholly-owned direct subsidiary of the Company (the “Domestication Merger”). Following the Domestication Merger on the Closing Date, G Merger Sub 1 merged with and into Legacy Getty, with Legacy Getty surviving the merger as an indirect wholly-owned subsidiary of the Company (the “First Getty Merger”). Immediately after the First Getty Merger, Legacy Getty merged with and into G Merger Sub 2 with G Merger Sub 2 surviving the merger as an indirect wholly-owned subsidiary of the Company (the “Second Getty Merger” and together with the First Getty Merger, the “Getty Mergers” and, together with the Statutory Conversion and the Domestication Merger, the “Business Combination”). See “Note 3 — Business Combination” for further details.Legacy Getty was incorporated in Delaware on September 25, 2012, and in October of the same year, indirectly acquired Getty Images, Inc.2. SUMMARY OF SIGNIFICANT ACCOUNTING POLICIES2.SUMMARY OF SIGNIFICANT ACCOUNTING POLICIESBasis of Presentation — The Business Combination in July of 2022 was accounted for as a reverse recapitalization in accordance with U.S. GAAP. Under this method of accounting, CCNB was treated as the “acquired” company and Legacy Getty is treated as the acquirer for financial reporting purposes. For accounting purposes, the Business Combination was treated as the equivalent of Legacy Getty issuing stock for the net assets of CCNB, accompanied by a recapitalization. The net assets of CCNB are stated at historical cost, with no goodwill or other intangible assets recorded.Legacy Getty was determined to be the accounting acquirer based on the following predominant factors:●•Legacy Getty stockholders have the greatest voting interest in the Company with approximately 72% of the voting interest;●•Legacy Getty stockholders have the ability to nominate a majority of the initial members of the Company’s Board of Directors;●•Legacy Getty senior management is the senior management of the Company; and●•Legacy Getty was the larger entity based on historical operating activity and had the larger employee base.F-7The consolidated assets, liabilities and results of operations prior to the Business Combination are those of Legacy Getty. The shares and corresponding capital amounts and earnings per share, prior to the Business Combination, have been retroactively restated based on shares reflecting the exchange ratio of 1.27905 (the “Exchange Ratio”) established in the Business Combination.Certain immaterial changes in presentationThe accompanying consolidated financial statements include the accounts and operations of the Company and its wholly owned subsidiaries. All intercompany balances and transactions have been made to conform the prior period presentation to current period reporting.eliminated in consolidation.F-7 the management to make estimates and assumptions that affect the reported amounts of assets and liabilities and disclosure of contingent assets and liabilities at the date of the consolidated financial statements and revenues and expenses reported during the period. Some of the estimates and assumptions that require the most difficult judgments are: a) the appropriateness ofassumptions used to estimate unused capped subscription-based and credit-based products; b) the valuation and useful lives of intangibles and other long-lived assets; b)assumptions used to allocate transaction price to multiple performance obligations for uncapped subscription arrangements; c) the appropriateness of the amount of accrued income taxes, including the potential outcome of future tax consequences of events that have been recognized in the consolidated financial statements as well as the deferred tax asset valuation allowances; c) the sufficiency of the allowance for doubtful accounts;allowances and; d) the assumptions used to value equity-based compensation arrangements; e) the assumptions used to allocate transaction price to multiple performance obligations for uncapped subscription arrangements; f) the assumptions used to estimate unused capped subscription-basedaccrued litigation reserves and credit-based products; g) the assumptions used to estimate the contingent consideration; and h) the assumptions used to estimate the fair value of Public, Private Placement and Forward Purchase Warrants (each as defined below).insurance recoveries. These judgments are inherently uncertain which directly impacts their valuation and accounting. Actual results and outcomes may differ from management’s estimates and assumptions.Reclassifications — Certain prior year amounts have been reclassified to conform to the current year presentation. For the year ending December 31, 2022, $1.1 million in legal fees associated with the warrant litigation was reclassified from “Selling, general and administrative expenses” to “Loss on litigation” within the Condensed Consolidated Statements of Operations.Principles of Consolidation — The consolidated financial statements and notes thereto include the accounts of Getty Images Holdings, Inc and its subsidiaries. Equity investments in which the Company exercises significant influence, but does not control and is not the primary beneficiary of, are accounted for using the equity method. Significant accounts and transactions between consolidated entities have been eliminated. Intercompany transactions and balances have been eliminated in consolidation.Noncontrolling Interest — The Company’s noncontrolling interest represents the minority stockholder’s ownership interest related to the Company’s subsidiary, Getty Images SEA Holdings Co., Limited (“Getty SEA”). The Company reports its non-controlling interest in subsidiary as a separate component of stockholders’ equity (deficit) in the Consolidated Balance Sheets and reports both net income (loss) attributable to the non-controlling interest and net lossincome (loss) attributable to the Company’s common stockholders on the face of the Consolidated Statements of Operations. The Company’s equity interest in Getty SEA is 50% and the non-controlling stockholder’s interest is 50%. Net Income or Loss from this subsidiary is allocated based upon these ownership interests. This is reflected in the Consolidated Statements of Redeemable Preferred Stock and Stockholders’ Equity (Deficit) as “Noncontrolling interest”.Net Income (Loss) Income Per Share Attributable to Common Stockholders — Basic net income (loss) income per share attributable to common stockholders is calculated by dividing the net income (loss) income attributable to common stockholders by the weighted-average number of shares of common stock outstanding for the period, without consideration of potentially dilutive securities. Net income (loss) income available to common stockholders represents net income (loss) income attributable to common stockholders adjusted by (i) the Redeemable Preferred Stock dividend (ii) premium on early redemption of the Redeemable Preferred Stock and (iii) the allocation of income or losses to the noncontrolling interest.DilutedIn periods where the Company recognizes a net loss, such as the year ended December 31, 2022, diluted net loss per share attributable to common stockholders is the same as basic net loss per share attributable to common stockholders since the effect of potentially dilutive securities is anti-dilutive given the net loss of the Company. anti-dilutive.Diluted net income per share is computed by dividing the net income attributable to common stockholders by the weighted average common shares outstanding and all potential common shares, if they are dilutive. The potentially dilutive effect of options or warrants are computed using the treasury stock method. Securities that potentially have an anti-dilutive effect are excluded from the diluted earnings per share calculation.Foreign Currencies — Assets and liabilities for subsidiaries with functional currencies other than the U.S. dollar are recorded in foreign currencies and translated at the exchange rate on the balance sheet date. Revenue and expenses areF-8translated at average rates of exchange prevailing during the year. Translation adjustments resulting from this process are charged or credited to “Other comprehensive income (loss) income”” (“OCI”), as a separate component of stockholders’ equity (deficit). Transaction gains and losses arising from transactions denominated in a currency other than the functional currency of the entity involved are included in “Foreign“Unrealized Foreign exchange gains (losses) — net” in the Consolidated Statements of Operations. For the years ended December 31, 2023, 2022, 2021, and 20202021 the Company recognized net foreign currency transaction gainsloss of $23.8 million, net gain of $24.6 million and net gain of $36.4 million, and net loss of $45.1 million, respectively.Derivative Instruments — The Company uses derivative instruments to manage exposures to foreign currency and interest rate risks. The objectives for holding derivatives include reducing or eliminating the economic impact of these exposures. Derivative instruments are recorded as either assets or liabilities and are measured at fair value. The accounting for changes in the fair value of a derivative depends on the intended use of the derivative and whether the instrument is designated as a hedge for accounting purposes. For a derivative instrument designated as a cash flow hedge, the effective portion of the derivative’s gain or loss is initiallyF-8“Gain (loss)“(Loss) gain on fair value adjustment for swaps and foreign currency exchange contracts —contract – net” in the Consolidated Statements of Operations. As of December 31, 2023, 2022, 2021, and 20202021 the Company did not have any derivatives designated as hedging instruments as defined by the derivative instruments and hedging activities accounting guidance. See “Note 6 — Derivative Instruments” for further information.Litigation Reserves— The Company recognizes a charge for litigation reserves when a loss is probable, and the amount is material and reasonably determinable. The amount accrued represents the Company’s best estimate of the loss, including related interest if applicable or, if no best estimate within a range of outcomes exists, the minimum amount in the range is reserved and the high end of the range is disclosed. If it is determined that a loss is only reasonably possible or that a loss is probable but the amount is not reasonably estimable, the Company discloses the nature of the possible loss and gives an estimate of the possible range of loss. The estimates and judgments could change based on new information, changes in laws or regulations, or the outcome of legal proceedings, settlements, or other factors. If different estimates and judgments were applied with respect to these matters, it is likely that reserves would be recorded for different amounts. The reserve for litigation is accrued in “Litigation Reserves” on the Condensed Consolidated Balance Sheets and related legal and professional fees associated with the litigation are included in “Accounts Payable” or “Accrued Expenses” on the Condensed Consolidated Balance Sheets. See Note 13 — Commitments and Contingencies” for further discussion.Recoveries of Losses on Litigation— The Company recognizes the benefit of recoveries of losses on litigation when it is probable that such recoveries will be received. These recoveries are typically receivable from our third-party insurance carriers for legal claims and related costs that are included in “Loss on Litigation” on the Condensed Consolidated Statement of Operations, see “Note 13 — Commitments and Contingencies”.Cash, Cash Equivalents and Restricted Cash — The following represents the Company’s cash, cash equivalents and restricted cash as of December 31, 20222023 and 20212022 (in thousands):As of December 31, 2023 2022 Cash and cash equivalents $ 136,623 $ 97,912 Restricted cash 4,227 4,482 Total cash, cash equivalents and restricted cash $ 140,850 $ 102,394 Cash equivalents are short-term, highly liquid investments that are both readily convertible to cash and have maturities at the date of acquisition of three months or less. Cash equivalents are generally composed of investment-grade debt instruments subject to lower levels of credit risk, including certificates of deposit and money market funds. The Company’s current cash and cash equivalents consist primarily of cash on hand, bank deposits, and money market accounts.F-9Restricted cash consists primarily of cash held as collateral related to corporate credit cards and real estate lease obligations.Fair Value Measurements — The Company records its financial assets and liabilities at fair value. Fair value is defined as the price that would be received upon sale of an asset or paid upon transfer of a liability in an orderly transaction between market participants at the measurement date and in the principal or most advantageous market for that asset or liability. The fair value should be calculated based on assumptions that market participants would use in pricing the asset or liability, not on assumptions specific to the entity. In addition, the fair value of liabilities should include consideration of nonperformance risk including the Company’s own credit risk.The three-tier fair value hierarchy prioritizes the inputs used in the valuation methodologies. Each fair value measurement is reported in one of the three levels, which is determined by the lowest level input that is significant to the fair value measurement in its entirety. These levels are:Level 1 — Valuations based on quoted prices for identical assets and liabilities in active markets.Level 2 — Valuations based on observable inputs other than quoted prices included in Level 1, such as quoted prices for similar assets and liabilities in active markets, quoted prices for identical or similar assets and liabilities in markets that are not active, or other inputs that are observable or can be corroborated by observable market data.Level 3 — Valuations based on unobservable inputs reflecting management’s own assumptions, consistent with reasonably available assumptions made by other market participants. These valuations require significant judgment.Contingent Consideration — The Company records a liability for contingent consideration at the date of a business combination and reassesses the fair value of the liability each period until it is settled. Upon settlement of these liabilities, the portion of the contingent consideration payment that is attributable to the initial amount recorded as part of the business combination will be classified as a cash flow from financing activities and the portion of the settlement that is attributable to subsequent changes in the fair value of the contingent consideration will be classified as a cash flow from operating activities in the Consolidated Statement of Cash Flows.Accounts Receivable — Net — Accounts receivable are trade receivables, net of reserves for allowances for doubtful accounts totaling $6.5 million and $5.9$6.5 million as of December 31, 2023 and 2022, and 2021, respectively.Allowance for doubtful accounts is calculated based on historical losses, existing economic conditions, and analysis of specific older account balances of customer and delegate accounts. Trade receivables are written off when collection efforts have been exhausted.F-9Year Ended December 31, 2023 2022 2021 Beginning of year $ 6,460 $ 5,946 $ 7,773 Provision 2,228 1,465 750 Deductions (2,161) (951) (2,577) End of year $ 6,527 $ 6,460 $ 5,946 Deductions represent balances written off, net of amounts recovered that had previously been written off, and the effect of exchange rate fluctuations.Property and Equipment — Net — Property and equipment are stated at cost, net of accumulated depreciation. Contemporary and archival imagery consists of costs to acquire imagery from third parties and internal and external costs incurred in creating imagery, including identification of marketable subject matter, art direction, digitization, mastering and the assignment of search terms, and other pertinent information to each image. Computer software developed for internal use consists of internal and external costs incurred during the application development stage of software development (except for training costs) and costs of upgrades or enhancements that result in additional software functionality. Costs incurred during the web application, infrastructure, graphics and content development stages of website development are also capitalized and included within computer software developed for internal use.F-10Expenditures that extend the life, increase the capacity or improve the efficiency of property and equipment are capitalized, while expenditures for repairs and maintenance are expensed as incurred.Depreciation is recognized on a straight-line basis over the estimated useful lives of the assets or, for leasehold improvements, over the shorter of the remaining original term of the lease or the estimated life of the related asset.Minority Investment without Readily Determinable Fair Value — The carrying amount of the Company’s minority investments, which is included within “Other long-term assets” on the Consolidated Balance Sheets, was $9.6$10.0 million and $8.1$9.6 million as December 31, 20222023 and 2021,2022, respectively. The Company uses the measurement alternative for these equity investments and their carrying value is reported at cost, adjusted for impairments or any observable price changes in ordinary transactions with identical or similar investments. Revenue related to content consumed by the minority investees was not material during any of the years end December 31, 2023, 2022 2021 and 2020.2021. The Company purchased a minority investment in another company during the year ended December 31, 2022. The cost of that investment was $2.0 million.The investments are holdings in a privately held companies that are not exchange traded and therefore not supported with observable market prices. The Company periodically evaluates the carrying value of the minority investment, or when events and circumstances indicate that the carrying amount of an asset may not be recovered. As of December 31, 2023, 2022 2021 and 2020,2021, no adjustments to the carrying values of the Company’s long-term investments were identified as a result of this assessment. Changes in performance negatively impacting operating results and cash flows of these investments could result in the Company recording an impairment charge in future periods.Goodwill — The Company evaluates goodwill for impairment annually or more frequently when an event occurs, or circumstances indicate it is more likely than not that the fair value of the reporting unit is below its carrying value. Circumstances that could indicate impairment and require impairment tests more frequently than annually include; significant adverse changes in legal factors or market and economic conditions, a significant decline in the financial results of the Company’s operations, significant changes in strategic plans, adverse actions by regulators, unanticipated changes in competition and market share, or a planned disposition of a significant portion of the business. Management performs the annual goodwill impairment analysis as of October 1 each year. The Company’s 2023, 2022 2021 and 20202021 goodwill impairment analyses did not result in an impairment charge. As circumstances change, it is possible that future goodwill impairment analysis could result in goodwill impairments, which would be included in the calculation of income or loss from operations.Identifiable Intangible Assets — Identifiable intangible assets are assets that do not have physical representation but that arise from contractual or other legal rights or are capable of being separated or divided from the Company and sold, transferred, licensed, rented or exchanged. Identifiable intangible assets are amortized on a straight-line basis over their estimated useful lives, unless such life is determined to be indefinite. The remaining useful lives of identifiable intangible assets are reassessed each reporting period to determine whether events and circumstances warrant revisions to the remaining periods of amortization. Potential impairment of identifiable intangible assets with an indefinite useful life are evaluated annually or whenever circumstances indicateF-11Loans Receivable — Loans are stated at unpaid principal balances less any allowance for loan losses. Interest is recognized over the term of the loan and is calculated using the compound interest method. Management considers a loan impaired when, based on current information or factors, it is probable that the principal and interest payment will not be collected according to the loan agreement. The Company did not recognize any loan impairment charges during the years ended December 31, 2023, 2022 2021 or 2020.Restructuring Costs — Restructuring costs consist of lease loss expenses and employee termination costs. The primary reasons the Company will vacate a leased space early are: consolidation of office space, decisions to move from one location to a more suitable location, and closure of excess space acquired in a business combination. An accrued liability for lease loss expenses is initially measured at fair value, based on a best estimate of the remaining lease payments due under the lease plus other costs, less any estimated sublease income, and then discounted using a credit-adjusted risk-free interest rate. These assumptions are periodically reviewed and adjustments are made to the accrued restructuring charge as required. The Company records accretion expense for losses on leased property as the difference between estimated cost and the present value of these costs. Accretion expense is recorded on an ongoing basis through the end of the lease term and is reflected as “Other operating expense — net” in the Consolidated Statements of Operations. Employee termination costs are incurred when the Company has a reduction in force and include one-time termination benefits that are not a part of an existing benefit arrangement. See “Note 21 — Restructuring Costs” for further information.Leases —The Company recorded rent expense for the year end December 31, 2021 on a straight-line basis over the term of the related lease. Prior to the adoption of ASU 2016-02, “Leases (Topic 842)”, as amended (“ASC 842”), the difference between the rent expense recognized and the actual payments made in accordance with the operating lease agreement was recognized as a deferred rent liability on the Company’s Consolidated Balance Sheet. AsF-11Effective January 1, 2022, the Company adopted ASC 842. 842 using the modified retrospective transition method and elected the package of practical expedients permitted under the transition guidance, which allows a carryforward of the historical lease classification. The Company also elected the hindsight practical expedient to determine the reasonably certain lease term for existing leases. The election of the hindsight practical expedient did not alter the lease terms for any of the existing leases. Upon adoption of this standard on January 1, 2022, the Company recognized a total lease liability in the amount of $61.3 million, representing the present value of the minimum rental payments remaining as of the adoption date, a right-of-use asset in the amount of $53.1 million with offsets to deferred rent of $8.3 million.In accordance with ASC 842, the Company first determines if an arrangement contains a lease and the classification of that lease, if applicable, at inception. This standard requires the recognition of right-of-use (“ROU”) assets and lease liabilities for the Company’s operating leases. For contracts with lease and non-lease components, the Company has elected not to allocate the contract consideration, and to account for the lease and non-lease components as a single lease component. The Company has also elected not to recognize a lease liability or ROU asset for leases with a term of 12 months or less, and recognize lease payments for those short-term leases on a straight-line basis over the lease term in the Consolidated Statements of Operations. Operating leases are included in “Right of use assets”, “Accrued expenses” and “Lease liabilities” (net of current portion) in the Consolidated Balance Sheets.ROU assets represent the Company’s right to use an underlying asset for the lease term and lease liabilities represent the Company’s obligation to make lease payments under the lease. ROU assets and lease liabilities are recognized at the lease commencement date based on the present value of lease payments over the lease term. The implicit rate within the Company’s leases is generally not determinable and therefore the incremental borrowing rate at the lease commencement date is utilized to determine the present value of lease payments. The determination of the incremental borrowing rate requires judgment. Management determines the incremental borrowing rate for each lease using the Company’s estimated borrowing rate, adjusted for various factors including level of collateralization, term and currency to align with the terms of the lease. The ROU asset also includes any lease prepayments, offset by lease incentives. Certain of the Company’s leases include options to extend or terminate the lease. An option to extend the lease is considered in connection with determining the ROU asset and lease liability when the Company is reasonably certain that the option will be exercised. An option to terminate is considered unless the Company is reasonably certain the option will not be exercised. The ROU assets are reviewed for impairment with the Company’s long-lived assetsDeferred Offering Costs— The Company capitalized direct and incremental qualified legal, accounting and direct costs related to its proposed equity offering and Business Combination. See “Note 3 — Business Combination” for further information. As of December 31, 2021 Deferred offering costs were included in “Other current assets” on the Consolidated Balance Sheets. Upon closing of the Business Combination the offering costs were reflected as a deduction to additional paid-in capital. As of December 31, 2021, $3.9 million of deferred offering costs were capitalized. There were no such costs capitalized as of December 31, 2022.F-12$1.5 million and $1.3$1.5 million for the years ended December 31, 2022 2021 and 2020,2021, respectively. These costs are included in “Selling, general and administrative expenses” in the Consolidated Statements of Operations. Getty Investments was the majority partner in Partnership. With the closing of the Business Combination, the management fee contract was terminated.On June 15, 2016, Getty SEA, a subsidiary of the Company, entered into various agreements with Visual China Group Holding Limited (“VCG”). As part of those agreements, Getty SEA issued $24.0 million in an unsecured note receivable to VCG. This note receivable bears interest at 2.5% per annum with an August 18, 2036 due date. VCG is also a minoritynoncontrolling interest stockholder of Getty SEA. As of December 31, 2023, 2022 and 2021 this unsecured note receivable is included in “Other long-term assets” in the Consolidated Balance Sheets.Revenue Recognition — Revenue is derived principally from licensing rights to use images, video footage and music that are delivered digitally over the internet. Digital content licenses are generally purchased on a monthly or annual subscription basis, whereby a customer either pays for a predetermined quantity of content or for access to the Company’s content library that may be downloaded over a specific period of time, or, on a transactional basis, whereby a customer pays for individual content licenses at the time of download. Also, a significant portion of revenue is generated through the sale and subsequent use of credits. Various amounts of credits are required to license digital content.The Company recognizes revenue gross of contributor royalties because the Company is the principal in the transaction as it is the party responsible for the performance obligation and it controls the product or service before transferring it to the customer. The Company also licenses content to customers through third-party delegates worldwide (approximately 3% of total revenues for the years ended December 31, 2023, 2022 2021 and 2020)2021). Delegates sell the Company’s products directly to customers as the principal in those transactions. Accordingly, the Company recognizes revenue net of costs paid to delegates. Delegates typically earn and retain 35% to 50% of the license fee, and the Company recognizes the remaining 50%65% to 65%50% as revenue.F-12The Company maintains a credit department that sets and monitors credit policies that establish credit limits and ascertains customer creditworthiness, thus reducing the risk of potential credit loss. Revenue is not recognized unless it is determined that collectability is reasonably assured. Revenue is recorded at invoiced amounts (including discounts and applicable sales taxes) less an allowance for sales returns, which is based on historical information. Customer payments received in advance of revenue recognition are contract liabilities and are recorded as deferred revenue. Customers that do not pay in advance are invoiced and are required to make payments under standard credit terms.The Company recognizes revenue under the core principle to depict the transfer of control to the Company’s customers in an amount reflecting the consideration to which the Company expects to be entitled. In order to achieve that core principle, the Company applies the following five-step approach: (i) identify the contract with a customer, (ii) identify the performance obligations in the contract, (iii) determine the transaction price, (iv) allocate the transaction price to the performance obligations in the contract and (v) recognize revenue when a performance obligation is satisfied.For digital content licenses, the Company recognizes revenue on both its capped subscription-based, credit-based sales and single image licenses when content is downloaded, at which time the license is provided. In addition, management estimates expected unused licenses for capped subscription-based and credit-based products and recognizes the revenue associated with the unused licenses throughout the subscription or credit period. The estimate of unused licenses is based on historical download activity and future changes in the estimate could impact the timing of revenue recognition of the Company’s subscription products.For uncapped digital content subscriptions, the Company has determined that access to the existing content library and future digital content updates represent two separate performance obligations. As such, a portion of the total contract consideration related to access to the existing content library is recognized as revenue at the commencement of the contract when control of the content library is transferred. The remaining contractual consideration is recognized as revenue ratably over the term of the contract when updated digital content is transferred to the licensee, in line with when the control of the new content is transferred.See “Note“Note 14 — Revenue” and “Note 22“Note 21 — Segment and Geographic Information” for additional revenue disclosures.Cost of Revenue — The ownership rights to the majority of the content licensed is retained by the owners, and licensing rights are provided to the Company by a large network of content suppliers. When the Company licenses content entrusted by content suppliers, royalties are paid to them at varying rates depending on the license model and the customers use of that content. SuppliersF-13Sales Commissions — Internal sales commissions are generally paid in the quarter following invoicing of the commissioned receivable and is reported in “Selling, general and administrative expenses” on the Consolidated Statements of Operations. The Company expenses contract acquisition costs, including internal sales commissions, as incurred, to the extent that the amortization period would otherwise be one year or less.Equity-Based Compensation — Equity-based compensation is accounted for in accordance with authoritative guidance for equity-based payments. This guidance requires equity-based compensation cost to be measured at the grant date based on the fair value of the award and recognized as an expense over the applicable service period, which is the vesting period, net of estimated forfeitures. Compensation expense for equity-based payments that contain service conditions is recorded on a straight-line basis, over the service period of generally four years. Compensation expense for equity-based payments that contain performance conditions is not recorded until it is probable that the performance condition will be achieved. The estimation of stock awards that will ultimately vest requires judgment, and to the extent actual results or updated estimates differ from the Company’s current estimates, such amounts will be recorded as a cumulative adjustment in the period estimates are revised. The Company considers many factors when estimating expected forfeitures, including types of awards, employee class, and historical experience. Actual results and future estimates may differ substantially from current estimates.Common Stock Warrants — The Company assumed 20,700,000 warrants originally issued in CCNB’s initial public offering (the “Public Warrants”) and 18,560,000 warrants issued in a private placement that closed concurrently withF-13CCNB’s initial public offering, (the “Private Placement Warrants”) in the Business Combination. In addition, on the Closing Date, the Company issued 3,750,000 warrants in connection with a Forward Purchase Agreement dated August 4, 2020 (the “Forward Purchase Agreement” and the “Forward Purchase Warrants”). The Public, Private Placement and Forward Purchase Warrants entitled the holder to purchase one share of Class A common stock at an exercise price of $11.50 per share.The Company evaluated the Public, Private Placement and Forward Purchase Warrants (together “the Warrants”) under ASC 815-40, Derivatives and Hedging-Contracts in Entity’s Own Equity (“ASC 815-40”), and concluded they did not meet the criteria to be indexed to the Company’s own stock as certain provisions of the warrant agreement could change the settlement amount of these warrants based on variables that would not be considered inputs to the valuation model for a fixed-for-fixed equity instrument. Since the Warrants met the definition of a derivative under ASC 815-40, the Company recorded these Warrants as liabilities in the Consolidated Balance Sheets at fair value, with subsequent changes in their respective fair values recognized in the “Loss on fair value adjustment for warrant liabilities — net” within the Consolidated Statements of Operations at each reporting date.The Public Warrants were publicly traded and thus had an observable market price to estimate fair value. The Forward Purchase Warrants, which had identical terms as the Public Warrants, were valued similar to the Public Warrants. The Private Placement Warrants were valued using a Black-Scholes option-pricing model as described in “Note 7 — Fair Value of Financial Instruments”.As described in “Note 5 — Common Stock Warrants”Warrants”, during the year ended December 31, 2022, all Warrants were exercised or redeemed.Advertising and Marketing— The Company markets its products and services mainly through paid search, natural or organic search optimization, affiliate marketing channels, email and website marketing, customer events and public relations initiatives. Costs associated with marketing efforts are recorded in “Selling, general and administrative expenses” when related liabilities are incurred. For paid search and affiliate marketing, liabilities are incurred when potential new customers click through the links in the ad, generating an obligation to the internet search provider or affiliate marketing partner. Advertising and marketing costs expensed for the years ended December 31, 2023, 2022 and 2021 and 2020 were $48.5 million, $55.8 million and $53.7 million, and $49.0 million, respectively.Income Taxes — The Company computes income taxes and accruals for uncertain tax positions under the asset and liability method as set forth in the authoritative guidance for accounting for income taxes and uncertain tax positions. Deferred income taxes are provided for the temporary differences between the consolidated financial statement carrying amounts and the tax basis of the Company’s assets and liabilities and operating loss and tax credit carryforwards. The Company establishes a valuation allowance for deferred tax assets if it is not more likely than not that the tax benefits will be realized. Periodically, the valuation allowance isF-14“Note“Note 20 — Income Taxes”Taxes” for further information.Segments — The Company has determined that it operates and manages one operating segment, which is the business of developing and commercializing visual content. The Company’s chief operating decision maker (the “CODM”), its chief executive officer, reviews financial information on an aggregate basis for the purpose of allocating resources and making operating decisions.Concentration of Credit Risk — Financial instruments that are exposed to concentration of credit risk consist primarily of cash and cash equivalents and accounts receivable balances. Cash and cash equivalents are held with financial institutions of high quality. Balances may exceed the amount of insurance provided on such deposits.Concentration of credit risk with respect to trade receivables is limited due to the large number of customers and their dispersion across many geographic areas. No single customer represented 10% or more of the Company’s total revenue or accounts receivable in any of the years presented.Recently Adopted Accounting Standard Updates — In February 2016, the FASB issued ASU 2016-02, “Leases” (“ASU 2016-02”). ASU 2016-02 amends the accounting for leases. The new guidance requires the recognition of lease assets and liabilities for operating leases with terms of more than twelve months, in addition to those currently recorded, on the Consolidated Balance Sheets. Presentation of leases within the Consolidated Statements of Operations and Consolidated Statements of Cash Flows is generally consistent with the current lease accounting guidance. The Company adopted the new standard as of January 1, 2022 using the modified retrospective transition method and elected the package of practical expedients permitted under the transition guidance, which allows a carryforward of the historical lease classification. The Company also elected the hindsight practical expedient to determine the reasonably certain lease term for existing leases. The election of the hindsight practical expedient did not alter the lease terms for any of the existing leases. Upon adoption of this standard on January 1, 2022, the Company recognized a total lease liability in the amount of $61.3 million, representing the present value of the minimum rental payments remaining as of the adoption date, a right-of-use asset in the amount of $53.1 million with offsets to deferred rent of $8.3 million.In December 2019, the FASB issued ASU 2019-12, “Simplifying the Accounting for Income Taxes (Topic 740)” (“ASU 2019-12”), which removes certain exceptions to the general principles in Topic 740 and improves consistent application of and simplifies U.S. GAAP for other areas ofF-14Topic 740 by clarifying and amending existing guidance. The Company adopted ASU 2019-12, effective January 1, 2022. The adoption of this standard did not have a material impact on the consolidated financial statements.Recently Issued Accounting Standard Updates —In June 2016, the FASB issued ASU 2016-13 (Topic 326), “Financial Instruments — Credit Losses” (“ASU 2016-13”). ASU 2016-13 changes how to recognize expected credit losses on financial assets. The standard requires an entity to replace the incurred loss impairment methodology in current U.S. GAAP with a methodology that reflects current expected credit losses, requires consideration of a broader range of reasonable and supportable information to inform credit loss estimates and provides additional transparency about credit risk. The effective date of ASU 2016-13 for the Company is beginning with fiscal years after December 15, 2022, including interim periods within those fiscal years. The Company adopted ASU 2016-13 on January 1, 2023. The adoption of this standard did not have a material impact on the consolidated financial statements.Recently Issued Accounting Standard Updates — In November 2023, the Financial Accounting Standards Board ("FASB") issued new guidance that modifies the disclosure and presentation requirements of reportable segments. The new guidance requires the disclosure of significant segment expenses that are regularly provided to the chief operating decision maker ("CODM") and included within each reported measure of segment profit and loss. In addition, the new guidance enhances interim disclosure requirements, clarifies circumstances in which an entity can disclose multiple segment measures of profit or loss, provides new segment disclosure requirements for entities with a single reportable segment, and contains other disclosure requirements. The update is effective for annual periods beginning after December 15, 2023, and interim periods within fiscal years beginning after December 15, 2024, with early adoption permitted. The Company is in the process of evaluating the impact of adopting this new guidance on the consolidated financial statement disclosures.In December 2023, the FASB issued new guidance to amend and improve the existing income tax disclosure requirements. Under the new guidance, public business entities are required to disclose more details to the effective tax rate reconciliation and income taxes paid. The new guidance is effective for public business entities for annual periods beginning after December 15, 2024. The Company is in the process of evaluating the impact of adopting this new guidance on the consolidated financial statement disclosures.Subsequent Events — The Company evaluated subsequent events and transactions for potential recognition or disclosure in the consolidated financial statements through March 13, 2023.3.BUSINESS COMBINATION3. BUSINESS COMBINATIONAs discussed in “Note 1 – Description of the Business”, on July 22, 2022, the Company consummated the transactions contemplated by the Business Combination Agreement. At the Closing, and subject to the terms and conditions of the Business Combination Agreement, holders of 153,322,880 shares of Legacy Getty common stock received 196,938,915 shares of the Company’s Class A common stock as consideration in the Business Combination, and the previously outstanding Legacy Getty Redeemable Preferred Stock was retired in full through a combination of a cash payment of approximately $615.0 million and 15,000,000 shares of the Company’s Class A common stock with a fair value at issuance of $140.2 million. Each Legacy Getty Option (whether vested or unvested) to purchase Legacy Getty Common Shares was converted into an option to purchase a number of shares of the Company’s Class A common stock and at an exercise price converted based on the Exchange Ratio, calculated in accordance with the terms of the Business Combination Agreement.F-15F-15Pursuant to a certain letter agreement executed concurrently with the Business Combination Agreement (the “Sponsor Side Letter”), CC Neuberger Principal Holdings II Sponsor, LLC (the “Sponsor”), its independent directors and certain affiliates, agreed to convert, through a series of transactions, 5,140,000 of its CCNB Class B common stock into 2,570,000 Series B-1common stock and 2,570,000 Series B-2 common stock of the Company (the shares of Series B-2 common stock together with the shares of Series B-1 common stock, the “Restricted Sponsor Shares”), which were subject to forfeiture if certain vesting events are not satisfied. The Series B-1 common stock and Series B-2 common stock would vest and convert into shares of Class A common stock if (i) the volume weighted average price of the shares of the Company’s Class A common stock over any 20 trading days within any 30 consecutive trading day period was greater than or equal to $12.50 and $15.00, respectively, or (ii) if there was a change of control of the Company that would result in the holders of shares of the Company’s Class A common stock receiving a price per share equal to or in excess of $12.50 and $15.00, respectively. The Restricted Sponsor Shares are accounted for as equity-classified equity instruments and recorded in additional paid-in capital as part of the Business Combination.Concurrent with the execution of the Business Combination Agreement, CCNB and the Company entered into Subscription Agreements (the “PIPE Subscription Agreements”) with the Sponsor and Getty Investments. Additionally, on December 28, 2021, CCNB and the Company entered into the Permitted Equity Subscription Agreement with Multiply Group (the “Permitted Equity Subscription Agreement”). On July 22, 2022, Getty Investments entered into an additional subscription agreement with the Company (the “Additional Getty Subscription Agreement”). Pursuant to the PIPE Subscription Agreements, the Permitted Equity Subscription Agreement and the Additional Getty Subscription Agreement, on the Closing Date, the Sponsor, Getty Investments and Multiply Group subscribed for and purchased, and CCNB and the Company issued and sold to such investors, an aggregate of 36,000,000 shares of the Company’s Class A common stock for a purchase price of $10.00 per share, for aggregate gross proceeds of $360.0 million (the “PIPE Financing”).On the Closing Date, the Company completed the issuance and sale of 20,000,000 shares of the Company’s Class A common stock and 3,750,000 Forward Purchase Warrants to Neuberger Berman Opportunistic Capital Solutions Master Fund LP (“NBOKS”) for an aggregate purchase price of $200.0 million, in connection with the Forward Purchase Agreement. Refer to “Note 5 – Common Stock Warrants” for additional information on the accounting for the Forward Purchase Warrants.Additionally, on the Closing Date, the Company completed the sale of 30,000,000 shares of the Company’s Class A common stock to NBOKS, for a purchase price of $10.00 per share and aggregate purchase price of $300.0 million, pursuant to that certain Backstop Facility Agreement dated November 16, 2020, as amended.Upon the closing of the Business Combination, the Company’s certificate of incorporation was amended and restated to, among other things, increase the total number of authorized shares of all classes of capital stock to 2,006,140,000 shares, $0.0001 par value per share, of which, 2,000,000,000 shares are designated as Class A common stock, 5,140,000 shares are designated as Class B common stock, and 1,000,000 shares are designated as preferred stock.The Business Combination was accounted for as a reverse recapitalization in accordance with U.S. GAAP. Under this method of accounting, CCNB was treated as the “acquired” company and Getty Images is treated as the acquirer for financial reporting purposes. Accordingly, for accounting purposes, the Business Combination was treated as the equivalent of Getty Images issuing stock for the net assets of CCNB, accompanied by a recapitalization. The net assets of CCNB are stated at historical cost, with no goodwill or other intangible assets recorded.F-16F-16Cash – CCNB trust and cash, net of redemptions $ 4,164 Cash – PIPE Financing 360,000 Cash – Forward Purchase Agreement 200,000 Cash – Backstop Agreement 300,000 Less: Cash paid to redeem Redeemable Preferred Stock (614,996) Less: Transaction costs paid during the year ended December 31, 2022 (106,917) Net cash contributions from the Business Combination and related transactions $ 142,251 Add: Non-cash assets received from CCNB 806 Add: Transaction costs allocated to warrants 4,262 Add: Cash paid to redeem Redeemable Preferred Stock 614,996 Add: Tax effect of change in tax basis due to business combination 6,508 Less: Fair value of Public, Private Placement and Forward Purchase Warrants (72,374) Less: Transaction costs previously paid by Legacy Getty during 2021 or accrued at December 31, 2022 (1,989) Net Business Combination and related transactions, excluding Redeemable Preferred Stock redemption $ 694,460 Add: Fair value of Class A common stock issued to redeem Redeemable Preferred Stock 140,250 Net Business Combination and related transactions, including Redeemable Preferred Stock redemption $ 834,710 The number of shares of common stock issued immediately following the consummation of the Business Combination:CCNB shares held by the Sponsor in the table above include 5,140,000 Restricted Sponsor Shares.4.ACQUISITION4. ACQUISITIONOn April 1, 2021, (the “Closing Date”), the Company acquired Unsplash Inc. (“Unsplash”) in exchange for $95.4 million in cash plus additional conditional payments (“Contingent Consideration”).The Contingent Consideration payments are based on revenue of Unsplash for (i) the period commencing May 1, 2021 and ending on the earlier of when the trailing 12-month12 month revenues of Unsplash reaches $10.0 million or two years (the “Two-Year Earnout”), and (ii) the period commencing May 1, 2021 and ending on the earlier of when the trailing 12-month12 month revenues of the Unsplash reaches $30.0 million or three years (the “Three-Year Earnout”).If the Two-Year Earnout is met, the payment will be $10.0 million, plus $1.0 thousand for every $1.0 million in revenues that exceed $10.0 million and $2.5 thousand for every $1.0 million in revenues that exceeds $20.0 million in that trailing 12-month period. The Two-Year Earnout was met and payment of $10.0 million was made during the year ended December 31, 2022.F-17If the Three-Year Earnout is met, the payment will be $10.0 million, plus $1.0 thousand for every $1.0 million in revenues that exceed $30.0 million and $2.5 thousand for every $1.0 million in revenues that exceeds $60.0 million in that trailing 12-month12 month period.F-17The components of the fair value of consideration transferred are as follows (in thousands):Cash $ 95,418 Contingent Consideration 13,200 Total fair value of consideration transferred $ 108,618 The transaction was accounted for using the acquisition method and, accordingly, the results of the acquired business have been included in the Company’s results of operations from the acquisition date. In connection with the acquisition, the Company incurred approximately $0.4 million of transaction costs.Unsplash provides a platform for sharing exclusively curated, world-class images, free for use. With more than 102 million image downloads and 20 billion image views per month, Unsplash has become a leading source for visuals on the internet. This acquisition will allow the Company to increase its presence across the full spectrum of the world’s growing creative community.The fair value of consideration transferred in this business combination was allocated to the intangible and tangible assets acquired and liabilities assumed at the acquisition date, with the remaining unallocated amount recorded as goodwill. Goodwill is primarily attributed to assembled workforce of Unsplash and expected synergies from combining operations. Goodwill recognized for this acquisition was allocated to the Company’s one operating segment and is generally not tax deductible.The aggregate purchase price was allocated to the assets acquired and liabilities assumed as follows (in thousands):Assets acquired and liabilities assumed: Fair Value at
Acquisition DateCash and cash equivalents $ 6,213 Accounts receivable 1,061 Other current assets 736 Prepaid expenses 118 Property and equipment 1,729 Other long term assets 306 Identifiable intangible assets 23,900 Goodwill 75,782 Total assets acquired $ 109,845 Accounts payable and accrued expenses (128) Deferred income tax liability (1,099) Total liabilities assumed (1,227) Net assets acquired $ 108,618 F-18Table of ContentThe identifiable intangible assets, which include contributor content, customer relationships, developed technology, and trade names, have a weighted average life of approximately 6.0 years and are being amortized on a straight-line basis. The fair value of the customer relationships was determined using a variation of the income approach known as the multiple-period excess earnings method. The fair value of the trade names and developed technology were determined using the relief-from-royalty method and the fair value of the contributor content was determined using the cost-to-recreate method.The revenue and operating loss from Unsplash included in the Company’s consolidated statements of operations for the year ended December 31, 2021 was $5.8 million and $1.2 million, respectively.F-185. COMMON STOCK WARRANTS5.COMMON STOCK WARRANTSThe Company redeemed the Public Warrants at a price of $0.01 per warrant after the sale price of Class A common stock equaled or exceeded $18.00 per share for 20 trading days within a 30-trading30-trading day period. The Company had the option to require all holders that wish to exercise the Public Warrants to do so on a cashless basis.Private Placement Warrants — Simultaneously with CCNB’s initial public offering, CCNB consummated a private placement of 18,560,000 Private Placement Warrants with CCNB’s sponsor. Each Private Placement Warrant was exercisable for one share of Class A common stock at a price of $11.50 per share, subject to adjustment. The Private Placement Warrants were identical to the Public Warrants, except that the Private Placement Warrants were non-redeemable so long as they were held by the initial purchasers or such purchasers’ permitted transferees, and the initial purchasers or such purchasers’ permitted transferees had the option to exercise the Private Placement Warrants on a cashless basis. If the Private Placement Warrants were held by someone other than the initial purchasers or their permitted transferees, the Private Placement Warrants would be redeemable by the Company and exercisable by such holders on the same basis as the Public Warrants.In August 2022, all of the Private Placement Warrants were exercised on a cashless basis for 11,555,996 shares of Class A common stock. The fair value of the Private Placement Warrants was remeasured upon the exercise of the warrants, resulting in an non-cash loss of $176.6 million recorded in “Loss on fair value adjustment for warrant liabilities — net”liabilities” Consolidated Statements of Operations.Forward Purchase Warrants — Additionally, on the Closing Date, the Company issued 3,750,000 Forward Purchase Warrants in connection with the Forward Purchase Agreement. The Forward Purchase Warrants had the same terms as the Public Warrants.The Company concluded the Public, Private Placement and Forward Purchase Warrants meet the definition of a derivative under ASC 815-40 (as described in “Note 2 — Summary of Significant Accounting Policies”) and were recorded as liabilities. Upon consummation of the Business Combination, the fair value of the Public, Private Placement and Forward Purchase Warrants were recorded in the Consolidated Balance Sheet. Transaction costs allocated to the issuance of the Public, Private Placement and Forward Purchase Warrants of $4.3 million were recorded as “Other non-operating (expense) income — net” in the Consolidated Statements of Operations.On September 19, 2022, the Company announced that it had elected to redeem all of the outstanding Public Warrants and Forward Purchase Warrants that remain outstanding at 5:00 p.m. New York City time on October 19, 2022 for $0.01 per warrant. 10,328 Public Warrants were exercised for an aggregate cash payment of $0.1 million. Effective October 19, 2022, the remaining Public Warrants and Forward Purchase Warrants were redeemed for $0.2 million. The fair value of the Public and Forward Purchase Warrants was remeasured upon the exercise and redemption of the warrants, resulting in a non-cash gain of $15.9 million recorded in “Loss on fair value adjustment for warrant liabilities — net” Consolidated Statements of Operations.F-19As of December 31, 2022 and December 31, 2023, there arewere no outstanding Public, Private Placement or Forward Purchase Warrants.6. DERIVATIVE INSTRUMENTS6.DERIVATIVE INSTRUMENTSrecognizedrecognized gain of $0.7 million gain ofF-19$1.7and $1.7 million and loss $0.9 million of loss for the years ended December 31, 2022 and 2021, and 2020, respectively. These gains and losses are recognized in “Gain (loss)“(Loss) gain on fair value adjustment for swaps and foreign currency exchange contract —– net” in the accompanying Consolidated Statements of Operations.Interest Rate Risk — In February 2019, the Company entered into two interest rate swaps to hedge interest rate risk associated with the Company’s debt. TheOne of the swaps had a notional amounts of one of these swaps is $175.0 million and the other was $355.0 million. DuringCompany paid a fixed rate of 2.5010%. This swap matured during the year ended December 31, 2022, the $175.0 million2022. The other swap has a notional amount of $355.0 million and the Company pays a fixed rate of 2.5380%. This swap matured. The Company holds one interest rate swap atwas still outstanding as of December 31, 2022.2023, and matured in February 2024. Each swap contains an embedded floor option under which the Company receives a rate of 0.0% or one-month LIBOR, whichever is greater, to match the terms of the Company’s debt. In June 2023 the rate transitioned to the greater of one-month CME Term SOFR or negative 0.1%. Both swaps are considered economic hedges and have not been designated as hedges, as defined in the applicable accounting guidance, for financial reporting purposes. The changes in fair value are recognized in “Gain (loss)“(Loss) gain on fair value adjustment for swaps and foreign currency exchange contract —– net” in the accompanying Consolidated Statements of Operations. Under the interest rate swap agreements, the Company pays fixed rates of 2.5010% and 2.6000%, respectively, each month. Each swap contains an embedded floor option under which the Company receives a rate of 0.0% or one-month LIBOR, whichever is greater, to match the terms of the Company’s debt.For the interest rate swaps, the Company recognized loss of $7.6 million, gain of $22.8 million and gain of $17.6 million and loss of $13.3 million on these derivative instruments for the years ended December 31, 2023, 2022 and 2021, and 2020, respectively.The Company does not hold or issue derivative financial instruments for trading purposes. In general, the Company’s derivative activities do not create foreign currency exchange rate risk because fluctuations in the value of the instruments used for economic hedging purposes are offset by fluctuations in the value of the underlying exposures being hedged. Counterparties to derivative financial instruments expose the Company to credit related losses in the event of nonperformance; however, the Company has entered into these instruments with creditworthy financial institutions and considers the risk of nonperformance to be minimal.The following table summarizes the location and fair value amounts of derivative instruments reported in the Consolidated Balance Sheets (in thousands):As of December 31, 2023 2022 Asset Liability Asset Liability Derivatives not designated as hedging instruments: Interest rate swaps $ 1,459 $ — $ 9,032 $ — Total derivatives $ 1,459 $ — $ 9,032 $ — “Other“Other current assets”assets” and long-term derivative assets are included in “Other long-term assets” on the Consolidated Balance Sheet. Short-term derivative liabilities are included in “Accrued expenses” and long-term derivative liabilities are included in “Other long-term liabilities” on the Consolidated Balance Sheet.F-20The Company’s disclosable financial instruments as of December 31, 2023 and 2022 consist of cash equivalents, forward foreign currency exchange contracts, interest rate swaps, debt, and contingent consideration and common stock warrants.consideration. Assets and liabilities measured at fair value on a recurring basis (cash equivalents, forward exchange contracts, interest rates swaps and common stock warrants) and a nonrecurring basis (debt) are categorized in the tables below based on the levels discussed in “Note 2 — Summary of Significant Accounting Policies”.Financial instrument assets recorded at fair value as of December 31 are as follows (in thousands):As of December 31, 2023 Level 1 Level 2 Level 3 Total Money market funds (cash equivalents) $ 57,062 $ — $ — $ 57,062 Derivative assets: Interest rate swaps — 1,459 — 1,459 $ 57,062 $ 1,459 $ — $ 58,521 As of December 31, 2022 Level 1 Level 2 Level 3 Total Money market funds (cash equivalents) $ 20,462 $ — $ — $ 20,462 Derivative assets: Interest rate swaps — 9,032 — 9,032 $ 20,462 $ 9,032 $ — $ 29,494 The fair value of the Company’s money market funds is based on quoted active market prices for the funds and is determined using the market approach.Financial instrument liabilities recorded or disclosed at fair value as of December 31 are as follows (in thousands):As of December 31, 2023 Level 1 Level 2 Level 3 Total Term Loans $ — $ 1,104,237 $ — $ 1,104,237 Senior Notes — 302,250 — 302,250 $ — $ 1,406,487 $ — $ 1,406,487 As of December 31, 2022 Level 1 Level 2 Level 3 Total Term Loans $ — $ 1,112,990 $ — $ 1,112,990 Senior Notes — 297,354 — 297,354 $ — $ 1,410,344 $ — $ 1,410,344 The fair value of the Company’s interest rate swap contracts and foreign currency exchange contracts are based on market quotes provided by the counterparty. Quotes by the counterparty are calculated based on observable current rates and forward interest rate curves and exchange rates. The Company recalculates and validates this fair value using publicly available market inputs using the market approach.Contingent Consideration — As of December 31, 20222023 and 2021,2022, the Company had estimated its obligations to transfer Contingent Consideration relating to the acquisition of Unsplash to be zero and $14.0 million, respectively.zero. The Company recorded acquisition-date fair value of the Contingent Consideration, based on the likelihood of contingent earn-out payments, as part of the consideration transferred. The earn-out payments are remeasured to fair value each reporting date. Changes in the fair value of the Contingent Consideration are recognized within “Other operating expense (income) expense — –F-21net” on the Consolidated Statement of Operations. The fair value of the Contingent Consideration is based on significant inputs not observable in the market, and as suchF-21The Contingent Consideration payments are based on revenue of Unsplash as outlined in “Note 4 — Acquisition.” The Two-Year Earnout was met and a payment of $10.0 million was made during the year ended December 31, 2022.The following table provides quantitative information associated with the fair value measurements of the Company’s Level 3 inputs:
December 31, 2023
(in thousands)Valuation
TechniqueUnobservable Input Range December 31, 2022Valuation(in thousands)TechniqueUnobservable InputRange— $—1.579.94%This Contingent Consideration was valued using an income approach where revenue was simulated in a risk-neutral framework using Geometric Brownian Motion, a model of stock price behavior that is used in option pricing models such as the Black-Scholes option pricing model. The real options method extends this model to situations where the asset of interest (revenue in this case) is not priced in the market. The significant unobservable inputs used in the fair value measurement of the Contingent Consideration forecasts of expected future revenues and the probability of achievement of those forecasts. Increases in the assessed likelihood of a higher payout under a Contingent Consideration arrangement contribute to increases in the fair value of the related liability. Conversely, decreases in the assessed likelihood of a higher payout under a Contingent Consideration arrangement contribute to decreases in the fair value of the related liability.The following table presents changes in the fair value of the Contingent Consideration for the years ended December 31 (in thousands):Year end December 31, 2023 2022 Balance, beginning of period $ — $ 14,039 Payment — (10,000) Change in fair value of Contingent Consideration — (4,039) Balance, end of period $ — $ — The Private Placement Warrants, all of which were exercised on a cashless basis in August 2022, were valued based on a Black-Scholes option pricing model, using assumptions and estimates the Company believes would be made by a market participant in making the same valuation. The Private Placement Warrants were collectively classified as a Level 3 measurement within the fair value hierarchy because the valuation model involves the use of unobservable inputs relating to the Company’s estimate of its expected stock volatility, which was developed based on the historical volatility of a publicly traded set of peer companies.F-22Changes in the fair value of the Private Placement Warrant liability related to updated assumptions and estimates are recognized within the Consolidated Statements of Operations as a non-operating expense. The changes in the fair value of the Private Placement Warrant liability resulted from changes in the fair values of the underlying Class A common shares and its associated volatilities.F-222022$$—56,237 56,237176,616 176,616(232,853)(232,853)$$—8.PROPERTY AND EQUIPMENT – NETProperty and equipment consisted of the following at the reported Balance Sheet dates (in thousands, except years):Estimated
Useful
Lives
(in Years)December 31, 2023 2022 Contemporary imagery 5 $ 395,063 $ 377,858 Computer hardware purchased 3 2,809 6,783 Computer software developed for internal use 3 161,317 119,516 Leasehold improvements 2–20 8,295 8,361 Furniture, fixtures and studio equipment 5 11,341 10,856 Archival imagery 40 96,090 94,043 Other 3–4 2,406 2,352 Property and equipment 677,321 619,769 Less: accumulated depreciation (497,943) (447,686) Property and equipment, net $ 179,378 $ 172,083 Included in archival imagery as of December 31, 2023 and 2022 and 2021 was $10.0$10.2 million and $10.3$10.0 million respectively, of imagery that has an indefinite life and therefore is not amortized.9. GOODWILL9.GOODWILLofof October 1, 20222023 and 2021.2022. The Company did not recognizerecognize a goodwill impairment charge during the year ended December 31, 20222023 and 2021.2022. The fair value of the Goodwill was estimated using both market indicators of fair value and the expected present value of future cash flows. As of December 31, 20222023 and 2021,2022, the accumulated impairment loss on Goodwill was $525.0 million.F-23Goodwill changed during the years presented as follows (in thousands):F-23Goodwill
before
impairmentAccumulated
impairment
chargeGoodwill – net December 31, 2021 $ 2,028,245 $ (525,000) $ 1,503,245 Effects of fluctuations in foreign currency exchange rates (3,667) — (3,667) December 31, 2022 $ 2,024,578 $ (525,000) $ 1,499,578 Effects of fluctuations in foreign currency exchange rates 2,236 — 2,236 December 31, 2023 $ 2,026,814 $ (525,000) $ 1,501,814 10. IDENTIFIABLE INTANGIBLE ASSETS — NET10.IDENTIFIABLE INTANGIBLE ASSETS — NETAs of December 31, 2023 2022 Range of
Estimated
Useful Lives
(Years)Gross
AmountAccumulated
AmortizationNet
AmountGross
AmountAccumulated
AmortizationNet
AmountTrade name Indefinite $ 397,495 $ — $ 397,495 $ 389,484 $ — $ 389,484 Trademarks and trade names 5–10 104,109 (104,109) — 104,053 (104,026) 27 Patented and unpatented technology 3–10 111,045 (106,869) 4,176 109,275 (103,419) 5,856 Customer lists, contracts, and relationships 5–11 399,378 (397,244) 2,134 391,454 (367,273) 24,181 Non-compete Covenant 3 900 (900) — 900 (900) — Other identifiable intangible assets 3–13 5,089 (5,089) — 5,059 (5,059) — $ 1,018,016 $ (614,211) $ 403,805 $ 1,000,225 $ (580,677) $ 419,548 The Getty Images and Unsplash trade name wasnames were valued using an estimated royalty rate which considered name recognition, licensing practices of the Company and its competitors for similar services, and other relevant qualitative factors.Based on balances at December 31, 2022,2023, the estimated aggregate amortization expense for identifiable intangible assets for the next five years is as follows (in thousands):Fiscal Years Ended
December 31,2024 $ 2,106 2025 $ 2,106 2026 $ 818 2027 $ 284 2028 $ 284 F-2411.OTHER ASSETS AND LIABILITIES11. OTHER ASSETS AND LIABILITIESOther Long-Term Assets — Other long-term assets consisted of the following at the reported Balance Sheet dates (in thousands):F-24Year end December 31, 2023 2022 Long term note receivable from a related party $ 24,000 $ 24,000 Minority and other investments 12,454 12,097 Derivative asset — 9,032 Tax receivable — 2,700 Equity method investment 2,852 2,064 Long term deposits 1,526 1,609 Other 430 450 Total other long-term assets $ 41,262 $ 51,952 Other Long-Term Liabilities — Other long-term liabilities consisted of the following at the reported Balance Sheet dates (in thousands):12.DEBTYear end December 31, 2023 2022 Accrued compensation and related costs $ 16,933 $ 23,851 Lease liabilities 9,780 10,094 Interest payable 9,942 9,993 Accrued professional fees 6,045 4,334 Other 953 1,055 Total accrued expenses $ 43,653 $ 49,327 12. DEBTDebt included the following (in thousands):Year end December 31, 2023 2022 Senior Notes $ 300,000 $ 300,000 USD Term Loans 637,000 687,400 EUR Term Loans 463,588 446,996 Less: issuance costs and discounts amortized to interest expense (1,930) (5,549) Long-term debt – net $ 1,398,658 $ 1,428,847 In February of 2019, the Company issued $300.0 million of Senior Unsecured Notes (“Senior Notes”) and entered into a senior secured credit facility (“Credit Facility”) consisting of (i) a $1,040.0 million term loan facility (“USD Term Loans”), (ii) a €450.0 million term loan facility (“EUR Term Loans”) (together with the USD Term Loans the “Term Loans”) and (iii) an $80.0 million revolving credit facility that cancould be upsized to $110.0 million (“Revolver”).On May 4, 2023, the Company amended the existing Credit Facility to among other things, (i) upsize the total amount of commitments under the revolving credit facility capacity from $80.0 million to $150.0 million and (ii) extend the maturity of the revolving credit facility until May 4, 2028. The revolving facility is also subject to a springing maturity of 180 days inside any earlier maturity of Senior Notes or Term Loans with an aggregate principal amount exceeding $100.0 million. The revolving credit facility remains undrawn. The Company accounted for this amendment as a modification of the existing revolving credit facility. The unamortized debt issuance costs and the fees incurred to amend the revolving credit facility will be amortized over the term of the new revolving credit facility. The Company incurred unused commitment fees of $0.4 million during each of the years ended December 31, 2023, 2022 and 2021.F-25The Senior Notes are due March 1, 2027, and bear interest at a rate of 9.750% per annum. Interest on the notes is payable semi-annually on March 1 and September 1 of each year. The Company may redeem the Senior Notes earlier than March 1, 2027, subject to prepayment premiums.The Term Loans mature in 2026. The Company may voluntarily prepay loans or reduce commitments under the Credit Facility without premium or penalty.In August of 2022, the Company utilized proceeds from its Business Combination along with cash on hand to repay $300.0 million of outstanding indebtedness on its USD Term Loans. In accordance with ASC 470-50-40-2 - Debt - Modifications and Extinguishments, the Company recorded a loss on extinguishment of debt of $2.7 million for the year ended December 31, 2022, inF-25The face value of the EUR Term Loans was €419.0 million and €419.0 million as of December 31, 2023 and 2022, and 2021,respectively, converted using currency exchange rates as of those dates. There is no amortization on the EUR Term Loans.The Credit Facility requires a principal payment with the net cash proceeds of certain events and up to 50% of excess cash flow (subject to reduction based on the achievement of specified net first lien leverage ratios). No excess cash flow principal payment was required for the years ended December 31, 20222023 and 20212022 based on the net first lien leverage ratio.The obligations under the Credit Facility are secured by a first priority lien on substantially all of the Company’s assets.On 2nd February 2023, we amended our Credit Agreement to replace LIBOR with Adjusted Term SOFR on the USD Term Loans effective from the start of the next interest period thereafter. For the USD Term Loans, the interest rate for base rate loans is 3.50% plus the greater of the prime rate in effect, the NYFRB Rate plus 0.5% or the Adjusted EurodollarTerm SOFR rate for a one-month interest period plus 1%. The interest rate for EurodollarTerm Benchmark loans with respect to the USD Term Loans is the sum of the applicable rate of 4.50%, plus the Adjusted EurodollarTerm SOFR rate. The EurodollarAdjusted Term SOFR rate for borrowings denominated in USD is defined as the greater of the LIBOR ScreenTerm SOFR rate per annum for deposits of dollars for the applicable interest period plus 0.10% or 0.00%. The Term SOFR Rate for the applicable interest period, is the is the rate per annum published by the CME Term SOFR Administrator and identified by Administrative Agent as of 11:the forward-looking term rate based on SOFR at approximately 5:00 a.m. LondonChicago time, two business daysU.S. Government Securities Business Days prior to the first day in such interest period, or 0.0% The Adjusted Eurodollar rate is defined as the interest rate per annum (rounded upward, if necessary, to the next 1/16 of 1% ), equal to the Eurodollar Rate for the interest period multiplied by the Statutory Reserve Rate. On 2nd February 2023, we amended our Credit Agreement to replace LIBOR with Adjusted Term SOFR on the USD Term Loans effective from the start of the next interest period. For the EUR Term Loans, the interest rate for loans is the sum of the applicable rate of 5.0%, plus the Adjusted Eurodollar rate. The Eurodollar rate for borrowings denominated in EUR is defined as the greater of the EURIBOR Screen rate per annum for deposits of Euro for the applicable interest period as of approximately 11:00 a.m. Brussels time two business days prior to the first day in such interest period, or 0.0%. The Adjusted Eurodollar rate is defined as the interest rate per annum (rounded upward, if necessary, to the next 1/16 of 1%), equal to the Eurodollar Rate for the interest period multiplied by the Statutory Reserve Rate. The USD Term loans had an average interest rate of 6.00%9.55%, 4.63%6.00% and 4.69%4.63% for the years ended December 31, 2023, 2022 2021 and 2020,2021, respectively. The EUR Term loans had an average interest rate of 5.27%8.21%, 5.00%5.27% and 5.00% for the years ended December 31, 2023, 2022 and 2021, and 2020, respectively.The Company has not borrowed on the Revolver and incurred fees of $0.4 million during each of the years ended December 31, 2022, 2021 and 2020. The Revolver matures in 2024.Debt issuance costs and discounts related to the Senior Notes and Term Loans are reported in the Consolidated Balance Sheet as a direct deduction from the face amount of the debt. These costs are amortized as a component of “Interest expense” in the Consolidated Statements of Operations utilizing the effective interest method. As of December 31, 2022,2023, the Company was compliant with all debt covenants and obligations.13.COMMITMENTS AND CONTINGENCIES13. COMMITMENTS AND CONTINGENCIESCommitments — The Company has entered into agreements that represent significant, enforceable and legally binding contractual obligations that are noncancelable without incurring a significant penalty. If a contract is cancelable with a penalty, the amount shown in the table below is the full contractual obligation, not the penalty, as the Company currently intends to fulfill each of these obligations.F-26Liabilities for uncertain tax positions are excluded from this table due to the uncertainty of the timing of the resolution of the underlying tax positions. At December 31, 2022,2023, net uncertain tax positions were $34.6 million, which is reduced by a benefit of $2.7$24.8 million. The entire balance as of December 31, 20222023 is non- currentnon-current as the timing of resolution is uncertain and no portion of these liabilities is expected to be cash settled within the next 12 months.Payments under purchase orders, certain sponsorships, donations and other commitments that are not enforceable and legally binding contractual obligations are also excluded from this table, as are payments, guaranteed and contingent, under employment contracts because they do not constitute purchase commitments.F-2620222023 (in thousands):Years ended December 31, 2024 2025 2026 2027 2028 Thereafter Total USD Term Loans and EUR Term loans: Principal payments $ — $ — $ 1,100,588 $ — $ — $ — $ 1,100,588 Interest payments199,400 83,831 11,121 — — — 194,352 Senior Notes: Principal payments — — — 300,000 — — 300,000 Interest payments 29,250 29,250 29,250 14,625 — — 102,375 Revolver commitment fee 763 681 — — — — 1,444 Operating lease payments on facilities leases 13,486 12,953 7,946 7,010 6,074 16,497 63,966 Minimum royalty guarantee payments to content suppliers 41,577 40,531 23,331 11,198 11,067 8,875 136,579 Technology purchase commitments 8,399 6,165 1,063 — — — 15,627 Other commitments 2,766 514 222 — — — 3,502 Total commitments $ 195,641 $ 173,925 $ 1,173,521 $ 332,833 $ 17,141 $ 25,372 $ 1,918,433 2022.2023. Rates used for the EUR Term Loans are 8.1% for 2023, 8.4%8.3% for 2024, 7.8%6.9% for 2025 and 7.9%6.8% for 2026. Rates used for the USD Term Loans are 9.4% for 2023, 8.6%9.3% for 2024, 7.8%7.9% for 2025 and 7.7%7.6% for 2026.Offsetting operating lease payments will be approximately $5.0 million in receiptsreceipts for subleased facilities each year through 2024, $4.9 million in 2025, and $1.2 million in 2026. Offsetting the minimum royalty guarantee payments to content suppliers will be approximately $2.0 million in minimum guaranteed receipts from content suppliers for each of the years through 2025.Contingencies — The Company indemnifies certain customers from claims related to alleged infringements of the intellectual property rights of third parties or misappropriation of publicity or personality rights of third parties, such as claims arising from copyright infringement or failure to secure model and property releases for images the Company licenses if such a release is required. The standard terms of these indemnifications require the Company to defend those claims upon notice and pay related damages, if any. The Company typically mitigates this risk by requiring all uses of licenses to be within the scope of the license, securing all necessary model and property releases for imagery for which the Company holds the copyright, and by contractually requiring contributing photographers and other imagery partners to do the same prior to submitting any imagery to the Company and by limiting damages/liability in certain circumstances. Additionally, the Company requires all contributors and Image Partners,image partners, as well as potentialF-27acquisition targets to warrant that the content licensed to or purchased by the Company does not and shall not infringe upon or misappropriate the rights of third parties. The Company requires contributing photographers, other imagery partners and sellers of businesses or image collections that Getty Images has purchased to indemnify the Company in certain circumstances where a claim arises in relation to an image they have provided or sold to the Company. Imagery Partners are typically required to carry insurance policies for losses related to such claims and individual contributors are encouraged to carry such policies and the Company itself has insurance policies to cover litigation costs for such claims. The Company will record liabilities for these indemnifications if and when such claims are probable and the range of possible payments and available recourse from imagery partners can be assessed, as applicable. Historically, the exposure to such claims has been immaterial, as were the recorded liabilities for intellectual property infringement at December 31, 20222023 or 2021.In the ordinary course of business, the Company enters into certain types of agreements that contingently require the Company to indemnify counterparties against third-party claims. These may include:●agreements with vendors and suppliers, under which the Company may indemnify them against claims arising from Getty Images’ use of their products or services;●agreements with customers other than those licensing images, under which the Company may indemnify them against claims arising from their use of Getty Images’ products or services;•agreements with vendors and suppliers, under which the Company may indemnify them against claims arising from Getty Images’ use of their products or services;F-27•agreements with customers other than those licensing images, under which the Company may indemnify them against claims arising from their use of Getty Images’ products or services;●agreements with agents, delegates and distributors, under which the Company may indemnify them against claims arising from their distribution of Getty Images’ products or services;●real estate and equipment leases, under which the Company may indemnify lessors against third-party claims relating to use of their property;●agreements with directors and officers, under which the Company indemnifies them to the full extent allowed by Delaware law against claims relating to their service to Getty Images;●agreements with purchasers of businesses Getty Images has sold, under which Getty Images may indemnify the purchasers against claims arising from the Company’s operation of the businesses prior to sale; and
•real estate and equipment leases, under which the Company may indemnify lessors against third-party claims relating to use of their property;●agreements with initial purchasers and underwriters of the Company’s debt securities, under which Getty Images indemnifies them against claims relating to their participation in the Transactions.•agreements with directors and officers, under which the Company indemnifies them to the full extent allowed by Delaware law against claims relating to their service to Getty Images;•agreements with purchasers of businesses Getty Images has sold, under which Getty Images may indemnify the purchasers against claims arising from the Company’s operation of the businesses prior to sale; and•agreements with initial purchasers and underwriters of the Company’s debt securities, under which Getty Images indemnifies them against claims relating to their participation in the Transactions.The nature and terms of these indemnifications vary from contract to contract, and generally a maximum obligation is not stated. Because management does not believe a material liability is probable, no related liabilities were recorded at December 31, 20222023 or 2021.The Company has been named as a defendant in two lawsuits filed by former public warrant holders in the United States District Court for the Southern District of New York, Alta Partners, LLC v. Getty Images Holdings, Inc., Case No. 1:22-cv-08916 (filed October 19, 2022), and CRCM Institutional Master Fund (BVI) LTD, et al. (together the “Plaintiffs”) v. Getty Images Holdings, Inc., Case No. 1:23-cv-01074 (filed February 8, 2023). The Plaintiffs generally allege breaches of the Warrant Agreement, dated August 4, 2020, and alternative claims for violations of the federal securities laws, including claims under the Securities Act of 1933 and/or the Securities Exchange Act of 1934. The complaints seek, among other things, an award of money damages. On February 17, 2023, the Court consolidated the actions for purposes of discovery. The Company filed answers to the complaints, and discovery closed on August 28, 2023. On September 11, 2023, all parties filed cross-motions for summary judgment, which were fully briefed on October 2, 2023. On October 27, 2023, the Court issued its decision on the cross-motions for summary judgment and entered judgment in favor of Plaintiffs on their breach of contract claims in the amount of $36.9 million for Alta Partners, LLC and $51.0 million for the CRCM plaintiffs, plus, in each case, pre-judgment interest of 9.0% per annum. The Court entered judgment in favor of the Company on all other claims asserted by Plaintiffs. The Company intends to appeal that portion of the Court’s judgment in favor of plaintiffs.The Company’s Loss on Litigation is comprised of these summary judgment amounts, in addition to interest pre-judgment through December 31, 2023 and associated legal fees through December 31, 2023. The Company has recognized Recovery of Loss on Litigation of $60.0 million, which represents the limit of the Company’s insurance coverage for this matter. As of December 31, 2023, the Company had a remaining insurance recovery receivable of $48.6 million.The Company is subject to a variety of other legal claims and suits that arise from time to time in the ordinary course of business. AlthoughOther than the matter described above, management currently believes that resolving such claims, individually or in aggregate, will not have a material adverse impact on the consolidated financial statements,statements. However, these matters are subject to inherent uncertainties and management’s view of these matters may change inF-28the future. The Company holds insurance policies that mitigate potential losses arising from certain indemnifications, and historically, significant costs related to performance under these obligations have not been incurred.14.REVENUEThe Company has open tax audits in various jurisdictions and some of these jurisdictions require taxpayers to pay assessed taxes in advance or at the time of appealing such assessments. One such jurisdiction is Canada, where one of the Company’s subsidiaries, iStockphoto ULC, recently received tax assessments from the Canada Revenue Agency (“CRA”) asserting additional tax is due. The position taken by the CRA is related to the transactions between iStockphoto ULC and other affiliates within the Getty Images group for the 2015 Canadian income tax return filed. The Company believes the CRA position lacks merit and intends to appeal and vigorously contest these assessments.As part of the appeal process in Canada, the Company may be required to pay a portion of the assessment amount, which the Company estimates could be up to $19.3 million. Such required payment is not an admission that the Company believes it is subject to such taxes. The Company believes it is more likely than not it will prevail on appeal, however, if the CRA were to be successful in the appeal process, the Company estimates the maximum potential outcome could be up to $29.2 million.14. REVENUEThe Company distributes its content and services offerings through three primary products:Creative —Creative is comprised of royalty free (“RF”) photos, illustrations, vectors, videos, and videos, whichgenerative AI-services, that are released for commercial use and cover a wide variety of commercial, conceptual and contemporary subjects, including lifestyle, business, science, health, wellness, beauty, sports, transportation and travel. This content is available for immediate use by a wide range of customers with a depth, breadth and quality allowing our customers to produce impactful websites, digital media, social media, marketing campaigns, corporate collateral, textbooks, movies, television and online video content relevant to their target geographies and audiences. We primarily source Creative content from a broad network of professional, semi-professional and amateur creators, many of whom are exclusive to Getty Images. We have a global creative insights team dedicated to providing briefing and art direction to our exclusive contributor community.Editorial — Editorial is comprised of photos and videos covering the world of entertainment, sports and news. We combine contemporary coverage of events around the globe and havewith one of the largest privately held photographic archivearchives globally with access to images fromto the beginning of photography. We invest in a dedicated editorial team which includes over 115110 staff photographers and videographers to generate our own coverage in addition to coverage from our network of primarily exclusive contributors and content partners.Other — The Company offers a range of additional products and services to deepen the customer relationships, enhance customer loyalty and create additional differentiation in the market. These additional products and services currently include music licensing, digital asset management and distribution services, print sales and data licensing.The following table summarizes the Company’s revenue by product (in thousands):Year Ended December 31, 2023 2022 2021 Creative $ 578,727 $ 585,398 $ 596,917 Editorial 320,643 325,779 306,631 Other 17,185 15,067 15,140 Total Revenue $ 916,555 $ 926,244 $ 918,688 The December 31, 20222023 deferred revenue balance will be earned as content is downloaded, services are provided or upon the expiration of subscription-based products, and nearly all is expected to be earned within the next twelve months. From the deferred revenue balance as of January 1, 2022, $135.5 million of total revenue was recognized forDuring the year ended December 31, 2022.2023, the Company recognized revenue of $139.3 million that had been included in deferred revenue as of January 1, 2023.F-28F-2915.REDEEMABLE PREFERRED STOCKUnder its second amended and restated certificate of incorporation, Legacy Getty was authorized to issue up to 900,000 shares of series A preferred stock (the “Redeemable Preferred Stock”) with a par value of $0.01 per share. In conjunction with the Business Combination discussed in “Note 3 —Business— Business Combination”, the previously outstanding Legacy Getty Redeemable Preferred Stock was redeemed in full during the year ended December 31, 2022 through a combination of a cash payment of approximately $615.0 million and 15,000,000 shares of the Company’s Class A common stock with a fair value at issuance of $140.2 million.Dividends declared and issued totaled $43.2 million (38,109 shares), and $71.4 million (70,574 shares) and $64.1 million (63,384 shares) for the years ended December 31, 2022 2021 and 2020,2021, respectively. Redeemable Preferred Stock dividends were included in the Statements of Redeemable Preferred Stock and Stockholders’ Equity (Deficit) as a detriment to common stockholders and a benefit to Redeemable Preferred stockholders. Such dividends are also included as an adjustment to net income (loss) income attributable to Getty Images Holdings, Inc. See “Note 2322 — Net Income (Loss) Income Attributable to Common Stockholders”.Per the terms of the Redeemable Preferred Stock, the Company elected to early redeem outstanding shares of Redeemable Preferred Stock at a premium. The redemption amount upon the Closing date was equal to (i) the liquidation value multiplied by (ii) the redemption percentage, which was 105%. The Company recognized a $26.7 million increase in the redemption value immediately prior to the Closing. These changes were effectedaffected by charges against paid-in capital as the Company was in a retained deficit prior to the Business Combination.16. STOCKHOLDERS’ EQUITY (DEFICIT)16.STOCKHOLDERS’ EQUITY (DEFICIT)Each holder of Class A common stock is entitled to one vote for each share on all matters properly submitted to a vote, including the election of directors. Class A Stockholders do not have cumulative voting rights in the election of directors. Accordingly, holders of a majority of the voting shares are able to elect all of the directors. Holders of shares of Class A common stock are entitled to dividends, if any, as may be declared from time-to-time by the Board out of legally available funds. Holders of Class A common stock have no preemptive, conversion, subscription or other rights, and there are no redemption or sinking fund provisions applicable to Class A common stock.Except as otherwise required by law, no holder of Class B common stock is entitled to any voting rights with respect to Class B common stock. If entitled to vote by law, each holder of Class B common stock is entitled to one vote per share. Holders of shares of Class B common stock are entitled to receive dividends, if any, as may be declared from time-to-time by the Board out of legally available funds, contingent upon the occurrence of a conversion into Class A common stock, as discussed below. The holders of shares of Class B common stock shall not be entitled to receive any assets of the Company in the event of any voluntary or involuntary liquidation, dissolution or winding up of the affairs of the Company. Holders of Class B common stock have no preemptive, conversion, subscription or other rights, and there are no redemption or sinking fund provisions applicable to Class B common stock.In connection with the Business Combination, 2,570,000 shares of Class B common stock were designated as Series B-1 common stock and 2,570,000 shares of Class B common stock were designated Series B-2 common stock. The Series B-1 common stock and Series B-2 common stock would automatically vest and convert into shares of Class A common stock if (i) the volume weighted average price of the shares of the Company’s Class A common stock over any 20 trading days within any 30 consecutive trading day period was greater than or equal to $12.50 and $15.00, respectively, or (ii) if there was a change of control of the Company that would result in the holders of shares of the Company’s Class A common stock receiving a price per share equal to or in excess of $12.50 and $15.00, respectively.In August 2022, the Series B-1 common stock and Series B-2 common stock automatically converted into 5,140,000 shares of Class A common stock. See “Note 5 — Common Stock Warrants” for further details.F-30In August 2022, the Earn-Out Shares issued in connection with the Business Combination vested and 58,999,956 shares of Class A common stock were issued.F-29Equity-based compensation expense is recorded in “Selling, general and administrative expenses” in the Consolidated Statements of Operations,Operations, net of estimated forfeitures. The Company recognized equity-based compensation - net of estimated forfeitures of $40.6 million, $9.5 million, $6.4 million, and $8.0$6.4 million for the years ended December 31, 2023, 2022 2021 and 2020,2021, respectively. The Company capitalized $3.0 million and $0.3 million of stock-based compensation expense associated with the cost of developing internal-use software during the year ended December 31, 2022.Prior to the Business Combination, certain employees of the Company were granted equity awards under Legacy Getty’s Amended and Restated 2012 Equity Incentive Plan of the Parent (“Legacy Getty 2012 Plan”). Upon closing of the Business Combination, awards under the Legacy Getty 2012 Plan were converted at the Exchange Ratio, and the Company’s board of directors approved the Getty Images Holdings, Inc. 2022 Equity Incentive Plan (“2022 Plan”). The 2022 Plan provides for the grant of stock options, including incentive stock options and nonqualified stock options, stock appreciation rights, restricted stock, dividend equivalents, restricted stock units (“RSU”), performance stock units (“PSU”), and other stock or cash-based awards. Equity-based awards generally vest overthree or four years. Under the 2022 Plan, up to 51,104,577 shares of Class A common stock is availableare reserved for issuance, of which 16,744,429 7,750,436 are available to be issued as of December 31, 2022.Stock Options — The following tables presents a summary of the Company’s stock option activity for the year ended December 31, 20222023 (in thousands except weighted average data and years):Number
of
awardsWeighted
Average
Exercise
PriceRemaining
Average
Contractual
Life (in Years)Outstanding — December 31, 2021126,271 $ 3.98 5.87 Retroactive application of recapitalization 7,331 $ (0.87) 0 Outstanding — December 31, 2021, after effect of recapitalization 33,602 $ 3.11 5.87 Granted 978 6.18 Exercised (2,959) 4.36 Pre-vesting forfeitures (1,659) 3.32 Post-vesting cancellations (27) 2.77 Outstanding - December 31, 2022 29,935 3.08 5.85 Granted 2,936 $ 6.49 Exercised (5,017) 3.00 Pre-vesting forfeitures (32) 4.94 Post-vesting cancellations (31) 6.00 Outstanding - December 31, 2023 27,791 3.45 5.12 Exercisable - December 31, 2023 23,845 $ 3.02 4.50 Vested and expected to vest after December 31, 2023 27,775 $ 3.45 5.12 1 Excludes 3,635 non-stock option equity awards that were outstanding under the Legacy Getty 2012 Plan, which were converted to Class A common stock upon closing of the Business Combination.(1)Excludes 3,635 non-stock option equity awards that were outstanding under the Legacy Getty 2012 Plan, which were converted to Class A common stock upon closing of the Business Combination.F-31Intrinsic value of stock options is calculated as the excess of market price of the Company’s common stock over the strike price of the stock options, multiplied by the number of stock options. The intrinsic value of the Company’s stock options is as follows (in thousands):December 31, 2023 2022 Stock options outstanding $ 56,534 $ 75,888 Stock options exercisable $ 54,944 $ 68,431 Stock options vested and expected to vest $ 56,502 $ 75,704 The intrinsic value of stock options exercised for the years ended December 31, 2023 and December 31, 2022 was approximately $14.9 million and $14.8 million.million, respectively. The intrinsic value of stock options exercised in each of the yearsyear ended December 21,31, 2021 and 2020 was insignificant.F-30inputinput into that model, for awards granted were as follows:Year Ended December 31, 2023 2022 2021 Weighted average grant date fair value per award $ 2.20 $ 3.17 $ 1.19 Valuation model used Black-Scholes Black-Scholes Black-Scholes Expected award price volatility 50 % 50 % 35 % Risk-free rate of return 3.70 % 4.15 % 1.15 % Expected life of awards 5.89 years 5.7 years 6.1 years Expected rate of dividends None None None The stock volatility assumption for award-based compensation is based on historical volatilities of the common stock of several public companies with characteristics similar to those of the Company since the Company’s common stock has only been trading in the public market for a short period of time.The risk-free rate of return represents the implied yield available during the month the award was granted for a U.S. Treasury zero-coupon security issued with a term equal to the expected life of the awards.The expected life is measured from the grant date and is based on the simplified method calculation.As of December 31, 20222023 there was $4.5$6.6 million of total unrecognized compensation expense related to outstanding time-based awards,stock options, which the Company expects to recognize over a weighted average period of approximately 1.42.1 years. During the years ended December 31, 2023, 2022 2021 and 2020,2021, the fair value of time-based awardsstock options that vested was $3.8 million, $7.9 million, and $6.7 million, and $10.1 million, respectively.Restricted Stock Units — The following table presents a summary of RSU activity (in thousands except weighted average data):Number
of
awardsWeighted Average
Grant-Date Fair ValueOutstanding — December 31, 2022 4,367 5.58 Granted 3,567 $ 4.80 Vested (2,048) $ 5.55 Cancelled (242) $ 5.08 Outstanding - December 31, 2023 5,644 $ 5.12 F-32Table of ContentAs of December 31, 2022,2023, the total unrecognized compensation expense related to restricted stock unitsRSUs is approximately $22.8$24.6 million, which is expected to be recognized over a weighted average period of approximately 3.02.19 years.Performance Stock UnitsNumber
of
awardsWeighted Average
Grant-Date Fair ValueOutstanding — December 31, 2022 — $ — Granted 963 $ 4.76 Vested — $ — Cancelled — $ — Outstanding - December 31, 2023 963 $ 4.76 The number of units subject to future vesting is based on annual Company achieved factors, such as Revenue growth and Adjusted EBITDA less Capital Expenditures growth. Unvested units are expected to vest at the determination date of March 20, 2024, and expense recognized is adjusted quarterly for expected achievement. In addition to the granted shares in the table above, the Company issued an incremental 1.90 million PSUs that will have an accounting grant date in future periods upon achieved factors being set. PSU achievement is at the discretion of the Compensation Committee of the Board of Directors.Earn Out Plan — The Getty Images Holdings, Inc. Earn Out Plan (“Earn Out Plan”) provides for the grant of RSUs, which generally vest upon grant. Under the Earn Out Plan, up to 6.0 million shares of Class A common stock are reserved for issuance, of which 1,431,582 shares are available to be issued as of December 31, 2023.Number of Weighted Average awards Grant-Date Fair Value Outstanding — December 31, 2022 — $ — Granted 4,568 $ 4.72 Vested (4,568) $ 4.72 Cancelled — $ — Outstanding — December 31, 2023 — $ — As of December 31, 2023, there is no unrecognized compensation expense related to RSUs granted from the Earn Out Plan, as all RSUs were fully vested upon grant.Employee Stock Purchase Plan —The Getty Images Holdings, Inc. 2022 Employee Stock Purchase Plan (“ESPP”) provides for shares of Class A common stock to be purchased by eligible employees at six months intervals at 85% of the fair market value of the stock on either the first or last trading day of each six months period, whichever is lower. Eligible employees are allowed to contribute up to 10% of their compensation. The Company’s first six months period under the ESPP began on June 01, 2023. Under the ESPP, up to 5.0 million shares of Class A common stock are reserved for issuance, of which all 4.6 million are available to be issued as of December 31, 2023.18.DEFINED CONTRIBUTION EMPLOYEE BENEFIT PLANSThe Company sponsors defined contribution retirement plans in which the majority of employees are able to participate.The Company sponsors one defined contribution plan in the U.S., a 401(k) plan, in which all U.S. employees over 18 years of age are auto-enrolled unless they opt-out. The Company matches 100% of participant contributions, up to the first 4% of each participant’s eligible compensation (generally including salary, bonuses and commissions), not to exceed the Internal Revenue Service per person annual limitations. Additionally, the Company sponsors one defined contribution pension plan in the U.K. Employees who contribute a minimum of 3% of their eligible compensation (generallyF-33(generally including salary, bonuses, and commissions), generally receive a Company contribution of 5% of eligible compensation. Lastly, the Company also has a group registered retirement savings plan (RRSP) for employees in Canada. The Company matches dollar-for-dollar up to 3% of base salary. Employee contributions are deducted on a pre- tax basis and they may begin participating after 3 months of service.The Company’s contributions to these plans and other defined contribution plans worldwide totaled $7.8 million, $7.4 million $8.3 million and $5.4$8.3 million for the years ended December 31, 2023, 2022 2021 and 2020,2021, respectively. These contributions were recorded as “Selling, general and administrative expenses” in the Consolidated Statements of Operations.F-3119. LEASES19.LEASES20222023 through 2032,2033, some of which include one or more options to renew. All of the Company’s leases are classified as operating leases. Operating leases are included in “Right of use assets” in the Consolidated Balance Sheets. Current portion of the lease liabilities are included in “Accrued expenses” and non-current portion of lease liabilities are included in “Lease liabilities” in the Consolidated Balance Sheets. Operating lease costs, including insignificant costs related to short-term leases, were $10.0$8.9 million, $11.8$10.0 million and $11.8 million for the years ended December 31, 2023, 2022 and 2021, and 2020, respectively.Additional information related to the Company’s leases as of and for the years ended December 31, 2023 and 2022, isare as follows (in thousands, except for the lease term and discount rate):As of December 31, 2023 As of December 31, 2022 Right of use asset $ 41,098 $ 47,231 Lease liabilities, current 9,780 10,094 Lease liabilities, non-current 39,858 46,218 Total lease liabilities $ 49,638 $ 56,312 Weighted average remaining lease term 5.9 years 6.3 years Weighted average discount rate 5.7 % 5.6 % Cash paid for amounts included in lease liabilities $ 13,391 $ 14,150 Right of use asset obtained in exchange for lease obligation upon adoption $ — $ 53,076 Right of use asset obtained in exchange for lease obligations $ 2,591 $ 6,050 Maturities of lease liabilities as of December 31, 20222023 were as follows (in thousands):Year ended December 31, 2024 $ 12,377 2025 12,941 2026 7,416 2027 6,289 2028 5,382 Thereafter 14,644 Total undiscounted lease payments 59,049 Less: imputed interest (9,411) Total lease liabilities $ 49,638 reassessedhas continued to assess its office needs and subleased several office locations during the year ended December 31, 2023 and 2022. These agreements were considered to beF-34operating leases. The Company has not been legally released from the primary obligations under the original leases and therefore the Company continues to account for the original lease separately. The Company recorded an ROU asset impairment charge of $314 thousand and $2.6 million for the yearyears ended December 31, 2023 and 2022, of $2.6 million,respectively, which was the amount by which the carrying value of the lease ROU assets exceeded the fair values. Estimates of the fair values are based on the discounted cash flows of estimated net rental income for the office spaces subleased. The ROU asset impairment charge is included in “Other operating (income) expense - net” on the Consolidated Statement of Operations. Rent income from the sublessees is included in the Consolidated Statement of Operations on a straight-line basis as an offset to rent expense associated with the original operating lease included in “Selling, general and administrative expenses” on the Consolidated Statement of Operations.F-3220. INCOME TAXES20.INCOME TAXES (loss) before income taxes are as follows (in thousands):Year Ended December 31, 2023 2022 2021 United States $ (67,496) $ (95,489) $ 104,984 Foreign 40,591 61,972 31,142 (Loss) income before income taxes $ (26,905) $ (33,517) $ 136,126 The components of income tax expense (benefit) are as follows (in thousands):The Company also recorded a total net tax benefit of $5.1 million to shareholder’s equity for the year ended December 31, 2022.Year Ended December 31, 2023 2022 2021 Current: United States $ 26,720 $ 20,652 $ 22,321 Foreign 1,823 9,487 (7,756) Total current income tax expense (benefit) 28,543 30,139 14,565 Deferred: United States (15,169) 13,356 4,698 Foreign (59,856) 631 (534) Total deferred income tax expense (benefit) (75,025) 13,987 4,164 Total provision for income tax expense $ (46,482) $ 44,126 $ 18,729 The items accounting for the difference between income taxes computed at the U.S. federal statutory rate and the effective income tax rate are as follows (in thousands):Year Ended December 31, 2023 2022 2021 Federal income tax expense (benefit) at the statutory rate $ (5,651) $ (7,039) $ 28,586 Effect of: State taxes, net of federal benefit (1,736) (3,092) 3,632 Tax impact of foreign earnings and losses 11,524 11,453 (10,171) Stock-based compensation 3,633 2,230 236 Nondeductible net loss on fair value adjustment for warrant liabilities — 34,659 — Valuation allowance (49,425) 12,223 1,532 Tax credits (5,284) (6,852) (5,030) Other, net 457 544 (56) Income tax expense (benefit) $ (46,482) $ 44,126 $ 18,729 F-35Table of ContentUncertain Tax Positions —The Company follows the provisions of accounting for uncertainty in income taxes. This guidance clarifies the accounting for uncertainty in income taxes recognized in the consolidated financial statements and prescribes a recognition threshold of more likely than not and a measurement attribute on all tax positions taken or expected to be taken in a tax return for their recognition in the financial statements.F-33Year Ended December 31, 2023 2022 2021 Uncertain tax benefits, beginning of year $ 28,967 $ 33,425 $ 47,637 Gross increase to tax positions related to prior years 338 31 121 Gross decrease to tax positions related to prior years (36) (1,109) (413) Gross increase to tax positions related to the current year 2,036 675 2,204 Gross decrease to tax positions related to the current year — — — Settlements (4,636) — — Lapse of statute of limitations (6,514) (4,055) (16,124) Uncertain tax benefits, end of year $ 20,155 $ 28,967 $ 33,425 As of December 31, 2022,2023, the Company had $29.0$20.2 million of gross unrecognized tax benefits, of which $20.1$19.3 million, if fully recognized, would affect our effective tax rate. The timing of resolution for these liabilities is uncertain. The resolution of these items may result in additional or reduced income tax expense. Possible releases of liabilities due to expirations of statutes of limitations will have the effect of decreasing our income tax expense and the effective tax rate, if and when they occur. Although the timing of resolution and/or closure of tax audits cannot be predicted with certainty, the Company believes it is reasonably possible that approximately $11.8$6.9 million of its reserves for uncertain tax positions may be released in the next 12 months.The Company recognizes interest and penalties related to liabilities for uncertain tax positions in income tax expense in the consolidated statements of operations. Interest and penalties were ($3.5) million, ($0.9) million, and ($5.3) million, and $2.5 million for the years ended December 31, 2023, 2022, 2021, and 2020,2021, respectively. The Company has recognized total accrued interest and penalties of approximately $8.9 million, $12.4 million, $13.3 million, and $18.6$13.3 million as of December 31, 2023, 2022, 2021, and 2020,2021, respectively, relating to uncertain tax positions.The Company conducts business globally and, as a result, the Company and its subsidiaries file income tax returns in the U.S., including various states, and foreign jurisdictions. In the normal course of business, the Company is subject to examination by taxing authorities throughout the world. The tax years 2017 and forward are open for U.S. federal income tax matters. The tax years 2015 and forward are open for U.S. state income tax matters. With few exceptions, foreign tax filings are open for years 2012 and subsequent years. As of December 31, 2022,2023, the Company is currently undergoing audit examinations for tax years 2005 through 2017 by the German Federal Ministry of Finance, for tax years 2015 through 2017 by the New York State Department of Taxation, for tax years 2012 through 2016 by the Canada Revenue Agency, for tax years 2015 through 20182021 by the Ireland Tax Appeals Commission, and for tax yearyears 2020 and 2021 by the UK HM Revenue and Customs.Deferred Taxes and Valuation Allowances — The Company follows authoritative guidance for accounting for income taxes, which requires the Company to reduce deferred tax by a valuation allowance if, based on the weight of all available positive and negative evidence, it is more likely than not that some portion or all of the deferred tax assets will not be realized. Based on all available evidence, the Company released a valuation allowance of $65.5 million in Ireland for the year ended December 31, 2023. After consideration of all available evidence for the realizability of U.S. deferred tax assets, the Company provided a valuation allowance of $126.7$148.9 million and $106.4$126.7 million for the years ended December 31, 20222023 and December 31, 2021,2022, respectively. In future periods, the Company will evaluate the positive and negative evidence available at the time in order to support its analysis for a valuation allowance, and as a result the Company may release its valuation allowance in part, or in total, when it becomes more likely than not that the deferred tax assets will be realized.F-34F-36December 31, 2023 2022 Deferred tax assets Income tax attributes $ 242,234 $ 225,831 Accrued liabilities and reserves 18,874 7,109 Operating lease liabilities 9,077 10,969 Prepaid expenses — — Stock-based compensation expense 5,893 6,736 Other 855 1,656 Gross deferred tax assets 276,933 252,301 Less valuation allowance (168,185) (216,745) Total deferred tax assets 108,748 35,556 Deferred tax liabilities Amortization and depreciation (44,932) (43,556) Operating lease assets (7,598) (9,139) Prepaid expenses (3,667) (1,569) Other (4,731) (10,095) Net deferred tax liabilities, net of valuation allowance $ 47,820 $ (28,803) The deferred tax assets at December 31, 2022,2023, with respect to net operating loss carryforwards and expiration periods are as follows (in thousands):Deferred
Tax
AssetsNet Operating
Loss
CarryforwardsUnited States, expiring between 2024 and 2042 $ 9,421 $ 134,888 Foreign, expiring between 2025 and 2042 21,345 87,079 Foreign, indefinite 54,386 421,200 Total $ 85,152 $ 643,167 The following is information pertaining to U.S. federal tax credits at December 31, 2022,2023, as well as the expiration periods (in thousands):Tax
CreditsUnited States, federal tax credit carryforwards: Foreign tax credits, expiring between 2023 and 2033 $ 44,307 Total $ 44,307 The components of our net deferred taxes at the reported balance sheet dates are primarily comprised of amounts relating to net operating loss carryforwards, accrued assets and liabilities, and depreciable and amortizable assets.21.RESTRUCTURINGThe Company committed to certain restructuring actions intended to simplify the business and improve operational efficiencies, which have resulted in headcount reductions. The settlement of certain estimated and previously accrued employee termination costs resulted in a net credit to restructuring of $33.0 thousand and $475.0 thousand for the years ending December 31, 2022 and 2021 respectively. Restructuring costs were $9.1 million for the years ended December 31, 2020, composed of employee termination costs and lease loss. Substantially all of the expected charges related to these activities have been incurred during 2020 and 2019. The Company actively evaluates cost efficiencies and may make decisions in future periods to take further actions which could incur additional restructuring charges.F-3521. SEGMENT AND GEOGRAPHIC INFORMATIONAccrued losses on leased properties and employee termination costs changed during the periods presented as follows (in thousands):Employee termination costs were settled in 2022. Upon adoption of ASC 842, the accrued losses on leased properties is now included in “Accrued expenses” and “Lease liabilities, non-current” on the Consolidated Balance Sheet for December 31, 2022. These liabilities will be satisfied over the remaining lease terms, which extend through 2026. The accrued restructuring costs as of December 31, 2021 were included in “Accrued expenses” and “Other long-term liabilities” on the Consolidated Balance Sheets.22.SEGMENT AND GEOGRAPHIC INFORMATION2021 and 2020,2021, the Company identified one operating and reportable segment for purposes of allocating resources and evaluating financial performance. Asset information on a segment basis is not disclosed as this information is not separately identified or internally reported to the Company’s CODM.F-37Geographic Financial InformationThe following represents the Company’s geographic revenue based on customer location (in thousands):December 31, 2023 2022 2021 Americas $ 515,374 $ 525,775 $ 496,607 Europe, the Middle East, and Africa 298,589 293,673 317,435 Asia-Pacific 102,592 106,796 104,646 Total Revenues $ 916,555 $ 926,244 $ 918,688 approximatelyapproximately 51.2%, 51.7%, and 48.9% and 51.3% of total revenue for the years ended December 31, 2023, 2022 2021 and 2020,2021, respectively. Included in Europe, the Middle East, and Africa is the United Kingdom, which accounts for approximately 10.4%11.1%, 11.5%10.4% and 10.4%11.5% of total revenue for the years ended December 31, 2023, 2022 2021 and 2020,2021, respectively. No other country accounts for more than 10% of the Company’s revenue in any period presented.F-36December 31, 2023 2022 Americas $ 89,728 $ 87,819 Europe, the Middle East, and Africa 89,164 83,928 Asia-Pacific 487 336 Total long-lived tangible assets $ 179,379 $ 172,083 Included in Americas is the United States, which comprises 47.0%45.2% and 47.1%47.0% of total long-lived tangible assets as of December 31, 20222023 and 2021,2022, respectively. Included in Europe, the Middle East, and Africa is Ireland, which comprises 41.7%42.8% and 43.6%41.7% of total long-lived tangible assets as of December 31, 2023 and 2022, and 2021, respectively.F-3822. NET INCOME (LOSS) PER SHARE ATTRIBUTABLE TO COMMON STOCKHOLDERSThe following table sets forth the computation of basic and diluted (loss) income per share of Class A common stock (amounts in thousands, except share and per share amounts):Year end December 31, 2023 2022 2021 NET INCOME (LOSS) $ 19,577 $ (77,643) $ 117,397 Less: Net income (loss) attributable to noncontrolling interest 238 (89) 329 Premium on early redemption of Redeemable Preferred Stock — 26,678 — Redeemable Preferred Stock dividend — 43,218 71,393 NET INCOME (LOSS) ATTRIBUTABLE TO GETTY IMAGES HOLDINGS, INC. - Basic $ 19,339 $ (147,450) $ 45,675 Weighted-average Class A common stock outstanding: Basic 399,037,805 276,942,660 196,084,650 Effect of dilutive securities 12,457,220 — 5,422,705 Diluted 411,495,025 276,942,660 201,507,355 Net income (loss) per share of Class A common stock attributable to Getty Images Holdings, Inc. common stockholders: Basic $ 0.05 $ (0.53) $ 0.23 Diluted $ 0.05 $ (0.53) $ 0.23 The following are excluded from the computation of diluted net income per share of Class A common stock as their effect would have been anti-dilutive:F-37December 31, 2023 2022 2021 Common stock options 4,424,674 29,934,987 13,826,565 Restricted stock units 2,335,684 4,367,413 — 6,760,358 34,302,400 13,826,565 F-39