UNITED STATES
SECURITIES AND EXCHANGE COMMISSION
Washington, D.C. 20549
FORM 10-K
(Mark One)
| | | | | |
| ☒ | ANNUAL REPORT PURSUANT TO SECTION 13 OR 15(d) OF THE SECURITIES EXCHANGE ACT OF 1934 |
For the fiscal year ended December 31, 20202023
OR
| | | | | |
| ☐ | TRANSITION REPORT PURSUANT TO SECTION 13 OR 15(d) OF THE SECURITIES EXCHANGE ACT OF 1934 |
For the transition period from to
Commission file number: 001-34028
AMERICAN WATER WORKS COMPANY, INC.
(Exact name of registrant as specified in its charter)
| | | | | |
| Delaware | 51-0063696 |
| (State or other jurisdiction of incorporation or organization) | (I.R.S. Employer Identification No.) |
1 Water Street, Camden, NJ 08102-1658
(Address of principal executive offices) (Zip Code)
(856) 955-4001
(Registrant’s telephone number, including area code)
Securities registered pursuant to Section 12(b) of the Act:
| | | | | | | | | | | | | | |
| Title of each class | | Trading Symbol | | Name of each exchange on which registered |
| Common stock, par value $0.01 per share | | AWK | | New York Stock Exchange |
Securities registered pursuant to Section 12(g) of the Act: None.
Indicate by check mark if the registrant is a well-known seasoned issuer, as defined in Rule 405 of the Securities Act. Yes ☒ No ☐
Indicate by check mark if the registrant is not required to file reports pursuant to Section 13 or Section 15(d) of the Act. Yes ☐ No ☒
Indicate by check mark whether the registrant (1) has filed all reports required to be filed by Section 13 or 15(d) of the Securities Exchange Act of 1934 during the preceding 12 months (or for such shorter period that the registrant was required to file such reports), and (2) has been subject to such filing requirements for the past 90 days. Yes ☒ No ☐
Indicate by check mark whether the registrant has submitted electronically every Interactive Data File required to be submitted pursuant to Rule 405 of Regulation S-T (§ 232.405 of this chapter) during the preceding 12 months (or for such shorter period that the registrant was required to submit such files). Yes ☒ No ☐
Indicate by check mark whether the registrant is a large accelerated filer, an accelerated filer, a non-accelerated filer, a smaller reporting company, or an emerging growth company. See the definitions of “large accelerated filer,” “accelerated filer,” “smaller reporting company,” and “emerging growth company” in Rule 12b-2 of the Exchange Act.
| | | | | | | | | | | | | | | | | | | | |
| Large accelerated filer | | ☒ | | Accelerated filer | | ☐ |
| Non-accelerated filer | | ☐ | | Smaller reporting company | | ☐ |
| | | | Emerging growth company | | ☐ |
If an emerging growth company, indicate by check mark if the registrant has elected not to use the extended transition period for complying with any new or revised financial accounting standards provided pursuant to Section 13(a) of the Exchange Act. ☐
Indicate by check mark whether the registrant has filed a report on and attestation to its management’s assessment of the effectiveness of its internal control over financial reporting under Section 404(b) of the Sarbanes-Oxley Act (15 U.S.C. 7262(b)) by the registered public accounting firm that prepared or issued its audit report. ☒
If securities are registered pursuant to Section 12(b) of the Act, indicate by check mark whether the financial statements of the registrant included in the filing reflect the correction of an error to previously issued financial statements. ☐
Indicate by check mark whether any of those error corrections are restatements that required a recovery analysis of incentive-based compensation received by any of the registrant’s executive officers during the relevant recovery period pursuant to §240.10D-1(b). ☐
Indicate by check mark whether the registrant is a shell company (as defined in Rule 12b-2 of the Act). Yes ☐ No ☒
State the aggregate market value of the voting and non-voting common equity held by non-affiliates computed by reference to the price at which the common equity was last sold, or the average bid and asked price of such common equity, as of the last business day of the registrant’s most recently completed second fiscal quarter.
Common Stock, $0.01 par value—$20,390,800,00024,527,200,000 as of June 30, 20202023 (solely for purposes of calculating this aggregate market value, American Water has defined its affiliates to include (i) those persons who were, as of June 30, 2020,2023, its executive officers, directors or known beneficial owners of more than 10% of its common stock, and (ii) such other persons who were deemed, as of June 30, 2020,2023, to be controlled by, or under common control with, American Water or any of thesuch persons described in clause (i) above).
Indicate the number of shares outstanding of eacheach of the registrant’s classes of common stock as of the latest practicable date: Common Stock, $0.01 par value per share—181,439,255194,755,320 shares as of February 19, 2021.6, 2024.
DOCUMENTS INCORPORATED BY REFERENCE
Portions of the American Water Works Company, Inc. definitive proxy statement for the 2021 Annual2024 Annual Meeting of Shareholders to be filed with the Securities and Exchange Commission within 120 days after December 31, 20202023 are incorporated by reference into Part III of this report.
TABLE OF CONTENTS
| | | | | | | | |
| | | Page |
| |
| | | |
| Item 1. | | |
| Item 1A. | | |
| Item 1B. | | |
| Item 1C. | | |
| Item 2. | | |
| Item 3. | | |
| Item 4. | | |
| | | |
| Item 5. | | |
| Item 6. | | |
| Item 7. | | |
| Item 7A. | | |
| Item 8. | | |
| Item 9. | | |
| Item 9A. | | |
| Item 9B. | | |
| Item 9C. | | |
| | | |
| Item 10. | | |
| Item 11. | | |
| Item 12. | | |
| Item 13. | | |
| Item 14. | | |
| | | |
| Item 15. | | |
| Item 16. | | |
| |
| |
FORWARD-LOOKING STATEMENTS
Statements included in Item 1—Business, Item 1A—Risk Factors, and Item 7—Management’s Discussion and Analysis of Financial Condition and Results of Operations, and in other sections of this Annual Report on Form 10-K, or incorporated by reference into this Form 10-K,therein, are forward-looking statements within the meaning of Section 27A of the Securities Act of 1933, as amended, Section 21E of the Securities Exchange Act of 1934, as amended (the “Exchange Act”), and the Private Securities Litigation Reform Act of 1995. In some cases, these forward-looking statements can be identified by words with prospective meanings such as “intend,” “plan,” “estimate,” “believe,” “anticipate,” “expect,” “predict,” “project,” “propose,” “assume,” “forecast,” “likely,” “uncertain,” “outlook,” “future,” “pending,” “goal,” “objective,” “potential,” “continue,” “seek to,” “may,” “can,” “should,” “will” and “could” or the negative of such terms or other variations or similar expressions. Forward-looking statements may relate to, among other things: the Company’s future financial performance, liquidity and cash flows; the timing and amount of rate and revenue adjustments, including through general rate case filings, filings for infrastructure surcharges and other governmental agency authorizations and proceedings, and filings to address regulatory lag; the Company’s ability to execute its current and long-term business, operational, capital expenditures and growth plans and portfolio optimization strategies, includingstrategies; the timing and outcome of pending or future acquisition activity, the completion of the announced sale of the Company’s New York subsidiary and the amount of proceeds anticipatedability to be received therefrom;achieve organic customer growth; the ability of the Company’s California subsidiary to obtain adequate alternative water supplies in lieu of diversions from the Carmel River; the amount, allocation and allocationtiming of projected capital expenditures and related funding requirements; the Company’s ability to repay or refinance debt; the ability to execute its currentfuture impacts of increased or increasing financing costs, inflation and long-term business, operational and capital expenditures strategies; itsinterest rates; the Company’s ability to finance current and projected operations, capital expendituresexpenditure needs and growth initiatives by accessing the debt and equity capital markets;markets and sources of short-term liquidity; the outcome and impact on the Company of governmental and regulatory investigations and proceedings and related potential fines, penalties and other sanctions; the ability to meet or exceed the Company’s stated environmental and sustainability goals, including its greenhouse gas (“GHG”) emission reduction, water delivery efficiency and water system resiliency goals; the ability to complete, and the timing and efficacy of, the design, development, implementation and improvement of technology and other strategic initiatives; the impactsCompany’s ability to the Company of the current pandemic health event resulting from the novel coronavirus (“COVID-19”);comply with new and changing environmental regulations; the ability to capitalize on existing or future utility privatization opportunities; trends in the water and wastewater industries in which the Company operates, including macro trends with respect to the Company’s efforts related to customer, technology and work execution; regulatory, legislative, tax policy or legal developments; and impacts that future significant tax legislation may have on the Company and on its business, results of operations, cash flows and liquidity.
Forward-looking statements are predictions based on the Company’s current expectations and assumptions regarding future events. They are not guarantees or assurances of any outcomes, financial results, levels of activity, performance or achievements, and readers are cautioned not to place undue reliance upon them. These forward-looking statements are subject to a number of estimates, assumptions, known and unknown risks, uncertainties and other factors. The Company’s actual results may vary materially from those discussed in the forward-looking statements included herein as a result of the factors discussed under Item 1A—Risk Factors, and the following important factors:
•the decisions of governmental and regulatory bodies, including decisions to raise or lower customer rates and regulatory responses to the COVID-19 pandemic;rates;
•the timeliness and outcome of regulatory commissions’ and other authorities’ actions concerning rates, capital structure, authorized return on equity, capital investment, system acquisitions and dispositions, taxes, permitting, water supply and management, and other decisions;
•changes in customer demand for, and patterns of use of, water and energy, such as may result from conservation efforts, impacts of the COVID-19 pandemic, or otherwise;
•limitations on the availability of the Company’s water supplies or sources of water, or restrictions on its use thereof, resulting from allocation rights, governmental or regulatory requirements and restrictions, drought, overuse or other factors;
•a loss of one or more large industrial or commercial customers due to adverse economic conditions, the COVID-19 pandemic, or other factors;
•present and future proposed changes in laws, governmental regulations and policies, including with respect to environmental,the environment (such as, for example, potential improvements to existing Federal regulations with respect to lead and copper service lines and galvanized steel pipe), health and safety, data and consumer privacy, security and data privacy,protection, water quality and water quality accountability, contaminants of emerging concern (including without limitation per- and polyfluoroalkyl substances (“PFAS”)), public utility and tax regulations and policies, and impacts resulting from U.S., state and local elections and changes in federal, state and local executive administrations;
•the Company’s ability to collect, distribute, use, secure and store consumer data in compliance with current or future governmental laws, regulations and policies with respect to data and consumer privacy, security and protection;
•weather conditions and events, climate variability patterns, and natural disasters, including drought or abnormally high rainfall, prolonged and abnormal ice or freezing conditions, strong winds, coastal and intercoastal flooding, pandemics (including COVID-19) and epidemics, earthquakes, landslides, hurricanes, tornadoes, wildfires, electrical storms, sinkholes and solar flares;
•the outcome of litigation and similar governmental and regulatory proceedings, investigations or actions;
•the risks associated with the Company’s aging infrastructure, and its ability to appropriately improve the resiliency of or maintain, andupdate, redesign and/or replace, current or future infrastructure and systems, including its technology and other assets, and manage
the expansion of its businesses;
•exposure or infiltration of the Company’s technology and critical infrastructure systems, including the disclosure of sensitive, personal or confidential information contained therein, through physical or cyber attacks or other means;means, and impacts from required or voluntary public and other disclosures related thereto;
•the Company’s ability to obtain permits and other approvals for projects and construction, update, redesign and/or replacement of various water and wastewater facilities;
•changes in the Company’s capital requirements;
•the Company’s ability to control operating expenses and to achieve operating efficiencies;efficiencies, and the Company’s ability to create, maintain and promote initiatives and programs that support the affordability of the Company’s regulated utility services;
•the intentional or unintentional actions of a third party, including contamination of the Company’s water supplies or the water provided to its customers;
•the Company’s ability to obtain and have delivered adequate and cost-effective supplies of pipe, equipment (including personal protective equipment), chemicals, electricity,power and other fuel, water and other raw materials;materials, and to address or mitigate supply chain constraints that may result in delays or shortages in, as well as increased costs of, supplies, products and materials that are critical to or used in the Company’s business operations;
•the Company’s ability to successfully meet its operational growth projections, for the Regulated Businesses and the Market-Based Businesses (each as defined in this Form 10-K), either individually or in the aggregate, and capitalize on growth opportunities, including, among other things, with respect to:
•acquiring, closing and successfully integrating regulated operations and market-based businesses;operations;
•the Company’s Military Services Group (“MSG”) entering into new military installation contracts, price redeterminations, and other agreements and contracts, with or otherwise obtaining, new customers or partnerships in the Market-Based Businesses;U.S. government; and
•realizing anticipated benefits and synergies from new acquisitions;
•risks and uncertainties following the completion of the sale of the Company’s Homeowner Services Group (“HOS”), including:
•the Company’s ability to receive amounts due, payable and owing to the Company under the amended secured seller note when due; and
•the ability of the Company to redeploy successfully and timely the net proceeds of this transaction into the Company’s Regulated Businesses;
•risks and uncertainties associated with contracting with the U.S. government, including ongoing compliance with applicable government procurement and security regulations;
•cost overruns relating to improvements in or the expansion of the Company’s operations;
•the Company’s ability to successfully develop and implement new technologies and to protect related intellectual property;
•the Company’s ability to maintain safe work sites;
•the Company’s exposure to liabilities related to environmental laws and regulations, including those enacted or adopted and under consideration, and the substances related thereto, including without limitation lead and galvanized steel, PFAS and other contaminants of emerging concern, and similar matters resulting from, among other things, water and wastewater service provided to customers;
•the ability of energy providers, state governments and other third parties to achieve or fulfill their GHG emission reduction goals, including without limitation through stated renewable portfolio standards and carbon transition plans;
•changes in general economic, political, business and financial market conditions, including without limitation conditions and collateral consequences associated with the current pandemic health event resulting from COVID-19;conditions;
•access to sufficient debt and/or equity capital on satisfactory terms and when and as needed to support operations and capital expenditures;
•fluctuations in inflation or interest rates;rates, and the Company’s ability to address or mitigate the impacts thereof;
•the ability to comply with affirmative or negative covenants in the current or future indebtedness of the Company or any of its subsidiaries, or the issuance of new or modified credit ratings or outlooks by credit rating agencies with respect to the Company or any of its subsidiaries (or any current or future indebtedness thereof), which could increase financing costs or funding requirements and affect the Company’s or its subsidiaries’ ability to issue, repay or redeem debt, pay dividends or make distributions;
•fluctuations in the value of, or assumptions and estimates related to, its benefit plan assets and liabilities, including with respect to its pension and other post-retirement benefit plans, that could increase the Company’s costexpenses and plan funding requirements;
•changes in federal or state general, income and other tax laws, including (i) future significant tax legislation (ii) further rules,or regulations interpretations and guidance by the U.S. Department of the Treasury and state or local taxing authorities (collectively, the “Related Interpretations”)(including without limitation impacts related to the enactment of the Tax CutsCorporate Alternative Minimum Tax), and Jobs Act of 2017 (the “TCJA”), (iii)(ii) the availability of, or the Company’s compliance with, the terms of applicable tax credits and tax abatement programs, and (iv) the Company’s ability to utilize its U.S. federal and state income tax net operating loss (“NOL”) carryforwards;programs;
•migration of customers into or out of the Company’s service territories;territories and changes in water and energy consumption resulting therefrom;
•the use by municipalities of the power of eminent domain or other authority to condemn the systems of one or more of the Company’s utility subsidiaries, including without limitation litigation and other proceedings with respect to the water system assets of the Company’s California subsidiary (“Cal Am”) located in Monterey, California (the “Monterey system assets”), or the assertion by private landowners of similar rights against such utility subsidiaries;
•any difficulty or inability to obtain insurance for the Company, its inability to obtain insurance at acceptable rates and on acceptable terms and conditions, or its inability to obtain reimbursement under existing or future insurance programs and coverages for any losses sustained;
•the incurrence of impairment charges, changes in fair value and other adjustments related to the Company’s goodwill or the value of its other assets;
•labor actions, including work stoppages and strikes;
•the Company’s ability to retain and attract highly qualified employees;and skilled employees and/or diverse talent;
•civil disturbances or unrest, or terrorist threats or acts, or public apprehension about future disturbances, unrest, or terrorist threats or acts; and
•the impact of new, and changes to existing, accounting standards.
These forward-looking statements are qualified by, and should be read together with, the risks and uncertainties set forth above and the risk factors included in Item 1A—Risk Factors and other statements contained in this Annual Report on Form 10-K, and readers should refer to such risks, uncertainties and risk factors in evaluating such forward-looking statements. Any forward-looking statements the Company makes shall speak only as of the date this Annual Report on Form 10-K was filed with the U.S. Securities and Exchange Commission (“SEC”). Except as required by the federal securities laws, the Company does not have any obligation, and it specifically disclaims any undertaking or intention, to publicly update or revise any forward-looking statements, whether as a result of new information, future events, changed circumstances or otherwise. New factors emerge from time to time, and it is not possible for the Company to predict all such factors. Furthermore, it may not be possible to assess the impact of any such factor on the Company’s businesses, either viewed independently or together, or the extent to which any factor, or combination of factors, may cause results to differ materially from those contained in any forward-looking statement. The foregoing factors should not be construed as exhaustive.
PART I
ITEM 1. BUSINESS
The Company
With a history dating back to 1886, American Water is the largest and most geographically diverse, publicly-traded water and wastewater utility company in the United States, as measured by both operating revenues and population served. A holding company originally incorporated in Delaware in 1936, the Company employs approximately 7,0006,500 professionals who provide drinking water, wastewater and other related services to over 1514 million people in 4624 states. The Company conducts the majority of its business through regulated utilities that provide water and wastewater services, collectively presented as one reportable segment, referred to as the “Regulated Businesses.” The Company also operates market-basedother businesses that provide complementary services.water and wastewater services to the U.S. government on military installations, as well as municipalities. Individually, these other businesses do not meet the criteria of a reportable segment in accordance with generally accepted accounting principles in the United States (“GAAP”), and are collectively presented as the “Market-Based Businesses,throughout this Annual Report on Form 10-K within “Other,” which is consistent with how management assesses the results of these businesses.
Throughout this Annual Report on Form 10-K, unless the context otherwise requires, references to “we,” “us,” “our,” the “Company,” and “American Water” mean American Water Works Company, Inc. and its subsidiaries, taken together as a whole. References to “parent company” mean American Water Works Company, Inc., without its subsidiaries.
Regulated Businesses
The Company’s primary business involves the ownership of utilities that provide water and wastewater services to residential, commercial, industrial, public authority, fire service and sale for resale customers. The Company’s utilities operate in overapproximately 1,700 communities in 1614 states in the United States, with 3.5 million active customers in its water and wastewater networks. Services provided by the Company’s utilities are subject to regulation by multiple state utility commissions or other entities engaged in utility regulation, collectively referred to as public utility commissions (“PUCs”). Federal, state and local governments also regulate environmental, health and safety, and water quality and water accountability matters. The Company reports the results of the services provided by its utilities in the Regulated Businesses segment. Operating revenues for the Regulated Businesses were $3,255$3,920 million for 2020, $3,0942023, $3,505 million for 20192022 and $2,984$3,384 million for 2018,2021, accounting for 86%93%, 86%92% and 87%86%, respectively, of the Company’s total operating revenues for the same periods.
Presented in the table below is a geographic summary of the Regulated Businesses’ operating revenues and the number of customers the Company serves, by type of service, for and as of the year ended December 31, 2020:2023:
| | Operating Revenues (in millions) | | | Operating Revenues (in millions) | | Number of Customers (in thousands) |
| | Operating Revenues (in millions) | | Number of Customers (in thousands) | | Water (a) | | Wastewater | | Total | | % of Total | | Water | | Wastewater | | Total | | % of Total |
| | Water (a) | | Wastewater | | Total | | % of Total | | Water | | Wastewater | | Total | | % of Total |
| Pennsylvania | | Pennsylvania | $ | 810 | | | $ | 155 | | | $ | 965 | | | 24.6 | % | | 683 | | | 98 | | | 781 | | | 22.4 | % |
| New Jersey | New Jersey | $ | 753 | | | $ | 43 | | | $ | 796 | | | 24.5 | % | | 657 | | | 55 | | | 712 | | | 20.4 | % | New Jersey | 908 | | | 57 | | 57 | | | 965 | | 965 | | | 24.6 | | 24.6 | % | | 668 | | | 64 | | 64 | | | 732 | | 732 | | | 21.0 | | 21.0 | % |
| Pennsylvania | 663 | | | 70 | | | 733 | | | 22.5 | % | | 673 | | | 77 | | | 750 | | | 21.6 | % |
| Missouri | Missouri | 335 | | | 11 | | | 346 | | | 10.6 | % | | 472 | | | 15 | | | 487 | | | 13.9 | % | Missouri | 430 | | | 20 | | 20 | | | 450 | | 450 | | | 11.5 | | 11.5 | % | | 483 | | | 24 | | 24 | | | 507 | | 507 | | | 14.5 | | 14.5 | % |
| Illinois | Illinois | 293 | | | 32 | | | 325 | | | 10.0 | % | | 292 | | | 68 | | | 360 | | | 10.3 | % | Illinois | 366 | | | 61 | | 61 | | | 427 | | 427 | | | 10.9 | | 10.9 | % | | 299 | | | 72 | | 72 | | | 371 | | 371 | | | 10.6 | | 10.6 | % |
| California | California | 247 | | | 3 | | | 250 | | | 7.7 | % | | 183 | | | 3 | | | 186 | | | 5.3 | % | California | 300 | | | 4 | | 4 | | | 304 | | 304 | | | 7.8 | | 7.8 | % | | 190 | | | 3 | | 3 | | | 193 | | 193 | | | 5.5 | | 5.5 | % |
| Indiana | 234 | | | 2 | | | 236 | | | 7.3 | % | | 318 | | | 2 | | | 320 | | | 9.2 | % |
| West Virginia | 164 | | | 1 | | | 165 | | | 5.1 | % | | 168 | | | 1 | | | 169 | | | 4.8 | % |
Total—Top Seven States (b) | 2,689 | | | 162 | | | 2,851 | | | 87.7 | % | | 2,763 | | | 221 | | | 2,984 | | | 85.5 | % |
Total—Top Five States (b) | | Total—Top Five States (b) | 2,814 | | | 297 | | | 3,111 | | | 79.4 | % | | 2,323 | | | 261 | | | 2,584 | | | 74.1 | % |
Other (c) | Other (c) | 381 | | | 23 | | | 404 | | | 12.3 | % | | 481 | | | 31 | | | 512 | | | 14.5 | % | Other (c) | 779 | | | 30 | | 30 | | | 809 | | 809 | | | 20.6 | | 20.6 | % | | 865 | | | 37 | | 37 | | | 902 | | 902 | | | 25.9 | | 25.9 | % |
| Total Regulated Businesses | Total Regulated Businesses | $ | 3,070 | | | $ | 185 | | | $ | 3,255 | | | 100.0 | % | | 3,244 | | | 252 | | | 3,496 | | | 100.0 | % | Total Regulated Businesses | $ | 3,593 | | | $ | | $ | 327 | | | $ | | $ | 3,920 | | | 100.0 | | 100.0 | % | | 3,188 | | | 298 | | 298 | | | 3,486 | | 3,486 | | | 100.0 | | 100.0 | % |
(a)Includes other operating revenues consisting primarily of miscellaneous utility charges, fees and rents.
(b)The Company’s “Top SevenFive States” are determined based upon operating revenues.
(c)Includes the Company’s utility operations in the following states: Georgia, Hawaii, Indiana, Iowa, Kentucky, Maryland, Michigan, New York, Tennessee, Virginia and West Virginia and other revenue attributable collectively to the Regulated Businesses.
Customers
The Company’s Regulated Businesses have a large and geographically diverse customer base. A customer is defined as a person, business, municipality or any other entity that purchases the Company’s water or wastewater services as of the last business day of a reporting period. One single customer may purchase the Company’s services for use by multiple individuals or businesses. Examples of these customers are homes, apartment complexes, businesses and governmental entities.
The vast majority of the Company’s regulated water customers are metered, which allows the Company to measure and bill for its customers’ water usage, typically on a monthly basis. The Company employs a variety of methods of customer meter reading to monitor consumption. These methods range from meters with mechanical registers where consumption is manually recorded by meter readers, to meters with electronic registers capable of transmitting consumption data to proximity devices or via radio frequency to mobile or fixed network data collectors. The Company’s wastewater customers are billed either a flat rate or based upon their water consumption.
Residential customers make up a substantial portion of the Company’s customer base in all of the states in which it operates. The Company also serves (i) commercial customers, such as food and beverage providers, commercial property developers and proprietors, and energy suppliers, (ii) fire service customers, where the Company supplies water through its distribution systems to public fire hydrants for firefighting purposes and to private fire customers for use in fire suppression systems in office buildings and other facilities, (iii) industrial customers, such as large-scale manufacturers, mining and production operations, (iv) public authorities, such as government buildings and other public sector facilities, including schools and universities, and (v) other utilities and community water and wastewater systems in the form of bulk contracts for the supply of water or the treatment of wastewater for their own customers.
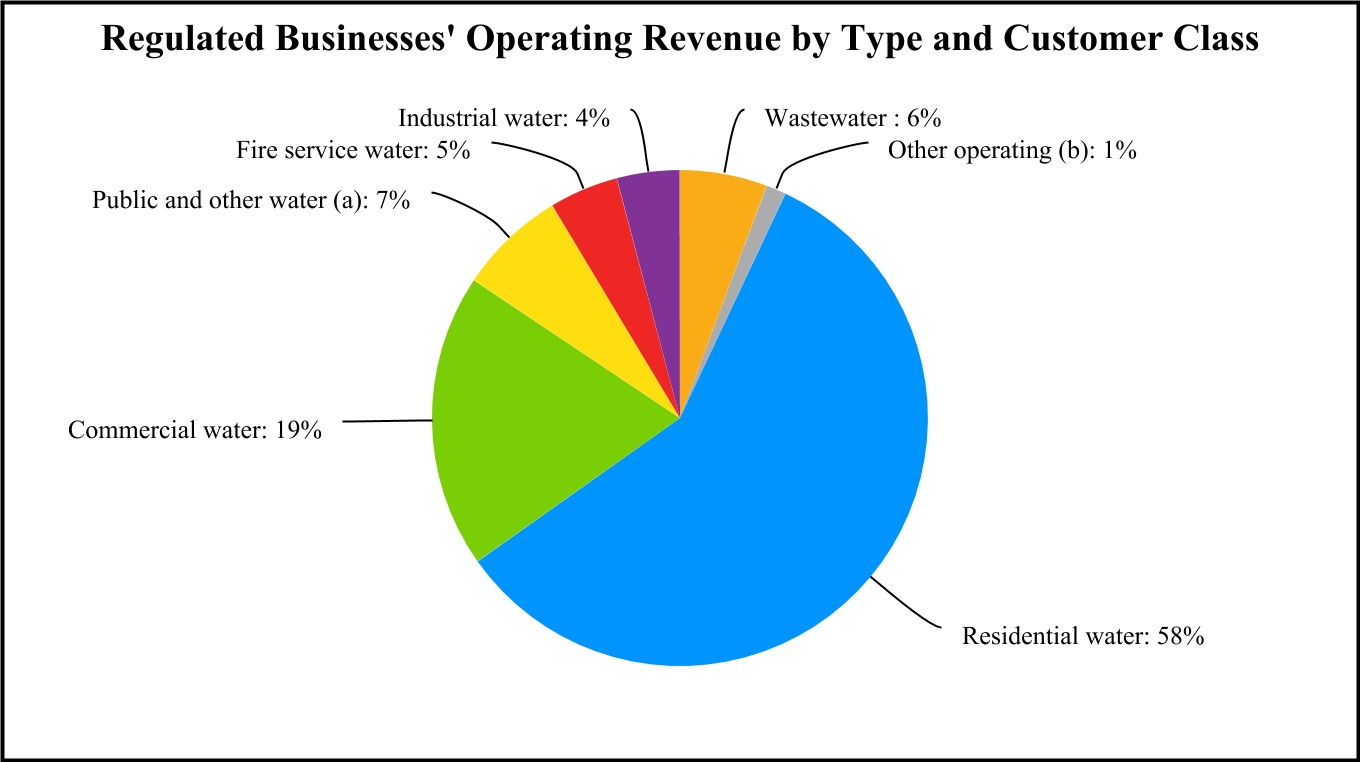
The following chart depictsPresented in the allocationtable below is a breakout of the Company’s Regulated Businesses’ operating revenue of $3,255 million by type, including a breakout of the total water services revenues by class of customer, for the yearyears ended December 31, 2020:2023, 2022 and 2021:
| | | | | | | | | | | | | | | | | | | | | | | | | | | | | | | | | | | |
| | 2023 | | 2022 | | 2021 |
| (In millions) | Revenue | | Percentage of Revenue | | Revenue | | Percentage of Revenue | | Revenue | | Percentage of Revenue |
| Water services: | | | | | | | | | | | |
| Residential | $ | 2,143 | | | 55 | % | | $ | 1,941 | | | 55 | % | | $ | 1,935 | | | 57 | % |
| Commercial | 798 | | | 20 | % | | 710 | | | 20 | % | | 676 | | | 20 | % |
| Fire service | 158 | | | 4 | % | | 147 | | | 4 | % | | 151 | | | 5 | % |
| Industrial | 167 | | | 4 | % | | 153 | | | 4 | % | | 141 | | | 4 | % |
| Public and other water (a) | 284 | | | 7 | % | | 267 | | | 8 | % | | 239 | | | 7 | % |
| Wastewater | 327 | | | 8 | % | | 242 | | | 7 | % | | 208 | | | 6 | % |
| Other (b) | 43 | | | 2 | % | | 45 | | | 2 | % | | 34 | | | 1 | % |
| Total | $ | 3,920 | | | 100 | % | | $ | 3,505 | | | 100 | % | | $ | 3,384 | | | 100 | % |
(a)Includes water revenues from public authorities and other utilities, and community water systems under bulk contracts.contracts and alternative revenue programs.
(b)Includes other operating revenues consisting primarily of miscellaneous utility charges, fees and rents.
Presented in the table below is the number of water and wastewater customers the CompanyCompany’s Regulated Businesses’ served by class of customer as of December 31, 2020, 20192023, 2022 and 2018,2021, which represents approximately 1514 million people served as of December 31, 2020:2023:
| | | | 2020 | | 2019 | | 2018 | | 2023 | | 2022 | | 2021 |
| (In thousands) | (In thousands) | Water | | Wastewater | | Water | | Wastewater | | Water | | Wastewater | (In thousands) | Water | | Wastewater | | Water | | Wastewater | | Water | | Wastewater |
| Residential | Residential | 2,948 | | | 236 | | | 2,914 | | | 215 | | | 2,892 | | | 188 | |
| Commercial | Commercial | 225 | | | 15 | | | 222 | | | 13 | | | 222 | | | 11 | |
| Fire service | Fire service | 50 | | | — | | | 49 | | | — | | | 48 | | | — | |
| Industrial | Industrial | 4 | | | — | | | 4 | | | — | | | 4 | | | — | |
Public and other (a) | Public and other (a) | 17 | | | 1 | | | 16 | | | 1 | | | 16 | | | 1 | |
| Total | 3,244 | | | 252 | | | 3,205 | | | 229 | | | 3,182 | | | 200 | |
| Total (b) | |
(a)Includes public authorities and other utilities and community water and wastewater systems under bulk contracts. Bulk contracts, which are accounted for as a single customer in the table above, generally result in service to multiple customers.
(b)The Company completed the sale of its New York subsidiary on January 1, 2022 and the sale of its Michigan subsidiary on February 4, 2022.
Customer growth in the Company’s Regulated Businesses is primarily from (i) adding new customers to its customer base through acquisitions of water and/or wastewater utility systems, (ii) population growth in its authorized service areas, and (iii) sale of water to other water utilities and community water systems.
Capital Investment
The Company plans to invest between $22$34 billion and $25$38 billion over the next 10 years including acquisitions, for capital improvements, including acquisitions, to its Regulated Businesses’ water and wastewater infrastructure, largely for pipe replacement and upgrading aging water and wastewater treatment facilities. The Company has proactively improved its pipe renewal rate from a 250-year replacement cycle in 2009 to an expected 110-yearapproximate 125-year replacement cycle by 2025,2028, which it anticipates will enable the Company to replace nearly 2,2002,000 miles of mains and collection pipes between 20212024 and 2025.2028. In addition, from 20212024 to 2025,2028, the Company’s capital investment in treatment plants, storage tanks and other key, above-ground facilities is expected to increase, further addressingseeking to address infrastructure renewal, resiliency, water quality, operational efficiency, technology and innovation, and emerging regulatory compliance needs. Additionally, theThe Company continues to invest significantly in resiliency projects to address the impacts of climate and weather variability by hardening its assets. Recently completed projects include a $15 million emergency power generation system installation at New Jersey’s Raritan Millstone Water Treatment Plant which provides automated standby power in the event of a power failure, and $23 million and $27 million Water Treatment Plant Improvement projects to retire obsolete pumping and water treatment facilities located in 100-year floodplains in both Muncie and Richmond, Indiana, respectively.
Regulation and Rate Making
The operations of the Company’s Regulated Businesses are generally subject to regulation by PUCs in the states in which they operate, with the primary responsibility of the PUCs being the promotion of the overall public interest by balancing the interest of customers and utility investors. Specific authority might differ from state to state, but in most states, PUCs review and approve rates charged to customers, accounting treatments, long-term financing programs and cost of capital, operation and maintenance (“O&M”) expenses, capital expenditures, taxes, affiliated transactions and relationships, reorganizations, mergers and acquisitions, and dispositions, along with imposing certain penalties or granting certain incentives. Regulatory policies vary from state to state and can change over time. These policies will affect the timing, as well as the extent, of recovery of expenses and the realized return on invested capital.
Periodic changes in customer rates generally occur through the filing of a rate case by the utility with the PUC. The timing of rate case filings is typically determined by either periodic requirements in the regulatory jurisdiction or by the utility’s need to increase its revenue requirement to recover capital investment costs, changes in operating revenues, operating costs or other market conditions. The Company attempts to minimize “regulatory lag,” which is the time between the occurrence of an event that triggers a change in the utility’s revenue requirement and the recognition in rates of that change.
The Company’s Regulated Businesses support regulatory practices at the PUCs and state legislatures that mitigate the adverse impact of regulatory lag. Presented in the table below are examples of approved regulatory practices:
| | | | | | | | | | | | | | |
| Regulatory Practices | | Description | | States Allowed |
| Infrastructure replacement surcharge mechanisms | | Allows rates to change periodically, outside a general rate case proceeding, to reflect recovery of capital investments made to replace infrastructure necessary to sustain safe and reliable services for the Company’s customers. These mechanisms typically involve periodic filings and reviews to ensure transparency. | | IA, IL, IN, KY, MO, NJ, NY, PA, TN, VA, WV |
| Future test year | | A “test year” is a period used for setting rates, and a future test year describes the first 12 months that new rates are proposed to be effective. The use of a future test year allows current or projected revenues, expenses and capital investments to be collected on a more timely basis. | | CA, HI, IA, IL, IN, KY, NY, PA, TN, VA |
| Hybrid test year | | A historical test year sets rates using data from a 12-month period that ends prior to a general rate case filing. A hybrid test year allows an update to historical data for “known and measurable” changes that occur subsequent to the historical test year. | | MD, MO, NJ, WV |
| Utility plant recovery mechanisms | | Allows recovery of the full return on utility plant costs during the construction period, instead of capitalizing an allowance for funds used during construction (“AFUDC”). In addition, some states allow the utility to seek pre-approval of certain capital projects and associated costs. In this pre-approval process, the PUC may assess the prudency of such projects. | | CA, IL, KY, NY, PA, TN, VA |
| Expense mechanisms | | Allows changes in certain operating expenses, which may fluctuate based on conditions beyond the utility’s control, to be recovered outside of a general rate case proceeding or deferred until the next general rate case proceeding. | | CA, HI, IL, IN, MD, MO, NJ, NY, PA, TN, VA |
| Revenue stability mechanisms | | Adjusts rates periodically to ensure that a utility recovers the revenues authorized in its general rate case, regardless of sales volume, including recognition of declining sales resulting from reduced consumption, while providing an incentive for customers to use water more efficiently. | | CA, IL NY |
| Consolidated tariffs | | Use of a unified rate structure for water systems owned and operated by a single utility, which may or may not be physically interconnected. The consolidated tariff pricing structure may be used fully or partially in a state, and is generally used to moderate the price impact of periodic fluctuations in local costs, while lowering administrative costs for customers. Pennsylvania and West Virginia also permitspermit a blending of water and wastewater revenue requirements. | | CA, IA, IL, IN, KY, MD, MO, NJ, NY, PA, VA, WV |
| Deferred accounting | | A regulators’regulator’s willingness to defer recognition of financial impacts when setting rates for utilities. | | All |
The Company pursues enhancements to these regulatory practices to facilitate efficient recovery of its costs and capital investments and to continue to provide safe, clean, reliable and affordable services to its customers. The ability to seek regulatory treatment using the regulatory practices described above does not guarantee that the PUCs will accept the Company’s proposal in the context of a particular rate case, and these regulatory practices may reduce, but not eliminate, regulatory lag associated with traditional rate making processes. It is also the Company’s strategy to expand the use of these mechanisms in areas where they may not currently apply and enhance certain mechanisms where they already exist.
Acquisitions and Strategic Growth
The U.S. water and wastewater industries include investor-owned systems as well as municipal systems that are owned and operated by local governments or governmental subdivisions. According to the most recent study by the U.S. Environmental Protection Agency (“EPA”), as of 2017, approximately 84% of the water market is served by municipal systems and approximately 98% of the country’s wastewater systems are government owned. The EPA also estimates, as of 2017, that there are approximatelyover 50,000 community water systems and approximatelyover 15,000 community wastewater systems in the United States, with approximately 80% of the community water systems serving a population of 3,000 or less.
A fundamental aspect of the Company’s growth strategy is to pursue acquisitions of water and/or wastewater systems in geographic proximity to areas where the Company operates its Regulated Businesses.Businesses, see Item 7—Management’s Discussion and Analysis of Financial Condition and Results of Operations for additional information. The proximity of acquisition opportunities to the Company’s regulated footprint allows it to integrate and manage the acquired systems and operations primarily using the Company’s existing management (although the Company typically retains the majority, if not all, of the employees of the acquired systems) and to achieve operational efficiencies and prioritize capital investment needs. The Company’s current customer mix of 93%91% water and 7%9% wastewater also presents strategic opportunities for wastewater growth and systems consolidation, allowing the Company to add wastewater customers where it already serves water customers. The Company intends to continue to expand its regulated footprint geographically by acquiring water and wastewater systems in its existing markets and, if appropriate, pursuing acquisition opportunities in certain domestic markets where the Company does not currently operate its Regulated Businesses. Before entering new regulated markets, the Company will evaluate the business and regulatory climates to ensure that it will have the opportunity to achieve an appropriate rate of return on its investment while maintaining its high standards for providing safe, reliable and affordable services to its customers, as well ascustomers. The Company will also evaluate whether there is a line of sight to grow the Company’s base customers to sufficient scale in a new regulated market so that it can attain efficiencies and promote customer affordability after entering thea new domestic market.
Increasingly stringent environmental, health and safety, cybersecurity and water quality and water accountability regulations, the amount of infrastructure in need of significant capital investment, financial challenges and industry legislation are several elements, among others, that may drive more municipalities to consider selling their water and wastewater assets.
Sale of New York American Water Company, Inc.
On November 20, 2019,January 1, 2022, the Company andcompleted the Company’spreviously disclosed sale of its regulated utility operations in New York subsidiary entered into a Stock Purchase Agreement (the “Stock Purchase Agreement”) with Liberty Utilities Co. which it subsequently assigned to its indirect, wholly owned subsidiary Liberty Utilities (Eastern Water Holdings) Corp. (“Liberty”), pursuant to whichan indirect, wholly owned subsidiary of Algonquin Power & Utilities Corp. Liberty will purchasepurchased from the Company all of the capital stock of the Company’s New York subsidiary (the “Stock Purchase”) for an aggregatea purchase price of approximately $608 million in cash, subject to adjustment as provided in the Stock Purchase Agreement.cash. The Company’s regulated New York operations haverepresented approximately 125,000127,000 customers in the State of New York. Algonquin Power & Utilities Corp., Liberty’s ultimate parent company, executed and delivered an absolute and unconditional guaranty of the performance of the obligations of Liberty under the Stock Purchase Agreement. The Stock Purchase is subject to various conditions, including obtaining approvals and satisfying or waiving other closing conditions. The Stock Purchase Agreement has an initial termination date of June 30, 2021. Either party may extend the agreement beyond June 30, 2021, and the Company intends to extend the agreement, if necessary, provided all of the conditions to closing have been or are capable of being met, other than obtaining regulatory approvals. If not otherwise extended, the ultimate termination date is December 31, 2021. Liberty may also terminate the Stock Purchase Agreement if any governmental authority initiates a condemnation or eminent domain proceeding against a majority of the consolidated properties of the New York subsidiary, taken as a whole.
In the fourth quarter of 2020, the Governor of New York proposed legislation that, among other things, requires the New York State Department of Public Service (“NYSDPS”) to study whether private water suppliers should be placed under municipal control. On February 3, 2021, the Governor issued a press release announcing that he directed the NYSDPS Special Counsel to commence and lead a municipalization feasibility study to be completed by April 1, 2021. Meanwhile, the Company’s New York subsidiary continues to work constructively with the NYSDPS and is taking the actions necessary to complete the Stock Purchase. Subject to satisfying or waiving the various conditions to closing, and assuming no prior termination of the Stock Purchase Agreement by Liberty as described above, the Company remains confident that the Stock Purchase will be completed, though the date of the close of the transaction could be impacted by the timing of the work to be completed by the NYSDPS Special Counsel.
Industry Legislation
In 2017, New Jersey enacted2020 and 2021, the Water Quality AccountabilityUnited States Congress passed, and the President signed into law, legislation with water and wastewater provisions including the Infrastructure Investment and Jobs Act (the “WQAA”“IIJA”), which sets operational standardsthe Consolidated Appropriations Act of 2021 and the American Rescue Plan of 2021. The legislation provided funding for alla variety of initiatives to support water utilitiesand wastewater infrastructure, lead service line replacement, treatment of PFAS and other contaminants of emerging concern, and low-income water assistance (“LIHWAP”). LIHWAP expired in 2023.
The Company’s regulated subsidiaries in New Jersey, including municipalIndiana, and investor-ownedMissouri have versions of water quality or safety accountability acts which require operational or safety and security standards for water and wastewater utilities with more than 500 service connections. Thisserving a certain number of customers. In New Jersey, the law imposes requirements in areas such as cybersecurity, asset management, water quality reporting, remediation of notices of violation, and hydrant and valve maintenance. The WQAAmaintenance and cybersecurity. In Indiana, the law requires water and wastewater utilities to conduct rate analyses, develop capital asset management plans and conduct cybersecurity and water loss audits. In Missouri, the most senioract requires water manager, or either the executive director for municipal utility authorities or the mayor or chief executive officer for municipally owned public water systems,and wastewater utilities to certify that the system meets the requirements under the WQAA. In an effort to strengthen accountability under the WQAA, the New Jersey Senate held three hearings on the WQAA during 2020. The New Jersey Assembly has also heard legislation to strengthen the WQAA in one committee,create cybersecurity, valve inspection and referral to the Assembly Appropriations Committee is pending.hydrant inspection programs.
The Company’s regulated subsidiaries in California, Illinois, Indiana, Iowa, Kentucky, Maryland, Missouri, New Jersey, Pennsylvania, Tennessee, Virginia and West Virginia have access to fair market valueutility valuation legislation and regulation for private sector investment in public sector water and wastewater systems. The Company supports full optionality for municipalities, including state legislation that enables the consolidation of the largely fragmented water and wastewater industries through third-party fair market valuations of purchased property. Fair market value assessment of water and wastewater systems is an alternative to the traditional depreciated original cost method of valuation, which allows the Company to offer municipalities a purchase price for their system assets that is reflective of the assets’ fair market value, while providing the Company with increased opportunity to recover the purchase price over the life of the purchased system assets, subject to PUC approval.
In 2020, legislation in Indiana was passed2021, the Tennessee Public Utility Commission implemented acquisition valuation rules that created an appraisal processinclude a methodology to establish fair value for non-municipal utilities and a presumption that a purchase price not exceeding the appraised value is reasonable. That legislation also requires that all new municipal water and wastewater systems are subject toassets based upon the jurisdictionnew replacement cost of the utility regulatory commission for ten years. Separate legislation authorizes recovery for above ground infrastructure, without a full rate case, for service enhancements that are completed for health, safety or environmental concerns. That same legislation also removed relocations completed for road construction fromassets less the distribution system improvement charge recovery caps.depreciation, in addition to other valuation methodology options.
Consolidated tariffs use a unified rate structure for systems owned and operated by a single utility, which may or may not be physically interconnected. Consolidated tariff pricing moderates the impact of periodic fluctuations in local costs and promotes a more universal water infrastructure investment in a state.jurisdiction. As a result, consolidated tariffs can make it easier to incorporate new systems into an existing utility, support economies of scale for even the smallest of systems and prioritize capital needs across the state.jurisdiction. Overall, the Company believes that consolidated tariffs bring cost-effective, high qualityhigh-quality services to a larger number of customers. TwelveEleven of the Company’s regulated jurisdictions currently have some form of consolidated tariff pricing, including California, Illinois, Indiana, Iowa, Kentucky, Maryland, Missouri, New Jersey, New York, Pennsylvania, Virginia and West Virginia.
In 2020, legislation in West Virginia was passed that allows for expanded asset valuation in connection with the acquisition of a utility or utility assets, combined water and wastewater revenue requirements and the expansion of permitted uses by municipalities of proceeds from the sale of a water or wastewater system. The legislation also allows inclusion of contributed property in a system’s asset valuation and rate base recognition for the full purchase price approved by the Public Service Commission of West Virginia.
In December 2020, Congress passed and the President signed into law a $900 billion COVID-19 relief and $1.4 trillion U.S. government appropriations package for 2021, which included $638 million for a low-income water assistance program and $2.8 billion for capitalization grants under the Clean Water and Drinking Water State Revolving Funds. The Company is awaiting further guidance on the distribution of these funds.
Competition
The Company’s Regulated Businesses generally do not face direct competition in their existing markets because (i) the Company operates in those markets pursuant to franchises, charters, certificates of public convenience and necessity or similar authorizations (collectively, “CPCNs”) issued by state PUCs or other authorities, and (ii) the high cost of constructing a new water and wastewater system in an existing market creates a significant barrier to market entry. However, the Company’s Regulated Businesses do face increasing competition from governmental agencies, other investor-owned utilities, large industrial customers with the ability to provide their own water supply/treatment process and strategic buyers that are entering new markets and/or making strategic acquisitions. When pursuing acquisitions, the Company’s largest investor-owned competitors, based on a comparison of operating revenues and population served, include Essential Utilities, Inc. (formerly known as Aqua America, Inc.), Suez North America, American States Water Company and California Water Service Group. From time to time, the Company also faces competition from infrastructure funds, multi-utility companies and others, such as Algonquin Power and Utilities Corp., Eversource Energy, SouthWest Water Company and Corix.Corix Infrastructure, Inc.
Condemnation and Eminent Domain
All or portions of the Regulated Businesses’ utility assets could be acquired by state, municipal or other government entities through one or more of the following methods: (i) eminent domain (also known as condemnation); (ii) the right of purchase given or reserved by a municipality or political subdivision when the original CPCN was granted; and (iii) the right of purchase given or reserved under the law of the state in which the utility subsidiary was incorporated or from which it received its CPCN. The acquisition consideration related to such a proceeding initiated by a local government may be determined consistent with applicable eminent domain law, or may be negotiated or fixed by appraisers as prescribed by the law of the state or inthe jurisdiction of the particular CPCN.
As such, the Regulated Businesses are periodically subject to condemnation proceedings in the ordinary course of business. For example, a citizens group in Monterey, California successfully added “Measure J” to the November 2018 election ballot asking voters to decide whether the Monterey Peninsula Water Management District (the “MPWMD”) should conduct a feasibility study concerning the potential purchase of the Monterey water service system assets (the “Monterey system assets”) of the Company’s California subsidiary and, if feasible, to proceed with(“Cal Am”) are the subject of a purchase of those assets without an additional public vote. This service territory represents approximately 40,000 customers. Inpotential condemnation action by the Monterey Peninsula Water Management District (the “MPWMD”) stemming from a November 2018 Measure J was certified to have passed. In August 2019, the MPWMD’s General Manager issued a report that recommends that the MPWMD board (1) develop criteria to determine which water systems should be considered for acquisition; (2) examine the feasibility of acquiring the Monterey system assets and consider public ownership of smaller systems only if the MPWMD becomes the owner of a larger system; (3) evaluate whether the acquisition of the Monterey system assets by the MPWMD is in the public interest and sufficiently satisfies the criterion of “feasible” as provided in Measure J; (4) ensure there is significant potential for cost savings before agreeing to commence an acquisition; and (5) developballot initiative. For more fully alternate operating plans before deciding whether to consider a Resolution of Necessity.
In November 2019, the MPWMD issued a preliminary valuation and cost of service analysis report, finding in part that (1) an estimate of the Monterey system assets’ total value plus adjustments would be approximately $513 million, (2) the cost of service modeling results indicate significant annual reductions in revenue requirements and projected monthly water bills, and (3) the acquisition of the Monterey system assets by the MPWMD would be economically feasible. On June 12, 2020, the MPWMD issued a draft environmental impact report for the potential acquisition of the Monterey system assets and a related district boundary adjustment that would be required if the MPWMD were to acquire and operate certain of the Monterey system assets located outside the MPWMD’s boundaries. On September 15, 2020, the MPWMD gave notice of its intention to appraise the Monterey system assets and related property interests. On September 29, 2020, the Company’s California subsidiary declined to make the Monterey system assets and related property interests available for inspection or to comply with any of the other requests contained in the MPWMD’s notice. On October 7, 2020, the MPWMD issued a final environmental impact report (“FEIR”), andinformation on November 4, 2020, the MPWMD certified the FEIR, which purports to analyze the environmental impacts of the MPWMD’s project to (1) acquire the Monterey system assets through the power of eminent domain, if necessary, and (2) expand its geographic boundaries to include all parts of this system. On November 25, 2020, the Company’s California subsidiary filed a petition challenging this certification in court. Seematter, see Item 3—Legal Proceedings—ChallengeProposed Acquisition of Certification—Proposed Monterey System Final Environmental Impact Report.
The MPWMD will be required to file an application with the Local Agency Formation Commission of Monterey County (“LAFCO”) seeking approval to become a retail water provider and annex approximately 56 parcels of land into the MPWMD’s boundaries. Approval by LAFCO is a precondition to the MPWMD’s ability to file an eminent domain proceeding against the Company’s California subsidiary to acquire the Monterey system assets. If the MPWMD were to make a final determination that an acquisition of the Monterey system assets is feasible, it would then need to file a multi-year eminent domain proceeding against the Company’s California subsidiary. In that proceeding, it would first need to establish its right to take the Monterey system assets. If such right is established, the amount of just compensation to be paid to the California subsidiary for such assets would then need to be determined.
Also, five municipalities in the Chicago, Illinois area (approximately 30,300 customers in total) formed a water agency and filed an eminent domain lawsuit against the Company’s Illinois subsidiary in January 2013, seeking to condemn the water pipeline that serves those five municipalities. Before filing its eminent domain lawsuit, the water agency made an offer of $38 million for the pipeline. The parties have filed with the court updated valuation reports. Although the date of the valuation trial is not currently scheduled, it is not likely to commence until the second quarter of 2021.Assets — Potential Condemnation.
Furthermore, the law in certain jurisdictions in which the Regulated Businesses operate provides for eminent domain rights allowing private property owners to file a lawsuit to seek just compensation against a public utility, if a public utility’s infrastructure has been determined to be a substantial cause of damage to that property. In these actions, the plaintiff would not have to prove that the public utility acted negligently. In California, for example, lawsuits have been filed in connection with large-scale natural events such as wildfires. Some of these lawsuits have included allegations that infrastructure of certain utilities triggered the natural event that resulted in damage to the property. In some cases, the PUC has allowed certain costs or losses incurred by the utility to be recovered from customers in rates, but in other cases such recovery in rates has been disallowed. Also, the utility may have obtained insurance that could respond to some or all of such losses, although the utility would be at risk for any losses not ultimately subject to rate or insurance recovery or losses that exceed the limits of such insurance.
Water Supply and Wastewater Services
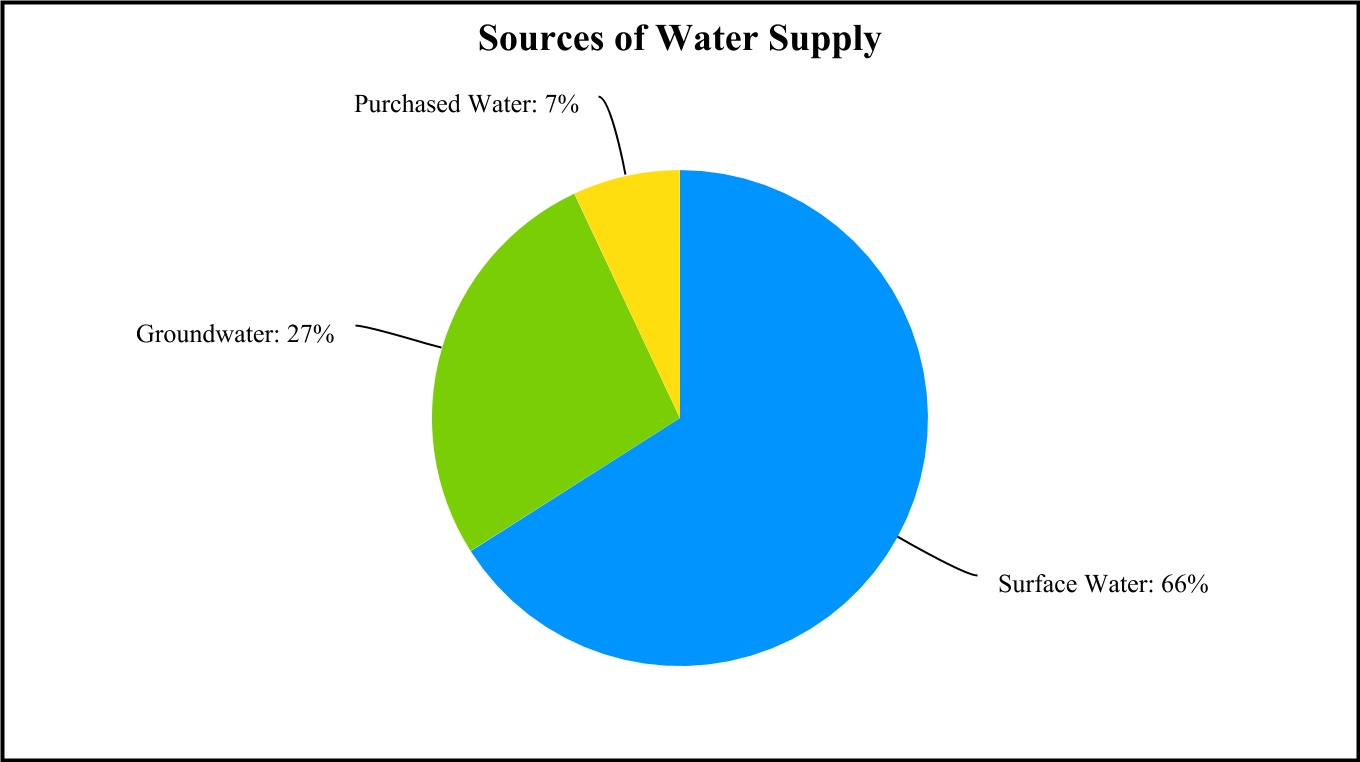
The Company’s Regulated Businesses generally own the physical assets used to store, pump, treat and deliver water to its customers and collect, treat, transport and recycle wastewater. Typically, the Company does not own the water, which is held in public trust and is allocated to the Company through contracts, permits and allocation rights granted by federal and state or multi-state agencies or through the ownership of water rights pursuant to local law. The Company is dependent on defined sources of water supply and obtains its water supply from surface water sources such as reservoirs, lakes, rivers and streams; from groundwater sources, such as wells and aquifers; and water purchased from third-party water suppliers. The level of water treatment the Company applies varies significantly depending upon the quality of the water source and customer stipulations. Surface water sources typically generally require significant treatment, while groundwater sources often require chemical treatment only.
Presented in the chart below are the Company’s sources of water supply as of December 31, 2020:
Presented in the table below are the percentages of water supply by source type for the Company’s Top SevenFive States individually and the Regulated Businesses collectively for the year ended December 31, 2020:2023:
| | | | Surface Water | | Ground Water | | Purchased Water | | Surface Water | | Ground Water | | Purchased Water |
| New Jersey | New Jersey | 72% | | 24% | | 4% | New Jersey | 74% | | 20% | | 6% |
| Pennsylvania | Pennsylvania | 91% | | 7% | | 2% | Pennsylvania | 91% | | 7% | | 2% |
| Missouri | Missouri | 78% | | 21% | | 1% | Missouri | 84% | | 15% | | 1% |
| Illinois | Illinois | 54% | | 35% | | 11% | Illinois | 55% | | 35% | | 10% |
| California | California | — | | 62% | | 38% | California | —% | | 67% | | 33% |
| Indiana | 44% | | 56% | | — |
| West Virginia | 100% | | — | | — |
| Regulated Businesses | | Regulated Businesses | 71% | | 22% | | 7% |
The Company’s ability to meet the existing and future water demands of its customers depends on an adequate water supply. Drought, governmental restrictions, overuse of sources of water, the protection of threatened species or habitats, contamination or other factors may limit the availability of ground and surface water. The Company employs a variety of measures in an effort to obtain adequate sources of water supply, both in the short-term and over the long-term. The geographic diversity of the Company’s service areas may mitigate some of the economic effects on the water supply associated with weather extremes itthe Company might encounter in any particular service territory. For example, in any given summer, some areas may experience drier than average weather, which may reduce the amount of source water available, while other areas the Company serves may experience wetter than average weather.
The Company evaluates quality, quantity, growth needs and alternate sources of water supply as well as transmission and distribution capacity to provide water service to its customers. Water supply is seasonal in nature and weather conditions can have a pronounced effect on supply. In order to ensure that the Company has adequate water supply, it uses long-term planning processes and maintains contingency plans to minimize the potential impact on service caused by climate variability and a wide range of weather fluctuations. The Company reviews current climate science and global models related to temperature, precipitation and sea level rise on an ongoing basis. Where actionable forecasts are available, the Company will use this information in its comprehensive planning studies and asset management plans. These studies and plans, which are used by the Company to develop its asset management and system reliability strategies, assess the climate risk and resiliency of the Company’s water and wastewater systems over short-, medium- and long-term time horizons, and include evaluations of the availability of water supplies and system capacity against a number of different factors, projections and estimates.
In connection with supply planning for most surface or groundwater sources, the Company employs models to determine safe yields under different rainfall and drought conditions. Surface and ground water levels are routinely monitored so that supply capacity deficits may, to the extent possible, be predicted and mitigated through demand management and additional supply development. In California, where the state has recently experienced a multi-year drought, the Company utilizes multiple water supply options including numerous ground water wells in multiple aquifers as well as various long-term purchase water agreements with regional water suppliers to optimize supplies while assuring resiliency during dry years. An example of the Company’s use of long-term planning to ensure that it has adequate water supply is its involvement in the Monterey Peninsula Water Supply Project (the “Water Supply Project”) in California. The Water Supply Project includes the construction of a desalination plant, to be owned by the Company’s California subsidiary,Cal Am, and the construction of wells that would supply water to the desalination plant. In addition, the Water Supply Project also includes the California subsidiary’sCal Am’s purchase of water from a groundwater replenishment project (the “GWR Project”) between Monterey One Water (formerly known as the Monterey Regional Water Pollution Control Agency) and the MPWMD. The Water Supply Project is intended, among other things, to fulfill obligations of the California subsidiaryCal Am to eliminate unauthorized diversions from the Carmel River as required under orders of the California State Water Resources Control Board (the “SWRCB”). For more information, see Item 3—Legal Proceedings—Alternative Water Supply in Lieu of Carmel River Diversions and Note 17—16—Commitments and Contingencies—Contingencies—Alternative Water Supply in Lieu of Carmel River Diversions, in the Notes to the Consolidated Financial Statements.
Wastewater services involve the collection of wastewater from customers’ premises through sewer lines. The wastewater is then transported through a sewer network to a treatment facility, where it is treated to meet required regulatory standards for wastewater before being returned to the environment. The solid waste by-product of the treatment process is disposed of or recycled in accordance with applicable standards and regulations.
Seasonality
Customer demand for the Company’s water service is affected by weather and tends to vary with temperature and amount and frequency of rainfall. Customer demand is generally greater during the warmer months, primarily due to increased water usage for irrigation systems and other outdoor water use. As such, the Company typically expects its operating revenues to be the highest in the third quarter of each year. Weather that is hotterwarmer and/or drier than average generally increases operating revenues, whereas, weather that is cooler and/or wetter than average generally serves to suppresssuppresses customer water demand and can reduce water operating revenues. ThreeTwo of the Company’s jurisdictions, California Illinois and New York,Illinois, have adopted revenue stability mechanisms which permit the Company to collect state PUC-authorized revenue for a given period whichthat is not tied to the volume of water sold during that period, thereby lessening the impact of weather variability. See Regulated Businesses—Regulation—Regulation and Rate Making for additional information regarding revenue stability mechanisms.
Market-Based BusinessesAffordability
The Company supports the United Nations’ declaration of access to clean water and sanitation as a human right, regardless of economic status. As a water utility, the Company’s Market-Based Businesses provide home services primarily to residentialwater must be safe, efficient, reliable, accessible and smaller commercialaffordable. Through increased efficiency, conservation and low-income support programs, on average across the enterprise, the Company consistently achieves water costs that are significantly below the EPA’s suggested guidance of 2% of household income. Succeeding in water affordability positively affects the health and safety of the Company’s customers and contributes to the economic prosperity of the communities in which it operates.
The Company’s approach to water access and affordability consists of two key strategies. The first is to supply water that is safe, reliable and meets the needs of its customers. The second is to provide affordable water services to customers while protecting its customers’ right to clean water, regardless of economic status or geographic location. The Company also focuses on addressing water affordability by maximizing both supply-side and demand-side efficiency. Average residential water bills for the Company’s customers are approximately $55 to $65 per month, and the expected average annual rate increases across the Company’s footprint over the next five years is 5% to 6%. The Company continues to advocate for federal and state customer affordability support and monitors the number of customers enrolled in its assistance programs to make sure that it is effectively responding to customer needs.
Other
Other primarily includes the MSG business, which enters into long-term contracts with the U.S. government to provide water and wastewater services on military installations. The Contract Services Group (“CSG”), also included in Other, has three contracts with municipal customers to operate and manage water and wastewater facilities and provide other related services. Other also includes corporate costs that are not allocated to the U.S. government on military installations, as well as municipalities,Company’s Regulated Businesses, interest income related to the secured seller promissory note from the sale of HOS, income from assets not associated with the Regulated Businesses, eliminations of inter-segment transactions and utility customers. Thesefair value adjustments related to acquisitions that have not been allocated to the Regulated Businesses segment. The businesses included withinOther are not subject to regulation by state PUCs and the services provided generally do not require significant capital investment. Operating revenues for the Company’s Market-Based BusinessesOther were $540$314 million for 2020, $5392023, $287 million for 20192022 and $476$546 million for 2018,2021, accounting for 14%7%, 15%8% and 14%, respectively, of the Company’s total operating revenues for the same periods.
The Company’s primary Market-Based Businesses include the following operating segments:
•Homeowner Services Group (“HOS”), which provides various warranty protection programs and other home services to residential customers;
•Military Services Group (“MSG”), which enters into long-term contracts with the U.S. government to provide water and wastewater services on various military installations.
The Company also has five contracts with municipal customers to operate and manage water and wastewater facilities and provide other related services through its Contract Services Group (“CSG”).
Homeowner Services Group
The Company’s Homeowner Services Group, which includes the operations of Pivotal Home Solutions (“Pivotal”) acquired in June 2018, provides warranty protection programs and other home services to residential customers for interior and exterior water and sewer lines, interior gas and electric lines, heating and cooling systems, water heaters and other home appliances, as well as power surge protection and other related services. The Company develops partnerships with municipalities, utilities and other organizations to offer protection programs to customers serviced by, or affiliated with, those municipalities, utilities and organizations. The term of these partnership agreements with the municipalities, utilities and other organizations is typically three to five years, with mutual optional renewals. As of December 31, 2020, HOS had approximately 3 million customer contracts in 43 states.
Military Services Group
The Company’s Military Services GroupMSG operates on 1718 military installations under 50-year contracts with the U.S. government as part of its Utilities Privatization Program. The scope of these contracts generally includes the operation and maintenance of the installation’s water and wastewater systems and a capital program focused on asset replacement and, in certain instances, systems expansion. The replacement of assets assumed when a contract is awarded to MSG is completed either through a discrete set of projects executed in the first five years of the contract or through the long termlong-term recapitalization program performed over the life of the contract. Traditionally, both of these programs are funded from the contract fee. At times, new assets are required to support the installation’s mission, and the construction of these assets is funded by the U.S. government as separate modifications or amendments to the contract. The capital for these assets historically has not been funded through the Company’s debt or equity issuances; rather, the Company has used limited working capital for short-term needs under these contracts. In April 2018, theThe U.S. Army institutedhas a requirement that a bidder must offer financing in its proposal for these new capital projects under existing contracts, but the U.S. Army’s implementation of this requirement on existing contracts has limited the need for such financing. However, recent U.S. Army and Navy Utilities Privatization solicitations have included requirements for the successful bidder to finance discrete initial capital projects over either a five- or ten-year period after project completion. ThreeFour of MSG’s current contracts require such capital project financing, which the Company is currently addressing through internal sources of liquidity.
The contract price for sixfour of MSG’s contracts with the U.S. government is subject to redetermination two years after commencement of operations, and every three years thereafter. Price redetermination is a contract mechanism to periodically adjust the service fee in the next period, to reflect changes in contract obligations and anticipated market conditions. The remaining 1114 contracts with the U.S. government are subject to annual price adjustments under a mechanism called “Economic Price Adjustment.” All 1718 contracts could be terminated, in whole or in part, prior to the end of the 50-year term for convenience of the U.S. government, or as a result of default or non-performance by the MSG subsidiary performing the contract. In either event, pursuant to termination provisions applicable to all of these contracts, MSG would be entitled to recover allowable costs that it may have incurred under the contract, plus the contract profit margin on incurred costs. MSG’s backlog of revenue associated with its contracts with the U.S. government is approximately $6.2$7.1 billion, with an average remaining contract term of 4139 years.
Sale of Homeowner Services Group
On December 9, 2021 (the “Closing Date”), the Company sold all of the equity interests of the HOS subsidiaries for total consideration of approximately $1.275 billion. Prior to the Closing Date, the Company provided various warranty protection programs and other home services primarily to residential and smaller commercial customers through its HOS operations. See Item 7—Management’s Discussion and Analysis of Financial Condition and Results of Operations and Note 5—Acquisitions and Divestitures in the Notes to Consolidated Financial Statements for additional information.
Competition
The Company’s Market-Based Businesses faceMSG faces competition from a number of service providers, including HomeServe USA and Cinch Home Services in HOS, and American States Water Company Suez North America, and Veolia Environnement S.A. in MSG.
Environmental, Health and Safety, Water Quality and Other Regulation
The Company’s water and wastewater operations, including the services provided by both its Regulated Businesses, MSG and Market-Based Businesses,CSG, are subject to extensive federal, state and local laws and regulations governing the protection of the environment, health and safety, the provision of water and wastewater services, particularly with respect to the quality of water the Company delivers to its customers, and the manner in which it collects, treats, discharges, recycles and disposes of wastewater. In the United States, these regulations are developed under federal legislation including the Safe Drinking Water Act, the Reduction of Lead in Drinking Water Act and the Clean Water Act, and under a variety of applicable state laws. Environmental, health and safety, and water quality regulations are complex and may vary from state to state in those instances where a state has adopted a standard that is more stringent than the federal standard. For example, while the EPA has issued a non-enforceable Health Advisory for the combined level of two perfluorinated compounds (perfluorooctanoic acid, or PFOA, and perfluorooctane sulfonate, or PFOS), the New Jersey Department of Environmental Protection was the first state agency to establish a standard for perfluorononanoic acid, or PFNA, in 2018 and has since established maximum containment levels for PFOA and PFOS, with implementation occurring in January 2021. The Company is also subject to various federal, state, and local laws and regulations governing the storage of hazardous materials, the management and disposal of hazardous and solid wastes, discharges to air and water, the cleanup of contaminated sites, dam safety and other matters relating to the protection of the environment and health and safety. PUCs also set conditions and standards for the water and wastewater services the Company delivers.
The Company maintains an environmental program that includes responsible business practices focused on compliance with environmental laws and regulations and the effective use of natural resources, recognizing that drinking water standards have generally, over time, increased in number and become increasingly more stringent. As newer or stricter standards are introduced, the Company’s capital and operating costs needed to comply with them will likely increase. The Company incurs substantial costs associated with compliance with the environmental, health and safety, and water quality standards to which its operations are subject and the Company invests in technology solutions for enhanced detection and monitoring of water quality issues. The Company estimates that it will make capital expenditures of approximately $725$900 million over the next five years, including $155and $200 million in 2021, for2024, to address water quality issues; most of which are focused on compliance with environmental control facilities, which the Company defines for this purpose as any project (or portion thereof) that involves the preservation of air, water or land.laws and regulations. The Company believes that its operations are materially in compliance with, and in many cases surpass, minimum standards required by applicable environmental laws and regulations.
The Company’s operations also involve the use, storage and disposal of hazardous substances and wastes. For example, the Company’s water and wastewater treatment facilities store and use gaseous chlorine andas well as other chemicals that generate wastes that require proper handling and disposal under applicable environmental requirements. The Company also could incur remedial costs in connection with any contamination relating to its operations or facilities or its off-site disposal of wastes.waste. The Comprehensive Environmental Response, Compensation, and Liability Act of 1980 (“CERCLA”), authorizes the EPA, and comparable state laws authorize state environmental authorities, to issue orders and bring enforcement actions to compel responsible parties to investigate and take remedial actions at any site that is determined to present an actual or potential threat to human health or the environment because of an actual or threatened release of one or more hazardous substances. Parties that generated or transported hazardous substances to such sites, as well as current and former owners and operators of such sites, may be deemed liable, without regard to fault, under CERCLA or comparable state laws. Although the Company is not aware of any material cleanup or decontamination obligations, the discovery of contamination or the imposition of such obligations in the future could result in additional costs to the Company. The Company’s facilities and operations are also subject to requirements under the U.S. Occupational Safety and Health Act and inspections thereunder.
Safe Drinking Water Act
The Safe Drinking Water Act and related regulations establish national quality standards for drinking water. The EPA has issued rules governing the levels of numerous, naturally occurring and man-mademanufactured chemical and microbial contaminants and radionuclides allowable in drinking water, and continues to propose new rules. These rules also prescribe testing requirements for detecting regulated contaminants, the treatment systems that may be used for removing those contaminants, and other requirements. To date, the EPA has set standards for over 90 contaminants and water quality indicators for drinking water, and there is a process in place to make a regulatory determination on at least five additional compounds every five years.
To help formulate the basis for future regulations, the EPA has the authority to require monitoring for additional, unregulated contaminants under the Unregulated Contaminant Monitoring Rule (the “Monitoring Rule”). The Company’s facilities have participated in the data gathering effort for the Monitoring Rule in previous rounds, which occurs every five years, including the fourth round that concluded at the end of 2020. There are millions of other chemical compounds that are not regulated, many of which lack a testing methodology, occurrence data, health effects information and/or cost effective treatment options. The process of developing new drinking water standards is long and complex, but the Company actively participates with the EPA and other water industry groups by sharing research and water quality operational knowledge. See Item 1—Business—Research and Development—Contaminants of Emerging Concern for additional information.
To effect the removal or inactivation of microbial contaminants, the EPA has established various rules to improve the disinfection and filtration of drinking water and to reduce consumers’ exposure to disinfectants and/or the by-products of their use in the disinfection process. Examples of these rules are the Long-Term 2 Enhanced Surface Water Treatment Rule (the “Long-Term 2 Rule”), the Stage 2 Disinfectants and Disinfection Byproduct Rule, and the Ground Water Rule, which is applicable to systems providing water from underground sources. In 2016, the revised Total Coliform Rule implemented a “find and fix” process where exceeding bacterial trigger levels requires an assessment to correct any sanitary defects. The Company is within the EPA’s time frame for compliance with allstandards and rules developed under the regulation of these standards,the Safe Drinking Water Act, which includes sample collection, data analysis, and, in some instances engineering planning and implementation of treatment enhancements. Recent monitoring as required by the Long-Term 2 Rule has indicated that approximately 30 of the Company’s surface water systems have recently completed or need to implement additional disinfection protection mechanisms against Cryptosporidium. In many cases, this will involve installing ultraviolet light disinfection systems, and although several plants have already completed assessments and upgrades, an estimated $150 million to $250 million of investment will still be required to upgrade the remaining facilities for Cryptosporidium disinfection. Further, the EPA is actively considering regulationsdevelopment of a new regulation for a number of contaminants, including strontium, hexavalent chromium, fluoride, nitrosamines, some pharmaceuticalsperchlorate and certain volatile organic compounds.updates to the current microbial and disinfection byproduct regulations. The Company does not anticipate that any such regulations, if enacted, will require implementation in 2021.
The Company conducted over ten million water quality and turbidity tests in 2020 at its laboratory facilities and plant operations, including continuous online instrumentations such as monitoring turbidity levels, disinfectant residuals and adjustments to chemical treatment based on changes in incoming water. The Company participates in the Partnership for Safe Water, the EPA’s voluntary program to meet more stringent goals for reducing microbial contaminants. With 68 of the Company’s 79 surface water treatment plants receiving the EPA program’s prestigious “Director” award, which recognizes utilities that (i) have completed a comprehensive self-assessment report, (ii) created an action plan for continuous improvement, and (iii) produced high-quality drinking water, the Company accounts for approximately one-third of the plants receiving such awards nationwide. In addition, 66 of the Company’s surface water treatment plants have received the “Five-Year Phase III” award, 61 plants have received the “Ten-Year Phase III” award, 57 plants have received the “Fifteen-Year Phase III” award, and 26 plants have received the “Twenty-Year Phase III” award; these awards recognize plants that have met the Director award status for five, 10, 15 and 20 years, respectively. Further, nine of the Company’s surface water plants have received the “Presidents” award, which recognizes treatment plants that achieve the Partnership’s rigorous individual filter effluent turbidity standards.2024.
Although it is difficult to project the ultimate costs of complying with the above or other pending or future requirements, the Company expects current cost requirements under the Safe Drinking Water Act and other similar laws to be recoverable through the regulatory process and therefore compliance costs are not expected to have a material impact on its operations or financial condition. In addition, capital expenditures and operating costs to comply with environmental mandates have been traditionally recognized by PUCs as appropriate for inclusion in establishing rates. As a result, the Company expects to recover the operating and capital costs resulting from these pending or future requirements.
Lead and Copper Rule and Reduction of Lead in Drinking Water Act
In 1991, the EPA published the Lead and Copper Rule (“LCR”) to control lead and copper in drinking water and, since that time, has issued minor revisions in 2000, 2004 and 2007, enhancing monitoring, reporting and public education requirements. In 2011, Congress enacted the Reduction of Lead in Drinking Water Act regarding the use and introduction into commerce of lead pipes, plumbing fittings for fixtures, solder and flux. While these advances have made an impact in reducing lead exposure in drinking water, legacy lead plumbing materials, primarily in building plumbing, still remain in many communities. The failure of certain water systems in the United States to comply with the requirements of the LCR has received recent media attention and scrutiny, and in certain cases, has led to a number of investigations and the imposition of significant penalties and sanctions against the operators of those systems and others. As part of its ongoing water main replacement and service line renewal projects, and in accordance with applicable state regulations and anticipation of updated federal regulation, the Company has started to replacebeen replacing lead service lines (“LSLs”) for many years in accordance with current scientific guidance. Also, the Company utilizes appropriate corrosion control techniques as necessary to comply with current water quality regulatory requirements. The
On December 21, 2021, the EPA finalized revisionsannounced next steps to strengthen the LCR (the “Revised LCR”)regulatory framework on January 15, 2021 that are designed to provide more effective protection of public health by reducing exposure to lead and copper in drinking water.water, including implementing the Lead and Copper Rule Revisions (“LCRR”) and indicated an intent to finalize the Lead and Copper Rule Improvements (“LCRI”) which were proposed on December 6, 2023, prior to October 16, 2024, the initial compliance date in the LCRR. The Company is in the process of reviewing the Revised LCR and will be developingexecuting an implementation strategy to comply with the new requirements, which are mandated by January 2024.initial LCRR requirement to complete a lead service line inventory. Capital expenditures and operating costs associated with compliance with any of thesethe LCRI will be determined once the EPA finalizes the rule, revisions cannot be presently determined until the Company’s review of the new rule is completed, but as previously noted, costs associated with compliance with federal water quality regulations have been traditionally recognized by PUCs as appropriate for inclusion in establishing rates.
The Company currently estimates that less than 5% ofhas provided both oral and written comments to the service lines within its regulated service territories contain leadEPA on either the Company or customer portion of the service line. The Company is replacing LSLs as part of its ongoing water main replacement and service line renewal projects. The Company’s goal is to work with the communities it currently serves to replace a significant majority of presently known LSLs in most of its service areas by the end of 2030, at an estimated cost ranging from $600 million to $1.2 billion.proposed LCRI. The Company believes thisthat, if the LCRI rulemaking were to be implemented, the total investment cost to identify and replace lead and galvanized steel service lines in the United States by 2037 would be significant and has been underestimated by the EPA in the LCRI rulemaking. Finally, the Company supports a delay of the compliance date for those portions of the LCRR proposed to be extended by the LCRI, some of which are currently scheduled to take effect on October 16, 2024, to allow all water service providers to prepare adequately for any changes that may be implemented through the proposed LCRI rulemaking while continuing to comply with the existing requirements.
The IIJA was signed into law in November 2021 and provides for up to $15 billion for lead service line replacement through drinking water state revolving funds. The Company will be attainable for most ofevaluate its service territories and apply for funding for those areas where public policy is supportive of this goal.that meet applicable requirements. With regard to future acquisitions, the Company will work with those communities as part of the acquisition process to set LSL removal goals appropriate for those systems. The prioritization of LSL removal is dependent on several factors, including the Company’s planned water main and service line renewal projects, adjacent projects by municipalities or other utilities, LCR compliance monitoring results, and cooperation with its customers with respect to replacing the customer-owned portion of the LSL as necessary. In certain cases, these and other factors may result in a shorter or longer time frame for replacement. Because replacing the external LSL in its entirety is advised by several water industry organizations including the U.S. National Drinking Water Advisory Council, the Lead Service Line Replacement Collaborative, and the American Water Works Association, the Company’s preferred approach is to replace the entire external LSL if lead is found on either the Company or customer portion of the service line; full LSL replacement is also consistent with the Revised LCR.LCRR and proposed LCRI. The Lead Service Line Replacement Collaborative is a diverse group of public health, water utility, environmental, labor, consumer and housing organizations from across the country working together to encourage communities to accelerate the full replacement of LSLs through collaborative efforts at the local level.
National Primary Drinking Water Regulations
On March 14, 2023, the EPA announced the proposed National Primary Drinking Water Regulations (“NPDWR”) for six PFAS including perfluorooctanoic acid (“PFOA”), perfluorooctane sulfonic acid (“PFOS”), perfluorononanoic acid (“PFNA”), hexafluoropropylene oxide dimer acid (“HFPO-DA”, commonly known as “GenX Chemicals”), perfluorohexane sulfonic acid (“PFHxS”), and perfluorobutane sulfonic acid (“PFBS”). The proposed regulations would establish legally enforceable levels for PFAS in drinking water. The EPA anticipates issuing a final rule in 2024 and utilities will be provided a three-year window to comply with the new regulations once finalized, although the Safe Drinking Water Act allows utilities to request an additional two years if capital improvements are required.
The Company performed an initial review of the NPDWR to assess the four parts per trillion requirements for PFOA and PFOS and the application of the Hazard Index approach for PFNA, PFBS, PFHxS, and GenX Chemicals. On May 24, 2023, the Company submitted comments to the EPA outlining its position on key issues to address the proposed regulations, including its projected costs associated with PFAS treatment at the proposed limits and the potential impact to customers’ bills. The Company estimates an investment of approximately $1 billion of capital expenditures to install additional treatment facilities over a three to five-year period in order to comply with the proposed regulations. Additionally, the Company estimates annual operating expenses up to approximately $50 million related to testing and treatment in today's dollars. These are preliminary estimates based on the proposed rule. The actual expenses may differ from these preliminary estimates and will be dependent upon multiple factors, including the final rule and effective date, as well as the completion of a system-by-system engineering analysis.
The Company supports sound policies and compliance with the NPDWR by all water utilities, while protecting customers and communities from the costly burden of monitoring and mitigating PFAS contamination in water systems. The Company continues to advocate for policies that hold polluters accountable and is participating in the multi-district litigation and other lawsuits filed against certain PFAS manufacturers seeking damages and reimbursement of costs incurred and continuing to be incurred to address contamination of public water supply systems by PFAS. For more information on the PFAS multi-district litigation, see Item 3—Legal Proceedings—PFAS Multi-District Litigation.
Clean Water Act
The Clean Water Act regulates discharges from drinking water and wastewater treatment facilities into lakes, rivers, streams and groundwater. In addition to requirements applicable to the Company’s wastewater collection systems, its operations require discharge permits under the National Pollutant Discharge Elimination System (“NPDES”) permit program established under the Clean Water Act, which must be renewed every five years. Pursuant to the NPDES permit program, the EPA and implementing states set maximum discharge limits for wastewater effluents and overflows from wastewater collection systems. Discharges that exceed the limits specified under NPDES permits can lead to the imposition of fines and penalties, and persistent non-compliance could lead to significant fines and penalties and other compliance costs. In addition, the difficulty of obtaining and complying with NPDES permits, and renewing expiring permits, may impose time and cost burdens on the Company’s operations. From time to time, discharge violations occur at the Company’s facilities, some of which result in fines. The Company does not expect any such violations or fines to have a material impact on its results of operations or financial condition. The EPA has identified wastewater discharge permitting and permits for the application of biosolids, or sewage sludge, containing PFAS as areas of focus in its PFAS Strategic Roadmap. Individual states may also take action in these areas. As indicated previously, capital expenditures and operating costs to comply with environmental mandates have been traditionally recognized by PUCs as appropriate for inclusion in establishing rates. As a result, the Company expects to recover the operating and capital costs resulting from any new requirements in these areas.
Research and Development
The Company’s Research and Development Program
The Company maintains an industry-leading research and development (“R&D”) program that is designed to enhance its services, support its compliance activities, improve service quality and operational effectiveness, and provide environmental leadership. For more than three decades from its inception, American Water’s R&D program has evolved into an industry-leading effort and has achieved numerous advancements in the science of drinking water, wastewater, and desalination. Through laboratory and industry resources and the team’s expertise, efforts are focused on contaminants of emerging concern, including but not limited to COVID-19, PFAS, Legionella, cyanotoxin-forming algal blooms, a variety of pathogens (for example, COVID-19, Cryptosporidium, Giardia, enteric viruses, and various bacteria), microbial indicators and disinfection byproducts. The Company’s R&D personnel are located at the Company’s corporate headquarters and at two laboratory testing facilities in New Jersey and Illinois, the latter housing its quality control and testing laboratory, which supports the Company’s R&D activities through testing and analysis.
The Company continues to leverage its expertise and collaborates with the EPA and state agencies to help establish effective environmental, health and safety, and water quality standards and regulations. This relationship includes the sharing of the Company’s research, such as its treatment and distribution system optimization research and its national water quality monitoring data. The Company’s engagement with the EPA provides it with early insight into emerging regulatory issues and initiatives, thereby allowing the Company to anticipate and to accommodate its future compliance requirements. The Company also frequently engages with the Centers for Disease Control and Prevention, other state environmental agencies, and national and international water research foundations. The Company believes that continued R&D activities are critical for providing safe, reliable and affordable services, as well as maintaining its leadership position in the industry, which provides the Company with a competitive advantage as it seeks business and operational growth.
Contaminants of Emerging Concern
Contaminants of emerging concern include numerous chemicals such as PFAS, pharmaceuticals, personal care products, pesticides, herbicides, antibiotic resistant bacteria (ARB), antibiotic resistant genes (ARG), endocrine disrupting compounds, microplastics and industrial chemicals, as well as certain naturally occurring microbes, such as bacteria, viruses and parasites, which have been detected in drinking water supplies, for which the risk to the public’s health is not fully understood and/or has not been assessed. Technological advances have only recently made it possible to detect many of these contaminants at trace levels. The ability to detect contaminants, even at trace levels, has invited discussion about these contaminants among regulators and government agencies, which in turn shapes the public’s perception of drinking water quality.
The Chemicals Abstract Service Registry contains over 173204 million registered chemicals, with an estimated 1,400 species of disease-causing microbes that can affect humans. The Company is continually investigating new substances and contaminants, employing a team of scientists, engineers and public health professionals to identify threats to its water supply, to act on emerging regulations and new health advisories, and to evaluate the benefits of alternative or advanced treatment technologies. The Company utilizes water quality testing equipment and implements new and emerging technologies to help detect potential water supply contamination issues. Examples of the Company’s efforts include:
•monitoring impacts of the COVID-19 pandemic on environmental viruspathogen loads and removal efforts through wastewater systems;
•characterizing factors that contribute to the formation of potentially carcinogenic disinfection by-products to define best practices for their mitigation;
•advancing the science on holistic management strategies to improve distribution system water quality further;
•using its research findings to communicate information to its customers regarding potential actions to limit occurrences of Legionella in their buildings; in this regard, the Centers for Disease Control and Prevention statistics indicate that water-associated disease from Legionella is on the rise, with exposure typically associated with customer-owned plumbing systems in large buildings;
•defining a framework to support management or possible future regulation of opportunistic pathogens;
•developing expanded monitoring methods for short-chain and fluorinated replacement PFAS;
•systematically investigating PFAS removal from a variety of water matrices using established and emerging treatment technologies;
•leading a PFAS risk communication strategy for the water sector;
•using innovative ultrasonic technologies to detect(e.g., satellite imagery) for early detection and manageresponse to algal blooms to helpmanage public health impacts and prevent taste and odor events andbefore cyanotoxins before they get tointo the water treatment plant;
•monitoring of taste and odor issues that impact customer satisfaction using expanded analytical methods to detect compounds, and evaluating and recommending treatment practices;
•implementing water source assessment tools, including sensors and data analytics, to evaluate and track chemical storage and aid in the identification of source water contamination events;
•developing methodology and advanced measurement techniques for contaminants of emerging concern to investigate transport, occurrence and treatment; and
•implementing activated carbon, biofiltration and ion exchange mechanismstreatment to seek to control contaminants of emerging concern.
Service Company and Security
American Water Works Service Company, Inc. (“Service Company”) is a wholly owned subsidiary of the Company that provides support and operational services to the Company and its affiliates. These services are predominantly provided to the Company’s Regulated Businesses under contracts that have been approved by PUCs, where necessary, and are also provided to its Market-Based Businessesthe MSG and CSG businesses as requested or may otherwise be necessary. Services provided by Service Company may include accounting and finance, administration, business development, communications, compliance, education and training, engineering, environmental, health and safety, human resources, information systems, internal audit, investor relations, legal and governance, operations, procurement, R&D, rates and regulatory support, security, risk management and insurance, treasury, and water quality. Service Company also operates two nationalprovides customer service centers located in Alton, Illinois and Pensacola, Florida, which provide customer relations, field service and operational support to the Company’s Regulated Businesses.Businesses, which includes call handling, billing, a major accounts program and other related services. Services are provided by Service Company at cost, enabling the Company’s operating subsidiaries to fulfill their responsibilities in a cost-effective manner, while providing them access to in-depth, functional expertise.
The Company’s security team, through Service Company, provides oversight and policy guidance on physical, cyber and information security, as well as business continuity, throughout itsthe Company’s operations. ItThe security team is responsible for designing, implementing, monitoring and supporting effective physical and technical security controls for the Company’s physical assets, business systems and operational technologies. Risk assessments are conducted periodically to evaluate the effectiveness of existing security controls and serve as the basis for additional safeguards, security controls and measures. OperationalFor additional information concerning this team and technical security controls are deployed and integrated as safeguards against unauthorized access to the Company’s information systems. These controls are aimed at (i) assuring the continuity of business processes that are dependent upon automation, (ii) maintaining the integrity of the Company’s data, (iii) supporting regulatory and legislative compliance requirements, and (iv) maintaining safe and reliable service to the Company’s customers. The Company engages in partnerships with U.S. federal, state and local law enforcement agencies to coordinate and improve the security of its water delivery systems and to safeguard its water supply and operations.cybersecurity program, see Item 1C—Cybersecurity.
Environmental, Social Responsibility and Governance
The Company considers environmental, social responsibility and governance (“ESG”) principles fundamental to its corporate strategy and values. Integration of these principles into the Company’s daily operations emphasizes its belief that “how” a company operates is just as important as “what” a company does. This focus is derived from the Company’s core values: (i) safety; (ii) trust; (iii) environmental leadership; (iv) teamwork; and (v) high performance, which are the principles by which it operates. The Company’s vision and values drive its company strategy, which is centered on five central themes:
•Safety—The safety of the Company’s employees and customers is the number one focus for American Water.
•Customers—The Company’s customers are at the center of everything it does, helping the Company to shape its strategic priorities.
•People—Maintaining an environment which is open, transparent, diverse and inclusive, and where the Company’s people feel valued, included and accountable, is critical to the Company’s ability to serve its customers every day.
•Operational Excellence—The Company’s operational excellence strategy helps it to find better and more efficient ways to do business, and to provideDelivering safe, clean, reliable and affordable water services to customers and treating wastewater has been fundamental to the Company’s business for its customers.
•Growth—decades. The Company believes that when companies grow, they can invest morehas an opportunity to make a positive, sustainable impact in creating stable jobs, training, benefits, infrastructurethousands of communities by serving them with diverse and their communities. The Company’s growth benefits all of its stakeholders, including its shareholders.skilled employees and maintaining the governance and diligence to meet or exceed service expectations.
Demonstrated ESG Leadership
The Company’s values and actions have achieved prestigious recognition by firms devoted to recognizing companies that demonstrate ESG leadership. Among others, American Water (i) was recognized on the 2023 Bloomberg Gender-Equality Index for the fifth consecutive year, (ii) was ranked 18th on Barron’s 100 Most Sustainable U.S. Companies 2023 List, (iii) was named one of America’s Most JUST companies by JUST Capital and CNBC for its continued commitment to employees, customers, communities and shareholders, (iv) earned the U.S. Department of Homeland Security’s SAFETY Act designation and the EPA’s WaterSense® Excellence Award, and (v) was honored as a 2023 VETS Indexes 3-Star Employer and earned the 2024 Military Friendly® Gold Employer designation for the Company’s efforts in hiring and supporting U.S. military veterans.
ESG Oversight
Management and Other Supporting Roles
American Water has developed a cross-functional approach for developing and implementing its ESG strategy, principles and reporting. The function involves the direct involvement and participation by many of its business units, including without limitation, its executive leadership team, as well as environmental, health and safety, human resources, legal, finance, accounting and investor relations teams (which includes the Company’s ESG reporting function).
Board of Directors Oversight
The Board of Directors oversees the Company’s strategy and performance related to sustainability through four standing committees:
•The Safety, Environmental, Technology and Operations Committee has oversight and responsibility with respect to, among other things: water quality and emerging contaminants; operational matters and functions; environmental and climate-related matters; and physical security and cybersecurity.
•The Audit, Finance and Risk Committee has oversight and responsibility of, among other things: the Company’s risk assessment and enterprise risk management; the Company’s financial statements and accounting; the independent auditor; internal audit and controls; and ethics and compliance matters.
•The Executive Development and Compensation Committee oversees, among other things: the Company’s human capital management and ID&E programs; culture and related engagement with employees; and executive development, succession and compensation.
•The Nominating/Corporate Governance Committee has oversight and responsibility with respect to, among other things: corporate governance; Board and committee membership, leadership and composition; director nominations and succession; and director education.
Alignment with Annual Performance Plan
•The Company’s Annual Performance Plan (“APP”), which provides annual, performance-based cash compensation to Company employees based upon the achievement of stated business goals, is aligned with its commitment to ESG principles. Performance measures and other mandatory training requirements related to the 2023 APP included the following:
•Environmental: Drinking Water Quality and Program Compliance;
•Social: Customer Satisfaction, Employee Safety and Employee Diversity; and
•Governance: The Company requires annual completion of Code of Ethics training for an employee to be eligible to receive an APP payout.
Reporting, Disclosures and Transparency
•In 2019,2023, the Company issued its fifth biennialseventh Sustainability Report covering its sustainability performance for calendar years 2018 and 2017. This report can be accessed on the Company’s website at https://amwater.com. In 2020, the Company completed a goal setting process resulting in the establishment of two new ESG goals and the clarification of its existing energy and emissions goal. The Company’s sustainability practices have supported its inclusion in the Euronext Vigeo® U.S. 50 index, FTSE4Good index series, the 2020 Constituent MSCI ESG Leaders Indexes and the 2021 Bloomberg Gender-Equality Index. Moreover, the Company achieved a ranking of ninth on the Corporate Knights’ 2021 Global 100 Most Sustainable Corporations in the World index, among various other recognitions.
The following highlights the Company’s commitment toas well as its ESG policiesData Summary, which covered performance and practices:
Environmental andmanagement of key metrics within the 2022 calendar year. American Water will begin publishing its Sustainability PracticesReport annually in 2024.
•EnergyIn addition, the Company issued its third annual Inclusion, Diversity & Equity (“ID&E”) Report, which describes the Company’s inclusion and Emissionsdiversity strategies, practices, policies and programs. During 2023, the Company also continued to update key ID&E metrics quarterly on its DiversityatAW.com website.
•The Company clarified its existing goal to reduce by more than 40% its greenhouse gas (“GHG”) emissions by 2025, from a 2007 baseline as an absolute measurementAs part of its scope 1 (direct) emissions, and scope 2 (indirect, derived fromcontinued commitment to transparency, the Company’s purchases of energy) emissions.Company provided the following new disclosures:
•The Company lowered its GHGIndependent assurance of Scope 1 and Scope 2 greenhouse gas emissions through December 31, 2019 by approximately 32% since its base year of 2007.
•The Company has designed, constructed, operatedfor 2020, 2021 and maintained its operational assets and facilities2022, in accordance with the International Standard for efficiency in energy and resource use.
•Water Efficiency and Resiliency
•The Company established a water efficiency goal to meet customer needs while saving 15% in water volume delivered per customer by 2035, compared to a 2015 baseline. The Company lowered its water delivery per customer through December 31, 2020 by 4.3% since its base year of 2015.
•The Company has further utilized a uniform water system resiliency metric, the Utility Resilience Index (“URI”), to track enhancements in the Company’s ability to prepare for, respond to, remediate and effectively manage incidents impacting its operations. The Company plans to increase its URI weighted average by 10% by 2030 from a 2020 baseline. The URI is a part of the American Water Works Association’s J-100 voluntary consensus risk and resilience standard and focuses on a utility’s ability to manage incidents affecting its customers, employees and assets, and return to normal operations as quickly as possible.
•Policy Leadership
•Approximately 8% of the Company’s total projected capital investment over the next five years is dedicated to resiliency, accounting for more than $700 million allocated to renewing and improving assets of the Regulated Businesses through a long-term asset management perspective.
•The Company supports a team of R&D scientists dedicated to partnering with water research organizations on water quality and technology-based source water monitoring.
•The Company collaborates and partners with federal and state agencies to support effective environmental, health and safety and water quality standards and regulations.
Social Responsibility
•People
•During 2020, over 100,000 hours of safety training were completed by the Company’s employees.
•The Company has made significant progress toward its zero injuries goal, reducing workplace injuries by 67% since 2015, and the Company’s 2020 safety performance was the best in its recorded history. Through year end 2020, the Company has further reduced its OSHA recordable injury rate (“ORIR”) to 0.99, approximately 81% better than the water industry average.
•During 2020, approximately 84% of the Company’s job requisitions had a diverse candidate pool, with approximately 59% of transfers or promotions filled by diverse individuals.
•During 2020, the Company established a Chief Inclusion and Diversity Officer position and function.Assurance Engagements ISAE 3000 (Revised);
•CustomersEEO-1 data for 2022, marking the third consecutive reporting year that the Company has shared this information broadly;
•For 2020, the Company achieved a customer satisfaction rating in the top quartile amongA comparison of the Company’s industry peer group.employee racial/ethnic diversity and residential customer diversity; and
•Communities
•More than $6.5 million has been donated over the past 10 years by the Company’s employees through workplace giving campaigns with the United WayA director skills and Water For People.
•In 2020, the American Water Charitable Foundation (the “AWCF”) launched a Giving Back is Beautifully Different campaign to support the Company’s employees in giving back to organizations important to them. The AWCF’s primary focus is to support disaster relief efforts and the Company’s employees in their charitable endeavors, and to fund initiatives related to clean water, conservation, education and community sustainability
•More than $500,000 was donated in 2020 to COVID-19 related relief and recovery efforts through Company-sponsored giving and the AWCF.
Governance
•Board and Committeesdiversity matrix.
•The Board of DirectorsCompany also discloses on its website its Political Contribution Policy, and, each of its standing committees are led byon an independent, non-executive chairperson.
•The Board of Directors met 13 times in 2020.
•The Board of Directors reflects gender, racialannual basis, information related to political contributions, certain payments to tax-exempt organizations and experiential diversity. As of December 31, 2020, the percentage of members on the Board of Directors representing racial or gender diversity was 54.5%.
•The Company’s average director tenure was approximately 6.2 years as of December 31, 2020.
•Demonstratedtrade associations (including Section 501(c)(4) organizations), and Representative Expertise
•The members of the Company’s Board of Directors have demonstrated expertise, including experience in utility and finance operations, customer service, cybersecurity, the military, financial services and capital markets, service as a public company CEO and board member, and management of global operations.lobbying expenditures.
Human Capital Resources
Overview
American Water is committed to supporting a high performing workforce, and the Company seeks to attract and retain employees who share the Company’s purpose and values and represent the communities the Company serves. The Company’s people areCompany demonstrates this commitment to its employees through its employee value proposition, called weCARE, which forms a criticalcentral part of its business, and the Company’s investment in its people begins with recruitment of diverse talent. The Company believes that representing the communities in which it serves playshuman capital resources mission and includes a key role in its ability to serve its customersfocus on deeper connections, personal growth, shared purpose, flexibility and improves its talent. The Company promotes an inclusive culture where its employees are given the opportunity to develop to their fullest potential and understand that they directly contribute to the Company’s ability to operate, grow and serve its customers.well-being. The Company believes that investing time, energy and resources in its workforce helps to generate new ideas, continuously improve operations, and provide high-quality, reliable service for the health, well-beingcustomers and safety of its employeescommunities served.
Employee Health and Safety
Safety has always been a core value at American Water and is a keycritical component of its peoplebusiness strategy. The Company’s ultimate goal is to achieve zero incidents, injuries and culture goals, and that these investments in its people allow employees to generate great ideas, provide quality customer service and make a difference infatalities for the lives of the Company’s customers.
Employee Safety
A longstanding value and strategy of the Company is safety. In this regard, the Company continues to focus on the safety of its employees and contractors, so that they mayall of whom deserve to return home from work in the same, or better, condition than when they arrived. At work, safety includes both physical and emotional well-being. The Company assesses occupationalCompany’s commitment to employee health and safety includes, in addition to measure performance across the entire organization, with the ultimate goal of achieving zero injuries orphysical safety, incidents.both emotional safety and overall wellbeing.
To uphold thissupport the Company’s commitment to safety, the Company’s employees completed over 100,000approximately 157,000 hours of employee safety training, including physical security and cybersecurity training, during 2020. Additionally, through frequent labor-management meetings,2023. To support and enhance the Company’s safety culture, the Company encourages open exchanges to explore new ways to further enhance safetyalso collaborates on the job. All employeeslocal, regional, and national levels with its labor union partners. Employees are empowered to supportdemonstrate safety leadership by takingutilizing a number of safety practices embedded in the time they need to complete a task safelyCompany’s culture, such as the use of (i) daily and to usepre-meeting safety messages, (ii) “Stop Work Authority” — the(the power to stop working immediately and mitigate a hazard whenever they believean employee believes a task is unsafe —unsafe), and (iii) a peer-to-peer program in which employees observe and coach each other to addressencourage safe work. For 2023, the hazard or issue with management. This authority is stated on the backCompany had an ORIR injury rate of every employee’s identification badge.
For 2020, while0.86, which reflects a 4% increase in injuries compared to 2022, taking into account a 1% increase in labor hours compared to 2022. Also, the number of injuries for purposes of the Company’s Days Away Restricted or Transferred (“DART“DART”) rateinjuries increased by 5%43.5% compared to 2019,2022, primarily due to an increase in strain, sprain and tear injuries, which the Company has focused on addressing through safety action plans tailored to these types of injuries. For 2023, the Company had its lowest ORIR injury rate in its recorded history, achieving a 16% reduction compared to 2019. In 2020, the Company also experienced a 2.6% decrease in labor hours compared to 2019. For 2020, the Company’s ORIR was 0.99 (63 injuries)54 injuries and its DART rate was 0.63 (400.52 (33 injuries), compared to an ORIR of 0.85 (52 injuries) and a DART rate of 0.570.37 (23 injuries) in 2019.2022.
In 2020, American Water teams led by promotingThe Company continued its focus in 2023, to promote leading indicator safety indicator activities, including pre-job safety briefings and near missnear-miss reporting, and by achievingsupporting the achievement of internal Certified Safe Worker designations. Near missNear-miss reports, where employees report potential hazards or incidents in a safe and secure manner, increased by 51%32% in 20202023 over 2019,2022, and 99%98% of near missnear-miss incident corrective actions were completed, with nearly 97% completed within 30 days, meeting the Company’s 2020 goal.days. The Company utilizes near missnear-miss reporting and timely corrective actions as leading indicatorskey measurements of measuring employee engagement and safety performance.
Supporting Employees DuringThis commitment to safety also includes building a culture of well-being where all employees can feel emotionally safe and live a healthy lifestyle. Through well-being education, the COVID-19 PandemicCompany is able to encourage employees to take preventative actions and increase participation in annual well-care exams and cancer screenings. In 2023, the Company introduced an enhanced wellness program platform to increase overall engagement and to leverage the use of mobile technologies. As a result, 34% of enrolled employees reached the highest participation level in the wellness program (compared to 19% in 2022). In addition, the mobile-ready platform presented an opportunity to engage more front-line employees in a user-friendly way.
DuringInclusion, Diversity and Equity
The Company believes that employees are at their best when they can bring their full selves to work every day. This belief is the COVID-19 pandemic, American Water has remained committed tocentral component of the health, well-being,Company’s “Beautifully Different” philosophy, which recognizes, embraces and safetycelebrates the uniqueness of its employees, as well as their families, and its customers and communities. The Company did not lay off any employees due to the pandemic. Also, American Water provided temporary medical and emotional health benefits, including paid time off and emergency leave.employees. The Company also supportedbelieves that having employees with different ideas, viewpoints, experiences and their families duringbackgrounds improves its ability to serve a diverse customer base. To this end, the uncertaintyCompany is committed to seeking and promoting diversity among its workforce, executive and senior management leadership teams, to align the diversity of the pandemic by providing additional resources, such as enhanced well-being support, workplace flexibility, back-up child/elder care, sitter database discounts and academic support.Company’s workforce with the diversity of the communities in which it serves.
As an essential business that must continue to provide water and wastewater services during the COVID-19 pandemic, the Company focused on the care and safetypart of its employees, contractors, vendors and others who work at or visit the Company’s worksites. Furthermore,APP, the Company has supported employee healthincluded diversity goals intended to increase the representation of women in, and safety by instituting work-from-home guidelines for all non-essential employees, providing safety trainingthe ethnic and resources, pausing most work-related travel that required air, train or overnight stays, implementing social distancing, requiringracial diversity of, the useCompany’s workforce. The goals measure the percentage of face coverings at work,females and encouraging good hygiene and frequent hand-washing and cleaning of work areas. racial/ethnic diversity among the Company’s workforce based on voluntary self-identification.
The Company also provided essential employeesmaintains its DiversityatAW.com website to provide transparency and locations with appropriate personal protective equipmentcommunicate progress on the Company’s initiatives. This website currently includes, among other information, American Water’s overall strategic approach to ID&E, the Company’s ID&E report, its EEO-1 data, key employee diversity metrics (which are updated quarterly), and cleaning supplies, as well as additional COVID-19 guidance for employees entering customer homesa discussion of the Company’s pay equity study and businesses.internal labor market analysis.
InclusionDuring 2023, the Company continued to focus on creating a culture that respects and Diversity
The Company promotes an environment wheresupports inclusion, diversity and diversity are embedded in its culture.equity. At all levels, the Company strives to understand, respect, value and provide equal opportunity to each employee. The Company seeksemployee, and to foster an environment where employees’ differences are embraced and celebrated. The Company holds as an essential concept the right of employees to proudly share their ideas and unique perspectives in an environment built on mutual respect, equity and inclusion. The Company is committed to diversity among its workforce, including its executive and senior management leadership teams, by reflecting the diversity of the communities in which the Company serves. The Company expects all of its leaders to lead with inclusion, diversity and diversity.equity.
The following graphic highlights the Company’s principal employee inclusion and diversity metrics for 2020, which for each metric was based on responses from employees who voluntarily self-reported this information to the Company.
As reflected above, diversity inDuring 2023, 85.0% of the Company’s hiring candidate pools were diverse. Additionally, for 2023, approximately 48.2% of the Company’s internal employee transfers and promotions were filled with a diverse individual, reflecting the Company’s commitment to employee development and career growth as well as the Company’s focus on workforce inclusion, diversity and equity. For purposes of these metrics, diversity refers only to gender, minority,race, ethnicity, disability, or veteran/military spouse status, and LGBTQ+ status, all based on voluntary, self-identified employee information.
The Company maintains active membershipspartnerships with groups such as Hiring our Heroes, Military Spouse Employment Partnership, American Corporate Partners, (ACP), CEO Action for Diversity and Inclusion, Disability:IN, Paradigm for Parity, and Out and Equal, to further enhance its ability to recruit and retain diverse employees. Among this year’sits recognitions, the Company was namedhonored as a 2020 Noteworthy Company by DiversityInc, a leading2023 VETS Indexes 3-Star Employer and earned the 2024 Military Friendly® Gold Employer designation for the Company’s efforts in hiring and supporting U.S. ranker of companies by diversity, equitymilitary veterans. American Water was also recognized as the first utility to receive the Friendly Forces 5 STAR Reservist Friendly Employer award, the highest employer rating for Guard service personnel and inclusion. reservists.
The Company was also a top scorer onin the 20202023 Disability Equality Index for the fifth consecutive year and was recognized by U.S. Veterans Magazine50/50 Women on Boards™ for a gender-balanced board of directors, Fortune’s Modern Board 25 Ranking, as well as a veteran-friendly companyChampion of Board Diversity with distinction by the Forum of Executive Women. The Company was also named a 2023 Best of the Decade honoree by Minority Business News USA and as an organization with a veteran-friendly supplier diversity program.
Women’s Enterprise USA, and the Company was included in the 2023 Impact Shares NAACP Minority Empowerment ETF. In keeping with the Company’s values, the Company does not toleratehas a stated “zero-tolerance” approach against discrimination, harassment or retaliation by or toward any employee, vendor, customer or other person in its workplace. All employees are required to complete anti-harassment, workplace respect and dignity, unconscious bias and inclusion and diversity training. In addition, annual Code of Ethics training is provided to all employees, which includes educationinstructions on using the Company’s anonymous hotline for reporting potential Code of Ethics violations.
To assist these efforts, the Company has established an InclusionThe Company’s five Employee Business Resource Groups (“EBRGs”), which represent diverse employee demographics (Women, African American/Black, LGBTQ+, and Diversity Advisory Council, which oversees the formation of employee business resource groupsDisabilities/Caregivers, with Military added in 2023), strive to support the Company’s inclusioncreate measurable and diversity efforts. In 2019, the Company’s Inclusion and Diversity Advisory Council launched the Inclusion and Diversity Champions Network, where employees serve as liaisons with other local workforces. Furthermore, in October 2020, the Company named its first Chief Inclusion Officer,long-lasting positive impacts on employees’ careers, as well as its first Director, Inclusion and Diversity, reflecting the Company’s views onculture and communities in which it serves. EBRG members participate in events and awareness activities throughout the year, which highlight the importance of building an inclusive and equitable culture. For example, employees may participate in monthly meetings with a focus on various related topics, including career development, psychological safety, cultural awareness or business objectives. EBRG members also have the opportunity to impact the communities in which the Company serves through service projects, including the annual Juneteenth Unity Walk that supported the National Alliance on Mental Illness, an organization that provides advocacy, education, and support for, and public awareness of, mental illness, and projects supported by a partnership with Girl Scout troops to promote environmental stewardship and the importance of careers in science, technology, engineering and mathematics, among others.
Total Rewards
In order to attract, retain and motivate a skilled, high-performing and diverse workforce, American Water provides a comprehensive and highly competitive Total Rewards program, including base pay, APP, long-term performance plan compensation for certain leadership positions, and a wide range of benefits consisting of, among others: medical, prescription, dental, vision, life and disability insurance coverage, a retirement savings plan, an employee stock purchase plan, educational assistance, paid time off through holidays and vacation and sick time. The Company’s Total Rewards offerings also include a health and wellness program and a menu of additional voluntary benefits.
All the Company’s employees, including those who are union-represented, participate in the APP to promote alignment between performance-based compensation and the achievement of the Company’s short-term performance goals. In addition, as part of its commitment to providing an inclusive and equitable culture for all employees, the Company regularly reviews its success in achieving pay equity, whereby pay decisions would be based on the responsibilities, talents and skills of its employees, rather than unrelated factors such as gender, race or ethnicity.
All employees who average 30 hours or more per week are eligible for full-time benefits. Approximately 89% of all benefit eligible employees are enrolled in the Company’s healthcare benefits. Full-time employees pay approximately 16% of the total premium cost of medical, dental and vision coverage. To reinforce the Company’s commitment to inclusion, diversity and diversity.equity, the Company’s medical benefits include coverage for applied behavior analysis, autism treatment, transgender services and hearing aids, as well as a fertility assistance benefit. In addition, in 2023, the Company increased its paid family leave benefit for employees from two weeks to six weeks.
Talent Development
The Company provides learning opportunities and work experiencespartners with business leaders to equip its employees withunderstand the tools, skills,key behaviors and competencies they needrequired to operate safely and effectively, and to grow professionally. To this end,meet our short and long-term business objectives. The Company applied its workforce planning process in 2023, to assess key positions across the organization, identify potential talent risks, and begin building action plans to mitigate those risks. In addition, the Company has established a Talent Management Center of Expertiseworked to help developcreate and deploy programs that are designed to attract, motivate, develop and retain talented employees, and foster a learning culture. TheIn 2023, the Company requires everyenhanced its employee including its union-representedlearning goal, which provided an opportunity for employees to complete a minimum of 2025 hours of training each year. Alllearning through a variety of methods, including: on-the-job experiences and challenges; teaching others; and traditional instructor-led or remote learning opportunities. The Company believes that personal growth is a valuable component of weCARE and is committed to supporting strategies to help its employees develop both personally and professionally. Approximately 95% of active, full-time employees hired before October 1, 20202023, met this requirement for 2020, with over 350,000the employee learning goal, resulting in approximately 328,000 hours of total training completed during the year, including approximately 100,000 hours of safety training. year.
In addition to required role-based training, managers assist employees to identify professional development opportunities, utilizing a framework of on-the-job learning, social learning and formal learning, to help them attempt to reach their full potential and grow their careers. Additionally, in 2020, approximately 59% ofTo further support employees’ growth and development, during 2023, the Company’s internalCompany expanded the employee transfersprofile fields within its employee information system to allow employees to showcase their achievements, contributions and promotions were diverse (defined as female, minority, disability, military, military spouse, and LGBTQ+ status, based on employee self-identification), which reflects the Company’s commitment to employee development and career growthaspirations, as well as the Company’s focus on inclusionto support identification of developing and reflecting the communities in which the Company operates.key talent.
Developing talent and ensuringto provide a pipelinepathway to executive leadership is a critical priority for the Company. During 2020,2023, the Company engaged in succession planning activities for the Company’s critical positionsbusiness-critical and executive leaders.business-impact positions. These succession plans seek tosupport the Company’s business continuity plans and goals, through the identification and development of current and future leaders, and promote diversity, as well as retention and talent development priorities.
In addition to succession planning for executive and senior leadership roles, in 2023, the Company conducted local and enterprise-wide talent reviews, identifying top and emerging talent with a focus on diversity, strengths, gaps and development needs against the critical skills needed for certain roles. Through these talent review processes, business leaders identified a pool of high-potential employees, which will assist the Company in providing continuedsupporting their career goals and aspirations and promote more effective employee experience and talent retention efforts. The Company also utilizes annual six-month mentoring programs designed to accelerate emerging leaders’ abilities to demonstrate leadership capabilities and relationships, with the guidance of an experienced executive mentor. Finally, in 2023, the Company, together with an outside vendor, initiated a new pilot program, called Accelerate for Impact, to support development of its high-potential employees’ key competencies. Accelerate for Impact provides select high-potential employees the growthopportunity to engage in social learning activities and futureto complete self-directed, online coursework that culminates with a capstone project.
Employee Experience
The Company has established its weCARE employee value proposition that focuses on employee experience as an influencer of an employee’s opinions and emotional response about the Company as an employer. weCARE is composed of five elements: deeper connections; personal growth; shared purpose; flexibility; and well-being. weCARE represents the Company’s commitment to valuing its employees and building a safe, healthy and inclusive culture where employees know their value and are appreciated for their talents and commitment to supporting the Company’s success. The Company offers employee programs covering each of the five components of weCARE. The Company is committed to improving the employee experience by listening to employees through focus group discussions and employee surveys, among other tools. To that end, the Company captures employee feedback, which helps the Company understand how employees are feeling and permits appropriate refinement of the Company’s business.employee programs, benefits and support. In early 2023, the Company administered an evolved engagement survey, seeking to capture a view of the Company’s employee experience, pursuant to which the Company received actionable feedback on each of these weCARE elements.
Workforce Data
As of December 31, 2020,2023, the Company had approximately 7,0006,500 employees. For 2020,2023, the Company’s employee turnover rate, which the Company defines as the ratio of the number of separated employees to the 12-month average headcount during the year to all active employees as of December 31, 2020,2023, was 7.4%11.5%, down from 9.7%12.3% in 2019.2022. American Water continuesseeks to seek to reduce regrettable employee turnover by establishing an inclusive culture, developingassessing the effectiveness of weCARE and through its employees, and providing competitive compensation and benefits.efforts to foster the Company’s employee experience.
As of December 31, 2020,2023, approximately 45%47% of the Company’s workforce was represented by unions, which include 72under 73 collective bargaining agreements with 14 different unions. Additionally, as of December 31, 2020,In 2023, the Company is in the initial stages of negotiating five newrenegotiated 21 collective bargaining agreements which would cover approximately 400 employees.that were set to expire during the year. During 2021, 172024, 21 of the Company’s collective bargaining agreements will be expiringexpire in accordance with their terms and the Company expects to be able to negotiate these agreements during the courseyear. In addition, the Company’s national benefits agreement, which expires on July 31, 2028, covers approximately 3,000 of the year.Company’s union-represented employees and their families and provides them with healthcare and other benefits. The Company also collaborates with union leadership on topics such as safety, customer, technology and employee benefits in forums such as the Joint Healthcare Committee, National Labor Management Committee and the annual Labor Management Conference. In 2023, the Company initiated a joint effort with certain of these labor unions and the Federal Mediation and Conciliation Service to host local discussions among management and union leaders with the goal of supporting and enhancing constructive relationships with these unions.
Board Oversight
The Executive Development and Compensation Committee (“ED&CC”) of the Board of Directors establishes and reviews the Company’s overall compensation philosophy and oversees the compensation and benefits plans and programs for its executive officers. The ED&CC oversees the process of planning for executive officer succession. It also provides oversight of the Company’s inclusion, diversity and equity programs and initiatives. Further, the ED&CC is responsible for reviewing and assessing, at least annually, the Company’s culture and related culture engagement, its organizational and leadership development plans and programs, and its programs designed to identify, attract and retain high-potential employees.
Information About Our Executive Officers
Presented in the table below are the name, age, offices held and business experience for each of the Company’s executive officers, as of February 24, 2021:
| | | | | | | | | | | | | | |
| Name | | Age | | Office and Experience |
Walter J. LynchM. Susan Hardwick | | 5861 | | President and Chief Executive Officer. Mr. Lynch has over 20 years of experience in the water and wastewater industry. Mr. LynchMs. Hardwick has served as President and Chief Executive Officer of the Company and a director since April 1, 2020. Mr. Lynch served as Executive Vice President and Chief Operating Officer of the Company from January 2016 to March 31, 2020, and as the Company’s President and Chief Operating Officer, Regulated Operations from February 2010 through December 2015. Prior to that, Mr. Lynch served as President of Regulated Operations from July 2008 to February 2010. Mr. Lynch2, 2022. She joined the Company in 2001. Mr. Lynch is a member of the Board of Directors of the National Association of Water Companies and serves as a member of its Executive Committee. |
Maureen Duffy | | 51 | | Senior Vice President, Communications and External Affairs. Ms. Duffy has served as Senior Vice President, Communications and External Affairs since January 1, 2020 and has been an executive officer of the Company since June 1, 2020. Prior to that, Ms. Duffy served as Vice President, Corporate Communications and Federal Affairs from May 2017 to December 31, 2019 and Vice President, Corporate Communications and External Affairs from September 2011 to May 2017. From July 2006 to September 2011, Ms. Duffy held various positions of increasing responsibility in the Company’s internal and external corporate communications function. From November 1999 to July 2006, she held various positions with the Company’s New Jersey subsidiary, including Government Affairs/Media Specialist, Communications Manager and Director of Corporate Communications. Prior to joining American Water, Ms. Duffy reported and produced news for WNJN/WNET-TV.
|
M. Susan Hardwick | | 58 | | Executive Vice President and Chief Financial Officer. Ms. Hardwick joined the Company on June 3, 2019 as itsthe Company's Executive Vice President—Finance and became its Executive Vice President andserved as the Company's Chief Financial Officer onfrom July 1, 2019.2019 until May 16, 2022. From December 7, 2021 until January 31, 2022, Ms. Hardwick previouslyalso served as Interim Chief Executive Officer. Prior to joining the Company, Ms. Hardwick served as the Executive Vice President and Chief Financial Officer of Vectren Corporation, which was sold to CenterPoint Energy, Inc., an electric and natural gas utility, on February 1, 2019. Ms. Hardwick joined Vectren Corporation in January 2000 and served in a variety of positions, including: Vice President, Controller and Assistant Treasurer; Senior Vice President, Finance; Senior Vice President, Chief Financial Officer; and Executive Vice President and Chief Financial Officer. Prior to joining Vectren, Ms. Hardwick was Assistant Corporate Comptroller at Cinergy Corp. She began her career with Arthur Andersen & Co., leaving there as a senior manager to join Cinergy Corp. Ms. Hardwick is a Certified Public Accountant. On August 13,Since September 2020, Ms. Hardwick was elected tohas served on the Board of Directors of New Jersey Resources Corporation, a diversified energy services company, where she is currently serving a three-year term expiring in 2024, and since January 1, 2021, servesshe has served as a member of its Audit Committee. Ms. Hardwick is also a member of the Board of Directors of the National Association of Water Companies and serves on its Executive Committee.
|
Bruce A. HaukJames H. Gallegos | | 5063 | | Executive Vice President Regulated Operations and Military Services Group.General Counsel. Mr. Hauk hasGallegos joined the Company on April 1, 2022 as its Executive Vice President and General Counsel. From February 2020 until April 2022, Mr. Gallegos served as the Company’sExecutive Vice President, Regulated OperationsGeneral Counsel and Military Services Group since March 1, 2020. Mr. Hauk served as the PresidentCorporate Secretary of the Company’s Illinois subsidiary from JanuaryAlliant Energy Corporation, a regulated, investor-owned public utility holding company, and its two utility subsidiaries (collectively, “Alliant Energy”). From February 2015 to JanuaryFebruary 2020, andMr. Gallegos served as Senior Vice President, Midwest Division from May 2018 until March 1, 2020.General Counsel and Corporate Secretary of Alliant Energy. Prior to that, heMr. Gallegos served in various positions with U S WEST, Inc., which merged with Qwest Communications International Inc. in 2000. |
| | | | | | | | | | | | | | |
| Name | | Age | | Office and Experience |
| John C. Griffith | | 57 | | Executive Vice President and Chief Financial Officer. Mr. Griffith joined the Company on May 16, 2022 as its Executive Vice President and Chief Financial Officer. Prior to joining the Company, since 2014, Mr. Griffith served as Managing Director, Mergers and Acquisitions, for Bank of America Securities’ Global Regulated Utilities and Renewable Energy practice. Prior to joining Bank of America Securities, from 2008 to 2014, Mr. Griffith served as the Company’s Vice President, Financial AnalysisChief Executive Officer of HighWave Energy, a renewable fuels start-up company, and Decisional Support from February 20141995 to January 2015 and as Vice President, Operations2008, he served in various capacities of the Company’s Indiana subsidiary from January 2011 to February 2014. Mr. Hauk has been appointed to serve as the Company's Deputy Chief Operating Officer, effective March 1, 2021.increasing responsibility with Merrill Lynch & Co. |
| Melanie M. Kennedy | | 4750 | | SeniorExecutive Vice President, Chief Human Resources Officer. Ms. Kennedy was appointedhas served as the Company’s Executive Vice President, Chief Human Resources Officer since December 2021, and as Senior Vice President, Chief Human Resources Officer effectivefrom December 10, 2020. Previously, Ms. Kennedy had2020 to December 2021. Prior to that, she served as the Company’s Senior Vice President, Human Resources sincefrom March 2017.2017 to December 2020. From August 2014 through February 2017, Ms. Kennedy served as the Company's Vice President, Human Resources, of the Company, and from August 2012 to August 2014, she served as Director, Human Resources in the Company’s Northeast Division. Ms. Kennedy initially joined the Company in 2007, and before that time, she practiced law for nine years.
|
Kevin B. KirwanCheryl Norton | | 6259 | | Senior Vice President, Chief Operational Excellence and Safety Officer. Mr. Kirwan was appointed as the Company’s Senior Vice President, Chief Operational Excellence and Safety Officer, effective March 1, 2020. Prior to that, Mr. Kirwan served as the Company’s Senior Vice President, Chief Environmental and Operational Excellence Officer since February 2019. From November 2017 to February 2019, he served as the Company’s Vice President of Operational Excellence. From July 2016 to November 2017, he served as Vice President, Operations for the Company’s New Jersey subsidiary, and prior to that, he held the role of Senior Director, Operations for the subsidiary’s Coastal Region. Mr. Kirwan initially joined the Company in 1985.
|
| | | | | | | | | | | | | | |
Name | | Age | | Office and Experience |
James S. Merante | | 46 | | Vice President and Treasurer. Mr. Merante was appointed as the Company’s Vice President and Treasurer in February 2019. Prior to that, Mr. Merante was Vice President, Internal Audit from February 2018 to February 2019, and served as Divisional Chief Financial Officer for the Company’s Mid-Atlantic Division from July 2014 until February 2018. Mr. Merante is licensed as Certified Public Accountant in Pennsylvania.
|
Adam Noble | | 55 | | Chief Technology and Innovation Officer. Mr. Noble joined the Company effective August 31, 2020 as its Chief Technology and Innovation Officer. Prior to joining the Company, Mr. Noble served as SeniorExecutive Vice President and Chief Information Officer of Veritiv Corporation, a North American business-to-business distributor of packaging and facility solutions, since June 2019. Previously, Mr. Noble served as Senior Vice President and Global Chief Information Officer at GAF Materials Corporation, a global manufacturing company, from May 2010 to March 2019, and as its Vice President and Chief Information Officer from May 2006 to April 2010. Mr. Noble has over 30 years of collective experience in the information technology sector.
|
Cheryl Norton | | 56 | | Senior Vice President, Chief Environmental Officer, and Senior Vice President, Eastern Division.Operating Officer. Ms. Norton has over 3035 years of employment with the Company serving in various roles, including operational leadership, environmental stewardship, laboratory management and research. She has servedbeen serving as the Company’s Executive Vice President and Chief Operating Officer since March 2021 and served as its Senior Vice President, Chief Environmental Officer sincefrom March 1, 2020.2020 to March 2021. She was also appointed as the Company’s Senior Vice President, Eastern Division and President of its New Jersey subsidiary infrom March 2019 and continues to serve in these roles.March 2021. Prior to that, Ms. Norton served as President of the Company’s Missouri subsidiary from November 2015 to March 2019, and President of its Kentucky subsidiary from January 2011 until November 2015. In addition, Ms. Norton also serves as a member of the Board of Directors of the Water Research Foundation. Ms. Norton has been appointed to serve as the Company's Executive Vice President and Chief Operating Officer, effective March 1, 2021.
|
Michael A. Sgro | | 62 | | Executive Vice President and General Counsel. Mr. Sgro has over 25 years of experience in the water and wastewater industry. He has served as the Company’s Executive Vice President and General Counsel since January 2016 and as its Secretary from January 2015 to February 17, 2021. He served as the Company’s Senior Vice President and General Counsel from February 2015 until January 2016, as its Interim General Counsel from January 2015 until February 2015, and as Vice President, General Counsel and Secretary of the Company’s Northeast Division from 2002 to 2015.
|
William Varley | | 63 | | Chief Growth Officer. Mr. Varley was appointed as the Company’s Chief Growth Officer and an executive officer effective June 1, 2020. Following a brief retirement from the Company in April 2019 after approximately 19 years of employment, Mr. Varley served as a consultant to the Company’s New York subsidiary for approximately three months beginning in March 2020. Prior to that, Mr. Varley held the Deputy Chief Operating Officer role from April 2018 until April 2019, where he developed and mentored the Company’s divisional leads and state presidents and led the customer service organization. Prior to that, from February 2017 to April 2018, Mr. Varley served as Senior Vice President of the Company’s Midwest Division. From January 2014 to February 2017, Mr. Varley served as Senior Vice President of the Company’s Northeast Division and President of its New Jersey subsidiary. Mr. Varley had also been President of the Company’s New York subsidiary, a position he held from 2007 until his transition to the Northeast Division.
|
Melissa K. Wikle | | 55 | | Vice President and Controller. Ms. Wikle joined the Company in July 2016 as its Vice President and Controller, and assumed the duties of the Company’s principal accounting officer in August 2016. Prior to joining the Company, Ms. Wikle served as Corporate Controller and Chief Accounting Officer of Columbus McKinnon Corporation, a publicly-traded worldwide designer, manufacturer and marketer of material handling products, systems and services, since April 2011. Ms. Wikle is a Certified Public Accountant.
|
Each executive officer is elected annually by the Board of Directors and serves until his or hertheir respective successor has been elected and qualified or his or hertheir earlier death, resignation or removal.
Available Information
The Company is subject to the reporting requirements of the Exchange Act. The Company files or furnishes annual, quarterly and current reports, proxy statements and other information with the SEC. Readers may obtain a copy of the Company’s annual reportsAnnual Reports on Form 10-K, its quarterly reportsQuarterly Reports on Form 10-Q or its current reportsCurrent Reports on Form 8-K, or any amendments to them, that are filed with or furnished to the SEC, free of charge, from the Company’s Investor Relations section of the Company’s website, https://ir.amwater.com, as soon as reasonably practicable after the Company files or furnishes the information to the SEC.
The Company maintains a website at https://amwater.com. Information contained on the Company’s website and its Investor Relations website, including its Sustainability Report, its Inclusion, Diversity & Equity Annual Report, and other reports or documents, and the information and data on the Company’s diversity website, https://Diversityataw.com, shall not be deemed incorporated into, or to be a part of, this report, and any website references included herein are not intended to be made through active hyperlinks. The Company recognizes its websitewebsites as a key channelchannels of distribution to reach public investors and as a means of disclosing information to comply with SEC Regulation FD.
The American Water corporate governance guidelinesCorporate Governance Guidelines and the charters for each of the standing committees of the Board of Directors, together with the American Water Code of Ethics and additional information regarding the Company’s corporate governance, are available on itsthe Company’s Investor Relations websitehttps://ir.amwater.com,, and will be made available, without charge, in print to any shareholder who requests such documents from itsthe Company’s Investor Relations Department in writing by mail at American Water Works Company, Inc., 1 Water Street, Camden, NJ, 08102.
ITEM 1A. RISK FACTORS
We operate in a market and regulatory environment that involves significant risks, many of which are beyond our control. In addition to the other information included or incorporated by reference in this Annual Report on Form 10-K, the following material factors should be considered in evaluating our business and future prospects. Any of the following risks, either alone or taken together, could materially and adversely affect our business, financial position, results of operations, cash flows and liquidity.
Risks Related to Our Industry and Business Operations
Our utility operationsRegulated Businesses are subject to extensive regulation by state PUCs and other regulatory agencies, which significantly affects our business, financial condition, results of operations and cash flows. Our utility operationsRegulated Businesses also may be subject to fines, penalties and other sanctions for an inability to meet these regulatory requirements.
Our Regulated Businesses provide water and wastewater services to our customers through subsidiaries that are subject to regulation by state PUCs. This regulation affects the rates we charge our customers and has a significant impact on our business and operations. Generally, the state PUCs authorize us to charge rates that they determine are sufficient to recover our prudently incurred operating expenses, including, but not limited to, operating and maintenance costs, depreciation, financing costs and taxes, and provide us with the opportunity to earn an appropriate rate of return on invested capital.
Our ability to successfully implement our business plan and strategy depends on the rates authorized by the various state PUCs. We periodically file rate increase applications with state PUCs. The ensuing administrative process may be lengthy and costly. Our rate increase requests may or may not be approved, or may be partially approved, and any approval may not occur in a timely manner. Moreover, a PUC may not approve a rate request toin an extentamount that is sufficient to:
•coverrecover our expenses, includingcost of operations, including: purchased waterwater; chemicals; and costs of chemicals, fuel, power and other commodities used in our operations;
•recover our operational labor and labor-related expenses, including without limitation costs and expenses associated with our pension and other post-employment benefits;
•enable us to recover our investment; and
•provide us with an opportunity to earn an appropriate rate of return on our investment.
Approval ofby the PUCs is also required in connection with other aspects of our utilities’ operations. Some state PUCsRegulated Businesses, which are empowered to impose financial penalties, fines and other sanctions for non-compliance with applicable rules and regulations. Our utilities are also required to have numerous permits, approvals and certificates from the PUCs that regulate their businesses and authorize acquisitions, dispositions, debt and/or equity financing, and, in certain cases, affiliated transactions. Some state PUCs are empowered to impose financial penalties, fines and other sanctions for non-compliance with applicable rules and regulations. Although we believe that each utility subsidiary has obtained or sought renewal of the material permits, approvals and certificates necessary for its existing operations, we are unable to predict the impact that future regulatory activities may have on our business.
The current COVID-19 pandemic may limit or curtail significantly or entirely the ability of PUCs to approve or authorize applications and other requests we may make with respect to our Regulated Businesses, including without limitation any or all types of approvals described above, as PUCs and their staffs seek to reduce, delay or streamline proceedings and other activities. PUCs and other governmental authorities have taken, and may continue to take, emergency or other actions in light of the COVID-19 pandemic that may impact us, including prohibiting the termination of service for non-payment during the current COVID-19 pandemic and extending or delaying procedural schedules in our regulatory proceedings. At this time, we are unable to predict the range of impacts that the COVID-19 pandemic and other related events may have on our ability to obtain these approvals as needed or requested by the Regulated Businesses in the ordinary course or at all, or the nature of any further emergency or other action that may be taken by the PUCs or other governmental authorities.
In any of these cases, our business, financial condition, results of operations, cash flows and liquidity may be adversely affected. Even if the rates approved are sufficient, we face the risk that we will not achieve the rates of return on our invested capital to the extentequity permitted by state PUCs. This could occur if certain conditions exist, including, but not limited to, (i) water usage is less than the level anticipated in establishing rates, (ii) customers increase their conservation efforts, or(iii) we experience negative impactsunusual or emergent situations, events or conditions, (iv) we experience a significant increase in customers without recovery of the COVID-19 pandemic,operating and other costs associated with serving them, or ifa decrease in customers that causes a decrease in operating revenue, or (v) our investments or expenses prove to be higher than the levels estimated in establishing rates. It may be difficult to predict the outcome or impact of these events on us or the actions that may be taken by the PUCs or other governmental authorities in response thereto.
Our operations and the quality of water we supply are subject to extensive and increasingly stringent environmental, water quality and health and safety laws and regulations, including with respect to contaminants of emerging concern, compliance with which could impact both our operating costs and capital expenditures, and violations of which could subject us to substantial liabilities and costs, as well as damage to our reputation.
Our regulated water and wastewater operations and the operations of our Market-Based Businesses are subject to extensive federal, state and local laws and regulations. These requirements include, among others, CERCLA, the Clean Water Act, the Safe Drinking Water Act, the LCR (as amended), and each of their implementing rules and regulations, as well as other federal and state requirements. For example, state PUCs and environmental regulators set conditions and standards for the water and wastewater services we deliver. If we deliverthe water or wastewater services we provide to our customers
that do not comply with regulatory standards, or otherwise violate environmental laws, regulations or permits, or other health and safety and water quality regulations, we could incur substantial fines, penalties or other sanctions or costs, as well as damage to our reputation. In the most serious cases, regulators could reduce requested rate increases or force us to discontinue operations and sell our operating assets to another utility or to a municipality. Given the nature of our business which, in part, involves
providing water service for human consumption, any potential non-compliance with, or violation of, environmental, water quality and health and safety laws or regulations would likely pose a more significant risk to us than to a company not similarly involved in the water and wastewater industry.
In addition, CERCLA authorizes the EPA to issue orders and bring enforcement actions to compel responsible parties to investigate and take remedial actions with respect to actual or threatened releases of hazardous substances, and can impose joint and several liability, without regard to fault, on responsible parties for the costs thereof. We are also required to obtain various environmental permits from regulatory agencies for our operations.
We incur substantial operating and capital costs on an ongoing basis to comply with environmental, water quality and health and safety laws and regulations. These laws and regulations and their enforcement, have become more stringent over time, and new or stricter requirements, such as the anticipated EPA drinking water regulations for PFAS, the LCRR and the proposed LCRI, could increase our costs. Although we may seek to recover ongoing compliance costs in our Regulated Businesses through customer rates, there can be no guarantee that the various state PUCs or similar regulatory bodies that govern our Regulated Businesses would approve rate increases that would enable us to recover such costs or that such costs will not materially and adversely affect our financial condition, results of operations, cash flows and liquidity.
We may also incur liabilities if, under environmental laws and regulations, we are required to investigate and clean up environmental contamination, including potential releases of hazardous chemicals, such as gaseous chlorine, which we use to treat water, or at off-site locations where we have disposed of residual waste or caused an adverse environmental impact. The discovery of previously unknown conditions, or the imposition of cleanup obligations in the future, could result in significant costs and could adversely affect our financial condition, results of operations, cash flows and liquidity. Such remediation costs may not be covered by insurance and may make it difficult for us to secure insurance at acceptable rates in the future.
Attention is being given to contaminants of emerging concern, including, without limitation, chemicals and other substances that currently do not have any regulatory standard in drinking water or have been recently created or discovered (including by means of scientific achievements in the analysis and detection of trace amounts of substances). Examples of sources of contaminants include, but are not limited to, newly created chemical compounds (including, for example, manufactured nanomaterials); human and veterinary products; perfluorinated and polyfluorinated compounds;PFAS; bacteria, microbes, viruses, (including the current novel coronavirus), amoebae and other pathogens; and residual by-products of disinfection. We rely upon governmental agencies to set appropriate regulatory standards to protect the public from these and other contaminants, and our role is to provide service that meets these standards, if any. In some of our states, PUCs may disapprove of cost recovery, in whole or in part, for implementation of treatment infrastructure for a contaminant in the absence of a regulatory standard. Furthermore, given the rapid pace at which these contaminants are being created and/or discovered, we may not be able to detect and/or mitigate all such substances in our drinking water system or supplies, which could have a material adverse impact on our financial condition, results of operations and reputation. In addition, we believe these contaminants maywill continue to form the basis for additional or increased federal or state regulatory initiatives and requirements in the future, which could significantly increase the cost of our operations.
Limitations on availability of water supplies or restrictions on our use of water supplies as a resultbecause of government regulation or action may adversely affect our access to sources of water, our ability to supply water to customers or the demand for our water services.
Our ability to meet the existing and future demand of our customers depends on the availability of an adequate supply of water. As a general rule, sources of public water supply, including rivers, lakes, streams, groundwater aquifers and recycled water sources, are held in the public trust and are not generally owned by private interests. As a result, we typically do not own the source water that we use in our operations, and the availability of our water supply is established through allocation rights (determined by legislation or court decisions) and passing-flow requirements set by governmental entities or by entering into water purchase agreements. These requirements, which can change from time to time, and vary by state or region, may adversely impact our water supply. Supply issues, such as drought, overuse of sources of water, the protection of threatened species or habitats, contamination or other factors may limit the availability of ground and surface water. If we are unable to secure available or alternative sources of water, our business, financial condition, results of operations and cash flows could be adversely affected.
For example, in our Monterey County, California operations, we are seeking to augment our sources of water supply, principally to comply with an October 2009the cease and desist orderorders issued by the SWRCB in July 1995 and October 2009 (the “1995 Order,” the “2009 Order”), and, as amended by ain July 2016, order (thethe “2016 Order”), of and, collectively, the SWRCB“Orders”) that requires our California subsidiaryrequire Cal Am to significantly decrease its diversions from the Carmel River in accordance with a reduction schedule that terminatesterminated on December 31, 2021 (the “2021 Deadline”).2021. See Item 3—Legal Proceedings—Alternative Water Supply in Lieu of Carmel River Diversions, which includes additional information regarding this matter. We are
also required to augment our Monterey County sourcesWhile the Company cannot currently predict the likelihood or result of water supplyany adverse outcome associated with these matters, further attempts to comply with the requirements of the Endangered Species Act. We cannot predict whether our California subsidiary will be able to secure alternative sources of water, or if it will be able to meet the 2021 Deadline or the diversion reduction and other remaining requirements under the 2009 Order and the 2016 Order. Failure by our California subsidiary to comply with the 2009 Order and the 2016 Order in whole or in part, or the 2021 Deadline,Orders may result in material additional costs or obligations, including fines and penalties against Cal Am in the event of noncompliance with the Orders, which could have a material adverse effect upon us and our business, results of operations and cash flows.
Service disruptions caused by severe weather conditions, climate variability patterns or natural or other disasters may disrupt our operations or reduce the demand for our water services, which could adversely affect our financial condition, results of operations, cash flows and liquidity.
Service interruptions due to severe weather, climate variability patterns and natural or other events are possible across all our businesses. These include, among other things, storms, freezing conditions, high wind conditions, hurricanes, tornadoes, earthquakes, landslides, drought, wildfires, coastal and intercoastal floods or high water conditions, including those in or near designated flood plains, pandemics (including the COVID-19 pandemic) and epidemics, severe electrical storms, sinkholes, solar flares and solar flares.chemical spills or other contamination causing temporary unavailability of our source water supplies. Weather and other natural events such as these may affect the condition or operability of our facilities, limiting or preventing us from delivering water or wastewater services to our customers, or requiring us to make substantial capital expenditures to repair any damage. Tariffs in place or cost recovery proceedings with respect to our Regulated Businesses may not provide reimbursement to us, in whole or in part, for any of these impacts.
Government restrictions on water use may also result in decreased use of water services, even if our water supplies are sufficient to serve our customers, which may adversely affect our financial condition, results of operations and cash flows. Seasonal and other drought conditions that may impact our water services are possible across all of our service areas. Governmental restrictions imposed in response to a drought may apply to all systems within a region independent of the supply adequacy of any individual system. Responses may range from voluntary to mandatory water use restrictions, rationing restrictions, water conservation regulations, and requirements to minimize water system leaks. While expenses incurred in implementing water conservation and rationing plans may generally be recoverable provided the relevant PUC determines they were reasonable and prudent, we cannot assurebe certain that any such expenses incurred will, in fact, be fully recovered. Moreover, reductions in water consumption, including those resulting from installation of equipment or changed consumer behavior, may persist even after a drought has ended and restrictions are repealed and the drought has ended,lifted, which could adversely affect our business, financial condition, results of operations and cash flows.
Climate variability may cause increased volatility in weather and may impact water usage and related revenue or require additional expenditures, all of which may not be fully recoverable in rates or otherwise.
The issue of climate variability is receiving increasing attention nationally and worldwide. Some scientific experts are predicting aThere is consensus among climate scientists that there will be worsening of weather volatility in the future associated with climate variability. Many climate variability predictions if true, present several potential challenges to water and wastewater utilities, including us, such as:
•increased frequency and duration of droughts;
•increased precipitation and flooding;
•increased frequency and severity of storms and other weather events;
•challenges associated with changes in temperature or increases in ocean levels;
•potential degradation of water quality;
•decreases in available water supply and changes in water usage patterns;
•increases in the number, length and severity of disruptions in service;
•increased costs to repair damaged facilities; or
•increased costs to reduce risks associated with the increasing frequency and severity of natural events, including to improve the resiliency and reliability of our water and wastewater treatment and conveyance facilities and systems.
Because of the uncertainty of weather volatility related to climate variability, we cannot predict its potential impact on our business, financial condition, results of operations, cash flows and liquidity. Furthermore, both Federal and state laws and regulations have been enacted or proposed that seek to reduce or limit GHGgreenhouse gas emissions and require or would require additional reporting, monitoring and monitoring,disclosure, and these regulations may become more pervasive or stringent in light of changing governmental agendas and priorities, although the exact nature and timing of these changes is uncertain. Although some or all potential expenditures and costs associated with the impact of climate variability and related laws and regulations on our Regulated Businesses could be recovered through rates, infrastructure replacement surcharges or other regulatory mechanisms, there can be no assurance that state PUCs would authorize rate increases to enable us to recover such expenditures and costs, in whole or in part.
The current regulatory rate setting process may result in a significant delay, also known as “regulatory lag,” from the time that we invest in infrastructure improvements, incur increased operating expenses as a result of inflation or other factors, incur increased cost of capital, including as a result of increasing short- and long-term interest rates, or experience declining water usage, to the time at which we can seek to address these events in general rate case applications;cases; our inability to mitigate or minimize regulatory lag or the impacts thereof could adversely affect our business.
There is typically a delay, known as “regulatory lag,” between the time one of our regulated subsidiaries makesRegulated Businesses make a capital investment or incursincur an operating expense increase, including as a result of inflation or other factors, and the time when those costs are reflected in rates. In addition, billings permitted by state PUCs typically are, to a considerable extent, based on the volume of water usageused in addition to a minimum base rate. Thus, we may experience regulatory lag between the time our revenues are affected by declining usage and the time we are able to adjust the rate per gallon of usage to address declining usage. Our inability to mitigate or reduce regulatory lag or the impacts thereof could have an adverse effect on our financial condition, results of operations, cash flows and liquidity.
We endeavor to mitigate or reduce regulatory lag by pursuing constructive regulatory practices. For example, three two of our states have approved revenue stability mechanisms that adjust rates periodically to ensure that a utility’s revenue will be sufficient to cover its costs regardless of sales volume, including recognition of declining sales resulting from reduced consumption,usage, while providing an incentive for customers to use water more efficiently. In addition, 11 of 10 of our state PUCs permit rates to be adjusted outside of the general rate case application process through surcharges that address certain capital investments, such as replacement of aging infrastructure. These surcharges are adjusted periodically based on factors such as project completion or future budgeted expenditures, and specific surcharges are eliminated once the related capital investment is incorporated in new PUC approvedPUC-approved rates. Furthermore, in setting rates, tenrates, nine of our state PUCs allow us to use future test years, which extend beyond the date a general rate requestcase is filed to allow for current or projected revenues, expenses and investments to be reflected in rates on a more timely basis. Other examples of such regulatory practices include expense mechanisms that allow us to increase rates for certain cost increases that are beyond our control, such as purchased water costs, property or other taxes, or costs for power or other fuel, conservation, chemical or other expenditures. These mechanisms enable us to adjust rates in less time after costs have been incurred than would be the case under a general rate case application process without the mechanisms.
While these mechanisms have mitigated or reduced regulatory lag in several of our regulated states, we continue to seek expansionapproval of regulatory practices to mitigate or reduce regulatory lag in those jurisdictions that have not approved them. Furthermore, PUCs may fail to adopt new surcharges and existing mechanisms may not continue in their current form, or at all, or we may be unable or become ineligible to continue to utilize certain of these mechanisms in the future. Although we intend to continue our efforts to expandseek state PUC approval of surchargesconstructive regulatory practices to address issues ofmitigate or reduce regulatory lag, our efforts may not be successful, or even if partially successful, they may not completely address our regulatory lag, in which case our business, financial condition, results of operations, cash flows and liquidity may be materially and adversely affected.
Changes in laws and regulations can significantly and materially affect our business, financial condition, results of operations, cash flows and liquidity.
New legislation,The impact of any future revisions or changes in interpretations of existing regulations or the adoption of new laws and regulations applicable to our Regulated Businesses is uncertain. Changes in laws or regulations, the imposition of additional laws and regulations, changes in enforcement practices of regulators, government policies or court decisions including, without limitation with respect to federal and state income and other tax laws, can materially affect our operations, results of operations and cash flows. Certain of the individuals who serve as regulators are elected or political appointees. Therefore, elections which result in a change of political administration or new appointments may also result in changes of certain of the individuals who serve as regulators and changes in the policies of the regulatory agencies that they serve. New laws or regulations, new interpretations of existing laws or regulations, changes in agency policy, including those made in response to shifts in public opinion, or conditions imposed during the regulatory hearing process could have the following consequences, among others:
•making it more difficult for us to increase our rates and, as a consequence, to recover our costs or earn our expected rates of return;
•changing the determination of the costs, or the amount of costs, that would be considered recoverable in rate cases and other regulatory proceedings;
•restricting our ability to terminate our services to customers who owe us money for services previously provided or limiting our bill collection efforts;
•requiring us to provide water or wastewater services at reduced rates to certain customers;
•limiting or restricting our ability to acquire water or wastewater systems, purchase or dispose of assets, or issue long-term debt or equity, or making it less cost-effective for us to do so;
•negatively impacting, among other things: (i) tax rates or positions or the deductibility of expenses under federal or state tax laws, (ii) the availability or amount of, or our ability to comply with the terms and conditions of, tax credits or tax
abatement benefit, (iii) the amount of taxes owed or paid, including as a result of the Corporate Alternative Minimum Tax provisions, (iv) the timing of tax effects on rates or (v) the ability to utilize our net operating loss carryforwards;
•changing regulations that affect the benefits we expected to receive when we began offering services in a particular area;
•increasing the associated costs of, and/or of difficulty complying with, environmental, health, safety, consumer privacy, water quality, and water quality accountability laws and regulations to which our operations are subject;
•changing or placing additional limitations on change in control requirements relating to any concentration of ownership of our common stock;
•making it easier for governmental entities to convert our assets to public ownership via condemnation, eminent domain or other similar process, or for governmental agencies or private plaintiffs to assess liability against us for damages under these or similar processes;
•increasing the costs and/or difficulty of complying with proposed changes to federal contractor affirmative action audits;
•placing limitations, prohibitions or other requirements with respect to the sharing of information and participation in transactions by or between a regulated subsidiary and us or our other affiliates, including Service Company and any of our other subsidiaries;
•restricting or prohibiting our extraction of water from rivers, streams, reservoirs or aquifers; and
•revoking or altering the terms of a CPCN issued to us by a state PUC or other governmental authority.
An example of an area in which laws and regulations are changing and increasing rapidly is with respect to data and consumer privacy, security and protection. We are becoming subject to an increasing number of data and consumer privacy, security and protection laws and regulations administered by various federal, state and local governments, including, for example, the California Consumer Privacy Act of 2018. Federal and state governments have also adopted or are proposing other limitations on, or requirements regarding, the collection, distribution, use, security and storage of personally identifiable information. In addition, the Federal Trade Commission and state attorneys general are applying federal and state consumer protection laws to impose standards on the collection, use and dissemination of data. Moreover, we expect that current laws, regulations and industry standards concerning privacy, data protection and information security in the United States will continue to evolve and increase, and we cannot determine the impact that compliance with such future laws, regulations or standards will have on us or on our business. Any failure or perceived failure by us to comply with current or future federal, state, or local data or consumer privacy or security laws, regulations, policies, guidance, industry standards, or legal obligations, or any incident resulting in unauthorized access to, or acquisition, release, or transfer of personally identifiable information or other data relating to our customers, employees and others, may result in private or governmental enforcement actions, litigation, fines and penalties, or adverse perception or publicity about us and our businesses, which could have a material adverse effect on our reputation and business and could result in us incurring substantial costs. These events could also result in significant diversions of resources, distract management and divert the focus and attention of our security and technical personnel from other critical activities. Any of the foregoing consequences could have a material adverse effect on our business, financial condition, results of operations, cash flows and liquidity.
Regulatory and environmental risks associated with the collection, treatment and disposal of wastewater may impose significant costs and liabilities.
The wastewater collection, treatment and disposal operations of our subsidiaries are subject to substantial regulation and involve environmental risks. If collection, treatment or disposal systems fail, overflow, or do not operate properly, untreated or inadequately treated wastewater or other contaminants could spill onto nearby properties or into nearby streams and rivers, causing damage to persons or property, injury to aquatic life and economic damages. This risk is most acute during periods of substantial rainfall or flooding, which are the main causes of sewer overflow and system failure. Liabilities resulting from such damage could adversely and materially affect our business, financial condition, results of operations and cash flows. CertainSome of our wastewater systems have commercial and industrial customers that are subject to specific limitations on the type, character and strengthconcentration of the wastewater they are permitted to discharge into our systems. The failure by these commercial and industrial customers to comply with their respective discharge requirements could, in turn, negatively impact our operations, damage our facilities or cause us to exceed applicable discharge limitations and requirements. Liabilities resulting from such exceedance events could adversely and materially affect our business, financial condition, results of operations and cash flows.
A loss of one or more large industrial or commercial customers could have a material adverse impact upon the results of operations of one or more of our Regulated Businesses.
Adverse economic conditions the COVID-19 pandemic or other factors may cause our customers, particularly industrial and large commercial customers, to curtail operations. A curtailment of operations by such a customer typically results in reduced water usage by that customer. For example, during 2020, the Company experienced a decrease in net customer demand related mainly to industrial and commercial customers, which the Company believes to be attributable to the impacts of the COVID-19 pandemic. In more severe circumstances, the decline in usage could be permanent. Any decrease in demand resulting from difficult economic conditions or the current COVID-19 pandemic affecting these customers could adversely affect our financial condition and results of operations. Tariffs in place with respect to our Regulated Businesses may not reimburse us, in whole or in part, for any of these impacts.
Our Regulated Businesses require significant capital expenditures and may suffer if we fail to secure appropriate funding to make investments, experience increases in short- and long-term interest rates or if we experience delays in completing major capital expenditure projects.
The water and wastewater utility business is capital intensive. We invest significant amounts of capital to add, replace and maintain property, plant and equipment, and to improve aging infrastructure. In 2020,2023, we invested $1.8$2.6 billion in net Company-funded capital improvements. The level of capital expenditures necessary to maintain the integrity of our systems will continue into the future and, maywe believe, will increase. We expect to fund capital improvement projects using cash generated from operations, borrowings under our revolving credit facility and commercial paper programs and issuances of long-term debt and equity. We may not be able to access our revolving credit facility or the commercial paper, long-term debt and equity capital markets, when necessary or desirable to fund capital improvements on favorable terms or at all. If we are not able to obtain sufficient financing through current or future sources of liquidity, we may be unable to maintain our existing property, plant and equipment, fund our capital investment strategies meet our growth targets andor expand our rate base to enable us to earn satisfactory future returns onmeet our investments.growth targets. Even with adequate financial resources to make required capital expenditures, we face the additional risk that we will not complete our major capital projects on time, as a result of supply chain interruptions, construction delays, permitting delays, labor shortages or other disruptions, environmental restrictions, legal and regulatory challenges, or other obstacles. Each of these outcomes could adversely affect our business, financial condition, results of operations and cash flows.
Aging infrastructure may lead to service disruptions, property damage and increased capital expenditures and O&M expenses and other costs, all of which could negatively impact our financial results.
We have risks associated with aging infrastructure, including water and sewer mains, pumping stations and water and wastewater treatment facilities. Additionally, we may have limited information regarding buried and newly acquired assets, which
could challenge our ability to conduct efficient asset management and maintenance practices. Assets that have aged beyond their expected useful lives may experience a higher rate of failure. Failure of aging infrastructure could result in increased capital expenditures and O&M costs,expenses and negatively impact our future O&M efficiency ratio.other costs. In addition, failure of aging infrastructure may result in property damage, and in safety, environmental and public health impacts. To the extent that any increased costs or expenditures are not fully recovered in rates, our results of operations, liquidity and cash flows could be negatively impacted.
Seasonality could adversely affect the volume of water sold and our revenues.
The volume of water we sell during the warmer months, typically in the summer, is generally greater than during other months, due primarily to increased water usage for irrigation systems, swimming pools, cooling systems and other applications. Throughout the year, and particularly during typically warmer months, the volume of water sold tends to vary with temperature, rainfall levels and rainfall frequency. In the event that temperatures during the typically warmer months are cooler than normal, or if there is more rainfall than normal, the amount of water we sell may decrease and adversely affect our revenues.
Three Two of our jurisdictions, California and Illinois, and New York,currently have adopted revenue stability mechanisms that permit us to recover the revenues authorized in a general rate case, regardless of sales volume. Revenue stability mechanisms are designed to recognize declining sales resulting from reduced consumption, while providing an incentive for customers to use water more efficiently. In those jurisdictions that have not adopted a revenue stability mechanism, our operating results could continue to be affected by seasonality.
Contamination of water supplies or our water service provided to our customers could result in service limitations and interruptions and exposure to substances not typically found in potable water supplies, and could subject us and our subsidiaries to reductions in usage and other responsive obligations, government enforcement actions, damage to our reputation and private litigation.
The water supplies that flow into our treatment plants or are delivered through our distribution system, or the water service that is provided to our customers, may be subject to contamination, including, among other items, contamination from naturally-occurring compounds, chemicals in groundwater systems, pollution resulting from man-mademanufactured sources (such as perchlorate, perfluorinated and polyfluorinated compounds, methyl tertiary butyl ether, 1,4-dioxane, lead and other materials, or chemical spills or other incidents that result in contaminants entering the water source), and possible terrorist attacks or other similar incidents. In addition, new categories of contaminants continue to emerge in the water industry. If one of our water supplies or the water service provided to our customers is contaminated, depending on the nature of the contamination, we may have to take responsive actions that could include, among other things (1) limiting use of the water supply under a “Do Not Use” protective order that enables continuation of basic sanitation and essential fire protection, or (2) interrupting the use of that water supply.supply, in whole or in part, potentially impacting basic sanitation and fire protection needs. If service is disrupted, our financial condition, results of operations, cash flows, liquidity and reputation may be adversely affected. In addition, we may incur significant costs in order to treat the contaminated source through the expansion of our current treatment facilities or the development of new sources of supply or new treatment methods. We may be unable to recover costs associated with treating or decontaminating water supplies through insurance, customer rates, tariffs or contract terms, and any recovery of these costs that we are able to obtain through regulatory proceedings or otherwise may not occur in a timely manner. Moreover, we could be subject to claims for damages arising from government enforcement actions or toxic tort or other lawsuits arising out of an interruption of service or human exposure to hazardous substances in our drinking water and water supplies. See Item 3—Legal Proceedings for information on certain pending lawsuits related to interruptions of water service.
Since we are engaged in the business of providing water service to our customers, contamination of the water supply, or the water service provided to our customers, could result in substantial injury or damage to our customers, employees or others and we could be exposed to substantial claims and litigation. Such claims could relate to, among other things, personal injury, loss of life, business interruption, property damage, pollution, and environmental damage and may be brought by our customers or third parties. Litigation and regulatory proceedings are subject to inherent uncertainties and unfavorable rulings can and do occur. We may not be protected from these claims or negative impacts of these claims in whole or in part by tariffs or other contract terms. Negative impacts to our reputation may occur even if we are not liable for any contamination or other environmental damage or the consequences arising out of human exposure to contamination or hazardous substances inwithin the water supply or water supplies.distributed finished drinking water. In addition, insurance coverage may not cover all or a portion of these losses, and are subject to deductibles and other limitations. Pending or future claims against us could have a material adverse impact on our business, financial condition, results of operations and cash flows.
We are subject to adverse publicity and reputational risks, which make us vulnerable to negative customer perception and could lead to increased regulatory oversight or sanctions.
Our business and operations have a large direct and indirect customer base and, as a result, we are exposed to public criticism regarding, among other things, the reliability of water service, wastewater and related or ancillary services, the quality of water provided, and the amount, timeliness, content, accuracy and format of bills that are provided for such services. For example, our New York subsidiary experienced increased customer and regulatory scrutiny related to an investigation by the New York State Public Service Commission (the “NYSPSC”) of the unintentional provision by our New York subsidiary of incorrect data to a taxing authority and the failure of a few employees of that subsidiary to properly disclose these issues in a rate case. A settlement of this investigation was approved by the Supreme Court of the State of New York in September 2018. Adverse publicity and negative consumer sentiment arising out of these and other incidentsour operations may render legislatures and other governing bodies, state PUCs and other regulatory authorities, and government officials less likely to view us in a favorable light, and may cause us to be susceptible to less
favorable legislative, regulatory and economic outcomes, as well as increased regulatory investigations or other oversight and more stringent regulatory or economic requirements. Unfavorable regulatory and economic outcomes may include negative investigative conclusions and/or findings, the enactment of more stringent laws and regulations governing our operations and less favorable economic terms in our agreementslong-term contracts related to our Market-Based Businesses, asMSG, as well as fines, penalties or other sanctions or requirements. The imposition of any of the foregoing could have a material negative impact on us and our financial condition, results of operations and cash flows.
The failure of, or the requirement to repair, upgrade or dismantle, any of our dams may adversely affect our financial condition, results of operations, cash flows and liquidity.
The properties of our Regulated Businesses segment include 7574 dams, the majority of which are earthen dams. The failure of any of these dams could result in personal injury and property damage, including without limitation downstream property damage, for which we may be liable. The failure of a dam would also adversely affect our ability to supply water in sufficient quantities to our customers and could adversely affect our financial condition and results of operations. Any losses or liabilities incurred due to a failure of one of our dams might not be covered by insurance policies or be recoverable in rates, and such losses may make it difficult for us to secure insurance at acceptable rates in the future.
We also are required from time to time to decommission, repair or upgrade the dams that we own. The cost of such repairs or upgrades can be and has been material. The federal and state agencies that regulate our operations may adopt rules and regulations requiring us to dismantle our dams, which also could entail material costs. Although in most cases the PUC has permitted recovery of expenses and capital investment related to dam rehabilitation, we might not be able to recover costs of repairs, upgrades or dismantling through rates in the future. The inability to recover these costs or delayed recovery of the costs as a result of regulatory lag can affect our financial condition, results of operations, cash flows and liquidity.
Any failure of our network of water and wastewater pipes, water mains and water reservoirs could result in losses and damages that may affect our financial condition and reputation.
Our operating subsidiaries distribute water and collect wastewater through an extensive network of pipes, water mains and storage systems located across the United States. A failure of major pipes, mains or reservoirs could result in injuries, property and other damage for which we may be liable. The failure of major pipes, mains and reservoirs may also result in the need to shut down some facilities or parts of our network in order to conduct repairs. Such failures and shutdowns may limit our ability to supply water in sufficient quantities to our customers and to meet the water and wastewater delivery requirements prescribed by government regulators, including state PUCs with jurisdiction over our operations, and adversely affect our financial condition, results of operations, cash flows, liquidity and reputation. Any business interruption or other losses might not be covered by insurance policies or be recoverable in rates, and such losses may make it difficult for us to secure insurance at acceptable rates in the future. Moreover, to the extent such business interruptions or other losses are not covered by insurance, they may not be recovered through rate adjustments.
An important part of our growth strategy is the acquisition of water and wastewater systems, which involves risks, including competition for acquisition opportunities from other regulated utilities, governmental entities and other buyers, which may hinder or limit our ability to grow our business.
An important element of our growth strategy is the acquisition and optimization of water and wastewater systems in order to broaden our current, and move into new, service areas. We may not be able to acquire other systems or businesses if we cannot identify suitable acquisition opportunities or reach mutually agreeable terms with acquisition candidates. Further,candidates, and whether or not any particular acquisition is successfully completed, these activities are expensive and time consuming and are subject to the availability of capital and personnel resources to complete such acquisitions.
As consolidation activity increases in the water and wastewater industries and competition for acquisition opportunities from other regulated utilities, governmental entities and other strategic and financial buyers continues to increase, the prices for suitable acquisition candidates may hinderincrease and our ability to expand our business.through acquisitions may otherwise be limited.
The negotiation and execution of potential acquisitions as well as the integration of acquired systems or businesses with our existing operations could require us to incur significant costs and cause diversion of our management’s time and resources. Future acquisitions by us could result in, among other things:
•unanticipated capital expenditures;
•unanticipated acquisition-related expenses;
•incurrence or assumption of debt, contingent liabilities and environmental liabilities and obligations, including liabilities that were unknown or undisclosed at the time of acquisition;
•failure to recover acquisition premiums;
•unanticipated capital expenditures;adjustments or premiums due to unfavorable decisions by PUCs and other governmental authorities;
•failure to maintain effective internal control over financial reporting;
•the need to successfully integrate the acquired systems’ operations and water quality, cybersecurity and infrastructure protection measures;
•recording goodwill and other intangible assets at values that ultimately may be subject to impairment charges;
•fluctuations in quarterly and/or annual results;
•unanticipated acquisition-related expenses;
•failure to realize anticipated or perceived benefits and synergies, such as desired return on equity or profitability, cost savings and revenue enhancements; and
•difficulties in integrating or assimilating acquired systems’ operations, personnel, benefits, services and systems.systems and water quality, cybersecurity and infrastructure protection measures.
Some or all of these items could have a material adverse effect on our business. TheIn addition, state laws on acquisition treatment or PUC interpretation thereof may affect our ability to recover costs associated with our investments in newly-acquired water and wastewater systems and businesses we acquire in the future may not achieve anticipated revenue, return on equity or profitability, or other perceived synergies, and any difficulties we encounter in the negotiation, execution or integration process could interfere withhave a material adverse impact on our results of operations, reduce our net income and profitability or adversely affect our internal control over financial reporting.
We compete with governmental entities, other regulated utilities, and strategic and financial buyers for acquisition opportunities. If consolidation becomes more prevalent in the water and wastewater industries and competition for acquisitions increases, the prices for suitable acquisition candidates may increase and limit our ability to expand through acquisitions.
Our Regulated Businesses are subject to condemnation and other proceedings through eminent domain or other similar authorized process, which could materially and adversely affect their results of operations and financial condition.
Municipalities and other government subdivisions have historically been involved in the provision of water and wastewater services in the United States, and organized efforts may arise from time to time in one or more of the service areas in which our Regulated Businesses operate to convert our assets to public ownership and operation through exercise of the governmental power of eminent domain, or another similar authorized process. A municipality, other government subdivision or a citizen group may seek to acquire our assets through eminent domain or such other process, either directly or indirectly as a result of a citizen petition.
For example, in November 2018, Monterey, California ballot Measure J, which was added by a citizens group, was certified as having been approved by a public vote, requiringon December 15, 2023, the MPWMD filed eminent domain litigation against Cal Am in Monterey County Superior Court with respect to conduct a study and submit a written plan concerning the feasibility of a potential purchase of the Monterey system assets without an additional public vote. The public vote led to the issuance by the MPWMD in November 2019 of a preliminary report finding, among other things, that the acquisition of the Monterey system assets by the MPWMD would be economically feasible. In November 2020, the MPWMD certified an FEIR with respect to a proposed acquisition and operation of this system by the MPWMD, and our California subsidiary has filed a petition in court challenging this certification. Also, five municipalities in the Chicago, Illinois area formed a water agency that filed an eminent domain lawsuit against our Illinois subsidiary in January 2013, seeking to condemn a water pipeline that serves those five municipalities. This lawsuit remains pending, and a valuation trial is scheduled for the second quarter of 2021.assets. See Item 1—Business—Regulated Businesses—3—Legal Proceedings—Proposed Acquisition of Monterey System Assets — Potential Condemnation and Eminent Domain, which includesfor additional information regarding these matters.
Furthermore, the law in certain jurisdictions in which our Regulated Businesses operate provides for eminent domain rights allowing private property owners to file a lawsuit to seek just compensation against a public utility, if the public utility’s infrastructure has been determined to be a substantial cause of damage to that property. In these actions, the plaintiff would not have to prove that the public utility acted negligently. In California, lawsuits have been filed in connection with large-scale natural events such as wildfires. Some of these lawsuits have included allegations that infrastructure of certain utilities triggered the natural event that resulted in damage to the property. In some cases, the PUC has disallowed recovery in rates of losses incurred by these utilities as a result of such lawsuits.
Contesting an exercise of condemnation, eminent domain or other similar process, or responding to a citizen petition, may result in costly legal proceedings and may divert the attention of management. Moreover, our efforts to resist the condemnation, eminent domain or other process may not be successful, which may require us to sell the operations at issue in a condemnation proceeding or to pay a private property owner compensation for the property damage suffered. If a municipality or other government subdivision succeeds in acquiring the assets of one or more of our Regulated Businesses through eminent domain or other process, there is a risk that we will not receive adequate compensation for the business, that we will not be able to keep the compensation, or that we will not be able to divest the business without incurring significant charges. Any of these outcomes may have a material adverse effect on our business, results of operations, financial condition, cash flows and liquidity.
We may be subject to physical and cyber attacks.
As operators of critical infrastructure, we may face a heightened risk of physical and cyber attacks from internal or external sources. Our water and wastewater systems may be vulnerable to disability or failures as a result of physical or cyber attacks, acts of war or terrorism, vandalism or other causes. Our operational and technology systems throughout our businesses may be vulnerable to unauthorized external or internal access, due to hacking, viruses, acts of violence, war or terrorism, and other causes. Unauthorized access to confidential information located or stored on these systems could negatively and materially impact our reputation, customers, employees, suppliers and other third parties. Further, third parties, including vendors, suppliers and contractors, who perform certain services for us or administer and maintain our sensitive information, could also be targets of cyber attacks and unauthorized access.access to their operational or technology systems. While we have instituted what we believe are reasonable and appropriate safeguards to protect our operational and technology systems, those safeguards may not always be effective due to the evolving nature of cyber attacks and cyber vulnerabilities. We cannot guarantee that such protections will be completely successful in the event ofto prevent or mitigate a cyber attack.
If, despite our security measures, a significant physical attack or cyber breach occurred, our operations could be disrupted, property damaged, and customer and other confidential information lost or stolen; we could experience substantial loss of revenues, response costs and other financial loss; we could suffer a loss or redirection of management time, attention and resources from our regular business operations; and we may be subject to increased regulation,regulatory requirements; and we may experience litigation and damage to our reputation, any of which could have a negative impact on our business, results of operations and cash flows. Experiencing a cyber security incident could also cause us to be non-compliant with applicableApplicable laws and regulations or contracts thatmay require us to report cybersecurity incidents or breaches or securely maintain confidential data causingin the event that we experience a physical or cyber security incident. Our efforts to comply with such laws and regulations or contractual provisions, or our failure to do so, may cause us to incur costs related to legal claims or proceedings and regulatory fines or penalties. These types of events, and their resulting impacts, either impactingto our facilities or assets, those of third parties, or the industry in general, could also cause us to incur additional security and insurance related costs.
In addition, in the ordinary course of business, we collect and retain sensitive information, including personally identifiable information, about our customers and employees. In many cases, we outsource administration of certain functions to vendors that couldhave been and will continue to be targets of cyber attacks. Any theft, loss or fraudulent use of customer, employee or proprietary data as a result of a cyber attack on us or a vendor could also subject us to significant litigation, liability and costs, as well as adversely impact our reputation with customers and regulators, among others.
We have obtained cyber insurance to provide coverage for a portion of the losses and damages that may result from a physical attack, cyber attack or a security breach, but such insurance is subject to a number of exclusions and may not cover the total loss or damage caused by an attack or a breach. The market for cybersecurity insurance is relatively new and coverage available for cybersecurity events may evolve as the industry matures. In the future, adequate insurance may not be available at rates that we believe are reasonable, and the costs of responding to and recovering from a physical attack, cyber attack or security breach incident may not be covered by insurance or recoverable in rates.
Our business is subject to complex and evolving federal, state and local laws and regulations regarding consumer privacy and the protection or transfer of data relating to individuals, which could result in, among other things, public disclosure of incidents, private or governmental claims or litigation against us, changes to our business practices, monetary penalties, reputational harm and increased cost of operations.
Laws and regulations are changing and increasing rapidly with respect to data and consumer privacy, security and protection. We are subject to an increasing number of complex and continually evolving data and consumer privacy, security and protection laws and regulations administered by various federal, state and local governments, including, for example, the California Privacy Rights Act, together with its amendments and implementing regulations, the Virginia Consumer Data Protection Act and the Cyber Incident Reporting for Critical Infrastructure Act of 2022. New laws and regulations may require us to disclose incidents to authorities, regulators and/or the public, when we otherwise may not have been required to disclose such incidents under previous laws and regulations, and such disclosures could negatively and materially impact our reputation, customers, employees, suppliers and other third parties. Federal and state governments have also adopted or are proposing other limitations on, or requirements regarding, the collection, distribution, use, security and storage of personally identifiable information. In addition, the Federal Trade Commission and state attorneys general are applying federal and state consumer protection laws to impose standards on the collection, use and dissemination of data. Moreover, we expect that current laws, regulations and industry standards concerning privacy, data protection and information security in the United States will continue to evolve and increase, and we cannot determine the impact that compliance with such future laws, regulations or standards will have on us or on our business. Any failure or perceived failure by us to comply with current or future federal, state, or local data or consumer privacy or security laws, regulations, policies, guidance, industry standards, or legal obligations, or any incident resulting in unauthorized access to, or the acquisition, release, or transfer of, personally identifiable information or other data relating to our customers, employees and others, may result in private or governmental enforcement actions, litigation or other claims against us, fines and penalties, or adverse perception or publicity about us and our businesses. These events could also require us to change our business practices, and the events or such changes may result in significant diversions of resources, distract management and divert the focus and attention of our security and technical personnel from other critical activities. Any of the foregoing consequences could have a material adverse effect on our business, reputation, financial condition, results of operations, cash flows and liquidity.
We may sustain losses that exceed or are excluded from our insurance coverage or for which we are self-insured.
We maintain insurance coverage, some of which may be self-insured, as part of our overall legal and risk management strategy to minimize potential liabilities arising from our utility operations, as well as the operations of our Market-Based Businesses.operations. Our insurance programs have varying coverage limits, exclusions and maximums, and insurance companies may seek to deny claims we might make. Generally, our insurance policies cover property damage, worker’s compensation, employer’s liability, general liability, cybersecurity, terrorism risks and automobile liability. Each policy includes deductibles or self-insured retentions and policy limits for covered claims. As a result, we may sustain losses that exceed or that are excluded from our insurance coverage, or for which we are self-insured.
self-insured and must therefore utilize our own financial resources to cover such losses. Although in the past we have been generally able to obtain insurance coverage related to our business, there can be no assurance that we can secure all necessary or appropriate insurance in the future, or that such insurance can be economically secured. For example, catastrophic events can result in decreased coverage limits, more limited coverage, increased premium costs or deductibles.
We rely on technology to facilitate the management of our business as well as our customer and supplier relationships, and a failure or disruption of implemented technology could materially and adversely affect our business.
Technology is an integral part of our business and operations, and any failure or disruption of the technology or related systems we implement could significantly limit our ability to manage and operate our business effectively and efficiently, which, in turn, could cause our business and competitive position to suffer and adversely affect our results of operations. We use technology systems to, among other things, bill customers, process orders, provide customer service, manage certain plant operations and construction projects, create and manage our financial records and other operational data, track assets, remotely monitor our plants and facilities, and manage human resources, supply chain, inventory, and accounts receivable collections. As a specific example, we depend on water meters to record and communicate the amount of water our customers use, which information in turn is used to generate customer bills, and in recent years, we have experienced greater than expected performance failures with certain water meters used in the Regulated Businesses. When thesefailures occur, we work with meter manufacturers to determine and address the cause of such failures. While these and other failures that we have experienced have not to date had a material adverse effect on our operations, there can be no assurance that efforts to address performance failures or other issues we may experience with water meters or other implemented technology will be successful in the future and that these or future failures of water meters or other technological issues will not have a material adverse effect on us.
Although we do not believe that the technology we have implemented or may in the future implement is at a materially greater risk of failure than that used by other similar organizations, our technology and operations that use or rely on technology remain vulnerable to damage or interruption from, among other things: failure or interruption of the technology or its related systems; loss or failure of power, internet, telecommunications or data network systems; and operator error or improper operation by, the negligent or improper supervision of, or the intentional acts of, employees, contractors and other third parties. Any or all of these events could have a material adverse impact on our business, results of operations, financial condition and cash flows.
An inability to successfully develop and implement new technologies poses substantial risks to our business and operational excellence strategies, which could have a material adverse effect on our business and financial results.
A significant part of our long-term strategic focusplan focuses on safety, operational excellence, cost and expense efficiency (including O&M expense efficiency,efficiency), water quality and affordability, asset and capital management and the customer experience includes implementing new technologies for, among other things: customer service and support; environmental compliance; water metering; water quality and source monitoring; cybersecurity; business development and growth; data analysis; employee development and training; and other initiatives.experience. For example, we have made and plan to continue to make significant investments in developing, deploying, integrating, enhancing and maintaining customer-facing technologies, applications to support field service and customer service operations, water source sensor and evaluation technologies, meter data management and data analysisanalytics, and artificial intelligenceintelligent automation technologies. Where appropriate, we also seek to align these new technologies with existing technology infrastructure and systems. There can be no assurance that we will be successful in designing, developing, deploying, integrating or maintaining these new technologies. Because these efforts can be long-term in nature, these new technologies may be more costly or time-consuming than expected to design, develop, integrate and complete and may not ultimately deliver the expected or desired benefits upon completion. While we have and will continue to seek to recover costs and earn a return on capital expenditures with respect to the costs and expenses of development and deployment of these new technologies in our Regulated Businesses, there can be no assurance that we will be able to do so in every instance or at all, and our inability to do so may adversely affect our ability to achieve intended cost and expense, including O&M expense, efficienciesefficiencies or other key performance results and, ultimately, could materially and adversely impact our business, financial condition, results of operations and cash flows.
Our inability to efficiently upgrade and improve our operational and technology systems, or implement new systems, could result in higher than expected costs or otherwise adversely impact our internal controls environment, operations and profitability.
Upgrades and improvements to computer systems and networks, or the implementation of new systems, may require substantial amounts of management’s time and financial resources to complete, and may also result in system or network defects or operational errors due to multiple factors, including employees’ ability to effectively use the new or upgraded system. We have implemented, and will continue to implement, technology to improve our business processes and customer interactions (including, without limitation, in connection with the installation or upgrade of our enterprise resource planning systems, and to support our cybersecurity program), and have installed new, and upgraded existing, technology systems. Any technical or other difficulties in upgrading and improving existing or implementing new technology systems may increase costs beyond those anticipated and have an adverse or disruptive effect on our operations and reporting processes, including our internal control over financial reporting. We may also experience difficulties integrating current systems with new or upgraded systems, which may impact our ability to serve our customers effectively or efficiently. Although we make efforts to minimize any adverse impact on our controls, business and operations, we cannot assure that all such impacts have been or will be mitigated, and any such impacts could harm our business (individually or collectively) and have a material adverse effect on our results of operations, financial condition and cash flows.
Disruptions in our supply chain related to goods, such as pipe, chemicals, power and other fuel, equipment, water and other raw materials, and services, could adversely impact our operations and our ability to serve our customers, as well as our financial results.
Our ability to serve our customers and operate our business in compliance with regulatory requirements is dependent upon purchasing or securing necessary goods and services from our suppliers and vendors. These items include but are not limited to
contracted services, chemicals, pipe, valves, hydrants, fittings, equipment (including personal protective equipment), water, and power and other fuel. Examples of supply chain disruptions include reduced quantities of goods available in the marketplace, delays in manufacturing or shipping goods, labor shortages at our suppliers or vendors, natural or other disasters and operational impacts to some of our suppliers or vendors. Disruptions in our supply chain related to goods and services have occurred and we anticipate will continue to occur into the foreseeable future.
Supply chain disruptions may cause us to be unable to purchase or otherwise obtain needed goods or services at a reasonable price or at all, and may significantly increase the price of goods and services we may obtain from suppliers and vendors. This, in turn, may adversely impact our operations and our ability to serve our customers in compliance with regulatory requirements, as well as our associated results of operations, cash flows and financial condition. While we attempt to plan for and have contingencies in place to address supply chain disruptions, our mitigation efforts may not be successful or may have further negative impacts on us.
Our business has inherently dangerous work sites. If we fail to maintain safe work sites, we may experience workforce or customer injuries or loss of life, and be exposed to financial losses, including penalties and other liabilities.
Safety is a core value and a strategy at American Water. Our safety performance and progress to our ultimate desired goal of zero injuries isare critical to our ability to carry out our operations effectively and to serve our customers, and thereby, to support our reputation. We maintain health and safety standardspractices to protect our employees, customers, contractors, vendors and the public. Eliminating all hazards all of the time is extremely challenging, but through strict adherence to our health and safety standards and empowering employees to stop work if deemed “unsafe,” we believe we can achieve an injury-free workplace.
At our business sites, including construction and maintenance sites, our employees, contractors and others are often in close proximity to large mechanical operating equipment, moving vehicles, pressurized water, electric and gas utility lines, below grade trenches and vaults, electrical and pneumatic hazards, fall from height hazards, suspended loads, hazardous chemicals and other regulated materials. On many sites, we are responsible for safety and, accordingly, must implement important safety procedures and practices above governmental regulatory requirements. As an essential business that must continue to provideprovides water and wastewater services, during the current COVID-19 pandemic, we are focused on the carehealth and safety of our employees, contractors, vendors, customers and others who work at or visit our worksites. If the procedures we implement are ineffective or are not followed by our employees, contractors or others, or we fail to implement procedures, our employees, contractors and others may experience illness, or minor, serious or fatal injuries. Unsafe work sites have the potential to increase employee turnover, expose us to litigation and raise our operating costs. Any of the foregoing could result in financial losses, which could have a material adverse impact on our business, financial condition, results of operations and cash flows.
In addition, our operations can involve the delivery, handling, storage, use and storagedisposal of hazardous chemicals, which, if improperly delivered, handled, stored, used or disposed of, could result inor if the location and identification of these chemicals are not reported accurately or timely, serious injury, death, environmental damage or property damage could result, and we could subject usbe subjected to fines, penalties or other liabilities. We are also subject to various environmental, transportation and occupational health and safety regulations. Although we maintain functional employee groups whose primary purpose is to implement effective environmental health and safety work procedures and practices throughout our organization, including construction sites and operating facilities, the failure to comply with these regulations or procedures could subject us to liability.
Work stoppages and other labor relations matters could adversely affect our results of operations and the ability to serve our customers.
As of December 31, 2020,2023, approximately 45%47% of our workforce was represented by unions, and we had 7273 collective bargaining agreements in place with 14 different unions representing our unionized employees. These collective bargaining agreements, 1721 of which willare scheduled to expire during 2021,2024, are subject to periodic renewal and renegotiation. We may not be able to successfully renew or renegotiate these labor contracts, or enter into new agreements, on terms that are acceptable to us. Any negotiations or dispute resolution processes undertaken in connection with our labor contracts could be delayed or affected by labor actions or work stoppages. Labor actions, work stoppages or the threat of work stoppages, and our failure to obtain favorable labor contract terms during renegotiations, may disrupt our operations, negatively impact the ability to serve our customers, and result in higher labor costs, which could adversely affect our reputation, financial condition, results of operations, cash flows and liquidity. While we have developed contingency plans to be implemented as necessary if a work stoppage or strike does occur, a strike or work stoppage may have a material adverse impact on our financial position, results of operations and cash flows.
Financial, Economic and Market-Related Risks
Our indebtedness could adversely affect our business and limit our ability to plan for or respond to changes in our business, and we may be unable to generate sufficient cash flows to satisfy our liquidity needs.
As of December 31, 2020,2023, our aggregate long-term and short-term debt balance (including preferred stock with mandatory redemption requirements) was $10.9$12.4 billion, and our working capital (defined as current assets less current liabilities) was in a deficit position. Our indebtedness could have important consequences, including:
•limiting our ability to obtain additional financing to fund future working capital requirements or capital expenditures;
•exposing us to interest rate risk with respect to the portion of our indebtedness that bears interest at variable rates;
•limiting our ability to pay dividends on our common stock or make payments in connection with our other obligations;
•impairing our access to the capital markets for debt and equity;
•requiring that an increasing portion of our cash flows from operations be dedicated to the payment of the principal and interest on our debt, thereby reducing funds available for future operations, dividends on our common stock or capital expenditures;
•limiting our ability to take advantage of significant business opportunities, such as acquisition opportunities, and to react to changes in market or industry conditions; and
•placing us at a competitive disadvantage compared to those of our competitors that have less debt.
In order to meet our capital expenditure needs,During 2023, we may be required to borrow additional funds under the revolving credit facility or issue a combination of new short-term and long-term debt securities and/or equity. We continue to assess our short- and long-term liquidity needs in light of the impact of the COVID-19 pandemic on the financial and capital markets, especially with respect to the market for corporate commercial paper, which experienced volatility and shortages of liquidity in March 2020. In response to these events, in March 2020, we entered into a $750 million 364-day term loan facility and immediately executed a $500 million draw thereunder to support our short-term liquidity by retaining that amount in cash. No further borrowings may be made under the term loan facility. During 2020, we utilized other existing sources of liquidity, such as our current cash balances, cash flows from operations and borrowings under the revolving credit facility as necessary or desirableour commercial paper program, to meet our short-term liquidity requirements. We believe that existing sources of liquidity will be sufficient to meet our cash requirements for the foreseeable future. However, asIn order to meet our capital expenditure and other operational needs, however, we may be required to borrow additional funds under the impacts of the COVID-19 pandemic on the economy, the financial and capital markets and our operations evolve, we will continue to assess our liquidity needs.revolving credit facility. In the event of a sustained market deterioration, we may need to obtain additional sources of liquidity, which would require us to evaluate available alternatives and take appropriate actions.
Moreover, additional borrowings may be required to repay or refinance outstanding indebtedness. Other than debt with respect to the term loan facility, debtDebt maturities and sinking fund payments in 2021, 20222024, 2025 and 20232026 will be $329$475 million, $14$619 million and $356$1,478 million, respectively. We can provide no assurance that we will be able to access the debt or equity capital markets on favorable terms, if at all, to repay or refinance this debt. Moreover, as new debt is added to our current debt levels, the related risks we now face could intensify, limiting our ability to repay or refinance existing debt on favorable terms.
We have in the past entered into, and in the future may enter into, financial derivative instruments, including without limitation, interest rate swaps, forward starting swaps swaptions and U.S. Treasury lock agreements. See Item 7A—Quantitative and Qualitative Disclosures About Market Risk. However, these efforts may not be effective to fully mitigate interest rate risk, and may expose us to other risks and uncertainties, including quarterly “mark to market” valuation risk associated with these instruments, that could negatively and materially affect our financial condition, results of operations and cash flows.
Our ability to pay our expenses and satisfy our debt service obligations depends in significant part on our future performance, which will be affected by the financial, business, economic, competitive, legislative (including tax initiatives and reforms, and other similar legislation or regulation), regulatory and other risk factors described in this section, many of which are beyond our control. If we do not have sufficient cash flows to pay the principal and interest on our outstanding debt, we may be required to refinance all or part of our existing debt, reduce capital investments, sell assets, borrow additional funds or sell additional equity. In addition, if our business does not generate sufficient cash flows from operations, or if we are unable to incur indebtedness sufficient to enable us to fund our liquidity needs, we may be unable to plan for or respond to changes in our business, which could cause our financial condition, operating results and prospects to be affected materially and adversely.
Our inability to access the debt or equity capital or financial markets or other events could affect our ability to meet our long-term commitments or liquidity needs at reasonable cost, and our ability to meet long-term commitments, which could adversely affect our financial condition and results of operations.
In addition to cash from operations, during 2020,2023, we generally relied primarily on a $2.25$2.75 billion revolving credit facility, a $2.10$2.60 billion commercial paper program, our $750 million 364-day term loan facility and the debt and equity capital markets, to satisfy our liquidity needs. The revolving credit facility currently expires in accordance with its terms in March 2025, and the 364-day term loan facility will expire in March 2021. Historically, we have regularly used our commercial paper program rather than the revolving credit facility as a principal source of short-term borrowing due to the generally more attractive rates we generally could obtain in the commercial paper market. As of December 31, 2020,2023, there were no outstanding borrowings under the revolving credit facility, $786$180 million of commercial paper outstanding $76and $75 million in outstanding letters of credit and $500 million outstanding under the 364-day term loan facility.credit. There can be no assurance that we will be able to continue to access this commercial paper program or revolving credit facility, when, as and if desired, or that the amount of capital available thereunder will be sufficient to meet all of our liquidity needs at a reasonable, or any, cost.
UnderOur ability to comply with covenants in our revolving credit facility and our other consolidated indebtedness is subject to various risks and uncertainties, including events beyond our control. For example, under the terms of the revolving credit facility and the 364-day term loan facility, our consolidated debt cannot exceed 70% of our consolidated capitalization, as determined under the terms of the those facilities.facility. If our equity were to decline or debt were to increase to a level that causes us to exceed this limit, lenders under those facilitiesthe facility would be entitled to refuse any further extension of credit under the revolving credit facility and to declare all of the outstanding debt under the revolving credit facility and/or the term loan facilitythereunder immediately due and payable. Events that could cause a reduction in equity include, without limitation, a significant write-down of our goodwill. To avoid such a default, a waiver or renegotiation of this covenant would be required, which would likely increase funding costs and could result in additional covenants that would restrict our operational and financing flexibility. Our ability to comply with this and other covenants contained in the revolving credit facility, the term loan facility and our
other consolidated indebtedness is subject to various risks and uncertainties, including events beyond our control. For example, events that could cause a reduction in equity include, without limitation, a significant write-down of our goodwill. Even if we are able to comply with this or other covenants, the limitations on our operational and financial flexibility could harm our business by, among other things, limiting our ability to incur
indebtedness or reduce equity in connection with financings or other corporate opportunities that we may believe would be in our best interests or the interests of our shareholders to complete.
As provided in our five-year capital plan, in order to meet our capital expenditure needs, we intend to issue a combination of short-term and long-term debt securities and/or additional equity shares of common stock. Disruptions in the debt or equity capital markets or changes in our credit ratings or other events could also limit our ability to access capital on terms favorable to us or at all. While the lending banks that participate in the revolving credit facility have to date honored their commitments under those facilities, disruptions in the credit markets, changes in our credit ratings, or deterioration of the banking industry’s financial condition could discourage or prevent lenders from meeting their existing lending commitments, extending the terms of such commitments, or agreeing to new commitments. In such a case, we may not be able to access the commercial paper, or debt or equity capital markets, or other sources of potential liquidity, in the future on terms acceptable to us or at all. Furthermore, our inability to maintain, renew or replace commitments under our revolving credit facility could materially increase our cost of capital and adversely affect our financial condition, results of operations and liquidity. Short- or long-term disruptions or volatility in the debt or equity capital and credit markets as a result of economic, legislative, political or other uncertainty,uncertainties, including as a result of the current COVID-19 pandemic, changes in U.S. tax and other laws, reduced financing alternatives, or failures of significant financial institutions could adversely affect our access to the capital necessary to provide adequate liquidity needed for our business. Any significant disruptionSignificant volatility or disruptions in the debt or equity capital debt or credit markets, or financial institution failures, could require us to take measures to conserve cash until the market stabilizes or until alternative financing can be arranged. Such measures could include delaying or deferring capital expenditures, reducing or suspending dividend payments, and reducing other discretionary expenditures. Finally, even absent significant volatility or disruptions in the capital markets, there iscan be no assurance that we will be able to access the equity markets to obtain capital or financing when necessary or desirable and on terms that are reasonable or acceptable to us.
Any of the foregoing events that impede our access to the debt or equity capital markets, or the failureThe occurrence of any of our lenders to meet their commitments that result from financial market disruptions,these circumstances could expose us to increased interest or other expense, require us to institute cash or liquidity conservation measures or otherwise adversely and materially affect our business, financial condition, results of operations, cash flows and liquidity, which may limit or impair our ability to achieve our strategic, business and operational goals and objectives.
The conditional exchange feature of the Exchangeable Senior Notes due 2026, if triggered, may adversely effect our liquidity and financial condition and may dilute the ownership interest of our shareholders or may otherwise depress the price of parent company’s common stock.
In June 2023, AWCC issued $1,035.0 million aggregate principal amount of its 3.625% Exchangeable Senior Notes due 2026 (the “Notes”). See Note 11—Long-Term Debt in the Notes to the Consolidated Financial Statements for a description of the Notes. In the event the conditional exchange feature of the Notes is triggered and one or more holders elect to exchange their Notes, AWCC would be required to settle any exchanged principal through the payment of cash, which could adversely affect our liquidity. In addition, in that case, even if holders do not elect to exchange their Notes, we would be required under applicable accounting rules to reclassify all or a portion of the outstanding principal of the Notes as a current rather than long-term liability, which would result in a material reduction of our net working capital. If AWCC elects to settle the portion, if any, of an exchange obligation in excess of the aggregate principal amount of the Notes being exchanged in shares of parent company common stock or a combination of cash and shares of such common stock, any sales in the public market of the common stock deliverable upon such exchange could adversely affect prevailing market prices of parent company common stock. In addition, the existence of the Notes may encourage short selling by market participants because the exchange of the Notes could be used to satisfy short positions, and any anticipated exchange of the Notes for shares of such common stock could depress the price of such common stock.
Parent company may be unable to meet its ongoing and future financial obligations and to pay dividends on its common stock if its subsidiaries are unable to pay upstream dividends or repay funds.
Parent company is a holding company and, as such, it has no substantive operations of its own. Substantially all of our consolidated assets are held by subsidiaries. Parent company’s ability to meet its financial obligations and to pay dividends on its common stock is primarily dependent on the net income and cash flows of its subsidiaries and their ability to pay upstream dividends or repay indebtedness to parent company. Prior to paying dividends to parent company, our regulated subsidiaries must comply with applicable regulatory restrictions and financial obligations, including, for example, debt service and preferred and preference stock dividends, as well as applicable corporate, tax and other laws and regulations and agreements, and our covenants and other agreements. Our subsidiaries are separate legal entities and have no obligation to pay or upstream dividends to parent company. A failure or inability of any of these subsidiaries to pay such dividends or repay intercompany obligations could have a material adverse impact on our liquidity and parent company’s ability to pay dividends on its common stock and meet its other obligations.
We may not be able to fully utilize our U.S. and state net operating loss carryforwards.
As of December 31, 2020, we had U.S. federal and state NOL carryforwards of approximately $366 million and $357 million, respectively, and management believes it is more likely than not that these NOL carryforwards will be recovered in the future. With the enactment in December 2017 of the TCJA, we analyzed the impacts of the reduction in the U.S. federal corporate income tax rate from 35% to 21% on our deferred tax assets and liabilities, including our NOL carryforwards, and as a result, remeasured those NOL carryforwards as of the date of enactment of the TCJA based on this tax rate change.
Our federal NOL carryforwards will begin to expire in 2029, and our state NOL carryforwards began to expire in 2020 and will continue to expire through 2040. We expect to fully utilize our federal NOL balance before it expires, and our ability to do so is primarily dependent upon our ability to generate sufficient taxable income. We have, in the past, been unable to utilize certain of our state NOL carryforwards, and the establishment or increase of a valuation allowance in the future would reduce our deferred income tax assets and our net income.
Our actual results may differ from those estimated by management in making its assessment as to our ability to use the NOL carryforwards. Moreover, adoption of Related Interpretations with respect to the TCJA and other changes in income tax laws, the economy and the general business environment could affect the future utilization of our NOL carryforwards. If we are unable to fully utilize our NOL carryforwards to offset taxable income generated in the future, our financial position, results of operations and cash flows could be materially adversely affected.
We have recorded a significant amount of goodwill and other assets measured and recorded at fair value on a recurring basis, and we may never realize the full value of our intangible assets, causing usbe required to record impairments thator changes in fair value to these assets, which may negatively affect our financial condition and results of operations.
Our total assets include $1.5as of December 31, 2023, included $1.1 billion of goodwill and $236 million of total assets measured and recorded at December 31, 2020.fair value on a recurring basis. The goodwill is primarily associated with the acquisition of American Water by an affiliate of our previous owner in 2003, the acquisition of E’town Corporation by a predecessor to our previous owner in 2001 and our acquisition of Pivotal in 2018.2003. Goodwill represents the excess of the purchase price the purchaser paid over the fair value of the net tangible and other intangible assets acquired. Goodwill is recorded at fair value on the date of an acquisition and is reviewed annually or more frequently if changes in circumstances indicate the carrying value may not be recoverable. As required by the applicable accounting rules, in the past, we have taken significant non-cash charges to operating results for impairments to goodwill impairmentsor other intangible assets, and have recorded changes in the past.
fair value of financial instruments and other assets. We may be required to recognize in the future an impairment of goodwill or a change in the futurefair value of financial instruments or certain other assets due to market conditions, or other factors related to our performance or the performance of an acquired business.business, or other circumstances that may impact the fair value of a financial instrument or the other asset. See Note 18—Fair Value of Financial Information in the Notes to the Consolidated Financial Statements for information on the fair value of financial and other assets. These market conditions could include a decline over a period of time of our stock price, a decline over a period of time in valuation multiples of comparable water utilities, market price performance of our common stock that compares unfavorably to our peer companies, decreases in control premiums, or other circumstances. For example, in the third quarter of 2018, prior to our sale of our former Keystone Clearwater Solutions (“Keystone”) operations, we strategically narrowed the scope of that business and, as a result, we recorded a non-cash, pre-tax impairment charge of $57 million.
A decline in the results forecasted in our business plan due to events such as changes in rate case results, capital investment budgets or interest rates, could also result in an impairment charge. Recognition of impairments of goodwill and changes in fair value of certain of our other assets would result in a charge to income in the period in which the impairment or change occurred, which may negatively affect our financial condition, results of operations and total capitalization. The effects of any such impairment or change could be material and could make it more difficult to maintain our credit ratings, secure financing on attractive terms, maintain compliance with debt covenants and meet the expectations of our regulators.
Market volatility and other conditions may impact the value of benefit plan assets and liabilities, as well as assumptions related to the benefit plans, which may require us to provide significant additional funding.
The performance of the capital markets affects the values of the assets that are held in trust to satisfy significant future obligations under our pension and postretirement benefit plans. The value of these assets is subject to market fluctuations and volatility, which may cause investment returns to fall below our projected return rates. As the COVID-19 pandemic continued throughout 2020, the stock market would often experience significant day-to-day fluctuations in market prices. We are currently unable to predict the effect, if any, of the COVID-19 pandemic or other events on the valuation of our pension assets and liabilities. A decline in the market value of our pension and postretirement benefit plan assets as of the measurement date or a change in the projection of the future return on plan assets can increase the funding requirements under our pension and postretirement benefit plans. Additionally, our pension and postretirement benefit plan liabilities are sensitive to changes in interest rates. Interest rates have experienced volatility and are subject to potential further adjustments based on the actions of the U.S. Federal Reserve, and others. If interest rates are lower at the current measurement date than the prior measurement date, our liabilities would increase, potentially increasing benefit expense and funding requirements. Further, changes in demographics,assumptions, such as increases in life expectancy assumptions and increasing trends in health care costs may also increase our funding requirements. Future increases in pension and other postretirement costs as a result of reduced plan assets may not be fully recoverable in rates, in which case our results of operations and financial position could be negatively affected. In addition, market factors can affect assumptions we use in determining funding requirements with respect to our pension and postretirement plans. For example, a relatively modest change in our assumptions regarding discount rates can materially affect our calculation of funding requirements. To the extent that market data compels us to reduce the discount rate used in our assumptions is reduced, our benefit obligations could be materially increased, which could adversely affect our financial position, results of operations and cash flows.
Additional Risks Related to Our Market-BasedOther Businesses
Parent company provides performance guarantees with respect to certain of the obligations of our Market-Based Businesses,Other businesses, including financial guarantees or deposits, which may adversely affect parent company if the guarantees are successfully enforced.
Under the terms of certain agreements under which ourMarket-Based Businesses, Other businesses, primarily MSG, provide water and wastewater services to municipalities otherand federal governmental entities, and other customers, parent company provides guarantees of specified performance obligations, of our Market-Based Businesses, including financial guarantees or deposits. In the event our Market-Based Businesses fail to perform these obligations are not performed, the entity holding the guarantees may seek to enforce the performance commitments against parent company or proceed against the deposit. In that event, our financial condition, results of operations, cash flows and liquidity could be adversely affected. At December 31, 2020,2023, we had remaining performance commitments, as measured by remaining contract revenue, totaling approximately $6.2 billionand primarily related to MSG’s contracts, totaling approximately $7.8 billion, of which $1.2 billion are guaranteed by parent company and thisthe remainder is guaranteed by certain subsidiaries in Other. The aggregate amount of remaining performance commitments is likely to increase ifas the number of military bases served by MSG increases. The presence of these commitments may adversely affect our financial condition and make it more difficult for us to secure financing on attractive terms.
MSG’s operations are subject to various risks associated with doing business with the U.S. government.
MSG enters into contracts with the U.S. government for the operation and maintenance of water and wastewater systems, which contracts may be terminated, in whole or in part, prior to the end of the 50-year term for convenience of the U.S. government or as a result of default or non-performance by the subsidiary performing the contract. In addition, the contract price for each of these military contracts is typically subject to either an annual economic price adjustment, or a price redetermination two years after commencement of operations and every three years thereafter. Annual economic price adjustment is an inflation index-based contract price increase mechanism. Price redetermination is a contract mechanism to periodically adjust the service fee in the next period to reflect changes in contract obligations and anticipated market conditions. Any early contract termination or unfavorable annual economic price adjustment or price redetermination could adversely affect our financial condition, results of operations and cash flows.
Moreover, entering into contracts with the U.S. government subjects us to a number of operational and compliance risks, including dependence on the level of government spending and compliance with and changes in governmental procurement and security regulations. We are subject to potential government investigations of our business practices and compliance with government procurement and security regulations, which are complex, and compliance with these regulations can be expensive and burdensome. If we were charged with wrongdoing as a result of an investigation, we could be suspended or debarred from bidding on or receiving awards of new contracts with the U.S. government or our existing contracts could be terminated, which could have a material adverse effect on our results of operations and cash flows.
General Risk Factors
New accounting standards or changes to existing accounting standards could materially impact how we report our results of operations, cash flowflows and financial condition.
Our Consolidated Financial Statements are prepared in accordance with GAAP. The SEC, the Financial Accounting Standards Board or other authoritative bodies or governmental entities may issue new pronouncements or new interpretations of existing accounting standards that may require us to change our accounting policies.policies or critical accounting estimates. These changes are beyond our control, can be difficult to predict and could materially impact how we report our results of operations, cash flowflows and financial condition. We could be required to apply a new or revised standard retroactively, which could also adversely affect our previously reported results of operations, cash flowflows and financial condition.
Undetected errors in internal controls and information reporting could result in the disallowance of cost recovery and noncompliant disclosure.
Our internal controls, accounting policies and practices and internal information systems are designed to enable us to capture and process transactions and information in a timely and accurate manner in compliance with GAAP, taxation requirements, federal securities laws and regulations and other laws and regulations applicable to us. We have also implemented corporate governance, internal control and accounting policies and procedures in connection with the Sarbanes-Oxley Act of 2002 (the “Sarbanes-Oxley Act”) and relevant SEC rules, as well as other applicable regulations. Such internal controls and policies have been and continue to be closely monitored by our management and Board of Directors to ensure continued compliance with these laws, rules and regulations. Management is also responsible for establishing and maintaining internal control over financial reporting and disclosure controls and procedures and is required to assess annually the effectiveness of these controls. While we believe these controls, policies, practices and systems are adequate to verify data integrity, unanticipated andor unauthorized actions of employees or temporary lapses in internal controls due to shortfalls in oversight or resource constraints could lead to undetected errors that could result in the disallowance of cost recovery and non-compliant disclosure and reporting. The consequences of these events could have a negative impact on our results of operations, cash flows and financial condition. The inability of management to certify as to the effectiveness of these controls due to the identification of one or more material weaknesses in these controls could also harm our reputation, increase financing costs or adversely affect our ability to access the capital markets.
Our continued success is dependent upon our ability to attract, hire and retain and utilizehighly qualified, personnel.skilled and/or diverse talent.
The success of our business is dependent upon our ability to attract, hire and retain and utilizehighly qualified, personnel,skilled and/or diverse talent, including engineers, licensed operators, water quality, and other operating and craft personnel,regulatory and management professionals who have the requireddesired experience and expertise. From timeSimilar to time, itother organizations, the Company may be difficulthave challenges implementing its human capital management, recruitment and employee succession plans to attract and retain qualified individuals with the expertisesuch talent based on a number of factors including, among others, market conditions, retirements and in the timeframe demanded for our business needs. In certain geographic areas, for example, we may not be able to satisfy the demand for our services because of our inability to successfully hire and retain qualified personnel.
In addition, as key personnel approach retirement age, we need to have appropriate succession plans in place and to successfully implement such plans.geography. If we cannot attract and retain qualified personnel or effectively implement appropriate succession plans,are unable to meet these human capital resource challenges, our business, financial condition, results of operations and cash flows may be materially and adversely impacted.
Our business may be adversely affected by the intentional misconduct of our employees and contractors.
Our Code of Ethics requires employees and contractors to make decisions ethically and in compliance with applicable law and regulatory requirements, and our Code of Ethics and its underlying policies, practices and procedures. All employees are required to complete training on and review the Code of Ethics on an annual basis, and violations of the Code of Ethics could result in disciplinary actions up to, and including, termination. Despite these efforts to prevent misconduct, it is possible for employees or contractors to engage in intentional misconduct and violate laws and regulations through, among other things, theft, fraud, misappropriation, bribery, corruption and engaging in conflicts of interest or related person transactions, or otherwise committing serious breaches of our Code of Ethics and our policies, practices and procedures. Intentional misconduct by employees or contractors could result in substantial liability, higher costs, increased regulatory scrutiny and significant reputational harm, any of which could have a material adverse effect on our financial condition, results of operations and cash flows.
ITEM 1B. UNRESOLVED STAFF COMMENTS
None.
ITEM 1C. CYBERSECURITY
The Company’s Cybersecurity Program
The Company’s cybersecurity program is an integral part of the long-term sustainability and effectiveness of the Company’s operational and technology environment. To protect the integrity of its data and operational and technology systems, the Company employs a “defense-in-depth” strategy that uses multiple security measures. This strategy aligns with the National Institute of Standards and Technology Cyber Security Framework and provides preventative, detective, and responsive measures to identify and manage risks. The Company periodically reviews and modifies the implementation of its cybersecurity strategy based on threat trends, program maturity, the results of assessments, and the advice of third-party security consultants.
The Company’s cybersecurity program includes the following areas of focus:
•Technology that includes, among other things, encryption, threat management, monitoring, investigation support and backups for physical devices, such as mobile phones and computers, connected to the Company network;
•Identity and access management controls that include, among other things, multi-factor authentication and safeguards associated with granting elevated privileges;
•Proactive cybersecurity processes, including vulnerability scanning, penetration testing and periodic program assessments by outside security consultants and assessors;
•Reactive cybersecurity processes that are regularly evaluated using various incident response and disaster recovery exercises;
•Employee cyber risk awareness and training, including regular simulation exercises with employees, that covers cybersecurity threats and actions to prevent and report attacks; and
•Third-party risk management and security standards, including due diligence, continuous monitoring, cyber risk scoring and contractual obligations, and periodic review of third-party control environments to align the Company’s risk exposure with its business requirements and risk tolerances.
Third-Party Relationships
The Company utilizes partners and third-party service providers to help deliver safe and reliable water and wastewater services across its regulated operations and has implemented a third-party risk management program to understand the cybersecurity risks to the Company that may arise out of these third-party relationships. The Company categorizes third-party relationships by risk level, which is determined primarily by the service provided by the third-party and its level of access to the Company’s data. Each category has specific cybersecurity controls, data privacy and documentation requirements, which are outlined in the agreement between the Company and the third-party service provider. In addition, the Company evaluates the online security footprint for its service providers at the time of agreement, and on a regular basis, thereafter, depending on the provider’s risk level. The Company reviews its agreements with third-party service providers periodically related to terms and conditions governing cybersecurity controls and data privacy. The Company also monitors, as appropriate, risks relating to potential compromises of sensitive Company information through third parties and reevaluates these risks periodically. In addition, the Company obtains annual attestation reports related to data security and privacy from certain third-party providers to further support compliance with industry-standard cybersecurity protocols.
Cybersecurity Risks
The Company believes that its current preventative actions and response activities provide reasonable measures of protection against security breaches and serve generally to reduce the Company’s overall cybersecurity risk. However, cybersecurity threats are constantly evolving and have and will continue to become more frequent and sophisticated. Although the Company has implemented measures that it believes are reasonable to safeguard its operational and technology systems and has sought to establish a culture of continuous monitoring and improvement, the evolving nature of cybersecurity attacks and vulnerabilities means that these protections may not always be effective. In addition, the Company has obtained insurance to provide coverage for a portion of the losses and damages that may result from a cyber attack or a security breach, but such insurance is subject to exclusions, limitations and exceptions, and may not cover the total loss or damage caused by an attack or breach. To date, management has determined that no cybersecurity incident experienced by the Company has resulted in a material impact on its financial condition, results of operations or business strategy. For additional information concerning cybersecurity-related risks, see Item 1A—Risk Factors—We may be subject to physical and cyber attacks, and —We may sustain losses that exceed or are excluded from our insurance coverage or for which we are self-insured.
Cybersecurity Risk Management and Strategy
The Company has established an enterprise-wide cybersecurity program designed to prevent disruption to critical information systems, minimize the loss or manipulation of sensitive information, and to timely identify, escalate and promptly remediate and recover from cybersecurity incidents and facilitate compliance with regulatory and disclosure requirements. To oversee cybersecurity risk management, the Company employs a dedicated unit, led by the Company’s Chief Security Officer (“CSO”), to implement cybersecurity controls, assess and report on cybersecurity risks and consult with the Company’s internal Enterprise Risk Management Committee, a decision-making body which supports and oversees the identification, assessment, prioritization, and mitigation strategies for enterprise-level risks, including cybersecurity risks. The Company’s CSO has 23 years of work experience in the cybersecurity field throughout various industries, including the utility sector, and has obtained several professional certifications, including from the International Information System Security Certification Consortium. The CSO reports directly to the Company's Chief Information Officer (“CIO”), who is responsible for the Company’s information technology program. The CIO has over 25 years of work experience in the information technology, physical security and cybersecurity fields, including previously serving as the Company’s CSO, and holds the Certified Protection Professional, Professional Certified Investigator and Physical Security Professional certifications from ASIS International. The CIO serves on the Water Sector Coordinating Council (“WSCC”), an advisory body comprised of representatives from various U.S. water and wastewater organizations, which serves as a policy, strategy and coordination mechanism for the water sector on critical infrastructure security and resilience issues. In that role, the CIO partners with representatives from the Department of Homeland Security and the EPA on U.S. water and wastewater sector initiatives. The CIO is also the former Chair of the WSCC, the National Association of Water Companies’ Safety and Security Committee, and the ASIS Utility Security Council.
The Company’s security team provides oversight and policy guidance on physical, cyber and information security, as well as business continuity, throughout the Company’s operations. It is responsible for designing, implementing, monitoring and supporting effective physical and technical security controls for the Company’s physical assets, business systems and operational technologies. The Company’s security team also conducts annual and ongoing cybersecurity awareness training and education for the Company’s employees. In 2023, 100% of the Company’s active workforce completed mandatory cybersecurity training. By equipping employees with knowledge and skills, the Company strives to cultivate and maintain a cybersecurity-conscious culture within its workforce.
The Company’s cybersecurity risk assessment process involves considering risks associated with the nature of its business, receiving and processing inputs from internal and external stakeholders, monitoring industry trends and risks and engaging external advisors, to assist in aligning the Company’s cybersecurity processes with industry best practices. Risk assessments are conducted quarterly and annually to evaluate the effectiveness of the Company’s existing security controls and serve as the basis for additional safeguards, security controls and measures. Operational and technical security controls are deployed and integrated as safeguards against unauthorized access to the Company’s information systems. These controls are aimed at (i) assuring the continuity of business processes that are dependent upon automation, (ii) maintaining the integrity of the Company’s data, (iii) supporting regulatory and legislative compliance requirements, and (iv) maintaining safe and reliable service to the Company’s customers.
The Company has also implemented a vulnerability assessment program that is conducted at least annually and more frequently, depending on the nature of the risk. This process serves as a guiding enterprise-wide framework to outline the scope and procedures of the Company’s cybersecurity risk management processes. By prioritizing vulnerability management and continuously evaluating the Company’s internal and external environments for vulnerabilities, the Company aims to implement preventative measures to protect its information assets and technology-based infrastructure from cybersecurity threats. This approach helps to reduce the Company’s exposure to material cybersecurity threat risks.
Incident Response
The Company utilizes an established internal framework designed to assess promptly the severity and materiality of cybersecurity incidents based on predefined quantitative and qualitative criteria and to determine the appropriate level of response. Incidents are escalated to the relevant management teams based on their severity and materiality for prompt response and mitigation. The Company maintains a standing crisis response team comprised of individuals from various functional units, including without limitation Information Technology, Legal, Finance, Enterprise Risk Management, Operations and Communications, to respond to cybersecurity and physical security incidents, environmental incidents and health and safety emergencies, among others.
If a cybersecurity incident were to occur, the Company would establish a cross-functional incident response team to respond to the specific cybersecurity incident. The incident response team would consist of a subset of members from the standing crisis response team, including personnel with the most relevant experience related to the specific incident. This collaborative approach is intended to enable the Company to leverage expertise throughout the business to address cybersecurity events and to evaluate the potential financial, legal, operational and reputational implications of an incident, or series of related incidents. In considering the materiality of an event, related attacks, whether in terms of quantity or impact, are reviewed individually and in the aggregate to determine whether they may have a significant impact on the Company’s financial condition, results of operations or business strategy, either quantitatively or qualitatively.
Cybersecurity Governance
The Board of Directors is responsible for oversight of the Company’s cybersecurity program and the Company’s responses to cybersecurity risk. The Board of Directors has delegated to the Safety, Environmental, Technology and Operations (“SETO”) Committee of the Board of Directors responsibility for the oversight and review of technology policy, strategy and governance, and cybersecurity issues that could impact the Company’s operational performance or risk profile. The SETO Committee meets at least quarterly and receives reports from the CIO and CSO related to cybersecurity threats, trends and risks, and related mitigation activities. In addition, the SETO Committee and the Board of Directors receive reports of periodic external assessments and internal testing of the effectiveness of the Company’s cybersecurity program. The SETO Committee coordinates with the Audit, Finance and Risk Committee of the Board of Directors, as appropriate, on matters related to cybersecurity risk. The Audit, Finance and Risk Committee is responsible for, among other things, overseeing the adequacy and effectiveness of the Company’s system of internal controls and the Company’s risk assessment and management strategy, including with respect to cybersecurity risks.
ITEM 2. PROPERTIES
The Company’s properties consist primarily of (i) water and wastewater treatment plants, (ii) mains and pipes used for transmission, distribution and collection of water and wastewater, (iii) wells and other sources of water supply, such as reservoirs, (iv) water and wastewater pumping stations, (v) meters and fire hydrants, (vi) general structures, including buildings, dams and treated water storage facilities, (vii) land and easements, (viii) vehicles, (ix) software rights, and (x) other equipment and facilities, the majority of which are used directly in the operation of its systems. Substantially all of the Company’s properties are owned by its subsidiaries, with a large percentage subject to liens of its mortgage bonds. A wholly owned subsidiary of parent company owns the Company’s corporate headquarters, located in Camden, New Jersey, and the Company and its operating subsidiaries lease office space, equipment and furniture from certain of the Company’s wholly owned subsidiaries. These properties are utilized by the Company’s directors, officers and staff in the conduct of the business.
The properties of the Company’s Regulated Businesses consist mainly of approximately:
•7980 surface water treatment plants;
•530540 groundwater treatment plants;
•150175 wastewater treatment plants;
•53,20053,700 miles of transmission, distribution and collection mains and pipes;
•1,1001,200 groundwater wells;
•1,6001,700 water and wastewater pumping stations;
•1,3001,100 treated water storage facilities; and
•7574 dams.
The Company has ongoing infrastructure renewal programs in all states in which its Regulated Businesses operate. These programs consist of both the rehabilitation of existing mains and equipment, and the replacement of mains and equipment that have been damaged or have reached, or are near, the end of their useful service lives. The properties of its Market-Based Businesseswithin Other consist mainly of office furniture and IT equipment. Approximately 52%50% of all properties that the Company owns are located in New Jersey and Pennsylvania.
The Company maintains property insurance against loss or damage to its properties by fire or other perils, subject to certain exceptions. For insured losses, the Company is self-insured to the extent that any losses are within the policy deductible or exceed the amount of insurance maintained.
The Company believes that its properties are generally maintained in good operating condition and in accordance with current standards of good water and wastewater industry practice.
ITEM 3. LEGAL PROCEEDINGS
Set forth below is information related to the Company’s material pending legal proceedings as of February 14, 2024, other than ordinary routine litigation incidental to the business, required to be disclosed in this Annual Report on Form 10-K. The information below should be read together with Note 16—Commitments and Contingencies in the Notes to the Consolidated Financial Statements. In accordance with the SEC’s disclosure rules, the Company has elected to disclose environmental proceedings involving the Company and a governmental authority if the amount of potential monetary sanctions, exclusive of interest and costs, that the Company reasonably believes will result from such proceeding is $1 million or more.
Alternative Water Supply in Lieu of Carmel River Diversions
Compliance with SWRCB Orders to Reduce Carmel River Diversions
Under the 2009 Order, California-American Water Company, the Company’s California subsidiary (“Cal Am”)Am is required, among other things, to decrease significantly its yearly diversions of water from the Carmel River according to a set reduction schedule. See Item 1—Business—Regulated Businesses—Water Supply and Wastewater Services and Item 1A—Risk Factors. The 2009 Order responded to claims that Cal Am had not sufficiently implemented actions to terminate its unpermitted diversions of water from the Carmel River as required by athe 1995 order ofOrder issued by the SWRCB. In July 2016, at the request of Cal Am and several Monterey County government agencies, the SWRCB issued the 2016 Order approving a deadline of December 31, 2021, for Cal Am’s compliance with the 2021 Deadline.
The 2009 Order includes a condition prohibiting Cal Am from diverting water from the Carmel River for new service connections or for any increased use of water at existing service addresses resulting from a change in zoning or use. In 2011, the California Public Utilities Commission (the “CPUC”) issued a decision directing modifications in Cal Am’s tariffs to recognize the moratorium mandated by the 2009 Order, and directing Cal Am to seek written guidance from the SWRCB with respect to any unresolved issues of interpretation or implementation of this condition. In 2012, the Deputy Director of the SWRCB sent a letter to Cal Am providing an interpretation as to the calculation of a baseline to determine increases in use of water at existing service addresses. In March 2018, the MPWMD adopted a resolution directing Cal Am to interpret the baseline in a manner that conflicts with the SWRCB’s written interpretation. In May 2018, Cal Am notified the MPWMD and the SWRCB that it intends to seek declaratory relief concerning the conflicting regulatory interpretations under the 2009 Order. In an attempt to resolve these conflicting interpretations prior to seeking judicial intervention, Cal Am has met with the MPWMD and the SWRCB several times. The SWRCB agreed to circulate revisions to its 2012 interpretive letter, which would be subject to a public comment period. Any failure to follow the MPWMD’s resolution or the SWRCB’s written interpretation, despite these conflicting interpretations, could potentially result in fines, penalties and other actions against Cal Am.
The 2016 Order provides that if the CPUC authorizes Cal Am to acquire more than 1,000 acre-feet per year of water from a source other than the Water Supply Project, proponents of the alternative water source could submit revised milestones to the SWRCB for consideration. See Monterey Peninsula Water Supply Project below. In May 2018, certain parties to the Water Supply Project proceeding submitted a petition to the SWRCB to add parallel milestones to the 2009 Order for 2019, 2020, and 2021, based on the proposed expansion of the Pure Water Monterey project, another groundwater replenishment project under construction on the Monterey peninsula. Petitioners claim that compliance with the alternate milestones would still provide for cessation of Cal Am’s unauthorized diversions from the Carmel River by 2021. A preliminary report on feasibility concluded that the expanded Pure Water Monterey project could provide an additional 2,250 acre-feet of water per year. Cal Am believes that (i) the petition is premature, (ii) the expanded Pure Water Monterey project is not yet a sufficiently certain or reliable water supply and, even if construction is successfully completed, would provide an insufficient quantity of water to allow full compliance with the 2009 Order, and (iii) the imposition of parallel milestones would distract from completion of the Water Supply Project. In December 2019, the SWRCB dismissed the petition without prejudice.
The 2016 Order imposes yearly milestones related to construction of the Water Supply Project’s desalination plant facilities. If any milestone is missed, the SWRCB may impose reductions of up to 1,000 acre-feet per year in the amount of water Cal Am is able to divert from the Carmel River. If a milestone is missed for reasons that are beyond Cal Am’s control, the SWRCB may waive the diversion reduction. On October 21, 2020, Cal Am reported to the SWRCB that, due to circumstances beyond its control, it will be unable to meet the 2020 milestones requiring intake well drilling and plant construction due to (i) delaysFollowing issuance by the California Coastal Commission (the “Coastal Commission”) in considering Cal Am’s application forNovember 2022, of a coastal development permit, for the desalination facility’s intake wells, and (ii) a stay issued by the Monterey Superior Court on physical construction of the desalination plant in pending litigation over the plant’s construction permit. Nevertheless, Cal Am reported that even with a 1,000 acre-foot reduction in Carmel River water supplies, it believed that customer demand could be met without additional rationing in the 2020-2021 water year. On November 17, 2020, the SWRCB provided its view to Cal Am that the milestone reductions were imposed to ensure a staggered approach to ending unauthorized diversions, and that regardless of fault a 1,000 acre-foot reduction was an appropriate and intended consequence of missing the milestone.
as described below, Cal Am continues to work constructively with all appropriate agencies to provide necessary information in connection with obtainingobtain the remaining required approvalspermits for the Water Supply Project. However, based on the matters discussed above and below in Item 3—Monterey Peninsula Water Supply Project, there can be no assurance that the Water Supply Project in its current configuration will be completed on a timely basis, if ever. Due toFor the delay in the approval schedule,year ended December 31, 2023, Cal Am currently does not believe that it will be able to fully complyhas complied with the diversion limitations contained in the 2016 Order. Continued compliance with the diversion limitations in 2024, and future years may be impacted by a number of factors, including without limitation potential recurrence of drought conditions in California and the reduction requirementsor exhaustion of water supply reserves, and other remaining requirements under thewill require successful development of alternate water supply sources sufficient to meet customer demand. The 2009 Order and the 2016 Order includingremain in effect until Cal Am certifies to the 2021 Deadline.SWRCB, and the SWRCB concurs, that Cal Am has obtained a permanent supply of water to substitute for past unauthorized Carmel River diversions. While the Company cannot currently predict the likelihood or result of any adverse outcome associated with these matters, further attempts to comply with the 2009 Order and the 2016 Order orin the 2021 Deadline,future may result in material additional costs and obligations to Cal Am, including fines and penalties against Cal Am in the event of noncompliance with the 2009 Order orand the 2016 Order.
Monterey Peninsula Water Supply Project
CPUC Final Approval of Water Supply Project
Cal Am’s ability to move forward on the Water Supply Project is and has been subject to extensive administrative review by the CPUC and other government agencies, obtaining necessary permits, and intervention from other parties. In September 2016, the CPUC unanimously approved a final decision to authorize Cal Am to enter into a water purchase agreement for the GWR Project and to construct a pipeline and pump station facilities and recover up to the incurred $50 million in associated costs plus AFUDC, subject to meeting certain criteria.
In September 2018, the CPUC unanimously approved another final decision finding that (i) the Water Supply Project meets the CPUC’s requirements for a CPCN (ii) the issuance of the final decision should not be delayed, and (iii) an additional procedural phase was not necessary to consider alternative projects. The CPUC’s 2018 decision concludes that the Water Supply Project is the best project to address estimated future water demands in Monterey, and, in addition to the cost recovery approved in its 2016 decision, adopts Cal Am’s cost estimates for the Water Supply Project, which amounted to an aggregate of $279 million plus AFUDC at a rate representative of Cal Am’s actual financing costs. The 2018 final decision specifies the procedures for recovery of all of Cal Am’s prudently incurred costs associated with the Water Supply Project upon its completion, subject to the frameworks included in the final decision related to cost caps, O&M costs, financing, ratemaking and contingency matters. The reasonableness of the Water Supply Project costs will be reviewed inby the first general rate case filed byCPUC when Cal Am after it becomes operational.seeks cost recovery for the Water Supply Project. Cal Am is also required to implement mitigation measures to avoid, minimize or offset significant environmental impacts from the construction and operation of the Water Supply Project and comply with a mitigation monitoring and reporting program, a reimbursement agreement for CPUC costs associated with that program, and reporting requirements on plant operations following placement of the Water Supply Project in service. Cal Am has incurred $154$241 million in aggregate costs as of December 31, 20202023, related to the Water Supply Project, which includes $36$72 million in AFUDC.
In September 2021, Cal Am, Monterey One Water and the MPWMD reached an agreement on Cal Am’s purchase of additional water from an expansion to the GWR Project, which is not expected to produce additional water until 2024 at the earliest. The amended and restated water purchase agreement for the GWR Project expansion is subject to review and approval of the CPUC, and in November 2021, Cal Am filed an application with the CPUC that sought review and approval of the amended and restated water purchase agreement. Cal Am also requested rate base treatment of the additional capital investment for certain Cal Am facilities required to maximize the water supply from the expansion to the GWR Project and a related Aquifer Storage and Recovery Project, totaling approximately $81 million. This requested amount was in addition to, and consistent in regulatory treatment with, the prior $50 million of cost recovery for facilities associated with the original water purchase agreement, which was approved by the CPUC in its unanimous 2016 final decision.
On December 5, 2022, the CPUC issued a final decision that authorizes Cal Am to enter into the amended water purchase agreement, and specifically to increase pumping capacity and reliability of groundwater extraction from the Seaside Groundwater Basin. The final decision sets the cost cap for the proposed facilities at approximately $62 million. Cal Am may seek recovery of amounts above the cost cap in a subsequent rate filing or general rate case. Additionally, the final decision authorizes AFUDC at Cal Am’s actual weighted average cost of debt for most of the facilities.
On December 30, 2022, Cal Am filed with the CPUC an application for rehearing of the CPUC’s December 5, 2022 final decision. On March 30, 2023, the CPUC issued a decision denying Cal Am’s application for rehearing but adopting its proposed AFUDC for already incurred and future costs. The decision also provides Cal Am the opportunity to serve supplemental testimony to increase its cost cap for certain of the Water Supply Project’s extraction wells. The amended water purchase agreement and a memorandum of understanding to negotiate certain milestones related to the expansion of the GWR Project have been signed by the relevant parties. Further hearings were scheduled in a Phase 2 to this CPUC proceeding to focus on updated supply and demand estimates for the Water Supply Project, and Phase 2 testimony was completed in September 2022.On October 23, 2023, a status conference was held to determine procedural steps to conclude the proceeding. Further evidentiary hearings in this proceeding have been scheduled for March 2024.
While Cal Am believes that its expenditures to date have been prudent and necessary to comply with the 2009 Order and the 2016 Order, as well as the CPUC’s 2016 and 2018relevant final decisions of the CPUC related thereto, Cal Am cannot currently predict its ability to recover all of its costs and expenses associated with the Water Supply Project and there can be no assurance that Cal Am will be able to recover all of such costs and expenses in excess of the $50$112 million in aggregate construction costs, plus applicable AFUDC, previously approved by the CPUC in its 2016 and December 2022 final decisions, as amended by its March 30, 2023 rehearing decision. See Note 17—16—Commitments and Contingencies in the Notes to the Consolidated Financial Statements for further discussion.
On July 2, 2019, Cal Am notified the MPWMD and Monterey One Water (collectively, the “Agencies”) that an event of default occurred under the water purchase agreement for the GWR Project because the Agencies failed to deliver to Cal Am by July 1, 2019 advanced treated recycled water produced by the GWR Project. Under the water purchase agreement, upon the occurrence of this event of default, Cal Am had the right to terminate the water purchase agreement immediately. Cal Am has elected not to exercise its right to terminate the water purchase agreement at this time, but in its notification to the Agencies, Cal Am expressly reserved its right to terminate the water purchase agreement until such time as the Agencies commence their required delivery of water from the GWR Project. On July 16, 2019, the MPWMD and Monterey One Water responded to Cal Am’s event of default notice and estimated that water delivery would begin by mid-October 2019. On December 12, 2019, Cal Am sent a letter to the Agencies requesting a status update with respect to the event of default. On January 2, 2020, Cal Am notified the Agencies that a second event of default occurred under the water purchase agreement because the Agencies failed to achieve the Performance Start Date (the date upon which the MPWMD’s performance obligations under the water purchase agreement were to commence) by January 1, 2020. Under the water purchase agreement, upon the occurrence of this event of default, Cal Am had the right to terminate the water purchase agreement immediately. Cal Am has elected not to exercise its right to terminate the water purchase agreement at this time, but in its notification to the Agencies, Cal Am expressly reserved its right to terminate the water purchase agreement until such time as the Performance Start Date has occurred. On July 30, 2020, the Agencies advised Cal Am that the Performance Start Date under the water purchase agreement for the GWR Project is September 1, 2020. After June 30, 2021, Cal Am will determine the amount of advanced treated recycled water produced by the GWR Project and delivered to Cal Am during the first fiscal year of the water purchase agreement, to determine the Agencies’ compliance with their performance obligations thereunder.
On April 17, 2019, Water Ratepayers Association of the Monterey Peninsula (“WRAMP”), a citizens’ advocacy group, filed an amended complaint in Monterey County Superior Court asserting a “qui tam” claim under the California False Claims Act on behalf of itself and the State of California against Cal Am and certain environmental consultants who worked on the CPUC’s environmental analysis of the MPWSP. The State Attorney General declined to proceed with this action after it was originally filed in 2016. On July 10, 2019, defendants filed a joint demurrer challenging the legal sufficiency of the allegations of the amended complaint. At an August 27, 2019 hearing on the demurrer, the court dismissed the petition without leave to amend. On October 17, 2019, WRAMP filed motions seeking clarification and a reconsideration of the court’s ruling. A hearing on these motions was set for December 3, 2019, but on November 26, 2019, WRAMP abandoned its motions and instead filed an appeal of the court’s dismissal. On November 17, 2020, WRAMP dismissed its appeal in exchange for a waiver of costs.
Coastal Development Permit Application
In June 2018, Cal Am submitted a coastal development permit application (the “Marina Application”) to the City of Marina (the “City”) for those project components of the Water Supply Project located within the City’s coastal zone. Members of the City’s Planning Commission, as well as City councilpersons, have publicly expressed opposition to the Water Supply Project. In May 2019, the City issued a notice of final local action based upon the denial by the Planning Commission of Cal Am’s coastal development permit application.the Marina Application. Thereafter, Cal Am appealed this decision to the Coastal Commission, as permitted under the City’s code and the California Coastal Act. At the same time, Cal Am submitted an application (the “Original Jurisdiction Application”) to the Coastal Commission for a coastal development permit for those project components located within the Coastal Commission’s original jurisdiction. In October 2019, staff of the Coastal Commission issued a report recommending a denial of Cal Am’s application for a coastal development permit with respect to the Water Supply Project, largely based on a memorandum prepared by the general manager of the MPWMD that contradicted findings made by the CPUC in its final decision approving the Water Supply Project. In November 2019, discussions between staffs of the Coastal Commission and the CPUC took place regarding theAfter Coastal Commission staff recommendation, at which time the CPUC raised questions about the Coastal Commission staff’s findings on water supply and demand, groundwater impacts and the viability of a project that the Coastal Commission staff believes may be a possible alternative to the Water Supply Project.
On August 25, 2020, the staff of the Coastal Commission released a report againissued reports recommending denial of Cal Am’s application for a coastal development permit. Although the report concluded that the Water Supply Project would have a negligible impactOriginal Jurisdiction Application, noting potential impacts on groundwater resources, the report also concluded it would impact other coastal resources, such as environmentally sensitive habitat areas and wetlands and that the Coastal Commission staff believes that a feasible alternative project exists that would avoid those impacts. The staff’s report also notedpossible disproportionate impacts to communities of concern. Onconcern, in September 16, 2020, Cal Am withdrew its original jurisdiction application to allow additional timethe Original Jurisdiction Application in order to address the Coastal Commission staff’s environmental justice concerns.The withdrawal of the original jurisdiction applicationOriginal Jurisdiction Application did not impact Cal Am’s appeal of the City’s denial of the Marina Application, which remains pending before the Coastal Commission.In November 2020, Cal Am refiled the original jurisdiction applicationOriginal Jurisdiction Application.
In October 2022, Cal Am announced a phasing plan for the proposed desalination plant component of the Water Supply Project. The desalination plant and slant wells originally approved by the CPUC would produce up to 6.4 million gallons of desalinated water per day. Under the phased approach, the facilities would initially be constructed to produce up to 4.8 million gallons per day of desalinated water, enough to meet anticipated demand through about 2030, and would limit the number of slant wells initially constructed. As demand increases in the future, desalination facilities would be expanded to meet the additional demand. The phased approach seeks to meet near-term demand by allowing for additional supply as it becomes needed, while also providing an opportunity for regional future public participation and was developed by Cal Am based on feedback received from the community.
In November 6, 2020. On December 3, 2020,2022, the Coastal Commission sentapproved the Marina Application and the Original Jurisdiction Application with respect to the phased development of the proposed desalination plant, subject to compliance with a number of conditions, all of which Cal Am expects to satisfy. Cal Am continues to seek the remaining permits necessary to construct the Water Supply Project.
In December 2022, the City, Marina Coast Water District (“MCWD”), MCWD’s groundwater sustainability agency (“GSA”), and the MPWMD jointly filed a petition for writ of mandate in Monterey County Superior Court against the Coastal Commission, alleging that the Coastal Commission violated the California Coastal Act and the California Environmental Quality Act in issuing a coastal development permit to Cal Am a noticefor construction of incomplete application, identifying certain additional information needed to consider the application complete.MPWSP slant wells. Cal Am is preparingnamed as a responsereal party in interest. On November 14, 2023, the court set an initial trial date of May 1, 2024. This matter remains pending.
Subject to the Coastal Commission’s notice.impact or resolution of this litigation, construction of the desalination plant is expected to begin in 2025 and the desalination plant is estimated to be in-service by the end of 2027.
Desalination Plant Development Permit
The proposed desalination plant for the Water Supply Project is to be located in an unincorporated portion of Monterey County, California, on a site owned by CEMEX, Inc. (“CEMEX”), and requires a combined development permit from theMonterey County of Monterey prior to commencement of construction. OnIn April 24, 2019, theMonterey County’s Planning Commission voted to approve the permit. In July 2019, the Board of Supervisors heard appeals filed by MCWD and a public advocacy group, at which time it denied the appeals and approved the permit. In August 2019, MCWD filed a petition in Monterey County Superior Court challenging Monterey County’s approval of Cal Am’s combined development permit application and seeking injunctive relief to enjoin Monterey County and Cal Am from commencing construction of the desalination plant. In October 2019, after a hearing, the court denied, without prejudice, MCWD’s motion for a preliminary injunction, but issued a stay of theMonterey County’s approval of the combined development permit, precluding commencement of physical construction of the desalination plant, but allowing Cal Am to continue to obtain permits needed for the desalination plant’s construction. OnIn January 21, 2021, the court issued its decision granting in part and denying in part MCWD’s petition. The court found that theMonterey County of Monterey did not completely comply with all of the requirements necessary to approve the combined development permit and set aside its approval so that theMonterey County could come into compliance. The court denied all of MCWD’s other claims. The court also lifted its stay on physical construction at the plant site.
In May 2021, Cal Am filed a notice of appeal as to the Monterey County Superior Court’s January 2021 decision, seeking to challenge the court’s decision on Monterey County’s statement of overriding considerations. Monterey County filed a notice of appeal as to the same issue in May 2021. In June 2021, MCWD filed cross-appeals on its claims that had been denied by the court. On September 8, 2023, the court of appeal issued its opinion reversing the trial court’s determination in favor of MCWD as to the statement of overriding considerations and rejecting MCWD’s appeals on all of its claims that the Monterey County Superior Court had denied. On September 25, 2023, MCWD filed a petition for rehearing in the court of appeal, which was denied on October 4, 2023. On November 13, 2023, MCWD filed a petition for review in the California Supreme Court, which was denied on January 10, 2024.
Proposed Zoning Changes at CEMEX Site for Slant Wells
In August 2018, the City circulated a public review draft of proposed amendments to its local coastal program and zoning ordinance, and placed the matter for consideration on the Planning Commission’s agenda for its September 2018 meeting. The proposed amendments would change zoning at the CEMEX site to open space and restrict future uses, including with respect to Cal Am’s planned use of the site for the slant wells for the Water Supply Project. Any change to the City'sCity’s local coastal program must ultimately be approved by the Coastal Commission. Cal Am, CEMEX and the Coastal Commission each submitted letters opposing the proposed amendments. At its November 2018 meeting, the Planning Commission adopted a resolution recommending that the Marina City Council consider approving the amendments.
In December 2018, the Marina City Council considered the proposed amendments. Cal Am, CEMEX and the Coastal Commission again submitted letters opposing the proposed changes, but the City Council unanimously adopted a resolution amending its local coastal plan and a draft amendment to its zoning ordinance. Changes to the ordinance require a second reading before becoming final, which occurred at the City’s December 2018 meeting. The changes to the local coastal plan mustwould need to be submitted to the Coastal Commission for approval; however, the Coastal Commission’s November 2022 approval of Cal Am’s coastal development permit application has rendered moot the impact of these proposed local coastal program and are not effective until such approval is obtained.
the coastal development permit. Test Slant Well Permitting
A preliminary step to building the Water Supply Project desalination plant is the construction and operation of a test slant well to confirm the suitability of the property on which intake wells will be located to draw water from under Monterey Bay. In November 2014, the Coastal Commission approved coastal development permits for the test slant well, enabling Cal Am to construct and operate the test slant well. Effective February 28, 2018, test slant well pumping ceased, except for minimal maintenance pumping activities, in accordance with Cal Am’s coastal development permits. Because Cal Am may use the test slant well as one of the slant wells for the Water Supply Project, Cal Am sought and obtained from the Coastal Commission permit amendments to allow the test slant well to remain in place and be maintained until February 28, 2022.2025. A required lease obtained from the California State Lands Commission, as amended, will expireexpires on December 16, 2022. Effective February 28, 2018, test slant well pumping ceased, except for minimal maintenance pumping activities, in accordance with Cal Am’s coastal development permits.2027.
Water Supply Project Land Acquisition and Slant Well Site Use
In July 2017, the Coastal Commission adopted a consent agreement and cease and desist order requiring sand mining operations on the property owned by CEMEX on which intake wells for the Water Supply Project will be located, to cease by the end of 2020 and the property to be sold to either a non-profit or governmental entity. The consent agreement strictly limits future use of the property but preserves Cal Am’s existing property rights and allows uses consistent with existing easements and other rights of record. A permanent easement granted by CEMEX to Cal Am was recorded in June 2018 to allow Cal Am access to the property and to construct, operate and maintain the Water Supply Project intake wells. OnIn November 26, 2019, the City notified CEMEX that, based on this permanent easement and Cal Am’s proposed use of the site for the intake wells, CEMEX has breached or will soon breach a prior 1996 annexation agreement (to which Cal Am was not a party). The City states that it intends to seek declaratory relief from CEMEX and Cal Am ordering that Cal Am’s extraction is limited to 500 acre-feet per year of groundwater, that Cal Am cannot export extracted water out of the basin, and that the permanent easement granted by CEMEX to Cal Am is void. The City has requested a meeting with CEMEX as part of a mandatory dispute resolution process under the annexation agreement prior to filing a lawsuit. CEMEX has denied the City’s claims and requested indemnification from Cal Am under the terms of the permanent easement. Cal Am and CEMEX believe that there is no valid limitation under the annexation agreement on Cal Am’s right to pump brackish groundwater and seawater at the site for desalination and use by Cal Am’s customers.
OnIn May 8, 2020, the City filed a lawsuit which it amended on June 29, 2020 and October 15, 2020, in Monterey County Superior Court, naming Cal Am and CEMEX as defendants, and MCWRA and MCWD as real parties in interest. The lawsuit, as amended, alleges a claim for breach of contract against CEMEX and seeks declaratory relief to void the permanent easement and prohibiting extraction of water by Cal Am’s slant wells at the CEMEX site in excess of 500 acre-feet per year and the export of such water outside the groundwater basin. OnIn November 17, 2020, Cal Am, CEMEX and MCWRA filed demurrers, which were overruled by the court at a hearing held onin February 9, 2021.
OnIn August 4, 2020, MCWD filed a cross-complaint in the May 8, 2020 lawsuit against Cal Am, CEMEX and MCWRA, alleging claims for specific performance of certain provisions of the 1996 annexation agreement related to the property owned by CEMEX on which intake wells for the Water Supply Project will be located, water rights, nuisance, unreasonable water use, and declaratory relief. On September 9, 2020, Cal Am filed a demurrer and motion to strike challenging theas well as claims asserted by MCWD. On October 14, 2020, the court sustained, with leave to amend, the demurrers as to the claims for specific performance, enjoinment of invasion of water rights, nuisance and unreasonable water use, and the court overruled the demurrers as to the claim forseeking additional declaratory relief. MCWDFollowing various rulings on demurrers filed a first amended complaint on November 13, 2020. On December 7, 2020,by Cal Am, CEMEX and MCWRA, filed demurrers to the amended claims. Onin February 23, 2021, the court sustained, without leave to amend, the demurrer to MCWD’s nuisance claim and overruled the remainder of the demurrers. In October 2021, the court granted a motion filed by Cal Am related to MCWD’s cross-complaint, which motion requested a referral of certain issues related to MCWD’s water rights and unreasonable use claims to the SWRCB for its expert advisory opinion. The SWRCB held hearings in 2022 and 2023, on the referred issues before its Administrative Hearing Officer. The Monterey County Superior Court has set a trial date of July 15, 2024, for the City’s lawsuit.
Challenges Related to Compliance with California’s Sustainable Groundwater Management Act
Under California’s Sustainable Groundwater Management Act (“SGMA”) enacted in 2015, groundwater basins designated by the state as critically overdrafted must be managed by a groundwater sustainability agency (“GSA”)GSA by 2020 in accordance with an approved groundwater sustainability plan (“GSP”) designed to achieve sustainability by 2040. Under the SGMA, GSAs have broad powers to achieve sustainability including, but not limited to, regulating groundwater extraction by imposing fees on groundwater extractions and controlling groundwater extractions by regulating, limiting or suspending extractions from wells. The 400-acre CEMEX site overlies a small portion of the 180/400 Subbasin of the Salinas Valley Groundwater Basin; the 84,000-acre 180/400 Subbasin has been designated by the state as critically overdrafted, mainly due to seawater intrusion into the subbasin.
In late 2016, the Salinas Valley Basin Groundwater Sustainability Agency (the “SVBGSA”) was formed as a joint powers authority to become the GSA for the Salinas Valley Groundwater Basin and prepare a GSP. In April 2018, the City filed a notice to become the GSA for the CEMEX site, creating an overlap with the SVBGSA’s filing for the 180/400 Subbasin. In 2016, the SVBGSA commenced preparation of a GSP covering the entire 180/400 subbasin, including the CEMEX site, but in August 2019 the City filed a notice that it intends to prepare its own GSP for the CEMEX site with the intent to severely limit or prohibit groundwater pumping at that site. The State Department of Water Resources (“SDWR”) has taken the position that until the overlap is resolved, it will not accept the GSP from either agency, placing the subbasin at risk of being placed in a probationary status and subject to state management. In December 2019, the County of Monterey filed its own notice to become the exclusive GSA at the CEMEX site in order to resolve the overlap, which is permitted under SGMA. SDWR accepted theMonterey County’s filing onin December 18, 2019, and now lists theMonterey County as the exclusive GSA for the site.
In December 30, 2019, the City filed a lawsuit in Monterey County Superior Court challenging theMonterey County’s filing, and SDWR’s acceptance of the filing, as the exclusive GSA for the CEMEX site. The City has named theMonterey County and its Board of Supervisors, the Countyits GSA, and SDWR and its director as defendants, and the SVBGSA and its Board of Directors as real parties. The City seeks to invalidate theMonterey County’s filing, as well as injunctive relief to preserve the City’s status as a GSA for the site. To protect its interest in the matter, Cal Am filed an application to intervene in this lawsuit, which was granted. A hearing has been scheduled for May 17, 2021.
OnMonterey County filed cross-claims against the City and SDWR. In September 14, 2020, Cal Am filed a separate but related complaint in Monterey County Superior Court challenging the validity of actions taken by the City and its GSA in adopting a groundwater sustainability plan for the CEMEX site, and the validity of the provisions of such plan. Due to the overlap of issues in the City’s lawsuit with those in the validation action, the parties stipulated to a stay of the validation action pending determination of the claims in the City’s action.action, which was approved by the court in December 2020. In February 2021, the City filed a separate but related in rem reverse validation complaint challenging the adoption by Monterey County of a GSP for the CEMEX site. On May 3, 2023, the City filed a second reverse validation complaint, challenging the adoption of amendments to the GSP for the 180/400 subbasin.
After a hearing, in August 2021, the court denied the claims brought by the City and granted Monterey County’s cross-claims, finding that the City’s GSA notice was untimely, the Monterey County GSA was the exclusive GSA for the CEMEX site, and the SVBGSA’s GSP was properly adopted for the entire 180/400 subbasin, including the CEMEX site. In November 2021, the City appealed this decision, and in December 2021, Monterey County appealed the court’s decision as to the finding that the City’s action creating a GSA was not void. The related validation and reverse validation actions remain stayed during the pendency of the appeal. On November 13, 2023, the California Court of Appeal affirmed the trial court's decision. On December 21, 2020,22, 2023, the court stayedCity filed a petition for review with the validation action.California Supreme Court.
ChallengeProposed Acquisition of Certification — Proposed Monterey System Acquisition Final Environmental Impact ReportAssets — Potential Condemnation
Local Agency Formation Commission Litigation
In November 2018, voters in Monterey, California passed “Measure J,” which decided that the MPWMD should conduct a feasibility study concerning the potential purchase of Cal Am’s Monterey system assets, and, if feasible, to proceed with a purchase of those assets without an additional public vote. This service territory represents approximately 40,000 customers. See Item 1—Business—Regulated Businesses—Condemnation and Eminent Domain for more information on this matter. In August 2019, the MPWMD’s General ManagerMPWMD issued a preliminary valuation and cost of service analysis report, finding in part that recommends that(1) an estimate of the MPWMD board, among other things, (1) evaluate whetherMonterey system assets’ total value plus adjustments would be approximately $513 million, (2) the cost of service modeling results indicate significant annual reductions in revenue requirements and projected monthly water bills, and (3) the acquisition of the Monterey system assets by the MPWMD is in the public interest and sufficiently satisfies the criterion of “feasible” as provided in Measure J, (2) ensure there is significant potential for cost savings before agreeing to commence an acquisition, and (3) develop more fully alternate operating plans before deciding whether to consider a Resolution of Necessity.
On October 7, 2020, the MPWMD issued a FEIR for the potential acquisition of the Monterey system assets, and on November 4,would be economically feasible. In 2020, the MPWMD certified the FEIR, which purports to analyzea final environmental impact report, analyzing the environmental impacts of the MPWMD’s project to (1) acquire the Monterey system assets through the power of eminent domain, if necessary, and (2) expand its geographic boundaries to include all parts of this system. On November 25, 2020,
In February 2021, the MPWMD filed an application with the Local Agency Formation Commission of Monterey County (“LAFCO”) seeking approval to become a retail water provider and annex approximately 58 parcels of land into the MPWMD’s boundaries. In June 2021, LAFCO’s commissioners voted to require a third-party independent financial study as to the feasibility of an acquisition by the MPWMD of the Monterey system assets. In December 2021, LAFCO’s commissioners denied the MPWMD’s application to become a retail water provider, determining that the MPWMD does not have the authority to proceed with a condemnation of the Monterey system assets. In April 2022, the MPWMD filed a lawsuit against LAFCO challenging its decision to deny the MPWMD’s application seeking approval to become a retail water provider. In June 2022, the court granted, with conditions, a motion by Cal Am to intervene in the MPWMD’s lawsuit against LAFCO. In December 2022, the court sustained in part, and denied in part, demurrers that had been filed by LAFCO seeking to dismiss the MPWMD’s lawsuit.
On December 11, 2023, the Monterey County Superior Court issued a petition for writ of mandate directing LAFCO to vacate and set aside its original denial of the MPWMD’s application to serve as a retail water provider (in conjunction with its effort to acquire the Monterey water system assets) and allowing the MPWMD to seek further LAFCO review of its application in compliance with all applicable law. The court held that LAFCO incorrectly applied two statutory standards and noted a lack of sufficient evidence to support certain of LAFCO’s factual findings. As a result, the LAFCO denial has been nullified and LAFCO will be required to hold another hearing on the MPWMD’s application. On February 8, 2024, and February 9, 2024, each of Cal Am and LAFCO, respectively, filed a notice of appeal with the California Court of Appeals regarding the Monterey County Superior Court’s decision to issue the writ of mandate. Cal Am is evaluating potential additional actions to contest the writ of mandate and to seek to uphold LAFCO’s denial of the MPWMD’s application, including filing other challenges and/or making suitable presentations at a subsequent LAFCO rehearing.
Potential Condemnation Actions by MPWMD
Separate from the proceedings related to the MPWMD’s application with LAFCO, by letter dated October 3, 2022, the MPWMD notified Cal Am of a decision to appraise the Monterey system assets and requesting access to a number of Cal Am’s properties and documents to assist the MPWMD with such an appraisal. Cal Am responded by letter on October 24, 2022, denying the request for access, stating that the MPWMD does not have the right to appraise Cal Am’s system without LAFCO approval to become a retail water provider. On April 28, 2023, Cal Am rejected an offer by the MPWMD to purchase the Monterey system assets for $448.8 million. Over the written and oral objections of Cal Am, at a hearing held on October 10, 2023, the MPWMD adopted a resolution of necessity to authorize it to file an eminent domain lawsuit with respect to the Monterey system assets.
On December 15, 2023, the MPWMD filed a lawsuit in Monterey County Superior Court challenging certificationseeking to condemn the Monterey system assets.While the Company cannot currently predict the outcome of this lawsuit, the FEIR, allegingCompany believes that, given existing legal precedent related to similar attempts by public agencies in California to take over water systems and its other defenses, Cal Am should be able to defend itself successfully against the MPWMD’s analysis of environmental impacts was inadequate and that certification was improper. This petition remains pending.
West Virginia Elk River Freedom Industries Chemical Spill
See Note 17—Commitments and Contingencies—Contingencies—West Virginia Elk River Freedom Industries Chemical Spill in the Notes to Consolidated Financial Statements for information regarding the final court approval of the global settlement with respect to the January 2014 Freedom Industries, Inc. chemical spill.eminent domain lawsuit.
Dunbar, West Virginia Water Main Break Class Action Litigation
On the evening of June 23, 2015, a 36-inch pre-stressed concrete transmission water main, installed in the early 1970s, failed. The water main is part of the West Relay pumping station located in the City of Dunbar, West Virginia and owned by West Virginia-American Water Company, the Company’s West Virginia subsidiary (“WVAWC”). The failure of the main caused water outages and low pressure for up to approximately 25,000 WVAWC customers. In the early morning hours of June 25, 2015, crews completed a repair, but that same day, the repair developed a leak. On June 26, 2015, a second repair was completed and service was restored that day to approximately 80% of the impacted customers, and to the remaining approximately 20% by the next morning. The second repair showed signs of leaking but the water main was usable until June 29, 2015, to allow tanks to refill. The system was reconfigured to maintain service to all but approximately 3,000 customers while a final repair was being completed safely on June 30, 2015. Water service was fully restored on July 1, 2015, to all customers affected by this event.
On June 2, 2017, a complaint captioned Jeffries, et al. v. West Virginia-American Water Company was filed in West Virginia Circuit Court in Kanawha County on behalf of an alleged class of residents and business owners who lost water service or pressure as a result of the Dunbar main break. The complaint alleges breach of contract by WVAWC for failure to supply water, violation of West Virginia law regarding the sufficiency of WVAWC’s facilities and negligence by WVAWC in the design, maintenance and operation of the water system. The Jeffries plaintiffs seek unspecified alleged damages on behalf of the class for lost profits, annoyance and inconvenience, and loss of use, as well as punitive damages for willful, reckless and wanton behavior in not addressing the risk of pipe failure and a large outage.
OnIn February 4, 2020, the Jeffries plaintiffs filed a motion seeking class certification on the issues of breach of contract and negligence, and to determine the applicability of punitive damages and a multiplier for those damages if imposed. OnIn July 14, 2020, the Circuit Court entered an order granting the Jeffries plaintiffs’ motion for certification of a class regarding certain liability issues but denying certification of a class to determine a punitive damages multiplier. OnIn August 31, 2020, WVAWC filed a Petition for Writ of Prohibition in the Supreme Court of Appeals of West Virginia seeking to vacate or remand the Circuit Court’s order certifying the issues class. At the request of the parties, on September 10, 2020, the Circuit Court ordered the stay of all matters in the class proceeding pending consideration of this petition. On December 3, 2020, the Supreme Court of Appeals issued an order to show cause stating that there are sufficient grounds for oral argument to consider prohibiting the class certification order. OnIn January 28, 2021, the Supreme Court of Appeals granted a motion by the Jeffries plaintiffs to remandremanded the case back to the Circuit Court for further consideration in light of a recent Supreme Court of Appeals decision issued in another case relating to the class certification issues raised.raised on appeal. In July 2022, the Circuit Court entered an order again certifying a class to address at trial certain liability issues but not to consider damages. In August 2022, WVAWC filed another Petition for Writ of Prohibition in the Supreme Court of Appeals of West Virginia challenging the West Virginia Circuit Court’s July 2022 order, which petition was denied on June 8, 2023. On August 21, 2023, the Circuit Court set a date of September 9, 2024, for a class trial on issues relating to duty and breach of that duty. The trial will not find class-wide or punitive damages.
The Company and WVAWC believe that WVAWC has meritorious defenses to the claims raised in this class action complaint and WVAWC will continue to vigorously defend itself against these allegations.
Chattanooga, Tennessee Class Action Litigation
On September 12, 2019, Tennessee-American Water Company, the Company’s Tennessee subsidiary (“TAWC”), experienced a leak in a 36-inch water transmission main, which caused service fluctuations or interruptions to TAWC customers and the issuance of a boil water notice. TAWC repaired the main by early morning on September 14, 2019, and restored full water service by the afternoon of September 15, 2019, with the boil water notice lifted for all customers on September 16, 2019.
On September 17, 2019, a complaint captioned Bruce, et al. v. American Water Works Company, Inc., et al. was filed in the Circuit Court of Hamilton County, Tennessee against TAWC, the Company and Service Company (collectively, the “Tennessee-American Water Defendants”), on behalf of a proposed class of individuals or entities who lost water service or suffered monetary losses as a result of the Chattanooga incident (the “Tennessee Plaintiffs”). The complaint alleged breach of contract and negligence against the Tennessee-American Water Defendants, as well as an equitable remedy of piercing the corporate veil. In the complaint as originally filed, the Tennessee Plaintiffs were seeking an award of unspecified alleged damages for wage losses, business and economic losses, out-of-pocket expenses, loss of use and enjoyment of property and annoyance and inconvenience, as well as punitive damages, attorneys’ fees and pre- and post-judgment interest.
On November 22, 2019, the Tennessee-American Water Defendants filed a motion to dismiss the complaint for failure to state a claim upon which relief may be granted, and, with respect to the Company, a motion to dismiss for lack of personal jurisdiction. After oral argument on the motion to dismiss, on In September 18, 2020, the court (i) granted the motion to dismiss the Tennessee Plaintiffs’ negligence claim against all Tennessee-American Water Defendants, (ii) denied the motion to dismiss the breach of contract claim against TAWC, (iii) held in abeyance the motion to dismiss the breach of contract claims against the Company and Service Company pending a further hearing and (iv) held in abeyance the Company’s motion to dismiss the complaint for lack of personal jurisdiction. On September 24, 2020, at the request of the Tennessee Plaintiffs, the court dismissed without prejudice all claims in the Bruce complaint against the Company and Service Company. The collective impact of the September 2020 court orders was that all of the Tennessee Plaintiffs’ claims in thistheir complaint, were dismissed, other thanexcept for the breach of contract claims against TAWC. OnTAWC, which remain pending. In October 16, 2020, TAWC answered the complaint, and the parties are commencing withhave been engaging in discovery. On January 12, 2023, after hearing oral argument, the court issued an oral ruling denying the Tennessee Plaintiffs’ motion for class certification. On February 9, 2023, the Tennessee Plaintiffs sought reconsideration of the ruling by the court, and any final ruling is appealable to the Tennessee Court of Appeals, as allowed under Tennessee law. On September 21, 2023, the court upheld its prior ruling but gave the Tennessee Plaintiffs the option to file an amended class definition. On October 12, 2023, the Tennessee Plaintiffs filed an amended class definition seeking certification of a business customer-only class. On December 1, 2023, TAWC filed a memorandum in opposition to the amended class definition.On January 18, 2024, the court heard oral argument on the motions but issued no decision. The court instead requested additional briefing and a second oral argument, deadlines for which have not yet been set.
TAWC and the Company believe that TAWC has meritorious defenses to the claims raised in this class action complaint, and TAWC is vigorously defending itself against these allegations.
Mountaineer Gas Company Main Break
During the afternoon of November 10, 2023, WVAWC was informed that an 8-inch ductile iron water main owned by WVAWC, located on the West Side of Charleston, West Virginia and originally installed in approximately 1989, experienced a leak. In the early morning hours of November 11, 2023, WVAWC crews successfully completed a repair to the water main. A precautionary boil water advisory was issued the same day to approximately 300 WVAWC customers and ultimately lifted on November 12, 2023.
On November 10, 2023, a break was reported in a low-pressure natural gas main located near the affected WVAWC water main break, and an inflow of water into the natural gas main and associated delivery pipelines occurred. The natural gas main and pipelines are owned by Mountaineer Gas Company, a regulated natural gas distribution company serving over 220,000 customers in West Virginia (“Mountaineer Gas”). The resulting inflow of water into the natural gas main and related pipelines resulted in a loss of natural gas service to approximately 1,100 Mountaineer Gas customers, as well as water entering customer service lines and certain natural gas appliances owned or used by some of the affected Mountaineer Gas customers. Mountaineer Gas reported that restoration of natural gas service to all affected gas mains occurred on November 24, 2023. The timing, order and causation of both the WVAWC water main break and Mountaineer Gas’s main break are currently unknown and under investigation.
To date, a total of four pending lawsuits have been filed against Mountaineer Gas and WVAWC purportedly on behalf of customers in Charleston, West Virginia related to these incidents. On November 14, 2023, a complaint captioned Ruffin et al. v. Mountaineer Gas Company and West Virginia-American Water Company was filed in West Virginia Circuit Court in Kanawha County on behalf of an alleged class of Mountaineer Gas residential and business customers and other households and businesses supplied with natural gas in Kanawha County, which lost natural gas service on November 10, 2023, as a result of these events. The complaint alleges, among other things, breach of contract by Mountaineer Gas, trespass by WVAWC, nuisance by WVAWC, violation of statutory obligations by Mountaineer Gas and WVAWC, and negligence by Mountaineer Gas and WVAWC. The complaint seeks class-wide damages against Mountaineer Gas and WVAWC for loss of use of natural gas, annoyance, inconvenience and lost profits, as well as punitive damages.
On November 15, 2023, a complaint captioned Toliver et al. v. West Virginia-American Water Company and Mountaineer Gas Company was filed in West Virginia Circuit Court in Kanawha County on behalf of an alleged class of all natural persons or entities who are citizens of the State of West Virginia and who are customers of WVAWC and/or Mountaineer Gas in the affected areas. The complaint alleges against Mountaineer Gas and WVAWC, among other things, negligence, nuisance, trespass and strict liability, as well as breach of contract against Mountaineer Gas. The complaint seeks class-wide damages against Mountaineer Gas and WVAWC for property damage, loss of use and enjoyment of property, annoyance and inconvenience and business losses, as well as punitive damages.
On November 16, 2023, a complaint captioned Dodson et al. v. West Virginia American Water and Mountaineer Gas Company was filed in West Virginia Circuit Court in Kanawha County on behalf of an alleged class of all West Virginia citizens living between Pennsylvania Avenue south of Washington Street, and Iowa Street, who are customers of Mountaineer Gas. The complaint alleges against Mountaineer Gas and WVAWC, among other things, negligence, nuisance, trespass, statutory code violations and unfair or deceptive business practices. The complaint seeks class-wide damages against Mountaineer Gas and WVAWC for property loss and damage, loss of use and enjoyment of property, mental and emotional distress, and aggravation and inconvenience, as well as punitive damages.
On January 4, 2024, a fourth complaint, captioned Thomas v. West Virginia-American Water Company and Mountaineer Gas Company, was filed in West Virginia Circuit Court in Kanawha County asserting similar allegations as those included in the Ruffin, Toliver and Dodson lawsuits (the “first three lawsuits”), with the addition of counts alleging unjust enrichment and violations of the West Virginia Human Rights Act and the West Virginia Consumer Credit and Protection Act.
On November 17, 2023, the Ruffin plaintiff filed a motion to consolidate the first three lawsuits before a single judge in Kanawha County Circuit Court. That motion remains pending.
On December 5, 2023, a complaint captioned Mountaineer Gas Company v. West Virginia-American Water Company was filed in West Virginia Circuit Court in Kanawha County seeking damages under theories of trespass, negligence and implied indemnity. The damages being sought related to the incident include, among other things, repair and response costs incurred by Mountaineer Gas and attorneys’ fees and expenses incurred by Mountaineer Gas. On December 14, 2023, Mountaineer Gas filed a motion with the Supreme Court of West Virginia to transfer this case to the West Virginia Business Court. On December 29, 2023, WVAWC filed a joinder in the motion to transfer the case. WVAWC has also filed a partial motion to dismiss this lawsuit. These motions remain pending.
On December 20, 2023, Mountaineer Gas filed answers to each of the first three lawsuits, which included cross-claims against WVAWC alleging that Mountaineer Gas is without fault for the claims and damages alleged in the lawsuits and WVAWC should be required to indemnify Mountaineer Gas for any damages and for attorneys’ fees and expenses incurred by Mountaineer Gas in the lawsuits. WVAWC has filed a partial motion to dismiss certain claims in the Ruffin, Toliver,Dodson and Thomas lawsuits and a motion to dismiss the cross-claims asserted against WVAWC therein by Mountaineer Gas. On January 30, 2024, a motion was filed with the West Virginia Supreme Court on behalf of the Toliver plaintiff to refer the four class action complaints and the Mountaineer Gas complaint to the West Virginia Mass Litigation Panel. On February 7, 2024, WVAWC filed a motion joining in that referral request. These motions remain pending.
On December 6, 2023, WVAWC initiated a process whereby Mountaineer Gas customers could file claims with WVAWC and seek payment from WVAWC of up to $2,000 per affected household for the inconvenience arising from a loss of use of their appliances and documented out-of-pocket expenses as a result of the natural gas outage. As of January 31, 2024, a total of 412 Mountaineer Gas customers completed this claims process and were paid by WVAWC an average of approximately $1,500 each. In return, these customers were required to execute a partial release of liability in favor of WVAWC.
On November 16, 2023, the Public Service Commission of West Virginia (the “WVPSC”) issued an order initiating a general investigation into both the water main break and natural gas outages occurring in this incident to determine the cause or causes thereof, as well as breaks and outages generally throughout the systems of WVAWC and Mountaineer Gas and the utility practices of both utilities. Following a series of disagreements among the parties regarding the scope of discovery, the WVPSC closed the general investigation into both utilities and ordered a separate general investigation for each utility. The WVPSC focused the two general investigations away from the cause of the events and instead on the maintenance practices of each utility during and after the main breaks. On January 29, 2024, the Consumer Advocate Division of the WVPSC filed a motion to intervene in the WVAWC general investigation. WVAWC is cooperating with its general investigation. Both general investigations remain pending.
The Company and WVAWC believe that the causes of action and other claims asserted against WVAWC in the class action complaints and the lawsuit filed by Mountaineer Gas are without merit and that WVAWC has meritorious defenses to such claims, and WVAWC is defending itself vigorously in these litigation proceedings. Given the current stage of these proceedings and the general investigation, the Company and WVAWC are currently unable to predict the outcome of any of the proceedings described above.
West Virginia Elk River Freedom Industries Chemical Spill
See Note 16—Commitments and Contingencies—Contingencies—West Virginia Elk River Freedom Industries Chemical Spill in the Notes to Consolidated Financial Statements for information regarding the final court approval of the global settlement with respect to the January 2014 Freedom Industries, Inc. chemical spill.
PFAS Multi-District Litigation
Several of the Company’s utility subsidiaries are parties to a multi-district litigation (the “MDL”) lawsuit, which commenced on December 7, 2018, in U.S. District Court for the District of South Carolina, against manufacturers of certain PFAS for damages, contribution and reimbursement of costs incurred and continuing to be incurred to address the presence of such PFAS in public water supply systems owned and operated by these utility subsidiaries and throughout their service areas. In August 2023, a potential class action settlement involving defendants The Chemours Company, Corteva, Inc. and DuPont de Nemours, Inc. to resolve claims brought in the MDL against them by public water systems, and a similar class action settlement with defendant 3M Company, received preliminary approval from the MDL court. The Company’s utility subsidiaries have determined to remain parties to these class action settlements. On February 8, 2024, after a hearing on December 14, 2023, the MDL court issued its final approval of the DuPont settlement, and the Company will begin the process of perfecting its claims under this settlement within the time period to be provided by the MDL court. A fairness hearing on the 3M settlement was held on February 2, 2024. This matter remains pending.
Other Matters
In April 2021, American Water Resources, LLC (“AWR”), which, prior to the December 2021 sale of the Company’s former Homeowner Services Group business (“HOS”) was one of the indirect, wholly owned subsidiaries comprising that business, received a grand jury subpoena in connection with an investigation by the U.S. Attorney’s Office for the Eastern District of New York (the “EDNY”). The subpoena sought documents regarding AWR’s operations and its contractor network in the New York City metropolitan area. In September 2022, a former employee of AWR pled guilty in U.S. District Court to two felony counts in connection with the matters under investigation by the EDNY. The Company fully cooperated with the EDNY investigation. There are currently no pending requests from the EDNY for additional information and the Company has not been contacted by the EDNY about the investigation since July 2023. While the EDNY has not formally communicated that its investigation is complete, the Company does not believe that the investigation will have a material adverse effect on the Company’s results of operations, financial condition or liquidity.
General
Periodically, the Company is involved in other proceedings or litigation arising in the ordinary course of business. Other than those proceedings described in this Item 3—Legal Proceedings, the Company does not believe that the ultimate resolution of these matters will materially affect its financial position or results of operations. However, litigation and other proceedings are subject to many uncertainties, and the outcome of individual matters is not predictable with assurance. It is possible that some litigation and other proceedings could be decided unfavorably to the Company, and that any such unfavorable decisions could have a material adverse effect on its business, financial condition, results of operations and cash flows.
ITEM 4. MINE SAFETY DISCLOSURES
Not applicable.
PART II
ITEM 5. MARKET FOR REGISTRANT’S COMMON EQUITY, RELATED STOCKHOLDER MATTERS AND ISSUER PURCHASES OF EQUITY SECURITIES
Since April 23, 2008, the Company’s common stock has traded on the New York Stock Exchange (“NYSE”) under the symbol “AWK.” As of February 19, 2021,6, 2024, there were 181,439,255194,755,320 shares of common stock outstanding held by approximately 2,4272,101 record holders. Holders of the Company’s common stock are entitled to receive dividends when they are declared by its Board of Directors. See Note 10—9—Shareholders’ Equity in the Notes to Consolidated Financial Statements for additional information regarding the Company’s dividends.
In February 2015, the Board of Directors authorized an anti-dilutive stock repurchase program to mitigate the dilutive effect of shares issued through the Company’s dividend reinvestment, employee stock purchase and executive compensation activities. The program allows the Company to purchase up to 10 million shares of its outstanding common stock over an unrestricted period of time in the open market or through privately negotiated transactions. The program is conducted in accordance with Rule 10b-18 of the Exchange Act, and, to facilitate these repurchases, the Company enters into Rule 10b5-1 stock repurchase plans with a third-party broker, which allow the Company to repurchase shares of its common stock at times when it otherwise might be prevented from doing so under insider trading laws or because of self-imposed trading blackout periods. Subject to applicable regulations, the Company may elect to amend or cancel the program or the stock repurchase parameters at its discretion to manage dilution.
From April 1, 2015, the date repurchases under the anti-dilutive stock repurchase program commenced, through December 31, 2020,2023, the Company repurchased an aggregate of 4,860,000 shares of its common stock under the program, leaving an aggregate of 5,140,000 shares available for repurchase under this program. There were no repurchases of common stock in 2020.2023.
ITEM 6. SELECTED FINANCIAL DATA
| | | | | | | | | | | | | | | | | | | | | | | | | | | | | |
| | For the Years Ended December 31, |
| (In millions, except per share data) | 2020 | | 2019 | | 2018 | | 2017 | | 2016 |
| Statement of Operations data: | | | | | | | | | |
| Operating revenues | $ | 3,777 | | | $ | 3,610 | | | $ | 3,440 | | | $ | 3,357 | | | $ | 3,302 | |
| Net income attributable to common shareholders | 709 | | | 621 | | | 567 | | | 426 | | | 468 | |
| Net income attributable to common shareholders per basic common share | $ | 3.91 | | | $ | 3.44 | | | $ | 3.16 | | | $ | 2.39 | | | $ | 2.63 | |
| Net income attributable to common shareholders per diluted common share | 3.91 | | | 3.43 | | | 3.15 | | | 2.38 | | | 2.62 | |
| Balance Sheet data: | | | | | | | | | |
| Total assets | $ | 24,766 | | | $ | 22,682 | | | $ | 21,223 | | | $ | 19,482 | | | $ | 18,482 | |
| Long-term debt and redeemable preferred stock at redemption value | 9,333 | | | 8,644 | | | 7,576 | | | 6,498 | | | 5,759 | |
| Other data: | | | | | | | | | |
| Cash dividends declared per common share | $ | 2.20 | | | $ | 2.00 | | | $ | 1.82 | | | $ | 1.66 | | | $ | 1.50 | |
Net cash provided by operating activities (a) (b) | 1,426 | | | 1,383 | | | 1,386 | | | 1,449 | | | 1,289 | |
Net cash used in investing activities (b) | (2,061) | | | (1,945) | | | (2,036) | | | (1,672) | | | (1,590) | |
Net cash provided by financing activities (a) (b) | 1,120 | | | 494 | | | 726 | | | 207 | | | 328 | |
| Capital expenditures included in net cash used in investing activities | (1,822) | | | (1,654) | | | (1,586) | | | (1,434) | | | (1,311) | |
(a) The information for the year ended December 31, 2016 has been revised to reflect the retrospective application of Accounting Standards Update 2016-09, Improvements to Employee Share-Based Payment Accounting, which was adopted by the Company as of January 1, 2017.
(b) The information for the year ended December 31, 2016 has been revised to reflect the retrospective application of Accounting Standards Update 2016-18, Restricted Cash, which was adopted by the Company as of December 31, 2017.[RESERVED]
ITEM 7. MANAGEMENT’S DISCUSSION AND ANALYSIS OF FINANCIAL CONDITION AND RESULTS OF OPERATIONS
The following discussion should be read together with the Consolidated Financial Statements and the Notes thereto included elsewhere in this Annual Report on Form 10-K. This discussion contains forward-looking statements that are based on management’s current expectations, estimates and projections about the Company’s business, operations and financial performance. The cautionary statements made in this Form 10-K should be read as applying to all related forward-looking statements whenever they appear in this Form 10-K. The Company’s actual results may differ materially from those currently anticipated and expressed in such forward-looking statements as a result of a number of factors, including those that are discussed under “Forward-Looking Statements,” Item 1A—Risk Factors and elsewhere in this Form 10-K. The Company has a disclosure committee consisting of members of senior management and other key employees involved in the preparation of the Company’s SEC reports. The disclosure committee is actively involved in the review and discussion of the Company’s SEC filings. For a discussion and analysis of the Company’s financial statements for fiscal 20192022 compared to fiscal 2018,2021, please refer to Item 7—Management’s Discussion and Analysis of Financial Condition and Results of Operations in the Company’s Annual Report on Form 10-K for the year ended December 31, 2019,2022, filed with the SEC on February 18, 2020.15, 2023.
Overview
American Water is the largest and most geographically diverse, publicly-traded water and wastewater utility company in the United States, as measured by both operating revenues and population served. The Company employs approximately 7,0006,500 professionals who provide drinking water, wastewater and other related services to over 1514 million people in 4624 states. The Company’s primary business involves the ownership of utilities that provide water and wastewater services to residential, commercial, industrial, public authority, fire service and sale for resale customers, collectively presented as the “Regulated Businesses.” The Company’s utilities operate in overapproximately 1,700 communities in 1614 states in the United States, with 3.5 million active customers with services provided by its water and wastewater networks. Services provided by the Company’s utilities are subject to regulation by PUCs. The Company also operates market-basedother businesses not subject to economic regulation by state PUCs that provide water wastewater and otherwastewater services to residential and smaller commercial customers, the U.S. government on military installations, as well as municipalities, and utility customers, collectively presented as the “Market-Based Businesses.throughout this Form 10-K within “Other.” These Market-Based Businesses are not subject to economic regulation by state PUCs. See Item 1—Business for additional information.
Novel Coronavirus (COVID-19) Pandemic UpdateSelected Financial Data
American Water has been monitoringThis selected financial data below should be read in conjunction with the global impact of COVID-19 pandemic and has taken steps to mitigate adverse impacts to the Company. The Company has three main areas of focus as part of its response to COVID-19: the care and safety of its employees; the safety of its customers and the communities it serves; and the execution of its business continuity plan. American Water continues to work with its vendors to prevent disruptions in its supply chain, and, at this time, has not experienced, and does not anticipate, any material negative impacts. The Company has also been monitoring the impacts of the pandemic on its access to the capital markets, and to the extent such access is adversely affected, American Water may need to consider alternative sources of funding for its operations and for working capital, any of which could increase its cost of capital.
This pandemic continues to evolve, and American Water continues to monitor developments affecting its employees, customers, contractors and vendors and will take additional actions as warranted. To date, the Company has experienced COVID-19 financial impacts, including an increase in uncollectible accounts expense, additional debt costs, and certain incremental operation and maintenance (“O&M”) expenses.The Company has also experienced decreased revenues as a result of the suspension of late fees and foregone reconnect fees. These impacts are collectively referred to as “financial impacts.” See Note 3—Impact of Novel Coronavirus (COVID-19) Pandemic in the Notes toCompany’s Consolidated Financial Statements for additional information. The extent to which COVID-19 may further impact American Water, including without limitation, its liquidity, financial condition, and results of operations, will dependrelated Notes in this Annual Report on future developments, which presently cannot be predicted.
As of February 24, 2021, American Water has commission orders authorizing deferred accounting for COVID-19 financial impacts in 11 of 14 jurisdictions, with proceedings in two jurisdictions pending. In addition to approving deferred accounting, to date, two regulatory jurisdictions have also approved cost recovery mechanisms for specified COVID-19 financial impacts. Regulatory actions to date are presented inForm 10-K as well as the table below:
| | | | | | | | | | | | | | |
Commission Actions | | Description | | States |
Orders issued | | Allows the Company to establish regulatory assets to record certain financial impacts related to the COVID-19 pandemic. | | CA, HI, IA, IL, IN, MD, MO, NJ, PA, VA, WV |
Cost recovery mechanisms | | California’s Catastrophic Event Memorandum Account allows the Company to track and recover certain financial impacts related to the COVID-19 pandemic. Illinois has authorized cost recovery of COVID-19 financial impacts through a special purpose rider over a 24-month period, which was implemented by the Company’s Illinois subsidiary effective October 1, 2020. Additionally, Illinois approved a bad debt rider tariff on December 16, 2020. This rider will allow the Company to collect actual bad debt expense over last authorized beginning March 2021 over a 24-month period. | | CA, IL |
Proceedings pending | | Pending proceedings considering deferred accounting authorization for the future recovery of COVID-19 financial impacts. | | NY, TN |
Consistent with these regulatory orders, the Company has recorded $30 million in regulatory assets and $4 million of regulatory liabilities for the financial impacts related to the COVID-19 pandemic on the Consolidated Balance Sheets as of December 31, 2020. On December 30, 2020, the Company’s Kentucky subsidiary received an order denying its request to defer to a regulatory asset the financial impacts related to the COVID-19 pandemic.
As of February 24, 2021, six states have ordered active moratoria on the suspension of service disconnections due to non-payment.The moratoria on disconnects have expired in eight states. The Company continues to monitor the evolving COVID-19 pandemic and will continue to comply with the current ordered moratoria and any future moratoria implemented.
Financing Activities
To ensure adequate liquidity given the impacts of the COVID-19 pandemic on debt and capital markets, on March 20, 2020, parent company and American Water Capital Corp. (“AWCC”), parent company’s wholly owned finance subsidiary, entered into a Term Loan Credit Agreement that provides for a 364-day term loan facility of up to $750 million (the “Term Loan Facility”). On March 20, 2020, AWCC borrowed $500 million under the Term Loan Facility, the proceeds of which were used for general corporate purposes of AWCC and American Water, and to provide additional liquidity. The Term Loan Facility allowed for a single additional borrowing of up to $250 million, which expired unused on June 19, 2020. See Note 13—Short-Term Debt in the Notes to Consolidated Financial Statements for additional information.
On April 14, 2020, AWCC completed a $1.0 billion debt offering which included the sale of $500 million aggregate principal amount of its 2.80% senior notes due 2030 and $500 million aggregate principal amount of its 3.45% senior notes due 2050. Net proceedsremainder of this offering were used to lend funds to parent companyItem 7—Management’s Discussion and its regulated subsidiaries, repay various senior notesAnalysis of Financial Condition and regulated subsidiary debt obligations at maturity, repay commercial paper obligations and short-term indebtedness under AWCC’s unsecured revolving credit facility, and for general corporate purposes. See Note 12—Long-Term Debt in the Notes to Consolidated Financial Statements for additional information.Results of Operations.
The Company sought to take advantage of lower interest rates available in the capital markets in 2020 by refinancing long-term debt, where possible. In 2020, AWCC and the Company’s regulated subsidiaries issued in the aggregate $311 million of private activity bonds and government funded debt in multiple transactions with annual interest rates ranging from 0.60% to 1.20%, maturing in 2023 to 2027. The Company used these proceeds to retire an aggregate of $311 million of long-term debt issues at maturity with annual interest rates ranging from 4.45% to 5.60%. | | | | | | | | | | | | | | | | | | | | | | | | | | | | | |
| | For the Years Ended December 31, |
| (In millions, except per share data) | 2023 | | 2022 | | 2021 | | 2020 | | 2019 |
| Statement of Operations data: | | | | | | | | | |
| Operating revenues | $ | 4,234 | | | $ | 3,792 | | | $ | 3,930 | | | $ | 3,777 | | | $ | 3,610 | |
| Net income attributable to common shareholders | 944 | | | 820 | | | 1,263 | | | 709 | | | 621 | |
| Net income attributable to common shareholders per basic common share | 4.90 | | | 4.51 | | | 6.96 | | | 3.91 | | | 3.44 | |
| Net income attributable to common shareholders per diluted common share | 4.90 | | | 4.51 | | | 6.95 | | | 3.91 | | | 3.43 | |
| Balance Sheet data: | | | | | | | | | |
| Total assets | $ | 30,298 | | | $ | 27,787 | | | $ | 26,075 | | | $ | 24,766 | | | $ | 22,682 | |
| Long-term debt and redeemable preferred stock at redemption value | 11,718 | | | 10,929 | | | 10,344 | | | 9,333 | | | 8,644 | |
| Other data: | | | | | | | | | |
| Cash dividends declared per common share | $ | 2.83 | | | $ | 2.62 | | | $ | 2.41 | | | $ | 2.20 | | | $ | 2.00 | |
| Net cash provided by operating activities | 1,874 | | | 1,108 | | | 1,441 | | | 1,426 | | | 1,383 | |
| Net cash used in investing activities | (2,815) | | | (2,127) | | | (1,536) | | | (2,061) | | | (1,945) | |
| Net cash provided by (used in) financing activities | 1,188 | | | 1,000 | | | (345) | | | 1,120 | | | 494 | |
| Capital expenditures included in net cash used in investing activities | (2,575) | | | (2,297) | | | (1,764) | | | (1,822) | | | (1,654) | |
Financial Results
For the years ended December 31, 2020, 20192023, 2022 and 2018,2021, diluted earnings per share (GAAP) were $3.91, $3.43$4.90, $4.51 and $3.15,$6.95, respectively. In 2020,2023, as compared to 2019,2022, diluted earnings per share increased $0.48. This$0.39. The increase was primarily driven by continued growththe implementation of new rates in the Regulated Businesses for the return on and recovery of capital and acquisition investments, offset somewhat by increased operating costs, primarily production costs from infrastructure investment, acquisitionsinflationary pressures, and organic growth, as well ashigher pension costs. Results for 2023 reflect the benefit from depreciation expense related to the assets of the Company’s New York subsidiary, as required by assets held for sale accounting. Revenues increased as a resultnet favorable impact of warmer, and drier thanweather compared to normal, estimated at $0.13 per share, while results for 2022 reflect the net favorable impact of weather duringcompared to normal, estimated at $0.06 per share. Results for 2023 also reflect the third quarterimpact of 2020 across several of the Company’s subsidiaries, contributing a benefit of $0.07 per diluted share for 2020. Revenuesdilution from the Company’s residential customers increased from many states experiencing work from home activities dueequity financing of $0.29 per share, roughly equivalent to avoided interest expense on the COVID-19 pandemic, which were largely offset by decreased revenues from the Company’s commercialyear.
Growth Through Capital Investment in Infrastructure and industrial customers as a result of the COVID-19 pandemic. Partially offsetting these increases were estimated impacts from the COVID-19 pandemic on HOS from increased claims that likely have resulted from more work from home activity. During the fourth quarter of 2019, the Company recognized a loss of $0.19 per diluted share, relating to the sale of its Keystone operations. Additionally, during the first quarter of 2019, the Company recorded a benefit of $0.01 per diluted share from the reduction of the liability related to the Freedom Industries chemical spill settlement in West Virginia.
Growth—through capital investment in infrastructure and regulated acquisitions, as well as strategic growth opportunities in the Market-Based BusinessesRegulated Acquisitions
The Company expects to continuecontinues to grow its businesses, with the substantial majority of its growth to be achieved in the Regulated Businesses through (i) continued capital investment in the Company’s infrastructure to provide safe, clean, reliable and affordable water and wastewater services to its customers, and (ii) regulated acquisitions to expand the Company’s services to new customers. The Company also expects to continue to grow the Market-Based Businesses, which leverages its core water and wastewater competencies. In 2020,2023, the Company invested $1.9$2.7 billion, primarily in the Regulated Businesses, as discussed below:
Regulated Businesses Growth and Optimization
•$1.82.6 billion capital investment in the Regulated Businesses, the substantial majority for infrastructure improvements and replacements; and
•$13581 million to fund acquisitions, including deposits for pending acquisitions, in the Regulated Businesses, which added approximately 37,800 water and wastewater18,100 customers during 2020,2023, in addition to approximately 14,50018,800 customers added through organic growth during 2020.2023.
During 2021,This includes the Company closed on theCompany’s New Jersey subsidiary’s acquisition of two regulatedthe water and wastewater systems addingassets of Egg Harbor City on June 1, 2023, for a cash purchase price of $22 million, $2 million of which was funded as a deposit to the seller in March 2021 in connection with the execution of the acquisition agreement.
On April 6, 2023, the Company’s Illinois subsidiary entered into an agreement to acquire the wastewater treatment plant from Granite City for an amended purchase price of $86 million. This plant provides wastewater service for approximately 600 customers,26,000 customer connections. The Company expects to close this acquisition in the first quarter of 2024.
Effective March 24, 2023, the Company’s Pennsylvania subsidiary acquired the rights to buy the wastewater system assets of the Township of Towamencin, for an aggregate purchase price of $104 million, subject to adjustment as provided in the asset purchase agreement. This system provides wastewater services to approximately 6,300 customer connections in seven townships in Montgomery County, Pennsylvania. The Company expects to close this acquisition in late 2024 or early 2025, pending final regulatory approval.
On October 11, 2022, the Company’s Pennsylvania subsidiary entered into an agreement to acquire the public wastewater collection and treatment system assets (the “System Assets”) from the Butler Area Sewer Authority. On November 9, 2023, the Pennsylvania Public Utility Commission (the “PaPUC”) approved a settlement agreement without modification with respect to the Company’s Pennsylvania subsidiary’s application to acquire the System Assets from the Butler Area Sewer Authority for a purchase price of $230 million, subject to adjustment as provided for in the asset purchase agreement. This system provides wastewater service for approximately 15,000 customer connections. On December 14, 2023, Center Township and Summit Township filed appeals with the Pennsylvania Commonwealth Court seeking to reverse the order entered by the PaPUC approving the sale of the System Assets. On December 29, 2023, the Company’s Pennsylvania subsidiary filed applications with the Commonwealth Court seeking to dismiss the appeals and requesting expedited consideration. By order dated February 1, 2024, the Commonwealth Court deferred deciding the application to dismiss the appeals and directed that the issues raised by the applications to dismiss are to be considered as part of the merits of the appeals. The order also granted expedited consideration and directed the case to be included on the next available list and established a briefing schedule. Based on the court’s schedule, the Company estimates that the disposition of the appeals could occur as soon as the second quarter of 2024.
As of December 31, 2023, the Company had entered into 25 agreements with a total aggregate purchase price of $3 million. As of February 24, 2021, the Company has entered into agreements$589 million for pending acquisitions in the Regulated Businesses, including the agreements discussed above, to add approximately 30,00088,300 additional customers.
Sale of New York American Water Company, Inc.
On November 20, 2019, the Company and the Company’s New York subsidiary entered into a Stock Purchase Agreement with Liberty, pursuant to which Liberty will purchase all of the capital stock of the New York subsidiary for an aggregate purchase price of approximately $608 million in cash, subject to adjustment as provided in the Stock Purchase Agreement. The Company’s regulated New York operations have approximately 125,000 customers in the State of New York. See Item 1—Business—Regulated Businesses—Sale of New York American Water Company, Inc. for additional information. The assets and related liabilities of the New York subsidiary were classified as held for sale on the Consolidated Balance Sheets as of December 31, 2020. See Note 6—Acquisitions and Divestitures in the Notes to Consolidated Financial Statements for additional information.
Market-Based Businesses Growth
MSG was awarded the contract for ownership, operation and maintenance of the water and wastewater systems at Joint Base Lewis-McChord in Washington state, effective September 24, 2020. Joint Base Lewis-McChord is comprised of Fort Lewis and McChord Air Force Base. The joint base has a population of approximately 115,000, comprised of 40,000 active personnel, 60,000 family members and 15,000 civilian and contract employees. The total contract award includes estimated revenues of approximately $771 million over a 50-year period, subject to an annual economic price adjustment.
Future Growth
Looking forward, the Company expects to invest between $10.3$16 billion to $10.5$17 billion from 2021 to 2025,over the next five years, and between $22$34 billion to $25$38 billion from 2021 to 2030,over the next 10 years, including $1.9$3.1 billion in 2021.2024. The Company’s expected future investments include:
•capital investment for infrastructure improvements in the Regulated Businesses of $8.9between $14.5 billion to $15 billion over the next five years, and between $19$30 billion and $21to $33 billion over the next 10 years, including $1.6 billion expected in 2021;years; and
•growth from acquisitions in the Regulated Businesses to expand the Company’s water and wastewater customer base of between $1.4$1.5 billion to $1.6$2 billion over the next five years, and between $3$4 billion to $4$5 billion over the next 10 years, including $300 million expected in 2021.years.
Presented inThe Company estimates the following chart is the estimated allocation of the Company’s expected capital investment for infrastructure improvements in its Regulated Businesses over the next fiveten years will be allocated to the following purposes: infrastructure renewal 68-70%, resiliency 9-11%, water quality, including capital expenditures for the EPA proposed regulations on PFAS 6-8%, operational efficiency, technology and innovation 5-7%, system expansion 4-6%, other 3-5%.
Other Matters
Environmental, Health and Safety, and Water Quality Regulation
On March 14, 2023, the EPA announced the proposed National Primary Drinking Water Regulations (“NPDWR”) for six PFAS including perfluorooctanoic acid (“PFOA”), perfluorooctane sulfonic acid (“PFOS”), perfluorononanoic acid (“PFNA”), hexafluoropropylene oxide dimer acid (“HFPO-DA”, commonly known as “GenX Chemicals”), perfluorohexane sulfonic acid (“PFHxS”), and perfluorobutane sulfonic acid (“PFBS”). The proposed regulations would establish legally enforceable levels for PFAS in drinking water. The EPA anticipates issuing a final rule in 2024 and utilities will be provided a three-year window to comply with the new regulations once finalized, although the Safe Drinking Water Act allows utilities to request an additional two years if capital improvements are required.
The Company performed an initial review of the NPDWR to assess the four parts per trillion requirements for PFAS and the application of the Hazard Index approach for PFNA, PFBS, PFHxS, and GenX Chemicals. On May 24, 2023, the Company submitted comments to the EPA outlining its position on key issues to address the proposed regulations, including its projected costs associated with PFAS treatment at the proposed limits and the potential impact to customers’ bills. The Company estimates an investment of approximately $1 billion of capital expenditures to install additional treatment facilities over a three to five-year period in order to comply with the proposed regulations. Additionally, the Company estimates annual operating expenses up to approximately $50 million related to testing and treatment in today's dollars. These are preliminary estimates based on the proposed rule. The actual expenses may differ from these preliminary estimates and will be dependent upon multiple factors, including the final rule and effective date, as well as the completion of a system-by-system engineering analysis.
The Company supports sound policies and compliance with the NPDWR by purpose:
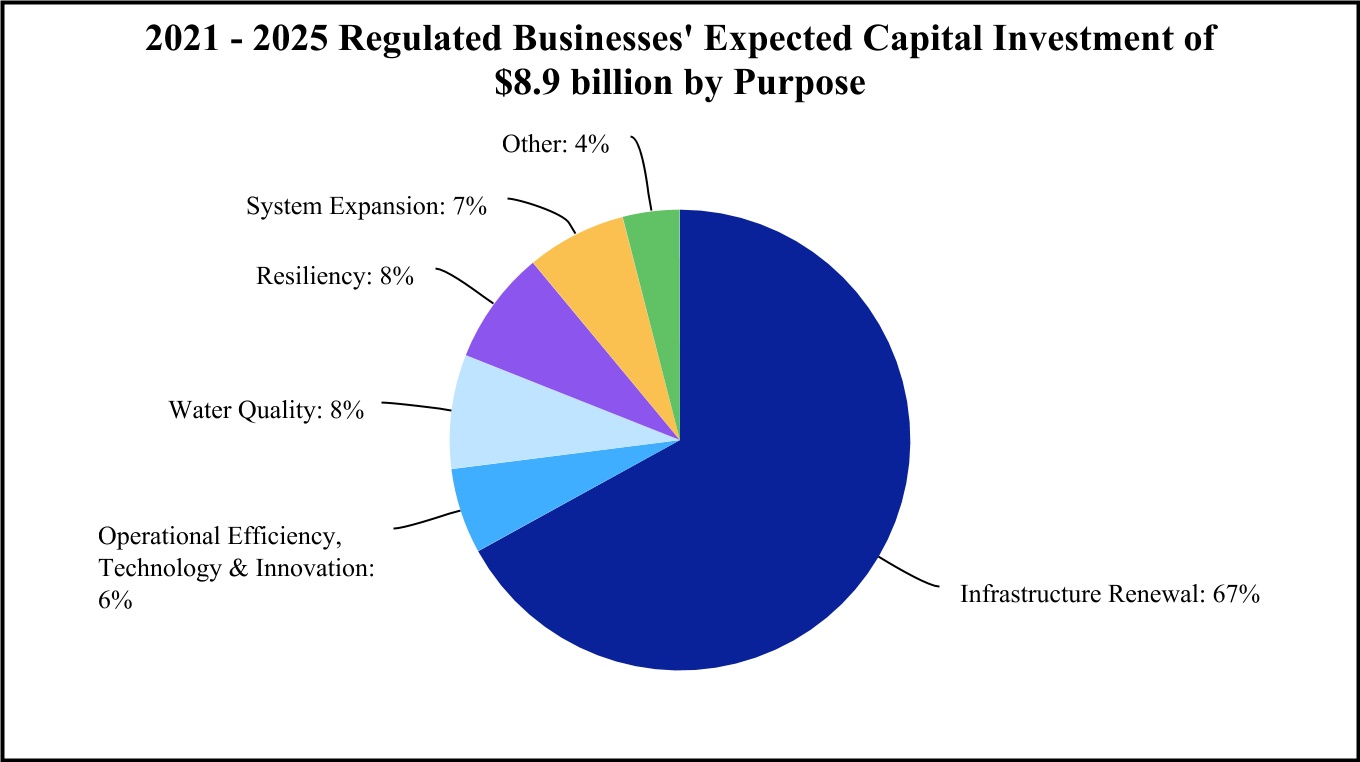
Operational Excellence
The Company’s adjusted regulated O&M efficiency ratio which is used as a measure of the operating performance of the Regulated Businesses, was 34.3%32.8% for the year ended December 31, 2020,2023, compared to 34.5% and33.7% for the year ended December 31, 2019.2022. The improvement in this ratio reflects the continued focus on operating costs, as well as an increase in operating revenues for the Regulated Businesses.Businesses, after considering the adjustment for the amortization of the excess accumulated deferred income taxes (“EADIT”) shown in the table below, as well as the continued focus on operating costs.
The Company’s adjusted regulated O&M efficiency ratio is a non-GAAP measure and is defined by the Company as its operation and maintenance expenses from the Regulated Businesses, divided by the operating revenues from the Regulated Businesses, where both operation and maintenance expenses and operating revenues were adjusted to eliminate purchased water expense. Operating revenues were further adjusted to exclude reductions for the amortization of the EADIT. Also excluded from operation and maintenance expenses areis the allocable portion of non-operation and maintenancenon-O&M support services costs, mainly depreciation and general taxes, which areis reflected in the Regulated Businesses segment as operation and maintenance expenses, but for consolidated financial reporting purposes, areis categorized within other line items in the accompanying Consolidated Statements of Operations. Additionally, the Company excluded the impact of certain Freedom Industries chemical spill settlement activities recognized in 2018 and 2019 from operation and maintenance expenses (see Note 17—Commitments and Contingencies in the Notes to Consolidated Financial Statements for additional information). The items discussed above were excluded from the O&M efficiency ratio calculation as they are not reflective of management’s ability to increase the efficiency of the Regulated Businesses.
The Company evaluates its operating performance using this ratio, and believes it is useful to investors because it directly measures improvement in the operating performance and efficiency of the Regulated Businesses. This information is derived from the Company’s consolidated financial information but is not presented in its financial statements prepared in accordance with GAAP. This information supplements and should be read in conjunction with the Company’s GAAP disclosures, and should be considered as an addition to, and not a substitute for, any GAAP measure. The Company’s adjusted regulated O&M efficiency ratio (i) is not an accounting measure that is based on GAAP; (ii) is not based on a standard, objective industry definition or method of calculation; (iii) may not be comparable to other companies’ operating measures; and (iv) should not be used in place of the GAAP information provided elsewhere in this Annual Report on Form 10-K.
Presented in the table below is the calculation of the Company’s adjusted regulated O&M efficiency ratio and a reconciliation that compares operation and maintenance expenses and operating revenues, each as determined in accordance with GAAP, to those amounts utilized in the calculation of its adjusted O&M efficiency ratio:
| | For the Years Ended December 31, |
| For the Years Ended December 31, | | | For the Years Ended December 31, |
| (Dollars in millions) | (Dollars in millions) | 2020 | | 2019 | | 2018 | (Dollars in millions) | 2023 | | 2022 | | 2021 |
| Total operation and maintenance expenses | Total operation and maintenance expenses | $ | 1,622 | | | $ | 1,544 | | | $ | 1,479 | |
| Less: | Less: | | | | | | Less: | | | |
| Operation and maintenance expenses—Market-Based Businesses | 389 | | | 393 | | | 362 | |
| Operation and maintenance expenses—Other | Operation and maintenance expenses—Other | (25) | | | (31) | | | (42) | |
| Total operation and maintenance expenses—Regulated Businesses | Total operation and maintenance expenses—Regulated Businesses | 1,258 | | | 1,182 | | | 1,159 | |
| Less: | Less: | | | | | | Less: | | | |
| Regulated purchased water expenses | Regulated purchased water expenses | 149 | | | 135 | | | 133 | |
| Allocation of non-operation and maintenance expenses | Allocation of non-operation and maintenance expenses | 41 | | | 31 | | | 31 | |
Impact of Freedom Industries settlement activities (a) | — | | | (4) | | | (20) | |
Adjusted operation and maintenance expenses—Regulated Businesses (i) | Adjusted operation and maintenance expenses—Regulated Businesses (i) | $ | 1,068 | | | $ | 1,020 | | | $ | 1,015 | |
| | Total operating revenues | Total operating revenues | $ | 3,777 | | | $ | 3,610 | | | $ | 3,440 | |
| Total operating revenues | |
| Total operating revenues | |
| Less: | Less: | | | | | | Less: | | | |
| Operating revenues—Market-Based Businesses | 540 | | | 539 | | | 476 | |
| Operating revenues—Other | Operating revenues—Other | (18) | | | (23) | | | (20) | |
| Total operating revenues—Regulated Businesses | Total operating revenues—Regulated Businesses | 3,255 | | | 3,094 | | | 2,984 | |
| Less: | Less: | | | | | | Less: | | | |
Regulated purchased water revenues (b) | 149 | | | 135 | | | 133 | |
| Other revenue | (7) | | | — | | | — | |
Regulated purchased water revenues (a) | |
| Revenue reductions from the amortization of EADIT | |
Adjusted operating revenues—Regulated Businesses (ii) | Adjusted operating revenues—Regulated Businesses (ii) | $ | 3,113 | | | $ | 2,959 | | | $ | 2,851 | |
| Adjusted O&M efficiency ratio—Regulated Businesses (i) / (ii) | Adjusted O&M efficiency ratio—Regulated Businesses (i) / (ii) | 34.3 | % | | 34.5 | % | | 35.6 | % |
Adjusted O&M efficiency ratio—Regulated Businesses (i) / (ii) | |
Adjusted O&M efficiency ratio—Regulated Businesses (i) / (ii) | | 32.8 | % | | 33.7 | % | | 34.1 | % |
(a) Includes the impact of a settlement in 2018 with one of the Company’s general liability insurance carriers, and a reduction in the first quarter of 2019 of a liability, each related to the Freedom Industries chemical spill.
(b) The calculation assumes regulated purchased water revenues approximate regulated purchased water expenses.
Regulatory Matters
General Rate Cases
Presented in the table below are annualized incremental revenues assuming a constant water sales volume and customer count, resulting from general rate casescase authorizations that became effective during 2018 through 2020:2023:
| | | | | | | | | | | | | | | | | |
| (In millions) | 2020 | | 2019 | | 2018 |
| General rate cases by state: | | | | | |
New Jersey (a) | $ | 39 | | | $ | — | | | $ | 40 | |
Indiana (b) | 13 | | | 4 | | | — | |
California (c) | 5 | | | 4 | | | 10 | |
Virginia (d) | (1) | | | — | | | — | |
Kentucky (effective June 28, 2019) | — | | | 13 | | | — | |
New York (e) | — | | | 4 | | | 5 | |
West Virginia (effective February 25, 2019) | — | | | 19 | | | — | |
Maryland (effective February 5, 2019) | — | | | 1 | | | — | |
Missouri (effective May 28, 2018) | — | | | — | | | 33 | |
Pennsylvania (effective January 1, 2018) | — | | | — | | | 62 | |
| Total general rate case authorizations | $ | 56 | | | $ | 45 | | | $ | 150 | |
| | | | | | | | | | | |
| (In millions) | Effective Date | | Amount |
| General rate cases by state: | | | |
| Missouri | May 28, 2023 | | $ | 44 | |
| Virginia | April 24, 2023 (a) | | 11 | |
| Pennsylvania | January 28, 2023 | | 138 | |
| Illinois | January 1, 2023 | | 67 | |
| California, Step Increase | January 1, 2023 | | 13 | |
| Total general rate case authorizations | | | $ | 273 | |
(a)Interim rates were effective May 1, 2022, and the difference between interim and final approved rates were subject to refund. The $39 million base rate increaseVirginia State Corporation Commission issued its final Order on April 24, 2023.
On June 29, 2023, the California Public Utilities Commission (“CPUC”) issued a decision on the cost of capital application for the Company’s California subsidiary, which authorized a return on equity of 8.98% and a capital structure with an equity component of 57.04% for the three-year period from 2022 to 2024. The CPUC’s decision was effective from the date of the order through the end of 2024. The decision included a Water Cost of Capital Mechanism (the “WCCM”) that allows the California subsidiary to increase its return on equity for the remainder of 2023 and 2024 based on capital market rates. As authorized by the WCCM, the California subsidiary filed with the CPUC staff advice letters to increase the return on equity. On July 25, 2023, the CPUC staff approved a return on equity of 9.50%, effective July 31, 2023. On November 1, 2020, which is net15, 2023, the CPUC staff approved a return on equity of excess accumulated deferred income taxes (“EADIT”) of $15 million being returned to customers. The unprotected EADIT balance of $133 million is being returned to customers over 15 years. The $39 million rate increase was further reduced by a bill credit, for a 10-month period beginning November 1, 2020 for both the protected and unprotected catch up period EADIT of $32.5 million. The catch up period of10.20%, effective January 1, 2018 through October 31, 2020 covers2024.
On May 3, 2023, the period from whenMissouri Public Service Commission issued an order approving the lower federal tax rate went into effect until new base rates went into effect. The $40 million rate increase was effective on June 15, 2018. As part of the resolution ofMarch 3, 2023, joint settlement agreement in the general rate case in 2018,filed on July 1, 2022, by the Company’s New JerseyMissouri subsidiary. The general rate case order approved a $44 million annualized increase in water and wastewater revenues, excluding $51 million in previously approved infrastructure surcharges, and authorized implementation of the new water and wastewater rates effective May 28, 2023. The annualized revenue increase was driven primarily by significant incremental capital investments since the Missouri subsidiary’s customers received refunds for2021 rate case order. The Missouri subsidiary’s view of its rate base was $2.3 billion, and its view as to its return on equity and long-term debt ratio (each of which is based on the amount of provisional rates implemented as of June 15, 2018 that exceededgeneral rate case order but was not disclosed therein) was 9.75% and 50.0%, respectively.
On April 24, 2023, the final rate increase plus interest.
(b)The Company’s Indiana subsidiary receivedVirginia State Corporation Commission issued an order approving the settlement of the rate case filed on September 26, 2022, by the Company’s Virginia subsidiary. The general rate case order approved an $11 million annualized increase in water and wastewater revenues. Interim rates in this proceeding were effective on May 1, 2022, and the order required that the difference between interim and the final approved rates were subject to refund within 90 days of the order issuance. The order approves the settlement terms with a return on equity of 9.7% and a common equity ratio of 40.7%. The annualized revenue increase was driven primarily by significant incremental capital investments since the Virginia subsidiary’s 2020 rate case order that have been completed or were planned through April 30, 2023, increases in pension and other postretirement benefits expense and increases in production costs, including chemicals, fuel and power costs. The general rate case order includes recovery of the Virginia subsidiary’s COVID-19 deferral balance. It also includes approval of the accounting deferral of deviations in pension and other postretirement benefits expense from those established in base rates, until the Virginia subsidiary’s next base rate case.
On December 8, 2022, the PaPUC issued an order approving the joint settlement agreement with all major parties with respect to itsin the rate case filed on April 29, 2022, by the Company’s Pennsylvania subsidiary. The general rate case filing, authorizingorder approved a $138 million annualized increase in water and wastewater revenues, excluding $24 million for previously approved infrastructure filings, and authorizes implementation of the new water and wastewater rates effective January 28, 2023. The annualized revenue increase was driven primarily by significant incremental revenues of $4 millioncapital investments since the Pennsylvania subsidiary’s 2021 rate case order that were completed through December 31, 2023, increases in the first rate year, effective July 1, 2019,pension and $13 millionother postretirement benefits expense and increases in the second rate year, effective May 1, 2020.
(c)production costs, including chemicals, fuel and power costs. The Company’s California subsidiary received approval for the third year (2020) step increase associated with its most recent general rate case authorization, effective January 1, 2020. In 2019,order also includes recovery of the step increasePennsylvania subsidiary’s COVID-19 deferral balance. The Pennsylvania subsidiary’s view of its rate base was effective May 11, 2019. On December 13, 2018, a settlement in this subsidiary’s$5.1 billion, and its view as to its return on equity and long-term debt ratio (each of which is based on the general rate case filingorder but was approved, authorizing rates effective January 1, 2018.
(d)The Company’s Virginia subsidiary received an order approving increased water revenues by $1 million, inclusive of Water & Wastewater Infrastructure Service Charge (“WWISC”) revenues of $1 million,not disclosed therein) was 10.0% and decreased wastewater revenue by $1 million, for a net zero award including WWISC, or an overall decrease of $1 million excluding WWISC. Unprotected EADIT is being returned to customers over eight years, and base rates include a reduction of $1 million for EADIT.
(e)The Company’s New York subsidiary implemented its third step increase associated with its most recent general rate case authorization, effective April 1, 2019.
Due in part to the COVID-19 pandemic, the NYSPSC approved, through a series of orders, the Company’s New York subsidiary’s request to postpone the previously approved step increase, originally scheduled to go into effect April 1, 2020 until May 1, 2021. The orders provided a make whole provision to recover the delayed revenues with no earnings impact. These delays impact rates for all metered and fire customers, which the Company is authorized to recover in a make-whole surcharge beginning May 1, 2021.
Pending General Rate Case Filings
On August 28, 2020, the Company’s Iowa subsidiary filed a general rate case requesting $3 million in annualized incremental revenues. Office of Consumer Advocate (“OCA”) and intervenor direct testimony was filed on December 17, 2020 and cross-reply testimony was filed on December 31, 2020. The Company’s Iowa subsidiary reply testimony was filed on January 14, 2021, and OCA rebuttal testimony was filed on February 8, 2021. Evidentiary hearings are scheduled to start March 3, 2021. An order is anticipated by April 30, 2021 with new rates effective by July 1, 2021.44.8%, respectively.
On June 30, 2020,December 15, 2022, the Illinois Commerce Commission issued an order approving the adjustment of base rates requested in a rate case filed on February 10, 2022, by the Company’s MissouriIllinois subsidiary. As updated in the Illinois subsidiary’s June 29, 2022 rebuttal filing, the request sought $83 million in additional annualized revenues, excluding previously recovered infrastructure surcharges. The general rate case order approved a $67 million annualized increase in water and wastewater system revenues, excluding previously recovered infrastructure surcharges of $18 million, effective January 1, 2023, based on an authorized return on equity of 9.78%, authorized rate base of $1.64 billion, a common equity ratio of 49.0% and a debt ratio of 51.0%. The annualized revenue increase was driven primarily by significant water and wastewater system capital investments since the Illinois subsidiary’s 2017 rate case order that have been completed or were planned through December 31, 2023, expected higher pension and other postretirement benefit costs, and increases in production costs, including chemicals, fuel and power costs.
Pending General Rate Case Filings
On January 25, 2024, the Company’s Illinois subsidiary filed tariffs for new water and wastewater rates. The request seeks a two-step rate increase consisting of aggregate annualized incremental revenue, based on a proposed return on equity of 10.75%, of (i) approximately $136 million effective January 1, 2025, based on a future test year through December 31, 2025 with average rate base and a capital structure with an equity component of 52.27% and a debt component of 47.73%, and (ii) approximately $16 million effective January 1, 2026, based on a future test year to include end of period rate base and a capital structure with an equity component of 54.43% and a debt component of 45.57%. The requested increases are driven primarily by an estimated $557 million in capital investments to be made by the Illinois subsidiary starting January 2024 through December 2025. The request also proposes a treatment and compliance rider to address recovery of future environmental compliance investments, and a modification to the existing volume balancing account mechanism to include full production cost recovery.
On January 19, 2024, the Company’s New Jersey subsidiary filed a general rate case requesting $78approximately $162 million in additional annualized incremental revenues. On August 26, 2020, the Missouri Public Service Commission (the “MPSC”) issued an order setting the test year and adoptingrevenues, which is based on a procedural schedule. Revenue requirement direct testimony was submittedproposed return on November 24, 2020 for all non-Company parties,equity of 10.75% and a technical conference was held on December 3, 2020. Costcapital structure with an equity component of service56.30% and rate design direct testimony was submitted on December 9, 2020 for all non-Company parties. Rebuttal testimony was submitted on January 15, 2021 for revenue requirement and on January 22, 2021 for rate design, and true-up data was filed on January 29, 2021, which included known and measurable changes through December 31, 2020. Settlement conferences commenced on February 16, 2021. A Motion to Suspend Procedural Schedule was filed on February 23, 2021 with the MPSC by all parties to the proceeding.a debt component of 43.70%. The MPSC issued an order effective February 24, 2021 suspending the procedural schedule to allow for either a stipulation and agreement or a status report to be filed no later than February 26, 2021.
On April 29, 2020, the Company’s Pennsylvania subsidiary filed a general rate case requesting $92 million and $46 million in annualized incremental revenues for rate year 1 and rate year 2, respectively. On October 30, 2020, the Company’s Pennsylvania subsidiary and the Bureau of Investigation and Enforcement entered into a settlement agreement providing for a totalrequested annualized revenue increase of $71 million over a two-year period. In November 2020, the Company’s Pennsylvania subsidiaryis driven primarily by approximately $1.3 billion in capital investments made and the remaining active parties in the case presented their positions in briefs to the Administrative Law Judge, who issued to the Pennsylvania Public Utility Commission (the “PaPUC”) a recommended decision approving the settlement. The procedural schedule in this case was extended to March 15, 2021. The Company expects the PaPUC to issue a final order in the near term, and once approvedbe made by the PaPUC, new waterNew Jersey subsidiary through December 2024. The request also proposes a revenue decoupling mechanism and wastewater rates will be effective January 28, 2021.seeks a deferral of certain production cost adjustments.
On July 1, 2019, the Company’s California subsidiary filed a general rate case requesting $26 million in annualized incremental revenues for 2021 and increases of $10 million and $11 million in the escalation year of 2022 and the attrition year ofDecember 15, 2023, respectively. On October 11, 2019, the Company filed its 100 day update for the same proceeding and updated the request to $27 million in annualized incremental revenues for 2021, and increases of $10 million and $10 million in the escalation year of 2022 and the attrition year of 2023, respectively. On September 10, 2020, the CPUC approved the Company’s California subsidiary’s motion for interim rates, establishing a memorandum account to track the difference between interim and final rates adopted by the CPUC in this proceeding, which were effective on January 1, 2021. Following settlement discussions among all parties to the proceeding, on January 22, 2021 and January 25, 2021, the Company’s California subsidiary filed with the CPUC a comprehensive settlement entered into among the Company’s California subsidiary, the Public Advocates Office, and other intervenors. These settlement agreements resolved all matters in dispute among the parties to the settlements. These settlements as well as resolution of issues raised by non-settling parties are now before the CPUC for approval.
On January 22, 2020, the Company’s California subsidiary submitted a request to delay by one year its cost of capital filing and maintain its current authorized cost of capital through 2021.2025. On March 12, 2020,February 2, 2024, the CPUC granted the request for a one year extension of the cost of capital filing to May 1, 2021,2025, to set its authorized cost of capital beginning January 1, 2022. 2026.
On January 5, 2021,November 8, 2023, the Company’s CaliforniaPennsylvania subsidiary submittedfiled a general rate case requesting approximately $204 million in additional annualized revenues, excluding projected infrastructure surcharges of $20 million. The request is based on a proposed return on equity of 10.95% and a capital structure with an equity component of 55.30% and a debt component of 44.70%. The requested annualized incremental revenue increase is driven primarily by an estimated $1.0 billion of incremental capital investments to further delaybe made through mid-2025. The request also proposes a mechanism to address compliance with evolving environmental requirements, such as emerging federal regulations for lead and PFAS. If approved, the new rates would be expected to take effect on August 7, 2024.
On November 1, 2023, the Company’s Virginia subsidiary filed a general rate case requesting $20 million in additional annualized revenues. The request is based on a proposed return on equity of 10.95% and a capital structure with an equity component of 45.67% and a debt and other component of 54.33%. The requested increase is driven by one year itsapproximately $110 million in capital investments between May 2023 and April 2025. The request also proposed a revenue decoupling mechanism and seeks deferral of certain production cost of capital filing and maintain the authorized cost of capital through 2022. On February 22, 2021, the CPUC denied the request to further delay the cost of capital filing. The Company’s California subsidiaryadjustments. Interim rates will submit a cost of capital application bybe effective May 1, 2021,2024, with the difference between interim and final approved rates subject to refund.
On June 30, 2023, the Company’s Kentucky subsidiary filed a general rate case requesting $26 million in additional annualized revenues, excluding infrastructure surcharges of $10 million. The request is based on a proposed return on common equity of 10.75% and a proposed capital structure with a new authorized costcommon equity component of 52.45%. An order is expected in the general rate case by the end of the first quarter of 2024.
On May 1, 2023, the Company’s West Virginia subsidiary filed a general rate case requesting $45 million in additional annualized revenues, excluding previously approved infrastructure surcharges of $7 million. The request is based on a proposed return on equity of 10.50% and a capital beginning January 1, 2022.structure with an equity component of 52.80%. The general rate case includes a future test year capturing planned investment through 2025 and an order is expected to be issued by February 25, 2024. On June 30, 2023, the West Virginia subsidiary filed its annual infrastructure surcharge requesting $8 million in additional annualized revenues for planned investment through 2024. The infrastructure surcharge will be aligned with the investments recognized in the general rate case if the future test year is approved.
On March 31, 2023, the Company’s Indiana subsidiary filed a general rate case requesting $87 million in additional annualized revenues, excluding $41 million of revenue from infrastructure filings already approved, which includes three step increases, with $43 million of the increase to be included in rates in January 2024, $18 million in May 2024, and $26 million in May 2025. The requested adjustment is based on a proposed return on equity of 10.60% and a capital structure with an equity component of 56.20%. Hearings were completed in September and an order is expected in the general rate case by the end of February 2024.
On July 1, 2022, the Company’s California subsidiary filed a general rate case requesting an increase in 2024 revenue of $56 million and a total increase in revenue over the 2024 to 2026 period of $95 million, all as compared to 2022 revenues. The Company updated its filing in January 2023 to capture the authorized step increase effective January 1, 2023. The filing was also updated to incorporate a decoupling proposal and a revision to the Company’s sales and associated variable expense forecast. The revised filing requested additional annualized revenues for the test year 2024 of $37 million, compared to 2023 revenues. This excludes the proposed step rate and attrition rate increase for 2025 and 2026 of $20 million and $19 million, respectively. The total revenue requirement request for the three-year rate case cycle, incorporating updates to present rate revenues and forecasted demand, is $76 million. On November 17, 2023, the California subsidiary filed with the CPUC a partial settlement agreement reached with the CPUC’s Public Advocates Office, which would determine the amount of incremental annualized water and wastewater revenue to be received by the California subsidiary to be $20 million in the 2024 test year, $16 million in the 2025 escalation year, and $15 million in the 2026 attrition year. The partial settlement agreement addresses the California subsidiary’s revenue requirement request but does not address rate design or certain other matters, such as the requested inclusion and implementation of a revenue stability mechanism to separate the California subsidiary’s revenue and water sales. New rates would be implemented retroactively to January 1, 2024, upon a final decision issued by the CPUC approving the partial settlement agreement and resolving the other issues not addressed by the partial settlement agreement, which is expected to occur in mid-2024.
Infrastructure Surcharges
A number of states have authorized the use of regulatory mechanisms that permit rates to be adjusted outside of a general rate case for certain costs and investments, such as infrastructure surcharge mechanisms that permit recovery of capital investments to replace aging infrastructure. Presented in the table below are annualized incremental revenues, assuming a constant water sales volume and customer count, resulting from infrastructure surcharge authorizations that became effective during 2018 through 2020:2023:
| | | | | | | | | | | | | | | | | |
| (In millions) | 2020 | | 2019 | | 2018 |
| Infrastructure surcharges by state: | | | | | |
Missouri (a) | $ | 12 | | | $ | 14 | | | $ | 6 | |
Pennsylvania (b) | 27 | | | 11 | | | — | |
Kentucky (effective July 1, 2020) | 1 | | | — | | | — | |
New Jersey (c) | 20 | | | 15 | | | — | |
Tennessee (effective January 1, 2020, September 1, 2019 and April 10, 2018) | 2 | | | 1 | | | 1 | |
Illinois (effective January 1, 2020, January 1, 2019 and January 1, 2018) | 7 | | | 8 | | | 3 | |
West Virginia (effective January 1, 2020, January 1, 2019 and January 1, 2018) | 3 | | | 2 | | | 3 | |
New York (effective August 1, 2019) | — | | | 2 | | | — | |
Indiana (effective March 14, 2018) | — | | | — | | | 7 | |
Virginia (effective March 1, 2018) | — | | | — | | | 1 | |
| Total infrastructure surcharge authorizations | $ | 72 | | | $ | 53 | | | $ | 21 | |
| | | | | | | | | | | |
| (In millions) | Effective Date | | Amount |
| Infrastructure surcharges by state: | | | |
| New Jersey | (a) | | $ | 32 | |
| Kentucky | October 1, 2023 | | 4 | |
| Indiana | (b) | | 26 | |
| Missouri | January 16, 2023 | | 14 | |
| Pennsylvania | January 1, 2023 | | 3 | |
| West Virginia | January 1, 2023 | | 7 | |
| Total infrastructure surcharge authorizations | | | $ | 86 | |
(a)In 2020, $2 million was effective December 14 and $10 million was effective June 27. In 2019, $5 million was effective December 21 and $9 million was effective June 24. In 2018, the effective date was December 15.
(b)In 2020, $82023, $15 million was effective October 1, $4 million was effective July 1, $5 million was effective April 1 and $10 million was effective January 1. In 2019, $6 million was effective October 1, $3 million was effective July 1 and $2 million was effective April 1.
(c)In 2020, $1030, $1 million was effective June 29 and $10$16 million was effective January 1. April 29.
(b)In 2019, the2023, $20 million was effective dateMarch 23 and $6 million was July 1.effective March 8.
Presented in the table below are annualized incremental revenues, assuming a constant water sales volume and customer count, resulting from infrastructure surcharge authorizations that became effective on or after January 1, 2020:2024:
| | | | | | | | | | | |
| (In millions) | Effective Date | | Amount |
| Infrastructure surcharge filings by state: | | | |
Pennsylvania Missouri
| (effective January 1, 2021)20, 2024 | | $ | 826 | |
Illinois | (effective January 1, 2021) | 7 2024 | |
West Virginia (effective January 1, 2021)
| 5 | |
Tennessee (effective January 1, 2021)
| 3 | |
| Total infrastructure surcharge filings | | | $ | 2331 | |
Pending Infrastructure Surcharge Filings
On January 15, 2021,31, 2024, the Company’s IndianaIowa subsidiary filed for an infrastructure surcharge requesting $8 million in additional annualized revenues.
On May 29, 2020, the Company’s New York subsidiary filed for an infrastructure surchargeproceeding requesting $1 million in additional annualized revenues. New rates related to this infrastructure surcharge were first deferred until January 1, 2021. Thereafter, on December 30, 2020, the NYSPSC ordered the postponement of rate changes until May 1, 2021, which will be recoverable, with interest, through a separate, make-whole recovery mechanism commencing May 1, 2021 through March 31, 2022.
TaxOther Regulatory Matters
CARES Act
In March 2020, the Coronavirus Aid, Relief, and Economic Security Act (the “CARES Act”) was signed into law. The CARES Act includes certain tax relief provisions applicable to the Company including: (i) the immediate refund of the corporate alternative minimum tax credit; (ii) the ability to carryback net operating losses for five years for tax years 2018 through 2020; and (iii) delayed payment of employer payroll taxes. The CARES Act did not have a material impact on the Company’s Consolidated Financial Statements.
Tax Cuts and Jobs Act
On December 22, 2017, the TCJA was signed into law, which, among other things, enacted significant and complex changes to the Code, including a reduction in the federal corporate income tax rate from 35% to 21% as of January 1, 2018. The enactment of the TCJA required a re-measurement of the Company’s deferred income taxes. The portion of this re-measurement related to the Regulated Businesses was substantially offset by a regulatory liability as EADIT will be used to benefit the Company’s regulated customers in future rates. Nine of the Company’s regulated subsidiaries are amortizing EADIT and crediting customers, including one which is using the EADIT to offset future infrastructure investments. The Company expects the timing of the amortization of EADIT credits by the five remaining regulated subsidiaries to be addressed in pending or future rate cases or other proceedings. When crediting EADIT to the customer, the Company records both a reduction to revenue and a reduction to income tax expense, having no material impact on net income.
Federal Net Operating Loss
The Company had a federal NOL carryover balance of $366 million as of December 31, 2020 that is expected to be fully utilized during 2021, after which time the Company expects that it will become a cash taxpayer for federal income tax purposes.
Legislative Updates
During 2020, the Company’s regulatory jurisdictions enacted the following legislation that has been approved and is effective as of February 24, 2021:
•Indiana House Enrolled Act 1131 establishes an appraisal process for non-municipal utilities to establish fair value and creates a presumption that the appraised value is a reasonable purchase price. Additionally, all new municipal systems will now be regulated for 10 years.
•Indiana Senate Enrolled Act 254 authorizes recovery without a full rate case for service enhancements for health, safety or environmental concerns for above ground infrastructure, and exempts relocation from distribution system improvement charge recovery caps.
•West Virginia Senate Bill 551 allows for expanded asset valuation, combined water and wastewater ratemaking and the expansion of how municipalities can utilize proceeds from the sale of a water or wastewater system.
•West Virginia Senate Bill 739 allows the Public Service Commission of West Virginia to force utility management changes up to and including an acquisition of a distressed or failing water or wastewater system, based on financial, managerial and technical ability among other factors, by a neighboring system that has the ability to assume control and protect consumers. The bill also includes guidance for customer notification, commission orders, and new rate mechanisms for cost recovery of these acquisitions.
•Iowa amended HF2452 legislation, which gives the Iowa Utilities Board 180 days to approve acquisitions and allows systems to qualify as a distressed system when they do not have a certified operator.
•Missouri House Bill 2120 requires most small community water utilities to establish a cyber security plan and valve and hydrant inspection program with reporting to the Department of Natural Resources certifying compliance with these provisions upon request.
•Virginia Senate Bill 831 directs the Virginia State Corporation Commission to establish fair market value for the state, and the legislation authorizes a water or sewer public utility acquiring a water or sewer system to elect to have its rate base established by using the fair market value. The Virginia State Corporation Commission issued an order on August 27, 2020 adopting the proposed rules governing Water or Wastewater Utility Applications Seeking Fair Valuation of Acquisitions of Municipal Water or Wastewater Systems effective as of October 1, 2020.
In September 2020, the CPUC released a decision under its Low-Income Rate Payer Assistance program rulemaking that will requirerequired the Company’s California subsidiary to file a proposal to alter its water revenue adjustment mechanism in its next general rate case filing in 2022, which would have become effective upon receiving an order in January 2024.the current pending rate case. On October 5, 2020, the Company’s California subsidiary filed an application for rehearing of the decision and following the CPUC’s denial of its rehearing application in September 2021, the Company’s California subsidiary filed a petition for writ of review with the California Supreme Court on October 27, 2021. On May 18, 2022, the California Supreme Court issued a writ of review for the California subsidiary’s petition and the petitions filed by other entities challenging the decision. Independent of the judicial challenge, California passed Senate Bill 1469, which allows the CPUC to consider and authorize the implementation of a mechanism that separates the water corporation’s revenue and its water sales. Legislation was signed by the Governor on September 30, 2022, and became effective on January 1, 2023. In response to the legislation, on January 27, 2023, the Company’s California subsidiary filed an updated application requesting the CPUC to consider a Water Resources Sustainability Plan decoupling mechanism in its pending 2022 general rate case, which, if adopted, will become effective upon receiving an order in the current pending rate case.
On March 2, 2021, an administrative law judge (“ALJ”) in the Office of Administrative Law of New Jersey filed an initial decision with the New Jersey Board of Public Utilities (“NJBPU”) that recommended denial of a petition filed by the Company’s New Jersey subsidiary, which sought approval of acquisition adjustments in rate base of $29 million associated with the acquisitions of Shorelands Water Company, Inc. in 2017 and the Borough of Haddonfield’s water and wastewater systems in 2015. On July 29, 2021, the NJBPU issued an order adopting the ALJ’s initial decision without modification. The Company’s New Jersey subsidiary filed a Notice of Appeal with the New Jersey Appellate Division on September 10, 2021. The Company’s New Jersey subsidiary filed its brief in support of the appeal on March 4, 2022. Response and Reply briefs were filed on June 22, 2022, and August 4, 2022, respectively. Oral argument was held on March 22, 2023, and the decision remains pending. There is no financial impact to the Company as a result of the NJBPU’s order, since the acquisition adjustments are currently recorded as goodwill on the Consolidated Balance Sheets.
Consolidated Results of Operations
Presented in the table below are the Company’s consolidated results of operations:
| | | | For the Years Ended December 31, | | For the Years Ended December 31, |
| 2020 | | 2019 | | 2018 |
| 2023 | | | 2023 | | 2022 | | 2021 |
| (In millions) | (In millions) | | | | | |
| Operating revenues | |
| Operating revenues | |
| Operating revenues | Operating revenues | $ | 3,777 | | | $ | 3,610 | | | $ | 3,440 | |
| Operating expenses: | Operating expenses: | | | | | | Operating expenses: | | | |
| Operation and maintenance | Operation and maintenance | 1,622 | | | 1,544 | | | 1,479 | |
| Depreciation and amortization | Depreciation and amortization | 604 | | | 582 | | | 545 | |
| General taxes | General taxes | 303 | | | 280 | | | 277 | |
| Loss (gain) on asset dispositions and purchases | — | | | 34 | | | (20) | |
| Impairment charge | — | | | — | | | 57 | |
| Other | |
| Total operating expenses, net | Total operating expenses, net | 2,529 | | | 2,440 | | | 2,338 | |
| Operating income | Operating income | 1,248 | | | 1,170 | | | 1,102 | |
| Other income (expense): | Other income (expense): | | | | | | Other income (expense): | | | |
| Interest, net | (395) | | | (382) | | | (350) | |
| Interest expense | |
| Interest Income | |
| Non-operating benefit costs, net | Non-operating benefit costs, net | 49 | | | 16 | | | 20 | |
| Gain on sale of businesses | |
| Other, net | Other, net | 22 | | | 29 | | | 15 | |
| Total other income (expense) | Total other income (expense) | (324) | | | (337) | | | (315) | |
| Income before income taxes | Income before income taxes | 924 | | | 833 | | | 787 | |
| Provision for income taxes | Provision for income taxes | 215 | | | 212 | | | 222 | |
| Consolidated net income | 709 | | | 621 | | | 565 | |
| Net loss attributable to noncontrolling interest | — | | | — | | | (2) | |
| Net income attributable to common shareholders | Net income attributable to common shareholders | $ | 709 | | | $ | 621 | | | $ | 567 | |
Segment Results of Operations
The Company’s operating segments are comprised of the revenue-generating components of its business forbusinesses which generate revenue, incur expense and have separate financial information which is internally produced and regularly used by management to make operating decisions, assess performance and allocate resources. The Company operates its business primarily through one reportable segment, the Regulated Businesses segment. The Company also operates market-based businesses that, individually, doOther primarily includes MSG, which does not meet the criteria of a reportable segment in accordance with GAAP,GAAP. Other also includes corporate costs that are not allocated to the Company’s Regulated Businesses, interest income related to the secured seller promissory note from the sale of HOS, income from assets not associated with the Regulated Businesses, eliminations of inter-segment transactions and are collectively presented asfair value adjustments related to acquisitions that have not been allocated to the Market-BasedRegulated Businesses whichsegment.This presentation is consistent with how management assesses the results of these businesses. For a discussion and analysis of the Company’s financial statements for fiscal 20192022 compared to fiscal 2018,2021, please refer to Item 7—Management’s Discussion and Analysis of Financial Condition and Results of Operations in the Company’s Annual Report on Form 10-K for the year ended December 31, 2019,2022, filed with the SEC on February 18, 2020.15, 2023.
Sale of Homeowner Services Group
On December 9, 2021, the Company sold all of the equity interests in subsidiaries that comprised HOS to a wholly owned subsidiary (the “Buyer”) of funds advised by Apax Partners LLP, a global private equity advisory firm, for total consideration of approximately $1.275 billion, resulting in pre-tax gain of $748 million. The consideration at closing was comprised of $480 million in cash, a secured seller promissory note payable in cash and issued by the Buyer in the principal amount of $720 million, with an interest rate of 7.00% per year, and a contingent cash payment of $75 million payable upon satisfaction of certain conditions on or before December 31, 2023. For the year ended December 31, 2022, the Company recorded post-closing adjustments, primarily related to working capital, of pre-tax income of $20 million, which is included in Gain on sale of businesses on the Consolidated Statements of Operations. The Company recognized $50 million of interest income during the years ended December 31, 2023 and 2022, from the secured seller note.
On February 2, 2024, the secured seller note was amended to increase the principal amount from $720 million to $795 million, in full satisfaction of the $75 million contingent cash payment payable under the HOS sale agreement. In addition, the interest rate payable on the secured seller note has increased from 7.00% per year to 10.00% per year until maturity. The secured seller note requires compliance with affirmative and negative covenants (subject to certain conditions, limitations and exceptions), including a covenant limiting the incurrence by the Buyer and certain affiliates of additional indebtedness in excess of certain thresholds, but does not include any financial maintenance covenants. Certain of these covenants have been amended, including to provide for annual reductions of specified debt incurrence ratios. Furthermore, the amendment to the secured seller note eliminated the conditional right, beginning December 9, 2024, to require a repayment, without premium or penalty, of 100% of the outstanding principal amount in full in cash together with all accrued and unpaid interest and other obligations thereunder. The final maturity date of the secured seller note remains December 9, 2026. The $75 million additional principal under the secured seller note must be repaid in full, without premium or penalty, in the event a proposed acquisition of a complementary business by or on behalf of an affiliate of the Buyer is not completed by May 2, 2024. The repayment obligations of the Buyer under the seller note are secured by a first priority security interest in certain property of the Buyer and the former HOS subsidiaries, including their cash and securities accounts, as well as a pledge of the equity interests in each of those subsidiaries, subject to certain limitations and exceptions.
As a result of the sale of HOS, the categories which were previously shown as “Market-Based Businesses” and “Other” have been combined and shown as Other. Segment results for the year ended December 31, 2021, have been adjusted retrospectively to reflect this change.
Regulated Businesses Segment
Presented in the table below is financial information for the Regulated Businesses:
| | | | For the Years Ended December 31, | | For the Years Ended December 31, |
| 2020 | | 2019 | | 2018 |
| 2023 | | | 2023 | | 2022 | | 2021 |
| (In millions) | (In millions) | | | | | | (In millions) | | | |
| Operating revenues | Operating revenues | $ | 3,255 | | | $ | 3,094 | | | $ | 2,984 | |
| Operation and maintenance | Operation and maintenance | 1,258 | | | 1,182 | | | 1,159 | |
| Depreciation and amortization | Depreciation and amortization | 562 | | | 529 | | | 500 | |
| General taxes | General taxes | 285 | | | 262 | | | 261 | |
| (Gain) on asset dispositions and purchases | (3) | | | (10) | | | (7) | |
| Other income (expenses) | (221) | | | (262) | | | (247) | |
| Income before income taxes | 932 | | | 869 | | | 826 | |
| Other operating (income) expense | |
| Other income (expense) | |
| Provision for income taxes | Provision for income taxes | 217 | | | 215 | | | 224 | |
| Net income attributable to common shareholders | Net income attributable to common shareholders | 715 | | | 654 | | | 602 | |
Operating Revenues
Presented in the tables below is information regarding the main components of the Regulated Businesses’ operating revenues:
| | For the Years Ended December 31, |
| For the Years Ended December 31, | | | For the Years Ended December 31, |
| | | 2020 | | 2019 | | 2018 | | 2023 | | 2022 | | 2021 |
| (In millions) | (In millions) | | | | | |
| Water services: | |
| Water services: | |
| Water services: | Water services: | | | | | | | | |
| Residential | Residential | $ | 1,895 | | | $ | 1,735 | | | $ | 1,663 | |
| Commercial | Commercial | 627 | | | 639 | | | 616 | |
| Fire service | Fire service | 147 | | | 142 | | | 137 | |
| Industrial | Industrial | 133 | | | 138 | | | 136 | |
| Public and other | Public and other | 226 | | | 230 | | | 216 | |
| Total water services | Total water services | 3,028 | | | 2,884 | | | 2,768 | |
| Wastewater services: | Wastewater services: | |
| Residential | Residential | 134 | | | 119 | | | 115 | |
| Residential | |
| Residential | |
| Commercial | Commercial | 34 | | | 31 | | | 30 | |
| Industrial | Industrial | 3 | | | 3 | | | 2 | |
| Public and other | Public and other | 14 | | | 14 | | | 14 | |
| Total water services | 185 | | | 167 | | | 161 | |
| Total wastewater services | |
Other (a) | Other (a) | 42 | | | 43 | | | 55 | |
| Total operating revenues | Total operating revenues | $ | 3,255 | | | $ | 3,094 | | | $ | 2,984 | |
(a)Includes other operating revenues consisting primarily of miscellaneous utility charges, fees and rents.
| | | | | | | | | | | | | | | | | |
| | For the Years Ended December 31, |
| | 2023 | | 2022 | | 2021 |
| (Gallons in millions) | | | | | |
| Billed water services volumes: | | | | | |
| Residential | 160,921 | | | 162,105 | | | 173,644 | |
| Commercial | 78,404 | | | 77,627 | | | 77,476 | |
| Industrial | 36,404 | | | 37,265 | | | 35,738 | |
| Fire service, public and other | 54,236 | | | 51,966 | | | 51,957 | |
| Total billed water services volumes | 329,965 | | | 328,963 | | | 338,815 | |
| | | | | | | | | | | | | | | | | |
| | For the Years Ended December 31, |
| | 2020 | | 2019 | | 2018 |
| (Gallons in millions) | | | | | |
| Billed water services volumes: | | | | | |
| Residential | 178,753 | | | 167,470 | | | 172,827 | |
| Commercial | 75,875 | | | 81,268 | | | 82,572 | |
| Industrial | 34,875 | | | 37,242 | | | 38,432 | |
| Fire service, public and other | 49,031 | | | 50,501 | | | 50,651 | |
| Total billed water services volumes | 338,534 | | | 336,481 | | | 344,482 | |
In 2020,2023, as compared to 2019,2022, operating revenues increased $161$415 million, primarily due to: (i) $122a $350 million increase from authorized rate increases, including infrastructure surcharges, principally fromto fund infrastructure investment in various states; (ii) $36a $32 million increase from water and wastewater acquisitions as well asand organic growth in existing systems; (iii) $16a $19 million estimated net increase in demand, primarily driven by (a) weather, including warmer anddue to drier than normal weather in the third quarter2023, mainly driven by drought conditions in our Missouri service territory; (iv) a $23 million net increase as a result of 2020 and unusually wet weather conditions experienced in the Northeast and Midwest during the second quarterreduced amortization of 2019, and (b) increases in demand from the Company’s residential customers in several states due to an increase in work from home activities resulting from the COVID-19 pandemic, substantially offset by decreases in demand from the Company’s commercial and industrial customers due to the COVID-19 pandemic; and (iv) $13 million decrease in other operating revenues due to EADIT, being returned to customers, includingprimarily in the Company’s New Jersey subsidiary as part of the general rate case which became effective on November 1, 2020.Pennsylvania subsidiary; and (v) partially offset by a $12 million decrease due to changes in customer demand.
Operation and Maintenance
Presented in the table below is information regarding the main components of the Regulated Businesses’ operating and maintenance expense, with explanations for material variances provided in the ensuing discussions:expense:
| | | | For the Years Ended December 31, | | For the Years Ended December 31, |
| | | 2020 | | 2019 | | 2018 | | 2023 | | 2022 | | 2021 |
| (In millions) | (In millions) | | | | | |
| Employee-related costs | |
| Employee-related costs | |
| Employee-related costs | Employee-related costs | $ | 495 | | | $ | 462 | | | $ | 451 | |
| Production costs | Production costs | 335 | | | 317 | | | 313 | |
| Operating supplies and services | Operating supplies and services | 242 | | | 237 | | | 227 | |
| Maintenance materials and supplies | Maintenance materials and supplies | 84 | | | 74 | | | 81 | |
| Customer billing and accounting | Customer billing and accounting | 58 | | | 55 | | | 60 | |
| Other | Other | 44 | | | 37 | | | 27 | |
| Total | $ | 1,258 | | | $ | 1,182 | | | $ | 1,159 | |
| Total operation and maintenance expense | |
Employee-Related Costs
| | | | For the Years Ended December 31, | | For the Years Ended December 31, |
| | | 2020 | | 2019 | | 2018 | | 2023 | | 2022 | | 2021 |
| (In millions) | (In millions) | | | | | |
| Salaries and wages | Salaries and wages | $ | 382 | | | $ | 363 | | | $ | 349 | |
| Salaries and wages | |
| Salaries and wages | |
| Group insurance | Group insurance | 65 | | | 60 | | | 57 | |
| Pensions | Pensions | 20 | | | 12 | | | 19 | |
| Other benefits | Other benefits | 28 | | | 27 | | | 26 | |
| Total | $ | 495 | | | $ | 462 | | | $ | 451 | |
| Total employee-related costs | |
In 2020,2023, as compared to 2019,2022, employee-related costs increased $33$8 million primarily due to: (i) $19 millionto annual merit increases and higher employee headcount to support growth of the business, which was partially offset by lower pension service costs, mainly attributable to an increase in salariesthe discount rate assumption.
Production Costs
| | | | | | | | | | | | | | | | | |
| | For the Years Ended December 31, |
| | 2023 | | 2022 | | 2021 |
| (In millions) | | | | | |
| Purchased water | $ | 161 | | | $ | 154 | | | $ | 153 | |
| Fuel and power | 108 | | | 104 | | | 97 | |
| Chemicals | 105 | | | 78 | | | 59 | |
| Waste disposal | 64 | | | 51 | | | 44 | |
| Total production costs | $ | 438 | | | $ | 387 | | | $ | 353 | |
In 2023, as compared to 2022, production costs increased $51 million, primarily due to inflationary impacts from increased fuel, power and wages from higher headcount and related compensation expense supporting growth in the businesses; (ii) $5 millionchemical costs, as well as an increase in group insurance due to higher premiums in 2020; and (iii) $8 million increase in pension service costs.waste disposal maintenance.
Production Costs
| | | | | | | | | | | | | | | | | |
| | For the Years Ended December 31, |
| | 2020 | | 2019 | | 2018 |
| (In millions) | | | | | |
| Purchased water | $ | 149 | | | $ | 135 | | | $ | 133 | |
| Fuel and power | 88 | | | 90 | | | 91 | |
| Chemicals | 57 | | | 54 | | | 52 | |
| Waste disposal | 41 | | | 38 | | | 37 | |
| Total | $ | 335 | | | $ | 317 | | | $ | 313 | |
In 2020,2023, as compared to 2019, production costs2022, operating supplies and services increased $18$13 million primarily due to an increase in purchased water.maintenance costs on equipment and buildings.
Operating Supplies and ServicesOther
In 2020,2023, as compared to 2019, operating supplies and services2022, other increased $5 million primarily due to technology services.
Maintenance Materials and Supplies
In 2020, as compared to 2019, maintenance materials and supplies increased $10$12 million primarily due to an increase in planned deferred maintenance and tank painting projects into the Company’s New Jersey subsidiary andinsurance other than group reserve which had an increase in other maintenance costs across several of the Company’s subsidiaries.
Other (Operation and Maintenance)
In 2020, asunfavorable claims experience compared to 2019, other (operation and maintenance) increased $7 million primarily due to a $4 million reduction to the liability related to the Freedom Industries chemical spill, recorded in the first quarter of 2019 andprior year, as well as higher property insurance premiums during 2020.premiums.
Depreciation and Amortization
In 2020,2023, as compared to 2019,2022, depreciation and amortization increased $33$60 million primarily due to additional utility plant placed in service partially offset by the pre-tax benefit of $14 million for the year ended December 31, 2020, from depreciation expense not recorded related to the assets of the Company’s New York subsidiary, as required by assets held for sale accounting.capital infrastructure investments and acquisitions.
Other Income (Expenses)General Taxes
In 2020,2023, as compared to 2019, other income (expenses)2022, general taxes increased $41$24 million, primarily due to the reductionan increase in the non-service cost components ofNew Jersey Gross Receipts Tax and incremental property taxes.
Other Income (Expense)
In 2023, as compared to 2022, other expenses increased $49 million primarily due to higher net periodic pension and other postretirement benefitsbenefit costs in the current period as a result of market conditions, as well as higher interest expense resulting from higher asset returns.the issuance of incremental long-term debt. These increases were partially offset by an increase in allowance for funds used during construction in the current periods.
Provision for Income Taxes
In 2023, as compared to 2022, the Regulated Businesses’ provision for income taxes increased $71 million. The Regulated Businesses’ effective income tax rate was 21.1% and 18.0% for the years ended December 31, 2023 and 2022, respectively. The increase was primarily due to the decrease in the amortization of EADIT, pursuant to regulatory orders. The amortization of EADIT is generally offset with reductions in revenue.
Market-Based BusinessesOther
Presented in the table below is information for the Market-Based Businesses, with explanations for material variances provided in the ensuing discussions:Other:
| | | | | | | | | | | | | | | | | |
| | For the Years Ended December 31, |
| 2020 | | 2019 | | 2018 |
| (In millions) | | | | | |
| Operating revenues | $ | 540 | | | $ | 539 | | | $ | 476 | |
| Operation and maintenance | 389 | | | 393 | | | 362 | |
| Depreciation and amortization | 26 | | | 37 | | | 29 | |
| Loss (gain) on asset dispositions and purchases | 1 | | | 44 | | | (13) | |
| Impairment charge | — | | | — | | | 57 | |
| Income before income taxes | 120 | | | 66 | | | 41 | |
| Provision for income taxes | 29 | | | 20 | | | 11 | |
| Net loss attributable to noncontrolling interest | — | | | — | | | (2) | |
| Net income attributable to common shareholders | 91 | | | 46 | | | 32 | |
| | | | | | | | | | | | | | | | | |
| | For the Years Ended December 31, |
| 2023 | | 2022 | | 2021 |
| (In millions) | | | | | |
| Operating revenues | $ | 314 | | | $ | 287 | | | $ | 546 | |
| Operation and maintenance | 279 | | | 244 | | | 452 | |
| Depreciation and amortization | 11 | | | 16 | | | 35 | |
| General taxes | 19 | | | 17 | | | 20 | |
| Interest expense | (96) | | | (119) | | | (113) | |
| Interest income | 45 | | | 50 | | | 3 | |
| Gain on sale of businesses | — | | | 19 | | | 748 | |
| Other income | 12 | | | 6 | | | 2 | |
| (Benefit from) provision for income taxes | (7) | | | — | | | 205 | |
| Net (loss) income attributable to common shareholders | $ | (27) | | | $ | (34) | | | $ | 474 | |
Operating Revenues
In 2020,2023, as compared to 2019,2022, operating revenues increased $1$27 million primarily due to: (i) $49 millionfrom an increase in capital projects in MSG, from increased capital upgrades, and the addition of two new military contracts in 2019 (Joint Base San Antonio andprimarily at the United States Military Academy at West Point, New York); (ii) $14 million increase in HOS primarily from price increasesYork and revenue for existing customers andNaval Station Mayport. The Naval Station Mayport contract growth; (iii) $48 million decrease from the sale of the Company’s Keystone operations in the fourth quarter of 2019; (iv) $9 million decrease from the expiration of the Company’s contractwas awarded on June 30, 2022, with the Townshipperformance start date for operation on March 1, 2023.
Operation and Maintenance
Presented in the table below is information regarding the main components of the Market-Based Businesses’Other’s operating and maintenance expense:
| | | | For the Years Ended December 31, | | For the Years Ended December 31, |
| | | 2020 | | 2019 | | 2018 | | 2023 | | 2022 | | 2021 |
| (In millions) | (In millions) | | | | | | (In millions) | | | |
| Operating supplies and services | Operating supplies and services | $ | 148 | | | $ | 128 | | | $ | 142 | |
| Maintenance materials and supplies | Maintenance materials and supplies | 114 | | | 109 | | | 69 | |
| Employee-related costs | Employee-related costs | 90 | | | 109 | | | 104 | |
| Production costs | Production costs | 21 | | | 29 | | | 32 | |
| Other | Other | 16 | | | 18 | | | 15 | |
| Total | $ | 389 | | | $ | 393 | | | $ | 362 | |
| Total operation and maintenance expense | |
DepreciationOperating Supplies and AmortizationServices
In 2020,2023, as compared to 2019, depreciation2022, operating supplies and amortization decreased $11services increased $30 million primarily due to costs associated with the saleincreased capital projects in MSG.
Employee-Related Costs
In 2023, as compared to 2022, employee-related costs increased $12 million primarily due to salaries and wages and group insurance.
Gain on Sale of the Company’s Keystone operations in the fourth quarter of 2019.Businesses
Loss (Gain) on Asset Dispositions and Purchases
During the fourth quarter of 2019,In 2022, the Company recognized arecorded post-closing adjustments, primarily related to working capital, of pre-tax loss on saleincome of $44$20 million, or $35 million after-tax, relatingwhich increased the total gain related to the sale of its Keystone operations.HOS. See Note 6—5—Acquisitions and Divestitures in the Notes to Consolidated Financial Statements for additional information.
Provision
Tax Matters
On August 16, 2022, the Inflation Reduction Act of 2022 (the “IRA”) was signed into law. The IRA contains a Corporate Alternative Minimum Tax (“CAMT”) provision, effective January 1, 2023. To determine if a company is considered an applicable corporation subject to CAMT, the company’s average adjusted financial statement income (“AFSI”) for Income Taxesthe three consecutive years preceding the tax year must exceed $1 billion. An applicable corporation must make several adjustments to net income when determining AFSI. During 2023, the Company evaluated the potential impacts of the CAMT provision within the IRA and available guidance and determined that it did not exceed the $1 billion AFSI threshold and therefore was not subject to CAMT in 2023. Based on current guidance, the Company is expected to be subject to CAMT beginning in 2024, and will continue to evaluate the impacts as additional guidance is released.
Legislative Updates
During 2023 and 2024, the Company’s regulatory jurisdictions enacted the following legislation that has been approved and is effective as of February 14, 2024:
In 2020,•California passed Senate Bill 1469, which allows the CPUC to consider and authorize the implementation of a mechanism that separates the water corporation’s revenue and its water sales. Legislation was signed by the Governor on September 30, 2022, and was effective on January 1, 2023.
•Indiana passed House Bill 1417, which allows for deferred accounting and subsequent recovery through rates of regulatory assets, with or without Indiana Utility Regulatory Commission (the “IURC”) approval. There are several requirements: (i) the costs must be deferred as compareda regulatory asset, (ii) only incremental costs may be deferred, and (iii) the IURC must find the costs to 2019, provisionbe reasonable and prudent. Legislation was signed by the Governor and became effective on April 20, 2023.
•Indiana passed Senate Bill 180, which allows for income taxes increased $9 million primarily dueconsolidated revenue to an increasesupport post-acquisition capital improvements in pre-tax income.wastewater systems via a service enhancement improvement recovery mechanism. Legislation was signed by the Governor and became effective on May 1, 2023.
•Illinois passed House Bill 1105, which provides that property belonging to a public utility that provides water or sewer service may not be taken or damaged by eminent domain without prior approval from the Illinois Commerce Commission. Legislation was signed by the Governor and became effective on June 9, 2023.
•Illinois passed Senate Bill 250 (Public Act 103-0006), which contains supplemental appropriations for the previous fiscal year 2023 and appropriations for fiscal year 2024. This bill contains a $5 million appropriation to the Department of Commerce and Economic Opportunity for purposes of grants pursuant to the Water and Sewer Financial Assistance Act (Public Act 102-262), which was an initiative of the Company’s Illinois subsidiary during the 102nd General Assembly. Legislation was signed by the Governor on June 7, 2023, and the appropriation became effective July 1, 2023.
•California passed Senate Bill 122, which authorizes $300 million in additional funding for the California Water and Wastewater Arrearage Payment Program, and extends the eligibility date from March 2020 to June 2021, to March 2020 to December 2022. Legislation was signed and became effective on July 10, 2023.
•California passed Senate Bill 253, which requires any public or private company that does business in California and has over $1 billion in annual revenue to publicly disclose, beginning in 2026, scope 1, 2, and 3 greenhouse gas emissions released from their operations and supply chain.
•California passed Senate Bill 261, which requires companies doing business in California with greater than $500 million in annual revenues to prepare, beginning in 2026, biennial reports disclosing climate-related financial risk.
•New Jersey passed Assembly Bill 4791, establishing the "Resiliency and Environmental System Investment Charge Program," which creates a regulatory mechanism that enables water and wastewater utilities to recover the costs of investment in certain non-revenue producing utility system components that enhance water and wastewater system resiliency, environmental compliance such as existing and proposed requirements for PFAS, safety, and public health. Legislation was signed by the Governor and became effective on January 12, 2024.
Liquidity and Capital Resources
The Company regularly evaluates and monitors its cash requirements for capital investments, acquisitions, operations, commitments, debt maturities, interest and dividends. The Company’s business is capital intensive, with a majority of this capital funded by cash flows from operations. When necessary, the Company also obtains funds from external sources, primarily in the debt markets and through short-term commercial paper borrowings. The Company may also access the equity capital markets to support its capital funding requirements, as needed. The Company’s access to external financing on reasonable terms depends on its credit ratings and current business conditions, including that of the utility and water utility industry in general, as well as conditions in the debt or equity capital markets, and the national and international economic and geopolitical arenas. Disruptions in the credit markets may discourage lenders from extending the terms of such commitments or agreeing to new commitments. Market disruptions may also limit the Company’s ability to issue debt and equity securities in the capital markets.
If these business, market, financial and other conditions deteriorate to the extent that the Company is no longer able to access the capital markets on reasonable terms, AWCC has access to an unsecured revolving credit facility that expires in March 2025 with aggregate bank commitments of $2.25 billion. The facility is used principally to fulfill the Company’s short-term liquidity needs by supporting AWCC’s $2.10 billion commercial paper program and to provide a sublimit of up to $150 million for letters of credit. Subject to satisfying certain conditions, the credit agreement permits AWCC to increase the maximum commitment under the facility by up to $500 million.
In order to meet short-term liquidity needs, AWCC issues commercial paper that is supported by its revolving credit facility. As of December 31, 2020, AWCC had no outstanding borrowings and $76 million of outstanding letters of credit under its revolving credit facility, with $1.39 billion available to fulfill its short-term liquidity needs and to issue letters of credit. The Company believes that its ability to access the debt and equity capital markets, the revolving credit facility and cash flows from operations will generate sufficient cash to fund the Company’s short-term requirements. The Company believes it has sufficient liquidity and the ability to manage its expenditures, should there be a disruption of the capital and credit markets. However, there can no assurance that the lenders will be able to meet existing commitments to AWCC under the revolving credit facility, or that AWCC will be able to access the commercial paper or loan markets in the future on acceptable terms or at all. See Credit Facilities and Short-Term Debt below for additional information.
To ensure adequate liquidity given the impacts of the COVID-19 pandemic on debt and capital markets, on March 20, 2020, AWCC entered into a Term Loan Credit Agreement, by and among parent company, AWCC and the lenders party thereto, which provided for the Term Loan Facility of up to $750 million. On March 20, 2020, AWCC borrowed $500 million under the Term Loan Facility, the proceeds of which were used for general corporate purposes of AWCC and American Water, and to provide additional liquidity. The Term Loan Facility allowed for a single additional borrowing of up to $250 million, which expired unused on June 19, 2020. The Term Loan Facility commitments terminate on March 19, 2021. As of December 31, 2020, $500 million of principal was outstanding under the Term Loan Facility.
The Company uses its capital resources, including cash, primarily to (i) fund operating and capital requirements, (ii) pay interest and meet debt maturities, (iii) pay dividends, (iv) fund acquisitions, (v) fund pension and postretirement benefit obligations, and (vi) the Company estimates, during 2021, to begin to pay federal income taxes. The Company invests a significant amount of cash on regulated capital projects where it expects to earn a long-term return on investment. Additionally, the Company operates in rate regulated environments in which the amount of new investment recovery may be limited, and where such recovery generally takes place over an extended period of time, and certain capital recovery is also subject to regulatory lag. See Item 1—Business—Regulated Businesses—Regulation and Rate Making for additional information. The Company expects to fund future maturities of long-term debt through a combination of external debt and, to the extent available, cash flows from operations. Since the Company expects its capital investments over the next few years to be greater than its cash flows from operating activities, the Company currently plans to fund the excess of its capital investments over its cash flows from operating activities for the next five years through a combination of long-term debt and equity.equity issuances, in addition to the remaining proceeds from the sale of HOS. The remaining proceeds from the sale of HOS include receipt of payments under a secured seller promissory note, plus interest. If necessary, the Company may delay certain capital investments or other funding requirements or pursue financing from other sources to preserve liquidity. In this event, the Company believes it can rely upon cash flows from operations to meet its obligations and fund its minimum required capital investments for an extended period of time.
The Company regularly evaluates and monitors its cash requirements for capital investments, acquisitions, operations, commitments, debt maturities, interest and dividends. The Company’s business is capital intensive, with a majority of this capital funded by cash flows from operations. The Company also obtains funds from external sources, primarily in the debt markets and through short-term commercial paper borrowings, and may also access the equity capital markets as needed or desired to support capital funding requirements. In order to meet short-term liquidity needs, American Water Capital Corp. (“AWCC”), the wholly owned finance subsidiary of parent company, issues commercial paper that is supported by its revolving credit facility. The Company’s access to external financing on reasonable terms may depend on, as appropriate, any or all of the following: current business conditions, including that of the utility and water utility industry in general; conditions in the debt or equity capital markets; the Company’s credit ratings; and conditions in the national and international economic and geopolitical arenas. Disruptions in the credit markets may discourage lenders from extending the terms of such commitments or agreeing to new commitments. Market disruptions may also limit the Company’s ability to issue debt and equity securities in the capital markets.
If these unfavorable business, market, financial and other conditions deteriorate to the extent that the Company is no longer able to access the commercial paper and/or capital markets on reasonable terms, AWCC has access to an unsecured revolving credit facility. The Company’s revolving credit facility provides $2.75 billion in aggregate total commitments from a diversified group of financial institutions. AWCC’s revolving credit facility is used principally to support its commercial paper program, to provide additional liquidity support, and to provide a sub-limit for the issuance of up to $150 million in letters of credit. The maximum aggregate principal amount of short-term borrowings authorized for issuance under AWCC’s commercial paper program is $2.60 billion. On October 26, 2023, the termination date of the credit agreement with respect to AWCC’s revolving credit facility was extended, as permitted by the terms of the credit agreement, from October 2027 to October 2028. Subject to satisfying certain conditions, the credit agreement also permits AWCC to increase the maximum commitment under the facility by up to an aggregate of $500 million and to request extensions of its expiration date for up to two one-year periods, as to which one such extension request remains. As of December 31, 2023, AWCC had no outstanding borrowings and $75 million of outstanding letters of credit under its revolving credit facility, with $2.50 billion available to fulfill its short-term liquidity needs and to issue letters of credit.
The Company believes that its ability to access the debt and equity capital markets, the revolving credit facility and cash flows from operations will generate sufficient cash to fund the Company’s short-term requirements. The Company believes it has sufficient liquidity and the ability to manage its expenditures, should there be a disruption of the capital and credit markets. However, there can be no assurance that the lenders will be able to meet existing commitments to AWCC under the revolving credit facility, or that AWCC will be able to access the commercial paper or loan markets in the future on acceptable terms or at all.
Cash Flows Provided byfrom Operating Activities
Cash flows provided byfrom operating activities primarily result from the sale of water and wastewater services and, due to the seasonality of demand, are generally greater during the warmer months. The Company’s future cash flows provided byfrom operating activities will be affected by, among other things: the Company’s customers’ ability to pay for service in a timely manner, economic utility regulation, inflation;inflation, compliance with environmental, health and safety standards;standards, production costs;costs, maintenance costs;costs, customer growth;growth, declining customer usage of water;water, employee-related costs, including pension funding;funding, weather and seasonality; taxes;seasonality, taxes, and overall economic conditions.
Cash flows provided by operating activities have been a reliable, steady source of funding, sufficient to meet operating requirements and fund the majority of the Company’s capital investments. The Company expects to seek access to debt and equity capital markets to meet the balance of its capital investment, if any, and fund its dividend payments, as needed. Operating cash flows can be negatively affected by changes in the Company’s rate regulated environments, changes in the Market-Based Businesses, changes in the economy, interest rates, the timing of tax payments, and the Company’s customers’ ability to pay for service in a timely manner, among other items. The Company can provide no assurance that its customers’ historical payment pattern will continue in the future. The Company’s current liabilities may exceed current assets mainly from debt maturities due within one year and the use of short-term debt as a funding source, primarily to meet scheduled maturities of long-term debt, fund acquisitions and construction projects, as well as cash needs, which can fluctuate significantly due to the seasonality of the business.business and other factors. The Company addresses cash timing differences primarily through the aforementionedits short-term liquidity funding mechanisms.
Presented in the table below is a summary of the major items affecting the Company’s cash flows provided byfrom operating activities:
| | | | For the Years Ended December 31, | | For the Years Ended December 31, |
| (In millions) | (In millions) | 2020 | | 2019 | | 2018 | (In millions) | 2023 | | 2022 | | 2021 |
| Net income | Net income | $ | 709 | | | $ | 621 | | | $ | 565 | |
| Add (less): | Add (less): | | | | | | Add (less): | | | |
| Depreciation and amortization | Depreciation and amortization | 604 | | | 582 | | | 545 | |
| Deferred income taxes and amortization of investment tax credits | Deferred income taxes and amortization of investment tax credits | 207 | | | 208 | | | 195 | |
| Non-cash impairment charge | — | | | — | | | 57 | |
Other non-cash activities (a) | Other non-cash activities (a) | — | | | 38 | | | 56 | |
Changes in working capital (b) | Changes in working capital (b) | (49) | | | (1) | | | 30 | |
| Settlement of cash flow hedges | (6) | | | (30) | | | — | |
| Pension and postretirement healthcare contributions | (39) | | | (31) | | | (22) | |
| Impact of Freedom Industries settlement activities | — | | | (4) | | | (40) | |
| Net cash flows provided by operating activities | $ | 1,426 | | | $ | 1,383 | | | $ | 1,386 | |
| Pension and non-pension postretirement benefit contributions | |
| Gain on sale of businesses | |
| Net cash provided by operating activities | |
(a)Includes provision for losses on accounts receivable, loss (gain) on asset dispositions and purchases, pension and non-pension postretirement benefits and other non-cash, net. Details of each component can be found on the Consolidated Statements of Cash Flows.
(b)Changes in working capital include changes to receivables and unbilled revenues, income tax receivable, accounts payable and accrued liabilities, accrued taxes and other current assets and liabilities, net, lessnet. Details of each component can be found on the settlementConsolidated Statements of cash flow hedges.Cash Flows.
In 2020,2023, cash flows provided by operating activities increased $43$766 million, primarily due to changes in deferred taxes, working capital and an increase in net income and the decreaseincome. The change in cash paid fordeferred taxes was driven by the settlement of cash flow hedgesthe deferred tax liability in 2020 compared2022 related to the prior yearCompany’s New York regulated operations that was sold in connection with AWCC’s 2020 and 2019 debt offerings.the first quarter of 2022. The main factors contributing to the increase in net income are described in “Consolidated Results of Operations” and “Segment Results of Operations” above. Partially offsetting these increases was a changechanges in working capital were primarily resulting fromdriven by $280 million of estimated tax payments for taxable gains on the following: (i) an increase in accounts receivable, net due to increased revenues compared tosales of the same periodCompany’s Homeowner Services Group and its New York regulated operations in the prior year and the impactfirst half of the COVID-19 pandemic in 2020; (ii) an increase in unbilled revenues as a result2022.
The Company expects to make pension contributions to the plan trusts of $37$44 million in 2021. In addition, the Company estimates that contributions will amount to $37 million, $35 million, $33 million and $30 million in 2022, 2023, 2024 and 2025, respectively.2024. Actual amounts contributed could change materially from these estimatesthis estimate as a result of changes in assumptions and actual investment returns, among other factors.
Cash Flows Used infrom Investing Activities
Presented in the table below is a summary of the major items affecting the Company’s cash flows used infrom investing activities:
| | | | For the Years Ended December 31, | | For the Years Ended December 31, |
| (In millions) | (In millions) | 2020 | | 2019 | | 2018 | (In millions) | 2023 | | 2022 | | 2021 |
| Capital expenditures | Capital expenditures | $ | (1,822) | | | $ | (1,654) | | | $ | (1,586) | |
| Acquisitions, net of cash acquired | Acquisitions, net of cash acquired | (135) | | | (235) | | | (398) | |
| Proceeds from sale of assets | 2 | | | 48 | | | 35 | |
| Proceeds from sale of assets, net of cash on hand | |
| Removal costs from property, plant and equipment retirements, net | Removal costs from property, plant and equipment retirements, net | (106) | | | (104) | | | (87) | |
| Net cash flows used in investing activities | $ | (2,061) | | | $ | (1,945) | | | $ | (2,036) | |
| Net cash used in investing activities | |
In 2020,2023, cash flows used in investing activities increased $116$688 million primarily dueas a result of increased payments for capital expenditures, as well as no assets sales in 2023 whereas 2022 had $608 million of proceeds from the sale of the Company’s New York operations. The Company continues to continued investmentinvest across all infrastructure categories, mainly replacement and renewal of transmission and distribution and treatmentservices, meter and pumpingfire hydrants infrastructure in the Company’s Regulated Businesses, as discussed below. Additionally, proceeds from the sale of assets were higher in 2019 compared to 2020, due to the sale of Keystone for $31 million, in the fourth quarter of 2019. Partially offsetting these increases was a decrease in acquisitions in 2020 compared to 2019.
The Company’s infrastructure investment plan consists of both infrastructure renewal programs, where the Company replaces infrastructure,mains, services, meters, hydrants and valves, as needed, and major capital investment projects, where the Company constructs new water and wastewater treatment and delivery facilities to meet new customer growth and water quality regulations. The Company’s projected capital expenditures and other investments are subject to periodic review and revision to reflect changes in economic conditions and other factors.
Presented in the table below is a summary of the Company’s capital expenditures by category:
| | | | For the Years Ended December 31, | | For the Years Ended December 31, |
| (In millions) | (In millions) | 2020 | | 2019 | | 2018 | (In millions) | 2023 | | 2022 | | 2021 |
| Transmission and distribution | Transmission and distribution | $ | 704 | | | $ | 661 | | | $ | 572 | |
| Treatment and pumping | Treatment and pumping | 306 | | | 190 | | | 231 | |
| Services, meter and fire hydrants | Services, meter and fire hydrants | 333 | | | 346 | | | 303 | |
| General structure and equipment | General structure and equipment | 299 | | | 234 | | | 371 | |
| Sources of supply | Sources of supply | 54 | | | 83 | | | 26 | |
| Wastewater | Wastewater | 126 | | | 140 | | | 83 | |
| Total capital expenditures | Total capital expenditures | $ | 1,822 | | | $ | 1,654 | | | $ | 1,586 | |
In 2020,2023, the Company’s capital expenditures increased $168$278 million primarily due to investment in transmission and distribution and treatment and pumping infrastructure.an increase across most infrastructure categories.
The Company also grows its business primarily through acquisitions of water and wastewater systems, as well as other water-related services.systems. These acquisitions are generally located in geographic proximity to the Company’s existing Regulated Businesses and support continued geographical diversification and growth of its operations. Generally, acquisitions are funded initially with short-term debt, and later refinanced with long-term financing, once reflected in rate base.financing. During 2020,2023, the Company paid $135$81 million to fund acquisitions, including deposits for the acquisitionpending acquisitions. The Company closed on 23 acquisitions of 23various regulated water and wastewater systems representing in the aggregateduring 2023, which added approximately 37,80018,100 water and wastewater customers.
As previously noted, over the next five years the Company expects to invest between $10.3$16 billion to $10.5$17 billion, from 2021with $14.5 billion to 2025, with $8.9$15 billion of this range for infrastructure improvements in the Regulated Businesses, and between $22 billion to $25 billion from 2021 to 2030. In 2021, the Company expects to invest $1.9between $34 billion with $1.6to $38 billion forover the next 10 years. In 2024, the Company expects to invest $3.1 billion, consisting of infrastructure improvements and $300 million for acquisitions in the Regulated Businesses.
Cash Flows from Financing Activities
Presented in the table below is a summary of the major items affecting the Company’s cash flows provided byfrom financing activities:
| | For the Years Ended December 31, |
| 2020 | | 2019 | | 2018 |
| For the Years Ended December 31, | | | For the Years Ended December 31, |
| 2023 | | | 2023 | | 2022 | | 2021 |
| (In millions) | (In millions) | | | | | |
| Proceeds from long-term debt | Proceeds from long-term debt | $ | 1,334 | | | $ | 1,530 | | | $ | 1,358 | |
| Proceeds from long-term debt | |
| Proceeds from long-term debt | |
| Repayments of long-term debt | Repayments of long-term debt | (342) | | | (495) | | | (526) | |
| Proceeds from term loan | 500 | | | — | | | — | |
| Net repayments of short-term borrowings | (5) | | | (178) | | | 60 | |
| Proceeds from issuance of common stock | — | | | — | | | 183 | |
| (Repayments of) proceeds from term loan | |
| Net proceeds from common stock financing | |
| Net short-term (repayments) borrowings with maturities less than three months | |
| Dividends paid | Dividends paid | (389) | | | (353) | | | (319) | |
| Anti-dilutive stock repurchases | — | | | (36) | | | (45) | |
Other financing activities, net (a) | Other financing activities, net (a) | 22 | | | 26 | | | 15 | |
| Net cash flows provided by financing activities | $ | 1,120 | | | $ | 494 | | | $ | 726 | |
| Net cash provided by (used in) financing activities | |
(a)Includes proceeds from issuances of common stock under various employee stock plans and the Company’s dividend reinvestment plan, net of taxes paid, advances and contributions in aid of construction, net of refunds, and debt issuance costs and make-whole premiums on early debt redemption.
In 2020,2023, cash flows provided by financing activities increased $626$188 million, primarily due to the $500 million borrowed undercommon stock financing and issuance of long-term debt. This was partially offset by repayment in full of the Term Loan Facilityshort-term commercial paper obligations during the first quarterhalf of 2020, lower net repayments of commercial paper borrowings and no anti-dilutive stock repurchases in 2020, partially offset by higher dividends paid in 2020.2023.
The Company’s financing activities are primarily focused on funding regulated infrastructure expenditures, regulated and market-based acquisitions and payment of dividends. These activities included the issuance of long-term and short-term debt, primarily through AWCC and in 2018, an equity issuance to fund approximately 50% of the purchase price of the Pivotal acquisition.issuances from parent company. Based on the needs of the Regulated Businesses and the Company, AWCC may borrow funds or issue its debt in the capital markets and then, through intercompany loans, provide those borrowings to the Regulated Businesses and parent company. The Regulated Businesses and parent company are obligated to pay their portion of the respective principal and interest to AWCC, in the amount necessary to enable AWCC to meet its debt service obligations. Parent company’s borrowings are not a source of capital for the Regulated Businesses, therefore, parent company is not able to recover the interest charges on its debt through regulated water and wastewater rates. As of December 31, 2020,2023, AWCC has made long-term fixed rate loans and commercial paper loans to the Regulated Businesses amounting to $5.4 billion and $718 million, respectively, in addition to the $500 million outstanding on the Term Loan Facility. Additionally, as of December 31, 2020, AWCC has made long-term fixed rate loans and commercial paper loans to parent company amounting $2.8 billion and $68 million, respectively. As of December 31, 2020, parent company has made long-term fixed rate loans to the Market-BasedRegulated Businesses amounting to $183 million related$7.6 billion. Additionally, as of December 31, 2023, AWCC has made long-term fixed rate loans to the acquisition of Pivotal on June 4, 2018.parent company amounting to $3.4 billion.
On April 14, 2020, AWCCMarch 3, 2023, the Company completed a $1.0 billion debtan underwritten public offering which included the sale of $500 millionan aggregate principal amount of its 2.80% Senior Notes due 2030 and $500 million aggregate principal amount12,650,000 shares of its 3.45% Senior Notes due 2050. At theparent company common stock. Upon closing of this offering, the offering, AWCCCompany received, after deduction of the underwriting discountsdiscount and before deduction of offering expenses, net proceeds of $989approximately $1,688 million. AWCCThe Company used the net proceeds to: (i) lend fundsof the offering to repay short-term commercial paper obligations of AWCC, the wholly owned finance subsidiary of parent company, and its regulated subsidiaries; (ii) fund sinking fund payments for and to repay at maturity, $28general corporate purposes.
On June 29, 2023, AWCC issued, in a private placement, $1,035 million in aggregate principal amount of outstanding long-term debt3.625% Exchangeable Senior Notes due 2026 (the “Notes”). AWCC received net proceeds of AWCCapproximately $1,022 million, after deduction of underwriting discounts and certaincommissions but before deduction of offering expenses payable by AWCC. A portion of the Company’s regulated subsidiaries; (iii)net proceeds was used to repay AWCC’s commercial paper obligations and short-term indebtedness under AWCC’s $2.25 billion unsecured revolving credit facility; and (iv)the remainder was used for general corporate purposes. See Note 11—Long-Term Debt in the Notes to Consolidated Financial Statements for additional information.
One of the principal market risks to which the Company is exposed is changes in interest rates. In order to manage the exposure, the Company follows risk management policies and procedures, including the use of derivative contracts such as swaps.treasury lock agreements. The Company also reduces exposure to interest rates by managing commercial paper and debt maturities. The Company does not enter into derivative contracts (through AWCC) for speculative purposes and does not use leveraged instruments. The derivative contracts entered into are for periods consistent with the related underlying exposures. The Company is exposed to the risk that counterparties to derivative contracts will fail to meet their contractual obligations. The Company minimizes the counterparty credit risk on these transactions by dealing only dealing with leading, credit-worthycreditworthy financial institutions, having long-term credit ratings of “A” or better.
On April 8, 2020,In November and December 2023, the Company terminated fourentered into six treasury lock agreements, each with an aggregatea term of 10 years, with notional amount of $400 million, realizing a net loss of $6amounts totaling $225 million, to reduce interest rate exposure on debt expected to be issued in 2024. These treasury lock agreements terminate in September 2024, and have an average fixed rate of 4.24%. The Company designated these treasury lock agreements as cash flow hedges, with their fair value recorded in accumulated other comprehensive gain or loss. Upon termination, the cumulative gain or loss recorded in accumulated other comprehensive gain or loss will be amortized through interest, net over a ten-year period, in accordance with the termsterm of the new debt issued on April 14, 2020. debt.
During 2022 and the first half of 2023, the Company entered into 11 treasury lock agreements, each with a term of 10 years, with notional amounts totaling $300 million. The Company designated these treasury lock agreements as cash flow hedges, with their fair value recorded in accumulated other comprehensive gain or loss. In June 2023, the Company terminated the treasury lock agreements realizing a net gain of $3 million included in Other, net in the accompanying Consolidated Statements of Operations.
No ineffectiveness was recognized on hedging instruments for the years ended December 31, 2020 and 2019.
The Company sought to take advantage of lower interest rates available in the capital markets in 2020 by refinancing long-term debt, where possible. In 2020, AWCC and the Company’s regulated subsidiaries issued in the aggregate $311 million of private activity bonds and government funded debt in multiple transactions with annual interest rates ranging from 0.60% to 1.20%, maturing in 2023, to 2027. The Company used these proceeds to retire an aggregate of $311 million of long-term debt issues at maturity with annual interest rates ranging from 4.45% to 5.60%.2022 or 2021.
In May 2018,February 2021, parent company and AWCC filed with the SEC a universal shelf registration statement that enables the Company to meet its capital needs through the offer and sale to the public from time to time of an unlimited amount of various types of securities, including American Water common stock, preferred stock, and other equity and hybrid securities, and AWCC debt securities, all subject to market conditions and demand, general economic conditions, and as applicable, rating status. The shelf registration statement will expire in May 2021.February 2024. During 2020, 20192022 and 2018, $1.00 billion,2021, $800 million, and $1.10 billion, and $1.33 billion, respectively, of debt securities were issued under this registration statement. Additionally, during 2018During 2023 under this registration statement, the Companyparent company issued 2.32 million12,650,000 shares of its common stock for aggregate net proceeds of $183approximately $1,688 million.
Presented in the table below are the issuances of long-term debt in 2020:2023:
| | Company | Company | | Type | | Rate | | Weighted Average Rate | | Maturity | | Amount
(in millions) | Company | | Type | | Rate | | Weighted Average Rate | | Maturity | | Amount
(in millions) |
AWCC (a) | AWCC (a) | | Senior notes—fixed rate | | 2.80%-3.45% | | 3.13% | | 2030-2050 | | $ | 1,000 | |
AWCC (a) (b) | | Private activity bonds and government funded debt—fixed rate | | 0.60%-0.70% | | 0.42% | | 2023-2023 | | 86 | |
| Other American Water subsidiaries | | Private Activity Mortgage Bonds | | 0.85%-1.20% | | 1.10% | | 2023-2027 | | 225 | |
AWCC (a) | |
| Other American Water subsidiaries | Other American Water subsidiaries | | Private activity bonds and government funded debt—fixed rate | | 0.00%-5.00% | | 0.16% | | 2021-2048 | | 23 | |
| Total issuances | Total issuances | | | | | | | | $ | 1,334 | |
(a)This indebtedness is considered “debt” for purposes of a support agreement between parent company and AWCC, which serves as a functional equivalent of a full and unconditional guarantee by parent company of AWCC’s payment obligations under such indebtedness. See “—Issuer and Guarantor of Senior Notes” below.
(b)This indebtedness has a mandatory redemption provision callable in 2023.
Presented in the table below are the retirements and redemptions of long-term debt in 20202023 through sinking fund provisions, optional redemption or payment at maturity:
| | Company | Company | | Type | | Rate | | Weighted Average Rate | | Maturity | | Amount
(in millions) | Company | | Type | | Rate | | Weighted Average Rate | | Maturity | | Amount
(in millions) |
| AWCC | AWCC | | Private activity bonds and government funded debt—fixed rate | | 1.79%-5.38% | | 5.29% | | 2020-2031 | | $ | 87 | |
| Other American Water subsidiaries | | Private activity mortgage bonds | | 4.45%-5.60% | | 5.19% | | 2020 | | 225 | |
| Other American Water subsidiaries | | Private activity bonds and government funded debt—fixed rate | | 0.00%-5.60% | | 2.08% | | 2020-2048 | | 15 | |
| AWCC | |
| Other American Water subsidiaries | Other American Water subsidiaries | | Mortgage bonds | | 3.92%-9.71% | | 7.83% | | 2020-2021 | | 13 | |
| Other American Water subsidiaries | Other American Water subsidiaries | | Mandatory redeemable preferred stock | | 8.49%-9.18% | | 8.64% | | 2031-2036 | | 2 | |
| Total retirements and redemptions | Total retirements and redemptions | | | | | | | | $ | 342 | |
From time to time and as market conditions warrant, the Company may engage in long-term debt retirements through make-whole redemptions, tender offers, open market repurchases or other viable alternatives.
Issuer and Guarantor of Senior Notes
The outstandingOutstanding unsecured senior notes issued by AWCC (other than the wholly owned finance subsidiary of parent company,Notes) have been issued under two indentures, each by and between AWCC and Computershare Trust Company, N.A., as successor to Wells Fargo Bank, National Association, as trustee, providing for the rights and obligations of the parties thereto and the holders of the notes issued thereunder. The Notes were issued under an indenture, by and among AWCC, parent company and U.S. Bank Trust Company, National Association, as trustee, providing for the rights and obligations of the parties thereto and the holders of the Notes. The senior notes alsoand the Notes have been issued with the benefit of a support agreement, as amended, between parent company and AWCC, which serves as the functional equivalent of a full and unconditional guarantee by parent company of AWCC’s payment obligations under the senior notes.such indebtedness. No other subsidiary of parent company provides guarantees for any of the outstanding senior notes.such indebtedness. If AWCC is unable to make timely payment of any interest, principal or premium, if any, on such senior notes or the Notes, parent company will provide to AWCC, at its request or the request of any holder of such senior notes,thereof, funds to make such payment in full. If AWCC fails or refuses to take timely action to enforce certain rights under the support agreement or if AWCC defaults in the timely payment of any amounts owed to any holder of such senior notes,holder, when due, the support agreement provides that thesuch holder may proceed directly against parent company to enforce such rights or to obtain payment of the defaulted amounts owed to that holder.
As a wholly owned finance subsidiary of parent company, AWCC has no significant assets other than obligations of parent company and certain of its subsidiaries in its Regulated Businesses segment to repay certain intercompany loans made to them by AWCC. AWCC’s ability to make payments of amounts owed to holders of the senior notes and the Notes will be dependent upon AWCC’s receipt of sufficient payments of amounts owed pursuant to the terms of such intercompany loans and from its ability to issue indebtedness or otherwise obtain loans in the future, the proceeds of which would be used to fund the repayment of the senior notes.notes and the Notes.
Because parent company is a holding company and substantially all of its operations are conducted through its subsidiaries other than AWCC, parent company’s ability to fulfill its obligations under the support agreement will be dependent upon its receipt of sufficient cash dividends or distributions from its operating subsidiaries. See Note 10—9—Shareholders’ Equity—Dividends and Distributions, in the Notes to the Consolidated Financial Statements for a summary of the limitations on parent company and its subsidiaries to pay dividends or make distributions. Furthermore, parent company’s operating subsidiaries are separate and distinct legal entities and, other than AWCC, have no obligation to make any payments on the senior notes or the Notes or to make available or provide any funds for such payment, other than through their repayment obligations under intercompany loans, if any, with AWCC. Based on the foregoing, parent company’s obligations under the support agreement will be effectively subordinated to all indebtedness and other liabilities, including trade payables, lease commitments and moneys borrowed or other indebtedness incurred or issued by parent company’s subsidiaries other than AWCC.
Credit Facilities and Short-Term Debt
AWCC has an unsecured revolving credit facility of $2.25 billion that expires in March 2025. In April 2020, AWCC and its lenders agreed to extend the termination date of the credit agreement with respect to AWCC’s revolving credit facility pursuant to its terms from March 2024 to March 2025. Subject to satisfying certain conditions, the credit agreement also permits AWCC to increase the maximum commitment under the facility by up to an aggregate of $500 million.
Interest rates on advances under the AWCC revolving credit facility are based on a credit spread to the LIBORSecured Overnight Financing Rate (“SOFR”) rate (or applicable market replacement rate) or base rate, each determined in accordance with Moody Investors Service’s and Standard & Poor’s Financial Services’S&P Global Ratings’ then applicable credit rating on AWCC’s senior unsecured, non-credit enhanced debt. The facility is used principally to support AWCC’s commercial paper program, to provide additional liquidity support and to provide a sub-limit of up to $150 million infor letters of credit. Indebtedness under the facility isand AWCC’s commercial paper are considered “debt” for purposes of a support agreement between parent company and AWCC, which serves as a functional equivalent of a full and unconditional guarantee by parent company of AWCC’s payment obligations under the credit facility.thereunder.
Presented in the tables below are the aggregate credit facility commitments, commercial paper limit and letter of credit availability under the revolving credit facility, as well as the available capacity for each, as of December 31,:31:
| | 2020 |
| Commercial Paper Limit | | Letters of Credit | | Total (a) |
| 2023 | | | 2023 |
| Commercial Paper Limit | | | Commercial Paper Limit | | Letters of Credit | | Total (a) |
| (In millions) | (In millions) | | | | | |
| Total availability | Total availability | $ | 2,100 | | | $ | 150 | | | $ | 2,250 | |
| Total availability | |
| Total availability | |
| Outstanding debt | Outstanding debt | (786) | | | (76) | | | (862) | |
| Remaining availability as of December 31, 2020 | $ | 1,314 | | | $ | 74 | | | $ | 1,388 | |
| Remaining availability as of December 31, 2023 | |
(a)Total remaining availability of $1.39$2.50 billion as of December 31, 2020 may be accessed2023, was accessible through revolver draws.
| | 2019 |
| Commercial Paper Limit | | Letters of Credit | | Total (a) |
| 2022 | | | 2022 |
| Commercial Paper Limit | | | Commercial Paper Limit | | Letters of Credit | | Total (a) |
| (In millions) | (In millions) | | | | | |
| Total availability | Total availability | $ | 2,100 | | | $ | 150 | | | $ | 2,250 | |
| Total availability | |
| Total availability | |
| Outstanding debt | Outstanding debt | (786) | | | (76) | | | (862) | |
| Remaining availability as of December 31, 2019 | $ | 1,314 | | | $ | 74 | | | $ | 1,388 | |
| Remaining availability as of December 31, 2022 | |
(a)Total remaining availability of $1.39$1.50 billion as of December 31, 2019 may be accessed2022, was accessible through revolver draws.
Presented in the table below is the Company’s total available liquidity as of December 31, 20202023 and 2019:2022:
| | | | | | | | | | | | | | | | | |
| Cash and Cash Equivalents | | Availability on Revolving Credit Facility | | Total Available Liquidity |
| (In millions) | | | | | |
| Available liquidity as of December 31, 2020 | $ | 547 | | | $ | 1,388 | | | $ | 1,935 | |
| Available liquidity as of December 31, 2019 | 60 | | | 1,388 | | | 1,448 | |
| | | | | | | | | | | | | | | | | |
| Cash and Cash Equivalents | | Availability on Revolving Credit Facility | | Total Available Liquidity |
| (In millions) | | | | | |
| Available liquidity as of December 31, 2023 | $ | 330 | | | $ | 2,495 | | | $ | 2,825 | |
| Available liquidity as of December 31, 2022 | $ | 85 | | | $ | 1,495 | | | $ | 1,580 | |
The weighted average interest rate on AWCCAWCC’s outstanding short-term borrowings was approximately 5.51% and 4.41%, for the years ended December 31, 20202023 and 2019 was approximately 1.16% and 2.54%,2022, respectively.
Capital Structure
Presented in the table below is the percentage of the Company’s capitalization represented by the components of its capital structure as of December 31:
| | | | 2020 | | 2019 | | 2018 | | 2023 | | 2022 | | 2021 |
| Total common shareholders’ equity | Total common shareholders’ equity | 37.1 | % | | 39.2 | % | | 40.4 | % | Total common shareholders’ equity | 44.2 | % | | 38.3 | % | | 39.9 | % |
| Long-term debt and redeemable preferred stock at redemption value | Long-term debt and redeemable preferred stock at redemption value | 53.6 | % | | 55.6 | % | | 52.4 | % | Long-term debt and redeemable preferred stock at redemption value | 52.9 | % | | 54.4 | % | | 56.6 | % |
| Short-term debt and current portion of long-term debt | Short-term debt and current portion of long-term debt | 9.3 | % | | 5.2 | % | | 7.2 | % | Short-term debt and current portion of long-term debt | 2.9 | % | | 7.3 | % | | 3.5 | % |
| Total | Total | 100 | % | | 100 | % | | 100 | % | Total | 100 | % | | 100 | % | | 100 | % |
The changeschange in the capital structure between periods weremix in 2023 is mainly attributable to an increase inthe common stock issuance on March 3, 2023, and the long-term debt and the $500 million borrowed under the Term Loan Facility during 2020, which is scheduledissuance on June 29, 2023. The proceeds from these issuances were used to terminate on March 19, 2021.repay short-term commercial paper borrowings.
Debt Covenants
The Company’s debt agreements contain financial and non-financial covenants. To the extent that the Company is not in compliance with these covenants, an event of default may occur under one or more debt agreements and the Company, or its subsidiaries, may be restricted in its ability to pay dividends, issue new debt or access the revolving credit facility. The long-term debt indentures contain a number of covenants that, among other things, prohibit or restrict the Company from issuing debt secured by the Company’s assets, subject to certain exceptions. Failure to comply with any of these covenants could accelerate repayment obligations.
Covenants in certain long-term notes the Term Loan Facility and the revolving credit facility require the Company to maintain a ratio of consolidated debt to consolidated capitalization (as defined in the relevant documents) of not more than 0.70 to 1.00. On December 31, 2020,2023, the Company’s ratio was 0.630.56 to 1.00 and therefore the Company was in compliance with the covenants.
Security Ratings
Presented in the table below are long-term and short-term credit ratings and rating outlooks as of February 24, 202114, 2024, as issued by the following rating agencies:Moody’s Investors Service on January 29, 2024, and S&P Global Ratings on February 6, 2023:
| | | | | | | | | | | | | | |
| Securities | | Moody’s Investors Service | | Standard & Poor’sS&P Global Ratings Service |
| Rating outlook | | Stable | | Stable |
| Senior unsecured debt | | Baa1 | | A |
| Commercial paper | | P-2 | | A-1 |
A security rating is not a recommendation to buy, sell or hold securities and may be subject to revision or withdrawal at any time by the assigning rating agency, and each rating should be evaluated independently of any other rating. Security ratings are highly dependent upon the ability to generate cash flows in an amount sufficient to service debt and meet investment plans. The Company can provide no assurances that its ability to generate cash flows is sufficient to maintain its existing ratings. None of the Company’sThe Company does not have any material borrowings that are subject to default or prepayment as a result of the downgrading of these security ratings, although such a downgrading could increase fees and interest charges under its credit facility.
As part of its normal course of business, the Company routinely enters into contracts for the purchase and sale of water, energy,power and other fuel, chemicals and other services. These contracts either contain express provisions or otherwise permit the Company and its counterparties to demand adequate assurance of future performance when there are reasonable grounds for doing so. In accordance with the contracts and applicable contract law, if the Company is downgraded by a credit rating agency, especially if such downgrade is to a level below investment grade, it is possible that a counterparty would attempt to rely on such a downgrade as a basis for making a demand for adequate assurance of future performance, which could include a demand that the Company must provide collateral to secure its obligations. The Company does not expect to post any collateral which will have a material adverse impact on the Company’s results of operations, financial position or cash flows.
Access to the capital markets, including the commercial paper market, and respective financing costs in those markets, may be directly affected by the Company’s securities ratings. The Company primarily accesses the debt capital markets, including the commercial paper market, through AWCC. However, the Company has also issued debt through its regulated subsidiaries, primarily in the form of mortgage bonds and tax exempt securities or borrowings under state revolving funds, to lower the overall cost of debt.
Dividends and Regulatory Restrictions
For discussion of the Company’s dividends, dividend restrictions and dividend policy, see Note 10—9—Shareholders’ Equity in the Notes to Consolidated Financial Statements for additional information.
Insurance Coverage
The Company carries various property, casualty, cyber and financial insurance policies with limits, deductibles and exclusions that it believes are consistent with industry standards. However, insurance coverage may not be adequate or available to cover unanticipated losses or claims. Additionally, annual policy renewals can be impacted by claims experience which in turn can impact coverage terms and conditions on a going-forward basis. The Company is self-insured to the extent that losses are within the policy deductible or exceed the amount of insurance maintained. Such losses could have a material adverse effect on the Company’s short-term and long-term financial condition and its results of operations and cash flows.
Critical Accounting Policies and Estimates
The preparation of financial statements in conformity with GAAP requires that management apply accounting policies and makedevelop estimates, assumptions and judgments that could affect the Company’s financial condition, results of operations and cash flows. Actual results could differ from these estimates, assumptions and judgments. Management believes that the areas described below require significant judgment in the application of accounting policy or in making estimates and assumptions in matters that are inherently uncertain and that may change in subsequent periods. Accordingly, changes in the estimates, assumptions and judgments applied to these accounting policies could have a significant impact on the Company’s financial condition, results of operations and cash flows, as reflected in the Company’s Consolidated Financial Statements. Management has reviewed the critical accounting polices described below with the Company’s Audit, Finance and Risk Committee, including the estimates, assumptions and judgments used in their application. Additional discussion regarding these critical accounting policies and their application can be found in Note 2—Significant Accounting Policies in the Notes to Consolidated Financial Statements.
Regulation and Regulatory Accounting
The Company’s regulated utilities are subject to regulation by PUCs and, as such, the Company follows the authoritative accounting principles required for rate regulated utilities, which requires the Company to reflect the effects of rate regulation in its Consolidated Financial Statements. Use of this authoritative guidance is applicable to utility operations that meet the following criteria: (i) third-party regulation of rates; (ii) cost-based rates; and (iii) a reasonable assumption that rates will be set to recover the estimated costs of providing service, plus a return on net investment, or rate base. As of December 31, 2020,2023, the Company concluded that the operations of its utilities met the criteria.
Application of this authoritative guidance has a further effect on the Company’s financial statements as it pertains to allowable costs used in the ratemaking process. The Company makes significant assumptions and estimates to quantify amounts recorded as regulatory assets and liabilities. Such judgments include, but are not limited to, assets and liabilities related to regulated acquisitions, pension and postretirement benefits, depreciation rates and taxes. Due to timing and other differences in the collection of revenues, these authoritative accounting principles allow a cost that would otherwise be charged as an expense by a non-regulated entity, to be deferred as a regulatory asset if it is probable that such cost is recoverable through future rates. Conversely, the principles require the creation of a regulatory liability for amounts collected in rates to recover costs expected to be incurred in the future, or amounts collected in excess of costs incurred and are refundable to customers.
For each regulatory jurisdiction where the Company conducts business, the Company assesses, at the end of each reporting period, whether the regulatory assets continue to meet the criteria for probable future recovery and regulatory liabilities continue to meet the criteria for probable future settlement. This assessment includes consideration of factors such as changes in regulatory environments, recent rate orders (including recent rate orders on recovery of a specific or similar incurred cost to other regulated entities in the same jurisdiction) and the status of any pending or potential legislation. If subsequent events indicate that the regulatory assets or liabilities no longer meet the criteria for probable future recovery or probable future settlement, the Company’s Consolidated Statements of Operations and financial position could be materially affected. In addition, if the Company concludes in a future period that a separable portion of the business no longer meets the criteria, the Company is required to eliminate the financial statement effects of regulation for that part of the business, which would include the elimination of any or all regulatory assets and liabilities that had been recorded in the Consolidated Financial Statements. Failure to meet the criteria of this authoritative guidance could materially impact the Company’s Consolidated Financial Statements.
As of December 31, 20202023 and 2019,2022, the Company’s regulatory asset balance was $1.1 billion and $1.1$1.0 billion, respectively, and its regulatory liability balance was $1.8$1.5 billion and $1.8$1.6 billion, respectively. See Note 4—3—Regulatory Matters in the Notes to Consolidated Financial Statements for further information regarding the Company’s significant regulatory assets and liabilities..liabilities.
Accounting for Income Taxes
Significant management judgment is required in determining the provision for income taxes, primarily due to the uncertainty related to tax positions taken, as well as deferred tax assets and liabilities, valuation allowances and the utilization of NOL carryforwards.
In accordance with applicable authoritative guidance, the Company accounts for uncertain income tax positions using a benefit recognition model with a two-step approach, including a more-likely-than-not recognition threshold and a measurement approach based on the largest amount of tax benefit that is greater than 50% likely of being realized upon ultimate settlement. If it is not more-likely-than-not that the benefit of the tax position will be sustained on its technical merits, no benefit is recorded. Uncertain tax positions that relate only to timing of when an item is included on a tax return are considered to have met the recognition threshold. Management evaluates each position based solely on the technical merits and facts and circumstances of the position, assuming the position will be examined by a taxing authority having full knowledge of all relevant information. Significant judgment is required to determine whether the recognition threshold has been met and, if so, the appropriate amount of unrecognized tax benefit to be recorded in the Consolidated Financial Statements.
The Company evaluates the probability of realizing deferred tax assets quarterly by reviewing a forecast of future taxable income and its intent and ability to implement tax planning strategies, if necessary, to realize deferred tax assets. The Company also assesses its ability to utilize tax attributes, including those in the form of carryforwards, for which the benefits have already been reflected in the financial statements. The Company records valuation allowances for deferred tax assets when it concludes that it is more-likely-than-not such benefit will not be realized in future periods.
Under GAAP, specifically Accounting Standards Codification TopicASC 740, Income Taxes(“ASC 740”), the tax effects of changes in tax laws must be recognized in the period in which the law is enacted. ASC 740 also requires deferred tax assets and liabilities to be measured at the enacted tax rate expected to apply when temporary differences are to be realized or settled. Thus, at the date of enactment of the TCJA, the Company’s deferred taxes were re-measured based upon the new tax rate. For the Company’s regulated entities, the change in deferred taxes are recorded as either an offset to a regulatory asset or a regulatory liability and may be subject to refund to customers. For the Company’s unregulated operations, the change in deferred taxes are recorded as a non-cash re-measurement adjustment to earnings.
Actual income taxes could vary from estimated amounts due to the future impacts of various items, including changes in income tax laws, the Company’s forecasted financial condition and results of operations, failure to successfully implement tax planning strategies and recovery of taxes through the regulatory process for the Regulated Businesses, as well as results of audits and examinations of filed tax returns by taxing authorities. The resulting tax balances as of December 31, 20202023 and 20192022, are appropriately accounted for in accordance with the applicable authoritative guidance; however, the ultimate outcome of tax matters could result in favorable or unfavorable adjustments to the Consolidated Financial Statements and such adjustments could be material. See Note 15—14—Income Taxes in the Notes to Consolidated Financial Statements for additional information regarding income taxes.
Accounting for Pension and Postretirement Benefits
The Company maintains noncontributory defined benefit pension plans covering eligible employees of its regulated utility and shared service operations. The Company also maintains other postretirement benefit plans providing medical and life insurance to eligible retirees. See Note 16—2—Significant Accounting Policies and Note 15—Employee Benefits in the Notes to Consolidated Financial Statements for additional information regarding the description of and accounting for the defined benefit pension plans and postretirement benefit plans.
The Company’s pension and postretirement benefit costs are developed from actuarial valuations. Inherent in these valuations are key assumptions provided by the Company to its actuaries, including the discount rate and expected long-term rate of return on plan assets. Material changes in the Company’s pension and postretirement benefit costs may occur in the future due to changes in these assumptions as well as fluctuations in plan assets. The assumptions are selected to represent the average expected experience over time and may differ in any one year from actual experience due to changes in capital markets and the overall economy. These differences will impact the amount of pension and other postretirement benefit expense that the Company recognizes. The primary assumptions are:
•Discount Rate—The discount rate is used in calculating the present value of benefits, which are based on projections of benefit payments to be made in the future. The objective in selecting the discount rate is to measure the single amount that, if invested at the measurement date in a portfolio of high-quality debt instruments, would provide the necessary future cash flows to pay the accumulated benefits when due.
•Expected Return on Plan Assets (“EROA”)—Management projects the future return on plan assets considering prior performance, but primarily based upon the plans’ mix of assets and expectations for the long-term returns on those asset classes. These projected returns reduce the net benefit costs the Company records currently.
•Rate of Compensation Increase—Management projects employees’ pay increases, which are used to project employees’ pension benefits at retirement.
•Health Care Cost Trend Rate—Management projects the expected increases in the cost of health care.
•Mortality— Management adopted the Society of Actuaries Pri-2012 mortality base table, the most recent table developed from private pension plan experience, which provides rates of mortality in 2012 and adopted the new MP-2020MP-2021 mortality improvement scale to gradually adjust future mortality rates downward due to increased longevity in each year after 2012.
The discount rate assumption, which is determined for the pension and postretirement benefit plans independently, is subject to change each year, consistent with changes in applicable high-quality, long-term corporate bond indices. The Company uses an approach that approximates the process of settlement of obligations tailored to the plans’ expected cash flows by matching the plans’ cash flows to the coupons and expected maturity values of individually selected bonds. For each plan, the discount rate was developed as the level equivalent rate that would yield the same present value as using spot rates aligned with the projected benefit payments. The weighted-average discount rate assumption for determining pension benefit obligations was 2.74%5.18%, 3.44%5.58% and 4.38%2.94% at December 31, 2020, 20192023, 2022 and 2018,2021, respectively. The weighted-average discount rate assumption for determining other postretirement benefit obligations was 2.56%5.22%, 3.36%5.60% and 4.32%2.90% at December 31, 2020, 20192023, 2022 and 2018,2021, respectively.
In selecting an EROA, the Company considered tax implications, past performance and economic forecasts for the types of investments held by the plans. The long-termweighted-average EROA assumption used in calculating pension cost was 6.79% for 2023, 6.50% for 2020, 6.20%2022 and 6.50% for 2019, and 5.95% for 2018.2021. The weighted averageweighted-average EROA assumption used in calculating other postretirement benefit costs was 3.68%5.00% for 2020, 3.56%2023, 3.60% for 20192022 and 4.77%3.67% for 2018.2021.
Presented in the table below are the allocations of the pension plan assets by asset category:
| | | | | | | | | | | | | | | | | | | | |
| | | 2021 Target Allocation | | Percentage of Plan Assets as of December 31, |
| Asset Category | | | 2020 | | 2019 |
| Equity securities | | 43 | % | | 49 | % | | 45 | % |
| Fixed income | | 50 | % | | 45 | % | | 48 | % |
| Real Estate | | 5 | % | | 6 | % | | 7 | % |
| Real estate investment trusts (“REITs”) | | 2 | % | | — | % | | — | % |
| Total | | 100 | % | | 100 | % | | 100 | % |
Postretirement Medical Bargaining Plan Changes
On July 31, 2018, a five-year national benefits agreement was ratified, covering, as of July 31, 2018, approximately 3,200 of the Company’s union-represented employees. Most of the benefits under this new agreement became effective on January 1, 2019, and include, among other things, union-represented employees’ participation in the Company’s cash-based annual performance plan, additional medical plan options and changes to certain retiree medical benefits, which required the Company to remeasure its other postretirement benefit plan obligation during the third quarter of 2018.
For those eligible union retirees and dependents over age 65, the current supplemental retiree medical plan will be replaced with a Health Reimbursement Arrangement (“HRA”) similar to the cap currently in place for non-union retirees. The Company is providing a subsidy allowing the post-65 retirees to purchase a Medicare supplemental plan on a private exchange network. The pre-65 coverage plan was also amended to provide a cap on future employer costs designed to limit the employer costs to 2018 levels. For pre-65 union members retiring early in 2019-2021 a supplemental benefit will be provided to alleviate the effect of the cap.
On August 31, 2018, the Postretirement Medical Benefit Plan was remeasured to reflect this plan change. The plan change resulted in a $175 million reduction in future benefits payable to plan participants, and, in combination with other experience reflected as of the remeasurement date, resulted in a $227 million reduction to the net accumulated postretirement benefit obligation. As of December 31, 2020, the remaining amortization period of the impact of the plan amendment is 7.9 years. As a result of the remeasurement and change in funded status, the Company decreased the investment risk in the plan and reduced its exposure to changes in interest rates by matching the assets of the plan to the projected cash flows for future benefit payments of the liability. Plan assets in excess of those securities designed to match the long-term liabilities are invested in shorter duration fixed income securities and equities. | | | | | | | | | | | | | | | | | | | | |
| | | 2024 Target Allocation | | Percentage of Plan Assets as of December 31, |
| Asset Category | | | 2023 | | 2022 |
| Equity securities | | 37 | % | | 41 | % | | 57 | % |
| Fixed income | | 63 | % | | 59 | % | | 43 | % |
| Total | | 100 | % | | 100 | % | | 100 | % |
Presented in the table below are the allocations of the other postretirement benefit plan assets by asset category:
| | | | | 2021 Target Allocation (a) | | Percentage of Plan Assets as of December 31, | | | 2024 Target Allocation (a) | | Percentage of Plan Assets as of December 31, |
| Asset Category | Asset Category | | 2020 | | 2019 | Asset Category | | | 2023 | | 2022 |
| Equity securities | Equity securities | | 18 | % | | 18 | % | | 17 | % | Equity securities | | 27 | % | | 32 | % | | 30 | % |
| Fixed income | Fixed income | | 82 | % | | 82 | % | | 83 | % | Fixed income | | 73 | % | | 68 | % | | 70 | % |
| Total | Total | | 100 | % | | 100 | % | | 100 | % | Total | | 100 | % | | 100 | % | | 100 | % |
(a)IncludesRefer to Note 15—Employee Benefits in the American Water Postretirement Medical Benefits Bargaining Plan,Notes to Consolidated Financial Statements for additional details on the New York Water Service Corporation Postretirement Medical Benefits Bargaining Plan, the American Water Postretirement Medical Benefits Non-Bargaining Plan,allocations of assets and the American Water Life Insurance Trust.trusts which fund the other postretirement benefit plans
The investments of the pension and postretirement welfare plan trusts include debt and equity securities held either directly or through mutual funds, commingled funds and limited partnerships. The trustee for the Company’s defined benefit pension and postretirement welfare plans uses an independent valuation firm to calculate the fair value of plan assets.
In selecting a rate of compensation increase, the Company considers past experience in light of movements in inflation rates. The Company’s rate of compensation increase was 3.51% for 2020, 2.97% for 20192023, 2022 and 3.00% for 2018.2021.
In selecting health care cost trend rates, the Company considers past performance and forecasts of increases in health care costs. As of January 1, 2020,2023, the Company’s health care cost trend rate assumption used to calculate the periodic benefit cost was 6.50%7.00% in 20202023 gradually declining to 5.00% in 20262031 and thereafter. As of December 31, 2020,2023, the Company projects that medical inflation will be 6.25%6.75% in 20212024 gradually declining to 5.00% in 20262031 and thereafter.
The Company will use a weighted-average discount rate and EROA of 2.74%5.18% and 6.50%6.79%, respectively, for estimating its 20212024 pension costs. Additionally, the Company will use a weighted-average discount rate and expected blended return based on weighted assetsEROA of 2.56%5.22% and 3.68%5.00%, respectively, for estimating its 20212024 other postretirement benefit costs. A decrease in the discount rate or the EROA would increase the Company’s pension expense. The Company’s 20202023 pension and postretirement total net benefit credit was $14$6 million and the 20192022 pension and postretirement total net benefit costcredit was $17$47 million. The Company expects to make pension contributions to the plan trusts of $37$44 million in 2021, and $37 million, $35 million, $33 million and $30 million in 2022, 2023, 2024 and 2025, respectively. Actual2024; however, the actual amounts contributed could change significantlymaterially from these estimates.this estimate. The assumptions are reviewed annually and at any interim re-measurement of the plan obligations. The impact of assumption changes is reflected in the recorded pension and postretirement benefit amounts as they occur, or over a period of time if allowed under applicable accounting standards.
Benefit Plan Amendments
In December 2022, the Company amended the American Water Pension Plan (“AWPP”), a tax-qualified defined benefit pension plan, to restructure it as of December 31, 2022. The restructuring involved the spin-off of certain inactive participants from the existing AWPP into a separate tax-qualified defined benefit pension plan, the American Water Pension Plan for Certain Inactive Participants (“AWPP Inactive”). Benefits offered to the plan participants remain unchanged. Actuarial gains and losses associated with AWPP Inactive are amortized over the average remaining life expectancy of the inactive participants. The actuarial gains and losses associated with the AWPP continued to be amortized over the average remaining service period for active participants. The Company remeasured the pension plan obligation and assets to reflect the amendment for each plan as of December 31, 2022.
In December 2022, the Company completed plan amendments to spin-off and merge a portion of the American Water Retiree Welfare Plan, with and into the Company’s medical plan for active employees (“Active Medical Plan”), in order to repurpose the over-funded portion of the Bargained Retiree Voluntary Employees’ Beneficiary Association (“Bargained VEBA”) trust. Benefits offered to the plan participants remain unchanged. As a result of these changes, effective December 31, 2022, the Company transferred investment assets from the Bargained VEBA into the existing trust maintained for the benefit of Active Medical Plan participants (“Active VEBA”). The transfer of these Bargained VEBA investment assets into the Active VEBA permits access to approximately $194 million of assets, as of December 31, 2022, for purposes of paying active union employee medical benefits. The Company recorded the transfer of assets as a negative contribution and therefore did not record a gain or loss, as permitted by accounting guidance. See Note 18—Fair Value of Financial Information in the Notes to Consolidated Financial Statements, for additional information on accounting for the assets as investments in debt and equity securities.
Revenue Recognition
Revenue from the Company’s Regulated Businesses is generated primarily from water and wastewater services delivered to customers. These contracts contain a single performance obligation, the delivery of water or wastewater services, as the promise to transfer the individual good or service is not separately identifiable from other promises within the contracts and, therefore, is not distinct. Revenues are recognized over time, as services are provided. There are generally no significant financing components or variable consideration. Revenues include amounts billed to customers on a cycle basis, and unbilled amounts calculated based on estimated usage from the date of the meter reading associated with the latest customer bill, to the end of the accounting period. The amounts that the Company has a right to invoice are determined by each customer’s actual usage, an indicator that the invoice amount corresponds directly to the value transferred to the customer.
Increases or decreases in the volumes delivered to customers and rate mix due to changes in usage patterns in customer classes in the period could be significant to the calculation of unbilled revenue. In addition, changes in the timing of meter reading schedules and the number and type of customers scheduled for each meter reading date would also have an effect on the unbilled revenue calculation. Unbilled revenue for the Company’s regulated utilities as of December 31, 20202023 and 20192022 was $150$193 million and $142$178 million, respectively.
The Company also recognizes revenue when it is probable that future recovery of previously incurred costs or future refunds that are to be credited to customers will occur through the ratemaking process.
Revenue from the Company’s Homeowner Services Group is generated through various protection programs in which the Company provides fixed fee services to domestic homeowners and smaller commercial customers for interior and exterior water and sewer lines, interior electric and gas lines, heating and cooling systems, water heaters, power surge protection and other related services. Most of the contracts have a one-year term and each service is a separate performance obligation, satisfied over time, as the customers simultaneously receive and consume the benefits provided from the service. Customers are obligated to pay for the protection programs ratably over 12 months or via a one-time, annual fee, with revenues recognized ratably over time for these services. Advances from customers are deferred until the performance obligation is satisfied.
The Company also has long-term, fixed fee contracts to operate and maintain water and wastewater systems for the U.S. government on various military installations and facilities owned by municipal customers. Billing and revenue recognition for the fixed fee revenues occurs ratably over the term of the contract, as customers simultaneously receive and consume the benefits provided by the Company. Additionally, these contracts allow the Company to make capital improvements to underlying infrastructure, which are initiated through separate modifications or amendments to the original contract, whereby stand-alone, fixed pricing is separately stated for each improvement. The Company has determined that these capital improvements are separate performance obligations, with revenue recognized over time based on performance completed at the end of each reporting period. Losses on contracts are recognized during the period in which the losses first become probable and estimable. Revenues recognized during the period in excess of billings on construction contracts are recorded as unbilled revenues, with billings in excess of revenues recorded as other current liabilities until the recognition criteria are met. Changes in contract performance and related estimated contract profitability may result in revisions to costs and revenues and are recognized in the period in which revisions are determined. Unbilled revenue for the Market-Based Businesseswithin Other as of December 31, 20202023 and 20192022, was $56$109 million and $30$97 million, respectively.
Revenue from the Company’s former HOS business, which was sold in December 2021, was generated through various protection programs in which the Company provided fixed fee services to domestic homeowners and smaller commercial customers for interior and exterior water and sewer lines, interior electric and gas lines, heating and cooling systems, water heaters, power surge protection and other related services. Most of the contracts had a one-year term and each service was a separate performance obligation, satisfied over time, as the customers simultaneously received and consumed the benefits provided from the service. Customers were obligated to pay for the protection programs ratably over 12 months or via a one-time, annual fee, with revenues recognized ratably over time for those services. Advances from customers were deferred until the performance obligation was satisfied.
Accounting for Contingencies
The Company records loss contingencies when management determines that the outcome of future events is probable of occurring and when the amount of the loss or a range of losses can be reasonably estimated. The determination of a loss contingency is based on management’s judgment and estimates about the likely outcome of the matter, which may include an analysis of different scenarios. Liabilities are recorded or adjusted when events or circumstances cause these judgments or estimates to change. In assessing whether a loss is reasonably possible, management considers many factors, which include, but are not limited to: the nature of the litigation, claim or assessment, review of applicable law, opinions or views of legal counsel and other advisors, and the experience gained from similar cases or situations. The Company provides disclosures for material contingencies when management deems there is a reasonable possibility that a loss or an additional loss may be incurred. The Company provides estimates of reasonably possible losses when such estimates may be reasonably determined, either as a single amount or within a reasonable range.
Actual amounts realized upon settlement or other resolution of loss contingencies may be different than amounts recorded and disclosed and could have a significant impact on the liabilities, revenue and expenses recorded on the Consolidated Financial Statements. See Note 17—16—Commitments and Contingencies in the Notes to Consolidated Financial Statements for additional information regarding contingencies.
NewRecent Accounting Standards
See Note 2—Significant Accounting Policies in the Notes to Consolidated Financial Statements for a description of recent accounting standards.
ITEM 7A. QUANTITATIVE AND QUALITATIVE DISCLOSURES ABOUT MARKET RISK
The Company is exposed to market risk associated with changes in commodity prices, equity prices and interest rates. The Company is exposed to risks from changes in interest rates as a result of its issuance of variable and fixed rate debt and commercial paper. The Company manages its interest rate exposure by limiting its variable rate exposure and by monitoring the effects of market changes in interest rates. The Company also has the ability to enter into financial derivative instruments, which could include instruments such as, but not limited to, interest rate swaps, forward starting swaps swaptions and U.S. Treasury lock agreements to manage and mitigate interest rate risk exposure. As of December 31, 2020,2023, a hypothetical increase of interest rates by 1% associated with the Company’s short-term borrowings would result in a $6$3 million increase in short-term interest expense.
As of December 31, 2023, the Company had six treasury lock agreements, each with a term of 10 years, with notional amounts totaling $225 million, to reduce interest rate exposure on debt expected to be issued in 2024. These treasury lock agreements terminate in September 2024, and have an average fixed rate of 4.24%. When entering into treasury locks, the Company is subject to market risk with respect to changes in the underlying benchmark interest rate that impacts the fair value of the treasury locks. The Company manages market risk by matching the terms of the treasury locks with the critical terms of the expected debt issuance. The fair value of the treasury locks at December 31, 2023, was in a loss position of $8 million. A hypothetical 1% adverse change in interest rates would result in a decrease in the fair value of the treasury locks to a loss position of approximately $26 million at December 31, 2023.
The Company’s risks associated with price increases for chemicals, electricity and other commodities are reduced through contractual arrangements and the expected ability to recover price increases through rates, in the next general rate case proceeding or other regulatory mechanism, as authorized by each regulatory jurisdiction. Non-performance by these commodity suppliers could have a material adverse impact on the Company’s results of operations, financial position and cash flows.
The market price of the Company’s common stock may experience fluctuations, which may be unrelated to its operating performance. In particular, the Company’s stock price may be affected by general market movements as well as developments specifically related to the water and wastewater industry. These could include, among other things, interest rate movements, quarterly variations or changes in financial estimates by securities analysts and governmental or regulatory actions. This volatility may make it difficult for the Company to access the capital markets in the future through additional offerings of its common stock or other equity securities, regardless of its financial performance, and such difficulty may preclude the Company from being able to take advantage of certain business opportunities or meet business obligations.
The Company is exposed to credit risk through its water, wastewater and other water-related services provided by the Regulated Businesses and Market-Based Businesses.related services. The Company’s Regulated Businesses serve residential, commercial, industrial and other customers, while the Market-Based Businessesbusinesses within Other engage in business activities with developers, government entities and other customers. The Company’s primary credit risk is exposure to customer default on contractual obligations and the associated loss that may be incurred due to the non-payment of customer accounts receivable balances. The Company’s credit risk is managed through established credit and collection policies which are in compliance with applicable regulatory requirements and involve monitoring of customer exposure and the use of credit risk mitigation measures such as letters of credit or prepayment arrangements. The Company’s credit portfolio is diversified with no significant customer or industry concentrations. In addition, the Regulated Businesses are generally able to recover all prudently incurred costs including uncollectible customer accounts receivable expenses and collection costs through rates.
The Company’s retirement trust assets are exposed to the market prices of debt and equity securities. Changes to the retirement trust asset values can impact the Company’s pension and other benefits expense, funded status and future minimum funding requirements. Changes in interest rates can impact retirement liabilities. The Company aims to reduce risk through asset diversification and by investing in long duration fixed-income securities that have a duration similar to that of its pension liabilities, seeking to hedge some of the interest rate sensitivity of its liabilities. That way, if interest rates fall and liabilities increase, the Company expects that the fixed-income assets in its retirement trust will also increase in value. The Company also expects its risk to be reduced through its ability to recover pension and other benefit costs through rates.
The Company is also exposed to a potential national economic recession or deterioration in local economic conditions in the markets in which it operates. The credit quality of the Company’s customer accounts receivable is dependent on the economy and the ability of its customers to manage through unfavorable economic cycles and other market changes. In addition, there can be no assurances that regulators will grant sufficient rate authorizations. Therefore, the Company’s ability to fully recover operating expense, recover its investment and provide an appropriate return on invested capital made in the Regulated Businesses may be adversely impacted.
ITEM 8. FINANCIAL STATEMENTS AND SUPPLEMENTARY DATA
INDEX TO CONSOLIDATED FINANCIAL STATEMENTS
| | | | | |
| | Page |
| Audited Consolidated Financial Statements | |
| |
| |
| |
| |
| |
| |
| |
Report of Independent Registered Public Accounting Firm
To the Board of Directors and Shareholders of
American Water Works Company, Inc.
Opinions on the Financial Statements and Internal Control over Financial Reporting
We have audited the accompanying consolidated balance sheets of American Water Works Company, Inc. and its subsidiaries (the “Company”) as of December 31, 20202023 and 2019,2022, and the related consolidated statements of operations, comprehensive income, changes in shareholders’ equity and cash flows for each of the three years in the period ended December 31, 2020,2023, including the related notes (collectively referred to as the “consolidated financial statements”). We also have audited the Company's internal control over financial reporting as of December 31, 2020,2023, based on criteria established in Internal Control - Integrated Framework (2013) issued by the Committee of Sponsoring Organizations of the Treadway Commission (COSO).
In our opinion, the consolidated financial statements referred to above present fairly, in all material respects, the financial position of the Company as of December 31, 20202023 and 20192022, and the results of its operations and its cash flows for each of the three years in the period ended December 31, 20202023 in conformity with accounting principles generally accepted in the United States of America. Also, in our opinion, the Company maintained, in all material respects, effective internal control over financial reporting as of December 31, 2020,2023, based on criteria established in Internal Control - Integrated Framework (2013) issued by the COSO.
Change in Accounting Principle
As discussed in Note2 to the consolidated financial statements, the Company changed the manner in which it accounts for leases in 2019.
Basis for Opinions
The Company's management is responsible for these consolidated financial statements, for maintaining effective internal control over financial reporting, and for its assessment of the effectiveness of internal control over financial reporting, included in Management's Report on Internal Control over Financial Reporting appearing under Item 9A. Our responsibility is to express opinions on the Company’s consolidated financial statements and on the Company's internal control over financial reporting based on our audits. We are a public accounting firm registered with the Public Company Accounting Oversight Board (United States) (PCAOB) and are required to be independent with respect to the Company in accordance with the U.S. federal securities laws and the applicable rules and regulations of the Securities and Exchange Commission and the PCAOB.
We conducted our audits in accordance with the standards of the PCAOB. Those standards require that we plan and perform the audits to obtain reasonable assurance about whether the consolidated financial statements are free of material misstatement, whether due to error or fraud, and whether effective internal control over financial reporting was maintained in all material respects.
Our audits of the consolidated financial statements included performing procedures to assess the risks of material misstatement of the consolidated financial statements, whether due to error or fraud, and performing procedures that respond to those risks. Such procedures included examining, on a test basis, evidence regarding the amounts and disclosures in the consolidated financial statements. Our audits also included evaluating the accounting principles used and significant estimates made by management, as well as evaluating the overall presentation of the consolidated financial statements. Our audit of internal control over financial reporting included obtaining an understanding of internal control over financial reporting, assessing the risk that a material weakness exists, and testing and evaluating the design and operating effectiveness of internal control based on the assessed risk. Our audits also included performing such other procedures as we considered necessary in the circumstances. We believe that our audits provide a reasonable basis for our opinions.
Definition and Limitations of Internal Control over Financial Reporting
A company’s internal control over financial reporting is a process designed to provide reasonable assurance regarding the reliability of financial reporting and the preparation of financial statements for external purposes in accordance with generally accepted accounting principles. A company’s internal control over financial reporting includes those policies and procedures that (i) pertain to the maintenance of records that, in reasonable detail, accurately and fairly reflect the transactions and dispositions of the assets of the company; (ii) provide reasonable assurance that transactions are recorded as necessary to permit preparation of financial statements in accordance with generally accepted accounting principles, and that receipts and expenditures of the company are being made only in accordance with authorizations of management and directors of the company; and (iii) provide reasonable assurance regarding prevention or timely detection of unauthorized acquisition, use, or disposition of the company’s assets that could have a material effect on the financial statements.
Because of its inherent limitations, internal control over financial reporting may not prevent or detect misstatements. Also, projections of any evaluation of effectiveness to future periods are subject to the risk that controls may become inadequate because of changes in conditions, or that the degree of compliance with the policies or procedures may deteriorate.
Critical Audit Matters
The critical audit matter communicated below is a matter arising from the current period audit of the consolidated financial statements that was communicated or required to be communicated to the audit committee and that (i) relates to accounts or disclosures that are material to the consolidated financial statements and (ii) involved our especially challenging, subjective, or complex judgments. The communication of critical audit matters does not alter in any way our opinion on the consolidated financial statements, taken as a whole, and we are not, by communicating the critical audit matter below, providing a separate opinion on the critical audit matter or on the accounts or disclosures to which it relates.
Accounting for the Effects of Rate Regulation
As described in Notes 2 and 43 to the consolidated financial statements, the Company’s consolidated regulatory assets and liabilities balances were $1,127$1,119 million and $1,7701,482 million, respectively, as of December 31, 2020.2023. The Company’s regulated utilities are subject to regulation by multiple state utility commissions and the Company follows authoritative accounting principles required for rate regulated utilities, which requires the effects of rate regulation to be reflected in the Company’s consolidated financial statements. As disclosed by management, for each regulatory jurisdiction where the Company conducts business, managementthe Company assesses, at the end of each reporting period, whether the regulatory assets continue to meet the criteria for probable future recovery and regulatory liabilities continue to meet the criteria for probable future settlement. This assessment includes consideration of factors such as changes in regulatory environments, recent rate orders (including recent rate orders on recovery of a specific or similar incurred cost to other regulated entities in the same jurisdiction) and the status of any pending or potential legislation.
The principal considerations for our determination that performing procedures relating to accounting for the effects of rate regulation is a critical audit matter are the significant judgment by management in accounting for regulatory assets and liabilities relative to whether regulatory assets continue to meet the criteria for probable future recovery and regulatory liabilities continue to meet the criteria for probable future settlement as a result of changes in regulatory environments, recent rate orders, and the status of any pending or potential legislation. This in turn led to a high degree of auditor judgment, subjectivity, and effort in performing audit procedures and evaluating audit evidence obtained relating to management’s judgments.
Addressing the matter involved performing procedures and evaluating audit evidence in connection with forming our overall opinion on the consolidated financial statements. These procedures included testing the effectiveness of controls relating to the Company’s regulatory accounting process, including controls over management’s assessment and consideration of factors related to the probability of future recovery or settlement. These procedures also included, among others, evaluating the reasonableness of management’s judgments regarding the probability of recovery and settlement based on the Company’s correspondence with regulators, status of regulatory proceedings, past practices, and other relevant information; evaluating the related accounting and disclosure implications; and evaluating regulatory assetsasset and liabilitiesliability balances based on provisions and formulas outlined in rate orders and other correspondence with the Company’s regulators.
| | |
| /s/ PricewaterhouseCoopers LLP |
| Philadelphia, Pennsylvania |
February 24, 202114, 2024 |
We have served as the Company’s auditor since 1948.
American Water Works Company, Inc. and Subsidiary Companies
Consolidated Balance Sheets
(In millions, except share and per share data)
| | December 31, 2020 | | December 31, 2019 |
| December 31, 2023 | | | December 31, 2023 | | December 31, 2022 |
| ASSETS | ASSETS | ASSETS |
| Property, plant and equipment | Property, plant and equipment | $ | 25,614 | | | $ | 23,941 | |
| Accumulated depreciation | Accumulated depreciation | (5,904) | | | (5,709) | |
| Property, plant and equipment, net | Property, plant and equipment, net | 19,710 | | | 18,232 | |
| Current assets: | Current assets: | | | | Current assets: | | | |
| Cash and cash equivalents | Cash and cash equivalents | 547 | | | 60 | |
| Restricted funds | Restricted funds | 29 | | | 31 | |
| Accounts receivable, net of allowance for uncollectible accounts of $60 and $41, respectively | 321 | | | 294 | |
| Accounts receivable, net of allowance for uncollectible accounts of $51 and $60, respectively | |
| Income tax receivable | |
| Unbilled revenues | Unbilled revenues | 206 | | | 172 | |
| Materials and supplies | Materials and supplies | 47 | | | 44 | |
| Assets held for sale | 629 | | | 566 | |
| Other | Other | 127 | | | 118 | |
| Total current assets | Total current assets | 1,906 | | | 1,285 | |
| Regulatory and other long-term assets: | Regulatory and other long-term assets: | | | | Regulatory and other long-term assets: | | | |
| Regulatory assets | Regulatory assets | 1,127 | | | 1,128 | |
| Seller promissory note from the sale of the Homeowner Services Group | |
| Operating lease right-of-use assets | Operating lease right-of-use assets | 95 | | | 103 | |
| Goodwill | Goodwill | 1,504 | | | 1,501 | |
| Postretirement benefit assets | 173 | | | 159 | |
| Intangible assets | 55 | | | 67 | |
| Other | Other | 196 | | | 207 | |
| Total regulatory and other long-term assets | Total regulatory and other long-term assets | 3,150 | | | 3,165 | |
| Total assets | Total assets | $ | 24,766 | | | $ | 22,682 | |
The accompanying notes are an integral part of these Consolidated Financial Statements.
American Water Works Company, Inc. and Subsidiary Companies
Consolidated Balance Sheets
(In millions, except share and per share data)
| | December 31, 2020 | | December 31, 2019 |
| December 31, 2023 | | | December 31, 2023 | | December 31, 2022 |
| CAPITALIZATION AND LIABILITIES | CAPITALIZATION AND LIABILITIES | CAPITALIZATION AND LIABILITIES |
| Capitalization: | Capitalization: | | | | Capitalization: | | | |
| Common stock ($0.01 par value; 500,000,000 shares authorized; 186,466,707 and 185,903,727 shares issued, respectively) | $ | 2 | | | $ | 2 | |
| Common stock ($0.01 par value; 500,000,000 shares authorized; 200,144,968 and 187,200,539 shares issued, respectively) | |
| Paid-in-capital | Paid-in-capital | 6,747 | | | 6,700 | |
| Retained earnings (accumulated deficit) | 102 | | | (207) | |
| Retained earnings | |
| Accumulated other comprehensive loss | Accumulated other comprehensive loss | (49) | | | (36) | |
| Treasury stock, at cost (5,168,215 and 5,090,855 shares, respectively) | (348) | | | (338) | |
| Treasury stock, at cost (5,414,867 and 5,342,477 shares, respectively) | |
| Total common shareholders' equity | Total common shareholders' equity | 6,454 | | | 6,121 | |
| Long-term debt | Long-term debt | 9,329 | | | 8,639 | |
| Redeemable preferred stock at redemption value | Redeemable preferred stock at redemption value | 4 | | | 5 | |
| Total long-term debt | Total long-term debt | 9,333 | | | 8,644 | |
| Total capitalization | Total capitalization | 15,787 | | | 14,765 | |
| Current liabilities: | Current liabilities: | | | | Current liabilities: | | | |
| Short-term debt | Short-term debt | 1,282 | | | 786 | |
| Current portion of long-term debt | Current portion of long-term debt | 329 | | | 28 | |
| Accounts payable | Accounts payable | 189 | | | 203 | |
| Accrued liabilities | Accrued liabilities | 591 | | | 596 | |
| Accrued taxes | Accrued taxes | 50 | | | 46 | |
| Accrued interest | Accrued interest | 88 | | | 84 | |
| Liabilities related to assets held for sale | 137 | | | 128 | |
| Other | Other | 215 | | | 174 | |
| Total current liabilities | Total current liabilities | 2,881 | | | 2,045 | |
| Regulatory and other long-term liabilities: | Regulatory and other long-term liabilities: | | | | Regulatory and other long-term liabilities: | | | |
| Advances for construction | Advances for construction | 270 | | | 240 | |
| Deferred income taxes and investment tax credits | Deferred income taxes and investment tax credits | 2,113 | | | 1,893 | |
| Regulatory liabilities | Regulatory liabilities | 1,770 | | | 1,806 | |
| Operating lease liabilities | Operating lease liabilities | 81 | | | 89 | |
| Accrued pension expense | Accrued pension expense | 388 | | | 411 | |
| Other | Other | 83 | | | 78 | |
| Total regulatory and other long-term liabilities | Total regulatory and other long-term liabilities | 4,705 | | | 4,517 | |
| Contributions in aid of construction | Contributions in aid of construction | 1,393 | | | 1,355 | |
| Commitments and contingencies (See Note 17) | 0 | | 0 |
| Commitments and contingencies (See Note 16) | | Commitments and contingencies (See Note 16) | | | |
| Total capitalization and liabilities | Total capitalization and liabilities | $ | 24,766 | | | $ | 22,682 | |
The accompanying notes are an integral part of these Consolidated Financial Statements.
American Water Works Company, Inc. and Subsidiary Companies
Consolidated Statements of Operations
(In millions, except per share data)
| | | | For the Years Ended December 31, | | For the Years Ended December 31, |
| | | 2020 | | 2019 | | 2018 | | 2023 | | 2022 | | 2021 |
| Operating revenues | Operating revenues | $ | 3,777 | | | $ | 3,610 | | | $ | 3,440 | |
| Operating expenses: | Operating expenses: | | | | | | Operating expenses: | | | |
| Operation and maintenance | Operation and maintenance | 1,622 | | | 1,544 | | | 1,479 | |
| Depreciation and amortization | Depreciation and amortization | 604 | | | 582 | | | 545 | |
| General taxes | General taxes | 303 | | | 280 | | | 277 | |
| Loss (gain) on asset dispositions and purchases | 0 | | | 34 | | | (20) | |
| Impairment charge | 0 | | | 0 | | | 57 | |
| Other | |
| Total operating expenses, net | Total operating expenses, net | 2,529 | | | 2,440 | | | 2,338 | |
| Operating income | Operating income | 1,248 | | | 1,170 | | | 1,102 | |
| Other income (expense): | Other income (expense): | | | | | | Other income (expense): | | | |
| Interest, net | (395) | | | (382) | | | (350) | |
| Interest expense | |
| Interest income | |
| Non-operating benefit costs, net | Non-operating benefit costs, net | 49 | | | 16 | | | 20 | |
| Gain on sale of businesses | |
| Other, net | Other, net | 22 | | | 29 | | | 15 | |
| Total other income (expense) | Total other income (expense) | (324) | | | (337) | | | (315) | |
| Income before income taxes | Income before income taxes | 924 | | | 833 | | | 787 | |
| Provision for income taxes | Provision for income taxes | 215 | | | 212 | | | 222 | |
| Consolidated net income | 709 | | | 621 | | | 565 | |
| Net loss attributable to noncontrolling interest | 0 | | | 0 | | | (2) | |
| Net income attributable to common shareholders | Net income attributable to common shareholders | $ | 709 | | | $ | 621 | | | $ | 567 | |
| Basic earnings per share: (a) | |
Basic earnings per share: (a) | |
Basic earnings per share: (a) | Basic earnings per share: (a) | | | | | | | | |
| Net income attributable to common shareholders | Net income attributable to common shareholders | $ | 3.91 | | | $ | 3.44 | | | $ | 3.16 | |
Diluted earnings per share: (a) | Diluted earnings per share: (a) | | | | | | Diluted earnings per share: (a) | | | |
| Net income attributable to common shareholders | Net income attributable to common shareholders | $ | 3.91 | | | $ | 3.43 | | | $ | 3.15 | |
| Weighted average common shares outstanding: | Weighted average common shares outstanding: | | | | | | Weighted average common shares outstanding: | | | |
| Basic | Basic | 181 | | | 181 | | | 180 | |
| Diluted | Diluted | 182 | | | 181 | | | 180 | |
(a)Amounts may not calculate due to rounding.
The accompanying notes are an integral part of these Consolidated Financial Statements.
American Water Works Company, Inc. and Subsidiary Companies
Consolidated Statements of Comprehensive Income
(In millions)
| | | | | | | | | | | | | | | | | |
| | For the Years Ended December 31, |
| | 2020 | | 2019 | | 2018 |
| Net income attributable to common shareholders | $ | 709 | | | $ | 621 | | | $ | 567 | |
| Other comprehensive income (loss), net of tax: | | | | | |
| Change in employee benefit plan funded status, net of tax of $(4), $3 and $20 in 2020, 2019 and 2018, respectively | (12) | | | 8 | | | 60 | |
| Defined benefit pension plan actuarial loss, net of tax of $1, $1 and $3 in 2020, 2019 and 2018, respectively | 3 | | | 4 | | | 7 | |
| Pension reclassification from accumulated other comprehensive loss of tax effects resulting from the Tax Cuts and Jobs Act | 0 | | | 0 | | | (22) | |
| Foreign currency translation adjustment | 0 | | | (1) | | | 0 | |
| Unrealized loss on cash flow hedges, net of tax of $(1), $(5) and $0 in 2020, 2019 and 2018, respectively | (4) | | | (13) | | | (2) | |
| Cash flow hedges reclassification from accumulated other comprehensive loss of tax effects resulting from the Tax Cuts and Jobs Act | 0 | | | 0 | | | 2 | |
| Net other comprehensive income (loss) | (13) | | | (2) | | | 45 | |
| Comprehensive income attributable to common shareholders | $ | 696 | | | $ | 619 | | | $ | 612 | |
| | | | | | | | | | | | | | | | | |
| | For the Years Ended December 31, |
| | 2023 | | 2022 | | 2021 |
| Net income attributable to common shareholders | $ | 944 | | | $ | 820 | | | $ | 1,263 | |
| Other comprehensive income (loss), net of tax: | | | | | |
| Change in employee benefit plan funded status, net of tax of $(2), $5 and $0 in 2023, 2022 and 2021, respectively | (3) | | | 14 | | | (1) | |
| Defined benefit pension plan actuarial loss, net of tax of $0, $1 and $1 in 2023, 2022 and 2021, respectively | 4 | | | 3 | | | 4 | |
| Unrealized gain (loss) on cash flow hedges, net of tax of $0, $1 and $1 in 2023, 2022 and 2021, respectively | (8) | | | 5 | | | 1 | |
| Unrealized gain (loss) on available-for-sale fixed-income securities, net of tax of $0 in 2023, 2022 and 2021 | 4 | | | — | | | — | |
| Net other comprehensive income (loss) | (3) | | | 22 | | | 4 | |
| Comprehensive income attributable to common shareholders | $ | 941 | | | $ | 842 | | | $ | 1,267 | |
The accompanying notes are an integral part of these Consolidated Financial Statements.
American Water Works Company, Inc. and Subsidiary Companies
Consolidated Statements of Cash Flows
(In millions)
| | | | For the Years Ended December 31, | | For the Years Ended December 31, |
| | | 2020 | | 2019 | | 2018 | | 2023 | | 2022 | | 2021 |
| CASH FLOWS FROM OPERATING ACTIVITIES | CASH FLOWS FROM OPERATING ACTIVITIES | | | | | | CASH FLOWS FROM OPERATING ACTIVITIES | | | |
| Net income | Net income | $ | 709 | | | $ | 621 | | | $ | 565 | |
| Adjustments to reconcile to net cash flows provided by operating activities: | Adjustments to reconcile to net cash flows provided by operating activities: | | | | | | Adjustments to reconcile to net cash flows provided by operating activities: | | | |
| Depreciation and amortization | Depreciation and amortization | 604 | | | 582 | | | 545 | |
| Deferred income taxes and amortization of investment tax credits | Deferred income taxes and amortization of investment tax credits | 207 | | | 208 | | | 195 | |
| Provision for losses on accounts receivable | Provision for losses on accounts receivable | 34 | | | 28 | | | 33 | |
| Loss (gain) on asset dispositions and purchases | 0 | | | 34 | | | (20) | |
| Impairment charge | 0 | | | 0 | | | 57 | |
| Gain on sale of businesses | |
| Pension and non-pension postretirement benefits | Pension and non-pension postretirement benefits | (14) | | | 17 | | | 23 | |
| Other non-cash, net | Other non-cash, net | (20) | | | (41) | | | 20 | |
| Changes in assets and liabilities: | Changes in assets and liabilities: | | | | | | Changes in assets and liabilities: | | | |
| Receivables and unbilled revenues | Receivables and unbilled revenues | (97) | | | (25) | | | (17) | |
| Income tax receivable | |
| Pension and non-pension postretirement benefit contributions | Pension and non-pension postretirement benefit contributions | (39) | | | (31) | | | (22) | |
| Accounts payable and accrued liabilities | Accounts payable and accrued liabilities | (2) | | | 66 | | | 25 | |
| Accrued taxes | |
| Other assets and liabilities, net | Other assets and liabilities, net | 44 | | | (72) | | | 22 | |
| Impact of Freedom Industries settlement activities | 0 | | | (4) | | | (40) | |
| Net cash provided by operating activities | Net cash provided by operating activities | 1,426 | | | 1,383 | | | 1,386 | |
| CASH FLOWS FROM INVESTING ACTIVITIES | CASH FLOWS FROM INVESTING ACTIVITIES | | | | | | CASH FLOWS FROM INVESTING ACTIVITIES | | | |
| Capital expenditures | Capital expenditures | (1,822) | | | (1,654) | | | (1,586) | |
| Acquisitions, net of cash acquired | Acquisitions, net of cash acquired | (135) | | | (235) | | | (398) | |
| Proceeds from sale of assets | 2 | | | 48 | | | 35 | |
| Proceeds from sale of assets, net of cash on hand | |
| Removal costs from property, plant and equipment retirements, net | Removal costs from property, plant and equipment retirements, net | (106) | | | (104) | | | (87) | |
| Net cash used in investing activities | Net cash used in investing activities | (2,061) | | | (1,945) | | | (2,036) | |
| CASH FLOWS FROM FINANCING ACTIVITIES | CASH FLOWS FROM FINANCING ACTIVITIES | | | | | | CASH FLOWS FROM FINANCING ACTIVITIES | | | |
| Proceeds from long-term debt | Proceeds from long-term debt | 1,334 | | | 1,530 | | | 1,358 | |
| Repayments of long-term debt | Repayments of long-term debt | (342) | | | (495) | | | (526) | |
| Proceeds from term loan | 500 | | | 0 | | | 0 | |
| Net short-term borrowings with maturities less than three months | (5) | | | (178) | | | 60 | |
| Issuance of common stock | 0 | | | 0 | | | 183 | |
| Proceeds from issuances of employee stock plans and direct stock purchase plan, net of taxes paid of $17, $11 and $8 in 2020, 2019 and 2018, respectively | 9 | | | 15 | | | 16 | |
| Advances and contributions in aid of construction, net of refunds of $24, $30 and $22 in 2020, 2019 and 2018, respectively | 28 | | | 26 | | | 21 | |
| (Repayments of) proceeds from term loan | |
| Net proceeds from common stock financing | |
| Net short-term (repayments) borrowings with maturities less than three months | |
| Advances and contributions in aid of construction, net of refunds of $25, $19 and $25 in 2023, 2022 and 2021, respectively | |
| Debt issuance costs and make-whole premium on early debt redemption | Debt issuance costs and make-whole premium on early debt redemption | (15) | | | (15) | | | (22) | |
| Dividends paid | Dividends paid | (389) | | | (353) | | | (319) | |
| Anti-dilutive share repurchases | 0 | | | (36) | | | (45) | |
| Net cash provided by financing activities | 1,120 | | | 494 | | | 726 | |
| Net increase (decrease) in cash, cash equivalents and restricted funds | 485 | | | (68) | | | 76 | |
| Other, net | |
| Net cash provided by (used in) financing activities | |
| Net (decrease) increase in cash, cash equivalents and restricted funds | |
| Cash, cash equivalents and restricted funds at beginning of period | Cash, cash equivalents and restricted funds at beginning of period | 91 | | | 159 | | | 83 | |
| Cash, cash equivalents and restricted funds at end of period | Cash, cash equivalents and restricted funds at end of period | $ | 576 | | | $ | 91 | | | $ | 159 | |
| Cash paid during the year for: | Cash paid during the year for: | | | | | | Cash paid during the year for: | | | |
| Interest, net of capitalized amount | Interest, net of capitalized amount | $ | 382 | | | $ | 383 | | | $ | 332 | |
| Income taxes, net of refunds of $2, $4 and $0 in 2020, 2019 and 2018, respectively | $ | 7 | | | $ | 12 | | | $ | 38 | |
| Income taxes, net of refunds of $30, $2 and $6 in 2023, 2022 and 2021, respectively | |
| Non-cash investing activity: | Non-cash investing activity: | | | | | | Non-cash investing activity: | | | |
| Capital expenditures acquired on account but unpaid as of year end | Capital expenditures acquired on account but unpaid as of year end | $ | 221 | | | $ | 235 | | | $ | 181 | |
| Seller promissory note from the sale of the Homeowner Services Group | |
| Contingent cash payment from the sale of the Homeowner Services Group | |
The accompanying notes are an integral part of these Consolidated Financial Statements.
American Water Works Company, Inc. and Subsidiary Companies
Consolidated Statements of Changes in Shareholders’ Equity
(In millions, except per share data)
| | Common Stock | | | Common Stock | | | | Retained Earnings | | Accumulated Other Comprehensive Loss | | Treasury Stock | | Total Shareholders' Equity |
| | Common Stock | | | | Retained Earnings (Accumulated Deficit) | | Accumulated Other Comprehensive Loss | | Treasury Stock | | Total Shareholders' Equity |
| | Shares | | Par Value | | Paid-in Capital | | Shares | | At Cost | |
| Balance as of December 31, 2017 | 182.5 | | | $ | 2 | | | $ | 6,432 | | | $ | (723) | | | $ | (79) | | | (4.1) | | | $ | (247) | | | $ | 5,385 | |
| Cumulative effect of change in accounting principle | — | | | — | | | — | | | 20 | | | — | | | — | | | — | | | 20 | |
| Net income attributable to common shareholders | — | | | — | | | — | | | 567 | | | — | | | — | | | — | | | 567 | |
| Common stock issuances (a) | 2.9 | | | — | | | 225 | | | (1) | | | — | | | (0.1) | | | (5) | | | 219 | |
| Repurchases of common stock | — | | | — | | | — | | | — | | | — | | | (0.5) | | | (45) | | | (45) | |
| Net other comprehensive income | — | | | — | | | — | | | — | | | 45 | | | — | | | — | | | 45 | |
| Dividends ($1.82 declared per common share) | — | | | — | | | — | | | (327) | | | — | | | — | | | — | | | (327) | |
| Balance as of December 31, 2018 | 185.4 | | | $ | 2 | | | $ | 6,657 | | | $ | (464) | | | $ | (34) | | | (4.7) | | | $ | (297) | | | $ | 5,864 | |
| Cumulative effect of change in accounting principle | — | | | — | | | — | | | (2) | | | — | | | — | | | — | | | (2) | |
| Net income attributable to common shareholders | — | | | — | | | — | | | 621 | | | — | | | — | | | — | | | 621 | |
| Common stock issuances (a) | 0.5 | | | — | | | 43 | | | — | | | — | | | (0.1) | | | (5) | | | 38 | |
| Repurchases of common stock | — | | | — | | | — | | | — | | | — | | | (0.3) | | | (36) | | | (36) | |
| Net other comprehensive income | — | | | — | | | — | | | — | | | (2) | | | — | | | — | | | (2) | |
| Dividends ($2.00 declared per common share) | — | | | — | | | — | | | (362) | | | — | | | — | | | — | | | (362) | |
| Balance as of December 31, 2019 | 185.9 | | | $ | 2 | | | $ | 6,700 | | | $ | (207) | | | $ | (36) | | | (5.1) | | | $ | (338) | | | $ | 6,121 | |
| Balance as of December 31, 2020 | |
| Balance as of December 31, 2020 | |
| Balance as of December 31, 2020 | |
| Net income attributable to common shareholders | Net income attributable to common shareholders | — | | | — | | | — | | | 709 | | | — | | | — | | | — | | | 709 | |
| Common stock issuances (a) | Common stock issuances (a) | 0.6 | | | — | | | 47 | | | — | | | — | | | (0.1) | | | (10) | | | 37 | |
| Net other comprehensive income | Net other comprehensive income | — | | | — | | | — | | | — | | | (13) | | | — | | | — | | | (13) | |
| Dividends ($2.20 declared per common share) | — | | | — | | | — | | | (400) | | | — | | | — | | | — | | | (400) | |
| Balance as of December 31, 2020 | 186.5 | | | $ | 2 | | | $ | 6,747 | | | $ | 102 | | | $ | (49) | | | (5.2) | | | $ | (348) | | | $ | 6,454 | |
| Dividends ($2.41 declared per common share) | |
| Balance as of December 31, 2021 | |
| Net income attributable to common shareholders | |
| Common stock issuances (a) | |
| Net other comprehensive income | |
| Dividends ($2.62 declared per common share) | |
| Balance as of December 31, 2022 | |
| Net income attributable to common shareholders | |
| Common stock issuances (a) | |
| Net other comprehensive loss | |
| Dividends ($2.83 declared per common share) | |
| Balance as of December 31, 2023 | |
(a)Includes stock-based compensation, employee stock purchase plan and direct stock reinvestment and direct stock purchase plan activity, as well as the issuance of shares in order to fund to the purchase of Pivotal Home Solutions (“Pivotal”) in 2018.activity.
The accompanying notes are an integral part of these Consolidated Financial Statements.
American Water Works Company, Inc. and Subsidiary Companies
Notes to Consolidated Financial Statements
(Unless otherwise noted, in millions, except per share data)
Note 1: Organization and Operation
American Water Works Company, Inc. (the “Company” or “American Water”) is a holding company for regulatedsubsidiaries that provide water and market-based subsidiarieswastewater services throughout the United States. References to “parent company” mean American Water Works Company, Inc., without its subsidiaries. The Company’s primary business involves the ownership of regulated utilities that provide water and wastewater services in 1614 states in the United States, collectively referred to as the “Regulated Businesses.” The Company also operates market-basedother businesses that provide water and wastewater services within non-reportable operating segments, collectively referred to as the “Market-Based Businesses.” The Company’s primary Market-Based Businesses include the Homeowner Services Group (“HOS”), which provides various warranty protection programs and other home services to residential customers; and the Military Services Group (“MSG”), which enters into long-term contracts with the U.S. government to provide wateron military installations, as well as municipalities. These other businesses do not meet the criteria of a reportable segment in accordance with generally accepted accounting principles in the United States (“GAAP”), and wastewater servicesare collectively presented throughout this Annual Report on various military installations.Form 10-K within “Other.”
Note 2: Significant Accounting Policies
Regulation
The Company’s regulated utilities are subject to regulation by multiple state utility commissions or other entities engaged in utility regulation, collectively referred to as Public Utility Commissions (“PUCs”). As such, the Company follows authoritative accounting principles required for rate regulated utilities, which requires the effects of rate regulation to be reflected in the Company’s Consolidated Financial Statements. PUCs generally authorize revenue at levels intended to recover the estimated costs of providing service, plus a return on net investments, or rate base. Regulators may also approve accounting treatments, long-term financing programs and cost of capital, operation and maintenance (“O&M”) expenses, capital expenditures, taxes, affiliated transactions and relationships, reorganizations, mergers, acquisitions and dispositions, along with imposing certain penalties or granting certain incentives. Due to timing and other differences in the collection of a regulated utility’s revenues, these authoritative accounting principles allow a cost that would otherwise be charged as an expense by a non-regulated entity, to be deferred as a regulatory asset if it is probable that such cost is recoverable through future rates. Conversely, these principles also require the creation of a regulatory liability for amounts collected in rates to recover costs expected to be incurred in the future, or amounts collected in excess of costs incurred and are refundable to customers. See Note 4—3—Regulatory Matters for additional information.
Use of Estimates
The preparation of financial statements in conformity with accounting principles generally accepted in the United States (“GAAP”)GAAP requires that management make estimates, assumptions and judgments that could affect the Company’s financial condition, results of operations and cash flows. Actual results could differ from these estimates, assumptions and judgments. The Company considers its critical accounting estimates to include (i) the application of regulatory accounting principles and the related determination and estimation of regulatory assets and liabilities, (ii) revenue recognition and the estimates used in the calculation of unbilled revenue, (iii) accounting for income taxes, (iv) benefit plan assumptions and (v) the estimates and judgments used in determining loss contingencies. The Company’s critical accounting estimates that are particularly sensitive to change in the near term are amounts reported for regulatory assets and liabilities, income taxes, benefit plan assumptions and contingency-related obligations.
Principles of Consolidation
The accompanying Consolidated Financial Statements include the accounts of American Water and all of its subsidiaries in which a controlling interest is maintained after the elimination of intercompany balances and transactions.
Property, Plant and Equipment
Property, plant and equipment consists primarily of utility plant utilized by the Company’s regulated utilities. Additions to utility plant and replacement of retirement units of utility plant are capitalized and include costs such as materials, direct labor, payroll taxes and benefits, indirect items such as engineering and supervision, transportation and an allowance for funds used during construction (“AFUDC”). Costs for repair, maintenance and minor replacements are charged to O&M expense as incurred.
The cost of utility plant is depreciated using the straight-line average remaining life, group method. The Company’s regulated utilities record depreciation in conformity with amounts approved by PUCs, after regulatory review of the information the Company submits to support its estimates of the assets’ remaining useful lives.
Nonutility property consists primarily of buildings and equipment utilized by the Company’s Market-Based BusinessesMilitary Services Group (“MSG”) and for internal operations. This property is stated at cost, net of accumulated depreciation, which is calculated using the straight-line method over the useful lives of the assets.
When units of property, plant and equipment are replaced, retired or abandoned, the carrying value is credited against the asset and charged to accumulated depreciation. To the extent the Company recovers cost of removal or other retirement costs through rates after the retirement costs are incurred, a regulatory asset is recorded. In some cases, the Company recovers retirement costs through rates during the life of the associated asset and before the costs are incurred. These amounts result in a regulatory liability being reported based on the amounts previously recovered through customer rates, until the costs to retire those assets are incurred.
The costs incurred to acquire and internally develop computer software for internal use are capitalized as a unit of property. The carrying value of these costs, net of amortization, amounted to $360$419 million and $345$369 million as of December 31, 20202023 and 2019,2022, respectively.
Cash and Cash Equivalents, and Restricted Funds
Substantially all cash is invested in interest-bearing accounts. All highly liquid investments with a maturity of three months or less when purchased are considered to be cash equivalents.
Restricted funds consist primarily of proceeds from financings for the construction and capital improvement of facilities, and deposits for future services under O&M projects. Proceeds are held in escrow or interest-bearing accounts until the designated expenditures are incurred. Restricted funds are classified on the Consolidated Balance Sheets as either current or long-term based upon the intended use of the funds.
Presented in the table below is a reconciliation of the cash and cash equivalents and restricted funds amounts as presented on the Consolidated Balance Sheets to the sum of such amounts presented on the Consolidated Statements of Cash Flows for the years ended December 31:
| | | | | | | | | | | |
| | 2020 | | 2019 |
| Cash and cash equivalents | $ | 547 | | | $ | 60 | |
| Restricted funds | 29 | | | 31 | |
| Cash and cash equivalents and restricted funds as presented on the Consolidated Statements of Cash Flows | $ | 576 | | | $ | 91 | |
Accounts Receivable and Unbilled Revenues
Accounts receivable include regulated utility customer accounts receivable, which represent amounts billed to water and wastewater customers generally on a monthly basis. Credit is extended based on the guidelines of the applicable PUCs and collateral is generally not required. Also included are market-basedthe trade accounts receivable of other businesses, primarily MSG, and nonutility customer receivables of the regulated subsidiaries. Unbilled revenues are accrued when service has been provided but has not been billed to customers and when costs exceed billings on market-basedcertain construction contracts.
Allowance for Uncollectible Accounts
Allowances for uncollectible accounts are maintained for estimated probable losses resulting from the Company’s inability to collect receivables from customers. Accounts that are outstanding longer than the payment terms are considered past due. A number of factors are considered in determining the allowance for uncollectible accounts, including the length of time receivables are past due, previous loss history, current economic and societal conditions and reasonable and supportable forecasts that affect the collectability of receivables from customers. The Company generally writes off accounts when they become uncollectible or are over a certain number of days outstanding. An increase in the allowance for uncollectible accounts for the period ending December 31, 2020 reflects the impacts from the current novel coronavirus (“COVID-19”) pandemic, including an increase in uncollectible accounts expense and a reduction in amounts written off due to shutoff moratoria in place across the Company’s subsidiaries. See Note 8—7—Allowance for Uncollectible Accounts for additional information.
Materials and Supplies
Materials and supplies are stated at the lower of cost or net realizable value. Cost is determined using the average cost method.
LeasesSeller Promissory Note
On January 1, 2019, the Company adoptedThe Company’s secured seller promissory note is accounted for under Accounting Standards UpdateCodification (“ASC”) Topic 310, 2016-02, Leases (Topic 842)Receivables,andall related amendments (collectively, the “Standard”).The Company implemented the guidance in the Standard using the modified retrospective approach and applied the optional transition method, which allowed entities to apply the new Standardis classified as held for investment and accounted for at amortized cost at the adoption datepresent value of consideration received for the sale of its Homeowner Services Group (“HOS”) business. Interest income from the secured seller promissory note is accrued based on the principal amount outstanding and recognize a cumulative-effect adjustment toearned over the opening balance of retained earnings in the period of adoption. Under this approach, prior periods have not been restated and continue to be reported under the accounting standards in effect for those periods. The Standard includes practical expedients, which relate to the identification and classification of leases that commenced before the adoption date, initial direct costs for leases that commenced before the adoption date, the ability to use hindsight in evaluating lessee options to extend or terminate a lease or to purchase the underlying asset and the ability to carry forward accounting treatment for existing land easements.
Adoptioncontractual life of the Standard resulted in the recognition of operating lease right-of-use (“ROU”) assets and operating lease liabilities as of January 1, 2019 of approximately $117 million and $115 million, respectively. The difference between the ROU assets and operating lease liabilities was recorded as an adjustment to retained earnings. The Standard did not materially impact the Company’s consolidated results of operations and had no impact on cash flows.loan.
Leases
The Company has operating and finance leases involving real property, including facilities, utility assets, vehicles, and equipment. The Company determines if an arrangement is a lease at inception. Operating leases are included in operating lease ROUright-of-use (“ROU”) assets, accrued liabilities and operating lease liabilities on the Consolidated Balance Sheets. Finance leases are included in property, plant and equipment, accrued liabilities and other long-term liabilities on the Consolidated Balance Sheets. The Company has made an accounting policy election not to include operating leases with a lease term of twelve months or less.
ROU assets represent the right to use an underlying asset for the lease term and the lease liabilities represent the obligation to make lease payments arising from the lease. ROU assets and lease liabilities are generally recognized at the commencement date based on the present value of discounted lease payments over the lease term. As most of the Company’s leases do not provide an implicit rate, the Company uses its incremental borrowing rate based on the information available at the commencement date in determining the present value of discounted lease payments. The implicit rate is used when readily determinable. ROU assets also include any upfront lease payments and excludes lease incentives. The Company’s lease terms may include options to extend or terminate the lease when it is reasonably certain that the option will be exercised. Lease expense is recognized on a straight-line basis over the lease term.
The Company has lease agreements with lease components (e.g., fixed payments including rent, real estate taxes and insurance costs) and non-lease components (e.g., common-area maintenance costs), which are generally accounted for separately; however, the Company accounts for the lease and non-lease components as a single lease component for certain leases. Certain lease agreements include variable rental payments adjusted periodically for inflation. Additionally, the Company applies a portfolio approach to effectively account for the ROU assets and lease liabilities. The Company’s lease agreements do not contain any material residual value guarantees or material restrictive covenants.
Goodwill
Goodwill represents the excess of the purchase price paid over the estimated fair value of the assets acquired and liabilities assumed in the acquisition of a business. Goodwill is not amortized and must be allocated at the reporting unit level, which is defined as an operating segment or one level below, and tested for impairment at least annually, or more frequently if an event occurs or circumstances change that would more likely than not, reduce the fair value of a reporting unit below its carrying value.
The Company’s goodwill is primarily associated with (i) the acquisition of American Water by an affiliate of the Company’s previous owner in 2003 (ii) the acquisition of E’town Corporation by a predecessor to the Company’s previous owner in 2001, and (iii) the acquisition of Pivotal in 2018; and has been allocated to reporting units based on the fair values at the date of the acquisitions. For purposes of testing goodwill for impairment, the reporting units in the Regulated Businesses segment are aggregated into a single reporting unit. The Market-Based Businessesgoodwill of Other is comprised ofattributable to the HOS and MSG reporting units.unit.
The Company’s annual impairment testing is performed as of November 30 of each year, in conjunction with the completion of the Company’s annual business plan.year. The Company assesses qualitative factors to determine whether quantitative testing is necessary. If it is determined, based upon qualitative factors, that the estimated fair value of a reporting unit is, more likely than not, greater than its carrying value, no further testing is required. If the Company bypasses the qualitative assessment or performs the qualitative assessment and determines that the estimated fair value of a reporting unit, is more likely than not, less than its carrying value, a quantitative, fair value-based testassessment is performed. This quantitative testing compares the estimated fair value of the reporting unit to its respective net carrying value, including goodwill, on the measurement date. An impairment loss will be recognized in the amount equal to the excess of the reporting unit’s carrying value compared to its estimated fair value, limited to the total amount of goodwill allocated to that reporting unit.
Application of goodwill impairment testing requires management judgment, including the identification of reporting units and determining the fair value of reporting units. Management estimates fair value using a discounted cash flow analysis. Significant assumptions used in these fair value estimations include, but are not limited to, forecasts of future operating results, discount rate and growth rates.rate.
The Company believes the assumptions and other considerations used to value goodwill to be appropriate, however, if actual experience differs from the assumptions and considerations used in its analysis, the resulting change could have a material adverse impact on the Consolidated Financial Statements. See Note 9—8—Goodwill and Other Intangible Assets for additional information.
Intangible Assets
Intangible assets consist primarily of finite-lived customer relationships associated with the acquisition of Pivotal. Finite-lived intangible assets are initially measured at their estimated fair values, and are amortized over their estimated useful lives based on the pattern in which the economic benefits of the intangible assets are consumed or otherwise used. See Note 9—Goodwill and Other Intangible Assets for additional information.
Impairment of Long-Lived Assets
Long-lived assets, other than goodwill, primarily include property, plant and equipment, goodwill, intangible assets and long-term investments.equipment. The Company evaluates long-lived assets for impairment when circumstances indicate the carrying value of those assets may not be recoverable. The Company determines if long-lived assets are potentially impaired by comparing the undiscounted expected future cash flows to the carrying value when indicators of impairment exist. When such indicators arise, the Company estimatesundiscounted cash flow analysis indicates a long-lived asset may not be recoverable, the fair valueamount of the impairment loss is determined by measuring the excess of the carrying amount of the long-lived asset from future cash flows expected to result fromor asset group over its use and, if applicable, the eventual disposition of the asset, comparing the estimated fair value to the carrying value of the asset. An impairment loss will be recognized in the amount equal to the excess of the long-lived asset’s carrying value compared to its estimated fair value.
The long-lived assets of the Company’s regulated utilities are grouped on a separate entity basis for impairment testing, as they are integrated state-wide operations that do not have the option to curtail service and generally have uniform tariffs. A regulatory asset is charged to earnings if and when future recovery in rates of that asset is no longer probable.
The Company believes the assumptions and other considerations used to value long-lived assets to be appropriate, however, if actual experience differs from the assumptions and considerations used in its estimates, the resulting change could have a material adverse impact on the Consolidated Financial Statements.
Advances for Construction and Contributions in Aid of Construction
Regulated utility subsidiaries may receive advances for construction and contributions in aid of construction from customers, home builders and real estate developers to fund construction necessary to extend service to new areas.
Advances are refundable for limited periods of time as new customers begin to receive service or other contractual obligations are fulfilled. Included in other current liabilities as of December 31, 20202023 and 20192022, on the Consolidated Balance Sheets are estimated refunds of $23$18 million and $25$19 million, respectively. ThoseThese amounts represent expected refunds during the next 12-month period.
Advances that are no longer refundable are reclassified to contributions.contributions in aid of construction. Contributions in aid of construction are permanent collections of plant assets or cash for a particular construction project. For ratemaking purposes, the amount of such contributions generally serves as a rate base reduction since the contributions represent non-investor supplied funds.
Generally, the Company depreciates utility plant funded by contributions and amortizes its contributions in aid of construction balance as a reduction to depreciation expense, producing a result which is functionally equivalent to reducing the original cost of the utility plant for the contributions. In accordance with applicable regulatory guidelines, some of the Company’s utility subsidiaries do not amortize contributions in aid of construction, and any contribution received remains on the balance sheet indefinitely. Amortization of contributions in aid of construction was $32$40 million, $29$37 million and $28$36 million for the years ended December 31, 2020, 20192023, 2022 and 2018,2021, respectively.
Revenue Recognition
On January 1, 2018, the Company adopted Accounting Standards CodificationUnder ASC Topic 606, Revenue From Contracts With Customers, and all related amendments (collectively, “ASC 606”),using the modified retrospective approach, applied to contracts which were not completed as of January 1, 2018.
Under ASC 606, a performance obligation is a promise within a contract to transfer a distinct good or service, or a series of distinct goods and services, to a customer. Revenue is recognized when performance obligations are satisfied and the customer obtains control of promised goods or services. The amount of revenue recognized reflects the consideration to which the Company expects to be entitled to receive in exchange for goods or services. Under ASC 606, a contract’s transaction price is allocated to each distinct performance obligation. To determine revenue recognition for arrangements that the Company determines are within the scope of ASC 606, the Company performs the following five steps: (i) identifies the contracts with a customer; (ii) identifies the performance obligations within the contract, including whether any performance obligations are distinct and capable of being distinct in the context of the contract; (iii) determines the transaction price; (iv) allocates the transaction price to the performance obligations in the contract; and (v) recognizes revenue when, or as, the Company satisfies each performance obligation.
The Company’s revenues from contracts with customers are discussed below. Customer payments for contracts are generally due within 30 days of billing and none of the contracts with customers have payment terms that exceed one year; therefore, the Company elected to apply the significant financing component practical expedient and no amount of consideration has been allocated as a financing component.
Regulated Businesses Revenue
Revenue from the Company’s Regulated Businesses is generated primarily from water and wastewater services delivered to customers. These contracts contain a single performance obligation, the delivery of water and/or wastewater services, as the promise to transfer the individual good or service is not separately identifiable from other promises within the contracts and, therefore, is not distinct. Revenues are recognized over time, as services are provided. There are generally no significant financing components or variable consideration. Revenues include amounts billed to customers on a cycle basis and unbilled amounts calculated based on estimated usage from the date of the meter reading associated with the latest customer bill, to the end of the accounting period. The amounts that the Company has a right to invoice are determined by each customer’s actual usage, an indicator that the invoice amount corresponds directly to the value transferred to the customer. The Company also recognizes revenue when it is probable that future recovery of previously incurred costs or future refunds that are to be credited to customers will occur through the ratemaking process.
Other Revenue
Through various warranty protection programs and other home services, the Company provides fixed fee services to residential customers for interior and exterior water and sewer lines, interior electric and gas lines, heating and cooling systems, water heaters and other home appliances, as well as power surge protection and other related services. Most of the contracts have a one-year term and each service is a separate performance obligation, satisfied over time, as the customers simultaneously receive and consume the benefits provided from the service. Customers are obligated to pay for the protection programs ratably over 12 months or via a one-time, annual fee, with revenues recognized ratably over time for these services. Advances from customers are deferred until the performance obligation is satisfied.
The Company also has long-term, fixed fee contracts to operate and maintain water and wastewater systems for the U.S. government on various military installations and facilities owned by municipal customers. Billing and revenue recognition for the fixed fee revenues occurs ratably over the term of the contract, as customers simultaneously receive and consume the benefits provided by the Company. Additionally, these contracts allow the Company to make capital improvements to underlying infrastructure, which are initiated through separate modifications or amendments to the original contract, whereby stand-alone, fixed pricing is separately stated for each improvement. The Company has determined that these capital improvements are separate performance obligations, with revenue recognized over time based on performance completed at the end of each reporting period. Losses on contracts are recognized during the period in which the losses first become probable and estimable. Revenues recognized during the period in excess of billings on construction contracts are recorded as unbilled revenues, with billings in excess of revenues recorded as other current liabilities until the recognition criteria are met. Changes in contract performance and related estimated contract profitability may result in revisions to costs and revenues and are recognized in the period in which revisions are determined. See Note 5—4—Revenue Recognition for additional information.
Prior to December 9, 2021, through various warranty protection programs and other home services, the Company previously provided fixed fee services to residential customers for interior and exterior water and sewer lines, interior electric and gas lines, heating and cooling systems, water heaters and other home appliances, as well as power surge protection and other related services through its former HOS business. Most of the contracts had a one-year term and each service was a separate performance obligation, satisfied over time, as the customers simultaneously received and consumed the benefits provided from the service. Customers were obligated to pay for the protection programs ratably over 12 months or via a one-time, annual fee, with revenues recognized ratably over time for those services. Advances from customers were deferred until the performance obligation was satisfied.
Income Taxes
The Company and its subsidiaries participate in a consolidated federal income tax return for U.S. tax purposes. Members of the consolidated group are charged with the amount of federal income tax expense determined as if they filed separate returns.
Certain income and expense items are accounted for in different time periods for financial reporting than for income tax reporting purposes. The Company provides deferred income taxes on the difference between the tax basis of assets and liabilities and the amounts at which they are carried in the financial statements. These deferred income taxes are based on the enacted tax rates expected to be in effect when these temporary differences are projected to reverse. In addition, the regulated utility subsidiaries recognize regulatory assets and liabilities for the effect on revenues expected to be realized as the tax effects of temporary differences, previously flowed through to customers, reverse.
Investment tax credits have been deferred by the regulated utility subsidiaries and are being amortized to income over the average estimated service lives of the related assets.
The Company recognizes accrued interest and penalties related to tax positions as a component of income tax expense and accounts for sales tax collected from customers and remitted to taxing authorities on a net basis. See Note 15—14—Income Taxes for additional information.
Allowance for Funds Used During Construction
AFUDC is a non-cash credit to income with a corresponding charge to utility plant that represents the cost of borrowed funds or a return on equity funds devoted to plant under construction. The regulated utility subsidiaries record AFUDC to the extent permitted by the PUCs. The portion of AFUDC attributable to borrowed funds is shown as a reduction of interest, net on the Consolidated Statements of Operations. Any portion of AFUDC attributable to equity funds would be included in other, net on the Consolidated Statements of Operations. Presented in the table below is AFUDC for the years ended December 31:
| | | | | | | | | | | | | | | | | |
| | 2020 | | 2019 | | 2018 |
| Allowance for other funds used during construction | $ | 30 | | | $ | 28 | | | $ | 24 | |
| Allowance for borrowed funds used during construction | 13 | | | 13 | | | 13 | |
Environmental Costs
The Company’s water and wastewater operations and the operations of its Market-Based Businesses are subject to U.S. federal, state, local and foreign requirements relating to environmental protection, and as such, the Company periodically becomes subject to environmental claims in the normal course of business. Environmental expenditures that relate to current operations or provide a future benefit are expensed or capitalized as appropriate. Remediation costs that relate to an existing condition caused by past operations are accrued, on an undiscounted basis, when it is probable that these costs will be incurred and can be reasonably estimated. A conservation agreement entered into by a subsidiary of the Company with the National Oceanic and Atmospheric Administration in 2010 and amended in 2017 required the subsidiary to, among other provisions, implement certain measures to protect the steelhead trout and its habitat in the Carmel River watershed in the State of California. The subsidiary agreed to pay $1 million annually commencing in 2010 with the final payment being made in 2021. Remediation costs accrued amounted to $1 million and $2 million as of December 31, 2020 and 2019, respectively. | | | | | | | | | | | | | | | | | |
| 2023 | | 2022 | | 2021 |
| Allowance for other funds used during construction | $ | 41 | | | $ | 20 | | | $ | 27 | |
| Allowance for borrowed funds used during construction | 24 | | | 14 | | | 10 | |
Derivative Financial Instruments
The Company uses derivative financial instruments primarily for purposes of hedging exposures to fluctuations in interest rates. These derivative contracts are entered into for periods consistent with the related underlying exposures and do not constitute positions independent of those exposures. The Company does not enter into derivative contracts for speculative purposes and does not use leveraged instruments.
All derivatives are recognized on the balance sheet at fair value. On the date the derivative contract is entered into, the Company may designatedesignates the derivative as a hedge of the fair value of a recognized asset or liability (fair-value hedge) or a hedge of a forecasted transaction or of the variability of cash flows to be received or paid related to a recognized asset or liability (cash-flow hedge).
Changes in the fair value of a fair-value hedge, along with the gain or loss on the underlying hedged item, are recorded in current-period earnings. The gains and losses on the effective portion of cash-flow hedges are recorded in other comprehensive income, until earnings are affected by the variability of cash flows. Any ineffective portion of designated cash-flow hedges is recognized in current-period earnings.
Cash flows from derivative contracts are included in net cash provided by operating activities on the Consolidated Statements of Cash Flows. See Note 12—11—Long-Term Debt for additional information.
Pension and Other Postretirement Benefits
TableThe Company maintains defined benefit pension plans and other postretirement benefit plans for eligible employees and retirees. The plan obligation and costs of Contentsproviding benefits under these plans are annually measured as of December 31. The measurement involves various factors, assumptions and accounting elections. The impact of assumption changes or experience different from that assumed on pension and other postretirement benefit obligations is recognized over time rather than immediately recognized in the Consolidated Statements of Operations and the Consolidated Statements of Comprehensive Income. Cumulative gains and losses that are in excess of 10% of the greater of either the projected benefit obligation or the fair value of plan assets are amortized over the expected average remaining future service period of the current active membership for the plans, with the exception of the American Water Pension Plan for Certain Inactive Participants (“AWPP Inactive”), which is amortized over the average remaining life expectancy of the inactive participants. See Note 15—Employee Benefits for additional information.The Company’s policy is to recognize curtailments when the total expected future service of plan participants is reduced by greater than 10% due to an event that results in terminations and/or retirements.
New Accounting Standards
Presented in the table below are new accounting standards that were adopted by the Company in 2020:2023:
| | | | | | | | | | | | | | | | | | | | | | | | | | |
| Standard | | Description | | Date of Adoption | | Application | | Effect on the Consolidated Financial Statements |
Measurement of Credit Losses on Financial Instruments
Accounting for Contract Assets and Contract Liabilities from Contracts with Customers | | Updated the accounting guidance on reporting credit losses for financial assets held at amortized cost basis and available-for-sale debt securities. Under this guidance, expected credit losses are required to be measured based on historical experience, current conditions and reasonable and supportable forecasts that affect the collectability of the reported amount of financial assets. Also, thisThe guidance requires that credit losses on available-for-sale debt securities be presentedan acquirer recognize and measure contract assets and contract liabilities acquired in a business combination in accordance with Accounting Standards Codification Topic 606, as an allowance rather than asif it had originated the contracts. The amendments in this update also provide certain practical expedients for acquirers when recognizing and measuring acquired contract assets and contract liabilities from revenue contracts in a direct write-down.business combination. | | January 1, 20202023 | | Modified retrospective
Prospective | | TheThis standard did not have a material impact on the Consolidated Financial Statements.Statements |
Changes toTroubled Debt Restructurings and Vintage Disclosures | | The main provisions of this standard eliminate the Disclosure Requirementsreceivables accounting guidance for Fair Value Measurement
| | Updated thetroubled debt restructurings (“TDRs”) by creditors while enhancing disclosure requirements when a borrower is experiencing financial difficulty. Entities must apply the loan refinancing and restructuring guidance for fair value measurement. The guidance removesreceivables to determine whether a modification results in a new loan or a continuation of an existing loan. Additionally, the requirements toamendments in this update require that an entity disclose transfers between Level 1current-period gross write-offs by year of origination for financing receivables and Level 2 measurements, the timing of transfers between levels, and the valuation processes for Level 3 measurements. Disclosure of transfers into and out of Level 3 measurements will be required. The guidance adds disclosure requirements for the changenet investment in unrealized gains and losses in other comprehensive income for recurring Level 3 measurements, as well as the range and weighted average of significant unobservable inputs used to develop Level 3 measurements.leases. | | January 1, 20202023 | | Prospective, with a modified retrospective option for added disclosuresamendments related to the recognition and for the narrative descriptionmeasurement of measurement uncertainty; retrospective for all other amendments.TDRs. | | TheThis standard did not have a material impact on the Consolidated Financial Statements.
Statements |
FacilitationPresentation and Disclosure Requirements | | The guidance amends GAAP disclosure and presentation requirements for various subtopics in the Financial Accounting Standards Board Codification and was issued in response to the U.S. Securities and Exchange Commission’s (“SEC”) final rule published in August 2018 that updated and simplified disclosure requirements that it believed were outdated, superseded, overlapping, duplicative and redundant. The new guidance is intended to align GAAP requirements with those of the Effects of Reference Rate Reform on Financial Reporting | | Provided optional guidance for a limited time to ease the potential accounting burden associated with the transition from London Interbank Offered Rate (“LIBOR”). The guidance contains optional expedients and exceptions for contract modifications, hedging relationships, and other transactions that reference LIBOR or other reference rates expected to be discontinued. The expedients elected must be appliedSEC for all eligible contracts or transactions, withentities. | | The date on which the exceptionSEC’s removal of hedging relationships, which can be applied on an individual basis. | | March 12, 2020 through December 31, 2022the related disclosure requirement became effective | | Prospective for contract modifications and hedging relationships; applied as of January 1, 2020.
| | TheThis standard did not have a material impact on the Consolidated Financial Statements.Statements |
Presented in the table below are recently issued accounting standards that have not yet been adopted by the Company as of December 31, 2020:2023:
| | | | | | | | | | | | | | | | | | | | | | | | | | |
| Standard | | Description | | Date of Adoption | | Application | | Estimated Effect on the Consolidated Financial Statements |
Simplifying the Accounting for Income TaxesSegment Reporting | | The guidance removes exceptions related toin this standard expands reportable segment disclosure requirements, primarily through enhanced disclosures about significant segment expenses. Additionally, the incremental approach for intraperiod tax allocation, the requirement to recognize a deferred tax liability for changes in ownership of a foreign subsidiary or equity method investment, and the general methodology for calculating income taxes in anguidance enhances interim period when the year-to-date loss exceeds the anticipated loss. The guidance addsdisclosure requirements, to reflect changes to tax laws or rates in the annual effective tax rate computation in the interim periodclarifies circumstances in which the changes were enacted, to recognize franchise oran entity can disclose multiple segment measures of profit and loss, provides new segment disclosure requirements for entities with a single reportable segment, and other similar taxes that are partially based on income as an income-based tax and any incremental amounts as non-income-based tax, and to evaluate when a step up in the tax basis of goodwill should be considered part of the business combination in which the book goodwill was originally recognized and when it should be considered a separate transaction.disclosure requirements. | | January 1, 2021; early adoption permitted2024, effective for fiscal year 2024 and interim periods within fiscal years beginning in 2025 | | Modified retrospective for amendments related to changes in ownership of a foreign subsidiary or equity method investment;
Modified retrospective or retrospective for amendments related to taxes partially based on income; Prospective for all other amendments.Retrospective | | The standard will not have a materialCompany is evaluating the impact on theits Consolidated Financial Statements. |
Accounting for Convertible InstrumentsIncome Taxes | | The guidance in this standard requires disclosure of a tax rate reconciliation table, in both percentages and Contractsreporting currency amounts, which includes additional categories of information about federal, state, and foreign income taxes and provides further details about reconciling items in certain categories that meet a quantitative threshold. The guidance also requires an Entity’s Own Equity | | Simplificationannual disclosure of financial reporting associated with accounting for convertible instrumentsincome taxes paid, net of refunds, disaggregated by federal, state, and contracts in an entity’s own equity.foreign taxes paid, and further disaggregated by jurisdiction based on a quantitative threshold. The standard reduced the number of accounting models for convertible debt instrumentsincludes other disclosure requirements and convertible preferred stock. This will result in fewer embedded conversion features being separately recognized from the host contract. Earnings per share (“EPS”) calculations have been simplified foreliminates certain instruments.existing disclosure requirements. | | January 1, 2022; early adoption permitted but not before fiscal years beginning after December 15, 20202025 | | Either modifiedProspective, with retrospective or fully retrospectiveapplication also permitted | | The Company is evaluating anythe impact on its Consolidated Financial Statements as well asand the timing of adoption. |
Reclassifications
Certain reclassifications have been made to prior periods in the Consolidated Financial Statements and Notes to conform to the current presentation.
Note 3: Impact of Novel Coronavirus (COVID-19) Pandemic
American Water has been monitoring the global outbreak of the COVID-19 pandemic. To date, the Company has experienced COVID-19 financial impacts, including an increase in uncollectible accounts expense, additional debt costs, and certain incremental O&M expenses. The Company has also experienced decreased revenues as a result of the suspension of late fees and foregone reconnect fees. These impacts are collectively referred to as “financial impacts.”
As of February 24, 2021, American Water has commission orders authorizing deferred accounting for COVID-19 financial impacts in 11 of 14 jurisdictions, with proceedings in 2 jurisdictions pending. In addition to approving deferred accounting, to date, 2 regulatory jurisdictions have also approved cost recovery mechanisms for specified COVID-19 financial impacts. Regulatory actions to date are presented in the table below:
| | | | | | | | | | | | | | |
Commission Actions | | Description | | States |
Orders issued | | Allows the Company to establish regulatory assets to record certain financial impacts related to the COVID-19 pandemic. | | CA, HI, IA, IL, IN, MD, MO, NJ, PA, VA, WV |
Cost recovery mechanisms | | California’s Catastrophic Event Memorandum Account allows the Company to track and recover certain financial impacts related to the COVID-19 pandemic. Illinois has authorized cost recovery of COVID-19 financial impacts through a special purpose rider over a 24-month period, which was implemented by the Company’s Illinois subsidiary effective October 1, 2020. Additionally, Illinois approved a bad debt rider tariff on December 16, 2020. This rider will allow the Company to collect actual bad debt expense over last authorized beginning March 2021 over a 24-month period. | | CA, IL |
Proceedings pending | | Pending proceedings considering deferred accounting authorization for the future recovery of COVID-19 financial impacts. | | NY, TN |
Consistent with these regulatory orders, the Company has recorded $30 million in regulatory assets and $4 million of regulatory liabilities for the financial impacts related to the COVID-19 pandemic on the Consolidated Balance Sheets as of December 31, 2020. On December 30, 2020, the Company’s Kentucky subsidiary received an order denying its request to defer to a regulatory asset the financial impacts related to the COVID-19 pandemic.
As of February 24, 2021, 6 states have ordered active moratoria on the suspension of service disconnections due to non-payment.The moratoria on disconnects have expired in 8 states.
Note 4:3: Regulatory Matters
General Rate Cases
Presented in the table below are annualized incremental revenues assuming a constant water sales volume and customer count, resulting from general rate casescase authorizations that became effective during 2018 through 2020:2023:
| | | | | | | | | | | | | | | | | |
| (In millions) | 2020 | | 2019 | | 2018 |
| General rate cases by state: | | | | | |
New Jersey (a) | $ | 39 | | | $ | 0 | | | $ | 40 | |
Indiana (b) | 13 | | | 4 | | | 0 | |
California (c) | 5 | | | 4 | | | 10 | |
Virginia (d) | (1) | | | 0 | | | 0 | |
Kentucky (effective June 28, 2019) | 0 | | | 13 | | | 0 | |
New York (e) | 0 | | | 4 | | | 5 | |
West Virginia (effective February 25, 2019) | 0 | | | 19 | | | 0 | |
Maryland (effective February 5, 2019) | 0 | | | 1 | | | 0 | |
Missouri (effective May 28, 2018) | 0 | | | 0 | | | 33 | |
Pennsylvania (effective January 1, 2018) | 0 | | | 0 | | | 62 | |
| Total general rate case authorizations | $ | 56 | | | $ | 45 | | | $ | 150 | |
| | | | | | | | | | | |
| Effective Date | | Amount |
| General rate cases by state: | | | |
| Missouri | May 28, 2023 | | $ | 44 | |
| Virginia | April 24, 2023 (a) | | 11 | |
| Pennsylvania | January 28, 2023 | | 138 | |
| Illinois | January 1, 2023 | | 67 | |
| California, Step Increase | January 1, 2023 | | 13 | |
| Total general rate case authorizations | | | $ | 273 | |
(a)The $39 million base rate increase was effective on November 1, 2020, which is net of excess accumulated deferred income taxes (“EADIT”) of $15 million being returned to customers. The unprotected EADIT balance of $133 million is being returned to customers over 15 years. The $39 million rate increase was further reduced by a bill credit, for a 10-month period beginning November 1, 2020 for both the protected and unprotected catch up period EADIT of $32.5 million. The catch up period of January 1, 2018 through October 31, 2020 covers the period from when the lower federal tax rate went into effect until new baseInterim rates went into effect. The $40 million rate increase was effective on June 15, 2018. As part of the resolution of the general rate case in 2018, the Company’s New Jersey subsidiary’s customers received refunds for the amount of provisional rates implemented as of June 15, 2018 that exceeded the final rate increase plus interest.
(b)The Company’s Indiana subsidiary received an order approving a joint settlement agreement with all major parties with respect to its general rate case filing, authorizing annualized incremental revenues of $4 million in the first rate year, effective July 1, 2019, and $13 million in the second rate year,were effective May 1, 2020.2022, and the difference between interim and final approved rates were subject to refund. The Virginia State Corporation Commission issued its final Order on April 24, 2023.
(c)TheOn June 29, 2023, the California Public Utilities Commission (“CPUC”) issued a decision on the cost of capital application for the Company’s California subsidiary, received approvalwhich authorized a return on equity of 8.98% and a capital structure with an equity component of 57.04% for the third year (2020) stepthree-year period from 2022 to 2024. The CPUC’s decision was effective from the date of the order through the end of 2024. The decision included a Water Cost of Capital Mechanism (the “WCCM”) that allows the California subsidiary to increase associatedits return on equity for the remainder of 2023 and 2024 based on capital market rates. As authorized by the WCCM, the California subsidiary filed with its most recent general rate case authorization,the CPUC staff advice letters to increase the return on equity. On July 25, 2023, the CPUC staff approved a return on equity of 9.50%, effective July 31, 2023. On November 15, 2023, the CPUC staff approved a return on equity of 10.20%, effective January 1, 2020. In 2019, the step increase was effective May 11, 2019. On December 13, 2018, a settlement in this subsidiary’s general rate case filing was approved, authorizing rates effective January 1, 2018.
(d)The Company’s Virginia subsidiary received an order approving increased water revenues by $1 million, inclusive of Water & Wastewater Infrastructure Service Charge (“WWISC”) revenues of $1 million, and decreased wastewater revenue by $1 million, for a net 0 award including WWISC, or an overall decrease of $1 million excluding WWISC. Unprotected EADIT is being returned to customers over eight years, and base rates include a reduction of $1 million for EADIT.
(e)The Company’s New York subsidiary implemented its third step increase associated with its most recent general rate case authorization, effective April 1, 2019.
Due in part to the COVID-19 pandemic, the New York State Public Service Commission (the “NYSPSC”) approved, through a series of orders, the Company’s New York subsidiary’s request to postpone the previously approved step increase, originally scheduled to go into effect April 1, 2020 until May 1, 2021. The orders provided a make whole provision to recover the delayed revenues with no earnings impact. These delays impact rates for all metered and fire customers, which the Company is authorized to recover in a make-whole surcharge beginning May 1, 2021.
Pending General Rate Case Filings
On August 28, 2020, the Company’s Iowa subsidiary filed a general rate case requesting $3 million in annualized incremental revenues. Office of Consumer Advocate (“OCA”) and intervenor direct testimony was filed on December 17, 2020 and cross-reply testimony was filed on December 31, 2020. The Company’s Iowa subsidiary reply testimony was filed on January 14, 2021, and OCA rebuttal testimony was filed on February 8, 2021. Evidentiary hearings are scheduled to start March 3, 2021. An order is anticipated by April 30, 2021 with new rates effective by July 1, 2021.2024.
On June 30, 2020,May 3, 2023, the Missouri Public Service Commission issued an order approving the March 3, 2023, joint settlement agreement in the general rate case filed on July 1, 2022, by the Company’s Missouri subsidiary. The general rate case order approved a $44 million annualized increase in water and wastewater revenues, excluding $51 million in previously approved infrastructure surcharges, and authorized implementation of the new water and wastewater rates effective May 28, 2023. The annualized revenue increase was driven primarily by significant incremental capital investments since the Missouri subsidiary’s 2021 rate case order. The Missouri subsidiary’s view of its rate base was $2.3 billion, and its view as to its return on equity and long-term debt ratio (each of which is based on the general rate case order but was not disclosed therein) was 9.75% and 50.0%, respectively.
On April 24, 2023, the Virginia State Corporation Commission issued an order approving the settlement of the rate case filed on September 26, 2022, by the Company’s Virginia subsidiary. The general rate case order approved an $11 million annualized increase in water and wastewater revenues. Interim rates in this proceeding were effective on May 1, 2022, and the order required that the difference between interim and the final approved rates were subject to refund within 90 days of the order issuance. The order approves the settlement terms with a return on equity of 9.7% and a common equity ratio of 40.7%. The annualized revenue increase was driven primarily by significant incremental capital investments since the Virginia subsidiary’s 2020 rate case order that have been completed or were planned through April 30, 2023, increases in pension and other postretirement benefits expense and increases in production costs, including chemicals, fuel and power costs. The general rate case order includes recovery of the Virginia subsidiary’s COVID-19 deferral balance. It also includes approval of the accounting deferral of deviations in pension and other postretirement benefits expense from those established in base rates, until the Virginia subsidiary’s next base rate case.
On December 8, 2022, the Pennsylvania Public Utility Commission (the “PaPUC”) issued an order approving the joint settlement agreement in the rate case filed on April 29, 2022, by the Company’s Pennsylvania subsidiary. The general rate case order approved a $138 million annualized increase in water and wastewater revenues, excluding $24 million for previously approved infrastructure filings, and authorizes implementation of the new water and wastewater rates effective January 28, 2023. The annualized revenue increase was driven primarily by significant incremental capital investments since the Pennsylvania subsidiary’s 2021 rate case order that were completed through December 31, 2023, increases in pension and other postretirement benefits expense and increases in production costs, including chemicals, fuel and power costs. The general rate case order also includes recovery of the Pennsylvania subsidiary’s COVID-19 deferral balance. The Pennsylvania subsidiary’s view of its rate base was $5.1 billion, and its view as to its return on equity and long-term debt ratio (each of which is based on the general rate case order but was not disclosed therein) was 10.0% and 44.8%, respectively.
On December 15, 2022, the Illinois Commerce Commission issued an order approving the adjustment of base rates requested in a rate case filed on February 10, 2022, by the Company’s Illinois subsidiary. As updated in the Illinois subsidiary’s June 29, 2022 rebuttal filing, the request sought $83 million in additional annualized revenues, excluding previously recovered infrastructure surcharges. The general rate case order approved a $67 million annualized increase in water and wastewater system revenues, excluding previously recovered infrastructure surcharges of $18 million, effective January 1, 2023, based on an authorized return on equity of 9.78%, authorized rate base of $1.64 billion, a common equity ratio of 49.0% and a debt ratio of 51.0%. The annualized revenue increase was driven primarily by significant water and wastewater system capital investments since the Illinois subsidiary’s 2017 rate case order that have been completed or were planned through December 31, 2023, expected higher pension and other postretirement benefit costs, and increases in production costs, including chemicals, fuel and power costs.
Pending General Rate Case Filings
On January 25, 2024, the Company’s Illinois subsidiary filed tariffs for new water and wastewater rates. The request seeks a two-step rate increase consisting of aggregate annualized incremental revenue, based on a proposed return on equity of 10.75%, of (i) approximately $136 million effective January 1, 2025, based on a future test year through December 31, 2025 with average rate base and a capital structure with an equity component of 52.27% and a debt component of 47.73%, and (ii) approximately $16 million effective January 1, 2026, based on a future test year to include end of period rate base and a capital structure with an equity component of 54.43% and a debt component of 45.57%. The requested increases are driven primarily by an estimated $557 million in capital investments to be made by the Illinois subsidiary starting January 2024 through December 2025. The request also proposes a treatment and compliance rider to address recovery of future environmental compliance investments, and a modification to the existing volume balancing account mechanism to include full production cost recovery.
On January 19, 2024, the Company’s New Jersey subsidiary filed a general rate case requesting $78approximately $162 million in additional annualized incremental revenues. On August 26, 2020, the Missouri Public Service Commission (the “MPSC”) issued an order setting the test year and adoptingrevenues, which is based on a procedural schedule. Revenue requirement direct testimony was submittedproposed return on November 24, 2020 for all non-Company parties,equity of 10.75% and a technical conference was held on December 3, 2020. Costcapital structure with an equity component of service56.30% and rate design direct testimony was submitted on December 9, 2020 for all non-company parties. Rebuttal testimony was submitted on January 15, 2021 for revenue requirement and on January 22, 2021 for rate design, and true-up data was filed on January 29, 2021, which included known and measurable changes through December 31, 2020. Settlement conferences commenced on February 16, 2021. A Motion to Suspend Procedural Schedule was filed on February 23, 2021 with the MPSC by all parties to the proceeding.a debt component of 43.70%. The MPSC issued an order effective February 24, 2021 suspending the procedural schedule to allow for either a stipulation and agreement or a status report to be filed no later than February 26, 2021.
On April 29, 2020, the Company’s Pennsylvania subsidiary filed a general rate case requesting $92 million and $46 million in annualized incremental revenues for rate year 1 and rate year 2, respectively. On October 30, 2020, the Company’s Pennsylvania subsidiary and the Bureau of Investigation and Enforcement entered into a settlement agreement providing for a totalrequested annualized revenue increase of $71 million over a two-year period. In November 2020, the Company’s Pennsylvania subsidiaryis driven primarily by approximately $1.3 billion in capital investments made and the remaining active parties in the case presented their positions in briefs to the Administrative Law Judge, who issued to the Pennsylvania Public Utility Commission (the “PaPUC”) a recommended decision approving the settlement. The procedural schedule in this case was extended to March 15, 2021. The Company expects the PaPUC to issue a final order in the near term, and once approvedbe made by the PaPUC, new waterNew Jersey subsidiary through December 2024. The request also proposes a revenue decoupling mechanism and wastewater rates will be effective January 28, 2021.seeks a deferral of certain production cost adjustments.
On July 1, 2019, the Company’s California subsidiary filed a general rate case requesting $26 million in annualized incremental revenues for 2021, and increases of $10 million and $11 million in the escalation year of 2022 and the attrition year ofDecember 15, 2023, respectively. On October 11, 2019, the Company filed its 100 day update for the same proceeding and updated the request to $27 million in annualized incremental revenues for 2021, and increases of $10 million and $10 million in the escalation year of 2022 and the attrition year of 2023, respectively. On September 10, 2020, the California Public Utilities Commission (the “CPUC”) approved the Company’s California subsidiary’s motion for interim rates, establishing a memorandum account to track the difference between interim and final rates adopted by the CPUC in this proceeding, which were effective on January 1, 2021. Following settlement discussions among all parties to the proceeding, on January 22, 2021 and January 25, 2021, the Company’s California subsidiary filed with the CPUC a comprehensive settlement entered into among the Company’s California subsidiary, the Public Advocates Office, and other intervenors. These settlement agreements resolved all matters in dispute among the parties to the settlements. These settlements as well as resolution of issues raised by non-settling parties are now before the CPUC for approval.
On January 22, 2020, the Company’s California subsidiary submitted a request to delay by one year its cost of capital filing and maintain its current authorized cost of capital through 2021.2025. On March 12, 2020,February 2, 2024, the CPUC granted the request for a one year extension of the cost of capital filing to May 1, 2021,2025, to set its authorized cost of capital beginning January 1, 2022. 2026.
On November 8, 2023, the Company’s Pennsylvania subsidiary filed a general rate case requesting approximately $204 million in additional annualized revenues, excluding projected infrastructure surcharges of $20 million. The request is based on a proposed return on equity of 10.95% and a capital structure with an equity component of 55.30% and a debt component of 44.70%. The requested annualized incremental revenue increase is driven primarily by an estimated $1.0 billion of incremental capital investments to be made through mid-2025. The request also proposes a mechanism to address compliance with evolving environmental requirements, such as emerging federal regulations for lead and per- and polyfluoroalkyl substances. If approved, the new rates would be expected to take effect on August 7, 2024.
On November 1, 2023, the Company’s Virginia subsidiary filed a general rate case requesting $20 million in additional annualized revenues. The request is based on a proposed return on equity of 10.95% and a capital structure with an equity component of 45.67% and a debt and other component of 54.33%. The requested increase is driven by approximately $110 million in capital investments between May 2023 and April 2025. The request also proposed a revenue decoupling mechanism and seeks deferral of certain production cost adjustments. Interim rates will be effective May 1, 2024, with the difference between interim and final approved rates subject to refund.
On June 30, 2023, the Company’s Kentucky subsidiary filed a general rate case requesting $26 million in additional annualized revenues, excluding infrastructure surcharges of $10 million. The request is based on a proposed return on common equity of 10.75% and a proposed capital structure with a common equity component of 52.45%. An order is expected in the general rate case by the end of the first quarter of 2024.
On May 1, 2023, the Company’s West Virginia subsidiary filed a general rate case requesting $45 million in additional annualized revenues, excluding previously approved infrastructure surcharges of $7 million. The request is based on a proposed return on equity of 10.50% and a capital structure with an equity component of 52.80%. The general rate case includes a future test year capturing planned investment through 2025 and an order is expected to be issued by February 25, 2024. On June 30, 2023, the West Virginia subsidiary filed its annual infrastructure surcharge requesting $8 million in additional annualized revenues for planned investment through 2024. The infrastructure surcharge will be aligned with the investments recognized in the general rate case if the future test year is approved.
On March 31, 2023, the Company’s Indiana subsidiary filed a general rate case requesting $87 million in additional annualized revenues, excluding $41 million of revenue from infrastructure filings already approved, which includes three step increases, with $43 million of the increase to be included in rates in January 5, 2021,2024, $18 million in May 2024, and $26 million in May 2025. The requested adjustment is based on a proposed return on equity of 10.60% and a capital structure with an equity component of 56.20%. Hearings were completed in September and an order is expected in the general rate case by the end of February 2024.
On July 1, 2022, the Company’s California subsidiary submittedfiled a requestgeneral rate case requesting an increase in 2024 revenue of $56 million and a total increase in revenue over the 2024 to further delay by one year2026 period of $95 million, all as compared to 2022 revenues. The Company updated its cost of capital filing and maintainin January 2023 to capture the authorized coststep increase effective January 1, 2023. The filing was also updated to incorporate a decoupling proposal and a revision to the Company’s sales and associated variable expense forecast. The revised filing requested additional annualized revenues for the test year 2024 of capital through 2022. $37 million, compared to 2023 revenues. This excludes the proposed step rate and attrition rate increase for 2025 and 2026 of $20 million and $19 million, respectively. The total revenue requirement request for the three-year rate case cycle, incorporating updates to present rate revenues and forecasted demand, is $76 million. On February 22, 2021,November 17, 2023, the California subsidiary filed with the CPUC denieda partial settlement agreement reached with the requestCPUC’s Public Advocates Office, which would determine the amount of incremental annualized water and wastewater revenue to further delaybe received by the cost of capital filing. The Company’s California subsidiary will submitto be $20 million in the 2024 test year, $16 million in the 2025 escalation year, and $15 million in the 2026 attrition year. The partial settlement agreement addresses the California subsidiary’s revenue requirement request but does not address rate design or certain other matters, such as the requested inclusion and implementation of a cost of capital application by May 1, 2021, with a new authorized cost of capital beginningrevenue stability mechanism to separate the California subsidiary’s revenue and water sales. New rates would be implemented retroactively to January 1, 2022.2024, upon a final decision issued by the CPUC approving the partial settlement agreement and resolving the other issues not addressed by the partial settlement agreement, which is expected to occur in mid-2024.
Infrastructure Surcharges
A number of states have authorized the use of regulatory mechanisms that permit rates to be adjusted outside of a general rate case for certain costs and investments, such as infrastructure surcharge mechanisms that permit recovery of capital investments to replace aging infrastructure. Presented in the table below are annualized incremental revenues, assuming a constant water sales volume and customer count, resulting from infrastructure surcharge authorizations that became effective during 2018 through 2020:2023:
| | | | | | | | | | | | | | | | | |
| (In millions) | 2020 | | 2019 | | 2018 |
| Infrastructure surcharges by state: | | | | | |
Missouri (a) | $ | 12 | | | $ | 14 | | | $ | 6 | |
Pennsylvania (b) | 27 | | | 11 | | | 0 | |
Kentucky (effective July 1, 2020) | 1 | | | 0 | | | 0 | |
New Jersey (c) | 20 | | | 15 | | | 0 | |
Tennessee (effective January 1, 2020, September 1, 2019 and April 10, 2018) | 2 | | | 1 | | | 1 | |
Illinois (effective January 1, 2020, January 1, 2019 and January 1, 2018) | 7 | | | 8 | | | 3 | |
West Virginia (effective January 1, 2020, January 1, 2019 and January 1, 2018) | 3 | | | 2 | | | 3 | |
New York (effective August 1, 2019) | 0 | | | 2 | | | 0 | |
Indiana (effective March 14, 2018) | 0 | | | 0 | | | 7 | |
Virginia (effective March 1, 2018) | 0 | | | 0 | | | 1 | |
| Total infrastructure surcharge authorizations | $ | 72 | | | $ | 53 | | | $ | 21 | |
| | | | | | | | | | | |
| Effective Date | | Amount |
| Infrastructure surcharges by state: | | | |
| New Jersey | (a) | | $ | 32 | |
| Kentucky | October 1, 2023 | | 4 | |
| Indiana | (b) | | 26 | |
| Missouri | January 16, 2023 | | 14 | |
| Pennsylvania | January 1, 2023 | | 3 | |
| West Virginia | January 1, 2023 | | 7 | |
| Total infrastructure surcharge authorizations | | | $ | 86 | |
(a)In 2020, $2 million was effective December 14 and $10 million was effective June 27. In 2019, $5 million was effective December 21 and $9 million was effective June 24. In 2018, the effective date was December 15.
(b)In 2020, $82023, $15 million was effective October 1, $4 million was effective July 1, $5 million was effective April 1 and $10 million was effective January 1. In 2019, $6 million was effective October 1, $3 million was effective July 1 and $2 million was effective April 1.
(c)In 2020, $1030, $1 million was effective June 29 and $10$16 million was effective January 1. April 29.
(b)In 2019, the2023, $20 million was effective dateMarch 23 and $6 million was July 1.effective March 8.
Presented in the table below are annualized incremental revenues, assuming a constant water sales volume and customer count, resulting from infrastructure surcharge authorizations that became effective on or after January 1, 2020:2024:
| | | | | | | | | | | |
| (In millions)Effective Date | | Amount |
| Infrastructure surcharge filings by state: | | | |
Pennsylvania Missouri
| (effective January 1, 2021)20, 2024 | | $ | 826 | |
Illinois | (effective January 1, 2021) | 7 2024 | |
West Virginia (effective January 1, 2021)
| 5 | |
Tennessee (effective January 1, 2021)
| 3 | |
| Total infrastructure surcharge filings | | | $ | 2331 | |
Pending Infrastructure Surcharge Filings
On January 15, 2021,31, 2024, the Company’s IndianaIowa subsidiary filed for an infrastructure surcharge requesting $8 million in additional annualized revenues.
On May 29, 2020, the Company’s New York subsidiary filed for an infrastructure surchargeproceeding requesting $1 million in additional annualized revenues. New rates related
Other Regulatory Matters
In September 2020, the CPUC released a decision under its Low-Income Rate Payer Assistance program rulemaking that required the Company’s California subsidiary to this infrastructure surcharge were first deferred untilfile a proposal to alter its water revenue adjustment mechanism in its next general rate case filing in 2022, which would have become effective upon receiving an order in the current pending rate case. On October 5, 2020, the Company’s California subsidiary filed an application for rehearing of the decision and following the CPUC’s denial of its rehearing application in September 2021, the Company’s California subsidiary filed a petition for writ of review with the California Supreme Court on October 27, 2021. On May 18, 2022, the California Supreme Court issued a writ of review for the California subsidiary’s petition and the petitions filed by other entities challenging the decision. Independent of the judicial challenge, California passed Senate Bill 1469, which allows the CPUC to consider and authorize the implementation of a mechanism that separates the water corporation’s revenue and its water sales. Legislation was signed by the Governor on September 30, 2022, and became effective on January 1, 2021. Thereafter,2023. In response to the legislation, on December 30, 2020,January 27, 2023, the NYSPSC orderedCompany’s California subsidiary filed an updated application requesting the postponement ofCPUC to consider a Water Resources Sustainability Plan decoupling mechanism in its pending 2022 general rate changes until May 1, 2021,case, which, if adopted, will be recoverable, with interest, through a separate, make-whole recovery mechanism commencing May 1, 2021 through March 31, 2022.become effective upon receiving an order in the current pending rate case.
On March 2, 2021, an administrative law judge (“ALJ”) in the Office of Administrative Law of New Jersey filed an initial decision with the New Jersey Board of Public Utilities (“NJBPU”) that recommended denial of a petition filed by the Company’s New Jersey subsidiary, which sought approval of acquisition adjustments in rate base of $29 million associated with the acquisitions of Shorelands Water Company, Inc. in 2017 and the Borough of Haddonfield’s water and wastewater systems in 2015. On July 29, 2021, the NJBPU issued an order adopting the ALJ’s initial decision without modification. The Company’s New Jersey subsidiary filed a Notice of Appeal with the New Jersey Appellate Division on September 10, 2021. The Company’s New Jersey subsidiary filed its brief in support of the appeal on March 4, 2022. Response and Reply briefs were filed on June 22, 2022, and August 4, 2022, respectively. Oral argument was held on March 22, 2023, and the decision remains pending. There is no financial impact to the Company as a result of the NJBPU’s order, since the acquisition adjustments are currently recorded as goodwill on the Consolidated Balance Sheets.
Regulatory Assets
Regulatory assets represent costs that are probable of recovery from customers in future rates. Approximately 50% of the Company’s total regulatory asset balance at December 31, 20202023, earns a return. Presented in the table below is the composition of regulatory assets as of December 31:
| | | | | | | | | | | |
| | 2020 | | 2019 |
| Deferred pension expense | $ | 374 | | | $ | 384 | |
| Removal costs recoverable through rates | 314 | | | 305 | |
| Regulatory balancing accounts | 57 | | | 96 | |
| Other | 446 | | | 398 | |
Less: Regulatory assets included in assets held for sale (a) | (64) | | | (55) | |
| Total regulatory assets | $ | 1,127 | | | $ | 1,128 | |
(a)These regulatory assets are related to the pending transactions contemplated by the Stock Purchase Agreement and are included in assets held for sale on the Consolidated Balance Sheets. See Note 6—Acquisitions and Divestitures for additional information. | | | | | | | | | | | |
| 2023 | | 2022 |
| Deferred pension expense | $ | 308 | | | $ | 251 | |
| Removal costs recoverable through rates | 322 | | | 307 | |
| Unamortized debt expense | 82 | | | 76 | |
| Regulatory balancing accounts | 81 | | | 87 | |
| Other | 313 | | | 269 | |
| Total regulatory assets | $ | 1,106 | | | $ | 990 | |
The Company’s deferred pension expense includes a portion of the underfunded status that is probable of recovery through rates in future periods of $366$300 million and $375$251 million as of December 31, 20202023 and 2019,2022, respectively. The remaining portion is the pension expense in excess of the amount contributed to the pension plansauthorized amounts which is deferred by certain subsidiaries and will be recovered in future service rates as contributions are made to the pension plan.rates.
Removal costs recoverable through rates represent costs incurred for removal of property, plant and equipment or other retirement costs.
Unamortized debt expense is amortized over the lives of the respective issues. Call premiums on the redemption of long-term debt, as well as unamortized debt issuance costs, are deferred and amortized to the extent they will be recovered through future service rates.
Regulatory balancing accounts accumulate differences between revenues recognized and authorized revenue requirements until they are collected from customers or are refunded. Regulatory balancing accounts include low income programs, and purchased power and water accounts.accounts, dam removal costs and other cost balancing mechanisms.
Other regulatory assets include the financial impacts relating to the COVID-19 pandemic, customer owned lead service line removal costs, purchase premiumpremiums recoverable through rates, tank painting costs, certain construction costs for treatment facilities, property tax stabilization, employee-related costs, business services project expenses, coastal water project costs, rate case expenditures and environmental remediation costs among others. These costs are deferred because the amounts are being recovered in rates or are probable of recovery through rates in future periods.
The Company has current regulatory assets of $13 million and $40 million included in other current assets on the Consolidated Balance Sheets as of December 31, 2023 and 2022, respectively.
Regulatory Liabilities
Regulatory liabilities generally represent amounts that are probable of being credited or refunded to customers through the rate making process. Also, if costs expected to be incurred in the future are currently being recovered through rates, the Company records those expected future costs as regulatory liabilities. Presented in the table below is the composition of regulatory liabilities as of December 31:
| | | | | | | | | | | |
| | 2020 | | 2019 |
| Income taxes recovered through rates | $ | 1,230 | | | $ | 1,258 | |
| Removal costs recovered through rates | 301 | | | 297 | |
| Postretirement benefit liability | 170 | | | 186 | |
| Other | 111 | | | 102 | |
Less: Regulatory liabilities included in liabilities related to assets held for sale (a) | (42) | | | (37) | |
| Total regulatory liabilities | $ | 1,770 | | | $ | 1,806 | |
(a)These regulatory liabilities are related to the pending transactions contemplated by the Stock Purchase Agreement and are included in liabilities related to assets held for sale on the Consolidated Balance Sheets. See Note 6—Acquisitions and Divestitures for additional information.
| | | | | | | | | | | |
| 2023 | | 2022 |
| Income taxes recovered through rates | $ | 1,064 | | | $ | 1,127 | |
| Removal costs recovered through rates | 254 | | | 275 | |
| Postretirement benefit liability | 85 | | | 100 | |
| Other | 78 | | | 88 | |
| Total regulatory liabilities | $ | 1,481 | | | $ | 1,590 | |
Income taxes recovered through rates relate to deferred taxes that will likely be refunded to the Company’s customers. On December 22, 2017, the Tax Cuts and Jobs Act of 2017 (the “TCJA”(“TCJA”) was signed into law, which, among other things, enacted significant and complex changes to the Internal Revenue Code of 1986, as amended, including a reduction in the federal corporate income tax rate from 35% to 21% as of January 1, 2018. The enactment of the TCJA required a re-measurement of the Company’s deferred income taxes. The portion of this re-measurement related to the Regulated Businesses was substantially offset by a regulatory liability as the excess accumulated deferred income taxes (“EADIT”) will be used to benefit its regulated customers in future rates. NaNAll of the Company’s regulated subsidiaries are amortizing EADIT and crediting customers, including one which is using the EADIT to offset future infrastructure investments. The Company expects the timing of the amortization of EADIT credits by the 5 remaining regulated subsidiaries to be addressed in pending or future rate cases or other proceedings.customers.
Removal costs recovered through rates are estimated costs to retire assets at the end of their expected useful lives that are recovered through customer rates over the lives of the associated assets.
On August 31, 2018,Postretirement benefit liability includes a portion of the Postretirement Medical Benefit Plan was remeasured to reflect anover-funded status that is probable of refund through rates in future periods. The remaining portion represents prior service credits resulting from announced plan amendmentamendments which changed benefits for certain union and non-union plan participants. As a result of the remeasurement, the Company recorded a $227 million reduction to the net accumulated postretirement benefit obligation, with a corresponding regulatory liability.
Other regulatory liabilities include the financial impacts relating to the COVID-19 pandemic, TCJA reservereserves on revenue, pension and other postretirement benefit balancing accounts, legal settlement proceeds, deferred gains and various regulatory balancing accounts.
The Company has current regulatory liabilities of $1 million and $5 million included in other current liabilities on the Consolidated Balance Sheets as of December 31, 2023 and 2022, respectively.
Note 5:4: Revenue Recognition
Disaggregated Revenues
Presented in the table below are operating revenues disaggregated for the year ended December 31, 2020:2023:
| | Revenues from Contracts with Customers | | Other Revenues Not from Contracts with Customers (a) | | Total Operating Revenues |
| Revenues from Contracts with Customers | | | Revenues from Contracts with Customers | | Other Revenues Not from Contracts with Customers (a) | | Total Operating Revenues |
| Regulated Businesses: | Regulated Businesses: | | | | | |
| Water services: | Water services: | | |
| Water services: | |
| Water services: | |
| Residential | |
| Residential | |
| Residential | Residential | $ | 1,895 | | | $ | 0 | | | $ | 1,895 | |
| Commercial | Commercial | 627 | | | 0 | | | 627 | |
| Fire service | Fire service | 147 | | | — | | | 147 | |
| Industrial | Industrial | 133 | | | — | | | 133 | |
| Public and other | Public and other | 201 | | | 0 | | | 201 | |
| Total water services | Total water services | 3,003 | | | 0 | | | 3,003 | |
| Wastewater services: | Wastewater services: | | |
| Residential | |
| Residential | |
| Residential | Residential | 134 | | | — | | | 134 | |
| Commercial | Commercial | 34 | | | — | | | 34 | |
| Industrial | Industrial | 3 | | | — | | | 3 | |
| Public and other | Public and other | 14 | | | — | | | 14 | |
| Total wastewater services | Total wastewater services | 185 | | | — | | | 185 | |
| Miscellaneous utility charges | Miscellaneous utility charges | 32 | | | — | | | 32 | |
| Alternative revenue programs | Alternative revenue programs | — | | | 25 | | | 25 | |
| Lease contract revenue | Lease contract revenue | — | | | 10 | | | 10 | |
| Total Regulated Businesses | Total Regulated Businesses | 3,220 | | | 35 | | | 3,255 | |
| Market-Based Businesses | 540 | | | — | | | 540 | |
| Other | Other | (17) | | | (1) | | | (18) | |
| Total operating revenues | Total operating revenues | $ | 3,743 | | | $ | 34 | | | $ | 3,777 | |
(a)Includes revenues associated with provisional rates, alternative revenue programs, lease contracts and intercompany rent, which are outside the scope of ASC 606, and accounted for under other existing GAAP.
Presented in the table below are operating revenues disaggregated for the year ended December 31, 2022:
| | | | | | | | | | | | | | | | | |
| Revenues from Contracts with Customers | | Other Revenues Not from Contracts with Customers (a) | | Total Operating Revenues |
| Regulated Businesses: | | | | | |
| Water services: | | | | | |
| Residential | $ | 1,938 | | | $ | 3 | | | $ | 1,941 | |
| Commercial | 709 | | | 1 | | | 710 | |
| Fire service | 147 | | | — | | | 147 | |
| Industrial | 152 | | | 1 | | | 153 | |
| Public and other | 252 | | | — | | | 252 | |
| Total water services | 3,198 | | | 5 | | | 3,203 | |
| Wastewater services: | | | | | |
| Residential | 173 | | | 1 | | | 174 | |
| Commercial | 45 | | | — | | | 45 | |
| Industrial | 4 | | | — | | | 4 | |
| Public and other | 19 | | | — | | | 19 | |
| Total wastewater services | 241 | | | 1 | | | 242 | |
| Miscellaneous utility charges | 36 | | | — | | | 36 | |
| Alternative revenue programs | — | | | 15 | | | 15 | |
| Lease contract revenue | — | | | 9 | | | 9 | |
| Total Regulated Businesses | 3,475 | | | 30 | | | 3,505 | |
| Other | 288 | | | (1) | | | 287 | |
| Total operating revenues | $ | 3,763 | | | $ | 29 | | | $ | 3,792 | |
(a)Includes revenues associated with provisional rates, alternative revenue programs, lease contracts and intercompany rent, which are outside the scope of ASC 606, and accounted for under other existing GAAP.
Presented in the table below are operating revenues disaggregated for the year ended December 31, 2021:
| | | | | | | | | | | | | | | | | |
| Revenues from Contracts with Customers | | Other Revenues Not from Contracts with Customers (a) | | Total Operating Revenues |
| Regulated Businesses: | | | | | |
| Water services: | | | | | |
| Residential | $ | 1,935 | | | $ | — | | | $ | 1,935 | |
| Commercial | 676 | | | — | | | 676 | |
| Fire service | 151 | | | — | | | 151 | |
| Industrial | 141 | | | — | | | 141 | |
| Public and other | 230 | | | — | | | 230 | |
| Total water services | 3,133 | | | — | | | 3,133 | |
| Wastewater services: | | | | | |
| Residential | 151 | | | — | | | 151 | |
| Commercial | 37 | | | — | | | 37 | |
| Industrial | 4 | | | — | | | 4 | |
| Public and other | 16 | | | — | | | 16 | |
| Total wastewater services | 208 | | | — | | | 208 | |
| Miscellaneous utility charges | 26 | | | — | | | 26 | |
| Alternative revenue programs | — | | | 9 | | | 9 | |
| Lease contract revenue | — | | | 8 | | | 8 | |
| Total Regulated Businesses | 3,367 | | | 17 | | | 3,384 | |
| Other | 547 | | | (1) | | | 546 | |
| Total operating revenues | $ | 3,914 | | | $ | 16 | | | $ | 3,930 | |
(a)Includes revenues associated with alternative revenue programs, lease contracts and intercompany rent, which are outside the scope of ASC 606, and accounted for under other existing GAAP.
Contract Balances
Contract assets and contract liabilities are the result of timing differences between revenue recognition, billings and cash collections. In the Company’s Market-Based Businesses,MSG, certain contracts are billed as work progresses in accordance with agreed-upon contractual terms, either at periodic intervals or upon achievement of contractual milestones. Contract assets are recorded when billing occurs subsequent to revenue recognition and are reclassified to accounts receivable when billed and the right to consideration becomes unconditional. Contract liabilities are recorded when the Company receives advances from customers prior to satisfying contractual performance obligations, particularly for construction contracts, and home warranty protection program contracts, and are recognized as revenue when the associated performance obligations are satisfied.
Contract assets of $39$95 million, $13$86 million and $14$71 million are included in unbilled revenues on the Consolidated Balance Sheets as of December 31, 2020, 20192023, 2022 and 2018,2021, respectively. There were $60$87 million of contract assets added during 2020,2023, and $34$78 million of contract assets were transferred to accounts receivable during 2020.2023. There were $27$161 million of contract assets added during 2019,2022, and $28$146 million of contract assets were transferred to accounts receivable during 2019.2022.
Contract liabilities of $35$63 million, $27$91 million and $20$19 million are included in other current liabilities on the Consolidated Balance Sheets as of December 31, 2020, 20192023, 2022 and 2018,2021, respectively. There were $120$103 million of contract liabilities added during 2020,2023, and $112$131 million of contract liabilities were recognized as revenue during 2020.2023. There were $62$189 million of contract liabilities added during 2019,2022, and $55$117 million of contract liabilities were recognized as revenue during 2019.2022.
Remaining Performance Obligations
Remaining performance obligations (“RPOs”) represent revenues the Company expects to recognize in the future from contracts that are in progress. The Company enters into agreements for the provision of services to water and wastewater facilities for the U.S. military, municipalities and other customers. As of December 31, 2020,2023, the Company’s O&M and capital improvement contracts in MSG and the Market-Based BusinessesContract Services Group have RPOs. Contracts with the U.S. government for work on various military installations expire between 2051 and 20712073 and have RPOs of $6.3$7.2 billion as of December 31, 2020,2023, as measured by estimated remaining contract revenue. Such contracts are subject to customary termination provisions held by the U.S. government, prior to the agreed-upon contract expiration. Contracts with municipalities and commercial customers expire between 20212026 and 2038 and have RPOs of $478$612 million as of December 31, 2020,2023, as measured by estimated remaining contract revenue. Some of the Company’s long-term contracts to operate and maintain the federal government’s, a municipality’s or other party’s water or wastewater treatment and delivery facilities include responsibility for certain maintenance for some of those facilities, in exchange for an annual fee. Unless specifically required to perform certain maintenance activities, the maintenance costs are recognized when the maintenance is performed.
Note 6:5: Acquisitions and Divestitures
Regulated Businesses
Closed Acquisitions
During 2020,2023, the Company closed on 23 acquisitions of various regulated water and wastewater systems for a total aggregate purchase price of $135 million.$77 million, which added approximately 18,100 water and wastewater customers. Assets acquired from these acquisitions, principally utility plant, totaled $159$81 million and liabilities assumed totaled $29$4 million. This includes the Company’s New Jersey subsidiary’s acquisition of the water and wastewater assets of Egg Harbor City on June 1, 2023, for a cash purchase price of $22 million including $21, $2 million of contributionswhich was funded as a deposit to the seller in aidMarch 2021 in connection with the execution of construction and assumed debt of $7 million. The Company recorded additional goodwill of $5 million associated with 2 of its acquisitions, which is reported in its Regulated Businesses segment. Severalthe acquisition agreement. Five of these acquisitions were accounted for as business combinations asand the Company continues to grow its business through regulated acquisitions. assets acquired consisted primarily of utility plant. The preliminary purchase price allocations related to acquisitions accounted for as business combinations will be finalized once the valuation of assets acquired has been completed, no later than one year after their acquisition date.
During 2019,2022, the Company closed on 2126 acquisitions of various regulated water and wastewater systems for a total aggregate purchase price of $235 million. $335 million, of which $315 million was funded in 2022, including the acquisition of the City of York wastewater system assets noted below.Assets acquired from these acquisitions, principally utility plant, totaled $237$337 million and liabilities assumed totaled $6 million. Several of these acquisitions were accounted for as business combinations.
On May 27, 2022, the Company’s Pennsylvania subsidiary acquired the public wastewater collection and treatment system assets from the York City Sewer Authority and the City of York for a purchase price of $235 million, in cash, $20 million of which was funded as a deposit to the seller in April 2021 in connection with the execution of the acquisition agreement. The system assets serve, directly and indirectly through bulk contracts, more than 45,000 customers. The acquisition was accounted for as a business combination. The purchase price allocation consisted primarily contributions in aid of construction, totaled $5 million. The Company recorded additional$231 million of utility plant and $4 million of goodwill, of $3 million associated with 3 of its acquisitions, which is reported in itsthe Company’s Regulated Businesses segment.
During 2018, the Company closed on 15 acquisitions of various regulated water and wastewater systems for a total aggregate purchase price of $33 million. Assets acquired from these acquisitions, principally utility plant, totaled $32 million and liabilities assumed, primarily contributions in aid of construction, totaled $1 million. The Company recorded additional goodwill of $2 million associated with 1 of its acquisitions, which is reported in its Regulated Businesses segment.
Assets Held for Sale
On November 20, 2019, the Company and the Company’s New York subsidiary, entered into a Stock Purchase Agreement (the “Stock Purchase Agreement”) with Liberty Utilities Co., which it subsequently assigned to its indirect, wholly owned subsidiary Liberty Utilities (Eastern Water Holdings) Corp. (“Liberty”), pursuant to which Liberty will purchase all of the capital stock of the New York subsidiary (the “Stock Purchase”) for an aggregate purchase price of approximately $608 million in cash, subject to adjustment as provided in the Stock Purchase Agreement. The Company’s regulated New York operations have approximately 125,000 customers in the State of New York. Algonquin Power & Utilities Corp., Liberty’s ultimate parent company, executed and delivered an absolute and unconditional guaranty of the performance of all of the obligations of Liberty under the Stock Purchase Agreement. The Stock Purchase is subject to various conditions, including obtaining approvals and satisfying or waiving other closing conditions. The Stock Purchase Agreement has an initial termination date of June 30, 2021. Either party may extend the agreement beyond June 30, 2021, and the Company intends to extend the agreement, if necessary, provided all of the conditions to closing have been or are capable of being met, other than obtaining regulatory approvals. If not otherwise extended, the ultimate termination date is December 31, 2021. Liberty may also terminate the Stock Purchase Agreement if any governmental authority initiates a condemnation or eminent domain proceeding against a majority of the consolidated properties of the New York subsidiary, taken as a whole. The assets and related liabilities of the New York subsidiary were classified as held for sale on the Consolidated Balance Sheets as of December 31, 2020.
Presented in the table below are the components of assets held for sale and liabilities related to assets held for sale of the New York subsidiary as of December 31, 2020:
| | | | | |
| December 31, 2020 |
Property, plant and equipment | $ | 504 | |
Current assets | 12 | |
Regulatory assets | 64 | |
Goodwill | 39 | |
Other assets | 10 | |
Assets held for sale | $ | 629 | |
Current liabilities | 14 | |
Deferred income taxes | 69 | |
Regulatory liabilities | 42 | |
Other liabilities | 12 | |
Liabilities related to assets held for sale | $ | 137 | |
Market-Based Businesses
Pivotal Acquisition
On June 4, 2018, the Company, through its wholly owned subsidiary American Water Enterprises, LLC, completed the acquisition of Pivotal for a total purchase price of $365 million, net of cash received. Pivotal is complementary to the Company’s HOS product offerings and enhances its presence in the home warranty solutions markets through utility partnerships. The results of Pivotal have been consolidated into the HOS non-reportable operating segment.
Divestitures
On December 12, 2019, American Industrial Water LLC, a wholly owned subsidiary of the Company (“AIW”), sold all of the outstanding membership interests in Water Solutions Holdings, LLC (“WSH”), which was a wholly owned subsidiary of AIW, to a natural gas and oil industry investment group, for total cash consideration of $31 million. WSH was the parent company of Keystone Clearwater Solutions, LLC (“Keystone”). Keystone provided water transportation services to shale natural gas exploration and production customers in the Appalachian Basin. As a result of the sale, the Company recorded a pre-tax loss on sale of $44 million, or $35 million after-tax, during the fourth quarter of 2019.
The pro forma impact of the Company’s acquisitions was not material to the Consolidated Statements of Operations for the years ended December 31, 2020, 20192023, 2022 and 2018.2021.
Pending Acquisitions
On April 6, 2023, the Company’s Illinois subsidiary entered into an agreement to acquire the wastewater treatment plant from Granite City for an amended purchase price of $86 million. This plant provides wastewater service for approximately 26,000 customer connections. The Company expects to close this acquisition in the first quarter of 2024.
Effective March 24, 2023, the Company’s Pennsylvania subsidiary acquired the rights to buy the wastewater system assets of the Township of Towamencin, for an aggregate purchase price of $104 million, subject to adjustment as provided in the asset purchase agreement. This system provides wastewater services to approximately 6,300 customer connections in seven townships in Montgomery County, Pennsylvania. The Company expects to close this acquisition in late 2024 or early 2025, pending final regulatory approval.
On October 11, 2022, the Company’s Pennsylvania subsidiary entered into an agreement to acquire the public wastewater collection and treatment system assets (the “System Assets”) from the Butler Area Sewer Authority. On November 9, 2023, the PaPUC approved a settlement agreement without modification with respect to the Company’s Pennsylvania subsidiary’s application to acquire the System Assets from the Butler Area Sewer Authority for a purchase price of $230 million, subject to adjustment as provided for in the asset purchase agreement. This system provides wastewater service for approximately 15,000 customer connections. On December 14, 2023, Center Township and Summit Township filed appeals with the Pennsylvania Commonwealth Court seeking to reverse the order entered by the PaPUC approving the sale of the System Assets. On December 29, 2023, the Company’s Pennsylvania subsidiary filed applications with the Commonwealth Court seeking to dismiss the appeals and requesting expedited consideration. By order dated February 1, 2024, the Commonwealth Court deferred deciding the application to dismiss the appeals and directed that the issues raised by the applications to dismiss are to be considered as part of the merits of the appeals. The order also granted expedited consideration and directed the case to be included on the next available list and established a briefing schedule. Based on the court’s schedule, the Company estimates that the disposition of the appeals could occur as soon as the second quarter of 2024.
Sale of New York American Water Company, Inc.
On January 1, 2022, the Company completed the previously disclosed sale of its regulated utility operations in New York to Liberty Utilities (Eastern Water Holdings) Corp. (“Liberty”), an indirect, wholly owned subsidiary of Algonquin Power & Utilities Corp. Liberty purchased from the Company all of the capital stock of the Company’s New York subsidiary for a purchase price of $608 million in cash. The Company’s regulated New York operations represented approximately 127,000 customers in the State of New York.
Sale of Michigan American Water Company
On February 4, 2022, the Company completed the sale of its operations in Michigan for $6 million in cash.
Sale of Homeowner Services Group
On December 9, 2021 (the “Closing Date”), the Company sold all of the equity interests in subsidiaries that comprised HOS to a wholly owned subsidiary (the “Buyer”) of funds advised by Apax Partners LLP, a global private equity advisory firm, for total consideration of approximately $1.275 billion, resulting in pre-tax gain of $748 million. The consideration at closing was comprised of $480 million in cash, a secured seller promissory note payable in cash and issued by the Buyer in the principal amount of $720 million, with an interest rate of 7.00% per year, and a contingent cash payment of $75 million payable upon satisfaction of certain conditions on or before December 31, 2023. For the year ended December 31, 2022, the Company recorded post-closing adjustments, primarily related to working capital, of pre-tax income of $20 million, which is included in Gain on sale of businesses on the Consolidated Statements of Operations. The Company recognized $50 million of interest income during the years ended December 31, 2023 and 2022, from the secured seller note.
On February 2, 2024, the secured seller note was amended to increase the principal amount from $720 million to $795 million, in full satisfaction of the $75 million contingent cash payment payable under the HOS sale agreement. In addition, the interest rate payable on the secured seller note has increased from 7.00% per year to 10.00% per year until maturity. The secured seller note requires compliance with affirmative and negative covenants (subject to certain conditions, limitations and exceptions), including a covenant limiting the incurrence by the Buyer and certain affiliates of additional indebtedness in excess of certain thresholds, but does not include any financial maintenance covenants. Certain of these covenants have been amended, including to provide for annual reductions of specified debt incurrence ratios. Furthermore, the amendment to the secured seller note eliminated the conditional right, beginning December 9, 2024, to require a repayment, without premium or penalty, of 100% of the outstanding principal amount in full in cash together with all accrued and unpaid interest and other obligations thereunder. The final maturity date of the secured seller note remains December 9, 2026. The $75 million additional principal under the secured seller note must be repaid in full, without premium or penalty, in the event a proposed acquisition of a complementary business by or on behalf of an affiliate of the Buyer is not completed by May 2, 2024. The repayment obligations of the Buyer under the seller note are secured by a first priority security interest in certain property of the Buyer and the former HOS subsidiaries, including their cash and securities accounts, as well as a pledge of the equity interests in each of those subsidiaries, subject to certain limitations and exceptions.
The secured seller note may not be prepaid at the Buyer’s election except in certain limited circumstances before the fourth anniversary of the Closing Date. If the Buyer seeks to repay the secured seller note in breach of this non-call provision, an event of default will occur under the secured seller note and the Company may, among other actions, demand repayment in full together with a premium ranging from 105.5% to 107.5% of the outstanding principal amount of the loan and a customary “make-whole” payment.
Note 7:6: Property, Plant and Equipment
Presented in the table below are the major classes of property, plant and equipment by category as of December 31:
| | | | | | | | | | | | | | | | | | | | | | | |
| 2020 | | 2019 | | Range of Remaining Useful Lives | | Weighted Average Useful Life |
| Utility plant: | | | | | | | |
| Land and other non-depreciable assets | $ | 174 | | | $ | 166 | | | | | |
| Sources of supply | 897 | | | 858 | | | 2 to 127 years | | 47 years |
| Treatment and pumping facilities | 3,984 | | | 3,750 | | | 3 to 111 years | | 41 years |
| Transmission and distribution facilities | 11,457 | | | 10,807 | | | 9 to 149 years | | 69 years |
| Services, meters and fire hydrants | 4,555 | | | 4,304 | | | 5 to 90 years | | 31 years |
| General structures and equipment | 2,003 | | | 1,748 | | | 1 to 109 years | | 16 years |
| Waste collection | 1,288 | | | 1,153 | | | 5 to 113 years | | 59 years |
| Waste treatment, pumping and disposal | 859 | | | 720 | | | 2 to 139 years | | 47 years |
| Construction work in progress | 837 | | | 801 | | | | | |
Less: Utility plant included in assets held for sale (a) | (646) | | | (587) | | | | | |
| Total utility plant | 25,408 | | | 23,720 | | | | | |
| Nonutility property | 211 | | | 226 | | | 3 to 50 years | | 8 years |
Less: Nonutility plant included in assets held for sale (a) | (5) | | | (5) | | | | | |
| Total property, plant and equipment | $ | 25,614 | | | $ | 23,941 | | | | | |
(a)This property, plant and equipment is related to the pending transactions contemplated by the Stock Purchase Agreement and is included in assets held for sale on the Consolidated Balance Sheets. See Note 6—Acquisitions and Divestitures for additional information. | | | | | | | | | | | | | | | | | | | | | | | | |
| 2023 | | 2022 | | Range of Remaining Useful Lives | | Weighted Average Useful Life | |
| Utility plant: | | | | | | | | |
| Land and other non-depreciable assets | $ | 293 | | | $ | 239 | | | | | | |
| Sources of supply | 1,081 | | | 1,003 | | | 10 to 127 years | | 46 years | |
| Treatment and pumping facilities | 4,594 | | | 4,298 | | | 3 to 101 years | | 39 years | |
| Transmission and distribution facilities | 13,900 | | | 12,971 | | | 6 to 128 years | | 68 years | |
| Services, meters and fire hydrants | 5,696 | | | 5,162 | | | 5 to 90 years | | 32 years | |
| General structures and equipment | 2,512 | | | 2,289 | | | 1 to 109 years | | 16 years | |
| Waste collection | 1,719 | | | 1,539 | | | 5 to 113 years | | 57 years | |
| Waste treatment, pumping and disposal | 1,191 | | | 1,129 | | | 2 to 153 years | | 37 years | |
| Construction work in progress | 1,040 | | | 974 | | | | | | |
| Other plant | 24 | | | 23 | | | | | | |
| Total utility plant | 32,050 | | | 29,627 | | | | | | |
| Nonutility property | 139 | | | 109 | | | 3 to 50 years | | 12 years | |
| Total property, plant and equipment | $ | 32,189 | | | $ | 29,736 | | | | | | |
Property, plant and equipment depreciation expense amounted to $520$617 million, $508$552 million and $497$550 million for the years ended December 31, 2020, 20192023, 2022 and 2018,2021, respectively and was included in depreciation and amortization expense on the Consolidated Statements of Operations. The provision for depreciation expressed as a percentage of the aggregate average depreciable asset balances was 2.82%2.68%, 2.96%2.60% and 3.09%2.77% for the years ended December 31, 2020, 20192023, 2022 and 2018,2021, respectively. Additionally, the Company had capital expenditures acquired on account but unpaid of $221$399 million and $235$330 million included in accrued liabilities on the Consolidated Balance Sheets as of December 31, 20202023 and 2019,2022, respectively.
In 2019, the Company completed and submitted its project completion certification to the New Jersey Economic Development Authority (“NJEDA”) in connection with itsthe Company’s capital investment in its corporate headquarters in Camden, New Jersey. The NJEDA hasJersey, the New Jersey Economic Development Authority (“NJEDA”) determined that the Company iswas qualified to receive $164$161 million in tax credits over a ten year10-year period.
The Company is required to meet various annual requirements, including the maintenance of qualified full-time positions at the qualified business facility, in order to monetize one-tenth of the tax credits annually and is subject to a claw-back period if the Company does not meet certain NJEDA requirements of the tax credit program in years 11 through 15.
In December 2022 and March 2023, the NJEDA issued the utilization certificates for the 2019 and 2020 tax credits, respectively, to the Company in the amount of $16 million each. The Company sold these tax credits to external parties for $15 million each. The loss on the sales of the tax credits was recorded to Other income (expense) in the Consolidated Statements of Operations for the years ended December 31, 2023 and 2022. As a result,of December 31, 2023 and 2022, the Company had receivablesassets of $33$32 million and $131$48 million, respectively, in other current assets and $90 million and $97 million, respectively, in other long-term assets respectively, on the Consolidated Balance Sheets as a result of these tax credits. In 2023, the Company reduced net realizable value of the future tax credit receivable by approximately $7 million as the Company does not expect it will be eligible for the full amount of the tax credit resulting from lower than required eligible headcount in the future. In January 2024, the NJEDA issued the utilization certificate for the 2021 tax credit to the Company in the amount of $16 million. The Company sold this tax credit to an external party for $15 million. The loss on the sale of the tax credit will be recorded to Other income (expense) in the Consolidated Statements of Operations for the year ended December 31, 2020. In March 2020,2024. The Company has made the necessary annual filing for the year ended December 31, 2022, and expects to make the 2023 filing in connection withApril 2024, prior to the COVID-19 pandemic,required filing deadline. The submitted filing is under review by the NJEDA pursuant to Executive Order 103 - State of Emergency and a Public Health Emergency effective immediately (“EO-103”), temporarily waived the requirement that a full-time employee must spend at least 80% of his or her time at the qualified business facility to meet the definition of eligible position or full-time job. The waiver remains in effect for the period of timeit is expected that the EO-103 isCompany will receive final NJEDA approval and monetize the credits in effect.2024.
Note 8:7: Allowance for Uncollectible Accounts
Presented in the table below are the changes in the allowances for uncollectible accounts for the years ended December 31:
| | | 2020 | | 2019 | | 2018 |
| 2023 | | | 2023 | | 2022 | | 2021 |
| Balance as of January 1 | Balance as of January 1 | $ | (41) | | | $ | (45) | | | $ | (42) | |
| Amounts charged to expense | Amounts charged to expense | (34) | | | (28) | | | (33) | |
| Amounts written off | Amounts written off | 12 | | | 32 | | | 34 | |
| Recoveries of amounts written off | 0 | | | 0 | | | (4) | |
| Less: Allowance for uncollectible accounts included in assets held for sale (a) | 3 | | | 0 | | | 0 | |
| Other, net (a) | |
| Balance as of December 31 | Balance as of December 31 | $ | (60) | | | $ | (41) | | | $ | (45) | |
(a)This portion of the allowance for uncollectible accounts is primarily related to COVID-19 related regulatory asset activity. The 2021 activity also includes the pending transactions contemplated byportion of the Stock Purchase Agreement among the Company,allowance related to the Company’s New York subsidiary, and an affiliate of Liberty Utilities Co., and is included in assets held for salewhich was sold on the Consolidated Balance Sheets.January 1, 2022. See Note 6—5—Acquisitions and Divestitures for additional information.
Note 9:8: Goodwill and Other Intangible Assets
Goodwill
Presented in the table below are the changes in the carrying value of goodwill for the years ended December 31, 20202023 and 2019:2022:
| | | | | | | | | | | | | | | | | | | | | | | | | | | | | | | | | | | | | | | | | |
| | Regulated Businesses | | Market-Based Businesses | | Consolidated |
| | Cost | | Accumulated Impairment | | Cost | | Accumulated Impairment | | Cost | | Accumulated Impairment | | Total Net |
| Balance as of January 1, 2019 | $ | 3,494 | | | $ | (2,332) | | | $ | 574 | | | $ | (161) | | | $ | 4,068 | | | $ | (2,493) | | | $ | 1,575 | |
| Goodwill from acquisitions | 3 | | | — | | | — | | | — | | | 3 | | | — | | | 3 | |
| Goodwill reduced through sale of Keystone operations | — | | | — | | | (91) | | | 53 | | | (91) | | | 53 | | | (38) | |
| Less: Goodwill included in assets held for sale (a) | (39) | | | — | | | — | | | | | (39) | | | — | | | (39) | |
| Balance as of December 31, 2019 | $ | 3,458 | | | $ | (2,332) | | | $ | 483 | | | $ | (108) | | | $ | 3,941 | | | $ | (2,440) | | | $ | 1,501 | |
| Goodwill from acquisitions | 5 | | | — | | | — | | | — | | | 5 | | | — | | | 5 | |
| Measurement period adjustments | (2) | | | — | | | — | | | — | | | (2) | | | — | | | (2) | |
| Balance as of December 31, 2020 | $ | 3,461 | | | $ | (2,332) | | | $ | 483 | | | $ | (108) | | | $ | 3,944 | | | $ | (2,440) | | | $ | 1,504 | |
(a)This goodwill is related to the pending transactions contemplated by the Stock Purchase Agreement and is included in assets held for sale on the Consolidated Balance Sheets as of December 31, 2020 and 2019. See Note 6—Acquisitions and Divestitures for additional information.
In 2020, the Company acquired goodwill of $5 million associated with 2 of its acquisitions in the Regulated Businesses segment. See Note 6—Acquisitions and Divestitures for additional information. | | | | | | | | | | | | | | | | | | | | | | | | | | | | | | | | | | | | | | | | | |
| | Regulated Businesses | | Other | | Consolidated |
| Cost | | Accumulated Impairment | | Cost | | Accumulated Impairment | | Cost | | Accumulated Impairment | | Total Net |
| Balance as of January 1, 2022 | $ | 3,466 | | | $ | (2,332) | | | $ | 113 | | | $ | (108) | | | $ | 3,579 | | | $ | (2,440) | | | $ | 1,139 | |
| Goodwill from acquisitions | 4 | | | — | | | — | | | — | | | 4 | | | — | | | 4 | |
| Balance as of December 31, 2022 | $ | 3,470 | | | $ | (2,332) | | | $ | 113 | | | $ | (108) | | | $ | 3,583 | | | $ | (2,440) | | | $ | 1,143 | |
| Goodwill from acquisitions | — | | | — | | | — | | | — | | | — | | | — | | | — | |
| Balance as of December 31, 2023 | $ | 3,470 | | | $ | (2,332) | | | $ | 113 | | | $ | (108) | | | $ | 3,583 | | | $ | (2,440) | | | $ | 1,143 | |
The Company completed its annual impairment testing of goodwill as of November 30, 2020,2023, which included qualitative assessments of its Regulated Businesses HOS and MSG reporting units. Based on these assessments, the Company determined that there were no factors present that would indicate that the fair value of these reporting units was less than their respective carrying values as of November 30, 2020.2023.
In 2019,2023, there were no additions or impairments to the Company’s goodwill.
In 2022, the Company acquired goodwill of $3$4 million associated with 3one of its acquisitions in the Regulated Businesses segment. Additionally, as part of the sale of the Company’s Keystone operations on December 12, 2019, the Company reduced goodwill, net, by $38 million.
Intangible Assets
The Company held finite-lived intangible assets, including customer relationships and other intangible assets as of December 31, 2020. The gross carrying value of customer relationships and other intangible assets was $78 million and $13 million, respectively, as of December 31, 2020 and 2019. Accumulated amortization of customer relationships and other intangible assets was $20 million and $4 million, respectively, as of December 31, 2019. Amortization expense related to customer relationships and other intangible assets was $9 million and $3 million, respectively, for the year ended December 31, 2020. The net book value of customer relationships and other intangible assets was $49 million and $6 million, respectively, as of December 31, 2020.
Intangible asset amortization expense amounted to $12 million, $14 million and $12 million for the years ended December 31, 2020, 2019 and 2018, respectively. Estimated amortization expense for the next five years subsequent to December 31, 2020 is as follows:
| | | | | |
| Amount |
| 2021 | $ | 10 | |
| 2022 | 8 | |
| 2023 | 6 | |
| 2024 | 5 | |
| 2025 | 4 | |
Note 10:9: Shareholders’ Equity
Common Stock Offering
On March 3, 2023, the Company completed an underwritten public offering of an aggregate of 12,650,000 shares of parent company common stock. Upon closing of this offering, the Company received, after deduction of the underwriting discount and before deduction of offering expenses, net proceeds of approximately $1,688 million. The Company used the net proceeds of the offering to repay short-term commercial paper obligations of American Water Capital Corp. (“AWCC”), the wholly owned finance subsidiary of parent company, and for general corporate purposes.
Dividend Reinvestment and Direct Stock Purchase Plan
Under the Company’s dividend reinvestment and direct stock purchase plan (the “DRIP”), shareholders may reinvest cash common stock dividends and purchase additional shares of Company common stock, up to certain limits, through the plan administrator without paying brokerage commissions. Shares purchased by participants through the DRIP may be newly issued shares, treasury shares, or at the Company’s election, shares purchased by the plan administrator in the open market or in privately negotiated transactions. Purchases generally will be made and credited to DRIP accounts once each week. As of December 31, 2020,2023, there were approximately 4.24.1 million shares available for future issuance under the DRIP.
Anti-dilutive Stock Repurchase Program
In February 2015, the Company’s Board of Directors authorized an anti-dilutive stock repurchase program, which allows the Company to purchase up to 10 million shares of its outstanding common stock from time to time over an unrestricted period of time. The Company did 0tnot repurchase shares of common stock during the yearyears ended December 31, 2020. The Company repurchased 0.4 million shares of common stock in the open market at an aggregate cost of $36 million under this program for the year ended December 31, 2019.2023 and 2022. As of December 31, 2020,2023, there were 5.1 million shares of common stock available for purchase under the program.
Accumulated Other Comprehensive Loss
Presented in the table below are the changes in accumulated other comprehensive loss by component, net of tax, for the years ended December 31, 20202023 and 2019:2022:
| | | | Defined Benefit Plans | | Foreign Currency Translation | | Gain (Loss) on Cash Flow Hedge | | Accumulated Other Comprehensive Loss | | Defined Benefit Plans | | Gain (Loss) on Cash Flow Hedge | | Gain (Loss) on Fixed-Income Securities | | Accumulated Other Comprehensive Loss |
| | Employee Benefit Plan Funded Status | | Amortization of Prior Service Cost | | Amortization of Actuarial Loss | |
| Beginning balance as of January 1, 2019 | $ | (102) | | | $ | 1 | | | $ | 56 | | | $ | 1 | | | $ | 10 | | | $ | (34) | |
| Other comprehensive income (loss) before reclassification | 8 | | | — | | | — | | | — | | | (13) | | | (5) | |
| Amounts reclassified from accumulated other comprehensive loss | — | | | — | | | 4 | | | (1) | | | — | | | 3 | |
| Net other comprehensive income | 8 | | | — | | | 4 | | | (1) | | | (13) | | | (2) | |
| Ending balance as of December 31, 2019 | $ | (94) | | | $ | 1 | | | $ | 60 | | | $ | 0 | | | $ | (3) | | | $ | (36) | |
| Employee Benefit Plan Funded Status | |
| Beginning balance as of January 1, 2022 | |
| Beginning balance as of January 1, 2022 | |
| Beginning balance as of January 1, 2022 | |
| Other comprehensive income (loss) before reclassification | Other comprehensive income (loss) before reclassification | (12) | | | — | | | — | | | — | | | (4) | | | (16) | |
| Amounts reclassified from accumulated other comprehensive loss | Amounts reclassified from accumulated other comprehensive loss | — | | | — | | | 3 | | | — | | | — | | | 3 | |
| Net other comprehensive income (loss) | Net other comprehensive income (loss) | (12) | | | — | | | 3 | | | 0 | | | (4) | | | (13) | |
| Ending balance as of December 31, 2020 | $ | (106) | | | $ | 1 | | | $ | 63 | | | $ | 0 | | | $ | (7) | | | $ | (49) | |
| Ending balance as of December 31, 2022 | |
| Other comprehensive income (loss) before reclassification | |
| Amounts reclassified from accumulated other comprehensive loss | |
| Net other comprehensive income (loss) | |
| Ending balance as of December 31, 2023 | |
The Company does not reclassify the amortization of defined benefit pension cost components from accumulated other comprehensive loss directly to net income in its entirety, as a portion of these costs have been deferred as a regulatory asset. These accumulated other comprehensive loss components are included in the computation of net periodic pension cost. See Note 16—15—Employee Benefits for additional information.
The amortization of the gain (loss) on cash flow hedges is reclassified to net income during the period incurred and is included in interest, net in the accompanying Consolidated Statements of Operations.
Dividends and Distributions
The Company’s Board of Directors authorizes the payment of dividends. The Company’s ability to pay dividends on its common stock is subject to having access to sufficient sources of liquidity, net income and cash flows of the Company’s subsidiaries, the receipt of dividends and direct and indirect distributions from, and repayments of indebtedness of, the Company’s subsidiaries, compliance with Delaware corporate and other laws, compliance with the contractual provisions of debt and other agreements and other factors.
The Company’s dividend rate on its common stock is determined by the Board of Directors on a quarterly basis and takes into consideration, among other factors, current and possible future developments that may affect the Company’s income and cash flows. When dividends on common stock are declared, they are typically paid in March, June, September and December. Historically, dividends have been paid quarterly to holders of record as of a date less than 30 days prior to the distribution date. Since the dividends on the Company’s common stock are not cumulative, only declared dividends are paid.
During 2020, 20192023, 2022 and 2018,2021, the Company paid $389$532 million, $353$467 million and $319$428 million in cash dividends, respectively. Presented in the table below is the per share cash dividends paid for the years ended December 31:
| | 2020 | | 2019 | | 2018 |
| 2023 | | | 2023 | | 2022 | | 2021 |
| December | December | $ | 0.55 | | | $ | 0.50 | | | $ | 0.455 | |
| September | September | $ | 0.55 | | | $ | 0.50 | | | $ | 0.455 | |
| June | June | $ | 0.55 | | | $ | 0.50 | | | $ | 0.455 | |
| March | March | $ | 0.50 | | | $ | 0.455 | | | $ | 0.415 | |
On December 10, 2020,6, 2023, the Company’s Board of Directors declared a quarterly cash dividend payment of $0.55$0.7075 per share payable on March 2, 2021,1, 2024, to shareholders of record as of February 8, 2021.2024.
Under applicable law, the Company’s subsidiaries may pay dividends on their capital stock or other equity only from retained, undistributed or current earnings. A significant loss recorded at a subsidiary may limit the amount of the dividend that the subsidiary can pay. The ability of the Company’s subsidiaries to pay upstream dividends, make other upstream distributions or repay indebtedness to parent company or American Water Capital Corp. (“AWCC”),AWCC, the Company’s wholly owned financing subsidiary, as applicable, is subject to compliance with applicable corporate, tax and other laws, regulatory restrictions and financial and other contractual obligations, including, for example, (i) regulatory capital, surplus or net worth requirements, (ii) outstanding debt service obligations, (iii) requirements to make preferred and preference stock dividend payments, and (iv) other contractual agreements, covenants or obligations made or entered into by the Company and its subsidiaries.
Regulatory Restrictions on Indebtedness
The issuance of long-term debt or equity securities by the Company or long-term debt by AWCC does not require authorization of any state PUC if no guarantee or pledge of the regulated subsidiaries is utilized. Based on the needs of the Regulated Businesses and parent company, AWCC may borrow funds or issue its debt in the capital markets and then, through intercompany loans, provide these borrowings to the Regulated Businesses or parent company. PUC authorization is generally required for the regulated subsidiaries to incur long-term debt. The Company’s regulated subsidiaries normally obtain these required PUC authorizations on a periodic basis to cover their anticipated financing needs for a period of time, or, as necessary, in connection with a specific financing or refinancing of debt.
Note 11:10: Stock Based Compensation
The Company has granted stock options,units, stock unitsawards and dividend equivalents to non-employee directors, officers and other key employees of the Company pursuant to the terms of its 2007the 2017 Omnibus Equity Compensation Plan (the “2007“2017 Omnibus Plan”)., approved by the Company’s shareholders in May 2017. Stock units under the 20072017 Omnibus Plan generally vest based on (i) continued employment with the Company (“RSUs”), or (ii) continued employment with the Company where distribution of the shares is subject to the satisfaction in whole or in part of stated performance-based goals (“PSUs”). The 2007 Plan has been replaced by the 2017 Omnibus Plan, as defined below, and no additional awards may be granted under the 2007 Plan. However, shares may still be issued under the 2007 Plan pursuant to the terms of awards previously issued under that plan prior to May 12, 2017.
In May 2017, the Company’s shareholders approved the American Water Works Company, Inc. 2017 Omnibus Equity Compensation Plan (the “2017 Omnibus Plan”). The Company has granted stock units, including RSUs and PSUs, stock awards and dividend equivalents to non-employee directors, officers and employees under the 2017 Omnibus Plan. A total of 7.2 million shares of common stock may be issued under the 2017 Omnibus Plan. As of December 31, 2020, 6.72023, 6.1 million shares were available for grant under the 2017 Omnibus Plan. The 2017 Omnibus Plan provides that grants of awards may be in any of the following forms: incentive stock options, nonqualified stock options, stock appreciation rights, stock units, stock awards, other stock-based awards and dividend equivalents. Dividend equivalents may be granted only on stock units or other stock-based awards. The 2017 Omnibus Plan expires in 2027.
The Company had granted stock options, stock units, including RSUs and PSUs, and dividend equivalents to non-employee directors, officers and other key employees of the Company under its 2007 Omnibus Equity Compensation Plan (the “2007 Plan”). The 2007 Plan has been replaced by the 2017 Omnibus Plan, as defined above, and no additional awards may be granted under the 2007 Plan. However, shares may still be issued under the 2007 Plan pursuant to the terms of awards previously issued under that plan prior to May 12, 2017.
The cost of services received from employees in exchange for the issuance of stock options and restricted stock awards is measured based on the grant date fair value of the awards issued. The value of stock options and stock unit awards at the date of the grant is amortized through expense over the requisite service period. All awards granted in 2020, 20192023, 2022 and 20182021 are classified as equity. The Company recognizes compensation expense for stock awards over the vesting period of the award. The Company stratified its grant populations and used historic employee turnover rates to estimate employee forfeitures. The estimated rate is compared to the actual forfeitures at the end of the reporting period and adjusted as necessary. There have been no significant adjustments to the forfeiture rates during 2020, 20192023, 2022 and 2018.2021. There were no grants of stock options to employees after 2016, and the remainingthere were no stock options outstanding as of December 31, 2020 were not material.2022. Presented in the table below is the stock-based compensation expense recorded in O&M expense in the accompanying Consolidated Statements of Operations for the years ended December 31:
| | | 2020 | | 2019 | | 2018 |
| 2023 | | | 2023 | | 2022 | | 2021 |
| RSUs and PSUs | RSUs and PSUs | $ | 19 | | | $ | 15 | | | $ | 15 | |
| Nonqualified employee stock purchase plan | Nonqualified employee stock purchase plan | 2 | | | 2 | | | 1 | |
| Stock-based compensation | Stock-based compensation | 21 | | | 17 | | | 16 | |
| Income tax benefit | Income tax benefit | (5) | | | (4) | | | (5) | |
| Stock-based compensation expense, net of tax | Stock-based compensation expense, net of tax | $ | 16 | | | $ | 13 | | | $ | 11 | |
There were 0no significant stock-based compensation costs capitalized during the years ended December 31, 2020, 20192023, 2022 and 2018.2021.
Subject to limitations on deductibility imposed by the Federal income tax code, the Company receives a tax deduction based on the intrinsic value of the award at the exercise date for stock options and the distribution date for stock units. For each award, throughout the requisite service period, the Company records the tax impacts related to compensation costs as deferred income tax assets. The tax deductions in excess of the deferred benefits recorded throughout the requisite service period are recorded to the Consolidated Statements of Operations and are presented in the financing section of the Consolidated Statements of Cash Flows.
Stock Units
During 2020, 20192023, 2022 and 2018,2021, the Company granted RSUs to certain employees under the 2017 Omnibus Plan. RSUs generally vest based on continued employment with the Company over periods ranging from one to three years. The RSUs are valued at the closing price of the Company’s common stock on the date of the grant and the majority vest ratably over a three-year service period. These RSUs are amortized through expense over the requisite service period using the straight-line method.
During 2020, 20192023, 2022 and 2018,2021, the Company granted stock units to non-employee directors under the 2017 Omnibus Plan. The stock units were vested in full on the date of grant; however, distribution of the shares will be made within 30 days of the earlier of (i) 15 months after the date of the last annual meeting of shareholders, subject to any deferral election by the director, or (ii) the participant’s separation from service. Because these stock units vested on the grant date, the total grant date fair value was recorded in operation and maintenance expense on the grant date.
The RSUs are valued at the closing price of the Company’s common stock on the date of the grant and the majority vest ratably over a three-year service period. These RSUs are amortized through expense over the requisite service period using the straight-line method.
Presented in the table below is RSU and director stock unit activity for the year ended December 31, 2020:2023:
| | | Shares (in thousands) | | Weighted Average Grant Date Fair Value (per share) |
| Non-vested total as of December 31, 2019 | 118 | | | $ | 85.41 | |
| Shares (in thousands) | | | Shares (in thousands) | | Weighted Average Grant Date Fair Value (per share) |
| Non-vested total as of December 31, 2022 | |
| Granted | Granted | 55 | | | 129.39 | |
| Vested | Vested | (71) | | | 98.67 | |
| Forfeited | Forfeited | (10) | | | 97.24 | |
| Non-vested total as of December 31, 2020 | 92 | | | $ | 100.39 | |
| Non-vested total as of December 31, 2023 | |
As of December 31, 2020, $42023, $6 million of total unrecognized compensation cost related to the nonvested RSUs is expected to be recognized over the weighted average remaining life of 1.341.55 years. The total fair value of stock units and RSUs vested was $5$6 million, $4$6 million and $4$9 million for the years ended December 31, 2020, 20192023, 2022 and 2018,2021, respectively.
During 2020, 20192023, 2022 and 2018,2021, the Company granted PSUs to certain employees under the 2017 Omnibus Plan. The majority of PSUs vest ratably based on continued employment with the Company over the three-yearthree-year performance period (the “Performance Period”). Distribution of the performance shares is contingent upon the achievement of one or more internal performance measures and, separately, a relative total shareholder return performance measure, over the Performance Period.
Presented in the table below is PSU activity for the year ended December 31, 2020:2023:
| | | Shares (in thousands) | | Weighted Average Grant Date Fair Value (per share) |
| Non-vested total as of December 31, 2019 | 316 | | | $ | 83.89 | |
| Shares (in thousands) | | | Shares (in thousands) | | Weighted Average Grant Date Fair Value (per share) |
| Non-vested total as of December 31, 2022 | |
| Granted | Granted | 149 | | | 116.27 | |
| Vested | Vested | (160) | | | 72.13 | |
| Forfeited | Forfeited | (12) | | | 108.36 | |
| Non-vested total as of December 31, 2020 | 293 | | | $ | 105.70 | |
| Non-vested total as of December 31, 2023 | |
As of December 31, 2020, $42023, $9 million of total unrecognized compensation cost related to the nonvested PSUs is expected to be recognized over the weighted average remaining life of 0.920.84 years. The total fair value of PSUs vested was $18$31 million, $14$24 million and $12$22 million for the years ended December 31, 2020, 20192023, 2022 and 2018,2021, respectively.
PSUs granted with one or more internal performance measures are valued at the market value of the closing price of the Company’s common stock on the date of grant. PSUs granted with a relative total shareholder return condition are valued using a Monte Carlo simulation model. Expected volatility is based on historical volatilities of traded common stock of the Company and comparative companies using daily stock prices over the past three years. The expected term is three years and the risk-free interest rate is based on the three-year U.S. Treasury rate in effect as of the measurement date. Presented in the table below are the weighted average assumptions used in the Monte Carlo simulation and the weighted average grant date fair values of PSUs granted for the years ended December 31:
| | | | 2020 | | 2019 | | 2018 | | 2023 | | 2022 | | 2021 |
| Expected volatility | Expected volatility | 16.65% | | 16.80% | | 17.23% | Expected volatility | 25.45% | | 29.69% | | 28.59% |
| Risk-free interest rate | Risk-free interest rate | 1.28% | | 2.47% | | 2.36% | Risk-free interest rate | 4.31% | | 1.90% | | 0.22% |
| Expected life (years) | Expected life (years) | 3.0 | | 3.0 | | 3.0 | Expected life (years) | 3.0 | | 3.0 |
| Grant date fair value per share | Grant date fair value per share | $159.64 | | $110.37 | | $73.62 | Grant date fair value per share | $168.00 | | $99.23 | | $229.22 |
The grant date fair value of PSUs that vest ratably and have market and/or performance conditions are amortized through expense over the requisite service period using the graded-vesting method.
Employee Stock Purchase Plan
The Company maintains a nonqualified employee stock purchase plan (the “ESPP”) that expires in 2027 through which employee participants (other than(which excludes certain of the Company’s executive officers)executives) may use payroll deductions to acquire Company common stock at a purchase price of 85% of the fair market value of the common stock at the end of a three-month purchase period. A total of 2.0 million shares may be issued under the ESPP, and as of December 31, 2020,2023, there were 1.71.5 million shares of common stock reserved for issuance under the ESPP. The ESPP is considered compensatory. During the years ended December 31, 2020, 20192023, 2022 and 2018,2021, the Company issued 86 thousand, 88 thousandapproximately 87,000, 82,000 and 95 thousand80,000 shares, respectively, under the ESPP.
Note 12:11: Long-Term Debt
The Company obtains long-term debt through AWCC primarily to fund capital expenditures of the Regulated Businesses and to lend funds to parent company to refinance debt and for other purposes. Presented in the table below are the components of long-term debt as of December 31:
| | Rate | | Weighted Average Rate | | Maturity | | 2020 | | 2019 |
| Rate | | | Rate | | Weighted Average Rate | | Maturity | | 2023 | | 2022 |
Long-term debt of AWCC: (a) | Long-term debt of AWCC: (a) | | | | | | | | | | Long-term debt of AWCC: (a) | | | | | | | |
| Senior notes—fixed rate | Senior notes—fixed rate | 2.80%-8.27% | | 4.05% | | 2021-2050 | | $ | 8,191 | | | $ | 7,191 | |
| Private activity bonds and government funded debt—fixed rate | Private activity bonds and government funded debt—fixed rate | 0.60%-2.90% | | 1.64% | | 2021-2031 | | 191 | | | 191 | |
| Long-term debt of other American Water subsidiaries: | Long-term debt of other American Water subsidiaries: | | | | | | | Long-term debt of other American Water subsidiaries: | | | | | | | | | |
| Private activity bonds and government funded debt—fixed rate | Private activity bonds and government funded debt—fixed rate | 0.00%-5.50% | | 1.74% | | 2021-2048 | | 735 | | | 724 | |
| Mortgage bonds—fixed rate | Mortgage bonds—fixed rate | 6.35%-9.69% | | 7.48% | | 2021-2039 | | 565 | | | 578 | |
| Mandatorily redeemable preferred stock | Mandatorily redeemable preferred stock | 8.47%-9.75% | | 8.57% | | 2024-2036 | | 5 | | | 7 | |
| Finance lease obligations | 12.25% | | 12.25% | | 2026 | | 1 | | | 1 | |
| Long-term debt | Long-term debt | | | | | | | 9,688 | | | 8,692 | |
Unamortized debt (discount) premium, net (b) | | (4) | | | 1 | |
Unamortized debt discount, net (b) | |
| Unamortized debt issuance costs | Unamortized debt issuance costs | | | | | | | (22) | | | (21) | |
| Less current portion of long-term debt | Less current portion of long-term debt | | | | | | | (329) | | | (28) | |
| Total long-term debt | Total long-term debt | | | | | | | $ | 9,333 | | | $ | 8,644 | |
(a)This indebtedness is considered “debt” for purposes of a support agreement between parent company and AWCC, which serves as a functional equivalent of a full and unconditional guarantee by parent company of AWCC’s payment obligations under such indebtedness.
(b)Includes debt discount, net of fair value adjustments previously recognized in acquisition purchase accounting.
All mortgage bonds and $734$720 million of the private activity bonds and government funded debt held by the Company’s subsidiaries were collateralized as of December 31, 2020.2023.
Long-term debt indenturesagreements contain a number of covenants that, among other things, limit, subject to certain exceptions, AWCC from issuing debt secured by the Company’s consolidated assets. Certain long-term notesnote covenants require the Company to maintain a ratio of consolidated total indebtedness to consolidated total capitalization (each as defined in the relevant documents) of not more than 0.70 to 1.00. The ratio as of December 31, 20202023, was 0.630.56 to 1.00. In addition, the Company has $868$830 million of notes which include the right to redeem the notes at par value, in whole or in part, from time to time, subject to certain restrictions, with a weighted average interest rate of 1.85%2.51%.
Presented in the table below are future sinking fund payments and debt maturities:
| | Amount |
| 2021 | $ | 329 | |
| 2022 | 14 | |
| 2023 | 356 | |
| Amount | | | Amount |
| 2024 | 2024 | 474 | |
| 2025 | 2025 | 597 | |
| 2026 | |
| 2027 | |
| 2028 | |
| Thereafter | Thereafter | 7,918 | |
Presented in the table below are the issuances of long-term debt in 2020:2023:
| | | | | | | | | | | | | | | | | | | | | | | | | | | | | | | | |
| Company | | Type | | Rate | | Weighted Average Rate | | Maturity | | Amount |
| AWCC | | Senior notes—fixed rate | | 2.80%-3.45% | | 3.13% | | 2030-2050 | | $ | 1,000 | |
AWCC (a) | | Private activity bonds and government funded debt—fixed rate | | 0.60%-0.70% | | 0.42% | | 2023-2023 | | 86 | |
| Other American Water subsidiaries | | Private Activity Mortgage Bonds | | 0.85%-1.20% | | 1.10% | | 2023-2027 | | 225 | |
| Other American Water subsidiaries | | Private activity bonds and government funded debt—fixed rate | | 0.00%-5.00% | | 0.16% | | 2021-2048 | | 23 | |
| Total issuances | | | | | | | | | | $ | 1,334 | |
(a)This indebtedness has a mandatory redemption provision callable in 2023. | | | | | | | | | | | | | | | | | | | | | | | | | | | | | | | | |
| Company | | Type | | Rate | | Weighted Average Rate | | Maturity | | Amount |
| AWCC | | Senior notes—fixed rate | | 3.63% | | 3.63% | | 2026 | | $ | 1,035 | |
| AWCC | | Private activity bonds and government funded debt—fixed rate | | 3.70%-3.88% | | 3.80% | | 2028 | | 86 | |
| Other American Water subsidiaries | | Private activity bonds and government funded debt—fixed rate | | 0.00%-3.75% | | 2.88% | | 2025-2041 | | 143 | |
| Total issuances | | | | | | | | | | $ | 1,264 | |
The Company incurred debt issuance costs of $15$16 million related to the above issuances.
Presented in the table below are the retirements and redemptions of long-term debt in 20202023 through sinking fund provisions, optional redemption or payment at maturity:
| | Company | Company | | Type | | Rate | | Weighted Average Rate | | Maturity | | Amount | Company | | Type | | Rate | | Weighted Average Rate | | Maturity | | Amount |
| AWCC | AWCC | | Private activity bonds and government funded debt—fixed rate | | 1.79%-5.38% | | 5.29% | | 2020-2031 | | $ | 87 | |
| Other American Water subsidiaries | | Private activity mortgage bonds | | 4.45%-5.60% | | 5.19% | | 2020 | | 225 | |
| Other American Water subsidiaries | | Private activity bonds and government funded debt—fixed rate | | 0.00%-5.60% | | 2.08% | | 2020-2048 | | 15 | |
| AWCC | |
| Other American Water subsidiaries | Other American Water subsidiaries | | Mortgage bonds | | 3.92%-9.71% | | 7.83% | | 2020-2021 | | 13 | |
| Other American Water subsidiaries | Other American Water subsidiaries | | Mandatory redeemable preferred stock | | 8.49%-9.18% | | 8.64% | | 2031-2036 | | 2 | |
| Total retirements and redemptions | Total retirements and redemptions | | | | | | | | $ | 342 | |
On April 14, 2020,June 29, 2023, AWCC completedissued, in a $1.0 billion debt offering which included the sale of $500private placement, $1,035 million aggregate principal amount of its 2.80% senior notes3.625% Exchangeable Senior Notes due 2030 and $500 million aggregate principal amount of its 3.45% senior notes due 2050. At the closing of the offering,2026 (the “Notes”). AWCC received net proceeds of approximately $1,022 million, after deduction of underwriting discounts and commissions but before deduction of offering expenses net proceedspayable by AWCC. A portion of $989 million. AWCC used the net proceeds of this offering: to (i) lend funds to parent company and its regulated subsidiaries; (ii) to fund sinking fund payments for, and to repay at maturity, $28 million in aggregate principal amount of outstanding long-term debt of AWCC and certain of the Company’s regulated subsidiaries; (iii)was used to repay AWCC’s commercial paper obligations and short-term indebtedness under AWCC’s $2.25 billion unsecured revolving credit facility; and (iv)the remainder was used for general corporate purposes. The Notes are senior unsecured obligations of AWCC and have the benefit of a support agreement from parent company, which serves as the functional equivalent of a guarantee by parent company of the obligations of AWCC under the Notes. The Notes will mature on June 15, 2026 (the “Maturity Date”), unless earlier exchanged or repurchased.
The Notes are exchangeable at an initial exchange rate of 5.8213 shares of parent company's common stock per $1,000 principal amount of Notes (equivalent to an initial exchange price of approximately $171.78 per share of common stock). The initial exchange rate of the Notes is subject to adjustment as provided in the indenture pursuant to which the Notes were issued (the “Note Indenture”). Prior to the close of business on the business day immediately preceding March 15, 2026, the Notes are exchangeable at the option of the noteholders only upon the satisfaction of specified conditions and during certain periods described in the Note Indenture. On or after March 15, 2026, until the close of business on the business day immediately preceding the Maturity Date, the Notes will be exchangeable at the option of the noteholders at any time regardless of these conditions or periods. Upon any exchange of the Notes, AWCC will (1) pay cash up to the aggregate principal amount of the Notes and (2) pay or deliver (or cause to be delivered), as the case may be, cash, shares of parent company's common stock, or a combination of cash and shares of such common stock, at AWCC's election, in respect of the remainder, if any, of AWCC’s exchange obligation in excess of the aggregate principal amount of the Notes being exchanged.
AWCC may not redeem the Notes prior to the Maturity Date, and no sinking fund is provided for the Notes. Subject to certain conditions, holders of the Notes will have the right to require AWCC to repurchase all or a portion of their Notes upon the occurrence of a fundamental change, as defined in the Note Indenture, at a repurchase price of 100% of their principal amount plus any accrued and unpaid interest.
One of the principal market risks to which the Company is exposed is changes in interest rates. In order to manage the exposure, the Company follows risk management policies and procedures, including the use of derivative contracts such as swaps.treasury lock agreements. The Company also reduces exposure to interest rates by managing commercial paper and debt maturities. The Company also does not enter into derivative contracts for speculative purposes and does not use leveraged instruments. The derivative contracts entered into are for periods consistent with the related underlying exposures. The Company is exposed to the risk that counterparties to derivative contracts will fail to meet their contractual obligations and minimizes this risk by dealing only with leading, credit-worthycreditworthy financial institutions having long-term credit ratings of “A” or better.
During March 2020, In November and December 2023, the Company entered into 4 10-yearsix treasury lock agreements, each with a term of 10 years, with notional amount of $100amounts totaling $225 million, to reduce interest rate exposure on debt which was subsequentlyexpected to be issued on April 14, 2020.in 2024. These treasury lock agreements hadterminate in September 2024, and have an average fixed rate of 0.94%4.24%. The Company designated these treasury lock agreements as cash flow hedges, with their fair value recorded in accumulated other comprehensive gain or loss. On April 8, 2020Upon termination, the Company terminated these 4 treasury lock agreements with an aggregate notional amount of $400 million, realizing a netcumulative gain or loss of $6 million, torecorded in accumulated other comprehensive gain or loss will be amortized through interest, net over a 10 year period, in accordance with the termsterm of the $1.0 billion new debt issued on April 14, 2020. NaNdebt.
During 2022 and the first half of 2023, the Company entered into 11 treasury lock agreements, each with a term of 10 years, with notional amounts totaling $300 million. The Company designated these treasury lock agreements as cash flow hedges, with their fair value recorded in accumulated other comprehensive gain or loss. In June 2023, the Company terminated the treasury lock agreements realizing a net gain of $3 million included in Other, net in the accompanying Consolidated Statements of Operations.
No ineffectiveness was recognized on hedging instruments for the years ended December 31, 2020 and 2019.2023, 2022 or 2021.
Note 13:12: Short-Term Debt
To ensure adequate liquidity given the impacts of the COVID-19 pandemic on debt and capital markets, on March 20, 2020, AWCC entered into a Term Loan Credit Agreement, by and among parent company, AWCC and the lenders party thereto, which provided for a term loan facility of up to $750 million (the “Term Loan Facility”). On March 20, 2020, AWCC borrowed $500 million under the Term Loan Facility, the proceeds of which were used for general corporate purposes of AWCC and parent company, and to provide additional liquidity. The Term Loan Facility allowed for a single additional borrowing of up to $250 million, which expired unused on June 19, 2020. The Term Loan Facility commitments terminate on March 19, 2021. AWCC may prepay all or a portion of amounts due under the Term Loan Facility without any premium or penalty. Borrowings under the Term Loan Facility bear interest at a variable annual rate based on LIBOR, plus a margin of 0.80%. The credit agreement for the Term Loan Facility contains the same affirmative and negative covenants and events of default as under AWCC’s $2.25 billion revolving credit facility. As of December 31, 2020, $500 million of principal was outstanding under the Term Loan Facility.
Short-term debt consists of commercial paper and credit facility borrowings totaling $786 million for both periods ending December 31, 2020 and 2019. The weighted average interest rate on AWCC short-term borrowings was approximately 1.16% and 2.54% for the year ended December 31, 2020 and 2019, respectively. As of December 31, 2020 there were 0 borrowings outstanding with maturities greater than three months.
Liquidity needs for capital investment, working capital and other financial commitments are generally funded through cash flows from operations, public and private debt offerings, commercial paper markets and, if and to the extent necessary, borrowings under the AWCC revolving credit facility, and, in the future, issuances of equity. TheAWCC maintains an unsecured revolving credit facility which provides $2.25$2.75 billion in aggregate total commitments from a diversified group of financial institutions. On April 1, 2020,October 26, 2023, the termination date of the credit agreement with respect to AWCC’s revolving credit facility was extended, pursuant toas permitted by the terms of the credit agreement, from March 21, 2024October 2027 to March 21, 2025.October 2028. The facility is used principally to support AWCC’s commercial paper program, to provide additional liquidity support and to provide a sub-limit of up to $150 million for letters of credit. Letters of credit are non-debt instruments maintained to provide credit support for certain transactions as requested by third parties. Subject to satisfying certain conditions, the credit agreement also permits AWCC to increase the maximum commitment under the facility by up to an aggregate of $500 million.$500 millionand to request extensions of its expiration date for up to two one-year periods, as to which one such extension request remains. As of December 31, 2020,2023, AWCC had 0no outstanding borrowings and $76$75 million of outstanding letters of credit under the revolving credit facility, with $1.39$2.50 billion available to fulfill the Company’s short-term liquidity needs and to issue letters of credit. During 2020, the Company borrowed and subsequently repaid $650 million under the revolving credit facility. The Company regularly evaluates the capital markets and closely monitors the financial condition of the financial institutions with contractual commitments in its revolving credit facility. Interest rates on advances under the facility are based on a credit spread to the LIBOR rateSecured Overnight Financing Rate (or applicable market replacement rate) or base rate, each determined in accordance with Moody Investors Service’s and Standard & Poor’s Financial Services’S&P Global Ratings’ then applicable credit rating on AWCC’s senior unsecured, non-credit enhanced debt.
Short-term debt consists of commercial paper and credit facility borrowings totaling $180 million and $1,177 million as of December 31, 2023 and 2022, respectively, or net of discount $179 million and $1,175 million as of December 31, 2023 and 2022, respectively. The weighted average interest rate on AWCC’s outstanding short-term borrowings was approximately 5.51% and 4.41%, for the years ended December 31, 2023 and 2022, respectively. As of December 31, 2023, there were no commercial paper borrowings outstanding with maturities greater than three months.
Presented in the tables below are the aggregate credit facility commitments, commercial paper limit and letter of credit availability under the revolving credit facility, as well as the available capacity for each, as of December 31:
| | 2023 | | | 2023 |
| Commercial Paper Limit | | | Commercial Paper Limit | | Letters of Credit | | Total (a) |
| | 2020 |
| Commercial Paper Limit | | Letters of Credit | | Total (a) |
| (In millions) | | | | | |
| Total availability | |
| Total availability | |
| Total availability | Total availability | $ | 2,100 | | | $ | 150 | | | $ | 2,250 | |
| Outstanding debt | Outstanding debt | (786) | | | (76) | | | (862) | |
| Remaining availability as of December 31, 2020 | $ | 1,314 | | | $ | 74 | | | $ | 1,388 | |
| Remaining availability as of December 31, 2023 | |
(a)Total remaining availability of $1.39$2.50 billion as of December 31, 2020 may be accessed2023, was accessible through revolver draws.
| | 2022 | | | 2022 |
| Commercial Paper Limit | | | Commercial Paper Limit | | Letters of Credit | | Total (a) |
| | 2019 |
| Commercial Paper Limit | | Letters of Credit | | Total (a) |
| (In millions) | | | | | |
| Total availability | |
| Total availability | |
| Total availability | Total availability | $ | 2,100 | | | $ | 150 | | | $ | 2,250 | |
| Outstanding debt | Outstanding debt | (786) | | | (76) | | | (862) | |
| Remaining availability as of December 31, 2019 | $ | 1,314 | | | $ | 74 | | | $ | 1,388 | |
| Remaining availability as of December 31, 2022 | |
(a)Total remaining availability of $1.39$1.50 billion as of December 31, 2019 may be accessed2022, was accessible through revolver draws.
Presented in the table below is the Company’s total available liquidity as of December 31, 20202023 and 2019:2022, respectively:
| | | | | | | | | | | | | | | | | |
| Cash and Cash Equivalents | | Availability on Revolving Credit Facility | | Total Available Liquidity |
| (In millions) | | | | | |
| Available liquidity as of December 31, 2020 | $ | 547 | | | $ | 1,388 | | | $ | 1,935 | |
| Available liquidity as of December 31, 2019 | $ | 60 | | | $ | 1,388 | | | $ | 1,448 | |
| | | | | | | | | | | | | | | | | |
| Cash and Cash Equivalents | | Availability on Revolving Credit Facility | | Total Available Liquidity |
| | | | | |
| Available liquidity as of December 31, 2023 | $ | 330 | | | $ | 2,495 | | | $ | 2,825 | |
| Available liquidity as of December 31, 2022 | $ | 85 | | | $ | 1,495 | | | $ | 1,580 | |
Presented in the table below is the short-term borrowing activity for AWCC for the years ended December 31:
| | | | | | | | | | | |
| | 2020 | | 2019 |
| Average borrowings | $ | 1,047 | | | $ | 726 | |
| Maximum borrowings outstanding | 2,172 | | | 1,271 | |
| Weighted average interest rates, computed on daily basis | 1.16 | % | | 2.54 | % |
| Weighted average interest rates, as of December 31 | 0.53 | % | | 1.86 | % |
The changes in average borrowings between periods were mainly attributable to the $500 million borrowed under the Term Loan Facility during 2020, which is scheduled to terminate on March 19, 2021. | | | | | | | | | | | |
| 2023 | | 2022 |
| Average borrowings | $ | 288 | | | $ | 505 | |
| Maximum borrowings outstanding | 1,570 | | | 1,177 | |
| Weighted average interest rates, as of December 31 | 5.51 | % | | 4.41 | % |
The credit facility requires the Company to maintain a ratio of consolidated debt to consolidated capitalization of not more than 0.70 to 1.00. The ratio as of December 31, 20202023, was 0.630.56 to 1.00.
None of the Company’sThe Company does not have any material borrowings that are subject to default or prepayment as a result of a downgrading of securities, although such a downgrading could increase fees and interest charges under AWCC’s revolving credit facility.
Note 14:13: General Taxes
Presented in the table below isare the components of general tax expense for the years ended December 31:
| | | 2020 | | 2019 | | 2018 |
| 2023 | | | 2023 | | 2022 | | 2021 |
| Property and capital stock | Property and capital stock | $ | 140 | | | $ | 124 | | | $ | 120 | |
| Gross receipts and franchise | Gross receipts and franchise | 116 | | | 110 | | | 112 | |
| Payroll | Payroll | 36 | | | 35 | | | 33 | |
| Other general | Other general | 11 | | | 11 | | | 12 | |
| Total general taxes | Total general taxes | $ | 303 | | | $ | 280 | | | $ | 277 | |
Note 15:14: Income Taxes
Presented in the table below isare the components of income tax expense for the years ended December 31:
| | | | | | | | | | | | | | | | | |
| | 2020 | | 2019 | | 2018 |
| Current income taxes: | | | | | |
| State | $ | 8 | | | $ | 4 | | | $ | 26 | |
| Federal | 0 | | | 0 | | | 1 | |
| Total current income taxes | $ | 8 | | | $ | 4 | | | $ | 27 | |
| Deferred income taxes: | | | | | |
| State | $ | 49 | | | $ | 54 | | | $ | 33 | |
| Federal | 159 | | | 155 | | | 163 | |
| Amortization of deferred investment tax credits | (1) | | | (1) | | | (1) | |
| Total deferred income taxes | 207 | | | 208 | | | 195 | |
| Provision for income taxes | $ | 215 | | | $ | 212 | | | $ | 222 | |
| | | | | | | | | | | | | | | | | |
| 2023 | | 2022 | | 2021 |
| Current income taxes: | | | | | |
| State | $ | 16 | | | $ | 26 | | | $ | 72 | |
| Federal | 28 | | | 82 | | | 75 | |
| Total current income taxes | $ | 44 | | | $ | 108 | | | $ | 147 | |
| Deferred income taxes: | | | | | |
| State | $ | 44 | | | $ | 24 | | | $ | 10 | |
| Federal | 165 | | | 57 | | | 221 | |
| Amortization of deferred investment tax credits | (1) | | | (1) | | | (1) | |
| Total deferred income taxes | 208 | | | 80 | | | 230 | |
| Provision for income taxes | $ | 252 | | | $ | 188 | | | $ | 377 | |
Presented in the table below is a reconciliation between the statutory federal income tax rate and the Company’s effective tax rate for the years ended December 31:
| | | | 2020 | | 2019 | | 2018 | | 2023 | | 2022 | | 2021 |
| Income tax at statutory rate | Income tax at statutory rate | 21.0 | % | | 21.0 | % | | 21.0 | % | Income tax at statutory rate | 21.0 | % | | 21.0 | % | | 21.0 | % |
| Increases (decreases) resulting from: | Increases (decreases) resulting from: | | | | | | Increases (decreases) resulting from: | | | |
| State taxes, net of federal taxes | State taxes, net of federal taxes | 4.8 | % | | 5.4 | % | | 5.5 | % | State taxes, net of federal taxes | 4.0 | % | | 4.1 | % | | 3.9 | % |
| EADIT | EADIT | (2.1) | % | | (0.9) | % | | 1.5 | % | EADIT | (4.2) | % | | (6.5) | % | | (3.6) | % |
| Tax impact due to the sale of HOS | | Tax impact due to the sale of HOS | — | % | | — | % | | 1.6 | % |
| Other, net | Other, net | (0.4) | % | | (0.1) | % | | 0.2 | % | Other, net | 0.3 | % | | 0.1 | % | | 0.1 | % |
| Effective tax rate | Effective tax rate | 23.3 | % | | 25.4 | % | | 28.2 | % | Effective tax rate | 21.1 | % | | 18.7 | % | | 23.0 | % |
Presented in the table below are the components of the net deferred tax liability as of December 31:
| | | | | | | | | | | |
| | 2020 | | 2019 |
| Deferred tax assets: | | | |
| Advances and contributions | $ | 424 | | | $ | 410 | |
| Tax losses and credits | 65 | | | 136 | |
| Regulatory income tax assets | 329 | | | 335 | |
| Pension and other postretirement benefits | 100 | | | 94 | |
| Other | 165 | | | 151 | |
| Total deferred tax assets | 1,083 | | | 1,126 | |
| Valuation allowance | (19) | | | (21) | |
| Total deferred tax assets, net of allowance | $ | 1,064 | | | $ | 1,105 | |
| Deferred tax liabilities: | | | |
| Property, plant and equipment | $ | 2,913 | | | $ | 2,760 | |
| Deferred pension and other postretirement benefits | 97 | | | 77 | |
| Other | 216 | | | 207 | |
| Total deferred tax liabilities | 3,226 | | | 3,044 | |
Less: Deferred tax liabilities included in liabilities related to assets held for sale (a) | 69 | | | 67 | |
| Total deferred tax liabilities, net of deferred tax assets | $ | (2,093) | | | $ | (1,872) | |
(a)These deferred tax liabilities are related to the pending transactions contemplated by the Stock Purchase Agreement and are included in liabilities related to assets held for sale on the Consolidated Balance Sheets. See Note 6—Acquisitions and Divestitures for additional information. | | | | | | | | | | | |
| 2023 | | 2022 |
| Deferred tax assets: | | | |
| Advances and contributions | $ | 478 | | | $ | 351 | |
| Tax losses and credits | 17 | | | 19 | |
| Regulatory income tax assets | 191 | | | 203 | |
| Pension and other postretirement benefits | 75 | | | 64 | |
| Other | 172 | | | 140 | |
| Total deferred tax assets | 933 | | | 777 | |
| Valuation allowance | (11) | | | (11) | |
| Total deferred tax assets, net of allowance | $ | 922 | | | $ | 766 | |
| Deferred tax liabilities: | | | |
| Property, plant and equipment | $ | 3,269 | | | $ | 2,872 | |
| Deferred pension and other postretirement benefits | 84 | | | 64 | |
| Other | 268 | | | 249 | |
| Total deferred tax liabilities | 3,621 | | | 3,185 | |
| Total deferred tax liabilities, net of deferred tax assets | $ | (2,699) | | | $ | (2,419) | |
As of December 31, 20202023 and 2019,2022, the Company recognized federalhad state net operating loss (“NOL”) carryforwards of $366$238 million and $673 million, respectively. The Company’s federal NOL carryforwards begin to expire in 2029, however, the Company expects to fully utilize its federal NOL carryforwards in 2021, and therefore, no valuation allowance is required.
As of December 31, 2020 and 2019, the Company had state NOLs of $357 million and $453$240 million, respectively, a portion of which are offset by a valuation allowance becauseas the Company does not believe these NOLs are more likely than not to be realized. The state NOL carryforwards began to expire in 2020 and will continue2024 through 2040.2043.
The Company files income tax returns in the United States federal jurisdiction and various state and foreign jurisdictions. With few exceptions, the Company is no longer subject to U.S. federal, state or local or non-U.S. income tax examinations by tax authorities for taxable years on or before 2012. The Company has state income tax examinations in progressended December 31, 2018 and does not expect material adjustments to result.
Presented in the table below are the changes in gross liability, excluding interest and penalties, for unrecognized tax benefits:
| | | | | |
| Amount |
Balance as of January 1, 20192022 | $ | 97140 | |
| Increases in current period tax positions | 1726 | |
| Decreases in prior period measurement of tax positions | (4)(8) | |
Balance as of December 31, 20192022 | $ | 110158 | |
| Increases in current period tax positions | 1827 | |
| Decreases in prior period measurement of tax positions | (6)(37) | |
Balance as of December 31, 20202023 | $ | 122148 | |
The Company’s tax positions relate primarily to the deductions claimed for repair and maintenance costs on its utility plant. The Company does not anticipate material changes to its unrecognized tax benefits within the next year. As discussed above, the Company expects to utilize its remaining federal NOLs in 2021, and therefore this federal tax attribute will not be available to reduce the federal liabilities for uncertain tax positions or interest accrued as presented on the Company’s Consolidated Financial Statements.
If the Company sustains all of its positions as of December 31, 2020,2023, an unrecognized tax benefit of $12$9 million, excluding interest and penalties, would impact the Company’s effective tax rate. The Company had an insignificantimmaterial amount of interest and penalties related to its tax positions as of December 31, 20202023 and 2019.2022.
Presented in the table below are the changes in the valuation allowance:
| | | | | |
| Amount |
Balance as of January 1, 20182021 | $ | 1319 | |
| Decreases in current period tax positions | (9) | |
| Balance as of December 31, 2021 | $ | 10 | |
| Increases in current period tax positions | 1 | |
Balance as of December 31, 20182022 | $ | 1411 | |
| Increases in current period tax positions | 7— | |
Balance as of December 31, 20192023 | $ | 2111 | |
Decreases in current period tax positions | (2) | |
Balance as of December 31, 2020 | $ | 19 | |
Other Tax Matters
On August 16, 2022, the Inflation Reduction Act of 2022 (the “IRA”) was signed into law. The IRA contains a Corporate Alternative Minimum Tax (“CAMT”) provision, effective January 1, 2023. To determine if a company is considered an applicable corporation subject to CAMT, the company’s average adjusted financial statement income (“AFSI”) for the three consecutive years preceding the tax year must exceed $1 billion. An applicable corporation must make several adjustments to net income when determining AFSI. During 2023, the Company evaluated the potential impacts of the CAMT provision within the IRA and available guidance and determined that it did not exceed the $1 billion AFSI threshold and therefore was not subject to CAMT in 2023.
Note 16:15: Employee Benefits
Overview of Pension and Other Postretirement Benefits Plans
The Company maintains noncontributory defined benefit pension plans covering eligible employees of its regulated utility and shared services operations. Benefits under the plans are based on the employee’s years of service and compensation. The pension plans have been closed for all new employees. The pension plans were closed for most employees hired on or after January 1, 2006. Union employees hired on or after January 1, 2001, except for specific eligible groups specified in the plan, had their accrued benefit frozen and will be able to receive this benefit as a lump sum upon termination or retirement. Union employees hired on or after January 1, 2001, and non-union employees hired on or after January 1, 2006, are provided with a defined contribution plan that includes a 5.25% of base pay Company-funded defined contribution plan.account. The Company does not participate in a multi-employer plan. The Company also has unfunded noncontributory supplemental nonqualified pension plans that provide additional retirement benefits to certain employees.
The Company’s pension funding practice is to contribute at least the greater of the minimum amount required by the Employee Retirement Income Security Act of 1974 or the normal cost. Further, the Company will consider additional cash contributions and/or available prefunding balances if needed to avoid “at risk” status and benefit restrictions under the Pension Protection Act of 2006 (“PPA”). The Company may also consider increased contributions, based on other financial requirements and the plans’ funded position. Pension expense in excess of the amount contributed to the pension plans is deferred by certain regulated subsidiaries pending future recovery in rates charged for utility services as contributions are made to the plans. See Note 4—3—Regulatory Matters for additional information. Pension plan assets are invested in a number of actively managed, commingled funds, and limited partnerships including equities, fixed income securities, guaranteed annuity contracts with insurance companies, real estate funds and real estate investment trusts (“REITs”).
December 31, 2022. The restructuring involved the spin-off of certain inactive participants from the existing AWPP into a separate tax-qualified defined benefit pension plan, AWPP Inactive. Benefits offered to the plan participants remain unchanged. As a result of the amendment, actuarial gains and losses associated with AWPP Inactive are amortized over the average remaining life expectancy of the inactive participants. The actuarial gains and losses associated with the AWPP will continue to be amortized over the average remaining service period for active participants. The Company remeasured the pension plan obligation and assets to reflect the amendment for each plan as of December 31, 2022. The Company maintains other postretirement benefit plans providing varying levels of medical and life insurance to eligible retirees. The retiree welfare plans are closed for union employees hired on or after January 1, 2006. The plans had previously closed for non-union employees hired on or after January 1, 2002. The Company’s policy is to fund other postretirement benefit costs up to the amount recoverable through rates. Assets of the plans are invested in a number of actively managed funds in the form of separate accounts, commingled funds and limited partnerships, including equities and fixed income securities.
Pension Plan Assets
The investment policy guideline of the pension plan is focused on diversification, improving returns and reducing the volatility of the funded status over a long-term horizon. The investment policy guidelines of the postretirement plans focus on the appropriate strategy given the funded status of the plans. None of the Company’s securities are included in pension or other postretirement benefit plan assets.
The Company uses fair value for all classes of assets in the calculation of market-related value of plan assets. As of 2018,December 31, 2023, the fair values and asset allocations of the pension plan assets include the American Water Pension Plan, the New York Water Service Corporation Pension Plan,AWPP and the Shorelands Water Company, Inc. Pension Plan.AWPP Inactive.
Upon completion
Presented in the tables below are the fair values and asset allocations of the pension plan assets as of December 31, 20202023 and 2019,2022, respectively, by asset category:
| | Asset Category | Asset Category | | 2021 Target Allocation | | Total | | Quoted Prices in Active Markets for Identical Assets (Level 1) | | Significant Observable Inputs (Level 2) | | Significant Unobservable Inputs (Level 3) | | Percentage of Plan Assets as of December 31, 2020 | Asset Category | | Total | | Quoted Prices in Active Markets for Identical Assets (Level 1) | | Significant Observable Inputs (Level 2) | | Significant Unobservable Inputs (Level 3) (a) | | Net Asset Value as a Practical Expedient | | Percentage of Plan Assets as of December 31, 2023 |
| Cash | Cash | | | | $ | 78 | | | $ | 78 | | | $ | — | | | $ | — | | | 4 | % | Cash | | $ | 56 | | | $ | | $ | 56 | | | $ | | $ | — | | | $ | | $ | — | | | $ | | $ | — | | | 4 | | 4 | % |
| Equity securities: | Equity securities: | | 50 | % | | | | | | | | | | | Equity securities: | | | | | | | | | | | | |
| U.S. large cap | U.S. large cap | | 420 | | | 420 | | | — | | | — | | | 21 | % | U.S. large cap | | 134 | | | 23 | | 23 | | | — | | — | | | — | | — | | | 111 | | 111 | | | 9 | | 9 | % |
| U.S. small cap | U.S. small cap | | 124 | | | 124 | | | — | | | — | | | 6 | % | U.S. small cap | | 37 | | | 37 | | 37 | | | — | | — | | | — | | — | | | — | | — | | | 3 | | 3 | % |
| International | International | | 367 | | | 8 | | | 169 | | | 190 | | | 18 | % | International | | 235 | | | — | | — | | | — | | — | | | — | | — | | | 235 | | 235 | | | 16 | | 16 | % |
| Real estate fund | Real estate fund | | 120 | | | — | | | — | | | 120 | | | 6 | % | Real estate fund | | 132 | | | — | | — | | | — | | — | | | — | | — | | | 132 | | 132 | | | 9 | | 9 | % |
| REITs | REITs | | 7 | | | — | | | 7 | | | — | | | 0 | % | REITs | | 6 | | | — | | — | | | — | | — | | | — | | — | | | 6 | | 6 | | | — | | — | % |
| Fixed income securities: | Fixed income securities: | | 50 | % | | | | | | | | | |
| U.S. Treasury securities and government bonds | U.S. Treasury securities and government bonds | | 171 | | | 163 | | | 8 | | | — | | | 9 | % |
| U.S. Treasury securities and government bonds | |
| U.S. Treasury securities and government bonds | | | 234 | | | 171 | | | 2 | | | — | | | 61 | | | 16 | % |
| Corporate bonds | Corporate bonds | | 594 | | | — | | | 594 | | | — | | | 30 | % | Corporate bonds | | 531 | | | — | | — | | | 531 | | 531 | | | — | | — | | | — | | — | | | 38 | | 38 | % |
| Mortgage-backed securities | Mortgage-backed securities | | 9 | | | — | | | 9 | | | — | | | 0 | % | Mortgage-backed securities | | 8 | | | — | | — | | | 8 | | 8 | | | — | | — | | | — | | — | | | 1 | | 1 | % |
| Municipal bonds | Municipal bonds | | 34 | | | — | | | 34 | | | — | | | 2 | % | Municipal bonds | | 23 | | | — | | — | | | 23 | | 23 | | | — | | — | | | — | | — | | | 2 | | 2 | % |
| Treasury futures | | 10 | | | 10 | | | — | | | — | | | 1 | % |
| Long duration bond fund | Long duration bond fund | | 10 | | | 7 | | | 3 | | | — | | | 1 | % | Long duration bond fund | | 3 | | | — | | — | | | — | | — | | | — | | — | | | 3 | | 3 | | | — | | — | % |
| Guarantee annuity contracts | Guarantee annuity contracts | | 46 | | | — | | | — | | | 46 | | | 2 | % | Guarantee annuity contracts | | 32 | | | — | | — | | | — | | — | | | 32 | | 32 | | | — | | — | | | 2 | | 2 | % |
| Total | Total | | 100 | % | | $ | 1,990 | | | $ | 810 | | | $ | 824 | | | $ | 356 | | | 100 | % | Total | | $ | 1,431 | | | $ | | $ | 287 | | | $ | | $ | 564 | | | $ | | $ | 32 | | | $ | | $ | 548 | | | 100 | | 100 | % |
113 | | | | | | | | | | | | | | | | | | | | | | | | | | | | | | | | | | | | | | |
| Asset Category | | Total | | Quoted Prices in Active Markets for Identical Assets (Level 1) | | Significant Observable Inputs (Level 2) | | Significant Unobservable Inputs (Level 3) (a) | | Net Asset Value as a Practical Expedient (b) | | Percentage of Plan Assets as of December 31, 2022 |
| Cash | | $ | 36 | | | $ | 36 | | | $ | — | | | $ | — | | | $ | — | | | 3 | % |
| Equity securities: | | | | | | | | | | | | |
| U.S. large cap | | 142 | | | 2 | | | — | | | — | | | 140 | | | 10 | % |
| U.S. small cap | | 79 | | | 79 | | | — | | | — | | | — | | | 6 | % |
| International | | 386 | | | 2 | | | — | | | — | | | 384 | | | 27 | % |
| Real estate fund | | 154 | | | — | | | — | | | — | | | 154 | | | 11 | % |
| REITs | | 6 | | | — | | | — | | | — | | | 6 | | | — | % |
| Fixed income securities: | | | | | | | | | | | | |
| U.S. Treasury securities and government bonds | | 126 | | | 119 | | | 7 | | | — | | | — | | | 9 | % |
| Corporate bonds | | 418 | | | — | | | 418 | | | — | | | — | | | 30 | % |
| Mortgage-backed securities | | 8 | | | — | | | 8 | | | — | | | — | | | 1 | % |
| Municipal bonds | | 21 | | | — | | | 21 | | | — | | | — | | | 1 | % |
| Long duration bond fund | | 3 | | | — | | | — | | | — | | | 3 | | | — | % |
| Guarantee annuity contracts | | 34 | | | — | | | — | | | 34 | | | — | | | 2 | % |
| Total | | $ | 1,413 | | | $ | 238 | | | $ | 454 | | | $ | 34 | | | $ | 687 | | | 100 | % |
| | | | | | | | | | | | | | | | | | | | | | | | | | | | | | | | | | | | | | |
| Asset Category | | 2020 Target Allocation | | Total | | Quoted Prices in Active Markets for Identical Assets (Level 1) | | Significant Observable Inputs (Level 2) | | Significant Unobservable Inputs (Level 3) | | Percentage of Plan Assets as of December 31, 2019 |
| Cash | | | | $ | 39 | | | $ | 39 | | | $ | — | | | $ | — | | | 2 | % |
| Equity securities: | | 50 | % | | | | | | | | | | |
| U.S. large cap | | | | 358 | | | 358 | | | — | | | — | | | 20 | % |
| U.S. small cap | | | | 84 | | | 78 | | | 6 | | | — | | | 5 | % |
| International | | | | 320 | | | 6 | | | 137 | | | 177 | | | 18 | % |
| Real estate fund | | | | 127 | | | — | | | — | | | 127 | | | 7 | % |
| REITs | | | | 7 | | | — | | | 7 | | | — | | | 0 | % |
| Fixed income securities: | | 50 | % | | | | | | | | | | |
| U.S. Treasury securities and government bonds | | | | 169 | | | 158 | | | 11 | | | — | | | 10 | % |
| Corporate bonds | | | | 542 | | | — | | | 542 | | | — | | | 31 | % |
| Mortgage-backed securities | | | | 14 | | | — | | | 14 | | | — | | | 1 | % |
| Municipal bonds | | | | 26 | | | — | | | 26 | | | — | | | 1 | % |
| Treasury futures | | | | 8 | | | 8 | | | — | | | — | | | 1 | % |
| Long duration bond fund | | | | 8 | | | 8 | | | — | | | — | | | 1 | % |
| Guarantee annuity contracts | | | | 45 | | | — | | | — | | | 45 | | | 3 | % |
| Total | | 100 | % | | $ | 1,747 | | | $ | 655 | | | $ | 743 | | | $ | 349 | | | 100 | % |
Presented inThere were no material changes during the tables below are a reconciliation of the beginning and ending balances ofperiod for the fair value measurements using significant unobservable inputs (Level 3) for 2020the years ended December 31, 2023 and 2019, respectively:2022, respectively.
| | | | | |
| (b)The classification of certain assets previously presented as Level 1, 2 and 3 of $140 million, $273 million and $274 million, respectively, as of December 31, 2022, have been adjusted and are now presented as investments for which Net Asset Value (“NAV’) is used as a practical expedient to approximate fair value in accordance with ASU 2015-07 “Disclosure for Investments in Certain Entities That Calculate Net Asset Value per Share (or its Equivalent)”. | Level 3 |
Balance as of January 1, 2020 | $ | 349 | |
Actual return on assets | 3 | |
Purchases, issuances and settlements, net | 4 | |
Balance as of December 31, 2020 | $ | 356 | |
| | | | | |
| Level 3 |
Balance as of January 1, 2019 | $ | 230 | |
Actual return on assets | 25 | |
Purchases, issuances and settlements, net | 94 | |
Balance as of December 31, 2019 | $ | 349 | |
The Company’s 2024 target pension plan asset allocation is 37% equity securities and 63% fixed income securities. The Company’s 2023 target pension plan asset allocation was 37% equity securities and 63% fixed income securities.
Other Postretirement Benefit Plan Assets
The Company’s postretirement benefit plans have different levels of funded status and the assets are held under various trusts. The investments and risk mitigation strategies for the plans are tailored specifically for each trust. In setting new strategic asset mixes, consideration is given to the likelihood that the selected asset allocation will effectively fund the projected plan liabilities and meet the risk tolerance criteria of the Company. The Company periodically updates the long-term, strategic asset allocations for these plans through asset liability studies and uses various analytics to determine the optimal asset allocation. Considerations include plan liability characteristics, liquidity needs, funding requirements, expected rates of return and the distribution of returns.
In 2018,December 2022, the Company announcedcompleted plan design changesamendments to spin-off and merge a portion of the American Water Retiree Welfare Plan (“Retiree Welfare Plan”), with and into the Company’s medical plan for active employees (“Active Medical Plan”), in order to repurpose the over-funded portion of the Bargained Retiree Voluntary Employees’ Beneficiary Association (“Bargained VEBA”) trust. Benefits offered to the medical bargaining benefit plan which resulted in a cap on future benefits and an over funded postretirement medical benefits bargaining plan.participants remain unchanged. As a result of the change in funded status,these changes, effective December 31, 2022, the Company decreasedtransferred investment assets from the Bargained VEBA into the existing trust maintained for the benefit of Active Medical Plan participants (“Active VEBA”). The transfer of these Bargained VEBA investment risk inassets into the planActive VEBA permitted access to approximately $194 million of assets for purposes of paying active union employee medical benefits. The Company recorded the transfer of assets as a negative contribution and reduced its exposure to changes in interest ratestherefore did not record a gain or loss, as permitted by matchingaccounting guidance. See Note 18—Fair Value of Financial Information, for additional information on accounting for the assets as investments in debt and equity securities as of the plan to the projected cash flows for future benefit payments of the liability.
December 31, 2023 and 2022. The Company engages third-party investment managers for all invested assets. Managers are not permitted to invest outside of the asset class (e.g., fixed income, equity, alternatives) or strategy for which they have been appointed. Investment management agreements and recurring performance and attribution analysis are used as tools to ensure investment managers invest solely within the investment strategy they have been provided. Futures and options may be used to adjust portfolio duration to align with a plan’s targeted investment policy.
In order to minimize asset volatility relative to the liabilities, a portion of plan assets is allocated to long duration fixed income investments that are exposed to interest rate risk. Increases in interest rates generally will result in a decline in the value of fixed income assets while reducing the present value of the liabilities. Conversely, rate decreases will increase fixed income assets, partially offsetting the related increase in the liabilities. Within equities, risk is mitigated by constructing a portfolio that is broadly diversified by geography, market capitalization, manager mandate size, investment style and process. For the postretirement medical bargaining plan,Bargained VEBA trust, its asset structure is designed to meet the cash flows of the liabilities. This design reduces the plan’s exposure to changes in interest rates.
Actual allocations to each asset class vary from target allocations due to periodic investment strategy updates, market value fluctuations, the length of time it takes to fully implement investment allocations, and the timing of benefit payments and contributions. The asset allocation is rebalanced on a quarterly basis, if necessary. The Retiree Welfare Plan is funded by the Bargained VEBA trust, the Non-Bargained Retiree Voluntary Employees’ Beneficiary Association (“Non-Bargained VEBA”) Trust assets includetrust, the American Water Postretirement Medical Benefits Bargaining Plan, the New York Water Service Corporation Postretirement Medical Benefits Bargaining Plan, the American Water Postretirement Medical Benefits Non-Bargaining Plan,Active VEBA trust, and the American Water Life Insurance Voluntary Employees’ Beneficiary Association (“Life VEBA”) Trust.
Presented in the tables below are the fair values and asset allocations of the postretirement benefit plan assets as of December 31, 20202023 and 2019,2022, respectively, by asset category:
| | | | | | | | | | | | | | | | | | | | | | | | | | | | | | | | | | | | | | |
| Asset Category | | 2021 Target Allocation | | Total | | Quoted Prices in Active Markets for Identical Assets (Level 1) | | Significant Observable Inputs (Level 2) | | Significant Unobservable Inputs (Level 3) | | Percentage of Plan Assets as of December 31, 2020 |
| Bargain VEBA: | | | | | | | | | | | | |
| Cash | | | | $ | 12 | | | $ | 12 | | | $ | — | | | $ | — | | | 3 | % |
| Equity securities: | | 4 | % | | | | | | | | | | |
| U.S. large cap | | | | 14 | | | 14 | | | — | | | — | | | 3 | % |
| Fixed income securities: | | 96 | % | | | | | | | | | | |
| U.S. Treasury securities and government bonds | | | | 389 | | | 308 | | | 81 | | | — | | | 93 | % |
| Long duration bond fund | | | | 5 | | | 5 | | | — | | | — | | | 1 | % |
| Total bargain VEBA | | 100 | % | | $ | 420 | | | $ | 339 | | | $ | 81 | | | $ | — | | | 100 | % |
| Non-bargain VEBA: | | | | | | | | | | | | |
| Cash | | | | $ | 1 | | | $ | 1 | | | $ | — | | | $ | — | | | — | |
| Equity securities: | | 60 | % | | | | | | | | | | |
| U.S. large cap | | | | 51 | | | 51 | | | — | | | — | | | 38 | % |
| International | | | | 33 | | | 33 | | | — | | | — | | | 24 | % |
| Fixed income securities: | | 40 | % | | | | | | | | | | |
Core fixed income bond fund (a) | | | | 50 | | | — | | | 50 | | | — | | | 38 | % |
| Total non-bargain VEBA | | 100 | % | | $ | 135 | | | $ | 85 | | | $ | 50 | | | $ | — | | | 100 | % |
| Life VEBA: | | | | | | | | | | | | |
| Equity securities: | | 70 | % | | | | | | | | | | |
| U.S. large cap | | | | $ | 0 | | | $ | 0 | | | $ | — | | | $ | — | | | 0 | % |
| Fixed income securities: | | 30 | % | | | | | | | | | | |
Core fixed income bond fund (a) | | | | 1 | | | 1 | | | — | | | — | | | 100 | % |
| Total life VEBA | | 100 | % | | $ | 1 | | | $ | 1 | | | $ | — | | | $ | — | | | 100 | % |
| Total | | 100 | % | | $ | 556 | | | $ | 425 | | | $ | 131 | | | $ | — | | | 100 | % |
(a)Includes cash for margin requirements. | | | | | | | | | | | | | | | | | | | | | | | | | | | | | | | | | | | | | | |
| Asset Category | | Total | | Quoted Prices in Active Markets for Identical Assets (Level 1) | | Significant Observable Inputs (Level 2) | | Significant Unobservable Inputs (Level 3) | | Net Asset Value as a Practical Expedient | | Percentage of Plan Assets as of December 31, 2023 |
| Bargained VEBA: | | | | | | | | | | | | |
| Cash | | $ | 4 | | | $ | 4 | | | $ | — | | | $ | — | | | $ | — | | | 4 | % |
| Fixed income securities: | | | | | | | | | | | | |
| U.S. Treasury securities and government bonds | | 7 | | | 7 | | | — | | | — | | | — | | | 7 | % |
| Corporate bonds | | 86 | | | — | | | 86 | | | — | | | — | | | 85 | % |
| Municipal bonds | | 4 | | | — | | | 4 | | | — | | | — | | | 4 | % |
| Total bargained VEBA | | $ | 101 | | | $ | 11 | | | $ | 90 | | | $ | — | | | $ | — | | | 100 | % |
| Active VEBA: | | | | | | | | | | | | |
| Cash | | $ | 2 | | | $ | 2 | | | $ | — | | | $ | — | | | $ | — | | | 6 | % |
| Fixed income securities: | | | | | | | | | | | | |
| U.S. Treasury securities and government bonds | | 2 | | | 2 | | | — | | | — | | | — | | | 6 | % |
| Corporate bonds | | 26 | | | — | | | 26 | | | — | | | — | | | 82 | % |
| Municipal bonds | | 2 | | | — | | | 2 | | | — | | | — | | | 6 | % |
| Total Active VEBA | | $ | 32 | | | $ | 4 | | | $ | 28 | | | $ | — | | | $ | — | | | 100 | % |
| Non-bargained VEBA: | | | | | | | | | | | | |
| Cash | | $ | 2 | | | $ | 2 | | | $ | — | | | $ | — | | | $ | — | | | 2 | % |
| Equity securities: | | | | | | | | | | | | |
| U.S. large cap | | 44 | | | 44 | | | — | | | — | | | — | | | 35 | % |
| International | | 30 | | | 30 | | | — | | | — | | | — | | | 24 | % |
| Fixed income securities: | | | | | | | | | | | | |
| Municipal bonds | | 49 | | | — | | | 49 | | | — | | | — | | | 39 | % |
| Total non-bargained VEBA | | $ | 125 | | | $ | 76 | | | $ | 49 | | | $ | — | | | $ | — | | | 100 | % |
| Total | | $ | 258 | | | $ | 91 | | | $ | 167 | | | $ | — | | | $ | — | | | 100 | % |
| | Asset Category | Asset Category | | 2020 Target Allocation | | Total | | Quoted Prices in Active Markets for Identical Assets (Level 1) | | Significant Observable Inputs (Level 2) | | Significant Unobservable Inputs (Level 3) | | Percentage of Plan Assets as of 12/31/2019 | Asset Category | | Total | | Quoted Prices in Active Markets for Identical Assets (Level 1) | | Significant Observable Inputs (Level 2) | | Significant Unobservable Inputs (Level 3) | | Net Asset Value as a Practical Expedient | | Percentage of Plan Assets as of December 31, 2022 |
| Bargain VEBA: | | | | | | | | | | | | |
| Bargained VEBA: | | Bargained VEBA: | | | | | | |
| Cash | Cash | | $ | 6 | | | $ | 6 | | | $ | — | | | $ | — | | | 2 | % | Cash | | $ | 3 | | | $ | | $ | 3 | | | $ | | $ | — | | | $ | | $ | — | | | $ | | $ | — | | | 2 | | 2 | % |
| Equity securities: | | 4 | % | | | | | | | | | | |
| U.S. large cap | | 13 | | | 13 | | | — | | | — | | | 3 | % |
| Fixed income securities: | Fixed income securities: | | 96 | % | | | | | | | | | |
| U.S. Treasury securities and government bonds | U.S. Treasury securities and government bonds | | 373 | | | 298 | | | 75 | | | — | | | 94 | % |
| U.S. Treasury securities and government bonds | |
| U.S. Treasury securities and government bonds | | | 131 | | | 72 | | | 59 | | | — | | | — | | | 97 | % |
| Long duration bond fund | Long duration bond fund | | 4 | | | 4 | | | — | | | — | | | 1 | % | Long duration bond fund | | 1 | | | 1 | | 1 | | | — | | — | | | — | | — | | | — | | — | | | 1 | | 1 | % |
| Total bargain VEBA | | 100 | % | | $ | 396 | | | $ | 321 | | | $ | 75 | | | $ | — | | | 100 | % |
| Non-bargain VEBA: | | | | | | | | | | | | |
| Total bargained VEBA | | Total bargained VEBA | | $ | 135 | | | $ | 76 | | | $ | 59 | | | $ | — | | | $ | — | | | 100 | % |
| Non-bargained VEBA: | | Non-bargained VEBA: | | | | | | |
| Cash | Cash | | $ | 4 | | | $ | 4 | | | $ | — | | | $ | — | | | — | | Cash | | $ | 1 | | | $ | | $ | 1 | | | $ | | $ | — | | | $ | | $ | — | | | $ | | $ | — | | | 1 | | 1 | % |
| Equity securities: | Equity securities: | | 60 | % | | | | | | | | | | | Equity securities: | | | | | | |
| U.S. large cap | U.S. large cap | | 48 | | | 48 | | | — | | | — | | | 36 | % | U.S. large cap | | 40 | | | 40 | | 40 | | | — | | — | | | — | | — | | | — | | — | | | 34 | | 34 | % |
| International | International | | 30 | | | 30 | | | — | | | — | | | 23 | % | International | | 29 | | | 29 | | 29 | | | — | | — | | | — | | — | | | — | | — | | | 25 | | 25 | % |
| Fixed income securities: | Fixed income securities: | | 40 | % | | | | | | | | | |
Core fixed income bond fund (a) | | 50 | | | — | | | 50 | | | — | | | 41 | % |
| Total non-bargain VEBA | | 100 | % | | $ | 132 | | | $ | 82 | | | $ | 50 | | | $ | — | | | 100 | % |
| Municipal bonds | |
| Municipal bonds | |
| Municipal bonds | | | 47 | | | — | | | 47 | | | — | | | — | | | 40 | % |
| Total non-bargained VEBA | | Total non-bargained VEBA | | $ | 117 | | | $ | 70 | | | $ | 47 | | | $ | — | | | $ | — | | | 100 | % |
| Life VEBA: | Life VEBA: | | | | | | | | | | | | | Life VEBA: | | | | | | |
| Equity securities: | | 70 | % | | | | | | | | | | |
| U.S. large cap | | $ | 2 | | | $ | 2 | | | $ | — | | | $ | — | | | 50 | % |
| Cash | | Cash | | $ | 2 | | | $ | 2 | | | $ | — | | | $ | — | | | $ | — | | | 100 | % |
| Fixed income securities: | Fixed income securities: | | 30 | % | | | | | | | | | |
Core fixed income bond fund (a) | | 2 | | | 2 | | | — | | | — | | | 50 | % |
| Total life VEBA | |
| Total life VEBA | |
| Total life VEBA | Total life VEBA | | 100 | % | | $ | 4 | | | $ | 4 | | | $ | — | | | $ | — | | | 100 | % | | $ | 2 | | | $ | | $ | 2 | | | $ | | $ | — | | | $ | | $ | — | | | $ | | $ | — | | | 100 | | 100 | % |
| Total | Total | | 100 | % | | $ | 532 | | | $ | 407 | | | $ | 125 | | | $ | — | | | 100 | % | Total | | $ | 254 | | | $ | | $ | 148 | | | $ | | $ | 106 | | | $ | | $ | — | | | $ | | $ | — | | | 100 | | 100 | % |
(a)Includes cashThe Company’s 2024 target postretirement benefit plan asset allocation for margin requirements.the Bargained VEBA and Active VEBA is 100% fixed income securities and for the Non-bargained VEBA is 60% equity securities and 40% fixed income securities. The Company’s 2023 target postretirement benefit plan asset allocation for the Bargained VEBA and Life VEBA was 100% fixed income securities and for the Non-bargained VEBA was 60% equity securities and 40% fixed income securities.
Valuation Techniques Used to Determine Fair Value
Cash—Cash and investments with maturities of three months or less when purchased, including certain short-term fixed-income securities, are considered cash and are included in the recurring fair value measurements hierarchy as Level 1.
Equity securities—Forsecurities —For equity securities, the trustees obtain prices from pricing services, whose prices are obtained from direct feeds from market exchanges, that the Company is able to independently corroborate. Certain equity securities are valued based on quoted prices in active markets and categorized as Level 1. Other equities, such as certain U.S. large cap and international securities held in the pension plan, are invested in commingled funds and/or limited partnerships. These funds are valued to reflect the plan fund’s interest in the fund based on the reported year-end net asset value.NAV. Since net asset valueNAV is not directly observable or not available on a nationally recognized securities exchange for the commingled funds and/or limited partnerships, they are categorizednot included in the fair value hierarchy as Level 2. For limited partnerships,they are measured at fair value using the assets as a whole are categorized as Level 3 due to the fact that the partnership provides the pricingNAV per share (or its equivalent) practical expedient. These investments can typically be redeemed monthly or more frequently, with 30 or less days of notice and the pricing inputs are less readily observable. In addition, the limited partnership vehicle cannot be readily traded.without further restrictions.
Fixed-income securities—The majority ofCertain U.S. Treasury securities and government bonds have been categorized as Level 1 because they trade in highly-liquid and transparent markets and their prices can be corroborated. The fair values of corporate bonds, mortgage backed securities, and certain government bonds are based on prices that reflect observable market information, such as actual trade information of similar securities. TheyThese securities are categorized as Level 2 because the valuations are calculated using models which utilize actively traded market data that the Company can corroborate. Exchange-traded optionsfuture and option positions are reported in accordance with changes in variation margins that are settled daily. Exchange-traded futures and options, for which market quotations are readily available, are valued at the last reported sale price or official closing price on the primary market or exchange on which they are traded and are classified as Level 1. Other U.S. Treasury securities are invested in commingled funds that may implement their investment strategies in a variety of ways which may include direct and/or indirect investment in securities and other instruments or assets (e.g., futures and swaps) or investment in units of other commingled funds. These funds are valued to reflect the plan fund’s interest in the fund based on the reported year-end NAV. Since NAV is not directly observable or not available on a nationally recognized securities exchange for the commingled funds, they are not included in the fair value hierarchy as they are measured at fair value using the NAV per share (or its equivalent) practical expedient. These investments can typically be redeemed daily, with no prior notice and without further restrictions.
Real estate fund—Real estate fund is categorized as Level 3 as the fund uses significant unobservable inputs for fair value measurement and thefunds are an investment vehicle is in the form of a limited partnership.
notice, subject to available cash. REITs—REITs are invested in commingled funds.funds primarily focused in publicly traded shares of real estate investment trusts. Commingled funds are valued to reflect the plan fund’s interest in the fund based on the reported year-end net asset value. SinceNAV. REITs are not included in the net assetfair value is not directly observable for the commingled funds,hierarchy as they are categorized as Level 2.measured at fair value using the NAV per share (or its equivalent) practical expedient. These investments can typically be redeemed daily, with no prior notice and without further restrictions.
Guaranteed annuity contracts—Guaranteed annuity contracts are categorized as Level 3 because the investments are not publicly quoted. Since these market values are determined by the provider, they are not highly observable and have been categorized as Level 3. Exchange-traded future
Benefit Obligations, Plan Assets and option positions are reported in accordance with changes in variation margins that are settled daily.Funded Status
Presented in the table below is a rollforward of the changes in the benefit obligation and plan assets for the two most recent years, for all plans combined:
| | | | | | | | | | | | | | | | | | | | | | | |
| | Pension Benefits | | Other Benefits |
| | 2020 | | 2019 | | 2020 | | 2019 |
| Change in benefit obligation: | | | | | | | |
| Benefit obligation as of January 1, | $ | 2,161 | | | $ | 1,892 | | | $ | 374 | | | $ | 353 | |
| Service cost | 31 | | | 28 | | | 4 | | | 4 | |
| Interest cost | 73 | | | 82 | | | 12 | | | 15 | |
| Plan participants' contributions | 0 | | | 0 | | | 2 | | | 2 | |
| Plan amendments | 0 | | | 0 | | | 5 | | | (1) | |
| Actuarial loss (gain) | 233 | | | 264 | | | 13 | | | 25 | |
Settlements (a) | (3) | | | 0 | | | 0 | | | 0 | |
| Gross benefits paid | (109) | | | (105) | | | (29) | | | (25) | |
| Federal subsidy | 0 | | | 0 | | | 1 | | | 1 | |
| Benefit obligation as of December 31, | $ | 2,386 | | | $ | 2,161 | | | $ | 382 | | | $ | 374 | |
| Change in plan assets: | | | | | | | |
| Fair value of plan assets as of January 1, | $ | 1,747 | | | $ | 1,499 | | | $ | 532 | | | $ | 507 | |
| Actual return on plan assets | 314 | | | 319 | | | 53 | | | 51 | |
| Employer contributions | 41 | | | 33 | | | (2) | | | (2) | |
| Plan participants' contributions | 0 | | | 0 | | | 2 | | | 2 | |
Settlements (a) | (3) | | | 0 | | | 0 | | | 0 | |
| Benefits paid | (109) | | | (104) | | | (29) | | | (26) | |
| Fair value of plan assets as of December 31, | $ | 1,990 | | | $ | 1,747 | | | $ | 556 | | | $ | 532 | |
| Funded value as of December 31, | $ | (396) | | | $ | (414) | | | $ | 174 | | | $ | 158 | |
| Amounts recognized on the balance sheet: | | | | | | | |
| Noncurrent asset | $ | 0 | | | $ | 0 | | | $ | 173 | | | $ | 159 | |
| Current liability | (2) | | | (3) | | | 0 | | | 0 | |
| Noncurrent liability | (388) | | | (411) | | | (1) | | | (1) | |
(Liabilities) assets related to assets held for sale (b) | (6) | | | 0 | | | 2 | | | 0 | |
| Net amount recognized | $ | (396) | | | $ | (414) | | | $ | 174 | | | $ | 158 | |
(a)The Company paid $3 million of lump sum payment distributions from the Company’s New York Water Service Corporation Pension Plan for the year ended December 31, 2020. There were no lump sum payments made for the year ended December 31, 2019.
(b)These balances are related to the pending transactions contemplated by the Stock Purchase Agreement and are included in assets held for sale and liabilities related to assets held for sale on the Consolidated Balance Sheets as of December 31, 2020. See Note 6—Acquisitions and Divestitures for additional information.
| | | | | | | | | | | | | | | | | | | | | | | |
| | Pension Benefits | | Other Benefits |
| 2023 | | 2022 | | 2023 | | 2022 |
| Change in benefit obligation: | | | | | | | |
| Benefit obligation as of January 1, | $ | 1,578 | | | $ | 2,294 | | | $ | 255 | | | $ | 342 | |
| Service cost | 17 | | | 30 | | | 2 | | | 3 | |
| Interest cost | 85 | | | 64 | | | 14 | | | 10 | |
| Plan participants' contributions | — | | | — | | | 3 | | | 3 | |
| Plan amendments | — | | | — | | | — | | | 6 | |
| Actuarial loss (gain) | 67 | | | (582) | | | (4) | | | (77) | |
| Divestiture | — | | | (86) | | | — | | | (4) | |
| Settlements | (3) | | | — | | | — | | | — | |
| Gross benefits paid | (118) | | | (142) | | | (24) | | | (28) | |
| Federal subsidy | — | | | — | | | 1 | | | — | |
| Other adjustments | (4) | | | — | | | — | | | — | |
| Benefit obligation as of December 31, | $ | 1,622 | | | $ | 1,578 | | | $ | 247 | | | $ | 255 | |
| Change in plan assets: | | | | | | | |
| Fair value of plan assets as of January 1, | $ | 1,413 | | | $ | 1,991 | | | $ | 254 | | | $ | 538 | |
| Actual return on plan assets | 93 | | | (401) | | | 22 | | | (68) | |
| Employer contributions | 46 | | | 39 | | | 3 | | | 12 | |
| Plan participants' contributions | — | | | — | | | 3 | | | 3 | |
| VEBA transfer | — | | | — | | | — | | | (194) | |
| Divestiture | — | | | (74) | | | — | | | (9) | |
| Settlements | (3) | | | — | | | — | | | — | |
| Benefits paid | (118) | | | (142) | | | (24) | | | (28) | |
| Fair value of plan assets as of December 31, | $ | 1,431 | | | $ | 1,413 | | | $ | 258 | | | $ | 254 | |
| Funded value as of December 31, | $ | (191) | | | $ | (165) | | | $ | 11 | | | $ | (1) | |
| Amounts recognized on the balance sheet: | | | | | | | |
| Noncurrent asset | $ | 73 | | | $ | 75 | | | $ | 12 | | | $ | — | |
| Current liability | (2) | | | (5) | | | — | | | — | |
| Noncurrent liability | (262) | | | (235) | | | (1) | | | (1) | |
| Net amount recognized | $ | (191) | | | $ | (165) | | | $ | 11 | | | $ | (1) | |
Presented in the table below are the components of accumulated other comprehensive income and regulatory assets that have not been recognized as components of periodic benefit costs as of December 31:
| | | | Pension Benefits | | Other Benefits | | Pension Benefits | | Other Benefits |
| | 2020 | | 2019 | | 2020 | | 2019 |
| 2023 | | | 2023 | | 2022 | | 2023 | | 2022 |
| Net actuarial loss | Net actuarial loss | $ | 436 | | | $ | 435 | | | $ | 49 | | | $ | 72 | |
| Prior service credit | Prior service credit | (16) | | | (19) | | | (217) | | | (257) | |
| Net amount recognized | Net amount recognized | $ | 420 | | | $ | 416 | | | $ | (168) | | | $ | (185) | |
| | Regulatory assets (liabilities) | Regulatory assets (liabilities) | $ | 366 | | | $ | 375 | | | $ | (168) | | | $ | (185) | |
| Regulatory assets (liabilities) | |
| Regulatory assets (liabilities) | |
| Accumulated other comprehensive income | Accumulated other comprehensive income | 54 | | | 41 | | | 0 | | | 0 | |
| Total | Total | $ | 420 | | | $ | 416 | | | $ | (168) | | | $ | (185) | |
Presented in the tables below are the aggregate projected benefit obligation, accumulated benefit obligation and aggregate fair value of plan assets for pension plans with a projected obligation in excess of plan assets as of December 31, 20202023 and 2019:2022:
| | Projected Benefit Obligation Exceeds the Fair Value of Plans' Assets |
| | 2020 | | 2019 |
| Projected Benefit Obligation Exceeds the Fair Value of Plans' Assets | | | Projected Benefit Obligation Exceeds the Fair Value of Plans' Assets |
| 2023 | | | 2023 | | 2022 |
| Projected benefit obligation | Projected benefit obligation | $ | 2,386 | | | $ | 2,161 | |
| Fair value of plan assets | Fair value of plan assets | 1,990 | | | 1,748 | |
| | | | Accumulated Benefit Obligation Exceeds the Fair Value of Plans' Assets |
| | | 2020 | | 2019 |
| | | Accumulated Benefit Obligation Exceeds the Fair Value of Plans' Assets |
| 2023 | | | 2023 | | 2022 |
| Accumulated benefit obligation | Accumulated benefit obligation | $ | 2,188 | | | $ | 2,018 | |
| Fair value of plan assets | Fair value of plan assets | 1,990 | | | 1,748 | |
The accumulated postretirement plan assets exceed benefit obligations for all of the Company’s other postretirement benefit plans, except for the Northern Illinois Retiree Welfare Plan.Plan, of which the accumulated postretirement benefit obligation is inconsequential for all periods presented.
In 2006, theContributions
The PPA replaced the funding requirements for defined benefit pension plans by requiringrequires that defined benefit plans contribute to 100% of the current liability funding target over seven years. Defined benefit plans with a funding status of less than 80% of the current liability are defined as being “at risk” and additional funding requirements and benefit restrictions may apply. The PPA was effective for the 2008 plan year with short-term phase-in provisions for both the funding target and at-risk determination. The Company’s qualified defined benefit plan is currently funded above the at-risk threshold, and therefore the Company expects that the plans will not be subject to the “at risk” funding requirements of the PPA. The Company is proactively monitoring the plan’s funded status and projected contributions under the law to appropriately manage the potential impact on cash requirements.
Minimum funding requirements for the qualified defined benefit pension plan are determined by government regulations and not by accounting pronouncements. The Company plans to contribute amounts at least equal to or greater than the minimum required contributions or the normal cost in 20212024 to the qualified pension plans. Contributions may be in the form of cash contributions as well as available prefunding balances.
Presented in the table below is information about the expected cash flows for the pension and postretirement benefit plans:
| | | | | | | | | | | |
| Pension Benefits | | Other Benefits |
| 2021 expected employer contributions: | | | |
| To plan trusts | $ | 37 | | | $ | 0 | |
| To plan participants | 2 | | | 0 | |
| | | | | | | | | | | |
| Pension Benefits | | Other Benefits |
| 2024 expected employer contributions: | | | |
| To plan trusts | $ | 44 | | | $ | — | |
| To plan participants | 2 | | | — | |
Estimated Future Benefit Payments Presented in the table below are the net benefits expected to be paid from the plan assets or the Company’s assets:
| | | | | | | | | | | | | | | | | |
| | Pension Benefits | | Other Benefits |
| | Expected Benefit Payments | | Expected Benefit Payments | | Expected Federal Subsidy Payments |
| 2021 | $ | 127 | | | $ | 27 | | | $ | 1 | |
| 2022 | 128 | | | 27 | | | 1 | |
| 2023 | 133 | | | 27 | | | 1 | |
| 2024 | 135 | | | 27 | | | 1 | |
| 2025 | 137 | | | 26 | | | 1 | |
| 2026-2030 | 692 | | | 123 | | | 4 | |
| | | | | | | | | | | | | | | | | |
| | Pension Benefits | | Other Benefits |
| Expected Benefit Payments | | Expected Benefit Payments | | Expected Federal Subsidy Payments |
| 2024 | $ | 119 | | | $ | 23 | | | $ | 1 | |
| 2025 | 122 | | | 23 | | | 1 | |
| 2026 | 123 | | | 23 | | | 1 | |
| 2027 | 125 | | | 23 | | | 1 | |
| 2028 | 125 | | | 22 | | | 1 | |
| 2029-2033 | 617 | | | 96 | | | 3 | |
Because the above amounts are net benefits, plan participants’ contributions have been excluded from the expected benefits.
Assumptions
Accounting for pensions and other postretirement benefits requires an extensive use of assumptions about the discount rate, expected return on plan assets, the rate of future compensation increases received by the Company’s employees, mortality, turnover and medical costs. Each assumption is reviewed annually. The assumptions are selected to represent the average expected experience over time and may differ in any one year from actual experience due to changes in capital markets and the overall economy. These differences will impact the amount of pension and other postretirement benefit expense that the Company recognizes.
Presented in the table below are the significant assumptions related to the pension and other postretirement benefit plans:
| | | | Pension Benefits | | Other Benefits | | Pension Benefits | | Other Benefits |
| | | 2020 | | 2019 | | 2018 | | 2020 | | 2019 | | 2018 | | 2023 | | 2022 | | 2021 | | 2023 | | 2022 | | 2021 |
| Weighted average assumptions used to determine December 31 benefit obligations: | Weighted average assumptions used to determine December 31 benefit obligations: | | | | | | | | | | | | Weighted average assumptions used to determine December 31 benefit obligations: | | | | | |
| Discount rate | Discount rate | 2.74% | | 3.44% | | 4.38% | | 2.56% | | 3.36% | | 4.32% | Discount rate | 5.18% | | 5.58% | | 2.94% | | 5.22% | | 5.60% | | 2.90% |
| Rate of compensation increase | Rate of compensation increase | 3.51% | | 2.97% | | 3.00% | | N/A | | N/A | | N/A | Rate of compensation increase | 3.51% | | 3.51% | | N/A |
| Medical trend | Medical trend | N/A | | N/A | | N/A | | graded from | | graded from | | graded from | Medical trend | N/A | | N/A | | graded from |
| | | | | | | | | 6.25% in 2021 | | 6.50% in 2020 | | 6.75% in 2019 | | | | | | 6.75% in 2024 | | 7.00% in 2023 | | 6.00% in 2022 |
| | | | | | | | | to 5.00% in 2026+ | | to 5.00% in 2026+ | | to 5.00% in 2026+ | | | | | | to 5.00% in 2031+ | | to 5.00% in 2026+ |
| Weighted average assumptions used to determine net periodic cost: | Weighted average assumptions used to determine net periodic cost: | | | | | | | | | | | | Weighted average assumptions used to determine net periodic cost: | | | | | | | |
| Discount rate | Discount rate | 3.44% | | 4.38% | | 3.75% | | 3.36% | | 4.32% | | 4.23% | Discount rate | 5.58% | | 2.94% | | 2.74% | | 5.60% | | 2.90% | | 2.56% |
| Expected return on plan assets | Expected return on plan assets | 6.50% | | 6.20% | | 5.95% | | 3.68% | | 3.56% | | 4.77% | Expected return on plan assets | 6.79% | | 6.50% | | 5.00% | | 3.60% | | 3.67% |
| Rate of compensation increase | Rate of compensation increase | 2.97% | | 3.00% | | 3.02% | | N/A | | N/A | | N/A | Rate of compensation increase | 3.51% | | 3.51% | | N/A |
| Medical trend | Medical trend | N/A | | N/A | | N/A | | graded from | | graded from | | graded from | Medical trend | N/A | | N/A | | graded from |
| | | | | | | | | 6.50% in 2020 | | 6.75% in 2019 | | 7.00% in 2018 | | | | | | | | 7.00% in 2023 | | 6.00% in 2022 | | 6.25% in 2021 |
| | | | | | | | | to 5.00% in 2026+ | | to 5.00% in 2026+ | | to 4.50% in 2026+ | | | | | | to 5.00% in 2031+ | | to 5.00% in 2026+ |
NOTE “N/A” in the table above means assumption is not applicable.
The discount rate assumption was determined for the pension and postretirement benefit plans independently. The Company uses an approach that approximates the process of settlement of obligations tailored to the plans’ expected cash flows by matching the plans’ cash flows to the coupons and expected maturity values of individually selected bonds. Historically, for each plan, the discount rate was developed at the level equivalent rate that would produce the same present value as that using spot rates aligned with the projected benefit payments.
The expected long-term rate of return on plan assets is based on historical and projected rates of return, prior to administrative and investment management fees, for current and planned asset classes in the plans’ investment portfolios. Assumed projected rates of return for each of the plans’ projected asset classes were selected after analyzing historical experience and future expectations of the returns and volatility of the various asset classes. Based on the target asset allocation for each asset class, the overall expected rate of return for the portfolio was developed, adjusted for historical and expected experience of active portfolio management results compared to the benchmark returns. The Company’s pension expense increases as the expected return on assets decreases. The Company used ana weighted average expected return on plan assets of 6.50%6.79% to estimate its 20202023 pension benefit costs, and an expected blended return based on weighted assets of 3.68%5.00% to estimate its 20202023 other postretirement benefit costs.
The Company had previously adopted aFor the years ended December 31, 2023, 2022 and 2021, the Company’s mortality table based on the Society of Actuaries RP 2014 mortality table including a generational MP-2018 projection scale. In 2020, the Company adoptedassumption utilized the Pri-2012 base mortality table andwith the new MP-2020MP-2021 mortality improvement scale to replace the previous assumption.scale.
Components of Net Periodic Benefit Cost
Presented in the table below are the components of net periodic benefit costs for the years ended December 31:
| | | | | | | | | | | | | | | | | |
| | 2020 | | 2019 | | 2018 |
| Components of net periodic pension benefit cost: | | | | | |
| Service cost | $ | 31 | | | $ | 28 | | | $ | 34 | |
| Interest cost | 73 | | | 82 | | | 76 | |
| Expected return on plan assets | (111) | | | (91) | | | (97) | |
| Amortization of prior service (credit) cost | (3) | | | (3) | | | 1 | |
| Amortization of actuarial loss | 30 | | | 32 | | | 27 | |
Settlements (a) | 1 | | | 0 | | | 0 | |
| Net periodic pension benefit cost | $ | 21 | | | $ | 48 | | | $ | 41 | |
| Other changes in plan assets and benefit obligations recognized in other comprehensive income: | | | | | |
| Current year actuarial (gain) loss | $ | 12 | | | $ | (8) | | | $ | (60) | |
| Amortization of actuarial loss | (3) | | | (4) | | | (7) | |
| Total recognized in other comprehensive income | 9 | | | (12) | | | (67) | |
| Total recognized in net periodic benefit cost and other comprehensive income | $ | 30 | | | $ | 36 | | | $ | (26) | |
| Components of net periodic other postretirement benefit (credit) cost: | | | | | |
| Service cost | $ | 4 | | | $ | 4 | | | $ | 8 | |
| Interest cost | 12 | | | 15 | | | 20 | |
| Expected return on plan assets | (19) | | | (18) | | | (26) | |
| Amortization of prior service credit | (34) | | | (35) | | | (23) | |
| Amortization of actuarial loss | 2 | | | 3 | | | 3 | |
| Net periodic other postretirement benefit (credit) cost | $ | (35) | | | $ | (31) | | | $ | (18) | |
(a)Due to the amount of lump sum payment distributions from the Company’s New York Water Service Corporation Pension Plan, settlement charges of less than $1 million were recorded for the year ended December 31, 2020. There were no settlement charges recorded for the year ended December 31, 2019. In accordance with existing regulatory accounting treatment, the Company has maintained the settlement charges in regulatory assets on the Consolidated Balance Sheets. The amount is being amortized in accordance with existing regulatory practice.
The Company’s policy is to recognize curtailments when the total expected future service of plan participants is reduced by greater than 10% due to an event that results in terminations and/or retirements.
Cumulative gains and losses that are in excess of 10% of the greater of either the projected benefit obligation or the fair value of plan assets are amortized over the expected average remaining future service of the current active membership for the plans.
| | | | | | | | | | | | | | | | | |
| 2023 | | 2022 | | 2021 |
| Components of net periodic pension benefit cost (credit): | | | | | |
| Service cost | $ | 17 | | | $ | 30 | | | $ | 36 | |
| Interest cost | 85 | | | 64 | | | 64 | |
| Expected return on plan assets | (94) | | | (122) | | | (126) | |
| Amortization of prior service (credit) cost | (3) | | | (3) | | | (3) | |
| Amortization of actuarial loss | 13 | | | 21 | | | 27 | |
| Settlements | 1 | | | — | | | — | |
| Net periodic pension benefit cost (credit) | $ | 19 | | | $ | (10) | | | $ | (2) | |
| Other changes in plan assets and benefit obligations recognized in other comprehensive income: | | | | | |
| Current year actuarial (gain) loss | $ | 3 | | | $ | (14) | | | $ | 1 | |
| Amortization of actuarial loss | (4) | | | (3) | | | (4) | |
| Total recognized in other comprehensive income | (1) | | | (17) | | | (3) | |
| Total recognized in net periodic benefit cost (credit) and other comprehensive income | $ | 18 | | | $ | (27) | | | $ | (5) | |
| Components of net periodic other postretirement benefit (credit) cost: | | | | | |
| Service cost | $ | 2 | | | $ | 3 | | | $ | 4 | |
| Interest cost | 14 | | | 10 | | | 10 | |
| Expected return on plan assets | (12) | | | (19) | | | (21) | |
| Amortization of prior service credit | (31) | | | (31) | | | (32) | |
| Amortization of actuarial loss | 2 | | | — | | | — | |
| Net periodic other postretirement benefit (credit) cost | $ | (25) | | | $ | (37) | | | $ | (39) | |
Savings Plans for Employees
The Company maintains 401(k) savings plans that allow employees to save for retirement on a tax-deferred basis. Employees can make contributions that are invested at their direction in one or more funds. The Company makes matching contributions based on a percentage of an employee’s contribution, subject to certain limitations. Due to the Company’s discontinuing new entrants into the defined benefit pension plan, on January 1, 2006, the Company began providing an additional 5.25% of base pay defined contribution benefit for union employees hired on or after January 1, 2001 and non-union employees hired on or after January 1, 2006. The Company’s 401(k) savings plan expenses totaled $12$14 million, $12$13 million and $12$14 million for 2020, 20192023, 2022 and 2018,2021, respectively. Additionally, the Company’s 5.25% of base pay defined contribution benefit expenses totaled $15$17 million, $13$16 million and $11$16 million for 2020, 20192023, 2022 and 2018,2021, respectively. All of the Company’s contributions are invested in one or more funds at the direction of the employees.
Note 17:16: Commitments and Contingencies
Commitments have been made in connection with certain construction programs. The estimated capital expenditures required under legal and binding contractual obligations amounted to $484$902 million as of December 31, 2020.2023.
The Company’s regulated subsidiaries maintain agreements with other water purveyors for the purchase of water to supplement their water supply. Presented in the table below are the future annual commitments related to minimum quantities of purchased water having non-cancelable contracts:
| | Amount |
| 2021 | $ | 66 | |
| 2022 | 67 | |
| 2023 | 66 | |
| Amount | | | Amount |
| 2024 | 2024 | 52 | |
| 2025 | 2025 | 52 | |
| 2026 | |
| 2027 | |
| 2028 | |
| Thereafter | Thereafter | 618 | |
The Company enters into agreements for the provision of services to water and wastewater facilities for the U.S. military, municipalities and other customers. See Note 5—4—Revenue Recognition for additional information regarding the Company’s performance obligations.
Contingencies
The Company is routinely involved in legal actions incident to the normal conduct of its business. As of December 31, 2020,2023, the Company has accrued approximately $10$6 million of probable loss contingencies and has estimated that the maximum amount of lossesloss associated with reasonably possible loss contingencies thatassociated with such actions, which can be reasonably estimated, is $4$3 million. For certain matters, claims andlegal actions, the Company is unable to estimate possible losses. The Company believes that damages or settlements, if any, recovered by plaintiffs in such matters, claims orlegal actions, other than as described in this Note 17—16—Commitments and Contingencies, will not have a material adverse effect on the Company.
West Virginia Elk River Freedom Industries Chemical Spill
On June 8, 2018, the U.S. District Court for the Southern District of West Virginia granted final approval of a settlement class and global class action settlement (the “Settlement”) for all claims and potential claims by all class members (collectively, the “West Virginia Plaintiffs”) arising out of the January 2014 Freedom Industries, Inc. chemical spill in West Virginia. The effective date of the Settlement was July 16, 2018. Under the terms and conditions of the Settlement, the Company’s West Virginia subsidiary (“WVAWC”) and certain other Company affiliated entities (collectively, the “West Virginia-American Water Defendants”)did not admit, and will not admit, any fault or liability for any of the allegations made by the West Virginia Plaintiffs in any of the actions that were resolved.
The aggregate pre-tax amount contributed by WVAWC of the $126 million portion of the Settlement with respect to the Company, net of insurance recoveries, is $19 million. As of December 31, 2020, $0.5 million of the aggregate Settlement amount of $126 million has been reflected in accrued liabilities, and $0.5 million in offsetting insurance receivables have been reflected in other current assets on the Consolidated Balance Sheets. The amount reflected in accrued liabilities as of December 31, 2020 reflects reductions in the liability and appropriate reductions to the offsetting insurance receivable reflected in other current assets, associated with payments made to the Settlement fund, the receipt of a determination by the Settlement fund’s appeal adjudicator on all remaining medical claims and the calculation of remaining attorneys’ fees and claims administration costs. The Company funded WVAWC’s contributions to the Settlement through existing sources of liquidity.
Dunbar, West Virginia Water Main Break Class Action Litigation
On the evening of June 23, 2015, a 36-inch pre-stressed concrete transmission water main, installed in the early 1970s, failed. The water main is part of the West Relay pumping station located in the City of Dunbar, West Virginia and owned by WVAWC.the Company’s West Virginia subsidiary (“WVAWC”). The failure of the main caused water outages and low pressure for up to approximately 25,000 WVAWC customers. In the early morning hours of June 25, 2015, crews completed a repair, but that same day, the repair developed a leak. On June 26, 2015, a second repair was completed, and service was restored that day to approximately 80% of the impacted customers, and to the remaining approximately 20% by the next morning. The second repair showed signs of leaking, but the water main was usable until June 29, 2015, to allow tanks to refill. The system was reconfigured to maintain service to all but approximately 3,000 customers while a final repair was being completed safely on June 30, 2015. Water service was fully restored by July 1, 2015, to all customers affected by this event.
On June 2, 2017, a complaint captioned Jeffries, et al. v. West Virginia-American Water Company was filed in West Virginia Circuit Court in Kanawha County on behalf of an alleged class of residents and business owners who lost water service or pressure as a result of the Dunbar main break. The complaint alleges breach of contract by WVAWC for failure to supply water, violation of West Virginia law regarding the sufficiency of WVAWC’s facilities and negligence by WVAWC in the design, maintenance and operation of the water system. The Jeffries plaintiffs seek unspecified alleged damages on behalf of the class for lost profits, annoyance and inconvenience, and loss of use, as well as punitive damages for willful, reckless and wanton behavior in not addressing the risk of pipe failure and a large outage.
OnIn February 4, 2020, the Jeffries plaintiffs filed a motion seeking class certification on the issues of breach of contract and negligence, and to determine the applicability of punitive damages and a multiplier for those damages if imposed. OnIn July 14, 2020, the Circuit Court entered an order granting the Jeffries plaintiffs’ motion for certification of a class regarding certain liability issues but denying certification of a class to determine a punitive damages multiplier. OnIn August 31, 2020, WVAWC filed a Petition for Writ of Prohibition in the Supreme Court of Appeals of West Virginia seeking to vacate or remand the Circuit Court’s order certifying the issues class. At the request of the parties, on September 10, 2020, the Circuit Court ordered the stay of all matters in the class proceeding pending consideration of this petition. On December 3, 2020, the Supreme Court of Appeals issued an order to show cause stating that there are sufficient grounds for oral argument to consider prohibiting the class certification order. OnIn January 28, 2021, the Supreme Court of Appeals granted a motion by the Jeffries plaintiffs to remandremanded the case back to the Circuit Court for further consideration in light of a recent Supreme Court of Appeals decision issued in another case relating to the class certification issues raised.raised on appeal. In July 2022, the Circuit Court entered an order again certifying a class to address at trial certain liability issues but not to consider damages. In August 2022, WVAWC filed another Petition for Writ of Prohibition in the Supreme Court of Appeals of West Virginia challenging the West Virginia Circuit Court’s July 2022 order, which petition was denied on June 8, 2023. On August 21, 2023, the Circuit Court set a date of September 9, 2024, for a class trial on issues relating to duty and breach of that duty. The trial will not find class-wide or punitive damages.
The Company and WVAWC believe that WVAWC has valid, meritorious defenses to the claims raised in this class action complaint. WVAWC is vigorously defending itself against these allegations. TheGiven the current stage of this proceeding, the Company cannot currently determine the likelihood of a loss, if any, orreasonably estimate the amount of any reasonably possible loss or a range of such lossesloss related to this proceeding.
Chattanooga, Tennessee Water Main Break Class Action Litigation
On September 12, 2019, the Company’s Tennessee subsidiary (“TAWC”), experienced a leak in a 36-inch water transmission main, which caused service fluctuations or interruptions to TAWC customers and the issuance of a boil water notice. TAWC repaired the main by early morning on September 14, 2019, and restored full water service by the afternoon of September 15, 2019, with the boil water notice lifted for all customers on September 16, 2019.
On September 17, 2019, a complaint captioned Bruce, et al. v. American Water Works Company, Inc., et al. was filed in the Circuit Court of Hamilton County, Tennessee against TAWC, the Company and American Water Works Service Company, Inc. (“Service Company,”Company” and, together with TAWC and the Company, collectively, the “Tennessee-American Water Defendants”), on behalf of a proposed class of individuals or entities who lost water service or suffered monetary losses as a result of the Chattanooga incident (the “Tennessee Plaintiffs”). The complaint alleged breach of contract and negligence against the Tennessee-American Water Defendants, as well as an equitable remedy of piercing the corporate veil. In the complaint as originally filed, the Tennessee Plaintiffs were seeking an award of unspecified alleged damages for wage losses, business and economic losses, out-of-pocket expenses, loss of use and enjoyment of property and annoyance and inconvenience, as well as punitive damages, attorneys’ fees and pre- and post-judgment interest.
On November 22, 2019, the Tennessee-American Water Defendants filed a motion to dismiss the complaint for failure to state a claim upon which relief may be granted, and, with respect to the Company, for lack of personal jurisdiction. Oral argument on the motion to dismiss took place on In September 9, 2020. On September 18, 2020, the court (i) granted the motion to dismiss the Tennessee Plaintiffs’ negligence claim against all Tennessee-American Water Defendants, (ii) denied the motion to dismiss the breach of contract claim against TAWC, (iii) held in abeyance the motion to dismiss the breach of contract claims against the Company and Service Company pending a further hearing and (iv) held in abeyance the Company’s motion to dismiss the complaint for lack of personal jurisdiction. On September 24, 2020, at the request of the Tennessee Plaintiffs, the court dismissed without prejudice all claims in the Bruce complaint against the Company and Service Company. The impact of the September 2020 court orders was that all of the Tennessee Plaintiffs’ claims in thistheir complaint, were dismissed, other thanexcept for the breach of contract claims against TAWC. OnTAWC, which remain pending. In October 16, 2020, TAWC answered the complaint, and the parties are commencing withhave been engaging in discovery. On January 12, 2023, after hearing oral argument, the court issued an oral ruling denying the Tennessee Plaintiffs’ motion for class certification. On February 9, 2023, the Tennessee Plaintiffs sought reconsideration of the ruling by the court, and any final ruling is appealable to the Tennessee Court of Appeals, as allowed under Tennessee law. On September 21, 2023, the court upheld its prior ruling but gave the Tennessee Plaintiffs the option to file an amended class definition. On October 12, 2023, the Tennessee Plaintiffs filed an amended class definition seeking certification of a business customer-only class. On December 1, 2023, TAWC filed a memorandum in opposition to the amended class definition. On January 18, 2024, the court heard oral argument on the motions but issued no decision. The court instead requested additional briefing and a second oral argument, deadlines for which have not yet been set.
TAWCThe Company and the CompanyTAWC believe that TAWC has valid, meritorious defenses to the claims raised in this class action complaint, andcomplaint. TAWC is vigorously defending itself against these allegations. TheGiven the current stage of this proceeding, the Company cannot currently determine the likelihood of a loss, if any, or estimate the amount of any loss or a range of such lossesloss related to this proceeding..proceeding.
Mountaineer Gas Company Main Break
During the afternoon of November 10, 2023, WVAWC was informed that an 8-inch ductile iron water main owned by WVAWC, located on the West Side of Charleston, West Virginia and originally installed in approximately 1989, experienced a leak. In the early morning hours of November 11, 2023, WVAWC crews successfully completed a repair to the water main. A precautionary boil water advisory was issued the same day to approximately 300 WVAWC customers and ultimately lifted on November 12, 2023.
On November 10, 2023, a break was reported in a low-pressure natural gas main located near the affected WVAWC water main, and an inflow of water into the natural gas main and associated delivery pipelines occurred. The natural gas main and pipelines are owned by Mountaineer Gas Company, a regulated natural gas distribution company serving over 220,000 customers in West Virginia (“Mountaineer Gas”). The resulting inflow of water into the natural gas main and related pipelines resulted in a loss of natural gas service to approximately 1,100 Mountaineer Gas customers, as well as water entering customer service lines and certain natural gas appliances owned or used by some of the affected Mountaineer Gas customers. Mountaineer Gas reported that restoration of natural gas service to all affected gas mains occurred on November 24, 2023. The timing, order and causation of both the WVAWC water main break and Mountaineer Gas’s main break are currently unknown and under investigation.
To date, a total of four pending lawsuits have been filed against Mountaineer Gas and WVAWC purportedly on behalf of customers in Charleston, West Virginia related to these incidents. On November 14, 2023, a complaint captioned Ruffin et al. v. Mountaineer Gas Company and West Virginia-American Water Company was filed in West Virginia Circuit Court in Kanawha County on behalf of an alleged class of Mountaineer Gas residential and business customers and other households and businesses supplied with natural gas in Kanawha County, which lost natural gas service on November 10, 2023, as a result of these events. The complaint alleges, among other things, breach of contract by Mountaineer Gas, trespass by WVAWC, nuisance by WVAWC, violation of statutory obligations by Mountaineer Gas and WVAWC, and negligence by Mountaineer Gas and WVAWC. The complaint seeks class-wide damages against Mountaineer Gas and WVAWC for loss of use of natural gas, annoyance, inconvenience and lost profits, as well as punitive damages.
On November 15, 2023, a complaint captioned Toliver et al. v. West Virginia-American Water Company and Mountaineer Gas Company was filed in West Virginia Circuit Court in Kanawha County on behalf of an alleged class of all natural persons or entities who are citizens of the State of West Virginia and who are customers of WVAWC and/or Mountaineer Gas in the affected areas. The complaint alleges against Mountaineer Gas and WVAWC, among other things, negligence, nuisance, trespass and strict liability, as well as breach of contract against Mountaineer Gas. The complaint seeks class-wide damages against Mountaineer Gas and WVAWC for property damage, loss of use and enjoyment of property, annoyance and inconvenience and business losses, as well as punitive damages.
On November 16, 2023, a complaint captioned Dodson et al. v. West Virginia American Water and Mountaineer Gas Company was filed in West Virginia Circuit Court in Kanawha County on behalf of an alleged class of all West Virginia citizens living between Pennsylvania Avenue south of Washington Street, and Iowa Street, who are customers of Mountaineer Gas. The complaint alleges against Mountaineer Gas and WVAWC, among other things, negligence, nuisance, trespass, statutory code violations and unfair or deceptive business practices. The complaint seeks class-wide damages against Mountaineer Gas and WVAWC for property loss and damage, loss of use and enjoyment of property, mental and emotional distress, and aggravation and inconvenience, as well as punitive damages.
On January 4, 2024, a fourth complaint, captioned Thomas v. West Virginia-American Water Company and Mountaineer Gas Company, was filed in West Virginia Circuit Court in Kanawha County asserting similar allegations as those included in the Ruffin, Toliver and Dodson lawsuits (the “first three lawsuits”), with the addition of counts alleging unjust enrichment and violations of the West Virginia Human Rights Act and the West Virginia Consumer Credit and Protection Act.
On November 17, 2023, the Ruffin plaintiff filed a motion to consolidate the first three lawsuits before a single judge in Kanawha County Circuit Court. That motion remains pending.
On December 5, 2023, a complaint captioned Mountaineer Gas Company v. West Virginia-American Water Company was filed in West Virginia Circuit Court in Kanawha County seeking damages under theories of trespass, negligence and implied indemnity. The damages being sought related to the incident include, among other things, repair and response costs incurred by Mountaineer Gas and attorneys’ fees and expenses incurred by Mountaineer Gas. On December 14, 2023, Mountaineer Gas filed a motion with the Supreme Court of West Virginia to transfer this case to the West Virginia Business Court. On December 29, 2023, WVAWC filed a joinder in the motion to transfer the case. WVAWC has also filed a partial motion to dismiss this lawsuit. These motions remain pending.
On December 20, 2023, Mountaineer Gas filed answers to each of the first three lawsuits, which included cross-claims against WVAWC alleging that Mountaineer Gas is without fault for the claims and damages alleged in the lawsuits and WVAWC should be required to indemnify Mountaineer Gas for any damages and for attorneys’ fees and expenses incurred by Mountaineer Gas in the lawsuits. WVAWC has filed a partial motion to dismiss certain claims in the Ruffin, Toliver,Dodson and Thomas lawsuits and a motion to dismiss the cross-claims asserted against WVAWC therein by Mountaineer Gas. On January 30, 2024, a motion was filed with the West Virginia Supreme Court on behalf of the Toliver plaintiff to refer the four class action complaints and the Mountaineer Gas complaint to the West Virginia Mass Litigation Panel. On February 7, 2024, WVAWC filed a motion joining in that referral request. These motions remain pending.
On December 6, 2023, WVAWC initiated a process whereby Mountaineer Gas customers could file claims with WVAWC and seek payment from WVAWC of up to $2,000 per affected household for the inconvenience arising from a loss of use of their appliances and documented out-of-pocket expenses as a result of the natural gas outage. As of January 31, 2024, a total of 412 Mountaineer Gas customers completed this claims process and were paid by WVAWC an average of approximately $1,500 each. In return, these customers were required to execute a partial release of liability in favor of WVAWC.
On November 16, 2023, the Public Service Commission of West Virginia (the “WVPSC”) issued an order initiating a general investigation into both the water main break and natural gas outages occurring in this incident to determine the cause or causes thereof, as well as breaks and outages generally throughout the systems of WVAWC and Mountaineer Gas and the utility practices of both utilities. Following a series of disagreements among the parties regarding the scope of discovery, the WVPSC closed the general investigation into both utilities and ordered a separate general investigation for each utility. The WVPSC focused the two general investigations away from the cause of the events and instead on the maintenance practices of each utility during and after the main breaks. On January 29, 2024, the Consumer Advocate Division of the WVPSC filed a motion to intervene in the WVAWC general investigation. WVAWC is cooperating with its general investigation. Both general investigations remain pending.
The Company and WVAWC believe that the causes of action and other claims asserted against WVAWC in the class action complaints and the lawsuit filed by Mountaineer Gas are without merit and that WVAWC has meritorious defenses to such claims, and WVAWC is defending itself vigorously in these litigation proceedings. Given the current stage of these proceedings and the general investigation, the Company and WVAWC are currently unable to predict the outcome of any of the proceedings described above, and the Company cannot currently determine the likelihood of a loss, if any, or estimate the amount of any loss or a range of loss related to this proceeding.
Alternative Water Supply in Lieu of Carmel River Diversions
Compliance with Orders to Reduce Carmel River Diversions—Monterey Peninsula Water Supply Project
Under a 2009 order (the “2009 Order”) of the State Water Resources Control Board (the “SWRCB”), the Company’s California subsidiary (“Cal Am”) is required to decrease significantly its yearly diversions of water from the Carmel River according to a set reduction schedule. In 2016, the SWRCB issued an order (the “2016 Order”Order,” and, together with the 2009 Order, the “Orders”) approving a deadline of December 31, 2021, for Cal Am’s compliance with these prior orders (the “2021 Deadline”).orders.
Cal Am is currently involved in developing the Monterey Peninsula Water Supply Project (the “Water Supply Project”), which includes the construction of a desalination plant, to be owned by Cal Am, and the construction of wells that would supply water to the desalination plant. In addition, the Water Supply Project also includes Cal Am’s purchase of water from a groundwater replenishment project (the “GWR Project”) between Monterey One Water and the Monterey Peninsula Water Management District (the “MPWMD”). The Water Supply Project is intended, among other things, to fulfill Cal Am’s obligations under the 2009 Order and the 2016 Order.Orders.
Cal Am’s ability to move forward on the Water Supply Project is subject to administrative review by the California Public Utilities Commission (the “CPUC”)CPUC and other government agencies, obtaining necessary permits, and intervention from other parties. In September 2016, the CPUC unanimously approved a final decision to authorize Cal Am to enter into a water purchase agreement for the GWR Project and to construct a pipeline and pump station facilities and recover up to the incurred $50 million in associated incurred costs, plus AFUDC, subject to meeting certain criteria.
In September 2018, the CPUC unanimously approved another final decision finding that (i) the Water Supply Project meets the CPUC’s requirements for a certificate of public convenience and necessity (ii) the issuance of the final decision should not be delayed, and (iii) an additional procedural phase was not necessary to consider alternative projects. The CPUC’s 2018 decision concludes that the Water Supply Project is the best project to address estimated future water demands in Monterey, and, in addition to the cost recovery approved in its 2016 decision, adopts Cal Am’s cost estimates for the Water Supply Project, which amounted to an aggregate of $279 million plus AFUDC at a rate representative of Cal Am’s actual financing costs. The 2018 final decision specifies the procedures for recovery of all of Cal Am’s prudently incurred costs associated with the Water Supply Project upon its completion, subject to the frameworks included in the final decision related to cost caps, operation and maintenance costs, financing, ratemaking and contingency matters. The reasonableness of the Water Supply Project costs will be reviewed inby the first general rate case filed byCPUC when Cal Am after it becomes operational.seeks cost recovery for the Water Supply Project. Cal Am is also required to implement mitigation measures to avoid, minimize or offset significant environmental impacts from the construction and operation of the Water Supply Project and comply with a mitigation monitoring and reporting program, a reimbursement agreement for CPUC costs associated with that program, and reporting requirements on plant operations following placement of the Water Supply Project in service. Cal Am has incurred $154$241 million in aggregate costs as of December 31, 20202023, related to the Water Supply Project, which includes $36$72 million in AFUDC.
In September 2021, Cal Am, Monterey One Water and the MPWMD reached an agreement on Cal Am’s purchase of additional water from an expansion to the GWR Project, which is not expected to produce additional water until 2024 at the earliest.On December 5, 2022, the CPUC issued a final decision that authorized Cal Am to enter into the amended water purchase agreement, and specifically to increase pumping capacity and reliability of groundwater extraction from the Seaside Groundwater Basin. The final decision sets the cost cap for the proposed facilities at approximately $62 million. Cal Am may seek recovery of amounts above the cost cap in a subsequent rate filing or general rate case. Additionally, the final decision authorizes AFUDC at Cal Am’s actual weighted average cost of debt for most of the facilities. On December 30, 2022, Cal Am filed with the CPUC an application for rehearing of the CPUC’s December 5, 2022, final decision, and on March 30, 2023, the CPUC issued a decision denying Cal Am’s application for rehearing, but adopting its proposed AFUDC for already incurred and future costs. This decision also provided Cal Am the opportunity to serve supplemental testimony to increase its cost cap for certain of the Water Supply Project’s extraction wells. The amended water purchase agreement and a memorandum of understanding to negotiate certain milestones related to the expansion of the GWR Project have been signed by the relevant parties. Further hearings were scheduled in a Phase 2 to this CPUC proceeding to focus on updated supply and demand estimates for the Water Supply Project, and Phase 2 testimony was completed in September 2022. On October 23, 2023, a status conference was held to determine procedural steps to conclude the proceeding, and further evidentiary hearings have been scheduled for March 2024.
While Cal Am believes that its expenditures to date have been prudent and necessary to comply with the 2009 Order and the 2016 Order,Orders, as well as the CPUC’s 2016 and 2018relevant final decisions of the CPUC related thereto, Cal Am cannot currently predict its ability to recover all of its costs and expenses associated with the Water Supply Project and there can be no assurance that Cal Am will be able to recover all of such costs and expenses in excess of the $50$112 million in aggregate construction costs, plus applicable AFUDC, previously approved by the CPUC in its 2016 final decision and its December 2022 final decision, as amended by its March 30, 2023 rehearing decision.
Coastal Development Permit Application
In June 2018, Cal Am submitted a coastal development permit application (the “Marina Application”) to the City of Marina (the “City”) for those project components of the Water Supply Project located within the City’s coastal zone. Members of the City’s Planning Commission, as well as City councilpersons, have publicly expressed opposition to the Water Supply Project. In May 2019, the City issued a notice of final local action based upon the denial by the Planning Commission of Cal Am’s coastal development permit application.the Marina Application. Thereafter, Cal Am appealed this decision to the California Coastal Commission, (the “Coastal Commission”), as permitted under the City’s code and the California Coastal Act. At the same time, Cal Am submitted an application (the “Original Jurisdiction Application”) to the Coastal Commission for a coastal development permit for those project components located within the Coastal Commission’s original jurisdiction. In October 2019, staff of the Coastal Commission issued a report recommending a denial of Cal Am’s application for a coastal development permit with respect to the Water Supply Project, largely based on a memorandum prepared by the general manager of the MPWMD that contradicted findings made by the CPUC in its final decision approving the Water Supply Project. In November 2019, discussions between staffs of the Coastal Commission and the CPUC took place regarding theAfter Coastal Commission staff recommendation, at which time the CPUC raised questions about the Coastal Commission staff’s findings on water supply and demand, groundwater impacts and the viability of a project that the Coastal Commission staff believes may be a possible alternative to the Water Supply Project.
On August 25, 2020, the staff of the Coastal Commission released a report againissued reports recommending denial of Cal Am’s application for a coastal development permit. Although the report concluded that the Water Supply Project would have a negligible impactOriginal Jurisdiction Application, noting potential impacts on groundwater resources, the report also concluded it would impact other coastal resources, such as environmentally sensitive habitat areas and wetlands and that the Coastal Commission staff believes that a feasible alternative project exists that would avoid those impacts. The staff’s report also notedpossible disproportionate impacts to communities of concern. Onconcern, in September 16, 2020, Cal Am withdrew its original jurisdiction application to allow additional timethe Original Jurisdiction Application in order to address the Coastal Commission staff’s environmental justice concerns. The withdrawal of the original jurisdiction applicationOriginal Jurisdiction Application did not impact Cal Am’s appeal of the City’s denial of the Marina Application, which remains pending before the Coastal Commission. In November 2020, Cal Am refiled the original jurisdiction applicationOriginal Jurisdiction Application.
In October 2022, Cal Am announced a phasing plan for the proposed desalination plant component of the Water Supply Project. The desalination plant and slant wells originally approved by the CPUC would produce up to 6.4 million gallons of desalinated water per day. Under the phased approach, the facilities would initially be constructed to produce up to 4.8 million gallons per day of desalinated water, enough to meet anticipated demand through about 2030, and would limit the number of slant wells initially constructed. As demand increases in the future, desalination facilities would be expanded to meet the additional demand. The phased approach seeks to meet near-term demand by allowing for additional supply as it becomes needed, while also providing an opportunity for regional future public participation and was developed by Cal Am based on feedback received from the community.
In November 6, 2020. On December 3, 2020,2022, the Coastal Commission sentapproved the Marina Application and the Original Jurisdiction Application with respect to the phased development of the proposed desalination plant, subject to compliance with a number of conditions, all of which Cal Am expects to satisfy. In December 2022, the City, Marina Coast Water District (“MCWD”), MCWD’s groundwater sustainability agency, and the MPWMD jointly filed a petition for writ of mandate in Monterey County Superior Court against the Coastal Commission, alleging that the Coastal Commission violated the California Coastal Act and the California Environmental Quality Act in issuing a coastal development permit to Cal Am a noticefor construction of incomplete application, identifying certain additional information needed to consider the application complete.slant wells. Cal Am is preparingnamed as a response toreal party in interest. On November 14, 2023, the Coastal Commission’s notice.court set an initial trial date of May 1, 2024. This matter remains pending.
Following the issuance of the coastal development permit, Cal Am continues to work constructively with all appropriate agencies to provide necessary information in connection with obtaining the remaining required approvalspermits for the Water Supply Project. However, based on the foregoing, there can be no assurance that the Water Supply Project in its current configuration will be completed on a timely basis, if ever. Due toFor the delay in the approval schedule,year ended December 31, 2023, Cal Am currently does not believe that it will be able to fully complyhas complied with the diversion reduction requirementslimitations contained in the 2016 Order. Continued compliance with the diversion limitations in 2024 and other remaining requirements under the 2009 Orderfuture years may be impacted by a number of factors, including without limitation potential recurrence of drought conditions in California and the 2016 Order, includingexhaustion of water supply reserves, and will require successful development of alternate water supply sources sufficient to meet customer demand. The Orders remain in effect until Cal Am certifies to the 2021 Deadline.SWRCB, and the SWRCB concurs, that Cal Am has obtained a permanent supply of water to substitute for past unauthorized Carmel River diversions. While the Company cannot currently predict the likelihood or result of any adverse outcome associated with these matters, further attempts to comply with the 2009 Order and the 2016 Order, or the 2021 Deadline,Orders may result in material additional costs and obligations to Cal Am, including fines and penalties against Cal Am in the event of noncompliance with the 2009 OrderOrders.
Proposed Acquisition of Monterey System Assets — Potential Condemnation
Local Agency Formation Commission Litigation
The water system assets of Cal Am located in Monterey, California (the “Monterey system assets”) are the subject of a potential condemnation action by the MPWMD stemming from a November 2018 public ballot initiative. In 2019, the MPWMD issued a preliminary valuation and cost of service analysis report, finding in part that (1) an estimate of the Monterey system assets’ total value plus adjustments would be approximately $513 million, (2) the cost of service modeling results indicate significant annual reductions in revenue requirements and projected monthly water bills, and (3) the acquisition of the Monterey system assets by the MPWMD would be economically feasible. In 2020, the MPWMD certified a final environmental impact report, analyzing the environmental impacts of the MPWMD’s project to (1) acquire the Monterey system assets through the power of eminent domain, if necessary, and (2) expand its geographic boundaries to include all parts of this system.
In February 2021, the MPWMD filed an application with the Local Agency Formation Commission of Monterey County (“LAFCO”) seeking approval to become a retail water provider and annex approximately 58 parcels of land into the MPWMD’s boundaries. In June 2021, LAFCO’s commissioners voted to require a third-party independent financial study as to the feasibility of an acquisition by the MPWMD of the Monterey system assets. In December 2021, LAFCO’s commissioners denied the MPWMD’s application to become a retail water provider, determining that the MPWMD does not have the authority to proceed with a condemnation of the Monterey system assets. In April 2022, the MPWMD filed a lawsuit against LAFCO challenging its decision to deny the MPWMD’s application seeking approval to become a retail water provider. In June 2022, the court granted, with conditions, a motion by Cal Am to intervene in the MPWMD’s lawsuit against LAFCO. In December 2022, the court sustained in part, and denied in part, demurrers that had been filed by LAFCO seeking to dismiss the MPWMD’s lawsuit.
On December 11, 2023, the Monterey County Superior Court issued a writ of mandate directing LAFCO to vacate and set aside its original denial of the MPWMD’s application to serve as a retail water provider (in conjunction with its effort to acquire the Monterey water system assets) and to reconsider the application in compliance with all applicable law. The court held that LAFCO incorrectly applied two statutory standards and noted a lack of sufficient evidence to support certain of LAFCO’s factual findings. As a result, the LAFCO denial has been nullified and LAFCO will be required to hold another hearing on the MPWMD’s application. On February 8, 2024, and February 9, 2024, respectively, Cal Am and LAFCO each filed a notice of appeal with the California Court of Appeals regarding the Monterey County Superior Court’s decision to issue the writ of mandate. Cal Am is evaluating potential additional actions to contest the writ of mandate and to seek to uphold LAFCO’s denial of the MPWMD’s application, including filing other challenges and/or making suitable presentations at a subsequent LAFCO rehearing.
Potential Condemnation Actions by MPWMD
Separate from the proceedings related to the MPWMD’s application with LAFCO, by letter dated October 3, 2022, the MPWMD notified Cal Am of a decision to appraise the Monterey system assets and requesting access to a number of Cal Am’s properties and documents to assist the MPWMD with such an appraisal. Cal Am responded by letter on October 24, 2022, denying the request for access, stating that the MPWMD does not have the right to appraise Cal Am’s system without LAFCO approval to become a retail water provider. On April 28, 2023, Cal Am rejected an offer by the MPWMD to purchase the Monterey system assets for $448.8 million. Over the written and oral objections of Cal Am, at a hearing held on October 10, 2023, the MPWMD adopted a resolution of necessity to authorize it to file an eminent domain lawsuit with respect to the Monterey system assets. On December 15, 2023, the MPWMD filed a lawsuit in Monterey County Superior Court seeking to condemn the Monterey system assets.While the Company cannot currently predict the outcome of this lawsuit, the Company believes that, given existing legal precedent related to similar attempts by public agencies in California to take over water systems and its other defenses, Cal Am should be able to defend itself successfully against the MPWMD’s eminent domain lawsuit.
West Virginia Elk River Freedom Industries Chemical Spill
On June 8, 2018, the U.S. District Court for the Southern District of West Virginia granted final approval of a settlement class and global class action settlement (the “Settlement”) for all claims and potential claims by all class members (collectively, the “West Virginia Plaintiffs”) arising out of the January 2014 Freedom Industries, Inc. chemical spill in West Virginia. The effective date of the Settlement was July 16, 2018. Under the terms and conditions of the Settlement, WVAWC and certain other Company affiliated entities did not admit, and will not admit, any fault or liability for any of the allegations made by the West Virginia Plaintiffs in any of the actions that were resolved.
As of December 31, 2023, $0.5 million of the aggregate Settlement amount of $126 million remains reflected in accrued liabilities, and $0.5 million in an offsetting insurance receivable remains reflected in other current assets on the Consolidated Balance Sheets pending resolution of all asserted actual or potential claims associated with this matter. The amount reflected in accrued liabilities reflects the status of the liability and the 2016 Order.offsetting insurance receivable reflected in other current assets, each as of December 31, 2023.
Note 18:17: Earnings per Common Share
Presented in the table below is a reconciliation of the numerator and denominator for the basic and diluted earnings per share (“EPS”) calculations for the years ended December 31:
| | | 2020 | | 2019 | | 2018 |
| 2023 | | | 2023 | | 2022 | | 2021 |
| Numerator: | Numerator: | | | | | | Numerator: | | | |
| Net income attributable to common shareholders | Net income attributable to common shareholders | $ | 709 | | | $ | 621 | | | $ | 567 | |
| | Denominator: | Denominator: | | | | | |
| Denominator: | |
| Denominator: | | | | |
| Weighted average common shares outstanding—Basic | Weighted average common shares outstanding—Basic | 181 | | | 181 | | | 180 | |
| Effect of dilutive common stock equivalents | Effect of dilutive common stock equivalents | 1 | | | 0 | | | 0 | |
| Weighted average common shares outstanding—Diluted | Weighted average common shares outstanding—Diluted | 182 | | | 181 | | | 180 | |
The effect of dilutive common stock equivalents is related to outstanding stock options, RSUs and PSUs granted under the Company’s 2007 Plan and outstanding RSUs and PSUs granted under the Company’s 2017 Omnibus Equity Compensation Plan, as well as estimated shares to be purchased under the Company’s 2017 Nonqualified Employee Stock Purchase Plan.ESPP. Less than 1000000one million share-based awards were excluded from the computation of diluted EPS for the years ended December 31, 2020, 20192023, 2022 and 2018,2021, because their effect would have been anti-dilutive under the treasury stock method.
The if-converted method is applied to the Notes issued in June 2023 for computing diluted EPS. For all periods presented, there was no dilution resulting from the Notes. See Note 11—Long-Term Debt for additional information relating to the Notes.
Note 19:18: Fair Value of Financial Information
Fair Value of Financial Instruments
The following methods and assumptions were used by the Company in estimating its fair value disclosures for financial instruments:
Current assets and current liabilities—The carrying amounts reported on the Consolidated Balance Sheets for current assets and current liabilities, including revolving credit debt, due to the short-term maturities and variable interest rates, approximate their fair values.
Secured seller promissory note from the sale of HOS — The carrying amount reported on the Consolidated Balance Sheets for the secured seller promissory note, included as part of the consideration from the sale of HOS is $720 million as of December 31, 2023 and 2022. This amount represents the principal amount owed under the secured seller note, for which the Company expects to receive full payment. The accounting fair value measurement of the secured seller note approximated $704 million and $686 million as of December 31, 2023 and 2022, respectively. The accounting fair value measurement is an estimate that is reflective of changes in benchmark interest rates. The secured seller note is classified as Level 3 within the fair value hierarchy. On February 2, 2024, the secured seller note from the sale of HOS was amended to increase the principal amount from $720 million to $795 million, in full satisfaction of a $75 million contingent cash payment. See Note 5—Acquisitions and Divestitures for additional information.
Preferred stock with mandatory redemption requirements and long-term debt—The fair values of preferred stock with mandatory redemption requirements and long-term debt are categorized within the fair value hierarchy based on the inputs that are used to value each instrument. The fair value of long-term debt classified as Level 1 is calculated using quoted prices in active markets. Level 2 instruments are valued using observable inputs and Level 3 instruments are valued using observable and unobservable inputs..inputs.
Presented in the tables below are the carrying amounts, including fair value adjustments previously recognized in acquisition purchase accounting, and the fair values of the Company’s financial instruments:
| | As of December 31, 2023 | | | As of December 31, 2023 |
| | | Carrying Amount | | December 31, 2020 | | Carrying Amount | | At Fair Value |
| | | Level 1 | | Level 2 | | Level 3 | | Total |
| | Level 1 | | | | Level 1 | Carrying Amount | | Level 2 | | Level 3 | | Total |
| Preferred stock with mandatory redemption requirements | Preferred stock with mandatory redemption requirements | $ | 5 | | | $ | 0 | | | $ | 0 | | | $ | 7 | | | $ | 7 | |
| Long-term debt (excluding finance lease obligations) | 9,656 | | | 9,639 | | | 415 | | | 1,753 | | | 11,807 | |
| Long-term debt | |
| | | | | | | | | | | | | | | | | | | | | | | | | | | | | |
| | Carrying Amount | | December 31, 2019 |
| | | Level 1 | | Level 2 | | Level 3 | | Total |
| Preferred stock with mandatory redemption requirements | $ | 7 | | | $ | 0 | | | $ | 0 | | | $ | 9 | | | $ | 9 | |
| Long-term debt (excluding finance lease obligations) | 8,664 | | | 7,689 | | | 417 | | | 1,664 | | | 9,770 | |
| | | | | | | | | | | | | | | | | | | | | | | | | | | | | |
| As of December 31, 2022 |
| | Carrying Amount | | At Fair Value |
| | Level 1 | | Level 2 | | Level 3 | | Total |
| Preferred stock with mandatory redemption requirements | $ | 3 | | | $ | — | | | $ | — | | | $ | 3 | | | $ | 3 | |
| Long-term debt (excluding finance lease obligations) | 11,207 | | | 8,599 | | | 49 | | | 1,427 | | | 10,075 | |
Fair Value Measurements
To increase consistency and comparability in fair value measurements, GAAP establishes a fair value hierarchy that prioritizes the inputs to valuation techniques used to measure fair value into three levels as follows:
Level 1—Quoted prices (unadjusted) in active markets for identical assets or liabilities that the Company has the ability to access as of the reporting date. Financial assets and liabilities utilizing Level 1 inputs include active exchange-traded equity securities, exchange-based derivatives, mutual funds and money market funds.
Level 2—Inputs other than quoted prices included within Level 1 that are directly observable for the asset or liability or indirectly observable through corroboration with observable market data. Financial assets and liabilities utilizing Level 2 inputs include fixed income securities, non-exchange-based derivatives, commingled investment funds not subject to purchase and sale restrictions and fair-value hedges.
Level 3—Unobservable inputs, such as internally-developed pricing models for the asset or liability due to little or no market activity for the asset or liability. Financial assets and liabilities utilizing Level 3 inputs include infrequently-traded non-exchange-based derivatives and commingled investment funds subject to purchase and sale restrictions.
Recurring Fair Value Measurements
Presented in the tables below are assets and liabilities measured and recorded at fair value on a recurring basis and their level within the fair value hierarchy:
| | At Fair Value as of December 31, 2020 |
| | Level 1 | | Level 2 | | Level 3 | | Total |
| As of December 31, 2023 | | | As of December 31, 2023 |
| Level 1 | | | Level 1 | | Level 2 | | Level 3 | | Total |
| Assets: | Assets: | | | | | | | | Assets: | | | |
| Restricted funds | Restricted funds | $ | 29 | | | $ | 0 | | | $ | 0 | | | $ | 29 | |
| Rabbi trust investments | Rabbi trust investments | 19 | | | 0 | | | 0 | | | 19 | |
| Deposits | Deposits | 4 | | | 0 | | | 0 | | | 4 | |
| Other investments | Other investments | 11 | | | 0 | | | 0 | | | 11 | |
| Money market and other | |
| Money market and other | |
| Money market and other | |
| Fixed-Income Securities | |
| Total assets | Total assets | 63 | | | 0 | | | 0 | | | 63 | |
| | Liabilities: | Liabilities: | | | | | | | |
| Liabilities: | |
| Liabilities: | | | | |
| Deferred compensation obligations | Deferred compensation obligations | 24 | | | 0 | | | 0 | | | 24 | |
| Mark-to-market derivative liability | |
| Total liabilities | Total liabilities | 24 | | | 0 | | | 0 | | | 24 | |
| Total assets | Total assets | $ | 39 | | | $ | 0 | | | $ | 0 | | | $ | 39 | |
| | | | | | | | | | | | | | | | | | | | | | | |
| At Fair Value as of December 31, 2019 |
| | Level 1 | | Level 2 | | Level 3 | | Total |
| Assets: | | | | | | | |
| Restricted funds | $ | 31 | | | $ | 0 | | | $ | 0 | | | $ | 31 | |
| Rabbi trust investments | 17 | | | 0 | | | 0 | | | 17 | |
| Deposits | 3 | | | 0 | | | 0 | | | 3 | |
| Other investments | 8 | | | 0 | | | 0 | | | 8 | |
| Total assets | 59 | | | 0 | | | 0 | | | 59 | |
| | | | | | | |
| Liabilities: | | | | | | | |
| Deferred compensation obligations | 21 | | | 0 | | | 0 | | | 21 | |
| Total liabilities | 21 | | | 0 | | | 0 | | | 21 | |
| Total assets (liabilities) | $ | 38 | | | $ | 0 | | | $ | 0 | | | $ | 38 | |
| | | | | | | | | | | | | | | | | | | | | | | |
| As of December 31, 2022 |
| Level 1 | | Level 2 | | Level 3 | | Total |
| Assets: | | | | | | | |
| Restricted funds | $ | 32 | | | $ | — | | | $ | — | | | $ | 32 | |
| Rabbi trust investments | 21 | | | — | | | — | | | 21 | |
| Deposits | 7 | | | — | | | — | | | 7 | |
| Other investments | | | | | | | |
| Money market and other | 61 | | | — | | | — | | | 61 | |
| Fixed-Income Securities | 147 | | | 6 | | | — | | | 153 | |
| Contingent cash payment from the sale of HOS | — | | | — | | | 72 | | | 72 | |
| Mark-to-market derivative asset | — | | | 1 | | | — | | | 1 | |
| Total assets | 268 | | | 7 | | | 72 | | | 347 | |
| | | | | | | |
| Liabilities: | | | | | | | |
| Deferred compensation obligations | 24 | | | — | | | — | | | 24 | |
| Total liabilities | 24 | | | — | | | — | | | 24 | |
| Total assets | $ | 244 | | | $ | 7 | | | $ | 72 | | | $ | 323 | |
Restricted funds—The Company’s restricted funds primarily represent proceeds received from financings for the construction and capital improvement of facilities and from customers for future services under operation, maintenance and repair projects.
Rabbi trust investments—The Company’s rabbi trust investments consist of equity and index funds from which supplemental executive retirement plan benefits and deferred compensation obligations can be paid. The Company includes these assets in other long-term assets on the Consolidated Balance Sheets.
Deposits—Deposits include escrow funds and certain other deposits held in trust. The Company includes cash deposits in other current assets on the Consolidated Balance Sheets.
Deferred compensation obligations—The Company’s deferred compensation plans allow participants to defer certain cash compensation into notional investment accounts. The Company includes such plans in other long-term liabilities on the Consolidated Balance Sheets. The value of the Company’s deferred compensation obligations is based on the market value of the participants’ notional investment accounts. The notional investments are comprised primarily of mutual funds, which are based on observable market prices.
Mark-to-market derivative assets and liabilities—The Company employs derivative financial instruments in the form of variable-to-fixed interest rate swaps and treasury lock agreements, classified as economic hedges and cash flow hedges, respectively, in order to fix the interest cost on existing or forecasted debt. The Company may use fixed-to-floating interest rate swaps, typically designated as fair-value hedges, to achieve a targeted level of variable-rate debt as a percentage of total debt. The Company uses a calculation of future cash inflows and estimated future outflows, which are discounted, to determine the current fair value. Additional inputs to the present value calculation include the contract terms, counterparty credit risk, interest rates and market volatility.
Other investments—As a result of the Retiree Welfare Plan changes discussed in Note 15—Employee Benefits, effective December 31, 2022, the Company transferred investment assets from the Bargained VEBA into the existing trust maintained for the benefit of the Active VEBA. The transfer of these Bargained VEBA investment assets into the Active VEBA permits access to approximately $194 million of assets for purposes of paying active union employee medical benefits.
The investments in the Active VEBA trust primarily consist of money market funds and available-for-sale fixed income securities. The money market and other investments have original maturities of three months or less when purchased. The fair value measurement of the money market and other investments is based on observable market prices and therefore included in the recurring fair value measurements hierarchy as Level 1. The available-for-sale fixed income securities are primarily investments in U.S. Treasury securities and government bonds. The majority of U.S. Treasury securities and government bonds have been categorized as Level 1 because they trade in highly-liquid and transparent markets. Certain U.S. Treasury securities are based on prices that reflect observable market information, such as actual trade information of similar securities, and are therefore categorized as Level 2, because the valuations are calculated using models which utilize actively traded market data that the Company can corroborate. The Company had no significant mark-to-market derivatives outstandingincludes other investments measured and recorded at fair value on the Consolidated Balance Sheets of $62 million and $67 million in other current assets, as of December 31, 2020.2023 and 2022, respectively, and $111 million and $147 million in other long-term assets, as of December 31, 2023 and 2022, respectively. Unrealized holding gains and losses on available-for-sale securities are excluded from earnings and reported in other comprehensive income until realized.
Other investments—Other investments primarily represent money market funds usedThe following tables summarize the unrealized positions for active employee benefits. available-for-sale fixed income securities as of December 31, 2023 and 2022:
| | | | | | | | | | | | | | | | | | | | | | | |
| As of December 31, 2023 |
| Amortized Cost Basis | | Gross unrealized gains | | Gross unrealized losses | | Fair Value |
| Available-for-sale fixed-income securities | $ | 143 | | | $ | 6 | | | $ | 3 | | | $ | 146 | |
| | | | | | | | | | | | | | | | | | | | | | | |
| As of December 31, 2022 |
| Amortized Cost Basis | | Gross unrealized gains | | Gross unrealized losses | | Fair Value |
| Available-for-sale fixed-income securities | $ | 153 | | | $ | — | | | $ | — | | | $ | 153 | |
The Company includes otherfair value of the Company’s available-for-sale fixed income securities, summarized by contractual maturities, as of December 31, 2023, is as follows:
| | | | | |
| Amount |
| Other investments - Available-for-sale fixed-income securities | |
| Less than one year | $ | 83 | |
| 1 year - 5 years | 50 | |
| 5 years - 10 years | 4 | |
| Greater than 10 years | 9 | |
| Total | $ | 146 | |
Contingent cash payment from the sale of HOS— The Company’s contingent cash payment derivative included as part of the consideration from the sale of HOS is included in other current assets on the Consolidated Balance Sheets.Sheets as of December 31, 2022. The accounting fair value measurement of the contingent cash payment was $72 million as of December 31, 2022, which was reflective of changes in the benchmark interest rate and was estimated using the probability of the outcome of receipt of the $75 million, a Level 3 input.
As of December 31, 2023, the contingent cash payment from the sale of HOS is accounted for as a receivable, as the conditions have been satisfied. The carrying amount of the receivable is included in other long-term assets on the Consolidated Balance Sheets as December 31, 2023, which approximates fair value. On February 2, 2024, the secured seller note from the sale of HOS was amended to increase the principal amount from $720 million to $795 million, in full satisfaction of the $75 million contingent cash payment. See Note 5—Acquisitions and Divestitures for additional information.
Note 20:19: Leases
The Company has operating and finance leases involving real property, including facilities, utility assets, vehicles, and equipment. Certain operating leases have renewal options ranging from one year to 60 years. The exercise of lease renewal options is at the Company’s sole discretion. Renewal options that the Company was reasonably certain to exercise are included in the Company’s ROU assets. Certain operating leases contain the option to purchase the leased property. The operating leases for real property, vehicles and equipment will expire over the next 3936 years, sixfive years, and five years, respectively.
The Company participates in a number of arrangements with various public entities (“Partners”) in West Virginia. Under these arrangements, the Company transferred a portion of its utility plant to the Partners in exchange for an equal principal amount of Industrial Development Bonds (“IDBs”) issued by the Partners under the Industrial Development and Commercial Development Bond Act. The Company leased back the utility plant under agreements for a period of 30 to 40 years. The Company has recorded these agreements as finance leases in property, plant and equipment, as ownership of the assets will revert back to the Company at the end of the lease term. The carrying value of the finance lease assets was $147$144 million and $147$145 million as of December 31, 20202023 and 2019,2022, respectively. The Company determined that the finance lease obligations and the investments in IDBs meet the conditions for offsetting, and as such, are reported net on the Consolidated Balance Sheets and excluded from the finance lease disclosure presented below.
The Company also enters into O&M agreements with the Partners. The Company pays an annual fee for use of the Partners’ assets in performing under the O&M agreements. The O&M agreements are recorded as operating leases, and future annual use fees of $4 million in 20212024 through 2025,2028, and $52$41 million thereafter, are included in operating lease ROU assets and operating lease liabilities on the Consolidated Balance Sheets.
Rental expenses under operating and finance leases presented on the Consolidated Balance Sheets were $14$11 million, $12 million and $16$13 million for the years ended December 31, 20202023, 2022 and 2019,2021, respectively. Rental expenses under operating leases which included variable and short-term lease costs were $35 million for the year ended December 31, 2018.
For the year ended December 31, 2020,2023, cash paid for amounts in lease liabilities, which includes operating and financing cash flows from operating and finance leases, was $14$11 million. For the year ended December 31, 2020,2023, ROU assets obtained in exchange for new operating lease liabilities was $2$11 million.
As of December 31, 2020,2023, the weighted-average remaining lease term of the finance lease and operating leases were fivewas 17 years, and 19 years, respectively, and the weighted-average discount rate of the finance lease and operating leases were 12% andwas 4%, respectively..
The future maturities of lease liabilities at December 31, 2020 are $132023, were $10 million in 2021, $122024, $10 million in 2022,2025, $9 million in 2026, $8 million in 2023, $72027, $6 million in 2024, $7 million in 20252028 and $94$76 million thereafter. At December 31, 20202023, imputed interest was $49$39 million.
Note 21:20: Segment Information
The Company’s operating segments are comprised of the revenue-generating components of its businesses for which generate revenue, incur expense and have separate financial information which is internally produced and regularly used by management to make operating decisions, assess performance and allocate resources. The Company operates its businesses primarily through 1one reportable segment, the Regulated Businesses segment. The Company also operates market-based businesses that, individually, do not meet the criteria of a reportable segment in accordance with GAAP, and are collectively presented as the Market-Based Businesses.
The Regulated Businesses segment is the largest component of the Company’s business and includes subsidiaries that provide water and wastewater services to customers in 1614 states.
The Company’s primary Market-Based Businesses include HOS, which provides various warranty protection programs andCompany also operates other home services to residential customers, andbusinesses, primarily MSG, which enters into long-term contracts with the U.S. government to provide water and wastewater services to the U.S. government on various military installations.installations, as well as municipalities. These other businesses do not meet the criteria of a reportable segment in accordance with GAAP, and are collectively presented throughout this Annual Report on Form 10-K within “Other,” which is consistent with how management assesses the results of these businesses. The Company’s former HOS business, which was sold in the fourth quarter of 2021, was included in “Market-Based Businesses” in the Company’s Form 10-K for the year ended December 31, 2021. As a result of the sale of HOS, the categories which were previously shown as “Market-Based Businesses” and “Other” have been combined and are shown as Other. Segment results for the year ended December 31, 2021, have been adjusted retrospectively to reflect this change.
The accounting policies of the segments are the same as those described in Note 2—Significant Accounting Policies. The Regulated Businesses segment and Market-Based Businesses includeincludes intercompany costs that are allocated by Service Company and intercompany interest that is charged by AWCC, both of which are eliminated to reconcile to the Consolidated Statements of Operations. Inter-segment revenues include the sale of water from a regulated subsidiary to market-based subsidiaries within Other, leased office space, and furniture and equipment provided by the market-based subsidiaries within Other to regulated subsidiaries. “Other”Other also includes corporate costs that are not allocated to the Company’s operating segments,Regulated Businesses, interest income related to the secured seller promissory note from the sale of HOS, income from assets not associated with the Regulated Businesses, eliminations of inter-segment transactions and fair value adjustments and associated income and deductions related to the acquisitions that have not been allocated to the operating segments for evaluation of performance and allocation of resource purposes.Regulated Businesses segment. The adjustments related to the acquisitions are reported in Other as they are excluded from segment performance measures evaluated by management.
Presented in the tables below is summarized segment information as of and for the years ended December 31:
| | | | 2020 | | 2023 |
| | Regulated
Businesses | | Market-Based
Businesses | | Other | | Consolidated |
| Regulated
Businesses | | | Regulated
Businesses | | Other | | Consolidated |
| Operating revenues | Operating revenues | $ | 3,255 | | | $ | 540 | | | $ | (18) | | | $ | 3,777 | |
| Depreciation and amortization | Depreciation and amortization | 562 | | | 26 | | | 16 | | | 604 | |
| Total operating expenses, net | Total operating expenses, net | 2,102 | | | 421 | | | 6 | | | 2,529 | |
| Interest, net | (291) | | | 1 | | | (105) | | | (395) | |
| Income before income taxes | 932 | | | 120 | | | (128) | | | 924 | |
| Provision for income taxes | 217 | | | 29 | | | (31) | | | 215 | |
| Net income attributable to common shareholders | 715 | | | 91 | | | (97) | | | 709 | |
| Interest expense | |
| Interest income | |
| Provision for (benefit from) income taxes | |
| Net income (loss) attributable to common shareholders | |
| Total assets | Total assets | 22,357 | | | 891 | | | 1,518 | | | 24,766 | |
| Cash paid for capital expenditures | Cash paid for capital expenditures | 1,804 | | | 10 | | | 8 | | | 1,822 | |
| | | | 2019 | | 2022 |
| | Regulated
Businesses | | Market-Based
Businesses | | Other | | Consolidated |
| Regulated
Businesses | | | Regulated
Businesses | | Other | | Consolidated |
| Operating revenues | Operating revenues | $ | 3,094 | | | $ | 539 | | | $ | (23) | | | $ | 3,610 | |
| Depreciation and amortization | Depreciation and amortization | 529 | | | 37 | | | 16 | | | 582 | |
| Total operating expenses, net | Total operating expenses, net | 1,964 | | | 480 | | | (4) | | | 2,440 | |
| Interest, net | (295) | | | 5 | | | (92) | | | (382) | |
| Income before income taxes | 869 | | | 66 | | | (102) | | | 833 | |
| Interest expense | |
| Interest income | |
| Gain on sale of businesses | |
| Provision for income taxes | Provision for income taxes | 215 | | | 20 | | | (23) | | | 212 | |
| Net income attributable to common shareholders | 654 | | | 46 | | | (79) | | | 621 | |
| Net income (loss) attributable to common shareholders | |
| Total assets | Total assets | 20,318 | | | 1,008 | | | 1,356 | | | 22,682 | |
| Cash paid for capital expenditures | Cash paid for capital expenditures | 1,627 | | | 13 | | | 14 | | | 1,654 | |
| | | | | | | | | | | | | | | | | |
| | 2021 |
| Regulated
Businesses | | Other | | Consolidated |
| Operating revenues | $ | 3,384 | | | $ | 546 | | | $ | 3,930 | |
| Depreciation and amortization | 601 | | | 35 | | | 636 | |
| Total operating expenses, net | 2,227 | | | 507 | | | 2,734 | |
| Interest expense | (290) | | | (113) | | | (403) | |
| Interest income | 1 | | | 3 | | | 4 | |
| (Loss) or gain on sale of businesses | (1) | | | 748 | | | 747 | |
| Provision for income taxes | 172 | | | 205 | | | 377 | |
| Net income attributable to common shareholders | 789 | | | 474 | | | 1,263 | |
| Total assets | 23,365 | | | 2,710 | | | 26,075 | |
| Cash paid for capital expenditures | 1,747 | | | 17 | | | 1,764 | |
| | | | | | | | | | | | | | | | | | | | | | | |
| | 2018 |
| | Regulated
Businesses | | Market-Based
Businesses | | Other | | Consolidated |
| Operating revenues | $ | 2,984 | | | $ | 476 | | | $ | (20) | | | $ | 3,440 | |
| Depreciation and amortization | 500 | | | 29 | | | 16 | | | 545 | |
| Impairment charge | 0 | | | 57 | | | 0 | | | 57 | |
| Total operating expenses, net | 1,912 | | | 441 | | | (15) | | | 2,338 | |
| Interest, net | (280) | | | 4 | | | (74) | | | (350) | |
| Income before income taxes | 826 | | | 41 | | | (80) | | | 787 | |
| Provision for income taxes | 224 | | | 11 | | | (13) | | | 222 | |
| Net income attributable to common shareholders | 602 | | | 32 | | | (67) | | | 567 | |
| Total assets | 18,680 | | | 999 | | | 1,544 | | | 21,223 | |
| Cash paid for capital expenditures | 1,477 | | | 13 | | | 96 | | | 1,586 | |
Note 22:21: Unaudited Quarterly Data
Presented in the tables below are supplemental, unaudited, consolidated, quarterly financial data for each of the four quarters in the years ended December 31, 20202023 and 2019,2022, respectively. The operating results for any quarter are not indicative of results that may be expected for a full year or any future periods.
| | 2020 |
| First Quarter | | Second Quarter | | Third Quarter | | Fourth Quarter |
| 2023 | | | 2023 |
| First Quarter | | | First Quarter | | Second Quarter | | Third Quarter | | Fourth Quarter |
| Operating revenues | Operating revenues | $ | 844 | | | $ | 931 | | | $ | 1,079 | | | $ | 923 | |
| Operating income | Operating income | 239 | | | 313 | | | 433 | | | 263 | |
| Net income attributable to common shareholders | Net income attributable to common shareholders | 124 | | | 176 | | | 264 | | | 145 | |
Basic earnings per share: (a) | Basic earnings per share: (a) | | | | | | | | Basic earnings per share: (a) | | | |
| Net income attributable to common shareholders | Net income attributable to common shareholders | $ | 0.69 | | | $ | 0.97 | | | $ | 1.46 | | | $ | 0.80 | |
| Diluted earnings per share: | Diluted earnings per share: | | | | | | | | Diluted earnings per share: | | | |
| Net income attributable to common shareholders | Net income attributable to common shareholders | 0.68 | | | 0.97 | | | 1.46 | | | 0.80 | |
(a)Amounts may not sum due to rounding.
| | 2019 |
| | First Quarter | | Second Quarter | | Third Quarter | | Fourth Quarter |
| 2022 | | | 2022 |
| First Quarter | | | First Quarter | | Second Quarter | | Third Quarter | | Fourth Quarter |
| Operating revenues | Operating revenues | $ | 813 | | | $ | 882 | | | $ | 1,013 | | | $ | 902 | |
| Operating income | Operating income | 238 | | | 302 | | | 406 | | | 224 | |
| Net income attributable to common shareholders | Net income attributable to common shareholders | 113 | | | 170 | | | 240 | | | 98 | |
| Basic earnings per share: (a) | Basic earnings per share: (a) | | | | | | | | Basic earnings per share: (a) | | | |
| Net income attributable to common shareholders | Net income attributable to common shareholders | $ | 0.62 | | | $ | 0.94 | | | $ | 1.33 | | | $ | 0.54 | |
| Diluted earnings per share: | Diluted earnings per share: | | | | | | | | Diluted earnings per share: | | | |
| Net income attributable to common shareholders | Net income attributable to common shareholders | 0.62 | | | 0.94 | | | 1.33 | | | 0.54 | |
(a)Amounts may not sum due to rounding.
ITEM 9. CHANGES IN AND DISAGREEMENTS WITH ACCOUNTANTS ON ACCOUNTING AND FINANCIAL DISCLOSURE
None.
ITEM 9A. CONTROLS AND PROCEDURES
Disclosure Controls and Procedures
The Company, under the supervision and with the participation of its management, including theits Chief Executive Officer and theits Chief Financial Officer, conducted an evaluation of the effectiveness of the design and operation of the Company’s disclosure controls and procedures as such term is defined in Rule 13a-15(e) and Rule 15d-15(e) under the Exchange Act as of the end of the period covered by this report.
Based on that evaluation, the Company’s Chief Executive Officer and its Chief Financial Officer have concluded that, as of December 31, 2020,2023, the Company’s disclosure controls and procedures were effective at a reasonable level of assurance. The Company’s disclosure controls and procedures are designed to provide reasonable assuranceensure that the information required to be disclosed by the Company in the reports it files or submits under the Exchange Act is recorded, processed, summarized and reported within the time periods specified in the SEC’s rules and forms, and that such information is accumulated and communicated to management, including the Chief Executive Officer and the Chief Financial Officer, to allow timely decisions regarding required disclosure. In designing and evaluating the disclosure controls and procedures, management recognizes that any controls and procedures, no matter how well designed and operated, can provide only reasonable assurance of achieving the desired control objective.
Management’s Report on Internal Control over Financial Reporting
The Company’s management is responsible for establishing and maintaining adequate internal control over financial reporting, as such term is defined in Rule 13a-15(f) of the Exchange Act. The Company’s internal control over financial reporting is a process designed by or under the supervision of the Company’s Chief Executive Officer and its Chief Financial Officer to provide reasonable assurance regarding the reliability of financial reporting and the preparation of financial statements for external purposes in accordance with GAAP. The Company’s internal control over financial reporting includes those policies and procedures that (i) pertain to the maintenance of records that in reasonable detail accurately and fairly reflect its transactions and dispositions of its assets, (ii) provide reasonable assurance that transactions are recorded as necessary to permit preparation of the financial statements in accordance with GAAP, and that the Company’s receipts and expenditures are being made only in accordance with authorizations of its management and its directors, and (iii) provide reasonable assurance regarding prevention or timely detection of unauthorized acquisition, use or disposition of its assets that could have a material effect on the financial statements.
Because of its inherent limitations, internal control over financial reporting may not prevent or detect misstatements. Also, projections of any evaluation of effectiveness to future periods are subject to the risk that controls may become inadequate because of changes in conditions, or that the degree of compliance with the policies or procedures may deteriorate.
The Company’s management, including the Company’s Chief Executive Officer and theits Chief Financial Officer, assessed the effectiveness of its internal control over financial reporting, as of December 31, 2020,2023, using the criteria described in Internal Control—Integrated Framework (2013) issued by the Committee of Sponsoring Organizations of the Treadway Commission (COSO).
Based on the Company’s evaluation under the framework in Internal Control—Integrated Framework (2013), its management concluded that its internal control over financial reporting was effective as of December 31, 2020.2023.
The effectiveness of the Company’s internal control over financial reporting as of December 31, 20202023, has been audited by PricewaterhouseCoopers LLP, an independent registered public accounting firm, as stated in their report appearing in Item 8—Financial Statements and Supplementary Data of this Annual Report on Form 10-K.
Changes in Internal Control over Financial Reporting
The Company concluded that there have been no changes in internal control over financial reporting that occurred during its last fiscal quarter that have materially affected, or are reasonably likely to materially affect, the Company’s internal control over financial reporting.
ITEM 9B. OTHER INFORMATION
None.On February 8, 2024, Karl F. Kurz, the Company’s Board Chair, was notified by Admiral James G. Stavridis of his decision to resign as a member of the Board of Directors of the Company (the “Board”), effective as of February 12, 2024. Admiral Stavridis’s notification stated that he was resigning to focus on all of his professional and personal obligations and that he did not have any disagreements with the Company on any matter relating to the Company’s operations, policies or practices. Admiral Stavridis had been a director of the Company since 2018 and served as Chair of the Safety, Environmental, Technology and Operations Committee (the “SETO Committee”) since 2021. At the effective time of his resignation, Admiral Stavridis also had served as a member of the Nominating/Corporate Governance Committee. The Company wishes to thank Admiral Stavridis for his many years of service to the Board.
On February 14, 2024, upon the recommendation of the Nominating/Corporate Governance Committee, the Board reduced the size of the Board from ten to nine members and appointed Board member Michael L. Marberry to replace Admiral Stavridis both as Chair of the SETO Committee and as a member of the Nominating/Corporate Governance Committee.
ITEM 9C. DISCLOSURE REGARDING FOREIGN JURISDICTIONS THAT PREVENT INSPECTIONS
Not applicable.
PART III
ITEM 10. DIRECTORS, EXECUTIVE OFFICERS AND CORPORATE GOVERNANCE
The information required by this item and not givenset forth below or in Item 1—Business—Executive Officers of this Annual Report on Form 10-K, is incorporated by reference from the Company’s Proxy Statement for the 20212024 Annual Meeting of Shareholders, to be filed with the SEC within 120 days following the end of the fiscal year covered by this report, under the captions entitled “Board of Directors and Corporate Governance,”Governance” and “Proposal 1—Election of Directors” and “Certain Beneficial Ownership Matters—Section 16(a) Delinquent Reports.Directors.”
The Company has adopted a Code of Ethics, which applies to directors, officers and employees. The full text of the Code of Ethics is publicly available on the Company’s website at https://amwater.com. The Company intends to post on its website any amendments to the Code of Ethics and any waivers of such provisions granted to certain principal officers.
ITEM 11. EXECUTIVE COMPENSATION
Information required by this item is incorporated by reference in the Company’s Proxy Statement for the 20212024 Annual Meeting of Shareholders, under the captions entitled “Board of Directors and Corporate Governance—Board Role in Risk Oversight—Executive Development and Compensation Committee Role,” “Proposal 1—Election of Directors—Director Compensation Table,” “Compensation Discussion and Analysis,” “Executive Compensation,”Compensation” (excluding the subsection “Pay Versus Performance”), “Compensation Committee Interlocks and Insider Participation” and “Compensation Committee Report.”Report” (with the latter report being furnished, and not filed, in this Annual Report on Form 10-K).
ITEM 12. SECURITY OWNERSHIP OF CERTAIN BENEFICIAL OWNERS AND MANAGEMENT AND RELATED STOCKHOLDER MATTERS
Information required by this item setting forth the security ownership of certain beneficial owners and management is incorporated by reference in the Company’s Proxy Statement for the 20212024 Annual Meeting of Shareholders, under the captions entitled “Certain Beneficial Ownership Matters—Security Ownership of Management,” “Certain Beneficial Ownership Matters—Security Ownership of Certain Beneficial Owners” and “Equity Compensation Plan Information.”
ITEM 13. CERTAIN RELATIONSHIPS AND RELATED TRANSACTIONS, AND DIRECTOR INDEPENDENCE
Information required by this item is incorporated by reference in the Company’s Proxy Statement for the 20212024 Annual Meeting of Shareholders, under the caption entitled “Board of Directors and Corporate Governance—Board Review of Related Person Transactions” and “Proposal 1—Election of Directors—Director Independence.”
ITEM 14. PRINCIPAL ACCOUNTANT FEES AND SERVICES
Information required by this item is incorporated by reference in the Company’s Proxy Statement for the 20212024 Annual Meeting of Shareholders, under the caption entitled “Proposal 3—Ratification of Appointment of Independent Registered Public Accounting Firm—Fees Paid to Independent Registered Public Accounting Firm” and “Proposal 3—Ratification of Appointment of Independent Registered Public Accounting Firm—Pre-Approval of Services Provided by Independent Registered Public Accounting Firm.”
PART IV
ITEM 15. EXHIBITS AND FINANCIAL STATEMENT SCHEDULES
(a) The following documents have been filed as a part of this Annual Report on Form 10-K:
1.The financial statements listed in the “Index to Consolidated Financial Statements” contained in Item 8—Financial Statements and Supplementary Data of this Form 10-K are hereby incorporated by reference in response to this Item 15(a).
2.Financial statement schedules have been omitted since they are either not required or are not applicable as the information is otherwise included in the financial statements or notes thereto.
3.Exhibits. The list of documents contained in “Exhibit Index” below is provided in response to this Item 15(a). The warranties, representations and covenants contained in any of the agreements included or incorporated by reference herein or which appear as exhibits hereto should not be relied upon by buyers, sellers or holders of the Company’s or its subsidiaries’ securities and are not intended as warranties, representations or covenants to any individual or entity except as specifically set forth in such agreement.
The responses to Items 15(b) and (c) of Form 10-K are included above in response to Item 15(a).
ITEM 16. FORM 10-K SUMMARY
None.
EXHIBIT INDEX
| | | | | | | | |
Exhibit
Number | | Exhibit Description |
2.1#2.1.1# | | Stock Purchase Agreement, dated November 20, 2019, by and among American Water Works Company, Inc., New York American Water Company, Inc. and Liberty Utilities Co. (incorporated by reference to Exhibit 2.1 to American Water Works Company, Inc.’s Current Report on Form 8-K, File No. 001-34028, filed November 20, 2019). |
| 2.1.2 | | Letter Agreement, dated June 29, 2021, by and among American Water Works Company, Inc., Liberty Utilities (Eastern Water Holdings) Corp. and New York American Water Company, Inc., with respect to the Stock Purchase Agreement, dated November 20, 2019, by and among American Water Works Company, Inc., New York American Water Company, Inc. and Liberty Utilities Co. (incorporated by reference to Exhibit 2.1 to American Water Works Company, Inc.’s Current Report on Form 8-K, File No. 001-34028, filed June 29, 2021). |
| 2.2# | | Membership Interest Purchase Agreement, dated as of October 28, 2021, by and among American Water Enterprises, LLC, American Water (USA), LLC, American Water Resources, LLC, Pivotal Home Solutions, LLC, American Water Resources Holdings, LLC, American Water Works Company, Inc. and Lakehouse Buyer Inc. (incorporated by reference to Exhibit 2.1 to American Water Works Company, Inc.’s Current Report on Form 8-K, File No. 001-34028, filed October 29, 2021). |
| 3.1 | | |
| 3.2 | | |
| 4.1 | | Indenture, dated as of October 22, 2007, between American Water Capital Corp. andComputershare Trust Company, N.A., as successor to Wells Fargo Bank, National Association (incorporated by reference to Exhibit 4.4 to American Water Capital Corp.’s Registration Statement on Form S-4, File No. 333-148284, and American Water Works Company, Inc.’s Registration Statement on Form S-4, File No. 333-148284-01, filed December 21, 2007). |
| 4.2 | | Indenture, dated as of December 4, 2009, between American Water Capital Corp. and Computershare Trust Company, N.A., as successor to Wells Fargo Bank, National Association (incorporated by reference to Exhibit 4.1 to American Water Works Company, Inc.’s Current Report on Form 8-K, File No. 001-34028, filed December 3, 2010). |
| 4.3 | | Officers’ Certificate,Indenture, dated December 15, 2010, establishing the 6.00% Senior Monthly Notes due 2040as of June 29, 2023, among American Water Capital Corp., American Water Works Company, Inc. and U.S. Bank Trust Company, National Association. (incorporated by reference to Exhibit 4.1 to American Water Works Company, Inc.’s Current Report on Form 8-K, File No. 001-34028, filed December 15, 2010)June 29, 2023). |
| 4.4 | | |
| 4.5 | | |
4.54.6 | | |
4.64.7 | | |
4.74.8 | | |
4.84.9 | | |
4.94.10 | | |
4.104.11 | | |
| | | | | | | | |
4.11Exhibit
Number | | Exhibit Description |
| 4.12 | | |
4.124.13 | | |
4.134.14 | | |
4.144.15 | | |
4.154.16 | | |
4.164.17 | | |
4.174.18 | | |
| | | | | | | | |
Exhibit
Number4.19 | | Exhibit Description |
4.18 | | |
4.194.20 | | |
4.204.21 | | |
| 4.22 | | |
| 4.23 | | |
| 4.24 | | |
4.2110.1.1# | | |
4.22 | | |
10.1.1 | | SecondThird Amended and Restated Credit Agreement, dated as of March 21, 2018,October 26, 2022, by and among American Water Works Company, Inc., American Water Capital Corp., each of the Lenders party thereto, Wells Fargo Bank, National Association, as administrative agent, JPMorgan Chase Bank, N.A., as syndication agent, and Mizuho Bank, Ltd., PNC Bank, National Association, and U.S. Bank National Association, as co-documentation agents (incorporated by reference to Exhibit 10.1 to American Water Works Company, Inc.’s CurrentQuarterly Report on Form 8-K,10-Q, File No. 001-34028, filed on March 21, 2018)October 31, 2022). |
| 10.1.2 | | First Amendment, dated as of June 21, 2023, to the Third Amended and Restated Credit Agreement, dated as of October 26, 2022, by and among American Water Works Company, Inc., American Water Capital Corp.,each of the Lenders party thereto, Wells Fargo Bank, National Association, as administrative agent, JPMorgan Chase Bank, N.A., as syndication agent, and Mizuho Bank, Ltd., PNC Bank, National Association, U.S. Bank National Association, and Bank of America, N.A., as co-documentation agents (incorporated by reference to Exhibit 10.1 to American Water Works Company, Inc.’s Quarterly Report on Form 10-Q, File No. 001-34028, filed July 26, 2023). |
| 10.1.3 | | Extension Agreement, dated as of April 9, 2019,October 26, 2023, by and among American Water Works Company, Inc., American Water Capital Corp., each of the Lenders party thereto, and Wells Fargo Bank, National Association, as administrative agent (incorporated by referencereference to Exhibit 10.17.210.1 to American Water Works Company Inc.’sInc.’s Quarterly Report on FormForm 10-Q, File File No. 001-34028, filed MayNovember 1, 2019). |
10.1.3 | | Extension Agreement, dated as of April 1, 2020, among American Water Works Company, Inc., American Water Capital Corp., each of the Lenders party thereto, and Wells Fargo Bank, National Association, as administrative agent (incorporated by reference to Exhibit 10.1.3 to American Water Works Company, Inc.’s Quarterly Report on Form 10-Q, File No. 001-34028, filed on May 20236), 2020). |
| 10.2 | | Term Loan Credit Agreement, dated as of March 20, 2020, by and among American Water, AWCC, Wells Fargo Bank, National Association, as administrative agent and as a lender, Wells Fargo Securities LLC, as a joint lead arranger and joint bookrunner, and each of Mizuho Bank, Ltd. and U.S. Bank National Association, as a joint lead arranger and joint bookrunner, and as a lender (incorporated by reference to Exhibit 10.1 to the Company’s Current Report on Form 8-K, File No. 001-34028, filed March 20, 2020). |
10.3 | | Support Agreement, dated June 22, 2000, together with First Amendment to Support Agreement, dated July 26, 2000, by and between American Water Works Company, Inc. and American Water Capital Corp. (incorporated by reference to Exhibit 10.3 to American Water Capital Corp.’s Registration Statement on Form S-1, File No. 333-145757-01, and American Water Works Company, Inc.’s Registration Statement on Form S-1, File No. 333-145757, filed October 11, 2007). |
10.4.1*10.3* | | Offer Letter Agreement,for Employment, dated as of February 17, 2015,2, 2022, between Michael A. Sgro and American Water Works Company, Inc. and M. Susan Hardwick (incorporated by reference to Exhibit 10.4 to American Water Works Company, Inc.’s Quarterly Report on Form 10-Q, File No. 001-34028, filed August 5, 2015). |
10.4.2* | | |
10.5*10.4* | | Offer Letter for Employment, dated May 1, 2019,February 16, 2021, between American Water Works Company, Inc. and M. Susan HardwickCheryl Norton (incorporated by reference to Exhibit 10.13 to American Water Works Company, Inc.’s Quarterly Report on Form 10-Q, File No. 001-34028, filed May 3, 2021). |
| 10.5* | | |
| 10.6* | | |
10.6* | | |
| 10.7* | | |
10.8* | | |
10.9* | | |
10.10* | | |
10.11* | | |
10.12*10.8* | | |
10.13.1*10.9.1* | | |
10.13.2*10.9.2* | | |
10.14*10.10* | | |
10.15.1*10.11.1* | | |
| | | | | | | | |
10.15.2*Exhibit
Number | | Exhibit Description |
| 10.11.2* | | |
| | | | | | | | |
Exhibit
Number10.12* | | Exhibit Description |
10.16* | | |
10.17.1*10.13.1* | | |
10.17.2*10.13.2* | | |
10.17.3* | | |
10.17.4* | | |
10.17.5* | | |
10.17.6* | | |
10.17.7*10.13.3* | | |
10.17.8* | | |
10.17.9* | | |
10.17.10*10.13.4* | | |
10.17.11*10.13.5* | | |
10.17.12*10.13.6* | | |
10.17.13*10.13.7* | | |
10.18.1*10.14.1* | | |
10.18.2*10.14.2* | | |
10.18.3*10.14.3* | | |
10.18.4*10.14.4* | | |
10.18.5* | | |
10.18.6* | | |
10.18.7* | | |
10.18.8*10.14.5* | | |
10.18.9*10.14.6* | | |
10.18.10*10.14.7* | | |
10.18.11* | | |
10.18.12*10.14.8* | | |
10.18.13*10.14.9* | | |
10.18.14*10.14.10* | | |
| 10.14.11* | | |
| 10.14.12* | | |
| | | | | | | | |
Exhibit
Number10.14.13* | | Exhibit Description |
10.18.15* | | |
| 10.14.14* | | |
10.18.16* | | |
10.18.17* | | |
10.18.18* | | |
10.18.19* | | |
10.18.20* | | |
10.18.21* | | |
10.18.22* | | |
10.18.23*10.14.15* | | |
10.18.24*10.14.16* | | |
10.18.25* | | |
10.18.26* | | |
10.18.27* | | |
10.18.28*10.14.17* | | |
10.18.29*10.14.18* | | |
10.18.30*10.14.19* | | |
| 10.14.20* | | |
| | | | | | | | |
10.18.31*Exhibit
Number | | Exhibit Description |
| 10.14.21* | | |
10.18.32*10.14.22* | | |
| 10.14.23* | | |
| 10.14.24* | | |
| 10.14.25* | | |
| 10.14.26* | | |
| 10.14.27* | | |
| 10.14.28* | | |
| 10.14.29* | | |
| 10.14.30* | | |
10.18.33*10.14.31* | | |
| 10.15* | | |
10.18.34*10.16* | | |
10.19*10.17.1#* | | |
| 10.17.2* | | |
| 10.17.3* | | |
| 10.18.1# | | Secured Seller Note Agreement, dated December 9, 2021, by and among Lakehouse Bidco Inc., Lakehouse Buyer Inc., American Water Resources, LLC, Pivotal Home Solutions, LLC, American Water Resources Holdings, LLC, American Water Resources of December 16, 2008Texas, LLC, American Water Resources of Florida, LLC, and American Water Enterprises, LLC (incorporated by reference to Exhibit 10.1 to American Water Works Company, Inc.’s QuarterlyCurrent Report on Form 10-Q,8-K, File No. 001-34028, filed November 3, 2010)December 9, 2021). |
10.20.1*10.18.2# | | Amendment No. 1 to Secured Seller Note Agreement, dated as of February 2, 2024, by and among Lakehouse Bidco Inc., Lakehouse Buyer Inc., American Water Works Company, Inc. Pension Plan for Employees, amendedResources, LLC, Pivotal Home Solutions, LLC, American Water Resources Holdings, LLC, American Water Resources of Texas, LLC, American Water Resources of Florida, LLC, and restated effective January 1, 2016American Water Enterprises, LLC (incorporated by reference to Exhibit 10.16.110.1.2 to American Water Works Company, Inc.’s QuarterlyCurrent Report on Form 10-K,8-K, File No. 001-34028, filed February 18, 2020)5, 2024). |
10.20.2*10.19 | | Revenue Share Agreement, dated December 9, 2021, by and among American Water Works Company, Inc. Amendment Two to the Pension Plan for Employees, amended, American Water Resources, LLC, Pivotal Home Solutions, LLC and restated effective January 1, 2016American Water Resources Holdings, LLC (incorporated by reference to Exhibit 10.16.210.2 to American Water Works Company, Inc.’s QuarterlyCurrent Report on Form 10-K,8-K, File No. 001-34028, filed February 18, 2020)December 9, 2021). |
| 21.1 | | |
| 22.1 | | |
| 23.1 | | |
| 31.1 | | |
| 31.2 | | |
| 32.1 | | |
| | | | | | | | |
Exhibit
Number | | Exhibit Description |
| 32.2 | | |
| 97.1 | | |
| 101.INS | | XBRL Instance Document - the instance document does not appear in the Interactive Data File because its XBRL tags are embedded within the Inline XBRL document. |
| 101.SCH | | Inline XBRL Taxonomy Extension Schema Document |
| 101.CAL | | Inline XBRL Taxonomy Extension Calculation Linkbase Document |
| | | | | | | | |
Exhibit
Number | | Exhibit Description |
| 101.DEF | | Inline XBRL Taxonomy Extension Definition Linkbase Document |
| 101.LAB | | Inline XBRL Taxonomy Extension Label Linkbase Document |
| 101.PRE | | Inline XBRL Taxonomy Extension Presentation Linkbase Document |
| 104 | | Cover Page Interactive Data File (formatted as Inline XBRL with applicable taxonomy extension information contained in Exhibits 101) |
# Certain schedules and exhibits to this agreement have been omitted pursuant to Item 601(a)(5)as permitted by rules or regulations of Regulation S-K.the SEC. The Company will furnish the omitted schedules and exhibits to the SEC upon request.
* Denotes a management contract or compensatory plan or arrangement.
Instruments defining the rights of holders of certain issues of long-term debt of the Company and certain of its consolidated subsidiaries have not been filed as exhibits to this report because the authorized principal amount of any one of such issues does not exceed 10% of the Company’s consolidated total assets. The Company agrees to furnish a copy of each such instrument to the SEC upon request.
The Stock Purchase Agreement filed as Exhibit 2.12.1.1, the Membership Interest Purchase Agreement filed as Exhibit 2.2, the Secured Seller Note Agreement filed as Exhibit 10.18.1 and the Amendment to Secured Seller Note Agreement noted filed as Exhibit 10.18.2 to this Annual Report on Form 10-K hashave been included to provide investors and security holders with information regarding its terms. Itthe terms of the respective agreements. The filing of these agreements is not intended to provide any other factual information about the parties thereto, or any of their respective subsidiaries or affiliates. The representations, warranties and covenants contained in the Stock Purchase Agreementrespective agreements (i) were made by the parties thereto only for purposes of that respective agreement and as of specific dates; (ii) were made solely for the benefit of the parties to the Stock Purchase Agreement;respective agreement; (iii) may be subject to limitations agreed upon by the contracting parties, including being qualified by confidential disclosures exchanged between the parties in connection with the execution of the Stock Purchase Agreementrespective agreement (such disclosures include information that has been included in public disclosures, as well as additional non-public information); (iv) may have been made for the purposes of allocating contractual risk between the parties to the Stock Purchase Agreementrespective agreements instead of establishing these matters as facts; and (v) may be subject to standards of materiality applicable to the contracting parties to the respective agreements that differ from those applicable to investors. Investors should not rely on the representations, warranties and covenants or any descriptions thereof as characterizations of the actual state of facts or condition of the parties to the respective agreements thereto, or any of their respective subsidiaries or affiliates. Additionally, the representations, warranties, covenants, conditions and other terms of the Stock Purchase Agreementrespective agreements may be subject to subsequent waiver or modification. Moreover, information concerning the subject matter of the representations, warranties and covenants may change after the date of the Stock Purchase Agreement,respective agreement, which subsequent information may or may not be fully reflected in the Company’s public disclosures. The Stock Purchase Agreementrespective agreements should not be read alone, but should instead be read in conjunction with the other information regarding the Company and its New York subsidiary that is or will be contained in, or incorporated by reference into, the reports and other documents that are filed by the Company with the SEC.
SIGNATURES
Pursuant to the requirements of Section 13 or 15(d) of the Securities Exchange Act of 1934, the Registrant has duly caused this report to be signed on its behalf by the undersigned, thereunto duly authorized, on the 24th14th day of February, 2021.2024.
| | | | | |
| AMERICAN WATER WORKS COMPANY, INC. |
BY: | /s/ WALTER J. LYNCHM. SUSAN HARDWICK |
| | Walter J. LynchM. Susan Hardwick |
| | President and Chief Executive Officer |
Pursuant to the requirements of the Securities Exchange Act of 1934, this Annual Report on Form 10-K has been signed on the 24th14th day of February, 2021,2024, by the following persons in the capacities indicated.
| | | | | | | | |
/s/ WALTER J. LYNCHM. SUSAN HARDWICK | | /s/ JEFFREY N. EDWARDS |
Walter J. LynchM. Susan Hardwick
President and Chief Executive Officer
(Principal Executive Officer and Director) | | Jeffrey N. Edwards
(Director)
|
/s/ M. SUSAN HARDWICKJOHN C. GRIFFITH | | /s/ MARTHA CLARK GOSS |
M. Susan HardwickJohn C. Griffith
Executive Vice President and Chief Financial Officer
(Principal Financial Officer) | | Martha Clark Goss
(Director)
|
/s/ MELISSA K. WIKLE | | /s/ VERONICA M. HAGENKIMBERLY J. HARRIS |
Melissa K. Wikle
Senior Vice President, and ControllerChief Accounting Officer
(Principal Accounting Officer) | | Veronica M. HagenKimberly J. Harris
(Director) |
/s/ KIMBERLY J. HARRISLAURIE P. HAVANEC | | /s/ JULIA L. JOHNSON |
Kimberly J. HarrisLaurie P. Havanec
(Director) | | Julia L. Johnson
(Director) |
| /s/ PATRICIA L. KAMPLING | | /s/ KARL F. KURZ |
Patricia L. Kampling
(Director) | | Karl F. Kurz
(Chairman of the Board)Board Chair) |
/s/ JAMES G. STAVRIDISMICHAEL L. MARBERRY | | | /s/ LLOYD M. YATES
James G. StavridisMichael L. Marberry
(Director) | | | Lloyd M. Yates
(Director)
| | |
| | |