| þ | ANNUAL REPORT PURSUANT TO SECTION 13 OR 15(d) | ||||||||||
| OF THE SECURITIES EXCHANGE ACT OF 1934 | |||||||||||
| TRANSITION REPORT PURSUANT TO SECTION 13 OR 15(d) | |||||||||||
| OF THE SECURITIES EXCHANGE ACT OF 1934 | |||||||||||
(State or jurisdiction of incorporation or organization) | 26-1219283 (I.R.S. Employer Identification No.) | |||||||
333 South Grand Avenue, 28th Floor Los Angeles, CA (Address of principal executive office) | 90071 (Zip Code) | |||||||
| Title of Each Class | Trading Symbol(s) | Name of Each Exchange on Which Registered | ||||||||||||
Common Stock, par value $0.01 per share | OCSL | The | ||||||||||||
Large accelerated filer þ | Accelerated filer ¨ | Non-accelerated filer ¨ | Smaller reporting company ¨ | |||||||||||||||||
Emerging growth company ¨ | |||||||||||||||||||
| PART I | |||||||||
| PART II | |||||||||
| PART III | |||||||||
| PART IV | |||||||||
| Investment A | Investment B | Investment C | Investment D | Investment E | Cumulative Unrealized Capital Depreciation | Cumulative Realized Capital Losses | Cumulative Realized Capital Gains | |||||||||||||||||||
| Year 1 | $10 million (cost basis) | $10 million (cost basis) | $10 million (cost basis) | $10 million (cost basis) | $10 million (cost basis) | -- | -- | -- | ||||||||||||||||||
| Year 2 | $20 million (sale price) | $8 million FMV | $12 million FMV | $10 million FMV | $10 million FMV | $2 million | -- | $10 million | ||||||||||||||||||
| Year 3 | -- | $8 million FMV | $14 million FMV | $14 million FMV | $16 million FMV | $2 million | -- | $10 million | ||||||||||||||||||
| Year 4 | -- | $10 million FMV | $16 million FMV | $12 million (sale price) | $14 million FMV | -- | -- | $12 million | ||||||||||||||||||
| Year 5 | -- | $14 million FMV | $20 million (sale price) | -- | $10 million FMV | -- | -- | $22 million | ||||||||||||||||||
| Year 6 | -- | $16 million (sale price) | -- | -- | $8 million FMV | $2 million | -- | $28 million | ||||||||||||||||||
| Year 7 | -- | -- | -- | -- | $8 million (sale price) | -- | $2 million | $28 million | ||||||||||||||||||
| Assumed Return on Portfolio (Net of Expenses) | - 10% | - 5% | 0% | 5% | 10% | ||||||||||
| Corresponding net return to common stockholder | -22.31% | -13.00% | -3.69% | 5.62% | 14.94% | ||||||||||
| Assumed Return on Portfolio (Net of Expenses) | - 10% | - 5% | 0% | 5% | 10% | ||||||||||||
| Corresponding net return to common stockholder | -25.21% | -14.99% | -4.77% | 5.45% | 15.68% | ||||||||||||
| Subscription Rights Exercise Price | Net Asset Value Per Share Prior To Exercise | Net Asset Value Per Share After Exercise | ||||||||||||
| 10% premium to net asset value per common share | $ | 10.00 | $ | 10.20 | ||||||||||
| Net asset value per common share | $ | 10.00 | $ | 10.00 | ||||||||||
| 10% discount to net asset value per common share | $ | 10.00 | $ | 9.80 | ||||||||||
| Sale Price | |||||||||||||||||||||||||||||||||||
| NAV (1) | High | Low | Premium (Discount) of High Sales Price to NAV (2) | Premium (Discount) of Low Sales Price to NAV (2) | Cash Distribution per Share (3) | ||||||||||||||||||||||||||||||
| Year ended September 30, 2021 | |||||||||||||||||||||||||||||||||||
| First quarter | $ | 6.85 | $ | 5.66 | $ | 4.52 | (17.4) | % | (34.0) | % | $ | 0.110 | |||||||||||||||||||||||
| Second quarter | $ | 7.09 | $ | 6.36 | $ | 5.47 | (10.3) | % | (22.8) | % | $ | 0.120 | |||||||||||||||||||||||
| Third quarter | $ | 7.22 | $ | 6.92 | $ | 6.19 | (4.2) | % | (14.3) | % | $ | 0.130 | |||||||||||||||||||||||
| Fourth quarter | $ | 7.28 | $ | 7.40 | $ | 6.58 | 1.6 | % | (9.6) | % | $ | 0.145 | |||||||||||||||||||||||
| Year ended September 30, 2022 | |||||||||||||||||||||||||||||||||||
| First quarter | $ | 7.34 | $ | 7.62 | $ | 7.03 | 3.8 | % | (4.2) | % | $ | 0.155 | |||||||||||||||||||||||
| Second quarter | $ | 7.26 | $ | 7.81 | $ | 7.13 | 7.6 | % | (1.8) | % | $ | 0.016 | |||||||||||||||||||||||
| Third quarter | $ | 6.89 | $ | 7.61 | $ | 6.20 | 10.4 | % | (10.0) | % | $ | 0.165 | |||||||||||||||||||||||
| Fourth quarter | $ | 6.79 | $ | 7.25 | $ | 5.87 | 6.8 | % | (13.5) | % | $ | 0.170 | |||||||||||||||||||||||
| Year ending September 30, 2023 | |||||||||||||||||||||||||||||||||||
| First quarter (through November 11, 2022) | * | $ | 6.89 | $ | 5.86 | * | * | $0.32 (4) | |||||||||||||||||||||||||||
| High | Low | |||||||
| Fiscal year ended September 30, 2017 | ||||||||
| First quarter | $ | 5.95 | $ | 5.10 | ||||
| Second quarter | $ | 5.71 | $ | 4.31 | ||||
| Third quarter | $ | 5.00 | $ | 3.90 | ||||
| Fourth quarter | $ | 5.72 | $ | 4.51 | ||||
| Fiscal year ended September 30, 2016 | ||||||||
| First quarter | $ | 6.53 | $ | 5.53 | ||||
| Second quarter | $ | 6.52 | $ | 4.40 | ||||
| Third quarter | $ | 5.53 | $ | 4.71 | ||||
| Fourth quarter | $ | 6.32 | $ | 4.86 | ||||
| Date Declared | Record Date | Payment Date | Amount per Share | Cash Distribution | DRIP Shares Issued | DRIP Shares Value | |||||||||||
| August 4, 2015 | October 15, 2015 | October 30, 2015 | $ | 0.06 | $ 8.4 million | 106,185 | (1) | $ 0.6 million | |||||||||
| August 4, 2015 | November 16, 2015 | November 30, 2015 | 0.06 | 8.4 million | 91,335 | (1) | 0.6 million | ||||||||||
| November 30, 2015 | December 15, 2015 | December 30, 2015 | 0.06 | 8.4 million | 99,673 | (1) | 0.6 million | ||||||||||
| November 30, 2015 | January 15, 2016 | January 28, 2016 | 0.06 | 8.4 million | 113,905 | (1) | 0.7 million | ||||||||||
| November 30, 2015 | February 12, 2016 | February 26, 2016 | 0.06 | 8.4 million | 123,342 | (1) | 0.6 million | ||||||||||
| February 8, 2016 | March 15, 2016 | March 31, 2016 | 0.06 | 8.6 million | 86,806 | (1) | 0.4 million | ||||||||||
| February 8, 2016 | April 15, 2016 | April 29, 2016 | 0.06 | 8.2 million | 112,569 | (1) | 0.6 million | ||||||||||
| February 8, 2016 | May 13, 2016 | May 31, 2016 | 0.06 | 8.4 million | 76,432 | (1) | 0.4 million | ||||||||||
| May 5, 2016 | June 15, 2016 | June 30, 2016 | 0.06 | 8.2 million | 108,629 | (1) | 0.5 million | ||||||||||
| May 5, 2016 | July 15, 2016 | July 29, 2016 | 0.06 | 8.2 million | 100,268 | (1) | 0.6 million | ||||||||||
| May 5, 2016 | August 15, 2016 | August 31, 2016 | 0.06 | 8.3 million | 59,026 | (1) | 0.4 million | ||||||||||
| August 3, 2016 | September 15, 2016 | September 30, 2016 | 0.06 | 8.3 million | 65,170 | (1) | 0.4 million | ||||||||||
| August 3, 2016 | October 14, 2016 | October 31, 2016 | 0.06 | 8.2 million | 81,391 | (1) | 0.4 million | ||||||||||
| August 3, 2016 | November 15, 2016 | November 30, 2016 | 0.06 | 8.2 million | 80,962 | (1) | 0.4 million | ||||||||||
| October 18, 2016 | December 15, 2016 | December 30, 2016 | 0.06 | 7.7 million | 70,316 | (1) | 0.4 million | ||||||||||
| October 18, 2016 | January 13, 2017 | January 31, 2017 | 0.06 | 8.0 million | 73,940 | (1) | 0.4 million | ||||||||||
| October 18, 2016 | February 15, 2017 | February 28, 2017 | 0.06 | 8.0 million | 86,120 | (1) | 0.4 million | ||||||||||
| February 6, 2017 | March 15, 2017 | March 31, 2017 | 0.02 | 2.7 million | 27,891 | (1) | 0.1 million | ||||||||||
| February 6, 2017 | June 15, 2017 | June 30, 2017 | 0.02 | 2.7 million | 20,502 | (1) | 0.1 million | ||||||||||
| February 6, 2017 | September 15, 2017 | September 29, 2017 | 0.125 | 17.0 million | 118,992 | (1) | 0.7 million | ||||||||||
| August 7, 2017 | December 15, 2017 | December 29, 2017 | 0.125 | ||||||||||||||
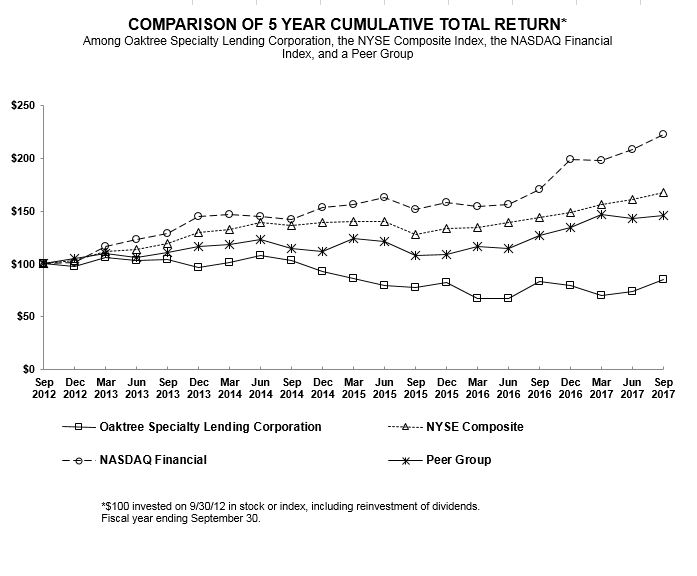
| Sep 2012 | Dec 2012 | Mar 2013 | Jun 2013 | Sep 2013 | Dec 2013 | Mar 2014 | Jun 2014 | Sep 2014 | Dec 2014 | ||||||||||||
| Oaktree Specialty Lending Corporation | 100.00 | 97.52 | 105.90 | 103.19 | 104.32 | 96.13 | 100.93 | 107.72 | 103.27 | 93.02 | |||||||||||
| NYSE Composite | 100.00 | 102.95 | 111.75 | 113.23 | 119.62 | 130.01 | 132.40 | 138.99 | 136.26 | 138.78 | |||||||||||
| NASDAQ Financial | 100.00 | 101.10 | 116.33 | 123.33 | 129.19 | 144.60 | 146.42 | 145.11 | 141.78 | 153.14 | |||||||||||
| Peer Group | 100.00 | 105.20 | 110.14 | 106.29 | 110.83 | 116.78 | 118.39 | 122.82 | 114.86 | 111.82 | |||||||||||
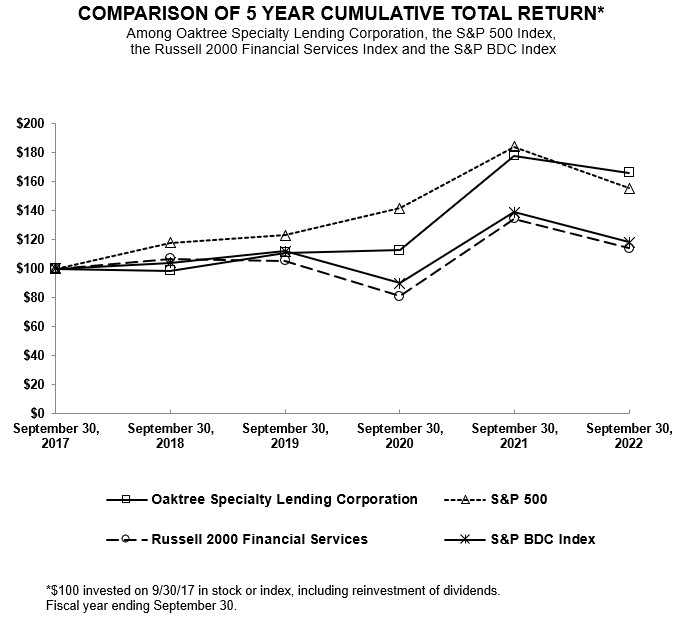
| September 30, 2017 | September 30, 2018 | September 30, 2019 | September 30, 2020 | September 30, 2021 | September 30, 2022 | ||||||||||||||||||
| Oaktree Specialty Lending Corporation | $ | 100.00 | $ | 98.62 | $ | 111.04 | $ | 112.83 | $ | 177.97 | $ | 166.19 | |||||||||||
| S&P 500 | $ | 100.00 | $ | 117.91 | $ | 122.93 | $ | 141.55 | $ | 184.02 | $ | 155.55 | |||||||||||
| Russell 2000 Financial Services | $ | 100.00 | $ | 106.79 | $ | 105.34 | $ | 81.07 | $ | 134.44 | $ | 113.96 | |||||||||||
| S&P BDC Index | $ | 100.00 | $ | 104.06 | $ | 112.05 | $ | 89.94 | $ | 138.81 | $ | 118.23 | |||||||||||
| Mar 2015 | Jun 2015 | Sep 2015 | Dec 2015 | Mar 2016 | Jun 2016 | Sep 2016 | Dec 2016 | Mar 2017 | Jun 2017 | Sep 2017 | |||||||||||||
Oaktree Specialty Lending Corporation (cont.) | 86.49 | 79.62 | 77.10 | 82.07 | 66.93 | 66.97 | 82.83 | 79.03 | 69.95 | 73.95 | 85.17 | ||||||||||||
| NYSE Composite (cont.) | 140.37 | 140.10 | 127.85 | 133.11 | 134.88 | 139.62 | 143.64 | 149.00 | 155.83 | 160.59 | 167.69 | ||||||||||||
| NASDAQ Financial (cont.) | 156.01 | 162.51 | 151.30 | 158.00 | 154.11 | 156.68 | 170.11 | 199.15 | 198.43 | 208.84 | 223.04 | ||||||||||||
| Peer Group (cont.) | 123.87 | 121.31 | 107.83 | 108.86 | 116.36 | 114.26 | 126.45 | 134.32 | 146.31 | 143.00 | 145.47 | ||||||||||||
| For the three months ended | ||||||||||||||||||||||||||||||||||||
(dollars in thousands, except per share amounts) | September 30, 2017 | June 30, 2017 | March 31, 2017 | December 31, 2016 | September 30, 2016 | June 30, 2016 | March 31, 2016 | December 31, 2015 | September 30, 2015 | June 30, 2015 | March 31, 2015 | December 31, 2014 | ||||||||||||||||||||||||
| Total investment income | $ | 35,732 | $ | 44,917 | $ | 45,555 | $ | 51,760 | $ | 59,160 | $ | 64,026 | $ | 59,563 | $ | 65,122 | $ | 63,770 | $ | 69,900 | $ | 66,467 | $ | 65,338 | ||||||||||||
| Net investment income | 11,464 | 19,390 | 18,504 | 23,294 | 25,695 | 29,106 | 25,343 | 26,582 | 28,159 | 32,251 | 28,123 | 26,407 | ||||||||||||||||||||||||
| Net realized and unrealized loss | (136,935 | ) | (25,447 | ) | (9,703 | ) | (97,536 | ) | (29,128 | ) | (34,324 | ) | (20,363 | ) | (89,468 | ) | (30,548 | ) | (11,740 | ) | (2,380 | ) | (54,877 | ) | ||||||||||||
| Net increase (decrease) in net assets resulting from operations | (125,471 | ) | (6,057 | ) | 8,801 | (74,242 | ) | (3,433 | ) | (5,218 | ) | 4,980 | (62,886 | ) | (2,389 | ) | 20,511 | 25,743 | (28,470 | ) | ||||||||||||||||
| Net assets | 867,657 | 1,010,750 | 1,019,626 | 1,030,272 | 1,142,288 | 1,184,376 | 1,225,974 | 1,263,113 | 1,353,094 | 1,403,213 | 1,410,302 | 1,407,822 | ||||||||||||||||||||||||
| Total investment income per common share | $ | 0.25 | $ | 0.32 | $ | 0.32 | $ | 0.36 | $ | 0.41 | $ | 0.44 | $ | 0.40 | $ | 0.43 | $ | 0.42 | $ | 0.46 | $ | 0.43 | $ | 0.43 | ||||||||||||
| Net investment income per common share | 0.08 | 0.14 | 0.13 | 0.16 | 0.18 | 0.20 | 0.17 | 0.18 | 0.18 | 0.21 | 0.18 | 0.17 | ||||||||||||||||||||||||
| Earnings (loss) per common share | (0.89 | ) | (0.04 | ) | 0.06 | (0.52 | ) | (0.02 | ) | (0.04 | ) | 0.03 | (0.42 | ) | (0.02 | ) | 0.13 | 0.17 | (0.19 | ) | ||||||||||||||||
| Net asset value per common share at period end | 6.16 | 7.17 | 7.23 | 7.31 | 7.97 | 8.15 | 8.33 | 8.41 | 9.00 | 9.15 | 9.20 | 9.18 | ||||||||||||||||||||||||
| Stockholder transaction expenses: | ||||||||||||||||||||||||||||||||||||||
| Sales load (as a percentage of offering price) | —% | (1) | ||||||||||||||||||||||||||||||||||||
| Offering expenses (as a percentage of offering price) | —% | (2) | ||||||||||||||||||||||||||||||||||||
| Dividend reinvestment plan fees | Up to $15 | (3) | ||||||||||||||||||||||||||||||||||||
| Total stockholder transaction expenses (as a percentage of offering price) | —% | (4) | ||||||||||||||||||||||||||||||||||||
| Annual expenses (as a percentage of net assets attributable to common stock): | ||||||||||||||||||||||||||||||||||||||
| Base management fees | 3.10% | (5) | ||||||||||||||||||||||||||||||||||||
| Incentive fees (17.5%) | 2.24% | (6) | ||||||||||||||||||||||||||||||||||||
| Interest payments on borrowed funds (including other costs of servicing and offering debt securities) | 5.28% | (7) | ||||||||||||||||||||||||||||||||||||
| Other expenses | 0.74% | (8) | ||||||||||||||||||||||||||||||||||||
| Acquired fund fees and expenses | 1.36% | (9) | ||||||||||||||||||||||||||||||||||||
| Total annual expenses | 12.72% | (10) | ||||||||||||||||||||||||||||||||||||
| An investor would pay the following expenses on a $1,000 investment | 1 Year | 3 Years | 5 Years | 10 Years | |||||||||||||||||||
| Assuming a 5% annual return (assumes no return from net realized capital gains) | $ | 100 | $ | 292 | $ | 474 | $ | 885 | |||||||||||||||
| Assuming a 5% annual return (assumes return entirely from net realized capital gains) | $ | 108 | $ | 314 | $ | 507 | $ | 929 | |||||||||||||||
| Period | Total Number of Shares Purchased | Average Price Paid per Share | Total Number of Shares Purchased as Part of Publicly Announced Programs | Dollar Value of Shares That May Yet be Purchased Under the Plans or Programs | ||||||||||||||
| October 1 - October 31 | — | $ | — | — | ||||||||||||||
| November 1 - November 30 | — | — | — | |||||||||||||||
| December 1 - December 31 | 2,298,247 | 5.44 | 2,298,247 | |||||||||||||||
| January 1 - January 31 | — | — | — | |||||||||||||||
| February 1 - February 29 | — | — | — | |||||||||||||||
| March 1- March 31 | — | — | — | |||||||||||||||
| April 1 - April 30 | — | — | — | |||||||||||||||
| May 1 - May 31 | — | — | — | |||||||||||||||
| June 1- June 30 | — | — | — | |||||||||||||||
| July 1 - July 31 | — | — | — | |||||||||||||||
| August 1 - August 31 | — | — | — | |||||||||||||||
| September 1 - September 30 | — | — | — | |||||||||||||||
| Total | 2,298,247 | $ | 5.44 | 2,298,247 | $ | — | ||||||||||||
| As of and for the Years Ended | ||||||||||||
| (dollars in thousands, except per share amounts) | September 30, 2017 | September 30, 2016 | September 30, 2015 | September 30, 2014 | September 30, 2013 | |||||||
| Statement of Operations data: | ||||||||||||
| Total investment income | $177,964 | $247,872 | $265,475 | $293,954 | $221,612 | |||||||
| Base management fee, net | 31,129 | 41,145 | 51,069 | 51,048 | 33,427 | |||||||
| Incentive fee | 10,713 | 22,091 | 28,575 | 35,472 | 28,158 | |||||||
| All other expenses | 64,729 | 97,338 | 70,891 | 64,860 | 45,074 | |||||||
| Gain on extinguishment of unsecured convertible notes | — | — | — | — | — | |||||||
| Insurance recoveries | 1,259 | 19,429 | — | — | — | |||||||
| Net investment income | 72,652 | 106,727 | 114,940 | 142,574 | 114,953 | |||||||
| Net unrealized appreciation (depreciation) on investments | (97,543) | (47,924) | (71,674) | (32,164) | 13,397 | |||||||
| Net unrealized (appreciation) depreciation on secured borrowings | (296) | (76) | 658 | (53) | — | |||||||
| Realized gain (loss) on investments | (171,782) | (125,283) | (28,529) | 2,175 | (26,529) | |||||||
| Net increase (decrease) in net assets resulting from operations | (196,969) | (66,556) | 15,395 | 112,532 | 101,821 | |||||||
| Per share data: | ||||||||||||
| Net asset value per common share at period end | $6.16 | $7.97 | $9.00 | $9.64 | $9.85 | |||||||
| Market price at period end | 5.47 | 5.81 | 6.17 | 9.18 | 10.29 | |||||||
| Net investment income | 0.51 | 0.72 | 0.75 | 1.00 | 1.04 | |||||||
| Net realized and unrealized loss on investments and secured borrowings | (1.90) | (1.17) | (0.65) | (0.21) | (0.12) | |||||||
| Net increase (decrease) in net assets resulting from operations | (1.39) | (0.45) | 0.10 | 0.79 | 0.92 | |||||||
| Distributions per common share | 0.465 | 0.72 | 0.79 | 1.00 | 1.15 | |||||||
| Balance Sheet data at period end: | ||||||||||||
| Total investments at fair value | $1,541,755 | $2,165,491 | $2,402,495 | $2,495,914 | $1,893,046 | |||||||
| Cash, cash equivalents and restricted cash | 59,913 | 130,362 | 143,484 | 109,046 | 147,359 | |||||||
| Other assets | 14,380 | 47,432 | 39,678 | 63,258 | 31,928 | |||||||
| Total assets | 1,616,048 | 2,343,285 | 2,585,657 | 2,668,218 | 2,072,333 | |||||||
| Total liabilities | 748,391 | 1,200,997 | 1,232,563 | 1,189,743 | 703,461 | |||||||
| Total net assets | 867,657 | 1,142,288 | 1,353,094 | 1,478,475 | 1,368,872 | |||||||
| Other data: | ||||||||||||
| Weighted average yield on debt investments (1) | 9.6% | 10.4% | 10.8% | 11.1% | 11.1% | |||||||
| Number of portfolio companies at period end | 125 | 129 | 135 | 124 | 99 | |||||||
| (Share amounts in thousands) | Year ended September 30, 2022 | Year ended September 30, 2021 | Year ended September 30, 2020 | Year ended September 30, 2019 | Year ended September 30, 2018 (1) | |||||||||||||||||||||||||||
| Net asset value per share at beginning of period | $7.28 | $6.49 | $6.60 | $6.09 | $6.16 | |||||||||||||||||||||||||||
| Net investment income (2) | 0.82 | 0.60 | 0.51 | 0.48 | 0.43 | |||||||||||||||||||||||||||
| Net unrealized appreciation (depreciation) (2)(5) | (0.75) | 0.73 | (0.14) | 0.27 | 0.73 | |||||||||||||||||||||||||||
| Net realized gains (losses) (2) | 0.09 | 0.16 | (0.10) | 0.14 | (0.83) | |||||||||||||||||||||||||||
| (Provision) benefit for taxes on realized and unrealized gains (losses) (2) | — | — | 0.01 | — | — | |||||||||||||||||||||||||||
| Distributions of net investment income to stockholders | (0.65) | (0.51) | (0.39) | (0.38) | (0.27) | |||||||||||||||||||||||||||
| Tax return of capital | — | — | — | — | (0.13) | |||||||||||||||||||||||||||
| Issuance of common stock | — | (0.19) | — | — | — | |||||||||||||||||||||||||||
| Net asset value per share at end of period | $6.79 | $7.28 | $6.49 | $6.60 | $6.09 | |||||||||||||||||||||||||||
| Per share market value at beginning of period | $7.06 | $4.84 | $5.18 | $4.96 | $5.47 | |||||||||||||||||||||||||||
| Per share market value at end of period | $6.00 | $7.06 | $4.84 | $5.18 | $4.96 | |||||||||||||||||||||||||||
| Total return (3) | (6.71)% | 57.61% | 2.10% | 12.56% | (1.49)% | |||||||||||||||||||||||||||
| Common shares outstanding at beginning of period | 180,361 | 140,961 | 140,961 | 140,961 | 140,961 | |||||||||||||||||||||||||||
| Common shares outstanding at end of period | 183,374 | 180,361 | 140,961 | 140,961 | 140,961 | |||||||||||||||||||||||||||
| Net assets at beginning of period | $1,312,823 | $914,879 | $930,630 | $858,035 | $867,657 | |||||||||||||||||||||||||||
| Net assets at end of period | $1,245,563 | $1,312,823 | $914,879 | $930,630 | $858,035 | |||||||||||||||||||||||||||
| Average net assets (4) | $1,308,518 | $1,150,662 | $871,305 | $909,264 | $841,583 | |||||||||||||||||||||||||||
| Ratio of net investment income to average net assets (4) | 11.36% | 8.44% | 8.26% | 7.47% | 7.13% | |||||||||||||||||||||||||||
| Ratio of total expenses to average net assets (4) | 8.68% | 9.65% | 7.57% | 9.65% | 9.51% | |||||||||||||||||||||||||||
| Ratio of net expenses to average net assets (4) | 8.45% | 9.51% | 8.16% | 8.78% | 9.35% | |||||||||||||||||||||||||||
| Ratio of portfolio turnover to average investments at fair value | 26.99% | 39.66% | 38.99% | 32.50% | 67.66% | |||||||||||||||||||||||||||
| Weighted average outstanding debt (6) | $1,361,151 | $964,390 | $647,080 | $573,891 | $608,553 | |||||||||||||||||||||||||||
| Average debt per share (2) | $7.47 | $5.95 | $4.59 | $4.07 | $4.32 | |||||||||||||||||||||||||||
| Asset coverage ratio at end of period (7) | 188.64% | 201.68% | 227.22% | 294.91% | 232.98% | |||||||||||||||||||||||||||
| (1) | |||||
| (2) | Calculated based upon | ||||
| (3) | Total return | ||||
| (4) | Calculated based upon the weighted average net assets for the period. | ||||
| (5) | For the year ended September 30, 2021, the amount shown for net unrealized appreciation (depreciation) includes the effect of the timing of common stock issuances in connection with the OCSI Merger. | ||||
| (6) | Calculated based upon the weighted average of principal debt outstanding for the period. | ||||
| (7) | Based on outstanding senior securities of $1,350.0 million, $1,280.0 million, $714.8 million, $476.1 million and $643.4 million as of September 30, 2022, 2021, 2020, 2019 and 2018, respectively. | ||||
| Year ended September 30, 2017 | Year ended September 30, 2016 | Year Ended September 30, 2015 | Year Ended September 30, 2014 | Year Ended September 30, 2013 | ||||||||||||||||||||||||||||
| Net asset value at beginning of period | $7.97 | $9.00 | $9.64 | $9.85 | $9.92 | |||||||||||||||||||||||||||
| Net investment income (4) | 0.51 | 0.72 | 0.75 | 1.00 | 1.04 | |||||||||||||||||||||||||||
| Net unrealized appreciation (depreciation) (4) | (0.69) | (0.33) | (0.46) | (0.23) | 0.12 | |||||||||||||||||||||||||||
| Net realized gains (losses) (4) | (1.21) | (0.84) | (0.19) | 0.02 | (0.24) | |||||||||||||||||||||||||||
| Distributions of net investment income to stockholders | (0.47) | (0.67) | (0.79) | (0.94) | (0.90) | |||||||||||||||||||||||||||
| Tax return of capital | — | (0.05) | — | (0.06) | (0.25) | |||||||||||||||||||||||||||
| Net issuance/repurchase of common stock | 0.05 | 0.14 | 0.05 | — | 0.16 | |||||||||||||||||||||||||||
| Net asset value at end of period | $6.16 | $7.97 | $9.00 | $9.64 | $9.85 | |||||||||||||||||||||||||||
| Per share market value at beginning of period | $5.81 | $6.17 | $9.18 | $10.29 | $10.98 | |||||||||||||||||||||||||||
| Per share market value at end of period | $5.47 | $5.81 | $6.17 | $9.18 | $10.29 | |||||||||||||||||||||||||||
| Total return (1) | 2.84% | 7.02% | (27.18)% | (0.97)% | 4.89% | |||||||||||||||||||||||||||
| Common shares outstanding at beginning of period | 143,259 | 150,263 | 153,340 | 139,041 | 91,048 | |||||||||||||||||||||||||||
| Common shares outstanding at end of period | 140,961 | 143,259 | 150,263 | 153,340 | 139,041 | |||||||||||||||||||||||||||
| Net assets at beginning of period | $1,142,288 | $1,353,094 | $1,478,475 | $1,368,872 | $903,570 | |||||||||||||||||||||||||||
| Net assets at end of period | $867,657 | $1,142,288 | $1,353,094 | $1,478,475 | $1,368,872 | |||||||||||||||||||||||||||
| Average net assets (2) | $1,018,498 | $1,229,639 | $1,413,357 | $1,393,635 | $1,095,225 | |||||||||||||||||||||||||||
| Ratio of net investment income to average net assets (2) | 7.13% | 8.68% | 8.13% | 10.23% | 10.50% | |||||||||||||||||||||||||||
| Ratio of total expenses to average net assets (2) | 10.49% | 13.09% | 10.69% | 10.91% | 9.95% | |||||||||||||||||||||||||||
| Ratio of net expenses to average net assets (2) | 10.35% | 11.48% | 10.65% | 10.86% | 9.74% | |||||||||||||||||||||||||||
| Ratio of portfolio turnover to average investments at fair value | 39.06% | 23.39% | 23.02% | 25.50% | 38.22% | |||||||||||||||||||||||||||
| Weighted average outstanding debt (3) | $982,372 | $1,190,105 | $1,228,413 | $1,110,021 | $597,596 | |||||||||||||||||||||||||||
| Average debt per share (4) | $6.95 | $8.07 | $8.02 | $7.82 | $5.42 | |||||||||||||||||||||||||||
| Asset coverage ratio at end of period (5) | 227.40% | 220.84% | 238.95% | 259.50% | 394.86% | |||||||||||||||||||||||||||
| (1) | Total return equals the increase or decrease of ending market value over beginning market value, plus distributions, divided by the beginning market value, assuming dividend reinvestment prices obtained under the Company's DRIP. Total return does not include sales load. | ||||
| (2) | Calculated based upon the weighted average net assets for the period. | ||||
| (3) | Calculated based upon the weighted average of principal debt outstanding for the period. | ||||
| (4) | Calculated based upon weighted average shares outstanding for the period. | ||||
| (5) | Based on outstanding senior securities of $680.7 million, $946.5 million, $975.3 million, $928.4 million and $464.3 million as of September 30, 2017, 2016, 2015, 2014 and 2013, respectively. | ||||
| September 30, 2022 | September 30, 2021 | |||||||||||||
| Cost: | ||||||||||||||
| Senior secured debt | 85.08 | % | 85.85 | % | ||||||||||
| Debt investments in the JVs | 5.59 | 5.79 | ||||||||||||
| Preferred equity | 3.26 | 2.60 | ||||||||||||
| Subordinated debt | 2.57 | 1.67 | ||||||||||||
| LLC equity interests of the JVs | 1.88 | 1.94 | ||||||||||||
| Common equity and warrants | 1.62 | 2.15 | ||||||||||||
| Total | 100.00 | % | 100.00 | % | ||||||||||
| September 30, 2022 | September 30, 2021 | |||||||||||||
| Fair value: | ||||||||||||||
| Senior secured debt | 86.86 | % | 86.72 | % | ||||||||||
| Debt investments in the JVs | 5.88 | 5.94 | ||||||||||||
| Preferred equity | 3.19 | 2.49 | ||||||||||||
| Subordinated debt | 2.28 | 1.67 | ||||||||||||
| Common equity and warrants | 0.96 | 1.71 | ||||||||||||
| LLC equity interests of the JVs | 0.83 | 1.47 | ||||||||||||
| Total | 100.00 | % | 100.00 | % | ||||||||||
| September 30, 2017 | September 30, 2016 | |||||
| Cost: | ||||||
| Senior secured debt | 74.73 | % | 78.36 | % | ||
| Subordinated debt | 6.42 | 7.49 | ||||
| Debt investments in SLF JV I | 7.32 | 6.34 | ||||
| LLC equity interests of SLF JV I | 0.92 | 0.70 | ||||
| Purchased equity | 6.40 | 3.61 | ||||
| Equity grants | 2.78 | 2.40 | ||||
| Limited partnership interests | 1.43 | 1.10 | ||||
| Total | 100.00 | % | 100.00 | % | ||
| September 30, 2017 | September 30, 2016 | |||||
| Fair value: | ||||||
| Senior secured debt | 78.01 | % | 78.02 | % | ||
| Subordinated debt | 6.06 | 7.22 | ||||
| Debt investments in SLF JV I | 8.35 | 5.96 | ||||
| LLC equity interests of SLF JV I | 0.36 | 0.63 | ||||
| Purchased equity | 5.10 | 5.27 | ||||
| Equity grants | 0.45 | 1.86 | ||||
| Limited partnership interests | 1.67 | 1.04 | ||||
| Total | 100.00 | % | 100.00 | % | ||
| September 30, 2022 | September 30, 2021 | |||||||||||||
| Cost: | ||||||||||||||
| Application Software | 14.98 | % | 14.49 | % | ||||||||||
| Multi-Sector Holdings (1) | 7.48 | 7.73 | ||||||||||||
| Pharmaceuticals | 4.83 | 5.44 | ||||||||||||
| Data Processing & Outsourced Services | 4.60 | 4.74 | ||||||||||||
| Biotechnology | 4.20 | 4.41 | ||||||||||||
| Health Care Technology | 3.82 | 0.55 | ||||||||||||
| Industrial Machinery | 3.12 | 3.47 | ||||||||||||
| Specialized Finance | 3.09 | 2.70 | ||||||||||||
| Internet & Direct Marketing Retail | 2.59 | 2.45 | ||||||||||||
| Aerospace & Defense | 2.37 | 2.66 | ||||||||||||
| Construction & Engineering | 2.33 | 2.44 | ||||||||||||
| Automotive Retail | 2.26 | 1.65 | ||||||||||||
| Health Care Services | 2.24 | 3.34 | ||||||||||||
| Health Care Distributors | 2.18 | 0.78 | ||||||||||||
| Internet Services & Infrastructure | 2.07 | 1.85 | ||||||||||||
| Personal Products | 2.03 | 4.08 | ||||||||||||
| Fertilizers & Agricultural Chemicals | 1.88 | 2.63 | ||||||||||||
| Metal & Glass Containers | 1.82 | 0.69 | ||||||||||||
| Real Estate Operating Companies | 1.82 | 1.08 | ||||||||||||
| Home Improvement Retail | 1.75 | 1.83 | ||||||||||||
| Airport Services | 1.65 | 1.64 | ||||||||||||
| Real Estate Services | 1.54 | 1.59 | ||||||||||||
| Leisure Facilities | 1.52 | 0.99 | ||||||||||||
| Diversified Support Services | 1.45 | 1.60 | ||||||||||||
| Specialty Chemicals | 1.43 | 1.84 | ||||||||||||
| Health Care Supplies | 1.39 | 1.17 | ||||||||||||
| Insurance Brokers | 1.36 | 1.00 | ||||||||||||
| Integrated Telecommunication Services | 1.32 | 1.85 | ||||||||||||
| Soft Drinks | 1.31 | 1.32 | ||||||||||||
| Electrical Components & Equipment | 1.29 | 1.27 | ||||||||||||
| Other Diversified Financial Services | 1.12 | 0.63 | ||||||||||||
| Advertising | 1.08 | 1.13 | ||||||||||||
| Movies & Entertainment | 1.00 | 1.02 | ||||||||||||
| Distributors | 0.97 | — | ||||||||||||
| Health Care Equipment | 0.93 | 0.93 | ||||||||||||
| Oil & Gas Storage & Transportation | 0.85 | 1.44 | ||||||||||||
| Environmental & Facilities Services | 0.80 | — | ||||||||||||
| Cable & Satellite | 0.79 | 1.05 | ||||||||||||
| Home Furnishings | 0.75 | 0.77 | ||||||||||||
| Systems Software | 0.57 | 0.26 | ||||||||||||
| Consumer Finance | 0.55 | — | ||||||||||||
| Hotels, Resorts & Cruise Lines | 0.53 | — | ||||||||||||
| Auto Parts & Equipment | 0.48 | 0.49 | ||||||||||||
| IT Consulting & Other Services | 0.45 | 0.30 | ||||||||||||
| Restaurants | 0.36 | 0.37 | ||||||||||||
| Research & Consulting Services | 0.35 | 0.29 | ||||||||||||
| Education Services | 0.35 | 0.04 | ||||||||||||
| Oil & Gas Refining & Marketing | 0.33 | 1.42 | ||||||||||||
| Trading Companies & Distributors | 0.29 | — | ||||||||||||
| Air Freight & Logistics | 0.28 | 0.19 | ||||||||||||
| Apparel Retail | 0.20 | — | ||||||||||||
| Apparel, Accessories & Luxury Goods | 0.20 | 0.20 | ||||||||||||
| Integrated Oil & Gas | 0.19 | 0.19 | ||||||||||||
| Food Distributors | 0.18 | 0.18 | ||||||||||||
| Specialized REITs | 0.16 | — | ||||||||||||
| Diversified Banks | 0.13 | 0.14 | ||||||||||||
| Technology Distributors | 0.12 | 0.12 | ||||||||||||
| Construction Materials | 0.09 | 0.09 | ||||||||||||
| Housewares & Specialties | 0.09 | 0.07 | ||||||||||||
| Electronic Components | 0.08 | 0.40 | ||||||||||||
| Alternative Carriers | 0.01 | 0.26 | ||||||||||||
| Independent Power Producers & Energy Traders | — | 0.92 | ||||||||||||
| Airlines | — | 0.88 | ||||||||||||
| Commercial Printing | — | 0.78 | ||||||||||||
| Managed Health Care | — | 0.73 | ||||||||||||
| Thrifts & Mortgage Finance | — | 0.63 | ||||||||||||
| Property & Casualty Insurance | — | 0.39 | ||||||||||||
| Leisure Products | — | 0.26 | ||||||||||||
| Food Retail | — | 0.15 | ||||||||||||
| Total | 100.00 | % | 100.00 | % | ||||||||||
| September 30, 2017 | September 30, 2016 | |||||
| Cost: | ||||||
| Internet software & services | 15.37 | % | 15.80 | % | ||
| Healthcare services | 11.98 | 16.60 | ||||
| Multi-sector holdings (1) | 9.87 | 7.80 | ||||
| Healthcare equipment | 5.67 | 5.24 | ||||
| Advertising | 4.82 | 7.47 | ||||
| Data processing & outsourced services | 4.42 | 3.68 | ||||
| Construction & engineering | 3.86 | 2.90 | ||||
| Pharmaceuticals | 3.46 | 2.61 | ||||
| Specialty stores | 3.33 | 2.04 | ||||
| Airlines | 3.28 | 3.11 | ||||
| Application software | 2.93 | 2.13 | ||||
| Education services | 2.85 | 1.03 | ||||
| Environmental & facilities services | 2.84 | 4.34 | ||||
| Research & consulting services | 2.16 | 2.76 | ||||
| Air freight and logistics | 1.85 | 1.39 | ||||
| Leisure facilities | 1.76 | 1.49 | ||||
| Integrated telecommunication services | 1.75 | 2.47 | ||||
| Housewares & specialties | 1.70 | — | ||||
| Oil & gas equipment services | 1.57 | 2.00 | ||||
| Casinos & gaming | 1.33 | — | ||||
| Consumer electronics | 1.32 | 1.09 | ||||
| Home improvement retail | 1.31 | 1.07 | ||||
| Diversified support services | 1.29 | 3.73 | ||||
| Auto parts & equipment | 1.21 | 0.73 | ||||
| Industrial machinery | 0.86 | 2.04 | ||||
| Distributors | 0.85 | — | ||||
| Security & alarm services | 0.75 | 0.59 | ||||
| Real Estate Services | 0.74 | — | ||||
| Other diversified financial services | 0.69 | 0.65 | ||||
| Hypermarkets & super centers | 0.68 | — | ||||
| Precious metals & minerals | 0.42 | — | ||||
| Thrift & mortgage finance | 0.41 | 0.35 | ||||
| Trucking | 0.40 | — | ||||
| Computer & electronics retail | 0.36 | — | ||||
| Multi-utilities | 0.35 | — | ||||
| Commercial printing | 0.34 | 0.27 | ||||
| Apparel, accessories & luxury goods | 0.29 | 0.69 | ||||
| Restaurants | 0.28 | 0.22 | ||||
| Food retail | 0.24 | 0.18 | ||||
| IT consulting & other services | 0.23 | 2.27 | ||||
| Specialized finance | 0.18 | — | ||||
| Food distributors | — | 0.52 | ||||
| Specialized consumer services | — | 0.39 | ||||
| Healthcare technology | — | 0.35 | ||||
| Total | 100.00 | % | 100.00 | % | ||
| September 30, 2017 | September 30, 2016 | |||||
| Fair value: | ||||||
| Internet software & services | 17.20 | % | 15.09 | % | ||
| Multi-sector holdings (1) | 10.67 | 7.37 | ||||
| Healthcare services | 6.09 | 16.64 | ||||
| Advertising | 5.43 | 6.90 | ||||
| Healthcare equipment | 4.73 | 5.58 | ||||
| Data processing & outsourced services | 4.43 | 3.71 | ||||
| Pharmaceuticals | 4.07 | 2.79 | ||||
| Airlines | 3.86 | 3.56 | ||||
| Specialty stores | 3.69 | 2.09 | ||||
| Application software | 3.50 | 2.35 | ||||
| Environmental & facilities services | 3.29 | 4.66 | ||||
| Construction & engineering | 3.26 | 2.90 | ||||
| Research & consulting services | 2.50 | 2.93 | ||||
| Education services | 2.48 | 0.91 | ||||
| Leisure facilities | 2.11 | 1.59 | ||||
| Integrated telecommunication services | 2.03 | 2.45 | ||||
| Housewares & specialties | 1.93 | — | ||||
| Oil & gas equipment services | 1.84 | 0.78 | ||||
| Home improvement retail | 1.61 | 1.21 | ||||
| Consumer electronics | 1.56 | 1.16 | ||||
| Casinos & gaming | 1.52 | — | ||||
| Diversified support services | 1.46 | 3.50 | ||||
| Auto parts & equipment | 1.41 | 0.86 | ||||
| Industrial machinery | 0.97 | 2.38 | ||||
| Distributors | 0.96 | — | ||||
| Security & alarm services | 0.85 | 0.64 | ||||
| Real Estate Services | 0.84 | — | ||||
| Other diversified financial services | 0.76 | 0.68 | ||||
| Hypermarkets & super centers | 0.75 | — | ||||
| Precious metals & minerals | 0.48 | — | ||||
| Trucking | 0.46 | — | ||||
| Computer & electronics retail | 0.42 | — | ||||
| Multi-utilities | 0.41 | — | ||||
| Thrift & mortgage finance | 0.40 | 0.27 | ||||
| Commercial printing | 0.39 | 0.28 | ||||
| Leisure products | 0.38 | 1.62 | ||||
| Restaurants | 0.32 | 0.23 | ||||
| Food retail | 0.28 | 0.19 | ||||
| IT consulting & other services | 0.25 | 2.38 | ||||
| Specialized finance | 0.21 | — | ||||
| Air freight and logistics | 0.12 | 0.33 | ||||
| Apparel, accessories & luxury goods | 0.08 | 0.68 | ||||
| Food distributors | — | 0.53 | ||||
| Specialized consumer services | — | 0.42 | ||||
| Healthcare technology | — | 0.34 | ||||
| Total | 100.00 | % | 100.00 | % | ||
| September 30, 2022 | September 30, 2021 | |||||||||||||
| Fair value: | ||||||||||||||
| Application Software | 15.43 | % | 14.58 | % | ||||||||||
| Multi-Sector Holdings (1) | 6.71 | 7.41 | ||||||||||||
| Pharmaceuticals | 4.79 | 5.56 | ||||||||||||
| Data Processing & Outsourced Services | 4.46 | 4.46 | ||||||||||||
| Biotechnology | 4.35 | 4.44 | ||||||||||||
| Health Care Technology | 3.90 | 0.55 | ||||||||||||
| Industrial Machinery | 3.25 | 3.53 | ||||||||||||
| Specialized Finance | 2.93 | 2.69 | ||||||||||||
| Internet & Direct Marketing Retail | 2.82 | 2.68 | ||||||||||||
| Aerospace & Defense | 2.48 | 2.72 | ||||||||||||
| Construction & Engineering | 2.45 | 2.47 | ||||||||||||
| Automotive Retail | 2.31 | 1.65 | ||||||||||||
| Health Care Distributors | 2.19 | 0.77 | ||||||||||||
| Internet Services & Infrastructure | 2.16 | 1.87 | ||||||||||||
| Fertilizers & Agricultural Chemicals | 2.08 | 2.64 | ||||||||||||
| Personal Products | 2.01 | 4.13 | ||||||||||||
| Real Estate Operating Companies | 1.93 | 1.11 | ||||||||||||
| Metal & Glass Containers | 1.91 | 0.68 | ||||||||||||
| Health Care Services | 1.84 | 3.31 | ||||||||||||
| Home Improvement Retail | 1.82 | 1.82 | ||||||||||||
| Airport Services | 1.72 | 1.59 | ||||||||||||
| Real Estate Services | 1.59 | 1.61 | ||||||||||||
| Leisure Facilities | 1.57 | 0.90 | ||||||||||||
| Diversified Support Services | 1.47 | 1.60 | ||||||||||||
| Health Care Supplies | 1.47 | 1.18 | ||||||||||||
| Specialty Chemicals | 1.36 | 1.82 | ||||||||||||
| Soft Drinks | 1.35 | 1.31 | ||||||||||||
| Insurance Brokers | 1.33 | 1.08 | ||||||||||||
| Electrical Components & Equipment | 1.32 | 1.26 | ||||||||||||
| Integrated Telecommunication Services | 1.29 | 1.94 | ||||||||||||
| Advertising | 1.08 | 1.19 | ||||||||||||
| Movies & Entertainment | 1.07 | 1.06 | ||||||||||||
| Distributors | 0.98 | — | ||||||||||||
| Other Diversified Financial Services | 0.98 | 0.62 | ||||||||||||
| Health Care Equipment | 0.97 | 0.93 | ||||||||||||
| Oil & Gas Storage & Transportation | 0.84 | 1.35 | ||||||||||||
| Environmental & Facilities Services | 0.83 | — | ||||||||||||
| Cable & Satellite | 0.78 | 1.06 | ||||||||||||
| Home Furnishings | 0.73 | 0.77 | ||||||||||||
| Hotels, Resorts & Cruise Lines | 0.56 | — | ||||||||||||
| Consumer Finance | 0.53 | — | ||||||||||||
| Systems Software | 0.51 | 0.26 | ||||||||||||
| Auto Parts & Equipment | 0.46 | 0.48 | ||||||||||||
| Restaurants | 0.35 | 0.37 | ||||||||||||
| Oil & Gas Refining & Marketing | 0.34 | 1.43 | ||||||||||||
| IT Consulting & Other Services | 0.34 | 0.29 | ||||||||||||
| Education Services | 0.34 | 0.04 | ||||||||||||
| Research & Consulting Services | 0.34 | 0.30 | ||||||||||||
| Air Freight & Logistics | 0.26 | 0.19 | ||||||||||||
| Trading Companies & Distributors | 0.22 | — | ||||||||||||
| Apparel Retail | 0.21 | — | ||||||||||||
| Integrated Oil & Gas | 0.20 | 0.19 | ||||||||||||
| Diversified Banks | 0.14 | 0.14 | ||||||||||||
| Food Distributors | 0.13 | 0.18 | ||||||||||||
| Specialized REITs | 0.13 | — | ||||||||||||
| Technology Distributors | 0.12 | 0.12 | ||||||||||||
| Housewares & Specialties | 0.10 | 0.08 | ||||||||||||
| Construction Materials | 0.08 | 0.09 | ||||||||||||
| Electronic Components | 0.08 | 0.40 | ||||||||||||
| Alternative Carriers | 0.01 | 0.27 | ||||||||||||
| Airlines | — | 0.96 | ||||||||||||
| Independent Power Producers & Energy Traders | — | 0.92 | ||||||||||||
| Commercial Printing | — | 0.79 | ||||||||||||
| Managed Health Care | — | 0.74 | ||||||||||||
| Thrifts & Mortgage Finance | — | 0.62 | ||||||||||||
| Property & Casualty Insurance | — | 0.39 | ||||||||||||
| Leisure Products | — | 0.26 | ||||||||||||
| Food Retail | — | 0.15 | ||||||||||||
| Total | 100.00 | % | 100.00 | % | ||||||||||
| September 30, 2017 | September 30, 2016 | September 30, 2015 | ||||||||||||||||||||||||||||||||||||||||
| Cost | % of Debt Portfolio | Fair Value | % of Debt Portfolio | Cost | % of Debt Portfolio | Fair Value | % of Debt Portfolio | Cost | % of Debt Portfolio | Fair Value | % of Debt Portfolio | |||||||||||||||||||||||||||||||
| Accrual | $ | 1,299,793 | 83.59 | % | $ | 1,357,794 | 95.29 | % | $ | 1,890,606 | 89.80 | % | $ | 1,854,228 | 93.89 | % | $ | 2,226,334 | 95.08 | % | $ | 2,206,418 | 97.97 | % | ||||||||||||||||||
| PIK non-accrual (1) | 10,227 | 0.66 | 379 | 0.03 | 40,187 | 1.91 | 31,548 | 1.60 | 66,579 | 2.84 | 28,145 | 1.25 | ||||||||||||||||||||||||||||||
| Cash non-accrual (2) | 244,952 | 15.75 | 66,636 | 4.68 | 174,629 | 8.29 | 89,036 | 4.51 | 48,694 | 2.08 | 17,600 | 0.78 | ||||||||||||||||||||||||||||||
| Total | $ | 1,554,972 | 100.00 | % | $ | 1,424,809 | 100.00 | % | $ | 2,105,422 | 100.00 | % | $ | 1,974,812 | 100.00 | % | $ | 2,341,607 | 100.00 | % | $ | 2,252,163 | 100.00 | % | ||||||||||||||||||
| Year ended September 30, 2017 | Year ended September 30, 2016 | Year ended September 30, 2015 | ||||||||||
| Cash interest income | $ | 18,327 | $ | 13,737 | $ | 5,179 | ||||||
| PIK interest income | 7,801 | 7,225 | 8,423 | |||||||||
| OID income | 154 | 27,886 | 4,627 | |||||||||
| Total | $ | 26,282 | $ | 48,848 | $ | 18,229 | ||||||
| September 30, 2017 | September 30, 2016 | |||
| Senior secured loans (1) | $245,063 | $324,406 | ||
| Weighted average interest rate on senior secured loans (2) | 7.70% | 7.84% | ||
| Number of borrowers in SLF JV I | 32 | 37 | ||
| Largest exposure to a single borrower (1) | $18,374 | $19,775 | ||
| Total of five largest loan exposures to borrowers (1) | $82,728 | $93,926 | ||
| Portfolio Company | Industry | Investment Type | Maturity Date | Current Interest Rate(1)(4) | Cash Interest Rate | Principal | Cost | Fair Value (2) | |||||||||||||||
| AdVenture Interactive, Corp. (3) | Advertising | 927 Common Stock Shares | $ | 1,088 | $ | 1,412 | |||||||||||||||||
| Allied Universal Holdco LLC (3) | Security & alarm services | First Lien | 7/28/2022 | LIBOR+3.75% (1% floor) | 5.08 | % | $ | 6,982 | 7,040 | 6,976 | |||||||||||||
| Ameritox Ltd. (3)(5) | Healthcare services | First Lien | 4/11/2021 | LIBOR+5% (1% floor) 3% PIK | 6.33 | % | 5,759 | 5,638 | 668 | ||||||||||||||
| 301,913.06 Class B Preferred Units | 302 | — | |||||||||||||||||||||
| 928.96 Class A Common Units | 5,474 | — | |||||||||||||||||||||
| Total Ameritox, Ltd. | 5,759 | 11,414 | 668 | ||||||||||||||||||||
| BeyondTrust Software, Inc. (3) | Application software | First Lien | 9/25/2019 | LIBOR+7% (1% floor) | 8.33 | % | 15,330 | 15,231 | 15,329 | ||||||||||||||
| BJ's Wholesale Club, Inc. (3) | Hypermarkets & super centers | First Lien | 1/26/2024 | LIBOR+3.75% (1% floor) | 4.99 | % | 4,988 | 4,993 | 4,793 | ||||||||||||||
| Compuware Corporation | Internet software & services | First Lien B3 | 12/15/2021 | LIBOR+4.25% (1% floor) | 5.49 | % | 11,154 | 11,041 | 11,293 | ||||||||||||||
| DFT Intermediate LLC (3) | Specialized finance | First Lien | 3/1/2023 | LIBOR+5.5% (1% floor) | 6.74 | % | 10,723 | 10,474 | 10,652 | ||||||||||||||
| Digital River, Inc. | Internet software & services | First Lien | 2/12/2021 | LIBOR+6.5% (1% floor) | 7.82 | % | 4,524 | 4,541 | 4,546 | ||||||||||||||
| Dodge Data & Analytics LLC (3) | Data processing & outsourced services | First Lien | 10/31/2019 | LIBOR+8.75% (1% floor) | 10.13 | % | 9,339 | 9,372 | 8,744 | ||||||||||||||
| DTZ U.S. Borrower, LLC (3) | Real estate services | First Lien | 11/4/2021 | LIBOR+3.25% (1% floor) | 4.57 | % | 6,964 | 6,998 | 6,990 | ||||||||||||||
| Edge Fitness, LLC | Leisure facilities | First Lien | 12/31/2019 | LIBOR+7.75% (1% floor) | 9.05 | % | 10,600 | 10,602 | 10,600 | ||||||||||||||
| EOS Fitness Opco Holdings, LLC (3) | Leisure facilities | First Lien | 12/30/2019 | LIBOR+8.75% (0.75% floor) | 9.99 | % | 18,374 | 18,182 | 18,557 | ||||||||||||||
| Everi Payments Inc.(3) | Casinos & gaming | First Lien | 5/9/2024 | LIBOR+4.5% (1% floor) | 5.74 | % | 4,988 | 4,964 | 5,039 | ||||||||||||||
| Falmouth Group Holdings Corp. | Specialty chemicals | First Lien | 12/13/2021 | LIBOR+6.75% (1% floor) | 8.08 | % | 4,610 | 4,578 | 4,610 | ||||||||||||||
| Garretson Resolution Group, Inc. | Diversified support services | First Lien | 5/22/2021 | LIBOR+6.5% (1% floor) | 7.83 | % | 5,836 | 5,818 | 5,766 | ||||||||||||||
| Portfolio Company | Industry | Investment Type | Maturity Date | Current Interest Rate (1)(4) | Cash Interest Rate | Principal | Cost | Fair Value (2) | |||||||||||||||
| InMotion Entertainment Group, LLC (3) | Consumer electronics | First Lien | 10/1/2018 | LIBOR+7.75% (1.25% floor) | 9.09 | % | 8,875 | 8,884 | 8,875 | ||||||||||||||
| First Lien B | 10/1/2018 | LIBOR+7.75% (1.25% floor) | 9.09 | % | 8,875 | 8,828 | 8,871 | ||||||||||||||||
| Total InMotion Entertainment Group, LLC | 17,750 | 17,712 | 17,746 | ||||||||||||||||||||
| Keypath Education, Inc. (3) | Advertising | First Lien | 4/3/2022 | LIBOR+7% (1.00% floor) | 8.33 | % | 2,040 | 2,040 | 2,039 | ||||||||||||||
| 927 shares Common Stock | 1,391 | 809 | |||||||||||||||||||||
| 2,040 | 3,431 | 2,848 | |||||||||||||||||||||
| Lift Brands, Inc. (3) | Leisure facilities | First Lien | 12/23/2019 | LIBOR+7.5% (1% floor) | 8.83 | % | 18,276 | 18,257 | 18,275 | ||||||||||||||
| Metamorph US 3, LLC (3)(5) | Internet software & services | First Lien | 12/1/2020 | LIBOR+5.5% (1% floor) 2% PIK | 6.74 | % | 9,969 | 9,481 | 3,786 | ||||||||||||||
| Motion Recruitment Partners LLC | Human resources & employment services | First Lien | 2/13/2020 | LIBOR+6% (1% floor) | 7.24 | % | 4,330 | 4,281 | 4,330 | ||||||||||||||
| NAVEX Global, Inc. | Internet software & services | First Lien | 11/19/2021 | LIBOR+4.75% (1% floor) | 5.49 | % | 5,959 | 5,925 | 5,982 | ||||||||||||||
| New IPT, Inc. (3) | Oil & gas equipment & services | First Lien | 3/17/2021 | LIBOR+5% (1% floor) | 6.33 | % | 1,794 | 1,794 | 1,794 | ||||||||||||||
| Second Lien | 9/17/2021 | LIBOR+5.1% (1% floor) | 6.43 | % | 1,094 | 1,094 | 1,094 | ||||||||||||||||
| 21.876 Class A Common Units | — | 321 | |||||||||||||||||||||
| Total New IPT, Inc. | 2,888 | 2,888 | 3,209 | ||||||||||||||||||||
| Novetta Solutions, LLC | Internet software & services | First Lien | 9/30/2022 | LIBOR+5% (1% floor) | 6.34 | % | 6,118 | 6,066 | 5,950 | ||||||||||||||
| OmniSYS Acquisition Corporation (3) | Diversified support services | First Lien | 11/21/2018 | LIBOR+7.5% (1% floor) | 8.83 | % | 10,896 | 10,900 | 10,833 | ||||||||||||||
| Refac Optical Group (3) | Specialty stores | First Lien A | 9/30/2018 | LIBOR+8% | 9.23 | % | 4,623 | 4,605 | 4,623 | ||||||||||||||
| Salient CRGT, Inc. (3) | IT consulting & other services | First Lien | 2/28/2022 | LIBOR+5.75% (1% floor) | 6.99 | % | 2,457 | 2,412 | 2,440 | ||||||||||||||
| Scientific Games International, Inc. (3) | Casinos & gaming | First Lien | 8/14/2024 | LIBOR+3.25% (1% floor) | 4.58 | % | 6,632 | 6,598 | 6,651 | ||||||||||||||
| SHO Holding I Corporation | Footwear | First Lien | 10/27/2022 | LIBOR+5% (1% floor) | 6.24 | % | 8,594 | 8,566 | 8,487 | ||||||||||||||
| TravelClick, Inc. (3) | Internet software & services | Second Lien | 11/6/2021 | LIBOR+7.75% (1% floor) | 8.99 | % | 5,127 | 5,127 | 5,153 | ||||||||||||||
| TV Borrower US, LLC | Integrated telecommunications services | First Lien | 2/22/2024 | LIBOR+4.75% (1% floor) | 6.08 | % | 3,582 | 3,565 | 3,607 | ||||||||||||||
| Valet Merger Sub, Inc. (3) | Environmental & facilities services | First Lien | 9/24/2021 | LIBOR+7% (1% floor) | 8.24 | % | 12,998 | 12,862 | 12,998 | ||||||||||||||
| Vubiquity, Inc. | Application software | First Lien | 8/12/2021 | LIBOR+5.5% (1% floor) | 6.83 | % | 2,653 | 2,636 | 2,633 | ||||||||||||||
| $ | 245,063 | $ | 251,648 | $ | 235,526 | ||||||||||||||||||
| Portfolio Company | Industry | Investment Type | Maturity Date | Current Interest Rate (1)(4) | Cash Interest Rate | Principal | Cost | Fair Value (2) | |||||||||||||||
| AccentCare, Inc. | Healthcare services | First Lien | 9/3/2021 | LIBOR+5.75% (1% floor) | 6.75 | % | $ | 4,906 | $ | 4,837 | $ | 4,830 | |||||||||||
| AdVenture Interactive, Corp. (3) (5) | Advertising | First Lien | 3/22/2018 | LIBOR+7.75% (1% floor) | 8.75 | % | 9,178 | 9,150 | 7,066 | ||||||||||||||
| AF Borrower, LLC | IT consulting & other services | First Lien | 1/28/2022 | LIBOR+5.25% (1% floor) | 6.25 | % | 8,083 | 8,105 | 8,121 | ||||||||||||||
| Ameritox Ltd. (3) | Healthcare services | First Lien | 4/11/2021 | LIBOR+5% (1% floor) 3% PIK | 6.00 | % | 5,890 | 5,884 | 5,848 | ||||||||||||||
| 301,913.06 Class B Preferred Units | 302 | 331 | |||||||||||||||||||||
| 928.96 Class A Common Units | 5,474 | 2,471 | |||||||||||||||||||||
| Total Ameritox, Ltd. | 5,890 | 11,660 | 8,650 | ||||||||||||||||||||
| BeyondTrust Software, Inc. (3) | Application software | First Lien | 9/25/2019 | LIBOR+7% (1% floor) | 8.00 | % | 17,198 | 17,038 | 17,059 | ||||||||||||||
| Compuware Corporation | Internet software & services | First Lien B1 | 12/15/2019 | LIBOR+5.25% (1% floor) | 6.25 | % | 3,194 | 3,164 | 3,206 | ||||||||||||||
| First Lien B2 | 12/15/2021 | LIBOR+5.25% (1% floor) | 6.25 | % | 9,825 | 9,689 | 9,806 | ||||||||||||||||
| Total Compuware Corporation | 13,019 | 12,853 | 13,012 | ||||||||||||||||||||
| CRGT, Inc. | IT consulting & other services | First Lien | 12/21/2020 | LIBOR+6.5% (1% floor) | 7.50 | % | 2,294 | 2,289 | 2,300 | ||||||||||||||
| Digital River, Inc. | Internet software & services | First Lien | 2/12/2021 | LIBOR+6.5% (1% floor) | 7.50 | % | 4,524 | 4,563 | 4,515 | ||||||||||||||
| Dodge Data & Analytics LLC (3) | Data processing & outsourced services | First Lien | 10/31/2019 | LIBOR+8.75% (1% floor) | 9.75 | % | 9,688 | 9,740 | 9,810 | ||||||||||||||
| Edge Fitness, LLC | Leisure facilities | First Lien | 12/31/2019 | LIBOR+8.75% (1% floor) | 9.75 | % | 10,600 | 10,602 | 10,565 | ||||||||||||||
| EOS Fitness Opco Holdings, LLC (3) | Leisure facilities | First Lien | 12/30/2019 | LIBOR+8.75% (0.75% floor) | 9.50 | % | 19,160 | 18,869 | 18,672 | ||||||||||||||
| Falmouth Group Holdings Corp. | Specialty chemicals | First Lien | 12/13/2021 | LIBOR+6.75% (1% floor) | 7.75 | % | 4,963 | 4,920 | 4,968 | ||||||||||||||
| Garretson Resolution Group, Inc. | Diversified support services | First Lien | 5/22/2021 | LIBOR+6.5% (1% floor) | 7.50 | % | 5,991 | 5,966 | 5,946 | ||||||||||||||
| InMotion Entertainment Group, LLC (3) | Consumer electronics | First Lien | 10/1/2018 | LIBOR+7.75% (1.25% floor) | 9.00 | % | 9,375 | 9,394 | 9,252 | ||||||||||||||
| First Lien B | 10/1/2018 | LIBOR+7.75% (1.25% floor) | 9.00 | % | 9,375 | 9,270 | 9,252 | ||||||||||||||||
| Total InMotion Entertainment Group, LLC | 18,750 | 18,664 | 18,504 | ||||||||||||||||||||
| Integrated Petroleum Technologies, Inc. (3) | Oil & gas equipment services | First Lien | 3/31/2019 | LIBOR+7.5% (1% floor) | 8.50 | % | 8,267 | 8,267 | 2,839 | ||||||||||||||
| Legalzoom.com, Inc. (3) | Specialized consumer services | First Lien | 5/13/2020 | LIBOR+7% (1% floor) | 8.00 | % | 19,775 | 19,410 | 19,660 | ||||||||||||||
| Lift Brands, Inc. (3) | Leisure facilities | First Lien | 12/23/2019 | LIBOR+7.5% (1% floor) | 9.00 | % | 19,043 | 19,015 | 18,858 | ||||||||||||||
| Lytx, Inc. (3) | Research & consulting services | First Lien | 3/15/2023 | LIBOR+8.5% (1% floor) | 9.50 | % | 7,981 | 7,981 | 7,981 | ||||||||||||||
| MedTech Group, Inc. | Healthcare equipment | First Lien | 1/1/2019 | LIBOR+5.25% (1% floor) | 6.25 | % | 11,910 | 11,910 | 11,696 | ||||||||||||||
| Metamorph US 3, LLC (3) | Internet software & services | First Lien | 12/1/2020 | LIBOR+6.5% (1% floor) | 7.50 | % | 10,078 | 9,945 | 8,390 | ||||||||||||||
| Motion Recruitment Partners LLC | Human resources & employment services | First Lien | 2/13/2020 | LIBOR+6% (1% floor) | 7.00 | % | 4,563 | 4,487 | 4,550 | ||||||||||||||
| My Alarm Center, LLC | Security & alarm services | First Lien A | 1/9/2019 | LIBOR+8% (1% floor) | 9.00 | % | 3,000 | 2,993 | 3,005 | ||||||||||||||
| First Lien B | 1/9/2019 | LIBOR+8% (1% floor) | 9.00 | % | 4,506 | 4,493 | 4,514 | ||||||||||||||||
| First Lien C | 1/9/2019 | LIBOR+8% (1% floor) | 9.00 | % | 1,136 | 1,128 | 1,133 | ||||||||||||||||
| Total My Alarm Center, LLC | 8,642 | 8,614 | 8,652 | ||||||||||||||||||||
| Portfolio Company | Industry | Investment Type | Maturity Date | Current Interest Rate (1)(4) | Cash Interest Rate | Principal | Cost | Fair Value (2) | |||||||||||||||
| NAVEX Global, Inc. | Internet software & services | First Lien | 11/19/2021 | LIBOR+4.75% (1% floor) | 5.75 | % | 995 | 943 | 990 | ||||||||||||||
| Novetta Solutions, LLC | Internet software & services | First Lien | 9/30/2022 | LIBOR+5% (1% floor) | 6.00 | % | 6,614 | 6,528 | 6,357 | ||||||||||||||
| OmniSYS Acquisition Corporation (3) | Diversified support services | First Lien | 11/21/2018 | LIBOR+7.5% (1% floor) | 8.50 | % | 10,896 | 10,903 | 10,743 | ||||||||||||||
| Refac Optical Group (3) | Specialty stores | First Lien A | 9/30/2018 | LIBOR+7.5% | 8.02 | % | 7,116 | 7,049 | 7,107 | ||||||||||||||
| SHO Holding I Corporation | Footwear | First Lien | 10/27/2022 | LIBOR+5% (1% floor) | 6.00 | % | 4,466 | 4,426 | 4,461 | ||||||||||||||
| TIBCO Software, Inc. | Internet software & services | First Lien | 12/4/2020 | LIBOR+5.5% (1% floor) | 6.50 | % | 4,748 | 4,548 | 4,691 | ||||||||||||||
| Too Faced Cosmetics, LLC | Personal products | First Lien | 7/7/2021 | LIBOR+5% (1% floor) | 6.00 | % | 1,135 | 1,028 | 1,140 | ||||||||||||||
| TravelClick, Inc. (3) | Internet software & services | Second Lien | 11/8/2021 | LIBOR+7.75% (1% floor) | 8.75 | % | 8,460 | 8,460 | 7,576 | ||||||||||||||
| TrialCard Incorporated | Healthcare services | First Lien | 12/31/2019 | LIBOR+4.5% (1% floor) | 5.50 | % | 13,319 | 13,222 | 13,255 | ||||||||||||||
| TV Borrower US, LLC | Integrated telecommunications services | First Lien | 1/8/2021 | LIBOR+5% (1% floor) | 6.00 | % | 9,800 | 9,633 | 9,763 | ||||||||||||||
| Valet Merger Sub, Inc. (3) | Environmental & facilities services | First Lien | 9/24/2021 | LIBOR+7% (1% floor) | 8.00 | % | 14,887 | 14,692 | 15,138 | ||||||||||||||
| Vitera Healthcare Solutions, LLC | Healthcare technology | First Lien | 11/4/2020 | LIBOR+5% (1% floor) | 6.00 | % | 4,863 | 4,863 | 4,747 | ||||||||||||||
| Vubiquity, Inc. | Application software | First Lien | 8/12/2021 | LIBOR+5.5% (1% floor) | 6.50 | % | 2,680 | 2,658 | 2,666 | ||||||||||||||
| Worley Claims Services, LLC (3) | Internet software & services | First Lien | 10/31/2020 | LIBOR+8% (1% floor) | 9.00 | % | 9,924 | 9,882 | 9,875 | ||||||||||||||
| $ | 324,406 | $ | 327,720 | $ | 315,153 | ||||||||||||||||||
| September 30, 2017 | September 30, 2016 | |||||||
| Selected Balance Sheet Information: | ||||||||
| Investments in loans at fair value (cost September 30, 2017: $251,648; cost September 30, 2016: $327,720) | $ | 235,526 | $ | 315,153 | ||||
| Receivables from secured financing arrangements at fair value (cost September 30, 2017: $9,783; cost September 30, 2016: $10,014) | 8,305 | 9,672 | ||||||
| Cash and cash equivalents | 24,389 | 1,878 | ||||||
| Restricted cash | 5,097 | 7,080 | ||||||
| Other assets | 3,485 | 4,700 | ||||||
| Total assets | $ | 276,802 | $ | 338,483 | ||||
| Senior credit facilities payable | $ | 113,053 | $ | 167,012 | ||||
| Debt securities payable at fair value (proceeds September 30, 2017: $147,052; proceeds September 30, 2016: $165,533) | 147,052 | 147,433 | ||||||
| Other liabilities | 10,383 | 8,371 | ||||||
| Total liabilities | $ | 270,488 | $ | 322,816 | ||||
| Members' equity | 6,314 | 15,667 | ||||||
| Total liabilities and members' equity | $ | 276,802 | $ | 338,483 | ||||
| Year ended September 30, 2017 | Year ended September 30, 2016 | |||||||
| Selected Statements of Operations Information: | ||||||||
| Interest income | $ | 23,222 | $ | 30,156 | ||||
| Other income | 869 | 840 | ||||||
| Total investment income | 24,091 | 30,996 | ||||||
| Interest expense | 22,195 | 23,262 | ||||||
| Other expenses | 700 | 501 | ||||||
| Total expenses (1) | 22,895 | 23,763 | ||||||
| Net unrealized appreciation (depreciation) | (22,789 | ) | 7,438 | |||||
| Net realized gain (loss) | 13,350 | (7,771 | ) | |||||
| Net income (loss) | $ | (8,243 | ) | $ | 6,900 | |||
| September 30, 2022 | September 30, 2021 | |||||||
| Senior secured loans (1) | $383,194 | $344,196 | ||||||
| Weighted average interest rate on senior secured loans (2) | 8.33% | 5.60% | ||||||
| Number of borrowers in SLF JV I | 60 | 55 | ||||||
| Largest exposure to a single borrower (1) | $10,093 | $9,875 | ||||||
| Total of five largest loan exposures to borrowers (1) | $48,139 | $46,984 | ||||||
| September 30, 2022 | September 30, 2021 | ||||||||||
| Senior secured loans (1) | $143,225 | $126,512 | |||||||||
| Weighted average current interest rate on senior secured loans (2) | 8.52% | 5.86% | |||||||||
| Number of borrowers in the Glick JV | 43 | 37 | |||||||||
| Largest loan exposure to a single borrower (1) | $6,562 | $6,907 | |||||||||
| Total of five largest loan exposures to borrowers (1) | $28,973 | $28,324 | |||||||||
| Debt Outstanding as of September 30, 2021 | Debt Outstanding as of September 30, 2022 | Weighted average debt outstanding for the year ended September 30, 2022 | Maximum debt outstanding for the year ended September 30, 2022 | |||||||||||||||||||||||
| Syndicated Facility | $ | 495,000 | $ | 540,000 | $ | 550,165 | $ | 620,000 | ||||||||||||||||||
| Citibank Facility | 135,000 | 160,000 | 160,986 | 185,000 | ||||||||||||||||||||||
| 2025 Notes | 300,000 | 300,000 | 300,000 | 300,000 | ||||||||||||||||||||||
| 2027 Notes | 350,000 | 350,000 | 350,000 | 350,000 | ||||||||||||||||||||||
| Total debt | $ | 1,280,000 | $ | 1,350,000 | $ | 1,361,151 | ||||||||||||||||||||
| Payments due by period as of September 30, 2022 | ||||||||||||||||||||||||||
| Contractual Obligations | Total | Less than 1 year | 1-3 years | 3-5 years | ||||||||||||||||||||||
| Syndicated Facility | $ | 540,000 | $ | — | $ | — | $ | 540,000 | ||||||||||||||||||
| Interest due on Syndicated Facility | 90,986 | 25,313 | 50,626 | 15,047 | ||||||||||||||||||||||
| Citibank Facility | 160,000 | — | 160,000 | — | ||||||||||||||||||||||
| Interest due on Citibank Facility | 19,225 | 8,996 | 10,229 | — | ||||||||||||||||||||||
| 2025 Notes | 300,000 | — | 300,000 | — | ||||||||||||||||||||||
| Interest due on 2025 Notes | 25,286 | 10,500 | 14,786 | — | ||||||||||||||||||||||
| 2027 Notes | 350,000 | — | — | 350,000 | ||||||||||||||||||||||
| Interest due on 2027 Notes (a) | 62,699 | 14,595 | 29,190 | 18,914 | ||||||||||||||||||||||
| Total | $ | 1,548,196 | $ | 59,404 | $ | 564,831 | $ | 923,961 | ||||||||||||||||||
| Number of Shares Issued | Gross Proceeds | Placement Agent Fees | Net Proceeds (1) | Average Sales Price per Share (2) | ||||||||||||||||||||||||||||
| "At the market" offering | 2,801,206 | $ | 21,049 | $ | 210 | $ | 20,839 | $ | 7.51 | |||||||||||||||||||||||
| Date Declared | Record Date | Payment Date | Amount per Share | Cash Distribution | DRIP Shares Issued (1) | DRIP Shares Value | |||||||||
| August 4, 2015 | October 15, 2015 | October 30, 2015 | $ | 0.06 | $ 8.4 million | 106,185 | $ 0.6 million | ||||||||
| August 4, 2015 | November 16, 2015 | November 30, 2015 | 0.06 | 8.4 million | 91,335 | 0.6 million | |||||||||
| November 30, 2015 | December 15, 2015 | December 30, 2015 | 0.06 | 8.4 million | 99,673 | 0.6 million | |||||||||
| November 30, 2015 | January 15, 2016 | January 28, 2016 | 0.06 | 8.4 million | 113,905 | 0.7 million | |||||||||
| November 30, 2015 | February 12, 2016 | February 26, 2016 | 0.06 | 8.4 million | 123,342 | 0.6 million | |||||||||
| February 8, 2016 | March 15, 2016 | March 31, 2016 | 0.06 | 8.6 million | 86,806 | 0.4 million | |||||||||
| February 8, 2016 | April 15, 2016 | April 29, 2016 | 0.06 | 8.2 million | 112,569 | 0.6 million | |||||||||
| February 8, 2016 | May 13, 2016 | May 31, 2016 | 0.06 | 8.4 million | 76,432 | 0.4 million | |||||||||
| May 5, 2016 | June 15, 2016 | June 30, 2016 | 0.06 | 8.2 million | 108,629 | 0.5 million | |||||||||
| May 5, 2016 | July 15, 2016 | July 29, 2016 | 0.06 | 8.2 million | 100,268 | 0.6 million | |||||||||
| May 5, 2016 | August 15, 2016 | August 31, 2016 | 0.06 | 8.3 million | 59,026 | 0.4 million | |||||||||
| August 3, 2016 | September 15, 2016 | September 30, 2016 | 0.06 | 8.3 million | 65,170 | 0.4 million | |||||||||
| August 3, 2016 | October 14, 2016 | October 31, 2016 | 0.06 | 8.2 million | 81,391 | 0.4 million | |||||||||
| August 3, 2016 | November 15, 2016 | November 30, 2016 | 0.06 | 8.2 million | 80,962 | 0.4 million | |||||||||
| October 18, 2016 | December 15, 2016 | December 30, 2016 | 0.06 | 7.7 million | 70,316 | 0.4 million | |||||||||
| October 18, 2016 | January 13, 2017 | January 31, 2017 | 0.06 | 8.0 million | 73,940 | 0.4 million | |||||||||
| October 18, 2016 | February 15, 2017 | February 28, 2017 | 0.06 | 8.0 million | 86,120 | 0.4 million | |||||||||
| February 6, 2017 | March 15, 2017 | March 31, 2017 | 0.02 | 2.7 million | 27,891 | 0.1 million | |||||||||
| February 6, 2017 | June 15, 2017 | June 30, 2017 | 0.02 | 2.7 million | 20,502 | 0.1 million | |||||||||
| February 6, 2017 | September 15, 2017 | September 29, 2017 | 0.125 | 17.0 million | 118,992 | 0.7 million | |||||||||
| August 7, 2017 | December 15, 2017 | December 29, 2017 | 0.125 | ||||||||||||
| Date Declared | Record Date | Payment Date | Amount per Share | Cash Distribution | DRIP Shares Issued (1) | DRIP Shares Value | ||||||||||||||||||||||||||||||||||||||
| November 13, 2020 | December 15, 2020 | December 31, 2020 | $ | 0.11 | $ 15.0 million | 93,964 | $ 0.5 million | |||||||||||||||||||||||||||||||||||||
| January 29, 2021 | March 15, 2021 | March 31, 2021 | 0.12 | 16.4 million | 81,702 | 0.5 million | ||||||||||||||||||||||||||||||||||||||
| April 30, 2021 | June 15, 2021 | June 30, 2021 | 0.13 | 22.9 million | 76,979 | 0.5 million | ||||||||||||||||||||||||||||||||||||||
| July 30, 2021 | September 15, 2021 | September 30, 2021 | 0.145 | 25.5 million | 85,075 | 0.6 million | ||||||||||||||||||||||||||||||||||||||
| October 13, 2021 | December 15, 2021 | December 31, 2021 | 0.155 | 27.2 million | 107,971 | 0.8 million | ||||||||||||||||||||||||||||||||||||||
| January 28, 2022 | March 15, 2022 | March 31, 2022 | 0.16 | 28.5 million | 104,411 | 0.8 million | ||||||||||||||||||||||||||||||||||||||
| April 29, 2022 | June 15, 2022 | June 30, 2022 | 0.165 | 29.4 million | 131,028 | 0.9 million | ||||||||||||||||||||||||||||||||||||||
| July 29, 2022 | September 15, 2022 | September 30, 2022 | 0.17 | 30.2 million | 153,544 | 1.0 million | ||||||||||||||||||||||||||||||||||||||
(1)Shares were purchased on |
| Financial Covenant | Description | Target Value | June 30, | |||||||||||||||||
| Minimum shareholders' equity | Net assets shall not be less than the | $ | $ | |||||||||||||||||
| Asset coverage ratio | Asset coverage ratio shall not be less than | |||||||||||||||||||
| Interest coverage ratio | Interest coverage ratio shall not be less than 2.25:1 | 2.25:1 | ||||||||||||||||||
| Minimum net worth | Net worth shall not be less than | $ | $ | |||||||||||||||||
| As of September 30, 2022 | As of September 30, 2021 | |||||||||||||||||||||||||
| ($ in millions) | 2025 Notes | 2027 Notes | 2025 Notes | 2027 Notes | ||||||||||||||||||||||
| Principal | $ | 300.0 | $ | 350.0 | $ | 300.0 | $ | 350.0 | ||||||||||||||||||
| Unamortized financing costs | (1.8) | (3.2) | (2.6) | (4.0) | ||||||||||||||||||||||
| Unaccreted discount | (1.2) | (0.7) | (1.7) | (0.9) | ||||||||||||||||||||||
| Interest rate swap fair value adjustment | — | (42.0) | — | (2.1) | ||||||||||||||||||||||
| Net carrying value | $ | 297.0 | $ | 304.1 | $ | 295.7 | $ | 343.0 | ||||||||||||||||||
| Fair Value | $ | 283.1 | $ | 294.0 | $ | 314.5 | $ | 351.1 | ||||||||||||||||||
| ($ in millions) | 2025 Notes | 2027 Notes | ||||||||||||
| Coupon interest | $ | 10.5 | $ | 9.5 | ||||||||||
| Amortization of financing costs and discount | 1.3 | 0.9 | ||||||||||||
| Effect of interest rate swap | — | (0.4) | ||||||||||||
| Total interest expense | $ | 11.8 | $ | 10.0 | ||||||||||
| Coupon interest rate (net of effect of interest rate swap for 2027 Notes) | 3.500 | % | 2.585 | % | ||||||||||
| ($ in millions) | 2025 Notes | 2027 Notes | ||||||||||||
| Coupon interest | $ | 10.5 | $ | 3.5 | ||||||||||
| Amortization of financing costs and discount | 1.3 | 0.3 | ||||||||||||
| Effect of interest rate swap | — | (1.1) | ||||||||||||
| Total interest expense | $ | 11.8 | $ | 2.7 | ||||||||||
| Coupon interest rate (net of effect of interest rate swap for 2027 Notes) | 3.500 | % | 1.813 | % | ||||||||||
| ($ in millions) | 2025 Notes | |||||||
| Coupon interest | $ | 6.3 | ||||||
| Amortization of financing costs and discount | 0.7 | |||||||
| Total interest expense | $ | 7.0 | ||||||
| Coupon interest rate | 3.500 | % | ||||||
| September 30, 2017 | September 30, 2016 | |||||||
| Lift Brands Holdings, Inc. | $ | 15,000 | $ | 13,000 | ||||
| P2 Upstream Acquisition Co. | 10,000 | 10,000 | ||||||
| Valet Merger Sub, Inc. | 9,326 | 5,596 | ||||||
| Edge Fitness, LLC | 8,353 | 8,353 | ||||||
| InMotion Entertainment Group, LLC | 7,544 | 6,856 | ||||||
| BeyondTrust Software, Inc. | 5,995 | 5,995 | ||||||
| EOS Fitness Opco Holdings, LLC | 5,000 | 5,000 | ||||||
| Dominion Diagnostics, LLC (1)(2) | 4,180 | — | ||||||
| Impact Sales, LLC | 3,234 | — | ||||||
| Systems, Inc. | 3,030 | — | ||||||
| Thing5, LLC | 3,000 | 5,000 | ||||||
| WeddingWire, Inc. | 3,000 | 3,000 | ||||||
| Keypath Education, Inc. | 3,000 | — | ||||||
| Traffic Solutions Holdings, Inc. | 2,998 | 2,682 | ||||||
| Motion Recruitment Partners LLC | 2,900 | 2,900 | ||||||
| Pingora MSR Opportunity Fund I, LP (limited partnership interest) | 2,760 | 2,054 | ||||||
| Edmentum, Inc.(1) | 2,664 | 2,664 | ||||||
| OmniSYS Acquisition Corporation | 2,500 | 2,500 | ||||||
| Ping Identity Corporation | 2,500 | 2,500 | ||||||
| 4 Over International, LLC | 2,232 | 2,232 | ||||||
| New IPT, Inc. | 2,229 | — | ||||||
| Refac Optical Group | 2,080 | 6,400 | ||||||
| SPC Partners VI, L.P. (limited partnership interest) | 2,000 | — | ||||||
| Ministry Brands, LLC | 1,708 | 15,000 | ||||||
| Sailpoint Technologies, Inc. | 1,500 | — | ||||||
| Metamorph US 3, LLC (1) | 1,470 | 3,675 | ||||||
| Senior Loan Fund JV 1, LLC | 1,328 | 14,065 | ||||||
| TransTrade Operators, Inc. (1)(3) | 1,052 | 424 | ||||||
| Webster Capital III, L.P. (limited partnership) | 736 | 1,013 | ||||||
| Riverside Fund V, LP (limited partnership interest) | 539 | 853 | ||||||
| Garretson Firm Resolution Group, Inc. | 508 | 1,066 | ||||||
| Sterling Capital Partners IV, L.P. (limited partnership interest) | 490 | 485 | ||||||
| Beecken Petty O'Keefe Fund IV, L.P. (limited partnership interest) | 472 | 813 | ||||||
| Tailwind Capital Partners II, L.P. (limited partnership interest) | 391 | 1,005 | ||||||
| Moelis Capital Partners Opportunity Fund I-B, L.P. (limited partnership interest) | 365 | 476 | ||||||
| RCP Direct II, LP (limited partnership interest) | 364 | 654 | ||||||
| Cenegenics, LLC (1)(3) | 297 | 1,001 | ||||||
| Riverside Fund IV, LP (limited partnership interest) | 254 | 544 | ||||||
| ACON Equity Partners III, LP (limited partnership interest) | 239 | 204 | ||||||
| RCP Direct, LP (limited partnership interest) | 184 | 236 | ||||||
| Bunker Hill Capital II (QP), LP (limited partnership interest) | 183 | 190 | ||||||
| Milestone Partners IV, LP (limited partnership interest) | 180 | 261 | ||||||
| SPC Partners V, L.P. (limited partnership interest) | 159 | 602 | ||||||
| Riverlake Equity Partners II, LP (limited partnership interest) | 129 | 177 | ||||||
| L Squared Capital Partners (limited partnership interest) | — | 308 | ||||||
| Legalzoom.com, Inc. | — | 15,427 | ||||||
| TigerText, Inc. | — | 10,000 | ||||||
| RP Crown Parent, LLC | — | 9,414 | ||||||
| TIBCO Software, Inc. | — | 5,800 | ||||||
| Integrated Petroleum Technologies, Inc. | — | 5,397 | ||||||
| Trialcard Incorporated | — | 4,900 | ||||||
| Adventure Interactive, Corp. (2) | — | 4,846 | ||||||
| Baart Programs, Inc. | — | 4,762 | ||||||
| Discovery Practice Management, Inc. | — | 3,958 | ||||||
| OBHG Management Services, LLC | — | 3,836 | ||||||
| First American Payment Systems, LP | — | 3,000 | ||||||
| My Alarm Center, LLC | — | 2,940 | ||||||
| Eagle Hospital Physicians, Inc. | — | 2,753 | ||||||
| HealthDrive Corporation | — | 2,534 | ||||||
| Teaching Strategies, LLC | — | 2,400 | ||||||
| ExamSoft Worldwide, Inc. | — | 2,000 | ||||||
| Accruent, LLC | — | 1,900 | ||||||
| Total | $ | 118,073 | $ | 215,651 | ||||
| Debt Outstanding as of September 30, 2016 | Debt Outstanding as of September 30, 2017 | Weighted average debt outstanding for the year ended September 30, 2017 | Maximum debt outstanding for the year ended September 30, 2017 | |||||||||||||
| SBA debentures | $ | 213,300 | $ | — | $ | 159,201 | $ | 213,300 | ||||||||
| ING facility | 472,495 | 226,495 | 356,961 | 530,495 | ||||||||||||
| Sumitomo facility | 43,800 | 29,500 | 40,379 | 44,000 | ||||||||||||
| 2019 Notes | 250,000 | 250,000 | 250,000 | 250,000 | ||||||||||||
| 2024 Notes | 75,000 | 75,000 | 75,000 | 75,000 | ||||||||||||
| 2028 Notes | 86,250 | 86,250 | 86,250 | 86,250 | ||||||||||||
| Secured borrowings | 18,929 | 13,489 | 14,581 | 18,929 | ||||||||||||
| Total debt | $ | 1,159,774 | $ | 680,734 | $ | 982,372 | ||||||||||
| Payments due by period as of September 30, 2017 | ||||||||||||||||||||
| Contractual Obligations | Total | Less than 1 year | 1-3 years | 3-5 years | More than 5 years | |||||||||||||||
| ING facility | $ | 226,495 | $ | 226,495 | $ | — | $ | — | $ | — | ||||||||||
| Interest due on ING facility | 6,733 | 6,733 | — | — | — | |||||||||||||||
| Sumitomo facility | 29,500 | 29,500 | — | — | — | |||||||||||||||
| Interest due on Sumitomo facility | 886 | 886 | — | — | — | |||||||||||||||
| Secured borrowings | 13,489 | — | 13,489 | — | — | |||||||||||||||
| Interest due on secured borrowings | 1,857 | 612 | 1,245 | — | — | |||||||||||||||
| 2019 Notes | 250,000 | — | 250,000 | — | — | |||||||||||||||
| Interest due on 2019 Notes | 17,263 | 12,188 | 5,075 | — | — | |||||||||||||||
| 2024 Notes | 75,000 | — | — | — | 75,000 | |||||||||||||||
| Interest due on 2024 Notes | 31,230 | 4,406 | 8,813 | 8,813 | 9,198 | |||||||||||||||
| 2028 Notes | 86,250 | — | — | — | 86,250 | |||||||||||||||
| Interest due on 2028 Notes | 55,940 | 5,283 | 10,566 | 10,566 | 29,525 | |||||||||||||||
| Total | $ | 794,643 | $ | 286,103 | $ | 289,188 | $ | 19,379 | $ | 199,973 | ||||||||||
| Year Ended | Qualified Net Interest Income | Qualified Short-Term Capital Gains | |||||||||
| September 30, | % | — | |||||||||
| September 30, 2022 | September 30, 2021 | |||||||||||||||||||||||||||||||||||||
| ($ in thousands) | Fair Value | % of Floating Rate Portfolio | Fair Value | % of Floating Rate Portfolio | ||||||||||||||||||||||||||||||||||
| 0% | $ | 228,186 | 11.1 | % | $ | 322,222 | 14.6 | % | ||||||||||||||||||||||||||||||
| >0% and <1% | 388,458 | 19.0 | % | 283,065 | 12.8 | % | ||||||||||||||||||||||||||||||||
| 1% | 1,364,668 | 66.6 | % | 1,507,977 | 68.4 | % | ||||||||||||||||||||||||||||||||
| >1% | 68,332 | 3.3 | % | 92,384 | 4.2 | % | ||||||||||||||||||||||||||||||||
| Total Floating Rate Investments | $ | 2,049,644 | 100.0 | % | $ | 2,205,648 | 100.0 | % | ||||||||||||||||||||||||||||||
| September 30, 2017 | September 30, 2016 | |||||||||||||
| ($ in thousands) | Fair Value | % of Floating Rate Portfolio | Fair Value | % of Floating Rate Portfolio | ||||||||||
| Under 1% | $ | 201,365 | 16.91 | % | $ | 271,484 | 16.98 | % | ||||||
| 1% to under 2% | 989,575 | 83.09 | 1,324,121 | 82.83 | ||||||||||
| 2% to under 3% | — | — | — | — | ||||||||||
| 3% and over | — | — | 3,000 | 0.19 | ||||||||||
| Total | $ | 1,190,940 | 100.00 | % | $ | 1,598,605 | 100.00 | % | ||||||
| ($ in thousands) Basis point increase | Increase in Interest Income | (Increase) in Interest Expense | Net increase in net assets resulting from operations | |||||||||||||||||
| 250 | $ | 53,484 | $ | (26,250) | $ | 27,234 | ||||||||||||||
| 200 | 42,767 | (21,000) | 21,767 | |||||||||||||||||
| 150 | 32,051 | (15,750) | 16,301 | |||||||||||||||||
| 100 | 21,334 | (10,500) | 10,834 | |||||||||||||||||
| 50 | 10,622 | (5,250) | 5,372 | |||||||||||||||||
| ($ in thousands) | ||||||||||||
| Basis point increase(1) | Interest income | Interest expense | Net increase (decrease) | |||||||||
| 500 | $ | 61,700 | $ | (13,100 | ) | $ | 48,600 | |||||
| 400 | 50,300 | (10,400 | ) | 39,900 | ||||||||
| 300 | 39,000 | (7,700 | ) | 31,300 | ||||||||
| 200 | 27,600 | (5,000 | ) | 22,600 | ||||||||
| 100 | 16,200 | (2,300 | ) | 13,900 | ||||||||
| ($ in thousands) Basis point decrease | (Decrease) in Interest Income | Decrease in Interest Expense | Net (decrease) in net assets resulting from operations | |||||||||||||||||
| 50 | $ | (10,611) | $ | 5,250 | $ | (5,361) | ||||||||||||||
| 100 | (21,062) | 10,500 | (10,562) | |||||||||||||||||
| 150 | (31,456) | 15,750 | (15,706) | |||||||||||||||||
| 200 | (41,787) | 21,000 | (20,787) | |||||||||||||||||
| 250 | (49,943) | 26,250 | (23,693) | |||||||||||||||||
| September 30, 2022 | September 30, 2021 | |||||||||||||||||||||||||
| ($ in thousands) | Interest Bearing Cash and Investments | Borrowings | Interest Bearing Cash and Investments | Borrowings | ||||||||||||||||||||||
| Money market rate | $ | 5,262 | $ | — | $ | 23,600 | $ | — | ||||||||||||||||||
| Prime rate | 2,618 | — | 305 | 10,000 | ||||||||||||||||||||||
| LIBOR | ||||||||||||||||||||||||||
| 30 day | 669,273 | 540,000 | 674,613 | 485,000 | ||||||||||||||||||||||
| 90 day (a) | 928,978 | 510,000 | 1,037,019 | 485,000 | ||||||||||||||||||||||
| 180 day | 199,301 | — | 323,869 | — | ||||||||||||||||||||||
| 360 day | — | — | 96,095 | — | ||||||||||||||||||||||
| EURIBOR | ||||||||||||||||||||||||||
| 30 day | € | 24,838 | — | € | 24,838 | — | ||||||||||||||||||||
| 90 day | 16,911 | — | 13,980 | — | ||||||||||||||||||||||
| 180 day | 1,964 | — | 18,203 | — | ||||||||||||||||||||||
| SOFR | ||||||||||||||||||||||||||
| 30 day | $ | 50,099 | — | — | — | |||||||||||||||||||||
| 90 day | 190,799 | — | — | — | ||||||||||||||||||||||
| 180 day | 18,390 | — | — | — | ||||||||||||||||||||||
| SONIA | £ | 40,137 | — | — | — | |||||||||||||||||||||
| UK LIBOR | ||||||||||||||||||||||||||
| 30 day | — | — | £ | 21,501 | — | |||||||||||||||||||||
| 180 day | — | — | 18,638 | — | ||||||||||||||||||||||
| Fixed rate | $ | 341,749 | 300,000 | $ | 200,599 | 300,000 | ||||||||||||||||||||
| September 30, 2017 | September 30, 2016 | |||||||||||||||
| ($ in thousands) | Interest Bearing Cash and Investments | Borrowings | Interest Bearing Cash and Investments | Borrowings | ||||||||||||
| Money market rate | $ | 59,913 | $ | — | $ | 130,362 | $ | — | ||||||||
| Prime rate | 1,061 | — | 12,344 | — | ||||||||||||
| LIBOR | ||||||||||||||||
| 30 day | 42,165 | 255,993 | 42,087 | 516,295 | ||||||||||||
| 90 day | 1,254,246 | 13,491 | 1,665,339 | 18,929 | ||||||||||||
| Fixed rate | 290,427 | 411,250 | 408,136 | 624,550 | ||||||||||||
| Total | $ | 1,647,812 | $ | 680,734 | $ | 2,258,268 | $ | 1,159,774 | ||||||||
| Description of the Matter | As described in Note 3 to the consolidated financial statements, the Company classified $2,169,475 thousand of its investments as Level 3 within the fair value hierarchy (Level 3 investments) as of September 30, 2022. As described in Note 2 and Note 3 to the consolidated financial statements, the Company’s valuation designee, under the oversight of the Board of Directors, determined the fair value of the Company’s Level 3 investments by using valuation techniques such as broker quotations, precedent transactions, enterprise value analyses or market yield techniques. These techniques require management to make judgments about the significant unobservable inputs including, among others, comparable EBITDA, revenue or asset multiples, market yields and broker quoted prices. Auditing the fair value of the Company’s Level 3 investments involved a high degree of auditor judgment and extensive audit effort, as changes in the valuation techniques or significant unobservable inputs could have resulted in significant changes in fair value measurements. | ||||
| How We Addressed the Matter in Our Audit | We obtained an understanding, evaluated the design and tested the operating effectiveness of controls related to the Company’s investment valuation process, including controls related to the Company’s assessment of valuation techniques and significant unobservable inputs used in determining the fair value measurements of the Level 3 investments. Our audit procedures included, among others, evaluating the Company’s valuation techniques and significant unobservable inputs used. Our audit procedures also included, for a sample of Level 3 investments, validating the mathematical accuracy of the fair value calculations and validating the accuracy of other relevant inputs used in estimating fair value measurement, such as investment terms and portfolio company financial information. For example, we compared publicly available information in the Company’s valuation models (e.g., market yields, EBITDA, revenue, and asset multiples of comparable public companies and comparable public transactions) to information available from third-party market research providers. We also compared the significant company-specific inputs in the Company’s valuation models to source documents, such as portfolio company financial statements and covenant certificates provided by the Company. To evaluate the reasonableness of significant unobservable inputs, we assessed whether these inputs were developed in a manner consistent with the Company’s valuation policies and in some instances, we involved our valuation specialists to independently develop ranges using portfolio company and available market information to estimate the fair value of selected investments and we compared these ranges to the Company’s fair value measurements. We also evaluated subsequent events and transactions and considered whether they corroborated or contradicted the Company’s fair value measurements. | ||||
| September 30, 2022 | September 30, 2021 | |||||||||||||
| ASSETS | ||||||||||||||
| Investments at fair value: | ||||||||||||||
| Control investments (cost September 30, 2022: $260,305; cost September 30, 2021: $283,599) | $ | 214,165 | $ | 270,765 | ||||||||||
| Affiliate investments (cost September 30, 2022: $27,353; cost September 30, 2021: $18,763) | 26,196 | 18,289 | ||||||||||||
| Non-control/Non-affiliate investments (cost September 30, 2022: $2,330,096; cost September 30, 2021: $2,236,759) | 2,253,750 | 2,267,575 | ||||||||||||
| Total investments at fair value (cost September 30, 2022: $2,617,754; cost September 30, 2021: $2,539,121) | 2,494,111 | 2,556,629 | ||||||||||||
| Cash and cash equivalents | 23,528 | 29,334 | ||||||||||||
| Restricted cash | 2,836 | 2,301 | ||||||||||||
| Interest, dividends and fees receivable | 35,598 | 22,125 | ||||||||||||
| Due from portfolio companies | 22,495 | 1,990 | ||||||||||||
| Receivables from unsettled transactions | 4,692 | 8,150 | ||||||||||||
| Due from broker | 45,530 | 1,640 | ||||||||||||
| Deferred financing costs | 7,350 | 9,274 | ||||||||||||
| Deferred offering costs | 32 | 34 | ||||||||||||
| Deferred tax asset, net | 1,687 | 714 | ||||||||||||
| Derivative assets at fair value | 6,789 | 1,912 | ||||||||||||
| Other assets | 1,665 | 2,284 | ||||||||||||
| Total assets | $ | 2,646,313 | $ | 2,636,387 | ||||||||||
| LIABILITIES AND NET ASSETS | ||||||||||||||
| Liabilities: | ||||||||||||||
| Accounts payable, accrued expenses and other liabilities | $ | 3,701 | $ | 3,024 | ||||||||||
| Base management fee and incentive fee payable | 15,940 | 32,649 | ||||||||||||
| Due to affiliate | 3,180 | 4,357 | ||||||||||||
| Interest payable | 7,936 | 4,597 | ||||||||||||
| Payables from unsettled transactions | 26,981 | 8,086 | ||||||||||||
| Derivative liability at fair value | 41,969 | 2,108 | ||||||||||||
| Credit facilities payable | 700,000 | 630,000 | ||||||||||||
| Unsecured notes payable (net of $5,020 and $6,501 of unamortized financing costs as of September 30, 2022 and September 30, 2021, respectively) | 601,043 | 638,743 | ||||||||||||
| Total liabilities | 1,400,750 | 1,323,564 | ||||||||||||
| Commitments and contingencies (Note 13) | ||||||||||||||
| Net assets: | ||||||||||||||
| Common stock, $0.01 par value per share, 250,000 shares authorized; 183,374 and 180,361 shares issued and outstanding as of September 30, 2022 and September 30, 2021, respectively | 1,834 | 1,804 | ||||||||||||
| Additional paid-in-capital | 1,826,498 | 1,804,354 | ||||||||||||
| Accumulated overdistributed earnings | (582,769) | (493,335) | ||||||||||||
| Total net assets (equivalent to $6.79 and $7.28 per common share as of September 30, 2022 and September 30, 2021, respectively) (Note 11) | 1,245,563 | 1,312,823 | ||||||||||||
| Total liabilities and net assets | $ | 2,646,313 | $ | 2,636,387 | ||||||||||
| September 30, 2017 | September 30, 2016 | |||||||
| ASSETS | ||||||||
| Investments at fair value: | ||||||||
| Control investments (cost September 30, 2017: $444,826; cost September 30, 2016: $456,493) | $ | 305,271 | $ | 388,267 | ||||
| Affiliate investments (cost September 30, 2017: $33,743; cost September 30, 2016: $34,955) | 36,983 | 39,769 | ||||||
| Non-control/Non-affiliate investments (cost September 30, 2017: $1,279,096; cost September 30, 2016: $1,792,410) | 1,199,501 | 1,737,455 | ||||||
| Total investments at fair value (cost September 30, 2017: $1,757,665; cost September 30, 2016: $2,283,858) | 1,541,755 | 2,165,491 | ||||||
| Cash and cash equivalents | 53,018 | 117,923 | ||||||
| Restricted cash | 6,895 | 12,439 | ||||||
| Interest, dividends and fees receivable | 6,892 | 15,568 | ||||||
| Due from portfolio companies | 5,670 | 4,077 | ||||||
| Receivables from unsettled transactions | — | 5,346 | ||||||
| Deferred financing costs | 1,304 | 2,234 | ||||||
| Insurance recoveries receivable | — | 19,729 | ||||||
| Other assets | 514 | 478 | ||||||
| Total assets | $ | 1,616,048 | $ | 2,343,285 | ||||
| LIABILITIES AND NET ASSETS | ||||||||
| Liabilities: | ||||||||
| Accounts payable, accrued expenses and other liabilities | $ | 2,417 | $ | 2,533 | ||||
| Base management fee and Part I incentive fee payable | 6,750 | 15,958 | ||||||
| Due to FSC CT | 1,815 | 2,204 | ||||||
| Interest payable | 3,167 | 3,912 | ||||||
| Amounts payable to syndication partners | 1 | 754 | ||||||
| Director fees payable | 184 | 566 | ||||||
| Payables from unsettled transactions | 58,691 | 6,234 | ||||||
| Legal settlements payable | — | 19,500 | ||||||
| Credit facilities payable | 255,995 | 516,295 | ||||||
| SBA debentures payable (net of $3,289 of unamortized financing costs as of September 30, 2016) | — | 210,011 | ||||||
| Unsecured notes payable (net of $4,737 and $5,956 of unamortized financing costs as of September 30, 2017 and September 30, 2016, respectively) | 406,115 | 404,630 | ||||||
| Secured borrowings at fair value (proceeds September 30, 2017: $13,489; proceeds September 30, 2016: $18,929) | 13,256 | 18,400 | ||||||
| Total liabilities | 748,391 | 1,200,997 | ||||||
| Commitments and contingencies (Note 16) | ||||||||
| Net assets: | ||||||||
| Common stock, $0.01 par value, 250,000 shares authorized; 140,961 shares issued and outstanding at September 30, 2017; 143,259 shares issued and outstanding at September 30, 2016 | 1,409 | 1,433 | ||||||
| Additional paid-in-capital | 1,579,278 | 1,591,467 | ||||||
| Net unrealized depreciation on investments and secured borrowings | (215,677 | ) | (117,838 | ) | ||||
| Net realized loss on investments and secured borrowings | (478,010 | ) | (306,228 | ) | ||||
| Accumulated overdistributed net investment income | (19,343 | ) | (26,546 | ) | ||||
| Total net assets (equivalent to $6.16 and $7.97 per common share at September 30, 2017 and September 30, 2016, respectively) (Note 12) | 867,657 | 1,142,288 | ||||||
| Total liabilities and net assets | $ | 1,616,048 | $ | 2,343,285 | ||||
| Year ended September 30, 2017 | Year ended September 30, 2016 | Year ended September 30, 2015 | Year ended September 30, 2022 | Year ended September 30, 2021 | Year ended September 30, 2020 | |||||||||||||||||||||||||||
| Interest income: | Interest income: | |||||||||||||||||||||||||||||||
| Control investments | $ | 14,230 | $ | 17,122 | $ | 15,541 | Control investments | $ | 14,043 | $ | 11,792 | $ | 9,832 | |||||||||||||||||||
| Affiliate investments | 3,939 | 4,110 | 4,338 | Affiliate investments | 1,744 | 716 | 467 | |||||||||||||||||||||||||
| Non-control/Non-affiliate investments | 133,344 | 175,584 | 195,988 | Non-control/Non-affiliate investments | 212,677 | 161,864 | 114,947 | |||||||||||||||||||||||||
| Interest on cash and cash equivalents | 810 | 380 | 55 | Interest on cash and cash equivalents | 452 | 9 | 322 | |||||||||||||||||||||||||
| Total interest income | 152,323 | 197,196 | 215,922 | Total interest income | 228,916 | 174,381 | 125,568 | |||||||||||||||||||||||||
| PIK interest income: | PIK interest income: | |||||||||||||||||||||||||||||||
| Control investments | 6,631 | 4,987 | 5,029 | |||||||||||||||||||||||||||||
| Affiliate investments | 788 | 822 | 860 | |||||||||||||||||||||||||||||
| Non-control/Non-affiliate investments | 3,674 | 8,219 | 7,500 | Non-control/Non-affiliate investments | 20,526 | 16,447 | 7,863 | |||||||||||||||||||||||||
| Total PIK interest income | 11,093 | 14,028 | 13,389 | Total PIK interest income | 20,526 | 16,447 | 7,863 | |||||||||||||||||||||||||
| Fee income: | Fee income: | |||||||||||||||||||||||||||||||
| Control investments | 1,244 | 2,715 | 1,841 | Control investments | 50 | 59 | 42 | |||||||||||||||||||||||||
| Affiliate investments | 753 | 320 | 52 | Affiliate investments | 20 | 20 | 20 | |||||||||||||||||||||||||
| Non-control/Non-affiliate investments | 8,510 | 19,643 | 20,371 | Non-control/Non-affiliate investments | 6,561 | 14,019 | 8,457 | |||||||||||||||||||||||||
| Total fee income | 10,507 | 22,678 | 22,264 | Total fee income | 6,631 | 14,098 | 8,519 | |||||||||||||||||||||||||
| Dividend and other income: | ||||||||||||||||||||||||||||||||
| Dividend income: | Dividend income: | |||||||||||||||||||||||||||||||
| Control investments | 3,954 | 9,175 | 12,574 | Control investments | 6,366 | 4,459 | 1,180 | |||||||||||||||||||||||||
| Non-control/Non-affiliate investments | 87 | 4,795 | 1,326 | Non-control/Non-affiliate investments | 81 | — | 3 | |||||||||||||||||||||||||
| Total dividend and other income | 4,041 | 13,970 | 13,900 | |||||||||||||||||||||||||||||
| Total dividend income | Total dividend income | 6,447 | 4,459 | 1,183 | ||||||||||||||||||||||||||||
| Total investment income | 177,964 | 247,872 | 265,475 | Total investment income | 262,520 | 209,385 | 143,133 | |||||||||||||||||||||||||
| Expenses: | Expenses: | |||||||||||||||||||||||||||||||
| Base management fee | 31,369 | 41,483 | 51,615 | Base management fee | 39,556 | 32,288 | 22,895 | |||||||||||||||||||||||||
| Part I incentive fee | 10,713 | 22,091 | 28,575 | Part I incentive fee | 26,644 | 21,598 | 15,194 | |||||||||||||||||||||||||
| Part II incentive fee | Part II incentive fee | (8,791) | 17,615 | (5,557) | ||||||||||||||||||||||||||||
| Professional fees | 5,703 | 15,232 | 4,079 | Professional fees | 4,418 | 4,231 | 2,532 | |||||||||||||||||||||||||
| Board of Directors fees | 872 | 966 | 722 | |||||||||||||||||||||||||||||
| Directors fees | Directors fees | 603 | 607 | 570 | ||||||||||||||||||||||||||||
| Interest expense | 49,935 | 54,621 | 56,654 | Interest expense | 46,929 | 30,518 | 26,289 | |||||||||||||||||||||||||
| Administrator expense | 2,217 | 1,891 | 3,090 | Administrator expense | 1,246 | 1,510 | 1,524 | |||||||||||||||||||||||||
| General and administrative expenses | 5,999 | 5,128 | 6,346 | General and administrative expenses | 2,986 | 2,725 | 2,494 | |||||||||||||||||||||||||
| Loss on legal settlements | 3 | 19,500 | — | |||||||||||||||||||||||||||||
| Total expenses | 106,811 | 160,912 | 151,081 | Total expenses | 113,591 | 111,092 | 65,941 | |||||||||||||||||||||||||
| Base management fee waived | (240 | ) | (338 | ) | (546 | ) | ||||||||||||||||||||||||||
| Insurance recoveries | (1,259 | ) | (19,429 | ) | — | |||||||||||||||||||||||||||
| Reversal of fees waived (fees waived) | Reversal of fees waived (fees waived) | (3,000) | (1,608) | 5,200 | ||||||||||||||||||||||||||||
| Net expenses | 105,312 | 141,145 | 150,535 | Net expenses | 110,591 | 109,484 | 71,141 | |||||||||||||||||||||||||
| Net investment income before taxes | Net investment income before taxes | 151,929 | 99,901 | 71,992 | ||||||||||||||||||||||||||||
| (Provision) benefit for taxes on net investment income | (Provision) benefit for taxes on net investment income | (3,308) | (2,795) | — | ||||||||||||||||||||||||||||
| Net investment income | 72,652 | 106,727 | 114,940 | Net investment income | 148,621 | 97,106 | 71,992 | |||||||||||||||||||||||||
| Unrealized appreciation (depreciation) on investments: | ||||||||||||||||||||||||||||||||
| Unrealized appreciation (depreciation): | Unrealized appreciation (depreciation): | |||||||||||||||||||||||||||||||
| Control investments | (71,329 | ) | (53,599 | ) | (21,874 | ) | Control investments | (33,306) | 31,731 | (29,488) | ||||||||||||||||||||||
| Affiliate investments | (1,574 | ) | 845 | 962 | Affiliate investments | (683) | 568 | (1,763) | ||||||||||||||||||||||||
| Non-control/Non-affiliate investments | (24,640 | ) | 4,830 | (50,762 | ) | Non-control/Non-affiliate investments | (107,136) | 80,531 | 10,904 | |||||||||||||||||||||||
| Net unrealized depreciation on investments | (97,543 | ) | (47,924 | ) | (71,674 | ) | ||||||||||||||||||||||||||
| Net unrealized (appreciation) depreciation on secured borrowings | (296 | ) | (76 | ) | 658 | |||||||||||||||||||||||||||
| Realized gain (loss) on investments and secured borrowings: | ||||||||||||||||||||||||||||||||
| Foreign currency forward contracts | Foreign currency forward contracts | 4,877 | 1,689 | (267) | ||||||||||||||||||||||||||||
| Net unrealized appreciation (depreciation) | Net unrealized appreciation (depreciation) | (136,248) | 114,519 | (20,614) | ||||||||||||||||||||||||||||
| Realized gains (losses): | Realized gains (losses): | |||||||||||||||||||||||||||||||
| Control investments | (59,722 | ) | (9,318 | ) | (4,516 | ) | Control investments | 1,868 | — | (4,155) | ||||||||||||||||||||||
| Affiliate investments | — | 3 | 72 | |||||||||||||||||||||||||||||
| Non-control/Non-affiliate investments | (112,060 | ) | (115,968 | ) | (24,085 | ) | Non-control/Non-affiliate investments | 1,585 | 27,094 | (4,615) | ||||||||||||||||||||||
| Net realized loss on investments and secured borrowings | (171,782 | ) | (125,283 | ) | (28,529 | ) | ||||||||||||||||||||||||||
| Extinguishment of unsecured notes payable | Extinguishment of unsecured notes payable | — | — | (2,541) | ||||||||||||||||||||||||||||
| Foreign currency forward contracts | Foreign currency forward contracts | 13,726 | (674) | (2,613) | ||||||||||||||||||||||||||||
| Net realized gains (losses) | Net realized gains (losses) | 17,179 | 26,420 | (13,924) | ||||||||||||||||||||||||||||
| (Provision) benefit for taxes on realized and unrealized gains (losses) | (Provision) benefit for taxes on realized and unrealized gains (losses) | (329) | (785) | 1,770 | ||||||||||||||||||||||||||||
| Net realized and unrealized gains (losses), net of taxes | Net realized and unrealized gains (losses), net of taxes | (119,398) | 140,154 | (32,768) | ||||||||||||||||||||||||||||
| Net increase (decrease) in net assets resulting from operations | $ | (196,969 | ) | $ | (66,556 | ) | $ | 15,395 | Net increase (decrease) in net assets resulting from operations | $ | 29,223 | $ | 237,260 | $ | 39,224 | |||||||||||||||||
| Net investment income per common share — basic | $ | 0.51 | $ | 0.72 | $ | 0.75 | ||||||||||||||||||||||||||
| Earnings (loss) per common share — basic | $ | (1.39 | ) | $ | (0.45 | ) | $ | 0.10 | ||||||||||||||||||||||||
| Weighted average common shares outstanding — basic | 141,438 | 147,422 | 153,164 | |||||||||||||||||||||||||||||
| Net investment income per common share — diluted | $ | 0.51 | $ | 0.71 | $ | 0.75 | ||||||||||||||||||||||||||
| Earnings (loss) per common share — diluted (Note 5) | $ | (1.39 | ) | $ | (0.45 | ) | $ | 0.10 | ||||||||||||||||||||||||
| Weighted average common shares outstanding — diluted | 141,438 | 151,339 | 160,954 | |||||||||||||||||||||||||||||
| Distributions per common share | $ | 0.465 | $ | 0.72 | $ | 0.79 | ||||||||||||||||||||||||||
| Net investment income per common share — basic and diluted | Net investment income per common share — basic and diluted | $ | 0.82 | $ | 0.60 | $ | 0.51 | |||||||||||||||||||||||||
| Earnings (loss) per common share — basic and diluted (Note 5) | Earnings (loss) per common share — basic and diluted (Note 5) | $ | 0.16 | $ | 1.46 | $ | 0.28 | |||||||||||||||||||||||||
| Weighted average common shares outstanding — basic and diluted | Weighted average common shares outstanding — basic and diluted | 182,181 | 162,118 | 140,961 | ||||||||||||||||||||||||||||
| Year ended September 30, 2022 | Year ended September 30, 2021 | Year ended September 30, 2020 | ||||||||||||||||||
| Operations: | ||||||||||||||||||||
| Net investment income | $ | 148,621 | $ | 97,106 | $ | 71,992 | ||||||||||||||
| Net unrealized appreciation (depreciation) | (136,248) | 114,519 | (20,614) | |||||||||||||||||
| Net realized gains (losses) | 17,179 | 26,420 | (13,924) | |||||||||||||||||
| (Provision) benefit for taxes on realized and unrealized gains (losses) | (329) | (785) | 1,770 | |||||||||||||||||
| Net increase (decrease) in net assets resulting from operations | 29,223 | 237,260 | 39,224 | |||||||||||||||||
| Stockholder transactions: | ||||||||||||||||||||
| Distributions to stockholders | (118,657) | (82,020) | (54,975) | |||||||||||||||||
| Net increase (decrease) in net assets from stockholder transactions | (118,657) | (82,020) | (54,975) | |||||||||||||||||
| Capital share transactions: | ||||||||||||||||||||
| Issuance of common stock in connection with the OCSI Merger | — | 242,704 | — | |||||||||||||||||
| Issuance of common stock under dividend reinvestment plan | 3,409 | 2,170 | 1,878 | |||||||||||||||||
| Repurchases of common stock under dividend reinvestment plan | (1,857) | (2,170) | (1,878) | |||||||||||||||||
| Issuance of common stock in connection with the "at the market" offering | 20,622 | — | — | |||||||||||||||||
| Net increase (decrease) in net assets from capital share transactions | 22,174 | 242,704 | — | |||||||||||||||||
| Total increase (decrease) in net assets | (67,260) | 397,944 | (15,751) | |||||||||||||||||
| Net assets at beginning of period | 1,312,823 | 914,879 | 930,630 | |||||||||||||||||
| Net assets at end of period | $ | 1,245,563 | $ | 1,312,823 | $ | 914,879 | ||||||||||||||
| Net asset value per common share | $ | 6.79 | $ | 7.28 | $ | 6.49 | ||||||||||||||
| Common shares outstanding at end of period | 183,374 | 180,361 | 140,961 | |||||||||||||||||
| Year ended September 30, 2017 | Year ended September 30, 2016 | Year ended September 30, 2015 | ||||||||||
| Operations: | ||||||||||||
| Net investment income | $ | 72,652 | $ | 106,727 | $ | 114,940 | ||||||
| Net unrealized depreciation on investments | (97,543 | ) | (47,924 | ) | (71,674 | ) | ||||||
| Net unrealized (appreciation) depreciation on secured borrowings | (296 | ) | (76 | ) | 658 | |||||||
| Net realized loss on investments and secured borrowings | (171,782 | ) | (125,283 | ) | (28,529 | ) | ||||||
| Net increase (decrease) in net assets resulting from operations | (196,969 | ) | (66,556 | ) | 15,395 | |||||||
| Stockholder transactions: | ||||||||||||
| Contributions from stockholders (Note 11) | 287 | — | — | |||||||||
| Distributions to stockholders | (65,449 | ) | (99,419 | ) | (120,647 | ) | ||||||
| Tax return of capital | — | (7,239 | ) | — | ||||||||
| Net decrease in net assets from stockholder transactions | (65,162 | ) | (106,658 | ) | (120,647 | ) | ||||||
| Capital share transactions: | ||||||||||||
| Issuance of common stock, net | — | — | (94 | ) | ||||||||
| Issuance of common stock under dividend reinvestment plan | 2,924 | 6,398 | 5,953 | |||||||||
| Repurchases of treasury stock | — | — | (2,538 | ) | ||||||||
| Repurchases of common stock under stock repurchase program | (12,500 | ) | (37,592 | ) | (17,497 | ) | ||||||
| Repurchases of common stock under dividend reinvestment program | (2,924 | ) | (6,398 | ) | (5,953 | ) | ||||||
| Net decrease in net assets from capital share transactions | (12,500 | ) | (37,592 | ) | (20,129 | ) | ||||||
| Total decrease in net assets | (274,631 | ) | (210,806 | ) | (125,381 | ) | ||||||
| Net assets at beginning of period | 1,142,288 | 1,353,094 | 1,478,475 | |||||||||
| Net assets at end of period | $ | 867,657 | $ | 1,142,288 | $ | 1,353,094 | ||||||
| Net asset value per common share | $ | 6.16 | $ | 7.97 | $ | 9.00 | ||||||
| Common shares outstanding at end of period | 140,961 | 143,259 | 150,263 | |||||||||
| Year ended September 30, 2022 | Year ended September 30, 2021 | Year ended September 30, 2020 | ||||||||||||||||||
| Operating activities: | ||||||||||||||||||||
| Net increase (decrease) in net assets resulting from operations | $ | 29,223 | $ | 237,260 | $ | 39,224 | ||||||||||||||
| Adjustments to reconcile net increase (decrease) in net assets resulting from operations to net cash provided by (used in) operating activities: | ||||||||||||||||||||
| Net unrealized (appreciation) depreciation | 136,248 | (114,519) | 20,614 | |||||||||||||||||
| Net realized (gains) losses | (17,179) | (26,420) | 13,924 | |||||||||||||||||
| PIK interest income | (20,526) | (16,447) | (7,863) | |||||||||||||||||
| Accretion of original issue discount on investments | (29,091) | (29,391) | (12,305) | |||||||||||||||||
| Accretion of original issue discount on unsecured notes payable | 679 | 572 | 302 | |||||||||||||||||
| Amortization of deferred financing costs | 3,740 | 4,151 | 2,187 | |||||||||||||||||
| Deferred taxes | (973) | 133 | (1,551) | |||||||||||||||||
| Purchases of investments | (702,063) | (1,120,168) | (727,161) | |||||||||||||||||
| Proceeds from the sales and repayments of investments | 693,745 | 792,161 | 579,550 | |||||||||||||||||
| Cash acquired in the OCSI Merger | — | 20,945 | — | |||||||||||||||||
| Changes in operating assets and liabilities: | ||||||||||||||||||||
| (Increase) decrease in interest, dividends and fees receivable | (16,115) | (8,495) | 4,232 | |||||||||||||||||
| (Increase) decrease in due from portfolio companies | (20,505) | 1,360 | (109) | |||||||||||||||||
| (Increase) decrease in receivables from unsettled transactions | 3,458 | 2,514 | (4,537) | |||||||||||||||||
| (Increase) decrease in due from broker | (43,890) | (1,640) | — | |||||||||||||||||
| (Increase) decrease in other assets | 619 | (1,427) | 437 | |||||||||||||||||
| Increase (decrease) in accounts payable, accrued expenses and other liabilities | 677 | (426) | (517) | |||||||||||||||||
| Increase (decrease) in base management fee and incentive fee payable | (16,709) | 19,516 | 1,045 | |||||||||||||||||
| Increase (decrease) in due to affiliate | (1,177) | 1,119 | (559) | |||||||||||||||||
| Increase (decrease) in interest payable | 3,339 | 1,163 | (670) | |||||||||||||||||
| Increase (decrease) in payables from unsettled transactions | 18,895 | 7,608 | (59,118) | |||||||||||||||||
| Increase (decrease) in director fees payable | — | (90) | — | |||||||||||||||||
| Net cash provided by (used in) operating activities | 22,395 | (230,521) | (152,875) | |||||||||||||||||
| Financing activities: | ||||||||||||||||||||
| Distributions paid in cash | (115,248) | (79,850) | (53,097) | |||||||||||||||||
| Borrowings under credit facilities | 300,000 | 505,000 | 286,000 | |||||||||||||||||
| Repayments of borrowings under credit facilities | (230,000) | (529,582) | (186,000) | |||||||||||||||||
| Repayments of unsecured notes | — | — | (161,250) | |||||||||||||||||
| Issuance of unsecured notes | — | 349,020 | 297,459 | |||||||||||||||||
| Repayments of secured borrowings | — | (9,341) | — | |||||||||||||||||
| Repurchases of common stock under dividend reinvestment plan | (1,857) | (2,170) | (1,878) | |||||||||||||||||
| Shares issued under the "at the market" offering | 20,839 | — | — | |||||||||||||||||
| Deferred financing costs paid | (334) | (8,890) | (4,835) | |||||||||||||||||
| Offering costs paid | (215) | — | (67) | |||||||||||||||||
| Net cash provided by (used in) financing activities | (26,815) | 224,187 | 176,332 | |||||||||||||||||
| Effect of exchange rate changes on foreign currency | (851) | (1,127) | 233 | |||||||||||||||||
| Net increase (decrease) in cash and cash equivalents and restricted cash | (5,271) | (7,461) | 23,690 | |||||||||||||||||
| Cash and cash equivalents and restricted cash, beginning of period | 31,635 | 39,096 | 15,406 | |||||||||||||||||
| Cash and cash equivalents and restricted cash, end of period | $ | 26,364 | $ | 31,635 | $ | 39,096 | ||||||||||||||
| Supplemental information: | ||||||||||||||||||||
| Cash paid for interest | $ | 39,171 | $ | 24,006 | $ | 24,470 | ||||||||||||||
| Non-cash financing activities: | ||||||||||||||||||||
| Issuance of shares of common stock under dividend reinvestment plan | $ | 3,409 | $ | 2,170 | $ | 1,878 | ||||||||||||||
| Deferred financing costs | — | (162) | — | |||||||||||||||||
| Issuance of shares in connection with the OCSI Merger | — | 242,704 | — | |||||||||||||||||
| Reconciliation to the Consolidated Statements of Assets and Liabilities | September 30, 2022 | September 30, 2021 | September 30, 2020 | |||||||||||||||||
| Cash and cash equivalents | $ | 23,528 | $ | 29,334 | $ | 39,096 | ||||||||||||||
| Restricted cash | 2,836 | 2,301 | — | |||||||||||||||||
| Total cash and cash equivalents and restricted cash | $ | 26,364 | $ | 31,635 | $ | 39,096 | ||||||||||||||
| Year ended September 30, 2017 | Year ended September 30, 2016 | Year ended September 30, 2015 | ||||||||||
| Operating activities: | ||||||||||||
| Net increase (decrease) in net assets resulting from operations | $ | (196,969 | ) | $ | (66,556 | ) | $ | 15,395 | ||||
| Adjustments to reconcile net increase (decrease) in net assets resulting from operations to net cash provided by operating activities: | ||||||||||||
| Net unrealized depreciation on investments | 97,543 | 47,924 | 71,674 | |||||||||
| Net unrealized appreciation (depreciation) on secured borrowings | 296 | 76 | (658 | ) | ||||||||
| Net realized loss on investments and secured borrowings | 171,782 | 125,283 | 28,529 | |||||||||
| PIK interest income | (11,093 | ) | (14,028 | ) | (13,389 | ) | ||||||
| Recognition of fee income | (10,507 | ) | (22,678 | ) | (22,264 | ) | ||||||
| Accretion of original issue discount on investments | (11,474 | ) | (4,248 | ) | (7,328 | ) | ||||||
| Accretion of original issue discount on unsecured notes payable | 266 | 266 | 443 | |||||||||
| Amortization of deferred financing costs | 6,082 | 4,975 | 5,117 | |||||||||
| Changes in operating assets and liabilities: | ||||||||||||
| Fee income received | 10,321 | 20,885 | 21,588 | |||||||||
| (Increase) decrease in restricted cash | 5,544 | (7,332 | ) | 17,208 | ||||||||
| (Increase) decrease in interest, dividends and fees receivable | 8,676 | 1,280 | (1,104 | ) | ||||||||
| (Increase) decrease in due from portfolio companies | (1,593 | ) | (1,436 | ) | 20,309 | |||||||
| (Increase) decrease in receivables from unsettled transactions | 5,346 | (178 | ) | (418 | ) | |||||||
| (Increase) decrease in insurance recoveries receivable | 19,729 | (19,729 | ) | — | ||||||||
| Increase in other assets | (36 | ) | (347 | ) | (131 | ) | ||||||
| Increase (decrease) in accounts payable, accrued expenses and other liabilities | (116 | ) | (2,413 | ) | 1,038 | |||||||
| Decrease in base management fee and Part I incentive fee payable | (9,208 | ) | (573 | ) | (5,150 | ) | ||||||
| Increase (decrease) in due to FSC CT | (389 | ) | (761 | ) | 501 | |||||||
| Decrease in interest payable | (745 | ) | (388 | ) | (1,497 | ) | ||||||
| Increase in payables from unsettled transactions | 52,457 | 2,586 | 3,648 | |||||||||
| Increase (decrease) in director fees payable | (382 | ) | 506 | 60 | ||||||||
| Increase (decrease) in legal settlements payable | (19,500 | ) | 19,500 | — | ||||||||
| Decrease in amounts payable to syndication partners | (753 | ) | (562 | ) | (2,501 | ) | ||||||
| Purchases of investments and net revolver activity | (568,270 | ) | (735,544 | ) | (1,419,801 | ) | ||||||
| Principal payments received on investments (scheduled payments) | 29,447 | 30,321 | 29,169 | |||||||||
| Principal payments received on investments (payoffs) | 818,959 | 543,950 | 653,522 | |||||||||
| PIK interest income received in cash | 4,307 | 2,076 | 2,397 | |||||||||
| Proceeds from the sale of investments | 92,721 | 241,902 | 749,835 | |||||||||
| Net cash provided by operating activities | 492,441 | 164,757 | 146,192 | |||||||||
| Financing activities: | ||||||||||||
| Contributions received in cash | 287 | — | — | |||||||||
| Distributions paid in cash | (62,525 | ) | (100,260 | ) | (114,694 | ) | ||||||
| Repayments under SBA debentures | (213,300 | ) | (11,700 | ) | — | |||||||
| Borrowings under credit facilities | 219,082 | 695,000 | 818,400 | |||||||||
| Repayments of borrowings under credit facilities | (479,382 | ) | (606,000 | ) | (708,500 | ) | ||||||
| Repurchases of treasury stock | — | — | (2,538 | ) | ||||||||
| Repayments of secured borrowings | (5,440 | ) | (2,858 | ) | (62,836 | ) | ||||||
| Repayments of unsecured convertible notes | — | (115,000 | ) | — | ||||||||
| Repurchases of common stock under stock repurchase program | (12,500 | ) | (37,592 | ) | (17,497 | ) | ||||||
| Repurchases of common stock under dividend reinvestment plan | (2,924 | ) | (6,398 | ) | (5,953 | ) | ||||||
| Deferred financing costs paid | (644 | ) | (403 | ) | (834 | ) | ||||||
| Offering costs paid | — | — | (94 | ) | ||||||||
| Net cash used by financing activities | (557,346 | ) | (185,211 | ) | (94,546 | ) | ||||||
| Net increase (decrease) in cash and cash equivalents | (64,905 | ) | (20,454 | ) | 51,646 | |||||||
| Cash and cash equivalents, beginning of period | 117,923 | 138,377 | 86,731 | |||||||||
| Cash and cash equivalents, end of period | $ | 53,018 | $ | 117,923 | $ | 138,377 | ||||||
| Supplemental information: | ||||||||||||
| Cash paid for interest | $ | 44,332 | $ | 49,768 | $ | 52,706 | ||||||
| Non-cash operating activities: | ||||||||||||
| Purchases of investments from restructurings | $ | (165,759 | ) | $ | (78,834 | ) | $ | — | ||||
| Proceeds from investment restructurings | $ | 165,759 | $ | 78,834 | $ | — | ||||||
| Non-cash financing activities: | ||||||||||||
| Issuance of shares of common stock under dividend reinvestment plan | $ | 2,924 | $ | 6,398 | $ | 5,953 | ||||||
| Portfolio Company/Type of Investment (1)(2)(3)(4)(5) | Cash Interest Rate (6) | Industry | Principal (7) | Cost | Fair Value | Notes | |||||||||||||||||||||||
| Control Investments | (8)(9) | ||||||||||||||||||||||||||||
| C5 Technology Holdings, LLC | Data Processing & Outsourced Services | ||||||||||||||||||||||||||||
| 829 Common Units | $ | — | $ | — | (15) | ||||||||||||||||||||||||
| 34,984,460.37 Preferred Units | 34,984 | 27,638 | (15) | ||||||||||||||||||||||||||
| 34,984 | 27,638 | ||||||||||||||||||||||||||||
| Dominion Diagnostics, LLC | Health Care Services | ||||||||||||||||||||||||||||
| First Lien Term Loan, LIBOR+5.00% cash due 2/28/2024 | 8.68 | % | $ | 14,333 | 14,333 | 14,333 | (6)(15) | ||||||||||||||||||||||
| First Lien Revolver, LIBOR+5.00% cash due 2/28/2024 | — | — | — | (6)(15)(19) | |||||||||||||||||||||||||
| 30,030.8 Common Units in DD Healthcare Services Holdings, LLC | 15,222 | 4,946 | (15) | ||||||||||||||||||||||||||
| 29,555 | 19,279 | ||||||||||||||||||||||||||||
| OCSI Glick JV LLC | Multi-Sector Holdings | (14) | |||||||||||||||||||||||||||
| Subordinated Debt, LIBOR+4.50% cash due 10/20/2028 | 6.30 | % | 59,662 | 50,194 | 50,283 | (6)(11)(15)(19) | |||||||||||||||||||||||
| 87.5% equity interest | — | — | (11)(16)(19) | ||||||||||||||||||||||||||
| 50,194 | 50,283 | ||||||||||||||||||||||||||||
| Senior Loan Fund JV I, LLC | Multi-Sector Holdings | (14) | |||||||||||||||||||||||||||
| Subordinated Debt, LIBOR+7.00% cash due 12/29/2028 | 8.80 | % | 96,250 | 96,250 | 96,250 | (6)(11)(15)(19) | |||||||||||||||||||||||
| 87.5% LLC equity interest | 49,322 | 20,715 | (11)(12)(16)(19) | ||||||||||||||||||||||||||
| 145,572 | 116,965 | ||||||||||||||||||||||||||||
| Total Control Investments (17.2% of net assets) | $ | 260,305 | $ | 214,165 | |||||||||||||||||||||||||
| Affiliate Investments | (17) | ||||||||||||||||||||||||||||
| Assembled Brands Capital LLC | Specialized Finance | ||||||||||||||||||||||||||||
| First Lien Revolver, LIBOR+6.75% cash due 10/17/2023 | 10.42 | % | $ | 24,490 | $ | 24,490 | $ | 24,225 | (6)(15)(19) | ||||||||||||||||||||
| 1,609,201 Class A Units | 764 | 370 | (15) | ||||||||||||||||||||||||||
| 1,019,168.80 Preferred Units, 6% | 1,019 | 1,223 | (15) | ||||||||||||||||||||||||||
| 70,424.5641 Class A Warrants (exercise price $3.3778) expiration date 9/9/2029 | — | — | (15) | ||||||||||||||||||||||||||
| 26,273 | 25,818 | ||||||||||||||||||||||||||||
| Caregiver Services, Inc. | Health Care Services | ||||||||||||||||||||||||||||
| 1,080,399 shares of Series A Preferred Stock, 10% | 1,080 | 378 | (15) | ||||||||||||||||||||||||||
| 1,080 | 378 | ||||||||||||||||||||||||||||
| Total Affiliate Investments (2.1% of net assets) | $ | 27,353 | $ | 26,196 | |||||||||||||||||||||||||
| Non-Control/Non-Affiliate Investments | (18) | ||||||||||||||||||||||||||||
| 109 Montgomery Owner LLC | Real Estate Operating Companies | ||||||||||||||||||||||||||||
| First Lien Term Loan, LIBOR+7.00% cash due 2/2/2023 | 9.80 | % | $ | 389 | $ | 387 | $ | 727 | (6)(15) | ||||||||||||||||||||
| First Lien Delayed Draw Term Loan, LIBOR+7.00% cash due 2/2/2023 | — | (31) | — | (6)(15)(19) | |||||||||||||||||||||||||
| 356 | 727 | ||||||||||||||||||||||||||||
| A.T. Holdings II SÀRL | Biotechnology | ||||||||||||||||||||||||||||
| First Lien Term Loan, 10.50% PIK due 12/22/2022 | 33,997 | 33,960 | 34,891 | (11)(15) | |||||||||||||||||||||||||
| 33,960 | 34,891 | ||||||||||||||||||||||||||||
| Access CIG, LLC | Diversified Support Services | ||||||||||||||||||||||||||||
| Second Lien Term Loan, LIBOR+7.75% cash due 2/27/2026 | 10.82 | % | 20,000 | 19,927 | 19,075 | (6) | |||||||||||||||||||||||
| 19,927 | 19,075 | ||||||||||||||||||||||||||||
| Accupac, Inc. | Personal Products | ||||||||||||||||||||||||||||
| First Lien Term Loan, SOFR+5.50% cash due 1/16/2026 | 9.12 | % | 15,976 | 15,686 | 15,944 | (6)(15) | |||||||||||||||||||||||
| First Lien Delayed Draw Term Loan, SOFR+5.50% cash due 1/16/2026 | — | — | (6) | (6)(15)(19) | |||||||||||||||||||||||||
| First Lien Revolver, SOFR+5.50% cash due 1/16/2026 | 9.14 | % | 500 | 462 | 495 | (6)(15)(19) | |||||||||||||||||||||||
| 16,148 | 16,433 | ||||||||||||||||||||||||||||
| Portfolio Company/Type of Investment (1)(2)(5)(9)(14) | Cash Interest Rate (13) | Industry | Principal (8) | Cost | Fair Value | ||||||||||||
| Control Investments (3)(15) | |||||||||||||||||
| Traffic Solutions Holdings, Inc. | Construction and engineering | ||||||||||||||||
| First Lien Term Loan, LIBOR+7% (1% floor) cash 2% PIK due 4/1/2021 (13) | 8.34 | % | $ | 36,567 | $ | 36,539 | $ | 36,568 | |||||||||
| First Lien Revolver, LIBOR+6% (1% floor) cash due 4/1/2021 (13) | 7.34 | % | 1,250 | 1,247 | 1,250 | ||||||||||||
| LC Facility, 6% cash due 4/1/2021 | 4,752 | 4,748 | 4,752 | ||||||||||||||
| 746,114 Series A Preferred Units, 10% | 20,029 | 7,700 | |||||||||||||||
| 746,114 Shares of Common Stock | 5,316 | — | |||||||||||||||
| 67,879 | 50,270 | ||||||||||||||||
| TransTrade Operators, Inc. | Air freight & logistics | ||||||||||||||||
| First Lien Term Loan, 5% cash due 12/31/2017 | 15,973 | 15,574 | 1,810 | ||||||||||||||
| First Lien Revolver, 8% cash due 12/31/2017 | 7,757 | 7,757 | — | ||||||||||||||
| 596.67 Series A Common Units | — | — | |||||||||||||||
| 4,000 Series A Preferred Units in TransTrade Holdings LLC | 4,000 | — | |||||||||||||||
| 5,200,000 Series B Preferred Units in TransTrade Holdings LLC | 5,200 | — | |||||||||||||||
| 32,531 | 1,810 | ||||||||||||||||
| First Star Speir Aviation Limited (11)(16) | Airlines | ||||||||||||||||
| First Lien Term Loan, 9% cash due 12/15/2020 | 41,395 | 34,542 | 41,395 | ||||||||||||||
| 100% equity interest (6) | 8,500 | 3,926 | |||||||||||||||
| 43,042 | 45,321 | ||||||||||||||||
| First Star Bermuda Aviation Limited (11)(16) | Airlines | ||||||||||||||||
| First Lien Term Loan, 9% cash 3% PIK due 8/19/2018 | 11,868 | 11,868 | 11,868 | ||||||||||||||
| 100% equity interest (6) | 2,693 | 2,323 | |||||||||||||||
| 14,561 | 14,191 | ||||||||||||||||
| Eagle Hospital Physicians, LLC | Healthcare services | ||||||||||||||||
| Earn-out (19) | 7,851 | 4,986 | |||||||||||||||
| 7,851 | 4,986 | ||||||||||||||||
| Senior Loan Fund JV I, LLC (11)(17)(18) | Multi-sector holdings | ||||||||||||||||
| Class A Mezzanine Secured Deferrable Floating Rate Notes due 2036 in SLF Repack Issuer 2016 LLC (13) | 6.88 | % | 101,030 | 101,030 | 101,030 | ||||||||||||
| Class B Mezzanine Secured Deferrable Fixed Rate Notes, 15% PIK due 2036 in SLF Repack Issuer 2016 LLC | 27,641 | 27,641 | 27,641 | ||||||||||||||
| 87.5% LLC equity interest (6) | 16,172 | 5,525 | |||||||||||||||
| 144,843 | 134,196 | ||||||||||||||||
| Ameritox Ltd. | Healthcare services | ||||||||||||||||
| First Lien Term Loan, LIBOR+5% (1% floor) cash 3% PIK due 4/11/2021 (13) | 6.33 | % | 38,338 | 37,539 | 4,445 | ||||||||||||
| 14,090,126.4 Class A Preferred Units in Ameritox Holdings II, LLC | 14,090 | — | |||||||||||||||
| 1,602,260.83 Class B Preferred Units in Ameritox Holdings II, LLC | 1,602 | — | |||||||||||||||
| 4,930.03 Class A Units in Ameritox Holdings II, LLC | 29,049 | — | |||||||||||||||
| 82,280 | 4,445 | ||||||||||||||||
| New IPT, Inc. | Oil & gas equipment services | ||||||||||||||||
| First Lien Term Loan, LIBOR+5% (1% floor) cash due 3/17/2021 (13) | 6.33 | % | 4,107 | 4,107 | 4,107 | ||||||||||||
| Second Lien Term Loan, LIBOR+5.1% (1% floor) cash due 9/17/2021 (13) | 6.43 | % | 2,504 | 2,504 | 2,504 | ||||||||||||
| First Lien Revolver, LIBOR+5% (1% floor) cash due 3/17/2021 (13) | 6.33 | % | 1,009 | 1,009 | 1,009 | ||||||||||||
| 50.087 Class A Common Units in New IPT Holdings, LLC | — | 736 | |||||||||||||||
| 7,620 | 8,356 | ||||||||||||||||
| AdVenture Interactive, Corp. | Advertising | ||||||||||||||||
| 9,073 shares of common stock | 13,611 | 13,818 | |||||||||||||||
| 13,611 | 13,818 | ||||||||||||||||
| Keypath Education, Inc. (20) | Advertising | ||||||||||||||||
| First Lien Term Loan, LIBOR+7% (1% floor) cash due 4/3/2022 (13) | 8.33 | % | 19,960 | 19,960 | 19,960 | ||||||||||||
| First Lien Revolver, LIBOR+7% (1% floor) cash due 4/3/2022 (13) | 8.33 | % | — | — | — | ||||||||||||
| 9,073 Class A Units in FS AVI Holdco, LLC | 10,648 | 7,918 | |||||||||||||||
| 30,608 | 27,878 | ||||||||||||||||
| Total Control Investments (35.2% of net assets) | $ | 444,826 | $ | 305,271 | |||||||||||||
| Portfolio Company/Type of Investment (1)(2)(3)(4)(5) | Cash Interest Rate (6) | Industry | Principal (7) | Cost | Fair Value | Notes | |||||||||||||||||||||||
| Acquia Inc. | Application Software | ||||||||||||||||||||||||||||
| First Lien Term Loan, LIBOR+7.00% cash due 10/31/2025 | 9.63 | % | $ | 27,349 | $ | 27,038 | $ | 27,158 | (6)(15) | ||||||||||||||||||||
| First Lien Revolver, LIBOR+7.00% cash due 10/31/2025 | 10.64 | % | 914 | 890 | 898 | (6)(15)(19) | |||||||||||||||||||||||
| 27,928 | 28,056 | ||||||||||||||||||||||||||||
| ADB Companies, LLC | Construction & Engineering | ||||||||||||||||||||||||||||
| First Lien Term Loan, SOFR+6.25% cash due 12/18/2025 | 9.80 | % | 14,685 | 14,217 | 14,431 | (6)(15) | |||||||||||||||||||||||
| 14,217 | 14,431 | ||||||||||||||||||||||||||||
| ADC Therapeutics SA | Biotechnology | ||||||||||||||||||||||||||||
| First Lien Term Loan, SOFR+7.50% cash due 8/15/2029 | 11.20 | % | 6,589 | 6,256 | 6,262 | (6)(11)(15) | |||||||||||||||||||||||
| First Lien Delayed Draw Term Loan, SOFR+7.50% cash due 8/15/2029 | — | (38) | (37) | (6)(11)(15)(19) | |||||||||||||||||||||||||
| 28,948 Common Stock Warrants (exercise price $8.297) expiration 8/15/2032 | 174 | 73 | (11)(15) | ||||||||||||||||||||||||||
| 6,392 | 6,298 | ||||||||||||||||||||||||||||
| Aden & Anais Merger Sub, Inc. | Apparel, Accessories & Luxury Goods | ||||||||||||||||||||||||||||
| 51,645 Common Units in Aden & Anais Holdings, Inc. | 5,165 | — | (15) | ||||||||||||||||||||||||||
| 5,165 | — | ||||||||||||||||||||||||||||
| AI Sirona (Luxembourg) Acquisition S.a.r.l. | Pharmaceuticals | ||||||||||||||||||||||||||||
| Second Lien Term Loan, EURIBOR+7.25% cash due 9/28/2026 | 7.94 | % | € | 24,838 | 27,752 | 22,143 | (6)(11)(15) | ||||||||||||||||||||||
| 27,752 | 22,143 | ||||||||||||||||||||||||||||
| AIP RD Buyer Corp. | Distributors | ||||||||||||||||||||||||||||
| Second Lien Term Loan, SOFR+7.75% cash due 12/23/2029 | 10.88 | % | $ | 14,414 | 14,154 | 13,910 | (6)(15) | ||||||||||||||||||||||
| 14,410 Common Units in RD Holding LP | 1,352 | 1,291 | (15) | ||||||||||||||||||||||||||
| 15,506 | 15,201 | ||||||||||||||||||||||||||||
| AirStrip Technologies, Inc. | Application Software | ||||||||||||||||||||||||||||
| 5,715 Common Stock Warrants (exercise price $139.99) expiration date 5/11/2025 | 90 | — | (15) | ||||||||||||||||||||||||||
| 90 | — | ||||||||||||||||||||||||||||
| All Web Leads, Inc. | Advertising | ||||||||||||||||||||||||||||
| First Lien Term Loan, LIBOR+8.50% PIK due 12/29/2023 | 23,338 | 22,057 | 22,141 | (6)(15) | |||||||||||||||||||||||||
| 22,057 | 22,141 | ||||||||||||||||||||||||||||
| Altice France S.A. | Integrated Telecommunication Services | ||||||||||||||||||||||||||||
| Fixed Rate Bond, 5.50% cash due 10/15/2029 | 4,050 | 3,518 | 3,057 | (11) | |||||||||||||||||||||||||
| 3,518 | 3,057 | ||||||||||||||||||||||||||||
| Alvogen Pharma US, Inc. | Pharmaceuticals | ||||||||||||||||||||||||||||
| First Lien Term Loan, SOFR+7.50% cash due 6/30/2025 | 11.20 | % | 13,134 | 12,847 | 13,068 | (6)(15) | |||||||||||||||||||||||
| 12,847 | 13,068 | ||||||||||||||||||||||||||||
| Alvotech Holdings S.A. | Biotechnology | (13) | |||||||||||||||||||||||||||
| Tranche A Fixed Rate Bond 10.00% cash due 6/24/2025 | 24,043 | 23,747 | 23,923 | (11)(15) | |||||||||||||||||||||||||
| Tranche B Fixed Rate Bond 10.00% cash due 6/24/2025 | 23,522 | 23,264 | 23,404 | (11)(15) | |||||||||||||||||||||||||
| 587,930 Common Shares in Alvotech SA | 5,308 | 3,974 | (11) | ||||||||||||||||||||||||||
| 124,780 Seller Earn Out Shares in Alvotech SA | 485 | 212 | (11)(15) | ||||||||||||||||||||||||||
| 52,804 | 51,513 | ||||||||||||||||||||||||||||
| American Auto Auction Group, LLC | Consumer Finance | ||||||||||||||||||||||||||||
| Second Lien Term Loan, SOFR+8.75% cash due 1/2/2029 | 12.30 | % | 14,760 | 14,492 | 13,284 | (6)(15) | |||||||||||||||||||||||
| 14,492 | 13,284 | ||||||||||||||||||||||||||||
| American Tire Distributors, Inc. | Distributors | ||||||||||||||||||||||||||||
| First Lien Term Loan, LIBOR+6.25% cash due 10/20/2028 | 9.03 | % | 9,895 | 9,772 | 9,293 | (6) | |||||||||||||||||||||||
| 9,772 | 9,293 | ||||||||||||||||||||||||||||
| Amplify Finco Pty Ltd. | Movies & Entertainment | ||||||||||||||||||||||||||||
| First Lien Term Loan, LIBOR+4.25% cash due 11/26/2026 | 7.92 | % | 15,220 | 13,973 | 14,687 | (6)(11)(15) | |||||||||||||||||||||||
| Second Lien Term Loan, LIBOR+8.00% cash due 11/26/2027 | 11.67 | % | 12,500 | 12,188 | 11,958 | (6)(11)(15) | |||||||||||||||||||||||
| 26,161 | 26,645 | ||||||||||||||||||||||||||||
| Portfolio Company/Type of Investment (1)(2)(5)(9)(14) | Cash Interest Rate (13) | Industry | Principal (8) | Cost | Fair Value | ||||||||||||
| Affiliate Investments (4) | |||||||||||||||||
| Caregiver Services, Inc. | Healthcare services | ||||||||||||||||
| Second Lien Term Loan, 10% cash 2% PIK due 6/30/2019 | $ | 9,719 | $ | 9,719 | $ | 9,665 | |||||||||||
| 1,080,399 Shares of Series A Preferred Stock, 10% | 1,080 | 2,534 | |||||||||||||||
| 10,799 | 12,199 | ||||||||||||||||
| AmBath/ReBath Holdings, Inc. | Home improvement retail | ||||||||||||||||
| First Lien Term Loan B, 12.5% cash 2.5% PIK due 8/31/2018 | 22,955 | 22,944 | 22,957 | ||||||||||||||
| 4,668,788 Shares of Preferred Stock | — | 1,827 | |||||||||||||||
| 22,944 | 24,784 | ||||||||||||||||
| Total Affiliate Investments (4.3% of net assets) | $ | 33,743 | $ | 36,983 | |||||||||||||
| Non-Control/Non-Affiliate Investments (7) | |||||||||||||||||
| Cenegenics, LLC | Healthcare services | ||||||||||||||||
| First Lien Term Loan, 9.75% cash 2% PIK due 9/30/2019 | 28,600 | $ | 27,737 | $ | 15,811 | ||||||||||||
| First Lien Revolver, 15% cash due 9/30/2019 | 2,203 | 2,203 | 1,218 | ||||||||||||||
| 452,914.87 Common Units in Cenegenics, LLC | 598 | — | |||||||||||||||
| 345,380.141 Preferred Units in Cenegenics, LLC | 300 | — | |||||||||||||||
| 30,838 | 17,029 | ||||||||||||||||
| Riverlake Equity Partners II, LP | Multi-sector holdings | ||||||||||||||||
| 1.92% limited partnership interest (11) | 870 | 625 | |||||||||||||||
| 870 | 625 | ||||||||||||||||
| Riverside Fund IV, LP | Multi-sector holdings | ||||||||||||||||
| 0.34% limited partnership interest (11) | 219 | 397 | |||||||||||||||
| 219 | 397 | ||||||||||||||||
| Bunker Hill Capital II (QP), L.P. | Multi-sector holdings | ||||||||||||||||
| 0.51% limited partnership interest (11) | 826 | 1,056 | |||||||||||||||
| 826 | 1,056 | ||||||||||||||||
| Maverick Healthcare Group, LLC (21) | Healthcare equipment | ||||||||||||||||
| First Lien Term Loan A, LIBOR+7.5% cash (1.75% floor) cash due 4/30/2017 (13) | 9.25 | % | 16,309 | 16,204 | 14,209 | ||||||||||||
| First Lien Term Loan B, LIBOR+11% cash (1.75% floor) cash due 4/30/2017 (13) | 12.75 | % | 41,739 | 39,110 | 14,531 | ||||||||||||
| CapEx Line, LIBOR+7.75% (1.75% floor) cash due 4/30/2017 (13) | 9.50 | % | 1,272 | 1,261 | 1,124 | ||||||||||||
| First Lien Revolver, PRIME+6.5% cash due 4/30/2017 (13) | 10.75 | % | 55 | 40 | 55 | ||||||||||||
| 56,615 | 29,919 | ||||||||||||||||
| Refac Optical Group | Specialty stores | ||||||||||||||||
| First Lien Term Loan A, LIBOR+8% cash due 9/30/2018 (13) | 9.23 | % | 4,027 | 3,997 | 4,027 | ||||||||||||
| First Lien Term Loan B, LIBOR+9% cash, 1.75% PIK due 9/30/2018 (13) | 10.23 | % | 34,621 | 34,533 | 34,275 | ||||||||||||
| First Lien Term Loan C, 12.5% cash due 9/30/2018 | 3,416 | 3,416 | 3,314 | ||||||||||||||
| First Lien Revolver, LIBOR+8% cash due 9/30/2018 (13) | 9.23 | % | 3,520 | 3,516 | 3,520 | ||||||||||||
| 1,550.9435 Shares of Common Stock in Refac Holdings, Inc. | 1 | — | |||||||||||||||
| 550.9435 Shares of Series A-2 Preferred Stock in Refac Holdings, Inc., 10% | 305 | — | |||||||||||||||
| 1,000 Shares of Series A Preferred Stock Units in Refac Holdings, Inc., 10% | 999 | 397 | |||||||||||||||
| 46,767 | 45,533 | ||||||||||||||||
| Baird Capital Partners V, LP | Multi-sector holdings | ||||||||||||||||
| 0.4% limited partnership interest (11) | 994 | 601 | |||||||||||||||
| 994 | 601 | ||||||||||||||||
| Milestone Partners IV, L.P. | Multi-sector holdings | ||||||||||||||||
| 0.82% limited partnership interest (11) | 948 | 1,527 | |||||||||||||||
| 948 | 1,527 | ||||||||||||||||
| Portfolio Company/Type of Investment (1)(2)(3)(4)(5) | Cash Interest Rate (6) | Industry | Principal (7) | Cost | Fair Value | Notes | |||||||||||||||||||||||
| Anastasia Parent, LLC | Personal Products | ||||||||||||||||||||||||||||
| First Lien Term Loan, LIBOR+3.75% cash due 8/11/2025 | 7.42 | % | $ | 2,736 | $ | 2,260 | $ | 2,189 | (6) | ||||||||||||||||||||
| 2,260 | 2,189 | ||||||||||||||||||||||||||||
| Ankura Consulting Group LLC | Research & Consulting Services | ||||||||||||||||||||||||||||
| Second Lien Term Loan, LIBOR+8.00% cash due 3/19/2029 | 10.78 | % | 4,346 | 4,281 | 3,813 | (6)(15) | |||||||||||||||||||||||
| 4,281 | 3,813 | ||||||||||||||||||||||||||||
| Apptio, Inc. | Application Software | ||||||||||||||||||||||||||||
| First Lien Term Loan, LIBOR+6.00% cash due 1/10/2025 | 8.46 | % | 34,458 | 33,737 | 33,738 | (6)(15) | |||||||||||||||||||||||
| First Lien Revolver, LIBOR+6.00% cash due 1/10/2025 | 8.46 | % | 892 | 863 | 846 | (6)(15)(19) | |||||||||||||||||||||||
| 34,600 | 34,584 | ||||||||||||||||||||||||||||
| APX Group Inc. | Electrical Components & Equipment | ||||||||||||||||||||||||||||
| Fixed Rate Bond, 5.75% cash due 7/15/2029 | 2,075 | 1,733 | 1,645 | (11) | |||||||||||||||||||||||||
| 1,733 | 1,645 | ||||||||||||||||||||||||||||
| Ardonagh Midco 3 PLC | Insurance Brokers | ||||||||||||||||||||||||||||
| First Lien Term Loan, EURIBOR+7.00% cash due 7/14/2026 | 8.00 | % | € | 1,964 | 2,176 | 1,927 | (6)(11)(15) | ||||||||||||||||||||||
| First Lien Term Loan, SONIA+7.00% cash due 7/14/2026 | 9.19 | % | £ | 18,636 | 23,139 | 20,826 | (6)(11)(15) | ||||||||||||||||||||||
| First Lien Term Loan, LIBOR+5.75% cash due 7/14/2026 | 8.81 | % | $ | 10,519 | 10,357 | 10,328 | (6)(11)(15) | ||||||||||||||||||||||
| First Lien Delayed Draw Term Loan, SONIA+5.75% cash due 7/14/2026 | £ | — | (44) | — | (6)(11)(15)(19) | ||||||||||||||||||||||||
| 35,628 | 33,081 | ||||||||||||||||||||||||||||
| ASP Unifrax Holdings, Inc. | Trading Companies & Distributors | ||||||||||||||||||||||||||||
| Fixed Rate Bond, 7.50% cash due 9/30/2029 | $ | 5,500 | 5,408 | 3,641 | |||||||||||||||||||||||||
| Fixed Rate Bond, 5.25% cash due 9/30/2028 | 2,500 | 2,220 | 1,926 | ||||||||||||||||||||||||||
| 7,628 | 5,567 | ||||||||||||||||||||||||||||
| Associated Asphalt Partners, LLC | Construction Materials | ||||||||||||||||||||||||||||
| First Lien Term Loan, LIBOR+5.25% cash due 4/5/2024 | 8.06 | % | 2,501 | 2,331 | 1,934 | (6) | |||||||||||||||||||||||
| 2,331 | 1,934 | ||||||||||||||||||||||||||||
| Astra Acquisition Corp. | Application Software | ||||||||||||||||||||||||||||
| First Lien Term Loan, LIBOR+5.25% cash due 10/25/2028 | 8.37 | % | 5,640 | 5,482 | 4,822 | (6) | |||||||||||||||||||||||
| 5,482 | 4,822 | ||||||||||||||||||||||||||||
| athenahealth Group Inc. | Health Care Technology | ||||||||||||||||||||||||||||
| 18,635 Shares of Series A Preferred Stock in Minerva Holdco, Inc., 10.75% | 18,264 | 16,575 | (15) | ||||||||||||||||||||||||||
| 18,264 | 16,575 | ||||||||||||||||||||||||||||
| Athenex, Inc. | Pharmaceuticals | ||||||||||||||||||||||||||||
| First Lien Term Loan, 11.00% cash due 6/19/2026 | 13,346 | 12,929 | 12,812 | (11)(15) | |||||||||||||||||||||||||
| First Lien Revenue Interest Financing Term Loan due 5/31/2031 | 8,309 | 8,264 | 8,309 | (11)(15) | |||||||||||||||||||||||||
| 328,149 Common Stock Warrants (exercise price $0.4955) expiration date 6/19/2027 | 973 | 16 | (11)(15) | ||||||||||||||||||||||||||
| 22,166 | 21,137 | ||||||||||||||||||||||||||||
| Aurora Lux Finco S.À.R.L. | Airport Services | ||||||||||||||||||||||||||||
| First Lien Term Loan, LIBOR+6.00% cash due 12/24/2026 | 8.78 | % | 22,425 | 22,086 | 21,326 | (6)(11)(15) | |||||||||||||||||||||||
| 22,086 | 21,326 | ||||||||||||||||||||||||||||
| The Avery | Real Estate Operating Companies | ||||||||||||||||||||||||||||
| First Lien Term Loan in T8 Urban Condo Owner, LLC, LIBOR+7.30% cash due 2/17/2023 | 10.44 | % | 15,674 | 15,605 | 15,682 | (6)(15) | |||||||||||||||||||||||
| Subordinated Debt in T8 Senior Mezz LLC, LIBOR+12.50% cash due 2/17/2023 | 16.17 | % | 3,789 | 3,774 | 3,800 | (6)(15) | |||||||||||||||||||||||
| 19,379 | 19,482 | ||||||||||||||||||||||||||||
| BAART Programs, Inc. | Health Care Services | ||||||||||||||||||||||||||||
| First Lien Delayed Draw Term Loan, LIBOR+5.00% cash due 6/11/2027 | 8.12 | % | 2,546 | 2,503 | 2,395 | (6)(15)(19) | |||||||||||||||||||||||
| Second Lien Term Loan, LIBOR+8.50% cash due 6/11/2028 | 11.62 | % | 7,166 | 7,059 | 6,915 | (6)(15) | |||||||||||||||||||||||
| Second Lien Delayed Draw Term Loan, LIBOR+8.50% cash due 6/11/2028 | 11.62 | % | 4,227 | 4,070 | 3,839 | (6)(15)(19) | |||||||||||||||||||||||
| 13,632 | 13,149 | ||||||||||||||||||||||||||||
| Portfolio Company/Type of Investment (1)(2)(5)(9)(14) | Cash Interest Rate (13) | Industry | Principal (8) | Cost | Fair Value | ||||||||||||
| RCPDirect, L.P. | Multi-sector holdings | ||||||||||||||||
| 0.9% limited partnership interest (11) | $ | 354 | $ | 559 | |||||||||||||
| 354 | 559 | ||||||||||||||||
| Riverside Fund V, L.P. | Multi-sector holdings | ||||||||||||||||
| 0.48% limited partnership interest (11) | 1,452 | 1,405 | |||||||||||||||
| 1,452 | 1,405 | ||||||||||||||||
| ACON Equity Partners III, LP | Multi-sector holdings | ||||||||||||||||
| 0.13% limited partnership interest (11) | 785 | 962 | |||||||||||||||
| 785 | 962 | ||||||||||||||||
| BMC Acquisition, Inc. | Other diversified financial services | ||||||||||||||||
| 500 Series A Preferred Shares | 500 | 763 | |||||||||||||||
| 50,000 Common Shares (6) | 1 | 67 | |||||||||||||||
| 501 | 830 | ||||||||||||||||
| Edmentum, Inc. | Education services | ||||||||||||||||
| Unsecured Senior PIK Note, 8.5% PIK due 6/9/2020 | $ | 2,434 | 2,434 | 1,922 | |||||||||||||
| Unsecured Junior PIK Note, 10% PIK due 6/9/2020 | 11,304 | 10,227 | 379 | ||||||||||||||
| Unsecured Revolver, 5% cash due 6/9/2020 | — | — | |||||||||||||||
| 126,127.80 Class A Common Units | 126 | — | |||||||||||||||
| 12,787 | 2,301 | ||||||||||||||||
| I Drive Safely, LLC | Education services | ||||||||||||||||
| 125,079 Class A Common Units of IDS Investments, LLC | 1,000 | — | |||||||||||||||
| 1,000 | — | ||||||||||||||||
| Yeti Acquisition, LLC | Leisure products | ||||||||||||||||
| 3,000,000 Common Stock Units of Yeti Holdings, Inc. | — | 5,900 | |||||||||||||||
| — | 5,900 | ||||||||||||||||
| Vitalyst Holdings, Inc. | IT consulting & other services | ||||||||||||||||
| 675 Series A Preferred Units of PCH Support Holdings, Inc., 10% | 675 | 511 | |||||||||||||||
| 7,500 Class A Common Stock Units of PCH Support Holdings, Inc. | 75 | — | |||||||||||||||
| 750 | 511 | ||||||||||||||||
| Beecken Petty O'Keefe Fund IV, L.P. | Multi-sector holdings | ||||||||||||||||
| 0.5% limited partnership interest (11) | 1,014 | 1,310 | |||||||||||||||
| 1,014 | 1,310 | ||||||||||||||||
| Comprehensive Pharmacy Services LLC | Pharmaceuticals | ||||||||||||||||
| 20,000 Common Shares in MCP CPS Group Holdings, Inc. | 2,000 | 2,776 | |||||||||||||||
| 2,000 | 2,776 | ||||||||||||||||
| Garretson Firm Resolution Group, Inc. | Diversified support services | ||||||||||||||||
| First Lien Revolver, PRIME+5.5% cash due 5/22/2020 (13) | 9.75 | % | 25 | 25 | 25 | ||||||||||||
| 4,950,000 Preferred Units in GRG Holdings, LP, 8% | 495 | 198 | |||||||||||||||
| 50,000 Common Units in GRG Holdings, LP | 5 | — | |||||||||||||||
| 525 | 223 | ||||||||||||||||
| Teaching Strategies, LLC | Education services | ||||||||||||||||
| Second Lien Term Loan, LIBOR+9.5% (1% floor) cash due 8/27/2023 (13) | 10.83 | % | 33,500 | 33,500 | 33,964 | ||||||||||||
| 33,500 | 33,964 | ||||||||||||||||
| Portfolio Company/Type of Investment (1)(2)(3)(4)(5) | Cash Interest Rate (6) | Industry | Principal (7) | Cost | Fair Value | Notes | |||||||||||||||||||||||
| Berner Food & Beverage, LLC | Soft Drinks | ||||||||||||||||||||||||||||
| First Lien Term Loan, LIBOR+5.50% cash due 7/30/2027 | 8.31 | % | $ | 33,078 | $ | 32,612 | $ | 32,053 | (6)(15) | ||||||||||||||||||||
| First Lien Revolver, PRIME+4.50% cash due 7/30/2026 | 10.75 | % | 1,702 | 1,660 | 1,617 | (6)(15)(19) | |||||||||||||||||||||||
| 34,272 | 33,670 | ||||||||||||||||||||||||||||
| BioXcel Therapeutics, Inc. | Pharmaceuticals | ||||||||||||||||||||||||||||
| First Lien Term Loan, 10.25% cash due 4/19/2027 | 5,322 | 5,111 | 5,114 | (11)(15) | |||||||||||||||||||||||||
| First Lien Delayed Draw Term Loan, 10.25% cash due 4/19/2027 | — | — | — | (11)(15)(19) | |||||||||||||||||||||||||
| First Lien Revenue Interest Financing Term Loan due 9/30/2032 | 2,353 | 2,353 | 2,353 | (11)(15) | |||||||||||||||||||||||||
| First Lien Revenue Interest Financing Delayed Draw Term Loan due 9/30/2032 | — | — | — | (11)(15)(19) | |||||||||||||||||||||||||
| 21,177 Common Stock Warrants (exercise price $20.04) expiration date 4/19/2029 | 125 | 98 | (11)(15) | ||||||||||||||||||||||||||
| 7,589 | 7,565 | ||||||||||||||||||||||||||||
| Blackhawk Network Holdings, Inc. | Data Processing & Outsourced Services | ||||||||||||||||||||||||||||
| Second Lien Term Loan, LIBOR+7.00% cash due 6/15/2026 | 9.50 | % | 30,625 | 30,276 | 29,017 | (6) | |||||||||||||||||||||||
| 30,276 | 29,017 | ||||||||||||||||||||||||||||
| Blumenthal Temecula, LLC | Automotive Retail | ||||||||||||||||||||||||||||
| First Lien Term Loan, 9.00% cash due 9/24/2023 | 3,979 | 3,980 | 3,960 | (15) | |||||||||||||||||||||||||
| 1,293,324 Preferred Units in Unstoppable Automotive AMV, LLC | 1,293 | 1,280 | (15) | ||||||||||||||||||||||||||
| 298,460 Preferred Units in Unstoppable Automotive VMV, LLC | 298 | 295 | (15) | ||||||||||||||||||||||||||
| 298,460 Common Units in Unstoppable Automotive AMV, LLC | 298 | 349 | (15) | ||||||||||||||||||||||||||
| 5,869 | 5,884 | ||||||||||||||||||||||||||||
| Cadence Aerospace, LLC | Aerospace & Defense | ||||||||||||||||||||||||||||
| First Lien Term Loan, LIBOR+6.50% cash 2.00% PIK due 11/14/2023 | 9.31 | % | 14,294 | 13,471 | 13,143 | (6)(15) | |||||||||||||||||||||||
| 13,471 | 13,143 | ||||||||||||||||||||||||||||
| Carvana Co. | Automotive Retail | ||||||||||||||||||||||||||||
| Fixed Rate Bond, 5.625% cash due 10/1/2025 | 6,700 | 5,825 | 4,724 | (11) | |||||||||||||||||||||||||
| 5,825 | 4,724 | ||||||||||||||||||||||||||||
| CCO Holdings LLC | Cable & Satellite | ||||||||||||||||||||||||||||
| Fixed Rate Bond, 4.50% cash due 5/1/2032 | 2,097 | 1,746 | 1,603 | (11) | |||||||||||||||||||||||||
| 1,746 | 1,603 | ||||||||||||||||||||||||||||
| CircusTrix Holdings, LLC | Leisure Facilities | ||||||||||||||||||||||||||||
| First Lien Term Loan, LIBOR+5.50% cash due 7/16/2023 | 8.62 | % | 10,692 | 10,004 | 10,209 | (6)(15) | |||||||||||||||||||||||
| 10,004 | 10,209 | ||||||||||||||||||||||||||||
| CITGO Holding, Inc. | Oil & Gas Refining & Marketing | ||||||||||||||||||||||||||||
| Fixed Rate Bond, 9.25% cash due 8/1/2024 | 7,857 | 7,857 | 7,807 | ||||||||||||||||||||||||||
| 7,857 | 7,807 | ||||||||||||||||||||||||||||
| CITGO Petroleum Corp. | Oil & Gas Refining & Marketing | ||||||||||||||||||||||||||||
| First Lien Term Loan, LIBOR+6.25% cash due 3/28/2024 | 9.37 | % | 795 | 770 | 797 | (6) | |||||||||||||||||||||||
| 770 | 797 | ||||||||||||||||||||||||||||
| Clear Channel Outdoor Holdings Inc. | Advertising | ||||||||||||||||||||||||||||
| Fixed Rate Bond, 7.50% cash due 6/1/2029 | 4,311 | 4,311 | 3,132 | (11) | |||||||||||||||||||||||||
| Fixed Rate Bond, 5.125% cash due 8/15/2027 | 1,374 | 1,229 | 1,163 | (11) | |||||||||||||||||||||||||
| Fixed Rate Bond, 7.75% cash due 4/15/2028 | 676 | 648 | 512 | (11) | |||||||||||||||||||||||||
| 6,188 | 4,807 | ||||||||||||||||||||||||||||
| Condor Merger Sub Inc. | Systems Software | ||||||||||||||||||||||||||||
| Fixed Rate Bond, 7.375% cash due 2/15/2030 | 8,420 | 8,243 | 6,900 | ||||||||||||||||||||||||||
| 8,243 | 6,900 | ||||||||||||||||||||||||||||
| Continental Intermodal Group LP | Oil & Gas Storage & Transportation | ||||||||||||||||||||||||||||
| First Lien Term Loan, LIBOR+8.50% cash due 1/28/2025 | 11.62 | % | 22,537 | 21,642 | 20,396 | (6)(15) | |||||||||||||||||||||||
| Common Stock Warrants expiration date 7/28/2025 | 648 | 457 | (15) | ||||||||||||||||||||||||||
| 22,290 | 20,853 | ||||||||||||||||||||||||||||
| Portfolio Company/Type of Investment (1)(2)(5)(9)(14) | Cash Interest Rate (13) | Industry | Principal (8) | Cost | Fair Value | ||||||||||||
| Dominion Diagnostics, LLC | Healthcare services | ||||||||||||||||
| Subordinated Term Loan, 11% cash 1% PIK due 10/8/2019 | $ | 19,866 | $ | 17,625 | $ | 8,534 | |||||||||||
| First Lien Term Loan, LIBOR+5% (1% floor) cash due 4/8/2019 (13) | 6.30 | % | 49,414 | 37,574 | 44,592 | ||||||||||||
| First Lien Revolver, LIBOR+5% (1% floor) cash due 4/8/2019 (13) | 6.30 | % | — | — | |||||||||||||
| 55,199 | 53,126 | ||||||||||||||||
| Sterling Capital Partners IV, L.P. | Multi-sector holdings | ||||||||||||||||
| 0.2% limited partnership interest (11) | 1,770 | 1,297 | |||||||||||||||
| 1,770 | 1,297 | ||||||||||||||||
| Advanced Pain Management | Healthcare services | ||||||||||||||||
| First Lien Term Loan, LIBOR+8.5% (1.25% floor) cash due 2/26/2018 (13) | 9.75 | % | 24,000 | 23,409 | 1,157 | ||||||||||||
| 23,409 | 1,157 | ||||||||||||||||
| TravelClick, Inc. | Internet software & services | ||||||||||||||||
| Second Lien Term Loan, LIBOR+7.75% (1% floor) cash due 11/6/2021 (13) | 8.99 | % | 2,697 | 2,475 | 2,710 | ||||||||||||
| 2,475 | 2,710 | ||||||||||||||||
| Pingora MSR Opportunity Fund I-A, LP | Thrift & mortgage finance | ||||||||||||||||
| 1.86% limited partnership interest (11) | 7,240 | 6,129 | |||||||||||||||
| 7,240 | 6,129 | ||||||||||||||||
| Credit Infonet, Inc. | Data processing & outsourced services | ||||||||||||||||
| Subordinated Term Loan, 12.25% cash 0.75% PIK due 10/26/2020 | 13,940 | 13,940 | 13,941 | ||||||||||||||
| 13,940 | 13,941 | ||||||||||||||||
| HealthEdge Software, Inc. | Application software | ||||||||||||||||
| 482,453 Series A-3 Preferred Stock Warrants (exercise price $1.450918) expiration date 9/30/2023 | 213 | 768 | |||||||||||||||
| 213 | 768 | ||||||||||||||||
| InMotion Entertainment Group, LLC | Consumer electronics | ||||||||||||||||
| First Lien Term Loan A, LIBOR+7.75% (1.25% floor) cash due 10/1/2018 (13) | 9.09 | % | 12,259 | 12,223 | 12,259 | ||||||||||||
| First Lien Term Loan B, LIBOR+7.75% (1.25% floor) cash due 10/1/2018 (13) | 9.09 | % | 5,344 | 5,265 | 5,344 | ||||||||||||
| First Lien Revolver, LIBOR+6.25% cash due 10/1/2018 (13) | 6.25 | % | 3,904 | 3,897 | 3,904 | ||||||||||||
| CapEx Line, LIBOR+7.75% (1.25% floor) cash due 10/1/2018 (13) | 9.09 | % | 797 | 789 | 797 | ||||||||||||
| 1,000,000 Class A Units in InMotion Entertainment Holdings, LLC | 1,000 | 1,761 | |||||||||||||||
| 23,174 | 24,065 | ||||||||||||||||
| Thing5, LLC | Data processing & outsourced services | ||||||||||||||||
| First Lien Term Loan, LIBOR+7.5% (1% floor) cash 2% PIK due 10/11/2020 (12)(13) | 8.83 | % | 47,530 | 47,530 | 40,900 | ||||||||||||
| First Lien Revolver, LIBOR+7.5% (1% floor) cash due 10/11/2020 (13) | 8.83 | % | 1,000 | 1,000 | 1,000 | ||||||||||||
| 2,000,000 Units in T5 Investment Vehicle, LLC | 2,000 | — | |||||||||||||||
| 50,530 | 41,900 | ||||||||||||||||
| Kason Corporation | Industrial machinery | ||||||||||||||||
| Mezzanine Term Loan, 11.5% cash 1.75% PIK due 10/28/2019 | 6,006 | 6,006 | 5,850 | ||||||||||||||
| 498.6 Class A Preferred Units in Kason Investment, LLC, 8% | 499 | 569 | |||||||||||||||
| 5,540 Class A Common Units in Kason Investment, LLC | 55 | — | |||||||||||||||
| 6,560 | 6,419 | ||||||||||||||||
| SPC Partners V, L.P. | Multi-sector holdings | ||||||||||||||||
| 0.571% limited partnership interest (11) | 1,762 | 1,857 | |||||||||||||||
| 1,762 | 1,857 | ||||||||||||||||
| Portfolio Company/Type of Investment (1)(2)(3)(4)(5) | Cash Interest Rate (6) | Industry | Principal (7) | Cost | Fair Value | Notes | |||||||||||||||||||||||
| Convergeone Holdings, Inc. | IT Consulting & Other Services | ||||||||||||||||||||||||||||
| First Lien Term Loan, LIBOR+5.00% cash due 1/4/2026 | 8.12 | % | $ | 11,913 | $ | 11,697 | $ | 8,596 | (6) | ||||||||||||||||||||
| 11,697 | 8,596 | ||||||||||||||||||||||||||||
| Conviva Inc. | Application Software | ||||||||||||||||||||||||||||
| 517,851 Shares of Series D Preferred Stock | 605 | 894 | (15) | ||||||||||||||||||||||||||
| 605 | 894 | ||||||||||||||||||||||||||||
| CorEvitas, LLC | Health Care Technology | ||||||||||||||||||||||||||||
| First Lien Term Loan, SOFR+5.75% cash due 12/13/2025 | 8.88 | % | 13,712 | 13,554 | 13,583 | (6)(15) | |||||||||||||||||||||||
| First Lien Revolver, PRIME+4.75% cash due 12/13/2025 | 11.00 | % | 916 | 898 | 898 | (6)(15)(19) | |||||||||||||||||||||||
| 1,099 Class A2 Common Units in CorEvitas Holdings, L.P. | 690 | 2,340 | (15) | ||||||||||||||||||||||||||
| 15,142 | 16,821 | ||||||||||||||||||||||||||||
| Covetrus, Inc. | Health Care Distributors | ||||||||||||||||||||||||||||
| First Lien Term Loan, SOFR+5.00% cash due 9/20/2029 | 7.65 | % | 10,336 | 9,716 | 9,681 | (6) | |||||||||||||||||||||||
| 9,716 | 9,681 | ||||||||||||||||||||||||||||
| Coyote Buyer, LLC | Specialty Chemicals | ||||||||||||||||||||||||||||
| First Lien Term Loan, LIBOR+6.00% cash due 2/6/2026 | 8.81 | % | 18,200 | 17,790 | 17,843 | (6)(15) | |||||||||||||||||||||||
| First Lien Revolver, LIBOR+6.00% cash due 2/6/2025 | — | (13) | (26) | (6)(15)(19) | |||||||||||||||||||||||||
| 17,777 | 17,817 | ||||||||||||||||||||||||||||
| Delivery Hero FinCo LLC | Internet & Direct Marketing Retail | ||||||||||||||||||||||||||||
| First Lien Term Loan, SOFR+5.75% cash due 8/12/2027 | 8.49 | % | 4,988 | 4,882 | 4,757 | (6)(11) | |||||||||||||||||||||||
| 4,882 | 4,757 | ||||||||||||||||||||||||||||
| Delta Leasing SPV II LLC | Specialized Finance | ||||||||||||||||||||||||||||
| Subordinated Delayed Draw Term Loan, 10.00% cash due 8/31/2029 | 4,183 | 4,183 | 4,183 | (11)(15)(19) | |||||||||||||||||||||||||
| 419 Series C Preferred Units in Delta Financial Holdings LLC | 419 | 419 | (11)(15) | ||||||||||||||||||||||||||
| 2.09 Common Units in Delta Financial Holdings LLC | 2 | 2 | (11)(15) | ||||||||||||||||||||||||||
| 31.37 Common Warrants (exercise price $1.00) | — | — | (11)(15) | ||||||||||||||||||||||||||
| 4,604 | 4,604 | ||||||||||||||||||||||||||||
| Delta Topco, Inc. | Systems Software | ||||||||||||||||||||||||||||
| Second Lien Term Loan, LIBOR+7.25% cash due 12/1/2028 | 9.34 | % | 6,680 | 6,647 | 5,934 | (6) | |||||||||||||||||||||||
| 6,647 | 5,934 | ||||||||||||||||||||||||||||
| Dialyze Holdings, LLC | Health Care Equipment | ||||||||||||||||||||||||||||
| First Lien Term Loan, LIBOR+9.00% cash 2.00% PIK due 8/4/2026 | 12.67 | % | 24,396 | 23,083 | 22,993 | (6)(15) | |||||||||||||||||||||||
| First Lien Delayed Draw Term Loan, LIBOR+9.00% cash 2.00% PIK due 8/4/2026 | — | (135) | (129) | (6)(15)(19) | |||||||||||||||||||||||||
| 5,403,823 Class A Warrants (exercise price $1.00) expiration date 8/4/2028 | 1,405 | 1,297 | (15) | ||||||||||||||||||||||||||
| 24,353 | 24,161 | ||||||||||||||||||||||||||||
| Digital.AI Software Holdings, Inc. | Application Software | ||||||||||||||||||||||||||||
| First Lien Term Loan, LIBOR+7.00% cash due 2/10/2027 | 9.91 | % | 9,902 | 9,599 | 9,793 | (6)(15) | |||||||||||||||||||||||
| First Lien Revolver, LIBOR+6.50% cash due 2/10/2027 | 9.41 | % | 251 | 228 | 239 | (6)(15)(19) | |||||||||||||||||||||||
| 9,827 | 10,032 | ||||||||||||||||||||||||||||
| DirecTV Financing, LLC | Cable & Satellite | ||||||||||||||||||||||||||||
| First Lien Term Loan, LIBOR+5.00% cash due 8/2/2027 | 8.12 | % | 19,242 | 18,970 | 17,973 | (6) | |||||||||||||||||||||||
| 18,970 | 17,973 | ||||||||||||||||||||||||||||
| DTI Holdco, Inc. | Research & Consulting Services | ||||||||||||||||||||||||||||
| First Lien Term Loan, SOFR+4.75% cash due 4/26/2029 | 7.33 | % | 5,000 | 4,906 | 4,760 | (6) | |||||||||||||||||||||||
| 4,906 | 4,760 | ||||||||||||||||||||||||||||
| Eagleview Technology Corporation | Application Software | ||||||||||||||||||||||||||||
| Second Lien Term Loan, LIBOR+7.50% cash due 8/14/2026 | 11.17 | % | 8,974 | 8,884 | 8,503 | (6)(15) | |||||||||||||||||||||||
| 8,884 | 8,503 | ||||||||||||||||||||||||||||
| Portfolio Company/Type of Investment (1)(2)(5)(9)(14) | Cash Interest Rate (13) | Industry | Principal (8) | Cost | Fair Value | ||||||||||||
| P2 Upstream Acquisition Co. | Application software | ||||||||||||||||
| First Lien Revolver, LIBOR+4% (1% floor) cash due 11/1/2018 (10)(13) | 5.33 | % | $ | — | $ | (238 | ) | ||||||||||
| — | (238 | ) | |||||||||||||||
| OmniSYS Acquisition Corporation | Diversified support services | ||||||||||||||||
| First Lien Term Loan, LIBOR+7.5% (1% floor) cash due 11/21/2018 (13) | 8.83 | % | $ | 5,500 | 5,495 | 5,468 | |||||||||||
| First Lien Revolver, LIBOR+7.5% (1% floor) cash due 11/21/2018 (10)(13) | 8.83 | % | — | (15 | ) | ||||||||||||
| 100,000 Common Units in OSYS Holdings, LLC | 1,000 | 903 | |||||||||||||||
| 6,495 | 6,356 | ||||||||||||||||
| Moelis Capital Partners Opportunity Fund I-B, LP | Multi-sector holdings | ||||||||||||||||
| 1.0% limited partnership interest (11) | 1,045 | 1,457 | |||||||||||||||
| 1,045 | 1,457 | ||||||||||||||||
| Aden & Anais Merger Sub, Inc. | Apparel, accessories & luxury goods | ||||||||||||||||
| 51,645 Common Units in Aden & Anais Holdings, Inc. | 5,165 | 1,241 | |||||||||||||||
| 5,165 | 1,241 | ||||||||||||||||
| Lift Brands, Inc. | Leisure facilities | ||||||||||||||||
| First Lien Term Loan, LIBOR+7.5% (1% floor) cash due 12/23/2019 (13) | 8.83 | % | 21,371 | 21,358 | 21,370 | ||||||||||||
| First Lien Revolver, LIBOR+7.5% (1% floor) cash due 12/23/2019 (10)(13) | 8.83 | % | (3 | ) | (1 | ) | |||||||||||
| 2,000,000 Class A Common Units in Snap Investments, LLC | 2,004 | 2,922 | |||||||||||||||
| 23,359 | 24,291 | ||||||||||||||||
| Tailwind Capital Partners II, L.P. | Multi-sector holdings | ||||||||||||||||
| 0.3% limited partnership interest (11) | 1,583 | 1,956 | |||||||||||||||
| 1,583 | 1,956 | ||||||||||||||||
| Long's Drugs Incorporated | Pharmaceuticals | ||||||||||||||||
| Second Lien Term Loan, LIBOR+11.25% cash due 2/19/2022 (13) | 12.49 | % | 26,909 | 26,909 | 27,447 | ||||||||||||
| 50 Series A Preferred Shares in Long's Drugs Incorporated | 813 | 1,267 | |||||||||||||||
| 27,722 | 28,714 | ||||||||||||||||
| Conviva Inc. | Application software | ||||||||||||||||
| 417,851 Series D Preferred Stock Warrants (exercise price $1.1966) expiration date 2/28/2021 | 105 | 169 | |||||||||||||||
| 105 | 169 | ||||||||||||||||
| OnCourse Learning Corporation | Education services | ||||||||||||||||
| 264,312 Class A Units in CIP OCL Investments, LLC | 2,726 | 1,988 | |||||||||||||||
| 2,726 | 1,988 | ||||||||||||||||
| ShareThis, Inc. | Internet software & services | ||||||||||||||||
| 345,452 Series C Preferred Stock Warrants (exercise price $3.0395) expiration date 3/4/2024 | 367 | 8 | |||||||||||||||
| 367 | 8 | ||||||||||||||||
| Aptean, Inc. | Internet software & services | ||||||||||||||||
| Second Lien Term Loan, LIBOR+9.5% (1% floor) cash due 12/20/2023 (13) | 10.84 | % | 5,900 | 5,821 | 5,952 | ||||||||||||
| 5,821 | 5,952 | ||||||||||||||||
| ExamSoft Worldwide, Inc. | Internet software & services | ||||||||||||||||
| 180,707 Class C Units in ExamSoft Investor LLC | 181 | 135 | |||||||||||||||
| 181 | 135 | ||||||||||||||||
| Portfolio Company/Type of Investment (1)(2)(3)(4)(5) | Cash Interest Rate (6) | Industry | Principal (7) | Cost | Fair Value | Notes | |||||||||||||||||||||||
| EOS Fitness Opco Holdings, LLC | Leisure Facilities | ||||||||||||||||||||||||||||
| 487.5 Class A Preferred Units, 12% | $ | 488 | $ | 966 | (15) | ||||||||||||||||||||||||
| 12,500 Class B Common Units | — | — | (15) | ||||||||||||||||||||||||||
| 488 | 966 | ||||||||||||||||||||||||||||
| Establishment Labs Holdings Inc. | Health Care Technology | ||||||||||||||||||||||||||||
| First Lien Term Loan, 3.00% cash 6.00% PIK due 4/21/2027 | $ | 10,418 | 10,275 | 10,231 | (11)(15) | ||||||||||||||||||||||||
| First Lien Delayed Draw Term Loan, 3.00% cash 6.00% PIK due 4/21/2027 | 3 | — | (11)(15)(19) | ||||||||||||||||||||||||||
| 10,278 | 10,231 | ||||||||||||||||||||||||||||
| Fairbridge Strategic Capital Funding LLC | Real Estate Operating Companies | (20) | |||||||||||||||||||||||||||
| First Lien Delayed Draw Term Loan, 9.00% cash due 12/24/2028 | 27,850 | 27,850 | 27,850 | (15)(19) | |||||||||||||||||||||||||
| 2,500 Warrant Units (exercise price $0.01) expiration date 11/24/2031 | — | 3 | (11)(15) | ||||||||||||||||||||||||||
| 27,850 | 27,853 | ||||||||||||||||||||||||||||
| FINThrive Software Intermediate Holdings, Inc. | Health Care Technology | ||||||||||||||||||||||||||||
| Second Lien Term Loan, LIBOR+6.75% cash due 12/17/2029 | 9.87 | % | 25,061 | 24,685 | 21,646 | (6) | |||||||||||||||||||||||
| 24,685 | 21,646 | ||||||||||||||||||||||||||||
| Fortress Biotech, Inc. | Biotechnology | ||||||||||||||||||||||||||||
| First Lien Term Loan, 11.00% cash due 8/27/2025 | 9,466 | 9,071 | 9,008 | (11)(15) | |||||||||||||||||||||||||
| 331,200 Common Stock Warrants (exercise price $3.20) expiration date 8/27/2030 | 405 | 66 | (11)(15) | ||||||||||||||||||||||||||
| 9,476 | 9,074 | ||||||||||||||||||||||||||||
| Frontier Communications Holdings, LLC | Integrated Telecommunication Services | ||||||||||||||||||||||||||||
| Fixed Rate Bond, 6.00% cash due 1/15/2030 | 4,881 | 4,420 | 3,845 | (11) | |||||||||||||||||||||||||
| 4,420 | 3,845 | ||||||||||||||||||||||||||||
| GKD Index Partners, LLC | Specialized Finance | ||||||||||||||||||||||||||||
| First Lien Term Loan, LIBOR+7.00% cash due 6/29/2023 | 10.67 | % | 25,128 | 24,915 | 24,851 | (6)(15) | |||||||||||||||||||||||
| First Lien Revolver, LIBOR+7.00% cash due 6/29/2023 | 10.60 | % | 1,280 | 1,268 | 1,262 | (6)(15)(19) | |||||||||||||||||||||||
| 26,183 | 26,113 | ||||||||||||||||||||||||||||
| Global Medical Response, Inc. | Health Care Services | ||||||||||||||||||||||||||||
| First Lien Term Loan, LIBOR+4.25% cash due 3/14/2025 | 7.37 | % | 5,572 | 5,435 | 4,848 | (6) | |||||||||||||||||||||||
| 5,435 | 4,848 | ||||||||||||||||||||||||||||
| Grove Hotel Parcel Owner, LLC | Hotels, Resorts & Cruise Lines | ||||||||||||||||||||||||||||
| First Lien Term Loan, SOFR+8.00% cash due 6/21/2027 | 11.04 | % | 14,311 | 14,041 | 14,060 | (6)(15) | |||||||||||||||||||||||
| First Lien Delayed Draw Term Loan, SOFR+8.00% cash due 6/21/2027 | — | (54) | (50) | (6)(15)(19) | |||||||||||||||||||||||||
| First Lien Revolver, SOFR+8.00% cash due 6/21/2027 | — | (27) | (25) | (6)(15)(19) | |||||||||||||||||||||||||
| 13,960 | 13,985 | ||||||||||||||||||||||||||||
| Harbor Purchaser Inc. | Education Services | ||||||||||||||||||||||||||||
| First Lien Term Loan, SOFR+5.25% cash due 4/9/2029 | 8.38 | % | 9,392 | 9,080 | 8,582 | (6) | |||||||||||||||||||||||
| 9,080 | 8,582 | ||||||||||||||||||||||||||||
| iCIMs, Inc. | Application Software | ||||||||||||||||||||||||||||
| First Lien Term Loan, SOFR+6.75% cash due 8/18/2028 | 9.49 | % | 19,203 | 18,874 | 18,867 | (6)(15) | |||||||||||||||||||||||
| First Lien Delayed Draw Term Loan, SOFR+6.75% cash due 8/18/2028 | — | — | — | (6)(15)(19) | |||||||||||||||||||||||||
| First Lien Revolver, SOFR+6.75% cash due 8/18/2028 | — | (31) | (32) | (6)(15)(19) | |||||||||||||||||||||||||
| 18,843 | 18,835 | ||||||||||||||||||||||||||||
| Immucor, Inc. | Health Care Supplies | ||||||||||||||||||||||||||||
| First Lien Term Loan, LIBOR+5.75% cash due 7/2/2025 | 9.42 | % | 8,569 | 8,401 | 8,407 | (6)(15) | |||||||||||||||||||||||
| Second Lien Term Loan, LIBOR+8.00% cash 3.50% PIK due 10/2/2025 | 11.67 | % | 22,619 | 22,162 | 22,275 | (6)(15) | |||||||||||||||||||||||
| 30,563 | 30,682 | ||||||||||||||||||||||||||||
| Portfolio Company/Type of Investment (1)(2)(5)(9)(14) | Cash Interest Rate (13) | Industry | Principal (8) | Cost | Fair Value | ||||||||||||
| DigiCert, Inc. | Internet software & services | ||||||||||||||||
| Second Lien Term Loan, LIBOR+9% (1% floor) cash due 10/21/2022 (13) | 10.24 | % | $ | 61,500 | $ | 60,980 | $ | 61,500 | |||||||||
| 60,980 | 61,500 | ||||||||||||||||
| RCPDirect II, LP | Multi-sector holdings | ||||||||||||||||
| 0.4% limited partnership interest (11) | 617 | 719 | |||||||||||||||
| 617 | 719 | ||||||||||||||||
| Integral Development Corporation | Other diversified financial services | ||||||||||||||||
| First Lien Term Loan, LIBOR+9.5% (1% floor) cash due 7/10/2019 (13) | 10.80 | % | 11,500 | 11,466 | 10,815 | ||||||||||||
| 1,078,284 Common Stock Warrants (exercise price $0.9274) expiration date 7/10/2024 | 113 | — | |||||||||||||||
| 11,579 | 10,815 | ||||||||||||||||
| Loftware, Inc. | Internet software & services | ||||||||||||||||
| Mezzanine Term Loan, 11% cash 1% PIK due 7/18/2020 | 6,198 | 6,198 | 6,198 | ||||||||||||||
| 300,000 Class A Common Units in RPLF Holdings, LLC | 300 | 220 | |||||||||||||||
| 6,498 | 6,418 | ||||||||||||||||
| Webster Capital III, L.P. | Multi-sector holdings | ||||||||||||||||
| 0.754% limited partnership interest (11) | 1,020 | 1,296 | |||||||||||||||
| 1,020 | 1,296 | ||||||||||||||||
| L Squared Capital Partners LLC | Multi-sector holdings | ||||||||||||||||
| 2% limited partnership interest (11) | 2,660 | 2,660 | |||||||||||||||
| 2,660 | 2,660 | ||||||||||||||||
| BeyondTrust Software, Inc. | Application software | ||||||||||||||||
| First Lien Term Loan, LIBOR+7% (1% floor) cash due 9/25/2019 (13) | 8.33 | % | 26,677 | 26,174 | 26,676 | ||||||||||||
| First Lien Revolver, LIBOR+7% (1% floor) cash due 9/25/2019 (10)(13) | 8.33 | % | (54 | ) | — | ||||||||||||
| 4,500,000 Class A membership interests in BeyondTrust Holdings LLC | 4,500 | 5,660 | |||||||||||||||
| 30,620 | 32,336 | ||||||||||||||||
| GOBP Holdings Inc. | Food retail | ||||||||||||||||
| Second Lien Term Loan, LIBOR+8.25% (1% floor) cash due 10/21/2022 (13) | 9.58 | % | 4,214 | 4,176 | 4,251 | ||||||||||||
| 4,176 | 4,251 | ||||||||||||||||
| Kellermeyer Bergensons Services, LLC | Diversified support services | ||||||||||||||||
| Second Lien Term Loan, LIBOR+8.50% (1% floor) cash due 4/29/2022 (13) | 9.81 | % | 6,105 | 5,907 | 5,983 | ||||||||||||
| 5,907 | 5,983 | ||||||||||||||||
| Dodge Data & Analytics LLC | Data processing & outsourced services | ||||||||||||||||
| First Lien Term Loan, LIBOR+8.75% (1% floor) cash due 10/31/2019 (13) | 10.13 | % | 7,348 | 7,348 | 6,881 | ||||||||||||
| 500,000 Class A Common Units in Skyline Data, News and Analytics LLC | 500 | 202 | |||||||||||||||
| 7,848 | 7,083 | ||||||||||||||||
| Metamorph US 3, LLC | Internet software & services | ||||||||||||||||
| First Lien Term Loan, LIBOR+5.5% (1% floor) cash 2% PIK due 12/1/2020 (13) | 6.74 | % | 9,969 | 9,550 | 3,816 | ||||||||||||
| First Lien Revolver, LIBOR+6.5% (1% floor) cash due 12/1/2020 (10)(13) | 7.74 | % | 2,205 | 2,203 | (74 | ) | |||||||||||
| 11,753 | 3,742 | ||||||||||||||||
| Portfolio Company/Type of Investment (1)(2)(3)(4)(5) | Cash Interest Rate (6) | Industry | Principal (7) | Cost | Fair Value | Notes | |||||||||||||||||||||||
| Impel Neuropharma, Inc. | Health Care Technology | ||||||||||||||||||||||||||||
| First Lien Revenue Interest Financing Term Loan due 2/15/2031 | $ | 13,083 | $ | 13,083 | $ | 13,083 | (15) | ||||||||||||||||||||||
| First Lien Term Loan, SOFR+8.75% cash due 3/17/2027 | 12.45 | % | 12,161 | 11,944 | 11,942 | (6)(15) | |||||||||||||||||||||||
| 25,027 | 25,025 | ||||||||||||||||||||||||||||
| Innocoll Pharmaceuticals Limited | Health Care Technology | ||||||||||||||||||||||||||||
| First Lien Term Loan, 11.00% cash due 1/26/2027 | 6,817 | 6,553 | 6,408 | (11)(15) | |||||||||||||||||||||||||
| First Lien Delayed Draw Term Loan, 11.00% cash due 1/26/2027 | — | — | — | (11)(15)(19) | |||||||||||||||||||||||||
| 56,999 Tranche A Warrant Shares (exercise price $4.23) expiration date 1/26/2029 | 135 | 609 | (11)(15) | ||||||||||||||||||||||||||
| 6,688 | 7,017 | ||||||||||||||||||||||||||||
| Integral Development Corporation | Other Diversified Financial Services | ||||||||||||||||||||||||||||
| 1,078,284 Common Stock Warrants (exercise price $0.9274) expiration date 7/10/2024 | 113 | — | (15) | ||||||||||||||||||||||||||
| 113 | — | ||||||||||||||||||||||||||||
| Inventus Power, Inc. | Electrical Components & Equipment | ||||||||||||||||||||||||||||
| First Lien Term Loan, SOFR+5.00% cash due 3/29/2024 | 8.55 | % | 18,660 | 18,567 | 18,134 | (6)(15) | |||||||||||||||||||||||
| Second Lien Term Loan, LIBOR+8.50% cash due 9/29/2024 | 12.17 | % | 13,674 | 13,514 | 13,154 | (6)(15) | |||||||||||||||||||||||
| 32,081 | 31,288 | ||||||||||||||||||||||||||||
| INW Manufacturing, LLC | Personal Products | ||||||||||||||||||||||||||||
| First Lien Term Loan, LIBOR+5.75% cash due 3/25/2027 | 9.42 | % | 35,625 | 34,806 | 31,528 | (6)(15) | |||||||||||||||||||||||
| 34,806 | 31,528 | ||||||||||||||||||||||||||||
| IPC Corp. | Application Software | ||||||||||||||||||||||||||||
| First Lien Term Loan, LIBOR+6.50% cash due 10/1/2026 | 9.44 | % | 34,357 | 33,612 | 32,639 | (6)(15) | |||||||||||||||||||||||
| 33,612 | 32,639 | ||||||||||||||||||||||||||||
| Ivanti Software, Inc. | Application Software | ||||||||||||||||||||||||||||
| Second Lien Term Loan, LIBOR+7.25% cash due 12/1/2028 | 10.33 | % | 10,247 | 10,196 | 7,702 | (6) | |||||||||||||||||||||||
| 10,196 | 7,702 | ||||||||||||||||||||||||||||
| Jazz Acquisition, Inc. | Aerospace & Defense | ||||||||||||||||||||||||||||
| First Lien Term Loan, LIBOR+7.50% cash due 1/29/2027 | 10.62 | % | 36,234 | 35,170 | 36,392 | (6)(15) | |||||||||||||||||||||||
| Second Lien Term Loan, LIBOR+8.00% cash due 6/18/2027 | 11.12 | % | 528 | 478 | 481 | (6) | |||||||||||||||||||||||
| 35,648 | 36,873 | ||||||||||||||||||||||||||||
| Kings Buyer, LLC | Environmental & Facilities Services | ||||||||||||||||||||||||||||
| First Lien Term Loan, LIBOR+6.50% cash due 10/29/2027 | 10.17 | % | 13,623 | 13,487 | 13,351 | (6)(15) | |||||||||||||||||||||||
| First Lien Revolver, LIBOR+6.50% cash due 10/29/2027 | 10.17 | % | 329 | 311 | 292 | (6)(15)(19) | |||||||||||||||||||||||
| 13,798 | 13,643 | ||||||||||||||||||||||||||||
| LaserShip, Inc. | Air Freight & Logistics | ||||||||||||||||||||||||||||
| Second Lien Term Loan, LIBOR+7.50% cash due 5/7/2029 | 10.38 | % | 2,394 | 2,370 | 1,867 | (6)(15) | |||||||||||||||||||||||
| 2,370 | 1,867 | ||||||||||||||||||||||||||||
| Lift Brands Holdings, Inc. | Leisure Facilities | ||||||||||||||||||||||||||||
| 2,000,000 Class A Common Units in Snap Investments, LLC | 1,399 | — | (15) | ||||||||||||||||||||||||||
| 1,399 | — | ||||||||||||||||||||||||||||
| Lightbox Intermediate, L.P. | Real Estate Services | ||||||||||||||||||||||||||||
| First Lien Term Loan, LIBOR+5.00% cash due 5/9/2026 | 8.67 | % | 41,008 | 40,243 | 39,573 | (6)(15) | |||||||||||||||||||||||
| 40,243 | 39,573 | ||||||||||||||||||||||||||||
| Liquid Environmental Solutions Corporation | Environmental & Facilities Services | ||||||||||||||||||||||||||||
| Second Lien Term Loan, LIBOR+8.50% cash due 11/30/2026 | 11.38 | % | 4,357 | 4,285 | 4,226 | (6)(15) | |||||||||||||||||||||||
| Second Lien Delayed Draw Term Loan, LIBOR+8.50% cash due 11/30/2026 | 11.38 | % | 2,370 | 2,323 | 2,265 | (6)(15)(19) | |||||||||||||||||||||||
| 450.75 Class A2 Units in LES Group Holdings, L.P. | 451 | 451 | (15) | ||||||||||||||||||||||||||
| 7,059 | 6,942 | ||||||||||||||||||||||||||||
| Portfolio Company/Type of Investment (1)(2)(5)(9)(14) | Cash Interest Rate (13) | Industry | Principal (8) | Cost | Fair Value | ||||||||||||
| Schulman Associates Institutional Board Review, Inc. | Research & consulting services | ||||||||||||||||
| Second Lien Term Loan, LIBOR+8% (1% floor) cash due 6/3/2021 (13) | 9.30 | % | $ | 17,000 | $ | 17,000 | $ | 17,000 | |||||||||
| 17,000 | 17,000 | ||||||||||||||||
| Janrain, Inc. | Internet software & services | ||||||||||||||||
| 218,008 Common Stock Warrants (exercise price $1.3761) expiration date 12/5/2024 | 45 | — | |||||||||||||||
| 45 | — | ||||||||||||||||
| TigerText, Inc. | Internet software & services | ||||||||||||||||
| 299,110 Series B Preferred Stock Warrants (exercise price $1.3373) expiration date 12/8/2024 | 60 | 409 | |||||||||||||||
| 60 | 409 | ||||||||||||||||
| Survey Sampling International, LLC | Research & consulting services | ||||||||||||||||
| Second Lien Term Loan, LIBOR+9% (1% floor) cash due 12/16/2021 (13) | 10.27 | % | 18,700 | 18,475 | 18,513 | ||||||||||||
| 18,475 | 18,513 | ||||||||||||||||
| PSC Industrial Holdings Corp. | Diversified support services | ||||||||||||||||
| Second Lien Term Loan, LIBOR+8.25% (1% floor) cash due 12/3/2021 (13) | 9.49 | % | 7,000 | 6,839 | 7,000 | ||||||||||||
| 6,839 | 7,000 | ||||||||||||||||
| EOS Fitness Opco Holdings, LLC | Leisure facilities | ||||||||||||||||
| First Lien Term Loan, LIBOR+8.75% (0.75% floor) cash due 12/30/2019 (13) | 9.99 | % | 3,675 | 3,675 | 3,711 | ||||||||||||
| First Lien Revolver, LIBOR+8.75% (0.75% floor) cash due 12/30/2019 (13) | 9.99 | % | — | 50 | |||||||||||||
| 487.5 Class A Preferred Units, 12% | 488 | 678 | |||||||||||||||
| 12,500 Class B Common Units | 13 | 463 | |||||||||||||||
| 4,176 | 4,902 | ||||||||||||||||
| Motion Recruitment Partners LLC | Human resources & employment services | ||||||||||||||||
| First Lien Revolver, LIBOR+6% (1% floor) cash due 2/13/2020 (10)(13) | 7.24 | % | (6 | ) | — | ||||||||||||
| (6 | ) | — | |||||||||||||||
| WeddingWire, Inc. | Internet software & services | ||||||||||||||||
| First Lien Term Loan, LIBOR+8.5% (1% floor) cash due 2/20/2020 (13) | 9.84% | 25,781 | 25,781 | 25,911 | |||||||||||||
| First Lien Revolver, LIBOR+8.5% (1% floor) cash due 2/20/2020 (13) | 9.84 | % | — | 15 | |||||||||||||
| 483,645 Common Shares of WeddingWire, Inc. | 1,200 | 1,607 | |||||||||||||||
| 26,981 | 27,533 | ||||||||||||||||
| xMatters, Inc. | Internet software & services | ||||||||||||||||
| 600,000 Common Stock Warrants (exercise price $0.593333) expiration date 2/26/2025 | 709 | 368 | |||||||||||||||
| 709 | 368 | ||||||||||||||||
| Edge Fitness, LLC | Leisure facilities | ||||||||||||||||
| Delayed Draw Term Loan, LIBOR+7.75% (1% floor) cash due 6/30/2020 (13) | 9.05 | % | 3,398 | 3,398 | 3,397 | ||||||||||||
| 3,398 | 3,397 | ||||||||||||||||
| Golden State Medical Supply, Inc. | Pharmaceuticals | ||||||||||||||||
| Mezzanine Term Loan, 10% cash 2.5% PIK due 4/24/2021 | 15,001 | 15,001 | 14,835 | ||||||||||||||
| 15,001 | 14,835 | ||||||||||||||||
| AirStrip Technologies, Inc. | Internet software & services | ||||||||||||||||
| 22,858.71 Series C-1 Preferred Stock Warrants (exercise price $34.99757) expiration date 5/11/2025 | 90 | — | |||||||||||||||
| 90 | — | ||||||||||||||||
| Portfolio Company/Type of Investment (1)(2)(3)(4)(5) | Cash Interest Rate (6) | Industry | Principal (7) | Cost | Fair Value | Notes | |||||||||||||||||||||||
| LSL Holdco, LLC | Health Care Distributors | ||||||||||||||||||||||||||||
| First Lien Term Loan, LIBOR+6.00% cash due 1/31/2028 | 9.12 | % | $ | 19,236 | $ | 18,894 | $ | 18,707 | (6)(15) | ||||||||||||||||||||
| First Lien Revolver, LIBOR+6.00% cash due 1/31/2028 | 9.12 | % | 1,710 | 1,672 | 1,651 | (6)(15)(19) | |||||||||||||||||||||||
| 20,566 | 20,358 | ||||||||||||||||||||||||||||
| LTI Holdings, Inc. | Electronic Components | ||||||||||||||||||||||||||||
| Second Lien Term Loan, LIBOR+6.75% cash due 9/6/2026 | 9.87 | % | 2,140 | 2,092 | 1,890 | (6) | |||||||||||||||||||||||
| 2,092 | 1,890 | ||||||||||||||||||||||||||||
| Marinus Pharmaceuticals, Inc. | Pharmaceuticals | ||||||||||||||||||||||||||||
| First Lien Term Loan, 11.50% cash due 5/11/2026 | 17,203 | 16,954 | 16,644 | (11)(15) | |||||||||||||||||||||||||
| First Lien Delayed Draw Term Loan, 11.50% cash due 5/11/2026 | — | — | — | (11)(15)(19) | |||||||||||||||||||||||||
| 16,954 | 16,644 | ||||||||||||||||||||||||||||
| Mesoblast, Inc. | Biotechnology | ||||||||||||||||||||||||||||
| First Lien Term Loan, 8.00% cash 1.75% PIK due 11/19/2026 | 7,215 | 6,650 | 6,440 | (11)(15) | |||||||||||||||||||||||||
| First Lien Delayed Draw Term Loan, 8.00% cash 1.75% PIK due 11/19/2026 | — | 1 | — | (11)(15)(19) | |||||||||||||||||||||||||
| 209,588 Warrant Shares (exercise price $7.26) expiration date 11/19/2028 | 480 | 170 | (11)(15) | ||||||||||||||||||||||||||
| 7,131 | 6,610 | ||||||||||||||||||||||||||||
| MHE Intermediate Holdings, LLC | Diversified Support Services | ||||||||||||||||||||||||||||
| First Lien Term Loan, SOFR+6.00% cash due 7/21/2027 | 9.50 | % | 18,390 | 18,088 | 17,691 | (6)(15) | |||||||||||||||||||||||
| First Lien Revolver, SOFR+6.00% cash due 7/21/2027 | — | (23) | (54) | (6)(15)(19) | |||||||||||||||||||||||||
| 18,065 | 17,637 | ||||||||||||||||||||||||||||
| Mindbody, Inc. | Internet Services & Infrastructure | ||||||||||||||||||||||||||||
| First Lien Term Loan, LIBOR+7.00% cash 1.50% PIK due 2/14/2025 | 10.64 | % | 45,665 | 44,689 | 44,523 | (6)(15) | |||||||||||||||||||||||
| First Lien Revolver, LIBOR+8.00% cash due 2/14/2025 | — | (54) | (100) | (6)(15)(19) | |||||||||||||||||||||||||
| 44,635 | 44,423 | ||||||||||||||||||||||||||||
| Mosaic Companies, LLC | Home Improvement Retail | ||||||||||||||||||||||||||||
| First Lien Term Loan, LIBOR+6.75% cash due 7/2/2026 | 9.89 | % | 46,499 | 45,802 | 45,421 | (6)(15) | |||||||||||||||||||||||
| 45,802 | 45,421 | ||||||||||||||||||||||||||||
| MRI Software LLC | Application Software | ||||||||||||||||||||||||||||
| First Lien Term Loan, LIBOR+5.50% cash due 2/10/2026 | 9.17 | % | 29,565 | 29,128 | 28,734 | (6)(15) | |||||||||||||||||||||||
| First Lien Delayed Draw Term Loan, LIBOR+5.50% cash due 2/10/2026 | — | (12) | (96) | (6)(15)(19) | |||||||||||||||||||||||||
| First Lien Revolver, LIBOR+5.50% cash due 2/10/2026 | — | (13) | (51) | (6)(15)(19) | |||||||||||||||||||||||||
| 29,103 | 28,587 | ||||||||||||||||||||||||||||
| Navisite, LLC | Data Processing & Outsourced Services | ||||||||||||||||||||||||||||
| Second Lien Term Loan, LIBOR+8.50% cash due 12/30/2026 | 12.17 | % | 22,560 | 22,241 | 21,524 | (6)(15) | |||||||||||||||||||||||
| 22,241 | 21,524 | ||||||||||||||||||||||||||||
| NeuAG, LLC | Fertilizers & Agricultural Chemicals | ||||||||||||||||||||||||||||
| First Lien Term Loan, LIBOR+10.50% cash due 9/11/2024 | 14.17 | % | 50,459 | 49,301 | 51,972 | (6)(15) | |||||||||||||||||||||||
| 49,301 | 51,972 | ||||||||||||||||||||||||||||
| NFP Corp. | Other Diversified Financial Services | ||||||||||||||||||||||||||||
| Fixed Rate Bond 6.875% cash due 8/15/2028 | 10,191 | 9,773 | 7,966 | ||||||||||||||||||||||||||
| 9,773 | 7,966 | ||||||||||||||||||||||||||||
| NN, Inc. | Industrial Machinery | ||||||||||||||||||||||||||||
| First Lien Term Loan, LIBOR+6.88% cash due 9/19/2026 | 9.99 | % | 58,713 | 57,655 | 56,805 | (6)(11)(15) | |||||||||||||||||||||||
| 57,655 | 56,805 | ||||||||||||||||||||||||||||
| OEConnection LLC | Application Software | ||||||||||||||||||||||||||||
| First Lien Term Loan, LIBOR+4.00% cash due 9/25/2026 | 7.12 | % | 3,323 | 3,162 | 3,207 | (6) | |||||||||||||||||||||||
| Second Lien Term Loan, LIBOR+7.00% cash due 9/25/2027 | 10.05 | % | 7,519 | 7,389 | 7,237 | (6)(15) | |||||||||||||||||||||||
| 10,551 | 10,444 | ||||||||||||||||||||||||||||
| Portfolio Company/Type of Investment (1)(2)(5)(9)(14) | Cash Interest Rate (13) | Industry | Principal (8) | Cost | Fair Value | ||||||||||||
| Access Medical Acquisition, Inc. | Healthcare services | ||||||||||||||||
| 450,000 Shares of Class A Common Stock in CMG Holding Company, LLC (6) | $ | 151 | $ | 970 | |||||||||||||
| 151 | 970 | ||||||||||||||||
| QuorumLabs, Inc. | Internet software & services | ||||||||||||||||
| 2,727,939 Common Stock Warrants (exercise price $0.0001) expiration date 7/8/2025 | 375 | — | |||||||||||||||
| 375 | — | ||||||||||||||||
| Poseidon Merger Sub, Inc. | Advertising | ||||||||||||||||
| Second Lien Term Loan, LIBOR+8.5% (1% floor) cash due 8/15/2023 (13) | 9.81 | % | $ | 30,000 | 29,101 | 30,300 | |||||||||||
| 29,101 | 30,300 | ||||||||||||||||
| Valet Merger Sub, Inc. | Environmental & facilities services | ||||||||||||||||
| First Lien Term Loan, LIBOR+7% (1% floor) cash due 9/24/2021 (13) | 8.24 | % | 50,661 | 50,016 | 50,660 | ||||||||||||
| First Lien Revolver, LIBOR+7% (1% floor) cash due 9/24/2021 (10)(13) | 8.24 | % | — | (115 | ) | — | |||||||||||
| 49,901 | 50,660 | ||||||||||||||||
| Argon Medical Devices, Inc. | Healthcare equipment | ||||||||||||||||
| Second Lien Term Loan, LIBOR+9.5% (1% floor) cash due 6/23/2022 (13) | 10.74 | % | 43,000 | 43,000 | 43,002 | ||||||||||||
| 43,000 | 43,002 | ||||||||||||||||
| Lytx, Inc. | Research & consulting services | ||||||||||||||||
| 3,500 Class A Units in Lytx Holdings, LLC | 2,478 | 2,459 | |||||||||||||||
| 3,500 Class B Units in Lytx Holdings, LLC | — | 559 | |||||||||||||||
| 2,478 | 3,018 | ||||||||||||||||
| Onvoy, LLC | Integrated telecommunication services | ||||||||||||||||
| Second Lien Term Loan, LIBOR+10.5% (1% floor) cash due 2/10/2025 (13) | 11.83 | % | 16,750 | 16,750 | 16,704 | ||||||||||||
| 19,666.67 Class A Units in GTCR Onvoy Holdings, LLC | 1,967 | 2,088 | |||||||||||||||
| 13,664.73 Series 3 Class B Units in GTCR Onvoy Holdings, LLC | — | — | |||||||||||||||
| 18,717 | 18,792 | ||||||||||||||||
| 4 Over International, LLC | Commercial printing | ||||||||||||||||
| First Lien Term Loan, LIBOR+6% (1% floor) cash due 6/7/2022 (13) | 7.24 | % | 6,045 | 6,001 | 6,045 | ||||||||||||
| First Lien Revolver, LIBOR+6% (1% floor) cash due 6/7/2021 (10)(13) | 7.24 | % | (17 | ) | — | ||||||||||||
| 5,984 | 6,045 | ||||||||||||||||
| Ping Identity Corporation | Internet software & services | ||||||||||||||||
| First Lien Term Loan, LIBOR+9.25% (1% floor) cash due 6/30/2021 (13) | 10.49 | % | 42,500 | 41,557 | 43,176 | ||||||||||||
| First Lien Revolver, LIBOR+9.25% (1% floor) cash due 6/30/2021 (10)(13) | 10.49 | % | (55 | ) | 40 | ||||||||||||
| 41,502 | 43,216 | ||||||||||||||||
| Ancile Solutions, Inc. | Internet software & services | ||||||||||||||||
| First Lien Term Loan, LIBOR+7% (1% floor) cash due 6/30/2021 (13) | 8.33 | % | 10,330 | 10,104 | 10,248 | ||||||||||||
| 10,104 | 10,248 | ||||||||||||||||
| Portfolio Company/Type of Investment (1)(2)(3)(4)(5) | Cash Interest Rate (6) | Industry | Principal (7) | Cost | Fair Value | Notes | |||||||||||||||||||||||
| OTG Management, LLC | Airport Services | ||||||||||||||||||||||||||||
| First Lien Term Loan, LIBOR+2.00% cash 8.00% PIK due 9/1/2025 | 5.08 | % | $ | 21,557 | $ | 21,267 | $ | 21,557 | (6)(15) | ||||||||||||||||||||
| First Lien Delayed Draw Term Loan, LIBOR+2.00% cash 8.00% PIK due 9/1/2025 | — | (31) | — | (6)(15)(19) | |||||||||||||||||||||||||
| 21,236 | 21,557 | ||||||||||||||||||||||||||||
| P & L Development, LLC | Pharmaceuticals | ||||||||||||||||||||||||||||
| Fixed Rate Bond, 7.75% cash due 11/15/2025 | 7,776 | 7,820 | 5,846 | ||||||||||||||||||||||||||
| 7,820 | 5,846 | ||||||||||||||||||||||||||||
| Park Place Technologies, LLC | Internet Services & Infrastructure | ||||||||||||||||||||||||||||
| First Lien Term Loan, SOFR+5.00% cash due 11/10/2027 | 8.13 | % | 9,850 | 9,460 | 9,374 | (6) | |||||||||||||||||||||||
| 9,460 | 9,374 | ||||||||||||||||||||||||||||
| Performance Health Holdings, Inc. | Health Care Distributors | ||||||||||||||||||||||||||||
| First Lien Term Loan, LIBOR+6.00% cash due 7/12/2027 | 8.88 | % | 17,976 | 17,690 | 17,537 | (6)(15) | |||||||||||||||||||||||
| 17,690 | 17,537 | ||||||||||||||||||||||||||||
| PFNY Holdings, LLC | Leisure Facilities | ||||||||||||||||||||||||||||
| First Lien Term Loan, LIBOR+7.00% cash due 12/31/2026 | 9.28 | % | 26,154 | 25,712 | 25,893 | (6)(15) | |||||||||||||||||||||||
| First Lien Delayed Draw Term Loan, LIBOR+7.00% cash due 12/31/2026 | 9.25 | % | 2,228 | 2,186 | 2,203 | (6)(15)(19) | |||||||||||||||||||||||
| First Lien Revolver, LIBOR+7.00% cash due 12/31/2026 | — | (21) | (13) | (6)(15)(19) | |||||||||||||||||||||||||
| 27,877 | 28,083 | ||||||||||||||||||||||||||||
| Planview Parent, Inc. | Application Software | ||||||||||||||||||||||||||||
| Second Lien Term Loan, LIBOR+7.25% cash due 12/18/2028 | 10.92 | % | 28,627 | 28,198 | 27,482 | (6)(15) | |||||||||||||||||||||||
| 28,198 | 27,482 | ||||||||||||||||||||||||||||
| Pluralsight, LLC | Application Software | ||||||||||||||||||||||||||||
| First Lien Term Loan, LIBOR+8.00% cash due 4/6/2027 | 10.68 | % | 48,689 | 47,951 | 47,155 | (6)(15) | |||||||||||||||||||||||
| First Lien Revolver, LIBOR+8.00% cash due 4/6/2027 | — | (53) | (111) | (6)(15)(19) | |||||||||||||||||||||||||
| 47,898 | 47,044 | ||||||||||||||||||||||||||||
| PRGX Global, Inc. | Data Processing & Outsourced Services | ||||||||||||||||||||||||||||
| First Lien Term Loan, LIBOR+6.75% cash due 3/3/2026 | 10.42 | % | 33,775 | 32,931 | 33,116 | (6)(15) | |||||||||||||||||||||||
| First Lien Revolver, LIBOR+6.75% cash due 3/3/2026 | — | (34) | (49) | (6)(15)(19) | |||||||||||||||||||||||||
| 80,515 Class B Common Units | 79 | 89 | (15) | ||||||||||||||||||||||||||
| 32,976 | 33,156 | ||||||||||||||||||||||||||||
| Profrac Holdings II, LLC | Industrial Machinery | ||||||||||||||||||||||||||||
| First Lien Term Loan, SOFR+8.50% cash due 3/4/2025 | 10.01 | % | 23,275 | 22,722 | 22,810 | (6)(15) | |||||||||||||||||||||||
| 22,722 | 22,810 | ||||||||||||||||||||||||||||
| Project Boost Purchaser, LLC | Application Software | ||||||||||||||||||||||||||||
| Second Lien Term Loan, LIBOR+8.00% cash due 5/31/2027 | 11.12 | % | 5,250 | 5,168 | 5,047 | (6)(15) | |||||||||||||||||||||||
| 5,168 | 5,047 | ||||||||||||||||||||||||||||
| Quantum Bidco Limited | Food Distributors | ||||||||||||||||||||||||||||
| First Lien Term Loan, SONIA+6.00% cash due 1/29/2028 | 8.39 | % | £ | 3,501 | 4,646 | 3,367 | (6)(11)(15) | ||||||||||||||||||||||
| 4,646 | 3,367 | ||||||||||||||||||||||||||||
| QuorumLabs, Inc. | Application Software | ||||||||||||||||||||||||||||
| 64,887,669 Junior-2 Preferred Stock | 375 | — | (15) | ||||||||||||||||||||||||||
| 375 | — | ||||||||||||||||||||||||||||
| Radiology Partners Inc. | Health Care Distributors | ||||||||||||||||||||||||||||
| First Lien Term Loan, LIBOR+4.25% cash due 7/9/2025 | 7.33 | % | $ | 3,400 | 3,202 | 2,880 | (6) | ||||||||||||||||||||||
| Fixed Rate Bond, 9.25% cash due 2/1/2028 | 4,755 | 4,720 | 3,109 | ||||||||||||||||||||||||||
| 7,922 | 5,989 | ||||||||||||||||||||||||||||
| Relativity ODA LLC | Application Software | ||||||||||||||||||||||||||||
| First Lien Term Loan, LIBOR+7.50% PIK due 5/12/2027 | 24,692 | 24,265 | 24,101 | (6)(15) | |||||||||||||||||||||||||
| First Lien Revolver, LIBOR+6.50% cash due 5/12/2027 | — | (43) | (64) | (6)(15)(19) | |||||||||||||||||||||||||
| 24,222 | 24,037 | ||||||||||||||||||||||||||||
| Renaissance Holding Corp. | Diversified Banks | ||||||||||||||||||||||||||||
| Second Lien Term Loan, LIBOR+7.00% cash due 5/29/2026 | 10.12 | % | 3,542 | 3,515 | 3,402 | (6) | |||||||||||||||||||||||
| 3,515 | 3,402 | ||||||||||||||||||||||||||||
| Portfolio Company/Type of Investment (1)(2)(5)(9)(14) | Cash Interest Rate (13) | Industry | Principal (8) | Cost | Fair Value | ||||||||||||
| Ministry Brands, LLC | Internet software & services | ||||||||||||||||
| First Lien Term Loan, LIBOR+5% (1% floor) cash due 12/2/2022 (13) | 6.24 | % | $ | 3,891 | $ | 3,857 | $ | 3,891 | |||||||||
| First Lien Delayed Draw Term Loan, LIBOR+5% (1% floor) cash due 12/2/2022 (13) | 6.24 | % | 1,352 | 1,336 | 1,352 | ||||||||||||
| Second Lien Term Loan, LIBOR+9.25% (1% floor) cash due 6/2/2023 (13) | 10.49 | % | 7,056 | 6,964 | 7,056 | ||||||||||||
| Second Lien Delayed Draw Term Loan, LIBOR+9.25% (1% floor) cash due 6/2/2023 (13) | 10.49 | % | 1,944 | 1,918 | 1,944 | ||||||||||||
| First Lien Revolver LIBOR+5% (1% floor) cash due 12/2/2022 (10)(13) | 6.24 | % | — | (9 | ) | — | |||||||||||
| 14,066 | 14,243 | ||||||||||||||||
| Sailpoint Technologies, Inc. | Application software | ||||||||||||||||
| First Lien Term Loan, LIBOR+7% (1% floor) cash due 8/16/2021 (13) | 8.33 | % | 20,870 | 20,529 | 20,870 | ||||||||||||
| First Lien Revolver, LIBOR+7% (1% floor) cash due 8/16/2021 (10)(13) | 8.33 | % | (22 | ) | — | ||||||||||||
| 20,507 | 20,870 | ||||||||||||||||
| California Pizza Kitchen, Inc. | Restaurants | ||||||||||||||||
| First Lien Term Loan, LIBOR+6% (1% floor) cash due 8/23/2022 (13) | 7.24 | % | 4,950 | 4,910 | 4,917 | ||||||||||||
| 4,910 | 4,917 | ||||||||||||||||
| Aptos, Inc. | Data processing & outsourced services | ||||||||||||||||
| First Lien Term Loan B, LIBOR+6.75% (1% floor) cash due 9/1/2022 (13) | 8.08 | % | 5,445 | 5,354 | 5,391 | ||||||||||||
| 5,354 | 5,391 | ||||||||||||||||
| SPC Partners VI, L.P. | Multi-sector holdings | ||||||||||||||||
| 0.39% limited partnership interest (11) | — | — | |||||||||||||||
| — | — | ||||||||||||||||
| Impact Sales, LLC | Advertising | ||||||||||||||||
| First Lien Term Loan, LIBOR+7% (1% floor) cash due 12/30/2021 (13) | 8.30 | % | 11,166 | 10,955 | 11,145 | ||||||||||||
| Delayed Draw Term Loan, LIBOR+7% (1% floor) cash due 12/30/2021 (13) | 8.30 | % | 513 | 443 | 506 | ||||||||||||
| 11,398 | 11,651 | ||||||||||||||||
| DFT Intermediate LLC | Specialized finance | ||||||||||||||||
| First Lien Term Revolver, LIBOR+5.5% (1% floor) cash due 3/1/2022 (13) | 6.74 | % | 3,300 | 3,224 | 3,278 | ||||||||||||
| 3,224 | 3,278 | ||||||||||||||||
| Systems, Inc. | Industrial machinery | ||||||||||||||||
| First Lien Term Loan, LIBOR+5.25% (1% floor) cash due 3/3/2022 (13) | 6.57 | % | 8,668 | 8,553 | 8,625 | ||||||||||||
| First Lien Revolver, LIBOR+5.25% (1% floor) cash due 3/3/2022 (10)(13) | 6.57 | % | (40 | ) | (40 | ) | |||||||||||
| 8,513 | 8,585 | ||||||||||||||||
| TerSera Therapeutics, LLC | Pharmaceuticals | ||||||||||||||||
| Second Lien Term Loan, LIBOR+9.25% (1% floor) cash due 3/30/2024 (13) | 10.58 | % | 15,000 | 14,586 | 14,629 | ||||||||||||
| 668,879 Common Units of TerSera Holdings LLC | 1,500 | 1,816 | |||||||||||||||
| 16,086 | 16,445 | ||||||||||||||||
| Cablevision Systems Corp. | Integrated telecommunication services | ||||||||||||||||
| Fixed Rate Bond 10.875% cash due 10/15/2025 (22) | 5,897 | 7,077 | 7,298 | ||||||||||||||
| 7,077 | 7,298 | ||||||||||||||||
| See notes to Consolidated Financial Statements. | |||||||||||||||||
| Portfolio Company/Type of Investment (1)(2)(3)(4)(5) | Cash Interest Rate (6) | Industry | Principal (7) | Cost | Fair Value | Notes | |||||||||||||||||||||||
| RP Escrow Issuer LLC | Health Care Distributors | ||||||||||||||||||||||||||||
| Fixed Rate Bond, 5.25% cash due 12/15/2025 | $ | 1,325 | $ | 1,218 | $ | 1,097 | |||||||||||||||||||||||
| 1,218 | 1,097 | ||||||||||||||||||||||||||||
| RumbleOn, Inc. | Automotive Retail | ||||||||||||||||||||||||||||
| First Lien Term Loan, LIBOR+8.25% cash due 8/31/2026 | 11.92 | % | 37,656 | 35,775 | 36,187 | (6)(11)(15) | |||||||||||||||||||||||
| First Lien Delayed Draw Term Loan, LIBOR+8.25% cash due 8/31/2026 | 11.92 | % | 11,393 | 10,583 | 10,760 | (6)(11)(15)(19) | |||||||||||||||||||||||
| 164,660 Class B Common Stock Warrants (exercise price $33.00) expiration date 2/28/2023 | 1,202 | 74 | (11)(15) | ||||||||||||||||||||||||||
| 47,560 | 47,021 | ||||||||||||||||||||||||||||
| Sabert Corporation | Metal & Glass Containers | ||||||||||||||||||||||||||||
| First Lien Term Loan, LIBOR+4.50% cash due 12/10/2026 | 7.63 | % | 1,691 | 1,610 | 1,623 | (6) | |||||||||||||||||||||||
| 1,610 | 1,623 | ||||||||||||||||||||||||||||
| ShareThis, Inc. | Application Software | ||||||||||||||||||||||||||||
| 345,452 Series C Preferred Stock Warrants (exercise price $3.0395) expiration date 3/4/2024 | 367 | — | (15) | ||||||||||||||||||||||||||
| 367 | — | ||||||||||||||||||||||||||||
| SiO2 Medical Products, Inc. | Metal & Glass Containers | ||||||||||||||||||||||||||||
| First Lien Term Loan, 5.50% cash 8.50% PIK due 12/21/2026 | 46,121 | 45,413 | 45,295 | (15) | |||||||||||||||||||||||||
| 415.34 Common Stock Warrants (exercise price $4,920.75) expiration date 7/31/2028 | 681 | 681 | (15) | ||||||||||||||||||||||||||
| 46,094 | 45,976 | ||||||||||||||||||||||||||||
| SM Wellness Holdings, Inc. | Health Care Services | ||||||||||||||||||||||||||||
| Second Lien Term Loan, LIBOR+8.00% cash due 4/16/2029 | 10.74 | % | 9,109 | 8,972 | 8,289 | (6)(15) | |||||||||||||||||||||||
| 8,972 | 8,289 | ||||||||||||||||||||||||||||
| SonicWall US Holdings Inc. | Technology Distributors | ||||||||||||||||||||||||||||
| Second Lien Term Loan, LIBOR+7.50% cash due 5/18/2026 | 10.48 | % | 3,195 | 3,163 | 2,997 | (6)(15) | |||||||||||||||||||||||
| 3,163 | 2,997 | ||||||||||||||||||||||||||||
| Sorrento Therapeutics, Inc. | Biotechnology | ||||||||||||||||||||||||||||
| 50,000 Common Stock Units | 197 | 79 | (11) | ||||||||||||||||||||||||||
| 197 | 79 | ||||||||||||||||||||||||||||
| Spanx, LLC | Apparel Retail | ||||||||||||||||||||||||||||
| First Lien Term Loan, LIBOR+5.25% cash due 11/20/2028 | 8.30 | % | 4,534 | 4,455 | 4,427 | (6)(15) | |||||||||||||||||||||||
| First Lien Revolver, LIBOR+5.25% cash due 11/18/2027 | 8.03 | % | 866 | 813 | 796 | (6)(15)(19) | |||||||||||||||||||||||
| 5,268 | 5,223 | ||||||||||||||||||||||||||||
| SPX Flow, Inc. | Industrial Machinery | ||||||||||||||||||||||||||||
| First Lien Term Loan, SOFR+4.50% cash due 4/5/2029 | 7.63 | % | 1,500 | 1,410 | 1,393 | (6) | |||||||||||||||||||||||
| 1,410 | 1,393 | ||||||||||||||||||||||||||||
| SumUp Holdings Luxembourg S.À.R.L. | Other Diversified Financial Services | ||||||||||||||||||||||||||||
| First Lien Term Loan, EURIBOR+8.50% cash due 3/10/2026 | 10.00 | % | € | 16,911 | 19,414 | 16,360 | (6)(11)(15) | ||||||||||||||||||||||
| 19,414 | 16,360 | ||||||||||||||||||||||||||||
| Sunland Asphalt & Construction, LLC | Construction & Engineering | ||||||||||||||||||||||||||||
| First Lien Term Loan, LIBOR+6.00% cash due 1/13/2026 | 8.88 | % | $ | 42,618 | 41,654 | 41,723 | (6)(15) | ||||||||||||||||||||||
| 41,654 | 41,723 | ||||||||||||||||||||||||||||
| Supermoose Borrower, LLC | Application Software | ||||||||||||||||||||||||||||
| First Lien Term Loan, LIBOR+3.75% cash due 8/29/2025 | 7.42 | % | 3,466 | 3,141 | 3,056 | (6) | |||||||||||||||||||||||
| 3,141 | 3,056 | ||||||||||||||||||||||||||||
| SVP-Singer Holdings Inc. | Home Furnishings | ||||||||||||||||||||||||||||
| First Lien Term Loan, LIBOR+6.75% cash due 7/28/2028 | 10.42 | % | 20,766 | 19,550 | 18,188 | (6)(15) | |||||||||||||||||||||||
| 19,550 | 18,188 | ||||||||||||||||||||||||||||
| Swordfish Merger Sub LLC | Auto Parts & Equipment | ||||||||||||||||||||||||||||
| Second Lien Term Loan, LIBOR+6.75% cash due 2/2/2026 | 9.81 | % | 12,500 | 12,474 | 11,469 | (6)(15) | |||||||||||||||||||||||
| 12,474 | 11,469 | ||||||||||||||||||||||||||||
| Portfolio Company/Type of Investment (1)(2)(5)(9)(14) | Cash Interest Rate (13) | Industry | Principal (8) | Cost | Fair Value | ||||||||||||
| Terraform Power Operating | Multi-utilities | ||||||||||||||||
| Fixed Rate Bond 6.375% cash due 2/1/2023 (11)(22) | $ | 6,000 | $ | 6,201 | $ | 6,255 | |||||||||||
| 6,201 | 6,255 | ||||||||||||||||
| HC2 Holdings Inc. | Multi-sector holdings | ||||||||||||||||
| Fixed Rate Bond 11% cash due 12/1/2019 (11)(22) | 10,500 | 10,666 | 10,631 | ||||||||||||||
| 10,666 | 10,631 | ||||||||||||||||
| Natural Resource Partners LP | Precious metals & minerals | ||||||||||||||||
| Fixed Rate Bond 10.5% cash due 3/15/2022 (11)(22) | 7,000 | 7,459 | 7,464 | ||||||||||||||
| 7,459 | 7,464 | ||||||||||||||||
| Virgin Media | Integrated telecommunication services | ||||||||||||||||
| Fixed Rate Bond 5.5% cash due 8/15/2026 (11)(22) | 2,000 | 2,038 | 2,108 | ||||||||||||||
| Fixed Rate Bond 5.25% cash due 1/15/2026 (11)(22) | 3,000 | 3,009 | 3,161 | ||||||||||||||
| 5,047 | 5,269 | ||||||||||||||||
| Scientific Games International, Inc. | Casinos & gaming | ||||||||||||||||
| First Lien Term Loan B4, LIBOR+3.25% cash due 8/14/2024 (13)(22) | 4.58 | % | 11,368 | 11,313 | 11,402 | ||||||||||||
| 11,313 | 11,402 | ||||||||||||||||
| ASHCO, LLC | Specialty stores | ||||||||||||||||
| First Lien Term Loan, LIBOR+5% (1% floor) cash due 12/15/2023 (13) | 6.24 | % | 12,000 | 11,762 | 11,335 | ||||||||||||
| 11,762 | 11,335 | ||||||||||||||||
| Salient CRGT Inc. | IT consulting & other services | ||||||||||||||||
| First Lien Term Loan, LIBOR+5.75% (1% floor) cash due 2/28/2022 (13) | 6.99 | % | 3,440 | 3,377 | 3,416 | ||||||||||||
| 3,377 | 3,416 | ||||||||||||||||
| BJ's Wholesale Club, Inc. | Hypermarkets & super centers | ||||||||||||||||
| First Lien Term Loan, LIBOR+3.75% (1% floor) cash due 1/26/2024 (13)(22) | 4.99 | % | 11,970 | 11,979 | 11,504 | ||||||||||||
| 11,979 | 11,504 | ||||||||||||||||
| Everi Payments Inc. | Casinos & gaming | ||||||||||||||||
| First Lien Term Loan, LIBOR+4.5% (1% floor) cash due 5/9/2024 (13)(22) | 5.74 | % | 11,970 | 11,996 | 12,093 | ||||||||||||
| 11,996 | 12,093 | ||||||||||||||||
| LSF9 Atlantis Holdings, LLC | Computer & electronics retail | ||||||||||||||||
| First Lien Term Loan, LIBOR+6% (1% floor) cash due 5/1/2023 (13) | 7.24 | % | 6,459 | 6,399 | 6,498 | ||||||||||||
| 6,399 | 6,498 | ||||||||||||||||
| Allied Universal Holdco LLC | Security & alarm services | ||||||||||||||||
| First Lien Term Loan, LIBOR+3.75% (1% floor) cash due 7/28/2022 (13)(22) | 5.08 | % | 11,970 | 12,043 | 11,958 | ||||||||||||
| Second Lien Term Loan, LIBOR+8.5% (1% floor) cash due 7/27/2023 (13)(22) | 9.81 | % | 1,149 | 1,171 | 1,145 | ||||||||||||
| 13,214 | 13,103 | ||||||||||||||||
| Truck Hero, Inc. | Auto parts & equipment | ||||||||||||||||
| Second Lien Term Loan, LIBOR+8.25% (1% floor) cash due 4/21/2025 (13) | 9.58 | % | 21,500 | 21,191 | 21,715 | ||||||||||||
| 21,191 | 21,715 | ||||||||||||||||
| BMC Software Finance, Inc. | Internet software & services | ||||||||||||||||
| First Lien Term Loan, LIBOR+4% (1% floor) cash due 9/10/2022 (13)(22) | 5.24 | % | 16,881 | 16,999 | 16,993 | ||||||||||||
| 16,999 | 16,993 | ||||||||||||||||
| See notes to Consolidated Financial Statements. | |||||||||||||||||
| Portfolio Company/Type of Investment (1)(2)(3)(4)(5) | Cash Interest Rate (6) | Industry | Principal (7) | Cost | Fair Value | Notes | |||||||||||||||||||||||
| Tacala, LLC | Restaurants | ||||||||||||||||||||||||||||
| Second Lien Term Loan, LIBOR+7.50% cash due 2/4/2028 | 10.62 | % | $ | 9,448 | $ | 9,338 | $ | 8,692 | (6) | ||||||||||||||||||||
| 9,338 | 8,692 | ||||||||||||||||||||||||||||
| Tahoe Bidco B.V. | Application Software | ||||||||||||||||||||||||||||
| First Lien Term Loan, LIBOR+6.00% cash due 9/29/2028 | 8.68 | % | 23,215 | 22,815 | 22,843 | (6)(11)(15) | |||||||||||||||||||||||
| First Lien Revolver, LIBOR+6.00% cash due 10/1/2027 | — | (29) | (28) | (6)(11)(15)(19) | |||||||||||||||||||||||||
| 22,786 | 22,815 | ||||||||||||||||||||||||||||
| Tecta America Corp. | Construction & Engineering | ||||||||||||||||||||||||||||
| Second Lien Term Loan, LIBOR+8.50% cash due 4/9/2029 | 11.62 | % | 5,203 | 5,125 | 5,034 | (6)(15) | |||||||||||||||||||||||
| 5,125 | 5,034 | ||||||||||||||||||||||||||||
| Telestream Holdings Corporation | Application Software | ||||||||||||||||||||||||||||
| First Lien Term Loan, SOFR+9.25% cash due 10/15/2025 | 12.11 | % | 18,323 | 17,956 | 17,865 | (6)(15) | |||||||||||||||||||||||
| First Lien Revolver, SOFR+9.25% cash due 10/15/2025 | 12.20 | % | 1,231 | 1,210 | 1,187 | (6)(15)(19) | |||||||||||||||||||||||
| 19,166 | 19,052 | ||||||||||||||||||||||||||||
| TerSera Therapeutics LLC | Pharmaceuticals | ||||||||||||||||||||||||||||
| Second Lien Term Loan, LIBOR+9.50% cash due 3/30/2026 | 13.17 | % | 29,663 | 29,352 | 29,031 | (6)(15) | |||||||||||||||||||||||
| 668,879 Common Units of TerSera Holdings LLC | 2,028 | 4,077 | (15) | ||||||||||||||||||||||||||
| 31,380 | 33,108 | ||||||||||||||||||||||||||||
| TGNR HoldCo LLC | Integrated Oil & Gas | ||||||||||||||||||||||||||||
| Subordinated Debt, 11.50% cash due 5/14/2026 | 4,984 | 4,866 | 4,872 | (10)(11)(15) | |||||||||||||||||||||||||
| 4,866 | 4,872 | ||||||||||||||||||||||||||||
| Thrasio, LLC | Internet & Direct Marketing Retail | ||||||||||||||||||||||||||||
| First Lien Term Loan, LIBOR+7.00% cash due 12/18/2026 | 11.17 | % | 37,494 | 36,569 | 35,807 | (6)(15) | |||||||||||||||||||||||
| 8,434 Shares of Series C-3 Preferred Stock in Thrasio Holdings, Inc. | 101 | 69 | (15) | ||||||||||||||||||||||||||
| 284,650.32 Shares of Series C-2 Preferred Stock in Thrasio Holdings, Inc. | 2,409 | 2,320 | (15) | ||||||||||||||||||||||||||
| 48,352 Shares of Series D Preferred Stock in Thrasio Holdings, Inc. | 979 | 979 | (15) | ||||||||||||||||||||||||||
| 23,201 Shares of Series X Preferred Stock in Thrasio Holdings, Inc. | 22,986 | 26,487 | (15)(19) | ||||||||||||||||||||||||||
| 63,044 | 65,662 | ||||||||||||||||||||||||||||
| TIBCO Software Inc. | Application Software | ||||||||||||||||||||||||||||
| First Lien Term Loan, SOFR+4.50% cash due 3/20/2029 | 8.15 | % | 12,032 | 10,949 | 10,827 | (6) | |||||||||||||||||||||||
| 10,949 | 10,827 | ||||||||||||||||||||||||||||
| Touchstone Acquisition, Inc. | Health Care Supplies | ||||||||||||||||||||||||||||
| First Lien Term Loan, LIBOR+6.00% cash due 12/29/2028 | 9.12 | % | 6,016 | 5,908 | 5,895 | (6)(15) | |||||||||||||||||||||||
| 5,908 | 5,895 | ||||||||||||||||||||||||||||
| Uniti Group LP | Specialized REITs | ||||||||||||||||||||||||||||
| Fixed Rate Bond, 6.50% cash due 2/15/2029 | 4,500 | 4,060 | 3,026 | (11) | |||||||||||||||||||||||||
| Fixed Rate Bond, 4.75% cash due 4/15/2028 | 300 | 258 | 238 | (11) | |||||||||||||||||||||||||
| 4,318 | 3,264 | ||||||||||||||||||||||||||||
| Win Brands Group LLC | Housewares & Specialties | ||||||||||||||||||||||||||||
| First Lien Term Loan, LIBOR+15.00% cash due 1/22/2026 | 19.64 | % | 2,316 | 2,293 | 2,264 | (6)(15) | |||||||||||||||||||||||
| 3,621 Class F Warrants in Brand Value Growth LLC (exercise price $0.01) expiration date 1/25/2027 | — | 192 | (15) | ||||||||||||||||||||||||||
| 2,293 | 2,456 | ||||||||||||||||||||||||||||
| Portfolio Company/Type of Investment (1)(2)(5)(9)(14) | Cash Interest Rate (13) | Industry | Principal (8) | Cost | Fair Value | ||||||||||||
| Internet Pipeline, Inc. | Internet software & services | ||||||||||||||||
| Incremental First Lien Term Loan, LIBOR+6.25% (1% floor) cash due 8/1/2022 (13) | 7.48 | % | $ | 5,565 | $ | 5,513 | $ | 5,677 | |||||||||
| 5,513 | 5,677 | ||||||||||||||||
| CCC Information Services Inc. | Internet software & services | ||||||||||||||||
| Second Lien Term Loan, LIBOR+6.75% (1% floor) cash due 3/13/2025 (13) | 7.99 | % | 2,500 | 2,559 | 2,581 | ||||||||||||
| 2,559 | 2,581 | ||||||||||||||||
| Hyland Software Inc. | Internet software & services | ||||||||||||||||
| Second Lien Term Loan, LIBOR+7% (1% floor) cash due 7/7/2025 (13) | 8.24 | % | 2,000 | 1,991 | 1,980 | ||||||||||||
| 1,991 | 1,980 | ||||||||||||||||
| Idera, Inc. | Internet software & services | ||||||||||||||||
| First Lien Term Loan B, LIBOR+5% (1% floor) cash due 6/27/2024 (13) | 6.24 | % | 6,926 | 6,910 | 6,978 | ||||||||||||
| 6,910 | 6,978 | ||||||||||||||||
| MHE Intermediate Holdings, LLC | Diversified support services | ||||||||||||||||
| First Lien Term Loan, LIBOR+5% (1% floor) cash due 3/11/2024 (13) | 6.33 | % | 2,993 | 2,964 | 2,993 | ||||||||||||
| 2,964 | 2,993 | ||||||||||||||||
| PowerPlan Holdings, LLC | Internet software & services | ||||||||||||||||
| First Lien Term Loan, LIBOR+5.25% (1% floor) cash due 2/23/2022 (13) | 6.49 | % | 4,988 | 4,941 | 4,987 | ||||||||||||
| 4,941 | 4,987 | ||||||||||||||||
| UOS, LLC | Trucking | ||||||||||||||||
| First Lien Term Loan, LIBOR+5.5% (1% floor) cash due 4/18/2023 (13) | 6.74 | % | 6,916 | 7,081 | 7,106 | ||||||||||||
| 7,081 | 7,106 | ||||||||||||||||
| Veritas US Inc. | Internet software & services | ||||||||||||||||
| First Lien Term Loan, LIBOR+4.5% (1% floor) cash due 1/27/2023 (13)(22) | 5.83 | % | 34,947 | 35,379 | 35,336 | ||||||||||||
| 35,379 | 35,336 | ||||||||||||||||
| Staples, Inc. | Distributors | ||||||||||||||||
| First Lien Term Loan, LIBOR+4% (1% floor) cash due 8/12/2024 (13)(22) | 5.31 | % | 10,000 | 9,976 | 9,967 | ||||||||||||
| Fixed Rate Bond 8.5% cash due 9/15/2025 (22) | 5,000 | 4,988 | 4,863 | ||||||||||||||
| 14,964 | 14,830 | ||||||||||||||||
| Zep Inc. | Housewares & Specialties | ||||||||||||||||
| Second Lien Term Loan, LIBOR+8.25% (1% floor) cash due 8/11/2025 (13) | 9.48 | % | 30,000 | 29,852 | 29,775 | ||||||||||||
| 29,852 | 29,775 | ||||||||||||||||
| DTZ U.S. Borrower, LLC | Real estate services | ||||||||||||||||
| First Lien Term Loan, LIBOR+3.25% (1% floor) cash due 11/4/2021 (13)(22) | 4.57 | % | 12,967 | 13,011 | 13,014 | ||||||||||||
| 13,011 | 13,014 | ||||||||||||||||
| Micro Holding Corp. | Internet software & services | ||||||||||||||||
| First Lien Term Loan, LIBOR+3.5% (1% floor) cash due 9/15/2024 (13) | 4.82 | % | 6,000 | 5,970 | 5,978 | ||||||||||||
| 5,970 | 5,978 | ||||||||||||||||
| Accudyne Industries, LLC | Oil & gas equipment services | ||||||||||||||||
| First Lien Term Loan, LIBOR+3.75% (1% floor) cash due 8/18/2024 (13)(22) | 5.01 | % | 19,915 | 19,977 | 19,990 | ||||||||||||
| 19,977 | 19,990 | ||||||||||||||||
| See notes to Consolidated Financial Statements. | |||||||||||||||||
| Portfolio Company/Type of Investment (1)(2)(3)(4)(5) | Cash Interest Rate (6) | Industry | Principal (7) | Cost | Fair Value | Notes | |||||||||||||||||||||||
| Windstream Services II, LLC | Integrated Telecommunication Services | ||||||||||||||||||||||||||||
| First Lien Term Loan, LIBOR+6.25% cash due 9/21/2027 | 9.37 | % | $ | 25,499 | $ | 24,632 | $ | 23,204 | (6) | ||||||||||||||||||||
| 18,032 Shares of Common Stock in Windstream Holdings II, LLC | 216 | 296 | (15) | ||||||||||||||||||||||||||
| 109,420 Warrants in Windstream Holdings II, LLC | 1,842 | 1,799 | (15) | ||||||||||||||||||||||||||
| 26,690 | 25,299 | ||||||||||||||||||||||||||||
| WP CPP Holdings, LLC | Aerospace & Defense | ||||||||||||||||||||||||||||
| First Lien Term Loan, LIBOR+3.75% cash due 4/30/2025 | 6.56 | % | 7,564 | 6,989 | 6,795 | (6) | |||||||||||||||||||||||
| Second Lien Term Loan, LIBOR+7.75% cash due 4/30/2026 | 10.56 | % | 6,000 | 5,855 | 5,070 | (6)(15) | |||||||||||||||||||||||
| 12,844 | 11,865 | ||||||||||||||||||||||||||||
| WPEngine, Inc. | Application Software | ||||||||||||||||||||||||||||
| First Lien Term Loan, LIBOR+6.00% cash due 3/27/2026 | 10.19 | % | 40,536 | 39,947 | 40,131 | (6)(15) | |||||||||||||||||||||||
| 39,947 | 40,131 | ||||||||||||||||||||||||||||
| WWEX Uni Topco Holdings, LLC | Air Freight & Logistics | ||||||||||||||||||||||||||||
| Second Lien Term Loan, LIBOR+7.00% cash due 7/26/2029 | 10.67 | % | 5,000 | 4,925 | 4,538 | (6)(15) | |||||||||||||||||||||||
| 4,925 | 4,538 | ||||||||||||||||||||||||||||
| Zayo Group Holdings, Inc. | Alternative Carriers | ||||||||||||||||||||||||||||
| Fixed Rate Bond, 4.00% cash due 3/1/2027 | 250 | 212 | 201 | ||||||||||||||||||||||||||
| 212 | 201 | ||||||||||||||||||||||||||||
| Zep Inc. | Specialty Chemicals | ||||||||||||||||||||||||||||
| Second Lien Term Loan, LIBOR+8.25% cash due 8/11/2025 | 11.92 | % | 19,578 | 19,542 | 16,152 | (6)(15) | |||||||||||||||||||||||
| 19,542 | 16,152 | ||||||||||||||||||||||||||||
| Zephyr Bidco Limited | Specialized Finance | ||||||||||||||||||||||||||||
| Second Lien Term Loan, SONIA+7.50% cash due 7/23/2026 | 9.72 | % | £ | 18,000 | 23,804 | 16,552 | (6)(11)(15) | ||||||||||||||||||||||
| 23,804 | 16,552 | ||||||||||||||||||||||||||||
| Total Non-Control/Non-Affiliate Investments (180.9% of net assets) | $ | 2,330,096 | $ | 2,253,750 | |||||||||||||||||||||||||
| Total Portfolio Investments (200.2% of net assets) | $ | 2,617,754 | $ | 2,494,111 | |||||||||||||||||||||||||
| Cash and Cash Equivalents and Restricted Cash | |||||||||||||||||||||||||||||
| JP Morgan Prime Money Market Fund, Institutional Shares | $ | 5,261 | $ | 5,261 | |||||||||||||||||||||||||
| Other cash accounts | 21,103 | 21,103 | |||||||||||||||||||||||||||
| Total Cash and Cash Equivalents and Restricted Cash (2.1% of net assets) | $ | 26,364 | $ | 26,364 | |||||||||||||||||||||||||
| Total Portfolio Investments and Cash and Cash Equivalents and Restricted Cash (202.4% of net assets) | $ | 2,644,118 | $ | 2,520,475 | |||||||||||||||||||||||||
| Derivative Instrument | Notional Amount to be Purchased | Notional Amount to be Sold | Maturity Date | Counterparty | Cumulative Unrealized Appreciation /(Depreciation) | |||||||||||||||||||||||||||
| Foreign currency forward contract | $ | 43,179 | € | 41,444 | 11/10/2022 | JPMorgan Chase Bank, N.A. | $ | 2,466 | ||||||||||||||||||||||||
| Foreign currency forward contract | $ | 45,692 | £ | 37,033 | 11/10/2022 | JPMorgan Chase Bank, N.A. | 4,323 | |||||||||||||||||||||||||
| $ | 6,789 | |||||||||||||||||||||||||||||||
| Derivative Instrument | Company Receives | Company Pays | Counterparty | Maturity Date | Notional Amount | Fair Value | ||||||||||||||||||||||||||||||||
| Interest rate swap | Fixed 2.7% | Floating 3-month LIBOR +1.658% | Royal Bank of Canada | 1/15/2027 | $350,000 | $(41,969) | ||||||||||||||||||||||||||||||||
| Portfolio Company/Type of Investment (1)(2)(5)(9)(14) | Cash Interest Rate (13) | Industry | Principal (8) | Cost | Fair Value | ||||||||||||
| McAfee, LLC | Internet software & services | ||||||||||||||||
| First Lien Term Loan, LIBOR+4.5% (1% floor) cash due 9/30/2024 (13) | 5.83 | % | $ | 8,000 | $ | 7,921 | $ | 8,083 | |||||||||
| 7,921 | 8,083 | ||||||||||||||||
| Total Non-Control/Non-Affiliate Investments (138.2% of net assets) | $ | 1,279,096 | $ | 1,199,501 | |||||||||||||
| Total Portfolio Investments (177.7% of net assets) | $ | 1,757,665 | $ | 1,541,755 | |||||||||||||
| Cash and Cash Equivalents | |||||||||||||||||
| JP Morgan Prime Money Market Fund | $ | 48,808 | $ | 48,808 | |||||||||||||
| Other cash accounts | 4,210 | 4,210 | |||||||||||||||
| Total Cash and Cash Equivalents (6.1% of net assets) | $ | 53,018 | $ | 53,018 | |||||||||||||
| Total Portfolio Investments, Cash and Cash Equivalents (183.8% of net assets) | $ | 1,810,683 | $ | 1,594,773 | |||||||||||||
| Portfolio Company/Type of Investment (1)(2)(3)(4)(5) | Cash Interest Rate (6) | Industry | Principal (7) | Cost | Fair Value | Notes | |||||||||||||||||||||||
| Control Investments | (8)(9) | ||||||||||||||||||||||||||||
| C5 Technology Holdings, LLC | Data Processing & Outsourced Services | ||||||||||||||||||||||||||||
| 829 Common Units | $ | — | $ | — | (15) | ||||||||||||||||||||||||
| 34,984,460.37 Preferred Units | 34,984 | 27,638 | (15) | ||||||||||||||||||||||||||
| 34,984 | 27,638 | ||||||||||||||||||||||||||||
| Dominion Diagnostics, LLC | Health Care Services | ||||||||||||||||||||||||||||
| First Lien Term Loan, LIBOR+5.00% cash due 2/28/2024 | 6.00 | % | $ | 27,381 | 27,381 | 27,381 | (6)(15) | ||||||||||||||||||||||
| First Lien Revolver, LIBOR+5.00% cash due 2/28/2024 | — | — | — | (6)(15)(19) | |||||||||||||||||||||||||
| 30,030.8 Common Units in DD Healthcare Services Holdings, LLC | 18,625 | 18,065 | (12)(15) | ||||||||||||||||||||||||||
| 46,006 | 45,446 | ||||||||||||||||||||||||||||
| First Star Speir Aviation Limited | Airlines | (10) | |||||||||||||||||||||||||||
| First Lien Term Loan, 9.00% cash due 12/15/2025 | 7,500 | — | 7,500 | (11)(15) | |||||||||||||||||||||||||
| 100% equity interest | 6,332 | 698 | (11)(12)(15) | ||||||||||||||||||||||||||
| 6,332 | 8,198 | ||||||||||||||||||||||||||||
| OCSI Glick JV LLC | Multi-Sector Holdings | (14) | |||||||||||||||||||||||||||
| Subordinated Debt, LIBOR+4.50% cash due 10/20/2028 | 4.60 | % | 61,709 | 50,705 | 55,582 | (6)(11)(15)(19) | |||||||||||||||||||||||
| 87.5% equity interest | — | — | (11)(16)(19) | ||||||||||||||||||||||||||
| 50,705 | 55,582 | ||||||||||||||||||||||||||||
| Senior Loan Fund JV I, LLC | Multi-Sector Holdings | (14) | |||||||||||||||||||||||||||
| Subordinated Debt, LIBOR+7.00% cash due 12/29/2028 | 8.00 | % | 96,250 | 96,250 | 96,250 | (6)(11)(15)(19) | |||||||||||||||||||||||
| 87.5% LLC equity interest | 49,322 | 37,651 | (11)(12)(16)(19) | ||||||||||||||||||||||||||
| 145,572 | 133,901 | ||||||||||||||||||||||||||||
| Total Control Investments (20.6% of net assets) | $ | 283,599 | $ | 270,765 | |||||||||||||||||||||||||
| Affiliate Investments | (17) | ||||||||||||||||||||||||||||
| Assembled Brands Capital LLC | Specialized Finance | ||||||||||||||||||||||||||||
| First Lien Revolver, LIBOR+6.00% cash due 10/17/2023 | 7.00 | % | $ | 15,899 | $ | 15,900 | $ | 15,712 | (6)(15)(19) | ||||||||||||||||||||
| 1,609,201 Class A Units | 764 | 587 | (15) | ||||||||||||||||||||||||||
| 1,019,168.80 Preferred Units, 6% | 1,019 | 1,152 | (15) | ||||||||||||||||||||||||||
| 70,424.5641 Class A Warrants (exercise price $3.3778) expiration date 9/9/2029 | — | — | (15) | ||||||||||||||||||||||||||
| 17,683 | 17,451 | ||||||||||||||||||||||||||||
| Caregiver Services, Inc. | Health Care Services | ||||||||||||||||||||||||||||
| 1,080,399 shares of Series A Preferred Stock, 10% | 1,080 | 838 | (15) | ||||||||||||||||||||||||||
| 1,080 | 838 | ||||||||||||||||||||||||||||
| Total Affiliate Investments (1.4% of net assets) | $ | 18,763 | $ | 18,289 | |||||||||||||||||||||||||
| Non-Control/Non-Affiliate Investments | (18) | ||||||||||||||||||||||||||||
| 4 Over International, LLC | Commercial Printing | ||||||||||||||||||||||||||||
| First Lien Term Loan, LIBOR+6.00% cash due 6/7/2022 | 7.00 | % | $ | 10,927 | $ | 10,524 | $ | 10,484 | (6)(15) | ||||||||||||||||||||
| First Lien Revolver, LIBOR+6.00% cash due 6/7/2022 | — | (24) | (93) | (6)(15)(19) | |||||||||||||||||||||||||
| 10,500 | 10,391 | ||||||||||||||||||||||||||||
| 109 Montgomery Owner LLC | Real Estate Operating Companies | ||||||||||||||||||||||||||||
| First Lien Delayed Draw Term Loan, LIBOR+7.00% cash due 2/2/2023 | 7.50 | % | 3,102 | 2,984 | 3,153 | (6)(15)(19) | |||||||||||||||||||||||
| 2,984 | 3,153 | ||||||||||||||||||||||||||||
| A.T. Holdings II SÀRL | Biotechnology | ||||||||||||||||||||||||||||
| First Lien Term Loan, 9.50% cash due 12/22/2022 | 37,158 | 36,930 | 36,972 | (11)(15) | |||||||||||||||||||||||||
| 36,930 | 36,972 | ||||||||||||||||||||||||||||
| Access CIG, LLC | Diversified Support Services | ||||||||||||||||||||||||||||
| First Lien Term Loan, LIBOR+3.75% cash due 2/27/2025 | 3.83 | % | 5,352 | 5,021 | 5,332 | (6) | |||||||||||||||||||||||
| Second Lien Term Loan, LIBOR+7.75% cash due 2/27/2026 | 7.83 | % | 17,000 | 16,923 | 17,028 | (6) | |||||||||||||||||||||||
| 21,944 | 22,360 | ||||||||||||||||||||||||||||
| Portfolio Company/Type of Investment (1)(2)(3)(4)(5) | Cash Interest Rate (6) | Industry | Principal (7) | Cost | Fair Value | Notes | |||||||||||||||||||||||
| Accupac, Inc. | Personal Products | ||||||||||||||||||||||||||||
| First Lien Term Loan, LIBOR+6.00% cash due 1/17/2026 | 7.00 | % | $ | 16,140 | $ | 15,758 | $ | 16,140 | (6)(15) | ||||||||||||||||||||
| First Lien Delayed Draw Term Loan, LIBOR+6.00% cash due 1/17/2026 | — | (29) | — | (6)(15)(19) | |||||||||||||||||||||||||
| First Lien Revolver, LIBOR+6.00% cash due 1/17/2026 | 7.00 | % | 1,838 | 1,789 | 1,838 | (6)(15)(19) | |||||||||||||||||||||||
| 17,518 | 17,978 | ||||||||||||||||||||||||||||
| Acquia Inc. | Application Software | ||||||||||||||||||||||||||||
| First Lien Term Loan, LIBOR+7.00% cash due 10/31/2025 | 8.00 | % | 27,349 | 26,936 | 27,295 | (6)(15) | |||||||||||||||||||||||
| First Lien Revolver, LIBOR+7.00% cash due 10/31/2025 | 8.00 | % | 179 | 148 | 175 | (6)(15)(19) | |||||||||||||||||||||||
| 27,084 | 27,470 | ||||||||||||||||||||||||||||
| ADB Companies, LLC | Construction & Engineering | ||||||||||||||||||||||||||||
| First Lien Term Loan, LIBOR+6.25% cash due 12/18/2025 | 7.25 | % | 15,463 | 14,817 | 15,287 | (6)(15) | |||||||||||||||||||||||
| 14,817 | 15,287 | ||||||||||||||||||||||||||||
| Aden & Anais Merger Sub, Inc. | Apparel, Accessories & Luxury Goods | ||||||||||||||||||||||||||||
| 51,645 Common Units in Aden & Anais Holdings, Inc. | 5,165 | — | (15) | ||||||||||||||||||||||||||
| 5,165 | — | ||||||||||||||||||||||||||||
| AI Sirona (Luxembourg) Acquisition S.a.r.l. | Pharmaceuticals | ||||||||||||||||||||||||||||
| Second Lien Term Loan, EURIBOR+7.25% cash due 9/28/2026 | 7.25 | % | € | 24,838 | 27,720 | 28,738 | (6)(11)(15) | ||||||||||||||||||||||
| 27,720 | 28,738 | ||||||||||||||||||||||||||||
| AirStrip Technologies, Inc. | Application Software | ||||||||||||||||||||||||||||
| 5,715 Common Stock Warrants (exercise price $139.99) expiration date 5/11/2025 | 90 | — | (15) | ||||||||||||||||||||||||||
| 90 | — | ||||||||||||||||||||||||||||
| All Web Leads, Inc. | Advertising | ||||||||||||||||||||||||||||
| First Lien Term Loan, LIBOR+6.50% cash due 12/29/2023 | 7.50 | % | $ | 23,899 | 21,512 | 22,992 | (6)(15) | ||||||||||||||||||||||
| 21,512 | 22,992 | ||||||||||||||||||||||||||||
| Alvogen Pharma US, Inc. | Pharmaceuticals | ||||||||||||||||||||||||||||
| First Lien Term Loan, LIBOR+5.25% cash due 12/31/2023 | 6.25 | % | 13,825 | 13,329 | 13,383 | (6) | |||||||||||||||||||||||
| 13,329 | 13,383 | ||||||||||||||||||||||||||||
| Alvotech Holdings S.A. | Biotechnology | (13) | |||||||||||||||||||||||||||
| Fixed Rate Bond 15% PIK Tranche A due 6/24/2025 | 20,967 | 20,576 | 20,967 | (11)(15) | |||||||||||||||||||||||||
| Fixed Rate Bond 15% PIK Tranche B due 6/24/2025 | 20,512 | 20,169 | 20,512 | (11)(15) | |||||||||||||||||||||||||
| 27,308 Common Shares | 6,322 | 6,322 | (15) | ||||||||||||||||||||||||||
| 47,067 | 47,801 | ||||||||||||||||||||||||||||
| Amplify Finco Pty Ltd. | Movies & Entertainment | ||||||||||||||||||||||||||||
| First Lien Term Loan, LIBOR+4.25% cash due 11/26/2026 | 5.00 | % | 15,376 | 13,814 | 14,985 | (6)(11)(15) | |||||||||||||||||||||||
| Second Lien Term Loan, LIBOR+8.00% cash due 11/26/2027 | 8.75 | % | 12,500 | 12,188 | 12,063 | (6)(11)(15) | |||||||||||||||||||||||
| 26,002 | 27,048 | ||||||||||||||||||||||||||||
| Ankura Consulting Group LLC | Research & Consulting Services | ||||||||||||||||||||||||||||
| Second Lien Term Loan, LIBOR+8.00% cash due 3/19/2029 | 8.75 | % | 7,466 | 7,354 | 7,606 | (6)(15) | |||||||||||||||||||||||
| 7,354 | 7,606 | ||||||||||||||||||||||||||||
| Apptio, Inc. | Application Software | ||||||||||||||||||||||||||||
| First Lien Term Loan, LIBOR+7.25% cash due 1/10/2025 | 8.25 | % | 34,458 | 33,420 | 33,922 | (6)(15) | |||||||||||||||||||||||
| First Lien Revolver, LIBOR+7.25% cash due 1/10/2025 | 8.25 | % | 892 | 849 | 858 | (6)(15)(19) | |||||||||||||||||||||||
| 34,269 | 34,780 | ||||||||||||||||||||||||||||
| Ardonagh Midco 3 PLC | Insurance Brokers | ||||||||||||||||||||||||||||
| First Lien Term Loan, EURIBOR+7.25% cash due 7/14/2026 | 8.25 | % | € | 1,964 | 2,179 | 2,283 | (6)(11)(15) | ||||||||||||||||||||||
| First Lien Term Loan, UK LIBOR+7.25% cash due 7/14/2026 | 8.00 | % | £ | 18,636 | 23,336 | 25,329 | (6)(11)(15) | ||||||||||||||||||||||
| First Lien Delayed Draw Term Loan, LIBOR+6.00% cash due 7/14/2026 | $ | — | — | — | (6)(11)(15)(19) | ||||||||||||||||||||||||
| First Lien Delayed Draw Term Loan, SONIA+6.00% cash due 7/14/2026 | £ | — | — | — | (6)(11)(15)(19) | ||||||||||||||||||||||||
| 25,515 | 27,612 | ||||||||||||||||||||||||||||
| Portfolio Company/Type of Investment (1)(2)(3)(4)(5) | Cash Interest Rate (6) | Industry | Principal (7) | Cost | Fair Value | Notes | |||||||||||||||||||||||
| Associated Asphalt Partners, LLC | Construction Materials | ||||||||||||||||||||||||||||
| First Lien Term Loan, LIBOR+5.25% cash due 4/5/2024 | 6.25 | % | $ | 2,531 | $ | 2,245 | $ | 2,350 | (6) | ||||||||||||||||||||
| 2,245 | 2,350 | ||||||||||||||||||||||||||||
| Athenex, Inc. | Pharmaceuticals | ||||||||||||||||||||||||||||
| First Lien Term Loan, 11.00% cash due 6/19/2026 | 42,145 | 40,475 | 41,845 | (11)(15) | |||||||||||||||||||||||||
| First Lien Delayed Draw Term Loan, 11.00% cash due 6/19/2026 | — | (274) | (150) | (11)(15)(19) | |||||||||||||||||||||||||
| 328,149 Common Stock Warrants (exercise price $12.63) expiration date 6/19/2027 | 973 | 95 | (11)(15) | ||||||||||||||||||||||||||
| 41,174 | 41,790 | ||||||||||||||||||||||||||||
| Aurora Lux Finco S.À.R.L. | Airport Services | ||||||||||||||||||||||||||||
| First Lien Term Loan, LIBOR+6.00% cash due 12/24/2026 | 7.00 | % | 22,655 | 22,232 | 21,318 | (6)(11)(15) | |||||||||||||||||||||||
| 22,232 | 21,318 | ||||||||||||||||||||||||||||
| The Avery | Real Estate Operating Companies | ||||||||||||||||||||||||||||
| First Lien Delayed Draw Term Loan in T8 Urban Condo Owner, LLC, LIBOR+7.30% cash due 2/17/2023 | 7.55 | % | 20,287 | 19,933 | 20,490 | (6)(15)(19) | |||||||||||||||||||||||
| Subordinated Delayed Draw Debt in T8 Senior Mezz LLC, LIBOR+12.50% cash due 2/17/2023 | 12.75 | % | 4,692 | 4,614 | 4,698 | (6)(15)(19) | |||||||||||||||||||||||
| 24,547 | 25,188 | ||||||||||||||||||||||||||||
| BAART Programs, Inc. | Health Care Services | ||||||||||||||||||||||||||||
| Second Lien Term Loan, LIBOR+8.50% cash due 6/11/2028 | 9.50 | % | 7,166 | 7,059 | 7,130 | (6)(15) | |||||||||||||||||||||||
| Second Lien Delayed Draw Term Loan, LIBOR+8.50% cash due 6/11/2028 | — | (52) | (18) | (6)(15)(19) | |||||||||||||||||||||||||
| 7,007 | 7,112 | ||||||||||||||||||||||||||||
| Berner Food & Beverage, LLC | Soft Drinks | ||||||||||||||||||||||||||||
| First Lien Term Loan, LIBOR+6.50% cash due 7/30/2027 | 7.50 | % | 33,412 | 32,844 | 32,844 | (6)(15) | |||||||||||||||||||||||
| First Lien Revolver, LIBOR+6.50% cash due 7/30/2027 | 7.50 | % | 619 | 566 | 566 | (6)(15)(19) | |||||||||||||||||||||||
| 33,410 | 33,410 | ||||||||||||||||||||||||||||
| Blackhawk Network Holdings, Inc. | Data Processing & Outsourced Services | ||||||||||||||||||||||||||||
| Second Lien Term Loan, LIBOR+7.00% cash due 6/15/2026 | 7.13 | % | 30,625 | 30,181 | 30,523 | (6) | |||||||||||||||||||||||
| 30,181 | 30,523 | ||||||||||||||||||||||||||||
| Blumenthal Temecula, LLC | Automotive Retail | ||||||||||||||||||||||||||||
| First Lien Term Loan, 9.00% cash due 9/24/2023 | 3,979 | 3,980 | 3,979 | (15) | |||||||||||||||||||||||||
| 1,293,324 Preferred Units in Unstoppable Automotive AMV, LLC | 1,293 | 1,293 | (15) | ||||||||||||||||||||||||||
| 298,460 Preferred Units in Unstoppable Automotive VMV, LLC | 298 | 298 | (15) | ||||||||||||||||||||||||||
| 298,460 Common Units in Unstoppable Automotive AMV, LLC | 298 | 298 | (15) | ||||||||||||||||||||||||||
| 99,486 Common Units in Unstoppable Automotive VMV, LLC | 100 | 99 | (15) | ||||||||||||||||||||||||||
| 5,969 | 5,967 | ||||||||||||||||||||||||||||
| Cadence Aerospace, LLC | Aerospace & Defense | ||||||||||||||||||||||||||||
| First Lien Term Loan, LIBOR+6.50% cash 2.00% PIK due 11/14/2023 | 7.50 | % | 14,146 | 12,574 | 12,992 | (6)(15) | |||||||||||||||||||||||
| 12,574 | 12,992 | ||||||||||||||||||||||||||||
| Chief Power Finance II, LLC | Independent Power Producers & Energy Traders | ||||||||||||||||||||||||||||
| First Lien Term Loan, LIBOR+6.50% cash due 12/31/2022 | 7.50 | % | 23,850 | 23,458 | 23,552 | (6)(15) | |||||||||||||||||||||||
| 23,458 | 23,552 | ||||||||||||||||||||||||||||
| CircusTrix Holdings, LLC | Leisure Facilities | ||||||||||||||||||||||||||||
| First Lien Term Loan, LIBOR+5.50% cash 2.50% PIK due 7/16/2023 | 6.50 | % | 10,686 | 9,793 | 8,816 | (6)(15)(19) | |||||||||||||||||||||||
| 9,793 | 8,816 | ||||||||||||||||||||||||||||
| CITGO Holding, Inc. | Oil & Gas Refining & Marketing | ||||||||||||||||||||||||||||
| First Lien Term Loan, LIBOR+7.00% cash due 8/1/2023 | 8.00 | % | 11,635 | 11,517 | 11,512 | (6) | |||||||||||||||||||||||
| Fixed Rate Bond, 9.25% cash due 8/1/2024 | 10,672 | 10,672 | 10,765 | ||||||||||||||||||||||||||
| 22,189 | 22,277 | ||||||||||||||||||||||||||||
| Portfolio Company/Type of Investment (1)(2)(3)(4)(5) | Cash Interest Rate (6) | Industry | Principal (7) | Cost | Fair Value | Notes | |||||||||||||||||||||||
| CITGO Petroleum Corp. | Oil & Gas Refining & Marketing | ||||||||||||||||||||||||||||
| First Lien Term Loan, LIBOR+6.25% cash due 3/28/2024 | 7.25 | % | $ | 14,221 | $ | 13,855 | $ | 14,269 | (6) | ||||||||||||||||||||
| 13,855 | 14,269 | ||||||||||||||||||||||||||||
| Clear Channel Outdoor Holdings Inc. | Advertising | ||||||||||||||||||||||||||||
| Fixed Rate Bond, 7.50% cash due 6/1/2029 | 7,137 | 7,137 | 7,431 | (11) | |||||||||||||||||||||||||
| 7,137 | 7,431 | ||||||||||||||||||||||||||||
| Continental Intermodal Group LP | Oil & Gas Storage & Transportation | ||||||||||||||||||||||||||||
| First Lien Term Loan, LIBOR+9.50% PIK due 1/28/2025 | 38,876 | 36,668 | 32,628 | (6)(15) | |||||||||||||||||||||||||
| Common Stock Warrants expiration date 7/28/2025 | 648 | 1,909 | (15) | ||||||||||||||||||||||||||
| 37,316 | 34,537 | ||||||||||||||||||||||||||||
| Convergeone Holdings, Inc. | IT Consulting & Other Services | ||||||||||||||||||||||||||||
| First Lien Term Loan, LIBOR+5.00% cash due 1/4/2026 | 5.08 | % | 7,024 | 6,848 | 7,003 | (6) | |||||||||||||||||||||||
| 6,848 | 7,003 | ||||||||||||||||||||||||||||
| Conviva Inc. | Application Software | ||||||||||||||||||||||||||||
| 517,851 Shares of Series D Preferred Stock | 605 | 894 | (15) | ||||||||||||||||||||||||||
| 605 | 894 | ||||||||||||||||||||||||||||
| CorEvitas, LLC | Health Care Services | ||||||||||||||||||||||||||||
| First Lien Term Loan, LIBOR+5.50% cash due 12/13/2025 | 6.50 | % | 10,196 | 10,071 | 10,109 | (6)(15) | |||||||||||||||||||||||
| First Lien Delayed Draw Term Loan, LIBOR+5.50% cash due 12/13/2025 | 6.50 | % | 1,943 | 1,894 | 1,912 | (6)(15)(19) | |||||||||||||||||||||||
| First Lien Revolver, PRIME+4.50% cash due 12/13/2025 | 7.75 | % | 305 | 283 | 290 | (6)(15)(19) | |||||||||||||||||||||||
| 1,099 Class A2 Common Units in CorEvitas Holdings, L.P. | 1,038 | 1,177 | (15) | ||||||||||||||||||||||||||
| 13,286 | 13,488 | ||||||||||||||||||||||||||||
| Coty Inc. | Personal Products | ||||||||||||||||||||||||||||
| First Lien Revolver, LIBOR+1.75% cash due 4/5/2023 | — | (712) | (395) | (6)(11)(15)(19) | |||||||||||||||||||||||||
| (712) | (395) | ||||||||||||||||||||||||||||
| Coyote Buyer, LLC | Specialty Chemicals | ||||||||||||||||||||||||||||
| First Lien Term Loan, LIBOR+6.00% cash due 2/6/2026 | 7.00 | % | 18,387 | 17,887 | 18,225 | (6)(15) | |||||||||||||||||||||||
| First Lien Revolver, LIBOR+6.00% cash due 2/6/2025 | — | (13) | (12) | (6)(15)(19) | |||||||||||||||||||||||||
| 17,874 | 18,213 | ||||||||||||||||||||||||||||
| Curium Bidco S.à.r.l. | Biotechnology | ||||||||||||||||||||||||||||
| Second Lien Term Loan, LIBOR+7.75% cash due 10/27/2028 | 8.50 | % | 16,787 | 16,535 | 17,070 | (6)(11)(15) | |||||||||||||||||||||||
| 16,535 | 17,070 | ||||||||||||||||||||||||||||
| Delta Topco, Inc. | Systems Software | ||||||||||||||||||||||||||||
| Second Lien Term Loan, LIBOR+7.25% cash due 12/1/2028 | 8.00 | % | 6,680 | 6,647 | 6,769 | (6) | |||||||||||||||||||||||
| 6,647 | 6,769 | ||||||||||||||||||||||||||||
| Dialyze Holdings, LLC | Health Care Equipment | ||||||||||||||||||||||||||||
| First Lien Term Loan, LIBOR+7.00% cash 2.00% PIK due 8/4/2026 | 8.00 | % | 24,093 | 22,439 | 22,467 | (6)(15) | |||||||||||||||||||||||
| First Lien Delayed Draw Term Loan, LIBOR+7.00% cash 2.00% PIK due 8/4/2026 | — | (170) | (163) | (6)(15)(19) | |||||||||||||||||||||||||
| 5,403,823 Class A Warrants (exercise price $1.00) expiration date 8/4/2028 | 1,405 | 1,459 | (15) | ||||||||||||||||||||||||||
| 23,674 | 23,763 | ||||||||||||||||||||||||||||
| Digital.AI Software Holdings, Inc. | Application Software | ||||||||||||||||||||||||||||
| First Lien Term Loan, LIBOR+7.00% cash due 2/10/2027 | 8.00 | % | 10,003 | 9,627 | 9,783 | (6)(15) | |||||||||||||||||||||||
| First Lien Revolver, LIBOR+7.00% cash due 2/10/2027 | 8.00 | % | 180 | 151 | 156 | (6)(15)(19) | |||||||||||||||||||||||
| 9,778 | 9,939 | ||||||||||||||||||||||||||||
| DirecTV Financing, LLC | Cable & Satellite | ||||||||||||||||||||||||||||
| First Lien Term Loan, LIBOR+5.00% cash due 8/2/2027 | 5.75 | % | 27,000 | 26,730 | 27,048 | (6) | |||||||||||||||||||||||
| 26,730 | 27,048 | ||||||||||||||||||||||||||||
| Eagleview Technology Corporation | Application Software | ||||||||||||||||||||||||||||
| Second Lien Term Loan, LIBOR+7.50% cash due 8/14/2026 | 8.50 | % | 8,974 | 8,884 | 8,918 | (6)(15) | |||||||||||||||||||||||
| 8,884 | 8,918 | ||||||||||||||||||||||||||||
| Portfolio Company/Type of Investment (1)(2)(3)(4)(5) | Cash Interest Rate (6) | Industry | Principal (7) | Cost | Fair Value | Notes | |||||||||||||||||||||||
| EHR Canada, LLC | Food Retail | ||||||||||||||||||||||||||||
| First Lien Term Loan, LIBOR+8.00% cash due 12/31/2021 | 9.00 | % | $ | 3,750 | $ | 3,745 | $ | 3,750 | (6)(15) | ||||||||||||||||||||
| 3,745 | 3,750 | ||||||||||||||||||||||||||||
| EOS Fitness Opco Holdings, LLC | Leisure Facilities | ||||||||||||||||||||||||||||
| 487.5 Class A Preferred Units, 12% | 488 | 274 | (15) | ||||||||||||||||||||||||||
| 12,500 Class B Common Units | — | — | (15) | ||||||||||||||||||||||||||
| 488 | 274 | ||||||||||||||||||||||||||||
| Firstlight Holdco, Inc. | Alternative Carriers | ||||||||||||||||||||||||||||
| First Lien Term Loan, LIBOR+3.50% cash due 7/23/2025 | 3.58 | % | 7,012 | 6,578 | 6,939 | (6) | |||||||||||||||||||||||
| 6,578 | 6,939 | ||||||||||||||||||||||||||||
| Fortress Biotech, Inc. | Biotechnology | ||||||||||||||||||||||||||||
| First Lien Term Loan, 11.00% cash due 8/27/2025 | 11,359 | 10,722 | 11,075 | (11)(15) | |||||||||||||||||||||||||
| 331,200 Common Stock Warrants (exercise price $3.20) expiration date 8/27/2030 | 405 | 341 | (11)(15) | ||||||||||||||||||||||||||
| 11,127 | 11,416 | ||||||||||||||||||||||||||||
| GI Chill Acquisition LLC | Managed Health Care | ||||||||||||||||||||||||||||
| First Lien Term Loan, LIBOR+3.75% cash due 8/6/2025 | 3.90 | % | 12,653 | 12,442 | 12,621 | (6)(15) | |||||||||||||||||||||||
| Second Lien Term Loan, LIBOR+7.50% cash due 8/6/2026 | 7.63 | % | 6,250 | 6,212 | 6,219 | (6)(15) | |||||||||||||||||||||||
| 18,654 | 18,840 | ||||||||||||||||||||||||||||
| GKD Index Partners, LLC | Specialized Finance | ||||||||||||||||||||||||||||
| First Lien Term Loan, LIBOR+8.50% cash due 6/29/2023 | 9.50 | % | 26,360 | 25,837 | 25,931 | (6)(15) | |||||||||||||||||||||||
| First Lien Revolver, LIBOR+8.50% cash due 6/29/2023 | 9.50 | % | 1,280 | 1,251 | 1,252 | (6)(15)(19) | |||||||||||||||||||||||
| 27,088 | 27,183 | ||||||||||||||||||||||||||||
| Global Medical Response, Inc. | Health Care Services | ||||||||||||||||||||||||||||
| First Lien Term Loan, LIBOR+4.25% cash due 3/14/2025 | 5.25 | % | 8,630 | 8,399 | 8,674 | (6) | |||||||||||||||||||||||
| 8,399 | 8,674 | ||||||||||||||||||||||||||||
| Gulf Operating, LLC | Oil & Gas Storage & Transportation | ||||||||||||||||||||||||||||
| First Lien Revolver, LIBOR+4.00% cash due 12/27/2021 | — | (704) | (75) | (6)(15)(19) | |||||||||||||||||||||||||
| (704) | (75) | ||||||||||||||||||||||||||||
| Houghton Mifflin Harcourt Publishers Inc. | Education Services | ||||||||||||||||||||||||||||
| First Lien Term Loan, LIBOR+6.25% cash due 11/22/2024 | 7.25 | % | 1,007 | 981 | 1,009 | (6)(11) | |||||||||||||||||||||||
| 981 | 1,009 | ||||||||||||||||||||||||||||
| iCIMs, Inc. | Application Software | ||||||||||||||||||||||||||||
| First Lien Term Loan, LIBOR+6.50% cash due 9/12/2024 | 7.50 | % | 25,635 | 25,024 | 25,525 | (6)(15) | |||||||||||||||||||||||
| First Lien Revolver, LIBOR+6.50% cash due 9/12/2024 | 7.50 | % | 1,176 | 1,147 | 1,171 | (6)(15) | |||||||||||||||||||||||
| 26,171 | 26,696 | ||||||||||||||||||||||||||||
| Immucor, Inc. | Health Care Supplies | ||||||||||||||||||||||||||||
| First Lien Term Loan, LIBOR+5.75% cash due 7/2/2025 | 6.75 | % | 8,657 | 8,425 | 8,570 | (6)(15) | |||||||||||||||||||||||
| Second Lien Term Loan, LIBOR+8.00% cash 3.50% PIK due 10/2/2025 | 9.00 | % | 21,834 | 21,225 | 21,616 | (6)(15) | |||||||||||||||||||||||
| 29,650 | 30,186 | ||||||||||||||||||||||||||||
| Integral Development Corporation | Other Diversified Financial Services | ||||||||||||||||||||||||||||
| 1,078,284 Common Stock Warrants (exercise price $0.9274) expiration date 7/10/2024 | 113 | — | (15) | ||||||||||||||||||||||||||
| 113 | — | ||||||||||||||||||||||||||||
| Inventus Power, Inc. | Electrical Components & Equipment | ||||||||||||||||||||||||||||
| First Lien Term Loan, LIBOR+5.00% cash due 3/29/2024 | 6.00 | % | 18,849 | 18,693 | 18,708 | (6)(15) | |||||||||||||||||||||||
| Second Lien Term Loan, LIBOR+8.50% cash due 9/29/2024 | 9.50 | % | 13,674 | 13,434 | 13,434 | (6)(15) | |||||||||||||||||||||||
| 32,127 | 32,142 | ||||||||||||||||||||||||||||
| Portfolio Company/Type of Investment (1)(2)(3)(4)(5) | Cash Interest Rate (6) | Industry | Principal (7) | Cost | Fair Value | Notes | |||||||||||||||||||||||
| INW Manufacturing, LLC | Personal Products | ||||||||||||||||||||||||||||
| First Lien Term Loan, LIBOR+5.75% cash due 5/7/2027 | 6.50 | % | $ | 37,031 | $ | 35,988 | $ | 36,291 | (6)(15) | ||||||||||||||||||||
| 35,988 | 36,291 | ||||||||||||||||||||||||||||
| Itafos Inc. | Fertilizers & Agricultural Chemicals | ||||||||||||||||||||||||||||
| First Lien Term Loan, LIBOR+8.25% cash due 8/25/2024 | 9.25 | % | 22,506 | 21,636 | 21,651 | (6)(15) | |||||||||||||||||||||||
| 21,636 | 21,651 | ||||||||||||||||||||||||||||
| Ivanti Software, Inc. | Application Software | ||||||||||||||||||||||||||||
| Second Lien Term Loan, LIBOR+8.50% cash due 12/1/2028 | 9.50 | % | 17,346 | 16,864 | 17,368 | (6)(15) | |||||||||||||||||||||||
| 16,864 | 17,368 | ||||||||||||||||||||||||||||
| Jazz Acquisition, Inc. | Aerospace & Defense | ||||||||||||||||||||||||||||
| First Lien Term Loan, LIBOR+7.50% cash due 1/29/2027 | 8.50 | % | 36,603 | 35,292 | 36,531 | (6)(15) | |||||||||||||||||||||||
| 35,292 | 36,531 | ||||||||||||||||||||||||||||
| Latam Airlines Group S.A. | Airlines | ||||||||||||||||||||||||||||
| First Lien Delayed Draw Term Loan, LIBOR+11.00% PIK due 3/29/2022 | 16,239 | 16,085 | 16,356 | (6)(11)(15)(19) | |||||||||||||||||||||||||
| 16,085 | 16,356 | ||||||||||||||||||||||||||||
| Lift Brands Holdings, Inc. | Leisure Facilities | ||||||||||||||||||||||||||||
| 2,000,000 Class A Common Units in Snap Investments, LLC | 1,399 | — | (15) | ||||||||||||||||||||||||||
| 1,399 | — | ||||||||||||||||||||||||||||
| Lightbox Intermediate, L.P. | Real Estate Services | ||||||||||||||||||||||||||||
| First Lien Term Loan, LIBOR+5.00% cash due 5/9/2026 | 5.13 | % | 41,432 | 40,445 | 41,225 | (6)(15) | |||||||||||||||||||||||
| 40,445 | 41,225 | ||||||||||||||||||||||||||||
| LogMeIn, Inc. | Application Software | ||||||||||||||||||||||||||||
| First Lien Term Loan, LIBOR+4.75% cash due 8/31/2027 | 4.83 | % | 3,970 | 3,720 | 3,973 | (6) | |||||||||||||||||||||||
| 3,720 | 3,973 | ||||||||||||||||||||||||||||
| LTI Holdings, Inc. | Electronic Components | ||||||||||||||||||||||||||||
| Second Lien Term Loan, LIBOR+6.75% cash due 9/6/2026 | 6.83 | % | 10,140 | 10,080 | 10,127 | (6) | |||||||||||||||||||||||
| 10,080 | 10,127 | ||||||||||||||||||||||||||||
| Marinus Pharmaceuticals, Inc. | Pharmaceuticals | ||||||||||||||||||||||||||||
| First Lien Term Loan, 11.50% cash due 5/11/2026 | 3,441 | 3,377 | 3,389 | (11)(15) | |||||||||||||||||||||||||
| First Lien Delayed Draw Term Loan, 11.50% cash due 5/11/2026 | 6,881 | 6,755 | 6,778 | (11)(15)(19) | |||||||||||||||||||||||||
| 10,132 | 10,167 | ||||||||||||||||||||||||||||
| Mayfield Agency Borrower Inc. | Property & Casualty Insurance | ||||||||||||||||||||||||||||
| First Lien Term Loan, LIBOR+4.50% cash due 2/28/2025 | 4.58 | % | 9,949 | 9,884 | 9,949 | (6) | |||||||||||||||||||||||
| 9,884 | 9,949 | ||||||||||||||||||||||||||||
| MedAssets Software Intermediate Holdings, Inc. | Health Care Technology | ||||||||||||||||||||||||||||
| Second Lien Term Loan, LIBOR+7.75% cash due 1/29/2029 | 8.50 | % | 14,137 | 13,877 | 13,960 | (6)(15) | |||||||||||||||||||||||
| 13,877 | 13,960 | ||||||||||||||||||||||||||||
| MHE Intermediate Holdings, LLC | Diversified Support Services | ||||||||||||||||||||||||||||
| First Lien Term Loan, LIBOR+5.75% cash due 7/21/2027 | 6.75 | % | 16,429 | 16,111 | 16,100 | (6)(15) | |||||||||||||||||||||||
| First Lien Delayed Draw Term Loan, LIBOR+5.75% cash due 7/21/2027 | 6.75 | % | 106 | 84 | 83 | (6)(15)(19) | |||||||||||||||||||||||
| First Lien Revolver, LIBOR+5.75% cash due 7/21/2027 | — | (27) | (28) | (6)(15)(19) | |||||||||||||||||||||||||
| 16,168 | 16,155 | ||||||||||||||||||||||||||||
| Mindbody, Inc. | Internet Services & Infrastructure | ||||||||||||||||||||||||||||
| First Lien Term Loan, LIBOR+7.00% cash 1.50% PIK due 2/14/2025 | 8.00 | % | 38,774 | 37,513 | 38,038 | (6)(15) | |||||||||||||||||||||||
| First Lien Revolver, LIBOR+8.00% cash due 2/14/2025 | — | (75) | (76) | (6)(15)(19) | |||||||||||||||||||||||||
| 37,438 | 37,962 | ||||||||||||||||||||||||||||
| Portfolio Company/Type of Investment (1)(2)(3)(4)(5) | Cash Interest Rate (6) | Industry | Principal (7) | Cost | Fair Value | Notes | |||||||||||||||||||||||
| Ministry Brands, LLC | Application Software | ||||||||||||||||||||||||||||
| First Lien Revolver, LIBOR+5.00% cash due 12/2/2022 | $ | — | $ | (9) | $ | (9) | (6)(15)(19) | ||||||||||||||||||||||
| Second Lien Term Loan, LIBOR+9.25% cash due 6/2/2023 | 10.25 | % | 11,000 | 10,844 | 10,906 | (6)(15) | |||||||||||||||||||||||
| 10,835 | 10,897 | ||||||||||||||||||||||||||||
| Mosaic Companies, LLC | Home Improvement Retail | ||||||||||||||||||||||||||||
| First Lien Term Loan, LIBOR+6.75% cash due 7/2/2026 | 7.75 | % | 47,388 | 46,487 | 46,488 | (6)(15) | |||||||||||||||||||||||
| 46,487 | 46,488 | ||||||||||||||||||||||||||||
| MRI Software LLC | Application Software | ||||||||||||||||||||||||||||
| First Lien Term Loan, LIBOR+5.50% cash due 2/10/2026 | 6.50 | % | 27,352 | 26,815 | 27,335 | (6)(15) | |||||||||||||||||||||||
| First Lien Delayed Draw Term Loan, LIBOR+5.50% cash due 2/10/2026 | — | (25) | — | (6)(15)(19) | |||||||||||||||||||||||||
| First Lien Revolver, LIBOR+5.50% cash due 2/10/2026 | — | (13) | (1) | (6)(15)(19) | |||||||||||||||||||||||||
| 26,777 | 27,334 | ||||||||||||||||||||||||||||
| Navisite, LLC | Data Processing & Outsourced Services | ||||||||||||||||||||||||||||
| Second Lien Term Loan, LIBOR+8.50% cash due 12/30/2026 | 9.50 | % | 22,560 | 22,165 | 22,176 | (6)(15) | |||||||||||||||||||||||
| 22,165 | 22,176 | ||||||||||||||||||||||||||||
| NeuAG, LLC | Fertilizers & Agricultural Chemicals | ||||||||||||||||||||||||||||
| First Lien Term Loan, LIBOR+5.50% cash 7.00% PIK due 9/11/2024 | 7.00 | % | 47,031 | 45,279 | 45,996 | (6)(15) | |||||||||||||||||||||||
| First Lien Delayed Draw Term Loan, LIBOR+5.50% cash 7.00% PIK due 9/11/2024 | — | (202) | (120) | (6)(15)(19) | |||||||||||||||||||||||||
| 45,077 | 45,876 | ||||||||||||||||||||||||||||
| NN, Inc. | Industrial Machinery | ||||||||||||||||||||||||||||
| First Lien Term Loan, LIBOR+6.88% cash due 9/19/2026 | 7.88 | % | 59,309 | 57,971 | 58,419 | (6)(11)(15) | |||||||||||||||||||||||
| 57,971 | 58,419 | ||||||||||||||||||||||||||||
| OEConnection LLC | Application Software | ||||||||||||||||||||||||||||
| First Lien Term Loan, LIBOR+4.00% cash due 9/25/2026 | 4.08 | % | 3,355 | 3,152 | 3,351 | (6) | |||||||||||||||||||||||
| 3,152 | 3,351 | ||||||||||||||||||||||||||||
| Olaplex, Inc. | Personal Products | ||||||||||||||||||||||||||||
| First Lien Term Loan, LIBOR+6.25% cash due 1/8/2026 | 7.25 | % | 52,122 | 50,906 | 51,731 | (6)(15) | |||||||||||||||||||||||
| First Lien Revolver, LIBOR+6.25% cash due 1/8/2025 | — | (58) | (75) | (6)(15)(19) | |||||||||||||||||||||||||
| 50,848 | 51,656 | ||||||||||||||||||||||||||||
| OmniSYS Acquisition Corporation | Diversified Support Services | ||||||||||||||||||||||||||||
| 100,000 Common Units in OSYS Holdings, LLC | 1,000 | 729 | (15) | ||||||||||||||||||||||||||
| 1,000 | 729 | ||||||||||||||||||||||||||||
| Onvoy, LLC | Integrated Telecommunication Services | ||||||||||||||||||||||||||||
| First Lien Term Loan, LIBOR+4.50% cash due 2/10/2024 | 5.50 | % | 3,601 | 3,410 | 3,603 | (6) | |||||||||||||||||||||||
| Second Lien Term Loan, LIBOR+10.50% cash due 2/10/2025 | 11.50 | % | 9,277 | 9,277 | 9,277 | (6)(15) | |||||||||||||||||||||||
| 19,666.67 Class A Units in GTCR Onvoy Holdings, LLC | 1,967 | 2,372 | (15) | ||||||||||||||||||||||||||
| 13,664.73 Series 3 Class B Units in GTCR Onvoy Holdings, LLC | — | — | (15) | ||||||||||||||||||||||||||
| 14,654 | 15,252 | ||||||||||||||||||||||||||||
| OTG Management, LLC | Airport Services | ||||||||||||||||||||||||||||
| First Lien Term Loan, LIBOR+10.00% cash due 9/1/2025 | 11.00 | % | 19,894 | 19,504 | 19,496 | (6)(15) | |||||||||||||||||||||||
| First Lien Delayed Draw Term Loan, LIBOR+10.00% cash due 9/1/2025 | — | (37) | (38) | (6)(15)(19) | |||||||||||||||||||||||||
| 19,467 | 19,458 | ||||||||||||||||||||||||||||
| P & L Development, LLC | Pharmaceuticals | ||||||||||||||||||||||||||||
| Fixed Rate Bond, 7.75% cash due 11/15/2025 | 7,776 | 7,832 | 8,089 | ||||||||||||||||||||||||||
| 7,832 | 8,089 | ||||||||||||||||||||||||||||
| Park Place Technologies, LLC | Internet Services & Infrastructure | ||||||||||||||||||||||||||||
| First Lien Term Loan, LIBOR+5.00% cash due 11/10/2027 | 6.00 | % | 9,950 | 9,479 | 9,961 | (6) | |||||||||||||||||||||||
| 9,479 | 9,961 | ||||||||||||||||||||||||||||
| Portfolio Company/Type of Investment (1)(2)(3)(4)(5) | Cash Interest Rate (6) | Industry | Principal (7) | Cost | Fair Value | Notes | |||||||||||||||||||||||
| Performance Health Holdings, Inc. | Health Care Distributors | ||||||||||||||||||||||||||||
| First Lien Term Loan, LIBOR+6.00% cash due 7/12/2027 | 7.00 | % | $ | 20,085 | $ | 19,698 | $ | 19,683 | (6)(15) | ||||||||||||||||||||
| 19,698 | 19,683 | ||||||||||||||||||||||||||||
| Pingora MSR Opportunity Fund I-A, LP | Thrifts & Mortgage Finance | ||||||||||||||||||||||||||||
| 1.86% limited partnership interest | 752 | 112 | (11)(16)(19) | ||||||||||||||||||||||||||
| 752 | 112 | ||||||||||||||||||||||||||||
| Planview Parent, Inc. | Application Software | ||||||||||||||||||||||||||||
| Second Lien Term Loan, LIBOR+7.25% cash due 12/18/2028 | 8.00 | % | 28,627 | 28,198 | 28,699 | (6)(15) | |||||||||||||||||||||||
| 28,198 | 28,699 | ||||||||||||||||||||||||||||
| PLNTF Holdings, LLC | Leisure Facilities | ||||||||||||||||||||||||||||
| First Lien Term Loan, LIBOR+8.00% cash due 3/22/2026 | 9.00 | % | 13,729 | 13,482 | 13,798 | (6)(15) | |||||||||||||||||||||||
| 13,482 | 13,798 | ||||||||||||||||||||||||||||
| Pluralsight, LLC | Application Software | ||||||||||||||||||||||||||||
| First Lien Term Loan, LIBOR+8.00% cash due 4/6/2027 | 9.00 | % | 48,689 | 47,788 | 47,763 | (6)(15) | |||||||||||||||||||||||
| First Lien Revolver, LIBOR+8.00% cash due 4/6/2027 | — | (65) | (67) | (6)(15)(19) | |||||||||||||||||||||||||
| 47,723 | 47,696 | ||||||||||||||||||||||||||||
| PRGX Global, Inc. | Data Processing & Outsourced Services | ||||||||||||||||||||||||||||
| First Lien Term Loan, LIBOR+6.75% cash due 3/3/2026 | 7.75 | % | 34,118 | 33,016 | 33,547 | (6)(15) | |||||||||||||||||||||||
| First Lien Revolver, LIBOR+6.75% cash due 3/3/2026 | — | (44) | (42) | (6)(15)(19) | |||||||||||||||||||||||||
| 80,515 Class B Common Units | 79 | 81 | (15) | ||||||||||||||||||||||||||
| 33,051 | 33,586 | ||||||||||||||||||||||||||||
| ProFrac Services, LLC | Industrial Machinery | ||||||||||||||||||||||||||||
| First Lien Term Loan, LIBOR+8.50% cash due 9/15/2023 | 9.75 | % | 30,910 | 29,146 | 30,600 | (6)(15) | |||||||||||||||||||||||
| 29,146 | 30,600 | ||||||||||||||||||||||||||||
| Project Boost Purchaser, LLC | Application Software | ||||||||||||||||||||||||||||
| Second Lien Term Loan, LIBOR+8.00% cash due 5/31/2027 | 8.08 | % | 5,250 | 5,151 | 5,224 | (6)(15) | |||||||||||||||||||||||
| 5,151 | 5,224 | ||||||||||||||||||||||||||||
| Quantum Bidco Limited | Food Distributors | ||||||||||||||||||||||||||||
| First Lien Term Loan, UK LIBOR+6.00% cash due 1/29/2028 | 6.11 | % | £ | 3,501 | 4,625 | 4,673 | (6)(11) | ||||||||||||||||||||||
| 4,625 | 4,673 | ||||||||||||||||||||||||||||
| QuorumLabs, Inc. | Application Software | ||||||||||||||||||||||||||||
| 64,887,669 Junior-2 Preferred Stock | 375 | — | (15) | ||||||||||||||||||||||||||
| 375 | — | ||||||||||||||||||||||||||||
| Relativity ODA LLC | Application Software | ||||||||||||||||||||||||||||
| First Lien Term Loan, LIBOR+7.50% PIK due 5/12/2027 | $ | 22,856 | 22,337 | 22,376 | (6)(15) | ||||||||||||||||||||||||
| First Lien Revolver, LIBOR+6.50% cash due 5/12/2027 | — | (52) | (47) | (6)(15)(19) | |||||||||||||||||||||||||
| 22,285 | 22,329 | ||||||||||||||||||||||||||||
| Renaissance Holding Corp. | Diversified Banks | ||||||||||||||||||||||||||||
| Second Lien Term Loan, LIBOR+7.00% cash due 5/29/2026 | 7.08 | % | 3,542 | 3,515 | 3,562 | (6) | |||||||||||||||||||||||
| 3,515 | 3,562 | ||||||||||||||||||||||||||||
| RevSpring, Inc. | Commercial Printing | ||||||||||||||||||||||||||||
| First Lien Term Loan, LIBOR+4.25% cash due 10/11/2025 | 4.38 | % | 9,725 | 9,185 | 9,709 | (6) | |||||||||||||||||||||||
| 9,185 | 9,709 | ||||||||||||||||||||||||||||
| RumbleOn, Inc. | Automotive Retail | ||||||||||||||||||||||||||||
| First Lien Term Loan, LIBOR+8.25% cash due 8/31/2026 | 9.25 | % | 38,036 | 35,651 | 35,640 | (6)(11)(15) | |||||||||||||||||||||||
| First Lien Delayed Draw Term Loan, LIBOR+8.25% cash due 8/31/2026 | — | (1,022) | (1,027) | (6)(11)(15)(19) | |||||||||||||||||||||||||
| 164,660 Class B Common Stock Warrants (exercise price $33.00) expiration date 2/28/2023 | 1,202 | 1,553 | (15) | ||||||||||||||||||||||||||
| 35,831 | 36,166 | ||||||||||||||||||||||||||||
| Portfolio Company/Type of Investment (1)(2)(3)(4)(5) | Cash Interest Rate (6) | Industry | Principal (7) | Cost | Fair Value | Notes | |||||||||||||||||||||||
| Sabert Corporation | Metal & Glass Containers | ||||||||||||||||||||||||||||
| First Lien Term Loan, LIBOR+4.50% cash due 12/10/2026 | 5.50 | % | $ | 1,818 | $ | 1,711 | $ | 1,825 | (6) | ||||||||||||||||||||
| 1,711 | 1,825 | ||||||||||||||||||||||||||||
| Scilex Pharmaceuticals Inc. | Pharmaceuticals | ||||||||||||||||||||||||||||
| Fixed Rate Zero Coupon Bond due 8/15/2026 | 7,692 | 6,512 | 7,169 | (15) | |||||||||||||||||||||||||
| 6,512 | 7,169 | ||||||||||||||||||||||||||||
| ShareThis, Inc. | Application Software | ||||||||||||||||||||||||||||
| 345,452 Series C Preferred Stock Warrants (exercise price $3.0395) expiration date 3/4/2024 | 367 | — | (15) | ||||||||||||||||||||||||||
| 367 | — | ||||||||||||||||||||||||||||
| SIO2 Medical Products, Inc. | Metal & Glass Containers | ||||||||||||||||||||||||||||
| Subordinated Debt, 11.25% cash due 2/28/2022 | 15,896 | 15,161 | 15,022 | (15) | |||||||||||||||||||||||||
| Subordinated Delayed Draw Debt, 11.25% cash due 2/28/2022 | — | (110) | (119) | (15)(19) | |||||||||||||||||||||||||
| Common Stock Warrants (exercise price $0.75) expiration date 7/31/2028 | 681 | 685 | (15) | ||||||||||||||||||||||||||
| 15,732 | 15,588 | ||||||||||||||||||||||||||||
| Sirva Worldwide, Inc. | Diversified Support Services | ||||||||||||||||||||||||||||
| First Lien Term Loan, LIBOR+5.50% cash due 8/4/2025 | 5.58 | % | 1,739 | 1,554 | 1,644 | (6) | |||||||||||||||||||||||
| 1,554 | 1,644 | ||||||||||||||||||||||||||||
| SM Wellness Holdings, Inc. | Health Care Services | ||||||||||||||||||||||||||||
| Second Lien Term Loan, LIBOR+8.00% cash due 4/16/2029 | 8.75 | % | 9,109 | 8,972 | 9,177 | (6)(15) | |||||||||||||||||||||||
| 8,972 | 9,177 | ||||||||||||||||||||||||||||
| SonicWall US Holdings Inc. | Technology Distributors | ||||||||||||||||||||||||||||
| Second Lien Term Loan, LIBOR+7.50% cash due 5/18/2026 | 7.63 | % | 3,195 | 3,163 | 3,178 | (6) | |||||||||||||||||||||||
| 3,163 | 3,178 | ||||||||||||||||||||||||||||
| Sorrento Therapeutics, Inc. | Biotechnology | ||||||||||||||||||||||||||||
| 50,000 Common Stock Units | 197 | 382 | (11) | ||||||||||||||||||||||||||
| 197 | 382 | ||||||||||||||||||||||||||||
| Star US Bidco LLC | Industrial Machinery | ||||||||||||||||||||||||||||
| First Lien Term Loan, LIBOR+4.25% cash due 3/17/2027 | 5.25 | % | 1,194 | 1,114 | 1,199 | (6) | |||||||||||||||||||||||
| 1,114 | 1,199 | ||||||||||||||||||||||||||||
| SumUp Holdings Luxembourg S.À.R.L. | Other Diversified Financial Services | ||||||||||||||||||||||||||||
| First Lien Delayed Draw Term Loan, EURIBOR+8.50% cash due 3/10/2026 | 10.00 | % | € | 13,980 | 15,991 | 15,908 | (6)(11)(15)(19) | ||||||||||||||||||||||
| 15,991 | 15,908 | ||||||||||||||||||||||||||||
| Sunland Asphalt & Construction, LLC | Construction & Engineering | ||||||||||||||||||||||||||||
| First Lien Term Loan, LIBOR+6.00% cash due 1/13/2026 | 7.00 | % | $ | 43,052 | 41,782 | 42,450 | (6)(15) | ||||||||||||||||||||||
| First Lien Revolver, LIBOR+6.00% cash due 1/13/2022 | 7.00 | % | 203 | 150 | 169 | (6)(15)(19) | |||||||||||||||||||||||
| 41,932 | 42,619 | ||||||||||||||||||||||||||||
| Supermoose Borrower, LLC | Application Software | ||||||||||||||||||||||||||||
| First Lien Term Loan, LIBOR+3.75% cash due 8/29/2025 | 3.88 | % | 8,576 | 7,581 | 7,996 | (6) | |||||||||||||||||||||||
| 7,581 | 7,996 | ||||||||||||||||||||||||||||
| SVP-Singer Holdings Inc. | Home Furnishings | ||||||||||||||||||||||||||||
| First Lien Term Loan, LIBOR+6.75% cash due 7/28/2028 | 7.50 | % | 20,976 | 19,537 | 19,735 | (6)(15) | |||||||||||||||||||||||
| 19,537 | 19,735 | ||||||||||||||||||||||||||||
| Swordfish Merger Sub LLC | Auto Parts & Equipment | ||||||||||||||||||||||||||||
| Second Lien Term Loan, LIBOR+6.75% cash due 2/2/2026 | 7.75 | % | 12,500 | 12,466 | 12,365 | (6)(15) | |||||||||||||||||||||||
| 12,466 | 12,365 | ||||||||||||||||||||||||||||
| Tacala, LLC | Restaurants | ||||||||||||||||||||||||||||
| Second Lien Term Loan, LIBOR+7.50% cash due 2/4/2028 | 8.25 | % | 9,448 | 9,317 | 9,451 | (6) | |||||||||||||||||||||||
| 9,317 | 9,451 | ||||||||||||||||||||||||||||
| Portfolio Company/Type of Investment (1)(2)(3)(4)(5) | Cash Interest Rate (6) | Industry | Principal (7) | Cost | Fair Value | Notes | |||||||||||||||||||||||
| Tecta America Corp. | Construction & Engineering | ||||||||||||||||||||||||||||
| Second Lien Term Loan, LIBOR+8.50% cash due 4/9/2029 | 9.25 | % | $ | 5,203 | $ | 5,125 | $ | 5,203 | (6)(15) | ||||||||||||||||||||
| 5,125 | 5,203 | ||||||||||||||||||||||||||||
| Telestream Holdings Corporation | Application Software | ||||||||||||||||||||||||||||
| First Lien Term Loan, LIBOR+8.75% cash due 10/15/2025 | 9.75 | % | 18,510 | 18,017 | 18,250 | (6)(15) | |||||||||||||||||||||||
| First Lien Revolver, LIBOR+8.75% cash due 10/15/2025 | 9.75 | % | 492 | 464 | 468 | (6)(15)(19) | |||||||||||||||||||||||
| 18,481 | 18,718 | ||||||||||||||||||||||||||||
| TerSera Therapeutics LLC | Pharmaceuticals | ||||||||||||||||||||||||||||
| Second Lien Term Loan, LIBOR+9.50% cash due 3/30/2026 | 10.50 | % | 29,663 | 29,359 | 29,371 | (6)(15) | |||||||||||||||||||||||
| 668,879 Common Units of TerSera Holdings LLC | 2,192 | 3,487 | (15) | ||||||||||||||||||||||||||
| 31,551 | 32,858 | ||||||||||||||||||||||||||||
| TGNR HoldCo LLC | Integrated Oil & Gas | ||||||||||||||||||||||||||||
| Subordinated Debt, 11.50% cash due 5/14/2026 | 4,984 | 4,842 | 4,884 | (11)(15)(20) | |||||||||||||||||||||||||
| 4,842 | 4,884 | ||||||||||||||||||||||||||||
| Thermacell Repellents, Inc. | Leisure Products | ||||||||||||||||||||||||||||
| First Lien Term Loan, LIBOR+5.75% cash due 12/4/2026 | 6.75 | % | 6,636 | 6,603 | 6,603 | (6)(15) | |||||||||||||||||||||||
| First Lien Revolver, LIBOR+5.75% cash due 12/4/2026 | — | (4) | (4) | (6)(15)(19) | |||||||||||||||||||||||||
| 6,599 | 6,599 | ||||||||||||||||||||||||||||
| Thrasio, LLC | Internet & Direct Marketing Retail | ||||||||||||||||||||||||||||
| First Lien Term Loan, LIBOR+7.00% cash due 12/18/2026 | 8.00 | % | 37,876 | 36,736 | 37,686 | (6)(15) | |||||||||||||||||||||||
| 8,434 Shares of Series C-3 Preferred Stock in Thrasio Holdings, Inc. | 101 | 171 | (15) | ||||||||||||||||||||||||||
| 284,650.32 Shares of Series C-2 Preferred Stock in Thrasio Holdings, Inc. | 2,410 | 5,764 | (15) | ||||||||||||||||||||||||||
| 23,201 Shares of Series X Preferred Stock in Thrasio Holdings, Inc. | 22,986 | 24,803 | (15)(19) | ||||||||||||||||||||||||||
| 62,233 | 68,424 | ||||||||||||||||||||||||||||
| TIBCO Software Inc. | Application Software | ||||||||||||||||||||||||||||
| Second Lien Term Loan, LIBOR+7.25% cash due 3/3/2028 | 7.34 | % | 16,788 | 16,681 | 17,002 | (6) | |||||||||||||||||||||||
| 16,681 | 17,002 | ||||||||||||||||||||||||||||
| TigerConnect, Inc. | Application Software | ||||||||||||||||||||||||||||
| 299,110 Series B Preferred Stock Warrants (exercise price $1.3373) expiration date 12/8/2024 | 60 | 525 | (15) | ||||||||||||||||||||||||||
| 60 | 525 | ||||||||||||||||||||||||||||
| Transact Holdings Inc. | Application Software | ||||||||||||||||||||||||||||
| First Lien Term Loan, LIBOR+4.75% cash due 4/30/2026 | 4.83 | % | 6,860 | 6,757 | 6,809 | (6)(15) | |||||||||||||||||||||||
| 6,757 | 6,809 | ||||||||||||||||||||||||||||
| Velocity Commercial Capital, LLC | Thrifts & Mortgage Finance | ||||||||||||||||||||||||||||
| First Lien Term Loan, LIBOR+8.00% cash due 2/5/2026 | 9.00 | % | 15,909 | 15,327 | 15,830 | (6)(15) | |||||||||||||||||||||||
| 15,327 | 15,830 | ||||||||||||||||||||||||||||
| Veritas US Inc. | Application Software | ||||||||||||||||||||||||||||
| First Lien Term Loan, LIBOR+5.00% cash due 9/1/2025 | 6.00 | % | 5,940 | 5,599 | 5,975 | (6) | |||||||||||||||||||||||
| 5,599 | 5,975 | ||||||||||||||||||||||||||||
| Vitalyst Holdings, Inc. | IT Consulting & Other Services | ||||||||||||||||||||||||||||
| 675 Series A Preferred Stock Units | 675 | 440 | (15) | ||||||||||||||||||||||||||
| 7,500 Class A Common Stock Units | 75 | — | (15) | ||||||||||||||||||||||||||
| 750 | 440 | ||||||||||||||||||||||||||||
| Win Brands Group LLC | Housewares & Specialties | ||||||||||||||||||||||||||||
| First Lien Term Loan, LIBOR+9.00% cash 5.00% PIK due 1/22/2026 | 10.00 | % | 1,894 | 1,875 | 1,884 | (6)(15) | |||||||||||||||||||||||
| 181 Class F Warrants in Brand Value Growth LLC (exercise price $0.01) expiration date 1/25/2027 | — | 119 | (15) | ||||||||||||||||||||||||||
| 1,875 | 2,003 | ||||||||||||||||||||||||||||
| Portfolio Company/Type of Investment (1)(2)(3)(4)(5) | Cash Interest Rate (6) | Industry | Principal (7) | Cost | Fair Value | Notes | |||||||||||||||||||||||
| Windstream Services II, LLC | Integrated Telecommunication Services | ||||||||||||||||||||||||||||
| First Lien Term Loan, LIBOR+6.25% cash due 9/21/2027 | 7.25 | % | $ | 31,598 | $ | 30,347 | $ | 31,793 | (6) | ||||||||||||||||||||
| 18,032 Shares of Common Stock in Windstream Holdings II, LLC | 216 | 363 | (15) | ||||||||||||||||||||||||||
| 109,420 Warrants in Windstream Holdings II, LLC | 1,842 | 2,199 | (15) | ||||||||||||||||||||||||||
| 32,405 | 34,355 | ||||||||||||||||||||||||||||
| WP CPP Holdings, LLC | Aerospace & Defense | ||||||||||||||||||||||||||||
| First Lien Term Loan, LIBOR+3.75% cash due 4/30/2025 | 4.75 | % | 4,369 | 4,005 | 4,264 | (6) | |||||||||||||||||||||||
| Second Lien Term Loan, LIBOR+7.75% cash due 4/30/2026 | 8.75 | % | 16,000 | 15,758 | 15,815 | (6)(15) | |||||||||||||||||||||||
| 19,763 | 20,079 | ||||||||||||||||||||||||||||
| WPEngine, Inc. | Application Software | ||||||||||||||||||||||||||||
| First Lien Term Loan, LIBOR+6.50% cash due 3/27/2026 | 7.50 | % | 40,536 | 39,778 | 40,013 | (6)(15) | |||||||||||||||||||||||
| 39,778 | 40,013 | ||||||||||||||||||||||||||||
| WWEX Uni Topco Holdings, LLC | Air Freight & Logistics | ||||||||||||||||||||||||||||
| Second Lien Term Loan, LIBOR+7.00% cash due 7/26/2029 | 7.75 | % | 5,000 | 4,925 | 4,981 | (6) | |||||||||||||||||||||||
| 4,925 | 4,981 | ||||||||||||||||||||||||||||
| Zep Inc. | Specialty Chemicals | ||||||||||||||||||||||||||||
| First Lien Term Loan, LIBOR+4.00% cash due 8/12/2024 | 5.00 | % | 6,495 | 6,165 | 6,353 | (6) | |||||||||||||||||||||||
| Second Lien Term Loan, LIBOR+8.25% cash due 8/11/2025 | 9.25 | % | 22,748 | 22,692 | 21,993 | (6)(15) | |||||||||||||||||||||||
| 28,857 | 28,346 | ||||||||||||||||||||||||||||
| Zephyr Bidco Limited | Specialized Finance | ||||||||||||||||||||||||||||
| Second Lien Term Loan, UK LIBOR+7.50% cash due 7/23/2026 | 7.55 | % | £ | 18,000 | 23,783 | 24,210 | (6)(11) | ||||||||||||||||||||||
| 23,783 | 24,210 | ||||||||||||||||||||||||||||
| Total Non-Control/Non-Affiliate Investments (172.7% of net assets) | $ | 2,236,759 | $ | 2,267,575 | |||||||||||||||||||||||||
| Total Portfolio Investments (194.7% of net assets) | $ | 2,539,121 | $ | 2,556,629 | |||||||||||||||||||||||||
| Cash and Cash Equivalents and Restricted Cash | |||||||||||||||||||||||||||||
| JP Morgan Prime Money Market Fund, Institutional Shares | $ | 23,600 | $ | 23,600 | |||||||||||||||||||||||||
| Other cash accounts | 8,035 | 8,035 | |||||||||||||||||||||||||||
| Total Cash and Cash Equivalents and Restricted Cash (2.4% of net assets) | $ | 31,635 | $ | 31,635 | |||||||||||||||||||||||||
| Total Portfolio Investments and Cash and Cash Equivalents and Restricted Cash (197.2% of net assets) | $ | 2,570,756 | $ | 2,588,264 | |||||||||||||||||||||||||
| Derivative Instrument | Notional Amount to be Purchased | Notional Amount to be Sold | Maturity Date | Counterparty | Cumulative Unrealized Appreciation /(Depreciation) | |||||||||||||||||||||||||||
| Foreign currency forward contract | $ | 52,186 | £ | 37,709 | 11/12/2021 | JPMorgan Chase Bank, N.A. | $ | 1,339 | ||||||||||||||||||||||||
| Foreign currency forward contract | $ | 46,663 | € | 39,736 | 11/12/2021 | JPMorgan Chase Bank, N.A. | 573 | |||||||||||||||||||||||||
| $ | 1,912 | |||||||||||||||||||||||||||||||
| Derivative Instrument | Company Receives | Company Pays | Counterparty | Maturity Date | Notional Amount | Fair Value | ||||||||||||||||||||||||||||||||
| Interest rate swap | Fixed 2.7% | Floating 3-month LIBOR +1.658% | Royal Bank of Canada | 1/15/2027 | $350,000 | $(2,108) | ||||||||||||||||||||||||||||||||
| Portfolio Company/Type of Investment (1)(2)(5)(9)(14)(20) | Cash Interest Rate (13) | Industry | Principal (8) | Cost | Fair Value | ||||||||||||
| Control Investments (3)(15) | |||||||||||||||||
| Traffic Solutions Holdings, Inc. | Construction and engineering | ||||||||||||||||
| First Lien Term Loan, LIBOR+7% (1% floor) cash 2% PIK due 4/1/2021 (13) | 8.00 | % | $ | 36,180 | $ | 36,152 | $ | 36,328 | |||||||||
| First Lien Revolver, LIBOR+6% (1% floor) cash due 4/1/2021 (13) | 7.00 | % | 2,800 | 2,797 | 2,800 | ||||||||||||
| LC Facility, 6.0% cash due 4/1/2021 | 3,518 | 3,514 | 3,518 | ||||||||||||||
| 746,114 Series A Preferred Units, 10% | 18,558 | 20,094 | |||||||||||||||
| 746,114 Shares of Common Stock | 5,316 | — | |||||||||||||||
| 66,337 | 62,740 | ||||||||||||||||
| TransTrade Operators, Inc. | Air freight & logistics | ||||||||||||||||
| First Lien Term Loan, 5% cash due 12/31/2017 | 15,973 | 15,572 | 7,046 | ||||||||||||||
| First Lien Revolver, 8% cash due 12/31/2017 | 6,885 | 6,885 | — | ||||||||||||||
| 596.67 Series A Common Units | — | — | |||||||||||||||
| 4,000,000 Series A Preferred Units in TransTrade Holdings LLC | 4,000 | — | |||||||||||||||
| 5,200,000 Series B Preferred Units in TransTrade Holdings LLC | 5,200 | — | |||||||||||||||
| 31,657 | 7,046 | ||||||||||||||||
| First Star Aviation, LLC (16) | Airlines | ||||||||||||||||
| 10,104,401 Common Units (6) | 5,533 | 2,413 | |||||||||||||||
| 5,533 | 2,413 | ||||||||||||||||
| First Star Speir Aviation Limited (11)(16) | Airlines | ||||||||||||||||
| First Lien Term Loan, 9% cash due 12/15/2020 | 55,395 | 50,305 | 54,214 | ||||||||||||||
| 2,058,411.64 Common Units (6) | — | 2,839 | |||||||||||||||
| 50,305 | 57,053 | ||||||||||||||||
| First Star Bermuda Aviation Limited (11)(16) | Airlines | ||||||||||||||||
| First Lien Term Loan, 9% cash 3% PIK due 8/19/2018 | 11,868 | 11,868 | 11,851 | ||||||||||||||
| 4,293,736 Common Units (6) | 3,360 | 5,729 | |||||||||||||||
| 15,228 | 17,580 | ||||||||||||||||
| Eagle Hospital Physicians, LLC | Healthcare services | ||||||||||||||||
| First Lien Term Loan A, 8% PIK due 4/30/2017 | 13,889 | 13,889 | 13,875 | ||||||||||||||
| First Lien Term Loan B, 8.1% PIK due 4/30/2017 | 3,889 | 3,889 | 3,887 | ||||||||||||||
| First Lien Revolver, 8% cash due 4/30/2017 | 1,913 | 1,913 | 1,913 | ||||||||||||||
| 4,100,000 Class A Common Units | 4,100 | 7,421 | |||||||||||||||
| 23,791 | 27,096 | ||||||||||||||||
| Senior Loan Fund JV I, LLC (11)(17) | Multi-sector holdings | ||||||||||||||||
| Subordinated Notes, LIBOR+8% cash due 5/2/2021 (13) | 8.47 | % | 144,841 | 144,841 | 129,004 | ||||||||||||
| 87.5% LLC equity interest (6) | 16,094 | 13,708 | |||||||||||||||
| 160,935 | 142,712 | ||||||||||||||||
| Express Group Holdings LLC (18) | Oil & gas equipment services | ||||||||||||||||
| First Lien Term Loan, LIBOR+8% (1% floor) cash due 9/3/2019 (13) | 9.00% | 12,073 | 12,073 | 1,193 | |||||||||||||
| First Lien Revolver, LIBOR+4.5% (1% floor) cash due 3/4/2019 (13) | 5.50% | 6,090 | 6,090 | 6,090 | |||||||||||||
| Last-In Revolver, PRIME+3.5% cash due 10/7/2016 | 7.00% | 3,000 | 3,000 | 3,000 | |||||||||||||
| 14,033,391 Series B Preferred Units | 3,982 | — | |||||||||||||||
| 280,668 Series A Preferred Units | 1,593 | — | |||||||||||||||
| 1,456,344 Common Stock Units | — | — | |||||||||||||||
| 26,738 | 10,283 | ||||||||||||||||
| Ameritox Ltd. (19) | Healthcare services | ||||||||||||||||
| First Lien Term Loan, LIBOR+5% (1% floor) cash 3% PIK due 4/11/2021 (13) | 6.00% | 31,258 | 31,228 | 31,039 | |||||||||||||
| 14,090,126.4 Class A Preferred Units in Ameritox Holdings II, LLC | 14,090 | 15,437 | |||||||||||||||
| 1,602,260.83 Class B Preferred Units in Ameritox Holdings II, LLC | 1,602 | 1,755 | |||||||||||||||
| 4,930.03 Class A Units in Ameritox Holdings II, LLC | 29,049 | 13,113 | |||||||||||||||
| 75,969 | 61,344 | ||||||||||||||||
| Total Control Investments (34.0% of net assets) | $ | 456,493 | $ | 388,267 | |||||||||||||
| Portfolio Company/Type of Investment (1)(2)(5)(9)(14)(20) | Cash Interest Rate (13) | Industry | Principal (8) | Cost | Fair Value | |||||||||||
| Affiliate Investments (4) | ||||||||||||||||
| Caregiver Services, Inc. | Healthcare services | |||||||||||||||
| Second Lien Term Loan, 10% cash 2% PIK due 6/30/2019 | $ | 9,524 | $ | 9,524 | $ | 9,549 | ||||||||||
| 1,080,399 Shares of Series A Preferred Stock, 10% | 1,080 | 4,079 | ||||||||||||||
| 10,604 | 13,628 | |||||||||||||||
| AmBath/ReBath Holdings, Inc. | Home improvement retail | |||||||||||||||
| First Lien Term Loan B, 12.5% cash 2.5% PIK due 8/31/2017 | 24,364 | $ | 24,351 | $ | 24,268 | |||||||||||
| 4,668,788 Shares of Preferred Stock | — | 1,873 | ||||||||||||||
| 24,351 | 26,141 | |||||||||||||||
| Total Affiliate Investments (3.5% of net assets) | $ | 34,955 | $ | 39,769 | ||||||||||||
| Non-Control/Non-Affiliate Investments (7) | ||||||||||||||||
| HealthDrive Corporation | Healthcare services | |||||||||||||||
| First Lien Term Loan A, 12% cash due 12/31/2016 | 3,958 | $ | 3,958 | $ | 3,958 | |||||||||||
| First Lien Term Loan B, 12% cash 2% PIK due 12/31/2016 | 11,938 | 11,938 | 11,938 | |||||||||||||
| First Lien Revolver, 12% cash due 12/31/2016 | 466 | 466 | 466 | |||||||||||||
| 16,362 | 16,362 | |||||||||||||||
| Cenegenics, LLC | Healthcare services | |||||||||||||||
| First Lien Term Loan, 9.75% cash 2% PIK due 9/30/2019 | 29,662 | 29,629 | 29,812 | |||||||||||||
| First Lien Revolver, 15% cash due 9/30/2019 | 1,000 | 1,000 | 1,000 | |||||||||||||
| 452,914.87 Common Units in Cenegenics, LLC | 598 | 613 | ||||||||||||||
| 345,380.141 Preferred Units in Cenegenics, LLC | 300 | 300 | ||||||||||||||
| 31,527 | 31,725 | |||||||||||||||
| Riverlake Equity Partners II, LP | Multi-sector holdings | |||||||||||||||
| 1.78% limited partnership interest (11) | 823 | 755 | ||||||||||||||
| 823 | 755 | |||||||||||||||
| Riverside Fund IV, LP | Multi-sector holdings | |||||||||||||||
| 0.34% limited partnership interest (11) | 456 | 302 | ||||||||||||||
| 456 | 302 | |||||||||||||||
| Bunker Hill Capital II (QP), L.P. | Multi-sector holdings | |||||||||||||||
| 0.51% limited partnership interest (11) | 810 | 739 | ||||||||||||||
| 810 | 739 | |||||||||||||||
| Portfolio Company/Type of Investment (1)(2)(5)(9)(14)(20) | Cash Interest Rate (13) | Industry | Principal (8) | Cost | Fair Value | ||||||||||||
| Maverick Healthcare Group, LLC | Healthcare equipment | ||||||||||||||||
| First Lien Term Loan A, LIBOR+5.5% cash (1.75% floor) cash 2% PIK due 4/30/2017 (13) | 7.25 | % | $ | 16,151 | $ | 16,108 | $ | 15,993 | |||||||||
| First Lien Term Loan B, LIBOR+5.5% cash (1.75% floor) cash 5.5% PIK due 4/30/2017 (13) | 7.25% | 39,159 | 39,110 | 38,900 | |||||||||||||
| CapEx Line, LIBOR+5.75% (1.75% floor) cash 2% PIK due 4/30/2017 (13) | 7.50 | % | 1,259 | 1,252 | 1,242 | ||||||||||||
| First Lien Revolver, PRIME+6.5% cash due 4/30/2017 (13) | 10.00% | 4,401 | 4,401 | 4,401 | |||||||||||||
| 60,871 | 60,536 | ||||||||||||||||
| Refac Optical Group | Specialty stores | ||||||||||||||||
| First Lien Term Loan A, LIBOR+7.5% cash due 9/30/2018 (13) | 8.02% | 6,198 | 6,150 | 6,190 | |||||||||||||
| First Lien Term Loan B, LIBOR+8.5% cash, 1.75% PIK due 9/30/2018 (13) | 9.02% | 34,290 | 34,149 | 33,967 | |||||||||||||
| First Lien Term Loan C, 12% cash due 9/30/2018 | 12.00% | 3,416 | 3,416 | 3,339 | |||||||||||||
| First Lien Revolver, LIBOR+7.5% cash due 9/30/2018 (13) | 8.02% | 1,600 | 1,596 | 1,600 | |||||||||||||
| 1,550.9435 Shares of Common Stock in Refac Holdings, Inc. | 1 | — | |||||||||||||||
| 550.9435 Shares of Series A-2 Preferred Stock in Refac Holdings, Inc., 10% | 305 | — | |||||||||||||||
| 1,000 Shares of Series A Preferred Stock Units in Refac Holdings, Inc., 10% | 999 | 136 | |||||||||||||||
| 46,616 | 45,232 | ||||||||||||||||
| Baird Capital Partners V, LP | Multi-sector holdings | ||||||||||||||||
| 0.4% limited partnership interest (11) | 1,000 | 558 | |||||||||||||||
| 1,000 | 558 | ||||||||||||||||
| Discovery Practice Management, Inc. | Healthcare services | ||||||||||||||||
| Senior Term Loan, LIBOR+9.25% cash due 11/4/2018 (13) | 9.90% | 30,698 | 30,651 | 30,698 | |||||||||||||
| Senior Revolver, LIBOR+7% cash due 11/4/2018 (10) (13) | 7.65% | — | (4 | ) | — | ||||||||||||
| Capex Line A, LIBOR+7% cash due 11/4/2018 (13) | 7.65% | 938 | 938 | 938 | |||||||||||||
| Capex Line B, LIBOR+7% cash due 11/4/2018 (13) | 7.65% | 2,000 | 2,000 | 2,000 | |||||||||||||
| 33,585 | 33,636 | ||||||||||||||||
| Milestone Partners IV, L.P. | Multi-sector holdings | ||||||||||||||||
| 0.85% limited partnership interest (11) | 1,739 | 2,005 | |||||||||||||||
| 1,739 | 2,005 | ||||||||||||||||
| National Spine and Pain Centers, LLC | Healthcare services | ||||||||||||||||
| Mezzanine Term Loan, 11% cash 1.6% PIK due 9/27/2020 | 30,720 | 30,679 | 30,750 | ||||||||||||||
| 317,282.97 Class A Units | 317 | 608 | |||||||||||||||
| 30,996 | 31,358 | ||||||||||||||||
| RCPDirect, L.P. | Multi-sector holdings | ||||||||||||||||
| 0.91% limited partnership interest (11) | 764 | 927 | |||||||||||||||
| 764 | 927 | ||||||||||||||||
| Riverside Fund V, L.P. | Multi-sector holdings | ||||||||||||||||
| 0.48% limited partnership interest (11) | 1,147 | 766 | |||||||||||||||
| 1,147 | 766 | ||||||||||||||||
| Portfolio Company/Type of Investment (1)(2)(5)(9)(14)(20) | Cash Interest Rate (13) | Industry | Principal (8) | Cost | Fair Value | |||||||||||
| ACON Equity Partners III, LP | ||||||||||||||||
| 0.13% limited partnership interest (11) | Multi-sector holdings | $ | 796 | $ | 482 | |||||||||||
| 796 | 482 | |||||||||||||||
| BMC Acquisition, Inc. | Other diversified financial services | |||||||||||||||
| 500 Series A Preferred Shares | 500 | 698 | ||||||||||||||
| 50,000 Common Shares (6) | 1 | — | ||||||||||||||
| 501 | 698 | |||||||||||||||
| Ansira Partners, Inc. | Advertising | |||||||||||||||
| Second Lien Term Loan, LIBOR+8.5% (1% floor) cash due 4/5/2021 (13) | 9.50% | $ | 38,000 | 38,000 | 37,840 | |||||||||||
| 209 Preferred Units of Ansira Holdings, LLC (6) | 209 | 234 | ||||||||||||||
| 250 Class A Common Units of Ansira Holdings, LLC | — | 368 | ||||||||||||||
| 38,209 | 38,442 | |||||||||||||||
| Edmentum, Inc. | Education services | |||||||||||||||
| Unsecured Senior PIK Note, 8.5% PIK due 6/9/2020 | 2,235 | 2,235 | 2,153 | |||||||||||||
| Unsecured Junior PIK Note, 10% PIK due 6/9/2020 | 10,227 | 10,227 | 8,064 | |||||||||||||
| Unsecured Revolver, 5% cash due 6/9/2020 | — | — | ||||||||||||||
| 126,127.80 Class A Common Units | 126 | — | ||||||||||||||
| 12,588 | 10,217 | |||||||||||||||
| I Drive Safely, LLC | Education services | |||||||||||||||
| 125,079 Class A Common Units of IDS Investments, LLC | 1,000 | 391 | ||||||||||||||
| 1,000 | 391 | |||||||||||||||
| Yeti Acquisition, LLC | Leisure products | |||||||||||||||
| 3,000,000 Common Stock Units of Yeti Holdings, Inc. (6) | — | 34,981 | ||||||||||||||
| — | 34,981 | |||||||||||||||
| Vitalyst Holdings, Inc. | IT consulting & other services | |||||||||||||||
| Subordinated Term Loan, 12% cash 1.5% PIK due 9/5/2018 | 19,681 | 19,682 | 19,697 | |||||||||||||
| 675 Series A Preferred Units of PCH Support Holdings, Inc., 10% | 675 | 418 | ||||||||||||||
| 7,500 Class A Common Stock Units of PCH Support Holdings, Inc. | 75 | — | ||||||||||||||
| 20,432 | 20,115 | |||||||||||||||
| Beecken Petty O'Keefe Fund IV, L.P. | Multi-sector holdings | |||||||||||||||
| 0.5% limited partnership interest (11) | 1,187 | 1,254 | ||||||||||||||
| 1,187 | 1,254 | |||||||||||||||
| First American Payment Systems, LP | Diversified support services | |||||||||||||||
| Second Lien Term Loan, LIBOR+9.5% (1.25% floor) cash due 4/12/2019 (13) | 10.75% | 23,304 | 23,304 | 22,546 | ||||||||||||
| First Lien Revolver, PRIME+3.5% cash due 10/12/2017 (13) | 7.00% | 2,000 | 2,000 | 1,975 | ||||||||||||
| 25,304 | 24,521 | |||||||||||||||
| Dexter Axle Company | Auto parts & equipment | |||||||||||||||
| 1,547 Common Shares in Dexter Axle Holding Company | 1,643 | 3,719 | ||||||||||||||
| 1,643 | 3,719 | |||||||||||||||
| Comprehensive Pharmacy Services LLC | Pharmaceuticals | |||||||||||||||
| Mezzanine Term Loan, 11.25% cash 1.5% PIK due 11/30/2019 | 14,798 | 14,798 | 14,811 | |||||||||||||
| 20,000 Common Shares in MCP CPS Group Holdings, Inc. | 2,000 | 2,435 | ||||||||||||||
| 16,798 | 17,246 | |||||||||||||||
| Portfolio Company/Type of Investment (1)(2)(5)(9)(14)(20) | Cash Interest Rate (13) | Industry | Principal (8) | Cost | Fair Value | |||||||||||
| Garretson Firm Resolution Group, Inc. | Diversified support services | |||||||||||||||
| First Lien Revolver, LIBOR+6.5% (1% floor) cash due 5/22/2020 (13) | 9.00% | $ | — | $ | — | |||||||||||
| 4,950,000 Preferred Units in GRG Holdings, LP, 8% | 495 | 611 | ||||||||||||||
| 50,000 Common Units in GRG Holdings, LP | 5 | — | ||||||||||||||
| 500 | 611 | |||||||||||||||
| Teaching Strategies, LLC | Education services | |||||||||||||||
| Senior Term Loan, LIBOR+5.5% (0.5% floor) cash due 10/1/2019 (13) | 6.34% | $ | 7,253 | 7,253 | 7,246 | |||||||||||
| Senior Revolver, LIBOR+5.5% (0.5% floor) cash due 10/1/2019 (13) | — | — | ||||||||||||||
| 7,253 | 7,246 | |||||||||||||||
| Omniplex World Services Corporation | Security & alarm services | |||||||||||||||
| Subordinated Term Loan, 12.25% cash 2.25% PIK due 8/19/2021 | 11,231 | 11,231 | 11,469 | |||||||||||||
| 500 Class A Common Units in Omniplex Holdings Corp. | 500 | 643 | ||||||||||||||
| 64.041 Class A-1 Common Units in Omniplex Holdings Corp. | 104 | — | ||||||||||||||
| 11,835 | 12,112 | |||||||||||||||
| Dominion Diagnostics, LLC | Healthcare services | |||||||||||||||
| Subordinated Term Loan, 11% cash 1% PIK due 10/8/2019 | 16,318 | 16,195 | 3,365 | |||||||||||||
| 16,195 | 3,365 | |||||||||||||||
| AdVenture Interactive, Corp. | Advertising | |||||||||||||||
| First Lien Term Loan, LIBOR+7.75% (1.00% floor) cash due 3/22/2018 (13) | 8.75% | 89,814 | 89,782 | 69,151 | ||||||||||||
| First Lien Revolver, LIBOR+7.75% (1.00% floor) cash due 3/22/2018 (10)(13) | 8.75% | (1 | ) | — | ||||||||||||
| 2,599.32 Preferred Units of AVI Holdings, L.P. | 1,820 | — | ||||||||||||||
| 91,601 | 69,151 | |||||||||||||||
| Sterling Capital Partners IV, L.P. | Multi-sector holdings | |||||||||||||||
| 0.2% limited partnership interest (11) | 1,515 | 1,314 | ||||||||||||||
| 1,515 | 1,314 | |||||||||||||||
| RP Crown Parent, LLC | Application software | |||||||||||||||
| First Lien Revolver, LIBOR+5.5% (1.25% floor) cash due 12/21/2017 (13) | 6.75% | — | — | |||||||||||||
| — | — | |||||||||||||||
| Advanced Pain Management | Healthcare services | |||||||||||||||
| First Lien Term Loan, LIBOR+8.5% (1.25% floor) cash due 2/26/2018 (13) | 9.75% | 24,000 | 24,000 | 24,019 | ||||||||||||
| 24,000 | 24,019 | |||||||||||||||
| Portfolio Company/Type of Investment (1)(2)(5)(9)(14)(20) | Cash Interest Rate (13) | Industry | Principal (8) | Cost | Fair Value | |||||||||||
| TravelClick, Inc. | Internet software & services | |||||||||||||||
| Second Lien Term Loan, LIBOR+7.75% (1% floor) cash due 11/6/2021 (13) | 8.75% | $ | 4,450 | $ | 3,978 | $ | 3,986 | |||||||||
| 3,978 | 3,986 | |||||||||||||||
| Pingora MSR Opportunity Fund I-A, LP | Thrift & mortgage finance | |||||||||||||||
| 1.9% limited partnership interest (11) | 7,946 | 5,846 | ||||||||||||||
| 7,946 | 5,846 | |||||||||||||||
| Credit Infonet, Inc. | Data processing & outsourced services | |||||||||||||||
| Subordinated Term Loan, 11.25% cash 1.75% PIK due 10/26/2018 | 13,795 | 13,795 | 13,260 | |||||||||||||
| 13,795 | 13,260 | |||||||||||||||
| Bracket Holding Corp. | Healthcare services | |||||||||||||||
| Second Lien Term Loan, LIBOR+8.25% (1% floor) cash due 2/15/2020 (13) | 9.25% | 32,000 | 32,000 | 32,061 | ||||||||||||
| 50,000 Common Units in AB Group Holdings, LP | 500 | 896 | ||||||||||||||
| 32,500 | 32,957 | |||||||||||||||
| HealthEdge Software, Inc. | Application software | |||||||||||||||
| 482,453 Series A-3 Preferred Stock Warrants (exercise price $1.450918) expiration date 9/30/2023 | 213 | 650 | ||||||||||||||
| 213 | 650 | |||||||||||||||
| InMotion Entertainment Group, LLC | Consumer electronics | |||||||||||||||
| First Lien Term Loan A, LIBOR+7.75% (1.25% floor) cash due 10/1/2018 (13) | 9.00% | 12,950 | 12,950 | 12,846 | ||||||||||||
| First Lien Term Loan B, LIBOR+7.75% (1.25% floor) cash due 10/1/2018 (13) | 9.00% | 5,645 | 5,476 | 5,571 | ||||||||||||
| First Lien Revolver, LIBOR+6.75% (1.25% floor) cash due 10/1/2018 (13) | 8.00% | 4,605 | 4,604 | 4,605 | ||||||||||||
| CapEx Line, LIBOR+7.75% (1.25% floor) cash due 10/1/2018 (13) | 9.00% | 839 | 839 | 839 | ||||||||||||
| 1,000,000 Class A Units in InMotion Entertainment Holdings, LLC | 1,000 | 1,319 | ||||||||||||||
| 24,869 | 25,180 | |||||||||||||||
| Thing5, LLC | Data processing & outsourced services | |||||||||||||||
| First Lien Term Loan, LIBOR+7.5% (1% floor) cash due 10/11/2018 (12)(13) | 8.50% | 53,680 | 53,680 | 52,093 | ||||||||||||
| First Lien Revolver, LIBOR+7.5% (1% floor) cash due 10/11/2018 (13) | 8.50% | 1,000 | 1,000 | 1,000 | ||||||||||||
| 2,000,000 Units in T5 Investment Vehicle, LLC | 2,000 | 292 | ||||||||||||||
| 56,680 | 53,385 | |||||||||||||||
| Epic Health Services, Inc. | ||||||||||||||||
| Second Lien Term Loan, LIBOR+8.25% (1% floor) cash due 8/17/2021 (13) | 9.25% | Healthcare services | 24,667 | 24,316 | 24,714 | |||||||||||
| 24,316 | 24,714 | |||||||||||||||
| Portfolio Company/Type of Investment (1)(2)(5)(9)(14)(20) | Cash Interest Rate (13) | Industry | Principal (8) | Cost | Fair Value | |||||||||||
| Kason Corporation | Industrial machinery | |||||||||||||||
| Mezzanine Term Loan, 11.5% cash 1.75% PIK due 10/28/2019 | 11.50% | $ | 5,901 | $ | 5,901 | $ | 5,813 | |||||||||
| 498.6 Class A Preferred Units in Kason Investment, LLC, 8% | 499 | 566 | ||||||||||||||
| 5,540 Class A Common Units in Kason Investment, LLC | 55 | 1 | ||||||||||||||
| 6,455 | 6,380 | |||||||||||||||
| SPC Partners V, L.P. | Multi-sector holdings | |||||||||||||||
| 0.571% limited partnership interest (11) | 1,398 | 1,515 | ||||||||||||||
| 1,398 | 1,515 | |||||||||||||||
| Systems Maintenance Services Holdings, Inc. | IT consulting & other services | |||||||||||||||
| Second Lien Term Loan, LIBOR+8.25% (1% floor) cash due 10/18/2020 (13) | 9.25% | 19,000 | 18,936 | 18,810 | ||||||||||||
| 18,936 | 18,810 | |||||||||||||||
| P2 Upstream Acquisition Co. | Application software | |||||||||||||||
| First Lien Revolver, LIBOR+4% (1% floor) cash due 10/31/2018 (13) | 5.00% | — | — | |||||||||||||
| — | — | |||||||||||||||
| Vandelay Industries Merger Sub, Inc. | Industrial machinery | |||||||||||||||
| Second Lien Term Loan, 10.75% cash 1% PIK due 11/12/2019 | 39,265 | 39,104 | 39,300 | |||||||||||||
| 2,500,000 Class A Common Units in Vandelay Industries, L.P. | 958 | 5,902 | ||||||||||||||
| 40,062 | 45,202 | |||||||||||||||
| Vitera Healthcare Solutions, LLC | Healthcare technology | |||||||||||||||
| Second Lien Term Loan, LIBOR+8.25% (1% floor) cash due 11/4/2021 (13) | 9.25% | 8,000 | 7,904 | 7,420 | ||||||||||||
| 7,904 | 7,420 | |||||||||||||||
| The Active Network, Inc. | Internet software & services | |||||||||||||||
| Second Lien Term Loan, LIBOR+8.5% (1% floor) cash due 11/15/2021 (13) | 9.50% | 16,543 | 16,379 | 16,336 | ||||||||||||
| 16,379 | 16,336 | |||||||||||||||
| OmniSYS Acquisition Corporation | Diversified support services | |||||||||||||||
| First Lien Term Loan, LIBOR+7.5% (1% floor) cash due 11/21/2018 (13) | 8.50% | 5,500 | 5,496 | 5,507 | ||||||||||||
| First Lien Revolver, LIBOR+7.5% (1% floor) cash due 11/21/2018 (13) | 8.50% | — | — | |||||||||||||
| 100,000 Common Units in OSYS Holdings, LLC | 1,000 | 1,118 | ||||||||||||||
| 6,496 | 6,625 | |||||||||||||||
| Moelis Capital Partners Opportunity Fund I-B, LP | Multi-sector holdings | |||||||||||||||
| 1.0% limited partnership interest (11) | 1,524 | 1,888 | ||||||||||||||
| 1,524 | 1,888 | |||||||||||||||
| Aden & Anais Merger Sub, Inc. | Apparel, accessories & luxury goods | |||||||||||||||
| Mezzanine Term Loan, 10% cash 2% PIK due 6/23/2019 | 12,694 | 12,694 | 12,610 | |||||||||||||
| 30,000 Common Units in Aden & Anais Holdings, Inc. | 3,000 | 2,010 | ||||||||||||||
| 15,694 | 14,620 | |||||||||||||||
| Lift Brands, Inc. | Leisure facilities | |||||||||||||||
| First Lien Term Loan, LIBOR+8% (1% floor) cash due 12/23/2019 (13) | 9.00% | 22,268 | 22,255 | 22,186 | ||||||||||||
| First Lien Revolver, LIBOR+8% (1% floor) cash due 12/23/2019 (13) | 9.00% | 2,000 | 1,997 | 2,000 | ||||||||||||
| 2,000,000 Class A Common Units in Snap Investments, LLC | 2,000 | 2,732 | ||||||||||||||
| 26,252 | 26,918 | |||||||||||||||
| Tailwind Capital Partners II, L.P. | Multi-sector holdings | |||||||||||||||
| 0.3% limited partnership interest (11) | 995 | 1,128 | ||||||||||||||
| 995 | 1,128 | |||||||||||||||
| Portfolio Company/Type of Investment (1)(2)(5)(9)(14)(20) | Cash Interest Rate (13) | Industry | Principal (8) | Cost | Fair Value | |||||||||||
| Long's Drugs Incorporated | Pharmaceuticals | |||||||||||||||
| Second Lien Term Loan, LIBOR+11% cash due 2/19/2022 (13) | 11.91% | $ | 26,909 | $ | 26,909 | $ | 26,890 | |||||||||
| 50 Series A Preferred Shares in Long's Drugs Incorporated (6) | 813 | 1,037 | ||||||||||||||
| 27,722 | 27,927 | |||||||||||||||
| Five9, Inc. | Internet software & services | |||||||||||||||
| 118,577 Common Stock Warrants (exercise price $10.12) expiration date 2/20/2024 | 321 | 780 | ||||||||||||||
| 321 | 780 | |||||||||||||||
| Conviva Inc. | Application software | |||||||||||||||
| 417,851 Series D Preferred Stock Warrants (exercise price $1.1966) expiration date 2/28/2021 | 105 | 110 | ||||||||||||||
| 105 | 110 | |||||||||||||||
| OnCourse Learning Corporation | Education services | |||||||||||||||
| 264,312 Class A Units in CIP OCL Investments, LLC | 2,726 | 1,891 | ||||||||||||||
| 2,726 | 1,891 | |||||||||||||||
| ShareThis, Inc. | Internet software & services | |||||||||||||||
| 345,452 Series C Preferred Stock Warrants (exercise price $3.0395) expiration date 3/4/2024 | 367 | 194 | ||||||||||||||
| 367 | 194 | |||||||||||||||
| Aptean, Inc. | Internet software & services | |||||||||||||||
| Second Lien Term Loan, LIBOR+7.5% (1% floor) cash due 2/26/2021 (13) | 8.50% | 3,000 | 3,000 | 2,957 | ||||||||||||
| 3,000 | 2,957 | |||||||||||||||
| Integrated Petroleum Technologies, Inc. | Oil & gas equipment services | |||||||||||||||
| First Lien Term Loan, LIBOR+7.5% (1% floor) cash due 3/31/2019 (13) | 8.50% | 18,929 | 18,911 | 6,500 | ||||||||||||
| First Lien Revolver, LIBOR+7.5% (1% floor) cash due 3/31/2019 (10)(13) | 8.50% | (3 | ) | — | ||||||||||||
| 18,908 | 6,500 | |||||||||||||||
| ExamSoft Worldwide, Inc. | Internet software & services | |||||||||||||||
| First Lien Term Loan, LIBOR+8% (1% floor) cash due 5/1/2019 (13) | 9.00% | 14,250 | 14,157 | 14,061 | ||||||||||||
| First Lien Revolver, LIBOR+8% (1% floor) cash due 5/1/2019 (13) | 9.00% | — | — | |||||||||||||
| 180,707 Class C Units in ExamSoft Investor LLC | 181 | 12 | ||||||||||||||
| 14,338 | 14,073 | |||||||||||||||
| DigiCert, Inc. | Internet software & services | |||||||||||||||
| Second Lien Term Loan, LIBOR+9% (1% floor) cash due 6/2/2020 (13) | 10.00% | 61,500 | 60,801 | 62,500 | ||||||||||||
| 60,801 | 62,500 | |||||||||||||||
| RCPDirect II, LP | Multi-sector holdings | |||||||||||||||
| 0.5% limited partnership interest (11) | $ | 346 | $ | 353 | ||||||||||||
| 346 | 353 | |||||||||||||||
| PR Wireless, Inc. (11) | Integrated telecommunication services | |||||||||||||||
| First Lien Term Loan, LIBOR+9% (1% floor) cash due 6/27/2020 (13) | 10.00% | $ | 12,715 | 12,424 | 8,788 | |||||||||||
| 118.4211 Common Stock Warrants (exercise price $0.01) expiration date 6/27/2024 | — | 430 | ||||||||||||||
| 12,424 | 9,218 | |||||||||||||||
| Portfolio Company/Type of Investment (1)(2)(5)(9)(14)(20) | Cash Interest Rate (13) | Industry | Principal (8) | Cost | Fair Value | |||||||||||
| Integral Development Corporation | Other diversified financial services | |||||||||||||||
| First Lien Term Loan, LIBOR+9.5% (1% floor) cash due 7/10/2019 (13) | 10.50% | $ | 14,250 | $ | 14,182 | $ | 14,079 | |||||||||
| 1,078,284 Common Stock Warrants (exercise price $0.9274) expiration date 7/10/2024 | 113 | — | ||||||||||||||
| 14,295 | 14,079 | |||||||||||||||
| Loftware, Inc. | Internet software & services | |||||||||||||||
| Mezzanine Term Loan, 11% cash 1% PIK due 7/18/2020 | 6,135 | 6,136 | 6,208 | |||||||||||||
| 300,000 Class A Common Units in RPLF Holdings, LLC | 300 | 311 | ||||||||||||||
| 6,436 | 6,519 | |||||||||||||||
| Tectum Holdings, Inc. | Auto parts & equipment | |||||||||||||||
| Second Lien Term Loan, LIBOR+8.75% (1% floor) cash due 1/28/2021 (13) | 9.75% | 15,000 | 15,000 | 14,969 | ||||||||||||
| 15,000 | 14,969 | |||||||||||||||
| TV Borrower US, LLC | Integrated telecommunication services | |||||||||||||||
| Second Lien Term Loan, LIBOR+8.5% (1% floor) cash due 7/8/2021 (11) (13) | 9.50% | 30,000 | 29,386 | 29,100 | ||||||||||||
| 29,386 | 29,100 | |||||||||||||||
| Webster Capital III, L.P. | Multi-sector holdings | |||||||||||||||
| 0.754% limited partnership interest (11) | 987 | 1,157 | ||||||||||||||
| 987 | 1,157 | |||||||||||||||
| L Squared Capital Partners LLC | Multi-sector holdings | |||||||||||||||
| 2% limited partnership interest (11) | 1,692 | 1,692 | ||||||||||||||
| 1,692 | 1,692 | |||||||||||||||
| ERS Acquisition Corp. | Diversified support services | |||||||||||||||
| Second Lien Term Loan, LIBOR+8.25% (1% floor) cash 2% PIK due 9/10/2018 (13) | 9.25% | 40,940 | 40,187 | 31,548 | ||||||||||||
| 40,187 | 31,548 | |||||||||||||||
| BeyondTrust Software, Inc. | Application software | |||||||||||||||
| First Lien Term Loan, LIBOR+7% (1% floor) cash due 9/25/2019 (13) | 8.00% | 29,929 | 29,152 | 29,814 | ||||||||||||
| First Lien Revolver, LIBOR+7% (1% floor) cash due 9/25/2019 (10)(13) | 8.00% | (79 | ) | — | ||||||||||||
| 4,500,000 Class A membership interests in BeyondTrust Holdings LLC | 4,500 | 5,525 | ||||||||||||||
| 33,573 | 35,339 | |||||||||||||||
| Answers Corporation | Internet software & services | |||||||||||||||
| First Lien Term Loan, LIBOR+5.25% (1% floor) cash due 10/3/2021 (13) | 6.25% | 4,925 | 4,906 | 2,659 | ||||||||||||
| Second Lien Term Loan, LIBOR+9% (1% floor) cash due 10/3/2022 (13) | 10.00% | 37,000 | 35,190 | 3,577 | ||||||||||||
| 40,096 | 6,236 | |||||||||||||||
| Idera, Inc. | Internet software & services | |||||||||||||||
| First Lien Term Loan, LIBOR+5.5% (1% floor) cash due 4/9/2021 (13) | 6.50% | 26,035 | 24,962 | 25,319 | ||||||||||||
| 24,962 | 25,319 | |||||||||||||||
| GOBP Holdings Inc. | Food retail | |||||||||||||||
| Second Lien Term Loan, LIBOR+8.25% (1% floor) cash due 10/21/2022 (13) | 9.25% | 4,214 | 4,169 | 4,214 | ||||||||||||
| 4,169 | 4,214 | |||||||||||||||
| Kellermeyer Bergensons Services, LLC | Diversified support services | |||||||||||||||
| Second Lien Term Loan, LIBOR+8.50% (1% floor) cash due 4/29/2022 (13) | 9.50% | 6,105 | 5,864 | 5,800 | ||||||||||||
| 5,864 | 5,800 | |||||||||||||||
| Portfolio Company/Type of Investment (1)(2)(5)(9)(14)(20) | Cash Interest Rate (13) | Industry | Principal (8) | Cost | Fair Value | |||||||||||
| Dodge Data & Analytics LLC | Data processing & outsourced services | |||||||||||||||
| First Lien Term Loan, LIBOR+8.75% (1% floor) cash due 10/31/2019 (13) | 9.75% | $ | 7,623 | $ | 7,623 | $ | 7,719 | |||||||||
| 500,000 Class A Common Units in Skyline Data, News and Analytics LLC | 500 | 627 | ||||||||||||||
| 8,123 | 8,346 | |||||||||||||||
| NAVEX Global, Inc. | Internet software & services | |||||||||||||||
| Second Lien Term Loan, LIBOR+8.75% (1% floor) cash due 11/18/2022 (13) | 9.75% | 44,837 | 44,587 | 43,492 | ||||||||||||
| 44,587 | 43,492 | |||||||||||||||
| GTCR Valor Companies, Inc. | Advertising | |||||||||||||||
| First Lien Term Loan, LIBOR+6% (1% floor) cash due 6/16/2023 (13) | 7.00% | 12,219 | 11,751 | 11,689 | ||||||||||||
| 11,751 | 11,689 | |||||||||||||||
| Tecomet Inc. | Healthcare equipment | |||||||||||||||
| Second Lien Term Loan, LIBOR+8.5% (1% floor) cash due 12/5/2022 (13) | 9.50% | 17,000 | 15,835 | 16,150 | ||||||||||||
| 15,835 | 16,150 | |||||||||||||||
| Metamorph US 3, LLC | Internet software & services | |||||||||||||||
| First Lien Term Loan, LIBOR+6.5% (1% floor) cash due 12/1/2020 (13) | 7.50% | 10,078 | 10,074 | 8,391 | ||||||||||||
| First Lien Revolver, LIBOR+6.5% (1% floor) cash due 12/1/2020 (13) | 7.50% | 1,225 | 1,224 | 1,225 | ||||||||||||
| 11,298 | 9,616 | |||||||||||||||
| Schulman Associates Institutional Board Review, Inc. | Research & consulting services | |||||||||||||||
| Second Lien Term Loan, LIBOR+8% (1% floor) cash due 6/3/2021 (13) | 9.00% | 17,000 | 17,000 | 17,333 | ||||||||||||
| 17,000 | 17,333 | |||||||||||||||
| Janrain, Inc. | Internet software & services | |||||||||||||||
| 218,008 Common Stock Warrants (exercise price $1.3761) expiration date 12/5/2024 | 45 | — | ||||||||||||||
| 45 | — | |||||||||||||||
| TigerText, Inc. | Internet software & services | |||||||||||||||
| Second Lien Term Loan, LIBOR+9.75% (1% floor) cash due 12/8/2017 (13) | 10.75% | 5,000 | 4,977 | 4,854 | ||||||||||||
| 299,110 Series B Preferred Stock Warrants (exercise price $1.3373) expiration date 12/8/2024 | 60 | 268 | ||||||||||||||
| 5,037 | 5,122 | |||||||||||||||
| Survey Sampling International, LLC | Research & consulting services | |||||||||||||||
| Second Lien Term Loan, LIBOR+9% (1% floor) cash due 12/16/2021 (13) | 10.00% | 18,700 | 18,422 | 18,326 | ||||||||||||
| 18,422 | 18,326 | |||||||||||||||
| Portfolio Company/Type of Investment (1)(2)(5)(9)(14)(20) | Cash Interest Rate (13) | Industry | Principal (8) | Cost | Fair Value | |||||||||||
| PSC Industrial Holdings Corp. | Diversified support services | |||||||||||||||
| Second Lien Term Loan, LIBOR+8.25% (1% floor) cash due 12/3/2021 (13) | 9.25% | $ | 7,000 | $ | 6,800 | $ | 6,615 | |||||||||
| 6,800 | 6,615 | |||||||||||||||
| TIBCO Software, Inc. | Internet software & services | |||||||||||||||
| First Lien Revolver, LIBOR+4% cash due 11/25/2020 (13) | 4.00% | — | — | — | ||||||||||||
| — | — | |||||||||||||||
| EOS Fitness Opco Holdings, LLC | Leisure facilities | |||||||||||||||
| First Lien Term Loan, LIBOR+8.75% (0.75% floor) cash due 12/30/2019 (13) | 9.50% | 3,832 | 3,832 | 3,734 | ||||||||||||
| First Lien Revolver, LIBOR+8.75% (0.75% floor) cash due 12/30/2019 (13) | 9.50% | — | — | |||||||||||||
| 487.5 Class A Preferred Units, 12% | 488 | 446 | ||||||||||||||
| 12,500 Class B Common Units | 13 | — | ||||||||||||||
| 4,333 | 4,180 | |||||||||||||||
| TrialCard Incorporated | Healthcare services | |||||||||||||||
| First Lien Revolver, LIBOR+5.25% (1% floor) cash due 12/31/2019 (10)(13) | 6.25% | (32 | ) | — | ||||||||||||
| (32 | ) | — | ||||||||||||||
| Motion Recruitment Partners LLC | Human resources & employment services | |||||||||||||||
| First Lien Revolver, LIBOR+6% (1% floor) cash due 2/13/2020 (10)(13) | 7.00% | — | (6 | ) | — | |||||||||||
| (6 | ) | — | ||||||||||||||
| WeddingWire, Inc. | Internet software & services | |||||||||||||||
| First Lien Term Loan, LIBOR+8.5% (1% floor) cash due 2/20/2020 (13) | 9.50% | 26,984 | 26,984 | 27,247 | ||||||||||||
| First Lien Revolver, LIBOR+8.5% (1% floor) cash due 2/20/2020 (13) | 9.50% | — | — | |||||||||||||
| 483,645 Common Shares of WeddingWire, Inc. | 1,200 | 1,044 | ||||||||||||||
| 28,184 | 28,291 | |||||||||||||||
| xMatters, Inc. | Internet software & services | |||||||||||||||
| 200,000 Common Stock Warrants (exercise price $1.78) expiration date 2/26/2025 | 709 | 347 | ||||||||||||||
| 709 | 347 | |||||||||||||||
| Edge Fitness, LLC | Leisure facilities | |||||||||||||||
| Delayed Draw Term Loan, LIBOR+8.75% (1% floor) cash due 12/31/2019 (13) | 9.75% | 3,398 | 3,398 | 3,388 | ||||||||||||
| 3,398 | 3,388 | |||||||||||||||
| Golden State Medical Supply, Inc. | Pharmaceuticals | |||||||||||||||
| Mezzanine Term Loan, 10% cash 2.5% PIK due 4/24/2021 | 15,001 | 15,001 | 15,345 | |||||||||||||
| 15,001 | 15,345 | |||||||||||||||
| My Alarm Center, LLC | Security & alarm services | |||||||||||||||
| First Lien Term Loan D, LIBOR+8% (1% floor) cash due 1/9/2019 (13) | 9.00% | 1,505 | 1,505 | 1,484 | ||||||||||||
| First Lien Term Revolver, PRIME+7.5% (1% floor) cash due 1/9/2019 (13) | 11.00% | 180 | 180 | 180 | ||||||||||||
| 1,685 | 1,664 | |||||||||||||||
| AirStrip Technologies, Inc. | Internet software & services | |||||||||||||||
| First Lien Term Loan, LIBOR+10% (1% floor) cash due 5/12/2018 (13) | 11.00% | 16,000 | 15,950 | 15,982 | ||||||||||||
| 22,858.71 Series C-1 Preferred Stock Warrants (exercise price $34.99757) expiration date 5/11/2025 | 90 | 66 | ||||||||||||||
| 16,040 | 16,048 | |||||||||||||||
| Portfolio Company/Type of Investment (1)(2)(5)(9)(14)(20) | Cash Interest Rate (13) | Industry | Principal (8) | Cost | Fair Value | |||||||||||
| Legalzoom.com, Inc. | Specialized consumer services | |||||||||||||||
| First Lien Term Loan, LIBOR+7% (1% floor) cash due 5/13/2020 (13) | 8.00% | $ | 6,400 | $ | 6,376 | $ | 6,459 | |||||||||
| First Lien Revolver, LIBOR+7% (1% floor) cash due 5/13/2020 (10)(13) | 8.00% | (7 | ) | — | ||||||||||||
| Delayed Draw Term Loan, LIBOR+7% (1% floor) cash due 5/13/2020 (13) | 2,645 | 2,623 | ||||||||||||||
| 9,014 | 9,082 | |||||||||||||||
| Access Medical Acquisition, Inc. | Healthcare services | |||||||||||||||
| Mezzanine Term Loan, 10% cash 2% PIK due 1/2/2022 | 12,476 | 12,476 | 12,728 | |||||||||||||
| 450,000 Shares of Class A Common Stock in CMG Holding Company, LLC | 450 | 1,132 | ||||||||||||||
| 12,926 | 13,860 | |||||||||||||||
| QuorumLabs, Inc. | Internet software & services | �� | ||||||||||||||
| 2,045,954 Common Stock Warrants (exercise price $0.0001) expiration date 7/8/2025 | 375 | — | ||||||||||||||
| 375 | — | |||||||||||||||
| Worley Claims Services, LLC | Internet software & services | |||||||||||||||
| First Lien Term Loan, LIBOR+8% (1% floor) cash due 10/31/2020 (13) | 9.00% | 7,664 | 7,566 | 7,625 | ||||||||||||
| 7,566 | 7,625 | |||||||||||||||
| Poseidon Merger Sub, Inc. | Advertising | |||||||||||||||
| Second Lien Term Loan, LIBOR+8.5% (1% floor) cash due 8/15/2023 (13) | 9.50% | 30,000 | 28,956 | 30,055 | ||||||||||||
| 28,956 | 30,055 | |||||||||||||||
| American Seafoods Group LLC | Food distributors | |||||||||||||||
| Second Lien Term Loan, LIBOR+9% (1% floor) cash due 2/19/2022 (13) | 10.00% | 12,000 | 11,903 | 11,400 | ||||||||||||
| 11,903 | 11,400 | |||||||||||||||
| Valet Merger Sub, Inc. | Environmental & facilities services | |||||||||||||||
| First Lien Term Loan, LIBOR+7% (1% floor) cash due 9/24/2021 (13) | 8.00% | 49,422 | 48,600 | 50,256 | ||||||||||||
| First Lien Revolver, LIBOR+7% (1% floor) cash due 9/24/2021 (13) | 8.00% | 5,596 | 5,454 | 5,596 | ||||||||||||
| 54,054 | 55,852 | |||||||||||||||
| Swipely, Inc. | IT consulting & other services | |||||||||||||||
| First Lien Term Loan, LIBOR+8.5% (1% floor) cash due 9/30/2019 (13) | 9.50% | 12,500 | 12,500 | 12,389 | ||||||||||||
| 252,119 Common Stock Warrants (exercise price $1.77) expiration date 9/30/2025 | — | 146 | ||||||||||||||
| 12,500 | 12,535 | |||||||||||||||
| Baart Programs, Inc. | Healthcare services | |||||||||||||||
| First Lien Term Loan, LIBOR+7.75% cash due 10/9/2021 (13) | 8.42% | 32,175 | 31,714 | 32,055 | ||||||||||||
| First Lien Revolver, LIBOR+7.75% cash due 10/9/2021 (10)(13) | 8.42% | (60 | ) | — | ||||||||||||
| 31,654 | 32,055 | |||||||||||||||
| Argon Medical Devices, Inc. | Healthcare equipment | |||||||||||||||
| Second Lien Term Loan, LIBOR+9.5% (1% floor) cash due 6/23/2022 (13) | 10.50% | 43,000 | 43,000 | 44,140 | ||||||||||||
| 43,000 | 44,140 | |||||||||||||||
| Lytx, Inc. | Research & consulting services | |||||||||||||||
| First Lien Term Loan, LIBOR+8.5% (1% floor) cash due 3/15/2023 (13) | 9.50% | 24,215 | 24,215 | 24,215 | ||||||||||||
| 3,500 Class A Units in Lytx Holdings, LLC | 3,500 | 3,529 | ||||||||||||||
| 27,715 | 27,744 | |||||||||||||||
| Portfolio Company/Type of Investment (1)(2)(5)(9)(14)(20) | Cash Interest Rate (13) | Industry | Principal (8) | Cost | Fair Value | |||||||||||
| Onvoy, LLC | Integrated telecommunication services | |||||||||||||||
| First Lien Term Loan, LIBOR+6.25% (1% floor) cash due 4/29/2021 (13) | 7.25% | $ | 14,813 | $ | 14,533 | $ | 14,773 | |||||||||
| 14,533 | 14,773 | |||||||||||||||
| Accruent, LLC | Internet software & services | |||||||||||||||
| First Lien Term Loan, LIBOR+5.25% (1% floor) cash due 5/16/2022 (13) | 6.25% | 4,988 | 4,941 | 4,997 | ||||||||||||
| First Lien Revolver, LIBOR+5.25% (1% floor) cash due 5/16/2022 (10)(13) | 6.25% | — | (18 | ) | — | |||||||||||
| 4,923 | 4,997 | |||||||||||||||
| 4 Over International, LLC | Commercial printing | |||||||||||||||
| First Lien Term Loan, LIBOR+6% (1% floor) cash due 6/7/2022 (13) | 7.00% | 6,169 | 6,111 | 6,127 | ||||||||||||
| First Lien Revolver, LIBOR+6% (1% floor) cash due 6/7/2021 (10)(13) | 7.00% | — | (21 | ) | — | |||||||||||
| 6,090 | 6,127 | |||||||||||||||
| OBHG Management Services, LLC | Healthcare services | |||||||||||||||
| First Lien Term Loan, LIBOR+5.25% (1% floor) cash due 6/28/2022 (13) | 6.25% | 14,863 | 14,858 | 14,820 | ||||||||||||
| First Lien Revolver, LIBOR+5.25% (1% floor) cash due 6/28/2021 (10)(13) | 6.25% | — | (2 | ) | — | |||||||||||
| 14,856 | 14,820 | |||||||||||||||
| Ping Identity Corporation | Internet software & services | |||||||||||||||
| First Lien Term Loan, LIBOR+9.25% (1% floor) cash due 6/30/2021 (13) | 10.25% | 42,500 | 41,305 | 41,225 | ||||||||||||
| First Lien Revolver, LIBOR+9.25% (1% floor) cash due 6/30/2021 (10)(13) | 10.25% | — | (70 | ) | — | |||||||||||
| 41,235 | 41,225 | |||||||||||||||
| Ancile Solutions, Inc. | Internet software & services | |||||||||||||||
| First Lien Term Loan, LIBOR+7% (1% floor) cash due 6/30/2021 (13) | 8.00% | 11,500 | 11,178 | 11,328 | ||||||||||||
| 11,178 | 11,328 | |||||||||||||||
| Ministry Brands, LLC | Internet software & services | |||||||||||||||
| First Lien Term Loan, LIBOR+7% (1% floor) cash due 11/20/2021 (13) | 8.00% | 19,874 | 19,683 | 19,675 | ||||||||||||
| Delayed Draw Term Loan, LIBOR+7% (1% floor) cash due 11/20/2021 (10)(13) | 8.00% | (143 | ) | — | ||||||||||||
| 19,540 | 19,675 | |||||||||||||||
| HSW RR, Inc. | Environmental & facilities services | |||||||||||||||
| First Lien Term Loan B, LIBOR+9% (1% floor) cash due 7/13/2020 (13) | 10.00% | 45,000 | 45,000 | 45,000 | ||||||||||||
| 45,000 | 45,000 | |||||||||||||||
| Sailpoint Technologies, Inc. | ||||||||||||||||
| First Lien Term Loan, LIBOR+8% (1% floor) cash due 8/16/2021 (13) | 9.00% | Application software | 15,000 | 14,710 | 14,700 | |||||||||||
| First Lien Revolver, LIBOR+8% (1% floor) cash due 8/16/2021 (10)(13) | 9.00% | (19 | ) | — | ||||||||||||
| 14,691 | 14,700 | |||||||||||||||
| California Pizza Kitchen, Inc. | Restaurants | |||||||||||||||
| First Lien Term Loan, LIBOR+6% (1% floor) cash due 8/23/2022 (13) | 7.00% | 5,000 | 4,951 | 4,985 | ||||||||||||
| 4,951 | 4,985 | |||||||||||||||
| Portfolio Company/Type of Investment (1)(2)(5)(9)(14)(20) | Cash Interest Rate (13) | Industry | Principal (8) | Cost | Fair Value | |||||||||||
| Aptos, Inc. | Data processing & outsourced services | |||||||||||||||
| First Lien Term Loan B, LIBOR+6.75% (1% floor) cash due 9/1/2022 (13) | 7.75% | $ | 5,500 | $ | 5,390 | $ | 5,445 | |||||||||
| 5,390 | 5,445 | |||||||||||||||
| SPC Partners V, L.P. | Multi-sector holdings | |||||||||||||||
| 0.39% limited partnership interest (11) | — | — | ||||||||||||||
| — | — | |||||||||||||||
| Total Non-Control/Non-Affiliate Investments (152.1% of net assets) | $ | 1,792,410 | $ | 1,737,455 | ||||||||||||
| Total Portfolio Investments (189.6% of net assets) | $ | 2,283,858 | $ | 2,165,491 | ||||||||||||
| Cash and Cash Equivalents | ||||||||||||||||
| JP Morgan Prime Money Market Fund | $ | 111,447 | $ | 111,447 | ||||||||||||
| Other cash accounts | 6,476 | 6,476 | ||||||||||||||
| Total Cash and Cash Equivalents (10.3% of net assets) | 117,923 | 117,923 | ||||||||||||||
| Total Portfolio Investments, Cash and Cash Equivalents (199.9% of net assets) | $ | 2,401,781 | $ | 2,283,414 | ||||||||||||
| September 30, 2017 | September 30, 2016 | |||||||||||||||
| Cost | Fair Value | Cost | Fair Value | |||||||||||||
| Investments in debt securities | $ | 1,426,301 | $ | 1,296,138 | $ | 1,960,581 | $ | 1,845,808 | ||||||||
| Investments in equity securities | 186,521 | 111,421 | 162,343 | 176,970 | ||||||||||||
| Debt investments in SLF JV I | 128,671 | 128,671 | 144,841 | 129,004 | ||||||||||||
| Equity investment in SLF JV I | 16,172 | 5,525 | 16,093 | 13,709 | ||||||||||||
| Total | $ | 1,757,665 | $ | 1,541,755 | $ | 2,283,858 | $ | 2,165,491 | ||||||||
| September 30, 2017 | September 30, 2016 | |||||||||||||
| Fair Value | % of Debt Portfolio | Fair Value | % of Debt Portfolio | |||||||||||
| Fixed rate debt securities | $ | 233,869 | 16.41 | % | $ | 376,207 | 19.05 | % | ||||||
| Floating rate debt securities, including debt investments in SLF JV I | 1,190,940 | 83.59 | 1,598,605 | 80.95 | ||||||||||
| Total | $ | 1,424,809 | 100.00 | % | $ | 1,974,812 | 100.00 | % | ||||||
| September 30, 2022 | September 30, 2021 | |||||||||||||||||||||||||
| Cost | Fair Value | Cost | Fair Value | |||||||||||||||||||||||
| Investments in debt securities | $ | 2,294,392 | $ | 2,223,329 | $ | 2,222,223 | $ | 2,259,924 | ||||||||||||||||||
| Investments in equity securities | 127,596 | 103,534 | 120,621 | 107,222 | ||||||||||||||||||||||
| Debt investments in the JVs | 146,444 | 146,533 | 146,955 | 151,832 | ||||||||||||||||||||||
| Equity investments in the JVs | 49,322 | 20,715 | 49,322 | 37,651 | ||||||||||||||||||||||
| Total | $ | 2,617,754 | $ | 2,494,111 | $ | 2,539,121 | $ | 2,556,629 | ||||||||||||||||||
| September 30, 2022 | September 30, 2021 | |||||||||||||||||||||||||
| Fair Value | % of Debt Portfolio | Fair Value | % of Debt Portfolio | |||||||||||||||||||||||
| Floating rate debt securities, including the debt investments in the JVs | $ | 2,049,644 | 86.49 | % | $ | 2,205,648 | 91.45 | % | ||||||||||||||||||
| Fixed rate debt securities | 320,218 | 13.51 | 206,108 | 8.55 | ||||||||||||||||||||||
| Total | $ | 2,369,862 | 100.00 | % | $ | 2,411,756 | 100.00 | % | ||||||||||||||||||
| Level 1 | Level 2 | Level 3 | Measured at Net Asset Value (a) | Total | Level 1 | Level 2 | Level 3 | Measured at Net Asset Value (a) | Total | |||||||||||||||||||||||||||||||||||||||||||
| Investments in debt securities (senior secured) | $ | — | $ | 142,257 | $ | 1,060,442 | $ | — | $ | 1,202,699 | Investments in debt securities (senior secured) | $ | — | $ | 255,803 | $ | 1,910,606 | $ | — | $ | 2,166,409 | |||||||||||||||||||||||||||||||
| Investments in debt securities (subordinated, including debt investments in SLF JV I) | — | 41,778 | 180,331 | — | 222,109 | |||||||||||||||||||||||||||||||||||||||||||||||
| Investments in debt securities (subordinated, including the debt investments in the JVs) | Investments in debt securities (subordinated, including the debt investments in the JVs) | — | 44,065 | 159,388 | — | 203,453 | ||||||||||||||||||||||||||||||||||||||||||||||
| Investments in equity securities (preferred) | — | — | 16,445 | — | 16,445 | Investments in equity securities (preferred) | — | — | 79,523 | — | 79,523 | |||||||||||||||||||||||||||||||||||||||||
| Investments in equity securities (common, including LLC equity interests of SLF JV I) | — | — | 69,164 | 31,338 | 100,502 | |||||||||||||||||||||||||||||||||||||||||||||||
| Investments in equity securities (common and warrants, including LLC equity interests of the JVs) | Investments in equity securities (common and warrants, including LLC equity interests of the JVs) | 4,053 | — | 19,958 | 20,715 | 44,726 | ||||||||||||||||||||||||||||||||||||||||||||||
| Total investments at fair value | — | 184,035 | 1,326,382 | 31,338 | 1,541,755 | Total investments at fair value | 4,053 | 299,868 | 2,169,475 | 20,715 | 2,494,111 | |||||||||||||||||||||||||||||||||||||||||
| Cash and cash equivalents | 53,018 | — | — | — | 53,018 | |||||||||||||||||||||||||||||||||||||||||||||||
| Cash equivalents | Cash equivalents | 5,261 | — | — | — | 5,261 | ||||||||||||||||||||||||||||||||||||||||||||||
| Derivative assets | Derivative assets | — | 6,789 | — | — | 6,789 | ||||||||||||||||||||||||||||||||||||||||||||||
| Total assets at fair value | $ | 53,018 | $ | 184,035 | $ | 1,326,382 | $ | 31,338 | $ | 1,594,773 | Total assets at fair value | $ | 9,314 | $ | 306,657 | $ | 2,169,475 | $ | 20,715 | $ | 2,506,161 | |||||||||||||||||||||||||||||||
| Secured borrowings relating to senior secured debt investments | — | — | 13,256 | — | 13,256 | |||||||||||||||||||||||||||||||||||||||||||||||
| Derivative liability | Derivative liability | $ | — | $ | 41,969 | $ | — | $ | — | $ | 41,969 | |||||||||||||||||||||||||||||||||||||||||
| Total liabilities at fair value | $ | — | $ | — | $ | 13,256 | $ | — | $ | 13,256 | Total liabilities at fair value | $ | — | $ | 41,969 | $ | — | $ | — | $ | 41,969 | |||||||||||||||||||||||||||||||
| Level 1 | Level 2 | Level 3 | Measured at Net Asset Value (a) | Total | ||||||||||||||||||||||||||||
| Investments in debt securities (senior secured) | $ | — | $ | 338,707 | $ | 1,878,536 | $ | — | $ | 2,217,243 | ||||||||||||||||||||||
| Investments in debt securities (subordinated, including the debt investments in the JVs) | — | 18,196 | 176,317 | — | 194,513 | |||||||||||||||||||||||||||
| Investments in equity securities (preferred) | — | — | 63,565 | — | 63,565 | |||||||||||||||||||||||||||
| Investments in equity securities (common and warrants, including LLC equity interests of the JVs) | 382 | — | 43,163 | 37,763 | 81,308 | |||||||||||||||||||||||||||
| Total investments at fair value | 382 | 356,903 | 2,161,581 | 37,763 | 2,556,629 | |||||||||||||||||||||||||||
| Cash equivalents | 23,600 | — | — | — | 23,600 | |||||||||||||||||||||||||||
| Derivative assets | — | 1,912 | — | — | 1,912 | |||||||||||||||||||||||||||
| Total assets at fair value | $ | 23,982 | $ | 358,815 | $ | 2,161,581 | $ | 37,763 | $ | 2,582,141 | ||||||||||||||||||||||
| Derivative liability | $ | — | $ | 2,108 | $ | — | $ | — | $ | 2,108 | ||||||||||||||||||||||
| Total liabilities at fair value | $ | — | $ | 2,108 | $ | — | $ | — | $ | 2,108 | ||||||||||||||||||||||
| Level 1 | Level 2 | Level 3 | Measured at Net Asset Value (a) | Total | ||||||||||||||||
| Investments in debt securities (senior secured) | $ | — | $ | — | $ | 1,689,535 | $ | — | $ | 1,689,535 | ||||||||||
| Investments in debt securities (subordinated, including debt investments in SLF JV I) | — | — | 285,277 | — | 285,277 | |||||||||||||||
| Investments in equity securities (preferred) | — | — | 47,749 | — | 47,749 | |||||||||||||||
| Investments in equity securities (common, including LLC equity interests of SLF JV I) | — | — | 106,540 | 36,390 | 142,930 | |||||||||||||||
| Total investments at fair value | — | — | 2,129,101 | 36,390 | 2,165,491 | |||||||||||||||
| Cash and cash equivalents | 117,923 | — | — | — | 117,923 | |||||||||||||||
| Total assets at fair value | $ | 117,923 | $ | — | $ | 2,129,101 | �� | $ | 36,390 | $ | 2,283,414 | |||||||||
| Secured borrowings relating to senior secured debt investments | — | — | 18,400 | — | 18,400 | |||||||||||||||
| Total liabilities at fair value | $ | — | $ | — | $ | 18,400 | $ | — | $ | 18,400 | ||||||||||
| Investments | ||||||||||||||||||||||||||||||||
| Senior Secured Debt | Subordinated Debt (including debt investments in the JVs) | Preferred Equity | Common Equity and Warrants | Total | ||||||||||||||||||||||||||||
| Fair value as of September 30, 2021 | $ | 1,878,536 | $ | 176,317 | $ | 63,565 | $ | 43,163 | $ | 2,161,581 | ||||||||||||||||||||||
| Purchases | 490,081 | 7,960 | 19,662 | 2,807 | 520,510 | |||||||||||||||||||||||||||
| Sales and repayments | (476,813) | (22,525) | (163) | (13,034) | (512,535) | |||||||||||||||||||||||||||
| Transfers in (a)(c) | 49,843 | — | — | — | 49,843 | |||||||||||||||||||||||||||
| Transfers out (a)(b) | (17,070) | — | — | (5,838) | (22,908) | |||||||||||||||||||||||||||
| Capitalized PIK interest income | 22,855 | 313 | — | — | 23,168 | |||||||||||||||||||||||||||
| Accretion of OID | 24,422 | 2,060 | — | — | 26,482 | |||||||||||||||||||||||||||
| Net unrealized appreciation (depreciation) | (67,455) | (4,737) | (3,029) | (6,642) | (81,863) | |||||||||||||||||||||||||||
| Net realized gains (losses) | 6,207 | — | (512) | (498) | 5,197 | |||||||||||||||||||||||||||
| Fair value as of September 30, 2022 | $ | 1,910,606 | $ | 159,388 | $ | 79,523 | $ | 19,958 | $ | 2,169,475 | ||||||||||||||||||||||
| Net unrealized appreciation (depreciation) relating to Level 3 investments still held as of September 30, 2022 and reported within net unrealized appreciation (depreciation) in the Consolidated Statement of Operations for the year ended September 30, 2022 | $ | (53,013) | $ | (4,885) | $ | (3,264) | $ | (11,751) | $ | (72,913) | ||||||||||||||||||||||
| Investments | Liabilities | |||||||||||||||||||||||
| Senior Secured Debt | Subordinated Debt (including debt investments in SLF JV I) | Preferred Equity | Common Equity | Total | Secured Borrowings | |||||||||||||||||||
| Fair value as of September 30, 2016 | $ | 1,689,535 | $ | 285,277 | $ | 47,749 | $ | 106,540 | $ | 2,129,101 | $ | 18,400 | ||||||||||||
| New investments & net revolver activity | 329,904 | 127,844 | — | 58,272 | 516,020 | — | ||||||||||||||||||
| Redemptions/repayments/sales | (807,528 | ) | (227,711 | ) | (652 | ) | (37,264 | ) | (1,073,155 | ) | (5,440 | ) | ||||||||||||
| Net accrual of PIK interest income | 1,640 | 3,675 | 1,470 | — | 6,785 | — | ||||||||||||||||||
| Accretion of OID | 12,178 | — | — | — | 12,178 | — | ||||||||||||||||||
| Net change in unearned income | 150 | 36 | — | — | 186 | — | ||||||||||||||||||
| Net unrealized appreciation (depreciation) on investments | (10,533 | ) | 11,052 | (25,170 | ) | (67,653 | ) | (92,304 | ) | — | ||||||||||||||
| Net unrealized appreciation on secured borrowings | — | — | — | — | — | 296 | ||||||||||||||||||
| Realized loss on investments | (154,904 | ) | (19,842 | ) | (6,952 | ) | 9,269 | (172,429 | ) | — | ||||||||||||||
| Fair value as of September 30, 2017 | $ | 1,060,442 | $ | 180,331 | $ | 16,445 | $ | 69,164 | $ | 1,326,382 | $ | 13,256 | ||||||||||||
| Net unrealized appreciation (depreciation) relating to Level 3 assets & liabilities still held as of September 30, 2017 and reported within net unrealized appreciation (depreciation) on investments and net unrealized (appreciation) depreciation on secured borrowings in the Consolidated Statement of Operations for the year ended September 30, 2017 | $ | (101,985 | ) | $ | (4,491 | ) | $ | (15,049 | ) | $ | (47,501 | ) | $ | (169,026 | ) | $ | 296 | |||||||
| Investments | ||||||||||||||||||||||||||||||||
| Senior Secured Debt | Subordinated Debt (including debt investments in the JVs) | Preferred Equity | Common Equity and Warrants | Total | ||||||||||||||||||||||||||||
| Fair value as of September 30, 2020 | $ | 904,237 | $ | 126,152 | $ | 29,959 | $ | 35,080 | $ | 1,095,428 | ||||||||||||||||||||||
| Purchases (a) | 1,237,783 | 66,537 | 27,692 | 5,665 | 1,337,677 | |||||||||||||||||||||||||||
| Sales and repayments | (352,237) | (45,353) | (31) | (28,629) | (426,250) | |||||||||||||||||||||||||||
| Transfers in (b)(c)(d) | 18,458 | — | — | 6,759 | 25,217 | |||||||||||||||||||||||||||
| Transfers out (b)(d) | (6,228) | — | — | — | (6,228) | |||||||||||||||||||||||||||
| Capitalized PIK interest income | 14,700 | — | — | — | 14,700 | |||||||||||||||||||||||||||
| Accretion of OID | 19,642 | 2,069 | — | — | 21,711 | |||||||||||||||||||||||||||
| Net unrealized appreciation (depreciation) | 43,736 | 18,177 | 7,218 | 13,953 | 83,084 | |||||||||||||||||||||||||||
| Net realized gains (losses) | (1,555) | 8,735 | (1,273) | 10,335 | 16,242 | |||||||||||||||||||||||||||
| Fair value as of September 30, 2021 | $ | 1,878,536 | $ | 176,317 | $ | 63,565 | $ | 43,163 | $ | 2,161,581 | ||||||||||||||||||||||
| Net unrealized appreciation (depreciation) relating to Level 3 investments still held as of September 30, 2021 and reported within net unrealized appreciation (depreciation) in the Consolidated Statement of Operations for the year ended September 30, 2021 | $ | 46,340 | $ | 4,857 | $ | 5,913 | $ | 13,763 | $ | 70,873 | ||||||||||||||||||||||
| Investments | Liabilities | |||||||||||||||||||||||
| Senior Secured Debt | Subordinated Debt (including subordinated notes of SLF JV I) | Preferred Equity | Common Equity (including LLC equity interests of SLF JV I) | Total | Secured Borrowings | |||||||||||||||||||
| Fair value as of September 30, 2015 | $ | 1,893,135 | $ | 359,028 | $ | 30,806 | $ | 85,179 | $ | 2,368,148 | $ | 21,182 | ||||||||||||
| New investments & net revolver activity | 737,729 | 14,962 | 22,073 | 35,367 | 810,131 | — | ||||||||||||||||||
| Redemptions/repayments/sales | (822,881 | ) | (59,025 | ) | (761 | ) | (11,413 | ) | (894,080 | ) | (2,858 | ) | ||||||||||||
| Net accrual of PIK interest income | 6,254 | 3,449 | 2,249 | — | 11,952 | — | ||||||||||||||||||
| Accretion of original issue discount | 4,248 | — | — | — | 4,248 | — | ||||||||||||||||||
| Net change in unearned income | 554 | 78 | — | — | 632 | — | ||||||||||||||||||
| Net unrealized appreciation (depreciation) on investments | (51,112 | ) | 9,946 | (6,305 | ) | 1,751 | (45,720 | ) | — | |||||||||||||||
| Net unrealized appreciation on secured borrowings | — | — | — | — | — | 76 | ||||||||||||||||||
| Realized loss on investments | (78,392 | ) | (43,161 | ) | (313 | ) | (4,344 | ) | (126,210 | ) | — | |||||||||||||
| Fair value as of September 30, 2016 | $ | 1,689,535 | $ | 285,277 | $ | 47,749 | $ | 106,540 | $ | 2,129,101 | $ | 18,400 | ||||||||||||
| Net unrealized appreciation (depreciation) relating to Level 3 assets & liabilities still held as of September 30, 2016 and reported within net unrealized depreciation on investments and net unrealized (appreciation) depreciation on secured borrowings in the Consolidated Statement of Operations for the year ended September 30, 2016 | $ | (111,957 | ) | $ | (35,015 | ) | $ | (1,492 | ) | $ | 829 | $ | (147,635 | ) | $ | 76 | ||||||||
| Asset | Fair Value | Valuation Technique | Unobservable Input | Range | Weighted Average (a) | ||||||||||||||||||||||||||||||||||||
| Senior Secured Debt | $ | 1,599,148 | Market Yield | Market Yield | (b) | 9.0% | - | 30.0% | 13.7% | ||||||||||||||||||||||||||||||||
| 14,333 | Enterprise Value | EBITDA Multiple | (c) | 5.0x | - | 7.0x | 6.0x | ||||||||||||||||||||||||||||||||||
| 297,125 | Broker Quotations | Broker Quoted Price | (e) | N/A | - | N/A | N/A | ||||||||||||||||||||||||||||||||||
| Subordinated Debt | 12,855 | Market Yield | Market Yield | (b) | 10.0% | - | 19.0% | 13.8% | |||||||||||||||||||||||||||||||||
| Debt Investments in the JVs | 146,533 | Enterprise Value | N/A | (f) | N/A | - | N/A | N/A | |||||||||||||||||||||||||||||||||
| Preferred & Common Equity | 61,693 | Enterprise Value | Revenue Multiple | (c) | 0.4x | - | 10.1x | 4.3x | |||||||||||||||||||||||||||||||||
| 36,913 | Enterprise Value | EBITDA Multiple | (c) | 3.0x | - | 20.0x | 11.4x | ||||||||||||||||||||||||||||||||||
| 3 | Enterprise Value | Asset Multiple | (c) | 0.9x | - | 1.1x | 1.0x | ||||||||||||||||||||||||||||||||||
| 872 | Transaction Precedent | Transaction Price | (d) | N/A | - | N/A | N/A | ||||||||||||||||||||||||||||||||||
| Total | $ | 2,169,475 | |||||||||||||||||||||||||||||||||||||||
| Asset | Fair Value | Valuation Technique | Unobservable Input | Range | Weighted Average (c) | ||||||||||
| Senior secured debt | $ | 632,835 | Market yield technique | Capital structure premium | (a) | 0.0% | - | 2.0% | 0.7% | ||||||
| Tranche specific risk premium/(discount) | (a) | (2.5)% | - | 10.5% | 2.9% | ||||||||||
| Size premium | (a) | 0.5% | - | 2.0% | 1.0% | ||||||||||
| Industry premium/(discount) | (a) | (1.2)% | - | 2.6% | 0.4% | ||||||||||
| 58,815 | Enterprise value technique | Revenue multiple | (b) | 0.2x | - | 0.6x | 0.5x | ||||||||
| 107,313 | Enterprise value technique | EBITDA multiple | (b) | 0.1x | - | 7.2x | 4.6x | ||||||||
| 98,800 | Transactions precedent technique | Transaction price | (d) | N/A | - | N/A | N/A | ||||||||
| 162,679 | Market quotations | Broker quoted price | (e) | N/A | - | N/A | N/A | ||||||||
| Subordinated debt | 40,825 | Market yield technique | Capital structure premium | (a) | 2.0% | - | 2.0% | 2.0% | |||||||
| Tranche specific risk premium | (a) | 1.8% | - | 5.9% | 3.4% | ||||||||||
| Size premium | (a) | 2.0% | - | 2.0% | 2.0% | ||||||||||
| Industry premium/(discount) | (a) | (0.5)% | - | 2.6% | 0.6% | ||||||||||
| 10,835 | Enterprise value technique | EBITDA multiple | (b) | 6.3x | - | 7.0x | 6.4x | ||||||||
| SLF JV I debt investments | 128,671 | Enterprise value technique | N/A | (f) | N/A | - | N/A | N/A | |||||||
| Preferred & common equity | 85,609 | Enterprise value technique | EBITDA multiple | (b) | 0.1x | - | 15.6x | 6.8x | |||||||
| Revenue multiple | (b) | 0.9x | 10.9x | 2.7x | |||||||||||
| Total | $ | 1,326,382 | |||||||||||||
| Secured borrowings | 13,256 | Market yield technique | Tranche specific risk premium (discount) | (a) | (2.0)% | - | 6.5% | 5.7% | |||||||
| Size premium | (a) | 2.0% | - | 2.0% | 2.0% | ||||||||||
| Industry premium | (a) | 0.2% | - | 0.2% | 0.2% | ||||||||||
| Total | $ | 13,256 | |||||||||||||
| Asset | Fair Value | Valuation Technique | Unobservable Input | Range | Weighted Average (a) | ||||||||||||||||||||||||||||||||||||
| Senior Secured Debt | $ | 1,413,373 | Market Yield | Market Yield | (b) | 4.0% | - | 30.0% | 10.4% | ||||||||||||||||||||||||||||||||
| 36,197 | Enterprise Value | EBITDA Multiple | (c) | 3.0x | - | 9.0x | 4.5x | ||||||||||||||||||||||||||||||||||
| 7,500 | Enterprise Value | Asset Multiple | (c) | 0.9x | - | 1.1x | 1.0x | ||||||||||||||||||||||||||||||||||
| 421,466 | Broker Quotations | Broker Quoted Price | (e) | N/A | - | N/A | N/A | ||||||||||||||||||||||||||||||||||
| Subordinated Debt | 24,485 | Market Yield | Market Yield | (b) | 12.0% | - | 14.0% | 12.6% | |||||||||||||||||||||||||||||||||
| Debt Investments in the JVs | 151,832 | Enterprise Value | N/A | (f) | N/A | - | N/A | N/A | |||||||||||||||||||||||||||||||||
| Preferred & Common Equity | 6,188 | Enterprise Value | Revenue Multiple | (c) | 0.9x | - | 11.2x | 2.5x | |||||||||||||||||||||||||||||||||
| 93,520 | Enterprise Value | EBITDA Multiple | (c) | 3.0x | - | 35.0x | 15.9x | ||||||||||||||||||||||||||||||||||
| 698 | Enterprise Value | Asset Multiple | (c) | 0.9x | - | 1.1x | 1.0x | ||||||||||||||||||||||||||||||||||
| 6,322 | Transactions Precedent | Transaction Price | (d) | N/A | - | N/A | N/A | ||||||||||||||||||||||||||||||||||
| Total | $ | 2,161,581 | |||||||||||||||||||||||||||||||||||||||
| Asset | Fair Value | Valuation Technique | Unobservable Input | Range | Weighted Average (c) | ||||||||||
| Senior secured debt | $ | 1,096,434 | Market yield technique | Capital structure premium | (a) | 0.0% | - | 2.0% | 0.8% | ||||||
| Tranche specific risk premium/(discount) | (a) | (4.5)% | - | 8.0% | 1.2% | ||||||||||
| Size premium | (a) | 0.5% | - | 2.0% | 1.1% | ||||||||||
| Industry premium/(discount) | (a) | (1.9)% | - | 5.4% | (0.1)% | ||||||||||
| 107,745 | Enterprise value technique | Weighted average cost of capital | 16.0% | - | 35.0% | 20.5% | |||||||||
| Company specific risk premium | (a) | 1.0% | - | 20.0% | 2.5% | ||||||||||
| Revenue growth rate | (19.6)% | - | 32.0% | (10.2)% | |||||||||||
| EBITDA multiple | (b) | 6.7x | - | 6.7x | 6.7x | ||||||||||
| Revenue multiple | (b) | 0.7x | 0.7x | 0.7x | |||||||||||
| 206,141 | Transactions precedent technique | Transaction price | (d) | N/A | - | N/A | N/A | ||||||||
| 279,215 | Market quotations | Broker quoted price | (e) | N/A | - | N/A | N/A | ||||||||
| Subordinated debt | 142,691 | Market yield technique | Capital structure premium | (a) | 2.0% | - | 2.0% | 2.0% | |||||||
| Tranche specific risk premium/(discount) | (a) | 1.0% | - | 4.0% | 2.8% | ||||||||||
| Size premium | (a) | 0.5% | - | 2.0% | 1.0% | ||||||||||
| Industry premium/(discount) | (a) | (1.3)% | - | 1.1% | 0.1% | ||||||||||
| 13,582 | Enterprise value technique | Weighted average cost of capital | 19.0% | - | 23.0% | 20.0% | |||||||||
| Company specific risk premium | (a) | 2.0% | - | 15.0% | 5.2% | ||||||||||
| Revenue growth rate | (2.9)% | - | (2.9)% | (2.9)% | |||||||||||
| Revenue multiple | (b) | 1.4x | - | 1.4x | 1.4x | ||||||||||
| SLF JV I debt investments | 129,004 | Market yield technique | Capital structure premium | (a) | 2.0% | - | 2.0% | 2.0% | |||||||
| Tranche specific risk discount | (a) | (1.2)% | - | (1.2)% | (1.2)% | ||||||||||
| Size premium | (a) | 2.0% | - | 2.0% | 2.0% | ||||||||||
| Industry premium | (a) | 1.9% | - | 1.9% | 1.9% | ||||||||||
| Preferred & common equity | 154,289 | Enterprise value technique | Weighted average cost of capital | 9.0% | - | 35.0% | 15.6% | ||||||||
| Company specific risk premium | (a) | 1.0% | - | 20.0% | 2.2% | ||||||||||
| Revenue growth rate | 0.9% | - | 156.0% | 32.5% | |||||||||||
| EBITDA multiple | (b) | 1.0x | - | 18.0x | 8.5x | ||||||||||
| Revenue multiple | (b) | 0.7x | 15.9x | 8.1x | |||||||||||
| Total | $ | 2,129,101 | |||||||||||||
| Secured borrowings | $ | 18,400 | Market yield technique | Capital structure premium | (a) | 0.0% | - | 1.0% | 0.8% | ||||||
| Tranche specific risk discount | (a) | (4.5)% | - | (0.5)% | (1.2)% | ||||||||||
| Size premium | (a) | 2.0% | - | 2.0% | 2.0% | ||||||||||
| Industry premium | (a) | 1.0% | - | 1.0% | 1.0% | ||||||||||
| Total | $ | 18,400 | �� | ||||||||||||
| Carrying Value | Fair Value | Level 1 | Level 2 | Level 3 | ||||||||||||||||||||||||||||
| Syndicated Facility payable | $ | 540,000 | $ | 540,000 | $ | — | $ | — | $ | 540,000 | ||||||||||||||||||||||
| Citibank Facility payable | 160,000 | 160,000 | — | — | 160,000 | |||||||||||||||||||||||||||
| 2025 Notes payable (carrying value is net of unamortized financing costs and unaccreted discount) | 296,991 | 283,077 | — | 283,077 | — | |||||||||||||||||||||||||||
| 2027 Notes payable (carrying value is net of unamortized financing costs, unaccreted discount and interest rate swap fair value adjustment) | 304,052 | 294,028 | — | 294,028 | — | |||||||||||||||||||||||||||
| Total | $ | 1,301,043 | $ | 1,277,105 | $ | — | $ | 577,105 | $ | 700,000 | ||||||||||||||||||||||
Carrying Value | Fair Value | Level 1 | Level 2 | Level 3 | ||||||||||||||||
| Credit facilities payable | $ | 255,995 | $ | 255,995 | $ | — | $ | — | $ | 255,995 | ||||||||||
| Unsecured notes payable (net of unamortized financing costs) | 406,115 | 414,067 | — | 163,517 | 250,550 | |||||||||||||||
| Total | $ | 662,110 | $ | 670,062 | $ | — | $ | 163,517 | $ | 506,545 | ||||||||||
| Carrying Value | Fair Value | Level 1 | Level 2 | Level 3 | ||||||||||||||||||||||||||||
| Syndicated Facility payable | $ | 495,000 | $ | 495,000 | $ | — | $ | — | $ | 495,000 | ||||||||||||||||||||||
| Citibank Facility payable | 135,000 | 135,000 | — | — | 135,000 | |||||||||||||||||||||||||||
| 2025 Notes payable (carrying value is net of unamortized financing costs and unaccreted discount) | 295,740 | 314,541 | — | 314,541 | — | |||||||||||||||||||||||||||
| 2027 Notes payable (carrying value is net of unamortized financing costs, unaccreted discount and interest rate swap fair value adjustment) | 343,003 | 351,134 | — | 351,134 | — | |||||||||||||||||||||||||||
| Total | $ | 1,268,743 | $ | 1,295,675 | $ | — | $ | 665,675 | $ | 630,000 | ||||||||||||||||||||||
Carrying Value | Fair Value | Level 1 | Level 2 | Level 3 | ||||||||||||||||
| Credit facilities payable | $ | 516,295 | $ | 516,295 | $ | — | $ | — | $ | 516,295 | ||||||||||
| SBA debentures payable (net of unamortized financing costs) | 210,011 | 198,536 | — | — | 198,536 | |||||||||||||||
| Unsecured notes payable (net of unamortized financing costs) | 404,630 | 422,307 | — | 165,444 | 256,863 | |||||||||||||||
| Total | $ | 1,130,936 | $ | 1,137,138 | $ | — | $ | 165,444 | $ | 971,694 | ||||||||||
| September 30, 2022 | September 30, 2021 | |||||||||||||||||||||||||
| Cost: | % of Total Investments | % of Total Investments | ||||||||||||||||||||||||
| Senior secured debt | $ | 2,227,245 | 85.08 | % | $ | 2,179,907 | 85.85 | % | ||||||||||||||||||
| Debt investments in the JVs | 146,444 | 5.59 | % | 146,955 | 5.79 | % | ||||||||||||||||||||
| Preferred equity | 85,300 | 3.26 | % | 65,939 | 2.60 | % | ||||||||||||||||||||
| Subordinated debt | 67,147 | 2.57 | % | 42,316 | 1.67 | % | ||||||||||||||||||||
| LLC equity interests of the JVs | 49,322 | 1.88 | % | 49,322 | 1.94 | % | ||||||||||||||||||||
| Common equity and warrants | 42,296 | 1.62 | % | 54,682 | 2.15 | % | ||||||||||||||||||||
| Total | $ | 2,617,754 | 100.00 | % | $ | 2,539,121 | 100.00 | % | ||||||||||||||||||
| September 30, 2022 | September 30, 2021 | |||||||||||||||||||||||||||||||||||||
| Fair Value: | % of Total Investments | % of Net Assets | % of Total Investments | % of Net Assets | ||||||||||||||||||||||||||||||||||
| Senior secured debt | $ | 2,166,409 | 86.86 | % | 173.93 | % | $ | 2,217,243 | 86.72 | % | 168.89 | % | ||||||||||||||||||||||||||
| Debt investments in the JVs | 146,533 | 5.88 | % | 11.77 | % | 151,832 | 5.94 | % | 11.56 | % | ||||||||||||||||||||||||||||
| Preferred equity | 79,523 | 3.19 | % | 6.38 | % | 63,565 | 2.49 | % | 4.84 | % | ||||||||||||||||||||||||||||
| Subordinated debt | 56,920 | 2.28 | % | 4.57 | % | 42,681 | 1.67 | % | 3.25 | % | ||||||||||||||||||||||||||||
| Common equity and warrants | 24,011 | 0.96 | % | 1.93 | % | 43,657 | 1.71 | % | 3.33 | % | ||||||||||||||||||||||||||||
| LLC equity interests of the JVs | 20,715 | 0.83 | % | 1.66 | % | 37,651 | 1.47 | % | 2.87 | % | ||||||||||||||||||||||||||||
| Total | $ | 2,494,111 | 100.00 | % | 200.24 | % | $ | 2,556,629 | 100.00 | % | 194.74 | % | ||||||||||||||||||||||||||
| September 30, 2017 | September 30, 2016 | |||||||||||||
| Cost: | % of Total Investments | % of Total Investments | ||||||||||||
| Senior secured debt | $ | 1,313,432 | 74.73 | % | $ | 1,789,532 | 78.36 | % | ||||||
| Subordinated debt | 112,869 | 6.42 | 171,049 | 7.49 | ||||||||||
| Debt investments in SLF JV I | 128,671 | 7.32 | 144,841 | 6.34 | ||||||||||
| LLC equity interests of SLF JV I | 16,172 | 0.92 | 16,093 | 0.70 | ||||||||||
| Purchased equity | 112,558 | 6.40 | 82,516 | 3.61 | ||||||||||
| Equity grants | 48,805 | 2.78 | 54,702 | 2.40 | ||||||||||
| Limited partnership interests | 25,158 | 1.43 | 25,125 | 1.10 | ||||||||||
| Total | $ | 1,757,665 | 100.00 | % | $ | 2,283,858 | 100.00 | % | ||||||
| September 30, 2017 | September 30, 2016 | |||||||||||||||||||
| Fair Value: | % of Total Investments | % of Total Net Assets | % of Total Investments | % of Total Net Assets | ||||||||||||||||
| Senior secured debt | $ | 1,202,699 | 78.01 | % | 138.61 | % | $ | 1,689,535 | 78.02 | % | 147.91 | % | ||||||||
| Subordinated debt | 93,438 | 6.06 | 10.77 | 156,273 | 7.22 | 13.68 | ||||||||||||||
| Debt investments in SLF JV I | 128,671 | 8.35 | 14.83 | 129,004 | 5.96 | 11.29 | ||||||||||||||
| LLC equity interests of SLF JV I | 5,525 | 0.36 | 0.64 | 13,709 | 0.63 | 1.20 | ||||||||||||||
| Purchased equity | 78,655 | 5.10 | 9.07 | 114,047 | 5.27 | 9.98 | ||||||||||||||
| Equity grants | 6,954 | 0.45 | 0.80 | 40,241 | 1.86 | 3.52 | ||||||||||||||
| Limited partnership interests | 25,813 | 1.67 | 2.97 | 22,682 | 1.04 | 1.99 | ||||||||||||||
| Total | $ | 1,541,755 | 100.00 | % | 177.69 | % | $ | 2,165,491 | 100.00 | % | 189.57 | % | ||||||||
| September 30, 2022 | September 30, 2021 | |||||||||||||||||||||||||
| Cost: | % of Total Investments | % of Total Investments | ||||||||||||||||||||||||
| Northeast | $ | 747,420 | 28.55 | % | $ | 720,781 | 28.39 | % | ||||||||||||||||||
| Midwest | 373,236 | 14.26 | % | 385,846 | 15.20 | % | ||||||||||||||||||||
| West | 358,306 | 13.69 | % | 365,471 | 14.39 | % | ||||||||||||||||||||
| Southeast | 356,041 | 13.60 | % | 294,339 | 11.59 | % | ||||||||||||||||||||
| International | 301,242 | 11.51 | % | 268,817 | 10.59 | % | ||||||||||||||||||||
| Southwest | 221,308 | 8.45 | % | 256,227 | 10.09 | % | ||||||||||||||||||||
| South | 168,819 | 6.45 | % | 156,764 | 6.17 | % | ||||||||||||||||||||
| Northwest | 91,382 | 3.49 | % | 90,876 | 3.58 | % | ||||||||||||||||||||
| Total | $ | 2,617,754 | 100.00 | % | $ | 2,539,121 | 100.00 | % | ||||||||||||||||||
| September 30, 2017 | September 30, 2016 | |||||||||||||
| Cost: | % of Total Investments | % of Total Investments | ||||||||||||
| Northeast U.S. | $ | 648,105 | 36.87 | % | $ | 660,616 | 28.92 | % | ||||||
| West U.S. | 328,673 | 18.70 | 470,700 | 20.61 | ||||||||||
| Southwest U.S. | 271,484 | 15.45 | 416,060 | 18.22 | ||||||||||
| Midwest U.S. | 258,895 | 14.73 | 320,368 | 14.03 | ||||||||||
| Southeast U.S. | 176,460 | 10.04 | 308,770 | 13.52 | ||||||||||
| International | 62,649 | 3.56 | 107,344 | 4.70 | ||||||||||
| Northwest U.S. | 11,399 | 0.65 | — | — | ||||||||||
| Total | $ | 1,757,665 | 100.00 | % | $ | 2,283,858 | 100.00 | % | ||||||
| September 30, 2022 | September 30, 2021 | |||||||||||||||||||||||||||||||||||||
| Fair Value: | % of Total Investments | % of Net Assets | % of Total Investments | % of Net Assets | ||||||||||||||||||||||||||||||||||
| Northeast | $ | 696,368 | 27.93 | % | 55.90 | % | $ | 721,647 | 28.24 | % | 54.97 | % | ||||||||||||||||||||||||||
| Midwest | 356,934 | 14.31 | % | 28.66 | % | 382,475 | 14.96 | % | 29.13 | % | ||||||||||||||||||||||||||||
| West | 345,251 | 13.84 | % | 27.72 | % | 371,257 | 14.52 | % | 28.28 | % | ||||||||||||||||||||||||||||
| Southeast | 344,567 | 13.82 | % | 27.66 | % | 299,486 | 11.71 | % | 22.81 | % | ||||||||||||||||||||||||||||
| International | 279,646 | 11.21 | % | 22.45 | % | 275,904 | 10.79 | % | 21.02 | % | ||||||||||||||||||||||||||||
| Southwest | 214,984 | 8.62 | % | 17.26 | % | 258,940 | 10.13 | % | 19.72 | % | ||||||||||||||||||||||||||||
| South | 166,230 | 6.66 | % | 13.35 | % | 155,526 | 6.08 | % | 11.85 | % | ||||||||||||||||||||||||||||
| Northwest | 90,131 | 3.61 | % | 7.24 | % | 91,394 | 3.57 | % | 6.96 | % | ||||||||||||||||||||||||||||
| Total | $ | 2,494,111 | 100.00 | % | 200.24 | % | $ | 2,556,629 | 100.00 | % | 194.74 | % | ||||||||||||||||||||||||||
| September 30, 2017 | September 30, 2016 | |||||||||||||||||||
| Fair Value: | % of Total Investments | % of Total Net Assets | % of Total Investments | % of Total Net Assets | ||||||||||||||||
| Northeast U.S. | $ | 539,803 | 35.01 | % | 62.22 | % | $ | 607,240 | 28.03 | % | 53.15 | % | ||||||||
| West U.S. | 297,716 | 19.31 | 34.31 | % | 452,078 | 20.88 | 39.58 | % | ||||||||||||
| Southwest U.S. | 224,233 | 14.54 | 25.84 | % | 406,307 | 18.76 | 28.32 | % | ||||||||||||
| Midwest U.S. | 224,111 | 14.54 | 25.83 | % | 263,434 | 12.17 | 23.06 | % | ||||||||||||
| Southeast U.S. | 179,460 | 11.64 | 20.68 | % | 323,481 | 14.94 | 35.57 | % | ||||||||||||
| International | 64,780 | 4.20 | 7.47 | % | 112,951 | 5.22 | 9.89 | % | ||||||||||||
| Northwest U.S. | 11,652 | 0.76 | 1.34 | % | — | — | — | |||||||||||||
| Total | $ | 1,541,755 | 100.00 | % | 177.69 | % | $ | 2,165,491 | 100.00 | % | 189.57 | % | ||||||||
| September 30, 2022 | September 30, 2021 | |||||||||||||||||||||||||
| Cost: | % of Total Investments | % of Total Investments | ||||||||||||||||||||||||
| Application Software | $ | 391,938 | 14.98 | % | $ | 367,265 | 14.49 | % | ||||||||||||||||||
| Multi-Sector Holdings (1) | 195,766 | 7.48 | 196,277 | 7.73 | ||||||||||||||||||||||
| Pharmaceuticals | 126,508 | 4.83 | 138,250 | 5.44 | ||||||||||||||||||||||
| Data Processing & Outsourced Services | 120,477 | 4.60 | 120,381 | 4.74 | ||||||||||||||||||||||
| Biotechnology | 109,960 | 4.20 | 111,856 | 4.41 | ||||||||||||||||||||||
| Health Care Technology | 100,084 | 3.82 | 13,877 | 0.55 | ||||||||||||||||||||||
| Industrial Machinery | 81,787 | 3.12 | 88,231 | 3.47 | ||||||||||||||||||||||
| Specialized Finance | 80,864 | 3.09 | 68,554 | 2.70 | ||||||||||||||||||||||
| Internet & Direct Marketing Retail | 67,926 | 2.59 | 62,233 | 2.45 | ||||||||||||||||||||||
| Aerospace & Defense | 61,963 | 2.37 | 67,629 | 2.66 | ||||||||||||||||||||||
| Construction & Engineering | 60,996 | 2.33 | 61,874 | 2.44 | ||||||||||||||||||||||
| Automotive Retail | 59,254 | 2.26 | 41,800 | 1.65 | ||||||||||||||||||||||
| Health Care Services | 58,674 | 2.24 | 84,750 | 3.34 | ||||||||||||||||||||||
| Health Care Distributors | 57,112 | 2.18 | 19,698 | 0.78 | ||||||||||||||||||||||
| Internet Services & Infrastructure | 54,095 | 2.07 | 46,917 | 1.85 | ||||||||||||||||||||||
| Personal Products | 53,214 | 2.03 | 103,642 | 4.08 | ||||||||||||||||||||||
| Fertilizers & Agricultural Chemicals | 49,301 | 1.88 | 66,713 | 2.63 | ||||||||||||||||||||||
| Metal & Glass Containers | 47,704 | 1.82 | 17,443 | 0.69 | ||||||||||||||||||||||
| Real Estate Operating Companies | 47,585 | 1.82 | 27,531 | 1.08 | ||||||||||||||||||||||
| Home Improvement Retail | 45,802 | 1.75 | 46,487 | 1.83 | ||||||||||||||||||||||
| Airport Services | 43,322 | 1.65 | 41,699 | 1.64 | ||||||||||||||||||||||
| Real Estate Services | 40,243 | 1.54 | 40,445 | 1.59 | ||||||||||||||||||||||
| Leisure Facilities | 39,768 | 1.52 | 25,162 | 0.99 | ||||||||||||||||||||||
| Diversified Support Services | 37,992 | 1.45 | 40,666 | 1.60 | ||||||||||||||||||||||
| Specialty Chemicals | 37,319 | 1.43 | 46,731 | 1.84 | ||||||||||||||||||||||
| Health Care Supplies | 36,471 | 1.39 | 29,650 | 1.17 | ||||||||||||||||||||||
| Insurance Brokers | 35,628 | 1.36 | 25,515 | 1.00 | ||||||||||||||||||||||
| Integrated Telecommunication Services | 34,628 | 1.32 | 47,059 | 1.85 | ||||||||||||||||||||||
| Soft Drinks | 34,272 | 1.31 | 33,410 | 1.32 | ||||||||||||||||||||||
| Electrical Components & Equipment | 33,814 | 1.29 | 32,127 | 1.27 | ||||||||||||||||||||||
| Other Diversified Financial Services | 29,300 | 1.12 | 16,104 | 0.63 | ||||||||||||||||||||||
| Advertising | 28,245 | 1.08 | 28,649 | 1.13 | ||||||||||||||||||||||
| Movies & Entertainment | 26,161 | 1.00 | 26,002 | 1.02 | ||||||||||||||||||||||
| Distributors | 25,278 | 0.97 | — | — | ||||||||||||||||||||||
| Health Care Equipment | 24,353 | 0.93 | 23,674 | 0.93 | ||||||||||||||||||||||
| Oil & Gas Storage & Transportation | 22,290 | 0.85 | 36,612 | 1.44 | ||||||||||||||||||||||
| Environmental & Facilities Services | 20,857 | 0.80 | — | — | ||||||||||||||||||||||
| Cable & Satellite | 20,716 | 0.79 | 26,730 | 1.05 | ||||||||||||||||||||||
| Home Furnishings | 19,550 | 0.75 | 19,537 | 0.77 | ||||||||||||||||||||||
| Systems Software | 14,890 | 0.57 | 6,647 | 0.26 | ||||||||||||||||||||||
| Consumer Finance | 14,492 | 0.55 | — | — | ||||||||||||||||||||||
| Hotels, Resorts & Cruise Lines | 13,960 | 0.53 | — | — | ||||||||||||||||||||||
| Auto Parts & Equipment | 12,474 | 0.48 | 12,466 | 0.49 | ||||||||||||||||||||||
| IT Consulting & Other Services | 11,697 | 0.45 | 7,598 | 0.30 | ||||||||||||||||||||||
| Restaurants | 9,338 | 0.36 | 9,317 | 0.37 | ||||||||||||||||||||||
| Research & Consulting Services | 9,187 | 0.35 | 7,354 | 0.29 | ||||||||||||||||||||||
| Education Services | 9,080 | 0.35 | 981 | 0.04 | ||||||||||||||||||||||
| Oil & Gas Refining & Marketing | 8,627 | 0.33 | 36,044 | 1.42 | ||||||||||||||||||||||
| Trading Companies & Distributors | 7,628 | 0.29 | — | — | ||||||||||||||||||||||
| Air Freight & Logistics | 7,295 | 0.28 | 4,925 | 0.19 | ||||||||||||||||||||||
| Apparel Retail | 5,268 | 0.20 | — | — | ||||||||||||||||||||||
| Apparel, Accessories & Luxury Goods | 5,165 | 0.20 | 5,165 | 0.20 | ||||||||||||||||||||||
| Integrated Oil & Gas | 4,866 | 0.19 | 4,842 | 0.19 | ||||||||||||||||||||||
| Food Distributors | 4,646 | 0.18 | 4,625 | 0.18 | ||||||||||||||||||||||
| Specialized REITs | 4,318 | 0.16 | — | — | ||||||||||||||||||||||
| Diversified Banks | 3,515 | 0.13 | 3,515 | 0.14 | ||||||||||||||||||||||
| Technology Distributors | 3,163 | 0.12 | 3,163 | 0.12 | ||||||||||||||||||||||
| Construction Materials | 2,331 | 0.09 | 2,245 | 0.09 | ||||||||||||||||||||||
| Housewares & Specialties | 2,293 | 0.09 | 1,875 | 0.07 | ||||||||||||||||||||||
| Electronic Components | 2,092 | 0.08 | 10,080 | 0.40 | ||||||||||||||||||||||
| Alternative Carriers | 212 | 0.01 | 6,578 | 0.26 | ||||||||||||||||||||||
| Independent Power Producers & Energy Traders | — | — | 23,458 | 0.92 | ||||||||||||||||||||||
| Airlines | — | — | 22,417 | 0.88 | ||||||||||||||||||||||
| Commercial Printing | — | — | 19,685 | 0.78 | ||||||||||||||||||||||
| Managed Health Care | — | — | 18,654 | 0.73 | ||||||||||||||||||||||
| Thrifts & Mortgage Finance | — | — | 16,079 | 0.63 | ||||||||||||||||||||||
| Property & Casualty Insurance | — | — | 9,884 | 0.39 | ||||||||||||||||||||||
| Leisure Products | — | — | 6,599 | 0.26 | ||||||||||||||||||||||
| Food Retail | — | — | 3,745 | 0.15 | ||||||||||||||||||||||
| $ | 2,617,754 | 100.00 | % | $ | 2,539,121 | 100.00 | % | |||||||||||||||||||
| September 30, 2017 | September 30, 2016 | |||||||||||||
| Cost: | % of Total Investments | % of Total Investments | ||||||||||||
| Internet software & services | $ | 270,192 | 15.37 | % | $ | 361,396 | 15.80 | % | ||||||
| Healthcare services | 210,527 | 11.98 | 379,250 | 16.60 | ||||||||||
| Multi-sector holdings (1) | 173,427 | 9.87 | 178,113 | 7.80 | ||||||||||
| Healthcare equipment | 99,614 | 5.67 | 119,705 | 5.24 | ||||||||||
| Advertising | 84,720 | 4.82 | 170,517 | 7.47 | ||||||||||
| Data processing & outsourced services | 77,673 | 4.42 | 83,988 | 3.68 | ||||||||||
| Construction & engineering | 67,879 | 3.86 | 66,337 | 2.90 | ||||||||||
| Pharmaceuticals | 60,810 | 3.46 | 59,521 | 2.61 | ||||||||||
| Specialty stores | 58,530 | 3.33 | 46,618 | 2.04 | ||||||||||
| Airlines | 57,602 | 3.28 | 71,067 | 3.11 | ||||||||||
| Application software | 51,444 | 2.93 | 48,581 | 2.13 | ||||||||||
| Education services | 50,013 | 2.85 | 23,568 | 1.03 | ||||||||||
| Environmental & facilities services | 49,902 | 2.84 | 99,054 | 4.34 | ||||||||||
| Research & consulting services | 37,952 | 2.16 | 63,137 | 2.76 | ||||||||||
| Air freight and logistics | 32,530 | 1.85 | 31,657 | 1.39 | ||||||||||
| Leisure facilities | 30,931 | 1.76 | 33,981 | 1.49 | ||||||||||
| Integrated telecommunication services | 30,840 | 1.75 | 56,343 | 2.47 | ||||||||||
| Housewares & specialties | 29,852 | 1.70 | — | — | ||||||||||
| Oil & gas equipment services | 27,598 | 1.57 | 45,646 | 2.00 | ||||||||||
| Casinos & gaming | 23,309 | 1.33 | — | — | ||||||||||
| Consumer electronics | 23,176 | 1.32 | 24,870 | 1.09 | ||||||||||
| Home improvement retail | 22,944 | 1.31 | 24,352 | 1.07 | ||||||||||
| Diversified support services | 22,724 | 1.29 | 85,144 | 3.73 | ||||||||||
| Auto parts & equipment | 21,191 | 1.21 | 16,643 | 0.73 | ||||||||||
| Industrial machinery | 15,074 | 0.86 | 46,517 | 2.04 | ||||||||||
| Distributors | 14,963 | 0.85 | — | — | ||||||||||
| Security & alarm services | 13,214 | 0.75 | 13,520 | 0.59 | ||||||||||
| Real Estate Services | 13,011 | 0.74 | — | — | ||||||||||
| Other diversified financial services | 12,079 | 0.69 | 14,794 | 0.65 | ||||||||||
| Hypermarkets & super centers | 11,979 | 0.68 | — | — | ||||||||||
| Precious metals & minerals | 7,459 | 0.42 | — | — | ||||||||||
| Thrift & mortgage finance | 7,240 | 0.41 | 7,946 | 0.35 | ||||||||||
| Trucking | 7,081 | 0.40 | — | — | ||||||||||
| Computer & electronics retail | 6,399 | 0.36 | — | — | ||||||||||
| Multi-utilities | 6,201 | 0.35 | — | — | ||||||||||
| Commercial printing | 5,983 | 0.34 | 6,090 | 0.27 | ||||||||||
| Apparel, accessories & luxury goods | 5,165 | 0.29 | 15,694 | 0.69 | ||||||||||
| Restaurants | 4,910 | 0.28 | 4,951 | 0.22 | ||||||||||
| Food retail | 4,176 | 0.24 | 4,169 | 0.18 | ||||||||||
| IT consulting & other services | 4,127 | 0.23 | 51,868 | 2.27 | ||||||||||
| Specialized finance | 3,224 | 0.18 | — | — | ||||||||||
| Food distributors | — | — | 11,903 | 0.52 | ||||||||||
| Specialized consumer services | — | — | 9,014 | 0.39 | ||||||||||
| Healthcare technology | — | — | 7,904 | 0.35 | ||||||||||
| Total | $ | 1,757,665 | 100.00 | % | $ | 2,283,858 | 100.00 | % | ||||||
| September 30, 2022 | September 30, 2021 | |||||||||||||||||||||||||||||||||||||
| Fair Value: | % of Total Investments | % of Net Assets | % of Total Investments | % of Net Assets | ||||||||||||||||||||||||||||||||||
| Application Software | $ | 384,589 | 15.43 | % | 30.87 | % | $ | 372,606 | 14.58 | % | 28.39 | % | ||||||||||||||||||||||||||
| Multi-Sector Holdings (1) | 167,248 | 6.71 | 13.43 | 189,483 | 7.41 | 14.43 | ||||||||||||||||||||||||||||||||
| Pharmaceuticals | 119,511 | 4.79 | 9.59 | 142,194 | 5.56 | 10.83 | ||||||||||||||||||||||||||||||||
| Data Processing & Outsourced Services | 111,335 | 4.46 | 8.94 | 113,923 | 4.46 | 8.68 | ||||||||||||||||||||||||||||||||
| Biotechnology | 108,465 | 4.35 | 8.71 | 113,641 | 4.44 | 8.66 | ||||||||||||||||||||||||||||||||
| Health Care Technology | 97,315 | 3.90 | 7.81 | 13,960 | 0.55 | 1.06 | ||||||||||||||||||||||||||||||||
| Industrial Machinery | 81,008 | 3.25 | 6.50 | 90,218 | 3.53 | 6.87 | ||||||||||||||||||||||||||||||||
| Specialized Finance | 73,087 | 2.93 | 5.87 | 68,844 | 2.69 | 5.24 | ||||||||||||||||||||||||||||||||
| Internet & Direct Marketing Retail | 70,419 | 2.82 | 5.65 | 68,424 | 2.68 | 5.21 | ||||||||||||||||||||||||||||||||
| Aerospace & Defense | 61,881 | 2.48 | 4.97 | 69,602 | 2.72 | 5.30 | ||||||||||||||||||||||||||||||||
| Construction & Engineering | 61,188 | 2.45 | 4.91 | 63,109 | 2.47 | 4.81 | ||||||||||||||||||||||||||||||||
| Automotive Retail | 57,629 | 2.31 | 4.63 | 42,133 | 1.65 | 3.21 | ||||||||||||||||||||||||||||||||
| Health Care Distributors | 54,662 | 2.19 | 4.39 | 19,683 | 0.77 | 1.50 | ||||||||||||||||||||||||||||||||
| Internet Services & Infrastructure | 53,797 | 2.16 | 4.32 | 47,923 | 1.87 | 3.65 | ||||||||||||||||||||||||||||||||
| Fertilizers & Agricultural Chemicals | 51,972 | 2.08 | 4.17 | 67,527 | 2.64 | 5.14 | ||||||||||||||||||||||||||||||||
| Personal Products | 50,150 | 2.01 | 4.03 | 105,530 | 4.13 | 8.04 | ||||||||||||||||||||||||||||||||
| Real Estate Operating Companies | 48,062 | 1.93 | 3.86 | 28,341 | 1.11 | 2.16 | ||||||||||||||||||||||||||||||||
| Metal & Glass Containers | 47,599 | 1.91 | 3.82 | 17,413 | 0.68 | 1.33 | ||||||||||||||||||||||||||||||||
| Health Care Services | 45,943 | 1.84 | 3.69 | 84,735 | 3.31 | 6.45 | ||||||||||||||||||||||||||||||||
| Home Improvement Retail | 45,421 | 1.82 | 3.65 | 46,488 | 1.82 | 3.54 | ||||||||||||||||||||||||||||||||
| Airport Services | 42,883 | 1.72 | 3.44 | 40,776 | 1.59 | 3.11 | ||||||||||||||||||||||||||||||||
| Real Estate Services | 39,573 | 1.59 | 3.18 | 41,225 | 1.61 | 3.14 | ||||||||||||||||||||||||||||||||
| Leisure Facilities | 39,258 | 1.57 | 3.15 | 22,888 | 0.90 | 1.74 | ||||||||||||||||||||||||||||||||
| Diversified Support Services | 36,712 | 1.47 | 2.95 | 40,888 | 1.60 | 3.11 | ||||||||||||||||||||||||||||||||
| Health Care Supplies | 36,577 | 1.47 | 2.94 | 30,186 | 1.18 | 2.30 | ||||||||||||||||||||||||||||||||
| Specialty Chemicals | 33,969 | 1.36 | 2.73 | 46,559 | 1.82 | 3.55 | ||||||||||||||||||||||||||||||||
| Soft Drinks | 33,670 | 1.35 | 2.70 | 33,410 | 1.31 | 2.54 | ||||||||||||||||||||||||||||||||
| Insurance Brokers | 33,081 | 1.33 | 2.66 | 27,612 | 1.08 | 2.10 | ||||||||||||||||||||||||||||||||
| Electrical Components & Equipment | 32,933 | 1.32 | 2.64 | 32,142 | 1.26 | 2.45 | ||||||||||||||||||||||||||||||||
| Integrated Telecommunication Services | 32,201 | 1.29 | 2.59 | 49,607 | 1.94 | 3.78 | ||||||||||||||||||||||||||||||||
| Advertising | 26,948 | 1.08 | 2.16 | 30,423 | 1.19 | 2.32 | ||||||||||||||||||||||||||||||||
| Movies & Entertainment | 26,645 | 1.07 | 2.14 | 27,048 | 1.06 | 2.06 | ||||||||||||||||||||||||||||||||
| Distributors | 24,494 | 0.98 | 1.97 | — | — | — | ||||||||||||||||||||||||||||||||
| Other Diversified Financial Services | 24,326 | 0.98 | 1.95 | 15,908 | 0.62 | 1.21 | ||||||||||||||||||||||||||||||||
| Health Care Equipment | 24,161 | 0.97 | 1.94 | 23,763 | 0.93 | 1.81 | ||||||||||||||||||||||||||||||||
| Oil & Gas Storage & Transportation | 20,853 | 0.84 | 1.67 | 34,462 | 1.35 | 2.63 | ||||||||||||||||||||||||||||||||
| Environmental & Facilities Services | 20,585 | 0.83 | 1.65 | — | — | — | ||||||||||||||||||||||||||||||||
| Cable & Satellite | 19,576 | 0.78 | 1.57 | 27,048 | 1.06 | 2.06 | ||||||||||||||||||||||||||||||||
| Home Furnishings | 18,188 | 0.73 | 1.46 | 19,735 | 0.77 | 1.50 | ||||||||||||||||||||||||||||||||
| Hotels, Resorts & Cruise Lines | 13,985 | 0.56 | 1.12 | — | — | — | ||||||||||||||||||||||||||||||||
| Consumer Finance | 13,284 | 0.53 | 1.07 | — | — | — | ||||||||||||||||||||||||||||||||
| Systems Software | 12,834 | 0.51 | 1.03 | 6,769 | 0.26 | 0.52 | ||||||||||||||||||||||||||||||||
| Auto Parts & Equipment | 11,469 | 0.46 | 0.92 | 12,365 | 0.48 | 0.94 | ||||||||||||||||||||||||||||||||
| Restaurants | 8,692 | 0.35 | 0.70 | 9,451 | 0.37 | 0.72 | ||||||||||||||||||||||||||||||||
| Oil & Gas Refining & Marketing | 8,604 | 0.34 | 0.69 | 36,546 | 1.43 | 2.78 | ||||||||||||||||||||||||||||||||
| IT Consulting & Other Services | 8,596 | 0.34 | 0.69 | 7,443 | 0.29 | 0.57 | ||||||||||||||||||||||||||||||||
| Education Services | 8,582 | 0.34 | 0.69 | 1,009 | 0.04 | 0.08 | ||||||||||||||||||||||||||||||||
| Research & Consulting Services | 8,573 | 0.34 | 0.69 | 7,606 | 0.30 | 0.58 | ||||||||||||||||||||||||||||||||
| Air Freight & Logistics | 6,405 | 0.26 | 0.51 | 4,981 | 0.19 | 0.38 | ||||||||||||||||||||||||||||||||
| Trading Companies & Distributors | 5,567 | 0.22 | 0.45 | — | — | — | ||||||||||||||||||||||||||||||||
| Apparel Retail | 5,223 | 0.21 | 0.42 | — | — | — | ||||||||||||||||||||||||||||||||
| Integrated Oil & Gas | 4,872 | 0.20 | 0.39 | 4,884 | 0.19 | 0.37 | ||||||||||||||||||||||||||||||||
| Diversified Banks | 3,402 | 0.14 | 0.27 | 3,562 | 0.14 | 0.27 | ||||||||||||||||||||||||||||||||
| Food Distributors | 3,367 | 0.13 | 0.27 | 4,673 | 0.18 | 0.36 | ||||||||||||||||||||||||||||||||
| Specialized REITs | 3,264 | 0.13 | 0.26 | — | — | — | ||||||||||||||||||||||||||||||||
| Technology Distributors | 2,997 | 0.12 | 0.24 | 3,178 | 0.12 | 0.24 | ||||||||||||||||||||||||||||||||
| Housewares & Specialties | 2,456 | 0.10 | 0.20 | 2,003 | 0.08 | 0.15 | ||||||||||||||||||||||||||||||||
| Construction Materials | 1,934 | 0.08 | 0.16 | 2,350 | 0.09 | 0.18 | ||||||||||||||||||||||||||||||||
| Electronic Components | 1,890 | 0.08 | 0.15 | 10,127 | 0.40 | 0.77 | ||||||||||||||||||||||||||||||||
| Alternative Carriers | 201 | 0.01 | 0.02 | 6,939 | 0.27 | 0.53 | ||||||||||||||||||||||||||||||||
| Airlines | — | — | — | 24,554 | 0.96 | 1.87 | ||||||||||||||||||||||||||||||||
| Independent Power Producers & Energy Traders | — | — | — | 23,552 | 0.92 | 1.79 | ||||||||||||||||||||||||||||||||
| Commercial Printing | — | — | — | 20,100 | 0.79 | 1.53 | ||||||||||||||||||||||||||||||||
| Managed Health Care | — | — | — | 18,840 | 0.74 | 1.44 | ||||||||||||||||||||||||||||||||
| Thrifts & Mortgage Finance | — | — | — | 15,942 | 0.62 | 1.21 | ||||||||||||||||||||||||||||||||
| Property & Casualty Insurance | — | — | — | 9,949 | 0.39 | 0.76 | ||||||||||||||||||||||||||||||||
| Leisure Products | — | — | — | 6,599 | 0.26 | 0.50 | ||||||||||||||||||||||||||||||||
| Food Retail | — | — | — | 3,750 | 0.15 | 0.29 | ||||||||||||||||||||||||||||||||
| Total | $ | 2,494,111 | 100.00 | % | 200.24 | % | $ | 2,556,629 | 100.00 | % | 194.74 | % | ||||||||||||||||||||||||||
| September 30, 2017 | September 30, 2016 | |||||||||||||||||||
| Fair Value: | % of Total Investments | % of Total Net Assets | % of Total Investments | % of Total Net Assets | ||||||||||||||||
| Internet software & services | $ | 265,076 | 17.20 | % | 30.56 | % | $ | 326,665 | 15.09 | % | 28.56 | % | ||||||||
| Multi-sector holdings (1) | 164,511 | 10.67 | 18.96 | 159,549 | 7.37 | 13.97 | ||||||||||||||
| Healthcare services | 93,912 | 6.09 | 10.82 | 360,937 | 16.64 | 31.60 | ||||||||||||||
| Advertising | 83,648 | 5.43 | 9.64 | 149,337 | 6.90 | 13.07 | ||||||||||||||
| Healthcare equipment | 72,922 | 4.73 | 8.40 | 120,827 | 5.58 | 10.58 | ||||||||||||||
| Data processing & outsourced services | 68,314 | 4.43 | 7.87 | 80,435 | 3.71 | 7.04 | ||||||||||||||
| Pharmaceuticals | 62,770 | 4.07 | 7.23 | 60,517 | 2.79 | 5.30 | ||||||||||||||
| Airlines | 59,511 | 3.86 | 6.86 | 77,046 | 3.56 | 6.74 | ||||||||||||||
| Specialty stores | 56,867 | 3.69 | 6.55 | 45,233 | 2.09 | 3.96 | ||||||||||||||
| Application software | 53,905 | 3.50 | 6.21 | 50,799 | 2.35 | 4.45 | ||||||||||||||
| Environmental & facilities services | 50,659 | 3.29 | 5.84 | 100,852 | 4.66 | 8.83 | ||||||||||||||
| Construction & engineering | 50,269 | 3.26 | 5.79 | 62,740 | 2.90 | 5.49 | ||||||||||||||
| Research & consulting services | 38,531 | 2.50 | 4.44 | 63,404 | 2.93 | 5.55 | ||||||||||||||
| Education services | 38,254 | 2.48 | 4.41 | 19,745 | 0.91 | 1.73 | ||||||||||||||
| Leisure facilities | 32,591 | 2.11 | 3.76 | 34,486 | 1.59 | 3.02 | ||||||||||||||
| Integrated telecommunication services | 31,358 | 2.03 | 3.61 | 53,092 | 2.45 | 4.65 | ||||||||||||||
| Housewares & specialties | 29,775 | 1.93 | 3.43 | — | 0.00 | — | ||||||||||||||
| Oil & gas equipment services | 28,347 | 1.84 | 3.27 | 16,783 | 0.78 | 1.47 | ||||||||||||||
| Home improvement retail | 24,784 | 1.61 | 2.86 | 26,141 | 1.21 | 2.29 | ||||||||||||||
| Consumer electronics | 24,066 | 1.56 | 2.77 | 25,180 | 1.16 | 2.20 | ||||||||||||||
| Casinos & gaming | 23,495 | 1.52 | 2.71 | — | 0.00 | — | ||||||||||||||
| Diversified support services | 22,554 | 1.46 | 2.60 | 75,720 | 3.50 | 6.63 | ||||||||||||||
| Auto parts & equipment | 21,715 | 1.41 | 2.50 | 18,688 | 0.86 | 1.64 | ||||||||||||||
| Industrial machinery | 15,004 | 0.97 | 1.73 | 51,581 | 2.38 | 4.52 | ||||||||||||||
| Distributors | 14,829 | 0.96 | 1.71 | — | 0.00 | — | ||||||||||||||
| Security & alarm services | 13,103 | 0.85 | 1.51 | 13,776 | 0.64 | 1.21 | ||||||||||||||
| Real Estate Services | 13,014 | 0.84 | 1.50 | — | 0.00 | — | ||||||||||||||
| Other diversified financial services | 11,646 | 0.76 | 1.34 | 14,777 | 0.68 | 1.29 | ||||||||||||||
| Hypermarkets & super centers | 11,504 | 0.75 | 1.33 | — | — | — | ||||||||||||||
| Precious metals & minerals | 7,464 | 0.48 | 0.86 | — | — | — | ||||||||||||||
| Trucking | 7,106 | 0.46 | 0.82 | — | — | — | ||||||||||||||
| Computer & electronics retail | 6,498 | 0.42 | 0.75 | — | — | — | ||||||||||||||
| Multi-utilities | 6,255 | 0.41 | 0.72 | — | — | — | ||||||||||||||
| Thrift & mortgage finance | 6,129 | 0.40 | 0.71 | 5,846 | 0.27 | 0.51 | ||||||||||||||
| Commercial printing | 6,045 | 0.39 | 0.70 | 6,127 | 0.28 | 0.54 | ||||||||||||||
| Leisure products | 5,900 | 0.38 | 0.68 | 34,981 | 1.62 | 3.06 | ||||||||||||||
| Restaurants | 4,917 | 0.32 | 0.57 | 4,985 | 0.23 | 0.44 | ||||||||||||||
| Food retail | 4,251 | 0.28 | 0.49 | 4,214 | 0.19 | 0.37 | ||||||||||||||
| IT consulting & other services | 3,927 | 0.25 | 0.45 | 51,460 | 2.38 | 4.51 | ||||||||||||||
| Specialized finance | 3,278 | 0.21 | 0.38 | — | — | — | ||||||||||||||
| Air freight and logistics | 1,810 | 0.12 | 0.21 | 7,046 | 0.33 | 0.62 | ||||||||||||||
| Apparel, accessories & luxury goods | 1,241 | 0.08 | 0.14 | 14,620 | 0.68 | 1.28 | ||||||||||||||
| Food distributors | — | — | — | 11,400 | 0.53 | 1.00 | ||||||||||||||
| Specialized consumer services | — | — | — | 9,082 | 0.42 | 0.80 | ||||||||||||||
| Healthcare technology | — | — | — | 7,420 | 0.34 | 0.65 | ||||||||||||||
| Total | $ | 1,541,755 | 100.00 | % | 177.69 | % | $ | 2,165,491 | 100.00 | % | 189.57 | % | ||||||||
| September 30, 2022 | September 30, 2021 | |||||||||||||
| Senior secured loans (1) | $383,194 | $344,196 | ||||||||||||
| Weighted average interest rate on senior secured loans (2) | 8.33% | 5.60% | ||||||||||||
| Number of borrowers in SLF JV I | 60 | 55 | ||||||||||||
| Largest exposure to a single borrower (1) | $10,093 | $9,875 | ||||||||||||
| Total of five largest loan exposures to borrowers (1) | $48,139 | $46,984 | ||||||||||||
| September 30, 2017 | September 30, 2016 | |||
| Senior secured loans (1) | $245,063 | $324,406 | ||
| Weighted average interest rate on senior secured loans (2) | 7.70% | 7.84% | ||
| Number of borrowers in SLF JV I | 32 | 37 | ||
| Largest exposure to a single borrower (1) | $18,374 | $19,775 | ||
| Total of five largest loan exposures to borrowers (1) | $82,728 | $93,926 | ||
| Portfolio Company | Industry | Investment Type | Maturity Date | Current Interest Rate(1)(4) | Cash Interest Rate | Principal | Cost | Fair Value (2) | |||||||||||||||
| AdVenture Interactive, Corp. (3) | Advertising | 927 Common Stock Shares | $ | 1,088 | $ | 1,412 | |||||||||||||||||
| Allied Universal Holdco LLC (3) | Security & alarm services | First Lien | 7/28/2022 | LIBOR+3.75% (1% floor) | 5.08 | % | $ | 6,982 | 7,040 | 6,976 | |||||||||||||
| Ameritox Ltd. (3)(5) | Healthcare services | First Lien | 4/11/2021 | LIBOR+5% (1% floor) 3% PIK | 6.33 | % | 5,759 | 5,638 | 668 | ||||||||||||||
| 301,913.06 Class B Preferred Units | 302 | — | |||||||||||||||||||||
| 928.96 Class A Common Units | 5,474 | — | |||||||||||||||||||||
| Total Ameritox, Ltd. | 5,759 | 11,414 | 668 | ||||||||||||||||||||
| BeyondTrust Software, Inc. (3) | Application software | First Lien | 9/25/2019 | LIBOR+7% (1% floor) | 8.33 | % | 15,330 | 15,231 | 15,329 | ||||||||||||||
| BJ's Wholesale Club, Inc. (3) | Hypermarkets & super centers | First Lien | 1/26/2024 | LIBOR+3.75% (1% floor) | 4.99 | % | 4,988 | 4,993 | 4,793 | ||||||||||||||
| Compuware Corporation | Internet software & services | First Lien B3 | 12/15/2021 | LIBOR+4.25% (1% floor) | 5.49 | % | 11,154 | 11,041 | 11,293 | ||||||||||||||
| DFT Intermediate LLC (3) | Specialized finance | First Lien | 3/1/2023 | LIBOR+5.5% (1% floor) | 6.74 | % | 10,723 | 10,474 | 10,652 | ||||||||||||||
| Digital River, Inc. | Internet software & services | First Lien | 2/12/2021 | LIBOR+6.5% (1% floor) | 7.82 | % | 4,524 | 4,541 | 4,546 | ||||||||||||||
| Dodge Data & Analytics LLC (3) | Data processing & outsourced services | First Lien | 10/31/2019 | LIBOR+8.75% (1% floor) | 10.13 | % | 9,339 | 9,372 | 8,744 | ||||||||||||||
| DTZ U.S. Borrower, LLC (3) | Real estate services | First Lien | 11/4/2021 | LIBOR+3.25% (1% floor) | 4.57 | % | 6,964 | 6,998 | 6,990 | ||||||||||||||
| Edge Fitness, LLC | Leisure facilities | First Lien | 12/31/2019 | LIBOR+7.75% (1% floor) | 9.05 | % | 10,600 | 10,602 | 10,600 | ||||||||||||||
| EOS Fitness Opco Holdings, LLC (3) | Leisure facilities | First Lien | 12/30/2019 | LIBOR+8.75% (0.75% floor) | 9.99 | % | 18,374 | 18,182 | 18,557 | ||||||||||||||
| Everi Payments Inc.(3) | Casinos & gaming | First Lien | 5/9/2024 | LIBOR+4.5% (1% floor) | 5.74 | % | 4,988 | 4,964 | 5,039 | ||||||||||||||
| Falmouth Group Holdings Corp. | Specialty chemicals | First Lien | 12/13/2021 | LIBOR+6.75% (1% floor) | 8.08 | % | 4,610 | 4,578 | 4,610 | ||||||||||||||
| Portfolio Company | Investment Type | Cash Interest Rate (1)(2) | Industry | Principal | Cost | Fair Value (3) | Notes | ||||||||||||||||||||||
| Access CIG, LLC | First Lien Term Loan, LIBOR+3.75% cash due 2/27/2025 | 6.82 | % | Diversified Support Services | $ | 10,093 | $ | 10,028 | $ | 9,692 | |||||||||||||||||||
| ADB Companies, LLC | First Lien Term Loan, SOFR+6.25% cash due 12/18/2025 | 9.80 | % | Construction & Engineering | 8,518 | 8,389 | 8,371 | (4) | |||||||||||||||||||||
| Altice France S.A. | First Lien Term Loan, LIBOR+4.00% cash due 8/14/2026 | 6.91 | % | Integrated Telecommunication Services | 3,000 | 2,841 | 2,730 | ||||||||||||||||||||||
| Alvogen Pharma US, Inc. | First Lien Term Loan, SOFR+7.50% cash due 6/30/2025 | 11.20 | % | Pharmaceuticals | 9,267 | 9,166 | 9,221 | (4) | |||||||||||||||||||||
| American Tire Distributors, Inc. | First Lien Term Loan, LIBOR+6.25% cash due 10/20/2028 | 9.03 | % | Distributors | 4,873 | 4,812 | 4,576 | (4) | |||||||||||||||||||||
| Amplify Finco Pty Ltd. | First Lien Term Loan, LIBOR+4.25% cash due 11/26/2026 | 7.92 | % | Movies & Entertainment | 7,800 | 7,722 | 7,527 | (4) | |||||||||||||||||||||
| Anastasia Parent, LLC | First Lien Term Loan, LIBOR+3.75% cash due 8/11/2025 | 7.42 | % | Personal Products | 1,539 | 1,203 | 1,232 | (4) | |||||||||||||||||||||
| Apptio, Inc. | First Lien Term Loan, LIBOR+6.00% cash due 1/10/2025 | 8.46 | % | Application Software | 4,615 | 4,580 | 4,519 | (4) | |||||||||||||||||||||
| Apptio, Inc. | First Lien Revolver, LIBOR+6.00% cash due 1/10/2025 | 8.46 | % | Application Software | 154 | 151 | 146 | (4)(5) | |||||||||||||||||||||
| Total Apptio, Inc. | 4,769 | 4,731 | 4,665 | ||||||||||||||||||||||||||
| ASP-R-PAC Acquisition Co LLC | First Lien Term Loan, LIBOR+6.00% cash due 12/29/2027 | 9.67 | % | Paper Packaging | 4,176 | 4,103 | 4,080 | ||||||||||||||||||||||
| ASP-R-PAC Acquisition Co LLC | First Lien Revolver, LIBOR+6.00% cash due 12/29/2027 | Paper Packaging | — | (9) | (11) | (5) | |||||||||||||||||||||||
| Total ASP-R-PAC Acquisition Co LLC | 4,176 | 4,094 | 4,069 | ||||||||||||||||||||||||||
| Astra Acquisition Corp. | First Lien Term Loan, LIBOR+5.25% cash due 10/25/2028 | 8.37 | % | Application Software | 5,052 | 4,858 | 4,319 | (4) | |||||||||||||||||||||
| Asurion, LLC | First Lien Term Loan, SOFR+4.00% cash due 8/19/2028 | 7.70 | % | Property & Casualty Insurance | 5,000 | 4,753 | 4,276 | ||||||||||||||||||||||
| Asurion, LLC | Second Lien Term Loan, LIBOR+5.25% cash due 1/20/2029 | 8.37 | % | Property & Casualty Insurance | 4,346 | 3,981 | 3,347 | ||||||||||||||||||||||
| Total Asurion, LLC | 9,346 | 8,734 | 7,623 | ||||||||||||||||||||||||||
| Aurora Lux Finco S.À.R.L. | First Lien Term Loan, LIBOR+6.00% cash due 12/24/2026 | 8.78 | % | Airport Services | 6,338 | 6,242 | 6,027 | (4) | |||||||||||||||||||||
| BAART Programs, Inc. | First Lien Term Loan, LIBOR+5.00% cash due 6/11/2027 | 8.12 | % | Health Care Services | 6,371 | 6,311 | 6,148 | ||||||||||||||||||||||
| BAART Programs, Inc. | First Lien Delayed Draw Term Loan, LIBOR+5.00% cash due 6/11/2027 | 8.12 | % | Health Care Services | 1,771 | 1,751 | 1,664 | (4)(5) | |||||||||||||||||||||
| Total BAART Programs, Inc. | 8,142 | 8,062 | 7,812 | ||||||||||||||||||||||||||
| Blackhawk Network Holdings, Inc. | First Lien Term Loan, LIBOR+3.00% cash due 6/15/2025 | 6.03 | % | Data Processing & Outsourced Services | 9,575 | 9,566 | 8,977 | ||||||||||||||||||||||
| BYJU's Alpha, Inc. | First Lien Term Loan, LIBOR+6.00% cash due 11/24/2026 | 8.98 | % | Application Software | 7,444 | 7,347 | 5,455 | ||||||||||||||||||||||
| C5 Technology Holdings, LLC | 171 Common Units | Data Processing & Outsourced Services | — | — | (4) | ||||||||||||||||||||||||
| C5 Technology Holdings, LLC | 7,193,539.63 Preferred Units | Data Processing & Outsourced Services | 7,194 | 5,683 | (4) | ||||||||||||||||||||||||
| Total C5 Technology Holdings, LLC | 7,194 | 5,683 | |||||||||||||||||||||||||||
| Centerline Communications, LLC | First Lien Term Loan, SOFR+5.50% cash due 8/10/2027 | 9.12 | % | Wireless Telecommunication Services | 4,358 | 4,286 | 4,280 | ||||||||||||||||||||||
| Centerline Communications, LLC | First Lien Delayed Draw Term Loan, SOFR+5.50% cash due 8/10/2027 | 9.12 | % | Wireless Telecommunication Services | 449 | 432 | 413 | (5) | |||||||||||||||||||||
| Centerline Communications, LLC | First Lien Revolver, SOFR+5.50% cash due 8/10/2027 | Wireless Telecommunication Services | — | (10) | (11) | (5) | |||||||||||||||||||||||
| Total Centerline Communications, LLC | 4,807 | 4,708 | 4,682 | ||||||||||||||||||||||||||
| Portfolio Company | Industry | Investment Type | Maturity Date | Current Interest Rate(1)(4) | Cash Interest Rate | Principal | Cost | Fair Value (2) | |||||||||||||||
| Garretson Resolution Group, Inc. | Diversified support services | First Lien | 5/22/2021 | LIBOR+6.5% (1% floor) | 7.83 | % | 5,836 | 5,818 | 5,766 | ||||||||||||||
| InMotion Entertainment Group, LLC (3) | Consumer electronics | First Lien | 10/1/2018 | LIBOR+7.75% (1.25% floor) | 9.09 | % | 8,875 | 8,884 | 8,875 | ||||||||||||||
| First Lien B | 10/1/2018 | LIBOR+7.75% (1.25% floor) | 9.09 | % | 8,875 | 8,828 | 8,871 | ||||||||||||||||
| Total InMotion Entertainment Group, LLC | 17,750 | 17,712 | 17,746 | ||||||||||||||||||||
| Keypath Education, Inc. (3) | Advertising | First Lien | 4/3/2022 | LIBOR+7% (1.00% floor) | 8.33 | % | 2,040 | 2,040 | 2,039 | ||||||||||||||
| 927 shares Common Stock | 1,391 | 809 | |||||||||||||||||||||
| 2,040 | 3,431 | 2,848 | |||||||||||||||||||||
| Lift Brands, Inc. (3) | Leisure facilities | First Lien | 12/23/2019 | LIBOR+7.5% (1% floor) | 8.83 | % | 18,276 | 18,257 | 18,275 | ||||||||||||||
| Metamorph US 3, LLC (3)(5) | Internet software & services | First Lien | 12/1/2020 | LIBOR+5.5% (1% floor) 2% PIK | 6.74 | % | 9,969 | 9,481 | 3,786 | ||||||||||||||
| Motion Recruitment Partners LLC | Human resources & employment services | First Lien | 2/13/2020 | LIBOR+6% (1% floor) | 7.24 | % | 4,330 | 4,281 | 4,330 | ||||||||||||||
| NAVEX Global, Inc. | Internet software & services | First Lien | 11/19/2021 | LIBOR+4.75% (1% floor) | 5.49 | % | 5,959 | 5,925 | 5,982 | ||||||||||||||
| New IPT, Inc. (3) | Oil & gas equipment & services | First Lien | 3/17/2021 | LIBOR+5% (1% floor) | 6.33 | % | 1,794 | 1,794 | 1,794 | ||||||||||||||
| Second Lien | 9/17/2021 | LIBOR+5.1% (1% floor) | 6.43 | % | 1,094 | 1,094 | 1,094 | ||||||||||||||||
| 21.876 Class A Common Units | — | 321 | |||||||||||||||||||||
| Total New IPT, Inc. | 2,888 | 2,888 | 3,209 | ||||||||||||||||||||
| Novetta Solutions, LLC | Internet software & services | First Lien | 9/30/2022 | LIBOR+5% (1% floor) | 6.34 | % | 6,118 | 6,066 | 5,950 | ||||||||||||||
| OmniSYS Acquisition Corporation (3) | Diversified support services | First Lien | 11/21/2018 | LIBOR+7.5% (1% floor) | 8.83 | % | 10,896 | 10,900 | 10,833 | ||||||||||||||
| Refac Optical Group (3) | Specialty stores | First Lien A | 9/30/2018 | LIBOR+8% | 9.23 | % | 4,623 | 4,605 | 4,623 | ||||||||||||||
| Salient CRGT, Inc. (3) | IT consulting & other services | First Lien | 2/28/2022 | LIBOR+5.75% (1% floor) | 6.99 | % | 2,457 | 2,412 | 2,440 | ||||||||||||||
| Scientific Games International, Inc. (3) | Casinos & gaming | First Lien | 8/14/2024 | LIBOR+3.25% (1% floor) | 4.58 | % | 6,632 | 6,598 | 6,651 | ||||||||||||||
| SHO Holding I Corporation | Footwear | First Lien | 10/27/2022 | LIBOR+5% (1% floor) | 6.24 | % | 8,594 | 8,566 | 8,487 | ||||||||||||||
| TravelClick, Inc. (3) | Internet software & services | Second Lien | 11/6/2021 | LIBOR+7.75% (1% floor) | 8.99 | % | 5,127 | 5,127 | 5,153 | ||||||||||||||
| TV Borrower US, LLC | Integrated telecommunications services | First Lien | 2/22/2024 | LIBOR+4.75% (1% floor) | 6.08 | % | 3,582 | 3,565 | 3,607 | ||||||||||||||
| Valet Merger Sub, Inc. (3) | Environmental & facilities services | First Lien | 9/24/2021 | LIBOR+7% (1% floor) | 8.24 | % | 12,998 | 12,862 | 12,998 | ||||||||||||||
| Vubiquity, Inc. | Application software | First Lien | 8/12/2021 | LIBOR+5.5% (1% floor) | 6.83 | % | 2,653 | 2,636 | 2,633 | ||||||||||||||
| $ | 245,063 | $ | 251,648 | $ | 235,526 | ||||||||||||||||||
| Portfolio Company | Investment Type | Cash Interest Rate (1)(2) | Industry | Principal | Cost | Fair Value (3) | Notes | ||||||||||||||||||||||
| CITGO Petroleum Corp. | First Lien Term Loan, LIBOR+6.25% cash due 3/28/2024 | 9.37 | % | Oil & Gas Refining & Marketing | $ | 7,038 | $ | 6,967 | $ | 7,057 | (4) | ||||||||||||||||||
| City Football Group Limited | First Lien Term Loan, LIBOR+3.50% cash due 7/21/2028 | 6.48 | % | Movies & Entertainment | 6,451 | 6,419 | 6,166 | ||||||||||||||||||||||
| Convergeone Holdings, Inc. | First Lien Term Loan, LIBOR+5.00% cash due 1/4/2026 | 8.12 | % | IT Consulting & Other Services | 7,373 | 7,206 | 5,320 | (4) | |||||||||||||||||||||
| Covetrus, Inc. | First Lien Term Loan, SOFR+5.00% cash due 9/20/2029 | 7.65 | % | Health Care Distributors | 5,375 | 5,053 | 5,035 | (4) | |||||||||||||||||||||
| Curium Bidco S.à.r.l. | First Lien Term Loan, LIBOR+4.00% cash due 7/9/2026 | 7.67 | % | Biotechnology | 5,820 | 5,776 | 5,587 | ||||||||||||||||||||||
| Dealer Tire, LLC | First Lien Term Loan, LIBOR+4.25% cash due 12/12/2025 | 7.37 | % | Distributors | 2,992 | 2,935 | 2,924 | ||||||||||||||||||||||
| Delivery Hero FinCo LLC | First Lien Term Loan, SOFR+5.75% cash due 8/12/2027 | 8.49 | % | Internet & Direct Marketing Retail | 6,035 | 5,876 | 5,756 | (4) | |||||||||||||||||||||
| DirecTV Financing, LLC | First Lien Term Loan, LIBOR+5.00% cash due 8/2/2027 | 8.12 | % | Cable & Satellite | 6,436 | 6,332 | 6,012 | (4) | |||||||||||||||||||||
| Domtar Corporation | First Lien Term Loan, LIBOR+5.50% cash due 11/30/2028 | 8.26 | % | Paper Products | 4,100 | 4,065 | 3,921 | ||||||||||||||||||||||
| DTI Holdco, Inc. | First Lien Term Loan, SOFR+4.75% cash due 4/26/2029 | 7.33 | % | Research & Consulting Services | 8,000 | 7,849 | 7,616 | (4) | |||||||||||||||||||||
| Eagle Parent Corp. | First Lien Term Loan, SOFR+4.25% cash due 4/1/2029 | 7.80 | % | Industrial Machinery | 4,478 | 4,373 | 4,367 | ||||||||||||||||||||||
| eResearch Technology, Inc. | First Lien Term Loan, LIBOR+4.50% cash due 2/4/2027 | 7.62 | % | Application Software | 7,331 | 7,258 | 6,859 | ||||||||||||||||||||||
| Gibson Brands, Inc. | First Lien Term Loan, LIBOR+5.00% cash due 8/11/2028 | 7.94 | % | Leisure Products | 7,444 | 7,369 | 6,029 | ||||||||||||||||||||||
| Global Medical Response, Inc. | First Lien Term Loan, LIBOR+4.25% cash due 3/14/2025 | 7.37 | % | Health Care Services | 1,979 | 1,979 | 1,722 | (4) | |||||||||||||||||||||
| Global Medical Response, Inc. | First Lien Term Loan, LIBOR+4.25% cash due 10/2/2025 | 6.81 | % | Health Care Services | 2,192 | 2,165 | 1,912 | ||||||||||||||||||||||
| Total Global Medical Response, Inc. | 4,171 | 4,144 | 3,634 | ||||||||||||||||||||||||||
| Harbor Purchaser Inc. | First Lien Term Loan, SOFR+5.25% cash due 4/9/2029 | 8.38 | % | Education Services | 8,000 | 7,774 | 7,310 | (4) | |||||||||||||||||||||
| Indivior Finance S.À.R.L. | First Lien Term Loan, SOFR+5.25% cash due 6/30/2026 | 8.80 | % | Pharmaceuticals | 7,406 | 7,293 | 7,286 | ||||||||||||||||||||||
| INW Manufacturing, LLC | First Lien Term Loan, LIBOR+5.75% cash due 3/25/2027 | 9.42 | % | Personal Products | 9,500 | 9,282 | 8,408 | (4) | |||||||||||||||||||||
| Iris Holding, Inc. | First Lien Term Loan, SOFR+4.75% cash due 6/28/2028 | 7.89 | % | Metal & Glass Containers | 5,000 | 4,624 | 4,610 | ||||||||||||||||||||||
| LaserAway Intermediate Holdings II, LLC | First Lien Term Loan, LIBOR+5.75% cash due 10/14/2027 | 8.23 | % | Health Care Services | 7,444 | 7,318 | 7,323 | ||||||||||||||||||||||
| Lightbox Intermediate, L.P. | First Lien Term Loan, LIBOR+5.00% cash due 5/9/2026 | 8.67 | % | Real Estate Services | 7,367 | 7,315 | 7,109 | (4) | |||||||||||||||||||||
| LogMeIn, Inc. | First Lien Term Loan, LIBOR+4.75% cash due 8/31/2027 | 7.80 | % | Application Software | 7,860 | 7,751 | 5,494 | ||||||||||||||||||||||
| LTI Holdings, Inc. | First Lien Term Loan, LIBOR+3.25% cash due 9/6/2025 | 6.37 | % | Electronic Components | 7,366 | 7,282 | 6,835 | ||||||||||||||||||||||
| Mindbody, Inc. | First Lien Term Loan, LIBOR+7.00% cash 1.50% PIK due 2/14/2025 | 10.64 | % | Internet Services & Infrastructure | 4,687 | 4,651 | 4,570 | (4) | |||||||||||||||||||||
| Mindbody, Inc. | First Lien Revolver, LIBOR+8.00% cash due 2/14/2025 | Internet Services & Infrastructure | — | (4) | (12) | (4)(5) | |||||||||||||||||||||||
| Total Mindbody, Inc. | 4,687 | 4,647 | 4,558 | ||||||||||||||||||||||||||
| MRI Software LLC | First Lien Term Loan, LIBOR+5.50% cash due 2/10/2026 | 9.17 | % | Application Software | 6,139 | 6,104 | 5,966 | (4) | |||||||||||||||||||||
| MRI Software LLC | First Lien Revolver, LIBOR+5.50% cash due 2/10/2026 | Application Software | — | (3) | (10) | (4)(5) | |||||||||||||||||||||||
| Total MRI Software LLC | 6,139 | 6,101 | 5,956 | ||||||||||||||||||||||||||
| Northern Star Industries Inc. | First Lien Term Loan, LIBOR+4.75% cash due 3/31/2025 | 7.87 | % | Electrical Components & Equipment | 6,685 | 6,673 | 6,484 | ||||||||||||||||||||||
| OEConnection LLC | First Lien Term Loan, LIBOR+4.00% cash due 9/25/2026 | 7.12 | % | Application Software | 7,777 | 7,741 | 7,505 | (4) | |||||||||||||||||||||
| Park Place Technologies, LLC | First Lien Term Loan, SOFR+5.00% cash due 11/10/2027 | 8.13 | % | Internet Services & Infrastructure | 4,925 | 4,781 | 4,687 | (4) | |||||||||||||||||||||
| Peloton Interactive, Inc. | First Lien Term Loan, SOFR+6.50% cash due 5/25/2027 | 8.35 | % | Leisure Products | 5,486 | 5,251 | 5,371 | ||||||||||||||||||||||
| Portfolio Company | Investment Type | Cash Interest Rate (1)(2) | Industry | Principal | Cost | Fair Value (3) | Notes | ||||||||||||||||||||||
| Planview Parent, Inc. | Second Lien Term Loan, LIBOR+7.25% cash due 12/18/2028 | 10.92 | % | Application Software | $ | 4,503 | $ | 4,435 | $ | 4,323 | (4) | ||||||||||||||||||
| Pluralsight, LLC | First Lien Term Loan, LIBOR+8.00% cash due 4/6/2027 | 10.68 | % | Application Software | 6,796 | 6,694 | 6,582 | (4) | |||||||||||||||||||||
| Pluralsight, LLC | First Lien Revolver, LIBOR+8.00% cash due 4/6/2027 | Application Software | — | (6) | (13) | (4)(5) | |||||||||||||||||||||||
| Total Pluralsight, LLC | 6,796 | 6,688 | 6,569 | ||||||||||||||||||||||||||
| RevSpring, Inc. | First Lien Term Loan, LIBOR+4.00% cash due 10/11/2025 | 7.67 | % | Commercial Printing | 9,625 | 9,607 | 9,304 | ||||||||||||||||||||||
| Sabert Corporation | First Lien Term Loan, LIBOR+4.50% cash due 12/10/2026 | 7.63 | % | Metal & Glass Containers | 2,536 | 2,511 | 2,435 | (4) | |||||||||||||||||||||
| SHO Holding I Corporation | First Lien Term Loan, LIBOR+5.25% cash due 4/27/2024 | 8.06 | % | Footwear | 8,201 | 8,194 | 7,176 | ||||||||||||||||||||||
| SHO Holding I Corporation | First Lien Term Loan, LIBOR+5.23% cash due 4/27/2024 | 8.04 | % | Footwear | 138 | 138 | 121 | ||||||||||||||||||||||
| Total SHO Holding I Corporation | 8,339 | 8,332 | 7,297 | ||||||||||||||||||||||||||
| Sorenson Communications, LLC | First Lien Term Loan, LIBOR+5.50% cash due 3/17/2026 | 9.17 | % | Communications Equipment | 2,553 | 2,528 | 2,454 | ||||||||||||||||||||||
| Spanx, LLC | First Lien Term Loan, LIBOR+5.25% cash due 11/20/2028 | 8.30 | % | Apparel Retail | 8,933 | 8,776 | 8,721 | (4) | |||||||||||||||||||||
| SPX Flow, Inc. | First Lien Term Loan, SOFR+4.50% cash due 4/5/2029 | 7.63 | % | Industrial Machinery | 7,500 | 7,184 | 6,966 | (4) | |||||||||||||||||||||
| Supermoose Borrower, LLC | First Lien Term Loan, LIBOR+3.75% cash due 8/29/2025 | 7.42 | % | Application Software | 7,743 | 7,479 | 6,827 | (4) | |||||||||||||||||||||
| Surgery Center Holdings, Inc. | First Lien Term Loan, LIBOR+3.75% cash due 8/31/2026 | 6.51 | % | Health Care Facilities | 3,377 | 3,365 | 3,213 | ||||||||||||||||||||||
| TIBCO Software Inc. | First Lien Term Loan, SOFR+4.50% cash due 3/20/2029 | 8.15 | % | Application Software | 6,256 | 5,693 | 5,629 | (4) | |||||||||||||||||||||
| Touchstone Acquisition, Inc. | First Lien Term Loan, LIBOR+6.00% cash due 12/29/2028 | 9.12 | % | Health Care Supplies | 7,285 | 7,155 | 7,140 | (4) | |||||||||||||||||||||
| Veritas US Inc. | First Lien Term Loan, LIBOR+5.00% cash due 9/1/2025 | 8.67 | % | Application Software | 6,365 | 6,290 | 5,087 | ||||||||||||||||||||||
| Windstream Services II, LLC | First Lien Term Loan, LIBOR+6.25% cash due 9/21/2027 | 9.37 | % | Integrated Telecommunication Services | 7,818 | 7,596 | 7,115 | (4) | |||||||||||||||||||||
| WP CPP Holdings, LLC | Second Lien Term Loan, LIBOR+7.75% cash due 4/30/2026 | 10.56 | % | Aerospace & Defense | 6,000 | 5,972 | 5,070 | (4) | |||||||||||||||||||||
| WP CPP Holdings, LLC | First Lien Term Loan, LIBOR+3.75% cash due 4/30/2025 | 6.56 | % | Aerospace & Defense | 1,985 | 1,910 | 1,783 | (4) | |||||||||||||||||||||
| Total WP CPP Holdings, LLC | 7,985 | 7,882 | 6,853 | ||||||||||||||||||||||||||
| Zayo Group Holdings, Inc. | First Lien Term Loan, LIBOR+3.00% cash due 3/9/2027 | 6.12 | % | Alternative Carriers | 2,155 | 2,000 | 1,812 | ||||||||||||||||||||||
| Total Portfolio Investments | $ | 383,194 | $ | 382,673 | $ | 359,625 | |||||||||||||||||||||||
| Portfolio Company | Investment Type | Cash Interest Rate (1)(2) | Industry | Principal | Cost | Fair Value (3) | Notes | ||||||||||||||||||||||
| Access CIG, LLC | First Lien Term Loan, LIBOR+3.75% cash due 2/27/2025 | 3.83 | % | Diversified Support Services | $ | 9,111 | $ | 9,084 | $ | 9,078 | (4) | ||||||||||||||||||
| ADB Companies, LLC | First Lien Term Loan, LIBOR+6.25% cash due 12/18/2025 | 7.25 | % | Construction & Engineering | 7,732 | 7,566 | 7,644 | (4) | |||||||||||||||||||||
| Altice France S.A. | First Lien Term Loan, LIBOR+4.00% cash due 8/14/2026 | 4.12 | % | Integrated Telecommunication Services | 2,596 | 2,468 | 2,591 | ||||||||||||||||||||||
| Alvogen Pharma US, Inc. | First Lien Term Loan, LIBOR+5.25% cash due 12/31/2023 | 6.25 | % | Pharmaceuticals | 9,755 | 9,580 | 9,443 | (4) | |||||||||||||||||||||
| Amplify Finco Pty Ltd. | First Lien Term Loan, LIBOR+4.25% cash due 11/26/2026 | 5.00 | % | Movies & Entertainment | 7,880 | 7,801 | 7,680 | (4) | |||||||||||||||||||||
| Anastasia Parent, LLC | First Lien Term Loan, LIBOR+3.75% cash due 8/11/2025 | 3.88 | % | Personal Products | 2,799 | 2,211 | 2,378 | ||||||||||||||||||||||
| Apptio, Inc. | First Lien Term Loan, LIBOR+7.25% cash due 1/10/2025 | 8.25 | % | Application Software | 4,615 | 4,565 | 4,544 | (4) | |||||||||||||||||||||
| Apptio, Inc. | First Lien Revolver, LIBOR+7.25% cash due 1/10/2025 | 8.25 | % | Application Software | 154 | 150 | 148 | (4)(5) | |||||||||||||||||||||
| Total Apptio, Inc. | 4,769 | 4,715 | 4,692 | ||||||||||||||||||||||||||
| Asurion, LLC | Second Lien Term Loan, LIBOR+5.25% cash due 1/20/2029 | 5.33 | % | Property & Casualty Insurance | 6,000 | 5,940 | 5,980 | ||||||||||||||||||||||
| Aurora Lux Finco S.À.R.L. | First Lien Term Loan, LIBOR+6.00% cash due 12/24/2026 | 7.00 | % | Airport Services | 6,403 | 6,283 | 6,025 | (4) | |||||||||||||||||||||
| BAART Programs, Inc. | First Lien Term Loan, LIBOR+5.00% cash due 6/11/2027 | 6.00 | % | Health Care Services | 5,985 | 5,925 | 5,970 | ||||||||||||||||||||||
| BAART Programs, Inc. | First Lien Delayed Draw Term Loan, LIBOR+5.00% cash due 6/11/2027 | 6.00 | % | Health Care Services | 450 | 436 | 446 | (5) | |||||||||||||||||||||
| Total BAART Programs, Inc. | 6,435 | 6,361 | 6,416 | ||||||||||||||||||||||||||
| Blackhawk Network Holdings, Inc. | First Lien Term Loan, LIBOR+3.00% cash due 6/15/2025 | 3.08 | % | Data Processing & Outsourced Services | 9,675 | 9,662 | 9,615 | ||||||||||||||||||||||
| Boxer Parent Company Inc. | First Lien Term Loan, LIBOR+3.75% cash due 10/2/2025 | 3.88 | % | Systems Software | 6,643 | 6,570 | 6,615 | ||||||||||||||||||||||
| Brazos Delaware II, LLC | First Lien Term Loan, LIBOR+4.00% cash due 5/21/2025 | 4.08 | % | Oil & Gas Equipment & Services | 7,253 | 7,234 | 7,158 | ||||||||||||||||||||||
| C5 Technology Holdings, LLC | 171 Common Units | Data Processing & Outsourced Services | — | — | (4) | ||||||||||||||||||||||||
| C5 Technology Holdings, LLC | 7,193,539.63 Preferred Units | Data Processing & Outsourced Services | 7,194 | 5,683 | (4) | ||||||||||||||||||||||||
| Total C5 Technology Holdings, LLC | 7,194 | 5,683 | |||||||||||||||||||||||||||
| Centerline Communications, LLC | First Lien Term Loan, LIBOR+5.50% cash due 8/10/2027 | 6.50 | % | Wireless Telecommunication Services | 2,000 | 1,961 | 1,960 | ||||||||||||||||||||||
| Centerline Communications, LLC | First Lien Delayed Draw Term Loan, LIBOR+5.50% cash due 8/10/2023 | 6.50 | % | Wireless Telecommunication Services | 1,920 | 1,890 | 1,889 | (5) | |||||||||||||||||||||
| Centerline Communications, LLC | First Lien Revolver, LIBOR+5.50% cash due 8/10/2027 | Wireless Telecommunication Services | — | (12) | (12) | (5) | |||||||||||||||||||||||
| Total Centerline Communications, LLC | 3,920 | 3,839 | 3,837 | ||||||||||||||||||||||||||
| CITGO Petroleum Corp. | First Lien Term Loan, LIBOR+6.25% cash due 3/28/2024 | 7.25 | % | Oil & Gas Refining & Marketing | 7,111 | 7,040 | 7,134 | (4) | |||||||||||||||||||||
| City Football Group Limited | First Lien Term Loan, LIBOR+3.50% cash due 7/21/2028 | 4.00 | % | Movies & Entertainment | 6,500 | 6,468 | 6,492 | ||||||||||||||||||||||
| Connect U.S. Finco LLC | First Lien Term Loan, LIBOR+3.50% cash due 12/11/2026 | 4.50 | % | Alternative Carriers | 7,362 | 7,204 | 7,376 | ||||||||||||||||||||||
| Convergeone Holdings, Inc. | First Lien Term Loan, LIBOR+5.00% cash due 1/4/2026 | 5.08 | % | IT Consulting & Other Services | 7,449 | 7,229 | 7,427 | (4) | |||||||||||||||||||||
| Curium Bidco S.à.r.l. | First Lien Term Loan, LIBOR+4.00% cash due 7/9/2026 | 4.13 | % | Biotechnology | 5,880 | 5,836 | 5,884 | ||||||||||||||||||||||
| Dcert Buyer, Inc. | First Lien Term Loan, LIBOR+4.00% cash due 10/16/2026 | 4.08 | % | Internet Services & Infrastructure | 5,885 | 5,870 | 5,893 | ||||||||||||||||||||||
| DirecTV Financing, LLC | First Lien Term Loan, LIBOR+5.00% cash due 8/2/2027 | 5.75 | % | Cable & Satellite | 6,000 | 5,940 | 6,011 | (4) | |||||||||||||||||||||
| Enviva Holdings, LP | First Lien Term Loan, LIBOR+5.50% cash due 2/17/2026 | 6.50 | % | Forest Products | 5,878 | 5,819 | 5,893 | ||||||||||||||||||||||
| Portfolio Company | Investment Type | Cash Interest Rate (1)(2) | Industry | Principal | Cost | Fair Value (3) | Notes | ||||||||||||||||||||||
| eResearch Technology, Inc. | First Lien Term Loan, LIBOR+4.50% cash due 2/4/2027 | 5.50 | % | Application Software | $ | 7,406 | $ | 7,332 | $ | 7,451 | |||||||||||||||||||
| GI Chill Acquisition LLC | First Lien Term Loan, LIBOR+3.75% cash due 8/6/2025 | 3.90 | % | Managed Health Care | 3,721 | 3,737 | 3,712 | (4) | |||||||||||||||||||||
| GI Chill Acquisition LLC | Second Lien Term Loan, LIBOR+7.50% cash due 8/6/2026 | 7.63 | % | Managed Health Care | 3,750 | 3,674 | 3,731 | (4) | |||||||||||||||||||||
| Total GI Chill Acquisition LLC | 7,471 | 7,411 | 7,443 | ||||||||||||||||||||||||||
| Gibson Brands, Inc. | First Lien Term Loan, LIBOR+5.00% cash due 8/11/2028 | 5.75 | % | Leisure Products | 7,500 | 7,425 | 7,463 | ||||||||||||||||||||||
| Global Medical Response, Inc. | First Lien Term Loan, LIBOR+4.75% cash due 10/2/2025 | 5.75 | % | Health Care Services | 2,214 | 2,178 | 2,226 | ||||||||||||||||||||||
| Global Medical Response, Inc. | First Lien Term Loan, LIBOR+4.25% cash due 3/14/2025 | 5.25 | % | Health Care Services | 1,995 | 1,995 | 2,004 | (4) | |||||||||||||||||||||
| Total Global Medical Response, Inc. | 4,209 | 4,173 | 4,230 | ||||||||||||||||||||||||||
| Grab Holdings Inc. | First Lien Term Loan, LIBOR+4.50% cash due 1/29/2026 | 5.50 | % | Interactive Media & Services | 2,985 | 2,907 | 3,025 | ||||||||||||||||||||||
| Indivior Finance S.À.R.L. | First Lien Term Loan, LIBOR+5.25% cash due 6/30/2026 | 6.00 | % | Pharmaceuticals | 7,481 | 7,336 | 7,456 | ||||||||||||||||||||||
| Intelsat Jackson Holdings S.A. | First Lien Term Loan, PRIME+4.75% cash due 11/27/2023 | 8.00 | % | Alternative Carriers | 3,568 | 3,550 | 3,622 | ||||||||||||||||||||||
| Intelsat Jackson Holdings S.A. | First Lien Term Loan, LIBOR+4.75% cash due 7/13/2022 | 5.75 | % | Alternative Carriers | 5,000 | 4,935 | 5,044 | ||||||||||||||||||||||
| Intelsat Jackson Holdings S.A. | First Lien Delayed Draw Term Loan, LIBOR+4.75% cash due 7/13/2022 | Alternative Carriers | — | (13) | 9 | (5) | |||||||||||||||||||||||
| Total Intelsat Jackson Holdings S.A. | 8,568 | 8,472 | 8,675 | ||||||||||||||||||||||||||
| INW Manufacturing, LLC | First Lien Term Loan, LIBOR+5.75% cash due 5/7/2027 | 6.50 | % | Personal Products | 9,875 | 9,597 | 9,678 | (4) | |||||||||||||||||||||
| Lightbox Intermediate, L.P. | First Lien Term Loan, LIBOR+5.00% cash due 5/9/2026 | 5.13 | % | Real Estate Services | 7,443 | 7,377 | 7,405 | (4) | |||||||||||||||||||||
| LogMeIn, Inc. | First Lien Term Loan, LIBOR+4.75% cash due 8/31/2027 | 4.83 | % | Application Software | 7,940 | 7,812 | 7,946 | (4) | |||||||||||||||||||||
| LTI Holdings, Inc. | First Lien Term Loan, LIBOR+3.50% cash due 9/6/2025 | 3.58 | % | Electronic Components | 7,442 | 7,329 | 7,354 | ||||||||||||||||||||||
| Maravai Intermediate Holdings, LLC | First Lien Term Loan, LIBOR+3.75% cash due 10/19/2027 | 4.75 | % | Biotechnology | 6,819 | 6,751 | 6,846 | ||||||||||||||||||||||
| Mindbody, Inc. | First Lien Term Loan, LIBOR+7.00% cash 1.50% PIK due 2/14/2025 | 8.00 | % | Internet Services & Infrastructure | 4,616 | 4,565 | 4,528 | (4) | |||||||||||||||||||||
| Mindbody, Inc. | First Lien Revolver, LIBOR+8.00% cash due 2/14/2025 | Internet Services & Infrastructure | — | (6) | (9) | (4)(5) | |||||||||||||||||||||||
| Total Mindbody, Inc. | 4,616 | 4,559 | 4,519 | ||||||||||||||||||||||||||
| MRI Software LLC | First Lien Term Loan, LIBOR+5.50% cash due 2/10/2026 | 6.50 | % | Application Software | 3,877 | 3,843 | 3,875 | (4) | |||||||||||||||||||||
| MRI Software LLC | First Lien Delayed Draw Term Loan, LIBOR+5.50% cash due 2/10/2026 | Application Software | — | (6) | (1) | (4)(5) | |||||||||||||||||||||||
| MRI Software LLC | First Lien Revolver, LIBOR+5.50% cash due 2/10/2026 | Application Software | — | (3) | — | (4)(5) | |||||||||||||||||||||||
| Total MRI Software LLC | 3,877 | 3,834 | 3,874 | ||||||||||||||||||||||||||
| Northern Star Industries Inc. | First Lien Term Loan, LIBOR+4.50% cash due 3/31/2025 | 5.50 | % | Electrical Components & Equipment | 6,755 | 6,738 | 6,738 | ||||||||||||||||||||||
| OEConnection LLC | First Lien Term Loan, LIBOR+4.00% cash due 9/25/2026 | 4.08 | % | Application Software | 7,852 | 7,816 | 7,842 | (4) | |||||||||||||||||||||
| Olaplex, Inc. | First Lien Term Loan, LIBOR+6.25% cash due 1/8/2026 | 7.25 | % | Personal Products | 6,273 | 6,189 | 6,226 | (4) | |||||||||||||||||||||
| Olaplex, Inc. | First Lien Revolver, LIBOR+6.25% cash due 1/8/2025 | Personal Products | — | (7) | (8) | (4)(5) | |||||||||||||||||||||||
| Total Olaplex, Inc. | 6,273 | 6,182 | 6,218 | ||||||||||||||||||||||||||
| Park Place Technologies, LLC | First Lien Term Loan, LIBOR+5.00% cash due 11/10/2027 | 6.00 | % | Internet Services & Infrastructure | 4,975 | 4,801 | 4,981 | (4) | |||||||||||||||||||||
| Planview Parent, Inc. | Second Lien Term Loan, LIBOR+7.25% cash due 12/18/2028 | 8.00 | % | Application Software | 4,503 | 4,435 | 4,514 | (4) | |||||||||||||||||||||
| Portfolio Company | Investment Type | Cash Interest Rate (1)(2) | Industry | Principal | Cost | Fair Value (3) | Notes | ||||||||||||||||||||||
| Pluralsight, LLC | First Lien Term Loan, LIBOR+8.00% cash due 4/6/2027 | 9.00 | % | Application Software | $ | 6,796 | $ | 6,669 | $ | 6,667 | (4) | ||||||||||||||||||
| Pluralsight, LLC | First Lien Revolver, LIBOR+8.00% cash due 4/6/2027 | Application Software | — | (8) | (8) | (4)(5) | |||||||||||||||||||||||
| Total Pluralsight, LLC | 6,796 | 6,661 | 6,659 | ||||||||||||||||||||||||||
| Sabert Corporation | First Lien Term Loan, LIBOR+4.50% cash due 12/10/2026 | 5.50 | % | Metal & Glass Containers | 2,728 | 2,700 | 2,738 | (4) | |||||||||||||||||||||
| SHO Holding I Corporation | First Lien Term Loan, LIBOR+5.25% cash due 4/27/2024 | 6.25 | % | Footwear | 8,288 | 8,277 | 7,874 | ||||||||||||||||||||||
| SHO Holding I Corporation | First Lien Term Loan, LIBOR+5.23% cash due 4/27/2024 | 6.23 | % | Footwear | 138 | 138 | 131 | ||||||||||||||||||||||
| Total SHO Holding I Corporation | 8,426 | 8,415 | 8,005 | ||||||||||||||||||||||||||
| Sirva Worldwide, Inc. | First Lien Term Loan, LIBOR+5.50% cash due 8/4/2025 | 5.58 | % | Diversified Support Services | 1,087 | 1,071 | 1,027 | (4) | |||||||||||||||||||||
| Sorenson Communications, LLC | First Lien Term Loan, LIBOR+5.50% cash due 3/17/2026 | 6.25 | % | Communications Equipment | 2,854 | 2,825 | 2,877 | ||||||||||||||||||||||
| Star US Bidco LLC | First Lien Term Loan, LIBOR+4.25% cash due 3/17/2027 | 5.25 | % | Industrial Machinery | 8,255 | 8,075 | 8,289 | (4) | |||||||||||||||||||||
| Supermoose Borrower, LLC | First Lien Term Loan, LIBOR+3.75% cash due 8/29/2025 | 3.88 | % | Application Software | 7,823 | 7,465 | 7,294 | (4) | |||||||||||||||||||||
| Surgery Center Holdings, Inc. | First Lien Term Loan, LIBOR+3.75% cash due 8/31/2026 | 4.50 | % | Health Care Facilities | 4,911 | 4,895 | 4,925 | ||||||||||||||||||||||
| Trench Plate Rental, Co. | First Lien Term Loan, LIBOR+4.75% cash due 12/3/2026 | 5.75 | % | Construction Materials | 3,942 | 3,882 | 3,881 | ||||||||||||||||||||||
| Trench Plate Rental, Co. | First Lien Delayed Draw Term Loan, LIBOR+4.75% cash due 12/3/2026 | Construction Materials | — | (11) | (12) | (5) | |||||||||||||||||||||||
| Trench Plate Rental, Co. | First Lien Revolver, LIBOR+4.75% cash due 12/3/2026 | 5.75 | % | Construction Materials | 24 | 15 | 15 | (5) | |||||||||||||||||||||
| Total Trench Plate Rental, Co. | 3,966 | 3,886 | 3,884 | ||||||||||||||||||||||||||
| Veritas US Inc. | First Lien Term Loan, LIBOR+5.00% cash due 9/1/2025 | 6.00 | % | Application Software | 6,435 | 6,333 | 6,473 | (4) | |||||||||||||||||||||
| Verscend Holding Corp. | First Lien Term Loan, LIBOR+4.00% cash due 8/27/2025 | 4.08 | % | Health Care Technology | 4,080 | 4,052 | 4,091 | ||||||||||||||||||||||
| Waystar Technologies, Inc. | First Lien Term Loan, LIBOR+4.00% cash due 10/22/2026 | 4.08 | % | Health Care Technology | 5,910 | 5,880 | 5,921 | ||||||||||||||||||||||
| Windstream Services II, LLC | First Lien Term Loan, LIBOR+6.25% cash due 9/21/2027 | 7.25 | % | Integrated Telecommunication Services | 7,899 | 7,629 | 7,948 | (4) | |||||||||||||||||||||
| WP CPP Holdings, LLC | Second Lien Term Loan, LIBOR+7.75% cash due 4/30/2026 | 8.75 | % | Aerospace & Defense | 6,000 | 5,964 | 5,931 | (4) | |||||||||||||||||||||
| Total Portfolio Investments | $ | 344,196 | $ | 346,052 | $ | 346,665 | |||||||||||||||||||||||
| September 30, 2022 | September 30, 2021 | |||||||||||||
| Selected Balance Sheet Information: | ||||||||||||||
| Investments at fair value (cost September 30, 2022: $382,673; cost September 30, 2021: $346,052) | $ | 359,625 | $ | 346,665 | ||||||||||
| Cash and cash equivalents | 14,274 | 23,446 | ||||||||||||
| Restricted cash | 5,642 | 4,517 | ||||||||||||
| Other assets | 5,686 | 4,529 | ||||||||||||
| Total assets | $ | 385,227 | $ | 379,157 | ||||||||||
| Senior credit facility payable | $ | 230,000 | $ | 215,620 | ||||||||||
| SLF JV I Notes payable at fair value (proceeds September 30, 2022: $110,000; proceeds September 30, 2021: $110,000) | 110,000 | 110,000 | ||||||||||||
| Other liabilities | 21,539 | 10,507 | ||||||||||||
| Total liabilities | $ | 361,539 | $ | 336,127 | ||||||||||
| Members' equity | 23,688 | 43,030 | ||||||||||||
| Total liabilities and members' equity | $ | 385,227 | $ | 379,157 | ||||||||||
| Year ended September 30, 2022 | Year ended September 30, 2021 | Year ended September 30, 2020 | ||||||||||||||||||
| Selected Statements of Operations Information: | ||||||||||||||||||||
| Interest income | $ | 24,014 | $ | 20,018 | $ | 19,808 | ||||||||||||||
| Other income | 198 | 565 | 338 | |||||||||||||||||
| Total investment income | 24,212 | 20,583 | 20,146 | |||||||||||||||||
| Senior credit facility interest expense | 7,713 | 5,706 | 7,432 | |||||||||||||||||
| SLF JV I Notes interest expense | 9,146 | 8,444 | 9,205 | |||||||||||||||||
| Other expenses | 253 | 260 | 244 | |||||||||||||||||
| Total expenses (1) | 17,112 | 14,410 | 16,881 | |||||||||||||||||
| Net investment income | 7,100 | 6,173 | 3,265 | |||||||||||||||||
| Net unrealized appreciation (depreciation) | (23,661) | 13,270 | (9,704) | |||||||||||||||||
| Net realized gains (losses) | 534 | 399 | (3,691) | |||||||||||||||||
| Net income (loss) | $ | (16,027) | $ | 19,842 | $ | (10,130) | ||||||||||||||
| Portfolio Company | Industry | Investment Type | Maturity Date | Current Interest Rate (1)(4) | Cash Interest Rate | Principal | Cost | Fair Value (2) | |||||||||||||||
| AccentCare, Inc. | Healthcare services | First Lien | 9/3/2021 | LIBOR+5.75% (1% floor) | 6.75 | % | $ | 4,906 | $ | 4,837 | $ | 4,830 | |||||||||||
| AdVenture Interactive, Corp. (3) (5) | Advertising | First Lien | 3/22/2018 | LIBOR+7.75% (1% floor) | 8.75 | % | 9,178 | 9,150 | 7,066 | ||||||||||||||
| AF Borrower, LLC | IT consulting & other services | First Lien | 1/28/2022 | LIBOR+5.25% (1% floor) | 6.25 | % | 8,083 | 8,105 | 8,121 | ||||||||||||||
| Ameritox Ltd. (3) | Healthcare services | First Lien | 4/11/2021 | LIBOR+5% (1% floor) 3% PIK | 6.00 | % | 5,890 | 5,884 | 5,848 | ||||||||||||||
| 301,913.06 Class B Preferred Units | 302 | 331 | |||||||||||||||||||||
| 928.96 Class A Common Units | 5,474 | 2,471 | |||||||||||||||||||||
| Total Ameritox, Ltd. | 5,890 | 11,660 | 8,650 | ||||||||||||||||||||
| BeyondTrust Software, Inc. (3) | Application software | First Lien | 9/25/2019 | LIBOR+7% (1% floor) | 8.00 | % | 17,198 | 17,038 | 17,059 | ||||||||||||||
| Compuware Corporation | Internet software & services | First Lien B1 | 12/15/2019 | LIBOR+5.25% (1% floor) | 6.25 | % | 3,194 | 3,164 | 3,206 | ||||||||||||||
| First Lien B2 | 12/15/2021 | LIBOR+5.25% (1% floor) | 6.25 | % | 9,825 | 9,689 | 9,806 | ||||||||||||||||
| Total Compuware Corporation | 13,019 | 12,853 | 13,012 | ||||||||||||||||||||
| CRGT, Inc. | IT consulting & other services | First Lien | 12/21/2020 | LIBOR+6.5% (1% floor) | 7.50 | % | 2,294 | 2,289 | 2,300 | ||||||||||||||
| Digital River, Inc. | Internet software & services | First Lien | 2/12/2021 | LIBOR+6.5% (1% floor) | 7.50 | % | 4,524 | 4,563 | 4,515 | ||||||||||||||
| Dodge Data & Analytics LLC (3) | Data processing & outsourced services | First Lien | 10/31/2019 | LIBOR+8.75% (1% floor) | 9.75 | % | 9,688 | 9,740 | 9,810 | ||||||||||||||
| Edge Fitness, LLC | Leisure facilities | First Lien | 12/31/2019 | LIBOR+8.75% (1% floor) | 9.75 | % | 10,600 | 10,602 | 10,565 | ||||||||||||||
| EOS Fitness Opco Holdings, LLC (3) | Leisure facilities | First Lien | 12/30/2019 | LIBOR+8.75% (0.75% floor) | 9.50 | % | 19,160 | 18,869 | 18,672 | ||||||||||||||
| Falmouth Group Holdings Corp. | Specialty chemicals | First Lien | 12/13/2021 | LIBOR+6.75% (1% floor) | 7.75 | % | 4,963 | 4,920 | 4,968 | ||||||||||||||
| Garretson Resolution Group, Inc. | Diversified support services | First Lien | 5/22/2021 | LIBOR+6.5% (1% floor) | 7.50 | % | 5,991 | 5,966 | 5,946 | ||||||||||||||
| InMotion Entertainment Group, LLC (3) | Consumer electronics | First Lien | 10/1/2018 | LIBOR+7.75% (1.25% floor) | 9.00 | % | 9,375 | 9,394 | 9,252 | ||||||||||||||
| First Lien B | 10/1/2018 | LIBOR+7.75% (1.25% floor) | 9.00 | % | 9,375 | 9,270 | 9,252 | ||||||||||||||||
| Total InMotion Entertainment Group, LLC | 18,750 | 18,664 | 18,504 | ||||||||||||||||||||
| Integrated Petroleum Technologies, Inc. (3) | Oil & gas equipment services | First Lien | 3/31/2019 | LIBOR+7.5% (1% floor) | 8.50 | % | 8,267 | 8,267 | 2,839 | ||||||||||||||
| Legalzoom.com, Inc. (3) | Specialized consumer services | First Lien | 5/13/2020 | LIBOR+7% (1% floor) | 8.00 | % | 19,775 | 19,410 | 19,660 | ||||||||||||||
| Lift Brands, Inc. (3) | Leisure facilities | First Lien | 12/23/2019 | LIBOR+8% (1% floor) | 9.00 | % | 19,043 | 19,015 | 18,858 | ||||||||||||||
| Lytx, Inc. (3) | Research & consulting services | First Lien | 3/15/2023 | LIBOR+8.5% (1% floor) | 9.50 | % | 7,981 | 7,981 | 7,981 | ||||||||||||||
| MedTech Group, Inc. | Healthcare equipment | First Lien | 1/1/2019 | LIBOR+5.25% (1% floor) | 6.25 | % | 11,910 | 11,910 | 11,696 | ||||||||||||||
| Metamorph US 3, LLC (3) | Internet software & services | First Lien | 12/1/2020 | LIBOR+6.5% (1% floor) | 7.50 | % | 10,078 | 9,945 | 8,390 | ||||||||||||||
| Motion Recruitment Partners LLC | Human resources & employment services | First Lien | 2/13/2020 | LIBOR+6% (1% floor) | 7.00 | % | 4,563 | 4,487 | 4,550 | ||||||||||||||
| My Alarm Center, LLC | Security & alarm services | First Lien A | 1/9/2019 | LIBOR+8% (1% floor) | 9.00 | % | 3,000 | 2,993 | 3,005 | ||||||||||||||
| First Lien B | 1/9/2019 | LIBOR+8% (1% floor) | 9.00 | % | 4,506 | 4,493 | 4,514 | ||||||||||||||||
| First Lien C | 1/9/2019 | LIBOR+8% (1% floor) | 9.00 | % | 1,136 | 1,128 | 1,133 | ||||||||||||||||
| Total My Alarm Center, LLC | 8,642 | 8,614 | 8,652 | ||||||||||||||||||||
| Portfolio Company | Industry | Investment Type | Maturity Date | Current Interest Rate (1)(4) | Cash Interest Rate | Principal | Cost | Fair Value (2) | |||||||||||||||
| NAVEX Global, Inc. | Internet software & services | First Lien | 11/19/2021 | LIBOR+4.75% (1% floor) | 5.75 | % | 995 | 943 | 990 | ||||||||||||||
| Novetta Solutions, LLC | Internet software & services | First Lien | 9/30/2022 | LIBOR+5% (1% floor) | 6.00 | % | 6,614 | 6,528 | 6,357 | ||||||||||||||
| OmniSYS Acquisition Corporation (3) | Diversified support services | First Lien | 11/21/2018 | LIBOR+7.5% (1% floor) | 8.50 | % | 10,896 | 10,903 | 10,743 | ||||||||||||||
| Refac Optical Group (3) | Specialty stores | First Lien A | 9/30/2018 | LIBOR+7.5% | 8.02 | % | 7,116 | 7,049 | 7,107 | ||||||||||||||
| SHO Holding I Corporation | Footwear | First Lien | 10/27/2022 | LIBOR+5% (1% floor) | 6.00 | % | 4,466 | 4,426 | 4,461 | ||||||||||||||
| TIBCO Software, Inc. | Internet software & services | First Lien | 12/4/2020 | LIBOR+5.5% (1% floor) | 6.50 | % | 4,748 | 4,548 | 4,691 | ||||||||||||||
| Too Faced Cosmetics, LLC | Personal products | First Lien | 7/7/2021 | LIBOR+5% (1% floor) | 6.00 | % | 1,135 | 1,028 | 1,140 | ||||||||||||||
| TravelClick, Inc. (3) | Internet software & services | Second Lien | 11/8/2021 | LIBOR+7.75% (1% floor) | 8.75 | % | 8,460 | 8,460 | 7,576 | ||||||||||||||
| TrialCard Incorporated | Healthcare services | First Lien | 12/31/2019 | LIBOR+4.5% (1% floor) | 5.50 | % | 13,319 | 13,222 | 13,255 | ||||||||||||||
| TV Borrower US, LLC | Integrated telecommunications services | First Lien | 1/8/2021 | LIBOR+5% (1% floor) | 6.00 | % | 9,800 | 9,633 | 9,763 | ||||||||||||||
| Valet Merger Sub, Inc. (3) | Environmental & facilities services | First Lien | 9/24/2021 | LIBOR+7% (1% floor) | 8.00 | % | 14,887 | 14,692 | 15,138 | ||||||||||||||
| Vitera Healthcare Solutions, LLC | Healthcare technology | First Lien | 11/4/2020 | LIBOR+5% (1% floor) | 6.00 | % | 4,863 | 4,863 | 4,747 | ||||||||||||||
| Vubiquity, Inc. | Application software | First Lien | 8/12/2021 | LIBOR+5.5% (1% floor) | 6.50 | % | 2,680 | 2,658 | 2,666 | ||||||||||||||
| Worley Claims Services, LLC (3) | Internet software & services | First Lien | 10/31/2020 | LIBOR+8% (1% floor) | 9.00 | % | 9,924 | 9,882 | 9,875 | ||||||||||||||
| $ | 324,406 | $ | 327,720 | $ | 315,153 | ||||||||||||||||||
| September 30, 2022 | September 30, 2021 | ||||||||||
| Senior secured loans (1) | $143,225 | $126,512 | |||||||||
| Weighted average current interest rate on senior secured loans (2) | 8.52% | 5.86% | |||||||||
| Number of borrowers in the Glick JV | 43 | 37 | |||||||||
| Largest loan exposure to a single borrower (1) | $6,562 | $6,907 | |||||||||
| Total of five largest loan exposures to borrowers (1) | $28,973 | $28,324 | |||||||||
| Portfolio Company | Investment Type | Cash Interest Rate (1)(2) | Industry | Principal | Cost | Fair Value (3) | Notes | ||||||||||||||||||||||
| ADB Companies, LLC | First Lien Term Loan, SOFR+6.25% cash due 12/18/2025 | 9.80% | Construction & Engineering | $ | 4,647 | $ | 4,579 | $ | 4,567 | (4) | |||||||||||||||||||
| Alvogen Pharma Inc | First Lien Term Loan, SOFR+7.50% cash due 6/30/2025 | 11.20% | Pharmaceuticals | 6,562 | 6,489 | 6,529 | (4) | ||||||||||||||||||||||
| American Tire Distributors, Inc. | First Lien Term Loan, LIBOR+6.25% cash due 10/20/2028 | 9.03% | Distributors | 2,889 | 2,853 | 2,714 | (4) | ||||||||||||||||||||||
| Amplify Finco Pty Ltd. | First Lien Term Loan, LIBOR+4.25% cash due 11/26/2026 | 7.92% | Movies & Entertainment | 2,925 | 2,896 | 2,823 | (4) | ||||||||||||||||||||||
| Anastasia Parent, LLC | First Lien Term Loan, LIBOR+3.75% cash due 8/11/2025 | 7.42% | Personal Products | 917 | 712 | 734 | (4) | ||||||||||||||||||||||
| ASP-R-PAC Acquisition Co LLC | First Lien Term Loan, LIBOR+6.00% cash due 12/29/2027 | 9.67% | Paper Packaging | 1,734 | 1,704 | 1,694 | |||||||||||||||||||||||
| ASP-R-PAC Acquisition Co LLC | First Lien Revolver, LIBOR+6.00% cash due 12/29/2027 | Paper Packaging | — | (4) | (5) | (5) | |||||||||||||||||||||||
| Total ASP-R-PAC Acquisition Co LLC | 1,734 | 1,700 | 1,689 | ||||||||||||||||||||||||||
| Astra Acquisition Corp. | First Lien Term Loan, LIBOR+5.25% cash due 10/25/2028 | 8.37% | Application Software | 2,078 | 2,033 | 1,777 | (4) | ||||||||||||||||||||||
| Asurion, LLC | First Lien Term Loan, SOFR+4.00% cash due 8/19/2028 | 7.70% | Property & Casualty Insurance | 2,000 | 1,901 | 1,711 | |||||||||||||||||||||||
| Asurion, LLC | Second Lien Term Loan, LIBOR+5.25% cash due 1/20/2029 | 8.37% | Property & Casualty Insurance | 2,423 | 2,212 | 1,866 | |||||||||||||||||||||||
| Total Asurion, LLC | 4,423 | 4,113 | 3,577 | ||||||||||||||||||||||||||
| Aurora Lux Finco S.À.R.L. | First Lien Term Loan, LIBOR+6.00% cash due 12/24/2026 | 8.78% | Airport Services | 3,656 | 3,601 | 3,476 | (4) | ||||||||||||||||||||||
| BAART Programs, Inc. | First Lien Term Loan, LIBOR+5.00% cash due 6/11/2027 | 8.12% | Health Care Services | 3,398 | 3,366 | 3,279 | |||||||||||||||||||||||
| BAART Programs, Inc. | First Lien Delayed Draw Term Loan, LIBOR+5.00% cash due 6/11/2027 | 8.12% | Health Care Services | 808 | 800 | 760 | (4)(5) | ||||||||||||||||||||||
| Total BAART Programs, Inc. | 4,206 | 4,166 | 4,039 | ||||||||||||||||||||||||||
| BYJU's Alpha, Inc. | First Lien Term Loan, LIBOR+6.00% cash due 11/24/2026 | 8.98% | Application Software | 3,970 | 3,919 | 2,909 | |||||||||||||||||||||||
| CITGO Petroleum Corp. | First Lien Term Loan, LIBOR+6.25% cash due 3/28/2024 | 9.37% | Oil & Gas Refining & Marketing | 3,519 | 3,484 | 3,529 | (4) | ||||||||||||||||||||||
| City Football Group Limited | First Lien Term Loan, LIBOR+3.50% cash due 7/21/2028 | 6.48% | Movies & Entertainment | 2,481 | 2,469 | 2,372 | |||||||||||||||||||||||
| Covetrus, Inc. | First Lien Term Loan, SOFR+5.00% cash due 9/20/2029 | 7.65% | Health Care Distributors | 2,280 | 2,143 | 2,136 | (4) | ||||||||||||||||||||||
| Curium Bidco S.à.r.l. | First Lien Term Loan, LIBOR+4.00% cash due 7/9/2026 | 7.67% | Biotechnology | 2,870 | 2,849 | 2,756 | |||||||||||||||||||||||
| DirecTV Financing, LLC | First Lien Term Loan, LIBOR+5.00% cash due 8/2/2027 | 8.12% | Cable & Satellite | 2,730 | 2,703 | 2,549 | (4) | ||||||||||||||||||||||
| Domtar Corporation | First Lien Term Loan, LIBOR+5.50% cash due 11/30/2028 | 8.26% | Paper Products | 2,503 | 2,478 | 2,394 | |||||||||||||||||||||||
| DTI Holdco, Inc. | First Lien Term Loan, SOFR+4.75% cash due 4/26/2029 | 7.33% | Research & Consulting Services | 3,000 | 2,943 | 2,856 | (4) | ||||||||||||||||||||||
| Portfolio Company | Investment Type | Cash Interest Rate (1)(2) | Industry | Principal | Cost | Fair Value (3) | Notes | ||||||||||||||||||||||
| Eagle Parent Corp. | First Lien Term Loan, SOFR+4.25% cash due 4/1/2029 | 7.80% | Industrial Machinery | $ | 2,488 | $ | 2,429 | $ | 2,426 | ||||||||||||||||||||
| eResearch Technology, Inc. | First Lien Term Loan, LIBOR+4.50% cash due 2/4/2027 | 7.62% | Application Software | 2,444 | 2,419 | 2,286 | |||||||||||||||||||||||
| Gibson Brands, Inc. | First Lien Term Loan, LIBOR+5.00% cash due 8/11/2028 | 7.94% | Leisure Products | 3,970 | 3,930 | 3,216 | |||||||||||||||||||||||
| Harbor Purchaser Inc. | First Lien Term Loan, SOFR+5.25% cash due 4/9/2029 | 8.38% | Education Services | 4,000 | 3,887 | 3,655 | (4) | ||||||||||||||||||||||
| Indivior Finance S.À.R.L. | First Lien Term Loan, LIBOR+5.25% cash due 6/30/2026 | 8.80% | Pharmaceuticals | 3,950 | 3,890 | 3,886 | |||||||||||||||||||||||
| INW Manufacturing, LLC | First Lien Term Loan, LIBOR+5.75% cash due 3/25/2027 | 9.42% | Personal Products | 2,375 | 2,320 | 2,102 | (4) | ||||||||||||||||||||||
| Iris Holding, Inc. | First Lien Term Loan, SOFR+4.75% cash due 6/28/2028 | 7.89% | Metal & Glass Containers | 2,000 | 1,846 | 1,844 | |||||||||||||||||||||||
| LaserAway Intermediate Holdings II, LLC | First Lien Term Loan, LIBOR+5.75% cash due 10/14/2027 | 8.23% | Health Care Services | 3,970 | 3,903 | 3,905 | |||||||||||||||||||||||
| LTI Holdings, Inc. | First Lien Term Loan, LIBOR+3.25% cash due 9/6/2025 | 6.37% | Electronic Components | 1,358 | 1,192 | 1,260 | |||||||||||||||||||||||
| MRI Software LLC | First Lien Term Loan, LIBOR+5.50% cash due 2/10/2026 | 9.17% | Application Software | 1,647 | 1,632 | 1,600 | (4) | ||||||||||||||||||||||
| MRI Software LLC | First Lien Revolver, LIBOR+5.50% cash due 2/10/2026 | Application Software | — | (1) | (4) | (4)(5) | |||||||||||||||||||||||
| Total MRI Software LLC | 1,647 | 1,631 | 1,596 | ||||||||||||||||||||||||||
| Northern Star Industries Inc. | First Lien Term Loan, LIBOR+4.75% cash due 3/31/2025 | 7.87% | Electrical Components & Equipment | 5,252 | 5,243 | 5,095 | |||||||||||||||||||||||
| OEConnection LLC | First Lien Term Loan, LIBOR+4.00% cash due 9/25/2026 | 7.12% | Application Software | 3,888 | 3,871 | 3,752 | (4) | ||||||||||||||||||||||
| Planview Parent, Inc. | Second Lien Term Loan, LIBOR+7.25% cash due 12/18/2028 | 10.92% | Application Software | 2,842 | 2,799 | 2,728 | (4) | ||||||||||||||||||||||
| Pluralsight, LLC | First Lien Term Loan, LIBOR+8.00% cash due 4/6/2027 | 10.68% | Application Software | 4,465 | 4,398 | 4,325 | (4) | ||||||||||||||||||||||
| Pluralsight, LLC | First Lien Revolver, LIBOR+8.00% cash due 4/6/2027 | Application Software | — | (5) | (10) | (4)(5) | |||||||||||||||||||||||
| Total Pluralsight, LLC | 4,465 | 4,393 | 4,315 | ||||||||||||||||||||||||||
| Sabert Corporation | First Lien Term Loan, LIBOR+4.50% cash due 12/10/2026 | 7.63% | Metal & Glass Containers | 1,691 | 1,674 | 1,623 | (4) | ||||||||||||||||||||||
| SHO Holding I Corporation | First Lien Term Loan, LIBOR+5.25% cash due 4/27/2024 | 8.06% | Footwear | 6,094 | 6,082 | 5,332 | |||||||||||||||||||||||
| SHO Holding I Corporation | First Lien Term Loan, LIBOR+5.23% cash due 4/27/2024 | 8.04% | Footwear | 102 | 102 | 90 | |||||||||||||||||||||||
| Total SHO Holding I Corporation | 6,196 | 6,184 | 5,422 | ||||||||||||||||||||||||||
| Spanx, LLC | First Lien Term Loan, LIBOR+5.25% cash due 11/20/2028 | 8.30% | Apparel Retail | 4,962 | 4,876 | 4,845 | (4) | ||||||||||||||||||||||
| SPX Flow, Inc. | First Lien Term Loan, SOFR+4.50% cash due 4/5/2029 | 7.63% | Industrial Machinery | 6,000 | 5,734 | 5,572 | (4) | ||||||||||||||||||||||
| Supermoose Borrower, LLC | First Lien Term Loan, LIBOR+3.75% cash due 8/29/2025 | 7.42% | Application Software | 2,820 | 2,712 | 2,487 | (4) | ||||||||||||||||||||||
| Surgery Center Holdings, Inc. | First Lien Term Loan, LIBOR+3.75% cash due 8/31/2026 | 6.51% | Health Care Facilities | 3,377 | 3,365 | 3,213 | |||||||||||||||||||||||
| TIBCO Software Inc. | First Lien Term Loan, SOFR+4.50% cash due 3/20/2029 | 8.15% | Application Software | 2,654 | 2,415 | 2,388 | (4) | ||||||||||||||||||||||
| Touchstone Acquisition, Inc. | First Lien Term Loan, LIBOR+6.00% cash due 12/29/2028 | 9.12% | Health Care Supplies | 3,024 | 2,970 | 2,963 | (4) | ||||||||||||||||||||||
| Tribe Buyer LLC | First Lien Term Loan, LIBOR+4.50% cash due 2/16/2024 | 7.62% | Human Resource & Employment Services | 1,583 | 1,582 | 1,266 | |||||||||||||||||||||||
| Windstream Services II, LLC | First Lien Term Loan, LIBOR+6.25% cash due 9/21/2027 | 9.37% | Integrated Telecommunication Services | 4,886 | 4,747 | 4,447 | (4) | ||||||||||||||||||||||
| WP CPP Holdings, LLC | First Lien Term Loan, LIBOR+3.75% cash due 4/30/2025 | 6.56% | Aerospace & Defense | 993 | 955 | 892 | (4) | ||||||||||||||||||||||
| WP CPP Holdings, LLC | Second Lien Term Loan, LIBOR+7.75% cash due 4/30/2026 | 10.56% | Aerospace & Defense | 3,000 | 2,986 | 2,534 | (4) | ||||||||||||||||||||||
| Total WP CPP Holdings, LLC | 3,993 | 3,941 | 3,426 | ||||||||||||||||||||||||||
| Total Portfolio Investments | $ | 143,225 | $ | 140,083 | $ | 133,144 | |||||||||||||||||||||||
| Portfolio Company | Investment Type | Cash Interest Rate (1)(2) | Industry | Principal | Cost | Fair Value (3) | Notes | ||||||||||||||||||||||
| ADB Companies, LLC | First Lien Term Loan, LIBOR+6.25% cash due 12/18/2025 | 7.25% | Construction & Engineering | $ | 3,866 | $ | 3,783 | $ | 3,822 | (4) | |||||||||||||||||||
| Alvogen Pharma US, Inc. | First Lien Term Loan, LIBOR+5.25% cash due 12/31/2023 | 6.25% | Pharmaceuticals | 6,907 | 6,780 | 6,687 | (4) | ||||||||||||||||||||||
| Amplify Finco Pty Ltd. | First Lien Term Loan, LIBOR+4.25% cash due 11/26/2026 | 5.00% | Movies & Entertainment | 2,955 | 2,925 | 2,880 | (4) | ||||||||||||||||||||||
| Anastasia Parent, LLC | First Lien Term Loan, LIBOR+3.75% cash due 8/11/2025 | 3.88% | Personal Products | 1,667 | 1,310 | 1,416 | |||||||||||||||||||||||
| Asurion, LLC | Second Lien Term Loan, LIBOR+5.25% cash due 1/20/2029 | 5.33% | Property & Casualty Insurance | 3,000 | 2,970 | 2,990 | |||||||||||||||||||||||
| Aurora Lux Finco S.À.R.L. | First Lien Term Loan, LIBOR+6.00% cash due 12/24/2026 | 7.00% | Airport Services | 3,694 | 3,625 | 3,476 | (4) | ||||||||||||||||||||||
| BAART Programs, Inc. | First Lien Term Loan, LIBOR+5.00% cash due 6/11/2027 | 6.00% | Health Care Services | 3,192 | 3,160 | 3,184 | |||||||||||||||||||||||
| BAART Programs, Inc. | First Lien Delayed Draw Term Loan, LIBOR+5.00% cash due 6/11/2027 | 6.00% | Health Care Services | 240 | 232 | 238 | (5) | ||||||||||||||||||||||
| Total BAART Programs, Inc. | 3,432 | 3,392 | 3,422 | ||||||||||||||||||||||||||
| Brazos Delaware II, LLC | First Lien Term Loan, LIBOR+4.00% cash due 5/21/2025 | 4.08% | Oil & Gas Equipment & Services | 4,835 | 4,823 | 4,772 | |||||||||||||||||||||||
| CITGO Petroleum Corp. | First Lien Term Loan, LIBOR+6.25% cash due 3/28/2024 | 7.25% | Oil & Gas Refining & Marketing | 3,555 | 3,520 | 3,567 | (4) | ||||||||||||||||||||||
| City Football Group Limited | First Lien Term Loan, LIBOR+3.50% cash due 7/21/2028 | 4.00% | Movies & Entertainment | 2,500 | 2,488 | 2,497 | |||||||||||||||||||||||
| Curium Bidco S.à.r.l. | First Lien Term Loan, LIBOR+4.00% cash due 7/9/2026 | 4.13% | Biotechnology | 4,900 | 4,863 | 4,903 | |||||||||||||||||||||||
| DirecTV Financing, LLC | First Lien Term Loan, LIBOR+5.00% cash due 8/2/2027 | 5.75% | Cable & Satellite | 3,000 | 2,970 | 3,005 | (4) | ||||||||||||||||||||||
| Enviva Holdings, LP | First Lien Term Loan, LIBOR+5.50% cash due 2/17/2026 | 6.50% | Forest Products | 3,919 | 3,879 | 3,928 | |||||||||||||||||||||||
| eResearch Technology, Inc. | First Lien Term Loan, LIBOR+4.50% cash due 2/4/2027 | 5.50% | Application Software | 2,469 | 2,444 | 2,484 | |||||||||||||||||||||||
| Gibson Brands, Inc. | First Lien Term Loan, LIBOR+5.00% cash due 8/11/2028 | 5.75% | Leisure Products | 4,000 | 3,960 | 3,981 | |||||||||||||||||||||||
| Houghton Mifflin Harcourt Publishers Inc. | First Lien Term Loan, LIBOR+6.25% cash due 11/22/2024 | 7.25% | Education Services | 431 | 420 | 433 | (4) | ||||||||||||||||||||||
| Indivior Finance S.À.R.L. | First Lien Term Loan, LIBOR+5.25% cash due 6/30/2026 | 6.00% | Pharmaceuticals | 3,990 | 3,913 | 3,977 | |||||||||||||||||||||||
| Integro Parent, Inc. | First Lien Term Loan, LIBOR+5.75% cash due 10/31/2022 | 6.75% | Insurance Brokers | 3,229 | 3,221 | 3,173 | |||||||||||||||||||||||
| Intelsat Jackson Holdings S.A. | First Lien Term Loan, LIBOR+4.75% cash due 7/13/2022 | 5.75% | Alternative Carriers | 4,167 | 4,112 | 4,203 | |||||||||||||||||||||||
| Intelsat Jackson Holdings S.A. | First Lien Delayed Draw Term Loan, LIBOR+4.75% cash due 7/13/2022 | Alternative Carriers | — | (11) | 7 | (5) | |||||||||||||||||||||||
| Total Intelsat Jackson Holdings S.A. | 4,167 | 4,101 | 4,210 | ||||||||||||||||||||||||||
| INW Manufacturing, LLC | First Lien Term Loan, LIBOR+5.75% cash due 5/7/2027 | 6.50% | Personal Products | 2,469 | 2,399 | 2,419 | (4) | ||||||||||||||||||||||
| Portfolio Company | Investment Type | Cash Interest Rate (1)(2) | Industry | Principal | Cost | Fair Value (3) | Notes | ||||||||||||||||||||||
| Lightstone Holdco LLC | First Lien Term Loan, LIBOR+3.75% cash due 1/30/2024 | 4.75% | Electric Utilities | $ | 3,439 | $ | 3,115 | $ | 2,855 | ||||||||||||||||||||
| LTI Holdings, Inc. | First Lien Term Loan, LIBOR+3.50% cash due 9/6/2025 | 3.58% | Electronic Components | 1,372 | 1,147 | 1,356 | |||||||||||||||||||||||
| MRI Software LLC | First Lien Term Loan, LIBOR+5.50% cash due 2/10/2026 | 6.50% | Application Software | 1,635 | 1,621 | 1,634 | (4) | ||||||||||||||||||||||
| MRI Software LLC | First Lien Delayed Draw Term Loan, LIBOR+5.50% cash due 2/10/2026 | Application Software | — | (1) | — | (4)(5) | |||||||||||||||||||||||
| MRI Software LLC | First Lien Revolver, LIBOR+5.50% cash due 2/10/2026 | Application Software | — | (1) | — | (4)(5) | |||||||||||||||||||||||
| Total MRI Software LLC | 1,635 | 1,619 | 1,634 | ||||||||||||||||||||||||||
| Northern Star Industries Inc. | First Lien Term Loan, LIBOR+4.50% cash due 3/31/2025 | 5.50% | Electrical Components & Equipment | 5,308 | 5,294 | 5,294 | |||||||||||||||||||||||
| OEConnection LLC | First Lien Term Loan, LIBOR+4.00% cash due 9/25/2026 | 4.08% | Application Software | 3,926 | 3,908 | 3,921 | (4) | ||||||||||||||||||||||
| Olaplex, Inc. | First Lien Term Loan, LIBOR+6.25% cash due 1/8/2026 | 7.25% | Personal Products | 3,502 | 3,454 | 3,475 | (4) | ||||||||||||||||||||||
| Olaplex, Inc. | First Lien Revolver, LIBOR+6.25% cash due 1/8/2025 | Personal Products | — | (4) | (5) | (4)(5) | |||||||||||||||||||||||
| Total Olaplex, Inc. | 3,502 | 3,450 | 3,470 | ||||||||||||||||||||||||||
| Planview Parent, Inc. | Second Lien Term Loan, LIBOR+7.25% cash due 12/18/2028 | 8.00% | Application Software | 2,842 | 2,799 | 2,849 | (4) | ||||||||||||||||||||||
| Pluralsight, LLC | First Lien Term Loan, LIBOR+8.00% cash due 4/6/2027 | 9.00% | Application Software | 4,465 | 4,383 | 4,380 | (4) | ||||||||||||||||||||||
| Pluralsight, LLC | First Lien Revolver, LIBOR+8.00% cash due 4/6/2027 | Application Software | — | (6) | (6) | (4)(5) | |||||||||||||||||||||||
| Total Pluralsight, LLC | 4,465 | 4,377 | 4,374 | ||||||||||||||||||||||||||
| Sabert Corporation | First Lien Term Loan, LIBOR+4.50% cash due 12/10/2026 | 5.50% | Metal & Glass Containers | 1,819 | 1,800 | 1,825 | (4) | ||||||||||||||||||||||
| SHO Holding I Corporation | First Lien Term Loan, LIBOR+5.25% cash due 4/27/2024 | 6.25% | Footwear | 6,159 | 6,140 | 5,851 | |||||||||||||||||||||||
| SHO Holding I Corporation | First Lien Term Loan, LIBOR+5.23% cash due 4/27/2024 | 6.23% | Footwear | 102 | 102 | 97 | |||||||||||||||||||||||
| Total SHO Holding I Corporation | 6,261 | 6,242 | 5,948 | ||||||||||||||||||||||||||
| Supermoose Borrower, LLC | First Lien Term Loan, LIBOR+3.75% cash due 8/29/2025 | 3.88% | Application Software | 2,850 | 2,703 | 2,657 | (4) | ||||||||||||||||||||||
| Surgery Center Holdings, Inc. | First Lien Term Loan, LIBOR+3.75% cash due 8/31/2026 | 4.50% | Health Care Facilities | 4,911 | 4,895 | 4,925 | |||||||||||||||||||||||
| Tribe Buyer LLC | First Lien Term Loan, LIBOR+4.50% cash due 2/16/2024 | 5.50% | Human Resource & Employment Services | 1,599 | 1,598 | 1,354 | |||||||||||||||||||||||
| Verscend Holding Corp. | First Lien Term Loan, LIBOR+4.00% cash due 8/27/2025 | 4.08% | Health Care Technology | 1,721 | 1,709 | 1,725 | |||||||||||||||||||||||
| Waystar Technologies, Inc. | First Lien Term Loan, LIBOR+4.00% cash due 10/22/2026 | 4.08% | Health Care Technology | 3,940 | 3,920 | 3,947 | |||||||||||||||||||||||
| Windstream Services II, LLC | First Lien Term Loan, LIBOR+6.25% cash due 9/21/2027 | 7.25% | Integrated Telecommunication Services | 4,937 | 4,768 | 4,967 | (4) | ||||||||||||||||||||||
| WP CPP Holdings, LLC | Second Lien Term Loan, LIBOR+7.75% cash due 4/30/2026 | 8.75% | Aerospace & Defense | 3,000 | 2,982 | 2,965 | (4) | ||||||||||||||||||||||
| Total Portfolio Investments | $ | 126,512 | $ | 124,112 | $ | 124,108 | |||||||||||||||||||||||
| September 30, 2022 | September 30, 2021 | ||||||||||
| Selected Balance Sheet Information: | |||||||||||
| Investments at fair value (cost September 30, 2022: $140,083; September 30, 2021: $124,112) | $ | 133,144 | $ | 124,108 | |||||||
| Cash and cash equivalents | 7,021 | 14,087 | |||||||||
| Restricted cash | 1,788 | 1,055 | |||||||||
| Other assets | 4,855 | 1,750 | |||||||||
| Total assets | $ | 146,808 | $ | 141,000 | |||||||
| Senior credit facility payable | $ | 82,082 | $ | 71,882 | |||||||
| Glick JV Notes payable at fair value (proceeds September 30, 2022: $68,185; September 30, 2021: $70,525) | 57,463 | 63,522 | |||||||||
| Other liabilities | 7,263 | 5,596 | |||||||||
| Total liabilities | $ | 146,808 | $ | 141,000 | |||||||
| Members' equity | — | — | |||||||||
| Total liabilities and members' equity | $ | 146,808 | $ | 141,000 | |||||||
| September 30, 2017 | September 30, 2016 | |||||||
| Selected Balance Sheet Information: | ||||||||
| Investments in loans at fair value (cost September 30, 2017: $251,648; cost September 30, 2016: $327,720) | $ | 235,526 | $ | 315,153 | ||||
| Receivables from secured financing arrangements at fair value (cost September 30, 2017: $9,783; cost September 30, 2016: $10,014) | 8,305 | 9,672 | ||||||
| Cash and cash equivalents | 24,389 | 1,878 | ||||||
| Restricted cash | 5,097 | 7,080 | ||||||
| Other assets | 3,485 | 4,700 | ||||||
| Total assets | $ | 276,802 | $ | 338,483 | ||||
| Senior credit facilities payable | $ | 113,053 | $ | 167,012 | ||||
| Debt securities payable at fair value (proceeds September 30, 2017: $147,052; proceeds September 30, 2016: $165,533) | 147,052 | 147,433 | ||||||
| Other liabilities | 10,383 | 8,371 | ||||||
| Total liabilities | $ | 270,488 | $ | 322,816 | ||||
| Members' equity | 6,314 | 15,667 | ||||||
| Total liabilities and members' equity | $ | 276,802 | $ | 338,483 | ||||
| For the year ended September 30, 2022 | For the period from March 19, 2021 to September 30, 2021 | ||||||||||
| Selected Statements of Operations Information: | |||||||||||
| Interest income | $ | 9,703 | $ | 4,643 | |||||||
| Fee income | 149 | 67 | |||||||||
| Total investment income | 9,852 | 4,710 | |||||||||
| Senior credit facility interest expense | 2,747 | 1,157 | |||||||||
| Glick JV Notes interest expense | 3,576 | 1,780 | |||||||||
| Other expenses | 168 | 95 | |||||||||
| Total expenses (1) | 6,491 | 3,032 | |||||||||
| Net investment income | 3,361 | 1,678 | |||||||||
| Net unrealized appreciation (depreciation) | (3,216) | (1,710) | |||||||||
| Realized gain (loss) | (145) | 32 | |||||||||
| Net income (loss) | $ | — | $ | — | |||||||
| Year ended September 30, 2017 | Year ended September 30, 2016 | |||||||
| Selected Statements of Operations Information: | ||||||||
| Interest income | $ | 23,222 | $ | 30,156 | ||||
| Other income | 869 | 840 | ||||||
| Total investment income | 24,091 | 30,996 | ||||||
| Interest expense | 22,195 | 23,262 | ||||||
| Other expenses | 700 | 501 | ||||||
| Total expenses (1) | 22,895 | 23,763 | ||||||
| Net unrealized appreciation (depreciation) | (22,789 | ) | 7,438 | |||||
| Net realized gain (loss) | 13,350 | (7,771 | ) | |||||
| Net income (loss) | $ | (8,243 | ) | $ | 6,900 | |||
| Selected Balance Sheet Information | September 30, 2017 | September 30, 2016 (1) | |||||
| Current assets | $ | 19,210 | $ | 20,226 | |||
| Non-current assets | 36,693 | 34,082 | |||||
| Total assets | 55,903 | 54,308 | |||||
| Current liabilities | 16,536 | 16,066 | |||||
| Non-current liabilities | 79,697 | 54,329 | |||||
| Total liabilities | 96,233 | 70,395 | |||||
| Members' deficit | $ | (40,330 | ) | $ | (16,087 | ) | |
| Selected Statement of Operations Information | For the year ended September 30, 2017 | For the period April 11, 2016 to September 30, 2016 (1) | |||||
| Total revenue | $ | 80,237 | $ | 42,637 | |||
| Cost of sales | 41,033 | 22,627 | |||||
| Gross margin | 39,204 | 20,010 | |||||
| Operating expenses | 41,823 | 26,061 | |||||
| Other expenses | 23,957 | 13,931 | |||||
| Income from continuing operations | (26,576 | ) | (19,982 | ) | |||
| Net income | $ | (26,576 | ) | $ | (19,982 | ) | |
| (Share amounts in thousands) | Year ended September 30, 2022 | Year ended September 30, 2021 | Year ended September 30, 2020 | |||||||||||||||||
| Earnings (loss) per common share — basic and diluted: | ||||||||||||||||||||
| Net increase (decrease) in net assets resulting from operations | $ | 29,223 | $ | 237,260 | $ | 39,224 | ||||||||||||||
| Weighted average common shares outstanding — basic and diluted | 182,181 | 162,118 | 140,961 | |||||||||||||||||
| Earnings (loss) per common share — basic and diluted | $ | 0.16 | $ | 1.46 | $ | 0.28 | ||||||||||||||
| (Share amounts in thousands) | Year ended September 30, 2017 | Year ended September 30, 2016 (1) | Year ended September 30, 2015 (1) | |||||||||
| Earnings (loss) per common share — basic: | ||||||||||||
| Net increase (decrease) in net assets resulting from operations | $ | (196,969 | ) | $ | (66,556 | ) | $ | 15,395 | ||||
| Weighted average common shares outstanding — basic | 141,438 | 147,422 | 153,164 | |||||||||
| Earnings (loss) per common share — basic | $ | (1.39 | ) | $ | (0.45 | ) | $ | 0.10 | ||||
| Earnings (loss) per common share — diluted: | ||||||||||||
| Net increase (decrease) in net assets resulting from operations, before adjustments | $ | (196,969 | ) | $ | (66,556 | ) | $ | 15,395 | ||||
| Adjustments for interest on convertible notes, base management fees and incentive fees | — | — | 5,458 | |||||||||
| Net increase (decrease) in net assets resulting from operations, as adjusted | $ | (196,969 | ) | $ | (66,556 | ) | $ | 20,853 | ||||
| Weighted average common shares outstanding — basic | 141,438 | 147,422 | 153,164 | |||||||||
| Adjustments for dilutive effect of convertible notes | — | 3,917 | 7,791 | |||||||||
| Weighted average common shares outstanding — diluted | 141,438 | 151,339 | 160,955 | |||||||||
| Earnings (loss) per common share — diluted | $ | (1.39 | ) | $ | (0.45 | ) | $ | 0.10 | ||||
| Common Stock | ||||||||||||||||||||||||||||||||
| (Share amounts in thousands) | Shares | Par Value | Additional paid-in-capital | Accumulated Overdistributed Earnings | Total Net Assets | |||||||||||||||||||||||||||
| Balance at September 30, 2019 | 140,961 | $ | 1,409 | $ | 1,487,774 | $ | (558,553) | $ | 930,630 | |||||||||||||||||||||||
| Net investment income | — | — | — | 71,992 | 71,992 | |||||||||||||||||||||||||||
| Net unrealized appreciation (depreciation) | — | — | — | (20,614) | (20,614) | |||||||||||||||||||||||||||
| Net realized gains (losses) | — | — | — | (13,924) | (13,924) | |||||||||||||||||||||||||||
| (Provision) benefit for taxes on realized and unrealized gains (losses) | — | — | — | 1,770 | 1,770 | |||||||||||||||||||||||||||
| Distributions to stockholders | — | — | — | (54,975) | (54,975) | |||||||||||||||||||||||||||
| Issuance of common stock under dividend reinvestment plan | 435 | 4 | 1,874 | — | 1,878 | |||||||||||||||||||||||||||
| Repurchases of common stock under dividend reinvestment plan | (435) | (4) | (1,874) | — | (1,878) | |||||||||||||||||||||||||||
| Balance at September 30, 2020 | 140,961 | $ | 1,409 | $ | 1,487,774 | $ | (574,304) | $ | 914,879 | |||||||||||||||||||||||
| Net investment income | — | — | — | 97,106 | 97,106 | |||||||||||||||||||||||||||
| Net unrealized appreciation (depreciation) | — | — | — | 114,519 | 114,519 | |||||||||||||||||||||||||||
| Net realized gains (losses) | — | — | — | 26,420 | 26,420 | |||||||||||||||||||||||||||
| (Provision) benefit for taxes on realized and unrealized gains (losses) | — | — | — | (785) | (785) | |||||||||||||||||||||||||||
| Distributions to stockholders | — | — | — | (82,020) | (82,020) | |||||||||||||||||||||||||||
| Reclassification of additional paid-in capital | — | — | 74,271 | (74,271) | — | |||||||||||||||||||||||||||
| Issuance of common stock in connection with the OCSI Merger | 39,400 | 395 | 242,309 | — | 242,704 | |||||||||||||||||||||||||||
| Issuance of common stock under dividend reinvestment plan | 338 | 3 | 2,167 | — | 2,170 | |||||||||||||||||||||||||||
| Repurchases of common stock under dividend reinvestment plan | (338) | (3) | (2,167) | — | (2,170) | |||||||||||||||||||||||||||
| Balance as of September 30, 2021 | 180,361 | $ | 1,804 | $ | 1,804,354 | $ | (493,335) | $ | 1,312,823 | |||||||||||||||||||||||
| Net investment income | — | — | — | 148,621 | 148,621 | |||||||||||||||||||||||||||
| Net unrealized appreciation (depreciation) | — | — | — | (136,248) | (136,248) | |||||||||||||||||||||||||||
| Net realized gains (losses) | — | — | — | 17,179 | 17,179 | |||||||||||||||||||||||||||
| (Provision) benefit for taxes on realized and unrealized gains (losses) | — | — | — | (329) | (329) | |||||||||||||||||||||||||||
| Distributions to stockholders | — | — | — | (118,657) | (118,657) | |||||||||||||||||||||||||||
| Issuance of common stock in connection with the "at the market" offering | 2,801 | 28 | 20,594 | — | 20,622 | |||||||||||||||||||||||||||
| Issuance of common stock under dividend reinvestment plan | 497 | 5 | 3,404 | — | 3,409 | |||||||||||||||||||||||||||
| Repurchases of common stock under dividend reinvestment plan | (285) | (3) | (1,854) | — | (1,857) | |||||||||||||||||||||||||||
| Balance as of September 30, 2022 | 183,374 | $ | 1,834 | $ | 1,826,498 | $ | (582,769) | $ | 1,245,563 | |||||||||||||||||||||||
| Date Declared | Record Date | Payment Date | Amount per Share | Cash Distribution | DRIP Shares Issued | DRIP Shares Value | |||||||||||
| August 3, 2016 | October 14, 2016 | October 31, 2016 | $ | 0.06 | $ 8.2 million | 81,391 | (1) | $ 0.4 million | |||||||||
| August 3, 2016 | November 15, 2016 | November 30, 2016 | 0.06 | 8.2 million | 80,962 | (1) | 0.4 million | ||||||||||
| October 18, 2016 | December 15, 2016 | December 30, 2016 | 0.06 | 7.7 million | 70,316 | (1) | 0.4 million | ||||||||||
| October 18, 2016 | January 13, 2017 | January 31, 2017 | 0.06 | 8.0 million | 73,940 | (1) | 0.4 million | ||||||||||
| October 18, 2016 | February 15, 2017 | February 28, 2017 | 0.06 | 8.0 million | 86,120 | (1) | 0.4 million | ||||||||||
| February 6, 2017 | March 15, 2017 | March 31, 2017 | 0.02 | 2.7 million | 27,891 | (1) | 0.1 million | ||||||||||
| February 6, 2017 | June 15, 2017 | June 30, 2017 | 0.02 | 2.7 million | 20,502 | (1) | 0.1 million | ||||||||||
| February 6, 2017 | September 15, 2017 | September 29, 2017 | 0.125 | 17.0 million | 118,992 | (1) | 0.7 million | ||||||||||
| Total for the year ended September 30, 2017 | $ | 0.465 | $ 62.5 million | 560,114 | $ 2.9 million | ||||||||||||
| Date Declared | Record Date | Payment Date | Amount per Share | Cash Distribution | DRIP Shares Issued | DRIP Shares Value | |||||||||||
| August 4, 2015 | October 15, 2015 | October 30, 2015 | $ | 0.06 | $ 8.4 million | 106,185 | (1) | $ 0.6 million | |||||||||
| August 4, 2015 | November 16, 2015 | November 30, 2015 | 0.06 | 8.4 million | 91,335 | (1) | 0.6 million | ||||||||||
| November 30, 2015 | December 15, 2015 | December 30, 2015 | 0.06 | 8.4 million | 99,673 | (1) | 0.6 million | ||||||||||
| November 30, 2015 | January 15, 2016 | January 28, 2016 | 0.06 | 8.4 million | 113,905 | (1) | 0.7 million | ||||||||||
| November 30, 2015 | February 12, 2016 | February 26, 2016 | 0.06 | 8.4 million | 123,342 | (1) | 0.6 million | ||||||||||
| February 8, 2016 | March 15, 2016 | March 31, 2016 | 0.06 | 8.6 million | 86,806 | (1) | 0.4 million | ||||||||||
| February 8, 2016 | April 15, 2016 | April 29, 2016 | 0.06 | 8.2 million | 112,569 | (1) | 0.6 million | ||||||||||
| February 8, 2016 | May 13, 2016 | May 31, 2016 | 0.06 | 8.4 million | 76,432 | (1) | 0.4 million | ||||||||||
| May 5, 2016 | June 15, 2016 | June 30, 2016 | 0.06 | 8.2 million | 108,629 | (1) | 0.5 million | ||||||||||
| May 5, 2016 | July 15, 2016 | July 29, 2016 | 0.06 | 8.2 million | 100,268 | (1) | 0.6 million | ||||||||||
| May 5, 2016 | August 15, 2016 | August 31, 2016 | 0.06 | 8.3 million | 59,026 | (1) | 0.4 million | ||||||||||
| August 3, 2016 | September 15, 2016 | September 30, 2016 | 0.06 | 8.3 million | 65,170 | (1) | 0.4 million | ||||||||||
| Total for the year ended September 30, 2016 | $ | 0.72 | $ 100.3 million | 1,143,340 | $ 6.4 million | ||||||||||||
| Date Declared | Record Date | Payment Date | Amount per Share | Cash Distribution | DRIP Shares Issued | DRIP Shares Value (2) | |||||||||||
| July 2, 2014 | October 15, 2014 | October 31, 2014 | $ | 0.0917 | $ 13.3 million | 82,390 | (1) | $ 0.7 million | |||||||||
| July 2, 2014 | November 14, 2014 | November 28, 2014 | 0.0917 | 13.4 million | 80,775 | (1) | 0.7 million | ||||||||||
| November 20, 2014 | December 15, 2014 | December 30, 2014 | 0.0917 | 13.4 million | 79,849 | (1) | 0.6 million | ||||||||||
| November 20, 2014 | January 15, 2015 | January 30, 2015 | 0.0917 | 13.4 million | 79,138 | (1) | 0.6 million | ||||||||||
| February 3, 2015 | March 16, 2015 | March 31, 2015 | 0.06 | 8.8 million | 56,295 | (1) | 0.4 million | ||||||||||
| February 3, 2015 | April 15, 2015 | April 30, 2015 | 0.06 | 8.8 million | 54,818 | (1) | 0.4 million | ||||||||||
| February 3, 2015 | May 15, 2015 | May 29, 2015 | 0.06 | 8.8 million | 60,714 | (1) | 0.4 million | ||||||||||
| February 3, 2015 | June 15, 2015 | June 30, 2015 | 0.06 | 8.8 million | 66,707 | (1) | 0.4 million | ||||||||||
| February 3, 2015 | July 15, 2015 | July 31, 2015 | 0.06 | 8.8 million | 71,412 | (1) | 0.5 million | ||||||||||
| February 3, 2015 | August 14, 2015 | August 31, 2015 | 0.06 | 8.7 million | 69,370 | (1) | 0.5 million | ||||||||||
| August 4, 2015 | September 15, 2015 | September 30, 2015 | 0.06 | 8.5 million | 113,881 | (1) | 0.7 million | ||||||||||
| Total for the year ended September 30, 2015 | $ | 0.79 | $ 114.7 million | 815,349 | $ 6.0 million | ||||||||||||
| Date Declared | Record Date | Payment Date | Amount per Share | Cash Distribution | DRIP Shares Issued | DRIP Shares Value (3) | ||||||||||||||||||||||||||||||||||||||
| October 13, 2021 | December 15, 2021 | December 31, 2021 | $ | 0.155 | $ 27.2 million | 107,971 | (1) | $ 0.8 million | ||||||||||||||||||||||||||||||||||||
| January 28, 2022 | March 15, 2022 | March 31, 2022 | 0.16 | 28.5 million | 104,411 | (1) | 0.8 million | |||||||||||||||||||||||||||||||||||||
| April 29, 2022 | June 15, 2022 | June 30, 2022 | 0.165 | 29.4 million | 131,028 | (2) | 0.9 million | |||||||||||||||||||||||||||||||||||||
| July 29, 2022 | September 15, 2022 | September 30, 2022 | 0.17 | 30.2 million | 153,544 | (2) | 1.0 million | |||||||||||||||||||||||||||||||||||||
| Total for the year ended September 30, 2022 | $ | 0.65 | $ 115.3 million | 496,954 | $ 3.4 million | |||||||||||||||||||||||||||||||||||||||
| Date Declared | Record Date | Payment Date | Amount per Share | Cash Distribution | DRIP Shares Issued | DRIP Shares Value (3) | ||||||||||||||||||||||||||||||||||||||
| November 13, 2020 | December 15, 2020 | December 31, 2020 | $ | 0.11 | $ 15.0 million | 93,964 | (2) | $ 0.5 million | ||||||||||||||||||||||||||||||||||||
| January 29, 2021 | March 15, 2021 | March 31, 2021 | 0.12 | 16.4 million | 81,702 | (2) | 0.5 million | |||||||||||||||||||||||||||||||||||||
| April 30, 2021 | June 15, 2021 | June 30, 2021 | 0.13 | 22.9 million | 76,979 | (2) | 0.5 million | |||||||||||||||||||||||||||||||||||||
| July 30, 2021 | September 15, 2021 | September 30, 2021 | 0.145 | 25.5 million | 85,075 | (2) | 0.6 million | |||||||||||||||||||||||||||||||||||||
| Total for the year ended September 30, 2021 | $ | 0.505 | $ 79.8 million | 337,720 | $ 2.2 million | |||||||||||||||||||||||||||||||||||||||
| Date Declared | Record Date | Payment Date | Amount per Share | Cash Distribution | DRIP Shares Issued | DRIP Shares Value | ||||||||||||||||||||||||||||||||||||||
| November 12, 2019 | December 13, 2019 | December 31, 2019 | $ | 0.095 | $ 12.9 million | 87,747 | (2) | $ 0.5 million | ||||||||||||||||||||||||||||||||||||
| January 31, 2020 | March 13, 2020 | March 31, 2020 | 0.095 | 12.9 million | 157,523 | (2) | 0.5 million | |||||||||||||||||||||||||||||||||||||
| April 30, 2020 | June 15, 2020 | June 30, 2020 | 0.095 | 13.0 million | 87,351 | (2) | 0.4 million | |||||||||||||||||||||||||||||||||||||
| July 31, 2020 | September 15, 2020 | September 30, 2020 | 0.105 | 14.3 million | 102,404 | (2) | 0.5 million | |||||||||||||||||||||||||||||||||||||
| Total for the year ended September 30, 2020 | $ | 0.390 | $ 53.1 million | 435,025 | $ 1.9 million | |||||||||||||||||||||||||||||||||||||||
| Number of Shares Issued | Gross Proceeds | Placement Agent Fees | Net Proceeds (1) | Average Sales Price per Share (2) | ||||||||||||||||||||||||||||
| "At the market" offering | 2,801,206 | $ | 21,049 | $ | 210 | $ | 20,839 | $ | 7.51 | |||||||||||||||||||||||
| As of September 30, 2022 | As of September 30, 2021 | |||||||||||||||||||||||||
| ($ in millions) | 2025 Notes | 2027 Notes | 2025 Notes | 2027 Notes | ||||||||||||||||||||||
| Principal | $ | 300.0 | $ | 350.0 | $ | 300.0 | $ | 350.0 | ||||||||||||||||||
| Unamortized financing costs | (1.8) | (3.2) | (2.6) | (4.0) | ||||||||||||||||||||||
| Unaccreted discount | (1.2) | (0.7) | (1.7) | (0.9) | ||||||||||||||||||||||
| Interest rate swap fair value adjustment | — | (42.0) | — | (2.1) | ||||||||||||||||||||||
| Net carrying value | $ | 297.0 | $ | 304.1 | $ | 295.7 | $ | 343.0 | ||||||||||||||||||
| Fair Value | $ | 283.1 | $ | 294.0 | $ | 314.5 | $ | 351.1 | ||||||||||||||||||
| ($ in millions) | 2025 Notes | 2027 Notes | ||||||||||||
| Coupon interest | $ | 10.5 | $ | 9.5 | ||||||||||
| Amortization of financing costs and discount | 1.3 | 0.9 | ||||||||||||
| Effect of interest rate swap | — | (0.4) | ||||||||||||
| Total interest expense | $ | 11.8 | $ | 10.0 | ||||||||||
| Coupon interest rate (net of effect of interest rate swap for 2027 Notes) | 3.500 | % | 2.585 | % | ||||||||||
| ($ in millions) | 2025 Notes | 2027 Notes | ||||||||||||
| Coupon interest | $ | 10.5 | $ | 3.5 | ||||||||||
| Amortization of financing costs and discount | 1.3 | 0.3 | ||||||||||||
| Effect of interest rate swap | — | (1.1) | ||||||||||||
| Total interest expense | $ | 11.8 | $ | 2.7 | ||||||||||
| Coupon interest rate (net of effect of interest rate swap for 2027 Notes) | 3.500 | % | 1.813 | % | ||||||||||
| ($ in millions) | 2025 Notes | |||||||
| Coupon interest | $ | 6.3 | ||||||
| Amortization of financing costs and discount | 0.7 | |||||||
| Total interest expense | $ | 7.0 | ||||||
| Coupon interest rate | 3.500 | % | ||||||
| Payments due during fiscal years ended September 30, | ||||||||||||||||||||||||||||||||||||||
| Total | 2023 | 2024 | 2025 | 2026 | 2027 and Thereafter | |||||||||||||||||||||||||||||||||
| Syndicated Facility | $ | 540,000 | $ | — | $ | — | $ | — | $ | 540,000 | $ | — | ||||||||||||||||||||||||||
| Citibank Facility | 160,000 | — | — | 160,000 | — | — | ||||||||||||||||||||||||||||||||
| 2025 Notes | 300,000 | — | — | 300,000 | — | — | ||||||||||||||||||||||||||||||||
| 2027 Notes | 350,000 | — | — | — | — | 350,000 | ||||||||||||||||||||||||||||||||
| Total | $ | 1,350,000 | $ | — | $ | — | $ | 460,000 | $ | 540,000 | $ | 350,000 | ||||||||||||||||||||||||||
| Payments due during fiscal years ended September 30, | ||||||||||||||||||||||||
| Debt Obligations | Total | 2018 | 2019 | 2020 | 2021 | 2022 and Thereafter | ||||||||||||||||||
| ING facility | $ | 226,495 | $ | 226,495 | $ | — | $ | — | $ | — | $ | — | ||||||||||||
| Sumitomo facility | 29,500 | 29,500 | — | — | — | — | ||||||||||||||||||
| Secured borrowings | 13,489 | — | — | — | 13,489 | — | ||||||||||||||||||
| 2019 Notes | 250,000 | — | 250,000 | — | — | — | ||||||||||||||||||
| 2024 Notes | 75,000 | — | — | — | — | 75,000 | ||||||||||||||||||
| 2028 Notes | 86,250 | — | — | — | — | 86,250 | ||||||||||||||||||
| Total | $ | 680,734 | $ | 255,995 | $ | 250,000 | $ | — | $ | 13,489 | $ | 161,250 | ||||||||||||
| Year ended September 30, 2017 | Year ended September 30, 2016 | Year ended September 30, 2015 | ||||||||||
| PIK balance at beginning of period | $ | 62,631 | $ | 50,678 | $ | 39,686 | ||||||
| Gross PIK interest accrued | 18,894 | 20,795 | 21,812 | |||||||||
| PIK income reserves (1) | (7,801 | ) | (6,767 | ) | (8,423 | ) | ||||||
| PIK interest received in cash | (4,307 | ) | (2,076 | ) | (2,397 | ) | ||||||
| PIK balance at end of period | $ | 69,417 | $ | 62,630 | $ | 50,678 | ||||||
| September 30, 2017 | September 30, 2016 | September 30, 2015 | ||||||||||||||||||||||||||||||||||||||||
| Cost | % of Debt Portfolio | Fair Value | % of Debt Portfolio | Cost | % of Debt Portfolio | Fair Value | % of Debt Portfolio | Cost | % of Debt Portfolio | Fair Value | % of Debt Portfolio | |||||||||||||||||||||||||||||||
| Accrual | $ | 1,299,793 | 83.59 | % | $ | 1,357,794 | 95.29 | % | $ | 1,890,606 | 89.80 | % | $ | 1,854,228 | 93.89 | % | $ | 2,226,334 | 95.08 | % | $ | 2,206,418 | 97.97 | % | ||||||||||||||||||
| PIK non-accrual (1) | 10,227 | 0.66 | 379 | 0.03 | 40,187 | 1.91 | 31,548 | 1.60 | 66,579 | 2.84 | 28,145 | 1.25 | ||||||||||||||||||||||||||||||
| Cash non-accrual (2) | 244,952 | 15.75 | 66,636 | 4.68 | 174,629 | 8.29 | 89,036 | 4.51 | 48,694 | 2.08 | 17,600 | 0.78 | ||||||||||||||||||||||||||||||
| Total | $ | 1,554,972 | 100.00 | % | $ | 1,424,809 | 100.00 | % | $ | 2,105,422 | 100.00 | % | $ | 1,974,812 | 100.00 | % | $ | 2,341,607 | 100.00 | % | $ | 2,252,163 | 100.00 | % | ||||||||||||||||||
| Year ended September 30, 2017 | Year ended September 30, 2016 | Year ended September 30, 2015 | ||||||||||
| Cash interest income | $ | 18,327 | $ | 13,737 | $ | 5,179 | ||||||
| PIK interest income | 7,801 | 7,225 | 8,423 | |||||||||
| OID income | 154 | 27,886 | 4,627 | |||||||||
| Total | $ | 26,282 | $ | 48,848 | $ | 18,229 | ||||||
| Year ended September 30, 2022 | Year ended September 30, 2021 | Year ended September 30, 2020 | ||||||||||||||||||
| Net increase (decrease) in net assets resulting from operations | $ | 29,223 | $ | 237,260 | $ | 39,224 | ||||||||||||||
| Net unrealized (appreciation) depreciation | 136,248 | (114,519) | 20,614 | |||||||||||||||||
| Book/tax difference due to organizational costs | (87) | (87) | (87) | |||||||||||||||||
| Book/tax difference due to interest income on certain loans | — | — | 1,214 | |||||||||||||||||
| Book/tax difference due to capital losses utilized | (16,490) | (41,625) | (545) | |||||||||||||||||
| Other book/tax differences | (6,506) | 11,863 | (6,058) | |||||||||||||||||
| Taxable/Distributable Income (1) | $ | 142,388 | $ | 92,892 | $ | 54,362 | ||||||||||||||
| Year ended September 30, 2017 | Year ended September 30, 2016 | |||||||
| Net decrease in net assets resulting from operations | $ | (196,969 | ) | $ | (66,556 | ) | ||
| Net unrealized depreciation on investments and secured borrowings | 97,839 | 48,000 | ||||||
| Book/tax difference due to loan fees | (188 | ) | (377 | ) | ||||
| Book/tax difference due to exit fees | 1,081 | 60 | ||||||
| Book/tax difference due to organizational and deferred offering costs | (87 | ) | (87 | ) | ||||
| Book/tax difference due to interest income on certain loans | 23,748 | 1,458 | ||||||
| Book/tax difference due to capital losses not recognized | 171,782 | 125,283 | ||||||
| Other book/tax differences | (7,348 | ) | (8,362 | ) | ||||
| Taxable/Distributable Income(1) | $ | 89,858 | $ | 99,419 | ||||
| Undistributed ordinary income, net | $ | 24,409 | |
| Net realized capital losses | 465,077 | ||
| Unrealized losses, net | 97,839 | ||
| Undistributed ordinary income, net | $ | (43,624) | |||
| Net realized capital losses | 473,274 | ||||
| Unrealized losses, net | 153,119 | ||||
| Accumulated overdistributed earnings | $ | 582,769 | |||
| ($ in millions) | |||||
| Portfolio Company | Net Realized Gain (Loss) | ||||
| Foreign currency forward contracts | $ | 13.7 | |||
| OmniSYS Acquisition Corporation | 2.2 | ||||
| First Star Speir Aviation Limited | 1.9 | ||||
| TigerConnect Inc. | 1.8 | ||||
| WP CPP Holdings, LLC | (1.7) | ||||
| Other, net | (0.7) | ||||
| Total, net | $ | 17.2 | |||
| ($ in millions) | |||||
| Portfolio Company | Net Realized Gain (Loss) | ||||
| PLATO Learning Inc. | $ | 7.8 | |||
| Keypath Education Holdings, LLC | 6.8 | ||||
| L Squared Capital Partners LLC | 3.4 | ||||
| LTI Holdings, Inc. | 2.6 | ||||
| BX Commercial Mortgage Trust 2020-VIVA | 2.6 | ||||
| California Pizza Kitchen Inc. | (1.8) | ||||
| Refac Optical Group | (1.3) | ||||
| Other, net | 6.3 | ||||
| Total, net | $ | 26.4 | |||
| ($ in millions) | |||||
| Portfolio Company | Net Realized Gain (Loss) | ||||
| Cenegenics, LLC | $ | (29.2) | |||
| Dominion Diagnostics, LLC | (15.6) | ||||
| Thruline Marketing Inc. | (4.9) | ||||
| Covia Holdings Corporation | (3.3) | ||||
| YETI Holdings, Inc. | 17.6 | ||||
| Sorrento Therapeutics, Inc. | 11.5 | ||||
| Lytx Holdings, LLC | 5.2 | ||||
| Goodrx Holdings Inc. | 2.1 | ||||
| HealthEdge Software, Inc. | 1.8 | ||||
| Other, net | 0.9 | ||||
| Total, net | $ | (13.9) | |||
| Year ended September 30, 2017 | Year ended September 30, 2016 | Year ended September 30, 2015 | Year ended September 30, 2014 | Year ended September 30, 2013 | ||||||
| Net asset value at beginning of period | $7.97 | $9.00 | $9.64 | $9.85 | $9.92 | |||||
| Net investment income (4) | 0.51 | 0.72 | 0.75 | 1.00 | 1.04 | |||||
| Net unrealized appreciation (depreciation) on investments and secured borrowings (4) | (0.69) | (0.33) | (0.46) | (0.23) | 0.12 | |||||
| Net realized gain (loss) on investments and secured borrowings (4) | (1.21) | (0.84) | (0.19) | 0.02 | (0.24) | |||||
| Distributions to stockholders (4) | (0.47) | (0.67) | (0.79) | (0.94) | (0.90) | |||||
| Tax return of capital (4) | — | (0.05) | — | (0.06) | (0.25) | |||||
| Net issuance/repurchases of common stock (4) | 0.05 | 0.14 | 0.05 | — | 0.16 | |||||
| Net asset value at end of period | $6.16 | $7.97 | $9.00 | $9.64 | $9.85 | |||||
| Per share market value at beginning of period | $5.81 | $6.17 | $9.18 | $10.29 | $10.98 | |||||
| Per share market value at end of period | $5.47 | $5.81 | $6.17 | $9.18 | $10.29 | |||||
| Total return (1) | 2.84% | 7.02% | (27.18)% | (0.97)% | 4.89% | |||||
| Common shares outstanding at beginning of period | 143,259 | 150,263 | 153,340 | 139,041 | 91,048 | |||||
| Common shares outstanding at end of period | 140,961 | 143,259 | 150,263 | 153,340 | 139,041 | |||||
| Net assets at beginning of period | $1,142,288 | $1,353,094 | $1,478,475 | $1,368,872 | $903,570 | |||||
| Net assets at end of period | $867,657 | $1,142,288 | $1,353,094 | $1,478,475 | $1,368,872 | |||||
| Average net assets (2) | $1,018,498 | $1,229,639 | $1,413,357 | $1,393,635 | $1,095,225 | |||||
| Ratio of net investment income to average net assets | 7.13% | 8.68% | 8.13% | 10.23% | 10.50% | |||||
| Ratio of total expenses to average net assets (excluding base management fee waiver and insurance recovery) | 10.49% | 13.09% | 10.69% | 10.91% | 9.95% | |||||
| Effect of base management fee waiver | (0.02)% | (0.03)% | (0.04)% | (0.05)% | (0.21)% | |||||
| Effect of insurance recoveries | (0.12)% | (1.58)% | — | — | — | |||||
| Ratio of net expenses to average net assets | 10.35% | 11.48% | 10.65% | 10.86% | 9.74% | |||||
| Ratio of portfolio turnover to average investments at fair value | 39.06% | 23.39% | 23.02% | 25.50% | 38.22% | |||||
| Weighted average outstanding debt (3) | $982,372 | $1,190,105 | $1,228,413 | $1,110,021 | $597,596 | |||||
| Average debt per share (4) | $6.95 | $8.07 | $8.02 | $7.82 | $5.42 | |||||
| September 30, 2017 | September 30, 2016 | |||||||
| Lift Brands Holdings, Inc. | $ | 15,000 | $ | 13,000 | ||||
| P2 Upstream Acquisition Co. | 10,000 | 10,000 | ||||||
| Valet Merger Sub, Inc. | 9,326 | 5,596 | ||||||
| Edge Fitness, LLC | 8,353 | 8,353 | ||||||
| InMotion Entertainment Group, LLC | 7,544 | 6,856 | ||||||
| BeyondTrust Software, Inc. | 5,995 | 5,995 | ||||||
| EOS Fitness Opco Holdings, LLC | 5,000 | 5,000 | ||||||
| Dominion Diagnostics, LLC (1)(2) | 4,180 | — | ||||||
| Impact Sales, LLC | 3,234 | — | ||||||
| Systems, Inc. | 3,030 | — | ||||||
| Thing5, LLC | 3,000 | 5,000 | ||||||
| WeddingWire, Inc. | 3,000 | 3,000 | ||||||
| Keypath Education, Inc. | 3,000 | — | ||||||
| Traffic Solutions Holdings, Inc. | 2,998 | 2,682 | ||||||
| Motion Recruitment Partners LLC | 2,900 | 2,900 | ||||||
| Pingora MSR Opportunity Fund I, LP (limited partnership interest) | 2,760 | 2,054 | ||||||
| Edmentum, Inc.(1) | 2,664 | 2,664 | ||||||
| OmniSYS Acquisition Corporation | 2,500 | 2,500 | ||||||
| Ping Identity Corporation | 2,500 | 2,500 | ||||||
| 4 Over International, LLC | 2,232 | 2,232 | ||||||
| New IPT, Inc. | 2,229 | — | ||||||
| Refac Optical Group | 2,080 | 6,400 | ||||||
| SPC Partners VI, L.P. (limited partnership interest) | 2,000 | — | ||||||
| Ministry Brands, LLC | 1,708 | 15,000 | ||||||
| Sailpoint Technologies, Inc. | 1,500 | — | ||||||
| Metamorph US 3, LLC (1) | 1,470 | 3,675 | ||||||
| Senior Loan Fund JV 1, LLC | 1,328 | 14,065 | ||||||
| TransTrade Operators, Inc. (1)(3) | 1,052 | 424 | ||||||
| Webster Capital III, L.P. (limited partnership) | 736 | 1,013 | ||||||
| Riverside Fund V, LP (limited partnership interest) | 539 | 853 | ||||||
| Garretson Firm Resolution Group, Inc. | 508 | 1,066 | ||||||
| Sterling Capital Partners IV, L.P. (limited partnership interest) | 490 | 485 | ||||||
| Beecken Petty O'Keefe Fund IV, L.P. (limited partnership interest) | 472 | 813 | ||||||
| Tailwind Capital Partners II, L.P. (limited partnership interest) | 391 | 1,005 | ||||||
| Moelis Capital Partners Opportunity Fund I-B, L.P. (limited partnership interest) | 365 | 476 | ||||||
| RCP Direct II, LP (limited partnership interest) | 364 | 654 | ||||||
| Cenegenics, LLC (1)(3) | 297 | 1,001 | ||||||
| Riverside Fund IV, LP (limited partnership interest) | 254 | 544 | ||||||
| ACON Equity Partners III, LP (limited partnership interest) | 239 | 204 | ||||||
| RCP Direct, LP (limited partnership interest) | 184 | 236 | ||||||
| Bunker Hill Capital II (QP), LP (limited partnership interest) | 183 | 190 | ||||||
| Milestone Partners IV, LP (limited partnership interest) | 180 | 261 | ||||||
| SPC Partners V, L.P. (limited partnership interest) | 159 | 602 | ||||||
| Riverlake Equity Partners II, LP (limited partnership interest) | 129 | 177 | ||||||
| L Squared Capital Partners (limited partnership interest) | — | 308 | ||||||
| Legalzoom.com, Inc. | — | 15,427 | ||||||
| TigerText, Inc. | — | 10,000 | ||||||
| RP Crown Parent, LLC | — | 9,414 | ||||||
| TIBCO Software, Inc. | — | 5,800 | ||||||
| Integrated Petroleum Technologies, Inc. | — | 5,397 | ||||||
| Trialcard Incorporated | — | 4,900 | ||||||
| Adventure Interactive, Corp. (2) | — | 4,846 | ||||||
| Baart Programs, Inc. | — | 4,762 | ||||||
| Discovery Practice Management, Inc. | — | 3,958 | ||||||
| OBHG Management Services, LLC | — | 3,836 | ||||||
| First American Payment Systems, LP | — | 3,000 | ||||||
| My Alarm Center, LLC | — | 2,940 | ||||||
| Eagle Hospital Physicians, Inc. | — | 2,753 | ||||||
| HealthDrive Corporation | — | 2,534 | ||||||
| Teaching Strategies, LLC | — | 2,400 | ||||||
| ExamSoft Worldwide, Inc. | — | 2,000 | ||||||
| Accruent, LLC | — | 1,900 | ||||||
| Total | $ | 118,073 | $ | 215,651 | ||||
| For the three months ended | ||||||||||||||||||||||||||||||||||||
(dollars in thousands, except per share amounts) | September 30, 2017 | June 30, 2017 | March 31, 2017 | December 31, 2016 | September 30, 2016 | June 30, 2016 | March 31, 2016 | December 31, 2015 | September 30, 2015 | June 30, 2015 | March 31, 2015 | December 31, 2014 | ||||||||||||||||||||||||
| Total investment income | $ | 35,732 | $ | 44,917 | $ | 45,555 | $ | 51,760 | $ | 59,160 | $ | 64,026 | $ | 59,563 | $ | 65,122 | $ | 63,770 | $ | 69,900 | $ | 66,467 | $ | 65,338 | ||||||||||||
| Net investment income | 11,464 | 19,390 | 18,504 | 23,294 | 25,695 | 29,106 | 25,343 | 26,582 | 28,159 | 32,251 | 28,123 | 26,407 | ||||||||||||||||||||||||
| Net realized and unrealized loss | (136,935 | ) | (25,447 | ) | (9,703 | ) | (97,536 | ) | (29,128 | ) | (34,324 | ) | (20,363 | ) | (89,468 | ) | (30,548 | ) | (11,740 | ) | (2,380 | ) | (54,877 | ) | ||||||||||||
| Net increase (decrease) in net assets resulting from operations | (125,471 | ) | (6,057 | ) | 8,801 | (74,242 | ) | (3,433 | ) | (5,218 | ) | 4,980 | (62,886 | ) | (2,389 | ) | 20,511 | 25,743 | (28,470 | ) | ||||||||||||||||
| Net assets | 867,657 | 1,010,750 | 1,019,626 | 1,030,272 | 1,142,288 | 1,184,376 | 1,225,974 | 1,263,113 | 1,353,094 | 1,403,213 | 1,410,302 | 1,407,822 | ||||||||||||||||||||||||
| Total investment income per common share | $ | 0.25 | $ | 0.32 | $ | 0.32 | $ | 0.36 | $ | 0.41 | $ | 0.44 | $ | 0.40 | $ | 0.43 | $ | 0.42 | $ | 0.46 | $ | 0.43 | $ | 0.43 | ||||||||||||
| Net investment income per common share | 0.08 | 0.14 | 0.13 | 0.16 | 0.18 | 0.20 | 0.17 | 0.18 | 0.18 | 0.21 | 0.18 | 0.17 | ||||||||||||||||||||||||
| Earnings (losses) per common share | (0.89 | ) | (0.04 | ) | 0.06 | (0.52 | ) | (0.02 | ) | (0.04 | ) | 0.03 | (0.42 | ) | (0.02 | ) | 0.13 | 0.17 | (0.19 | ) | ||||||||||||||||
| Net asset value per common share at period end | 6.16 | 7.17 | 7.23 | 7.31 | 7.97 | 8.15 | 8.33 | 8.41 | 9.00 | 9.15 | 9.20 | 9.18 | ||||||||||||||||||||||||
| (Share amounts in thousands) | Year ended September 30, 2022 | Year ended September 30, 2021 | Year ended September 30, 2020 | Year ended September 30, 2019 | Year ended September 30, 2018 (1) | |||||||||||||||||||||||||||
| Net asset value per share at beginning of period | $7.28 | $6.49 | $6.60 | $6.09 | $6.16 | |||||||||||||||||||||||||||
| Net investment income (2) | 0.82 | 0.60 | 0.51 | 0.48 | 0.43 | |||||||||||||||||||||||||||
| Net unrealized appreciation (depreciation) (2)(5) | (0.75) | 0.73 | (0.14) | 0.27 | 0.73 | |||||||||||||||||||||||||||
| Net realized gains (losses) (2) | 0.09 | 0.16 | (0.10) | 0.14 | (0.83) | |||||||||||||||||||||||||||
| (Provision) benefit for taxes on realized and unrealized gains (losses) (2) | — | — | 0.01 | — | — | |||||||||||||||||||||||||||
| Distributions of net investment income to stockholders | (0.65) | (0.51) | (0.39) | (0.38) | (0.27) | |||||||||||||||||||||||||||
| Tax return of capital | — | — | — | — | (0.13) | |||||||||||||||||||||||||||
| Issuance of common stock | — | (0.19) | — | — | — | |||||||||||||||||||||||||||
| Net asset value per share at end of period | $6.79 | $7.28 | $6.49 | $6.60 | $6.09 | |||||||||||||||||||||||||||
| Per share market value at beginning of period | $7.06 | $4.84 | $5.18 | $4.96 | $5.47 | |||||||||||||||||||||||||||
| Per share market value at end of period | $6.00 | $7.06 | $4.84 | $5.18 | $4.96 | |||||||||||||||||||||||||||
| Total return (3) | (6.71)% | 57.61% | 2.10% | 12.56% | (1.49)% | |||||||||||||||||||||||||||
| Common shares outstanding at beginning of period | 180,361 | 140,961 | 140,961 | 140,961 | 140,961 | |||||||||||||||||||||||||||
| Common shares outstanding at end of period | 183,374 | 180,361 | 140,961 | 140,961 | 140,961 | |||||||||||||||||||||||||||
| Net assets at beginning of period | $1,312,823 | $914,879 | $930,630 | $858,035 | $867,657 | |||||||||||||||||||||||||||
| Net assets at end of period | $1,245,563 | $1,312,823 | $914,879 | $930,630 | $858,035 | |||||||||||||||||||||||||||
| Average net assets (4) | $1,308,518 | $1,150,662 | $871,305 | $909,264 | $841,583 | |||||||||||||||||||||||||||
| Ratio of net investment income to average net assets (4) | 11.36% | 8.44% | 8.26% | 7.47% | 7.13% | |||||||||||||||||||||||||||
| Ratio of total expenses to average net assets (4) | 8.68% | 9.65% | 7.57% | 9.65% | 9.51% | |||||||||||||||||||||||||||
| Ratio of net expenses to average net assets (4) | 8.45% | 9.51% | 8.16% | 8.78% | 9.35% | |||||||||||||||||||||||||||
| Ratio of portfolio turnover to average investments at fair value | 26.99% | 39.66% | 38.99% | 32.50% | 67.66% | |||||||||||||||||||||||||||
| Weighted average outstanding debt (6) | $1,361,151 | $964,390 | $647,080 | $573,891 | $608,553 | |||||||||||||||||||||||||||
| Average debt per share (2) | $7.47 | $5.95 | $4.59 | $4.07 | $4.32 | |||||||||||||||||||||||||||
| Asset coverage ratio at end of period (7) | 188.64% | 201.68% | 227.22% | 294.91% | 232.98% | |||||||||||||||||||||||||||
| (1) | Beginning on October 17, 2017, the Company is externally managed by Oaktree or its affiliates. Prior to October 17, 2017, the Company was externally managed by the Former Adviser. | ||||
| (2) | Calculated based upon weighted average shares outstanding for the period. | ||||
| (3) | Total return equals the increase or decrease of ending market value over beginning market value, plus distributions, divided by the beginning market value, assuming dividend reinvestment prices obtained under the Company's DRIP. Total return does not include sales load. | ||||
| (4) | Calculated based upon the weighted average net assets for the period. | ||||
| (5) | For the year ended September 30, 2021, the amount shown for net unrealized appreciation (depreciation) includes the effect of the timing of common stock issuances in connection with the OCSI Merger. | ||||
| (6) | Calculated based upon the weighted average of principal debt outstanding for the period. | ||||
| (7) | Based on outstanding senior securities of $1,350.0 million, $1,280.0 million, $714.8 million, $476.1 million and $643.4 million as of September 30, 2022, 2021, 2020, 2019 and 2018, respectively. | ||||
| Class and Year(1) | Total Amount Outstanding Exclusive of Treasury Securities (2) | Asset Coverage Per Unit(3) | Involuntary Liquidating Preference Per Unit(4) | Average Market Value Per Unit(5) | ||||||||||
| Syndicated Facility and Prior ING Facility | ||||||||||||||
| Fiscal 2013 | $ | 168,000 | 3,949 | — | N/A | |||||||||
| Fiscal 2014 | 267,395 | 2,595 | — | N/A | ||||||||||
| Fiscal 2015 | 383,495 | 2,389 | — | N/A | ||||||||||
| Fiscal 2016 | 472,495 | 2,208 | — | N/A | ||||||||||
| Fiscal 2017 | 226,495 | 2,274 | — | N/A | ||||||||||
| Fiscal 2018 | 241,000 | 2,330 | — | N/A | ||||||||||
| Fiscal 2019 | 314,825 | 2,949 | — | N/A | ||||||||||
| Fiscal 2020 | 414,825 | 2,272 | — | N/A | ||||||||||
| Fiscal 2021 | 495,000 | 2,017 | — | N/A | ||||||||||
| Fiscal 2022 | 540,000 | 1,886 | — | N/A | ||||||||||
| Citibank Facility | ||||||||||||||
| Fiscal 2021 | $ | 135,000 | 2,017 | — | N/A | |||||||||
| Fiscal 2022 | 160,000 | 1,886 | — | N/A | ||||||||||
| Wells Fargo Facility | ||||||||||||||
| Fiscal 2013 | $ | 20,000 | 3,949 | — | N/A | |||||||||
| Sumitomo Facility | ||||||||||||||
| Fiscal 2013 | $ | — | 3,949 | — | N/A | |||||||||
| Fiscal 2014 | 50,000 | 2,595 | — | N/A | ||||||||||
| Fiscal 2015 | 43,800 | 2,389 | — | N/A | ||||||||||
| Fiscal 2016 | 43,800 | 2,208 | — | N/A | ||||||||||
| Fiscal 2017 | 29,500 | 2,274 | — | N/A | ||||||||||
| Convertible Notes | ||||||||||||||
| Fiscal 2013 | $ | 115,000 | 3,949 | — | N/A | |||||||||
| Fiscal 2014 | 115,000 | 2,595 | — | N/A | ||||||||||
| Fiscal 2015 | 115,000 | 2,389 | — | N/A | ||||||||||
| Secured Borrowings | ||||||||||||||
| Fiscal 2014 | $ | 84,750 | 2,595 | — | N/A | |||||||||
| Fiscal 2015 | 21,787 | 2,389 | — | N/A | ||||||||||
| Fiscal 2016 | 18,929 | 2,208 | — | N/A | ||||||||||
| Fiscal 2017 | 13,489 | 2,274 | — | N/A | ||||||||||
| Fiscal 2018 | 12,314 | 2,330 | — | N/A | ||||||||||
| Class and Year(1) | Total Amount Outstanding Exclusive of Treasury Securities (2) | Asset Coverage Per Unit(3) | Involuntary Liquidating Preference Per Unit(4) | Average Market Value Per Unit(5) | ||||||||||
| 2019 Notes | ||||||||||||||
| Fiscal 2014 | $ | 250,000 | 2,595 | — | N/A | |||||||||
| Fiscal 2015 | 250,000 | 2,389 | — | N/A | ||||||||||
| Fiscal 2016 | 250,000 | 2,208 | — | N/A | ||||||||||
| Fiscal 2017 | 250,000 | 2,274 | — | N/A | ||||||||||
| Fiscal 2018 | 228,825 | 2,330 | — | N/A | ||||||||||
| 2024 Notes | ||||||||||||||
| Fiscal 2013 | $ | 75,000 | 3,949 | — | 979.45 | |||||||||
| Fiscal 2014 | 75,000 | 2,595 | — | 966.96 | ||||||||||
| Fiscal 2015 | 75,000 | 2,389 | — | 991.94 | ||||||||||
| Fiscal 2016 | 75,000 | 2,208 | — | 993.70 | ||||||||||
| Fiscal 2017 | 75,000 | 2,274 | — | 1,006.74 | ||||||||||
| Fiscal 2018 | 75,000 | 2,330 | — | 1,010.72 | ||||||||||
| Fiscal 2019 | 75,000 | 2,949 | — | 1,012.76 | ||||||||||
| 2025 Notes | ||||||||||||||
| Fiscal 2020 | $ | 300,000 | 2,272 | — | N/A | |||||||||
| Fiscal 2021 | 300,000 | 2,017 | — | N/A | ||||||||||
| Fiscal 2022 | 300,000 | 1,886 | — | N/A | ||||||||||
| 2027 Notes | ||||||||||||||
| Fiscal 2021 | $ | 350,000 | 2,017 | — | N/A | |||||||||
| Fiscal 2022 | 350,000 | 1,886 | — | N/A | ||||||||||
| 2028 Notes | ||||||||||||||
| Fiscal 2013 | $ | 86,250 | 3,949 | — | 957.21 | |||||||||
| Fiscal 2014 | 86,250 | 2,595 | — | 943.73 | ||||||||||
| Fiscal 2015 | 86,250 | 2,389 | — | 988.06 | ||||||||||
| Fiscal 2016 | 86,250 | 2,208 | — | 999.29 | ||||||||||
| Fiscal 2017 | 86,250 | 2,274 | — | 1,007.51 | ||||||||||
| Fiscal 2018 | 86,250 | 2,330 | — | 994.82 | ||||||||||
| Fiscal 2019 | 86,250 | 2,949 | — | 993.33 | ||||||||||
| Total Senior Securities | ||||||||||||||
| Fiscal 2013 | $ | 464,250 | 3,949 | — | ||||||||||
| Fiscal 2014 | 928,395 | 2,595 | — | |||||||||||
| Fiscal 2015 | 975,332 | 2,389 | — | |||||||||||
| Fiscal 2016 | 946,474 | 2,208 | — | |||||||||||
| Fiscal 2017 | 680,734 | 2,274 | — | |||||||||||
| Fiscal 2018 | 643,389 | 2,330 | — | |||||||||||
| Fiscal 2019 | 476,075 | 2,949 | — | |||||||||||
| Fiscal 2020 | 714,825 | 2,272 | — | |||||||||||
| Fiscal 2021 | 1,280,000 | 2,017 | — | |||||||||||
| Fiscal 2022 | 1,350,000 | 1,886 | — | |||||||||||
| Description | Notional Amount to be Purchased | Notional Amount to be Sold | Maturity Date | Gross Amount of Recognized Assets | Gross Amount of Recognized Liabilities | Balance Sheet Location of Net Amounts | ||||||||||||||||||||||||||||||||
| Foreign currency forward contract | $ | 43,179 | € | 41,444 | 11/10/2022 | $ | 2,466 | $ | — | Derivative asset | ||||||||||||||||||||||||||||
| Foreign currency forward contract | $ | 45,692 | £ | 37,033 | 11/10/2022 | $ | 4,323 | $ | — | Derivative asset | ||||||||||||||||||||||||||||
| $ | 6,789 | $ | — | |||||||||||||||||||||||||||||||||||
| Description | Notional Amount to be Purchased | Notional Amount to be Sold | Maturity Date | Gross Amount of Recognized Assets | Gross Amount of Recognized Liabilities | Balance Sheet Location of Net Amounts | ||||||||||||||||||||||||||||||||
| Foreign currency forward contract | $ | 52,186 | £ | 37,709 | 11/12/2021 | $ | 1,339 | $ | — | Derivative asset | ||||||||||||||||||||||||||||
| Foreign currency forward contract | $ | 46,663 | € | 39,736 | 11/12/2021 | $ | 573 | $ | — | Derivative asset | ||||||||||||||||||||||||||||
| $ | 1,912 | $ | — | |||||||||||||||||||||||||||||||||||
| Description | Notional Amount | Maturity Date | Gross Amount of Recognized Assets | Gross Amount of Recognized Liabilities | Balance Sheet Location of Net Amounts | |||||||||||||||||||||||||||
| Interest rate swap | $ | 350,000 | 1/15/2027 | $ | — | $ | 41,969 | Derivative liability | ||||||||||||||||||||||||
| $ | — | $ | 41,969 | |||||||||||||||||||||||||||||
| Description | Notional Amount | Maturity Date | Gross Amount of Recognized Assets | Gross Amount of Recognized Liabilities | Balance Sheet Location of Net Amounts | |||||||||||||||||||||||||||
| Interest rate swap | $ | 350,000 | 1/15/2027 | $ | — | $ | 2,108 | Derivative liability | ||||||||||||||||||||||||
| $ | — | $ | 2,108 | |||||||||||||||||||||||||||||
| September 30, 2022 | September 30, 2021 | |||||||||||||
| Senior Loan Fund JV I, LLC | $ | 35,000 | $ | 35,000 | ||||||||||
| Delta Leasing SPV II LLC | 27,187 | — | ||||||||||||
| Fairbridge Strategic Capital Funding LLC | 22,150 | — | ||||||||||||
| OCSI Glick JV LLC | 13,998 | 13,998 | ||||||||||||
| BioXcel Therapeutics, Inc. | 11,785 | — | ||||||||||||
| Dominion Diagnostics, LLC | 11,148 | 11,148 | ||||||||||||
| BAART Programs, Inc. | 8,645 | 3,583 | ||||||||||||
| iCIMs, Inc. | 6,930 | — | ||||||||||||
| Marinus Pharmaceuticals, Inc. | 5,734 | 18,349 | ||||||||||||
| MRI Software LLC | 5,196 | 2,699 | ||||||||||||
| Establishment Labs Holdings Inc. | 5,075 | — | ||||||||||||
| RumbleOn, Inc. | 4,822 | 16,301 | ||||||||||||
| Accupac, Inc. | 4,605 | 3,267 | ||||||||||||
| Ardonagh Midco 3 PLC | 4,372 | 14,892 | ||||||||||||
| Grove Hotel Parcel Owner, LLC | 4,293 | — | ||||||||||||
| Innocoll Pharmaceuticals Limited | 4,195 | — | ||||||||||||
| Mindbody, Inc. | 4,000 | 4,000 | ||||||||||||
| OTG Management, LLC | 3,789 | 3,789 | ||||||||||||
| Mesoblast, Inc. | 3,553 | — | ||||||||||||
| Pluralsight, LLC | 3,532 | 3,532 | ||||||||||||
| Dialyze Holdings, LLC | 3,431 | 3,431 | ||||||||||||
| ADC Therapeutics SA | 3,020 | — | ||||||||||||
| Thrasio, LLC | 2,578 | 2,578 | ||||||||||||
| PRGX Global, Inc. | 2,518 | 2,518 | ||||||||||||
| Spanx, LLC | 2,226 | — | ||||||||||||
| Relativity ODA LLC | 2,218 | 2,218 | ||||||||||||
| Assembled Brands Capital LLC | 2,008 | 24,868 | ||||||||||||
| Tahoe Bidco B.V. | 1,741 | — | ||||||||||||
| Kings Buyer, LLC | 1,537 | — | ||||||||||||
| PFNY Holdings, LLC | 1,527 | — | ||||||||||||
| MHE Intermediate Holdings, LLC | 1,429 | 3,466 | ||||||||||||
| Berner Food & Beverage, LLC | 1,392 | 2,475 | ||||||||||||
| Apptio, Inc. | 1,338 | 1,338 | ||||||||||||
| Coyote Buyer, LLC | 1,333 | 1,333 | ||||||||||||
| Acquia Inc. | 1,326 | 2,061 | ||||||||||||
| Liquid Environmental Solutions Corporation | 1,115 | — | ||||||||||||
| CorEvitas, LLC | 915 | 3,235 | ||||||||||||
| Digital.AI Software Holdings, Inc. | 826 | 898 | ||||||||||||
| Telestream Holdings Corporation | 528 | 1,266 | ||||||||||||
| 109 Montgomery Owner LLC | 477 | 937 | ||||||||||||
| LSL Holdco, LLC | 427 | — | ||||||||||||
| GKD Index Partners, LLC | 320 | 320 | ||||||||||||
| Athenex, Inc. | — | 21,072 | ||||||||||||
| Gulf Operating, LLC | — | 10,064 | ||||||||||||
| Coty Inc. | — | 9,886 | ||||||||||||
| Latam Airlines Group S.A. | — | 7,267 | ||||||||||||
| Sunland Asphalt & Construction, LLC | — | 6,492 | ||||||||||||
| NeuAG, LLC | — | 5,441 | ||||||||||||
| Olaplex, Inc. | — | 4,806 | ||||||||||||
| Pingora MSR Opportunity Fund I-A, LP | — | 3,500 | ||||||||||||
| SIO2 Medical Products, Inc. | — | 3,406 | ||||||||||||
| SumUp Holdings Luxembourg S.À.R.L. | — | 3,350 | ||||||||||||
| 4 Over International, LLC | — | 2,300 | ||||||||||||
| The Avery | — | 1,850 | ||||||||||||
| Ministry Brands, LLC | — | 1,100 | ||||||||||||
| Thermacell Repellents, Inc. | — | 833 | ||||||||||||
| CircusTrix Holdings, LLC | — | 37 | ||||||||||||
| Total | $ | 224,239 | $ | 264,904 | ||||||||||
| Portfolio Company/Type of Investment (1) | Cash Interest Rate | Industry | Principal | Net Realized Gain (Loss) | Net Unrealized Appreciation (Depreciation) | Amount of Interest, Fees or Dividends Credited in Income (2) | Fair Value at October 1, 2016 | Gross Additions (3) | Gross Reductions (4) | Fair Value at September 30, 2017 | % of Total Net Assets | |||||||||||||||||||||||||||||
| Control Investments | ||||||||||||||||||||||||||||||||||||||||
| Traffic Solutions Holdings, Inc. | Construction & engineering | |||||||||||||||||||||||||||||||||||||||
| First Lien Term Loan, LIBOR+7% (1% floor) cash 2% PIK due 4/1/2021 | 8.34 | % | $ | 36,567 | $ | — | $ | (148 | ) | $ | 4,243 | $ | 36,328 | $ | 1,303 | $ | (1,063 | ) | $ | 36,568 | 4.2 | % | ||||||||||||||||||
| First Lien Revolver, LIBOR+6% (1% floor) cash due 4/1/2021 | 7.34 | % | 1,250 | — | — | 122 | 2,800 | 1,261 | (2,811 | ) | 1,250 | 0.1 | % | |||||||||||||||||||||||||||
| LC Facility, 6% cash due 4/1/2021 | 4,752 | — | — | 236 | 3,518 | 1,248 | (14 | ) | 4,752 | 0.5 | % | |||||||||||||||||||||||||||||
| 746,114 Series A Preferred Units, 10% | — | — | (13,864 | ) | 1,471 | 20,094 | 3,201 | (15,595 | ) | 7,700 | 0.9 | % | ||||||||||||||||||||||||||||
| 746,114 Common Stock Units | — | — | — | — | — | 2,284 | (2,284 | ) | — | — | % | |||||||||||||||||||||||||||||
| TransTrade Operators, Inc. (7) | Air freight and logistics | |||||||||||||||||||||||||||||||||||||||
| First Lien Term Loan, 5% cash due 12/31/2017 | 15,973 | — | (5,238 | ) | 8 | 7,046 | 644 | (5,880 | ) | 1,810 | 0.2 | % | ||||||||||||||||||||||||||||
| First Lien Revolver, 8% cash due 12/31/2017 | 7,757 | — | (872 | ) | (4 | ) | — | 2,680 | (2,680 | ) | — | — | % | |||||||||||||||||||||||||||
| 596.67 Series A Common Units | — | — | — | — | — | — | — | — | % | |||||||||||||||||||||||||||||||
| 4,000 Series A Preferred Units in TransTrade Holdings LLC | — | — | — | — | — | — | — | — | % | |||||||||||||||||||||||||||||||
| 5,200,000 Series B Preferred Units in TransTrade Holdings LLC | — | — | — | — | — | — | — | — | % | |||||||||||||||||||||||||||||||
| First Star Aviation, LLC (6) | Airlines | |||||||||||||||||||||||||||||||||||||||
| 10,104,401 Common Units | — | (3,767 | ) | 3,119 | — | 2,413 | 3,120 | (5,533 | ) | — | — | % | ||||||||||||||||||||||||||||
| First Star Speir Aviation Limited (6) | Airlines | |||||||||||||||||||||||||||||||||||||||
| First Lien Term Loan, 9% cash due 12/15/2020 | 41,395 | — | 2,945 | 2,618 | 54,214 | 4,031 | (16,850 | ) | 41,395 | 4.8 | % | |||||||||||||||||||||||||||||
| 100% equity interest | — | — | (7,413 | ) | — | 2,839 | 8,500 | (7,413 | ) | 3,926 | 0.5 | % | ||||||||||||||||||||||||||||
| First Star Bermuda Aviation Limited (6) | Airlines | |||||||||||||||||||||||||||||||||||||||
| First Lien Term Loan, 9% cash 3% PIK due 8/19/2018 | 11,868 | — | 17 | 915 | 11,851 | 179 | (162 | ) | 11,868 | 1.4 | % | |||||||||||||||||||||||||||||
| 100% equity interest | — | — | (2,739 | ) | — | 5,729 | 58 | (3,464 | ) | 2,323 | 0.3 | % | ||||||||||||||||||||||||||||
| Eagle Hospital Physicians, LLC | Healthcare services | |||||||||||||||||||||||||||||||||||||||
| First Lien Term Loan A, 8% PIK due 4/30/2017 | — | (13,812 | ) | 14 | 571 | 13,875 | 1,058 | (14,933 | ) | — | — | % | ||||||||||||||||||||||||||||
| First Lien Term Loan B, 8.1% PIK due 4/30/2017 | — | — | 2 | 81 | 3,887 | 4,189 | (8,076 | ) | — | — | % | |||||||||||||||||||||||||||||
| First Lien Revolver, 8% cash due 4/30/2017 | — | — | — | 156 | 1,913 | 2,257 | (4,170 | ) | — | — | % | |||||||||||||||||||||||||||||
| 4,100,000 Class A Common Units | — | — | (6,185 | ) | — | 7,421 | 4,100 | (11,521 | ) | — | — | % | ||||||||||||||||||||||||||||
| Earn-out | — | — | — | — | — | 7,851 | (2,865 | ) | 4,986 | 0.6 | % | |||||||||||||||||||||||||||||
| Senior Loan Fund JV I, LLC (5) | Multi-sector holdings | |||||||||||||||||||||||||||||||||||||||
| Subordinated Notes, LIBOR+8% cash due 5/2/2021 | — | (19,857 | ) | 15,838 | 2,859 | 129,004 | 16,546 | (145,550 | ) | — | — | % | ||||||||||||||||||||||||||||
| Class A Mezzanine Secured Deferrable Floating Rate Notes due 2036 in SLF Repack Issuer 2016 LLC | 6.88 | % | 101,030 | — | — | 5,225 | — | 101,030 | — | 101,030 | 11.6 | % | ||||||||||||||||||||||||||||
| Class B Mezzanine Secured Deferrable Fixed Rate Notes, 15% PIK due 2036 in SLF Repack Issuer 2016 LLC | 27,641 | — | — | 2,977 | — | 27,641 | — | 27,641 | 3.2 | % | ||||||||||||||||||||||||||||||
| 87.5% LLC equity interest | — | — | (8,263 | ) | 1,050 | 13,708 | 434 | (8,617 | ) | 5,525 | 0.6 | % | ||||||||||||||||||||||||||||
| Portfolio Company/Type of Investment (1) | Cash Interest Rate | Industry | Principal | Net Realized Gain (Loss) | Amount of Interest, Fees or Dividends Credited in Income (2) | Fair Value as of October 1, 2021 | Gross Additions (3) | Gross Reductions (4) | Fair Value as of September 30, 2022 | % of Total Net Assets | ||||||||||||||||||||||||||||||||||||||||||||||||||||
| Control Investments | ||||||||||||||||||||||||||||||||||||||||||||||||||||||||||||||
| C5 Technology Holdings, LLC | Data Processing & Outsourced Services | |||||||||||||||||||||||||||||||||||||||||||||||||||||||||||||
| 829 Common Units | $ | — | $ | — | $ | — | $ | — | $ | — | $ | — | — | % | ||||||||||||||||||||||||||||||||||||||||||||||||
| 34,984,460.37 Preferred Units | — | — | 27,638 | — | — | 27,638 | 2.2 | % | ||||||||||||||||||||||||||||||||||||||||||||||||||||||
| Dominion Diagnostics, LLC | Health Care Services | |||||||||||||||||||||||||||||||||||||||||||||||||||||||||||||
| First Lien Term Loan, LIBOR+5.00% cash due 2/28/2024 | 8.68 | % | $ | 14,333 | — | 1,367 | 27,381 | — | (13,048) | 14,333 | 1.2 | % | ||||||||||||||||||||||||||||||||||||||||||||||||||
| First Lien Revolver, LIBOR+5.00% cash due 2/28/2024 | — | — | 57 | — | — | — | — | — | % | |||||||||||||||||||||||||||||||||||||||||||||||||||||
| 30,030.8 Common Units in DD Healthcare Services Holdings, LLC | — | 3,308 | 18,065 | — | (13,119) | 4,946 | 0.4 | % | ||||||||||||||||||||||||||||||||||||||||||||||||||||||
| First Star Speir Aviation Limited (5) | Airlines | |||||||||||||||||||||||||||||||||||||||||||||||||||||||||||||
| First Lien Term Loan, 9.00% cash due 12/15/2025 | — | 7,500 | — | 7,500 | — | (7,500) | — | — | % | |||||||||||||||||||||||||||||||||||||||||||||||||||||
| 100% equity interest | (5,632) | 158 | 698 | — | (698) | — | — | % | ||||||||||||||||||||||||||||||||||||||||||||||||||||||
| OCSI Glick JV LLC (6) | Multi-Sector Holdings | |||||||||||||||||||||||||||||||||||||||||||||||||||||||||||||
| Subordinated Debt, LIBOR+4.50% cash due 10/20/2028 | 6.30 | % | 59,662 | — | 4,667 | 55,582 | 1,538 | (6,837) | 50,283 | 4.0 | % | |||||||||||||||||||||||||||||||||||||||||||||||||||
| 87.5% equity interest | — | — | — | — | — | — | — | % | ||||||||||||||||||||||||||||||||||||||||||||||||||||||
| Senior Loan Fund JV I, LLC (7) | Multi-Sector Holdings | |||||||||||||||||||||||||||||||||||||||||||||||||||||||||||||
| Subordinated Debt, LIBOR+7.00% cash due 12/29/2028 | 8.80 | % | 96,250 | — | 8,001 | 96,250 | — | — | 96,250 | 7.7 | % | |||||||||||||||||||||||||||||||||||||||||||||||||||
| 87.5% LLC equity interest | — | 2,901 | 37,651 | — | (16,936) | 20,715 | 1.7 | % | ||||||||||||||||||||||||||||||||||||||||||||||||||||||
| Total Control Investments | $ | 170,245 | $ | 1,868 | $ | 20,459 | $ | 270,765 | $ | 1,538 | $ | (58,138) | $ | 214,165 | 17.2 | % | ||||||||||||||||||||||||||||||||||||||||||||||
| Affiliate Investments | ||||||||||||||||||||||||||||||||||||||||||||||||||||||||||||||
| Assembled Brands Capital LLC | Specialized Finance | |||||||||||||||||||||||||||||||||||||||||||||||||||||||||||||
| First Lien Revolver, LIBOR+6.75% cash due 10/17/2023 | 10.42 | % | $ | 24,490 | $ | — | $ | 1,764 | $ | 15,712 | $ | 14,996 | $ | (6,483) | $ | 24,225 | 1.9 | % | ||||||||||||||||||||||||||||||||||||||||||||
| 1,609,201 Class A Units | — | — | 587 | — | (217) | 370 | — | % | ||||||||||||||||||||||||||||||||||||||||||||||||||||||
| 1,019,168.80 Preferred Units, 6% | — | — | 1,152 | 71 | — | 1,223 | 0.1 | % | ||||||||||||||||||||||||||||||||||||||||||||||||||||||
| 70,424.5641 Class A Warrants (exercise price $3.3778) expiration date 9/9/2029 | — | — | — | — | — | — | — | % | ||||||||||||||||||||||||||||||||||||||||||||||||||||||
| Caregiver Services, Inc. | Health Care Services | |||||||||||||||||||||||||||||||||||||||||||||||||||||||||||||
| 1,080,399 shares of Series A Preferred Stock, 10% | — | — | — | 838 | — | (460) | 378 | — | % | |||||||||||||||||||||||||||||||||||||||||||||||||||||
| Total Affiliate Investments | $ | 24,490 | $ | — | $ | 1,764 | $ | 18,289 | $ | 15,067 | $ | (7,160) | $ | 26,196 | 2.1 | % | ||||||||||||||||||||||||||||||||||||||||||||||
| Total Control & Affiliate Investments | $ | 194,735 | $ | 1,868 | $ | 22,223 | $ | 289,054 | $ | 16,605 | $ | (65,298) | $ | 240,361 | 19.3 | % | ||||||||||||||||||||||||||||||||||||||||||||||
| Express Group Holdings LLC (8) | Oil & gas equipment services | |||||||||||||||||||||||||||||||||||||||
| First Lien Term Loan, LIBOR+6% (1% floor) cash due 9/3/2019 | — | (22,312 | ) | 10,880 | (110 | ) | 1,193 | 12,073 | (13,266 | ) | — | — | % | |||||||||||||||||||||||||||
| First Lien Revolver, LIBOR+4.5% (1% floor) cash due 3/4/2019 | — | — | — | (2 | ) | 6,090 | 5,211 | (11,301 | ) | — | — | % | ||||||||||||||||||||||||||||
| Last-In Revolver, PRIME+3.5% (3.5% floor) cash due 10/7/2016 | — | — | — | 106 | 3,000 | — | (3,000 | ) | — | — | % | |||||||||||||||||||||||||||||
| 14,033,391 Series B Preferred Units | — | — | 3,982 | — | — | 3,982 | (3,982 | ) | — | — | % | |||||||||||||||||||||||||||||
| 280,668 Series A Preferred Units | — | — | 1,593 | — | — | 1,593 | (1,593 | ) | — | — | % | |||||||||||||||||||||||||||||
| 1,456,344 Common Units | — | — | — | — | — | — | — | — | — | % | ||||||||||||||||||||||||||||||
| Ameritox Ltd. (7) | Healthcare services | |||||||||||||||||||||||||||||||||||||||
| First Lien Term Loan, LIBOR+5% (1% floor) cash 3% PIK due 4/11/2021 | 6.33 | % | 38,338 | — | (32,905 | ) | 2,428 | 31,039 | 9,151 | (35,745 | ) | 4,445 | 0.5 | % | ||||||||||||||||||||||||||
| 14,090,126.4 Class A Preferred A Units in Ameritox Holdings II, LLC | — | — | (15,437 | ) | — | 15,437 | 1,423 | (16,860 | ) | — | — | % | ||||||||||||||||||||||||||||
| 1,602,260.83 Class B Preferred A Units in Ameritox Holdings II, LLC | — | — | (1,755 | ) | — | 1,755 | 162 | (1,917 | ) | — | — | % | ||||||||||||||||||||||||||||
| 4,930.03 Common Units in Ameritox Holdings II, LLC | — | — | (13,113 | ) | — | 13,113 | — | (13,113 | ) | — | — | % | ||||||||||||||||||||||||||||
| New IPT, Inc. | Oil & gas equipment services | |||||||||||||||||||||||||||||||||||||||
| First Lien Term Loan, LIBOR+5% (1% floor) cash due 3/17/2021 | 6.33 | % | $ | 4,107 | $ | — | $ | — | $ | 140 | $ | — | $ | 4,107 | $ | — | $ | 4,107 | 0.5 | % | ||||||||||||||||||||
| Second Lien Term Loan, LIBOR+5.1% (1% floor) cash due 9/17/2021 | 6.43 | % | 2,504 | — | — | 87 | — | 2,504 | — | 2,504 | 0.3 | % | ||||||||||||||||||||||||||||
| First Lien Revolver, LIBOR+5% (1% floor) cash due 3/17/2021 | 6.33 | % | 1,009 | 26 | — | 39 | — | 1,009 | — | 1,009 | 0.1 | % | ||||||||||||||||||||||||||||
| 50.087 Class A Common Units in New IPT Holdings, LLC | — | — | 736 | — | — | 736 | — | 736 | 0.1 | % | ||||||||||||||||||||||||||||||
| AdVenture Interactive, Corp. | Advertising | |||||||||||||||||||||||||||||||||||||||
| 9,073 shares of common stock | — | — | 207 | — | — | 24,466 | (10,648 | ) | 13,818 | 1.6 | % | |||||||||||||||||||||||||||||
| Keypath Education, Inc. | Advertising | |||||||||||||||||||||||||||||||||||||||
| First Lien Term Loan, LIBOR+7% (1% floor) cash due 4/3/2022 | 8.33 | % | 19,960 | — | — | 835 | — | 19,960 | — | 19,960 | 2.3 | % | ||||||||||||||||||||||||||||
| First Lien Revolver, LIBOR+7% (1% floor) cash due 4/3/2022 | 8.33 | % | — | — | — | 8 | — | — | — | — | — | % | ||||||||||||||||||||||||||||
| 9,073 Class A Units in FS AVI Holdco, LLC | — | — | (2,730 | ) | — | — | 10,648 | (2,730 | ) | 7,918 | 0.9 | % | ||||||||||||||||||||||||||||
| Total Control Investments | $ | 314,151 | $ | (59,722 | ) | $ | (71,329 | ) | $ | 26,059 | $ | 388,267 | $ | 290,640 | $ | (373,636 | ) | $ | 305,271 | 35.2 | % | |||||||||||||||||||
| Affiliate Investments | ||||||||||||||||||||||||||||||||||||||||
| Caregiver Services, Inc. | Healthcare services | |||||||||||||||||||||||||||||||||||||||
| Second Lien Term Loan, 10% cash 2% PIK due 6/30/2019 | 9,719 | — | (81 | ) | 1,170 | 9,549 | 232 | (116 | ) | 9,665 | 1.1 | % | ||||||||||||||||||||||||||||
| 1,080,399 shares of Series A Preferred Stock, 10% | — | — | (1,544 | ) | — | 4,079 | 5 | (1,550 | ) | 2,534 | 0.3 | % | ||||||||||||||||||||||||||||
| AmBath/ReBath Holdings, Inc. | Home improvement retail | |||||||||||||||||||||||||||||||||||||||
| First Lien Term Loan B, 12.5% cash 2.5% PIK due 8/31/2018 | 22,956 | — | 96 | 4,310 | 24,268 | 995 | (2,306 | ) | 22,957 | 2.6 | % | |||||||||||||||||||||||||||||
| 4,668,788 shares of Preferred Stock | — | — | (45 | ) | — | 1,873 | 349 | (395 | ) | 1,827 | 0.2 | % | ||||||||||||||||||||||||||||
| Total Affiliate Investments | $ | 32,675 | $ | — | $ | (1,574 | ) | $ | 5,480 | $ | 39,769 | $ | 1,581 | $ | (4,367 | ) | $ | 36,983 | 4.3 | % | ||||||||||||||||||||
| Total Control & Affiliate Investments | $ | 346,826 | $ | (59,722 | ) | $ | (72,903 | ) | $ | 31,539 | $ | 428,036 | $ | 292,221 | $ | (378,003 | ) | $ | 342,254 | 39.4 | % | |||||||||||||||||||
| Portfolio Company/Type of Investment (1) | Cash Interest Rate | Industry | Principal | Net Realized Gain (Loss) | Amount of Interest, Fees or Dividends Credited in Income (2) | Fair Value as of October 1, 2020 | Gross Additions (3) | Gross Reductions (4) | Fair Value as of September 30, 2021 | % of Total Net Assets | ||||||||||||||||||||||||||||||||||||||||||||||||||||
| Control Investments | ||||||||||||||||||||||||||||||||||||||||||||||||||||||||||||||
| C5 Technology Holdings, LLC | Data Processing & Outsourced Services | |||||||||||||||||||||||||||||||||||||||||||||||||||||||||||||
| 829 Common Units | $ | — | $ | — | $ | — | $ | — | $ | — | $ | — | — | % | ||||||||||||||||||||||||||||||||||||||||||||||||
| 34,984,460.37 Preferred Units | — | — | 27,638 | — | — | 27,638 | 2.1 | % | ||||||||||||||||||||||||||||||||||||||||||||||||||||||
| Dominion Diagnostics, LLC | Health Care Services | |||||||||||||||||||||||||||||||||||||||||||||||||||||||||||||
| First Lien Term Loan, LIBOR+5.00% cash due 2/28/2024 | 6.00 | % | $ | 27,381 | — | 1,726 | 27,660 | — | (279) | 27,381 | 2.1 | % | ||||||||||||||||||||||||||||||||||||||||||||||||||
| First Lien Revolver, LIBOR+5.00% cash due 2/28/2024 | — | — | 275 | 5,260 | 2,439 | (7,699) | — | — | % | |||||||||||||||||||||||||||||||||||||||||||||||||||||
| 30,030.8 Common Units in DD Healthcare Services Holdings, LLC | — | 2,795 | 7,667 | 10,398 | — | 18,065 | 1.4 | % | ||||||||||||||||||||||||||||||||||||||||||||||||||||||
| First Star Speir Aviation Limited (5) | Airlines | |||||||||||||||||||||||||||||||||||||||||||||||||||||||||||||
| First Lien Term Loan, 9.00% cash due 12/15/2025 | 7,500 | — | — | 11,510 | — | (4,010) | 7,500 | 0.6 | % | |||||||||||||||||||||||||||||||||||||||||||||||||||||
| 100% equity interest | — | 763 | 1,622 | 1,244 | (2,168) | 698 | 0.1 | % | ||||||||||||||||||||||||||||||||||||||||||||||||||||||
| New IPT, Inc. | Oil & Gas Equipment & Services | |||||||||||||||||||||||||||||||||||||||||||||||||||||||||||||
| First Lien Term Loan, LIBOR+5.00% cash due 3/17/2021 | — | — | 42 | 1,800 | 504 | (2,304) | — | — | % | |||||||||||||||||||||||||||||||||||||||||||||||||||||
| First Lien Revolver, LIBOR+5.00% cash due 3/17/2021 | — | — | 17 | 788 | 221 | (1,009) | — | — | % | |||||||||||||||||||||||||||||||||||||||||||||||||||||
| 50.087 Class A Common Units in New IPT Holdings, LLC | — | — | — | — | — | — | — | % | ||||||||||||||||||||||||||||||||||||||||||||||||||||||
| OCSI Glick JV LLC (6) | Multi-Sector Holdings | |||||||||||||||||||||||||||||||||||||||||||||||||||||||||||||
| Subordinated Debt, LIBOR+4.50% cash due 10/20/2028 | 4.60 | % | 61,709 | — | 2,401 | — | 56,693 | (1,111) | 55,582 | 4.2 | % | |||||||||||||||||||||||||||||||||||||||||||||||||||
| 87.5% equity interest | — | — | — | — | — | — | — | % | ||||||||||||||||||||||||||||||||||||||||||||||||||||||
| Senior Loan Fund JV I, LLC (7) | Multi-Sector Holdings | |||||||||||||||||||||||||||||||||||||||||||||||||||||||||||||
| Subordinated Debt, LIBOR+7.00% cash due 12/29/2028 | 8.00 | % | 96,250 | — | 7,388 | 96,250 | — | — | 96,250 | 7.3 | % | |||||||||||||||||||||||||||||||||||||||||||||||||||
| 87.5% LLC equity interest | — | 903 | 21,190 | 16,461 | — | 37,651 | 2.9 | % | ||||||||||||||||||||||||||||||||||||||||||||||||||||||
| Total Control Investments | $ | 192,840 | $ | — | $ | 16,310 | $ | 201,385 | $ | 87,960 | $ | (18,580) | $ | 270,765 | 20.6 | % | ||||||||||||||||||||||||||||||||||||||||||||||
| Affiliate Investments | ||||||||||||||||||||||||||||||||||||||||||||||||||||||||||||||
| Assembled Brands Capital LLC | Specialized Finance | |||||||||||||||||||||||||||||||||||||||||||||||||||||||||||||
| First Lien Revolver, LIBOR+6.00% cash due 10/17/2023 | 7.00 | % | $ | 15,899 | $ | — | $ | 736 | $ | 4,194 | $ | 12,435 | $ | (917) | $ | 15,712 | 1.2 | % | ||||||||||||||||||||||||||||||||||||||||||||
| 1,609,201 Class A Units | — | — | 483 | 104 | — | 587 | — | % | ||||||||||||||||||||||||||||||||||||||||||||||||||||||
| 1,019,168.80 Preferred Units, 6% | — | — | 1,091 | 61 | — | 1,152 | 0.1 | % | ||||||||||||||||||||||||||||||||||||||||||||||||||||||
| 70,424.5641 Class A Warrants (exercise price $3.3778) expiration date 9/9/2029 | — | — | — | — | — | — | — | % | ||||||||||||||||||||||||||||||||||||||||||||||||||||||
| Caregiver Services, Inc. | Health Care Services | |||||||||||||||||||||||||||||||||||||||||||||||||||||||||||||
| 1,080,399 shares of Series A Preferred Stock, 10% | — | — | — | 741 | 97 | — | 838 | 0.1 | % | |||||||||||||||||||||||||||||||||||||||||||||||||||||
| Total Affiliate Investments | $ | 15,899 | $ | — | $ | 736 | $ | 6,509 | $ | 12,697 | $ | (917) | $ | 18,289 | 1.4 | % | ||||||||||||||||||||||||||||||||||||||||||||||
| Total Control & Affiliate Investments | $ | 208,739 | $ | — | $ | 17,046 | $ | 207,894 | $ | 100,657 | $ | (19,497) | $ | 289,054 | 22.0 | % | ||||||||||||||||||||||||||||||||||||||||||||||
| Portfolio Company/Type of Investment (1) | Cash Interest Rate | Industry | Principal | Net Realized Gain (Loss) | Net Unrealized Appreciation (Depreciation) | Amount of Interest, Fees or Dividends Credited in Income (2) | Fair Value at October 1, 2015 | Gross Additions (3) | Gross Reductions (4) | Fair Value at September 30, 2016 | % of Total Net Assets | |||||||||||||||||||||||||||||
| Control Investments | ||||||||||||||||||||||||||||||||||||||||
| Traffic Solutions Holdings, Inc. | Construction & engineering | |||||||||||||||||||||||||||||||||||||||
| First Lien Term Loan, LIBOR+7% (1% floor) cash 2% PIK due 4/1/2021 | 8.00 | % | $ | 36,180 | $ | — | $ | 176 | $ | 2,370 | $ | — | $ | 37,244 | $ | (916 | ) | $ | 36,328 | 3.2 | % | |||||||||||||||||||
| Second Lien Term Loan, 12% cash 3% PIK due 12/31/2016 | — | — | 28 | 1,458 | 16,878 | 341 | (17,219 | ) | — | — | % | |||||||||||||||||||||||||||||
| First Lien Revolver, LIBOR+6% (1% floor) cash due 4/1/2021 | 7.34 | % | 2,800 | — | 3 | 145 | — | 2,891 | (91 | ) | 2,800 | 0.2 | % | |||||||||||||||||||||||||||
| LC Facility, 6% cash due 4/1/2021 | 3,518 | — | 2 | 241 | 1,444 | 2,188 | (114 | ) | 3,518 | 0.3 | % | |||||||||||||||||||||||||||||
| 746,114 Series A Preferred Units, 10% | — | — | (1,569 | ) | 2,249 | 19,414 | 4,871 | (4,191 | ) | 20,094 | 1.8 | % | ||||||||||||||||||||||||||||
| 746,114 Common Stock Units | (5,931 | ) | — | 5,930 | — | (5,930 | ) | — | — | % | ||||||||||||||||||||||||||||||
| TransTrade Operators, Inc. | Air freight and logistics | |||||||||||||||||||||||||||||||||||||||
| First Lien Term Loan, 5% cash 3% PIK due 12/31/2017 | 15,973 | — | (1,668 | ) | 836 | 8,713 | 1,137 | (2,804 | ) | 7,046 | 0.6 | % | ||||||||||||||||||||||||||||
| First Lien Revolver, 8% cash due 12/31/2017 | 6,885 | — | (5,590 | ) | 415 | 1,555 | 6,035 | (7,590 | ) | — | — | % | ||||||||||||||||||||||||||||
| 596.67 Series A Common Units in TransTrade Holdings LLC | — | — | — | — | — | — | % | |||||||||||||||||||||||||||||||||
| 4,000,000 Series A Preferred Units in TransTrade Holdings LLC | — | — | — | — | — | — | % | |||||||||||||||||||||||||||||||||
| 5,200,000 Series B Preferred Units in TransTrade Holding LLC | — | — | — | — | — | — | % | |||||||||||||||||||||||||||||||||
| First Star Aviation, LLC (6) | Airlines | |||||||||||||||||||||||||||||||||||||||
| First Lien Term Loan, 9% cash 3% PIK due 1/9/2018 | — | — | 77 | 1,252 | 5,313 | 54 | (5,367 | ) | — | — | % | |||||||||||||||||||||||||||||
| 10,104,401 Common Units | — | — | (2,515 | ) | — | 9,500 | 1,510 | (8,597 | ) | 2,413 | 0.2 | % | ||||||||||||||||||||||||||||
| First Star Speir Aviation Limited (6) | Airlines | |||||||||||||||||||||||||||||||||||||||
| First Lien Term Loan, 9% cash due 12/15/2020 | 55,395 | — | 2,405 | 1,655 | 47,824 | 15,611 | (9,221 | ) | 54,214 | 4.7 | % | |||||||||||||||||||||||||||||
| 100% equity interest | — | — | 874 | — | 1,965 | 2,506 | (1,632 | ) | 2,839 | 0.2 | % | |||||||||||||||||||||||||||||
| First Star Bermuda Aviation Limited (6) | Airlines | |||||||||||||||||||||||||||||||||||||||
| First Lien Term Loan, 9% cash 3% PIK due 8/19/2018 | 11,868 | — | 17 | 1,993 | 24,836 | 869 | (13,854 | ) | 11,851 | 1.0 | % | |||||||||||||||||||||||||||||
| 100% equity interest | — | — | 2,490 | — | 2,773 | 4,558 | (1,602 | ) | 5,729 | 0.5 | % | |||||||||||||||||||||||||||||
| Eagle Hospital Physicians, LLC | Healthcare services | |||||||||||||||||||||||||||||||||||||||
| First Lien Term Loan A, 8% PIK due 4/30/2017 | 13,889 | — | 26 | 1,097 | 13,066 | 1,226 | (417 | ) | 13,875 | 1.2 | % | |||||||||||||||||||||||||||||
| First Lien Term Loan B, 8.1% PIK due 4/30/2017 | 3,889 | — | 6 | 306 | 3,574 | 341 | (28 | ) | 3,887 | 0.3 | % | |||||||||||||||||||||||||||||
| First Lien Revolver, 8% cash due 4/30/2017 | 1,913 | — | — | 204 | 2,847 | 51 | (985 | ) | 1,913 | 0.2 | % | |||||||||||||||||||||||||||||
| 4,100,000 Class A Common Units | — | — | 1,956 | — | 5,464 | 2,561 | (604 | ) | 7,421 | 0.6 | % | |||||||||||||||||||||||||||||
| Senior Loan Fund JV I, LLC (5) | Multi-sector holdings | |||||||||||||||||||||||||||||||||||||||
| Subordinated Notes, LIBOR+8% cash due 5/2/2021 | 8.47 | % | — | — | (14,876 | ) | 11,959 | 128,917 | 14,963 | (14,876 | ) | 129,004 | 11.3 | % | ||||||||||||||||||||||||||
| 87.5% equity interest | — | — | (158 | ) | 5,775 | 12,205 | 7,424 | (5,921 | ) | 13,708 | 1.2 | % | ||||||||||||||||||||||||||||
| Miche Group, LLC | ||||||||||||||||||||||||||||||||||||||||
| First Lien Revolver, 8% cash due 12/18/2016 | — | (9,318 | ) | — | 67 | 2,500 | — | (2,500 | ) | — | — | % | ||||||||||||||||||||||||||||
| 100 units in FSFC Miche, Inc. | — | — | 1,730 | — | 4,175 | 2,513 | (6,688 | ) | — | — | % | |||||||||||||||||||||||||||||
| Express Group Holdings LLC (7) | Oil & gas equipment services | |||||||||||||||||||||||||||||||||||||||
| First Lien Term Loan, LIBOR+6% (1% floor) cash due 9/3/2019 | 9.00% | 12,289 | — | (10,880 | ) | 473 | — | 12,073 | (10,880 | ) | 1,193 | 0.1 | % | |||||||||||||||||||||||||||
| First Lien Revolver, LIBOR+4.5% (1% floor) cash due 3/4/2019 | 5.50% | 6,090 | — | — | 65 | — | 8,914 | (2,824 | ) | 6,090 | 0.5 | % | ||||||||||||||||||||||||||||
| Last-In Revolver, PRIME+3.5% (3.5% floor) cash due 10/7/2016 | 7.00% | 3,000 | — | — | 67 | — | 3,000 | — | 3,000 | 0.3 | % | |||||||||||||||||||||||||||||
| 14,033,391 Series B Preferred Units | — | — | (3,982 | ) | — | — | 3,982 | (3,982 | ) | — | — | % | ||||||||||||||||||||||||||||
| 280,668 Series A Preferred Units | — | — | (1,593 | ) | — | — | 1,593 | (1,593 | ) | — | — | % | ||||||||||||||||||||||||||||
| 1,456,344 Common Units | — | — | — | — | — | — | — | — | — | % | ||||||||||||||||||||||||||||||
| Ameritox Ltd. | Healthcare services | |||||||||||||||||||||||||||||||||||||||
| First Lien Term Loan, LIBOR+5% (1% floor) cash 3% PIK due 4/11/2021 | 6.00% | 31,259 | — | (189 | ) | 1,372 | — | 31,336 | (297 | ) | 31,039 | 2.7 | % | |||||||||||||||||||||||||||
| 14,090,126.4 Class A Preferred A Units in Ameritox Holdings II, LLC | — | — | 1,346 | — | — | 15,437 | — | 15,437 | 1.4 | % | ||||||||||||||||||||||||||||||
| 1,602,260.83 Class B Preferred A Units in Ameritox Holdings II, LLC | — | — | 153 | — | — | 1,755 | — | 1,755 | 0.2 | % | ||||||||||||||||||||||||||||||
| 4,930.03 Common Units in Ameritox Holdings II, LLC | — | — | (15,937 | ) | — | — | 29,049 | (15,936 | ) | 13,113 | 1.1 | % | ||||||||||||||||||||||||||||
| Total Control Investments | $ | 204,948 | $ | (9,318 | ) | $ | (53,599 | ) | $ | 33,999 | $ | 318,893 | $ | 216,033 | $ | (146,659 | ) | $ | 388,267 | 34.0 | % | |||||||||||||||||||
| Affiliate Investments | ||||||||||||||||||||||||||||||||||||||||
| Caregiver Services, Inc. | Healthcare services | |||||||||||||||||||||||||||||||||||||||
| Second Lien Term Loan, 10% cash 2% PIK due 6/30/2019 | $ | 9,524 | $ | 3 | $ | (30 | ) | $ | 1,175 | $ | 9,389 | $ | 395 | $ | (235 | ) | $ | 9,549 | 0.8 | % | ||||||||||||||||||||
| 1,080,399 shares of Series A Preferred Stock, 10% | — | — | (134 | ) | — | 4,213 | 40 | (174 | ) | 4,079 | 0.4 | % | ||||||||||||||||||||||||||||
| AmBath/ReBath Holdings, Inc. | Home improvement retail | |||||||||||||||||||||||||||||||||||||||
| First Lien Term Loan B, 12.5% cash 2.5% PIK due 8/31/2017 | — | — | — | 4,077 | 26,240 | 935 | (2,907 | ) | 24,268 | 2.1 | % | |||||||||||||||||||||||||||||
| 4,668,788 shares of Preferred Stock | — | — | 1,009 | — | 764 | 1,715 | (606 | ) | 1,873 | 0.2 | % | |||||||||||||||||||||||||||||
| Total Affiliate Investments | $ | 9,524 | $ | 3 | $ | 845 | $ | 5,252 | $ | 40,606 | $ | 3,085 | $ | (3,922 | ) | $ | 39,769 | 3.5 | % | |||||||||||||||||||||
| Total Control & Affiliate Investments | $ | 214,472 | $ | (9,315 | ) | $ | (52,754 | ) | $ | 39,251 | $ | 359,499 | $ | 219,118 | $ | (150,581 | ) | $ | 428,036 | 37.5 | % | |||||||||||||||||||
| Consolidated Statements of Assets and Liabilities as of September 30, | |||||
| Consolidated Statements of Operations for the Years Ended September 30, | |||||
| Consolidated Statements of Changes in Net Assets for the Years Ended September 30, | |||||
| Consolidated Statements of Cash Flows for the Years Ended September 30, | |||||
| Consolidated Schedule of Investments as of September 30, | |||||
| Consolidated Schedule of Investments as of September 30, | |||||
| Notes to Consolidated Financial Statements | |||||
| Schedule 12-14 — Investments in and advances to affiliates | |||||
| Agreement and Plan of Merger among Oaktree Strategic Income II, Inc., the Registrant, Merger Sub, Inc. and Oaktree Fund Advisors LLC (for the limited purposes set forth therein), dated as of October 28, 2020 (Incorporated by reference to Exhibit 2.1 filed with the Registrant’s Current Report on Form 8-K (File No. 814-00755) filed on September 15, 2022). | ||||||||
Restated Certificate of Incorporation of the Registrant (Incorporated by reference to Exhibit 3.1 filed with Registrant’s Form 8-A (File No. 001-33901) filed on January 2, 2008). | ||||||||
Certificate of Amendment to the Registrant’s Restated Certificate of Incorporation (Incorporated by reference to Exhibit (a)(2) filed with Registrant’s Registration Statement on Form N-2 (File No. 333-146743) filed on June 6, 2008). | ||||||||
Certificate of Correction to the Certificate of Amendment to the Registrant’s Restated Certificate of Incorporation (Incorporated by reference to Exhibit (a)(3) filed with Registrant’s Registration Statement on Form N-2 (File No. 333-146743) filed on June 6, 2008). | ||||||||
Certificate of Amendment to Registrant’s Restated Certificate of Incorporation (Incorporated by reference to Exhibit 3.1 filed with Registrant’s Quarterly Report on Form 10-Q (File No. 001-33901) filed on May 5, 2010). | ||||||||
Certificate of Amendment to Registrant’s Certificate of Incorporation (Incorporated by reference to Exhibit (a)(5) filed with the Registrant’s Registration Statement on Form N-2 (File No. 333-180267) filed on April 2, 2013). | ||||||||
Certificate of Amendment to the Restated Certificate of Incorporation of the | ||||||||
Form of Common Stock Certificate (Incorporated by reference to Exhibit 4.1 filed with Registrant’s Form 8-A (File No. 001-33901) filed on January 2, 2008). | ||||||||
| Description of Securities |
Indenture, dated April 30, 2012, between Registrant and Deutsche Bank Trust Company Americas, as trustee (Incorporated by reference to Exhibit (d)(4) filed with Registrant’s Registration Statement on Form N-2 (File No. 333-180267) filed on July 27, 2012). | ||||||||
Fourth Supplemental Indenture, dated as of October 17, 2017, between Registrant and Deutsche Bank Trust Company Americas, as trustee (Incorporated by reference to Exhibit 4.1 filed with the Registrant’s Form 8-K (File No. 814-00755) filed on October 17, 2017). | ||||||||
| Form of | ||||||||
| Sixth Supplemental Indenture, dated as of May 18, 2021, relating to the | ||||||||
| Administration Agreement, dated as of | |||||||||
| Amended and Restated Dividend Reinvestment Plan (Incorporated by reference to Exhibit 10.1 filed with Registrant’s Form 8-K (File No. | |||||||||
| Amendment No. 1 to Amended and Restated Senior Secured Revolving Credit Agreement, dated as of December 13, 2019, among the Registrant, as Borrower, the lenders party thereto from time to time and ING Capital LLC, as administrative agent for the lenders thereunder (Incorporated by reference to Exhibit 10.1 filed with the Registrant’s Current Report on Form 8-K (File No. 814-00755) filed on December 17, 2019). | ||||||||
| Amendment No. 2 to Amended and Restated Senior Secured Revolving Credit Agreement, dated as of May 6, 2020, among the Registrant, as Borrower, the lenders party thereto from time to time and ING Capital LLC, as administrative agent for the lenders thereunder (Incorporated by reference to Exhibit 10.2 filed with the Registrant’s Form 10-Q (File No. 814-00755) filed on May 7, 2020). | ||||||||
| Incremental Commitment and Assumption Agreement, dated as of October 28, 2020, made by the Registrant, as Borrower, the assuming lender party hereto, as assuming lender, and ING Capital LLC, as administrative agent and issuing bank relating to the Amended and Restated Senior Secured Revolving Credit Agreement, dated as of February 25, 2019 among the Registrant, as Borrower, the lenders party thereto, ING Capital LLC, as administrative agent, ING Capital LLC, JPMorgan Chase Bank, N.A. and Merrill Lynch, Pierce, Fenner & Smith Incorporated as joint lead arrangers and joint bookrunners, and JPMorgan Chase Bank, N.A. and Bank of America, N.A., as syndication agents (Incorporated by reference to Exhibit 10.1 filed with the Registrant’s Current Report on Form 8-K (File No. 814-00755) filed on October 29, 2020). | ||||||||
| Amendment No. 3 to Amended and Restated Senior Secured Revolving Credit Agreement, dated as of December 10, 2020, among the Registrant, as Borrower, the lenders party thereto from time to time and ING Capital LLC, as administrative agent for the lenders thereunder (Incorporated by reference to Exhibit 10.1 filed with the Registrant’s Current Report on Form 8-K (File No. 814-00755) filed on December 14, 2020). | ||||||||
| Incremental Commitment Agreement, dated as of December 28, 2020, made by the Registrant, as Borrower, MUFG Union Bank, N.A., as increasing lender, and ING Capital LLC, as administrative agent and issuing bank relating to the Amended and Restated Senior Secured Revolving Credit Agreement, dated as of February 25, 2019 among the Registrant, as Borrower, the lenders party thereto, ING Capital LLC, as administrative agent, ING Capital LLC, JPMorgan Chase Bank, N.A. and Merrill Lynch, Pierce, Fenner & Smith Incorporated as joint lead arrangers and joint bookrunners, and JPMorgan Chase Bank, N.A. and Bank of America, N.A., as syndication agents (Incorporated by reference to Exhibit 10.1 filed with the Registrant’s Current Report on Form 8-K (File No. 814-00755) filed on December 29, 2020). | ||||||||
| Amendment No. 4 to Amended and Restated Senior Secured Revolving Credit Agreement and Amendment No. 1 to Amended and Restated Guarantee, Pledge and Security Agreement, dated May 4, 2021, among the Company, as borrower, OCSL SRNE, LLC, as subsidiary guarantor, FSFC Holdings, Inc., as subsidiary guarantor, the lenders party thereto, and ING Capital LLC, as administrative agent (Incorporated by reference to Exhibit 10.1 filed with the Registrant’s Form 10-Q (File No. 814-00755) filed on August 4, 2021). | ||||||||
| Incremental Commitment Agreement, dated as of December 10, 2021, made by Oaktree Specialty Lending Corporation, as Borrower, BNP Paribas, as assuming lender, and ING Capital LLC, as administrative agent and issuing bank relating to the Amended and Restated Senior Secured Revolving Credit Agreement, dated as of February 25, 2019 among Oaktree Specialty Lending Corporation, as Borrower, the lenders party thereto, ING Capital LLC, as administrative agent, ING Capital LLC, JPMorgan Chase Bank, N.A. and Merrill Lynch, Pierce, Fenner & Smith Incorporated as joint lead arrangers and joint bookrunners, and JPMorgan Chase Bank, N.A. and Bank of America, N.A., as syndication agents (Incorporated by reference to Exhibit 10.1 filed with the Registrant’s Current Report on Form 8-K (File No. 814-00755) filed on December 13, 2021). | ||||||||
| Loan Sale Agreement by and between Registrant and OCSL Senior Funding II LLC (formerly FS Senior Funding II LLC), dated as of January 15, 2015 (Incorporated by reference to Exhibit 10.2 filed with the Registrant’s Current Report on Form 8-K (File No. 814-00755) filed on March 19, 2021). | ||||||||
| Amended and Restated Loan and Security Agreement, dated as of January 31, 2018, by and among Registrant, OCSL Senior Funding II LLC (formerly OCSI Senior Funding II LLC), the lenders referred to therein, Citibank, N.A., and Wells Fargo Bank, National Association (Incorporated by reference to Exhibit 10.3 filed with the Registrant’s Current Report on Form 8-K (File No. 814-00755) filed on March 19, 2021). | ||||||||
| First Amendment to the Amended and Restated Loan and Security Agreement by and among the Registrant, as collateral manager, OCSL Senior Funding II LLC (formerly OCSI Senior Funding II LLC), as borrower, and Citibank, N.A., as administrative agent and sole lender, dated as of May 14, 2018 (Incorporated by reference to Exhibit 10.4 filed with the Registrant’s Current Report on Form 8-K (File No. 814-00755) filed on March 19, 2021). | |||||||||
| Second Amendment to the Amended and Restated Loan and Security Agreement by and among Registrant, as collateral manager, OCSL Senior Funding II LLC (formerly OCSI Senior Funding II LLC), as borrower, and Citibank, N.A., as administrative agent and sole lender, dated as of July 18, 2018 (Incorporated by reference to Exhibit 10.5 filed with the Registrant’s Current Report on Form 8-K (File No. 814-00755) filed on March 19, 2021). | |||||||||
| Third Amendment to the Amended and Restated Loan and Security Agreement by and among Registrant, as collateral manager, OCSL Senior Funding II LLC (formerly OCSI Senior Funding II LLC), as borrower, and Citibank, N.A., as administrative agent and sole lender, dated as of September 17, 2018 (Incorporated by reference to Exhibit 10.6 filed with the Registrant’s Current Report on Form 8-K (File No. 814-00755) filed on March 19, 2021). | |||||||||
| Fourth Amendment to the Amended and Restated Loan and Security Agreement by and among Registrant, as collateral manager, OCSL Senior Funding II LLC (formerly OCSI Senior Funding II LLC), as borrower, and Citibank, N.A., as administrative agent and sole lender, dated as of September 20, 2019 (Incorporated by reference to Exhibit 10.7 filed with the Registrant’s Current Report on Form 8-K (File No. 814-00755) filed on March 19, 2021). | |||||||||
| Fifth Amendment to the Amended and Restated Loan and Security Agreement by and among the Registrant, as collateral manager, OCSL Senior Funding II LLC (formerly OCSI Senior Funding II LLC), as borrower, and Citibank, N.A., as administrative agent and sole lender, dated as of October 27, 2020 (Incorporated by reference to Exhibit 10.8 filed with the Registrant’s Current Report on Form 8-K (File No. 814-00755) filed on March 19, 2021). | |||||||||
| Sixth Amendment to the Amended and Restated Loan and Security Agreement by and among the Company, as collateral manager, OCSL Senior Funding II LLC, as borrower, and Citibank, N.A., as administrative agent and sole lender, dated as of July 2, 2021 (Incorporated by reference to Exhibit 10.1 filed with the Registrant’s Current Report on Form 8-K (File No. 814-00755) filed on July 9, 2021). | |||||||||
| Seventh Amendment to the Amended and Restated Loan and Security Agreement by and among the Company, as collateral manager, OCSL Senior Funding II LLC, as borrower, and Citibank, N.A., as administrative agent and sole lender, dated as of November 18, 2021 (Incorporated by reference to Exhibit 10.1 filed with the Registrant’s Current Report on Form 8-K (File No. 814-00755) filed on November 22, 2021). | |||||||||
| Letter Agreement, dated as of September 14, 2022, by and between the Company and Oaktree | |||||||||
| Joint Code of Ethics of the Registrant, Oaktree Strategic Income II, Inc. and Oaktree Strategic | |||||||||
| Code of Ethics of Oaktree | |||||||||
| 21 | Subsidiaries of Registrant and jurisdiction of incorporation/organizations: FSFC Holdings, Inc. — Delaware OCSL Senior Funding II LLC— Delaware | ||||||||
| Consent of Registered Public Accounting Firm | |||||||||
| Power of Attorney (included on the signature page hereto). | |||||||||
| Certification of Chief Executive Officer Pursuant to Rule 13a-14(a) under the Securities Exchange Act of 1934. | |||||||||
| Certification of Chief Financial Officer Pursuant to Rule 13a-14(a) under the Securities Exchange Act of 1934. | |||||||||
| Certification of Chief Executive Officer Pursuant to Section 906 of the Sarbanes-Oxley Act of 2002 (18 U.S.C. 1350). | |||||||||
| Certification of Chief Financial Officer Pursuant to Section 906 of the Sarbanes-Oxley Act of 2002 (18 U.S.C. 1350). | |||||||||
| Inline XBRL Instance Document - the instance document does not appear in the Interactive Data File because its XBRL tags are embedded within the Inline XBRL document. | ||||||||
| 101.SCH* | Inline XBRL Taxonomy Extension Schema Document. | |||||||
| 101.DEF* | Inline XBRL Taxonomy Extension Definition Linkbase Document. | |||||||
| 101.LAB* | Inline XBRL Taxonomy Extension Label Linkbase Document. | |||||||
| 101.PRE* | Inline XBRL Taxonomy Extension Presentation Linkbase Document. | |||||||
| 104* | Cover Page Interactive Data File (formatted as inline XBRL and contained in Exhibit 101) | |||||||
| * | Filed herewith. | ||||
| ^ | Exhibits and schedules to Exhibit 2.1 have been omitted in accordance with Item 601 of Regulation S-K. The registrant agrees to furnish supplementally a copy of all omitted exhibits and schedules to the SEC upon its request. | ||||
| OAKTREE SPECIALTY LENDING CORPORATION | ||||||||||
| By: | /s/ | |||||||||
| Chief Executive Officer | ||||||||||
| By: | /s/ | |||||||||
| Chief Financial Officer and Treasurer | ||||||||||
| Signature | Title | Date | ||||||||||||||
/s/ Armen Panossian | Chief Executive Officer (principal executive officer) | November | ||||||||||||||
/s/ | Chief Financial Officer and Treasurer (principal financial officer and principal accounting officer) | November | ||||||||||||||
/s/ JOHN B. FRANK John B. Frank | Director | November | ||||||||||||||
/s/ | Director | November | ||||||||||||||
/s/ DEBORAH A. GERO Deborah A. Gero | Director | November 14, 2022 | ||||||||||||||
/s/ CRAIG JACOBSON Craig Jacobson | Director | November | ||||||||||||||
/s/ BRUCE ZIMMERMAN Bruce Zimmerman | Director | November | ||||||||||||||